ADMINISTRATIVE RECORD COVER SHEET - Amazon S3
295
964 o File: 660.22A M.L. a~~~~ ADMINISTRATIVE RECORD COVER SHEET AR File Number 1
-
Upload
khangminh22 -
Category
Documents
-
view
1 -
download
0
Transcript of ADMINISTRATIVE RECORD COVER SHEET - Amazon S3

964 oFile: 660.22AM.L.
a~~~~
ADMINISTRATIVE RECORDCOVER SHEET
AR File Number 1

FINAL
REMEKDIAL I)ESIGN & REMEDIAL ACTION WORK PL AN
FOR
OPERA 131E I: Nil 8
DEF [NSF St PPI A (,ENTIER RICIIMIONDI
PrItoidred For
IDeltitse ILogrktics AgechlC
kroi
nct;4,IDkfelnse SupplY (. Corer Richmond
Septembler Ž008

8005 Outer Circle Rd., Brooks City-Base, TX 78235EATT 210.271.0925 F 210.271.3061 ERHTECH IAECOMwww.earthtech.aecommcem
I October 2008
Mr. Roy Shrove, CIHHQ AFCEE/EXA3300 Sidney BrooksBrooks City-Base, Texas 78235
Subject: Final Remedial Design and Remedial Action Work Plan for Operable Unit 8Defense Supply Center Richmond (DSCR)Contract No. FA8903-04-D-869l, Task Order 0035
Dear Mr. Shrove,
Earth Tech AECOM is pleased to submit the above-referenced document. All comments on thedraft final version have been addressed and the suggested changes have been incorporated in thefinal version. Additional copies of this document have been issued as shown on the attacheddistribution list.
If you have any questions or comments, please contact the undersigned at (210) 271-0925.
SincerelyEarth Tech AECOM
Manis M Joshi, P.E.Project Manager
encl: Final RD RA Work Plan for OU 8

96 4 3
Distribution ListFinal Remedial Design and Remedial Action Work Plan for Operable Unit 8
Defense Supply Center Richmond
Mr. Roy ShroveHQ AFCEEIEXA3300 Sidney BrooksBrooks City-Base, Texas 78235Tel: (210) 536-4502(I electronic copy)
Mr. Mark LeeperDefense Supply Center RichmondDSCR-SD, Building 80 (S Edlavitch)8000 Jefferson Davis HighwayRichmond, VA 23297-5000Tel: (804) 2794129(3 copies ± I electronic copy)
Mr. Jack Potosnak(3HS13)U. S EPA, RegionS31650 Arch StreetPhiladelphia, PA 19103-2029Tel: (215) 814-3362(3 copies)
Mr. Jim CutlerVirginia Department of Environmental QualityDivision of Waste Operations629 E. Main Street, P.O. Box 10009Richmond, VA 23240-0009Tel: (804) 698-4498(I copy)
Mr. Phil DawsonDefense Logistics AgencyEnvironment and Safety (DES-E)8725 John J Kingman Road, Suite 2639Fort Belvoir, VA 22060-6221Tel: (703) 767-6255(I electronic copy)
EARTH TECH AECOM

Final
REMEDIAL DESIGN & REMEDIAL ACTION WORK PLAN
FOR
OPERABLE UNIT 8
DEFENSE SUPPLY CENTER RICHMOND
Prepared For:
Defense Supply Center Richmond
Defense Logistics Agency
Air Force Center for Engineering and the Environment
Prepared By:
Earth Tech AECOM
Contract No. FA8903-04-D-8671
Task Order 0035
September 2008

984
CONTACTS LIST
Name Contact InformationMr. Mark Leeper DSCR-SD Environmental Office
Building 808000 Jefferson Davis HighwayRichmond, VA 23297-5000804-279-4129 (office)
Mr. Jim Cutler Virginia Department of EnvironmentalQualityDivision of Waste Operations629 E. Main St., 4ch FloorRichmond, VA 23240-0009804-689-4498 (office)
Mr. Jack Potosnak US EPA (3HS13)1650 Arch StreetPhiladelphia, PA 19 103-2029215-814-3362 (office)
Mr. Roy Shrove AFCEE/EXA3300 Sidney BrooksBrooks City-Base, Texas 78235210-536-4502 (office)
Ms. Jana Dawson TechLaw, Inc.14500 Avion Parkway, Suite 300Chantilly, VA 20151703-81 8-3254 (office)
Mr. Manish Joshi Earth Tech AECOM8005 Outer Circle RoadBrooks City-Base, Texas 782352 10-271 -0925(office)

964 6Remedial Design & Remedial Action Work Plan September 2008Operable Unit 8, DSCR
Table of Contents
1 INTRODUCTION............................................................................... -
2 OUSSITEHISTORY.......................................................................... 2-1
2.1 OU 8 Geology ............................................................................ 2-2
2.2 OU 8 Hydrogeology....................................................................... 2-32.2.1 Upper Water Bearing Unit (WBU).................................................. 2-32.2.2 Lower WBU........................................................................... 2-4
2.3 Nature and Extent of Groundwater Contamination................................. 2-5
2.4 Fate and Transport Modeling ........................................................... 2-5
2.5 Risk Assessment and Feasibility Study Evaluations.................................. 2-6
3 OUR1FINAL REMEDY........................................................................ 34
3.1 Institutional Controls..................................................................... 3-1
3.2 MINA........................................................................................ 3-1
3.3 Trigger Criteria ........................................................................... 3-2
4 REMEDIAL DESIGN AND REMEDIAL ACTION ACTIVITIES........................ 4-1
4.1 Remedial Design........................................................................... 4-1
4.2 Remedial Action Field Activities........................................................ 4-7
S UPCOMING ACT!VI TIES ................................................................... 5.. 5)
6 REFERENCES.................................................................................. 6-1

964 7Remedial Design & Remedial Action Work Plan September 2008Operable Unit 8, DSCR
List of FiguresFigure I-1: Operable UnitS8, DSCR 1-4
Figure 2-1: OU 8 Site Map 2-14
Figure 2-2: OU 8 Cross section A-A' 2-15
Figure 2-3: OU 8 Cross-section B-B' 2-16Figure 2-4: OU 8 Upper WBU Potentiometric Surface Map 2-17
Figure 2-5: OU 8 Lower WBU Potentiomnetric Surface Map 2-18
Figure 2-6: OU 8 TCE Plume (June 2006) 2-19
Figure 2-7: OU 8 PCE Plume (June 2006) 2-20
Figure 2-8: OU 8 c I2DCE Plume (June 2006) 2-21
Figure 2-9: OU 8 VC Plume (June 2006) 2-22
Figure 4-I1: OU 8 Investigation Area 4-Il
Figure 4-2: OU 8 Remedial Action Monitoring Wells 4-12
List of TablesTable 2-I1: OU 8 Contaminant Data (July 2006) 2-10Table 4-I1: OU 8 Monitoring Wells 4-8
Table 4-2: Analytical Protocol for Monitoring Well Groundwater Samples, OU 8 4-10
List of AppendixesAPPENDIX A: DESIGN SITE CHARACTERIZATION MEMORANDUM
APPENDIX B: DPE SYSTEM DECOMISSIONING PLAN
APPENDIX C: RESPONSE TO COMMENTS
APPENDIX D: HISTORICAL OU S GROUNDWATER DATA

964 8Remedial Design & Remedial Action Work Plan September 2008Operable Unit 6t DSCR
Acronyms and Abbreviations
I1.2-DCA I1.2-dichloroethaneAFCEE Air Force Center for Environmental ExcellenceANPs Acid Neutralization PitsARARs Applicable or Relevant and Appropriate RequirementsBDCM Bromodichloromethaneci 2DCE cis-l1.2-dichloroethene
CERCLA Comprehensive Environmental Response, Compensation, andLiability Act
CCC Contaminant of ConcernCVOC chlorinated volatile organic compoundsDCE DichioroetherneDCM DichioromethaneDLA Defense Logistics AgencyDPE Dual Phase ExtractionDSCR Defense Supply Center RichmondESD Explanation of Significant DifferencesFF5 Focused Feasibility StudyHHBRA Human Health Baseline Risk AssessmentICs institutional controlsLUCIP Land Use Control Implementation PlanLUCs Land Use ControlsMCL Maximum Contaminant Levelmg/kg milligrams per kilogramMNA Monitored Natural AttenuationMNA Monitored Natural AttenuationCU Operable UnitPCE Tetrach loroethene
RA Remedial ActionRAO Remedial Action ObjectivesRD Remedial DesignRI Remedial InvestigationRU/FS Remedial Investigation/Feasibility Study ReportROD Record of DecisionSIPS Supplemental Feasibility Study

984 gRemedial Design & Remedial Action Work Plan September 2008Operable Unit 8, DSCR
Acronyms and Abbreviations (continued)
SVE soil vapor extractionTCA TrichloroethanesTC E TrichloroetheneUSEPA United States Environmental Protection AgencyVC vinyl chlorideVDEQ Virginia Department of Environmental QualityPg/L Micrograms per Liter
iv

964 tRemedial Design & Remedial Action Work Plan September 2008Operable Unit 8. DSCR
I INTRODUCTION
This document presents the remedial design (RD) and the remedial action (RA) field and dataevaluation activities to be conducted for the implementation of the selected remedy at OperableUnit (OU) 8 at the Defense Supply Center Richmond (DSCR). OU 8 is defined as thegroundwater beneath and downgradient of the Acid Neutralization Pits (ANPs), located in thenorthern portion of DSCR. The ANPs are referred to as OU 5. Based on previous investigationsand evaluations, DSCR and United States Environmental Protection Agency (USEPA), withconcurrence from Virginia Department of Environmental Quality (VDEQ), have selectedinstitutional controls and monitored natural attenuation (MNA) with in situ bioremediation as apossible contingency to be the preferred remedy to address impacted groundwater at OU 8. Thisremedy has been outlined in the OU 8 Record of Decision (ROD) (DSCR, 2007). Figure 1-1
shows the location of OU 8 at DSCR.
The most robust and defensible strategy to determine if natural attenuation is occurring at aparticular site is to collect multiple converging lines of evidence (NRC, 1993). The TechnicalProtocol for Evaluating Natural Attenuation of Chlorinated Solvents in Ground Water (US EPA,1998) outlines data quality objectives, and how to collect, evaluate, and present the followingmultiple converging lines of evidence with regard to evaluating the degradation of chlorinated
solvents:
* Observed reductions in contaminant concentrations along the flow path downgradient fromthe source of contamination.
* Documented loss of contaminant mass at the field scale using chemical and geochemical
analytical data demonstrating:
o, decreasing parent compound concentrations;
o, increasing daughter compound concentrations;
o depletion of electron acceptors and donors;
o increasing metabolic byproduct concentrations;
o favorable succession of redox conditions;
1-I

964 1Remedial Design & Remedial Action Work Plan September 2008Operable Unit 8, DSCR
a A conservative tracer (if available) and a rigorous estimate of residence time alongthe flow path to document contaminant mass reduction and to calculate biologicaldecay rates at the field scale.
* Microbiological laboratory or field data that support the occurrence of biodegradation andprovide estimated rates of biodegradation.
Additionally, the proposed remedy at OU S was selected and will be implemented in accordancewith the US EPA OSWER Directive 9200.4-17, titled Use of Monitored Natural Attenuation atSuperfund, RCRA Corrective Action, and Underground Storage Tank Sites (US EPA, 1999).Bioremediation was selected as a contingency over competing technologies based upon strongsite-specific indicators of bioremediation potential. Treatability studies are currently beingimplemented at OU 6 and OU 7 to further evaluate critical design, cost and performance data onenhanced bioremediation of chlorinated solvent contaminants. Laboratory and field data haveshown that reductive dehalogenation occurs under reducing geochemical conditions, where anelectron donor (e.g. edible oil or organic matter) is utilized as the main energy source formicrobial metabolism and the highly oxidized chlorinated solvents [e.g. tetrachloroethene (PCE),trichloroethene (TCE), dichloroethene (D)CE), vinyl chloride (VC), trichloroethanes (TCA), etc.]are used as electron acceptors. When a source of organic carbon is present, microorganismscapable of degrading PCE and TCE to cis-1,2-DCE (cI2DCE) appear to be common in thesubsurface environment.
The addition of carbon substrate creates reducing conditions under which reduced metal sulfidesare formed which have been shown to cause the abiotic reductive dechlorination of chlorinatedethenes (Ferrey et al., 2004, Butler and Hayes, 1999, 2000, Lee and Batchelor, 2002, 2004) andethanes.
Historical contaminant and geochemical data collected at OU 8 provides strong evidence thatnatural biodegradation was occurring and will continue to occur. However, the dual phaseextraction system that was operated from June 1997 - January 2004 included not only vacuum-enhanced recovery of ground water and soil vapor, but included air injection. These processescombined to reduce dissolved contaminant concentrations and to potentially raise redoxconditions toward a more oxidized state. Post shutdown monitoring was primarily intended to
1-2

9 4 12Remedial Design & Remedial Action Work Plan September 2008Operable Unit 8, DSCR
evaluate any contaminant concentration rebound. Additionally, post shutdown monitoring datawill be used to evaluate whether subsurface geochemnical conditions will return to pre-DPE
conditions. These conditions were anaerobic and supportive of reductive dechlorination. Ifcontaminant concentrations display increasing trends and geochemnical conditions appearsuboptimal to the point where contaminant concentrations continue to rise at the propertyboundary, the in situ bioremediation contingency remedy will be implemented.
Section 2 of this document presents the OU 8 history, subsurface setting and historicalinvestigative activities, while section 3 presents the ROD-selected remedy. Section 4 presentsthe RD and RA activities to be performed for the implementation of the final remedy and Section5 provides a summary of the project schedule and reporting activities.
Appendix A presents a memorandum summarizing the design site characterization activities,while Appendix B presents the DPE system decommissioning plan. Appendix C contains theresponse to comments on the draft Work Plan, while Appendix D presents the historical OU 8
groundwater data.
1-3

ZONE I AE
ZONE 3 <N
DEFES
CENER operable unit,0CR Fgr____ ________ ~RICHM N

964 14Remedial Design & Remedial Action Work Plan September 2008Operable Unit 8, DSCR
2 OU 8 SITE HISTORY
The following sections provide a brief summary of OU 8 history, subsurface setting andinvestigative activities as presented in the Revised Focused Feasibility Study (FFS) (MACTEC,
2006a). Figure 2-1 shows the OU 8 map and the associated monitoring wells.
OIJ 8 is the groundwater beneath and downgradient of the ANPs. OU 5 includes the ANPs andthe surrounding, potentially impacted soil. The ANPs consist of two former concrete tanks thatreceived wastewater from metal cleaning operations at Warehouse 65. Operations in Warehouse65 included cleaning (paint and rust removal) and repainting steel combat helmets, compressed
gas cylinders, and other metal items. These operations were conducted from 1958 to the early1980s. From 1958 to the late 1970s, wastewater from the primary tank was discharged to thestorm sewer. After the addition of the secondary tank during the late 1970s, wastewater wasdischarged to the sanitary sewer. Solids that collected in the bottom were periodically removedand disposed at the Chesterfield County landfill. A leaching procedure analysis of these solidswas performed in 1979 and the solid were determined not to be hazardous (Engineering Science,1993). The solvents used during metal cleaning operations are not documented; however,solvents may have been transported from other installation locations and disposed in the ANPs.The ANPs were closed in 1985, the sludge was removed, residual sludge was washed from thetank bottoms, and the tanks were backfilled with clean soil. At the time of closure, the concretesides and bottoms of the tanks were found to be broken and cracked.
A Remedial Investigation (RI) of the ANPs was completed in 1989 and the results showed lowlevels of chlorinated volatile organic compounds (CVOCs), including PCE and TCE in the soilsurrounding the tanks. A human health baseline risk assessment (HI4RRA) was performed andsoil action levels protective of groundwater were calculated. A comparison of soil concentrationswith the OU 5 ROD action levels showed that the PCE concentration in one soil boring (DMS-80) was above the soil action level. The highest detected PCE concentration was 1.5 milligramsper kilogram (mg/kg) which was measured in a 1988 pre-SVE soil sample (Dames & Moore,1989). The selected remedy for the OU 5 soils was soil vapor extraction (SVE) and construction
of concrete covers over the tanks as outlined in the OU 5 ROD. An SVE pilot test wasperformed in December 1992. Relatively low concentrations of VOCs were detected in the SVE
2-1

964 15Remedial Design & Remedial Action Work Plan September 20083Operable Unit 8, DSCR
influent The analytical results from December 1992 soil borings collected before and after theSVE test showed no concentrations above the lowest OU 5 ROD action levels (e.g. Groundwater protection: PCE - 0.58 mg/kg; TCE - 0.20 mg/kg). Based on these results DSCR and theRegulatory Agencies agreed that further SVE was not required and an Explanation of SignificantDifferences (ESD) was signed in March 1996 proposing the elimination of the SVE system.
Previous investigations, including the RU/FS, treatability studies, and the SupplementalFeasibility Study (SFS) investigation, identified impacts to groundwater near Warehouse 65.Groundwater results showed that CVOCs in the upper WBU have extended from the ANPs tothe northeast.
A limited investigation around Warehouse 64 was conducted to identif$' the source ofhalogenated methane compounds in the upper WBU. The investigation included the collectionand review of background documents on activities within Warehouse 64, a site reconnaissance ofWarehouse 64 and surrounding buildings, and soil and groundwater sample collection. Based onthe soil and groundwater analytical results, one halogenated methane compound was detected inI of 28 soil samples, and 5 halogenated methane compounds were detected in severalgroundwater samples. The source area for the three halogenated methane compounds(dichloromethane [DCM], bromodichloromethane [BDCM], and chloroform) appears to be nearWarehouse 64.
2.1 OU 8 Geology
Cross sections A-A' and B-B' (Figure 2-2 and Figure 2-3, respectively) illustrate subsurfacegeologic conditions. The general stratigraphy of coastal plain sediments is as follows:
* Silty sand, sandy silt, and silty or fat clay from the ground surface to depths ranging from
approximately 12 to 30 feet bgs.
* Poorly graded (i.e., well sorted) sand with gravel, interlayered with poorly graded gravel. Thethickness of this unit is approximately 2 to 19 feet. The top of the unit is approximately 13 to19 feet bgs. and the bottom of the unit is approximately 21 to 28 feet bgs. The unit is presentthroughout OU 8 but is absent to the north (the northern end of cross section A-A' and thenorthwestern end of cross section B-B').
2-2

964 16Remedial Design & Remedial Action Work Plan September 2008Operable Unit 8, DSCR
* Silty and/or fat clay. The thickness of this unit is approximately 5 to 10 feet. The top of theunit is approximately 21 to 28 feet bgs, and the bottom of the unit is approximately 26 to 36feet bgs. This unit is present beneath the poorly graded sand with gravel unit and is absent inthe northernmost part of the installation.
* Poorly graded sand with gravel and silty sand, poorly graded sand with gravel, and/or poorlygraded sand with gravel interlayered with poorly graded gravel. The thickness of this unit isapproximately 10 to 25 feet. The top of the unit is approximately 26 to 36 feet bgs, and thebottom of the unit is approximately 46 to 52 feet bgs. This unit is present throughout OU 8and the northern portion of the installation.
The fining-upward stratigraphic sequences indicate fluvial environments of deposition for thecoastal plain sediments. Two such sequences are in the stratigraphic section. Each sequenceincludes poorly graded sands with gravels deposited as channel lag or point bars and overlyingsands, silts, and clays deposited in over-bank environments.
Beneath the coastal plain sediments, from approximately 46 to 52 feet bgs, is'saprolite weatheredfrom the underlying Petersburg Granite. Locally, bedrock was not encountered in borings, andthe thickness of saprolite and depth to bedrock is unknown.
2.2 OU 8 Hydrogeology
2.2.1 Upper Water Bearing Unit (WBU)
The silty sand, sandy silt, and silty or fat clay extend downward from the ground surface, and theunderlying unit of poorly sorted sand and gravel has been designated as the upper WBU. Thehydraulic conductivity (permeability) of the sand with gravel portion of the upper WBU at OU 8was measured by aquifer testing during a pilot test study performed in 1995. The pilot test andobservation wellIs were located approximately 90 to 1 50 feet north of Warehouse 65. The testingyielded hydraulic conductivities ranging from approximately 1.8x 10,2 to 3.7x 10⁻² feet per minute(f1/min) (9.4x 10o3 to I .9X 10.2 centimeters per second [em/sec]). The geometric mean hydraulicconductivity was approximately 2.4x 10.2 ft/mm ( 1.2 x10.2 cm/see). Because of its relatively highhydraulic conductivity, the unit of poorly sorted sand and gravel may be a preferential pathwayfor groundwater movement. The unit of silty and/or fat clay beneath the upper WBU has a
2-3

964Remedial Design & Remedial Action Work Plan September 2008Operable Unit 8. DSCR
relatively low hydraulic conductivity and constitutes a confining unit. Coastal plain sediments
below the confining unit constitute the lower WBU.
A Dual Phase Extraction (DPE) system and air injection system was operated at OU 8 from June
1997 through January 2004. During the system operation, groundwater movement was radial
from all directions toward the square formed by the DPE wells (Figure 2-1), with hydraulic
gradients from approximately 0.007 to 0.02. Water level measurements in the upper WBU
conducted from January to October 2004 showed an increase in the water elevations and the
general direction of groundwater movement was consistently to the east and northeast. Thepotentiometric surface contours for the Upper WBU are shown in Figure 2-4 (July 2006 data).
During October 2004, after the DPE system ceased operation, the hydraulic gradient in the upper
WBU was approximately 0.00 15. Using the geometric mean hydraulic conductivity, thehydraulic gradient during October 2004, and an effective porosity of 0.20, the estimated average
linear velocity of groundwater movement in the upper WBU was approximately 0.26 ft/day (93.1
ft/yr).
2.2.2 Lower WBU
The potentiometric surface of the lower WBU during July 2006 is shown in Figure 2-5. The
general direction of groundwater movement was north-northeast with an estimated hydraulic
gradient of approximately 0.009. The hydraulic conductivity of the lower WB3U was estimated tobe 7.3 to 16.5 ft/day. Using the hydraulic gradient and an effective porosity of 0.20, the
estimated average linear velocity of groundwater movement was approximately 0.33 to 0.74
ft/day (120 to 27! ft/yr). A comparison of the potentiometric surfaces in the upper WBU vs. thelower WBU shows that the upper WBU potentiometric surface was approximately over 10 feet
higher than the lower WBU. These relative potentiometric surface elevations indicate that thevertical component of hydraulic gradient from the upper WBU to the lower WBU is downward.
The operation of the DPE system did not appear to have any effect on the potentiometric surface
of the lower WBU suggesting continuity in the clay aquiclude underlying the upper WBU.
2-4

961 1Remedial Design & Remedial Ac/ion Work Plan September 2008Operable Unit 8. 08CR
2.3 Nature and Extent of Groundwater Contamination
A review of the OU 8 groundwater data indicates that constituent concentrations were reduced
significantly prior to installation of the DPE system. As mentioned earlier, the DPE system was
operated at OU 8 from June 1997 through January 2004. At groundwater monitoring wellDMW-24A (see Figure 2-1), PCE decreased from 1,800 to 35 pg/L from 1987 to 1997. TCE inthis well decreased from 1,400 to 6 tg/L during this same period. At DMW-30A (see Figure 2-
I), PCE decreased from 3,700 to 1, 100 pg/L, and TCE decreased from 850 to 24 Pg/L during thisperiod. A combination of source removal activity at the ANP, decreased leaching of constituents
from soil, depletion of constituent mass by advective transport of groundwater from the well
area, volatilization, and degradation by biotic and/or abiotic processes likely caused thedecreasing concentrations observed at the wells. Groundwater samples collected after
termination of the DPE operation indicate that the areal extents of the PCE and TCE plumes
were reduced, and PCE and TCE concentrations within the plumes decreased from June 1997 to
January 2004. It appears that the constituent concentrations were reduced through a combination
of natural attenuation and operation of the DPE system.
Semiannual groundwater monitoring activities were conducted at OU 8 from 2004 to 2006.
Figure 2-6 presents the extent of the TCE plume in the OU 8 upper WBU based on the July
2006 data. The July 2006 contaminant data is presented in Table 2-1. No contaminants above
their respective cleanup levels were detected in the lower WBU wells.
2.4 Fate and Transport Modeling
During the Revised FFS, future contaminants of concern (COC) concentrations were predicted
using fate and transport modeling methods. Models were constructed and simulations were
generated to predict the following:
* Constituent concentrations (if any) in off-installation groundwater
* Migration of COG plumes to the northeast causing off-installation concentrations to exceedmaximum contaminant levels (MCLs) or other risk thresholds
* Estimated time for plumes to migrate off-installation (if off-installation migration were tooccur). This time estimate will indicate whether or not there is sufficient time to collectadditional data to confirm natural attenuation processes/rates and plume stability
2-5

964 1 9Remedial Design & Remedial Action Work Plan September 2008Operable Unit 8, DSCR
Conclusions of the BIOCHLOR modeling are summarized below. Simulations of COG
migration incorporated several degradation scenarios. Three scenarios were modeled:
I .Greater degradation rates (lower half-lives), calculated from pre-DPE data
2. Lesser degradation rates (higher half-lives) obtained from literature
3. A combination of both (slower degradation rates as the aquifer recovers from DPE system
operation and then faster degradation rates as the aquifer returns to pre-DPE conditions)
To incorporate a measure of conservatism but to also obtain a more realistic degradation ratethan the lowest literature value, Scenario 3 above was selected to predict future COG
concentrations. The future COG concentrations predicted by BIOCHLOR are listed below.
* Concentrations of PCE in off-installation groundwater could reach 0.6 jtg/L, concentrations
of TCE could reach 2.4 pg/L, and concentrations of cis-l,2-dichloroethene (cI2DCE) and
VC could reach 0.5 pg/L.
* Concentrations of 1,2-dichloroethane (1,2-DCA), DCM, and chloroform should be less than
I pg/L in off-installation groundwater, and the concentration of B3DCM could reach 4 gg/L if
dispersion is the only natural attenuation process affecting migration of this constituent.
* COG plumes will migrate to the northeast but will not cause off-installation concentrations to
exceed MCLs.
* The highest predicted concentrations would occur at the installation boundary in
approximately 20 years, approximately 700 feet northeast of the former ANP. This time
would be sufficient to collect additional data and confirm natural attenuation processes/rates
and plume stability.
2.5 Risk Assessment and Feasibility Study Evaluations
The results of the OU 8 HHBRA (MACTEC, 2006) are summarized below:
* Risk to on-site receptors is acceptable. Noncarcinogenic risks to off-installation receptors are
acceptable. Carcinogenic risk to potential off-installation residents who will hypothetically
use groundwater 20 years from now, at concentrations below the MCLs, is estimated at 6*
Io,
* Unacceptable risk to off-installation receptors is not probable for the following reasons:
2-6

964 20Remedial Design & Remedial Action Work Plan September 2008Operable Unit 8, DSCR
o The upper WBU is unsuitable as a potable water source;
o Publicly supplied water is widely available surrounding the installation;
o No off-installation residents currently exist at the property boundary;
o A county ordinance requires use of publicly supplied water where available and this
ordnance does apply in the off-base areas of concern; and
o The model used to predict maximum off-installation concentrations is very conservative.
Remedial action objectives (RAO) were established within this ITS to address impacted
groundwater in the upper WBU associated with OU 8. The RAOs, which take into consideration
the future use of the installation, include the following:
* Prevent unacceptable risk to human health and the environment from exposure to CO~s in
groundwater
* Reduce groundwater CO~s within OU 8 plume to meet chemical-specific applicable or
relevant and appropriate requirements (ARARs).
The groundwater fate and transport modeling indicated that groundwater concentrations at theproperty boundary will not exceed MCLs. The FF5 identified and screened remedial
technologies and associated process options to satisfy RAOs with respect to effectiveness,
implementability, and cost. Select remedial technologies and process options were carried
forward after the initial screening and were combined to develop the following remedial
alternatives:
* Alternative I: No Action. Leaves the impacted groundwater in place with no additional
measures to prevent exposure and serves as a baseline for comparison with the otheralternatives.
* Alternative 2: Institutional Controls and Monitored Natural Attenuation (MNA) with aContingency. This alternative will allow for and monitored natural attenuation of CO~s andprevent the use of impacted groundwater as a potable water source within the installation.LUCs would be attached to the property deed to restrict groundwater use should the propertybe transferred to a future owner. MNA relies on natural and existing biological, chemical,and physical processes that, under favorable conditions, act without human intervention toreduce the mass and concentration of constituents in groundwater. A contingency plan such
2-7

964 21
Remedial Design & Remedial Action Work Plan September 2008Operable Unit 8, DSCR
as, but not limited to, adding chemicals or nutrients to enhance the rate of in situbioremediation may be implemented should monitoring of MINA indicate that the RAOs are
not being met.
* Alternative 3:. In situ Bioremediation and Institutional Controls. Alternative 3 is similar
to Alternative 2, but incorporates the injection of chemicals and/or nutrients in areas ofhigher concentrations to accelerate the degradation rate. For the purposes of this evaluation,
it was assumed that in situ bioremnediation could triple the attenuation rate, thus reducing theduration of the remedial action from 30 years, as assumed in Alternative 2, to 10 years. Acontingency plan, such as restarting the DPE system, is included in Alternative 3 if in situ
bioremediation is not effective.
In the technology screening process of the FFS, MNA was given strong consideration for three
reasons:
* Natural attenuation processes were clearly evident prior to DPE system installation in 1997.For example, at DMW-24A, located near the former ANI's, PCE decreased from 1,800 to 35micrograms per liter frig/L) from 1987 to 1997. TCE decreased in this same period from1,400 to 6 gg/L. At DMW-30A, located downgradient of the ANPs, PCE decreased from3,700 to ],100 ggIL and TCE decreased from 850 to 24 gg/L during this same period with noengineered intervention implemented. These decreases in PCE and TCE concentration arelikely the result of natural attenuation processes.
* Indicator parameters, such as the presence of daughter products (cl2DCE and VC), andfavorable geochemical parameters, such as low dissolved oxygen and redox potential,provide indirect evidence for natural attenuation. The expected degradation byproduct ofPCE and TCE, cis-1,2-dichlorethene was not a measured analyte prior to 1997, but when itwas reported, it was detected at molar concentrations that would suggest that natural
biodegradation was occurring prior to DPE system operation.
• The plume has remained relatively stable in areal extent during the post-DPE evaluation
period.
Each alternative was evaluated against the nine CERCLA criteria to provide a basis for selectinga preferred remedial alternative. This analysis indicated that Alternatives 2 and 3 provided
2-8

964 22Remedial Design & Remedial Action Work Plan September 2008Operable Unit &, DSCR
adequate protection of human health and the environment and Will meet ARARs, whileAlternative I will not allow for documentation and evaluation of natural attenuation processes toensure this protection. Therefore, both Alternatives 2 and 3 met the CERCLA criteria.Alternatives 2 and 3 have similar advantages because they both would reduce toxicity mass andvolume and are active treatment processes, while Alternative 3 would require less time but at ahigher cost. It was determined that the assumed duration for each alternative was the parameterwith the greatest uncertainty, with significant impact on the overall costs.
2-9

C"Q
c'J~~~~~~~~~~~~~~~
z 'z VV 2VITA
40 -, -~ ~~ ~~ ~~~~ 0 0 00
00ef ' v '. V ei6 6 ~66
C~a V VV V ?V V
'0~~~~~~~~~~~C
z - ~ IC- _ _ I
<.N % w C_ _ _ _ _ _ _ _ _ _ _ _ _ _ _ _ _ _ _ _ _ _ _
- 10 0
z INv v v~7
"In
o -0
II ~ ~ ~ ~ ~ I
0~~~~~~~~~~~~~~~
C~~~~~~~~~~~~~~~~~~~~~~~
----------------------------------------------------------------~ ~ ~ ~ ~ ~~~~~2
Z en 0 N0 ONVVVOOV~~~~~~~~~~~~~~~~X0~~~~~~~~~~~~~~~~~~~~~~~~~~o 6 6 6~~~~~~~~~~~~~~~~~~~~~0r -C~~~~~~~~~~~~~~~~~~~~~~~~~
o 06~~~~~~~~~~~~~~~~~
00~~~~~C CO~~~~~T
In In~~~~~~~~~oMu P z

C.0~~~~~~~~~~0
Z>0 < --
< z~~0
MZO~~~~~~~~~
ac < ~v nfr V
- Cy
c0~~~c
2 cl~~2
z A ~~n V V c V I7
0 00L 66 a
z ~ ~ ~ a 2
a <a
z j
.2~~a 09 <
6 VV V V~rFEi
00 0 6'~~~~~~~~~~~~~~~~~~~C
0--------------------------------------------------- - - -~~~~~~~~~~~~~~~~~~~~~~~~~C
CDa
0~~~~~~~~~~~~~I?0 5 00 X
6 06 0~~~~~0000000.4 -
C)~~~~~~~~~~~~~~~~~~~CP. 0~~~~~~ 00u
0 u = 0~~~6 50 0.Sa C a0
z ~ ~~~~~~~ 0 00
z 0 u>-~~~~~~~~~0 .4 ~ ~ ~ ~ 0
-Cc 0 < 04 M P ~ 0 0 0
M > M on u > -" -~ - -
Z~~~~~~~~~~~~~~~~~~~~~~~~~~~~~~~~~L ~00

cn~~~~~~~~~~~o
5Z~~ .0 V V V V~v v
2
0< z V V V Vvv
z z- ~ ~ ~ ~ C
z0
R
z <~ ,
z <~6
z~~~
CC~~~~~~~~~~~~C
z V~~ V VV
z~~~~~~~~~'0~ ~ ~~~~
Nz4 Wi
-0 Z -o V V~~ V V v z
A 66~~~~~~~~~~
C~~~~~~~~~~~~
2 6
-< < - -
2 6~~~~~~~~~~~
zm > C,<~~~~~~,f

C~~~~~~~~~~~~~~~~~~~~~~~~~mC
0~~~~~~~~~~~~~~
V V V V
~~~~~~~~~~'0'~~ ~~ ~ ~~~~~~~~~~~~~~~~~~~~5
C? o~~~~~~~~~~~~0-00
C~~~~~~~~~~~~~xC
'0~~~~~~~~~~~~~~~~~~~~
0~~~~~~~~~~~~~~~~~~~~~~~~2 2 ~ ~ a(
0 - u-fl~~~~~~~~~~~~~~~~~~~~ M

NZ 00 2- C-
7 uo-I 2
4, wt� w-I> -Vt-S -'ULU V � C� 4t.
0--�o2
o 'A- 2LU
- I 0.- I LU
' 0 2>
-.
�>% S
4 4 S
* S S.
V.
K
�S * *s,Id
� - � S
2 S*1b S4I"
S U a4

4 -14~~~~~~~~~~~~~~~~~~~~~~~~~~~~~~U
low~~~~~~~
9~~~~~~~19 ~ ~ ~ ~ -1.H~~~~~~• ,
9 -ZdASO~~~~~~~~~~~~~~~~~~~~~~~~~~~~~~U
vt-ZdNSD~~~~~~~~~~~~~~
00~~~~~~~~~~~~~~~~~~U
iE~ ~~~~~h_

C> C~~~~~~~~~~~~~~~~~~~~~~~~~~L
¶~~~~~~~~~IVt~~~~~~W
Is~~~
nO iS~~~~~~~~~~~
it~~~~~~~~~~~~~~~~~P I

96 1 3 0
0' 0)
to0
oL N DEESoUPYCETRRCMNMOIOIG ELRCMNDVRCI
41,10 0 po CD,2CD CD Co~~~~~~~~~R
$ ~~~~~~~~~~~~~~~~~~~) 0) $~~~~~~~~~~~~~~~~~~~~~~~~~~~~~~~~~~~~

-. I~~~~~~~~~~~~~C) N
C) 0 0
UEUN Do
o NoUC~~~~F'-I O'LP,
(0 ~~~~0 C)I 0W aci

DPP OP ~ ~ ~ ~ e 3
51~~~~~~~~~~A~~~~~~AM
MW A N~MA~ ~ ll
"ANP 22 i~~~~~~~AVNP
P~~~~~~~~~~~~~~~~~~~
~~~ flP4 fl?4~NPJPLY~F F~ RIaMN~~~~~~ (I ~ ~ ~ ~ ~ ~ RG W 0V i
U U S U~~~~~~~~~~~~~~~eUIP5ml I l I)~ 7P ',",WB

4) ~~~0
a,~~~~~~~~~~JID
.3~~~~~~.4
iF) (0 0 lu )~ WFYCD (0 (0 CD~~~~~~~~~~~~Fe

__ __ _L T g`1 3
A~~~
N~~~~~~~~~~~~~~W0)~~~~~~~~~~~~~~~K 1,
40 0~~~~~~~~~~~~~VWN

0 0
I-
Co V U)~~~~~~~~~~~~IHMN IRII(0 (0 (0~~~~~~~~~~~~~~O C lm
4) 0) I~~~~~~60) 0)J

964 36Remedial Design & Remedial Action Work Plan September 2008Operable Unit 8, DSCR
3 OU 8 FINAL REMEDY
Based on the evaluation of alternatives, Defense Logistics Agency (DLA), DSCR, and USEPA,with concurrence from VDEQ, have selected institutional controls and MNA with in situbioremediation as a possible contingency (Alternative 2) to be the preferred remedy to addressimpacted groundwater in the upper WBU at CU 8. The following presents a summary of theselected remedy as presented in the CU 8 ROD (DLA, 2007).
3.1 Institutional Controls
The selected remedy includes implementation and enforcement of institutional controls ([Cs).Potable groundwater use has been prohibited installation-wide. Land use will be solely for non-residential purposes until conditions allow for unlimited use and unrestricted exposure togroundwater. Land use controls (LUCs) will be attached to the property deed to restrictgroundwater use and prohibit residential development and land use for schools or childcarefacilities, should the property change ownership in the future before completion of' the remedy.An assessment by the DSCR environmental group will be required before construction activitiescan be undertaken at CU 8 to ensure that conditions will not present an unacceptable risk toconstruction workers. Prior to excavation, monitoring data will be reviewed to determinepotential vapor hazards and any associated health and safety requirements.
The DSCR Environmental land use control implementation plan (LUCIP) (MACTEC, 2006b,)will be amended to include CU 8-specific institutional controls.
Annual inspections will be conducted to determine whether the institutional controls remaineffective and that land and groundwater use restrictions are being achieved. The annualinspections will describe deficiencies or violations and proposed measures or corrective actionstaken or required. In the unlikely event of a deficiency or violation, DSCR will take appropriate
corrective action.
3.2 MNA
MNA relies on natural biological, chemical, and physical processes that, under favorableconditions, act without human intervention to reduce the mass and concentration of groundwaterCO~s. Natural attenuation processes include biodegradation, dispersion, dilution, adsorption,
3-1

964 .37Remediajl Design & Remedial Action Work Plan September 2008Operable Unit 8, 135CR
volatilization, and abiotic destruction. Under this alternative, groundwater will be monitored todocument that
* Off-installation concentrations remain below MCLs; and
* Concentrations or mass are being reduced by MNA.
Biological and geochemnical parameters will be monitored semi-annually for three years.Monitoring will be conducted annually thereafter. A review of historical groundwater datasuggests that aquifer conditions were favorable prior to DPE and air injection and are expected toreturn to favorable conditions. As presented in the FFS, TCE concentrations were reduced byapproximately 99 percent from January 1987 to January 1995, and the extent of the plumeretracted approximately 300 feet. Current contaminant concentrations and plume extent indicateno unacceptable risk to human health and the environment. However, continued verificationmonitoring is planned. Historical reductions have occurred, likely attributable to the DPEsystem and natural attenuation, but recent (post DPE operation) degradation rates have not beendetermined and will be evaluated during an initial three-year monitoring period. In accordancewith USEPA protocols (USEPA, 1998), the MNA processes will be scored to indicate ifconditions are supportive of natural attenuation processes. As shown in Figure 3-1, a two-tieredapproach will be used to confirm MNA. In Tier I, natural attenuation processes will beconfirmed and attenuation rates will be determined during a three-year period. The three-yearperiod will commence after approval of this document. Tier I will be based on the field andanalytical data from the semi-annual monitoring events for the three-year period. Tier 2 beginsthe annual groundwater monitoring phase (beginning in Year 4). A Contingency Work Plan willbe prepared at the onset of Tier 2 if trigger criteria are met.
3.3 Trigger Criteria
Under Alternative 2, multiple and converging lines of evidence will be used to evaluate naturalattenuation of COCs and daughter products in groundwater. These lines of evidence includehistorical data trends (showing plume stabilization and/or loss of constituent mass orconcentration over time) and geochemical data (showing suitable conditions for biodegradation).These lines of evidence will also serve and trigger criteria for the contingency remedy.Statistically significant contaminant concentration trends will be used as predictors of plume
3-2

964 38Remedial Design & Remedial Action Work Plan September 2008Operable Unit 8. 125CR
stability. Plume stability can only be verified via physical monitoring. For example, anincreasing contaminant concentration trend in the interior of the plume is a "negative" indicatorin that it may foreshadow a potential increase in the areal extent of the plume. On the other
hand, the observed concentration increases may be transient and/or may not result in anyexpansion of the plume. Statistically increasing trends at point-of-compliance wells moreclosely represent a net plume expansion and represent more strongly weighted triggers forcontingency action. Point-of-compliance wells are positioned on the DSCR installation to more
conservatively project compliance with the RAO of preventing unacceptable risk to humanhealth and the environment. Point-of-compliance wells are identified in section 4.0 and will be
subject to addition or substitution after each monitoring event. In order to validate theeffectiveness and protectiveness of the remedy over time, recommended changes to the long-term monitoring well network, to include point-of-compliance locations, will be submitted for
US EPA and VDEQ concurrence in annual and five-year review documents.
The following will be evaluated:
* Groundwater monitoring will be conducted to statistically evaluate data trends over time anddemonstrate the effectiveness of natural attenuation. The EPA MINA screening protocol will
be used to determine if conditions are supportive of biodegradation. If a statistically
significant increasing trend is observed at a particular location the geographic proximity ofthis location to points of compliance will be closely assessed. As identified in the ROD, thepotential impact of concentration increases at a particular location will assessed to verify that
the remedy remains protective and effective, If adequate evidence of biodegradation andplume containment is not observed, including but not limited to the degradation of parent
compounds, then the in situ bioremediation contingency will be implemented.
* A network of boundary wells (sentinel locations) and point-of-compliance wells will be used
to verify' model predictions and protect downgradient receptors. If threshold concentrations
are exceeded at the point-of-compliance wells at a statistically significant frequency, and it isdetermined that MCLs could be exceeded at boundary wells, then the in situ bioremediation
contingency would be implemented.
3-3

964 39Remedial Design & Remedial Action Work Plan September 2008Operable Unit 8, 05CR
4 REMEDIAL DESIGN AND REMEDIAL ACTION ACTIVITIES
The following sections present the remedial design and the remedial action field activities for theimplementation of the final remedy at OU 8.
4.1 Remedial Design
In accordance with the OU 8 ROD, the DSCR Environmental LUCIP was amended to includeOU 8-specific institutional controls (ICs). The OU 8 [Cs included designation of the land usesolely for non-residential purposes until conditions allow for unlimited use and unrestrictedexposure to groundwater. The ICs also included the requirement for a pre-constructionassessment before construction activities can be undertaken at OU 8. The LUCIP addendum wasfinalized in November 2007 (DSCR, 2007).
To evaluate the natural attenuation of the contaminants, semi-annual groundwater monitoringactivities will be conducted at the OU 8 upper WBU wells for a period of up to three (3) years(Tier I monitoring period). Table 4-I provides a list of OU 8 wells that will be monitored on asemiannual basis. Each monitoring well is designated as a plume well, a point of compliancewell or a boundary well in accordance with the OU 8 ROD. These wells were selected formonitoring based on a review of the site conceptual model, historical contaminant data, and theBIOCHLOR modeling results presented in the revised FEFS. The groundwater samples will beanalyzed for the parameters listed in Table 4-2.
Additional monitoring wells were installed in the areas shown in Figure 4-1. These wells weredesigned to monitor the groundwater in this area of previously identified elevated COCs(MACTEC, 2006c) and recently identified area of elevated VOC contamination. Prior toinstalling these wells, groundwater grab samples were collected using direct-push drillingtechniques and real-time data analysis (VOCs) in accordance with USEPA Triad procedures.Data quality objectives for field analyses are detailed in Technical Protocol for Evaluating
Natural Attenuation of Chlorinated Solvents in Ground Water (US EPA, 1998,). Based on thedirect push contaminant data, the monitoring well locations were finalized. Appendix Apresents a summary of the direct push investigation and the monitoring well installation. Figure4-2 shows the locations of the monitoring wells presented in Table 4-1.
4-1

964 40Remedial Design & Remedial Action Work Plan September 2008Operable Unit 8, 08CR
The well list in Table 4-1 likely includes substantial redundancy. Sampling results from the newmonitoring wells will provide new and critical information to validate what represents asufficient and optimized monitoring well network. In short, the long-term monitoring networkand program at OU 8 will be subject to optimization. Recommended changes to the monitoringprogram will be submitted as part of annual and Five-year reviews for US EPA and VDEQconcurrence.
The OU 8 site history suggests that contaminants likely impacted ground water twenty to fiftyyears ago. Ground water monitoring data from 1986 identifies that ground water was impactedat least twenty-two years ago. Contaminants have been documented in the upper WBU wellslocated upgradient, sidegradient, and down gradient of lower WBU wells. Historicallymonitored lower WBU wells include MWANP-120, MWANP-4D3, USGS-I, USGS-4, USGS-5,and USGS-6. Contaminants could potentially migrate into the lower WBU through adiscontinuity in the aquiclude. The ground water contaminant plume in the upper WBU hasmost likely receded from its maximum areal extent. Thus, the potential for contaminants in theupper WI3U to travel to a yet unreached theoretical discontinuity is negligible. Contaminantscould also migrate into the lower WBU via vertically downward advection, diffusion, anddispersion. The potential for this to occur in the future is rated low because contaminantconcentrations have declined significantly over time. The clay aquiclude material is of a lowenough vertical hydraulic conductivity to preclude contaminant penetration over the twenty-twoyear monitoring time frame as well as the potential fifty year time frame from potential release.Additionally, clays have a substantial adsorption capacity for organics like PCE and TCE.Neither the contaminant concentrations nor the flux rates appear high enough to overwhelm theadsorptive capacity of the clay aquiclude. Thus, monitoring of lower WBU wells (listed above)for VOCs is proposed to be performed every two years. If a considerable reduction (e.g., 30%)in the areal extent of the upper WBU plume is observed, then the requirement for continuedmonitoring of the lower WBIJ wells will be evaluated.
The following annual activities are proposed to evaluate the natural attenuation of COCs anddaughter products in the OU 8 groundwater (Tier I):
4-2

964 IRemedial Design & Remedial Action Work Plan September 2008Operable Unit 8, DSCR
*Statistically evaluate the contaminant concentration data trends. A minimum of fourcomparable sampling events are required to conduct a statistical analysis. Mann-Kendallstatistical methods (Gilbert, 1987) will be used to determine if threshold concentrations areexceeded at point-of-compliance wells at a statistically significant frequency. In accordancewith Gilbert, 1987, the following steps will be taken annually to evaluate trigger conditionsand appropriate actions:
o The most recent sampling results will be evaluated to determine if data for consecutiveevents are comparable. The term comparable is an important consideration so thatappropriate systematic, hydrogeological, or anthropogenic factors are considered. Forexample, ground water contaminant data obtained when the DPE system was operatingwill not, in most cases, per comparable to data collected when the system was shutdownfor an extended period. A change in sampling or analytical method may compromisecomparability. A minimum of four comparable events are required to conduct a validMann-Kendall analysis. Additional (if available) comparable consecutive results will beused to improve statistical significance;
o Mann-Kendall worksheets will be prepared for every well that meets the above criterion;o The geographic location of any and all wells where contaminant concentration exceed its
respective federal MCL,, display an increasing trend with a confidence interval in excessof 90% will be reviewed to determine if the plume will likely expand. Trends indowngradient and adjacent wells will be evaluated to determine if any net plumeexpansion is occurring.
o Plume wells displaying recent COG concentrations exceeding 10 times the MCL,increasing concentration trends of greater than 20% per year, and a confidence interval inexcess of 90% will be subjected to quality assurance/quality control (QA/QC) audit toverify past sampling and analysis procedures. These plume wells will be subjected tosampling and analysis during the next scheduled monitoring event;
o Point of compliance wells with most recent COG concentrations in excess of respectiveMCLs, increasing concentration trends of greater than 50% per year and a 90%confidence interval will result in an immediate confirmatory monitoring and qualityassurance/quality control (QA/QC) audit. Quarterly monitoring will be conducted untilthe greater than 50% per year increasing trend is no longer observed, le an increasing
4-3

964 42Rem edial Design & Remedial Action Work Plan September 2008Operable Unit 8, DSCR
contaminant concentration trend in excess of 50% per year is observed after fourconsecutive quarterly confirmatory monitoring events, in situ bioremediation via organicsubstrate addition will be implemented in and potentially upgradient of the subject point-of-compliance well. The MCLs for PCE, TCE, and VC are 5 pg/L, 5 zg/L, and 2 pg/Lrespectively. Thus, a 50% increase over each respective N4CL ranges from I to 2.5 pg/L.This I to 2.5 pg/L range is likely within the range of inherent sampling and analysisvariability. For example, a relative percent difference of 20% meets US EPA QA/QCcriteria. Concentration variations of I to 3 pig/L for PCE and TCE do not appear tojustify action unless a statistically increasing trend is sustained over an extended period.For example, two years of a 50% increasing trend could result in a transition from 5 Vig/Lto I I pg/L. The lower MCL for VC provides for a more stringent trigger criteria. It isalso important to note that VC is a degradation byproduct that is typically not persistent.Institutional controls and the proposed one year of quarterly confirmatory monitoringprovide sufficient lead time to implement the contingency remedy before anyunacceptable risks to human health and the environment are manifested.
a The OUS ROD also includes trigger criteria for the implementation of the in situbioremnediation contingency remedy in the event that the effectiveness of naturalattenuation is not demonstrated over time. Given that the plume has reached point ofcompliance wells and appears to have reached it maximum areal extent, the triggercriteria provided above are sufficiently stringent in that they do not allow significantplume expansion without action. Natural attenuation processes represent the mechanisms
of plume containment. Any "unacceptable" reduction in the effectiveness of naturalattenuation will compromise this natural containment and trigger the above criteria atpoint of compliance wells. The effectiveness of natural attenuation, and any otherremedy, should include its capability to bring about the reduction of contaminant mass,mobility, and toxicity. An absence of reduction in contaminant mobility and toxicitywould violate the above trigger criteria, namely increasing contaminant concentrationtrends and MCL exceedances would be exhibited in point-of-compliance wells.Although somewhat unrealistic, contaminant mass reduction may not be explicitlyvalidated using the above trigger criteria. Specifically, a total absence of ground wateradvection and contaminant transport could result in contaminant mass conservation and
4-4

964 43Remedial Design & Remedial Action Work Plan September 2008Operable Unit &, DSCR
an absence of increasing concentration trends across site wells. An additional naturalattenuation effectiveness criteria that specifies that all selected site monitoring wellsexhibit a statistically significant decreasing contarninant trend over each five year periodis proposed. Thus, a summary of the percentage of wells that show a statisticallydecreasing trend will be presented in the annual reviews. If less than 80% of the wellsdemonstrate statistically decreasing trends, a contingency remedy review will be initiatedwhich, at minimum, will include a cause-effect analysis. Projected exceptions todecreasing trend criteria include the following examples:
o, Wells that are justifiably removed from the monitoring program for technicalreasons with the concurrence of US EPA and VDEQ and are thereby not sampledover the most recent Five-year Review period will be exempt from consideration;
o Results from wells that display high variability will be separated into comparable
events or excluded'o Stable or no trend status will be acceptable at locations where contaminant
concentrations approach what would likely represent back diffusion from aquifermaterials (Ball, 2005). Contaminant concentrations trends that display anasymptotic progression to within 2 - 5 times of their respective federal N4CLs willbe viewed as examples of back diffusion. These locations and asymptotic plumebehavior will continue to be evaluated, but the existence of stable or no trendconditions at these asymptotic locations does not invalidate the effectiveness ofthe natural attenuation remedy. It simply represents the existence of mass transferlimitations that cannot be reasonably overcome by any available technology; and
o Recently installed wells without a sufficient data set to evaluate trends.* Utilize the USEPA MNA screening protocol to determine if subsurface conditions continue
to be supportive of natural biodegradation processes.
* Determine attenuation rates for the COCs after at least four comparable rounds ofgroundwater monitoring. Perform BIOCHLOR or equivalent groundwater modelingannually using these calculated degradation rates to predict the following:o Potential migration of COC plumes to the northeast causing off-installation
concentrations to exceed MCLs; and
4-5

964 iaRemedial Design & Remedial Ac/ion Work Plan September 2008Operable Unit 8, DSCR
o Estimated time for plumes to migrate off-installation (if off-installation migration were tooccur). Among numerous other input parameters, ground water modeling results arehighly sensitive to inferred ground water flow path. Current potentiometric data includepotential seasonal variations, effects of DPE system operation, rebound after DPE systemshutdown, less than optimal monitoring well placement, and possible survey elevationerrors. Thus, actual monitoring data, statistical contaminant concentration trends, andactual changes in plume configuration will be assigned a greater level of significance ascompared to modeling results.
A contingency Work Plan describing the in-situ biodegradation component of the remedy will bedeveloped (Tier 2 event) if:
* Parent compound (PCE and TCE) concentrations in the point of compliance wells areincreasing above the MCLs;
* Contaminant concentration in the site wells show statistically increasing trends;* MINA screening process does not show adequate evidence of biodegradation; and
* Modeling results show that contaminant concentrations in the off-installation groundwaterare expected to be above MCLs.
Results of the ongoing OU 6 and OU 7 treatability studies and procedures outlined in thePrinciples and Practices of Enhanced Anaerobic Bioremediation of Chlorinated Solvents(AECEE, 2004) will be used to finalize the OU 8 in-situ biodegradation approach. DSCR, incoordination with USEPA and VDEQ, may enact the contingency remedy prior to completion ofthe Tier I monitoring period if the monitoring data indicate a statistically significant increasingcontaminant concentration trend exists or if adequate natural attenuation rates are not observed.
However, if the results of the above analyses show adequate evidence of biodegradation with noprediction of off-installation groundwater concentrations exceeding MCLs, annual groundwatermonitoring activities will be conducted. A long term groundwater monitoring plan (Tier 2) willbe prepared for USEPA and VDEQ review and concurrence. This plan will summarize theresults of the above evaluations and propose the well locations, analytical parameters, frequency,and duration of future sampling events.
4-6

964 45Remedial Design & Remedial Action Work Plan September 2008Operable Unit 8, DSCR
4.2 Remedial Action Field Activities
In accordance with the OU 8 ROD and design activities described above, the following fieldactivities will be performed to implement the OU 8 remedial action.
Groundwater monitoring activities will be conducted in accordance with the Technical Protocolfor Evaluating Natural Attenuation of Chlorinated Solvents in Ground Water (US EPA, 1998),DSCR General Sampling and Analysis Plan, and Quality Assurance Project Plan (MACTEC,2004) as appropriate. Initial semiannual monitoring activities will be typically performed inSeptember and March of every year.
Additional monitoring well installation and site characterization activities were and will beconducted (if needed) using direct push drilling techniques. To determine contaminant extentand finalize locations for additional monitoring wells, groundwater grab samples were collectedusing a direct push rig and a discrete ground water sampling device (e.g., Geoprobe® SP-l5sampler). Groundwater samples were collected at multiple vertical intervals at each direct pushlocation by advancing the sampler to the bottom target depth (e.g., base of upper WBU),deploying the sample screen, collecting ground water samples via low flow sampling techniques,then retracting the sampler to the next shallower interval and repeating the sample collectionprocess. Initial intervals were selected based upon previous contaminant detections (e.g. SFSdata). The discrete ground water sampler has a 3 'A2 foot screened length. Sample depths wereadjusted to sample intervals that are separated by I 72 to 4 'A2 foot lengths. This type of focusedhigh density sampling provided a high level of certainty regarding actual contaminantdistribution and concentrations. After completion of the sampling activities, each samplinglocation was grouted with bentonite/cement slurry to the ground surface.
The ground water samples were analyzed for VOCs (SW8260) in an on-site laboratory. Uponcompletion of the characterization activities, monitoring wells were installed using the directpush rig. These monitoring wells were constructed using 3,4" diameter PVC casings with pre-packed screens. In addition, the OU 8 DP3 system was decommissioned in accordance with thework plan presented in Appendix B.
Annual site inspections will be conducted to verify the effectiveness of the LUCs. These siteinspections will be conducted during the groundwater monitoring events.
4-7

9 614Remedial Design & Remedial Action Work Plan September 2008Operable Unit 8, DSCR
Table 4-1: OU 8 Monitoring Wells
Well ID PurposeMWANP-21 Upgradient WellDMW-24A Plume WellDMW-30A Plume WellDP- I Plume WellDP-10 Plume WellDP-9 Plume WellDMW-31A Plume WellMWANP-l Plume WellDP-6 Plume Well
DP-7 Plume WellDP-8 Plume WellMWANP-15 Plume WellMWANP-2 Plume WellMWANP-3 Plume Well0S72-MWI Plume WellMWANP-17 Plume WellDP-lI Plume WellDP-2 Plume WellMWANP-22 Plume WellMWANP-7 Plume WellMWANP-23A Plume Well
0S72-MW2 Plume WellOU8-GW9 Plume Well0U8-MW50 Plume WellOU8-MW5I Plume WellOU8-MW52 Plume Well
OU8-MW53 Plume WellP 0~~~~~~~U8-MW54 Plume WellMWANP-24 Point of Compliance WellMWANP-25 Point of Compliance WellMWANP-26i Point of Compliance WellMWANP-27 Point of Compliance WellUSGS-2 Boundary WellMWANP-16 Boundary WellMWANP-19 Boundary Well
4-8

984 1,7Remedial Design & Remedial Action Work Plan September 2008Operable Unit 8, DSCR
MWANP-20 Boundary WellUSGS-I Lower WBU Well (every 2 years - VOCs only)USGS-5 Lower WBU Well (every 2 years - VOCs only)USGS-6 Lower WBU Well (every 2 years - VOCs only)USGS-4 Lower WBU Well (every 2 years - VOCs only)MWANP-4D Lower WBU Well (every 2 years - VOCs only)MWANP-12D Lower WBU Well (every 2 years - VOCsony
I~~~~~~~~~~~~~OW
4-9

96 4 4`8Rem ediel Design & Remedial Action Work Plan September 2008Operable Unit 8, 05CR
Table 4-2: Analytical Protocol for Monitoring Well Groundwater Samples, OU 8
Matrix
Field(F) orAnalyte Method Analytical
Laboratory (L)
Water
Redox Potential Direct-reading meter FDissolved Oxygen Direct-reading meter FpH Direct-reading meter FSpecific Conductance Direct-reading meter FTemperature Direct-reading meter F
Ferrous Iron Colorimetric, Hach Method 8146 (or similar) FAlkalinity (Carbonate[CO,2]) ~~~~~~~Titrimetric, Hach Method 8221 (or similar) F
Nitrate + Nitrite [asNitrogen (N)] Colorimetric, Hach Method 10020 (or similar) F
Sulfate Colorimetric, Hach Method 8051 I(or similar) F
Chloride (optional) E300.1I LMethane, Ethane, Ethene
(optional) RSK-1 75 LTotal Organic Carbon
(optional) 5W~~~~~9060 LVO~~~~s" SW82608 ~~~~~~~~~~L
a.VOCs = volatile organic compounds.
4-10

w0
o 0' eta- � U-- C I
V U'-4o rc�-J tan' 'a-� C * -
0 Law "a -'S
Ud Oici -Z0 <N �AtIA
C)0)or zLii"4 V<v�n I
______ ---I
*
a
* *+ *** a
0-d
1

C w
_____
�J a
0 I N..
0 C
zSiLk w
o 0CM -�O .� kU
toY �
* lviitoZ
LU L}
U I-' ULI-
�0 0
* a
* ..
S
a
a
* > a 4
It a J
U

964 51Remedial Design & Remedial Action Work Plan September 2008Operable Unit 8, DSCR
5 UPCOMING ACTIVITIES
Upon finalization of this document, the first projected groundwater monitoring event will be
conducted in September 2008. Upon receipt and validation of the analytical results, agroundwater summary report, describing the activities and results will be submitted to US EPA
and VDEQ.
The second monitoring event is scheduled for March 2009. The annual inspection will also beconducted during this event.
The Tier 2 work will commence in 2010 after completion of 6 rounds of groundwater
monitoring.
5-1

9684 5 2Remedial Design & Remedial Action Work Plan September 2008Operable UnitS8, DSCR
6 REFERENCES
AFCEE. 200 1. Aqueous Mineral Intrinsic Bioremediation Assessment Protocol, Air Force Centerfor Environmental Excellence, San Antonio, Texas.http://www.afcee.brooks.af~mi l/products/techtrans/monitorednaturalattenuation/amiba/mainmenu.pdf
AFCEE. 2004. Principles and Practices of Enhanced Anaerobic Bioremediation of ChlorinatedSolvents, Air Force Center for Environmental Excellence, San Antonio, Texas.
Butler, E. C.; Hayes, K. F. Kinetics of the transformation of trichloroethylene andtetrachloroethylene by iron sulfide, Environ. Sci. Technol. 1999, 33, 202 1-2027.
Butler, E.C. and K. F. Hayes. 2000. Kinetics of the Transformation of Halogenated AliphaticCompounds by Iron Sulfide. Environmental Science and Technology 34(3):422-429.
DSCR. 2007. Final Record of Decision Operable Unit 8 Acid Neutralization Pits GroundwaterDefense Supply Center Richmond, Virginia.
Ferrey ML, Wilkin RT, Ford RG, Wilson JT. 2004. Nonbiological removal of cis-dichloroethyleneand 1,1/- dichloroethylene in aqujfer sediment containing magnetite. Environ Sci Technol. 2004 Mar15;38(6): 1746-52.
Lee W. and Batchelor B. 2004. Abiotic reductive dechlorination of chlorinated ethylenes by iron-bearingiphyllosilicates. 12: Chemosphere. 2004 Sep; 56(10): 999-1009.
Lee, W. and Batchelor, B. 2002. Abiotic Reductive Dechlorination of Chlorinated Ethylenes byIron-Bearing Soil Minerals. I. Pyrite and Magnetite. Environ. Sci. Technol. 2002, 36, 5147-5154
MACTEC, 2004. Final General Sampling and Analysis Plan, Defense Supply Center. Richmond, Richmond,Virginia October 2004
MACTEC, 2006a. Final Revised Focused Feasibility Study Operable Unit 8Conceptual Site Model, DefenseSupply Center Richmond. Richmond, Virginia Revision 1, April 2006.
MACTEC, 2006b. Final Environmental Land Use Control Implementation Plan for Defense Supply CenterRichmondL Richmond, Virginia Revision 1, April 2006.
MACTEC, 2006c. Supplemental Feasibility Study Investigation Report, Defense Supply Center, Richmond,Richmond, Virginia Revision 1, February 2006.
National Research Council, 1993, In Situ Bioremediation, When Does it Work?: National AcademyPress, Washington, D.C., 207 p.
US EPA. 1998. Technical Protocol for Evaluating Natural Attenuation of Chlorinated Solvents inGround Water. EPA 600-R-98-128. September 1998.
6-1

954 53
APPENDIX A: DESIGN SITE CHARACTERIZATION MEMORANDUM

964 54
TECHNICAL MEMORANDUM
DESIGN SITE CHARACTERIZATION
OPERABLE UNIT 8DEFENSE SUPPLY CENTER RICHMOND
Backeround:-
This memorandum summarizes the site characterization activities performed in support of theremedial design (RD) and the remedial action (RA) for Operable Unit (OU) 8 at the DefenseSupply Center Richmond (DSCR). OU 8 is defined as the groundwater beneath anddowngradient of the Acid Neutralization Pits (ANI's), located in the northern portion of DSCR.The ANI's are referred to as OU 5. Previous investigations, including RemedialInvestigation/Feasibility Study (RI/FS), treatability studies, and the Supplemental FeasibilityStudy (SFS) investigation, identified impacts to groundwater downgradient of the ANI's and nearWarehouse 65 (see Figure 1). Groundwater results showed that chlorinated volatile organiccompounds (VOCs) in the upper water bearing unit (WBU) have extended from the ANI's to theeast/northeast. The primary contaminants of concern at OU 8 are tetrachloroethene (PCE),trichioroethene (TCE), cis 1,2-dichloroethene (cisl2DCE) and vinyl chloride (VC). During the2002 SFS investigation, direct push soil and groundwater samples were collected to determinethe extent of the contamination at OU 8. Figure I shows the SFS investigation locations.Locations OU8DPT-3, 3-1, 3-2 and 3-3 showed elevated levels of PCE and TCE atapproximately 15' to 17' below ground surface (bgs) as shown below:
* OU8DPT-3 (16-17 feet bgs): PCE 820 pg/L, TCE 1200 gg/L
* OU8DPT-3-I 1(15-17 feet bgs): PCE 120 pg/L, TCE 650 gg/L
* OUSDPT-3-2 (15-17 feet bgs): PCE 96 4g/L, TCE 330 gLg/L
* OU8DPT-3-3 (16-17 feet bgs): PCE 96 ptg/L, TCE 500 gig/L
Interviews conducted with DSCR personnel revealed that vehicle paint stripping operations werealso conducted in the former open cylinder storage area located north of Warehouse 65 (seeFigure I - blue area). No soil or groundwater samples were collected inside the storage areaduring previous investigations.
Page I of 5 September 2008

96 4 55
Objectives:
The objectives of the design site characterization were to:
* Determine the vertical and horizontal extent of groundwater contamination in the formercylinder storage area and in the area of elevated groundwater contaminant concentrationdiscovered during the SFS. This would be achieved by collecting multiple groundwatersamples using direct push techniques and using a field analytical laboratory to obtainquick-turnaround screening level data.
* Based on the direct push data, install permanent monitoring wells for incorporation intothe OU 8 remedial action monitoring network. Upon installation, groundwater samplesfrom the monitoring wells will be collected for analyses of VOCs and monitored naturalattenuation parameters in accordance with the DSCR Quality Assurance Project Plan(QAPP).
Field Activities and Results:
The site characterization activities and monitoring well installation were and will be conductedusing direct push drilling techniques in accordance with Environmental Protection Agency(EPA) Triad procedures. Data quality objectives for field analyses are detailed in TechnicalProtocol for Evaluating Natural Attenuation of Chlorinated Solvents in Ground Water.
Groundwater grab samples were collected using a direct push rig and a discrete ground watersampling device (e.g., Geoprobeg® SP- 15 sampler). Groundwater samples were collected atmultiple vertical intervals at each direct push location by advancing the sampler to the bottomtarget depth (e.g., base of upper WBU), deploying the sample screen, collecting ground watersamples via low flow sampling techniques, then retracting the sampler to the next shallowerinterval and repeating the sample collection process. The initial intervals were selected basedupon previous contaminant detections (e.g. SES data). The discrete ground water sampler has a3 VA foot screened length. Sample depths were adjusted to sample intervals that are separated by1 VA to 4 VA foot lengths. This type of focused high density sampling provided a high level ofcertainty regarding actual contaminant distribution and concentrations. After completion of thesampling activities, each sampling location was grouted with bentonite/cement slurry to theground surface. Direct push groundwater samples were collected at thirty six locations with oneto three vertical intervals at each location. Figure 2 shows the DPT locations. Locations
Page 2 of' 5 September 2008

954 56
0U8DPT323, 324, 325, 333, 338, 339, 340, 341, 343, 344 and 345 were installed in the former
cylinder storage area. The ground water samples were analyzed for VOCs (via SW8260) in anon-site laboratory. Attachment A presents the results of the on-site laboratory analyses.
Attachment B presents the on-site laboratory quality manual, while Attachment C presents the
standard operating procedure for the analytical method.
Based on the results of the direct push/screening level groundwater samples, three monitoring
wells were installed in the former cylinder storage area where PCE was detected in the mg/L
range and TCE, and cisl2DCE were detected in the high pg/L range. These monitoring wellswill be constructed using ¾/" diameter PVC casings with pre-packed screens. OU8NMW50 and
OU8MW51I were installed with a screened interval of I11' to 16' bgs, while 0U8MW52 was
installed with a screened interval of 12' to 17' bgs.
Direct push groundwater samples installed in the previous SFS investigation area did not show
elevated levels of VOCs as seen during the SFS. However, 0U8NMW54 (¾/" diameter PVC
casings with pre-packed screen) was installed downgrdient of the SFS investigation area(adjacent to OU8DPT326) due to the relatively high detection of PCE and TCE and due to the
absence of existing monitoring wells in the area.
OU8MW53 (Y¾" diameter PVC casings with pre-packed screen) was installed with a screenedinterval of IC' to 15' bgs due to elevated levels of benzene and toluene in the associated direct
push sampling locations (0U8DPT342 and 0U8DPT346). This well is located near a former
fuel fill stand, which explains the detection of fuel-related contamination in the groundwater
samples in this area. The locations of these wells are shown in Figure 4-2 of the Work Plan.
These wells were added to the list of wells to be monitored uinder the OU 8 remedial activities.
The first remedial action sampling event is scheduled for September 2008.
Page 3 ofi5 September 2008

C2
�, 0 0- OLt� �(0 0
0rZ�ES±40 0t t
U]
0
N_____________ p
U-'C
IIt
V
D

04 U]
a2
_____ �, 0 IL
ziO C-, �
-Y
L�
1U) � I05 SW
0) )-Z � � LUr�:' � 4,
C)
22 U]U) U.
Fin U]
± * [iLl 10 7:
a
A

964 is
ATTACHMENT A: ON-SITE LABORATORY ANALYTICAL DATA

964 60
KB Labs, Inc.6821 SWArcher RoadGainesville, FL 32608Phone: 352-367-0073
Fax:, 352-367-0073II~~~~~~bM~~~~~bWA ~~~~~~Email. infof~kbmobitelabsco
PROJECT NARRATIVEProlect Scope
From May 27 to 30, 2008, a total of 68 water samples were analyzed for Earth Tech atDSC Richmond, VA. The samples were analyzed for dichlorodifluoromethane,chloromethane, vinyl chloride, bromomethane, chloroethane, trichlorofluoromethane,11,11-dichloroethene, methylene chloride, t-1, 2-dichloroethene, 1,1-dichloroethane, c-i,2-dichloroethene, chloroform, 11,11,1-trichloroethane, carbon tetrachloride, benzene, 1,2-dichloroethane, trichloroethene, 1 ,2-dichloropropane, dibromomethane,bromodichloromethane, cis-1, 3-dichloropropene, toluene, t-1, 3-dichloropropene, 1,1,2-trichloroethane, tetrachloroethene, dibromochloromethane, 1,2-dibromoethane,chlorobenzene, 1,1,1 ,2-tetrachloroethane, ethylbenzene, xylenes, styrene, bromoform,Isopropylbenzene, bromobenzene, 1,1 ,2,2-tetrachloroethane, 1 ,2,3-trichloropropane,1 ,3,5-trimethylbenzene, 1 ,2,4-trimethylbenzene, 1 ,3-dichlorobenzene, 1,4-dichlorobenzene, 1 ,2-dichlorobenzene, 1 ,2-dibromo-3-chloropropane, 1,2,4-trichlorobenzene, hexachlorobutadiene, and naphthalene.
NELAP Certification
KB Mobile Labs Unit KB2: FDOH NELAP Certification Number E82840
Analytical Procedure
All samples were analyzed using SW846 Method 5030/8260 for waters. Ten (1 0)milliliters (mL) of water or air (air samples) were purged with helium and the volatileorganic compounds (VOCs) were collected on a solid-phase adsorption trap. Theadsorption trap was heated and back-purged with helium. The components were thenseparated by capillary column gas chromatography and measured with a massspectrometer (GCIMS) operated in the electron impact full-scan mode. The individualVOCs in the samples were measured against corresponding VOC standards.
Analytical Results
Laboratory results were provided to the client on an as-completed or next-day basis.Final results of the on-site analyses are provided in a hardcopy report. The dataproduced and reported in the field has been reviewed and approved for this final reportby the Director of Operations for KB Labs.
UKB Labs is a small, woman-owned business enterprise."
2 of 26

964 c I
KB Labs, Inc.6821 SW Archer RoadGainesville, FL 32608Phone: 352-367-0073
Fax:, 352-367-0073tb~~~~~~~~~~ny ~~~~~~~~Email. info~kbmnobilelabs.com
Uncrtantyof Reported Values
All measurement data presented in this report are subject to a degree of uncertainty andthe degree of uncertainty varies with each compound of interest. KB Labs estimates theuncertainty of each measurement using a statistical evaluation of the standard deviationfrom the mean percent recovery of a number of trials of a given measurement. Morespecifically, KB Labs maintains historical percent recovery control limits at the 99%confidence level for each analyte of interest. These are calculated as ± 3 times thestandard deviation from the mean of historical measurements of the percent recovery ofspikes of the analytes of interest into actual and control sample matrices. For example,if the lower and upper percent recovery control limits for a specific analyte of interesthave been determined to be 70 and 100 percent respectively, a reported value of 10.0ug/L will be with 99% confidence 7.0 to 13.0 ug/L.For more information about KIB Labsestimation of uncertainty, contact KB Labs' quality assurance officer and/or request acopy of KB Labs' SOP for determining measurement uncertainty.
Quality Control (QC) Data
Surrogate Recoveries - Table 1 lists the daily analytical sequence and percent recoveryresults for surrogate compounds, which were added to all analyses. Four (4) surrogatecompounds were added to each analysis in order to continually monitor general methodperformance.
VOC Spike Recoveries - Table 2 lists the percent recovery results for matrix spike andlaboratory control samples. A known amount of each target compound was added toselected field samples and to laboratory reagent water in order to monitor theperformance of each of the target compounds in the actual matrix and in laboratoryreagent water.
Method Blanks - Daily analysis of laboratory reagent water samples was performed inorder to monitor the cleanliness of the analytical system.
DATA REPORT NARRATIVE
1. All sample data has been reviewed and, if required, updated in the Final DataReport for rounding and significant figures.
2. Sample vials from the glassware manufacturer was determined to becontaminated with methylene chloride (-14 ug/L) and toluene (-4 ug/L) whileonsite. The source was of the contamination was not determined until the last
"KB Labs is a small, woman-owned business enterprise."
3 of 26

964 6 2
KS Labs, Inc.6821 SWArcher RoadGainesville, FL 32608Phone: 352-367-0073
Fax:, 352-367-0073Email., infoc~kbmnobilelpbs.co
day onsite (5/30/08). All methylene chloride and toluene results prior to sourcediscovery are identified with B data qualifier. Please note that samples dilutedappear to have large results for these two compounds when in actuality they areprobably non-detect. LOS recoveries for these two compounds are also elevatedbecause of the contamination.
3. Sample ID OU8DPT317-10 reported m,p-xylene <2.0 ug/L changed to 2.3ug/L.
4. Sample ID 0U8DPT324-17 reported trichloroethene 57 ug/L changed to 67ugIL.
5. Sample ID 0U8DPT333-12 reported trichloroethene 740 ug/L changed to630ug/L.
6. Sample ID 0U8DPT337-17 reported o-xylene <11.0 ug/L changed to 2.5ug/L.
7. Sample ID OU8DPT345-12 on the preliminary sheet should be OUSDPT346-12.
8. All samples with an '1" qualifier for an analyte indicate the concentration slightlyexceeded calibration range.
'KB Labs is a small, woman-owned business enterprise."
4 of 26

964 63KB LABS, INC.
Table 1: Analytical Run Sequence/Surrogate Percent Recoveries
Client: Earth Tech Driller/Sampler: North American Probe Analyst: Enoch
Site: 050 Richmond KB Labs Project Manager: Kelly Bergdoll KB Labs Project No: 08-1 29On-si-te Dates: -5/27/08~- Client Project Manager: Manish Joshi Matrix: Water5/30/08 _ _ _ _ _ _ _ _ _ _ _ _ _ _ _ _ _ _ _ _ _
Sample ID Date of Surrogate % Recovery Surrogate Control LimitsAnalysis Si* S2* S3* ISiC* _SV1 jFS-2 * S3*j S4*
METHOD BLANK 05/27/08 100 98 98 99 Pass Pass Pass PassVSTD 10 065-/27/08 1_0_0 99 101 95 Pass _Pass P__ass -PassRSTD ~20 0-65-/27/08 9-9 97 9-9 9-5 -Pas-s Pass- Pass _P~a-ss6u-80DPT310-~19 0 65/275/08 T10 1T03 '10-1 1-00 Paiss _Pa~ss as PsbUSOP-i ~ 065-/27/08 1_i05 1_i04 9-7 1-01 P~as-s -P-ass -Pass- -Passou8bPT_31o-1_4 0d5_/27/08 102 10n5 9-9 -101 P_5a~ss P~a~ss Pass PRass-b6oP-T310-1 4 MS -- 605/27/08 1704 1-07 9-7 9-5 _Pass -Pass Pass PassbbiPT310o-14 MSD 05/2-7/08 1-02 1-03 9-7 9-2 Pass -Pass -Pass PassbU8-OP-l i 0 - 65-/27/08 -102 106 9-9 1-01 Pas Pss Ps ass-6teibPT31 1-m 05-/2-7/08 10o6 -106 9-9 9-9 _Pass P~ass Piass PassOU8-DPT3I_-_9 0_d5_/27/08 105 1_0_8 9-7 1-00 `P-ass -Pass Pass Pass6u8-oPT311-9 ~ 065/2-7/08 1-06 1T08 9-8 102 -P~a-ss -P-a-ss -P~a-ss -P~a-ss608oPT312-114 _05-/27/08 1T0-6 -109- 98 1-02 _P~a-ss _Pass- Pa`ss -Pass_OU8DPT312-9 6_ 5-/2 7/0 8- 10 1 _1_08 9-7 9-9 _P-ass Pass Pa~ss P-amssOU18D 31_3-19 0_65_/27/08 1-03 1_0_8 9-5 9-8 -Pass Pass _Pa~ss Pas-sowiDoPT313-1 9A 0_-5-/27/08 10~3 0o8 9-9 9-9 P5a-s-s Pass P_5a-s s- P as soU8DPT31 3-14 0 -5-/27/08 105o _109 9 7 9-8 Pass Pa-ss Pa'ss Pass0U81DIPT313-9 0~b5-/27/0-8 -106 1-10 9-8 1_0_0 Pass Pass P-a-ss -Pass0U8DIPT3114-14 0-5/27/0-8 105 1 06- 97 1-01 -Pass Panss Pass -Pass0U8DPT3_14-9 05o/2_7/08 10o5 10_i5 9-8 -103 P-ass Pia-ss- Pass PassVSTD 20 __ __ -05/2-7/08 1-06 1-12 1-00 9-6 Pas Pas Pass PRassMETHO'DBLANK - _ 065/2-8/08 9-9 102 98 9-9 Pas as Pass PassVSTD 1_0 _____ 0-5-/28/08 1-03 1-05 98_ 9-7 Pass Pass P-Cass _Pa-ssRSTb f 20 _____ 065-/28/08 -10-0 99 100000-O- Pass Paiss _Pass PassMETHOD BLANKRE-RUN 065/28/08 1-04 1-03 1_01- 102 P-~ass -Pa-ss- Pass PassMETHOD BLANK RERUN 05/28/08 103 102 99 104 Pass Pass Pass PassOU8DPT315-9§ 065/28/08 99- -100 1-00 1-01 P5ass P -ass PSs Pass6[AbPT315-15 05/2-8/08 1-02 1-07 9-6 9-8 Pass Pass- PSs Pass6ugDPT31_6_14 0__5-/28/0 102 105 100 103 Pass Pa~s-s Pass PassOU8DPT316-9 __ _05/28/08 102 105 98 -1 00 Pa ss -P-ass Pass PassB66-MW_2 __ 5/2-8/08 1-04 1-04 10 15 Pas as Pss asOU8DPT_317-15 -605-/28/08 1-02 1_03_ 10-0 1-02 PBass -Pass Pass PassOU81PT-317-1O -605-/28/08 1-02 1-01 1i 02- 1-05- P-ass _Pass Pass PassMVETHODB6LANK - 05/28/08 100 1 _0_6 9-9 9-7 Pass PaFs~s Pass Pass8366-MW1 ___ __ 5-/28/08 1 01 1-06 9-7 1-00 PRass Pass Pass -Pass6Li8DPT3_18-22 05/28/08 105 _1 03 - 9-9 105 Pass Pa-ss Pass PFa-ssOU8DPT31-_16 0_5_/28/08 -103 1-i02 101o 10o5 P-as-s -P~ass P~ass -PassbumbPna18-16 M _m 0b5-/28/0-8 100w 100o 97 9-6 Pass _Pass -Piass P~ass
SI = Dibromofluoromethane (67% - 141 %)52 = 1,2- Dichloroethane-D4 (53% - 147%)S3 = Toluene-DS (83% - 113%)54 = 4-Bromofluorobenzene (78% - 1 19%) Table 1 Page 1 of 3
5 of 26

964 64
KB LABS, INC.
Table 1: Analytical Run Sequence/Surrogate Percent Recoveries
Client: Earth Tech Driller/Sampler: North American Probe Analyst: Enoch
Site: 050 Richmond KB Labs Project Manager: Kelly Bergcfoll KB Labs Project No: 08-1 29
On-site Dates: -5/27/08- Client Project Manager: Manish Joshi Matrix: Water5/30/08 _ _ _ _ _ _ _ _ _ _ _ _ _ _ _ _ _ _ _ _ _ _ _ _ _ _ _ _ _ _ _ _ _ _ _ _ _
Sample ID Date of Surrogate % Recovery Surrogate Control LimitsAnalysis S11 S2 S3* S4t __81* I S2* S3* S4*k
0U80PT318-16 MSD 05/28/08 104 105 104 99 Pass Pass Pass PassduaoPT317-10 MS 05/28/08 104 10O 4 9-8 98 Pass Pass Pass PassOUi8DPT317-10 MSD 05/28/08 102 104 101 94 Pass Pass Pass Pass0U8DPT319-19 065-/28/08 _1 02- 100 100 102 Pass Pass Pass PassOU8DPT319-14 - ~05/28/08 102 109 98 102 _Pass Pa-s s _Pa ss PsOU8DPT320-14 _ 05/28/08 103 112 97 10O2 Piass -Pa-ss P~ass PassOU8DPT320-9 05/28/08 101 106 198 100 Pass -pass Pass PassOU8DPT321-14A 065-/28/08 1-10 115 95 100 Pass Pass Pass Pass6U8DPT321-14 0-5/28/08 1-03 108 100 100 Pass Pass Pass PassbU8DPT321-14A 05/28/08 104 102 103 100 Pass Pass P-Cass PassOU8DPT321-14 ___ 5 -/28/08 170 1 100 101 -- 1-03 Pass Pass Pass Passd Ub8DPT32-1 -9 _ 05/2-8/08 1-08 109 99 98 Pass Pass Pass Pass6GbPTjmfrA -14___ 05/28/08 99 107 96 101 Pass Pass Pass Pass6U6DPT322-9 05/28/08 _10_3 1-07 95 99 Pass Pass Pass Pas0U81DPT323-118 ____05/28/08 107 110 95 101 Pass Pass Pass PassOUBDPT3_23-13 - 05/2 8/08 1-09 104 100 102 Pass Pass Pass PassVSTD2O - - 05/28/08 101 101 100 94 Ps Pass Pass Pass
METHOD BLANK - 05/29/08 98 106 ~100 98_ Pass Pass Pass PassVSTDi 10___ 05/29/08 17 104 99 101 Pass Pass Pass PassRSTD_ 20 ___ 05/29/08 102 103 101 97 Pass Pass Pass Passbu8_PT322-14 _ __- 065-/29/08 108 108iw 97 97 Pass Pass Pass Pass6U8DPT322-9 ____ 05/29/08 106 104 100 103 Pass Pass Pass Pass
0U80PT323-13 __ _ 05-/29/08 103 104_ 9-8 96 Pass Pass Pass Pass0U8DPT324-17 05/29/08 105 114 98 10-0 P5a-ss Pass Pass Passbu8DPT-324-l1 0-5-/29/08 106 107 97 100 Pass Pass Pass Pass-0U80-P12 6__ 5-/29/08 106 109 95 98 Pass Pass Pass PassOU8DMlW-30A 05/29/08 106 109 97 102 Pass Pass Pass PassbuBDPT2.5--18 -0C5-/29/08 10o4 10o8 98 99 Pass Pass Pass PassbU80PT325-i1 0__-5-/29/08 _10-5 113 98 104 Pass Pass Pass PassMWANP9 065/29/08 1-06 113 94 -100 5Pa-ss Pass Pass Pass0U8DPT132-6-14 - 05/29/08 1 0 6 116 96 103 Pass Pass Pass PassOU8IDMW-30A__ 05/29/08 13 07 94 96 Pass Pass Pass Pass0U8DP12 MS ____ 05/29/08 109 112 97 98 Pass Pass Pass Passb dOUSDi2MSD 0 5_/2_9/08 105 ill 96 96 Pass Pass Pass PassMWANP MS __ _ 05/29/08 104 106 97 95 Pass Pass Pass PassMWA7NP9 MSD __ 05/29/08 108 109 98 102 Pass Pass Pass PassbuabPT327-14 ___0/90 10 12 98 01 Pass Pass Pass PassOU8D3PT38-_14_ 05/29/108 1-07 108 94 96- Piass P_1a-ss Pass Pass'Surrooate Compounds:SI = Dibromofluoromethane (67% - 141 %)52 = 1,2- Dichloroethane-D4 (53% - 147%)SS = Toluene-D8 (83% - 113%)S4 = 4-Bromolluorobenzene (78% - 1 19%) Table 1 Page 2 of 3
6 of 26

964 6
KB LABS, INC.
Table 1: Analytical Run Sequence/Surrogate Percent Recoveries
Client: Earth Tech Driller/Sampler: North American Probe Analyst: Enoch
Site: OSO Richmond KB Labs Project Manager: Kelly Bergdoll KB Labs Project No: 08-1 29
On--site Daes ~5/27/08- Client Project Manager: Manish Joshi Matrix: Water5/30/08 _ _ _ _ _ _ _ _ _ _ _ _ _ _ _ _ _ _ _ _ _ _ _ _ _ _ _ _ _ _ _ _ _ _ _ _ _ _ _ _ _
Sample ID Date of Surrogate % Recovery Surrogate Control LimitsSample ID ~~Analysis Si* S2* S3r S4* SI*[ S2* S3* S4*
0U8DPT329-14 05/29/08 105 115 96 98 Pass Pass Pass Pass6U8DPrT329-1 4A 065/29/08 102 112 98 103 Pass Pass Pass PassOU8DPT330-1 4 05/29/08 10O6 _1_14 9-8 99 Pass Pass Pass PassOU8DPT33I-14 05/29/08 -109 107 97 97 -Pass Pass Pass PassdU8DPT332-14 05/29/08 111 110 103 98 Pass Pass Pass Pass0Ui80PDTM3_3-18 __ 05/29/08 110 107 98 99 Pass Pass Pass Pass0U8D)PT333-112 05/29/08 110 107 97 102 Pass Pass Pass Pass0U8DPT331-14 ____ 05/29/08 107 114 95 92 Pass Pass Pass Pass0U06PT-334-14 065/29/08 110 109 98 104 Pass Pass Pass PassbU80DPT334_-9_ 065-/29/08 1066 10 97 96 _Pass Paiss -Pamss PassMETH~b _BLANK - -05-/30-/08 1-10 115 96 99 Pass Pass Pass PassVSTD 10 ___ 05/30/08 106 105 97 102 Pass Pass Pass PassRSTD 20 ___ 05/30/08 _108 109 100 101 Pass Pass Pass PassbU8DPT334-9 05/30/08 10 6 1-04 9-8 1-03 Pass Pass Pass PassoU8DPT335-17 - 05-/30/08 111 110 99 102 Pass Pass Pass Pass6u8b1PT336-17 - 05_/30/0_8 114_ 1-14 9-5 102 P__ass Piass Pas-s P5anss0u8DPT337_-17 05/30/08 1 10- V112 9-7 103 Pass Pass Pass Pass0O6DPT338-17 05/30/08 -1 1 0 1-13 9-9 102 Pass Pass Pass Pass0U8DPT339-1 7 05/30/08 108 116 97 98 Pass Pass Pass PassoU8DPT34o-_17 05/30/08 1-09 117 97 99 Pass Pass Pass PassblUMPT3411-17 _ _ 05/30/08 108 117 94 _98- PFa~ss Pass Pass Pass6U8DPT-341-17A ____ 05-/30/08 10 3 110- 9-5 100 Pass Pass Pass Pass6bj8DPT342-17 05/30/08 108 118 96 100 Pass Pass Pass Pass0U8DPT342-112 0-5-/30/08 1-04 1-15 96 96 Pass Pass Pass PassbU8DPT342-17 05/30/08 110 107 98 99 P-Fa-ss Pawss Pass Pass0U18DPT43-112 0-5-/30/08 -112 117 98 96 Paf~ss Pass Pass PassOU8DPT343-12 05/30/08 110 118 96 99 Pass Pass Pass Pass0U8DPT344--12 05/30/08 112 115 99 103 Pass Pass Pass PassbU8PT3_45-1 2 065-/30/08 1i0-8 1-17 94 103 Pass Pass Pass Passcu8bPT3I44-12 05/30/08 1 _14 116 95 196 Pass Pass Pass Pass0U18DPT34_6-12 -- 05/30/08 114 120 97 1101 Pass Pass Pass PassVSTo20 105/30/081 113 121 196 197 1Pass Pass IPass PassComments: Although some surrogates may be out of the control percent recovery range, other
supporting QC, such as matrix spikes, matrix spike duplicates, method blanks, andlaboratory control samples, are performed by KI3 Labs to further validate reporteddata.
'Surrooate Compounds:SI = Dibromofluaromethane (67% - 141%)S2 = 1,2- Dichloroethane-D4 (53% - 147%)S3 = Toluene-08 (83% - 113%)S4 = 4-Bromofluorobenzene (78% - 1 19%) Table 1 Page 3 of 3
7 of 26

964 .66
KB LABS, INC.
Table 2: VOC Spike Compound Percent Recoveries
Client: Earth Tech Driller/Sampler North American Probe Analyst: Enoch
Site: DSC Richmond KB Labs Project Manager: Kelly Bergdoll KB Labs Project No.: 08-129
On-site Dates: 5/27/08- Client Project Manager: Manish JoshiMarxWte5130/08 _ _ _ _ _ _ _ _ _ _ _ _ _ _ _ _ _ _ _ _ _
Matrix Soike/Matrix Spike Duplicate (MS/MSDt:
Samples: OU8DPT310-14 MS Date of Analysis: 5/2712008OU8DPT310-14 MSD ________ ______ _______
Matri Spik Compunds Control Limits Percent Recoveries Control Limit ChecksMatri Spie Comound Loer I Uppr IRPD iOI F~D M S RPDDU Fio-ro-dillurom-n ethani g 2 o d Pas Pas Pass
Chloromethanc 39 142 I 20 -97 9 10 Pass _ Pass PassVinyl Chloride 20 1874t-20 102 101 I 1 Pass Pass __ _ Pass-Bromomethane 70 130 20 71i 84 17 Pass j Pass -PassChioroethane - 70 130t 20 86 91 6 Pass as P assTrichlorofluoromethane 56 149 _20 107 106----- Pass _ Pas Pass1,1-Dichloroethene 52 144 20 102-101 2-_ Pass Pass f PassMethylene Chloride 47 148 t 20 166 95 6 -Pass -Pass -- pass_trans-1,2-Dichloroethene 41 157t 2 10±11[0 -Pass -- Pass- -Pass1,1-Dichloroethane 69 134 20 10311 T _Ps
cis-1,2-Dichloroethene 59 143 20 101 100o 0 Pass 1 as PsChloroform 64 148 20 103 1044 1 PasPass Pass1.1,1-Trichloroethane 53 147 20 -103 102 2 1 Pas s-- Pia ss [ PasisCarbon Tetrachloride 51 161 20 102 _103 0 Pass Pass Pass
Benzene ~~~~~~51 149 *-20- 101 101' Pass Pss [ Pass1,2-Dichloroethane 51 16 20 10 W as Pass Passi33 -20 -1 + 10 -3 -- s - ------ ---Trichloroethene - 50 147 +20 102 9 2, Pasas1,2-Dichloropropane Pass -Pass- - --------~~~~~~~~~~~~~~~~~~~~~~~~~~~~~~~~~~~~~~~~~~~~~~~~~~~~~~~~~~~~~~~~~~~~~~~~~~~~~~~~~~~~~~~~~~~~~~~~~~~~~~~~~~~~~~~~~~~~~~~~~~~~~~~~~~~~~~~~~~~~~~~~~~~~~~~~~~~~~~~~~~~~~~~~~- - - - -- - - - -- - - - -1,2-Dichloropropane 62 _ 150 20 104 101 Pass Pass Pass
Dibromomethane 70 -~130 20 100 1-03- 3 Pass- P ass- -PssBromodichloromethane 58 156 20 103 103 0 0 - ass - Pass Passa ~ ~ -I- Passc-1,3-Dichloropropene 53 169 20 - 101 101 _0 Pass Pass t- PsToluene 60 136 '20 93 9 _as as Pst-1,3-Dichiloropropene 72 154 20 9 9 Pass Pass: Pass1,1,2-Trichloroethane 64 _144 20 98 104 6 - _Pass __ Pass ' PassTetrachloroethene 56 1-38 20 95 95~ 0 Pass Pawss PssDibromochloromethane 69 147 20 102r102 _ 1 Pass--- Pass I- Pass-L I ss- s1,2-Dibromoethane -70 130 20 - 7 '103 6 Pass Pass I PassChlorobenzene 83 _ 128 20 97 98 i Pass Pass I -RPass1, 1, 1,2-Tetrachloroetthane 62 156 20 100 103 3 Pass ' Pass ' PassEthylbenzene 60 143 20 92 : 92 0 Pass Pass Passm,p-Xylene 58 -14 -2 0 9-3 92 I 1 Pss_ Pss i Pso-Xylene 57 + ~~~~ ~~145 20 ba + Pass '- - P -
o-Xylene 57 m zo m +93 0--* Pass Pass RsSlyrene - 64 - 14~~~~~6 - 20 94 93-- 1- _Pass _ Pass P-- assBromoform 59 157 20 91i94 3 Pass ' Pass Passlsopropylbenzene 70 130, 20 93 92 0 Pass Pass I assBromobenzene 70 -130 20 - 0 90 0 __Pass 4-Pass Pass1,1,2,2-Tetrachloroethane 70 130 20 98 ioi1 Pas--Pas -Pass
95 + 99 ~~3 Pass Pass ' Pass1.3.5-Trimethylbenzene 70 130 20 94 921- 2 Pass Pass Passt I _ -- -- ~ ~ s - - _ --1,2,4-Trimethylbenzene 70 130 20 94 -91 2 Pas-r PSs P--ass1 ,3-Dichlorobenzene 74 117 20 92 6 3 0- Pas Pass Pass
1,4-Dichlorobenzene -76 116 20 93 94 1 Pass Pass Pass1,2-Dichlorobenzene 72 14 20 -95------ 1 -Pass Pass Ps1.2-Dibromo-3-chlorapropan 44 182 20 93-j 102 10 Pass Pass- - Pass1,2,4-Trichlorobenzene 57 102 20 90 91 _ -_I __Pass Pass PassHexachlorobutadiene 70 130 20 98 96 1 Pass Pass i Pass[Nanththalone 47 158 20 I 8d 1 4 7 - .Pass - as I P as-sNote: Control Limits are based on a semi-annual historical evaluation of mobile unit.
Table 2 Page 1 of 7
8 of 26

KB LABS, INC. 964 -6?Table 2: VOC Spike Compound Percent Recoveries
Client: Earth Tech Driller/Sampler North American Probe Analyst: Enoch
Site: DSC Richmond KB Labs Project Manager: Kelly Bergdoll KB Labs Project No.: 08-129
On-site Dates: 5/27/08- Client Project Manager: Manish Josh!iarx ae5/30108MarxWte
Samples: OU8DPT317-10 MS Date of Analysis: 5/28/2008OU8DPT317-10 MSD _ _______
Matri Spik Compunds Control Limits Percent Recoveries Control Limit ChecksMatrix Spik CompoundsLower I pprTPD MS IiFTD RPD MS I MSD RPD
Dlchlo-ro-dilu-oronie-thani 90 t120 C0 89 9 W § t <LCL Pass H PassChiom6mathac 39- + 4 20 -99- 96 - 4 Pass, Pass PassVinyl Chloride -29 187 20 100 99 I ss Pas s K PassBrornorethane 706 39- 20 5 78 4 -Pass 4 Pass PassChloroethane -70 + 130 420 95 4 Pass j _Pass__ PassTrichloroifluoromnethane 56 149 20 104 105 0 P ass Pass Pass1,1-Dichloroethenie 52 144 20 104 102 2 Pass Pass PassMethylene Chloride 47 1481 20 -85 95 _ 1-0 Pas-as s ss I _ Pass-trans-1,2-Dichloroethene 41 +157 -~20 102 102 0 Ps as F Ps1,1-Dichloroethane 69 134 206 102 102 0 Pass Pass Pass _
cis-1,2-Dichloroethene 59 143--20 101 10O0 1 Pass P ass PassChloroform 64 148 20 17 10i as fas fPs1,1,1-Trichloroethane 53 14A7 20 105--104 1 -pa-Ss PassCarbon Tetrachloride S1i- 181 20 102 10 1 ass Pas Pass-Benzene 51 149 20 104 105 1 Ps as I Ps
1,2-Dchlorethan 5 1 163 20 102 105 3 Ps as Ps1,2-ichloroethene 51 4 0 4 Pass Pass I Pass1,-hchloroprthene 50 15 90 -- -+17 20 100 49 Pass - Pas PassDibromomethane 70o 130 20 100 94 6 Pass Pass PassBromodichloromethane -58 *156 20- 102 103 1 Pass 4 Pass P-assc-1.3-Dichloropropene 53 169 i id 97 4 Pass- Pass - P-as-sToluene (60 136 r20 95 _100 5 - -ass Pass I- Pass-t-1.3-Dichloropropene 72 -1541 20 _92 _94~ -2 Pass Pasas_-1,1,2-Trichloroethane 64 144 20 n 100 1-0-1 1 Pas as PassTetrachloroethene 56 138 20 89 92 3 -Pas-s Pass PassDibromochloromethane 69 1 47 20- 9-4 -9-6 Pass -- Pass Pass1,2-Dibromoetharne 70 130 20- 94 101 8 Pass Pass j PassChlorobenzene - 3 +128 20 7 110N I- Ps1,1,1,2-Tetrachloroethane 62 16 20 - -98-102 4 -F_ Pas Pas Pass---Ethylbenzene 60 143 -20 100 -99 1 Pass Pass Passm,p-Xylene 58 142 1 2 0 9 67 -6- - Pas-s Pass Pso-Xylene 57 145 20 101 lO0 jO Pass L Pass 4 PassStyrene 64 146'20* 94j 94 10( Pass Pass PsBrornoform 59 157 20 91 9--2 as Pass -,I Pa-ssIsopropylbenzene 70 136 20 99 97 1 Pass -- Pass 1 PassBromobenzene 70 1 420 96 97 1 Pass _ Pass Ps1, 1,2,2-Tetrachloroethane 70 130 20- 99 97 2 Pass pass I Pass1.2.3-Trichloropropane -70 +130 -20 99 97 2- Pass Pas s-- -Pass-1,3,5-Trimethylbenzene 70 t130 20 - 96 95 1---s as Ps1,2,4-Trimethylbenzene 70 130 20 94 94 1 Pass Pass- -Pass1 ,4-Dichlorobenzene 76 1167- 26 95_ 100 5 Pass Pass i Pass
1,4-Dihlorobnzene 6 1 16 26 93 95- 3 Pass Pamss P-ass1,2-Dichlorobenzene 72 124 20 94 9~5 1 Pass Pass, Pa-0ss-1,2,4-Trchlorobnzene 57 102 20 7 63 7 pass Pass Pass
L ~~~~~~~~~~~~~~~~~~~~~~~~~~~~~~~~~~~~-------------------------- ns[Naphthalene 47 158 _____20 6_ 72 _7 as Pss Pass
Note: ontrolLimit are bsed ona sem-annua histoical valuaton of obileunit.
Table 2 Page 2 of 7
9 of 26

964 68KB LABS, INC.
Table 2: VOC Spike Compound Percent Recoveries
Client: Earth Tech Driller/Sampler North American Probe Analyst: Enoch
Site; DSC Richmond KB Labs Project Manager: Kelly Bergdoll KB Labs Project No.: 08-129
On-site Dates: 5/27/08- Client Project Manager: Manish JoshiMarxWte5/30/08MarxWte
Samples: OU8DPTI8-1 6 MS Date of Analysis: 512812008OU8DPT18-16 MSD
Matrix Spike Compounds Control Limits Percent Recoveries Control Limit ChecksDlchlordifluoomethan ~~Low erfIUppr PD III~IIIIIIIPD MS I MSD RPDDichlordifluornnethar 90 120 u 9u 3 Pass [ LCL PIassChlolronnthanE 39 142] -20 93 984 _ 1 - -pas PaI PassVinyl Chloride 20 ' 8 0 9 0 4 Pas as Ps187 1_20_ 10( - -PsBromomethane 70 130J 20 62 71 13 -<LCL L Pass _iPassChloroethane 70 130 120 - 88 86 1 Pasas _ as-p_ a s ___as PasTrichlorofluoromethane 56 149~ 20 100 15 5 Pass Pass I Pass
1.1-Dichloroethene 52 14 20 94 100 5 P-ass Pass-- I -PassMethylene Chloride 47 148 20 -77 ,71--- -8 P1ass -. Pass I _ Passtrans-1,2-Dichloroethene 41 157 20 96 99 3 -Pass__ Pass.. Pass_1,1-Dichloroethane 69 134 20 96 101 6 Pass Pass L asscis-1,2-Dichloroethene 59 143 20 97 98 2 Pass Pass 1 PassChloroform 64 + ~~~~~1481 20 97 12' 5 Pass Pass _Pass1,1,1-Trichloroethane 53 147 I20 10 0l4l 4 Pass -Pass Pass_Carbon Tetrachloride 51 161 20 99 104 1 5 Pass Pass i- Pass _
Benzene ~~~~~~~51 149 t 20 97+102 4 Pass Pss I Pass1,2-Dichloroethane 5 147 20 95 100~ Pass PsTrichloroethene 50 4 20 97 105 8 Pas Ps1,2-Dichloropropane 62 -5 20± 0 Pass I Pass I PassDibromornethane 70 +130 20 89 * 7 -6 P9 - Pass PassBromodichloromethane 58 16 2 94 101' 6 Pass Lp- Pass-0-1,3-Dichloropropene 53 169--20 86 95 1 Pas Pass Pass _Toluene 60 136 429 88 92 .4 Pass Pass i Passt-1.3-Dichtoropropene 72r 154 20 82 94 14 Pass Pass Pass1,1,2-Trichloroethane 64 144 20 92 i 13 Pass Pass I PassTetrachioroethene 56 138 20 102 ,11 I 9 Pass P-as 4 PassDibromochloromethane -69 147 '20 90 100 11 Pass '_Pamss Pass1,2-Dibromoethane 70 130 1-20 86-98 _ 13- -Oa ss- Pass I PassChlorobenzene 83 128 20 99 9§ Pass - Pass 1
_Pass
1.1,1,2-Tetrachloroethane 62 +156 20 93 1066 13 Pass Pass IPass_Ethylbenzene 60 143 20 96 98 2 Pass Pas t asm,p-Xylene _58 142 20 90 96f------- s- P ass -Passo-Xylene 57 145 20. 95 _ l0l 6 Pass Pass I PsStyrene 64 146 20 86 -934 96 Pamss Pass Pass_Brornoform 59:157' 20 80+ 91 13 Pass Pass Pass
- I---- ___Isopropylbenzene 70 130 t20 93 96 4 Pass lsM - + as4 PsBromnobenzene + 6 170 130 20 86 ' 9 12 Pass- Pass Pass1.1,2,2-Tetrachloroethane 70 +130 20 86 . 9 9 ------ Pass I Pass Ps
1,2,3-Trichloropropane 70 130 20 91 102 1 Pass r IPs- P-ass1,3.5-Trimethylbenzene 0- 3 20 91 t -2 Pss Pas Ps1.2,4-Trimehylbenzene 70 130 + 0 93 94 , 2 pas ass Pass
1,4-Dichlorobenzene 76 116 -f20 84 91 - -8 Pass Pass Pss1,2-Dichlorobenzene 72 124 20 85 95 12 Pass- Pass Passl,2-Dibromo-3-chloropropani 44 182 20 --- 76 10 Pas 1I Pass -Pass-Al - -a* s•I1,2,4-Trichlorobenzene 57 *102 20 70 79 12- Pass Pass -Pass--Hexachlorobutadiene 70 130 -- 2 7 98 ass-- Pasas
Naphthalene 47 158 20 5~5 D 9 2 Pass -P'ass PassNote: Control Limits are based on a semi-annual historical evaluation of mobile unit.
Table 2 Page 3 of 7
l0oaf 26

KB LABS, INC. 9 4 6Table 2: VOC Spike Compound Percent Recoveries
Client: Earth Tech Driller/Sampler North American Probe Analyst: Enoch
Site: OSC Richmond KB Labs Project Manager: Kelly Bergdoll KB Labs Project No.: 08-129On-site Dates: 5/27108- Client Project Manager: Manish JoshiMarxWte5/30/08MarxWte
Samples. OU8DP12 MS Daeo Anayi:5/29/20080U8DP12 MSD
Matrx Spke omponds Control Limits fecet Reoeries Control Limit ChecksDichlorodifluoromethani . eLp~rRD M IMSDW RP c assMMDChloromethane 39 142 20 1- Pass Pass {PsVinyl Chloride 20 187 20 1 Pss_ as100 7L _I~~~ass Pass -- wBromomethane 70 130 -~20 _6 5 C C PassChloroethane 70 :io 20 < LCLas PasLCLsTrichlorofluoromethane 56 149 + 20 15 105Pass Pas as1,1-Dichloroethene 52 i144 20 101 102 2 Pass PasI asMethylene Chloride 47 148 20 -9_1 9-4 __3 __ Pas-s - Ps' astrans- 1,2-Dichlorcoethene 4 1 157 20O 194 15 1 Ps Pass Pass1,-Dichloroethane 69+ 134 0 14 104 '0 PassPas ascis-1,2-Dichloroethene 59 143 20 101 100 1 Pas-s' Pas -Pass-Chloroform 64 148 20 ----- 163 Pas--Pss Ps1,1,1-Trichloroethane 53 147 20 103 104 1 Pass Pass -PassCarbon Tetrachloride 51l 161 20 104 106 Pass Passi PassBenzene 51 149 2 101 101 0 Pass Pass] Ps1.2-Dichloroethane 51 163 20 111 112 _ as as PassTrichloroethene 50 147120 9 96 3 Pass Pass Pass1,2-Dichioropropane - 62 15f id i6u P10P 5 Pss Pass PaSssDibromomethane 70 130 20 - 104 105 11 -Pass _ -- Pass L. PassBromodichloromethane -58 156S 20 106 106 0 Ps Pass Pass__0-1,3-Dichloropropene 53-169 20 94 9- - Pass- Pass _4 PassToluene 60 13620 89 9113 -Pass -Pas s- IPasst-1,31-Dichloropropene 72 1541 20 92 9 4 2 - Pass P-ass[ P- nas-s1,1,2-Trichloroethane 64 144 -20 109 108 2 -Ps Pass PassTetrachloroethene 56 138 f20 6 -7 7 Pass LPass IPassDibromochloromethane 69 147 20 99 _0 _2 P-Cass Pass Pass1,2-Dibromoethane 70 13.0 20 104T10713 Pass Pass P assChlorobenzene 83 128 -20 -93 97 4 Pas as_ as1,1,1,2-Tetrachloroethane 62 156 20 -100 + lOS 4 -Pass Pass i _PassEthylbenzene 60 14 3 ~ 20 92 94 2 ~ Pass Pass Passm,p-Xylene 58,142 20 92 94; 3 Pass' Pass IPasso-Xylene 57- 145 -20 92 94 2 Pass Pass ---Pass ..Styrerne 64 +1461 2.0 87 92-t _5 Pass Pass- -PassBromoform 59 157 20. 97 97 0- Pass- I_ P-ass P_4 _assIsopropylbenzene 7 130 2 0 - 91 94 3 Pass Pass PassBromobenzene 70 130 20 9 9 2- PassI Pass Pass1,1,2.2-Tetrachloroethane 70 130 20 110 _114'4 Pass Pass' Pass12,2.3-Trichloropropane 70 130 20 ill 1 03 7 Pass -pass-- I Pass1,3,5-Trimethylbenzene 70 130 20 88 92 If4 O as Pas as1 ,2,4-Trimethylbenzene 70 13r 20-87 91 5 Pass Pass -Pass-1,3-Di74lo117nz20e 91 93 2 Ps Pas -as76 -0 3Pas Pass 'Pass1,2-Dichlorobenzene 72 1246 20 87 92 2 Pass -Pass Pass12-Dichloobenzen182 12 0 9 9 2 Pass, Pass 'Pass1,2-Dibromo-3-chloropropan 44 18 _ 92 s as _er1,2.4-Trichlorobenzene 57 102 +20 82 '8 Passr Pass 'Pass
Hexachlorobutadiene 70 130 -f20 El 9Pass Pass~ Pass,Naphthalene 47 158 20 -7 8 1 as 'P ssI PassNote: Control Limits are based on a semi-annual historical evaluation of mobile unit.
Table 2 Page 4 of 7
1 1 of 26

964 70KB LABS, INC.
Table 2: VOC Spike Compound Percent Recoveries
Client: Earth Tech Driller/Sampler North American Probe Analyst: Enoch
Site: DSC Richmond KB Labs Project Manager: Kelly Bergdoll KB Labs Project No.: 08-129
On-site Dates: 5127/08- Client Project Manager: Manish JoshiMarxWte5/30/08 _ _ _ _ _ _ _ _ _ _ _ _ _ _ _ _ _ _ _ _ _ _ _ _
Samples: MWANP9 MS Date of Analysis: 5/29/2008MWANP9 MSD ________
Matrix Spike Compounds Control Limits Percent Recoveries Control Limit ChecksDichloroifluoromthant ~ LowerJIU erIIPD MS MSD IRPD MS MSD RPD
Diclordiluoomthat HU F.et) Zu 84 90 7 - < LCL [~Pass PassChlorometharii 39> 142 20 95 971- Pas s- as Pass P -sVinyl Chlonide 20 1817 20 99 970 2 -Pass, Pass: Pass_...Bromomethane 70 136 - 20 68 - < LCL Pass PsCor ethn 70,130 2 9 100' 4 Pass' _Pass PsTrichlorofluoromethane 56 14 0 0 H--------- ____ Pass
56 149 26 108 106 2 Pass Pass Pass1li-Dichloroethene - 52 14-4 20 103 100 3- Pass -I Pass PassMethylene Chloride 47 148 20 104 108 4 Pass rPassi Passtrans-i1.2-Dichloroethene 41 -157 20 100 102 _2 -Pass Pass i Pass1,1-Dichloroethane 69 +1314 20 101 106 114 Ps - Pasascis-1,2-Dichloroethene 59 143 2 -10<101 0 Pass pass PassChloroform 64 148 20 106 105 1 Pass Pass i Ps1,1,1-Trichloroethane 53 147 20 101 106 t4 Pa-Pss PsCarbon Tetrachiloride 51 16 20 -98- 103 5 -_Pass Pass _ PassBenzene 51 ,149 20 97-102 5 Pass Pass Pass1.2-Dichloroethane 51 163 20 108 113 5 Pass Pass PsTrichloroethene 50 147 20 100 102 3 Pass Pass ' Pass
4-1,2-Dichloropropane 62 10 20 103 103 _ 0 Pass Pass - PassDibromomethane 70 1 30 20 96 id100 4- Pass Pass Ps
- Rass ---Bromodichloromethane 58 156 20 102 105 3 - Pass Pass Passc-i 3-Dichloropropene 53 169 1 20 92 96 i 4 __Pass Pas PaissToluene 60 136 20 90 93. 3 Pass Pass Passt-1,3-Dichloropropene 72 154 20 94 - 90 5 Pass Pass Pass1,1,2-Trichloroethane 64 144 20 - -- 104 1 P-SS a- --- Ps-Tetractiloroethene 56 138 20 103 94 _ 9 _ Pass Pass PassDibromochloromethanie 69 144 20------- 99as - -- _ __
1,2-Dibromoethane 70 130 20 107 101 5 - Pass PasasChlorobenzene 83 128 20 96 94 3 _Pass _ Pass Pass1,1,1,2-Tetrachloroethane 62 156 20 99 : 7 1 a--PasEthyibeozene 60~~ ~~~ 14 92 ?as. -- s -- Pass-Ethylbenzene 60 143 20 97 5 Pass Pass Passm,p-Xylene 58 +142 20 92 7 97 ,a Ps PaPaso-Xylene 57 145' 20 92 97 5 Pass Pass Pass
-r ___ _ ~Pas I PasStyrene 64 146 20 88 92 4 Pass Pass Pass -
Brornoform 59 157 26 89q 93.5 Piass Pass -Pa ssIsopropylbenzeno 70 130 20 92 95 4 Pass Pass PassBromobenzene 70 130 20 -- 95 99 4 Pass _ Pass - Pass1, 1, 22-Tetrachloroethane 70 130 *20 110 115 4 Pass Pass _ Pass1, .2,3Tri chloropropane 70 13 -O - 112 .. 8 Pass Pass i Pass1,3,5-Trimethylbenzene 70 130 20 -89 93 5 Pass Pass Pass1.2,4-Trimethylbenzene 70 130 20 8-7 91 * 5 - as-Pass Pass1i3-Dichilorobenzene 74+ 117 -~20 9-2 _974 6 Pass Pass- - -Pass-1,4-Dichlorobernzene 76 116 20 88 95 i 8- Pass -- Pass - 4 Pass1,2-Dichlorobenzene 72 *14 20 90 5 6 Ps as Ps1,2-Dibromo-3-chloropropan 44 182 20 99 _108 9 Pa-Ss Pas Pass---1,24-Trichlorobenzene 57 102 20 83 83 I 1 Pass Pass PsHexarhlorobutadiene 70 130 20 102 971 5 Pass Pass f PsNaphthalene 47 158 20u 79 I 1 Pass Pass PsNote: Control Limits are based on a semi-annual historical evaluation of mobile unit.
Table 2 Page 5 of 7
12 of 26

964 71KB LABS, INC.
Table 2: VOC Spike Compound Percent Recoveries
Client: Earth Tech Driller/Sampler North American Probe Analyst: Enoch
Site: DSC Richmond KB Labs Project Manager: Kelly Bergdoli KB Labs Project No.: 08-129
On-site Dates: 5/27/08- Client Project Manager: Manish .JoshiMarxWte5/30/08 _ _ _ _ _ _ _ _ _ _ _ _ _ _ _ _ _ _ _ _ _ _ _ _
Laboratory Control Spikes (LCSJ:
Samples: LOS 1 Date of Analysis: 5/27/2008LOS 2 5/28/2008LOS 3 5/29/2008
Spike Cmpounds Control Limits Percent Recoveries Control Limit ChecksSpike Compounds Lower Upper LCS#1 ILCS#21 LCS-#3 LCS#1 LCS#2 FLCS#3
Dichlorodifluoromnethane 70 to 130 108 110 105 Pass J Pass- _ _PassChloromethane 70 to 130 11 113 114 Pas as Ps4- --- a-S Pass--- --Vinyl Chloride 55 +to 148 84 86 88 Pass - Pas P. ass
Bromomethane 70 to 130 87 M 79 Pass Pas PassChloroethane 70 to 130 91 89 97 Pass Pass PassTrichtorofluoromnethane 70 F o4 3 0 0 0 as - ss as1,1-Dichloroethene 56 to 130 104 103 108 Pass Pass- PassMethylene Chloride 70 to 130 93 155 B 166 B Pass > UCL > UCLtrans-1,2-Dichloroethene 54 to + 38 100 t 98 98 Pass Pas Pass1,1-Dichloroethane 70o to 130 97 99] 10- Pass Passj Pa sscis-1,2-Dichloroethene 70 to 122 96 -94 97 Ps Pas r PsChloroform 70 t 0 7 9 102 _Pass Ps es1, 1,1I-Trich~loroethane 70 to 13 99 99 -106 _Pass Pass I assCarbon Tetrachloride 70 to 130 99 98 102 Ps Pass Pass -
Benzene 72~ tot 121 9 9699 Ps as Pass1.2-Dichloroethane 70 to 1-30 98998_ 0 Pass -- Pass P-assTrichloroethene 67 t - 118---9-----99 * 101 Pagss Pss-1.2-Dichloropropane 70 toa10s9P102 PasDibromomethane 70 to 130 96 96 97 Pass _ Pass PassBromodichloromethane 70 to 10 98 931 98 Pass Pass Paissc-1,3-Dichloropropene 70 to 130 101 19 96 - -- Pass t Pass -__PassToluene 75 9 45 1138 i 11B Pass Pass Passt-1,3-Dichloropropene -70 to _ 30 107 -104 106 Pass Pass _ Pass1,1,2-Trichloroethane 70 -to 1-30 96 95 97 V ass -h Pas - 1 Pass
Tetrachloroethene 75 - ~~to 1-31 99 102 _105 _Pass Pass - PassDibromochiloromethane 70 to 13T6 -1id66 98- 99 Pass Pass Pass1,2-Dibromoethane 64+ to 115 99 98 99- Pa-s-s P-a--ss - PassChlorobenzene 70 Fto 1126 be-989-9 + 98 Pasass Ps1,1.,12-Tetrachloroethane 70 +to t1 10 9 0 Pas -- Pass1 - Pass -
- 130-- 0 ---40 Pas Pass- PassEthylbenzene 75 to 131 94 98 9 ass assj Pa-s-sm,p-Xylene 66 to F145 - 5 95 - 99 Pass Pass Passo-Xylene 71 to 141 95+ 97 98 Pass Pass PassStyrene -- 70 -to 134 95 944 9 as { as PsBromoform 53. t 147 91 92 86 Pass Pass Pass
Isopropylbenzene 96 ~~~to 126 107 110 il 11_Pss- Pass PassBromobenzene 70 to t130 92 92 96 Pass Pass _ Ps1,1,2,2-Tetrachloroethane 70 to 130--96- pas130+ -96~ 97 100 PaSs Pass Pass1,2,3-Trichloropropane 70 to I 130 93 98 101 Pass Pass Pass1,3,5-Trimethylbenzene 70 to 130 95 93. 94 _ pass Pass Pass1,2,4-Trimethylbenzene 70 to 130 94 90o- 91 _ Pas- Ps
1,3-Dichlorobenzene 70 to 130 94 95 95 _ Pass Pass Passl,4-Dicblorobenzene 70 to ~~130 97 1 95 96 Pass Pass Pass
1,2-Dichlorobenzene 70 to 130 94 95 93 Pass Pass -Pass
1,2-Dibromo-3-chloropmopan 70- to 1130 86 86 _ 89 Pass I--Pass - Pass1,2,4-Trichlorobenzene 85 to 134 92 80 + 2 - Pass h < LCL I < CHexachlorobutadiene 70 to 130 98 99 104 Pass { Pass - Pass,Naphthalene 52 toI 150 87 72 60 -pass Pass I PassNote: Control limits are based on method guidance.
Table 2 Page 6 of 7
13 of 26

96 4 72
KB LABS, INC.
Table 2: VOC Spike Compound Percent Recoveries
Client: Earth Tech Drilier/Sampler. North American Probe Analyst: Enoch
Site: DSC Richmond KS Labs Project Manager: Kelly Bergdoll KB Labs Project No.: 08-129
On-site Dates: 5/27/08- Client Project Manager: Manish Joshi Matrix: Water5/30/0 8 ______________________________________
Samples: LCS 4 Daeof Analysis: 5/3012008Spike Compounds Control Limits Percent Recoveries Control Limit Checks
__________________Lower U~pper LC#4 ILCS#4
Dichlorodifluoromethane -70 to 130 101I Pass -
Chloromethane __ 70 to ~ -115 4 PassVinyl Chloride 55~0: to 148 84 1 Pass jI
Bromomethane 70 to j130 71 I PassChloroethane 70 to 130 -89 t-------Pass i---Trichlorofluoromethane 70 to 1130 _ 110 --- a-s s1,-Dichiloroethene 56 +to 1 45_ iO0j PassMethylene Chloride 70 to~ 1W 11?9 > UCL---trans-1,2-Dichtoroethene 54 -~to _ 38 10------------1,-Dichloroethane 70 to 130 104 Passcis-1,2-Dirhloroethene 70 -+to 122 1006 Pass----------Chloroform 70 to _130 105 pass
1,1,1-Trichloroethane 70 to 2 130 104 Pass---Carbon tetrachloride 70 +6 to 13 _103 PassBenzene 72 to 121 101---------as I-1,2-Dichloroethane 70 -+to 130 10-3 PsTrichloroethene 87 to 118 103 Pass.1,2-Dichloropropane 70 to 130 - 12 Pass
Dibromomethane 70 +to 130 -965 Pass - ------Bromodichloromethane 70 +to _130 -11Pass-
c,1,3-Dichloropropene 70 to 13 93 +-~
Toluene _75- to 1-29 1-149 asBt-1,3-Dichloropropene 70 to 130 100 Pass1,1,2-Trichloroethane 70 to 130 101 -- - ass -_------
Tetrachloroethene 75 to _131 -102 Pass ~Dibromochloromethane 70 +to 130 191 Pass1,2-Dibromoethane 64 to 115 §99 _- PassChlorobenzene 70 +to 126 96 PassN1,1,1.2-Tetrachloroethane - 70 to 130 -102--- PsEthylbenzene -75 to -131- 96 - -_Pass-t
m,p-Xylene 66 *to 14 96 Pass [ -o-Xylene 71 +to 141 96 Paisss -
Styrene 7 40-to3,Pass
Bromoform 53 to 147 85----------ass4lsopropylbenzene -96 to 126 110 +---------Pass 4-
Bromobenzene 70 F to __130 -95 - as----------1,1,2,2-Tetrachloroethane 70 to 130 106 Pas1,2,3-Trichloropropane 70 +to 130 100 4Pass
1,3,5-Trimethylbenzene 70 -to 130 -96 ±Pass I-1,2,4-Trimethylbenzene 70 to 10 92 Pass1,3-Dicfhlorobenzene 70 to -3 96 Ps
1,4-Dihloroenzene70 to 130 9-Pass1,2-Dichlorobenzene 70 to 130 -943 Pass -
1 ,2-Dibromo-3-chloropropan 70 to 130 70 Pass1,2,4-Trichlorobenzene 85 +to- 134 79 * LCLHexachlorobutadiene 70 to -130 12PassNaphthalene 52 to 150 56 Pass INote: Control limits are based on method guidance.
Table 2 Page 7 of 7
14 of 26

964 7-
KB LABS, INC.Final Data Report
Project Number: 08-1 29DSC Richmond
Prepared for: Earth TechWell ID Will ID Wall ID WM 0 W11 ID Wel I 1Wl '0 well it Wet11 it W.11 ID Well '0 wel ID Well ID
0 ~ ~ ~ ~ ~ ~ ~ ~ ~ ~ ~~~~~~~~~~~~'000 o~~~ ~~ ~~ o 0 8 o o
0 00
Matrix 5/27/2008 5127/2008 512712008 I5/2 712008 5/2712008 5/27/2008 5/27/2008 5127/2008 5/27/2008 5/27/2008 5/27/2008 5127/2008Analysis Dale Water Water Water Waler Water Water Water Waler Water Waler Waler Waler0/itaon- 1 1, 10 1 1 1 I 1 1 1 I 1 1 1 1Dichlorodfi.0oromethaene ci <1.0 < 10 j, <10 < 1.0 < 1.0 < 1.0 < 10 <1.0 < 10 <10 <10aChloromethane____ '.1.0 .0 <1 0 <0 <0 < 1.0 <1.0 <10 <10 < 10 ci 1 iaVin~yfChlorlde-_ _ <1.0 <10 __ 1.0 <1.0 <10D <10 <10 <1.0 <1.0 <1.0 <1I0 <ciaBronnorotharne <5 0 5 < 50 < 5.0 <5 50 <50 <50 < 5.0 <50 <50 < 5 0 <5.0Chloroetlhane <-- 1.0 <1.0 < ~1 .0<,ID < D <1.0 cio Ia < I0 <t <i0 ~ 1o < 4oT~hehnofoluorom~ethane 2.0 1.5 <1.0 < 1.0 < 1.0 <1.0 <1I0 < 10 1.2 1.2 <1I0 <4101.1-DlChIoroetherlC <10 <1.0 <1 <10 <0 <10 < 1.0 < 1.0 <1. <1 ~ I0 < 10 < 1.0Methylene Chlonide - 11.46 14.4 B 13.3 B 8.768 14.58 07 10.7 B 14,668 14.66I 10.48S 12.5 B 11.2 B!-i,2.Dichloroethene <0 <1.0 < 1,0 <10 <1i0 <10 <1.0 < 10 <1I0 <10 <1 <10i*1,1pMIometh~pane ___ 1.0 <10 1,0 <10 <1.0 <10 <I < 1.0 < 10 <10 <1 0 < 1.0C.1,2-Dichloret here <1.0 8.8 <1, <1 <I <1I0 < 1.0 < 1.0 <1,0 <~-1.0 <1,0 <1.0Chloroform <1.0 <1.0 <1I0 < 10 <In <1.0 <1.0 < 10 < 10 < 1.0 < 1.0 <1.01l,II-Trlehlorothano <10 <1.40 <.0 <1~ 0 < 01 0< ,140<1. <1.0 < 0cia <in0 <10 < 1,0Carbon Tetrachloride 1,0 <10 <40 <4.0 <1.0 <01.0 <1.0 <10 < 1.0 < 1.0 <10 <10OSeenzon c1.0+~1,0 < 10 , <10 10 <1,0 <1.0 < 10 <10 <0 <1.0 < 1.01.20Ophlomoethane _ <1.0 I 4 40 1.0 < 1.0 <10I1 <0 < 1.0 <10 <10 <1.0 <1.0OTrichloroethene 17.8- 28.2 1.4 130 L 1.6 43.4 19.3 10.5 12.0 11.4 17.6 9.41,2.ODhloropopRan <1.0 <1.0 <1I0 < 10 <1.0 <1.0 <1I0 <1I0 <1.0 < 1.0 < 1.0 <1 0OibroMorelhan_ ' _ 1.0- <1.0 <1I0 <1.0 1 0 <1.0 < 1.0 < 1.0 <10 < 1.0 < 1.0 < 1.0Bronnodichloronnethlane <10 <1.0 < 1.0 < 1.0 < 1.0 <i.o <In <i < 1.0 <10 1 0 <1 0e-1.3-OiChloropro~pene _ 10 <1 0 <1.0 <10 <10 <10 <1.0 < 1.0 < 10 <10 < 1.0 < 1.0Toluene 4.16 .6 39 _3.46 36 3.6 38 3.96B 3.96B 3.868 4.18 3.86
1,1,2-Trichlonoethane <1.0 <10 <10 <1I0 I10 < 1.0 < 1,0 <1i0 < 10 <1.0 < 1.0 < 1,0Totrachlorocthene 17.9 -15 2.6 87.3 1.5 28.7 17.0 10.2 10.3 97 17.0 11.0Dilbronnochlooromethane < 1.0 <1,0 <1I0 <1I0 I10 < 1,0 <1 I 0 < <1.0I <1. <1 <10l,2-Oibromoethane <1.1.0 .0O <10 ' 10 <1I0 '1i0 ' 1.0 <10 <10 <10 <1,0 <1,0Chlorobenzene <1 0 , <1 <O1.0 < 1.0 <1 <10~ < 10 <1.0 < 1,0 < 10 <10 <10I1.l.I-,2-Totrachlo rmethane < 1.0 < 10- <10 1.0 < 1.0 <1,0 <1I0 I10 1 0 ' 1,0 <10 <1.0Elhylaenzerle - <10- <1.0 <1,0 <10 <1 <10 <10i <1,0 < 1,0 <i <10I0 < 10n,&p Xyleno <20 <L 2.0 _ <2.0 < 2.0 < 2.0 <2.0 <20 < 2.0 I <2.0 < 2.0 < 2.0 < 2.0o.X~ylne <10 c~ 1.0 <1 ~ 1.0 . <1.0 <1,0 <1 <1 ,I0 <10 <1 0Styrene -- <. <1,0 <10 <10 <. 1.0 < 1.0 <10 < 10 < 10 <1,0 <1,0-Bronnofoni <. <,0 10 _ _ <10 <0 <10 <1,0 <-10 < 10 ' 10 <1.0 <I401l2opfpytbernzene <10 <1 <1 I0 <1 <10 < 10 <0 <10 <1 0- <1 0 , 0<in <10Bromnobenzene - - < 1. <<1.0 1. 10 <1.0 F <10 <10 <1.0 <1 0 < 10 'in <1,01,1.2.2-Thlrachloroelhane <1.0 <1.0 <1 0 <1 0 <1. <110 <1.0 <10 < 10 <1.0 < 1,0l,2.3.Trlchtorprpancon__ <5.0 <50 <50 <5 0 <50 < 5.0 < 5.0 <sn <50 0 <5 <50 < 5.01,3.5.THnnaihylbenzene <1.0 10 <0 -1 01.0 < 1.0'io <o <in <~Ina '1.0 < 1,0 <1,0 <1, 01,2,4.Trnneth~yfbonzwenI <0 <1.0 < 1.0 <10 <010 <1,0 < 10 <1 a <1.0 <1.0 <4,01,3-Dichlorobenzene <1.0 <1.0- <1I0 < 1.0 < 1.0 < 1.0 <1,0 <10 <10 1 < <1.0 <101.4.Dlcblorobenzene <1.0 <1.0 < 1,0 <1,0 < 1,0 < 1.0 < 10 < 10 <1.0 <10 <10 <101,2.Dichlorobenzene <40 <1.0 <1,0- <1,0- cia < in0 <10 <1.0 <10- <10 <1.0 <1,01,2.Dilbromno.3.hloroompane < 5.0 < 5 0 <5,0 < 5,0 <5.0 < 5.0 < 5.0 <50 <50 < 5.0 <50 <501,2,4.TrnChlorobernhene <50 <5.0- <540 < 540 <50 <50 <50 <540 <50 <50 <5.0 < 5.0Hlexachlorobutadiene <5.0 <5.0 <540 <5.0 <50 <50 <50 <50 <5.0 <50 <50 <5.0Naphth.1en <5,0 <5,0 <5.0 <50 <50 <50 <50 <5.0 <5.0 <5 50 <5.0
KS Labs ConfIdential 6/13/2008 Page 1
15 of 26

96 4 74
KB LABS, INC.Final Data Report
Project Number: 08-1 29DSC Richmond
Prepared for: Earth TechWell ID WWAl ID Well ID WWI ID WWIl ID Wet ID Well ID W.11 ID Well ID WWl ID Well ID well io
0 0 ~ o0 0 0 0 lb0
I 12100 12100 /2/20 52/20 52120 5-82085-820852820 51820 5-820 5/8/00 5-820Date Smpled.Water ater Wter Wter Waer Watr Wate Wate Wae aeNae ae
Diltio : i1 1 1 1 1 I - - - - -
Dichlod~fluoomethae ~ 10 1.0 1 0 ~ 1 a ,1.0 ~ 0 ~ I0 ~ I0 lb 10 ,1.Chlromthn e 1. I0 ~ 1. ~ .0 I0 ~ 1 ~ .0 I0 C1 Co Co Co 1 C)1
Tdhloron um: tanI-0 1 I. 1 - 1. 1 0 1. I 1 1. 1 1 . 11O-ichlorodllooethene <10 < 10 <10 < 1.0 <1i0 1.0 < 10 <1I0 < 10 < 10 <1.0 cia.MtlneChlooehnde 103 <10B <12.0 <14.0 <10 <102 <13,0 <10.I <10. <1. B 1.0 <1 <13.0Vinyl DChloridhee - - <1 ~0 <1.0- -I <0- <10 ' 1.0 <10 <10 < 10 <1I0 <10 <1.0 <1.01BrDhomometharre <5.0 150 <50 <5.0 <51.0 <50 <5.0 <51.0 <Sf <50~ .0 <50 <50chlor~hlooethane <1,0 <1.0 < 10 <1.0 < 1.0 <1 0 <1,0 <1.0 < 10 < 1.0 <1.0 <1.0TrChlorofuorcmetar <1.0 <1.0 <1.0 1.0 < 10 <1.0 < 10 <1I0 < 1.0 < 10 3.6 <1.01l.l-Dch loroethene 1_0_ <10 <1.0 <1.0 < 10 < 1.0 ' 1.0 < 10 < 1.0 < 10 <1.0 <1.0Carhbone Trchl-orde 13.3 B'-- 15.08 12.6 14.4 B 1.6 <10,28 13.3 B 13.9 B 13.38 9.56 12.0 B 13.6Bln-1.2-ihoahn 1.0 <1.0 < 10 <1.0 < 1.0 <10 <1,0 < 1.0 < 10 < 1,0 <10 <1 01.l2Oichloroethane <O1.0 < 1.0 I <4.0 <10 < 1.0 <1.0 <1 0 < 1.0 <10 1.0 <1.0 <10OoT12-ichloroethene <1.0 <1.0 <19.0 <1.0 <71. <10 <. <1.0 <77 102 <1.0 <10 i1,0
1,l21.Trchloroelhaene < 10 <1.0 < 1.0 <1I0 < 1.0 < 1.0 < 1.0 <1.0 < 1.0 <1.0 < 1.0 <1 0Cbrbomolrnhanhoie < 1.0 <1.0 <1I0 < 1.0 < 10 < 10 < 1.0 < 1.0 < 10 < 1.0 < 10 <1.0Benzodnhora he <1 <1.0 <1.0 <101 <1.0 <1I 0 <1 0 <1.0 < I0~1.0 < 1.0 <1.0 <10c1,2.Olchloroethaene < 1.0 <1.0 < 1.0 <10 < 10 '1.0 <10 < 10 < 1.0 < 10 <1.0 <10Toluhoretne 3.95 5.3 . 2k 59.4 29. 57..1.6 1.0 . .377621.0 5.9 1.9.2i,23-Dichlorcoproporle < 10 <T ~ 1.0 <1. 0 <10 < 1.0 <10 < 10 < 1.0 < 10 < 10 < 1.0<1Dibromhoroethane <1.0 <1.0 < 10 < 1.0 <10 < 10 <1.0 <1 1.0 < ~1.0 <1.0 <1. 0
Dbromodchloromath~ane < 1.0 <la <i <1.0 <1- I0 <10 <1.0 <1I0 < 1.0 <10 < 1.0 ' 1.0c1,2-Dichlrommropne < 1.0 <1.0 < 1.0 <10 <1. 0 <1.0 <1.0 <1. 0 <1I0 <1.0 ' 1.0 <1I0
C...hlorobenzerene - 1.0- <10 < 1.0 <40 <1I0 <1.0 <1.0 <1 <1.0 < 0 1.0 < 10 < 1.01, I 12-Terachloroe hnoe <,10 10 <. 1 100 < <10 <1. 0 <10 <1.0 <1.0 <1 0
Tetrchlooelhne 33 6. 405 2. 47. 399 <1 1.0 3. 70 <10 44 2.Dthl Broonzoen han I <40 <10 <1.0 <10 <10 <1.0 <10 < 10 < 1.0 <10 ' 1.0 <1 0m.2pOibomoethne<10 <10 <1.0 <10 <120 <1.0 <10 <120 <10 <1.0 <1.0 <10Cho-Xrobrzn <1.0 < 1.0 < 1.0 <1.0 <1I0 <10 <1.0 < 1.0 <10 <1.0 <10 < 1.0IS1ty2rene achoroetane ' � <in <i0 I10 <10 < 1.0 1.0 <1 <1.0 <1 I0 <1.0 <10Elhorlsenzen < 10 < 10 < 1.0 <10 < 1.0 < 10 < 10 1.0 <10 I4,0 <10 <10srnppylolezne - <20 <21.0 <210 <20 <21.0 <20 <20 <21.0 2. <21.0 <20 2.6Onroberiene < 10 ci1o <in <1.0 I '~1.0 <1.0 <1 1.0 <10 < 1.0 <01.0 <10S,12,.etahlrrteen <1.0 <1.0 <1I.0 <1.0 < 1.0 <1.0 < 10 < 1.0 <10 <10 < 10 <1I01B2o3mohormpr<1. ~0 <i <i0 5e <150 <1.0 <1 0 ~.0 '10 <0 <10 <10 '1. 0 <150!3o5-rmethlbe~enzie <I,0- ci.o <in <Io < ,1.0 <1 0 <1.0 < 1.0 <10 <1.0 <1I0 <1. 01A2o4mobanetzoezne _ <,1.o <in- <i.e <0 <1.0 <1.0 <1.0 <10 <1.0 <10 < 1.0 <1I0l1`Di,2.erloroelhmnre <~1.0 <1.0 < 10 < 1.0 < 1.0 <10 <1.0 <1. 0 <10 <1,0 < 10 <1I01,4213.Tchloroproanzee <510 <5.0 <5.0 <5.0 <5I0 <50 <5.0 <5.0 <50 <5.0 <50 <51.012.3.5-hmlorolbenzene < 10 '1.0 <1.0 <4 1.0 < 0 1 0 <10 <1I.0 <10 <10 < 10 <1.0
I.2.4.Thmelhlbenzene '1o <in 'io 1 10 <10 <. 1 10 <0 '. 1
1.2.Dibromo-3chloropropane -<0 <5.0 <50 < 5.0 <550 0 50 < 5.0 <50 <5.0 <50 < 5.01,2,4.Thcblorobenzene <50 <5.0 <5.0 <50 < 5.0 <5 0 <S < ~ 5.0 <5.0 <50 '5.0 < 50He...chlorobutadiene <5 0 <50 <50 < 50 <5.0 <50 <50 < 5.0 <50 < 5.0 <S 50Naphthalene <5.0 <5.0 <5.0 <50 <50 < 50 < ~5.0 <50 <5.0 <S <Sn <5.0
KB Lab, Confdenltal 6/13/2008 Page 2
16 of 26

964 75
KB LABS, INC.Final Data Report
Project Number: 08-129DSC Richmond
Prepared for: Earth TechWel ID Well ID Well ID WellHD Well 10 well ID Well ID WellID Well ID Well ID Well ID Well ID
- - 02 01 0 01
D I~~~ti_______ 1 1 1 1.0 1.0 1 1,0 1. 10 10 1 10Dichlorodrifluoromethane__ 1 <10 <10 <10 <1.0 <1. <b 1.0 <1.0 <1 <10 <10 <10
Vinyl Chlor~~~~~de - <1.0 <~~1.0 <10 <10 <1.0 <10 < 10 <10 <1.0 <410 <1<0
Bromometnen 50 <0 <5.0 < 5.0 <5.0 <5.0 <5.0 <5.0 <,50 <50 <50 <50Chioroethane 10 _ 1.0 <1.0 <11.0 0to<1.0 <1 <10 <10 <,10 <10 < 10Trlchlorofluororralhane 2.0 I 1O 1.1- 2.2 2.7 2.6 2.4 2. .2 C 10 C1.0 1011.CDlchioroethens-e <-1.0 <1.0 <10 <10 <,10 < 1.0 <,1.0 <1.0 <1 10 <,1 0 <,10Methylee CMonde 13.96 ' 8.25B 13.668 11.48B 14.7 B 13.68B 12.95B 12.48B 13.7 8 140 B 11.4 B 1503Bt0l2.Dlcthloroethene __,_ 1.0- <,1.0 <10 <41.0 <10 < 1.0 < 1.0 <10 <10 <,10 3.6 <11,I-Dichloroethaone <1 0 <1.0 <10 <1I0 <10 <1I0 <40 < 1.0 <1I0 <,10 <1I0 <10c-1,2--Dichloroethene - 1 0 <- 1 0 <1.0 I 1.0 c 1,0 c 1.0 1.0 1.2 1.3 64 41.6 18Chloroform _ _ 1.0 < 10 <10 <,1.0 10 <10 < 1,0 < 1.0 <10 <,10 <,1 0 <111,1J.-Trchlonsethune <1.0 <'10 <1. <1.0 <1, <1,0io <1 <10 <,1.0 <,10 <1.0 < 10Carbon Tetrachloride <10 <1.0 <1.0 < 1.0 <1.0 < 1.0 < 10 <10 <1, <' ,10 <1.0 < 10Ban-zone <0 <1.0 <,1.0 < 1.0 <1.0 < 10 <1i0 <10 < 1.0 < 10 <1t0 < 101.2-Dichloroethane 1.0 <1.0 < 1.0 <,1.0 <1.0 <,1.0 < 10 <10 <,1.0 49 6.1 < 10Trichloroethene 13.4 72.5 98.6 120 L 130 140 130 L 170 160 300 67.9 67t.2-DIchloropropane <1I0 <0 <10 <10 <1a <0 <0 <10 <,1.0 <10 <1 < ,10Dlbromlomet~haflO <1, <10 <1l.0 <1.0 <,1.0 <,1.0 <1.0 < 1.0 <10 <10 <10 <10BromModichloromethane <10 <10 <10 <10 1,0 <1,0 <1.0 <1I0 <10 <10 <1.0 <10c-1,3.0ichlomrop n------1.0 1 1.0 <10 < 1 0<io < <Ina <10 < 1.0 <10 <1.0 <10Toluene 6.78B 5.68B 548 B 5.26B 4.68B 6.38 8 .18B 4.96B 5.58B 418B 5.86B 388Bt-1,3.Dichlbrroompee - <10 1 0 <10 <1,0 <10 <,1.0 <,1,0 <,1 0 <1I0 <,10 <,1.0 <,10l,12.2Tnlolomethane <1 I0 < 10 <1.0 <10 <10 <10 <10 <,1.0 <4.0 <10 <10 <0Tetrachloroethene 10.6 52.5 78.4 I 99.3 100 110 84.3 120 110 1200 L 370 350Dlbromochloromethane <1.0 I 1. <1 0 <10 <In <1.0 <1.0 <1,0 <10 <,10 <,1 0 <,10I.2.Dlbromoethane <1 1.0 <1. <1i0 <10 <In <10 <1,0 <10 <10 <i <10Chlorobenzene - I <10 10 <10 <1,0 <1,0 <i. 0 <in <10 <10 <1 10 <0
.,11,2-Tetrachloroethene <i < 1.0 < 1.0 < 1.0 < 10 < 1,0 <1.0 <1.0 <10 <10 <10 <1Ethyl Benzene <1.0 <1.0 < 1,0 <10 <1O ~ <1 <1.0 < 10 < 1.0 <10 <Io <10n&,p Nylons 2.2 _ 2.1 <2020 0 <220 0 20 < 2.0 <2.0 <20 <2.0 < 20
a-Xyteno < 10 <in < 1.0 <1.0 <10 <10 <1.0 < 1.0 <10 10 <10 <,10Sityrneri < 1.0 II,0 <1. <40I <In9 -<40 <4.0 I<1,0 <10 <10 I10 <10~IBromoform_____I<0 <,4.0 <,1.0 <i.0 <in <10 <10 I<10 <1.0 <10 <,1.0 <10iso~prop~ybonzene- <1 <10 <. 10 <10 . <1,0 <10 <1 0 <1.0 <10 <,1,0 <,10Bromobenzene 1.0 <1 I 0<in i.o <1.0 <10 10 <1, < 10 10 <0 <,101.t2,2.-Tetrzahloroathane- <1,0 <10 < 10 <1i0 <10 <1.0 <1.0 <,1.0 1,0 <10 <10 <,101,2,3.Trchtoropropall.- < 5,0 0 ,S, <5.0 <Sn <,5.0 <50 <50 <,50 < 5.0 <50 <5.0 < 501,3.5.Tnmnethyflbenzane 14 <1.0- <1I0 <1. <1 I0 <,1.0 <,1,0 <In <10 <010 <101,2,4.Tnmethytbenzneo <1.0 I10 <1I0 < 1.0 <1.0 <I <1 I0 0<in <i.o <10,io101,3.Dichlorobenzene _ 1.2 <1.0 __ 1 0 <1I0 <In <10 <1I0 <1. <110 <1,0 <10l,4.Olchlorobenzene 1.3 <10 <10I<O 40 <1,0 <,10 <10 <10 <10 1010l.2.Dichlorobenzene 1.1 <40 <,1.0 <1.0 <10 <10 <in 1io <1,0 <101 0 0 <101.2.Dibromo.3.chlorcprnpane <50 , 50 <,50 <5.0 <,5.0 <Sn <sn <so <5.0 <50 <50 < 501,2,4.Trichlorobenzone __ 5.0 <5.0 <,5.0 ,5 5 5 50 <50 <5.0 <50 5 0 < 50Hexacblorobulediene <5.0 50 <5`50 <0 <. 5.0 <50 <50 <50 <,5.0 <,50Naphthleone <50 5. <0 <50 <5.0 <.0 5.0 <5.0 <5.0 <50 <50 1 <50
KS Labs Confidential 6/13/2008 Page 3
17 of 26

964 76
KB LABS, INC.Final Data Report
Project Number: 08-1 29DSC Richmond
Prepared for: Earth Tech
Well ID Well ID Well ID Well ID Well ID Well ID WellIID Well ID Well ID Well ID WWIl ID Well ID
4 C
a a~~~~ 0 -0 0 0 0 0 0 0 0 0
Matrix 5/29(2008 5/29/2008 5(29/2008 5/2912008 5f29/2008 5/2912008 512912008 5129/2008 5129/2008 512912008 512912008 5/29/2008Date Sampled Waler Water Water Water Water Water Water Waler Water Water Water WaterD/uIMn= 10 I 1. 10 10 10 I 1 10 10 10 I 1 1 1Dk~hlorodilfuoromethane <1 1.0 <1.0 <1 'o 10 <10 '410 <10 '10 < 1.0 <1.0 '1I0Chloromethane '1 <0- < 1.0 < 10 '10 <10 ' 10 <10 '10 '1.0 <10 <'4.0Vinyl Chloride , 1 '1,0 < 10 < 10 <10 1,0 '10 <10 '10 <1 0 <1,0 ' 0Bromomethane 5 50 '50 <'50 '50 '5.0 <50 '50 '5) '50 <5.0 < 5.0Chloroetharne ___ 10 ] <1.0 <1I0 < 10 '10 '10 ' 10 <10 '10 '10 < 10 <10Trclcorofluoromethane __ 10 ], 3.6 < 1.0 10 '10 3.2 ' 10 '10 < 10 '10 '1.0 <1.01,I-Dilehlroelhene __ _ '10 <4.0 <1.0 < 10 '10 <10 ' 10 <10 ' 10 '10 '1,0 '10Methylene Chloide 986B t'45 B 126 97- 10 1.7 110 B so08 150 B 10.08B 13.4 8 11.5 Bt-1,2.D,Chloroethene dO , 0 1.7 10 <1 . 1 1 1 .0 < 1,01,1-Dichloroethavne '10 T <10 _ '1.0 <10 <1 1 1 4 <10A<1.0 <i <in 0c-i1.20Ochloroetlhen 8_ i 13.4 170 38 33 7.7 <10 '10 < 1t 0 < 1 0 I < 1.0 ',Chloroform <40 - <1I0 ' 10 '10 <10 < 1.0 <10 < 10 <0 <10 '10 '1,01.1,l.TriChlomoethane ' 10.f,. < 1.0 < 1.0 ' 10 <10o '1, < 10 < 10 <40 <10 '1 0 <10Cartoon Ttrachlorde <10 ' 1.0 <10 a < 10 < 10 < 10 ' 10 < 10 <10 < 1,0 <1 0 1.0Benizono <0 10_10 0 10 <10 < 1.0 <10 '10 '10 <10 ' 1.0 <1.01.2.Dlchloroethane <1-0 '10 1.1 <1 <a 10 < 10 ' 10 < 10 <10 'i <1.0 '4 <.0Trlchloroethene 70 20.3 26.0 38 42 7.0 210 160 130 e7.0 90.8 33.01,2-Dlcllrqp,ro~p.r <10 I<tO <1I0 <10 '10 < 1.0 '410 <10 < 10 <1I0 < 1,0 < 1,0Dlbromornethane '10 '1,0 <1I0 _ 10 <10 '4I0 ' 10 < 10 '10 < 1.0 <10 '10Bronnodichltoromethlane '10 '1.0 < 10 '10 <11 0 0 10 < 10 <10 ' 1 I 0<iI 10c-1,.3-D chloropropene - 10 '1,0 '.0 '10 <10 ~ 10 ~ 1 01 .Tolumene 3568 4.16B 3.88B 386B 406B 3,768 366B 3261 376B 5.68B 6.36B 5.28Bt-l.3.Dichloropro~pele , 10 <0- <1. <10, '10 <1 <10 1 0 0J <1 '10 <1.0 <4I01,1,2.Tnocloroethane <40 <1.0 < 10 ' 10 <10 < 1.0 < 10 < 10 <40 < 1,0 '10 < 1.0Tetrachloroetherne 360 _ 110 L 110 16 210 26.0 150 110 s0 31.5 33.3 13.1Dlbromochlo romethere _ <410 < 10 <io <1 10 < 1,0 <10 < 10 <10 < 10 < 10 < 1.0-
1,2-ibrooethne <10 <io <in a I dO <10 < 1,0 < 10 < 10 <10 <1I0 < 1,0 <0Chlorobonzone <io t 1 .o <10 < 1 10 < 10 <0 < 10 '0 'io <i '1,0
tl11,2.Tetrachloroethane _ <10 -+ <1, 1.O '10 <10 '10 <10 <10 '10 ' 10 <10 '10Eth14 Benzene < 10 <1,0- <40 '10 <10 '10 <11 0 0 '11 0 0<<40 1.0m~p Xylone ' 20 ' 2.0 <2,0 < 20 '20 < 2.0 '20 < 20 <20 ' 2.0 < 2.0 <,o-Xylono - 10_ <1,0 '1.0 <10 '10 <1.0 '10 <10 '10 <10 <1.0 < 1.0Slyrere ' 10 <In ci.o '40 <10 '10 <10 '10 <10 <1.0 '1.0 <1 0Bronioform <10 '1,0 <10 < 10 '10 1,0 '10 < 10 <10 '10 <1,0 <10leopropytbenzene '10 '1,0 <10 ' 10 '10 <1,0 '10 <10 <10 '1I0 <1,0 '10Bromobenizene '10 <10 <1.0 < 10 <10 <1,0 <10 10 10 , '1,0 <1,0 < 1.011.2.2-Tetrachloroethane ' 10 <4,0 '10 < 10 <10 '10 <10 < 10 <40 <10 <1,0 '101,2,3.TrlchlOro~pr~pane_ <50 '5.0 '5550 0 <5o0 < 50 < 50 <50 '5,0 <50 < 5,013,35.Trlmathylbernzene '10 <10 <1,0 <10 <10 < 1,0 <10 <10 '10 '10 <1.0 ' 1,01,2,4.Trmethyibenzene ___ 10 ' 1.0 <1,0 '10 <10 <10 '10 < 10 '10 <10 '1, '10i1,3-OlChlorobenzene___ 10 ' 1.0 <1.0 <10 '41.0 <10 <10 <10 '1.0 <1.0 '101,4-Ochlorobenzene <10 ' 1,0 _ 1 <0 '0 <10 '10 10 '10 '10 <10 '101,2.0,hchlorobenzene <10 _ <1 0 I 1 0 0 0 10 1 01 .1.2.Oibromo.3.chtoroprOonae ' 0 50 <50- <10 '1 <0 50 <10 <10 <1.0 '10
Hexachlrob~tacme ~ 0 < 5,0 '50 <50 <50 '50 ' 50 < 50 '50 <'50 <50 <5Hexechloroutad~ene __ <50 <5.0 <5.0 <50 '5.0 .0 50 < 50 < 50 < 5.0 '0 <.Naphthalene <5 s 50o.,, ,,j9,, '0 <5 5 5 <0 <, 50 <50
KB LabS ConflodentIal 6/1312006 Page 4
18 of 26

964 77
KB LABS, INC.Final Data Report
Project Number: 08-1 29DSC Richmond
Prepared for: Earth TechWell ID Well ID Well ID Well ID Well ID Well ID Well ID Well ID Well 0D Well ID Well ID W.ll ID
p A~~~~~~~~~~~~~~~
0 0 0 0 0 0 0 0 0 0 0
Matinx 5/29/2008 5/29/72008 5/29/2008 5/29/2008 5/29(2008 5/29/2008 5/30/2008 5/30/2008 5/30/2008 5/30/2008 5/30/2008 5130/2008Analysis Date Water Water Waler Water Waler Water Water Water Waler Water Water WaterDIlution 1. 10 1 20 200 1 1 1 10 1 1 10 so 50DichlorodilfUoromethane <1 1.0 <20 '200 < 10 '1I0 <10 < 10 <10 <1 50 <50Chloromothane < 10 <10 <20 <200 <0 10 <0 <1 <1.0 <,~ 10 <50 <50VirylChlorhda <1I0 <10 <20 '200 < 1.0 < 1.0 <1.0 <1.0 ci < ~ 10 <50 < 50Brornornethane < 5.0 <---~50 <100- <1000 <50 <50S <5.0 <50 <50 < 50 <250 <250
Chloroetheno <~~~~1.0 <1.0 <20 <200 1.0 < 1.0 <10 < 10 <1.0 < 10 <50 <50Trlchlorofluoromethane__ <1.0 <1.0- ' 20 <200 < 10 < 10 <1.0 <1I0 1.0 < 10 <50 <501.l.Dichloroethene <10 <1.0 < ~ 20 <200 < 10 < 1.0 <10 <10 < 10 < 10 <o <50Methylene Chloride 15.88- -12.118 20068 290D B 10.03a 13.3 BS 13.3 B 14.1 B C 1.0 C10 <50 <50t-1.2-Dlchlonoethene <1 0 <1.0- < 20 < 200 < 1.0 < 10 <10 <1 1.0 <10 <50 <50
1.1.Ochlo~ohn-e <1.0 <10 < 20 ' 200 <1I0 < 10 <1.0 <0 <1,0 <10 <50 <50c-1,2-Dlchloroethn c10 <.0 43 < 0 i,0 26.1 <1,0 1.2 1 1.7 19 130 75Chloroform <1.0 I 1.0 < 20 < 200 < 1.0 < 1,0 <1.0 < 1.0 <40 < 10 <5 <01,1.Ijrlchlonoethane __ <1.0 <1.0 <20 < 200 < 1.0 < 1,0 <1.0 <1I0 <1I0 < 10 <0 <5Cartoon Tetraehlorde <4.0 <10 < 20 <20 1,0 <1.0 <10 1. <0 <0 <S<5Benzene -- I10 <10 < 20 <200 <1,0 <1,0 <1,0 <0 38.8 < 10 < 50 ' 501,2.OlChloroethame____ 1.0 <10- 47 <20 1 0 <10 <1.0 1.6 8.8 10 < 50 <SO0Tnhehoroothene 130 _ 33.8 220 630 < 1,0 20.9 1.7 14.9 36.4 56 200 1701t2.Pichlorop"Oppne, - < 1,0 <1,0 < 20 <200 <10 <10 <10 <10 < 1.0 <10 < 50 <5Dlbtornomethane '10 <In <20 <200 <10 <1,0 <1.0 <10 <~~ ~ ~~~~ ~~~~~~~~1 0 < 10 <5 <p,50Dbromodeormethane '1.0 <1,0 <20 <200 <tIO <10 <10' <40 <1.0 <1 '5 5a t 3 D e h o op e n e - 1 2 2 0 1 0< . 1 0 < 1 0 1 0 < 0 < 5 0 < 5 0t1.3-mdich]loroprpn h _ <1,0 <10 <20 <200 <1 10 10 <,0 <0 <0 5 5C1,,2.Tichlomropetne ' 1.0 <1.0 <__20 <20 <0 < 10 < 10 <10 '1.0 <40 <50 <50
Terclorehn 83.1 4 31.3 9601 3400I 1.4 2150 305.2 534.7 e2.3 290 1500 100t-1r3mDchlorolmeohane <1,0 <1.0- <20 < 200 <10 <10 < 10 < 10 <10 < 10 < 50 <501.12-TDihlrmoethane '1.0 < 1.0 <-20 < 200 I1,0 < 1 0 <1, 0 < 1,0 <1,0 <10 < 50 <50Trchlorobehene <31. <10S <20 <200 <1.4 210 310 <in. 8210 <10 <500 <50
,1)1,2.Tetraeloroelhane <1.0 <1,0 <20 < 200 <1,0 <10 <10 I10 I10 <40 < 50 < 501E2hDlbrnonnatae '1 40_ <0 <01.0 10 <1.0 < 1.0 <1.0 <10 < 50 < 50Chorobezeno < _1.0 <10 <20 < 200 <10 <1.0 <1.0 < 1.0 2. < ~10 < 50 < 50S, , 1r.ene --oethn <1.0 <1.0 <20 <20 <1.0 <1.0 <1.0 1a < 10 < 10 < 50 < 50
soprhyl Bezen~on <40 1, <20 <200 10 <10 <0 <10 <0 <0 50 <50oBrmobenzene <1.0 '1,0 <240 <200 <10 <10 <1.0 210 '10 <420 100 <500S,22toyrenhe rete 140 <1.0 <20 < 200 <1,0 < 1,0 ' 1.0 <1I0 < 10 < 10 < 50 < 50123.Trhofomn opn ',0 <0 210 <1000 <50 <0 50 50 <5 <5 <50 <501.o5Timplybenzene <1,0 <10 <20 < 200 < 10 < 10 <10 < 10 < 1.0 <10 <50 50B2.romoberiz ezee e 1.0 <1.0 < 20 < 200 <1.0 10 <1.0 <1. <1. 0 < 10 < 50 ' 501,132.Di trchloroenhene I-<0 I 1,0 < 20 < 20 <10 10 <1,0 <Oin cia <10 <50 <1,4.Olchlorobenzeno <10 <1.0 __ <20 <2~~~~00 < 10 <10 < 10 <10 <1.0 < 10 <5 so 501,23-Dlchlomrobonzrle __ <10 <1.50 <20 <2000 _ 10 < 10 <150 <1.0 <10 < 10 250 2501.23Dibromo.3thylbrizrpre <510 <5.0 <100 <1000 <510 50 <5I0 <510 <50 50 <50 <501,2,4-Trnntehylobenzene <5. 0 <5.0 < 100 2 100 <51.0 <5I.0 <5 0 <5 0 <50 <510 '250 <250HexeDchlowbrobuaene <5. 0 <5.0 <100 <1000 <510 <5I.0 <5 <5 ~ 10 <5I.0 <510 <250 <250Ne4()phthoeroene<5~.0 <5.0 <100 <12000 <5I0 <5I0 <0 50 <50 <50 <250 <250
KBDLabsm onfldontlal 6/1/208 Pge
1.2 -0 _pane ~~~ 5.0 501 of 2650 0 < 0< 5

96 4 78
KB LABS, INC.Final Data Report
Project Number: 08-1 29DSC Richmond
Prepared for: Earth TechWell ID WNO io Wel ID Well ID Wol ID Well ID Well ID Wall ID Well ID Wall ID Well ID Well ID
0 0 0 0 0 0
Matrix: 5130/2008 5/3012008 5/3012008 5/30/08 53/2008 75/302008 =25/3/08 5/30/2008Dale Sampled. Water Water Waler Water Water Waler Waler WaterDilution: I10 1 0 10a 20- 20. 100I 1. 10 I 1 20 _____Dlchlonodlfluor~m-elhane < 10 ~ 10 c 10 <20 <20 < .0 < 1 0 <20Chloromnothane <10 <10 <10 '20 <20 <1 10 <2Vinyl Chloride <1 10 <10 <20 <20 <10 1. <2Bromomethane ___ 50 <0 <50 < 100 < 100 <50 <50 <0Chloroethane _10 <0 < 10 <0 < 20 <1 1 <2Trlehlorofluoromethane <10 < 10 <10 < 20 < 20 < . 1 0 <2MathonoChlonridee < 10 < 40 < 10 < 20 <20 1.1 1.4 <2t.1,2.Doiloroethene <10 < 10 <10 <2 <0 1. < 0 <0I,1-Dichloroelhn 10 < 10 <10 20 <20 < 1.0 I 1 0 < 20c-1,2-Dchlorehno ___ 46 9 <1 < 20 620 61.7 7.6 20Chloroform <io 10 < 10 < 20 <20 < 1 0 <1.' 0 < 20 ___11,1.1Tichloroethane ____ 10 < 1 < 0 20 <2 < 1 0 I 10 < 20Carbon Totrachlondad__ 10 C10 < 10 <20 <20 10 1,0 < 20Benzeno <11 0 0 30 2000 <2 1.0 <10 8301 .2.Olchloroetharne a -- 314 2 17 0 _ _Trlch-loroethene 120 98 I 1 <20 60 30.6 8.6 < 201.2.0ichIororopneT- -<0 <10 I10 <2 <20 <C1.0 < 1,0 <20
D/bromnnorethane <10 <10 <10 <2 20 <1. <120Bromodichloromethane < 10 < 10 <1 <2 <2 < 1. 1.0 < 20c-I13-0lchloropr ~n 1 100 <1 <20 <2 <10 < 1.0 <20Toluene a0s
23 5t.1.3.Oictllorop`0Pen-e <10 < 10 10 _ 2 0 1.0 < 201.1,2-Trichlorootone _ <10 <10 <10 < 20 <0 1. <0 <2Totramlloroothene 750 610 10 <20 410 19 3. 2Dlbronnochloronmethano C 110 0 10 < 20 <20 < 1 0 < 1 0 < 201.2,1D1bromnoethane <10 <101 0 0 <0 20 10 <10 <20Chlorobenzene ---- <10 <11 0 0 <0 20 <I.0 <0 <20M1,1,12-Totrachtoroethare, <-10 <-101- 10 <20 < 0 < 10 I0 < 20Ethy Benzone <40 < 10 <10 <2 2 10 <1.0 <20M&p Xylono <-20 < 20 <20 13 4 20 < 2.0 220o-Xytene - <10 < 10 82 56 <2 <1.0 < 10 380Styrerno <10 <410 < 10 <2 < 20 <1.0 -<10 < 20 ____Oromo~forn '10 <10- '10 <2 I2 <4.0 < 1.0 < 20Isopropyloobenzene <1 10 < 10 <20 <0 <0 < 10 < 20Bromobernzene <1 <10 <_<20 20_ <10 < 1.0 <20l.l.2,2T.TtroCh1lorothar~e < 0 < 0 <10 C2 20 < .0 < 1.0 <20l,2,3JTrchlonopro~pane_ - 5 5 0 0 0 00 < 5. <50 <001.3.5-Tritmethylbenzene 0 <0 <1 2 < 20 < 1.0 < I 0 351,2,4-Thnnethylbenzene____ 10 < 0 <10 3 20 I 0 < 1 0 45
1,3-Dichlorobenizene < 10 __0 10 <2 _20 __< 1.0 < 1 0 __'20
1,4-Dichlorobenzeine__ 10 <10 1 < 20 < 20 < 1.0 < 1 0 < 201.2.Djchloroaanzene <10 < 0 < 0 20 < 20 < 1 0 < 1.0 <201.2.Dflbromo-3-chlorpropene < 50 <50 <50 < 00 <10 <5.0 <50 <01,2,4-Trichlorobenzere _ 5 <5s<0 00 <10 0S <5.0 <0HexaChlonobu~tadjone <50 <55 0 0 I<10 10 <5.0 <50 < 100M~plhtholene < 50 <55 0 I 0 10 50 <5 0 <10 ____
KB Labs Confidentlal 6/13/2008 PageS6
20 of 26

964 79
KB LABS, INC.Method Blank SummaryProject Number: 08-129
DSC RichmondPrepared for: Earth Tech
Me MB Ms Me MeS Me Ms mO mO VB Me MB
U P
Matrix 5/27/2008 5/28/200 8 57/28/2008 5/29/2008 5/30/2008Analysis Date Water Water Water Water WaterDilution 1 1 1 1 1Dichlorodifluormomthane _ ci <1 0 <10 <10 <10Chloromathane c I _ <1 0 <10 <10 <10
_ _Vinyl Chloride < 1.0 __ 1.0 < 10 <10 <0 ____
Sromornothane- <~50 <503 <50 <50 <50 ____
Chloroethane <1.0 cT -a <10 <1 ciTrichioroftuoommethane <10 < 1.0 cia <I <1 O___lI-Dichloroa th-ene <1.0 < To0 ci0 c~ 1 0 c 1Mathyteno Chionde ____ <1.0 -13.0 13.8 14.7 13.0tt12-Dichloroethene I __ <0 <10 <10 < 10 ci 1.0__1,1.DlchJooethane< 1.0 <1.0 1 0 < 1 0 < I 0
_____C.1.2.Dichloncethone __ 1.0 c 0 < I 0 c 1.0 1.0Chloroform cia ci <10 < 1,0 <1 0 _ _1.li.Trlchloroethane cI < 10 <1,0 C 1.0 <10 ____
Carbon Tetrachlooide <1.0 C1.0 _ c1.0 <1.0 C1.0Beruzono 1 _ _0 10 __ 1.1 ,2.Oichtioroothana- 1.0 O ______1
Trichloroathene- _______I____0 .0
l.2.DichloropoPano - <.0 <1.0 <10 cia ci.o ___Dib ron orna tha n a
_________
Bromnodiehiorbanethan~e <1.0 _ <1.0 1 0 <1.0 i .0c.1.3.0/chlorol 1ee C10 < .0 <1.0 c1 0 1.0 ____
_____
t11.3-Dichlorokiropeno ci1 0 C1 0 <10 C10 CI0 _____
1,1,2-Trichloroolhane C1.0 I 0~ 1:10 < 1.0 <0 _____
Tetrachioroethanene -_________ _________ __________ ____I__
D11bromrochioronie there I 0 c 1 .0 1 .0 1 0 _____
1 .2.DJbiranoethane 1.0 1.0 < 0 1 __
Chiarabenzene <10 1 4 111.1I,2-Tetraohloroethnen 10 <1.0 C I 0 <10 < 10Ethyl Benzene <1- __ _
____ ___ ___ _____ _ ___I__T_4p Xyena_
_ 0 _0_ 20 20_2o-Xylene - 10 1.
_1_0I_ _1Styreno _____
____ ___ ___ ___
Brornoforrn, _________ .0 < .0 1
IS7-piwopylbenzeno _____<_____ ___I______
Bromobenzeno ___________O I
l,1.2.2-Totrachioroethaeno <. 1,0 <tO0 1 0 c1,0 ____ _____
1.2,23-Trichloro~prparnoe____ 50 _50 <T50 <50 <S ___0__
1.3.S-Trfet,P1bonzone _ 1 0 c_1,-!0 <10 I 0 <10 _____1,2.4-TrimneVhyibenzene _ 1 0 < 1q0 < 1.0 C 10 C10_____
1,3.Oictiorobenzene <10 10 < 1 0 < 1.0 <1.0 ____
I1.4-Dlchloroboneno 1.0___0 i__I__<_
,12 .2-Dchlorobenzene 5 __50_______ 5F
1.2.Diblromo.t3l.choepoan 5.0 c5,0 <540 < 5.0 <5.0 ____
KS Labs Confidential 6/13/2008 Page I
21 of 26
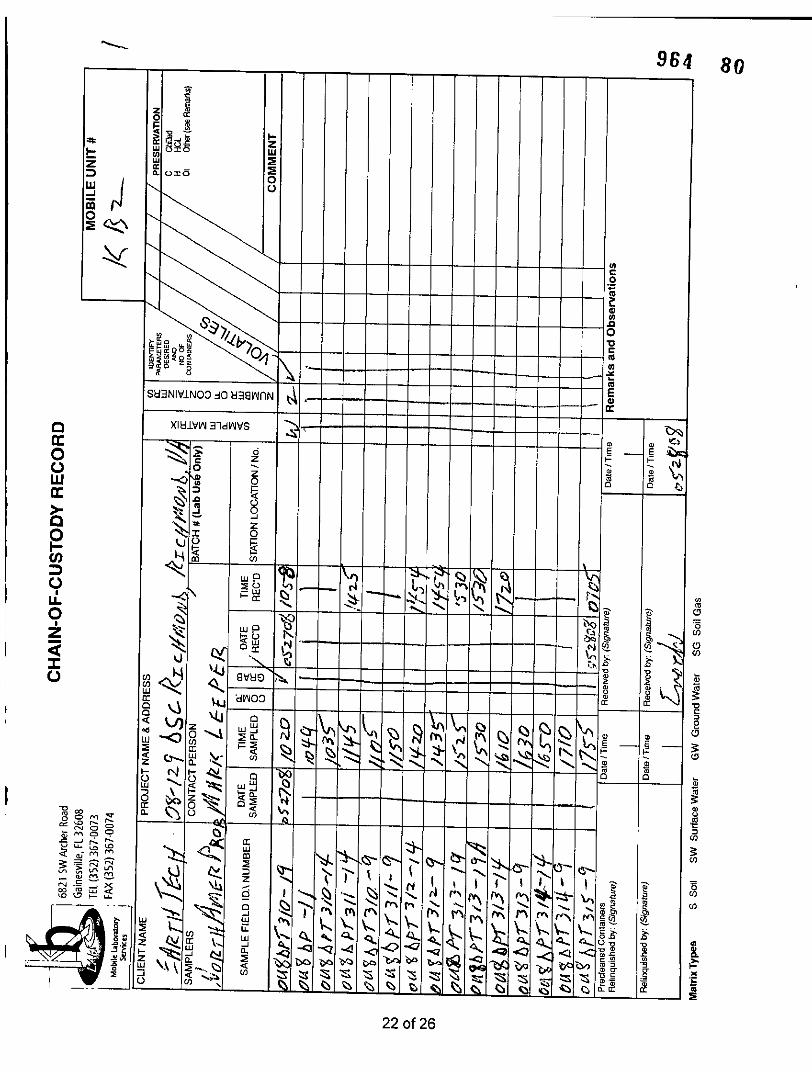
_ _ _ _ _ _ _ _ ~ ~ ~ ~ ~~~~~~~96 4 8 0
(0 W~~C 2~~~~~~~~~~.
0~~~~~~
1~~~~~~~~~~4 U~~~~~~~~~~~~
0~~~~~~~~~~~~~~~~~
O XIH~Sd3 IVIN0H10dI evNV
0EU~~~~~~~
0~~~~~~~I.-~~~~~~~~~~~~~~~~~~~~~~~~~~~R-(0
0
z w 'p
3 U .. &R~~~~~~~~~~~~~~~~~~~~~~~~~~~~~~~~~~~~~~~~~~~~~~~~~~~~~~~~~~~~~~~~~~~~~~~~0
t 0
U) Gv~~~~~~~~~~~~~~~~~~~~~~~~~q I ~ ~ ~ ~ ~ ~ ~ ~ ~ ~ £
~~~~~~~do
- w m - ~~ a
t 3- L) ~ ~ ~ m 4.'i l-
MAn~v~ff%.,~ o\,~t -, (,QC tA
<~~~~~~~~~~~~~~~~~~~~~~~~~~~~~~~~~~~~~~~~~~.
k
22 of 26

964 8j
0z~~~~~~
0
0
co
0 z~~~~~~~~~
0 z~~~~~~~~~~~~-C
0 0
LULL~~~~~~~~~~~~~~I
a]a
I- 'I- c-C - - - -
( U e V 0 - - - - - - - - - - - - - -U wP -
0 - ~ ~ ~ - - - -
s6 _ ----------
0~~~~~~~
I 0 4 rilNQ .
Cd~ ~ ~~~~~~2 f2

Lv>, _ _ _ _ _ _ _ - - _ _ _ _ _ _ ~~~~~~~~~~~~~~9 6 4 8 2
I
* -
0
S83NIV1NOO3O10H8svinN -
XIHLVVJ 3ldLVb'S- - - - - - - - - -
w ~~~~~~0
0~~~~~~~
S ~~~~~~~0 dAOD -~~~~~~~~~~~c
0GVH E)~~~~~~~~~~~~~~~~~~~
cn ~ ~ ~ ~ ~ ~ ~ ~ ~~~l
z za
0~~~~~~~~~~~~~~~~~~~~~~~~~~~~~~~~~~~~~~~~~~~~~~~~~~~~~~~~0
-o~~~~~~~~ x c
tv)~~~~~~~~~~~~~~~~~~~~~~~~~i- 0~~~J - .1..~NN.
rq ri 4 of 2

z~~~~~~
w 0w
0 NV ~~~~~~~~~~~
- - -- - - - - - - - - -
0
4 ~~~ cc~4
c z ~ ~ ~~~~~~~~-U
oi E
C)~~~~~~~~~~~~~I
0~~~~~~~~~~~~~~~~~~~~~~~~~~~~~~~~~~~~~~~~~~~~~~~~~~~~~~~~~~~~~~~~~~~0w 0~~~~~~
c-
'I- ~ ~ ~ ~ ~ ~ N.~ vE
0 _~~~~~~~~~~~~C tN CD
fv, a ~~~~~~~~CD
0 0~~~~~~~~~/
2~~~~~~~~~~~~~~~~~~~~~~~~~~
< Q- 41~~~ :a, - CD-
<~~~~~~~ ,
fl*g~ -........
_ _ _ _ U~~~~~~~~~~~~~~~~~~CI, t~
____ (4~~~~~25of2

____ ________ ~~~~~~~964 84
I~~~z~~~
4* Z
-i
0
0
0-------------------------6
SHflNIVJ.NOO.dO H38vdflN
o ~~~~~XIH±Vv 31dVYJVS
0 F~~~~~~~~~~~~~~~~~~~~~~~~~~~~~~
o ~~~~~~z 1
x 0~~~~~~~~~~~~~~~~~~
0
C) flr t....
IL ~ ~- -~ - ---
0~~~~~~~~~~~~~~~~~~~~~~~~~~~~~~~
CyM~~~~~~~~~~~~~~~~~~~~~~~
<S.A~~~~~~~~~~~~~~~~~~~~~
0~~~~~~~~~~~~~~~~~~~~~~~~~~~~~~~~~~~~~~~~~~~~~~~~~~~0
z~~~~zaQ
-4~~~~~~~~~~~V
26 of 26

964 85
ATTACHMENT B: ON-SITE LABORATORY QUALITY MANUAL

964 BE
Laboratory Quality Manual
Prepared by:
KB Labs, Inc.6821 SW Archer Road
Gainesville, Florida 32608(352) 367-0073
In Accordance with:
Chapter 64E- 1 Florida Administrative Code (FAC)Certification of Environmental Testing Laboratories
And with the consensus standards adopted at the National EnvironmentalLaboratory Accreditation Conference (NELAC)
This manual covers the following mobile units of KB Labs, Inc:
KB3-i, KB3-2, and KB3-3
Effective Date: May 2007

964
Laboratory Quality Manual
Prepared by:
KB Labs, Inc.6821 SW Archer Road
Gainesville, Florida 32608(352) 367-0073
In Accordance with:
Chapter 64E- 1 Florida Administrative Code (FAG)Certification of Environmental Testing Laboratories
And with the consensus standards adopted at the National EnvironmentalLaboratory Accreditation Conference (NELAC)
This manual covers the following mobile units of KB Labs, Inc:
KB-1, KB3-2, and KB3-3
CONCURRENCES:
KB3 Labs, Inc. Laboratory Director:Signature: __ _ _ _ _ _ _ _ _ _ _ _ _ _ _ _ _Date:
Bradley A. Weichert
KB3 Labs, Inc. Quality Assurance Officer:
Signaure: Michael G. WinslowDae
EFFECTIVE DATE: May 2007
2 KB Labs, Inc.Laboratory Quality Manual
Revision 3June 2007

964 *
TABLE OF CONTENTS
Laboratory Quality ManualPa2e
TITLE PAGE................................................................ ISIGNATURE PAGE......................................................... 2TABLE OF CONTENTS......................................................3LIST OF TABLES............................................................ 6LIST OF FIGURES .......................................................... 7
1.0 STATEMENT OF POLICY AND OBJECTIVES ............................ 81.1 SCOPE OF SERVICES................................................ 8
2.0 STAFF ORGANIZATION AND RESPONSIBILITIES...................... 92.1 DESCRIPTION OF JOB RESPONSIBILITIES.......................... 92.2 PERSONNEL EXPERIENCE AND TRAINING ........................ 102.3 ETHICS TRAINING .................................. 12.4 APPROVED SIGNATORIES..........................................I11
3.0 FACILITIES AND EQUIPMENT ........................................... 14
4.0 TEST METHODS & STANDARD OPERATING PROCEDURES ........... IS4.1 ADDITIONAL SOPs.................................................. 18
5.0 PROJECT OPERATIONS.................................................. 215.1 PROCEDURES FOR NEW WORK ASSIGNMENTS...................2 1
6.0 SAMPLE TRACKING AND HANDLING................................... 236.1 SAMPLING .......................................................... 236.2 SAMPLE CUSTODY ................................................. 236.3 CHAIN OF CUSTODY ............................................... 236.4 SAMPLE RECEIPT................................................... 236.5 SAMPLE STORAGE ................................................. 246.6 SAMPLE DISPOSAL ................................................. 24
7.0 CALIBRATION AND TRACEABILITY OF MEASUREMENTS........... 267.1 INSTRUMENT CALIBRATION.......................................267.2 PREPARATION OF INSTRUMENT CALIBRATION STANDARDS....267.3 STANDARD CURVE CALIBRATION................................. 277.4 INTERNAL STANDARDS (GC/MS) .................................. 277.5 INSTRUMENT TUNING (GC/MS).................................... 287.6 STORAGE OF CALIBRATION & REFERENCE STANDARDS......... 28
3 KB Labs, Inc.Laboratory Quality Manual
Revision 3June 2007

964 89
Page
7.7 MONITORING OF REFRIGERATORS AND FREEZERS .............. 28
8.0 SPECIFIC ROUTINE PROCEDURES TO ASSESS DATA ACCURACYAND PRECISION .......................................................... 308.1 LABORATORY QUALITY CONTROL CHECKS ...................... 308.2 METHOD PERFORMANCE .......................................... 3 18.3 DEMONSTRATION OF ANALYTICAL CAPABILITY ................ 32
9.0 DATA REDUCTION, VALIDATION, AND REPORTING .................. 339.1 DATA REDUCTION ................................................. 339.2 DATA REVIEW AND VALIDATION................................. 339.3 DATA REPORTING ................................................. 34
10.0 SYSTEM AND PERFORMANCE AUDITS.................................. 3510.! INTERNAL SYSTEM AUDITS........................................ 3510.2 EXTERNAL SYSTEM AUDITS....................................... 3510.3 INTERNAL PERFORMANCE AUDITS ............................... 3510.4 EXTERNAL PERFORMANCE AUDITS............................... 36
11.0 CORRECTIVE ACTION ................................................... 3711.1 COMPLAINTS ....................................................... 3711.2 DEPARTURES FROM PROCEDURES AND SPECIFICATIONS ........ 37
12.0 RECORD KEEPING AND DOCUMENT CONTROL........................4012.1 STORAGE OF PROJECT DATA...................................... 4012.2 STORAGE OF ADMINISTRATIVE RECORDS........................ 4012.3 MOBILE UNIT RECORD KEEPING .................................. 4112.4 DOCUMENT CONTROL ............................................. 41
13.0 PREVENTIVE MAINTAINANCE .......................................... 4213.1 DOCUMENTATION OF ROUTINE MAINTENANCE AND
NON-ROUTINE REPAIRS........................................... 4213.2 LABORATORY SET-UP ROUTINE................................... 42
APPENDIX A: Floor Plans ........................................................ 45Floor Plan KB- I.............................................................. 46Floor Plan KB3-2 ............................................................. 46Floor Plan KB-3 .............................................................. 47Floor Plan, Administrative Office.............................................. 48
4 KB Labs, Inc.Laboratory Quality Manual
Revision 3June 2007

964 SU
Page
APPENDIX B: Standard Forms.................................................... 49Work Order Form ............................................................ 50Chain-of-Custody Record ..................................................... 5 1Demonstration of Capability Certification Statement ............................ 52Field Chemist Comments...................................................... 53Data Review Checklist........................................................ 54Data Folder Table of Contents Checklist........................................ 55Quarterly System Audit Form ................................................. 56
APPENDIX B: Final Report to Client...................................... ........ 57Cover Letter................................................................. 58Project Narrative ............................................................. 59Analysis Sequence/Surrogate Percent Recoveries ............................... 60Spike Compound Percent Recoveries .......................................... 6 1Final Data Report ............................................................ 62Chain-of-Custody Records .................................................... 63
5 ~~~~~~~~~~KB Labs, Inc.Laboratory Quality Manual
Revision 3June 2007

96 4 9 I
LIST OF TABLES
Title Table No. Page
Approved Signatories 2-1 13Major Instrumentation - KB3-I 3-1 ISMajor Instrumentation - KB-2 3-2 16Major Instrumentation - KB3-3 3-3 1 7Analytical Methods Performed by KB Labs, Inc. 4-1 20Sample Containers, Preservation Methods, and Holding Times 6-1 25Standard Sources and Preparation 7-1 29Corrective Action 11-I 39Preventive Maintenance Procedures 13-1 43
6 KB Labs, Inc.Laboratory Quality Manual
Revision 3June 2007

964 392
LIST OF FIGURES
Title Figure No. Nage
Organization Chart 2-1 12Floor Plan, KB-i 3-1 45Floor Plan, KB-2 3-2 45Floor Plan, KB-3 3-3 46Floor Plan, Administrative Office 3-4 47Flowchart of' KB Labs Project Operations 5-1 22
7 KB Labs, Inc.Laboratory Quality Manual
Revision 3June 2007

964 93
1.0 STATEMENT OF POLICY AND OBJECTIVES
The policy of the management of KB Labs, Inc., is to implement a quality assurance programwhich is in compliance with the provisions and standards set forth in Chapter 64E-1I FloridaAdministrative Code (FAC), Certification of Environmental Testing Laboratories, which havebeen determined to be equivalent to the National Environmental Laboratory AccreditationConference (NELAC) standards; and to assure that all certified environmental analyses areperformed in accordance with the provisions and standards in Chapter 64E-I(FAC). Thepurpose is to ensure that all environmental data generated by KB3 Labs are scientifically valid,definable, and of known and acceptable precision and accuracy.
The management of KB Labs is committed to providing its clients services that conform toestablished quality requirements, including those associated with schedules and budgets, andassuring that all personnel strive to perform their job functions correctly without compromise ofquality or obligations to clients.
1.1 SCOPE OF SERVICES
KB Labs provides a number of on-site analytical services using mobile laboratory facilities. KBLabs performs chemical analyses only. The primary focus is the determination of
* Volatile organic compounds (VOCs) by gas chromatography/mass spectrometry(GC/MS), providing full confirmation data on-site.
Analytical capabilities also include:
* Organochlorine pesticides (OCPs) by gas chromatography/electron capture detector(GC/ECD)
* Polychlorinated biphenyls (PC~ls) by GC/ECD
8 KB Labs, Inc.Laboratory Quality Manual
Revision 3June 2007

964 94
2.0 STAFF ORGANIZATION AND RESPONSIBILITIES
Figure 2-1 shows the organization and line of authority of KB Labs personnel.
2.1 DESCRIPTION OF JOB RESPONSIBILITIES
The job descriptions of key staff are described below.
* President - responsible for all contractual obligations of the proposed work and directsCorporate efforts as necessary to achieve the objectives of schedule, cost, and technicalperform-ance. The President is also responsible for the review and administration of allcontract changes, and for the direct communication and liaison with the client. ThePresident can also act as a project manager.
* Director of Operations - responsibilities include the preparation of work plans andschedules, the allocation of manpower and material resources, and the directcommunication with field team operations. The Director of Operations can also act asproject manager.
* Quality Assurance (QA) Officer - provides monitoring and periodic internal auditing ofthe quality control (QC) procedures of the field chemists, ensures that established QCprocedures are being followed, that adequate documentation is provided, and that all QCproblems are handled in an expeditious manner. The QA officer is also responsible forthe formatting and quality control of all documents and for the compiling, updating andsubmitting of the formis, SOPs, and the Laboratory Quality Manual.
* Laboratory (Technical) Director - responsible for the overall technical operations of allmobile laboratory units. The Laboratory Director is responsible for certifying that thefield chemists with the necessary educational and technical training perform theanalytical tests and maintain the overall operation of each mobile unit in accordance withthe policies and procedures documented in the Laboratory Quality Manual.
* Field Chemists - responsible for performing quality analytical work in accordance withpublished standard procedures. Field chemists serve primarily as chemical analysts, butmay also function as project managers, field team leaders, sample custodians, couriers, orother capacities on a project-specific basis. Field chemists are generally assigned theresponsibility of operating and maintaining a single field mobile unit.
* Health and Safety Officer - responsible for the oversight of the laboratory health andsafety program and maintenance of the Health and Safety Manual.
9 KB Labs, Inc.Laboratory Quality Manual
Revision 3June 2001

964
2.2 PERSONNEL EXPERIENCE AND TRAINING
Documented evidence for the following will be maintained on an ongoing basis for each memberof the organization in designated personnel files kept in the administrative office of KB Labs.Copies of these files will also be maintained in each mobile lab facility. This evidence willinclude resumes, training records, demonstrations of capability, results of performanceevaluation samples, etc.
* All personnel shall have sufficient education, training, experience and technicalknowledge to adequately meet the requirements and responsibilities of their designatedfunctions in the organization and they must comply with the specific quality requirementsof their function.
* Technical personnel must be able to demonstrate a specific knowledge and skill in theperformance of their technical tasks, as well as a general knowledge of analyticalmethods, laboratory operations, QA/QC procedures, and records maintenance.
* All technical personnel must have read and understood the Laboratory Quality Manual.
* All technical personnel must have read and understood all SOPs that address functionsfor which they are responsible.
* Field chemists must demonstrate on an annual basis proficiency in the test methods forwhich they perform. This proficiency requirement can be met with successfulperformance of a demonstration of capability, a blind PE sample, or at least fourconsecutive laboratory control samples.
Refer to KB Labs' Standard Operating Procedure (SOP) No. 027, New Analyst Training.
2.3 ETHICS TRAINING
All employees will receive instruction in the basic standards of ethical conduct that are expectedof them while employed by K-B Labs. This training will be conducted at the beginning of theiremployment and on an annual basis thereafter. The training will be conducted by the LabDirector or the Quality Assurance Officer and will include matters relating to data falsification ormanipulation, client confidentiality, and professional conduct.
* An employee who falsifies or improperly manipulates data will be subject to terminationof employment and/or possible legal action.
* All data generated, collected, or obtained from a third party subcontractor by KB Labsabout KB Labs clients will be treated as confidential. No information or analytical datawill be provided to a third party without the permission of the client.
10 KB Labs, Inc.Laboratory Quality Manual
Revision 3June 2007

964 9;
Employees should use "common sense" in complying with acceptable business practicesand at a minimum adhere to the following:
o Accept or give no gifts that where it could be inferred that business favors mightbe returned or expected by KB Labs.
o Do not use information gained as a KB Labs employee for personal gain.o Make no promises that conflict with the employee's responsibilities to KB Labs.o Report any violations of company policies.o Comply with federal, state, and local laws and regulations governing personal and
business conduct.
Employees must read and understand KB Labs' SOP No. 029, Ethics and IndividualResponsibility Training. A signed and dated copy of this document will be placed in theemployee's training file.
2.4 APPROVED SIGNATORIES
Table 2-1 below lists the approved title, current responsible party, and corresponding signature
for laboratory document types.
I 1 KB Labs, Inc.Laboratory Quality Manual
Revision 3June 2007

964 3?
Michael G. Winslow
Health & Sft fie
Office ManagerPurchasing Agent -
Hazardous Waste Coordinator Laboratory DirectorChristine E. Priest Bradley A Weichern
Mobile UnitField Chemists
KB- I KB-2 KB-3(Volatiles) (Volatiles) (Sernivolatiles)
Bradley Weichert Glenn Jackson Enoch Tuan Luu Greg Lam
FICURE 2-1: KB Labs Organization Chart
12 KB Labs, Inc.Laboratory Quality Manual
Revision 3June 2007

96 4 98
Table 2-1: Approved Signatories
Document Type Title Name Signature Initials
Laboratory Quality QA Officer Michael G. Winslow __________
ManualLab Director Bradley A. Weichert ___________
Lab Director Bradley A. Weichert ___________
Bid, Proposals President M. Kelly Bergdoll ______________
Director of Todd L. Romero __________
Operations
Contracts President M. Kelly Bergdoll _______________
Reports to Clients Director of Todd L. Romero __________
Operations
President M. Kelly Bergdoll ______________
QA Reports QA Officer Michael G. Winslow __________
Preliminary Field Field Chemists Bradley A. Weichert ___________
Reports, LabNotebooks, Greg G. Lamb __________
Logbooks, DataSheets Mark WA. Mathews __________
Glenn Jackson
Enoch _ _ _ _ _ _ _ _ _ _
Tuan Luu tr_ _ __ _ _ _ _
13 KI3 Labs, Inc.Laboratory Quality Manual
Revision 3June 2007

964 g9
3.0 FACILITIES AND EQUIPMENT
KB Labs currently operates a total of three (3) mobile laboratories - two (2) dedicated tovolatiles analysis, one (1) to semi-volatiles analysis.. Each laboratory is designed to operate witha maximum of two field chemists, although generally for most projects only one chemist isrequired to operate a mobile laboratory facility. The mobile units are lzuzu single axle boxtrucks. Appendix A shows the floor plans for each of the mobile units with the arrangement ofmajor analytical instrumentation and support equipment.
Tables 3-1 to 3-3 below list the major analytical instrumentation that is located in each of themobile laboratories. Each mobile unit maintains the appropriate manuals supplied by themanufacturer for operation and maintenance of the instrumentation.
Each mobile unit operates as a stand alone laboratory and is NELAC certified as such.
14 KB Labs, Inc.Laboratory Quality Manual
Revision 3June 2007

96410
Table 3-1 Major Instrumentation, KB-I
_____________________________________ _________________________Y ear
Item(s) Model(s) Serial Nos. Purchased
Hewlett-Packard (HP) GC 5890A /3235A46501 (GC) 1998Gas Chromatograph/Mass MSD 5971A*/ 3188A02953 (MISD) 1998Spectrometer/Data System Chem Station
Hewlett-Packard GC 5890A / 2643A09969 (GC) 1998Gas Chromatograph/Flame FID 19231 /Ionization Integrator 3396Detector/Integrator
Tekmar LSC 2000/ 90288012 (LSC) 1998Purge & Trap Concentrator /ALS 2016 90277001 (ALS) 199816 Position Autosampler
*upgraded to 5972 in 2002
Is ~~~~~~~~~KB Labs, Inc.Laboratory Quality Manual
Revision 3June 2007

964 Ij
Table 3-2 Major Instrumentation, KB-2
YearItern(s) Model(s) Serial Nos. Purchased
Hewlett - Packard (HP) GC 6890A /US0004 1726 (GC) 2006Gas Chromatograph/Mass MSD 5973A /US925 11963(MSD)Spectrometer/Data System Chem Station
Hewlett-Packard (HP) GC 5890A / FID 2541 A06416 (GC) 1999Gas Chromatograph/Flame 19231 / IntegratorIonization Detector 3396/[ntegrator
Tekmar LSC 3000 /94271006 (Tekcmar) 2006Purge & Trap Concentrator Arcon 90178025 (Varian)/Varian Autosampler
16 KB Labs, Inc.Laboratory Quality Manual
Revision 3June 2007

96 4 102
Table 3-3 Major Instrumentation, KB-3
Item(s) Modejl~s) Serial Nos. Year Purchased
Hewlett-Parkard (HP) GC 5890 /2750A 1644470 1999Gas Chromatograph/Electron Integrator 3396Capture & Flame Ionization /Turbo-chrom 4.0Detectors/Integrator/DataSystem
Hewlett - Packard (HP) GC 5890A /2643A09843 (GC) 1999Gas Chromatograph/Mass MSD 5971 A /3306A04459(MSD)Spectrometer/Data System Chem Station
Tekmar LSC 2000 /90248015 (LSC) 1999Purge & Trap Concentrator ALS 2016 90178025 (ALS)/ Autosampler
Applied SeparationsPressurized Solvent Extractor PSE 10502 032000401 2001
17 KB Labs, Inc.Laboratory Quality Manual
Revision 3June 2007

964 los,
4.0 TEST METHODS AND STANDARD OPERATING PROCEDURES
Analytical reference methods and sample preparation reference methods currently performed byKB Labs, Inc. are listed in Table 4. The table also indicates the allocation of test methods amongthe different mobile units.
If additional, alternative, or modified procedures are ever proposed, a complete description of themethod with data from an initial demonstration of proficiency will be provided to DOH forapproval.
Each mobile unit maintains a copy of the most recent revision of the EPA SW846 referencemethod available for the tests performed in the mobile unit. In addition, a copy of the KB Labsanalytical method SOP is attached to the published reference method. These SOPs documentspecific steps, procedural changes, and operating conditions actually utilized by KB Labs fieldchemists.
A comprehensive Laboratory Methods Manual is also maintained in the KB Labs administrativeoffice that contains the latest revision of the SW846 methods used by K-B Labs as well as copiesof KB Labs analytical method SOPs.
4.1 ADDITIONAL SOPs
In addition to analytical method SOPs, KB Labs maintains copies of the following SOPs in boththe mobile lab units and the administrative office:
SOP No. Title
SOPOO0I Mobile Lab Power-Up
SOP002 Storage and Management of Gas Cylinders
S0P003 Final Report Preparation, Review, and Delivery
S0P004 Data Review and Validation
SOP005 Supply Requisition
S0P006 New Work Assignments
S0P007 Sample Receipt and Acceptance
50P008 Filing and Archiving Project Records
50P009 Significant Figures and Rounding Off
SOPO010 Waste Disposal
SOPO I I Temperature Monitoring
1 8 KB Labs, Inc.Laboratory Quality Manual
Revision 3June 2007

964 IO4
SOP No. Title
SOP0 12 Storage of Standards
SOP013 Sample Storage
S0P014 Maintenance of Control Data
SOP0 15 Document Control
S0P016 Handling Complaints
SOPO 1 7 Corrective Actions
SOPO IS Quality Control
SOPO 19 Labeling and Tracking of Standards
S0P020 Audits
S0P021I Sample Identification and Tracking
S0P022 Proficiency Test Samples
S0P023 Analytical Run Sequence
S0P024 Detection Limits
S0P025 Sample Containers, Preservation, and Holding Times
S0P026 Subsampling
S0P027 New Analyst Training
S0P028 Demonstration of Capability
S0P029 Ethics Training
S0P030 Contingency Plans for Changes in Ownership
SOPO31I Protecting Confidentiality, Proprietary Rights, and National Security
S0P032 Departures from Documented Policies and Procedures
S0P033 Downtime Events
S0P034 Management Quality System Review
S0P03 S Calculations
S0P036 Calculating and Reporting Soil Data
1 9 KB Labs, Inc.Laboratory Quality Manual
Revision 3June 2007

964 ios,
Table 4-1 Analytical Methods Performed by KB Labs, Inc.
AnalyticalSample Preparation Reference KB Labs
Parameter Matrix Reference Method Method SOP No.
Volatile organics Water 5030 8260B ASOPI(KB-1, KB-2, KB-3) Soil 5035 8260B
Organochlorine pesticides Soil 3545 8081 ASOP2(KB-3)
Polychiorinated biphenyls Soil 3545 8082 ASOP2(KB-3)
20 KB Labs, Inc.Laboratory Quality Manual
Revision 3June 2007

96 4 to06
5.0 PROJECT OPERATIONS
Figure 5-1 shows a flowchart of KB Labs overall project operations and primary taskresponsibilities from field trip preparation to data report delivery.
5.1 PROCEDURES FOR NEW WORK ASSIGNMENTS
Before accepting a new work assignment, the Director of Operations reviews the Request forProposal (RFP) and/ or verbally questions the potential client to ascertain the following elementsto determine if KB Labs, Inc. can successfully complete the work assignment:
* Analytical compounds to be analyzed and by what analytical method.* Determine sample matrix (i.e., ground water, soils, etc.)* Approximate number of samples to be analyzed.* Time duration and site location of project.* Requested reporting limits.* Point-of-Contact (POC) information* Final reporting requirements (both electronic and hardcopy).
The following elements are reviewed by the Director of Operations as the basis for mobilelaboratory and Field Chemist assigunment to new project:
* Analytical compounds to be analyzed and analytical method.* Training and analytical experience of Field Chemist.* Availability of laboratory and Field Chemist for scheduled project dates.* Past chemist experience at site and/or previous interaction with client.
Preparation of the laboratory and Field Chemist for new work assignment involves thefollowing:
* Field Chemist is issued completed Work Order Form (See Appendix B) from the Directorof Operations (Project Manager).
* Required standards, gases, and laboratory supplies are issued (if necessary) to theassigned laboratory by the Director of Operations.
* Routine maintenance is performed on the laboratory and analytical instruments prior todeparture by the Field Chemist.
See also KB Labs' SOP No. 006, New Work Assignments.
2 1 KB Labs, Inc.Laboratory Quality Manual
Revision 3June 2007

964 1 0?
Field Trip PreparationProject Manager/Field Chemist
Sample CollectionClient Sampler
Transport to Mobile LabClient Sampler
Sample Log-inField Chemist
Schedule AnalysesField Chemist
Perform AnalysesField Chemist
Quality Control ChecksF Q Field Chemist
Data ManagementField Chemist;
Data ReviewField Chemist, Data Specialist
Data ReprData Specialist, Projc aae
FIGURE 5-1: Flowchart of KB Labs Project Operations
22 KB Labs, Inc.Laboratory Quality Manual
Revision 3June 2007

964 108
6.0 SAMPLE TRACKING AND HANDLING'
6.1 SAMPLING
KB Labs provides no sampling services. However, KB Labs will supply sample containers. Allsample containers are purchased pre-cleaned (and with preservatives if required) from certifiedcommercial suppliers. Sample containers are not cleaned for reuse.
Table 6-1 lists containers, preservation methods, and holding times for volatile and semi-volatile
sample types.
6.2 SAMPLE CUSTODY
Sample custody is an essential part of field and laboratory operations and is defined as follows:
Sample custody - the sampler or transferee is in physical possession of the sample or was inphysical possession of sample and sample was then placed in a secure area to prevent tampering.Where data may be needed for potential litigation, strict chain-of-custody procedures must beused.
6.3 CHAIN-OF-CUSTODY
A Chain-of-Custody Record (see Appendix B) is initiated at the time sample containers aredispatched to the field sampling team by the field chemist. A Chain-of-Custody Recordaccompanies sample containers to the field. This document is used by the field team to recordsample identification, sample description, date, time, and location of collection, analysesrequired, and condition of sample. All requested information on this form must be completedwhere appropriate. This document must be signed by a member of the field team. All errors aredeleted with one line through error and initialed and dated.
Because mobile lab operations are limited both in scope and time, the individual sampleidentification numbers initiated by the field team are maintained by KB Labs from samplereceipt to final data reporting.
6.4 SAMPLE RECEIPT
The field chemist is designated as the sample custodian. This person receives samples from a
member of the field sampling team and checks for the following:
* appropriate sample containers.* adequate sample volume or mass* signs of leaking, broken, or contaminated sample containers.* whether headspace is present in the sample container (VOCs).* proper preservation as specified in Table 6.
23 KI3 Labs, Inc.Laboratory Quality Manual
Revision 3June 2007

aTIIII I
K~~~~~~~~~~~~~~~cIII!IIZ
iIc zlII I ~Ilw mi r ~"IIknI
K ~ ~ ~ ~ IpI II,' t !Ir
r~liiI I I 1~1 ~ Ih
K ~ ~ III IIi
I 11, I A I 11,1111, <I 11, I 111w I , I~l~ II 1II21L

96 lI
IA ~SaII1ptV f pr,1hmr*~[A l FI6~ \itilil~..Al Iephdfil IiA, 1
Paramovi___ %Ilrid' nanl w li 11 d,

96 4 i
7.0 CALIBRATION AND TRACEABILITY OF MEASUREMENTS
Because measuring operations employing analytical instruments and other support testequipment have an effect on the accuracy or validity of tests, each mobile unit must performcalibration and verification procedures before equipment is put into service and on continuingbasis.
7.1 INSTRUMENT CALIBRATION
Instrument calibration procedures establish the relationship between a calibration standard ofknown concentration and the measurement of the standard concentration by an instrument oranalytical procedure. At a minimum, calibration is required (1) when an instrument is firststarted up; (2) daily, prior to the analysis of a batch of samples, (3) when the instrument has beensubject to major maintenance, or (4) when the instrument fails the calibration quality controlchecks.
Initial calibration is performed when the instrument is started up or when the instrumentresponse has drifted out of calibration in order to demonstrate that the instrument is capable ofacceptable performance at the beginning of the analytical run and is producing a linearcalibration. Initial calibration is usually performed with five standards that cover the analyticalworking range of the method. The standard concentrations will be adjusted to take into accountthe instrument and method, the upper and lower limits of linearity, and the instrumental detectionlimit.
Continuing calibration is performed at the beginning and end of the day's analysis or a leastevery 12 hours in order to verify initial calibration. The continuing calibration standard (CCS) isgenerally a mid-level standard from the initial calibration but should be varied within thecalibration range on a regular basis.
(Sample responses are quantitated from the initial calibration and not from continuingcalibration.)
In all cases, if the method calibration requirements are more stringent than those listed in thisdocument, then the method calibration requirements will be followed. In all cases, when aninstrument is calibrated for analysis it will be recorded in an instrument logbook with date,initials of analyst, analyte(s), and all appropriate instrument settings. It will also be recorded onthe analytical bench sheet or computer printout how the instrument was calibrated.
7.2 PREPARATION OF INSTRUMENT CALIBRATION STANDARDS
Stock solutions used to prepare calibration standards, surrogate and matrix spike solutions, andinternal standard solutions are purchased from commiercial suppliers (see Table 7-1 below).
26 KB Labs, Inc.Laboratory Quality Manual
Revision 3June 2007

964 112
For stock standards purchased directly through a supplier, the initials of the receiver and date ofreceipt are written in ink on the original Certificate of Analysis. If the standard has an expirationdate, this date is circled in ink to ensure that the preparer does not use expired standards. Asthese expire, they are disposed. All information concerning these standards, including LOT#,supplier of standard, concentration of standard, purity of standard, and method of determinationof purity are on the original container and the Certificate of Analysis which accompanies thestandard. Further information concerning the purchase of the standards is in a purchase orderlogbook with date of purchase, purchaser of standard, supplier of chemical and date of receipt ofstandard. All other information concerning these standards can be obtained from the supplier ofthe standard as needed. The original copy of the Certificate of Analysis for stock standardspurchased in kept on file with the Quality Assurance Officer.
Working standards are prepared directly from the stock standard. If required, all dilutions areprepared in Class-A volumetric glassware. All documentation tracing the working standards tostock standards and chemicals will be kept in a standards notebook next to each instrument andwill include the analyte(s), initials of analyst, date of preparation, concentration levels ofstandards, how standards were prepared, and stock standard used to prepare working standardsand intermediate standards if applicable.
Working standard solutions will be prepared by sequential dilution of a single stock standard tobracket the analytical working range of the method. Working standard solutions may be eithercomposite standards of more than one analyte or single-analyte solutions. The standardconcentrations will be adjusted to take into account the instrument and method, upper and lowerlimits of linearity, and the instrumental detection limit. At least three (3) standard concentrationscovering the working range and a blank will be prepared and analyzed. The working standardsand the blank will be analyzed at the beginning of the analytical run (initial calibration) and atleast one mid-level standard will be reanalyzed at least every 12 hours and at the end of the runto check for constant instrument response (continuing calibration verification).
7.3 STANDARD CURVE CALIBRATION
The working curve will be produced by plotting the standard response for each standard versusthe concentration of each standard from the initial calibration run or average response factors, ifmethod criteria are met. Specific quality control acceptance criteria for working curves or forcontinuing calibration standards are listed in the methods and will be followed.
7.4 INTERNAL STANDARDS (GC/MS)
Internal standards are added to all samples and standards that are analyzed for GC/MS analysis.Quantitation cannot be performed without internal standards. Method appropriate internalstandards are listed in the analytical reference method. The working concentration of the internalstandards will be prepared according to the method.
27 KI3 Labs, Inc.Laboratory Quality Manual
Revision 3June 2007

964 fl3
7.5 INSTRUMENT TUNING (GC/MS)
Daily instrument tuning will be performed to ensure that the instrument is calibrated and inproper working condition. Bromofluorobenzene (BFB) will be used as the tuning compound forvolatile analysis and the mass intensity specifications will be followed according to each method.The working concentration for BFB will be prepared according to the method.
7.6 STORAGE OF CALIBRATION AND REFERENCE STANDARDS
All standards are stored in refrigerators located in each mobile laboratory facility. Standards willbe stored separately from samples. VOCs will be stored in a freezer at -1O0 C and SVOCs andmetals in a refrigerator at < 6 OC.
Refer to KCB Labs' SOP No. 0 13, Storage of Standards.
7.7 MONITORING OF REFRIGERATORS AND FREEZER
Temperatures for refrigerators and freezers are measured on a daily basis and recorded in a DailyTemperature Record . If the measured temperature for this equipment is out of control, it will benoted in the logbook, the necessary adjustment will be made to correct the temperature and itwill be monitored until temperature is in control and constant. All laboratory thermometers arecalibrated annually against a NIST certified thermometer. If any thermometer is more than 1' Cdifferent from the NIST thermometer, it is replaced.
28 KB Labs, Inc.Laboratory Quality Manual
Revision 3June 2007

964 124
Table 7-1: Standard Sources and Preparation
Standard Preparation From Lab Stock PreparationT3DC Source Source Storage Frequency
Calibration Purchased Working solutions Refrigerator @ Weekly for gases,compounds from are made directly < 6 'C (SVOCs) or monthly
supplier from source stock Freezer @ -10 0C(VOCs)
GC/MS Purchased Working solutions Freezer @ -10 0C SemiannuallyInternal fro m are made directlystandards supplier from source stock(VOCs)
Matrix spike Purchased Working solutions Refrigerator @ Semiannuallyand surrogate from are made directly < 6 C (SVOCs)compounds supplier from source stock Freezer @ -10 0C
(VOCs)
GC/MS Tuning Purchased Working solutions Freezer @ -ItO C AnnuallyCompound from are made directlyBromofluoro- supplier from source stockbenzene
29 KB Labs, Inc.Laboratory Quality Manual
Revision 3June 2007

98 4 11,5
8.0 SPECIFIC ROUTINE PROCEDURES USED TO ASSESSDATA ACCURACY AND PRECISION
Data accuracy will be assessed for each measurement system and each sample lot using a knownreference sample and/or a sample spiked at a known level. The recovery of the sample will thenbe compared to the method accuracy acceptance criteria established by the laboratory.
Data precision will be assessed similarly using replicate analyses. Data precision will becompared to the method precision acceptance criteria established by the laboratory.
If the accuracy or precision results do not fall within the established control limits for methodperformance, then the results reported for all samples processed as part of the same set must belabeled as suspect, and the samples may need to be repeated. The project QA officer and projectmanager will be notified and the necessary corrective action implemented.
In all cases, if the EPA method specific QC requirements (if established) are more stringent thanthose established by KI3 Labs, then the method QC requirements should be followed.
8.1 LABORATORY QUALITY CONTROL CHECKS
Types of QC samples used include method blanks, matrix spikes, matrix spike duplicates,laboratory control or reference spikes, surrogates, and blind performance evaluation samples.
The following minimum QC checks will apply to all analyses:
Method blank - Daily analysis of laboratory reagent water or standard soil samples isperformed in order to monitor the cleanliness of the analytical system. Method blank analysis(VOCs only) is performed before analyzing samples, after high level sample analysis, and atleast every 12 hours. For SVOCs there should be at least one method blank for every batch of 20or less samples extracted.
Matrix spike/matrix spike duplicates (MS/MSD) - A known amount of each target compoundis added to duplicate aliquots of a selected field samples in order to monitor the performance(precision and accuracy) of the target analytes in an actual matrix. An MS/MSD is analyzed at afrequency of one pair every 20 samples of a matrix type (soil or water).
Reference standard/laboratory control spike (REF/LCS) - A REF/LCS is analyzed after theinitial calibration to check the validity of the calibration standards. The REF/LCS is preparedfrom a different source stock standard than are the calibration standards. An REF/LCS isanalyzed at a frequency of one for every preparation batch of 20 or less samples of a matrix type.
Surrogate standards - The surrogate standard solution is added to all samples and standardsthat are analyzed. The surrogate compounds evaluate the performance of the analytical systemand to help determine the potential for sample matrix effects.
30 KI3 Labs, Inc.Laboratory Quality Manual
Revision 3June 2007

96416
QC tables are maintained for duplicate spikes, and reference samples. Separate tables aremaintained for each analytical method. Warning and control limits are established by standarddeviation techniques.
For duplicate samples, the relative standard difference (RPD) = X, - XI x 100(XI ± X 2 /2)
is utilized as the test statistic precision.
For spike data, the test statistic for accuracy is the percent recovery of the spike defined asfollows:
% Recovery = cone, spiked sample - cone. unspiked sample x 100conc. of spike actually added
The test statistic for reference samples is the actual measured concentration. For both of thesetest statistics the mean and standard deviation are determined utilizing a number of data points.The warning and control limits are established as ± 2 and ± 3 standard deviation units from thecalculated mean values, respectively. These limits are updated on a continuing basis as new QAdata is entered. They are based on the most recent 50 data points for a given analyte and matrix.If a sufficient number of QA data points is not available for a given analyte and matrix, then theQA targets will be based upon published QA targets until sufficient data points have beengenerated.
Refer to KB Labs SOP No. 0 18, Quality Control.
8.2 METHOD PERFORMANCE
Method performance is established by determining the Method Detection Limits (MIDLs) in thematrix of interest. The MDL is defined as the minimum concentration of a substance that can bemeasured and reported with 99% confidence that the value is above zero. The MDL that isachieved for a given analyte will vary depending on instrument sensitivity and matrix effects.
The MDL for both waters and soils is experimentally determined by KB Labs using proceduresdescribed in 40 CFR, Part 136, Appendix B and as per 91-04. Seven replicate samples of eachmatrix (standard laboratory reagent water or soil) are spiked with a known concentration of eachanalyte of interest. The concentrations for each analyte are then experimentally determinedusing the procedures described above for this method. The standard deviation of the foundconcentrations for the seven replicates is then calculated. The MDL for each analyte is thendetermined by multiplying the standard deviation by 3.14.
Refer to KB Labs' SOP No. 024, Detection Limits.
Laboratory control limits are established by KB Labs for both waters and soils. The laboratorycontrol limits are calculated by determining the average percent recovery and standard deviationmeasured for each analyte when determining its MDL. The upper and lower control limits arecalculated as the average percent recovery plus or minus 3 times the standard deviation.
3 1 KB Labs, Inc.Laboratory Quality Manual
Revision 3June 2007

964 .117
All MDLs will be verified or updated on an annual basis. Copies of the MvDL studies for eachmethod will be kept in the appropriate mobile units and in the mobile unit files maintained in theadministrative office.
Refer to KB Labs' SOP No. 0 14, Maintenance of Control Data.
8.3 DEMONSTRATION OF ANALYTICAL CAPABILITY
Each analyst, prior to using any test method on samples, must perform a demonstration ofcapability for each method. This requirement will also hold for any time a new instrument isintroduced into the laboratory.
The demonstration of capability will consist the same procedures followed for determining theMDLs as described in Section 8.2 above. A minimum of four (4) replicate samples (instead of 7)are required.
All demonstrations of capability will be documented on the Demonstration of Capability formshown in Appendix B. These completed and signed forms will be maintained in each analyst'straining and experience file.
Refer to KB3 Labs' SOP No. 028, Demonstration of Capability.
32 KB Labs, Inc.Laboratory Quality Manual
Revision 3June 2007

96 418
9.0 DATA REDUCTION, VALIDATION, AND REPORTING
9.1 DATA REDUCTION
Data reduction and transfer are essential functions in summarizing information to supportconclusions. It is essential that these processes are performed accurately and that acceptedstatistical techniques are used. Field chemists are responsible for calculating final data and QCdata from raw data recorded on laboratory bench sheets, chart recordings, and computerprintouts. All calculations are in accordance with the approved methods cited earlier. Examplecalculations are included with summarized data to facilitate review. All computer printoutsshould be labeled with analyst name, analyte, date of analysis, project name, and all pertinentinstrument settings. All data are compiled in a project file folder for delivery to the DataSpecialist for review. To facilitate data review for each project, the following items should be ineach project file folder in the order listed:
* Diskette with field preliminary data report in electronic spreadsheet format* Work Order Formn• Field log sheets* Chain-of-custody sheets* A hardcopy of the field preliminary data report* Field Chemist Comments (See Appendix B)' - any pertinent comments such as departures
from method, problems, etc.* Spike recovery summaries* Initial multilevel calibration summaries (if performed)* Tune records (MS)* Daily sequence summuaries* Instrument analysis chromnatograms and quantitation reports in chronological order* Screening chromnatogramts
9.2 DATA REVIEW AND VALIDATION
Data review and validation is conducted by the Data Specialist who is responsible to thedesignated project manager. All work performed by the Field Chemist is checked during thedata review process. The signature of the reviewer and date of review are entered on the DataReview Checklist (see Appendix B) each project file folder. The responsibility of the DataSpecialist is to ensure the following:
* Each project folder has the items listed in Section 9.1 above.* All data are calculated correctly.* All data are entered correctly in the field data report.* All QC data are calculated correctly.* All QC values are within the acceptance criteria.* Check that chain-of-custody forms are properly completed and that sample identifications
are in agreement with those in the project file and data report.
33 KB Labs, Inc.Laboratory Quality Manual
Revision 3June 2007

964 us9
Upon completion of data review and validation, the Data Specialist will include a Data FolderTable of Contents Checklist (see Appendix B and a Data Review Checklist in the project datafile.
Refer to KB Labs' SOP No. 004, Data Review and Validation.
9.3 DATA REPORTING
The Data Specialist generates the final report to the client and is responsible to the designatedproject manager. Assurance that reported data are correct is the responsibility of the projectmanager, the Data Specialist, and the Field Chemist. The final report to the client contains thefollowing:
* A cover letter which references the project name, date, and location and summanizes thecontents of the report and the qualifications of KB Labs, Inc
* A brief project narrative which provides general information about the project scope,analytical procedures, analytical results, and QC data
* A data narrative addressing discrepancies between the final data report and thepreliminary field data report
* A table listing the analytical run sequence with surrogate recovenies* A table listing matrix spike and control spike recoveries* A final data report in spreadsheet format* Copies of the chain-of-custody sheets
Appendix C gives an example of a standard KB Labs final report to client.
Refer to KB Labs' No. 003, Final Report Preparation, Review, and Delivery.
34 KB Labs, Inc.Laboratory Quality Manual
Revision 3June 2007

964 120
10.0 SYSTEM AND PERFORMANCE AUDITS
Systems and performance audits are used to assess and document the performance of fieldchemists. These audits form a basis for corrective action requirements and constitute apermanent record of the conformance of measurement systems to QA requirements. Refer to KBLabs' SOP No. 020, Audits.
10.1 INTERNAL SYSTEM AUDITS
The QA Officer will choose random sample numbers from different projects conducted duringthe year and trace the sample from receipt to final reporting, reviewing proper chain of custody,sample receipt procedures, proper method selection, data reduction, sample preparation, andanalysis within holding times. At least one sample will be audited each quarter for each methodand mobile unit. The Quarterly System Audit Forms (Appendix B) will be submitted to the LabDirector and to the President.
All laboratory QC information will be reviewed at least annually by the QA officer. Thisinformation, including replicates, spikes, and reference samples for all methods is printed andkept on file.
The QA officer checks all instrument and analytical logs to assure that all analytical work thathas been done is properly documented, including date of analysis, initials of analyst, analyte, andall pertinent instrument settings.
The QA officer will submit an annual report to the Lab Director and President listingI ~ ~~~deficiencies that must be addressed to correct or improve laboratory procedures.
10.2 EXTERNAL SYSTEM AUDITS
KB Labs is biannually inspected by FL DOH, and all recommendations are implemented. KBLabs is open to FL DOH for inspection at any time.
10.3 INTERNAL PERFORMANCE AUDITS
Internal performance audits consist of commercially produced QC check samples (LaboratoryControl or Reference Samples) run with each analysis by the analyst. The found value is thencompared to the true value. All QC check sample data is entered onto the analytical bench sheetincluding true value, found value, percentage recovery and, if applicable, 95 percent confidenceinterval. The QC check sample will be from a different stock source than the calibrationstandards.
10.4 EXTERNAL PERFORMANCE AUDITS
35 KB Labs, Inc.Laboratory Quality Manual
Revision 3June 2007

96 412
Biamnual performance audits include the analysis and evaluation of proficiency test samples.KB Labs will participate in the U.S. EPA Water Pollution Laboratory Performance Evaluationstudy Program. Results of these analyses will be provided to DOH.
Refer to KB Labs' SOP No. 022, Proficiency Test Samples.
36 KB Labs, Inc.Laboratory Quality Manual
Revision 3June 2007

9864 1 22
11.0 CORRECTIVE ACTION
Data acceptability is based on the quality assurance objectives for measurement data stated inSection 8.0.
If the acceptance criteria are not met for one or more QC checks, than the first person to takecorrective action will be the analyst. The analyst will determine when the system was no longerin control and follow the corrective action.
If the system is still out of control, the Laboratory Director and QA officer will be informed ofthe specific discrepancies and decisions concerning the data will be made on a project specificbasis.
The Laboratory Director or QA officer will be responsible for notifying laboratory personnel ofthe corrective action(s) be taken.
For external QC discrepancies (performance evaluation sample), the Laboratory Director and QAofficer will determine the source of the discrepancy, plan a course of action to solve the problemand inform the appropriate laboratory personnel of the new procedure.
All DOH recommended corrective actions will be initiated as a result of system or performanceaudits, split samples or data validation review.
Refer to KB Labs SOP No. 17, Corrective Actions.
11.1 COMPLAINTS
Whenever a complaint is received by KB Labs from a client or other party about compliancewith the NELAC Standard, project requirements, laboratory policies and procedures, or about thequality of the laboratory's test results, an internal audit (Sec. 10.1) will be immediatelyconducted by the Quality Assurance Officer, or in the case of specific project issues unrelated todata quality, the Director of Operations will investigate the problem. A record of the complaintand subsequent action will be maintained in the project file in the administrative office.
Refer to KB Labs SOP No. 16, Handling Complaints.
11.2 DEPARTURES FROM PROCEDURES AND SPECIFICATIONS
It is the policy of KB Labs that documented procedures and standard specifications will befollowed on a routine basis for all projects. However, the following exceptions may anise:
* If a client requests a departure from a documented procedure or standard specification, itwill be noted in detail on the report to the client and in the project file.
* If KB Labs cannot, because of unexpected field conditions or operational circumstances,follow a documented procedure or a standard specification, the Field Chemist willimmediate notify the Director of Operations and/or the Quality Assurance Officer, who
37 KB Labs, Inc.Laboratory Quality Manual
Revision 3June 2007

964 1 23
will then notify the client. The departure will be documented in the final report to theclient and in the project file.
Refer to KB Labs' SOP No. 32, Departures from Documented Policies and Procedures.
38 KB Labs, Inc.Laboratory Quality Manual
Revision 3June 2007

96 4 12 4
Table I1-1-: Corrective Action
OC Activity Acceptance Criteria Recommended Corrective Action
Initial Calibration Follow protocol stated in reference Rerun calibration. If necessary,method. prepare fresh calibration standards.
Method Blank < I/1IO concentration in any sample Re-prep and reanalyze new methodassociated with blank. blank and samples associated with
contaminated blank. If necessary,perform appropriate instrumentmaintenance.
GC/MS Tuning BFB ion abundance criteria must be Perform mass calibration. Retunemet as set forth in Method 8260b hardware. If necessary, clean
source.
Continuing Follow protocol stated in reference Rerun continuing calibrationCalibration method. standard. If necessary, rerun initial
standard calibration.
Surrogates Within established control limits Reanalyze samples that have one or
more surrogates out of control.
MS/MSD Spikes Within established control limits Reanalyze samples that have one or
more spikes out of control.
LCS Within established control limits
39 KI3 Labs, Inc.Laboratory Quality Manual
Revision 3June 2007

964 1 25
12.0 RECORD KEEPING AND DOCUMENT CONTROL
12.1 STORAGE OF PROJECT DATA
All project data files containing the items listed in Section 9.1 above are stored chronologicallyin a file cabinet in KB Labs' administrative office. No project data files are stored in the mobilelaboratory units. In order to help maintain the integrity of data and to protect the confidentialityand proprietary rights of all clients, these tiles are archived as needed into banker's boxes thatare kept in a secure storage area of the administrative office. All archived data are stored at least5 years in accordance with NELAC standards. An access log will be maintained for retrievingthe archived files. Access is limited to employees of KB Labs only. No data will be released toparties other then the client without written permission from the client.
Data from the analytical instrument computers are archived onto backup disks at least every sixmonths. These disks are stored in the administrative office in fire proofs boxes in a designatedarea. They are labeled with the project number and project name and stored sequentially byproject number.
Final reports to the client (see Section 9.3) are stored in electronic computer files by client andproject name. These are regularly backed up on disk and stored in the administrative office fireproof boxes in a designated area. A photocopy of the final report to the client is also containedin the project management tile, which is described below in Section 12.2
Refer to KB Labs SOP No. 008, Filling and Archiving Project Records.
12.2 STORAGE OF ADMINISTRATIVE RECORDS
Project management files are maintained by the Director of Operations in a separate file cabinetin the administrative office. These files are arranged alphabetically by client and within theclient file, alphabetically by project name. A project management file generally contains thefollowing documentation:
* Proposal or bid* Contract* Work Order* Final Report* Correspondence* Notes
Personnel files are maintained alphabetically by the QA Officer in a separate file cabinet in theadministrative office and contain the following documentation:
*Resume*Training Record*Demonstrations of Capability
40 KB Labs, Inc.Laboratory Quality Manual
Revision 3June 2007

96 4 12 6
Mobile unit files are maintained by the QA Officer in the administrative office. These filescontain the following documentation:
* SOPs for analytical methods performed in the mobile unit* MDL study data* Copies of all demonstration of capability certifications* PE sample data
12.3 MOBILE UNIT RECORD KEEPING
Each of the mobile units will maintain limited documentation for operations conducted in theunit. This documentation will include the following, each of which will be maintained inseparate, labeled folders stored in a file cabinet:
* SOPs for analytical methods performed in the mobile unit* Other company SOPs* Most recent MDL study data for each method perform-ed in the unit* Copies of all demonstration of capability certifications for unit personnel* PE sample data for at least the last three rounds for each analytical method performed* Personnel Resumne(s)* Personnel Training Record (s)
In addition, each mobile unit will maintain a copy, of the most recent version of the LaboratoryQuality Manual and Health & Safety Manual and will maintain logbooks for sample receipt,instrument run, instrument maintenance and repair, standards, and refrigerator temperature.Completed logbooks will be stored in the administrative office in a designated area.
12.4 DOCUMENT CONTROL
Official KB Labs documentation such as the Laboratory Quality Manual, Laboratory Health &Safety Manual, SOPs, standard formns, etc. are updated annually or whenever necessary. It isimportant that the most recent revision of each document is utilized by all personnel. In order tofacilitate this, each document will have the document file name, date of production, and revisionnumber clearly indicated in the header or footer.
It is the responsibility of the Quality Assurance Supervisor to assure that all official documentsare updated as required and that the latest revision is in use by all personnel. Copies of oldoutdated documentation will be kept on file by the QA Officer. A master list of the latestrevision of all documentation will be maintained and posted in the administrative office by theQuality Assurance Supervisor.
Refer to KB Labs SOP No. 0 15, Document Control.
41 KB Labs, Inc.Laboratory Quality Manual
Revision 3June 2007
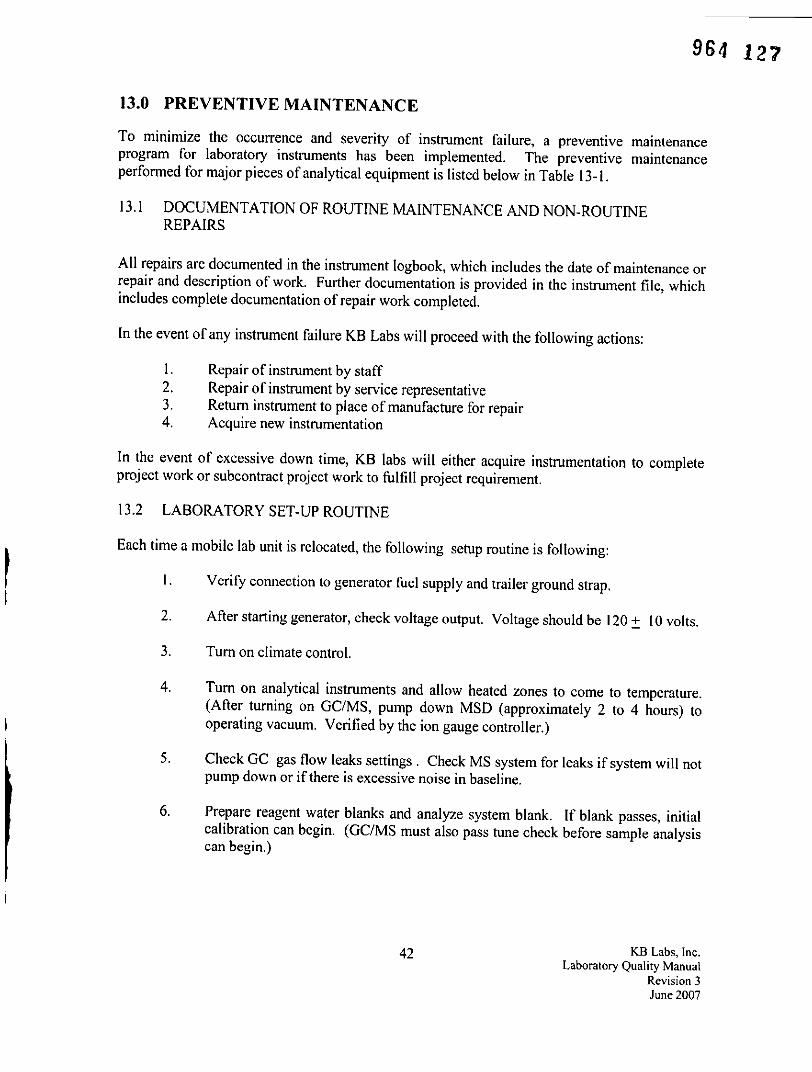
964 1 27
13.0 PREVENTIVE MAINTENANCE
To minimize the occurrence and severity of instrument failure, a preventive maintenanceprogram for laboratory instruments has been implemented. The preventive maintenanceperformed for major pieces of analytical equipment is listed below in Table 13-1.
13.1 DOCUMENTATION OF ROUTINE MAINTENANCE AND NON-ROUTINEREPAIRS
All repairs are documented in the instrument logbook, which includes the date of maintenance orrepair and description of work. Further documentation is provided in the instrumnent file, whichincludes complete documentation of repair work completed.
In the event of any instrument failure KB Labs will proceed with the following actions:
I . Repair of instrument by staff2. Repair of instrument by service representative3. Return instrument to place of manufacture for repair4. Acquire new instrumentation
In the event of excessive down time, KB labs will either acquire instrumentation to completeproject work or subcontract project work to fulfill project requirement.
13.2 LABORATORY SET-UP ROUTINE
Each time a mobile lab unit is relocated, the following setup routine is following:
I . Verify connection to generator fuel supply and trailer ground strap.
2. After starting generator, check voltage output. Voltage should be 120 + 10 volts.
3. Turn on climate control.
4. Turn on analytical instruments and allow heated zones to come to temperature.(After turning on GC/MS, pump down MSD (approximately 2 to 4 hours) tooperating vacuum. Verified by the ion gauge controller.)
5. Check GC gas flow leaks settings. Check MS system for leaks if system will notpump down or if there is excessive noise in baseline.
6. Prepare reagent water blanks and analyze system blank. If blank passes, initialcalibration can begin. (GC/MS must also pass tune check before sample analysiscan begin.)
42 KB Labs, Inc.Laboratory Quality Manual
Revision 3June 2007

964 128
Table 13-1: Preventive Maintenance Procedures
Procedure Frequency
Gas Chromatograph
Change septa When system develops leaks or as needed
Check carrier gas Daily
Change carrier gas When pressure falls below 1 00 psi
Cut edge of capillary column When system performance declines
Change columns When column performance declines or as needed
Change injector port liner When dirty or as needed
Mass Spectrometer
Backup system software Monthly
Replace traps Annually
Manufacturer's preventive maintenance Annually
Clean source When calibration compound criteria cannot be
achieved or as needed
Keep instrument clean and dust-free After each use
Purge and Trap
Clean, bake, and purge spargers Daily prior to use
Bake out trap Daily prior to use
Replace trap Quarterly or as needed
Replace fittings Annually or as needed
Table 13-1: Preventive Maintenance Procedures (Cont'd)
43 KB Labs, Inc.Laboratory Quality Manual
Revision 3June 2007

984 129
Procedure Frequency
Support Equipment
Ovens, Refrigerators Monitor temperature, keep units clean Daily
Hot Plates Keep units clean After each use
Generator Check oil level Before starting
Check battery fluid Monthly
Change oil and filter Every 1 000 hoursChange air filter Monthly, more often
if conditions are dusty
Check voltage Upon startup
44 ~~~~~~~~~KB Labs, Inc.Laboratory Quality Manual
Revision 3June 2007

964 130
APPENDIX A
Floor Plans
45 KB Labs, Inc.Laboratory Quality Manual
Revision 3June 2007

96 4 1.31
Fiaure 3-1: Floor Plan, KB-i
l4 feet -
*Reffig. a
* Fire Extinguisher Gnrtr S
D] 8 Feet
Gas Autosampler Purge & Trap Data System
Cylinders Concentrator
Figure 3-2: Floor Plan, KB3-2Data ~ ~ ~ ~ ~ ~ ~ ~ ~ ~~eertr Gas
System Integrator r
Purge & Trap Aut~osamplerQConcentrator
H S~~~~~~~~~~~~~~~~~~~~~~8Feet
Fir Extinguisher A
Gasnde Refrig. Refrig. 7AC
14 feet 1
46 KB Labs, Inc.Laboratory Quality Manual
Revision 3June 2007

964 132
Figzure 3-3: Floor Plan, KB-3
Pressurized Solvent Extractor Purge & Trap Concentrator
Generator GC/PlD/FID0o Roof~ Roofo AC~ ACRfe
o H Solid P~~hase Extractor2
Fire Extingusiher -
Gas Cylinders
47 KB Labs, Inc.Laboratory Quality Manual
Revision 3June 2007

964 133Figure 3-4: Floor Plan, Administrative Office
17 feet i
24 feet
9 feet
4 ~~~~~~12 feet
48 KB Labs, Inc.Laboratory Quality Manual
Revision 3June 2007

964 134
APPENDIX B
Standard Forms
49 KB Labs, Inc.Laboratory Quality Manual
Revision 3June 2007

964 135
50 KB Labs, Inc.Laboratory Quality Manual
Revision 3June 2007

964 136
5 1 KB Labs, Inc.Laboratory Quality Manual
Revision 3June 2007

964 137
Demonstration of CapabilityCertification Statement
Date: Analyst Name: Mobile Lab No:
Matrix: Method Number: SOP Number:Parameters:
We, the undersigned, CERTIFY that:
I . The analyst identified above, using the cited test method, which is in use at this facilityfor the analysis of samples under the National Environmental Laboratory AccreditationProgram, has met the Demonstration of Capability.
2. The test method was performed by the analyst identified on this certification.
3. A copy of the test method and the laboratory-specific SOPs are available for all personnel
on-site.
4. The data associated with the demonstration of capability are true, accurate, complete andself-explanatory.
5. All raw data (including a copy of this certification form) necessary to reconstruct andvalidate these analyses have been retained at the facility, and that the associatedinformation is well organized and available for review by authorized assessors.
Bradley A. Weichert DateTechnical Director
Michael G. Winslow DateQuality Assurance Officer
52 KB Labs, Inc.Laboratory Quality Manual
Revision 3June 2007

96 4 13 8
Field Chemist Comments
Comments:
Signature: __ _ _ _ _ _ _ _ _ __ _ _ _ _ _ _ _ _ D ate: _ _ _ _ _ _ _ _ _ _
Title: Field Chemist
53 KB Labs, Inc.Laboratory Quality Manual
Revision 3June 2007

96i4 139
Data Review Checklist
___Check Data Folder Table of Contents Checklist
___Check COCs vs. field data reportMake sure all sample l~s match and are accounted for.
___Data numbers vs field reportGo through raw data page by page and compare numbers
___Highlight any numbers that need to be changed on the field report
____Cover letter
____Project narrative___ Change header box and review for accuracy (i.e. water description if waters arerun)___ Change date at bottom
Run sequence/surrogate table___Change header box
Use daily sequence summaries to get sequence of samplesGo through raw data to get surrogate recoveries
___Change date at bottom
____Matrix spike table___Change header box
Comment section___Change date at bottom
Review recovery values
____Final data report___Significant figures (only two SF for dilutions)
Put units on the table
Data report narrative___ Use highlighted preliminary field report
If significant changes are necessary, inform Director of Operations
__COCSIf yellow pages are gone, client has them from the field; send photocopies of white
pages.____ If yellows are still attached, send white pages and keep yellows as originals.
Signature: __ _ _ _ _ _ _ _ _ _ _ _ _ _ _ _ _ _ _ _ _ _ _ D ate: _ _ _ _ _ _ _ _ _ _ _ _ _ _ _ _
Title: Data Specialist
54 KB Labs, Inc.Laboratory Quality Manual
Revision 3June 2007

9 64 14 0
Data Folder Table of Contents Checklist
___1. Disk with preliminary field report, FDEP report (if required)
___2. Work Order Form
___3. Field Logs
___4. COCs
___5. Preliminary field data report hardcopy
____6. Comment page (if required) detailing departures from method, problems, etc.
___7. Spike recovery summaries
____8. Initial calibration summaries (if performed)
___9. Tune record (MS only)
I0. Daily sequence summaries (any pertinent comments should be recorded here
including reruns, dilutions, poor recoveries, data not used (inc. 'why'), etc.
I 1. Analysis chromatograms and quantitation reports, in chronological order
12. Screening chromatograms
Comments:
Signature: _____________________Date:Title: Data Review Specialist
55 ~~~~~~~~~KB Labs, Inc.Laboratory Quality Manual
Revision 3June 2007

96 4 14 1
Quarterly System Audit Form
Date: __ _ _ _ _ _ _ _ _ _ _ _ _A uditor: _ _ _ _ _ _ _ _ _ _ _ _ _ _ _ _ _ _ _
Mobile Lab No: Analysis Requested:
Sample No.
Project Name:
Client Name:
Date Received:
Yes NoWsChain of Custody properly filled in and signed? _______
Des sample receipt logbook match the Chain of Custody?Weecorrect sample fractions received? ________
Was the proper method chosen? _______
Aebench sheets available for the analysis?Was analysis performed within holding times?-Are all data calculations correct?Is there QC with the sample analysis batch?Was the project file reviewed? ________
-Does the instrument log date match the bench sheet date? ________
-Does the bench data match the data on the report?Were there any deficiencies noted?Are dilution factors documented?Is a run tog included and complete?Is standared prep log cornplete? ________________
Comments
Corrective Action
56 KB Labs, Inc.Laboratory Quality Manual
Revision 3June 2007

964 14 2
APPENDIX C
Final Report
57 KB Labs, Inc.Laboratory Quality Manual
Revision 3June 2007

964 14 3
Page 1 of 8
KB LABS, INC.6821 Southwest Archer RoadGainesville, Florida 32608
telephone (352) 367-0073fax (352) 367-0074
June 1, 2001
Paul BunyanBig Boy Environmental, Inc.12345 Tall Guy BlvdOxtown, FL 33333
Re: Final Analytical Report, Big Ugly, Oxtown, FL
Dear Mr. Bunyan:
Enclosed is the final report of the on-site analysis performed by KB3 Labs, Inc. at the Big Uglysite in Oxtown, FL. On-site analyses were performed May 23 - May 24, 2001. Included are abrief project narrative, tables listing quality control results, final analytical results, and samplechain-of-custody form. This information will also be sent electronically. Including this coverpage, the Final Report includes eight pages.
KB Labs' mobile laboratories have been inspected by the FDOH Bureau of Laboratories andhave been recommended for NELAP Certification as of April 1, 2003. Our personnel,methodology, proficiency testing, and quality assurance requirements complied with theguidelines of Chapter 64E-lI of the Florida Administrative Code and with the consensusstandards adopted at the National Environmental Laboratory Accreditation Conference(NELAC). Data for the site referenced above were determined in accordance with publishedprocedures under Test Methods for Evaluating Solid Waste (EPA SW-846, Update III RevisedMay 1997). Unless otherwise indicated on the quality control narrative accompanying the datareport, the quality assurance and quality control procedures performed in conjunction withanalysis of groundwater samples demonstrated that the reported data met our standards foraccuracy and precision under NELAC Standards.
If you have any questions, please do not hesitate to call me or Kelly Bergdoll, President of KB;Labs, at (352) 367-0073.
Sincerely,
KB Labs, Inc.
Todd RomeroDirector of Operations
58 KB Labs, Inc.Laboratory Quality Manual
Revision 3June 2007

96 4 144
Page 2 of 8KB LABS, INC.
PROJECT NARRATIVE
Client: Big Boy Environmental, Inc. Driller/Sampler: Big Rig, Inc. Analyst: M. Mathews
Site: Big Ugly, Oxtown, FL KB Project Manager: Kelly Bergdoll KB Project No. 0333
Onsite Dates: 5/23/01 - 5/24/01 Client Project Manager: Paul Bunyan Matrix: Water
Project Scoi~e
On May 23 -May 24, 2001, a total of eight (8) water samples were collected at the Big Ugly site in Oxtown, FL.Samples were analyzed onsite in the KB Labs mobile facility. The samples were analyzed for benzene, toluene,ethylbenzene, m&p-xylene, o-xylene, MTBE, naphthalene, and Diesel Range Organics (DRO).
Analytical Procedure
VOCs -All water samples were analyzed using SW846 Method 5030/8260 for waters. Ten (10) milliliters (mL) ofwater were purged with helium and the volatile organic compounds (VOCs) were collected on a solid-phaseadsorption trap. The adsorption trap was heated and back-purged with helium and the components were separatedby capillary column gas chromatography and measured with a mass spectrometer (GC/MS) operated in the electronimpact full-scan mode. The individual VOCs in the samples were measured against corresponding VOC standards.
DRO- All water samples were first extracted in a vacuum extraction manifold using Sep-Pak CIX cartridges (2-gram). Sample volumes varied (20-200 mL) depending upon particulate content. The CIXcartridges were thensolvent extracted with 5 mL of hexane. Samples extracts were then analyzed by gas chromatography/flameionization detector (GC/FID). DRO in the samples was then measured against a corresponding diesel standard.
Analytical Results
Laboratory results were provided to the client on an as-completed or next-day basis. Final results of the on-siteanalyses are provided in a standard Excel spreadsheet format. The data produced and reported in the field has beenreviewed and approved for this final report by the KB Labs Quality Assurance (QA) Officer.
Ouality Control (0C0 Data
Surrogate Recoveries (VOCs only) - Tables 1.1 - 1.2 list the daily analytical sequence and percent recovery resultsfor surrogate compounds which were added to all analyses. Pour (4) surrogate compounds were added to eachanalysis in order to continually monitor general method performance.
Matrix Spike and Laboratory Control Spike Recoveries - Table 2 lists the percent recovery results for matrix spikesamples and /or laboratory control samples. A known amount of selected target compounds was added to selectedfield samples and/or to a laboratory blank sample in order to monitor the performance of the compounds in theactual matrix and in the laboratory blank sample.
Method Blanks - Daily analysis of laboratory reagent water samples was per-formed in order to monitor thecleanliness of the analytical system. No target compounds were detected on or above the reporting limits.
Signature:Title: Director of Operations Date: June 1, 2001
59 KB Labs, Inc.Laboratory Quality Manual
Revision 3June 2007

964 145
Page 3 of 8
KB LABS, INC.6821 Southwest Archer Road
Gainesville, Florida 32608
telephone (352) 367-0073fax (352) 367-0074
Table I-I: VOC Analysis Sequence/Surrogate Percent Recoveries (5/23/0 1)
Client: Big Boy Environmental, Inc. Driller/Sampler: Big Rig, Inc. Analyst: M. MathewsSite: Big Ugly, Oxtown, FL KB Labs Project Manager: Kelly Bergdoll KB Labs Project No: 0333~On-site Dates: 5/23/01 - 5/24/01 Client Project Manager: Paul Bunyan Matrix: Water
Control SI* S2* S3* S4*Station/Sample ID Li~nzis»> (80-120) (80 - 120) (80 - 120) (80 - 120)
CCS 20 ug/L 8 1 98 97 89Method Blank 82 97 95 89SMPI' 97 96 93 83
SMP2 85 106 93 82SMI`3 88 79 95 84 S2 lowSMP4 91 100 96 86SMP3 MS 99493 84SMP3 MSD i86 95 93 85
CCS 20 ug/L 85 100 94 89
*Surrogate Compounds Signature:___________________SI = 1,2-Dichloroethane-D452 - 1,4-Difluorobenzene Title: Data SpecialilsiS3 = Toluene - D8S4 = 4 - Bromofluorobenzene Date: June 1, 2001
60 KB Labs, Inc.Laboratory Quality Manual
Revision 3June 2007

964 146;
Page 4 of 8
Table 1-2: VOC Analysis Sequence/Surrogate Percent Recoveries (5/24/01)
Client: Big Boy Environmental, Inc. Driller/Sampler: Big Rig, Inc. Analyst: M. Mathews
Site: Big Ugly, Oxtown, FL KB Labs Project Manager: Kelly Bergdoll KB Labs Project No: 0333lOn-site Dates: 5/23/01 - 5/24/01 Client Project Manager: Paul Bunyan Matrix: Water
Control SI* S2* S3* S4*Station/Sample ID Limits»> (80-120) (80 - 120) (80- 120) (80 - 120)
CCS 20ug/L 91 101 92 87
Method Blank 79 95 96 88 SI low
REF/LCS 121 103 94 84 SI high
SMP5 90 96 91 83
SMP6 120 11$ 95 93
SMP7 83 93 97 89
SMP8 80 95 98 88
CCS 20ug/L 11 e90 82
5wSunor~ate Compounds Signature:
SI 1l2-Dichlorocthanc-D)4
S2' l,4Difluorobenzene Title: Data Specialist
53 Foluene - D)8
S4 4 - flrornotluorobenzene Date: June I. 200!
6 1 KB Labs, Inc.Laboratory Quality Manual
Revision 3June 2007

964 14 7
Table 2: VOC Spike Compound Percent Recoveries
Client: Big Boy Environmental Driller/Sampler: Big Rig, Inc. Analyst: M. MathewsSite: Big Ugly. Oxtown, FL KB Labs Project Manager: Kelly Bergdoll KB Labs Project No: 0333On-site Dates: 5/23/01 - 5/24/01 Client Project Manager: Paul Bunyan Matrix: Water
Spike Comnpounds *> VOCI VOCZ VOC3 V0C4 VOC5 VOC6 VOC7 VOC8Control Limits ** >> 70-130 75-119 79-114 81-114 74-120 78-116 70-130 70-130 CommentWarning Limits**> > 80-120 82-111 85-108 864108 82-113 85-110 80-120 80-120
RPD Limit >> 20 20 20 20 20 20 20 20
Station/Samnple ID:SMP3 MS 77 91 98 94 92 93 100 97SMP3 MSD 85 92 99 94 91 93 116 91
RPD 10 I I 0 I 0 15 6
REF/LCS ______ NA f95 97192 96-1 99 120 ill __ __ _____
Control limits based historical matnix spike recovenies.
5* Ske Comnounds
VOC I - MTBE VOC7 = Naphthalene Signature: __________________
VOC2 = Benzene VOCS = DieselVOC3 = Toluene Title: Data SpecialistVOC4 = EthylbenzeneVOC5 m&p-Xylene Date: June 1, 2001VOC6 = o-Xylene
62 KB Labs, Inc.Laboratory Quality Manual
Revision 3June 2007

964 148
Big Boy Environmental, Inc. June 1, 2001
Analytical DataPae6oBig Ugly, Oxtown, FL
5/23/0 1 - 5/24/01
MTBE <1 <1--d <1 <1 <1 <1 <1 <1 <1 __
Benzene_ <1 <1 <1 <1 <1 <1 <1 <1 <1Toluene <1 <1 <1 <1 <1 <1 <1 <1 <1 __
,Ethylbenzene _<1 <1- <1 <1 <1 <1 <1 <1 <1 _____
n&_p-Xylene <1 <1 -- 1.5 <1 <1 <I <I <1 <I __
o-Xyjene __ I__ <I <~l I <1 <1 <1 <1 <1 <1 __
Naphthalene <1 <-1<1 -<I 1.7 <1 <1 2.8 <1 __
DRO (mg/L) fSee 1<2.0 <2.9 T <~2.01<4.3 <2.0 <4.0 <4.3 <5.0[ Note I_ __ I_
Note: DRO reporting limits vary with the total volume of sample processed.This volume will vary depending the particulate content of the sample.
Signature:___________________
Title: Data Specialist
Date: 6/1/01
63 KB Labs, Inc.Laboratory Quality Manual
Revision 3June 2007

964 149
A-,
ATTACHMENT C: STANDARD OPEATING PROCEDURE FOR VOCs
- k~~~~~~~~, ~~~~~,~~~~ I I I - I~~~~~~~~~~~~~~~

964 150
KB Labs, Inc.
ANALYTICAL STANDARD OPERATINGPROCEDURE No. 1
DETERMINATION OF VOLATILE ORGANIC COMPOUNDS BY PURGE &TRAP GAS CHROMATOGRAPHY/MASS SPECTROMETRY -
METHOD 8260B
Signature of Approving Authority: __ ________________
Michael G. WinslowQuality Assurance Officer
Effective Date: July 2007
KB SOP VOC05Revision 3July 2007

964 1Sf
Analytical Standard Operating Procedure No. 1Revision 2
DETERMINATION OF VOLATILE ORGANIC COMPOUNDS BY PURGE & TRAP GASCHROMATOGRAPHY/MASS SPECTROMETRY - METHOD 8260B
1.0 SCOPE AND APPLICATION
1.1 This method is applicable to the determination of volatile organic compounds (VOCs)in water and soil samples by purge and trap/gas chromatography/mass spectrometry.
1.2 The following compounds may be determined by this method:
1, 1, 1,2-Tetrachloroethane 2,2-Dichloropropane lsopropylbenzene1, 1,1I -Trichloroethane 2-Chlorotoluene m&p-Xylene1, 1,2,2-Tetrachloroethane 4-Chlorotoluene Methylene chloride1, 1,2-Trichloroethane Benzene MtBE1,1I -Dichloroethane Bromnobenzene NaphthaleneI, 1-Dichloroethene Bromodichloromethane n-ButylbenzeneI1,2,3-Trichlorobenzene Bromoform n-PropylbenzeneI1,2,4-Trichlorobenzene Bromomnethane o-XyleneI1,2,4-Trimethylbenzene c-I ,2-Dichloroethene p-IsopropyltolueneI1,2-Dibromo-3- c-I ,3-Dichloropropene sec-Butylbenzenechloropropane Carbon tetrachloride StyreneI1,2-Dibromomethane Chlorobenzene t-1I,2-DichloroetheneI1,2-Dichlorobenzene Chloroethane t- I1,3-DichloropropeneI1,2-Diehloroethane Chloroform tert-ButylbenzeneI1,2-Dichloropropane Chloromethane TetrachloroetheneI1,3,5-Trimethyhlbenzene Dibromochloromethane TolueneI1,3-Dichlorobenzene Dibromomnethane TrichloroetheneI1,3-Dichloropropane Dichorodifluoromethane TrichlorofluoromethaneI1,4-Dichlorobenzene Ethylbenzene Vinyl chlorideI1,4-Dioxane Hexachlorobutadiene
2.0 SUMMARY OF METHOD
2.1 The VOCs are introduced into the gas chromatograph by the purge-and-trap technique asdescribed in EPA SW 846 Method 5030B for waters and EPA SW846 Method 5035A for soils.Samples are purged with helium and the volatile components are collected on a solid-phase adsorptiontrap.
2.2 After purging is complete, the adsorption trap is heated and back-purged with helium todesorb the trapped components into a gas chromatograph for separation on a narrow bore capillary
2KB SO PVOC05
Revision 3July 2007

964 15 2
column. Components eluted ftom the capillary column are introduced directly into a mass spectrometerfor qualitative and quantitative determination based on EPA SW846 Method 82608.
2.3 The individual volatile components are measured against appropriate standards.Identification of the target compounds is accomplished by comparing their mass spectra with theelectron impact mass spectra of authentic standards. Quantitation is accomplished by comparing theresponse of a major ion relative to an internal standard using a five-point calibration curve.
2.4 The estimated quantitation limits (EQL) or reporting limits established by KB Labs forthis method are I ug/L for low-level water samples and 2 - 10 ug/kg wet-weight for soil samples. Theactual limits are dependent upon individual compound purging efficiency, the amount of sample used,and the particular sample matrix. See Tables included in Attachments to this SOP.
3.0 DEFINITIONS
Refer to Sec 5.0, Chapter I, Test Methods for Evaluating Solid Wastes, Fourth Edition, SW-846.
4.0 INTERFERENCES
4.1 The analyst must be careful not to introduce major sources of VOC contamination intothe laboratory. These sources include organic extraction solvents, impurities in the purging gas andsorbent trap, and the use of non-PTFE sealants, plastic tubing, or flow controllers with rubbercomponents. A method or reagent blank should be analyzed to determine whether contaminants arepresent. Subtracting blank values from sample results is not permitted.
4.2 Contamination can occur when a sample containing low concentrations of VOCs isanalyzed immediately after one containing high concentrations of VOCs. The analyst should rinse thesample transfer syringe with two portions of reagent water after each sample transfer into theautosampler purging chambers. If time allows, reagent water blanks can be placed between samples inthe autosampler device.
4.3 To reduce the chances of sample and system contamination, all samples are screenedprior to analysis by GC/MS. Screening is performed by analyzing sample headspace using GC/FID.
5.0 SAFETY
Refer to procedures described in KB Labs' Health and Safety Manual.
6.0 EQUIPMENT AND SUPPLIES
6.1 Purge-and-trap concentrator: Tekmar Model LSC 2000
6.2 Purge-and-trap autosampler: Tekmar Model 2016
6.3 Method 5035 (low-level soil) retrofit apparatus: Logika Modal VC1OO.
3KBSOPVOC05
Revision 3July 2007

964 1r5J
6.4 Gas chromatographlmass spectrometer (GC/MS) system: Hewlett-Packard (HP) 5890GC/HP5971IA MS / Chem Station
6.5 Gas chromatograph/flame ionization dectector: HP 5890 Series II with a HP 3396integrator.
6.6 OC column for GC/MS: D8624, 20 m x 0.1l8mm, 1.0mm film thickness
6.7 Syringes: 10 uL, I100 uL, I mL (gas tight), and 10 mL,
6.8 Volumetric flasks: 10 mL, 100 mnL
6.9 Glass vials: 40 mL with PTFE-lined septum screw caps.
6.10 PTFE-lined screw cap vials: 2 mL
6.11I Disposable pipets: I mL Pastuer.
6.12 Top-loading balance: Ohaus SC2020, capable of weighing 0.01I grams.
7.0 REAGENTS AND STANDARDS
7.1 Methanol, purge and trap grade.
7.2 Reagent water: VOC free (determined from method blank analysis)
7.3 Stock Calibration Standard Solutions
7.3.1 Volatiles (54 components): 200 ug/mL in methanol, purchased fromAccustandard.
7.3.2 Gases (6 components): 200 ug/mL in methanol, purchased fromAccustandard.
7.4 Stock Calibration Verification Standard Solutions (second source)
7.4. 1 Volatiles (54 components): 200 ug/mL in methanol, purchased from Restek.
7.4.2 Gases (6 components): 200 ug/mL in methanol, purchased from Restek
7.5 Stock Internal Standard and Surrogate Solutions
7.5.1 7 Components: 2000 ug/mL, purchased from Accustandard.
7.6 Preparation of Calibration Standards
4KBSOPVOC05
Revision 3July 2007

964 1l54
7.6.1 A calibration standard spiking solution is first prepared by diluting I ml, of each200 ug/inL stock calibration standard (Accustandard volatile and gas) to 10 mL with methanol.This working stock has a concentration of 20 ug/mL.
7.6.2 Calibration standards in reagent water are then prepared from the working stocksolution according to the dilution scheme outlined below:
Volume of CalilbrationStandard Spiking Solution Volume of Reagent Water (mL) Concentration of
Added (uL) Calibration Standard (ug/L)0.5 102.5 1 0 55 1 0 1010 10 2025 10 5050 10 100 _
7.7 Preparation of Calibration Verification Standard
7.7.1 A calibration verifcation standard spiking solution is prepared by diluting I mLof each stock calibration standard (Restek volatile and gas) to a 10 mL volumetric flask andbringing to volume with methanol. This calibration verifcation standard spiking solution has aconcentration of 20 ug/mL.
7.7.2 A calibration verification standard in water is prepared by adding either 10 or 25uL of the calibration verification standard spiking solution to I0 mL of reagent water containedin a Il0-mL gas-tight syringe. The concentration of the calibration verifcation standard is 20ug/L or 50 ug/L.
7.8 Preparation of Internal Standards and Surrogate Standards
7.8.1 An intermediate internal standard/suirro gate stock soluttion is prepared by dilutingI ml, of the 2000 ug/mL stock standard into 10 mL of methanol. This intermediate stock solutionhas a concentration of 200 ug/nt.
7.8.2 A internal standard/surrogate spiking solution is prepared by adding I mL of theintermediate internal standard/surrogate stock solution to I0 mL of methanol. This spikingsolution has a concentration of 20 ug/mL.
7.8.3 1 0 ul, of the internal standard/surrogate spiking solution is added to all 10 mLwater standards and samples prior to analysis. This will give a 20 ug/L concentration for internalstandard and surrogate compounds.
5KB SOP VOC05
Revision 3July 2007

964 .155
7.9 Storage of Standards
7.9.1 All standards will be stored in a freezer @ -10 0C or less.
7.9.2 All unopened stock standards in methanol have an expiration day assigned by themanufacturer.
7.9.3 All standards prepared in methanol will be stored in 2 mL-PTFE-lined screw capvials without headspace in the vial. Standards with partial headspace in the vial will not beretained.
7.9.4 VOC stock standards in methanol with permanent gases that are stored long termin the office VOC freezer expire one week after opening unless acceptability of the standard canbe documented.
7.9.5 VOC standards in methanol with non-gaseous compounds that are stored long-term in the office VOC freezer expire 6 months after opening unless acceptability of the standardcan be documented.
7.9.6 Secondary standards in methanol have a one-week holding time.
7.9.7 Vials expire 7 days from when the septum is punctured.
7.9.8 All standards will be stored separately from samples
8.0 SAMPLE COLLECTION, PRESERVATION, AND STORAGE
8.1 Sample Collection
8.1.1 Sample containers are purchased pre-cleaned and with aCertificate of QualityAssurance/Analysis from an approved vendor and will be supplied to the client by KB Labs priorto sampling.
8.1.2 Collection of Water Samples
8. 1.2.1 Each water sample is collected in two 40-inL glass vials with open-topscrew caps finted with PTFE-lined septa. The duplicate vial is potentially used forMS/MSD analysis. Once the sample is collected, the septum must be placed with thePTFE side towards the water sample and the open-top cap tightened finger tight.
8. 1.2.2 Water samples must be collected without headspace (no bubbles).
8.1.3 Collection of Soil Samples
6KB SO PVOCO5
Revision 3July 2007

964 1 56
8.1.3.1 For soil samples, approximately five grams of sample is collected in eachof three pre-weighed 40-ml, glass vials with open-top screw cap fitted with PTFE-linedsepta. The pre-weighed vials contain 10 ml, of laboratory reagent water. Two of thesamples should be collected for potential duplicate spike samples. Once a sample isplaced in a vial, the septum must be placed with the PTFE side towards the soil sampleand the open-top cap tightened finger tight.
8.1.3.2 In case high concentrations (> 200 ug/kg) of target analytes are suspectedfrom screening analysis, approximately five grams of sample is collected in a pre-weighed 40-ml, glass vial/PFTE-Iined septum containing 10 mL of methanol. Once thesample is collected, the septum must be placed with the PTFE side towards the soilsample and the open-top cap tightened finger tight.
8.1.3.3 In order to accommodate for the determination of percent moisturedeterminations for soil samples, an additional 40-mL vial, filled to the top with the soilsample, should be collected.
8. 1.4 The label on each sample container must be have a distinguishing fieldidentification for each sample and be accompanied by a properly completed chain-of-custodyform. The weight of each prepared vial should be recorded on the label to the nearest .01I grams.Refer to KB Labs' Standard Operating Procedure (SOP) No. 007 for a description of samplereceipt and acceptance procedures prior to sample analysis.
8.2 Sample Preservation and Storage
8.2.1 Even though samples are generally received in the mobile lab immediately aftercollection by the client, they must still be received on ice.
8.2.2 If a sample is not processed immnediately after receipt, it will be stored in an icedcooler at 4 + 2 0C until ready for processing. The sample should be allowed to come to roomtemperature before processing for analysis.
8.2.3 Because samples are generally analyzed in the mobile lab the same day as receipt,holding times should not be an issue. The regulatory holding times for water samplesrefrigerated at 4 + 2 0C is 7 days and for soil samples 14 days. Soils samples collected in water,if not analyzed within 48 hrs, must be frozen - after freezing they have a 14-day holding timefrom the time of collection. Samples preserved with sodium bisulfate in the field have a 14-dayholding time.
9.0 QUALITY CONTROL
9.1 Initial Demonstration of Capability (IDOC)
9.1.1 A new analyst will perform an IDOC prior to using any test method for theanalysis of client samples.
7KB SOP VOC05
Revision 3July 2007

964 15?7
9.1.2 An IDOC will also be performed whenever a new instrument or method isimplemented.
9.1.3 The IDOC will be performed in a clean and applicable matrix.
9.1.5 Four replicate samples of each matrix (standard laboratory reagent water or soil)are spiked with a known concentration of each analyte of interest at 10 - 50 times the methoddetection limits for the analytes.
9.1.6 The concentrations for each analyte are then experimentally determined using thestandard operating procedures for the analytical method.
9.1.7 The mean recovery and standard deviation of the found concentrations for thereplicates is then calculated for each analyte, and these are then compared to the correspondingacceptance criteria for accuracy and precision established by the lab from historical data.Acceptance criteria established by the lab may not exceed 70 - 130%.
9.2 Quality control procedures for the operation of the GC/MS include:
9.2.1 The GC/MS system must be tuned to meet specified BFB criteria described inSection I0. 1.
9.2.2 Initial calibration of the GC/MS system must be performed as described inSection 10.2.
9.2.3 Calibration verification procedures must be performed every 12 hours ofinstrument operation as described in Section 10.3 and the CCC, SPCC, and IS criteria must bemet.
9.2.4 A laboratory reagent blank (method blank) must be analyzed in order to monitorthe cleanliness of the analytical system. The method blank must be analyzed after the calibrationstandard(s) and before the samples and the results must demonstrate that the analytical systemcontains less than 20% of the reporting level for all target compounds and is free of anycontaminates that might interfere with the analysis of the target compounds. Method blanks maybe analyzed at a higher frequency if deemed necessary by the operator.
9.2.5 All samples, including standards and method blanks, must be fortified withsurrogate and internal standards. The percent recovery of each surrogate compound iscalculated in order to evaluate the performance of the analytical system and to help determine thepotential for sample matrix effects. Surrogate compounds include I,2-dichloroethane-d4, 1,4-difluorobenzene, toluene-d8, and 4-bromofluorobenzene. Surrogate control limits are set at + 3standard deviations of the laboratory average historical recoveries. Quantitation is performedwith the internal standards which include pentafluorobenzene, chlorobenzene-d5, and 1,4-dichlorobenzene-d4.
8KB SOP VOCO5
Revision 3July 2007

954 158
9.2.6 Duplicate matrix spike (MS/MSD) samples must be analyzed for every 20samples analyzed and for any daily sample batch that is less than 20 samples in order to monitorthe performance (precision and accuracy) of the target compounds in the actual matrix. Theaccuracy (% Recovery) and precision (%RPD) is calculated for every pair of spikes and astatistical analysis is performed on at least the last 20 samples analyzed in order to calculate andupdate control limits. The matrix spike samples are prepared by spiking I0 rnL aliquots of aselected water sample (or 5 gram soil sample) with the appropriate uL amounts of the matrixspiking standard, which are prepared from different stock standards than the calibrationstandards.
9.2.7 A single laboratory control sample (LCS) must be analyzed for every 20 samplesanalyzed and for any daily sample batch that is less than 20 samples in order to monitor therecovery of the target compounds from a clean sample matrix. A accuracy (% Recovery) iscalculated and a statistical analysis is performed on at least the last twenty samples analyzed inorder to calculate and update control limits.
9.3 Quality control criteria and corrective actions are summarized in the table below:
Table_9.3 _ _ _ _ _ _ _ _ _ _
Minimum AcceptanceQC Check Frequency Criteria Corrective Action(s)
Initial Demonstration Prior to analysis of Historical lab Prepare and reanalyzeof Capabililty (IDOC) any samples acceptance limits, but new samples.- 4 replicate standard not to exceed 70 - 130 Recalibrate, ifmatrix spikes of all percent. necessary.target analytes @ 10 -50 times MDLGC/MS Tuning - 4- Prior to initial BEB ion abundance Retune instrument.bromofluorobenzene calibration and every criteria must be met as If necessary, clean(BFB) 12 hours of analysis listed in method, source.
timeInitial Calibration (5 Prior to sample The RSD of target Rerun calibrationconcentration levels) analysis analyte R~s must be < standards. Cleanfor all target analytes. 15%. Minimum mean purge and trapLowest cone. level at R~s of SPCCs as listed transfer lines. Rerunreporting limit, in method must be met initial calibration.
during initial Check for systemcalibration. The RSD leaks, clip six inchesof CCC RFs during off column, changeinitial calibration must column. If necessary,be < 30%. prepare new
calibration standards.Calibration Daily before sample Rcriteria for SPCCs Rerun CCS. ThenVerification (- a analysis and every 12 the samte as during rerun initialmidlevel standard run hrs of analysis time. initial calibration. RE calibration, if
9KBSOPVOCO5
Revision 3July 2007

964 159
every 12 hrs) of CCCs must be <20 necessary.prepared from percent difference fromseparate source from initial calibration. Thecalibration standards IS retention times must
be < 30 secs fromthose in the midpointstandard of most recentinitial calibration. TheIS responses must bewithin -50% to + 100%of those in themidpoint standard ofthe most recent initialcalibration.
Method Blank One per daily analysis No target analyte Bake out purge andbatch, detected > 5% or MRL trap system. Change
adsorbent trap. Re-prep and reanalyzedmethod blank withassociated samples.
Matrix Spike/Matrix One MS/MSD every Should be within Check LCS toSpike Duplicate 20 samples per control limits determine if matrix(MS/MSD) - all matrix, established by lab. effects apply.target analytes spikedat same conc. as LCSLaboratory Control One per daily analysis Must be within control Reprep and reanalyzeSample (LCS) - all batch. limits established by LCS. Reanalyzedtarget analytes spiked lab. associated samples.at < 50% of linearrange calibrated.Prepared same asCvS.Surrogates - 4- All samples, spikes, Must be within control Reanalyze sample. IfBromofluorobenzene, standards, and method limits established by one or more stillI1,2-Dichloroethane- blanks, lab or the method. remain outsided4, Toluene-d8, 1,4- criteria, recalibrateDichlorobenzene. and or remake
_____ ____ _____ ___ ____ _____ ____ ___ -surrogate solution.Internal Standards - All samples, spikes, Area must be -50 to Reanalyze sample. IfFluorobenzene, standards, and method +1 00% of last one or more stillChlorobenzene-d5, blanks. calibration check. RT remain outsideI1,4-dichlorobenzene- must be + 30 secs from criteria, recalibrated4. last calibration check. and or remake IS
_____ ____ ____ ____ ____ ____ ____ ____ _____ ____ ____ ____ ____ solution.
l0KBSOPVOC05
Revision 3July 2007

964 Iso
10.0 ANALYTICAL PROCEDURE
10.1 Calibration and Standardization
10.1.1 Bromofluorobenzene (BFB) tuning criteria must be met at the beginning of eachday and every 12 hours thereafter as long as analyses are performed. The following tuningcriteria from EPA Method 8260 must be met before any samples or standards are analyzed.
M/z Required Intensity (relative abundance)50 15 to 40% of m/z 9575 30 to 60% of mlz9595 Base peak, 1 00% relative abundance96 5 to 9 %ofm/z 95173 Less than 2% of nmiz 174174 Greater than 50% of m/z 95175 5 to 9%of m/z174176 Greater than 95% but less than IO11% of m/z 174177 5to 9 %of m/z176
10.1.2 Initial calibration is performed when the instrumnent is started up when theinstrument response has drifted out of calibration in order to demonstrate that the instrumnent iscapable of acceptable performance at the beginning of the analytical run and is producing alinear calibration.
10.1.2.1 Five or six calibration standards @ 1,5,10,20,50, and 100 ug/L areanalyzed.
10. 1.2.2 The percent relative standard deviation (%RSD) of each target analytemust be < 15 %.
10.1.2.3 The system performance check compounds (SPCCs) must pass thefollowing minimum mean response factor (RE) criteria:
Chloromethane 0.101.1 -Dichloroedthane 0.10Bromoform 0.10Chorobenzene 0.301, 1,2,2-Tetrachloroethane 0.30
10.1.2.4 The following calibration check compounds (CCCs) must meetmimimum RSD criteria of < 30%
1,1 -Dichloroethane TolueneChloroform EthylbenzeneI1,2-Dichloropropene Vinyl chloride
p ~~~~~~~~~~~~~~~~~~~~~~~KBSOPVOC05Revision 3July 2007

964 IS
10. 1.3 A calibration verifi cation standard (CT'S) at least every 12 hours in order toverify initial calibration.
10.1.3.1 A 20 ug/L or 50ug/L standard must be analyzed.
10. 1.3.2 The SPCCs must pass the minimum mean RF criteria as in initialcalibration.
10.1.3.3 The percent difference of the CCCs must be <20% of initialcalibration, or if not included in the target compounds, all analytes must be < 20@ ofinitial calibration.
10. 1.3.4 The internal standard (IS) retention times must be < 30 secs from thosein the midpoint standard of the most recent initial calibration.
10.1.3.5 The IS responses must be within -50% and +100% of those in themidpoint standard for the most recent initial calibration.
10.2 Sample Screening:
10.2.1 All samples (waters and soils) are screened by GC/FID before preparation forloading onto the GC/MS purge and trap system. The screening procedure preventscontamination from high-level samples from being introduced into the instrumentation. Dilutionlevels are determined from the sample screening, allowing for a more rapid concentrationestimation and limiting reruns for dilutions.
10.2.2 Water samples: Approximately 1 mL of the sample is removed from the samplevial with a disposable pipet and placed into a 40-mL glass vial/PTFE-lined open-top screw cap.The cap is finger tightened with the PTFE-lined screw cap facing toward the sample. The vial isshaken for about 30 seconds. The sample from which I mL has been removed must be analyzedwithin 24 hrs.
10.2.3 Soil samples: The third sample vial is used directly for headspace screening.
10.2.4 I mL of headspaee gas is removed from the headspace of the sample vial (watersand soils) with a gas-tight syringe and injected directly into the injection port of theOC/FID. The headspace response is recorded on an integrator.
10.2.5 The headspace FID response is compared to the headspaceFID response of a100ug/L water standard or 1 00 ug/kg soil sample prepared in I mL of reagent water or 1 g ofstandard soil.
1 2KBSOPVOC05
Revision 3July 2007

964 .162
10.2.6 Sample dilutions:
Samples requiring dilution based on the headspace screening response will be diluted asfollows:
10.2.6.1 Appropriate aliquots of the water samples will be added to reagentwater to a total volume of 1 0 mL.
10.2.6.2 Appropriate aliquots of the methanol from the vial containing 5 grams ofsoil sample in 10 mL of methanol will be added to 10 mL reagent water.
10.3 Preparation of Water Samples for Purge and Trap
10.3.1 Remove the plunger from a 10 mL gas-tight syringe with an open/shut valve andclose the value.
10.3.2 Open the sample vial and pour the sample into the to the 10 mL. mark on thesyringe.
10.3.3 Reinsert the plunger into the syringe, turn it upright, bring the plunger end to the1 0 ml, mark.
10.3.4 With a 10 uL microsyringe, add I0 uL, of the surrogate/internal standard spikingsolution to the I0 mL sample in the syringe by inserting the microsyringe needle through the 1 0-mL syringe valve. Close the syringe valve. The concentration of the surrogates and internalstandards will be 20 ug/L.
10.3.5 If the sample is a matrix spike, add 10 uL of the calibration standard spikingsolution to the sample. The concentration of the spiked compounds will be 20 ug/L.
10.3.6 If the sample is a standard or laboratory control spike follow the above procedureusing laboratory reagent water and the appropriate amount of the calibration standard orlaboratory control sample spiking solutions.
10.3.8 Open the value on the appropriate purging chamber on the autosarnpler apparatus,insert the sample syringe into the injection port, open the value on the syringe, inject the watersample into the purging chamber, and close the chamber value.
10.4 Preparation of Soil Samples for Purge and Trap
10.4.1 Soil sample vials will not be opened by the analyst prior to analysis (with theexception of the vial designated for percent moisture determnination).
10.4.2 With a I0 uL microsyringe, add I0 uL, of the surrogate/internal standard
13KBSOPVOCO5
Revision 3July 2007

964 163
spiking solution to the sample by inserting the microsyringe needle through the sample vialseptum. The concentration of the surrogates and internal standards will be 20 ug/L in the waterextract and 40 ug/L in the soil sample.
10.4.3 If the sample is a matrix spike, add 10 uL of the calibration standard spikingsolution to the sample by inserting the microsyringe needle through the sample vial septum. Theconcentration of the spiked compounds will be 20 ug/L in the water extract and 40 ug/L in thesoil sample
10.4.4 Soil samples are attached to the purge and trap retrofit apparatus for analysis.
10.5 Concentrator Operating Conditions:
10.5.1 Adsorbent trap: Supelco K (10 cm Carbopack B, 6 cm Carboxen 1000, 1 cmCarboxen 1001)
10.5.2 Delivery pressure: - 30 psi Helium
10.5.3 Valve temp: 1800C
10.5.4 Transfer line temp: 1800C
10.5.5 Purge temp, set point: 400C
10.5.6 Purge program:
10.5.6.1 Purge: 6 minutes
10.5.6.2 Dry purge: 2 minutes
10.5.6.3 Desorb preheat : 2700C
10.5.6.4 Desorb: 2700 C/2 min
10.5.6.5 Bake: 2750C/4 mni, bake gas bypass: 120 sec;
10.5.6.6 Heater pockets preheat: 500C/2 mmn
10.6 Autosampler Operating Conditions:
10.6.1 Valve temp: 1750C
10.6.2 Transfer line temp: 1750C
14KBSOPVOC05
Revision 3July 2007

964 1?64
10.7 GC/MS Operating Conditions:
10.7.1 GC Operating Conditions For Full 8260 Compound List:
10.7. 1.1 Column: DB3624, 2Cm x 0. 18m, 1.0mm film
10.7.1.2 Injector: 4mm ID low volume glass insert
10.7.1.3 Injector temp: 2200 C
10.7.1.4 Detector temnp: 2800 C
10.7.1.5 Oven temperature program:
10.7.1.5.1 Initial temp: 350 C, hold for 4 minutes
10.7.1.5.2 Ramp temnp: 80C/min
10.7.1.5.3 Final temp: 2000 C, hold for 0.5 minutes
10.7.1.6 Column flow: constant flow, 4.0 psi @ 350C
10.7.1.7 Split flow: 20:1
10.7.2 MS Operating Conditions:
10.7.2.1 Mass range: 35-250 amu.
10.7.2.2 Scan time: 2 sec/scan
10.7.2.3 Source Temp: 280 0C
10.8 Analytical Run Sequence:
10.8.1 BFB Tuning
10.8.2 Method blank
10.8.3 Initial calibration
10.8.3.1 1 ug/L calibration standard
10.8.3.2 5 ug/L calibration standard
10.8.3.3 10 ug/L calibration standard'5
KB SOP VOC05Revision 3July 2007

964 165
10.8.3.4 20 ug/L calibration standard
10.8.3.5 50 ug/L calibration standard (use for daily calibration)
10.8.3.6 100 ug/L calibration standard
10.8.4 Method blank
10.8.5 Laboratory control sample (second source standard)
10.8.6 Method blank
10.8.7 Samples (including MS and MSD)
10.8.8 Method blank
10.8.9 Calibration verification standard (every 12 hours)
1 1.0 DATA ANALYSIS AND CALCULATIONS
11.1 Qualitative analysis:
Qualitative identification of each target compound is based on retention time and comparison ofthe sample mass spectrum with the characteristic ions in the reference mass spectrum - the threetons of greatest intensity or any ions over 30% relative intensity. Compounds are identified aspresent in the sample when the following criteria are met:
II .1.1 The characteristic ions of acompounds is maximized in the same scan or withinone scan of each other.
11.1.2 The retention time of the compound in the sample is with +6 seconds of theretention time of the compound in the calibration standard.
11.1.3 The relative intensities of the characteristic ions agree within 30%of the relativeintensities of these ions in the reference spectrum.
1. 1.4 Structural isomers that produce similar mass spectra and are sufficiently resolved,should be identified as individual isomers.
11.2 Quantitative analysis
11.2.1 The quantitation of identified target analytes is based on the integrated abundanceof the extracted ion current profile of the primary and secondary characteristic ion(s). These are
16KB SOP VOC05
Revision 3July 2007

listed in Table 5, p. 37-39, of Reference 14. 1. The internal standard used for quantitation is theone nearest to the retention time of the analyte.
1 1.2.2 The average response factors from initial calibration are used to calculate theconcentration of each compound in the sample using the following equation:
Cs = AxCsx D A, = peak area of analyte in sampleAi, x RRF x V,(Ms) Cis = concentration of internal standard
D = dilution factorA,, = peak area of internal standardRRF = mean response factorV5 (M,) = volume of mass of sample
RRF = x C 5 A, =peak area of analyteAi, x C, Ai, =peak area of internal standard
C. concentration of analyteCi concentration of internal standard
12.0 METHOD PERFORMANCE
12.1 Method performance is established by determining the Method Detection Limits (MDLs)in the matrix of interest. The MDL is defined as the minimum concentration of a substance that can bemeasured and reported with 99% confidence that the value is above zero. The MDL that is achieved fora given analyte will vary depending on instrument sensitivity and matrix effects.
12.2 The MDL for both waters and soils is experimentally determined using proceduresdescribed in 40 CFR, Part 136, Appendix B and as per 91-04.
12.2.1 Seven replicate samples of each matrix (standard laboratory reagent water or soil)are spiked with a known concentration of each analyte of interest.
12.2.2 The concentrations for each analyte are then experimentally determined using theprocedures described above for this method.
12.2.3 The standard deviation of the found concentrations for the seven replicates isthen calculated.
12.2.4 The MDL for each analyte is then determined by multiplying the standarddeviation by 3.
13.0 WASTE MANAGEMENT AND POLLUTION PREVENTION
Refer to procedures described in KB Labs' Standard Operating Procedure SOPOJO (Waste Disposal)and KB Labs' Health and Safety Manual.
'7KBSOPVOCO5
Revision 3July 2007

964 is
14.0 REFERENCES
14.1 Test Method for Evaluating Solid Wastes, Fourth Edition, SW846, Method 8260B,Revision 2, December 1996
14.2 Test Met hod for Evaluating Solid Wastes, Fourth Edition, S W846, Method 800GB3Revision 2, December 1996
14.3 Test Method for Evaluating Solid Wastes, Fourth Edition, SW846, Method 503GB,Revision 2, December 1996
14.4 Test Method for Evaluating Solid Wastes, Foutrth Edition, SW846, Method 5035A,Revision 0, December 1996
14.5 Code of Federal Regulations, Title 40, Part 40, Appendix B.
14.6 Hewlett-Packard 59721 MSD Hardware Manual Number.
14.7 Tekmar LSC 2000 Purge and Trap Concentrator User Manual.
14.8 KB Labs' Quality Assurance Manual, August, 2003.
14.9 KB Labs' Health and Safety Manual, 1998.
14. 10 KB Labs Standard Operating Procedure (SOP) No. 007, Sample Receipt and
Acceptance, July 2003, Revision 1.
1 8KB SO PVOC05
Revision 3July 2007

964 1 68
ATTACHMENT S
19KBSOPVOC05
Revision 3July 2007

964 1 6 9
METHOD DETECTION LIMIT STUDY
Method: 8260B InstrumentI.D.: HP5890GC/HP597]AMSD
Sample Prep Method: 5030B AnalyticalColumn: DB624,20mxO.Igmmi.D.,I.Oumf'iimthickness
Analyst: Brad Weichert Matrix: Water
SampleVolume: 10ral,
SpikeCone.andAmount: 5.OuLof2ug/mLspikingsolutionintolOmLwater
Test MDL Replicates
Can -3 - -'-4 f MRL
i5ichiorodifluoroinethane 1 0.86 0.67 0.721 0.64 0.84 0.69 0.86 0.75 0.10 0.3 1chloroinethane 1 0.82 0.78 0.70 0.77 0.86 0.84 0.99 0.82 0.09 0.3 1
10h 0.75 0.84Viny loride 1 0.81 0.65 0.84 0.74 0.76 0.77 0.07 0.2 1Bromonnethane 1 0.71 0.70 0.83 0.88 1.13 0.67 0.81 0.82 0.16 0.5 IChl-Oroethane 1 1.06 0.78 0.75 0.98 0.97 0.70 0.77 0.86 0.14 0.4 1Trichlorofluoromethane 1 0.85 0.78 0.81 0.71 0.89 0.76 1.06 0.84 0.11 0.4 11,1.dichloroethene 1 0.98 0.69 0.70 0.78 0.95 0.78 0.68 0.79 0.12 0.4 1Medly-lenoe Chloride 1 1.03 0.60 0.92 1.19 137 1.08 0.93 0.99 0.20 0.6 11.1,2-Dichloroethene 1 0.98 0.62 0.74 0.96 0.97 0.8 1 0.87 0.85 0.14 0.4 1MtBE 1 0.73 0.66 0.971 0.87 1.04 1 0.90 1 0.99 0.88 0.14 0.4 11,1-Dichloroethane 1 0.87 0.69 0.87 0 83 0.98 0.86 0.82 0.85 0.09 0.3 12,2-Dichlaropropane I 1.01 0.79 0.87 0.90 0.80 0.85 0.78 0.86 0 08 0.3c-1,2-Dichloroethene 1 0.85 0.67 0.81 0.84 1.03 0.92 0.77 0.84 0.11 0.4Chl=form 1 0.78 0.60 0 99 1.00 0.99 1.02 0.95 0.89 0.15 0.51. 1, I -Trichloroethane 1 0.87 0.70 0.66 0.82 0.90 0.86 0.72 0.79 0.10 0.3 1Carbon tetrachloride 1 .4-7 2 27 2.29 2.53 2.42 2.47 2.43 2.41 0.10 0.3 1benzene 1 0.79 0.64 0.81 0.76 0.84 0.87 0.84 0.79 0.08 0.2 1
-D, 0.92 1.07 1.17 0.85 1.11 1.00 0.161.2 chloroethane I 1.11 0.75 0.5 1Trichloroethene 1 0.78 0.69 0.79 0.87 0.88 0.82 0.73 0.79 0.07 0.2 11,2-Dichloropropane I 0.80 0.71 0.74 0.89 0 99 0.88 1 0.74 0.82 0.10 0.3 1Dibromornethane 1 1.22 0.80 0.91 1.03 1.29 1.12 1.01 1.05 0.17 0.5 IBromodichloromethane 1 0.74 0 62 0.91 0.74 1.02 0.82 0.97 0.83 0.14 0.4 1c- 1,3-Dichloropropene I 0 81 0.69 0.74 0.89 0.95 0.83 0.83 0.82 0.09 0.3 1Toluene 1 82 0.58 0.68 0.67 0.70 0.70 O�72 0.70 0.07 0.2 1t-1,3-13ichloxopropene t 0.79 0.86 0.70 0.81 0.93 0.98 0.83 0.84 0.09 0.3 11,1,2-rrichloroethane I 0.89 0.75 1.12 0.93 1.09 0.85 0.93 0.94 0.13 0.4 1Tetrachloroethene 1 0.84 0.74 0.73 0.73 1 0.94 0.96 0.84 0.83 0.10 0.3 11,3-Dichloropropane 1 0.77 1 -6 72 0.73 0.75 0.92 0.79 0.85 0.79 0.07 0.2 1Dibremochloromethane 1 0.90 0.58 0.53 0.77 0.74 0.92 1 0.77 0.74 0.15 1 0.5 I1,2 Dibromomethane 1 0.92 0.72 0.85 0.81 0.96 0.97 0.86 0.87 0.09 0.3 1Chlorobenzene 1 0.80 0 68 0.72 0.76 0.90 0.83 0 76 0.79 0.07 0.2 1
loroethane 1 0.89 0.64 0.68 0.75 0.77 0.84 0.76 0.76 0 09 0.3 1Ethylbenzene 1 .73 0.66 0.66 0.68 0.74 0.75 0.75 0.71 0 04 0.1 Im&p.Xy]cne 1 1.42 1.51 1.25 1.45 1.44 1.43 1.43 1.42 0.09 0.3 1o-Xylene�� I 0 82 0.93 0.62 0.70 0.75 0.71 0.81 0 75 0 08 0.2 1Styrene 1 0.69 0.71 0.74 0.66 0.93 0.78 0.861 0.77 0 10 0.3 1Bromoforra 1 0.61 OkO L14 0.71 1.09 0.90 0.83 0.84 0.22 0.7 1 1isopropylbenzene 1 O�76 0.75 0.67 0.68 0.73 0.78 0.72 0.73 0.04 0.1 I IBromobenzene 1 0.99 0.69 0.60 0.80 0.81 0.75 0.73 0.77 0.12 0.4 11,T1,2-Tetrachloroethane 1 0.94 0.85 0.73 0.8 1 0.95 0.69 0.95 0.85 0.11 0.3 1n-Propyllacrizene 1 0.76 0.77 0.64 0.69 0.75 0.84 0.73 0 74 0.06 0.2 12-Chlorotoluene 1 0.79 0.8 1 0.72 0.79 0.84 0.71 0.78 0 78 0.05 0.1 I,I�Chlorotoduene 1 0.87 0.71 0.67 0.70 0.89 0.81 0.75 0.77 0.09 0.3 11,3,5-Trimethylbenzcne 1 0.68 0.68 0.68 0.68 0.75 0.76 0.82 0.72 0.06 0.2 1tert-Butylbenzene I 0.74 .64 0 4 7 76 077 0.73 O�04 0.1 I
0 so 0.70 N'1,2,4-Trimethylbenzene 0.59 7 7 0 t) 73 0.71 0 07 0.2see-Butylbenzene 0.74
1 0 74 0 71 0.641 0.70 0.75 0.86 1 0.75
20KBSOPVOC05
Revision 3July 2007

964 .170
1,3-dichlIorobenzene I 0.88 0.71 0.69 0.75 0.87 0.68 0.75 0.76 0.08 0.3 Ip-Isopropyltoluene 1 0.83 0.72 0.57 0.66 0.75 0.73 0.70 0.71 0.08 0.3 I1,4-dichlorobenzene I 0.77 0.90 0.s81 0.77 0.82 0.91 0.87 0.84 0.06 0.2 I1.2-Dichlorobenzene 1 0.82 0.8 0.65 0.84 0.82 0.86 0.87 0.81 0.07 0.2 In-Bulylbcnzcnc I 0.77 0.78 0.65 0.68 0.83 0.84 0.79 0.76 0.07 0.2 I1,2-Dibromno-3-ch loropropan I 0.64 1.86 1.69 1.63 2.17 2.81 1.12 1.70 0.70 2.2 51,2,4-Trichlorobenzene I 0.77 0.66 0.77 0.96 1.07 1.18 0.90 0,90 0.18 0.6 IIle xachlIorobutadiene I .4 0.79 0.53 0 77 0.91 1.04 0,99 0.84 0 17 0.5 I
aphihdalene I 0.89 0.88 0.76 080o 0.97 1.72 1.07 I.Oi 0.33 1.0 5I,223-Trichlorobenzene 1 0.76 0.61 0.75 0.83 1.06 1.1 0.91 0 87 0.179 06 I1,4-Dioxanc 0 0 8 5 1100 120 1011 137; 1041 107 17 53 100
21KB SO PVOC05
Revision 3July 2007

964 1J1
METHOD DETECTION LIMIT STUDYMethod: 8260B Instrument I.D.: l-P58900C/HP5971A MSDISample Prep Method: 50353 lAnalytical Column: DB624, 20 inx 0.18 mm iD., 1.0urnf'ilm thicknessAnalyst: Brad Wetchert M"atrix :SilDate: 7/08/04 Samuple4 Mss: S g
___________________ _________Spike Cone, and Amount: 5.0 uL.of 2uglnL spiking solution into 5.0 g silTest 1MDL Replicatesi (ug/kg)
Co ntamnarunt Cont. (ug/kg)! t 2 -3 4 T 5 D ML 1 RDichlorodifluoromethane 2 1.96 2.04 2.10 1.86 1.58 2.04 1.88 1.92 0.17 0.5 2Chloromethane 2 1.70 1.62 2.42 1 56 1.96 2.04 2.12 1.92 0.31 1.0 2Vinyl Chloride 2 1.78 1.54 2.12 1.72 1.80 1.96 1.90 1.83 0.19 0.6 2Blromomelhane 2 1.90 2.12 3.08 2.24 2.16 1.70 1.94 2.16 0.44 1.4 2Chloroethane 2 1.80 1.80 1.82 1.88 1.84 1.90 1 96 1.86 0.06 0.2 2Trichlorofluoromethane 2 2.12 2.00 2.06 1.78 1.68 1.78 1.78 1.89 0.17 0.5 21,1-dichhloroethene 2 2.04 2.20 2.34 2.04 1.70 2.22 1.86 2.06 0.22 0.7 2Merhylene Chlonde 2 2.20 2.38 2.48 1.68 1.60 1.76 1.88 2.00 0.35 1.1 2t-1,2-Dichloroethcnc 2 1.90 1.54 2.50 2.20 1.58 1.94 2.04 1.96 0.34 1.1 2IMcRE 2 2.42 2,24 2.76 2.10 2.08 2.00 1.96 2.22 0.28 0.9 2Il1-Dichloroethanc 2 1.72 1.72 2.18 1.56 1.72 1.96 2.02 1.84 0.22 0.7 2
2,2-Diebloropropane - 2 2.14 2.20 2.64 1.72 1.44 2.00 1.94 2.01 0.38 1.2 2c-1,2-Dichloroethene 2 1.50 1.70 1.96 1.78 1.92 1.90 1.76 1.79 0.16 0.5 2Chloroform 2 2.14 1.88 2.12 1.96 2.04 2.30 1.94 2.05 0.14 0.5 21 ,I-Triehlorocthane 2 1.60 1.82 2.04 1.54 1.80 1.76 1.88 1.78 0.17 0.5 2Carbon tetrachloride 2 4.5 8 4.94 4.52 4.66 45 4.6 4.94 4.68 0.8 0.6 2Benzene 2 1.86 1.82 1,96 1.54 1.70 1.86 1.92 1.81 0.14 0.5 2I 2-Dichloroethane 2 2.82 2 30 2.78 1.84 1.80 2.34 2.36 2.32 0.40 1.3 2T~richloroethene 2 i 1.94 11.76 1.82 1.52 1.80 1.96 1.92 11.82 0,15 0.5 21,2-Dichloropropane 2 2.28 1.98 1.90 1.94 2.04 2 02 1.82 2.00 0.15 0.5 2Dibromomethane 2 2.44 2 06 2.98 1 .84 1.86 1.68 2 38 2.18 0.45 1.4 2Bromodichloromethane -~- 2 2.12 2.00 2.24 1.80 1.90 2.06 2.04 2.02 0.14 0.5 2c-l1,3-Dichloropropene____ 2 1.76 1.86 2.08 1.60 2.02 2.10 1.94 1.91 0.18 0.6 2Toluene 2 1.72 1.70 1.82 1.56 1.62 1.58 1.94 1.71 0.14 0.4 2-i1,3-Dichloropropene 2 1.82 1.62 2.38 1.60 1.68 1.86 1.78 1,82 0.27 0.8 2
l~~l,2-Trkhloroclhane 2 2.32 1.82 2.10 2.06 1.58 1.72 1.82 1.92 0.25 0.8 2Tctrachloroethene 2 2.04 1.68 1.96 1.60 1.94 2.28 1.98 1.93 0.23 0.7 21,3--Dichloropropane 2 2.48 1.96 2.18 1.82 1.94 2.26 1.82 2.07 0.25 0. 2Dibromoebloromethane 2 1.74 1.90 2.12 1.20 1.62 1.92 1.54 1.72 0.30 0.9 21,2 Dibrornornehane 2 2.80 1,86 2.32 1.36 1.721 1.86 12.08 2.00 0.46 1.4 12Chlomobenzene 2 1.92 1.80 1.78 1.56 1.70 1.94 1.84 1.79 0.13 0.4 21,i,1,2-Tetruchloroethame 2 1.62 1.50 2.18 1.50 1.88 1.70 1.50 1.70 0.25 0 8 2Edhylbenzenc 2 1.90 1.78 1.90 1.56 1.54 1.80 1.88 1.77 0,15 0.5 2m,&p-Xylene 2 3.46 3 08 3.38 3 02 3 42 3.00 3.28 3.23 0.20 0.6 2o-Xylcnc 2 1.84 1,68 2.16 1.78 1.70 1.62 1.88 1.81 0.18 0.6 2Styrene ~ ~2 1.72 1.56 1.94 1.42 1.56 1.66 1.76 1.66 0.17 0.5 2Bromoforn, 2 1.76 2.16 2 22 1,62 2.68 I 86 1.68 2.00 0.38 1.2 2ISOpropyl~bemnze 2 1.88 1.60 1.64 1A42 1.50 1.82 1.76 1.66 0.17 0.5 2Bromobenzene 2 2.26 1.64 1.54 1.56 1.74 2.14 12.00 11.84 0.29 0.9 2
I I22ftahloo ae2 24 .8 2.22 1,40 1.78 2.02 2.18 2.00 0.34 1.1 2
n.i'ropylbenzene 2 1.84 1.68 1.66 1.58 1.58 1.80 1.88 1.72 0.12 0.4 22-Chlorotolutene 2 1.74 1.74 2.18 1.60 1.60 1.80 1.88 1.79 0.20 0.6 24.C-hlorosoluene 2 2.14 1.64 2.02 1.64 1.60 1.90 1.94 1.84 0.21 0.7l.3.5-Trnmethylbcnzcne 2 1.98 1.58 1.64 1.58 1.48 1.84 1.78 1.70 0.18 0.6 2terl-Bulylkenzene 2 1.84 1.62 1.76 1.56 1.40 1.60 1.66 1.63 0.14 0.4 2.,24.4-Tnmethylbenzene 2 1.84 1.60 1.66 1.44 1.64 1.72 1.80 1.67 0.13 0.4 2
scc.Butylbcnzcne 2 1.76 1.72 1.76 1.40 I 46 1.72 1.78 I 66 0.16 0.5 2
22KB SO PVOC05
Revision 3July 2007

964 17?
1,3-clichlorobenzene 2 2.20 1.36 1.60 1.66 1.66 1.76 1.92 11.74 0.26 0.8 2p-Isopropylioluene 2 2.10 1.58 1.72 1.50 1.78 1.62 1.88 1.74 0.20 0.6 2I4-dichlorobcnzene 2 2.36 1.58 1.98 1.64 1.98 2.06 2.20 1.97 0.28 0.9 21.2-Dichlorobenwnen 2 2.26 1.74 2.26 1.72 1.58 1.86 2.02 1.92 0.27 0.8 2n-Bulylbenzene 2 1.94 1.84 1.84 1.54 1.54 1.76 2.12 1.80 0.21 0.7 21.2-Dibroino-3-chloropropan 2 2.94 3.66 2.70 2.10 3.90 4.22 4.08 3.37 0,80 2.5 51,2,4-frichlorobernzene 2 4.58 2.22 2.82 2.00 2.00 3.04 2.60 2.75 0.90 2.8 5Hexachlorobuladiene 2 3.14 1.44 2.54 1.70 2.02 2.24 2.16 2 18 0 56 1.7 2Naplhalene __ 2 6.3 2.6 40 1.4 220 2.46 2.92 3.27 1.59 5.0 5
l23.Trichloroben~~~~ ~ ~ ~ ~~~~~~~~~~~zene 2 .4 .4 .4 1.0 22 2.24 2.16 2.18 0.56 .1,4-Dioxane 200 174 102 200 1 108 134 18 18 42 37 5 20
23KB SOP VOC05
Revision 3July 2007

964 Alj- ,
APPENDIX B: DPE SYSTEM DECOMISSIONING PLAN

964 174
FINAL
DECOMISSIONING PLANDUAL PHASE EXTRACTION SYSTEM
OPERABLE UNIT 8DEFENSE SUPPLY CENTER RICHMOND
RICHMOND, VIRGINIA
Prepared by:
Versar, Inc.6850 Versar Center
Springfield, Virginia 22151
Updated by:
Earth Tech, Inc.8005 Outer Circle Road
Brooks City Base, TC 78235
September 2007

964 175OU & Decommissioning Plan, DSCR
TABLE OF CONTENTS
Section Page
LIST OF ACRONYMS AND ABBREVIATIONS.................................................. in
1.0 INTRODUCTION................................................................................1.1 Background ..............................................................................1.2 Purpose....................................................................................
2.0 DUAL PHASE EXTRACTION SYSTEM DESCRIPTION.................................32.1 DPE System Overview ................................................................. 32.2 System Component Description and Decommissioning Procedures ................ 4
2.2.1 Groundwater Extraction System...............................................42.2.1.1 Electrical Power......................................................42.2.1.2 Remote Panels........................................................42.2.1.3 Well Control Interlocks .............................................. 42.2.1.4 Recovery Well Equipment...........................................52.2.1.5 Well Head Equipment................................................52.2.1.6 Dual Phase Extraction Wells........................................52.2.1.7 AirlInjection Wells .......................................... 62.2.1.8 Well Decommissioning .............................................. 6
2.2.2 Above and Below Ground Piping ............................................. 72.2.2.1 Piping Details.........................................................72.2.2.2 Above Ground Piping................................................72.2.2.3 Below Group Piping ................................................. 7
2.2.3 Treatment System Components................................................82.2.3.1 Electrical Power Connections ....................................... 82.2.3.2 Shallow Tray Air Stripper (STAS)..................................82.2.3.3 Stripper Off-Gas Piping..............................................82.2.3.4 Effluent Transfer Pump .............................................. 82.2.3.5 Effluent Piping ....................................................... 92.2.3.6 Vapor Extraction Blower ............................................ 92.2.3.7 Air Injection Blower ................................................. 92.2.3.8 Main Control Panel ................................................. 102.2.3.9 Equipment Building ................................................ 102.2.3.10 Vegetation Plan ..................................................... 10
LIST OF FIGURES
Figure I. Site Map and Treatability Study System Layout

964 17,6OU & Decommissioning Plan. DSCR
ATTACHMENTS
Attachment A. System PhotographsAttachment B. Piping and Instrumentation DiagramsAttachment C. Well Construction DetailsAttachment D. Equipment List

964 1 77OU S Decommissioning Plan, DSCR
LIST OF ACRONYMS AND ABBREVIATIONS
ANP Acid Neutralization PitsBTEX benzene, toluene, ethylbenzene, and xylenes
CERCLA Comprehensive Environmental Response, Compensation, and Liability Actco Contracting OfficerDPE dual phase extraction system
DSCR Defense Supply Center RichmondDLA Defense Logistics Agency
EPA Environmental Protection AgencyFFA Federal Facility Agreement
HASP Health and Safety PlanHOPE high density polyethylene
ICs Institutional ControlsID inside diameterMNA Monitored Natural AttenuationNPL National Priority ListOU Operable UnitPCE TetrachloroethenePID piping and instrumentation diagrams
PVC polyvinyl chlorideRCRA Resource Conservation and Recovery ActSTAS Shallow Tray Air StripperTCE TrichloroetheneUSEPA United States Environmental Protection Agency
VOEQ Virginia Department of Environmental QualityVDWM Virginia Department of Waste ManagementVEB Vapor Extraction BlowerVOC Volatile Organic Compound

964jfOU 8 Decommissioning Plan. DSCR
1.0. INTRODUCTION
1.1 Background
The Defense Supply Center Richmond (DSCR) is a Defense Logistics Agency (DLA) facilitylocated approximately I I miles south of Richmond, Virginia. The DSCR is a Federal Facility onthe National Priority List (NPL) under the Comprehensive Environmental Response,Compensation, and Liability Act (CERCLA). The DSCR was listed on the NPL in 1987 and inSeptember 1990 entered into a Federal Facility Agreement (FFA) with the U.S. EnvironmentalProtection Agency (USEPA), DLA, and the Virginia Department of Environmental Quality(VDEQ). The FFA establishes a procedural framework and schedule for developing,implementing, and monitoring appropriate environmental response actions.
Operable Unit 8 (OU 8) at the DSCR is defined as the contaminated groundwater beneath anddowngradient from the site of the former Acid Neutralization Pits (ANP) OU 5, near Warehouse65. During the mid I1990s, treatability testing was conducted to determine the effectiveness of adual phase extraction system (DPE) to remove chlorinated volatile organic compounds (VOCs)from the OU 8 groundwater.
The OU 8 DPE system was initially installed for treatability testing and then operations werecontinued as an interim cleanup measure. The DPE system was operated from July 1997 untilJanuary 2004 when it was shut down to evaluate the potential rebound of groundwatercontaminant concentrations. The system was shut down once the mass removal reachedasymptotic conditions and a rebound test was conducted. Based on the rebound test data, theconstituent rebound was not considered significant and restarting the system was notrecommended. A final remedy that addresses residual contamination at OU 8 has been selectedby DSCR and USEPA with concurrence from VDEQ. The remedy includes institutional controls(ICs) and monitored natural attenuation (M4NA) with an in-situ bioremediation contingency.
1.2 Purpose
The purpose of this document is to provide guidance and procedures for decommissioning theOU 8 DPE system and associated piping/equipment. Procedures outlined in the DSCR Healthand Safety Plan (HASP) (DSCR, 2007) will be followed during all decommissioning fieldactivities.

964 179
OUR8 Decommissioning Plan, DSCR
Recent groundwater sampling data is presented in the OU 8 Remedial Design document. Thegroundwater contamination is mainly related to chlorinated VOCs and potentially naturallyoccurring metals such as manganese. Soil contamination in the DPE areas is not likely based onthe 1995 ESD for OU 5. Areas that were previously excavated during the OU 8 systeminstallation were backfilled with clean materials. Environmental impacts are not anticipated tobe present in these clean backfilled areas. Equipment and piping removal actions in these cleanbackfilled areas should not pose and environmental hazard to site personnel.
2

964 18o
OU 8 Decommissioning Plan, DSCR
2.0. DUAL PHASE EXTRACTION SYSTEM DESCRIPTION
2.1 DPE System Overview
The 013 8 DPE system was installed in 1997 to recover and treat groundwater and soil vaporcontaining VOCs emanating from beneath and downgradient from the site of the former ANPnear Warehouse 65 at DSCR. The ANP area consisted of two former concrete settling tankswhich received waste water from metal cleaning operations (paint and rust removal) conductedat Warehouse 65 (Figure 1). The two tanks were located in a fenced area approximately 25 feetnorthwest of the warehouse. The tanks (14,600-gallon and 3,000-gallon capacities) wereapproximately 6.5 feet in depth and received metal cleaning waste water from 1958 to the early1980's. The pits were closed and removed from service in 1985. During pit closure activitiesthe concrete sides and bottoms were found to be cracked. Subsequence investigation identifiedthe presence of VOCs mainly tetrachloroethene (PCE) trichloroethene (TCE) and 1,2-dichloroethene with lesser concentrations of benzene, toluene, ethylbenzene, and xylenes(BTEX) in the soil and groundwater beneath and downgradient of these tanks.
For the treatability study, construction of the OU 8 dual phase recovery and treatment systemwas completed in the summer 1997 with start up activities conducted in July 1997. Thetreatment system consisted of the following components:
* Groundwater Extraction System* Groundwater Treatment System* Vapor Extraction System
* Air Injection System* Air Injection Wellhead System* Dual Phase Wellhead System
* Well Field Groundwater Collection Piping* Well Field Vapor Collection Piping* Portable Equipment Building
P ~~~~The system was utilized for vapor and groundwater recovery and treatment (treatability studyfollowed by interim remedial action) until it was shut down in January 2004. The 013 8 systemutilized twelve dual-phase wells to extract contaminated vapors and groundwater from the areasof elevated contaminant concentrations. Recovered groundwater was piped to the equipmentbuilding for treatment through a shallow-tray air stripper for removal of VOCs. The air strippertreated the groundwater to meet effluent water quality standards for VOCs. Contaminated off-
3
9S4 18;OU 8 Decommissioning Plan, DSC'R
gases from the air stripper were directed to the atmosphere because the vapor concentrations metair quality requirements. The treated water from the system was discharged to storm sewerwhich flows to Falling Creek. Air was also injected into the saturated formation through at sixinjection wells to enhance contaminant removal by the vapor extraction system. Extractedvapors were removed by the soil vapor extraction system for discharge to the atmosphere. Airemissions were monitored to ensure compliance with applicable air quality requirements.
2.2 System Component Description And Decommissioning! Procedures
The deconmilssioning procedures for each component of the DPE system are described in thefollowing paragraphs. System photographs are included in Attachment A.
2.2.1 Groundwater Extraction System
2.2.1.1 Electrical Power
The electrical power service in the equipment building for all the recovery well pumps will belocked-out and permanently disengaged prior to pump removal. The electrical leads from thecircuit breakers to the motor starters will be removed and tagged out according the lock-out/tag-
out safety procedures as presented in the HASP. The breakers will then be removed. A licensedelectrician will perform these tasks. The piping and instrumentation diagrams (PlDs) for themain control panel (3 phase 460 volt power supply) will be made available to the electrician.The PIDs are included in Attachment B.
2.2.1.2 Remote Panels
The remote panels located adjacent to each well will then be disconnected from the well,removed, and inventoried for storage or disposal. The control panel contains a Danfoss VLT2000 Series Adjustable Frequency Drive, Danfoss motor choke, control circuit transformer,Warrick level control relays, Hoffman panel heater, relays, fuses, blocks switches andreceptacles.
2.2.1.3 Well Control Interlocks
The well pump control interlocks located in the main control panel, will be disabled andremoved. The well pump control interlocks prevent operation of the well pumps if' the airstripper is not operational.
4

964 1 82OU 8 Decommissioning Plan. DSCR
2.2.1.4 Recovery Well Equipment
The electric submersible pumps (Grundfos Model ICE5, 2HP, 460 volt, 3-phase) and the in-wellfluid level controls/probes will be removed from the recovery wells. When the pumps and levelcontrol sensors are removed, they will be washed with a pressure washer. All decontaminantwater will be collected and containerized for disposal. Pumps and level sensors determined to bein working condition will be inventoried for storage. Equipment in poor working condition orshowing significant indications of wear and tear will be disposed. A decommissioning checklistwill be completed as equipment is inventoried and removed from the wells. The equipment willbe placed in a labeled box for storage. The submersible pumps will be labeled and placed on ashipping pallet for storage. The equipment will be relocated to the storage area designated byDSCR personnel.
2.2.1.5 Well Head Equipment
The well head assembly (PVC or fiberglass) will be disassembled for disposal or recycling. Allaboveground vapor extraction and liquid discharge piping, support struts, concrete, totalizingflow meters, heat trace, pipe insulation, electrical wiring and control valves will be disposed orrecycled. As much as possible, metal components and electrical wire will be recycled.
2.2.1.6 Dual Phase Extraction Wells
Twelve dual-phase extraction wells were installed in a rectangle pattern at the locations shownon Figure 1. The dual-phase recovery wells (DP-l through DP-12) were constructed of 6-inchinside diameter (ID) Schedule 40 polyvinyl chloride (PVC) well casing and I0 feet of 0.020-inchcontinuous slot PVC wire wrapped well screen. The wells were installed (in the upper WBU) in17.5-inch ID boreholes advanced by a hollow-stem auger drilling rig to depths of 22 to 27.5 feetbelow ground surface. The annular space at each borehole was backfilled with sand, bentoniteclay chips above the sand, bentonite grout above the chips and concrete at the ground surface. Athree feet square concrete well pad surrounds each well to a depth of four inches. Threeprotective steel posts set in concrete surround each well. These wells will not be abandoned atthis time, and may be used for groundwater monitoring and/or for future in situ bioremediationactivities. The well construction details are presented in Attachment C.
5

96 4 183OUR Decommissioning Plan, DSCR
2.2.1.7 Air Injection Well Details
The air injection wells (Al-I through AI-6 on Figure 1) were constructed of 2-inch ID Schedule40 pvc well casing and 4.5 feet of 0.020-inch machine slotted PVC well screen. The wells wereinstalled in 8.25-inch ID boreholes advanced by a hollow-stem auger drilling rig to depths of 19to 25 feet below ground surface. The annular space at each borehole was backfilled with sand,bentonite clay chips above the sand, bentonite grout above the chips. No concrete pads wereconstructed for the air injection wells. These wells will not be abandoned at this time, andmaybe used for groundwater monitoring and/or for future in situ bioremediation activities. Thewell construction details are presented in Attachment C.
2.2.1.8 Well Decommissioning
During Tier I or Tier II activities, it may be determined that some of the dual phase extractionwells or air injection wells should be decommissioned. These wells will be abandoned by aVirginia licensed driller and in accordance with VDEQ decommissioning guidance. The wellswill be abandoned by grouting with either a high solids (30% or greater) bentonite slurry or withneat cement (Portland Type II cement with 5-10% powdered bentonite) prepared according tothe manufacturer's directions. Potable water will be used to mix the well grout materials.
The grout materials will be injected by a tremie pipe or stiff hose from the bottom of the wellprogressing upward in one continuous emplacement. This method will displace the ground watercontained in the well to the surface. A fluid diverter (PVC Tee adapter) may be placed on thewell head so that all potentially contaminated fluids can be diverted into a trough or container fordisposal. The well seal material will be introduced through the top of diverter allowing thedisplaced fluids to flow from the side diverter. Once the grout flows freely from the diverter, theholes in the Tee adapter will be restricted to allow pressure to build in the well forcing the groutinto the sand filter pack. The volume of grout used to abandon the well will be recorded.
Once the well is grouted and the seal has set up, the well head adapter (PVC or fiberglass Teeassembly) will be removed and the casing will be cut-off approximately 2-3 feet below groundsurface. A concrete cap will be placed over this location. The open excavation above theconcrete will be back-filled with top soil, and native shrubs or grass will be planted at theselocations. These ecological enhancements will be implemented in coordination with DSCRpersonnel. Some of the advantages of implementing ecological enhancements include:
• Increased habitat diversity;• Replacement of invasive species with native ones; and
6

964 184OUR8 Decommissioning Plan. DSCR
* May result in long term cost savings for site maintenance;,
For wells located in asphalt or concrete pavements, the PVC casing will be cut off belowgroundsurfarce with an internal pipe cutter. The PVC will be removed and the well will bebackfilled with concrete. If the concrete or asphalt plug around the well is cracked ordeteriorated then the entire plug of surface concrete will be removed and recast as concrete afterthe PVC casing has been removed.
2.2.2 Above and Below Ground Pivin2
2.2.2.1 Piping Details
The below ground liquid discharge piping from the recovery wells to the treatment system shedis constructed either of 4-inch or 6-inch ID high density polyethylene (HDPE). The above andbelowground vapor extraction system piping from recovery wells are constructed of 4-inchHDPE. The air supply lines to the air injection wells are constructed of I -inch to 3-inch schedule40 threaded galvanized steel pipes. Attachment B presents the piping installation diagrams.
2.2.2.2 Above Ground Piping
All above ground steel pipes, valves, fittings and support struts will be removed and discarded orrecycled as scrap metal. Some of the aboveground piping was insulated and heat traced toprevent water from freezing. All insulation and heat trace material will be discarded as debris.
2.2.2.3 Below Ground Piping
The underground piping was placed in trenches at a minimum depth of lB8 inches below grade toI ~ ~~~prevent water from freezing during winter. Depending on the pipe integrity, this piping will bepressure grouted in place (if the integrity is questionable) or capped at the ground surface (if theintegrity is sound). Capping will allow for reuse of the piping for future remediation activities (iffuture rernediation is deemed necessary). For pipes with questionable integrity, in-placepressure grouting will be performed using either well grout materials or a neat cement (PortlandType 1I cement with 5-10% powdered bentonite). The entire line will be filled with grout. Theflange fitting located adjacent to each well can be utilized to adapt a grout pump discharge hoseto the pipe for abandonment during the pressure grouting sequence.
7

~9S612
OURLDecomnmissioning Plan, DSCR
2.2.3 Treatment System Components
The equipment list from the OU 8 system installation is included in Attachment D.
2.2.3.1 Electrical Power Connections
The electrical power service in the equipment building will be locked out and permanentlydisengaged prior to the equipment removal. The electrical leads from the circuit breakers to allmotors, the ventilation fan, the heater, and the main control panel will be removed and taggedout according the lock-out/tag-out safety procedures as presented in the HASP. Electrical poweroutlets and lighting may remain active until all the equipment has been removed from theequipment building. A licensed electrician will perform these tasks. After completion of theequipment removal, permanent interruption of electrical power to the equipment building will becompleted. The final power interruption will be performed by the electrical power company.All electric breakers will be removed from the main electrical panel will be stored or discardedas debris. All wiring and the main panel box will be recycled.
2.2.3.2 Shallow Tray Air Stripper (STAS)
The STAS consists of a 15-HP, 3-phase, 460-volt direct-drive centrifugal blower connected to aseries of stacked aeration stripping trays. The stripper is a Model 31231 304L SS Shallow TrayAerator (STA) manufactured by North East Environmental Products. The STA trays and bottomsump will be dissembled, pressured washed, cleaned and packed/secured for storage. Thestripping unit will be reassembled onto a shipping platform and labeled. The blower assemblywill be removed, lubricated, and packed. The flexible couplings and hose clamps will be packedwith the blower. The operations and maintenance manuals will be packed with the associatedequipment.
2.2.3.3 Stripper Off-Gas Piping
The stripper off-gas piping will be removed and discarded as scrap metal. All valves, gauges,
and sample ports will be recycled or discarded All equipment placed in storage will be
2.2.3.4 Effluent Transfer Pump
The effluent transfer pump is a 5 HP, 460 -volt, 3-phase direct drive Goulds "5" series singlesage centrifugal pump (Model 3656). The effluent pump will be flushed with fresh water,
8

99418
OU 8 Decommissioning Plan, DSCR
drained of fluid, lubricated with WD-40 or equivalent, secured to a shipping platform and labeledfor storage. All control floats associated with the operation of the effluent transfer pump will beinventoried and packed for storage. The tilt float switches (Warrick series Type F) containmercury and will be disposed in accordance with appropriate procedures, if these will not beplaced in storage.
2.2.3.5 Effluent Piping
All effluent pump piping will be discarded and recycled as scrap metal.
2.2.3.6 Vapor Extraction Blower (VEB)
The VEB is manufactured by American Fan and is powered by a 10-HP, 3 -phase, 460 voltmotor. The VEB is coupled with a liquid/vapor separator from moisture removal in the vaporstream. This VEB and Separator will be packed separately. All integral switches, sight tube, airmake-up valve, vacuum gauge, throttling valve, magnehelic gauge, and manual sump pump willbe checked for proper operation. All functioning equipment will be inventoried and packed forstorage. Integral piping that is part of the VEB or the air duct control system will be placed instorage. The VEB will be lubricated, secured to a shipping platform and labeled for storage. Theliquid/vapor separator tanks will be cleaned, dried, secured to a shipping platform, wrapped inplastic and labeled for storage. The sludge pump will be flushed with freshwater, dried,lubricated and packed with the separator. The inlet filter and make-up air filter for the blowerwill be discarded.
2.2.3.7 Air Injection Blower
A Roots Rotary Lobe positive displacement blower Model URAI-53-3-255 connected to a 25HP, 3-phase, 460-volt motor and was used for the air injection system. The galvanized pipingfrom the blower to the well field will be discarded as scrap metal. The inlet air filter will bediscarded. The inlet and discharge silencers will remain with the blower and may be disconnectfor shipping. The blower will be lubricated, secured to a shipping platform and labeled forstorage. All integral gauges for the blower, the air bleed valve, integral piping and the throttlingvalve will be packed with the blower assembly.
9

964 187OU 8 Decommissioning Plan, 116CR
2.2.3.8 Main Control Panel
The main control panel will be disconnected from the wall of the equipment building. The panelcontents will be inventoried, labeled, secured to a shipping platform for storage.
2.2.3.9 Equipment Building
The equipment building will be cleaned. The equipment building and its ancillary components(heating unit, thermostat, etc.,) will be reused. If required, the building will be moved to anotherlocation as specified by DSCR personnel.
2.2.3.10 Vegetation Plan
All disturbed areas will be graded level with ground surface with similar materials. Ecologicalenhancements (native vegetation) will be implemented, wherever applicable, in coordinationwith DSCR personnel.
I0

964 188
IC - - - - -O
C~~~~~~~~~~~4 O0
~~z v z 2 = * c C~~~lo03~~~~~~~~~~~~

964 189OU 8 Decommissioning Plan, DSCR
ATTACHMENT A
SYSTEM PHOTOGRAPHS
n, ,

$ SM~ NJ PHI(FO( RAPI I s
",. ~I. hIt~ AS\M>I;, R NI R .\OI WN 1 (ONt IWI I.NF.

iNULI I EN] %\I) [[H.] IEN I PIPFS 14) fIR..~F.IIKN I Sill[I1
LI I I) ID

5164 jq�K11
S� SI I "I VI I (I OG It % III k
I
11
\ I t
II
I
I
II
I
I
I11
71
I
UR s I IIIIIIIIIR fflmk I R

1k~~~F'IiSp9
S) SI * VitI'PiIt l IS *IA ; V .\is
m wo&~'i~'An t~l U

'V~~~~~~~~~~~~9~19
>1~
L
at

984 1g5
ATTACHMENT B
PIPING AND INSTRUMENTATION DIAGRAMS

964 196
4 33 27
olINNIYii/io Mh I A

964 197
4 33 28
WLS-1I
FOUR CHANNEL LEVEL CONTROL
Lic -C )4E~~~~I N
ouu awaaan na
a"03 on
-- I
L IWID/VAPtl#SEP mliojmr Il~
AERA1UR SUMPMI ILOAT I
AERATIR EFrLurNrI
AE~FRVArDR ErFIrrun~pPUMP [IF

984 198
4 33 2 9
gal ~ ~ ~ n
j ho VgjI I I I N
II~~i II a mA~~I

964 199
4 33 30
--- - ---- - --------~II
~~ B ~ L

964 Zoo
433 31
Ii;I u!
�UE��J Ii I n�JI , a;; huhH H'
It
jil
I "'
N 'a
It 11�II ii
,It I! jilliI !I �
141
*9 S�LIEJI IIII
U'
a,
DThl 00 00
0 0 0 w9
I' tiIiI 4

964 201
____ 433 320 1"C - -E14(v jiliwlill B.1.-' ag - *.jI.ns. 5I I -. g -tZtjs!�Jn�
- I.ao �4.4 1-�
N t.�..dI... I V Ug vii U
no' r�A0 I
I4.4 5 3
-I � H-J ii. hi0�4 I
-J
- "Iz-II.- 0- 0.ti.�o ;�
C-ic., 2-4 -
Lu--Li
Z�3 vsIo
a LI
I
j! *
I I Ui *s' ,' , It?
p * £bit iJ
iv I
rAm liv 'pI I - HI �1 �I) - � EU S
�W01U ICU flh�IW-� * gj

964 202433 33
E me~~~~~~~~~~~~~~~~
115 -1
L--
I~~~~~~
L ----------- ---- ----

t"~ Ihlt al jti'; ~'~ li994 203
till~ ~ ~ ~ ~~~~i

964 204
aIi
I II F�I I z 'I
h1 1 plaitWI I 4 lId I K hi
II
�;!� �1!� 1
I
-J
C
I III
t II I
I; A, Iii0.
hI'
nU
I
II I I
S
iihi 4

964 205
ATTACHMENT C
WELL CONSTRUCTION DETAILS

96420
I ~DUAL PHASE EXTRACTION WELL INSTALLATION DIAGRAM 45 16w Fild Representatrve CGrnyt' & CrotQ. PoetNm "FRO3 rc~A. tM
hnCornrateo, P*Aerp~n EJW;,erOIV~0tM.11 Dr~ 4 proiectl No. lIOc&N.3lt1 Wdl
rodSurfae. Elevationwa wo -2(0ES-
Top f Screen Elevation~ Date 1______________meI__1__
ReenePoint Elevation
SlaUC Water Level Q. 24 Hire After Dev.)X CVEMe"s From Relerence Point (Date/rnm.) POEtV
Dnilling Tectruque JAYJ1kriU) AM 114..ŽA<SSPOSTSAS3Auger/54t Size And Type -ti42&212., i2 .fTIjKf
Borehole Dinamter A -. v
Scenhiaea CoAt4ifitJ-,f L'3fo 5tl C'OManulserurerbn -
Screen Diaee O . SltSz...fSo.
MeeorMateral %W ~LI 'A Tht V43eManutactu~reir
. wlo il
R~ser Diameter .Jg........Type AFiter Pack Ct"S~Aigf~nj&
FallterPas Manufiactureir Tfl.k4rsa rvc TOP O*
Senterwe Type 3 g Yer9ougr.;VsQ-Maulctifrer fl-l0 t.dtt~
i-vlypo '30% Soal,a Ste,*o'vta Sw,(s>GS -
Manutacturer 4%4-~'ti *m. ~P0FPLTER PACK
Amount Sand Used 60SO 6o"3 TOPOPSCREENAmowit Bentanite Used (Seafl al, TOP kO*Amount Bmntonite Used (Smout) ,4 kk SCREEN
AJTounfl Cement Used (Grout)---J ~~
Dimensions 01 Concrete Pad ~ K 3' y L4H
Depth To Top Of Bentordtit Saal (fig%)
Depth To Top 0aiRier Pee (Bg) A'9^-.. O7*0BTTOM OF BCRUNP Z DDepthTo Top 01Screen Secton inroads(fgs) 2'SECTIOSTHREADS,D9PthtoTop0fScrwenc8gs) - 11,5, k O
Depth To Bottom Of Screen (isp) it 2. B' S E A
Length Of Open Scemen Al9. 3' RVOT m To~ ALL MEASURWEMENTS IN FEE-T)
Depth To bottom Of Screen Section Threads; (figs) '2'IW. ~lRt *..OOS
Depth To Bottom Of End Cap -- 2H-' mfEwrOIe .s ~TR PACK
OlDep Of cnng (Bgs) rd26
lIP ~~~~~~~~~~~~~~~~~~~~~~~P el- Rev. 51fS

964 207
4 52 14 7
DUAL PHASE EXTRACTION WELL INSTALLATION DIAGRAMLaw Field Representative tA y Prqject Namet tscig MAT Tfeo6&i4-.g 'Sfudt
Onllng ontactr ~ae4 rptv~ ~ . b "~ Protect No fl0Lc-flfl` WoNoGrownd Sudnse Eievehion Wall Loca______on
Top Of Screen Elevation____________ Date L2 I Tim a ..-. rim
Reference Point Elevation
Stani Water Level (. 24 Nns Aflte Dev.I)LOKMeam From Reference Point (Datefrim.) POETV
Auger/Bit Site nlye '
Scrhoi~untior'- 17.25"
Screen Material ( '~, ~0'..'tu $~P-e l%. HO aVC.AManufacturer O:'.Yk c, 44 ~'4'E
ScreenDaee .... SoSre02"
RiserMatena O~JY \. Mrtrz'.
Manufacturer
Riser Diuameter (A"
Type Filter Peck C~Lon--.iSc. flt l-radation '- n A
BENTfrNrTE SM]A -
Bentorute Type 3"Bro~ .~ 1 (w.-vCMarturacwtorr -lo ri~ C
*gj'Men~t Type (S51vwr GroA4 ttb Solta-5 B&+s SManufacturer fl.A'e's TOPOFQ .OC
Amount Sand Used Sol,)S lco-k TOPOtFa4SEC~JhM
Amount Boerionde Used (Seal) TOP OF * . . s c aAm ount Bentonste Used (Sm tO 0Amount Cement Used (routa) NAt- *, A
Helght Of Stadosp V
Dienios f onree-a 3')t3'x Li3
Depth To Top Of Feuorit Pack (Bgs) -OMPAMSRE
Dopth To Top of Screen Section Threads (Hgs) SETO
DepthTo TopOftScreen (ags) 13S 'VO
DepthTo Bottom OfScrn (BP) )____________ D wLe g~it Of Open Screen 9.3l if VT 1 CL ALL AfEASURBIEAITS IN FEE1)
Depth To Bottomn Of Semen Section Thrmead (9gp) 2Z31 WCOMETE . *GROUT
DepthToBottom OfEnd Cap ZS,111TO1,1E FITERPCTotal Depth Of Boring M;t BmB.se
Rwnwks ~~~~~~~~~~~Inspector-
__________________________________ Descrepanoer:
Chedced By. Date: A-SZ.
HF DIF~~~~~~~~~~~~~~~~~~~~~~OE Wells - Rev. GM9

964 2~
452 148
DUAL PHASE EXTRACTION WELL INSTALLATION DIAGRAM
Reid Representative CPnoer B ame O9PAg WSI -Trl't4A61o1.* -)4%
tlmg Cntracor V~tA~r~t~tW~r~if~tdtl ~Prowec No. %%C-( 30 WolNo. 1r-
Growid Suwiace Elevation __________ _ Wall Location bX2L4) ie
Top Of Scramn Elevation ___________ Dat 12-(TimeRelermnce Point Elevation
Static Water Level Ci. 24 Hns After 0ev.) WL OEMess From Reference Point (Date/Time) POETV
odflingTechruque J4011tL ±S+ AiiwietMeg, rsitSize And Typo ASTKU A
Borehole OwMenler ~11.25"
Screen Maternal -CoN4:~Sbd bLJi~ &k 4 cT,
Manufacturer *¶ c-l
Riser MalenuiSal *c~ d v~ o~~'Manulacturor
Riser Diameter
Type Filter Peck Cts' t,.ca te& S atonIZ2AFibter Pack Marufacturer flA1 v mevn,C rrEN.TONNTESEA
Bentonne Type 31i'BWnVw;b C0Jrz SwrF \
Magwlactjrer " ~~~~~~~ '~FILTVI PACK vAmount Sand Used Z5?) 5o A)55 O
Aronowt Benti~Me Used (SeeJ) LI') Sit" 6% ' SCREENAmount Bentimite Used (Smoug)4 ba
Amont Cement Used (0mut) WJA
DiniosionsOf Concrete Pad ________
Depth To Top Of Brintonite SMw (Bg.) B~ OiTTOMor
DepthToTop Of Fiter Pack (gs) ItM F CEN CU
Depth To Top Of Screen Section Threads (BP.) A. 'SECTION I1IRES
Depth To Top Of Screen (Bgp) SC~~lO
DepthTo BottomOf Scmmen(Bgs) 233 WTOO+4
Length Of Open Screen ~ 93 NTI M L ESR4NSh ET
Depth To Bottom Of Scmeen Section Throead (Bgs) CO NCR~ETE GROUT
DepthTo Bottom Of VWdCap -eSM MF-APC
TtlDepth Of Borling (BPt) I65
OPE weii - Rev. SAMS

964 209
452 149
DUAL PHASE EXTRACTION WELL INSTALLATION DIAGRAM
w Reid Representative Gt-11rc, 13rofProject Name, bScpR CVX- Trw~chiS
Outling Contructor Bimr ar,,o D' Kcaz Projecife iIO50-(Pt3"1 W611en TVLa
GWound Surface Elevation ____________ Wet Locnon Cu.-? CAMJP•&\!
Top Of Screen Elevation Date ____ ____ __Time___ Ott
Ref ounce Point Elevfani
Static Water Level (~ 24 Mms Alter Dev) IOKNM~ass. From Reference Point (DatWeime) WL o
Auger/flStze And Type ... 2AZLL&2XTA±KUPforehele Diameter A- Il. 2S
SretesnMatonialOMrWSWrp 5 .A PUManiatte ¶tegcEes.PAD
ScreenDamtr.. a...loSze...taZ.
Manufacturer
Amser Diameter _ _ _ _ _ _ _ _ _ _ _ _ _ _ _ _ _
Type Filter Pack ~GaaonJ~2.Filler PadckfMnriacturer T1- IP'Sect. re
Bantante Type 32I~trt a Su tq
Manufacturer e - P~~~~~~~~LTER PACK
Irta Swid Used T20) SREE
AIom Bertorches Used (Seel) Top0 SIAaotlertionoe Used (romui)i- SRE
A~mouznt Comene Used (Smout) k~lq
Height Of Sldcup
Olatensions Of C-oncrete Pad 3'x 1k(
Depth To Top Of entonneSeat(ags) lo________
Depth To Top OfFilerPadck(Bgs) "43 MOFCEE 6CA'.N
Depth To Top OScreenSecdwThmeads (Gt) SETINLH.W
DepthTo Top 01Semen (Bgs) 9'TTO.O
Depth To Bottom Of Sceme (Bga) ; 91ENDlOCAP
Lengt Of Open Screen '9.'PTOSAEALL AEEASUREIVENTS IN FEEl)
Depth To Bottomt Of Sceme Section Threads (Egs) A- 5coNCETE E*anourrDepth To Bottom Of End Cap 2 VP EJ IWCJITE .$FILTER PACK
Total1 Depth Of Boring (85g) M2& MUAA.RemaucsDriller.'tt
___________________________________ C~rheclced Sir- L olj..
OPE Well -Rv.12

964 210
Best Available Copy 45 5
Dottig Cenmctr 1~cW~r ErrcNcrLj:iL>~'' Prqect No ~ZiC -Lr31 1 ~jWell No.Ground Surface Elevation ___________ Wag Location 0'-A- 2 (,AQFr ~5~'ATop Of Screen Elevation B_______________ ate 9 Tme I /Reference Pwrnt Elevation
Stati Waitr Level (~ 24 Mrs Alter Dsv.) ~ ~Mass From Reference Point (DatultrimeWLLCOE
Drillng Technque ~ c AijSds N Auck.AIRPOSTA'3Augerl/t Size And Type .. AiSlIiKT
Borehole Diameter P1215 IScramn Mateinal :t-d r^ .st sm&t -I-0;ThJ(
Manufactuor PAD__
_ _ __ _ _ _ _ _ __ _ _ _ _ _ _
Scramn Diameter '2Slot Size C2L.C-- r"Riser Matenrialj \N C Cm Cro.c'Uanulacturer ""C.
Riser Diameter __________________ ______
Type Filler Pack( 6& ii t AFilter Pack ,CC T - TOP OF -
Bentonito Type 92 .,nonc Q2 (Xr V>
Manufacturer TOP OFS- . r
AionotsandUsed L12' 50 'Of S ~ OP OFeiSElCTION'RAD **Amount Bertorute Used (Sea) LoS5-\ahS. TOPorArnount BentromteUsed (0G SCREENS. *S~
Amount Cement Used (Grout) WA
Dimonsonsflo Of conicrete Peaul.c x
Depth To Top Of Dmntonne. Sod (egg) h!. "
Depth To Top Of Filter Packc (Ugp) GOMM Of A S Fl
Capth To Top Of Screen Soo) mIe (Bs) ~ ~ dhsn
DBPti To Bo11om Of Screen (BP) 2' S ENOC*P
L~engt Of Opmn SceenA ~ 3' WFVDepth To Bottom Of Screen Section Threads (Spy) z2A.5WR CBENTOME G PiIAPOevth ToBosthanOftEnd Cap I t ETI2FLE1PC
Inspector. -
Discrepancies: DEWU-Rv
hchned Br. .- . . oteZA £ A-

964 21!
452 15
F ~DUAL PHASE EXTRACTION WELL INSTALLATION DIAGRAM
w RledfRepresentative LtN Ges-PrqlclNam. 1)C1~i.l5onsQ angcoactor FQ &FrA 7t:SO'rgnnm Pi Dr1ieA I rmjectNo. lioco4-GrSW7 WCllNO ' T___- __
Groumd Surface Elevation __________ Well~ocabon r-gC-9Al.:5rt7)
Top of Screen Elevaucm__________ Date I 1P-9 (.r Tmned222
Relerence Point Elevation
Stati Water Loelel (, 24 Mrm Alter Dev.)LONMeaas Prom Reference Point (OatetMme) POETV
DnilingTflhflique $r tA AIRcvv' ANwPOS(%45A>Auger~'9t SOLe And Typ sn 5"KUP2 fA
BorIihaliae~tser 12.ZS"Scemen Matwnal Vt-tlXMC Ar10 c L4r- pt~ A
Mafltuactluret 'CCscreen Diameter ... slots Ize
Riser Matenial Ta C 4 M.C 0Manufacturer '
Riser Diamer
Type Fiher PackCe*, .'I~cC G~,on, 12Z-90FflherPadckManudacturrer nhil-r< SENONITrEA
Saitonne TypeSsz e'stxCp rV u
Camallye30 ?' -cL-, Beer"lj $t ,Le'i %, (ISawr f-
Amowi t Sent~d , Used (S na ) sc a
Amwznl Bentonrte Used (Clut) 0
AmwtCement Used (Grout) A
HetgritOf Sbcoup
Dimensions Of Cocreete Pad %. 3 H a
Depth To Top Of Bentonite Seet (Ag.) A,9.6 BOTMO
bepth'to Top Of Mifter Pack 9gs) ~" 11.'6% BTOOFSEMCRN
Depth To Top 01 Screen Sectin Threads (Sqa) I 5 5 S ECTIO 14RC06JLD
Oepth To Top OfScreen (Bgs) - )(a,'
Depcth ToBottomOfIScreen (Bgs) '2S_____
Lengt Of Open Screen - g 6NrT C.AUMAUSE EF
Depth To Bottom Of Scemen Section Threads (Bgs) '~ s[OR COICREMt GR QOUT
Depth To Bottom Of End Cap, ' 2:275' EE] ENONTE ' FILTER PACK
oaDepthOf Boning (BQS)- O~~~~Diler. M' 4 ?""
______ _____ _____ ______ _____ _____ _____Inspeor ~ *
P~~~~~~~~~~~~~~~~e~e 9yO PE Well - Rev. D

94212
452 152
DUAL PHASE EXTRACTION WELL INSTALLATION DIAGRAM
nttg~cittCW e~bS ~ i~QA¶ tt4Aa~ Project Name MV 0 WE"kti ""o. bP1
GrudSurfac Soevation _ ________ WS Location U- (AOPi4PSy
Top Of Scremi Elevation___________ Date Thezo-9 tD
pteference Paint Elevation
Staic Water Level (~ 24 His After 0ev.) OIN
Meat From Rolerence Point (Diatisfm) POETV
Ontig Tedhirque A NETO OT 3
Augeoint Size AndlType L
Borehocle Diametar r
Scream Mate nalManjutaciurorX,
Screen Diaeter.. ... SltSz....L2...
Ahser Material SAPOlnt~l NoP Cx (msttooMarmitacturaf 1
AM er Diametler (___________
Type Ruier Pac SI kOmadlatbon -_OF
Filter Pack Manutactu irer 2e"-srl
5eintonwite Type -enrrtO~h h-
Manufacturer r Q-
Asnoutf Sentarder Used (SmGwq At~Amount Crnent Used (Grout) \
Height CM Sbdcup I'26
DimnuensonsolccncretePed-~ t Ng t.
Depth To Top Of Bentordtt SeaW (Ogs) 9 qBoptToeTop OfIMar Paek (Bam) OCAOFS MCEM
Depth tTo TopoCfScreen Sects rThreadisp(p) itsScnrAI
Depth ToTop OfScremn(Sgs) 1 87MO
Oespth To Bottom 01 Sremen (isp) END T C CL"ALMASRAf U E?
Length Of pen Screen
Gooth To Bottomn Of Semen Sedon Threats (Ogs) CONCRETE *GROUT?
Depth To Boittom Of End Cap. -21.5' BENTCNITE FILTER PACK
Total Dwpth Of Boring (Bgsj- " 9' I
iDdkn ?.." wn -.
____ ____ ___ ____ ____ ___ ____ ____ ___ ____ ____ ___Discrapanotss:
Moidrad By:. A Dee II-
HF DPS e e.LD

SEU 213
45215
I ~DUAL PHASE EXTRACTION WELL INSTALLATION DIAGRAMI" t~F~ed~enannv.~-~~--? C040Prqlect Nunsr*ntc CMA-r..;,$4diling coenctor l5eaf6,o &rwr.wtek d~ PricleotNo. 1tioO-Wr3119 WeDl No ;P?
Ground Surface Elevatio ___________wooLocawn Ot(A1JP•*s ____
Top orl Screen Elevation _____________Date timea 11009AReference Pint Elevation _ _ _ _ _ _ _ _ _ _ _ _ _ _ _
Stati Water Level (- 24 HMm. Alber Dev) WU OEMe" Fromt Aeference Point (Dalet~nwm)
Augeriflal SaIO AnRyp &ZOUR5jf~3
Borehole Diameter _ _ _ _ _ _ _ _ _ _ _
Screen Matenial Cc)-'u PADm rLNNMmiutact-urer r9k
Screen DiarneterSlt64.srZ
Rater Matens&ed&i ic acotManulacturer "" -AP C
Amer Diameter __ _ _ _ _ _ __ _ _ _ _ _ __ _ _ _ _ _ _
TyeFilter Packc~OLC A~unaI.t
Bontone Type ax2 Vlv-etC~s6 w IU
G Type SOM lst6e.-bkvv1Manulachtuer "1* I'r;!
Amousnt Sand Used 'S\ n~~o~. TOP OF SCREENI- ~~~~~~SECTK*h TFl4EAWsArnowg Bentdrinie Used (Sees) •15 REje TpoAmoutnt Seantora Used (Grou)
Amount cemnert used (Groct) - NA
HeightnOf SIckup As.
otmenrsionaOf Concretep Padt¾cVie ' Ct
Dept To Top Of Bmntanite Seam (5g.) A.0-
Depth To Top Of Screen Sectdon Threads (BPg) 19SCC=IRf
DOPth To Top Of Semen (Bgs) ao______ _________ _FU
Oepth To SonomtOfScauen (BP) DID CALength Of Doe Screem "-ol Z'~ ~ D~L orosALL UAU&DSEET)
Depth To Bottomn Of Screen Section Threads (Bugs) C 24O NCRETE GROUTDepth To Bottom Of End Cap nFTRPC
ToaDepthOf Borig (Sg) IUD~~er towe
HF ~~~~~~~~~~~~~~~~~~~~OPE Well - Rw. SM5

96 4 2.14
4 52 154
I ~DUAL PHASE EXTRACTION WELL INSTALLATION DIAGRAM'S Rid epesntawve Creaoc.,B %o"Q .L~ tA2 tS~ .3U. w
Oulmg~rvrcso BAer z,'tnq\~ PhrieWNo. Weo43till WONo.D9 jGrowd Surface Elevation _ _________ Well ocation tl)IR (A6A ShxTop of screen Elevation Date_________ s .Z.41243k96 .intoAitemence Point Elevation
Staptc Water Level (, 24 Hit After 0ev.)W1COEMeas From Rolerence Point (Date/ilm.)POETV
Auig.(Jail Size And Typo ST~r~i~t~~~.
Borehole DIametwr ~' 1.as
Sworn, Matenial PAD~'os ar~ 6~ 4 PtMmawtacturor rtA Qt -
Screen Diameter A.......Slot size ~OO* :R~se~a~eej ,cieA A .-jj p ?%DC CMjcn\cr-Ps).R g rMan teraltrtu
Riear Diameter _ _ _ _ _ _ _ _ _ _ _ _ _ _ _ _ _ _ _ _ _ _
Type Filter Pack -,e\ Oramdnwt - TPOFitter Pack Manulacturor 2521,sfence, -r Ar BETONIOF A1
Bentenit Typo 3)2" ZeA4.1+ Cko (&uvV
Manufacturer ~Lv-,TOPOSR.TER PACK ,.
Amount Send Used S&) 5 o -JO Is TOP OP SCAEENAmamoSnlernlhiUsed(Seal) ?( tcjs~. A SCREEN
Aaontw Bentonite Used (Grout) j fEFSAmonot Cement used (Oroit) N k "
HeighlOf Sldckup /'"..*ea 0 ' '
DtmenslonsOfcoinoraetoPad t.'3kSk MDepth To Top Of Bentordte Sea] (figs) A' IcIDephTo Top Of Fiter Padck(gs) 'A .I BOTOM O
DepthTo Top OfScreen SectionThreas ft) SEC2'TIOHREADS aOepth To Top Of screen (Bgs) MS.5
OepI)h To Bottom Of Scemen Sector ThNeaC(Up
Depth To Bottom Of Screen (ogs)m Thra' 23 ) T OAP U. GRW_____
Depth To Bottom Of End Cap '- 5 BJMWMFIT PC
TOW JDepthOf Bonng~g) t*2"j
_________ _________ ________ _________ _______ nspeden
HF O~~~~~~~~~~~~~~~~~~~~~~~~PE Well - Rerv. £195

964 215
452 1 55
DUL PHASE EXTRACTION WELL INSTALLATION DIAGRAM
wFlew Representatie PotNm M A
Contracto &A44 =!a Pqect t.__________ WeflNo _______0
Ground Swifaco Elevation wudtr -( 13 52 .
Top Of Screen Elervation Dt Tra15
Reference Paint Elevation
Static Water Loved @~24 Hire After Dev)WL OEMccs. From Reference Point (Dateflm.) POETV
Drilling Technique lbt~j' ' ~ OT 3
Augerililt Size And rypes,--F~~ T~
Borehole Diam'eter tfl*.
Screen Mateinal &,,: ADe5 . oTiMMa .utIa = Irar '-T1 WL PI4*-v t - , l
S54js44t'S. rfc9Swoto Dammeter Slot Size -- 2,22'
Riser Matenial L46W S P\C-
Rister Diameter t
Type Filter Pack ~AAh~S54Gaain t-o TPOFdlter Psack Manufacturer tr TOPS Sr OF
Bentortite Type 39 ~~~.4 ~~ s (k,¶ 4Uomefatro Type
L~e~nurn Typo nLr. Top )Manutacturor FU6-r~jrt.TORPACK
Amount Sand Used TOP) 9OFj
Asnotnt Cement Used (Grout) M
Height Of Stickup ~-5
Dlrmensions af Concrete Pad ~k ~ L
Depth To Top 01 Bentornlte teal (figs) 61
Depth To Top Of Alfter Paclk Cfts) SRE
Depth ToTop atScreen Section Threads (Bps) "' TIO
Oopth To Top of Screen (Og3). ''o eeormO
Dopth To sonom OfScren (Sgs)____END____ CAP__
Length at open Screen M- 1,1JT TO ErAtS AUl AEASURSEDP IN FEET]
Depth To Bottom Of Screen Section Threads (figs) ;, r WI CONCRETE GROUT
Depth To Bottom Of End Cap 2-2 %L i BWWNYNIM &. FLYER PACK
Total OepU. Of BSwing (Bgs) Dr/ M %"ve.A tra,~b~
Inspector.
____ ~~~~~~~~~~~~~~Discrpances:Checked Date.~.
NF ~~~~~~~~~~~~~~~~~~~~~~DPIE Well -ARe. SMS

984 216
I ~~~DUAL PHASE EXTRACTION WELL INSTALL~ATION DIAGRAM 45 saW ieWd Representative l~r~ .. OtOO Proec Name tsg- O WtcoA-
* :Ihn Contacto 219ALo~,,I -AProjectblo.1% t-G-31fl1w WI -Ground Surfhce EIevnton __ _ _ _ _ _ _ _ _ _ Well tLocamn Tt ' Pem 5 .Tap CM Scramn Elevation D____________ at. ....i& j~j -Tin. ________
Reference Point Elevation --------
____________
Static Water Level (' 24 Net After 0eV,) WL OEMess. From Reference Point CDatsIjmTtma=
Drifting Ted'iqus ARKO~O OTAugers'9a Siz. And TypeSTC ABorehole Diamerter A'f
Screen Matenal n~vi LJrc,~ 56k3-jOManufacturer rNo PA
Screen Dimenter Slot Size 0QP
ManufPacturefarre ~TOO
Tyen FI Tyer W4TOMT! EMI -. -FManr Pack M r TOP OF__ __ __ __ _
4.~~~~~~~~~~40
AmutSadUed T0PO5FGs er4tOfl SgnE[N~~Amunlat B11r1er eu dTTOPoO
Amouit Bantodn Used.. SP.TEROCM
Amun CmetUsed (Grout-)~
Deph ot BrTopitefUsedt(rtout (g)____________ t 4.....TPCAowth BeTo TpnfterUe PSac) (9U)V SoMM s-NAmountr Cepent UScedemu eco rhmads = 95., -
O)4tmensot Of CocrentePad nTh 3Vc sw 9%-11a= A
Depth ToBotto Of BEndtopaeSa fg)- _ _ _-
TDepth ? o Of Scree S(BP) ho~t fl~
Discrepancies:*
OePUTOTOP~~~~~f&!C~~fl(B~~) MCI.6i Br. __ A. Dae e--9-Depth To Bottom Of Screen (figs) ~~~OPE emeRMv.' t

964 21 7
4 52 15 7
DUAL PHASE EXTRAC~iON WELL INSTALLATION DIAGRAM
Reid Riepresentative Q,'uticq B. C~sc. PSOISCI ,N aR e4GA-
gLkflflg Cotaco BeA'f64r E-ntAft.,wnkv t4C 1 Project No. JI -nzA-EL-.Wel~ts No OPzt
Ground Surface Elevation _ _________ Wet Locatisin ruR AM l)
Top Of Screen Elevation _ _ _ _ _ _ _ _ _ _ _ _ _ _ owe 3 - 2j ( -... rmRMOWMeCe Point Elevation
Static Water Level (' 24 NMr. Altos flovpLCN
Mess From Relfernce Point (DoatmmflWLCOE ROETV
DreligTedhimque HoI6AnAI PU4ETIAnr (NSAIAugr/St SzeAnd Type
Borewtel Demeter '124
Screen Mateia Cmn* nuo`5 L4)ceSO" H ?'QC, A
Uanufacturer MeMnN ~r~tef.sScreen Diameter _________slot size0,2
RiserfMutenala4AI -o9CCManufacturer
Riser Diameter (
Type Filter Pack I SuKCSflJ0rTOPoo OFZ
False Pat Manutacturer flr.tr C. -..J a.TPO
Beontanite Type ~a9not Jd~(w 1'
Amount Sand Used =AFotb?.I
Amoifl Bentonitet Used (Smut aC. E
Amount Cement Used (Srout) MA
Heiht Of ShtkUp ~
Dimensions 0lConcrete Padr'3
Dopth. To Top Of Beonlte~t Seal (figs) AjCI
floth Te Top Of Rilor Pack (figs) "9' BOTOMB1:W4EE
Depth To Toep of Screen Section Threads (Ogs) ~ 2 ETNHM
Depth To Top OfScreen(Bs) BOTIDtS
Depth To eottom Of Screen(D) A# . ______
Lengti of open Scren g3 TOWCa AA ESUE
Depmh To Bottom Of Scemen Secton Threads (Bgp) FOR.' ! COWJCHTE~ GROUT
NOTo Boto Of-Ed CpN' oBEtrOrTE t.. i LTER PAcK
1 1Dslkct MtcSt.s____ O~~~~~~~~~~~~~~icaparims:
Chedcead Byr ~ Dlate
DPE Wel-Rev.W5X

964 218
AIR SPARGING WELL INSTALLATION DIAGRAM 4 52 .158
Ddfluotgmutato '?t&FtA FCw. rwtJ lrWAI t Pr,*c:1No. HOW40a2I11 Wel ..
Grountd Suan ace BElevaon _ _______ Was Loato DUi (AIJ %;+e
Top of Scren Eeavaton _______________ Date 1.1J/24.te.....7.... Ti..me. I40o
Rete rena. Point Elevation
Stafte Waler LWve (~. 24 Nrm Allte AM Nv.)N
O111ng Techniqu A40&kr- 5iSA~AugerlfSihzentd: Type ...S'D...~
Sreftn Mask!ia rat, A~r, $n&'~b.. 4Manufacturer 'tiiT
ScreeOn Daeter Z _Slot es 0ze .0
RiserMateria hsl,,dJUh Li ThZ S u QaIMantslactjre r Er 'v1 ~
Risr Diameter 2Type FIRSTePack Clo S11 =N Grdati -J.&..L. iwO,
PiljerPadcMsnufaeturer br-VlttSa Q, - uwrsni.kenonito Type T.2 'Be
Maiulactarer YW-,Ar Q'jin ,R
ManutacL--r W-a~~rWE ~aa4- ('n TOP OFLYER PAOCK
Amount Sand Used H) tol bzc2. TOP OFSREI ~~~~SECVIOJThRMDE z :.
Amount Beotonlie Used (Gs])v Z1 o, 3O . TOP OFba A~~~~~~~ SCREENAmowit Bontenide Used (Smuo) :14to~k-1
Amount Content Used (Groutni 4L)bj-
Height 0fStckwp 2-5
Drtnmmmn Of Concrete Pad. N'A
Depth To Top 0tBontonfle Seal (Bg) N
Depth To TopOf Filtor Faa(8g3) SCREsna ~EN
Depth 1.Top Of Sceen GeconThreads (SBt)_k .Depth To Top OfScreen (Bog) eo 3 oTTmjou '-
Depth ToBottomOfSoormen M )__________ 940CAPr. ______
Lengt Of open Screen 'SI(NOTTIDSCALE ALL MEASUREMENVTS RiFEE?)
Depth TO Bottom Of Semen Section Threads (Bgs) - COCLM =GR~
Depth TO Bottom Of End$ Cap 2___________MI 5 BMTONF11 M$~ FLTER PACK
Tow Depth Of Bering (Sip) -25 ~Dn -rj
L ~~~~~~~~~~~aChenicd Dr. q Doe
- ~~~~~~~AS2 Welt - Rev. sm9

964 219
AIR SPARGING WELL INSTALLATION DIAGRAM 452 .159taw Reddfeprasentnv. Qrrjgz 8 Q-oPprjc Na ThSR -CU TrrEG4cL6 ,1i±5
Gonmd S411acaElfwabo ________ WengULon V4ykX (AJJ 6&-0~TOP o Ofe Scren nation_______D____ at. ruZ(.. tme
Slabt Waet. Leve (.24 His Afer Dev.)A ICIIMeas From Referenc point (Date/Tune) SCUDftfmgTechivq 44SA
Aurfdlil Sir. AM CONRET
Borehol Diameater ?.2ScreenMaterie 12xr.~ $Ssec&-a Sdk HO PU
Malurfacujrer rg& cScreen Diameter Slo so 002INaerMatenal SCKOA.L '4 'Put U$r mel'):'
Mwnulacturer r, r 'ie '. -.
Riser Diameter 2.:zType Ailter Pack S-
AFiter Pack TOPOFfGT -B
Santomie Type 4etrt .$Ls r j'PCementType & i ~ Y a ~
Monfactarer ffU v. .c. 6n'r-¶-1jjj TPOP OFSREAMcv~nI EagwolieUsed NSe) 5O 0 6a SECATrEAS TO OAi~notmt mantwtt Used (Seau) t) so'SCREENAMOuni Cementtt Used (Grout)- r, .t
Height Of Svciaup 2S
Dimensrnsor cnrte O008 Pad NADepthTocTopot Bentonite sew jftg9 1 1Depth ToTop 0t Fiter Pack cep) 1II ESTO O
BOTtuOM SC10 ¼ REEN
Dep~t ToTop of Screensengn Th9eadsB(BTT)M
DaPth TO80ttomOf Scveen(Ss) " __1_ENDCAP
DePli TO ScuOM Of Screen Section Threads (figs) OONC a `T mIRirrDepth To Boftm Of End Cap 24. ~~~BENTONdtr 2O.FLTER PACK
Total Depth Of Aonng (Bigs) ~Remarks ___________
L ~ ~ ~ ~ ~ ~ ~ ~ lCece y ~ Dz."HF~~~~~~~~~~~~~~~~~~~~~~~~~~~w-

964 220
LawlAdd Rpraawtuv cQ=50= ' r k ®-30:p Pruojectame bt Re anulOmaidW Surface Elevationn________ ocatio 01L4- 3,iRP!STOP Of Germe Elevatin____________ ot riz~Y& me -L BooRaaron.. Pabt wEyoit____________
Staft Water Level (324 his. After Dev.)AMJETNoas. From eetrence Point (atafllm) TCU
OwlimgTecevgqu. 1Abt11o $ie. AU r(M AAU"UraSte AndT~s '-tsAr M
Borehole Dwminter 2
Screen ODamete &.... Solo sit. ~Rater Malates2~ 'SCAOLA Se P
IMUantularo r r 14jitRiser Omannter _ _ _ _ _ _ _ _ _ _ _ _ _ _ _ _ _ _ _ _ _
T w'6 Filer Packc Cm, ;I 0-Afier Pack UM~anurewr .. flMce~t •
Cement gType ':3 fCA
Amoutm Bentonns Used (Seal) TOP OFAmonwt Bentordte Used (Gru
7 SCREEN m B'm
Amout jCemen: Useod (Grou) 9
Height uoPJ 4.2.61pOgmnonuions Of Concrete Pad AADePth To Top Of Bentonito Boat (Ug 32..DfAt*To TopU01Rhor Pack (Bg) A,/ ILjTOO
DepsiTo TOP Of Screen Lens Thinads (Sp) ... aZ2.........
DepthTo Top ofsem..n (9) '-2O. 3'Dopes To Bottni Of Scemen (Bgs) OM CAP___ ~Length ow open Screen 4 g 'PTTofXALLU AUEENsI ~lDePth TO Bottom Of Swooen Section Threads (Bgs) -Zn:L . =NAE1 ' RUDepth To Boftto Of End Ce0 . 251 BENTOIJI5 E o FILTER PACKTOWa Depth Of Baring (Dgs) "5
_ _ _ _ _ _ _ _ _ _ _ _ _ _ _ _ _ _ _ _ _ _ _ ~ ~ ~~~C ecke By.~ R rreRomance ___________________________________Rev__S

964 221
!1117 ~~~~AIR SPARGING WELL INSTALLATION DIAGRAM 452 161LablWR pRpresran arin'os%7 B . C d Name scr R cxu W TrwfMh;I1% tdDriig cwac RMr>r nurmenivk D>' Project- t. SI &zBri "Ii Wall NoAGua Srf ase 9Elvation_
__ __ WonLocation - .- ?(AMPZ 376,TOP Of Sccesi Elevenion _ _ _ _ _ _ _ _ _ _ _ _ _ Dame TM IS .Rleaters# Pohlt SElvfcn
Blaft Waler Level () 24 Mmi. Alter Dev.1 I NETOMdass. PFnt Reference point (Datb/flm.)
Augenlfl Gaze And~~~~~ype n=RUEasJf;z51n74
Borehole Diameter Zs
McamuMancCtrurera~t~S ~ hSMmNDacetjr -g*. r oli.o '
Scare Ohiteter 2 ... StSx
Type Frsazn 5,k eeS I~acc. 40 Pct.
R ilter DPa ckmet r _ la__ __ur __ ___ ___ ___ ___ ____e_ _
BentoniteType ~ ~~u~ss~'~jMamilaewurertrlet
Cement Type R~ri+ic,aj I-,~manulactwer
TOn ~n .jrIP
Amiount Swd Use (0 50" TOP OFSCREEN hAmfotzntflentonite Used(Seag)
SGCT4TW TOP OF~Amoint Bentonfie Used (Grou) SCREmEN entt
Amounrt Caeent Used (GrwJ2$9 %o4
DIMISMSIOns Of Concrete Pad WAopth To Top Of Bnonznes W(503) '9 !-
BOTTOM OF SCREENSREDeph T To OfScreen Section Threads (BiP) TSEINWAD
OetP1To Top Of Soa" (1p) " 17 3'Depthto laonom Of Screen (Bgp) "* 1 ZI. END CAP __ ___
Length 0t Open Scree A- %.6 1PrTo7 C AUAASR n WEjDepthi To B0orno Of Screen Section Threads (BUp) "22' Mg COh4RETE .*R0901
Do th TO Bagtom Of End Cap ' 2zz, DVJTOI4E 4'SFILTER PACKTOW DepthO Sag (S) A, 2Z5'1 R~~rnad, DOW. Mke. %rw
- Che~~~~~~~~~ch ads Br. . L. . . . . Date: '- 'I r- V 12AS2 Well - ae". sAM

964 222
I ~~~~~~AIR SPARGING WELL INSTALLATION DIAGRAM 452 1s2LUw Meldflepnoentaven GM'QO.% B . Q~ljoi~ t Prg ect f l nge TY S R CUT Ts- l W
Du~mgc~~ Re~farpEnviroynvvw4cL DrH-Aa Prijct Nao ilcC040&UJ w.IIN-4m.fovun Surface Elevafton____
____ wnocn WUb flU(A-? Ok? tn'rTop Of Screen Ele2Vatn o Z-.TojlPLRelersino. Poit Elevraion
Stalac Water Leve (. 24 His Alter Div)AMeat From Re sen.Iont(DtalPm
Drilling Telinlquje -lo rIIAAUg. dBnSIze AM T mp --. S
floreghol. Diameter tZScreen Materiwl rccmo'SI Sl.aA$ck y) 'PUC
Martilactrer .4' e., A C.Screwn Diareter Slot Sine C o2a;Riser Matudal 9d~suU '-JoWL (s~. eI\
Aiser Diameter Z__ _ _ _ _ _ _ _ _ _ _ _ _ _ _
Miter Pad( Manufactifrer -UI
Cement Type 4 4J1Manufachnere
TOP tCW~n4*f
Amai eitoneUsed (Oru -2 !s cPa evo.Amount Cement Used (Smut Z)9HaightcOfStkeiesp
DU1menson Of Concrete Pad $4Depth To TOP Of Sentorilte Seal (Egp) GdDopth To Top of niter Pack (Bgs) -, rr occrtsae OFDope, To TOP Of Soemiln-Section Threads (figs) IN` BCORMADep&hTo Top Of Swson Cfg) - 193CofltToBottomW cmesm.(BP, END CAP____Lengti Of Open Swoon- q I NOT TO SM9L EAW1WEITSIUV FEE7)DopehToBontonI01Screen Sedan inroads (90 9i Ea.. 0 R cm pMygeDepthTofBottom Of Em Ca 19'or tRPCTOWs Depth (f Swing (fig)Dd.
_____________________ --.~~~D M I -_ .c C')

964 223
AIR SPARGING WELL INSTALLATION DIAGRAM 452 163L*w~llRedtwosntntvw Crott.r, f Cw'nP prow alm prci? OkLT TeM Uk6-ha5,:DO"t Contactor bi- A Project No. ilCM40-e2IEl. ASNOuuwd Guina" Eevaton _________ WonLeeatimnO.1AJ~k
Top of sagun Bevadn owe__________ Dt AVxL2aj9( The. _vIwAM aass ens oElevaeton
SUMt WaterLevel (b 24 Mm. Afier IRINECIO)Leam. From lReterenos Point (Datei'llme) fcu
MOMr/U Siz. Anld TwfI.53.- IQHWS2Z
Screeriliailiejs Thc.*....SloI"ed SO'k wow116ujacturar * te~ 'R-.%' * nc
Screen Dlameter SWo size Q02&16AlssrMateraiaySkot lot NO0 Pic -Q&
Mmuanjasrer tL)� r .,
Riear Diameter Z
Filter Pack MjnumafacujrTh-Arso., iwBentoiteType 3 evCtD~
Manufacrewro sT7
Cement Type
AmW4JA Sand Used S') ~FYRPOAmifmt Sntornjte Used (SOW) Z')6CtoaTOP OFAmfoimtf Bootonife Used (Got 9.N 1 6kCOSIN
Amewgt Cement Used (Smut) z 8S.sA
DO4mensions Of Cacrele Pad MA 4
DOPth To TopOf l~atItesePagck ga9AW%' -. M OF
Depth To TOP Of Screen.-Section Thrads (BO) ciNmse
Deph o oua o aen 9gfl ENACA
Depth To Bopto o4 Screen (s)cio 7haa (80 ME3 &TEg~Depth TO Bottom Of Eend Cap) Su 2Ž1.ILT-pP.
TtlDept Tof BottmO nd (ap) "2'B~DIE ~ FiRPC

964 224
ATTACHMENT D
EQUIPMENT LISTS

964 225
4 33 38
Q ~Equipment List
Item Name Deseriptdon Qty
I Well Pumps Grundfos Reds-Flo environmental duty staInless steel1Submersible well pumps with Teflon scals Modal lOES.Pumps close coupled to 3-wire. 31601460, 2 Hpsubmersible motors. Each pump supplied with 50' ofTeflon jacketed 3-ware power cord. I motor shroud, 5O' ofTefon jack red 4-lead sensor cable, I set of 3conductivity level probes. 30 of 1/8" diameter stualessstudl pump support cable.
2 Shallow Tray Aerator North East Envirtunmenial Products Model 31231 304LSS Shallow Tray Aerator. Unit supplied with I direct-drive, non-ovedloading. centrifugal-type fan, capable ofproducing lS00 cfms t IS'WC. The blower wili bepowered by a 3/60i460.15 HP. TEPC motor and suppliedwdit the following access~odes.c
________________________filtcr/silencer, mousting stand and inlet screent.
3 Effluent Transfer Pump Goulds Model 3656. size 1-1/2 x 2-6 pump constructedIfrom can imn with mechanical seals and supplied writh a5-518" impeller. Thei pump will be close coupled to a3160(46%,3500 rpm,S N p. TEPC motor to produce 160
_________________ pmn at 70' TDH.
4 Vacuum Extracton Blower American Fan positive displacement blower Model SN-04-26 5 equipped with the following:10 Hp. 3/60/460. 3515 rpm, TUFC motor, V-belt drive,OHSA-approved belt gard, blower and motor base,flexble outlet connector.
S Vacuum Relief Valve Adjustable vacuum relief valve
6 Liquid/Vapor Separator 60 gallon painted carbon steel high efficiency liquid/vaporseparator with a 4" tangentially mounted minla, moisturecoalescing elements, sight gauge tubing. manual drainvalve, and hand operated manual diaphragm pump forcondensate and sludge removal as manufactured by ERS.
7 Air Make-up Valve Valve assembly mounted at the system separator influent_______________________port for introduction or ambient make-up or dilution air
8 Air Duct System 4' SCH! 40 galv. piping and fittings, (1) sample port. (1) I lotPilot tube insertion point, (I) 4- ai throtting butterflyvalve.
9 lnsuwnentation/Cauges * (1) 0- 30 psi Pressure gauge mounted on the blower I lotdischarge.
* (2) 0-160" WC Vacuum gauges mounted on eitherside of the inlet filtedsilencer
. (1) Air Plow Monitoring Assembly with air flowindicator and pressure gauge calibrated In cfm.

964 226
4 33 39
10 Amr Sparging Blower Rootis rtary lobe Positive displacement blower ModelJRAI-S3-3-2.55 capable of producing 255 scim at 14
psi(less system and piping losses). Blower equipped withthe follow4ng25 Hp. 3/60/460, ThEC motor, v-belt dnive. OSHAapproved belt guard, blower and motor stand, flexible inletand owtlet connectors, blower stand (56dtx 28tW z
____ ___ ___ ___ ___ ___ ___ 75-H)
I I Pressure Relief Valve Adjustable pressure relief valve.
12 Wret Filter bsetfilturformrmovalof 97 to98 pacent of partjclee8to I_______ _______ _______ 10 microns or larger
13 Inet Silencer 3" Inlet sile~ncer
14 Disc huge Silencer 2-l1"rdischarge aileaverI
is Air Bleed Valve Valve assembly moonted newr the system's discharge toIallow for system air flow reduction. Valve assembly
____ __________________ supplied with a discharge silencer
16 System Piping Y' £01 40 galy. piping and fittings, (1) 4W PVC air______ _ _______ ________ _______ throttling butterfly valve.
17 InstrumentatiooiGauges (1) 0-30 psi pressure gauge mounted on the blowerIdischarge
________________ Cl1) 5W-30OOY tempcmnwure gauge
is BuIlding IOWWa 24 L wood frame, building wI rtimforved floor, T-IllI painted siding, shingled roof. ful interior insulation,
____________________particle board to tenior siding
19 Main Control 42? x 36" enclosure, 3/60/480 volt, capable of controlling Ifour motors. Provides housing for a Model 4100Sensaphone. Russtrak Model 288 chart recoider, Signet
I I ~~~~~~~Model 3-8510 flow transmitter and a FCI receptacle.
20 Well Controls 30" x 24" enclosures. 3/601/480 volt, capable of controlling 12individual well pumps. Provides housing for a DhnflosaModel VLT 2030 variable frequenrcy drive, panel heaterand a weather resistat receptacle.

964 Z&?
C/)
0~~~~~~(
(0 ~ ~ ~ ~ ~ ~ ~ ~ ~ ~ ~4) =~~~~~~~~~~~~. ~ =Q w 2 ~ -
Cr a-v~~~~~~~~~a a 00
C -~~~~~~~~~~~~= -oo '0 -~~~~~~~~~~~~~LU- :E 2 E, M-4O
6. -c ~~~~~~~~~~~~~~~~~~a O O = W =T* M o. flgwa-. 0 =0(0,C ~~~~. :ec~~~~~~~oo E . o 1
EL W 00 0 E W Co =
E E? 0 =o E>10-2 2 ) c M~
M 0 O o > ~~~~~~~~~t~ 0O o4) C-i- 4)~~~~M 1 =-g - ,~
F a~~~~~ .o ou c. ' Om 4 ~ 4) ~ ,0
o Mn 0 Mc?~ 0 4)Ct
C 0 0 0 i vjG 00 C
EL a ~,- ff M Q . 0M aEL - c o
1oc a 0f 04) c a
a U 0 IL flSZtO 0. 0
O 'L- U -~~~~~~~~~~~L
- ~0. 00
- -~~~~~~~~~~~0C
coO a,~~2 0E - .04) )
E0 ?. cc> .c4 3 ~ - 0 ) 0Ii~~~~ 2 e5 C Vff E M ~ g -7 ao U. 01- 0~ ~~~~~~~~ 5
_ .~~~~ c~~~cE 0i 4
CD EE.o O.C4. )54 Mwcon4)Ef
W ~ ~ o'ocnw C4) - 0 O 4LU 0U 00 0 'C 4)l4.-5oU~ 8 -~5U ED ~~~~2 g ~
E ~~~ S~~zcso.~~~~; -~ 20 E
Om -J25 -.oe C- - c 4 )
0 0 w o . . . ~2 W6. . - C~~~0' 0.o~ma 0 0:wo 1 3: Ea~~~ .52 E 0 E~~~~~~0082
Z <W 4W (04 >
0. ~~~~~~~~~~ C~~~~
j L ), *doI (C 2~~ Co'V o m. Om(0
C- W)) o5.Z orMW -Jo. IL4ZW 0 C ~ ~ ~ ~ It Thx CM
LU~~~~~L Wo =
n .)~~E0 C0 U~~~~~~~~~~~~~~~~~~~~~~~~~0 ~ ~ i-t±. W
o b owY4

0 ~ ~ ~ ~ ~ ~ ~ ~ ~ ~ ~ ~ ~ 2
CL
'~~~~~~~~~0d ~ ~ ~ ~ ~ ~ ~
E~~~~ ~~~~ 0~~L ObO EL
~~~~ 0 ~ ~ u
Z cCO - ~ . --Sc~w 6~ L
0-j1 E4 4)2O24 05 M
M M, zE - ML, (D F~~ MM L4 ) W 0)0W--a! < -D
0 , , wsI-s CO Co
C ~-0 E eowwi,- 4
W oivg <M cD a 4M, CUm 0
M>oE
in -.- C- 0
0 W0 oo- o, r E w E=0.0, z M- MC
o 0)4 W4O 0 E 4)QM EL 4 E
MC5 ,4 0o 8 MU08 Z-W
O.C 0 WO.L oU c ' O0 C~~~~~~~w LuO ) 5 )fl fl C) w-) 0
0 - ,~OC S
0 -C 0> 0> ~ ~oOLO4)S M= E '-4)
-5Wa~ M~OoL0 s M Wa -aE W>0 W
M E a sMW C O~h-=a -' W0 W)E
0 .W. M W.0 O CV0C ) 5CM
'r -~~~~~ ) ~, SC.t..C ot ~ ).-
-ZC P. 0OZ.m§o4) M)fl.W
~~~~1 C- 0,,o z 4)u =-a~
0 C~~~00 0 0E 0C~~~~~~~~~~
a aO M4).0 -oW0) M a0 0 C=D i E M0M2 MO E=
0~~~~~~~~~~~~~~~~~~oz 0~~~~~~~~~~~~~

W ~ ~ ~ ~ ~ ~ ~ ~ ~ ~~6 ~
=~~~~~~~~~~~~~~~~4.2~~~~~~~~W-
EU4
E-~~~~~~~~~~~~-
Eog ~~~~~~,~ a=.2,
EL. WcCaMicb
0 2 a= rn4)L)o E >O. o4
fl-a-~~~~~~~~ uI
o ~~~~~~~~~~ -a0 C -
a M I.
~~ 00~~ 4) = C ~~~ C.., 4)0 P 0 i' 2 E MM E
= 0~~~~~~~~3 - 0-
<WE~o E0 4),om g'c uEW-w
m I E_ o <_ E - .~~ ~ B' awe ' W)4) .
.6w=4) &4Žh 0>4=to~W vo0 2.:c C M -OW 0f,, >-'e,~-
4 )- Zn W- a ~- -= W W c WM c'j-L-E 4
E26 2 4'a0 £W0'- 3: = 0 B M'O0 ua a M
"a- 0~-. 0 ,-3V20 FL 0 5c a 5
mm 4)00 O(Vb, toW 0,0
EcMv. 5 bE -0 2 E EB -o'so 0 2 _E V co- W ,cz.9£0M CM S --fl4)'Fo C
8 Z.L, 2 0 M ~~~,`O M C 0:0 a,.--= a,,-ptfm cto .- _ _ M M 9
I- a, aC ) n 0 o £0to H ~ ~ C (V -. S <' .! ISt u-a >5 W 5
-, > 0 u0. a M.
Zor -sM E--
.G 0 8 B , m~~~~~~~ 0 O:m t- E M 0 E W T~~~~~~~~~(04) 4) 4)~~~~~~~~~~~~~~
EL zwn =.-Cum~~~~~~~ ~~~o~-6 ~~~S f; aw 2 -,06 ~ ~ tM W o M O~~~~~~~~~~~
C.) ~~~~~~ en cc r..~~~~~ O O

964 230
50
. 3~ o M ,.o =0 W
'P s-C-I 5
C M 00)
M >~~~~~~~-
oL0 flocM E- =0
co -CMEO = MO3
0flC ~ 0 M >O
0 -~~0
oCC M CIO
W 0 , M _ 0 0
00)O)5 0 2 0; '-. 0 2
00doWu~~~~~~~~~ 3in0'O
0)~~~~~L E2M 2 0 00 0~~~~~4,0 O
L)L) W 0.0 0
M 2 ~ m>0 u _M:w m -o 4, a
0~~~~~~
K ~~i - W MM = & E - M M
=r~~~o~ ~~'0 W04 n. a- W E M M0)j -2 M< a tqw~ < -~~ =L -2- ~?~ a a 0 3 W~~.S~E 3~E-- om :n)= C.2 0O* 0 M x 8 r,S W- tDC
00M M _ _ , . = 0- 0 _ M 0 = 5_
,-0E ME '= ME > ~:M E CO>0
* ~~ CC~~(~ 0 .0 a:S~.g -'eoAS.022cwwm
o ~~r-~~wo o~~ - - M = .- _ o 0
0aa-o~o E E 0 M - >O M a: EO0~~~~~--~~-s 0 >.3:~ -9 M_ 0
03w0W> M < 0MM .- O ,E!F AC
C.- - 0~c 0 aS, 00<00204 0) -c
0 W M < ==0. E O)E 7ELE E~m 0 M ~ ji E WS 0. O OCS000o
0 0 M a M MM 0 W 0M .5 ~ M= a) > W o0' ~ 0 000 5
O -E W M. 2 i.M M M = M N M -~~~~~0.C. LD0M" a g5 M=~> ~
~~~~~~~~~~ ~~~M-MM0 - O 0
C g,~~~~~~~~~~~~2 a ~~~~M E20 EWo
0 0CL 0 W a3
I'm! 618 ! sWa > W~~~~~~~~
M 0~~~~~~~~~~~~~~~~~~~~
00 0) - -0 M

9 64 2 31
; C~~~~~~~~~~~EC
CO -o a
O, L E. .s -E -
Ca ~~~~~~~E0 E COWM , C aa>2~w W
=C)V 3=`42C a-C
-4 0 C .C_ C M CC 'a4)Vs a M amoO a4) 0O0 D
O) N-SSE gm P~~ =N
PM) 0 O 0Mm --o
a E'=)-O a> _Mo 8~ CC W =M
O ~ ~ ~ ~ ~ m 0
0 e0 >t >z4) -
c a O)~ 2 o'EcCL .s E a E M '
4)4 O own
G- w ;? , M a
>..O ) O, )O -, 3: 00 >2 OM w' --~~~~~~~ C4) .~~~~~~~~~~~~~~~~~~~~~a 3'~~~~~~~~~~~~~ CCo. G 0a
,sa a c~i >. -a wni Ef O a~v G c E
wc C~~~~..r~~n, m.n E jjj ooC t 4)- -w A
a '0.O -MGL n ~ODi'h Z-M S Ja-a
E) w4 0E Ccw 4W a
Cfl4)w C) 0) ta'4)~~~~~~~~~w 3 . 0L
(92 (N~~~~~~~~~~~~E O"a
- _ _ _ _ _ _ _ _ _ _ _ _ _ _~~~~C 0 w - - 0 _ = OM.-

964 232
d's
=
'is~~~~~~~~~ATO'
W W a ~~~~~~~~~~~0)
c , , o Ž
.0 8 ~ ~ ~ U
LLO a ,4, '-'- -~~~~~W i 0)-
Co S.Ett~~~~~ n 0= .t- 4,~ ~~~~~~ 0)0) -
o ~~~~~~~~~~~~~~~~~~~~~~~~~~0Ca L c ~~~'a E
.- ~~~~~~~~~~~~~~~~~~~~~~~0 4, ,.. =0.0 ~ ~ ~ ~ ~ .. : C M0
W Ca, 14,2> a, 4
> 'o B .. ,;, mw~,or-§MW O 0W4 , ) U to , - 2 Mo- F
0) a =~~~~~~~~~~u-= Z 4W
-r, ,E a4 ,
..',.
E ~~~~~~ ~~~~ E 04 a, 0)CM j X 0 Wc a, W -w oa o 0
W -E M, LD M < E O aW 0)M O= 2 4, . '9 -. ~ N
E am w M0 M )0cC
00)E O 0) W. oE oE C -- --~y WS iooW - .M5.M
S ~ 0Zc~i~>sag0 E a
M 40 E ~ o ~S 0 2= >'w .F a,- j EL 0)4EL > co M-=~ 2oM, zom5- S o E2 5 F-o X~a WV.M fl C
mz -,ai -=~W ~W 10 20 E W-
0 ~ ~ ~ ( 4 CD ~0 M -
. E~~ c
,-0 EC>0E
E 'O =0)04
W4,2& a04t-- ,4, rX04 -q WS
.e C a, di~~~ ~ a,, = za ) 0-, 0 a~~~~~~~
ozc., .4, ci,~~~~~~~~~~~~~~~~~~~ZCNL,, 4

964 233
30
C~~~~~~~~~~~~~~C
Lu 4~~~~~~~~~~~~~~~~~L
0 a
E M.0 t0
M 4 ,Ow E~~~~~~~~~~~~~~~~~~C
ci0
N D
0=~~~~~~
4,-O~~ ~~~~~~~~~~ ~~~~~~~ 0 0 , )o,>
0-J LD . wo2`
= 02.w -o-0, EO_-
o EU 0 WE Wca
~-4,4, 0 LL-. .
W ao
0)cwE E C
= 00 0~-= M 1 ~co'O ~~~~~~M WV~M E t
0 00 0W -~~~~C y - 0AR , a ~EV ~ v 4~O , c W 0).
m 0 1 W2 2 > 0
4, M E- 0.
C S~~~~~~~~~~~1
2 ~~~~~ )W(~~~~~~~0)~~~~O n(,.0 <4=M, M4)o3 LL
o E~~~~0a0, C;w M -t.- 2 W.E vM no E~w E fLSw o mm o E 0~-0 = 'f 4 M, M M5
iE 2 t tO
C'S' Ls~ 2 > ~ -~~
5 00) V4
.0)0

964 234
- - - - -~~~~
~~~~0 ~ ~C ~~>0
0 ~ ~ '
00
-c - _________________ _________ __MO ______
E CDM 2 ~ ' ~*g- EL -4o n-"
a. 0 E2 [2 Mo 8,jaSQY04
a C~~~~~~~~~~~~~~~~~~~~~0E* '0 ~ ~ ~ ~ ~~~~~~~C(OQ~~~~~~~~~ ->O~~~~~~)C O
0 0~~~~~>
,.c *~~~~ a 0 -n-,rc2
* .22~~~Ma .
0) -o~~~~~~~~~~~~~
COSCO o ~ ~2 H4 )
0 -Ow0~ En M 4
4)~~~.J 0~~ 0E O )4 ~.0 0i2 <~~0 '0Ca)6
0i~~~~~~~~~~~
0 4)~~~0-'6-o* M:-OM-oM~~ 2 o~~~~~ a)E. 04) Ea "'' ma(
LU w o
o EJIEvi ~ ~ 2 t 8 O.O- 0- .02
LI) E8I ~ EB
E Om c Ci o 0= L)OFC=w M2_M De__ EO'fl
(0 0~ ~W~* 06
M LUZ '.0 E a - -o= ME ~ 0z. 2 rz 004) M E 5Va~CO E8COM
2 _ &.~~~& 0(0.G. V
0 as 0 fe 0~~~V.- M Cn 0
H o o:z EJOJEEH
oo CO
E '0 CC'a
0 L) ~ ~ ~ ~~U 4)

964 235
APPENDIX D: HISTORICAL OU 8 GROUNDWATER DATA

- --- - - - - - - --
I~~~~~~~~~~~~
I~~~~~~~~~~~~I
- - - - - - --- - - -
- .~~~~LI
V1~~~~~~~~~~~~~~~

4Ž ~ ~ ~ ~ - - - - - - - - -- - -
C~- - - - - - - - -
- - - - - -
a ~ ~ ~ - ---
- - -- - - - -
- - - - -
- -- - - - - - - - -
- - - - - - - --- - - - - - - -

4 4F

- LI V�V 7V7Vp Ii RUt'�Th
14 I
I .f�j[0
- taa
I VtS I IIIaa Ii�
N-a IL
LI
S
a
a
a
i jaaa
tax4- J1H�
� I F
<F I I
ii I

Ct~~~~~~~~~~~~~~~~~~~~~~~~~~~~~~~~~~~~~~~~~~~~~~~L
0~~~~~~~~~~~~~~~~~~~~~~~~~~~~~i
- - - - - -
- - - - - -~~~~~~~~~~~~~~~~~~~~~~~~~L
a~~~~~~~~~~~~~~~~~~~~~~~~~~~~~~~~~~~~~~~~~~~~L
a~~~~LI L ~0~~~~~~~~~~~~~~~~~~~
- ~ ~ ~ ~ ~ ~ ~ ~ IL- - - - - -
- I w~~~~~~~~~~~~~~~~~~~~~~~I
I '4~~D D ~ 1 L 1 9
IL~~~~~~~

a,~~~~~~~~~~~~~~~~~~~~~~~~~~~~~~~~~~~l
N -~t-------
I.~~~~~~~~~~~~~~~~~~~I
N~~~~~~~~ II ev mv e
a~~~~~~lee
Vl1 I
a~~~~~~~~~~~ee~
N ~ ~ ~ ~ ~ ~ ~ ~ ~ ~ ~ ~ ~ ~~~~~l
0~~~~~~~~~~~~~~~"
t~~~~~~~~~~~~~~~~~~~~~~~~~~~~~~~~~~~~~~~v
a ~ ~ ~ - - - - - - -
a~~~~~~~~~~~~~lr4~~~~~~~~~~~~~~~~~~~~~~~~~~e
0~~~- -- - - - -
e aqeN~~~~~~~~~~~~~~~~~~~~~~~~~~~~~~
0 ~ ~ ~ - - - - - - - - - - - - - - - - - - - -
0~~~~~
a~~~ea~~~~~~~~~~o
4~~~~~~~~~~~41

2 V~~

'a
I I.1'I
�1
gILp IIp
-I
1 st)
4' *4.1� [H -� Vi A
Hg
I.-Ifr-
[V -tt
H-r
* I
- I
t 1.
j
Li

9R4 Ž14
0
2r
00
CC
ao
2
00
Ca V
0No
00N -
o
C
AC
o}
o �'Ito
- D Th
0
tr
4
4) 4)

06~ ~ ~ ~ ~ ~~~~~~6
A
A
AA I
Q~~~?) Sit -~ ~ A - -
- C~~~~~
a~~~~~~~~~~~~~~~~~~~A
t~~~~~~~~~~~~~~~~~~~~~~~~~~~~~~~~~~~~~~~~~~~~~~~~~~~~~~~~~~AA
N N~~~~~
- IAI--- -

5Th4 ?46
NA
CC
VN
710
0
- U,1 ,ta -.
a- II
-4
S4

9�4 ?1?
ITTIC
¾
0N -
8�.N ¾
Naa
N
N0
NN
g
CoN
0 .4 *� �.J 4S 0 0 0 (V (V CU:):,:) r its
0 IC
4
I

iaN
o
CaN
NSaN
C
82
U-S
4Ž
0)
40) �
U>
4Ž4Ž U

TT:~ ~~~~~9iI
- - - - - - - -
2t
N~IC N
0~~~~

9�fl 2
SN
7
C0
<70.)
V0C -
C>VN
0o *N
CN
0
40CN
'-(7 � 04
C
0 0 (0 'S 2) <9 0 0 (0 (9 (9 0 (0)0tU0tt2272zD
LbLb
Lba)
0� ¶C)
4(46 Cd
C-',

964 25$
C
a 7
wCoN
CCN
aCN ��5 K
o t3 500
-'-Jr orE
(5-v
C � �4-....-

SEn
00N
I--N
0
4,
VV
0
t
g �N
rao'.4aN
o � -�
S:� r Z�2�
0�
4C)
1)

964 253
C TK
IK>
I,
K4I
S
2141

�6i 2Sf
wao �A
aaN
CaoN
0,
C
t0a
ar.t0a
o L - -iiaC.. � I
a0N INo V
S
� 43 43 [3 43 (3 0 43 43
V
rz�
� C
t
V -� 0 vi0 0- F'

25s
KIT
V1$
7V
4
1-tLVLI -�
K
L�j
>0
� L

Th *- - - - - - - - -
C) ~ ~ ~ ~ ~ ~ ~ ~~~~l
C ~- - - - - - -
0~- - - - - - -
- - - - - - - - - - -
-- 0
- - -. - - .
C~~~~D
N ~ ~ ~

I t~~~~~~~~6 5
N~~~~~~~I
0~~~~~~~~~~~ - ~ ~ ~ ~ ~ ~ ~ 1L

C>~~~~~~~~~~~~~~~~~~~~~~~~~~~~~~~~~~~~~~~I
V~~
C,~~~~~~~~C
- - - - - - - - - - - - - - - -
0~~~~~~~~~~~~~~~~I
N ~~~~~~~~~~I4l
- --- -- - - - - - - g
- -- - - - - - - -Q
-

<3- - - - - - - - -
C~~~- - - - - - -
Ct ~ ~ ~ -- --
a~ ~ ~ ----
0 ~ ~ ~ ~ ~ ~ ~
C ~ ~ - - -
a~~~~~C0:o

964 ZIp;
�S
vi
g
� K
4
IK
4
�V
r
� :, C
2

964 ��fij
I
I
I
I
II
z"Im I
III
r

4 ~ ~ - - - - -
r~~~~ O

961 6~
- - -
o - - - - - - - ]- --
- - - - - - - - - - -0 0 (9 (2
*r) rn S S S S

96 4 204
z0.1? co
*:0
2

964 265
0.c m
*0
C~

<V~- - - - - - - - - - -
- - -- - - - -- -
a - - ~ - - - - -- - - - -
- -- - - - - -- - - -
--- -- -- -- -- -- -- -- -- -- -- -.- - - - -

- -
U~~~~~~~~
1% ~ ~ ~ ~ ~ ~ ~ ~ ~ ~ 1
o -' -. - - - -j

C)~~~~~~~~~~~
~~~~ -I,. --- --
- - -- - - - - - - - 7 -

�44 icr)
tO
o
N
0N
N
a
C
C
t0aN �)a
0N0,
0V
V
o *; -9V � (i� 0 0
->
i*I

N
C,
I---
IŽTh
K
0
V
I
I
N
0
S
C
� , 0
U,
C 4
t

0)
.1 INTlNrN
aC
aa
IN4
a
0C
0a
PN
0aC
(9
C
N0CN
N
I'S
V
0
C
t
0�

C
N
-t
CC
a
oN
t
C
N-
K
N <1?
0
0
C
V
N
C0
o �
� 4

11211C
oN
C
N
I0
0
tV
- VAN
a
C
B
CC
2 (S
t
tO
4

4<C,>
C
S.-N
I
C3 IV.
C
1< K-
4
S
N
C
4
-
NCC
N
'.4Co
C
C
94- U,
o *� 544 n (fl)
N
C
U'4 C

jib
jN
a
aaV
N
a
Ka
a '
St
aJi�0,
o<0
7)
N
S
� a 5

(V
Cu
1�
tCCN
C
V
-- ItU
4
a
N
TI
N
41a
� v-I� :�j>
fl�l � $ 6 �>- �
I

�KiC
o
-
V
C
I
it
C
NC
NaC
N
V0,
o� D (9
9
aC
C4
LA<I

N ~ ~ ~ ~ --
C> ~ ~ ~ ~ -- - - - - - -
C - ~ ~ - -- - - - - -
- - - - - - - - - - -o~ ~~I1 II
CD1
- - - - - - - - - -a~~~~~~~~~~~~~~~~~~I
IN q D ~ D
I0 I > I1
C~~~~~~~~~~~~~~~~~~~~~~I

cm~- - - - - - - -
----------- E

I C
a~~~~~~~~~~
C~~~~~~~~~~C
IIa~HM -

964 �8I
a
C
N
8
N
0
I - --Na
0CN
ta
0 �
D S} :1) 1Z)t ID S S ID ID
S
I
-n OF-�l4
V V
K)p5hz
V
SQ t V

gf;i ,�t
K
oN
aV
to
0oN
oNo
o
� I>aN
aaN
o
aN
� 1� (5Th
I AN
24 I
� [I

I
g
oN
0
30
0N
¾
0
o 2 C C� Th U
2
C
4,
0 V

284
C
C.
CCN
C
C
0
C
I-.
4VC4
ta0
o e01�0 j- ZTh�) t
U
4'.
a.2,

0r
C
0CN
N
K
0
a
it0
V
0
N0CN
C0
Ca
0
13 (13LUn
0�
4

�G4 ?8V
0
S
0o ->
4
i
g0
N
N
- z �D�1
IV
4)
4%VLA
4)

964 287
=3 00 c

�g 4
0�ci- . .,� - -� _ .- <V V) AOVC -
A �
V41
o E A A A A A A A A A A A A A A A -g A A A A -J A A0 2 C <5 C C C C t.9 C C C C £2 C C < o o d 6 6 66 6 6 6 6A 2 S S S S S S S S S S S S U S Th � S S S *S 2 5 S 2 5
ul�'p
t 0-- 1) 1Ž
r
C t
2 S � E C-t 4',

<V ~ ~ ~ ~ ~ ~ ~ ~ ~
V~~
ft -- - --- --- -
N~~
IAN
I

0~~- - - - - -
C>~~~~~~~~~~~~~~~~~~I
C~~~~~~~~~~~~~~~~~~~i
N ~ ~ ~ T DC

964 291
m Is

IE ~ ~ ~ ~ ~ ~ 4I
0 ~~~~~0
C~~~E~ Aq

964 293
moc(DI
o"Ig

964 294
FINAL PAGE
ADMINISTRATIVE RECORD
FINAL PAGE