Appendix F- SCHOOL COVER SHEET ... - ePlan
34
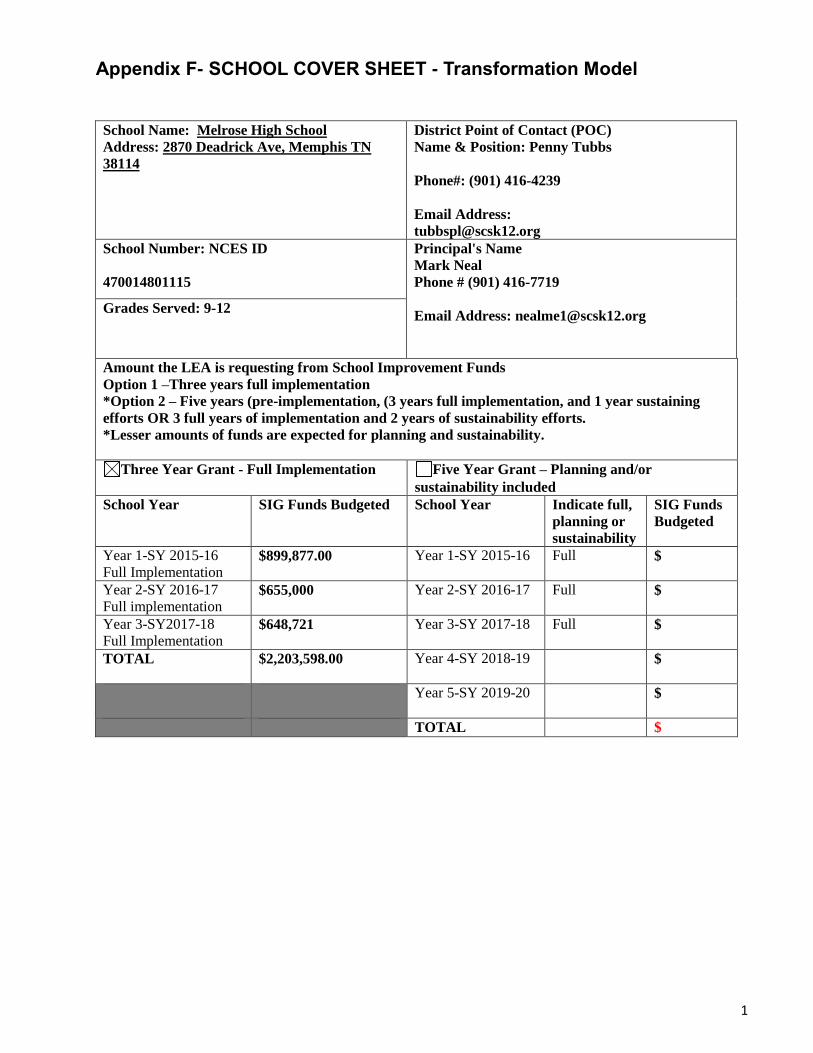
1 Appendix F- SCHOOL COVER SHEET - Transformation Model School Name: Melrose High School Address: 2870 Deadrick Ave, Memphis TN 38114 District Point of Contact (POC) Name & Position: Penny Tubbs Phone#: (901) 416-4239 Email Address: [email protected] School Number: NCES ID 470014801115 Principal's Name Mark Neal Phone # (901) 416-7719 Email Address: [email protected] Grades Served: 9-12 Amount the LEA is requesting from School Improvement Funds Option 1 –Three years full implementation *Option 2 – Five years (pre-implementation, (3 years full implementation, and 1 year sustaining efforts OR 3 full years of implementation and 2 years of sustainability efforts. *Lesser amounts of funds are expected for planning and sustainability. Three Year Grant - Full Implementation Five Year Grant – Planning and/or sustainability included School Year SIG Funds Budgeted School Year Indicate full, planning or sustainability SIG Funds Budgeted Year 1-SY 2015-16 Full Implementation $899,877.00 Year 1-SY 2015-16 Full $ Year 2-SY 2016-17 Full implementation $655,000 Year 2-SY 2016-17 Full $ Year 3-SY2017-18 Full Implementation $648,721 Year 3-SY 2017-18 Full $ TOTAL $2,203,598.00 Year 4-SY 2018-19 $ Year 5-SY 2019-20 $ TOTAL $
-
Upload
khangminh22 -
Category
Documents
-
view
0 -
download
0
Transcript of Appendix F- SCHOOL COVER SHEET ... - ePlan
1
Appendix F- SCHOOL COVER SHEET - Transformation Model
School Name: Melrose High School
Address: 2870 Deadrick Ave, Memphis TN
38114
District Point of Contact (POC)
Name & Position: Penny Tubbs
Phone#: (901) 416-4239
Email Address:
School Number: NCES ID
470014801115
Principal's Name
Mark Neal
Phone # (901) 416-7719
Email Address: [email protected]
Grades Served: 9-12
Amount the LEA is requesting from School Improvement Funds
Option 1 –Three years full implementation
*Option 2 – Five years (pre-implementation, (3 years full implementation, and 1 year sustaining
efforts OR 3 full years of implementation and 2 years of sustainability efforts.
*Lesser amounts of funds are expected for planning and sustainability.
Three Year Grant - Full Implementation Five Year Grant – Planning and/or
sustainability included
School Year SIG Funds Budgeted School Year Indicate full,
planning or
sustainability
SIG Funds
Budgeted
Year 1-SY 2015-16
Full Implementation $899,877.00 Year 1-SY 2015-16 Full $
Year 2-SY 2016-17
Full implementation $655,000 Year 2-SY 2016-17
Full $
Year 3-SY2017-18
Full Implementation $648,721 Year 3-SY 2017-18
Full $
TOTAL $2,203,598.00 Year 4-SY 2018-19
$
Year 5-SY 2019-20
$
TOTAL $

2
School Level Descriptive Information
Planning Tool NEEDS ASSESSMENT Template (LEA & School Plans) Available for entry in ePlan, May 1, 2015 PLANNING TEAM
Please identify all planning team members, including title. Mark Neal, Principal; Marsha Davis, Vice Principal; Kimberly Bell- Burke, Assistant Principal; Seth Harkins, Math Teacher; Alexia Jones, Math Teacher; Sharayah Peterson, ELA Teacher; Chastity Guy, Family and Consumer Science Teacher
SUMMARY OF ACCOMPLISHMENTS and WHAT’S WORKING
Summarize your accomplishments and what is working for students and why. During the 2014-15 school year, Melrose High School added an extra hour to the school day after becoming an I-Zone school within Shelby County Schools. Each class period was increased to 60 minutes, giving all teachers additional time with students in order to provide more intense and rigorous instruction. Melrose High School has made strides in academic achievement during the 2014-15 SY according to Discovery Assessment data and End of Course Assessments. The academic gains are credited to staffing, Professional Learning Communities, intervention, and tiered instruction. Students received weekly intervention that targeted their weaknesses in Biology, English I, English II, English III, Algebra I, and Algebra II. The intervention plan was based on student data from common formative assessments and Discovery Education Assessment results. Students were given tiered instruction twice a week for 50 minutes. This intervention started in March 2015. During this time students received direct instruction and specific skill remediation based on assessment data. Students were directly involved in their remediation plan as they monitored their growth on specific skills through various data tracking systems, such as All in Learning. Students were required to keep data folders that allowed them to keep accurate records of their common formative assessments and Discovery Education Assessment growth. The folders also included a section for specific skill tracking to determine the areas of growth needed for each SPI. This allowed students to have some control of the items they chose to complete during specific enrichment and remediation time.
ACCOUNTABILITY DATA
Accountability Achievement Targets – Analyze the data and provide a summary of progress and challenges, identifying underlying reasons for each.
Since 2012, Algebra I scores have met or exceeded the state predicated scores, thus producing significant growth. In 2012, the predicated score was 657.4, and students at Melrose excelled, as the average score was 670.9. This produced a growth of 13.4 points. The 2013 school year did not produce a discernable difference in growth as the predicated score was 658.9, and the average score was 663.6. The 2014 school year brought the most growth as the average predicated scores was 669.3, and the average score was 700.9. The actual achieved growth for the 2014 school year was 31.4. The growth from 2012 to 2014 yielded an overall average growth of 16.5 as the three- year average predicated scores was 661.7, and the average score was 677.2. In the 2012 school year, Algebra II End of Course test scores were -39.7 below the state predicated score of 657.9. In 2013, there was no discernable difference in the average predicated score of 665.7 and the average score of 664.6. The most significant growth was seen in 2014, as the average predicated score was 668.7, and
3
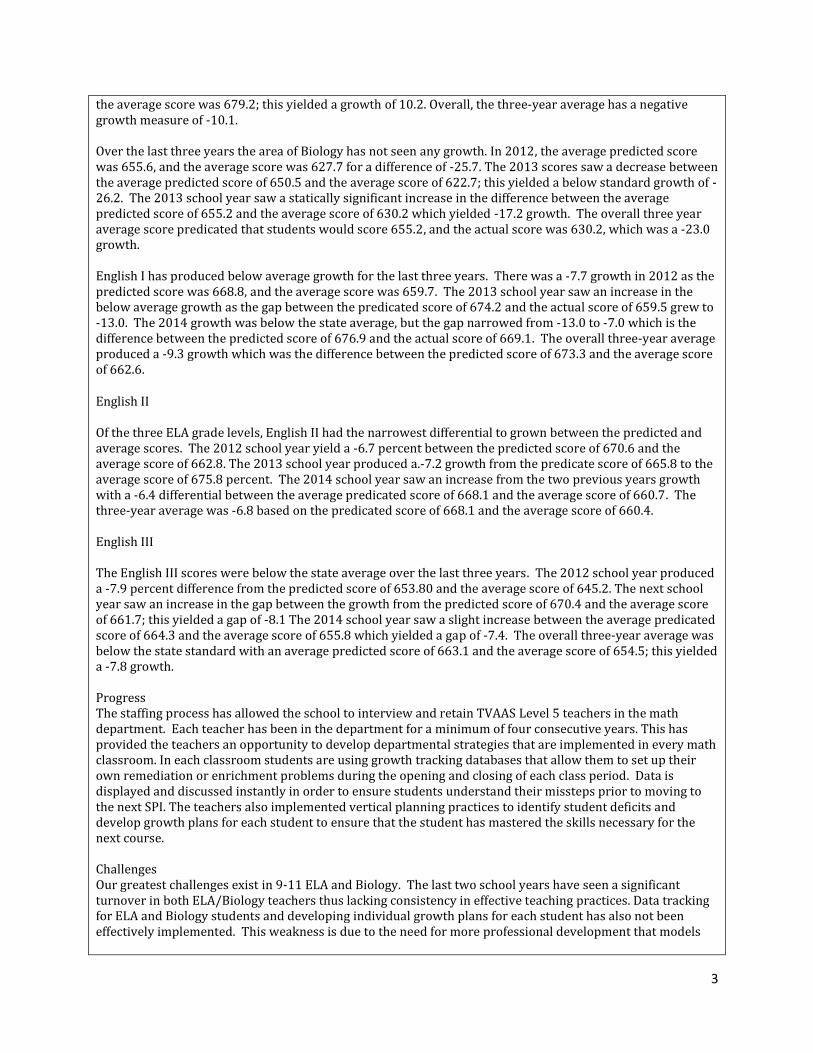
the average score was 679.2; this yielded a growth of 10.2. Overall, the three-year average has a negative growth measure of -10.1. Over the last three years the area of Biology has not seen any growth. In 2012, the average predicted score was 655.6, and the average score was 627.7 for a difference of -25.7. The 2013 scores saw a decrease between the average predicted score of 650.5 and the average score of 622.7; this yielded a below standard growth of -26.2. The 2013 school year saw a statically significant increase in the difference between the average predicted score of 655.2 and the average score of 630.2 which yielded -17.2 growth. The overall three year average score predicated that students would score 655.2, and the actual score was 630.2, which was a -23.0 growth. English I has produced below average growth for the last three years. There was a -7.7 growth in 2012 as the predicted score was 668.8, and the average score was 659.7. The 2013 school year saw an increase in the below average growth as the gap between the predicated score of 674.2 and the actual score of 659.5 grew to -13.0. The 2014 growth was below the state average, but the gap narrowed from -13.0 to -7.0 which is the difference between the predicted score of 676.9 and the actual score of 669.1. The overall three-year average produced a -9.3 growth which was the difference between the predicted score of 673.3 and the average score of 662.6. English II Of the three ELA grade levels, English II had the narrowest differential to grown between the predicted and average scores. The 2012 school year yield a -6.7 percent between the predicted score of 670.6 and the average score of 662.8. The 2013 school year produced a.-7.2 growth from the predicate score of 665.8 to the average score of 675.8 percent. The 2014 school year saw an increase from the two previous years growth with a -6.4 differential between the average predicated score of 668.1 and the average score of 660.7. The three-year average was -6.8 based on the predicated score of 668.1 and the average score of 660.4. English III The English III scores were below the state average over the last three years. The 2012 school year produced a -7.9 percent difference from the predicted score of 653.80 and the average score of 645.2. The next school year saw an increase in the gap between the growth from the predicted score of 670.4 and the average score of 661.7; this yielded a gap of -8.1 The 2014 school year saw a slight increase between the average predicated score of 664.3 and the average score of 655.8 which yielded a gap of -7.4. The overall three-year average was below the state standard with an average predicted score of 663.1 and the average score of 654.5; this yielded a -7.8 growth. Progress The staffing process has allowed the school to interview and retain TVAAS Level 5 teachers in the math department. Each teacher has been in the department for a minimum of four consecutive years. This has provided the teachers an opportunity to develop departmental strategies that are implemented in every math classroom. In each classroom students are using growth tracking databases that allow them to set up their own remediation or enrichment problems during the opening and closing of each class period. Data is displayed and discussed instantly in order to ensure students understand their missteps prior to moving to the next SPI. The teachers also implemented vertical planning practices to identify student deficits and develop growth plans for each student to ensure that the student has mastered the skills necessary for the next course. Challenges Our greatest challenges exist in 9-11 ELA and Biology. The last two school years have seen a significant turnover in both ELA/Biology teachers thus lacking consistency in effective teaching practices. Data tracking for ELA and Biology students and developing individual growth plans for each student has also not been effectively implemented. This weakness is due to the need for more professional development that models
4
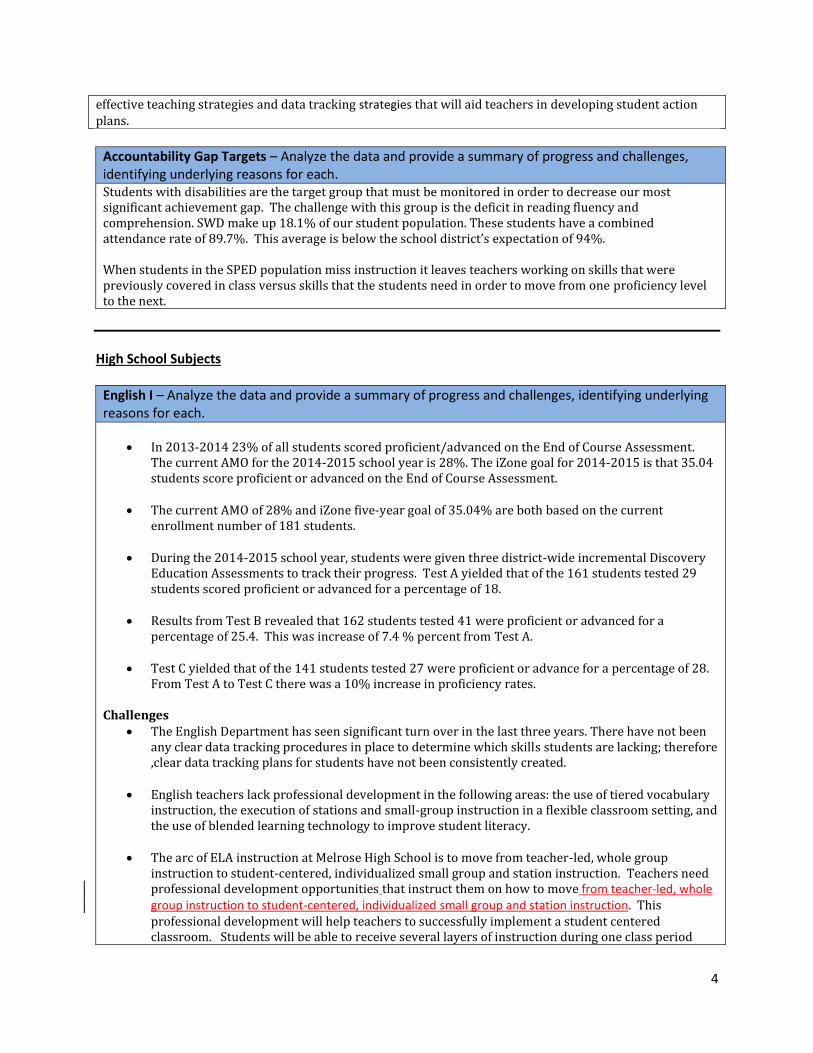
effective teaching strategies and data tracking strategies that will aid teachers in developing student action plans.
Accountability Gap Targets – Analyze the data and provide a summary of progress and challenges, identifying underlying reasons for each. Students with disabilities are the target group that must be monitored in order to decrease our most significant achievement gap. The challenge with this group is the deficit in reading fluency and comprehension. SWD make up 18.1% of our student population. These students have a combined attendance rate of 89.7%. This average is below the school district’s expectation of 94%. When students in the SPED population miss instruction it leaves teachers working on skills that were previously covered in class versus skills that the students need in order to move from one proficiency level to the next.
High School Subjects
English I – Analyze the data and provide a summary of progress and challenges, identifying underlying reasons for each.
In 2013-2014 23% of all students scored proficient/advanced on the End of Course Assessment. The current AMO for the 2014-2015 school year is 28%. The iZone goal for 2014-2015 is that 35.04 students score proficient or advanced on the End of Course Assessment.
The current AMO of 28% and iZone five-year goal of 35.04% are both based on the current enrollment number of 181 students.
During the 2014-2015 school year, students were given three district-wide incremental Discovery
Education Assessments to track their progress. Test A yielded that of the 161 students tested 29 students scored proficient or advanced for a percentage of 18.
Results from Test B revealed that 162 students tested 41 were proficient or advanced for a
percentage of 25.4. This was increase of 7.4 % percent from Test A.
Test C yielded that of the 141 students tested 27 were proficient or advance for a percentage of 28. From Test A to Test C there was a 10% increase in proficiency rates.
Challenges
The English Department has seen significant turn over in the last three years. There have not been any clear data tracking procedures in place to determine which skills students are lacking; therefore ,clear data tracking plans for students have not been consistently created.
English teachers lack professional development in the following areas: the use of tiered vocabulary instruction, the execution of stations and small-group instruction in a flexible classroom setting, and the use of blended learning technology to improve student literacy.
The arc of ELA instruction at Melrose High School is to move from teacher-led, whole group instruction to student-centered, individualized small group and station instruction. Teachers need professional development opportunities that instruct them on how to move from teacher-led, whole group instruction to student-centered, individualized small group and station instruction. This professional development will help teachers to successfully implement a student centered classroom. Students will be able to receive several layers of instruction during one class period

5
thus allowing the teacher to teach each standard more in depth.
Additionally, in order to address the literacy deficiencies of students and prepare them for both the more rigorous TN Core standards and the challenging texts of the PLAN and ACT tests, the students of Melrose High School would benefit from a program similar to that of Scholastic's READ 180 program.
READ 180 provides teachers with whole-class instructional materials for reading skills and
strategies, academic vocabulary, writing, and grammar. The program also provides students with a software component that allows them to work on an individualized learning path to progress them past their current zone of proximal development. Students also work in small groups in order to receive more personalized, direct instruction from their teachers. READ 180 provides students with content-rich literature and informational texts that will increase their independence in order to engage with a variety of texts within the English classroom and beyond.
Lastly READ 180 provides a comprehensive Response to Intervention (RTI) plan for students at tier
II and III that allows students to have highly individualized instruction. READ 180 provides customizable professional development to foster success for teachers in implementation. The READ 180 system will work in tandem with the direction that the Melrose ELA department is already taking: to provide students with the most effective individualized instruction possible.
The READ 180 system will work in tandem with the direction that the Melrose ELA department is
already taking: to provide students with the most effective individualized instruction possible.
English II – Analyze the data and provide a summary of progress and challenges, identifying underlying reasons for each. ELA II
In 2013-2014, 22% of all students scored proficient/advanced on the End of Course Assessment. The current AMO for the 2014-2015 school year is 27%. The iZone goal for 2014-2015 is that 34.24 students score proficient or advanced on the End of Course Assessment.
The current AMO of 27% and iZone five-year goal of 34.24% are both based on the current enrollment number of 198 students.
During the 2014-2015 school year, students were given three district-wide incremental Discovery
Education Assessments to track their progress. Test A yielded that of the 184 students tested 55 students scored proficient or advanced for a percentage of 29.9.
Test B results indicated that of the 199 students tested 57 were proficient or advanced for a
percentage of 29.1.
Test C yielded that of the 183 students tested 56 were proficient or advance for a percentage of 30.1. Throughout the year English II maintained consistent numbers that projected that the students would met the AMO standard for the school year.
Progress Through afterschool tutoring and strategic intervention, students were able to maintain the skills
that they acquired entering the school year. Based on the DEA results throughout the year, teachers showed progress with creating lessons that would meet the various academic needs of each student.

6
Challenges As students progress to the next grade level each year, the skills required to demonstrate College
and Career Readiness will increase in difficulty. Students will have to practice skills such as revise drafts to replace illogical conjunctive adverbs with more logical ones and recognize and correct expressions that deviate from idiomatic English. These skills will be developed as teachers create assessments that mimic the standards that are covered on the PLAN and ACT.
Currently teachers in the ELA department lack the skills needed to develop assessment that are
aligned with the PLAN and ACT. Teachers lack the understanding of how to implement and teach the skills that will move them from 13.8 score range to 16-19 score range on the ACT College and Career readiness benchmark scale. The issues stem from the amount of teacher turn over that has occurred in the English department in the last three years. Maintaining consistent teachers who are implementing effective practices that are aligned to the ACT and the Plan will drive improving scores.
Teachers need to attend ACT-driven professional development sessions that focus on teaching the
students skills that will move them from 13.8 score range to 16-19 score range on the ACT College and Career readiness benchmark scale.
The use of various software programs such as KAPLAN ACT Prep and The Real ACT that are aligned
with the ACT will also give students an opportunity to work on specific academic pathways that are built based on each students’ mastery of specific standards.
English III – Analyze the data and provide a summary of progress and challenges, identifying underlying reasons for each. English III
In 2013-2014 9.6% of all students scored proficient/advanced on the End of Course Assessment. The current AMO for the 2014-2015 school year is 15.6%. The iZone goal for 2014-2015 is that 23.84% students score proficient or advanced on the End of Course Assessment.
The current AMO of 15.6% and iZone five-year goal of 23.84% are both based on the current enrollment number of 207 students.
During the 2014-2015 school year, students were given three district-wide incremental Discovery
Education Assessments to track their progress. Test A yielded that of the 200 students tested 47 students scored proficient or advanced for a percentage of 23.5.
Test B results indicated that of the 205 students tested 40 were proficient or advanced for a
percentage of 19.6. This was decrease in proficiency rates from test by a percentage of 3.9.
Test C yielded that of the 202 students tested 76 students were proficient or advanced for a percentage of 37.7. This was increase from Test A by 14.2 % and Test B by 18.1.
Progress
Through co-teaching strategies and tiered instruction students have been able to have access to differentiated instruction. This level of instruction provides students an opportunity to practice mastery skills at a level that meets the learning need of each student.
Focus primarily on remedial instruction for prerequisite skills students are lacking for Algebra I and standards aligned with TNReady.

7
Conduct mini-lessons, provide additional practice, formative assessments, and track data for
students to track their progress and areas of growth.
Challenges
English III students are expected to not only follow the chronology of US History from a literary standpoint, which increases the need for authentic nonfiction literature, but also the standards call for students to be able to analyze rhetorical strategies, annotate text, and write scholarly analysis using several sources.
Students in English III need access to increasingly complex non-fiction text outside what the district
provides through traditional textbooks. These texts will be purchased from online vendors who can provide paper and online resources.
Students will need to be exposed to ACT length test throughout the school year to improve the
three-year average reading score of 14.7 and the three-year average English score of 13.8.
There is a need for a reading specialist to help with the planning and execution of timed ACT practice tests throughout the school year. The school will need to provide these teachers with professional development on annotating text, rhetorical strategies, and writing more scholarly analysis.
There is need for an Instructional Coach to support teachers in this professional development.
Algebra I – Analyze the data and provide a summary of progress and challenges, identifying underlying reasons for each.
In 2013-2014 52.2% of all students scored proficient/advanced on the End of Course Assessment. The current AMO for the 2014-2015 school year is 55.2%. The iZone goal for 2014-2015 is that 58.4% students score proficient or advanced on the End of Course Assessment.
The current AMO of 55.2 % and iZone five-year goal of 58.4% are both based on the current enrollment number of 159 students.
During the 2014-2015 school year, students were given three district-wide incremental Discovery
Education Assessments to track their progress. Test A yielded that of the 152 students tested 74 students scored proficient or advanced for a percentage of 48.7.
Test B yielded that of 152 students tested 111 were proficient or advanced for a percentage of 73. This
exceeded the Test A percentage by 24.3%.
Test C yielded that of the 154 students tested 106 were proficient or advance for a percentage of 68.9. This was slight decrease from the Test B, but still above the expected goal of 55.2
The data from the current school year has shown that approximately 24% of Algebra I students, including students with disabilities, have benefited greatly from small group (2-7 students per teacher). These students have grown from a score of Below Basic on their 8th grade TCAP to a score of Proficient or Advanced on the benchmark formative assessments from Discovery. Furthermore, significant gains were made after regular small-group instruction was provided in class. These groups were comprised of a resident teacher, working with low-performing students on prerequisite skills at a slower, more individualized pace. Also an inclusion teacher worked with students in small groups doing individualized remediation based on standards in which
8
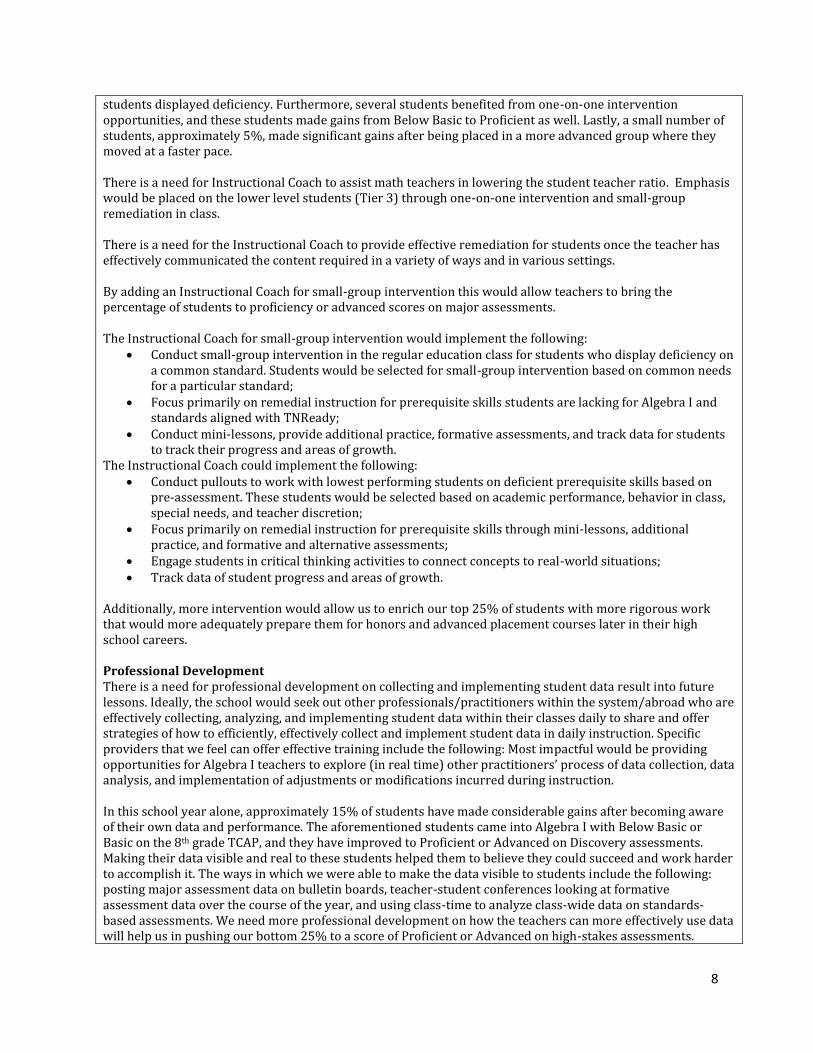
students displayed deficiency. Furthermore, several students benefited from one-on-one intervention opportunities, and these students made gains from Below Basic to Proficient as well. Lastly, a small number of students, approximately 5%, made significant gains after being placed in a more advanced group where they moved at a faster pace. There is a need for Instructional Coach to assist math teachers in lowering the student teacher ratio. Emphasis would be placed on the lower level students (Tier 3) through one-on-one intervention and small-group remediation in class. There is a need for the Instructional Coach to provide effective remediation for students once the teacher has effectively communicated the content required in a variety of ways and in various settings. By adding an Instructional Coach for small-group intervention this would allow teachers to bring the percentage of students to proficiency or advanced scores on major assessments. The Instructional Coach for small-group intervention would implement the following:
Conduct small-group intervention in the regular education class for students who display deficiency on a common standard. Students would be selected for small-group intervention based on common needs for a particular standard;
Focus primarily on remedial instruction for prerequisite skills students are lacking for Algebra I and standards aligned with TNReady;
Conduct mini-lessons, provide additional practice, formative assessments, and track data for students to track their progress and areas of growth.
The Instructional Coach could implement the following: Conduct pullouts to work with lowest performing students on deficient prerequisite skills based on
pre-assessment. These students would be selected based on academic performance, behavior in class, special needs, and teacher discretion;
Focus primarily on remedial instruction for prerequisite skills through mini-lessons, additional practice, and formative and alternative assessments;
Engage students in critical thinking activities to connect concepts to real-world situations; Track data of student progress and areas of growth.
Additionally, more intervention would allow us to enrich our top 25% of students with more rigorous work that would more adequately prepare them for honors and advanced placement courses later in their high school careers. Professional Development There is a need for professional development on collecting and implementing student data result into future lessons. Ideally, the school would seek out other professionals/practitioners within the system/abroad who are effectively collecting, analyzing, and implementing student data within their classes daily to share and offer strategies of how to efficiently, effectively collect and implement student data in daily instruction. Specific providers that we feel can offer effective training include the following: Most impactful would be providing opportunities for Algebra I teachers to explore (in real time) other practitioners’ process of data collection, data analysis, and implementation of adjustments or modifications incurred during instruction. In this school year alone, approximately 15% of students have made considerable gains after becoming aware of their own data and performance. The aforementioned students came into Algebra I with Below Basic or Basic on the 8th grade TCAP, and they have improved to Proficient or Advanced on Discovery assessments. Making their data visible and real to these students helped them to believe they could succeed and work harder to accomplish it. The ways in which we were able to make the data visible to students include the following: posting major assessment data on bulletin boards, teacher-student conferences looking at formative assessment data over the course of the year, and using class-time to analyze class-wide data on standards-based assessments. We need more professional development on how the teachers can more effectively use data will help us in pushing our bottom 25% to a score of Proficient or Advanced on high-stakes assessments.
9
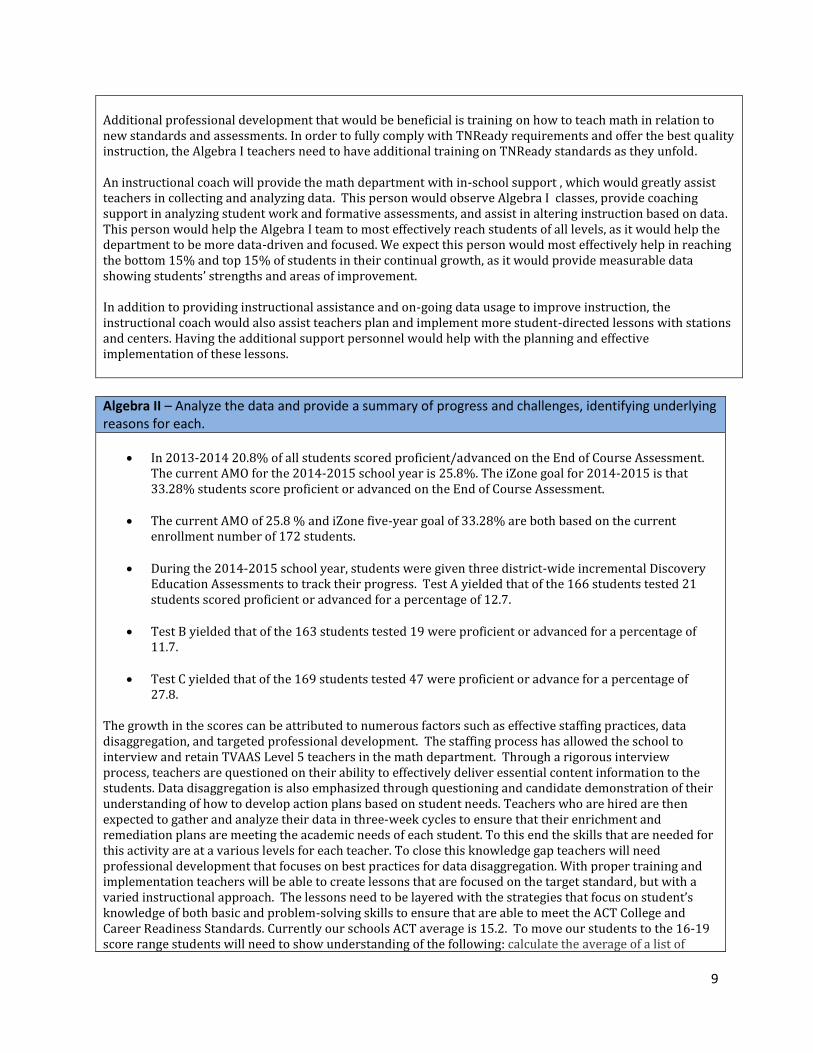
Additional professional development that would be beneficial is training on how to teach math in relation to new standards and assessments. In order to fully comply with TNReady requirements and offer the best quality instruction, the Algebra I teachers need to have additional training on TNReady standards as they unfold. An instructional coach will provide the math department with in-school support , which would greatly assist teachers in collecting and analyzing data. This person would observe Algebra I classes, provide coaching support in analyzing student work and formative assessments, and assist in altering instruction based on data. This person would help the Algebra I team to most effectively reach students of all levels, as it would help the department to be more data-driven and focused. We expect this person would most effectively help in reaching the bottom 15% and top 15% of students in their continual growth, as it would provide measurable data showing students’ strengths and areas of improvement. In addition to providing instructional assistance and on-going data usage to improve instruction, the instructional coach would also assist teachers plan and implement more student-directed lessons with stations and centers. Having the additional support personnel would help with the planning and effective implementation of these lessons.
Algebra II – Analyze the data and provide a summary of progress and challenges, identifying underlying reasons for each.
In 2013-2014 20.8% of all students scored proficient/advanced on the End of Course Assessment. The current AMO for the 2014-2015 school year is 25.8%. The iZone goal for 2014-2015 is that 33.28% students score proficient or advanced on the End of Course Assessment.
The current AMO of 25.8 % and iZone five-year goal of 33.28% are both based on the current enrollment number of 172 students.
During the 2014-2015 school year, students were given three district-wide incremental Discovery
Education Assessments to track their progress. Test A yielded that of the 166 students tested 21 students scored proficient or advanced for a percentage of 12.7.
Test B yielded that of the 163 students tested 19 were proficient or advanced for a percentage of
11.7.
Test C yielded that of the 169 students tested 47 were proficient or advance for a percentage of 27.8.
The growth in the scores can be attributed to numerous factors such as effective staffing practices, data disaggregation, and targeted professional development. The staffing process has allowed the school to interview and retain TVAAS Level 5 teachers in the math department. Through a rigorous interview process, teachers are questioned on their ability to effectively deliver essential content information to the students. Data disaggregation is also emphasized through questioning and candidate demonstration of their understanding of how to develop action plans based on student needs. Teachers who are hired are then expected to gather and analyze their data in three-week cycles to ensure that their enrichment and remediation plans are meeting the academic needs of each student. To this end the skills that are needed for this activity are at a various levels for each teacher. To close this knowledge gap teachers will need professional development that focuses on best practices for data disaggregation. With proper training and implementation teachers will be able to create lessons that are focused on the target standard, but with a varied instructional approach. The lessons need to be layered with the strategies that focus on student’s knowledge of both basic and problem-solving skills to ensure that are able to meet the ACT College and Career Readiness Standards. Currently our schools ACT average is 15.2. To move our students to the 16-19 score range students will need to show understanding of the following: calculate the average of a list of
10
numbers, calculate the average given the number of data values and the sum of the data values, Extract relevant data from a basic table or chart and use the data in a computation. Students will be able to master these skills with the aided use of technology such as TI N-Spire calculators. The use of these calculators will allow teachers to demonstrate the problems via projection from the smartboard directly to the calculator. The teacher will be able to log into each students calculator to see the steps that he or she took towards demonstrating understanding. Students will be able see their exact misstep and correction information. Student understanding of how literacy ties to their movement from the lowest ACT benchmark to the middle score range of 20-23. In order to solve routine two-step or three-step arithmetic problems involving concepts such as rate and proportion, tax added, percentage off, and estimating by using a given average value in place of actual values student have to be able to read and dissect what the question is asking prior to solving the problem. This deficiency can be aided with the help of an Instructional Coach.
Biology I – Analyze the data and provide a summary of progress and challenges, identifying underlying reasons for each.
In 2013-2014 12% of all students scored proficient/advanced on the End of Course Assessment. The current AMO for the 2014-2015 school year is 18.1%. The iZone goal for 2014-2015 is that 26.72% students score proficient or advanced on the End of Course Assessment.
The current AMO of 18.1 % and iZone five-year goal of 26.72% are both based on the current enrollment number of 172 students.
During the 2014-2015 school year, students were given three district-wide incremental Discovery
Education Assessments to track their progress. Test A yielded that of the 200 students tested 47 students scored proficient or advanced for a percentage of 23.5.
Test B yielded that of the 205 students tested 40 were proficient or advanced for a percentage of
19.6.
Test C yielded that of the 202 students tested 76 were proficient or advance for a percentage of 37.7.
Throughout the 2014-15 school year, the Melrose High School leadership team and the science department in particular have worked to increase student learning and improve performance on standardized tests. With the introduction of the I-Zone, Melrose High School lengthened each class period to 60 minutes to add an extra hour to the school day. The Science Department utilized the extra hour by emphasizing study habits, note-taking, and SPI-based weekly assessments. The Melrose Science Department also used blended learning devices to benefit students. The teachers implemented make-up work strategies online, created online- scaffold lessons based on previous testing, and used illustrative videos to engage students and clarify material. In addition, the teachers have used resources such as Gizmo, Gaggle, and Compass Learning to tailor work to the appropriate level for each student. Along with these web based classroom tools, students would greatly benefit from a web based program that would not only measures baseline data quickly, but would build a path of study for students individually. Students need individual log-ins for fidelity and teachers need the professional development for proper implementation. Even with the gains that have been made in the Science Department, the teachers still have challenges in the classroom. One of the biggest challenges to learning is the lack of access to resources. Lab supplies and classroom supplies are both expensive and often disposable. There is a need for quality scientific equipment in the lab space along with sufficient classroom supplies during the school year would give teachers the
11
opportunity to plan more tactile and inquiry-based labs throughout the year. More specifically, the science department at Melrose High School would benefit from the use of update science labs that include Smart board technology for interactive lessons and physical labs for increased real world connection. These newly generated lessons would not only provide ease of transition in increased technology for teachers, but would also allow our classrooms to be more student centered as students could manipulate the lessons guided by teachers. Smart Board technology includes the Interactive white boards, projectors, and the software to support the programming. Aside from interactive white boards, students learn better with hands on manipulative such found in standard high school labs. These manipulative include but are not limited to safety apparatus, gloves, and several types of prepackaged lab experiments (bacteria, enzyme, and cellular respirations). The labs are directly tied to criteria set by the college readiness standards in science so that students are not only increasing proficiency in state testing, but will also increase the Science sub-score for ACT school-wide. Students will increase skills in understanding experimental designs, predicting outcomes, determining which experimental conditions will change the outcomes. Currently students at Melrose achieve at an overall ACT score of 14.8 with a 15.5 in Science/Reasoning. The readiness standards that correlate to scores for science reasoning in the 16-20 range include multiple concepts centered on physical labs. With these improvements teacher would also need the professional development to properly implement the use of Smart Board technology and newly acquired labs. Along with the aforementioned strategies, students would benefit from field experiences that stimulate learning through interactive lessons such as those provided in the Mid-America Science Museum in Arkansas. Not only does this lesson outside of the classroom stimulate interest in the sciences, it increases literacy with a visual medium for stronger connections, and provide a 3-dimensional context for a student-centered lesson. According to the Center for Teacher at Vanderbilt University, field experiences are unmatched in their learning potential overall.
US History – Analyze the data and provide a summary of progress and challenges, identifying underlying reasons for each. US History – need data (analyze) summary of progress, challenges and reasons- tied to literacy ----Incomplete The U.S. History EOC was not administered during 2014-2015 school year. This exam was field tested this year to bridge the gap for the new assessment in the 2015-2016 school year. The former exam did not affect the AYP status if the school; however, students declined in their performance over a three-year period.
In 2012 the average predicted score was 499.4; however, the average score was 493.9 which yielded a -5.2 growth measure.
In 2013 the average predicated score was 503 and the average scores was 497.5. This yielded a -5.1 growth measure for the second year in a row.
In 2014, the difference between the average predicated score of 500.2 and average score of 490.5 grew to a -8.9.
The three- year average produced a -6.4 growth measure, which was the difference between the average predicated score of 500.7 and the average score of 494.1.
The school will strengthen U.S. History results through literacy efforts school-wide. Also, field experiences are inherently interdisciplinary in creating a learning community among students and allow teachers to get to know students’ strengths and areas for improvement. This will assist the teacher in better communicating concepts of the course. One such field experience would be to travel to the State Capitol in Nashville, TN. This experience would provide a greater context for non-fiction literature as it relates to current events and bring life to documents and historical timelines of events that lead to new discovery.
12
Progress/Growth Data
TVAAS – Analyze the data and provide a summary of progress and challenges, identifying underlying reasons for each. The overall three-year composite of Melrose High School is -14.04. This negative trend can be linked back to the lack of above average growth in literacy End of Course over the last three years. The overall composite for Melrose High School is currently Level. The students in ELA classes have not shown mastery of objectives that are linked to the state assessments. The lack of growth in the literacy is due in part to lack of retention of effective teachers in the English department. Over the last three years the ELA department has not had consistent members who planned and disaggregated data to develop intervention or enrichment plans for students. To overcome the high rate of attrition in the ELA department, students and teachers both will benefit from systemic school wide literacy strategies. A school based reading specialist could both train the staff on literacy strategies and implement a year-long calendar of strategies for teachers and students increase literacy. Professional development to properly implement a strategy calendar would be necessary to ensure fidelity. Growth has been noted in the area of numeracy over the last three years. This growth can be attributed to Algebra I meeting or exceeding the predicated scores over the last three years. The three year average for Algebra I was 677.2 thus the growth was 16.5 percent above the state predicated score range of 661.7. Also included in the numeracy growth is the Algebra II growth in 2014. Algebra II scored 10.2 percent over the predicated score of 668.7. The overall TVAAS composite is being affected by the .39.7 growth measure in Algebra II in 2012. Students have since grown to scoring at no discernable difference from the state level expected score of 665.7 in 2013 to the average score of 664.6. In 2014, the growth measure for Algebra II was 10.2 percent above the state predicated score of 668.7. Although the three-year average in Algebra II was still -10.1 below the state average significant growth has been made since 2012. This growth can be attributed to being able to retain the same group of teachers in the math department over the last four years. Each teacher understands the need to academically group students to promote growth. The teachers use technology sources to ensure that students receive immediate feedback so that students are able to understand if more intervention or enrichment is needed. Professional development to properly implement a strategy calendar is needed necessary to ensure fidelity to the process of developing and implementing strategies that are aligned to mastery of the concepts for the TNReady assessments. Both departments have cited the need for more coaching and professional development to help them meet the academic demands of analyzing data and the new TN Ready Standards.
COLLEGE/CAREER READINESS
Explore/Plan/ACT – Analyze your data and provide a summary of progress and challenges, identifying underlying reasons for each. Analysis of the previous two school years indicates an increase in the composite score by 2 tenths. Math and science scores increased by 5 tenths and 6 tenths respectively. Analyzing the current 11th grade ACT scores with their prior PLAN scores shows a trend in increase of composite scores but a decrease in math and science scores. Student understanding of complex text and test taking skills can be contributed to the low sub and composite scores. To combat the challenge of inserting rigor in ELA and other literacy based classes.

13
The following will need to occur: ACT Prep Classes be offered in English and math ACT Boot Camp 4 Saturdays prior to each testing window. Kaplan ACT Practice books will be incorporated into ELA, math and intervention classes. TI-Inspire non-CAS calculator training for teachers and students Training for math teachers on how to incorporate ACT into their math and ELA curriculum The Real ACT Prep Guide will be incorporated into ELA, math and intervention classes. To facilitate the aforementioned improvements, core subject teachers will provide ACT tutoring.
The instructional coach will support ACT improvement efforts by keeping abreast of new trends in technology for math, receiving ACT training, and providing ongoing support to teachers. Field experiences such as college tours provide another strong learning experience for students with our demographic composure. For example, traveling to local and distant universities will expose students to a collegiate atmosphere, provide a context for college readiness standards from ACT, and motivate students to improve upon their academic standings. This would not only helps us increase graduation rate as students strive toward postsecondary learning opportunities, but will also drive students to increase their ACT scores as they become more selective in choosing which institute to attend.
Graduation Rate – Analyze the data and provide a summary of progress and challenges, identifying underlying reasons for each.
In 2012-2013 the graduation rate was 53.6%, which increased to 65.1% in the 2013-2014 school year. Although the graduation rate is still below the state goal of 90%, Melrose saw a greater increase in graduation rate than both the state and the district in 2014 school year. In the 2012 school year the state’s graduation rate was 86.3, and it increased to 87.2 in the 2013 school year. In 2012 Shelby County’s graduation rate was 67.6, and it increased to 74.6 in the 2013 school year. The graduation rate has not progressed due to cohort dropouts. The transient population possesses data tracking problems as it relates to diplomas completion rates. Sufficient progress has not been made to develop clear procedures to obtain documentation for student withdrawals. To increase the graduation rate by 10% each year, the instructional coach, as aforementioned, will monitor student progress with online course recovery classes. This assistance sharpens instructional focus for the cohort. The instructional coach will also provide professional development to classroom teachers on how to best support the graduating cohort with online coursework and by tracking graduation data.
SCHOOL CLIMATE and CULTURE
School Safety – Evaluate and summarize. School safety is an area that we pay close attention to at Melrose High School. We utilize daily metal detector checks for all students entering the building. This requires significant manpower to ensure that the screening process is efficient. Students found to consistently be in violation of safety policies will need to be supported by systemic in school behavior modification. This will not only decrease the number of incidents resulting in suspension to decrease school wide discipline, but will also address the overall attendance for Melrose High School. In addition to an instructional coach the students of this demographic composite would need a attendance analyst to provide support to students by tracking behavior and attendance data to ensure that students are given behavior plans to deter undesirable actions. During disciplinary hearings students who have not been giving the adequate support of a fully implemented behavior plan, but consistently display behavior issues float back and forward between alternative schools and their base high schools causing gaps in learning, inconsistent grading, and contribute not only to ongoing behavior issues,

14
but to a decrease in graduation rate. Overall this person would also implement the Positive Behavior Intervention Strategies (PBIS) school-wide. These strategies will assist us as we foster a climate of celebration in regards to teacher and students by acknowledging them throughout the year. We have three honors celebrations for students based off of nine-week grades. We have display boards for teacher and students of the week. We have academic display boards for students who make honor roll, principal’s honor roll, ACT 30 Plus, and Scholarship recipients. We also have teacher leadership opportunities.
Discipline – Evaluate and summarize disciplinary actions, suspensions, expulsions, etc. (by subgroups including racial/ethnic, ED, SWD, EL, male/female). This year the discipline referrals for males outweighed those of the female population as females accounted for 1239 referrals and males had 1566. The majority of the discipline leveed was to our freshman class which had 964 referrals. This was also our largest class at Melrose with 194 students. The administration worked with teachers to develop classroom management strategies that could be used to help reduce the number of referrals. The strategies were presented to teachers in the fall and again in February 2015. Teachers were asked to discuss their classroom management progressive discipline plans. Teachers were able to provide feedback on their view or classroom management issues versus those issues that would need to be handled by an administrator. Teachers noted that the amount of referrals that ended in a conference (parent or student) were marginally close in number to those of ISS and OSS. Overall there were 930 parent conferences held this school year, along with 997 In School Suspensions and 812 Out of School Suspensions issued.
TELL (or Other) Survey – Evaluate and summarize. The response rate for the Insight survey was 88%. Below are selected responses:
85% agreed that school leaders promote a safe and productive learning environment.
69% agreed that school leaders consistently support me in addressing student misbehavior when I have exhausted my classroom consequences
76% agreed they get enough feedback on their instructional practices.
69 % agreed that they receive support to implement changes from feedback (i.e someone models suggestions for me, I have time to practice outside of class).
46% reviewed the assessments their students were expected to take with other teachers or school
leaders.
86% agreed that professional development opportunities are well planned and facilitated.
86% agreed that the time spent collaborating with colleagues is productive.
69% agreed that the school has established systems that ensure families are well informed about the school and their student's progress.
57% agreed that the school encourages and helps families to support student learning at home.
The administration has conducted professional development sessions to discuss discipline issues within the school. The sessions provided teachers with guidelines for addressing student behavior issues in the classroom. The session also included how classroom management and instructional practices are tied together. Teachers expressed the need to receive direct instruction from an instructional coach of a member of the administrative team regarding the implementation of suggested instructional practices.
15
Parent & Student Surveys – How do you evaluate and analyze parent and student needs? Evaluate and summarize any survey results, if applicable. Results from the 2015 Tripod Survey signify that areas of strength and concerns for Melrose, as noted below.
56% of our students agree that teachers are caring 63% of our students agree that teachers are challenging 49% of our students agree that teachers have control 59% of our students agree that teachers clarify with multiple good explanations for difficult
material 50% of our students agree that teachers present captivating lessons 49% of our students agree that teachers confer knowledge through meaningful conversation with
students 58% of our students agree that teachers summarize lessons and check for understanding
Our understanding from this data is that areas of improvement are the following: Teachers need professional development in the areas of classroom management with our student
population Teachers need professional development in the areas of communicating with students to gain
insight from them
Other – Summarize other factors impacting climate and culture. Class sizes have often affect teacher productivity. The current ratio of 27:1 does not allow teachers to fully implement data analysis to the fullest. Having 170 to 200 students does not allow teachers to devote individualized instruction to the depth that is necessary to see growth in great increments. Teachers are asked to go deeper into their subject areas without being given the resources to complete the task.
ADDITIONAL AREAS
RTI2 / Student Interventions & Supports – How are timely interventions and student services provided to support individual needs? Students are provided specific skills intervention based on three-week cycles of common formative assessments. Students are then grouped based on skill level where they are given differentiated assignments to strengthen deficient areas. Students are also provided intervention twice a week for 50 minutes through ELA, science, and math classes. The master schedules incorporates classes for ELA and math students to receive intensive intervention throughout the year by being enrolled in addition math or ELA class geared towards targeting deficient skills by student. Academic specialists in reading and math will support the inventions schedule assisting in the initial stages. Student will be properly screened and placed into appropriately matched intervention and enrichment classes. These groups must be monitored throughout the year so that students who make improvements are tracked and given strategies tailored to their individual need. Most of the students who benefit from our intervention are those who are not meeting grade level expectations. The teachers will need support in aligning lessons with student deficit areas. The instructional coach will support teachers in lesson planning and curriculum alignment.
Professional Development – Describe your PD plan, how it focuses on improving instruction, and is aligned with student needs. Teacher leaders provide professional development once a month to the entire staff. The sessions focus on effective use of technology, implementation of literacy strategies and effective data tracking. Professional Development, school-wide, needs to take on a laser-focus to encompass all facets of learning for all sub groups. Students with disability continue to be our main subgroup of focus, professional development for
16
differentiation strategies for all teachers, technology enhancement for all teachers, and ongoing training for the newly devised TNReady standards is needed to sustaining overall success. Specifically, teachers need training on best-practice strategies on differentiation for students of all levels of academic achievement to support standard classes as well as interventions. All teachers will need to be continually updated on Smartboard technology to provide authentic student centered classroom experiences. Math teachers will need ongoing PD on the use of the TI-NSpire calculators. The instructional coach will need ongoing training for TNReady updates as the state unfolds revised standards. Academic coaches will need to professional development and ongoing support in data analysis to track student progress and recidivism.
Highly Qualified & Effective Teachers – Describe how you recruit, retain and evaluate teachers. Teachers will be interviewed based on the specific skill set outlined in the TEM Rubric. District partners, such as, Memphis Teacher Residency will provide additional growth feedback to teachers to address their specific areas of weaknesses. Teachers who exhibit leadership qualities will serve as capacity leaders within the building to develop the instructional skills of their peers. Teachers will follow the district observation model along with weekly walk-throughs from the school administrative team. In an effort to continue to attract highly qualified teachers to Melrose High School, we will solicit marketing support from Choose901 in order to communicate our mission. We are providing ongoing professional development; encouraging participation in local, state, and national professional development, providing a mentoring program, and establishing networks to build capacity. Teachers are provided TEM specific support based on deficiencies noted in observations. TEM 4.0 sessions are offered on the first Tuesday of every month. The sessions provide teachers with strategies that support tiered instruction. Teachers are encouraged to participate in quarterly book studies that focus on the implementation of engaging teaching strategies.
Parent and Community Involvement – Describe strengths and challenges around parent and community involvement.
Click here to enter text.Parents have access to Parent Link in order monitor and track the academic progress of
their child. The PTSA holds monthly meetings to address parent and student needs. The principal and administrative team attended the PTSA meetings to develop plans for address parental concerns or needs. College and Career fairs are held twice a year to provided students and parents with access to resources to that will help them make post-secondary decisions. There exist several strengths around parent and community involvement.
Many homeowners in the community have children and grandchildren who attend Melrose High School, categorizing MHS as a true community school minimizing transportation as a caveat for students and parents.
Many stakeholders are graduates of Melrose High School, thus they provide some small scholarships based upon merit to few students in the school.
There is also much interest surrounding sports at Melrose High School.
Challenges surrounding parent/community involvement relate mainly to the poverty level of our parent base.
The average household income is $23K for the 38114 zip code, with significantly above average population of single parent families.
The percentage of adults without high school diplomas is about 40%, and the average household income is 45% below the state average.
17
These limitations place an above average financial burden on the pupil expenditure for Melrose. With this state of poverty comes several challenges that adversely impact or school. Challenges, such as, gang activity, academic apathy, drug use, and teenage pregnancies. Melrose receives support from the SCS gang unit, Grassy. The members of this team meet with students who are facing the above-mentioned challenges. From those meeting the Grassy member seeks to help the student solve issues through conflict resolution and other non-violent tactics.
Communicating Assessment Results – How do you analyze and communicate assessment results to stakeholders? Teachers have access to Discovery Assessment tools that allow them to disaggregate the data by student. This data breakdown is discussed in PLC meetings that are held weekly. Teachers use All-In-Learning to disaggregate data from CFA assessments. The information is shared as Melrose follows the released of progress reports and report cards as outlined by Shelby County Schools.
Technology – Describe strengths and challenges around technology. Melrose has some technological advantages and several disadvantages.
There are five stationary computer labs throughout the building, with three in need of computer upgrades because they are running Windows 8.0 or earlier systems.
Students have blended learning devices at a ratio of 1 to 1; however, there is limited usability and limitations in wireless usage throughout the building because of the retrofitted wireless configuration within the building.
The students at Melrose High School do not have additional personnel whose expertise is in the field of computer technology to monitor the labs, plan, and schedule student usage for these labs.
PRIORITIZED LIST OF NEEDS
List, in priority order, your areas of need as identified through the needs assessment. Prioritizing needs will identify the most critical areas where your work will begin with the creation of goals and strategies.
Teachers will need to receive direct instruction to ensure they are able to effectively implement the feedback that they receive from informal and formal observations. The modeling strategies will be implemented through a lead teacher on staff who will work with teachers based on the instructional needs identified through observations.
Teachers will also receive data analyzing and implementation training.
Students who are performing below proficiency in English, science and math will be offered Saturday school intervention twice a month.
ACT tutoring will be available twice a month for all students in grades 9-12.
TNReady Assessment tutoring will be available twice a month for all students in grades 9-12.
Thursday school will occur as a means to tutor students who have discipline issues and thus miss class due to those issues.

18
English, math and science classes will be equipped with technology upon request to be used by students to teach and reinforce fundamental literacy concepts and skills so students are able to learn successfully at their own level.
All teachers will participate in high quality, on-going professional development on the TEM framework and evaluation process to improve their instructional effectiveness.
Teachers will participate in weekly PLC data meetings to analyze weekly assessment results and to determine strategies to move students from below proficiency to proficiency.

19
Transformation Model
School Name: Melrose High School
Comprehensive Needs Assessment:
1. What overall conclusions can be drawn from the needs assessment?
2. How does the selected intervention model align with the school’s needs?
Teachers will need specific professional development targeted towards analyzing data and the implementation of tiered instruction.
1. If the LEA has begun in whole or in part a school improvement intervention model during the current school year (SY 2014-15) or during the two years
prior, and wishes to continue, describe the actions that have been taken up to the present that are relative to the intervention model. Cite evidence of the
impact of the model on the school to date.
- The LEA began an intervention model for Melrose High School by changing the Principal of the school, staffing the school with teachers of higher
quality based off of performance records, and providing an additional hour of study to each day. The additional school hour provide the school with
an opportunity to incorporate a class schedule that provided an intervention period for students in English I, II, III, students in both Algebra II and
Biology. Quarterly Assessment data showed signs of significant gains in Algebra I and modest gains in English I, II, and Biology.
Annual Goals for Reading/Language Arts on State assessments for “all students” group.
1. SY 2015-2016: Student proficiency percentages for all students will increase from 28% to 38% Proficient/Advance in English I.
Student proficiency percentages for all students will increase from 27% to 37% Proficient/Advance in English II.
Student proficiency percentages for all students will increase from 18% to 28% Proficient/Advance in English III.
2. SY 2016-2017: Student proficiency percentages for all students will increase from 38% to 48% Proficient/Advance in English I.
Student proficiency percentages for all students will increase from 37% to 44% Proficient/Advance in English II.
Student proficiency percentages for all students will increase from 28% to 38% Proficient/Advance in English III.
3. SY 2017-2018: Student proficiency percentages for all students will increase from 48% to 55% Proficient/Advance in English I.
Student proficiency percentages for all students will increase from 44% to 50% Proficient/Advance in English II.
Student proficiency percentages for all students will increase from 38% to 48% Proficient/Advance in English III.

20
Quarterly Milestones – Reading/Language Arts
1. What formative assessment/s will the LEA consistently use at least quarterly to measure student progress?
- With the shift to TN Ready Standards and assessments, the school will utilize teacher made quarterly assessments based off of the state standards and
school pacing guide. The school will also utilize the district provided assessment tool for comparison.
2. What are quarterly milestone goals for reading/language arts on formative assessments for the “all students” group for School-Year 2015-2016? (to be
updated annually for renewal of the grant)
September 2015
Identify students that are at least 2% points above or below proficient cut score based on the 2015 EOC assessment for possible intervention.
Administer diagnostic assessment in all ELA tested courses in order to determine tiered instruction groups.
Every test taker will take common formative assessments every three weeks with 65% of students scoring proficient.
Administer district mandated formative assessment with 30% of students scoring proficient or higher in English I, 30% of students scoring proficient or
higher in English II, and 20% of students scoring proficient or higher in English III.
November 2015
Administer common formative assessments every three weeks to every test taker with 70% of students scoring proficient.
Increase the number of students scoring proficient an additional 4% on the formative assessment.
Administer district mandated formative assessment with 34% of students scoring proficient or higher in English I, 34% of students scoring proficient or
higher in English II, and 25% of students scoring proficient or higher in English III.
March 2015
Administer common formative assessments every three weeks to every test taker with 75% of students scoring proficient.
Increase the number of students scoring proficient an additional 3-4% or higher on the formative assessment.
Administer district mandated formative assessment with 38% of students scoring proficient or higher in English I, 37% of students scoring proficient or
higher in English II, and 28% of students scoring proficient or higher in English III.
May 2015
Administer common formative assessment with 75% of students scoring proficient.
The percent of every test taker scoring proficient on the EOC will increase by 10% in 2016.

21
Annual Goals for mathematics on State assessments for “all students” group.
1. School Year (SY) 2015-2016: Student proficiency percentages for all students will increase from 55% to 62% Proficient/Advance in Algebra I.
Student proficiency percentages for all students will increase from 26% to 33% Proficient/Advance in Algebra II.
2. SY 2016-2017: Student proficiency percentages for all students will increase from 62% to 69% Proficient/Advance in Algebra I.
Student proficiency percentages for all students will increase from 33% to 40% Proficient/Advance in Algebra II.
3. SY 2017-2018: Student proficiency percentages for all students will increase from 69% to 75% Proficient/Advance in Algebra I.
Student proficiency percentages for all students will increase from 40% to 47% Proficient/Advance in Algebra II.
Quarterly Milestones – Mathematics
1. What formative assessment will the LEA consistently use at least quarterly to measure student progress?
- With the shift to TN Ready Standards and assessments, the school will utilize teacher made quarterly assessments based off of the state standards and
school pacing guide. The school will also utilize the district provided assessment tool for comparison.
2. What are quarterly milestone goals for reading/language arts on formative assessments for the “all students” group for School-Year 2015-2016? (to be
updated annually for renewal of the grant)
September 2015
Identify students that are at least 2% points above or below proficient cut score based on the 2015 EOC assessment for possible intervention.
Administer diagnostic assessment in all ELA tested courses in order to determine tiered instruction groups.
Every test taker will take common formative assessments every three weeks with 65% of students scoring proficient.
Administer district mandated formative assessment with 54% of students scoring proficient or higher in Algebra I and 26% of students scoring proficient or
higher in Algebra II.
November 2015
Administer common formative assessments every three weeks to every test taker with 70% of students scoring proficient.
Increase the number of students scoring proficient an additional 3-4% on the formative assessment.
Administer district mandated formative assessment with 58% of students scoring proficient or higher in Algebra I and 30% of students scoring proficient or
higher in Algebra II.
22
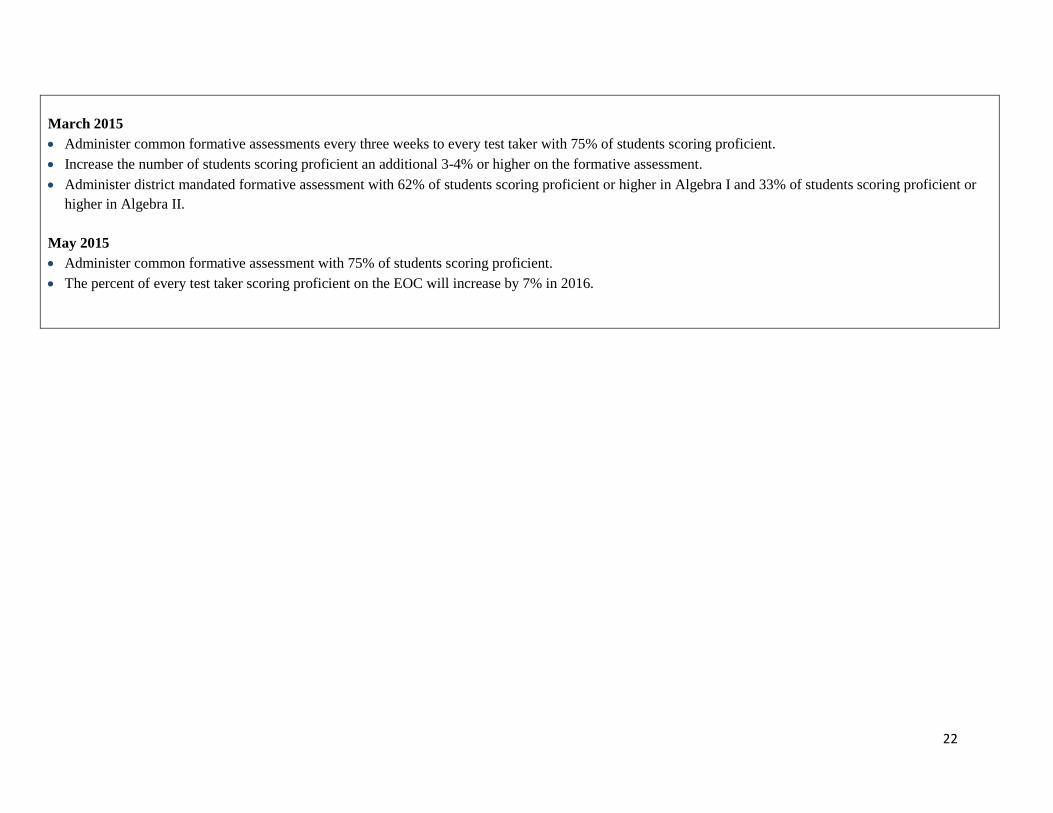
March 2015
Administer common formative assessments every three weeks to every test taker with 75% of students scoring proficient.
Increase the number of students scoring proficient an additional 3-4% or higher on the formative assessment.
Administer district mandated formative assessment with 62% of students scoring proficient or higher in Algebra I and 33% of students scoring proficient or
higher in Algebra II.
May 2015
Administer common formative assessment with 75% of students scoring proficient.
The percent of every test taker scoring proficient on the EOC will increase by 7% in 2016.
23
Transformation Model
Requirements for the Transformation Model (LEA must implement actions 1-11.)
A plan of action and a timeline for implementation are required for each element.
If the LEA elects to implement the grant during a three-year period, please ensure that the timeline for full implementation begins at the start of the
first school year and continues for the two subsequent years.
If the LEA elects to implement the grant during the five-year period, please ensure that the timeframe includes a year for planning, three years of full
implementation and a year of sustainability or three years of full implementation and two years of sustainability.
A transformation model is one in which the LEA must implement each of the following strategies to develop and increase teacher and school leader
effectiveness:
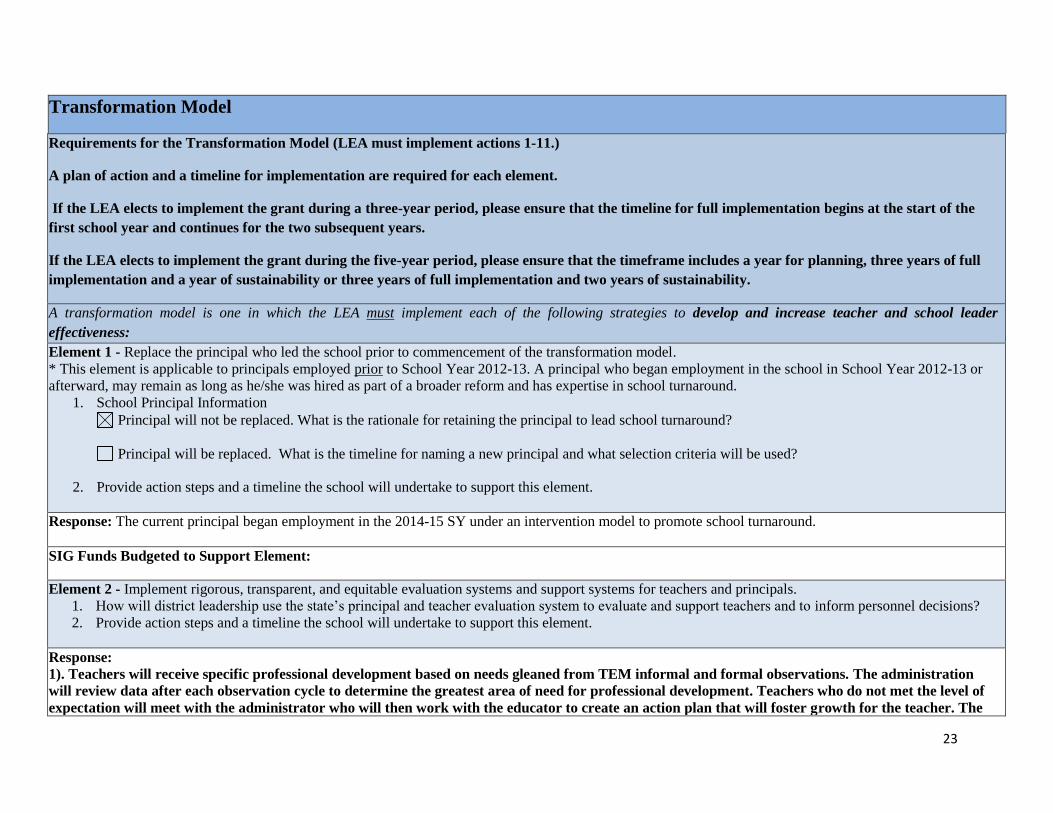
Element 1 - Replace the principal who led the school prior to commencement of the transformation model.
* This element is applicable to principals employed prior to School Year 2012-13. A principal who began employment in the school in School Year 2012-13 or
afterward, may remain as long as he/she was hired as part of a broader reform and has expertise in school turnaround.
1. School Principal Information
Principal will not be replaced. What is the rationale for retaining the principal to lead school turnaround?
Principal will be replaced. What is the timeline for naming a new principal and what selection criteria will be used?
2. Provide action steps and a timeline the school will undertake to support this element.
Response: The current principal began employment in the 2014-15 SY under an intervention model to promote school turnaround.
SIG Funds Budgeted to Support Element:
Element 2 - Implement rigorous, transparent, and equitable evaluation systems and support systems for teachers and principals.
1. How will district leadership use the state’s principal and teacher evaluation system to evaluate and support teachers and to inform personnel decisions?
2. Provide action steps and a timeline the school will undertake to support this element.
Response:
1). Teachers will receive specific professional development based on needs gleaned from TEM informal and formal observations. The administration
will review data after each observation cycle to determine the greatest area of need for professional development. Teachers who do not met the level of
expectation will meet with the administrator who will then work with the educator to create an action plan that will foster growth for the teacher. The

24
Transformation Model
educator will then implement the feedback within one week of the meeting. The implementation of the feedback will also provide modeling of the
instructional practice for the educator. The administrator will conduct an informal observation to determine growth and next steps. If the educator has
not shown growth, the administrator will then require the educator to conduct peer observations or reflective practice of a current lesson. The reflective
practice will provide the educator with an opportunity to see the feedback in action and discuss possible areas of growth. Informal observations will be
used in conjunction with formal observations.
2) The number of formal observations varies based on the teachers TEM observation rating from the previous year. Novice teacher receive four
observations a year while TEM Level 5 teachers receive two. Teachers receive 50% of their announced/unannounced observations in the first semester
of school and the remaining observations during the second semester.
The school will also hire an Instructional Coach to coordinate, facilitate, and provide professional development for the staff in order to ensure that
students are receiving effecting teaching that meets their individual needs. The Instructional Coach will begin work with the staff in August 2015 and
continue with professional development through May 2016 of the next school year. May 2016 will mark the next phase for instructional planning for the
next school year.
SIG Funds Budgeted to Support Element:
Element 3 - Use teacher and principal evaluation and support system to identify and reward school leaders, teachers, and other staff who, in implementing this
model, have increased student achievement and high-school graduation rates and identify and remove those who, after ample opportunities have been provided
for them to improve their professional practice, have not done so.
1. What criteria will be used to identify and reward school leaders, teachers and other staff?
2. What criteria will be used to determine those who are in need of improvement?
3. What is the length of time teachers will be afforded an opportunity to improve professional practice before being released?
4. Provide action steps and a timeline the school will undertake to support this element.
Response:
1) THE TEAM Rubric will be the observation tool for the administration, and the teachers will be measured using the TEM rubric. State TVAAS levels
will also be used to identify staff members eligible for rewards. If performance expectations are met with double digit gains the following will be
awarded to each staff member: Principals will receive 6,000; Assistant Principals will receive 4,000; Teachers will receive 3,000; Paraprofessionals will
receive 1,500, and all non-instructional support and other building personnel will receive 1,000.
The administration will evaluate student growth data from teacher and district-aligned assessments to determine how teachers are impacting student
growth throughout the school year. Data from those assessments will be compared to district and state goals that will allow the school leaders to
determine growth throughout the school year.
25
Transformation Model
2) The administration will use formal and informal observation data to determine teachers who are in need of improvement. Teachers who score below
expectations in any indicator on the TEM rubric will be targeted for PD and instructional support.
3) The administration will use the district observation model to set clear goals and measures for employees’ performance that reflect the established
evaluation system and provide targeted training or assistance for an employee receiving unsatisfactory evaluations or benchmark results. Teachers will
receive up to two weeks for improvement between each observation to ensure that he or she has time to implement the recommended changes. Support
to implement changes will be provided after each observation and throughout the school year. Teachers who fall below expectations of the TEM Level 3
at the end of the school year will be released from the school.
4) The administration will use the district observation model to set clear goals and measures for employees’ performance that reflect the established
evaluation system and provide targeted training or assistance for an employee receiving unsatisfactory evaluations or benchmark results. Teachers will
receive up to two weeks for improvement between each observation to ensure that he or she has time to implement the recommended changes. The
number of formal observations varies based on the teachers TEM observation rating from the previous year. Novice teachers receive four observations
a year while TEM Level 5 teachers receive two. Teachers receive 50% of their announced/unannounced observations in the first semester of school and
the remaining observations during the second semester. Teachers who fail to meet the expectation mark of TEM Level 3 by the end of the school year
will be released from the school.
SIG Funds Budgeted to Support Element:
Performance Bonus – 100,000
Element 4 - Implement strategies such as financial incentives, increased opportunities for promotion and career growth, and more flexible work conditions that
are designed to recruit, place and retain staff with the necessary skills to meet the needs of students in the school, taking into consideration the results from the
teacher and principal evaluation and support system.
1. What strategies will be utilized to recruit and place staff?
2. What strategies will be utilized to retain staff?
3. How will the results of the state teacher and principal evaluation and support system be utilized?
4. Provide action steps and a timeline the school will undertake to support this element.
Response:
1) Marketing strategies with local agency and the school’s marketing department will allow stakeholders to see the growth and changes being
implemented at Melrose High School. Perspective teachers will also be interviewed in panel style in order for them to discuss their ideas with their
26
Transformation Model
perspective colleagues. During the interview the educator will teach a mini-lesson in order to determine the appropriate grade and subject level
placement. Local partnership with area businesses will also allow the promotion of school culture that will become a recruitment tool during
interviews. Teachers will also receive a $1,000 signing bonus for agreeing to work at Melrose High School. Administrators will receive a $3,000 bonus.
2) Once effective staffing has taken place, those teachers will receive performance stipends for growth. Teachers will receive targeted professional
development based off of observation data to ensure they have ample opportunities for growth. PD opportunities will take place on and off site in order
to provide teachers with multiple perspectives in enhancing their practices in a high needs environment. Professional development plans will be
provided for teachers who are experiencing struggles or seeking enrichment throughout the school year. Teachers who meet the expectations according
to TEM will receive a retention bonus of $1,000 for continuing to work at Melrose High School. Administrators will receive a bonus of $3,000.
3) Teacher and administrative observation data will be utilized to determine eligibility of employment. Employees must score a minimum of Level 3 on
the observation rubric.
4) The administration will use the district observation model to set clear goals and measures for employees’ performance that reflect the established
evaluation system and provide targeted training or assistance for an employee receiving unsatisfactory evaluations or benchmark results. Teachers will
receive up to two weeks for improvement between each observation to ensure that he or she has time to implement the recommended changes. The
number of formal observations varies based on the teachers TEM observation rating from the previous year. Novice teachers receive four observations
a year while TEM Level 5 teachers receive two. Teachers receive 50% of their announced/unannounced observations in the first semester of school and
the remaining observations during the second semester. Teachers and administrators who fail to meet the expectation mark of TEM/TEAM Level 3 by
the end of the school year will be released from the school.
SIG Funds Budgeted to Support Element:
Signing and retention bonus -$98,956.00
A transformation model is one which the LEA must implement each of the following comprehensive instructional reform strategies.
Element 5: Use data to identify and implement an instructional program that is research-based and “vertically aligned” from one grade to the next as well as
aligned with State academic standards.
1. How will the school use data to ensure that its instructional program is research-based and in vertical alignment from grade to grade and with state
academic standards?
2. Provide action steps and a timeline the school will undertake to support this element.
27
Transformation Model
Response: The school will focus on providing students’ tiered tracks of study based on their proficiencies levels. Incoming 9th
grade students will be
assigned to Honors/AP, standard, or intervention tracks of study. The intervention track will schedule up to 50 9th
grade students (25% of the
population) into a math and ELA content development class. The students will take one semester of ELA and math support during the school year.
Standard track students will follow a course that offers credits to satisfy graduation requirements and they will have an opportunity to move into the
honors or intervention tracks based on their performance. Honors/AP track students will follow the most rigorous course of study with a focus on ACT
preparation and college visits.
The incoming 9th
grade students will be an area of focus in order to give us a 4-year timeline to improve school performance levels on state assessments,
ACT scores, graduation rates, college scholarship awards, and post-secondary placements starting with the 2015-16 SY. During this 4-year cycle,
intervention and enrichment will be provided through daily instruction for some students. It will also be provided through a bi-weekly Saturday school
program for ACT prep or ELA, Math, and Science remediation.
SIG Funds Budgeted to Support Element:
Tutoring & formative assessment -$15,601
Element 6: Promote the continuous use of student data (such as from formative, interim, and summative assessments) to inform and differentiate instruction in
order to meet the academic needs of individual students.
1. How will the school differentiate instruction to meet the needs of individual students?
2. Provide action steps and a timeline the school will undertake to support this element.
Response:
1) The school will require core subject teachers to administer a diagnostic assessment to start the year. Students will also participate in a reading
assessment in order to identify their current reading levels for differentiation of instruction. This beginning of the year data will be coupled with data
from previous year performance and IEP’s in order to assign students to tiered cohort tracks of instruction (Honors/AP, Standard, and Intervention).
The school will implement a school-wide intervention plan based off teacher formative assessment and standardized quarterly assessments. This will
allow teachers to provide 50 minutes a week of academic support to 25-30 of their individual students in English I, English II, English III, Algebra I,
Algebra II, Geometry, and Biology students. Core subject teachers will receive support from the Instructional Coach and Reading Specialist in
identifying intervention students and facilitating tiered instruction.
2) - Purchase READ 180 program in August 2015
- Diagnostic assessments will occur between August 17 – Sept 1
- Quarterly assessments will occur during the first three grading periods
- Common formative assessments will occur every three weeks starting August 24

28
Transformation Model
SIG Funds Budgeted to Support Element:
Instructional supplies - $47,079.00
Element 7: Provide staff with ongoing, high-quality, job-embedded professional development that is aligned with the school’s comprehensive
instructional program and designed with school staff to ensure that they are equipped to facilitate effective teaching and learning and have the capacity
to successfully implement school reform strategies.
1. How will the plan for on-going, job-embedded professional development be developed, how will it be delivered, and what will be the specific areas of
focus for the first year of the grant? (To be updated each year prior to the renewal of the grant.)
2. Provide action steps and a timeline the school will undertake to support this element.
Response:
1) The school-wide PD plan will focus on supporting teacher growth by focusing on data disaggregation, TN Ready Standards and school-wide literacy,
as well as, providing instructional strategies around tiered instruction and center-based classrooms. The administration will create a PD calendar for all
faculty members that will notate required and optional PD throughout the school year. The PD calendar will remain fluid to a degree in order to allow
for teacher input on what PD is needed, as well as, adjustments based off of observation and culture/climate data. Core subject teachers will have
weekly PLC meetings during their planning periods to further discuss PD plans and disaggregate student data. The school will create a leadership team
from all academic departments in order to receive multiple perspectives on school culture in regards to academics.
2) August In-service = PD over school vision/mission, norms, operating procedures, culture, discipline, school data, curriculum standards, and
instructional practices.
September – May = PD over instructional practices with a focus on school data, literacy, curriculum standards, and instructional practices.
SIG Funds Budgeted to Support Element:
Stipends & PD -$43,919.00
A transformation model is one which the LEA must implement each of the following strategies to increase learning time and create community-oriented
schools.
Element 8: Establish schedules and implement strategies that provide increased learning time as defined in the SIG final requirements.

29
Transformation Model
1. Describe the school’s plan to increase learning time for all students including the number of minutes to be added to the day, week, month or year for
a. all students to receive additional time for core academic instruction,
b. all students to receive an opportunity for instruction in non-core subjects enrichment,
c. teachers to collaborate and plan.
2. Provide action steps and a timeline the school will undertake to support this element.
Response:
1) The school will operate with an additional 60 minutes added to the school day. The extra minutes will allow each class period to be extended in order
to allow tiered instruction, centers, and project based learning to be appropriately implemented on a daily basis. Targeted students from assessment
data will receive additional support in core subjects once a week for remediation while the rest of the student body participates in a school-wide literacy
block. This literacy block will also allow for enrichment opportunities for high performing students. Teachers will also offer 60 minutes a week of after-
school tutoring for students, and some teachers will offer Saturday school bi-weekly for remediation and enrichment opportunities from 9-11am.
SIG Funds Budgeted to Support Element:
Extended day & salaries and benefits -$521,176.00
Element 9: Provide ongoing mechanisms for family and community engagement.
1. What mechanisms will be put in place to ensure family and community engagement?
2. Provide an overview of the plan for family and community engagement and a timeline the school will undertake to support this element.
Response:
1) The school will employ a Behavior and Attendance Specialist in order to inform parents of behaviors that have positive and adverse effects on the
school and student performance. The Behavior and Attendance Specialist will work with the administration to strengthen relationships with the
community. The administration will also work with the PTSA and host monthly meetings for the community. We will hold quarterly parent meetings at
night on various topics, such as, school-wide data, tiered academic tracks, parental involvement, gang awareness, and attendance trends. We will also
create parent involvement groups to promote involvement.
2) August 2015: To combat some of the ailments of our community, we will create a parent resource room in order to provide information on jobs,
community resources, and GED programs. The community resource room will also have a food bank and clothes closet inside.
The Behavior and Attendance Specialist will work a 10-month teacher schedule and develop a caseload of “at-risk” students based off of disciplinary
referrals, attendance, and academic performance to provide targeted support in order to increase the student’s graduation potential and post-secondary
30
Transformation Model
options.
SIG Funds Budgeted to Support Element: Behavior and Attendance Specialist $51,946.00
Student Transportation $21,200.00
A transformation model is one which the LEA must implement each of the following strategies to provide operational flexibility and sustained support.
Element 10: Give the school sufficient operational flexibility (such as staffing, calendars/time, and budgeting) to implement fully a comprehensive approach to
substantially improve student achievement outcomes and increase high school graduation rates.
1. What operational flexibilities have been given to the school to ensure increased student achievement?
2. Provide action steps and a timeline the school will undertake to support this element.
Response:
1) The addition of an extra hour to enhance the quality of classroom instruction by providing tiered support and centers in all core courses. All core
subject teachers will have common planning built into the master schedule in order to foster PLC work on a weekly basis. The school will also provide a
bi-weekly Saturday school program for intervention and ACT enrichment. The intervention program will help students stay on track with the
graduation cohort while the ACT prep will improve student acceptance of scholarships to post-secondary institutions.
SIG Funds Budgeted to Support Element:
Element 11: Ensure that the school receives ongoing, intensive technical assistance and related support from the LEA, the SEA, or a designated external lead
partner organization (such as a school turnaround organization or an EMO).
1. What ongoing support is provided to the school from the district level?
2. If the school is partnering with an external organization, what type of support will be provided? Please include the name of the partner and ensure
that the selection process is provided in the LEA application.
3. Provide action steps and a timeline the school will undertake to support this element.
Response:
1) The school will provide its master schedule to the district in order to promote monthly learning walks in order to promote teacher growth. The
district has academic content coaches to provide PD support and recommendations for teachers based off of observations. The school will also partner
with community organizations in order to market the work of the school, provide field experiences for students, and incentives for teachers and students
for reaching set academic benchmarks. This ongoing support is provided by various departments with our LEA including: iZone Instructional Advisors
31
Transformation Model
and Coaches, Federal Programs, Exceptional Children, and Curriculum and Instruction.
3) The ongoing support from the various District offices is ongoing throughout the school year. PD is provided to school administration and teacher
leaders from June – August to prepare for the upcoming school year. Further PD is provided from August – May for all school employees.
SIG Funds Budgeted to Support Element:
Permissible Elements for the Implementation of the Transformation Model - Optional
While elements 12-25 are not required, the school may select from the list below, strategies that the school will implement as part of its transformation
plan.

32
Transformation Model
12. Providing additional compensation to attract and retain staff with the skills necessary to meet the needs of the students in a transformation school
13. Instituting a system for measuring changes in instructional practices resulting from professional development
14. Ensuring that the school is not required to accept a teacher without the mutual consent of the teacher and principal, regardless of the teacher’s seniority
15. Conducting periodic reviews to ensure that the curriculum is being implemented with fidelity, is having the intended impact on student achievement, and
is modified if ineffective
16. Implementing a school wide “response-to-intervention” model
17. Providing additional supports and professional development to teachers and principals in order to implement effective strategies to support students with
disabilities in the least restrictive environment and to ensure that limited English proficient students acquire language skills to master academic content
18. Using and integrating technology-based supports and interventions as part of the instructional program
19. In secondary schools--
(a) Increasing rigor by offering opportunities for students to enroll in advanced coursework (such as Advanced Placement or International
Baccalaureate; or science, technology, engineering, and mathematics courses, especially those that incorporate rigorous and relevant project-,
inquiry-, or design-based contextual learning opportunities), early-college high schools, dual enrollment programs, or thematic learning
academies that prepare students for college and careers, including by providing appropriate supports designed to ensure that low-achieving
students can take advantage of these programs and coursework
(b) Improving student transition from middle to high school through summer transition programs or freshman academies
(c) Increasing graduation rates through, for example, credit-recovery programs, re-engagement strategies, smaller learning communities,
competency-based instruction and performance-based assessments, and acceleration of basic reading and mathematics skills;
(d) Establishing early-warning systems to identify students who may be at risk of failing to achieve to high standards or graduate
20. Partnering with parents and parent organizations, faith- and community-based organizations, health clinics, other State or local agencies, and others to
create safe school environments that meet students’ social, emotional, and health needs
21. Extending or restructuring the school day so as to add time for such strategies as advisory periods that build relationships between students, faculty, and
other school staff
22. Implementing approaches to improve school climate and discipline, such as implementing a system of positive behavioral supports or taking steps to
eliminate bullying and student harassment
23. Expanding the school program to offer full-day kindergarten or pre-kindergarten
24. Allowing the school to be run under a new governance arrangement, such as a turnaround division within the LEA or SEA
25. Implementing a per-pupil school-based budget formula that is weighted based on student needs
Optional: From the list above, list strategies that the school will implement as part of its transformation model. For each strategy, provide the action steps and a
timeline for implementation.
Response:

33
Transformation Model
SIG Funds Budgeted to Support Element:
Planning Activities:
Planning allows the LEA to spend one year (School Year 2015-16) in preparation for full implementation of a school intervention model. In light of the
fact that LEAs received a Priority Schools Planning Grant, it is expected that a planning year will be needed only in special circumstances.
Planning activities must align to schools’ needs assessment and elements of the selected interventions.
Please provide a list of activities, action steps and a timeline the school will undertake during the planning year.
Response:
SIG Funds Budgeted to Support Element:

34