Annual report and accounts 2014 - Abrdn
306
Annual report and accounts 2014 Standard Life plc
-
Upload
khangminh22 -
Category
Documents
-
view
0 -
download
0
Transcript of Annual report and accounts 2014 - Abrdn
Annual report and accounts 2014Standard Life plc

Group financial highlights
Assets under administrationfrom continuing operations
2012 2013 2014
£296.6bn
£214.7bn£188.3bn
Total net �ows fromcontinuing operations
£1.0bn
£8.8bn
£5.5bn
2012 2013 2014
Group underlying cash generation from continuing operations
£408m
£336m£304m
2012 2013 2014
Group operating pro�t before tax from continuing operations
Underlying UK professional indemnity insurance claimUK and Europe operating assumption changes
2012 2013 2014
£506m
£604m
17.03 penceper share1
Full year dividend (subjectto shareholder approval)
73 penceper shareReturn of value following sale of our Canadian business(subject to shareholder approval)
£503m IFRS profit after tax attributableto equity holders (up 8%)
If you want to know the definitions for these financial terms, you will find them in the glossary on pages 296 to 301.
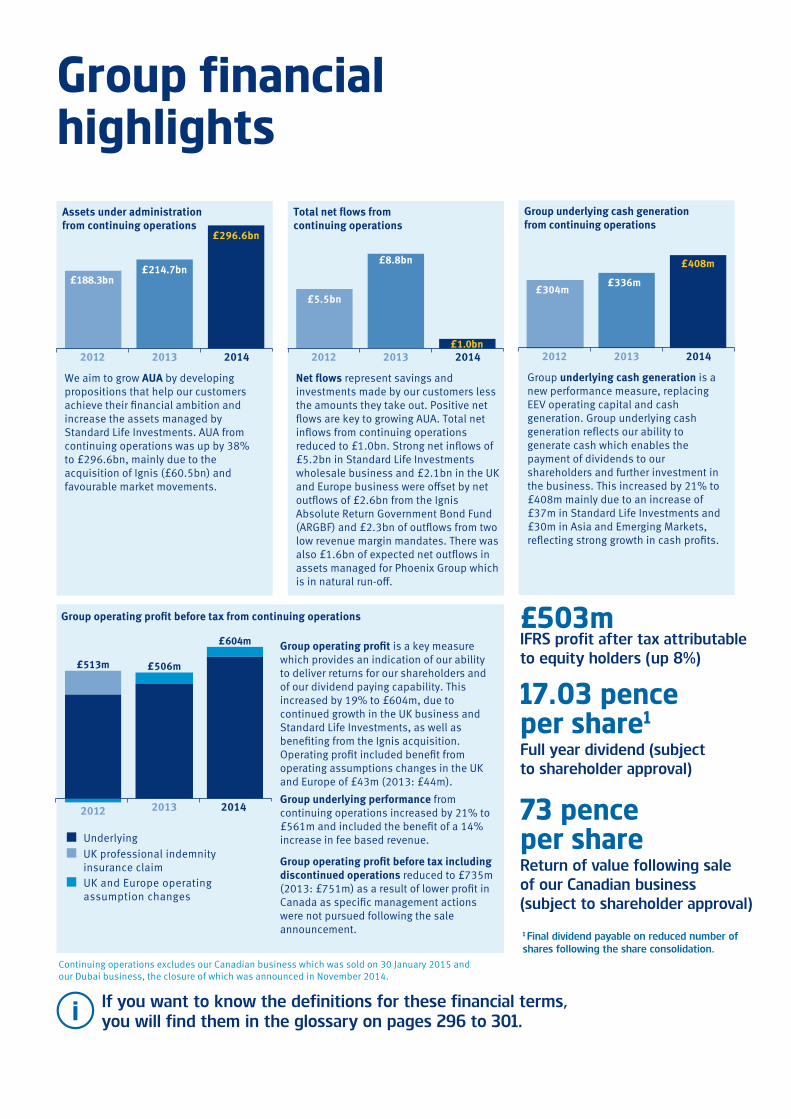
We aim to grow AUA by developing propositions that help our customers achieve their �nancial ambition and increase the assets managed by Standard Life Investments. AUA from continuing operations was up by 38% to £296.6bn, mainly due to the acquisition of Ignis (£60.5bn) and favourable market movements.
Net �ows represent savings and investments made by our customers less the amounts they take out. Positive net �ows are key to growing AUA. Total net in�ows from continuing operations reduced to £1.0bn. Strong net in�ows of £5.2bn in Standard Life Investments wholesale business and £2.1bn in the UK and Europe business were o�set by net out�ows of £2.6bn from the Ignis Absolute Return Government Bond Fund (ARGBF) and £2.3bn of out�ows from two low revenue margin mandates. There was also £1.6bn of expected net out�ows in assets managed for Phoenix Group which is in natural run-o�.
Group operating pro�t is a key measure which provides an indication of our ability to deliver returns for our shareholders and of our dividend paying capability. This increased by 19% to £604m, due to continued growth in the UK business and Standard Life Investments, as well as bene�ting from the Ignis acquisition. Operating pro�t included bene�t from operating assumptions changes in the UK and Europe of £43m (2013: £44m).Group underlying performance from continuing operations increased by 21% to £561m and included the bene�t of a 14% increase in fee based revenue.
Group operating pro�t before tax including discontinued operations reduced to £735m (2013: £751m) as a result of lower pro�t in Canada as speci�c management actions were not pursued following the sale announcement.
Group underlying cash generation is a new performance measure, replacing EEV operating capital and cash generation. Group underlying cash generation re�ects our ability to generate cash which enables the payment of dividends to our shareholders and �rther investment in the business. This increased by 21% to £408m mainly due to an increase of £37m in Standard Life Investments and £30m in Asia and Emerging Markets, re�ecting strong growth in cash pro�ts.
£513m
Continuing operations excludes our Canadian business which was sold on 30 January 2015 and our Dubai business, the closure of which was announced in November 2014.
1 Final dividend payable on reduced number ofshares following the share consolidation.
Contents
Chairman’s statement
The Chairman shares his views on our performance, the relevant issues affecting our business and how we operate. Page
Chairman’s statement 4
1. Strategic report
A narrative review of the Group’s performance that includes an overview from the Chief Executive and Chief Financial Officer and details of our individual businesses. You can also find out about our approach to risk management and sustainability.
Chief Executive’s overview 5 Group key financial performance indicators 8
Chief Financial Officer’s overview 9
Business segment performance
Standard Life Investments UK and Europe Asia and Emerging Markets Discontinued operations
15
Principal risks and uncertainties 26
Our sustainable business overview 30
Basis of preparation 36
2. Governance information Good governance is part of ensuring we operate responsibly and act in the interests of our shareholders. In this section you can find out more about our Directors’ background and experience, their specific responsibilities in relation to the Annual report and accounts, the key parts of our governance framework and how it was implemented during 2014 as well as reports from the various Board committees. You can also find out about our approach to Directors’ remuneration and the results of how our Remuneration Policy was carried out during 2014. Board of Directors 37 Directors’ report 40
Directors’ responsibilities 47
Corporate governance 48
Directors’ remuneration report 71
3. Financial information
The Group’s IFRS financial statements and EEV financial information which include detailed analysis of the Group’s performance, assets and liabilities. You will also find additional analysis of the Group’s assets under administration and net flows and the Company financial statements.
Group financial statements Page
Independent auditors’ report – Group financial statements 103
Group primary statements 110
Group accounting policies 116
Notes to the Group financial statements 135
European Embedded Value (EEV) financial information
Independent auditors’ report – EEV financial information 238
EEV primary statements 240
Notes to the EEV financial information 243
Company financial statements
Independent auditors’ report – Company financial statements 257
Company primary statements 259
Company accounting policies 263
Notes to the Company financial statements 270
Supplementary information
Supplementary Information 285
4. Other information Further information for shareholders such as our financial calendar and how to get in touch. Shareholder information 294
Glossary 296
Contact details 302

Chairman’s statement
Chairman’s statement Transforming Standard Life In recent years, Standard Life has undergone a dramatic transformation. We have changed from being Europe’s largest mutual insurance company to one focused on providing investment solutions to customers and clients around the world. 2014 marked a major step in this transformation and is one of the most significant years in our company’s 190-year history. We bought Ignis Asset Management in the UK, agreed the sale of our long-standing Canadian business to Manulife, and we are in the process of returning around £1.75 billion to our shareholders. It’s been a busy year.
I’m pleased to confirm another year of increased dividends, with our final dividend of 11.43p per share (up 8.0% on 2013) giving a total dividend for 2014 of 17.03p per share (up 7.8% on 2013). If approved at our AGM in May this year, this is due to be paid to shareholders on 19 May 2015.
When Standard Life was floated on the Stock Market in 2006, our market value was around £4.6 billion. By the time the return of value is completed and this year’s dividend is paid, we will have distributed £4.6 billion to shareholders and yet our market value should still far exceed where we started. Our financial position is strong and will remain so once Solvency 2 is introduced. The world is an uncertain and increasingly fragmented place and our financial strength is a source of considerable competitive advantage for us. We intend to keep on growing the value of your company.
2014 wasn’t just a year of corporate activity because it also witnessed some very dramatic changes in the UK savings and pensions market. Years of complex regulations were swept away by the Government and people will shortly have far greater freedom over what they can do with the pension savings they build up over their lives. Auto enrolment is encouraging people to save, and the changes make it even more attractive to do so. This is all great news. Giving people the ability to have more control and choice in planning their finances for retirement is a very positive thing. We have developed competitive pension propositions that offer customers alternatives to annuities and this makes us well placed to make the most of these opportunities. We also believe strongly in advice and guidance for customers to help them make their choices.
The sale of our Canadian business reduces the volatility of our earnings by greatly increasing the proportion of our earnings coming from asset management and fee based business. This change lies at the core of our strategy. Standard Life Investments started life as the investment department of an insurance company. It is now firmly at the heart of our strategy providing investment solutions to clients globally, and this is coupled with our powerful UK distribution business, which is a market leader in corporate pensions and a very important participant in the UK savings market.
2014 was also the year in which the Scottish people voted to stay part of the United Kingdom. Our role was not to tell people how to vote, but we did feel that it was right for us to spell out what we would have to do to protect our customers’ and shareholders’ interests, if the areas of concern we highlighted about constitutional change were not addressed. Our comments were noticed, broadly remarked upon, and respected. We continue to monitor very closely the impact of the further powers that will be transferred to Scotland. We support practical changes which benefit Scotland and Scottish companies provided that the unity of the UK Single Market is retained. Almost 90% of our UK customers live in England, Wales and Northern Ireland whilst the majority of our people are based in Scotland, so this is very important to us.
Standard Life Investments continues to expand globally and had another very successful year. Our German and Irish businesses have continued to grow. Our joint venture business in China operates in 74 cities and reported a profit for the first time, which is a major milestone. Our two very fine businesses in India, life assurance and asset management, both in partnership with HDFC, had a fabulous year helped by the confident way in which the new Indian government has got down to work. Our relationships with all our partners are in very good shape around the world and we pay great attention to this.
A longstanding belief of mine is that effective, robust corporate governance helps create value in companies. To achieve this, boards need to be supportive, with independently-minded board members, able to constructively challenge and who avoid group-think. We appointed three new board members during the year, as part of our aim to maintain a diverse team of people with relevant experience and fresh perspectives. Luke Savage joined as our Chief Financial Officer and is a highly experienced finance professional. We also welcomed two new non-executive Directors – Isabel Hudson and Kevin Parry – who each bring a wealth of relevant skills and experience to our Board. Malcolm Wood, who was our Company Secretary and General Counsel for a number of years, left with our best wishes to take up a new role with Lloyds Group. David Grigson, our excellent Chairman of the Group Audit Committee, will be retiring from the Board after the AGM and Kevin Parry will become Chairman of that Committee. We try always to have a strong succession framework in place.
It’s your Board’s responsibility to make sure that Standard Life is a sustainable business that looks after its customers, enhances shareholder value, and is rooted in the communities it serves. The pace of activity in 2014 placed a great burden on our people, all of whom responded magnificently and I’m very grateful to everybody. 2015 will no doubt, as always, continue to bring uncertainties and opportunities in equal measure. We will do our best to end the year in even better shape than we start it.
Sir Gerry Grimstone, Chairman
4 Standard Life
1. Strategic report
1.1 Chief Executive’s overview Standard Life has continued to perform well driven by a focus on delivering value for money for our customers and clients. We have increased revenues, profits and cash generation and now have assets under administration of almost £300bn.
We have made good strategic progress during the year with the acquisition of Ignis Asset Management and the sale of our Canadian business, increasing focus on fee business and enabling a £1.75bn return to shareholders. We are also well positioned to deal with the far-reaching reforms to the savings and retirement income rules in the UK and to support customers through these changes. Standard Life Investments has continued to perform strongly and expand internationally.
Although investment markets are unsettled and may affect the near-term pace of asset and revenue growth, we are very well placed for the future. We have an excellent track record of succeeding in evolving markets and have the products, experience and proven investment performance to help our customers and clients in all of our markets to save and invest, so that they can look forward to their financial futures with confidence.
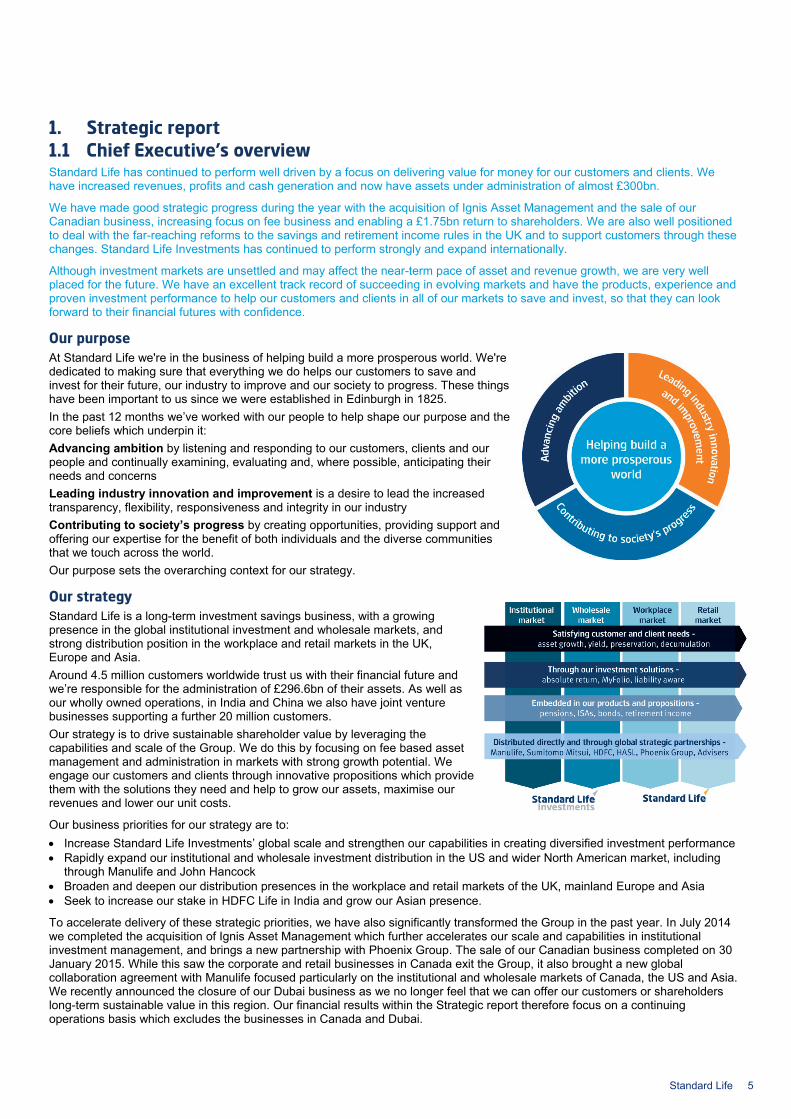
Our purpose At Standard Life we're in the business of helping build a more prosperous world. We're dedicated to making sure that everything we do helps our customers to save and invest for their future, our industry to improve and our society to progress. These things have been important to us since we were established in Edinburgh in 1825. In the past 12 months we’ve worked with our people to help shape our purpose and the core beliefs which underpin it: Advancing ambition by listening and responding to our customers, clients and our people and continually examining, evaluating and, where possible, anticipating their needs and concerns Leading industry innovation and improvement is a desire to lead the increased transparency, flexibility, responsiveness and integrity in our industry Contributing to society’s progress by creating opportunities, providing support and offering our expertise for the benefit of both individuals and the diverse communities that we touch across the world. Our purpose sets the overarching context for our strategy.
Our strategy Standard Life is a long-term investment savings business, with a growing presence in the global institutional investment and wholesale markets, and strong distribution position in the workplace and retail markets in the UK, Europe and Asia. Around 4.5 million customers worldwide trust us with their financial future and we’re responsible for the administration of £296.6bn of their assets. As well as our wholly owned operations, in India and China we also have joint venture businesses supporting a further 20 million customers. Our strategy is to drive sustainable shareholder value by leveraging the capabilities and scale of the Group. We do this by focusing on fee based asset management and administration in markets with strong growth potential. We engage our customers and clients through innovative propositions which provide them with the solutions they need and help to grow our assets, maximise our revenues and lower our unit costs.
Our business priorities for our strategy are to: • Increase Standard Life Investments’ global scale and strengthen our capabilities in creating diversified investment performance • Rapidly expand our institutional and wholesale investment distribution in the US and wider North American market, including
through Manulife and John Hancock • Broaden and deepen our distribution presences in the workplace and retail markets of the UK, mainland Europe and Asia • Seek to increase our stake in HDFC Life in India and grow our Asian presence.
To accelerate delivery of these strategic priorities, we have also significantly transformed the Group in the past year. In July 2014 we completed the acquisition of Ignis Asset Management which further accelerates our scale and capabilities in institutional investment management, and brings a new partnership with Phoenix Group. The sale of our Canadian business completed on 30 January 2015. While this saw the corporate and retail businesses in Canada exit the Group, it also brought a new global collaboration agreement with Manulife focused particularly on the institutional and wholesale markets of Canada, the US and Asia. We recently announced the closure of our Dubai business as we no longer feel that we can offer our customers or shareholders long-term sustainable value in this region. Our financial results within the Strategic report therefore focus on a continuing operations basis which excludes the businesses in Canada and Dubai.
Standard Life 5
1. Strategic report continued
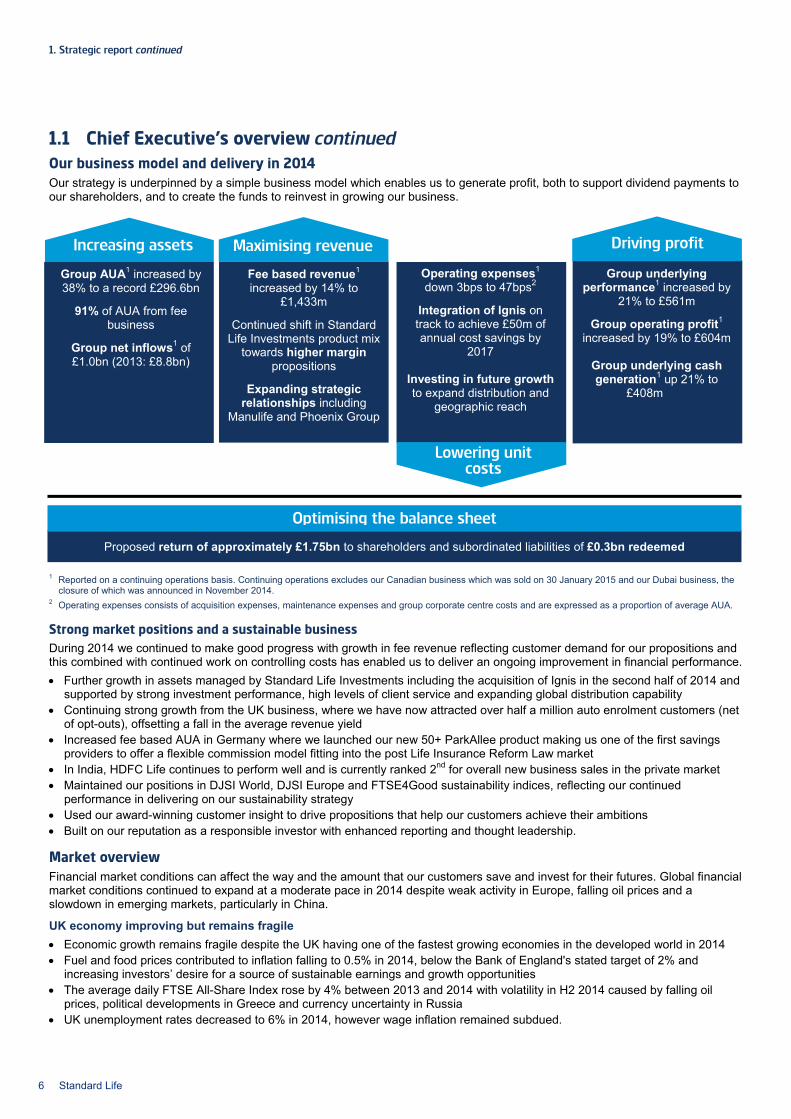
1.1 Chief Executive’s overview continued Our business model and delivery in 2014 Our strategy is underpinned by a simple business model which enables us to generate profit, both to support dividend payments to our shareholders, and to create the funds to reinvest in growing our business.
1 Reported on a continuing operations basis. Continuing operations excludes our Canadian business which was sold on 30 January 2015 and our Dubai business, the closure of which was announced in November 2014.
2 Operating expenses consists of acquisition expenses, maintenance expenses and group corporate centre costs and are expressed as a proportion of average AUA.
Strong market positions and a sustainable business During 2014 we continued to make good progress with growth in fee revenue reflecting customer demand for our propositions and this combined with continued work on controlling costs has enabled us to deliver an ongoing improvement in financial performance. • Further growth in assets managed by Standard Life Investments including the acquisition of Ignis in the second half of 2014 and
supported by strong investment performance, high levels of client service and expanding global distribution capability • Continuing strong growth from the UK business, where we have now attracted over half a million auto enrolment customers (net
of opt-outs), offsetting a fall in the average revenue yield • Increased fee based AUA in Germany where we launched our new 50+ ParkAllee product making us one of the first savings
providers to offer a flexible commission model fitting into the post Life Insurance Reform Law market • In India, HDFC Life continues to perform well and is currently ranked 2nd for overall new business sales in the private market • Maintained our positions in DJSI World, DJSI Europe and FTSE4Good sustainability indices, reflecting our continued
performance in delivering on our sustainability strategy • Used our award-winning customer insight to drive propositions that help our customers achieve their ambitions • Built on our reputation as a responsible investor with enhanced reporting and thought leadership.
Market overview Financial market conditions can affect the way and the amount that our customers save and invest for their futures. Global financial market conditions continued to expand at a moderate pace in 2014 despite weak activity in Europe, falling oil prices and a slowdown in emerging markets, particularly in China.
UK economy improving but remains fragile • Economic growth remains fragile despite the UK having one of the fastest growing economies in the developed world in 2014 • Fuel and food prices contributed to inflation falling to 0.5% in 2014, below the Bank of England's stated target of 2% and
increasing investors’ desire for a source of sustainable earnings and growth opportunities • The average daily FTSE All-Share Index rose by 4% between 2013 and 2014 with volatility in H2 2014 caused by falling oil
prices, political developments in Greece and currency uncertainty in Russia • UK unemployment rates decreased to 6% in 2014, however wage inflation remained subdued.
Increasing assets
Group AUA1 increased by 38% to a record £296.6bn
91% of AUA from fee business
Group net inflows1 of £1.0bn (2013: £8.8bn)
Fee based revenue1 increased by 14% to
£1,433m
Continued shift in Standard Life Investments product mix
towards higher margin propositions
Expanding strategic relationships including
Manulife and Phoenix Group
Group underlying performance1 increased by
21% to £561m
Group operating profit1
increased by 19% to £604m
Group underlying cash generation1 up 21% to
£408m
Operating expenses1 down 3bps to 47bps2
Integration of Ignis on track to achieve £50m of annual cost savings by
2017
Investing in future growth to expand distribution and
geographic reach
Maximising revenue Driving profit
Lowering unit costs
Proposed return of approximately £1.75bn to shareholders and subordinated liabilities of £0.3bn redeemed
Optimising the balance sheet
6 Standard Life
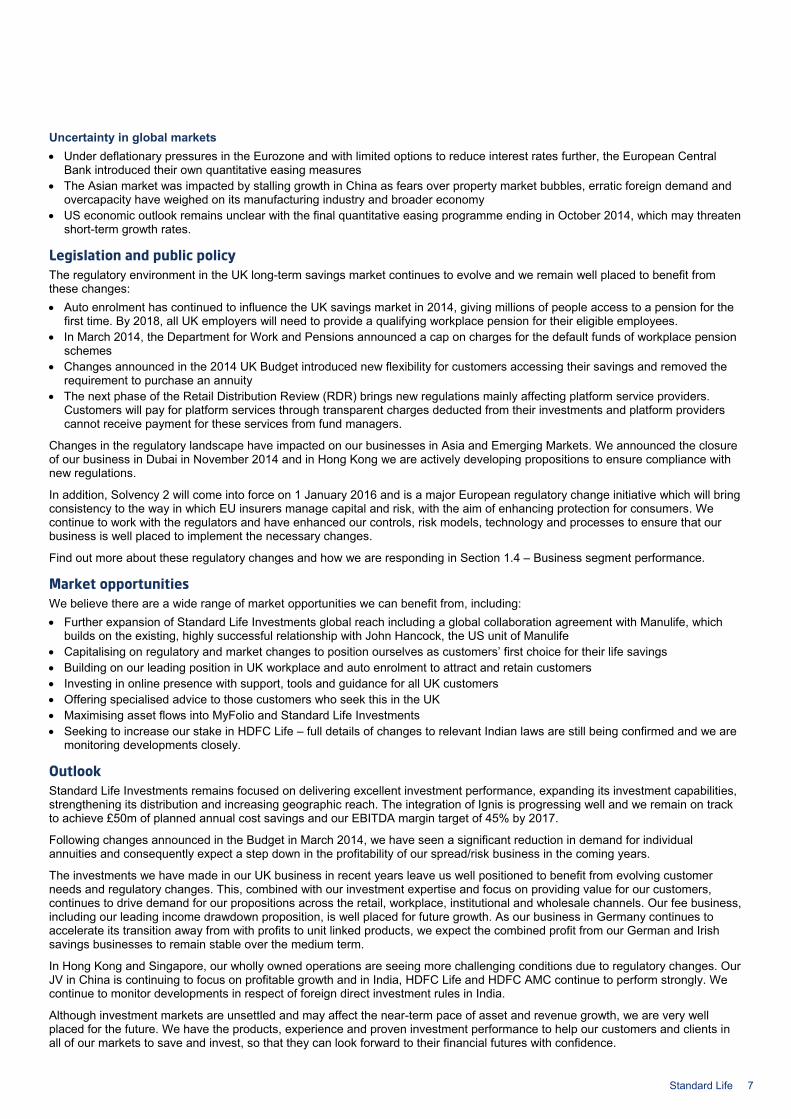
Uncertainty in global markets • Under deflationary pressures in the Eurozone and with limited options to reduce interest rates further, the European Central
Bank introduced their own quantitative easing measures • The Asian market was impacted by stalling growth in China as fears over property market bubbles, erratic foreign demand and
overcapacity have weighed on its manufacturing industry and broader economy • US economic outlook remains unclear with the final quantitative easing programme ending in October 2014, which may threaten
short-term growth rates.
Legislation and public policy The regulatory environment in the UK long-term savings market continues to evolve and we remain well placed to benefit from these changes: • Auto enrolment has continued to influence the UK savings market in 2014, giving millions of people access to a pension for the
first time. By 2018, all UK employers will need to provide a qualifying workplace pension for their eligible employees. • In March 2014, the Department for Work and Pensions announced a cap on charges for the default funds of workplace pension
schemes • Changes announced in the 2014 UK Budget introduced new flexibility for customers accessing their savings and removed the
requirement to purchase an annuity • The next phase of the Retail Distribution Review (RDR) brings new regulations mainly affecting platform service providers.
Customers will pay for platform services through transparent charges deducted from their investments and platform providers cannot receive payment for these services from fund managers.
Changes in the regulatory landscape have impacted on our businesses in Asia and Emerging Markets. We announced the closure of our business in Dubai in November 2014 and in Hong Kong we are actively developing propositions to ensure compliance with new regulations.
In addition, Solvency 2 will come into force on 1 January 2016 and is a major European regulatory change initiative which will bring consistency to the way in which EU insurers manage capital and risk, with the aim of enhancing protection for consumers. We continue to work with the regulators and have enhanced our controls, risk models, technology and processes to ensure that our business is well placed to implement the necessary changes.
Find out more about these regulatory changes and how we are responding in Section 1.4 – Business segment performance.
Market opportunities We believe there are a wide range of market opportunities we can benefit from, including: • Further expansion of Standard Life Investments global reach including a global collaboration agreement with Manulife, which
builds on the existing, highly successful relationship with John Hancock, the US unit of Manulife • Capitalising on regulatory and market changes to position ourselves as customers’ first choice for their life savings • Building on our leading position in UK workplace and auto enrolment to attract and retain customers • Investing in online presence with support, tools and guidance for all UK customers • Offering specialised advice to those customers who seek this in the UK • Maximising asset flows into MyFolio and Standard Life Investments • Seeking to increase our stake in HDFC Life – full details of changes to relevant Indian laws are still being confirmed and we are
monitoring developments closely.
Outlook Standard Life Investments remains focused on delivering excellent investment performance, expanding its investment capabilities, strengthening its distribution and increasing geographic reach. The integration of Ignis is progressing well and we remain on track to achieve £50m of planned annual cost savings and our EBITDA margin target of 45% by 2017.
Following changes announced in the Budget in March 2014, we have seen a significant reduction in demand for individual annuities and consequently expect a step down in the profitability of our spread/risk business in the coming years.
The investments we have made in our UK business in recent years leave us well positioned to benefit from evolving customer needs and regulatory changes. This, combined with our investment expertise and focus on providing value for our customers, continues to drive demand for our propositions across the retail, workplace, institutional and wholesale channels. Our fee business, including our leading income drawdown proposition, is well placed for future growth. As our business in Germany continues to accelerate its transition away from with profits to unit linked products, we expect the combined profit from our German and Irish savings businesses to remain stable over the medium term.
In Hong Kong and Singapore, our wholly owned operations are seeing more challenging conditions due to regulatory changes. Our JV in China is continuing to focus on profitable growth and in India, HDFC Life and HDFC AMC continue to perform strongly. We continue to monitor developments in respect of foreign direct investment rules in India.
Although investment markets are unsettled and may affect the near-term pace of asset and revenue growth, we are very well placed for the future. We have the products, experience and proven investment performance to help our customers and clients in all of our markets to save and invest, so that they can look forward to their financial futures with confidence.
Standard Life 7
1. Strategic report continued
£408m
£304m £336m
2012 2014 2013
£296.6bn
£188.3bn £214.7bn
2012 2014 2013
£1.0bn £5.5bn
Net flows AUA
£8.8bn
1.2 Group key financial performance indicators
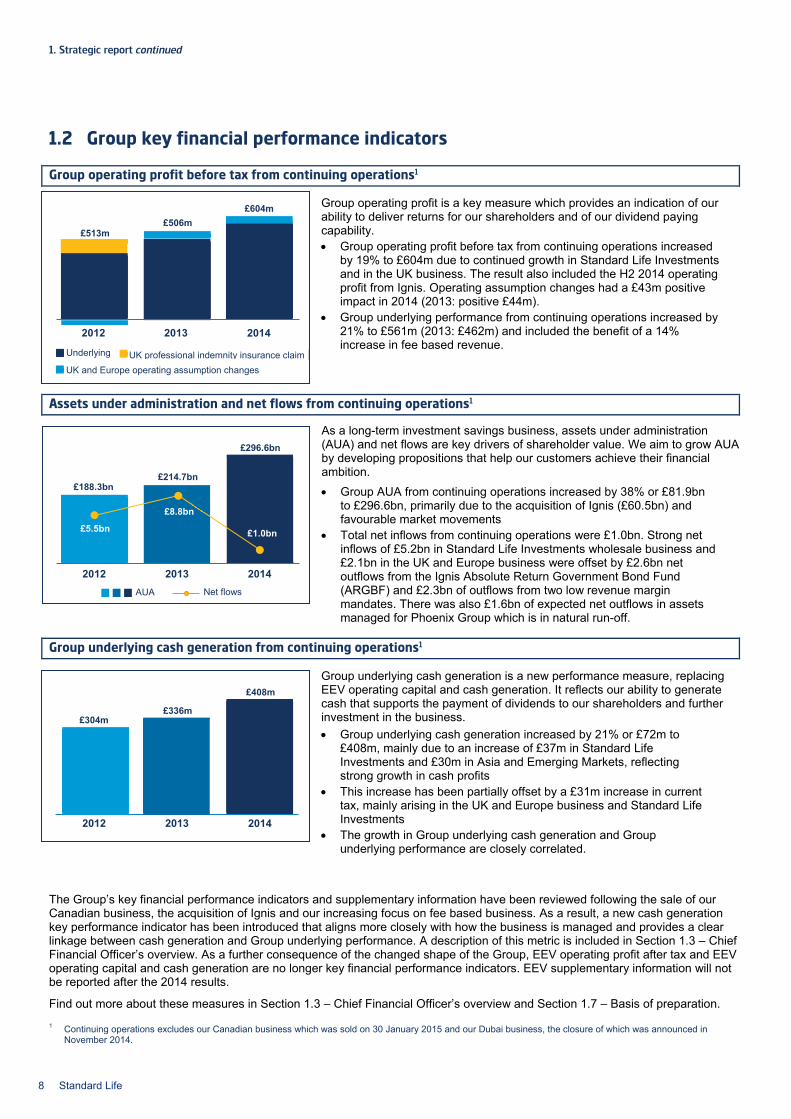
Group operating profit before tax from continuing operations1 Group operating profit is a key measure which provides an indication of our ability to deliver returns for our shareholders and of our dividend paying capability. • Group operating profit before tax from continuing operations increased
by 19% to £604m due to continued growth in Standard Life Investments and in the UK business. The result also included the H2 2014 operating profit from Ignis. Operating assumption changes had a £43m positive impact in 2014 (2013: positive £44m).
• Group underlying performance from continuing operations increased by 21% to £561m (2013: £462m) and included the benefit of a 14% increase in fee based revenue.
Assets under administration and net flows from continuing operations1
As a long-term investment savings business, assets under administration (AUA) and net flows are key drivers of shareholder value. We aim to grow AUA by developing propositions that help our customers achieve their financial ambition. • Group AUA from continuing operations increased by 38% or £81.9bn
to £296.6bn, primarily due to the acquisition of Ignis (£60.5bn) and favourable market movements
• Total net inflows from continuing operations were £1.0bn. Strong net inflows of £5.2bn in Standard Life Investments wholesale business and £2.1bn in the UK and Europe business were offset by £2.6bn net outflows from the Ignis Absolute Return Government Bond Fund (ARGBF) and £2.3bn of outflows from two low revenue margin mandates. There was also £1.6bn of expected net outflows in assets managed for Phoenix Group which is in natural run-off.
Group underlying cash generation from continuing operations1
Group underlying cash generation is a new performance measure, replacing EEV operating capital and cash generation. It reflects our ability to generate cash that supports the payment of dividends to our shareholders and further investment in the business. • Group underlying cash generation increased by 21% or £72m to
£408m, mainly due to an increase of £37m in Standard Life Investments and £30m in Asia and Emerging Markets, reflecting strong growth in cash profits
• This increase has been partially offset by a £31m increase in current tax, mainly arising in the UK and Europe business and Standard Life Investments
• The growth in Group underlying cash generation and Group underlying performance are closely correlated.
The Group’s key financial performance indicators and supplementary information have been reviewed following the sale of our Canadian business, the acquisition of Ignis and our increasing focus on fee based business. As a result, a new cash generation key performance indicator has been introduced that aligns more closely with how the business is managed and provides a clear linkage between cash generation and Group underlying performance. A description of this metric is included in Section 1.3 – Chief Financial Officer’s overview. As a further consequence of the changed shape of the Group, EEV operating profit after tax and EEV operating capital and cash generation are no longer key financial performance indicators. EEV supplementary information will not be reported after the 2014 results.
Find out more about these measures in Section 1.3 – Chief Financial Officer’s overview and Section 1.7 – Basis of preparation.
1 Continuing operations excludes our Canadian business which was sold on 30 January 2015 and our Dubai business, the closure of which was announced in November 2014.
£506m
2013 2012
£513m £604m
2014
Underlying UK professional indemnity insurance claim
UK and Europe operating assumption changes
8 Standard Life
1.3 Chief Financial Officer’s overview Our financial results demonstrate our ability to deliver sustainable returns for our shareholders. Continuing operations excludes our Canadian business which was sold on 30 January 2015 and our Dubai business, the closure of which was announced in November 2014.
IFRS and Group operating profit 2014 2013 Movement
Group operating profit before tax from continuing operations1 £604m £506m 19%
IFRS profit after tax attributable to equity holders of Standard Life plc (including discontinued operations)
£503m £466m 8%
Group operating return on equity (including discontinued operations) 14.9% 14.7% 0.2% points
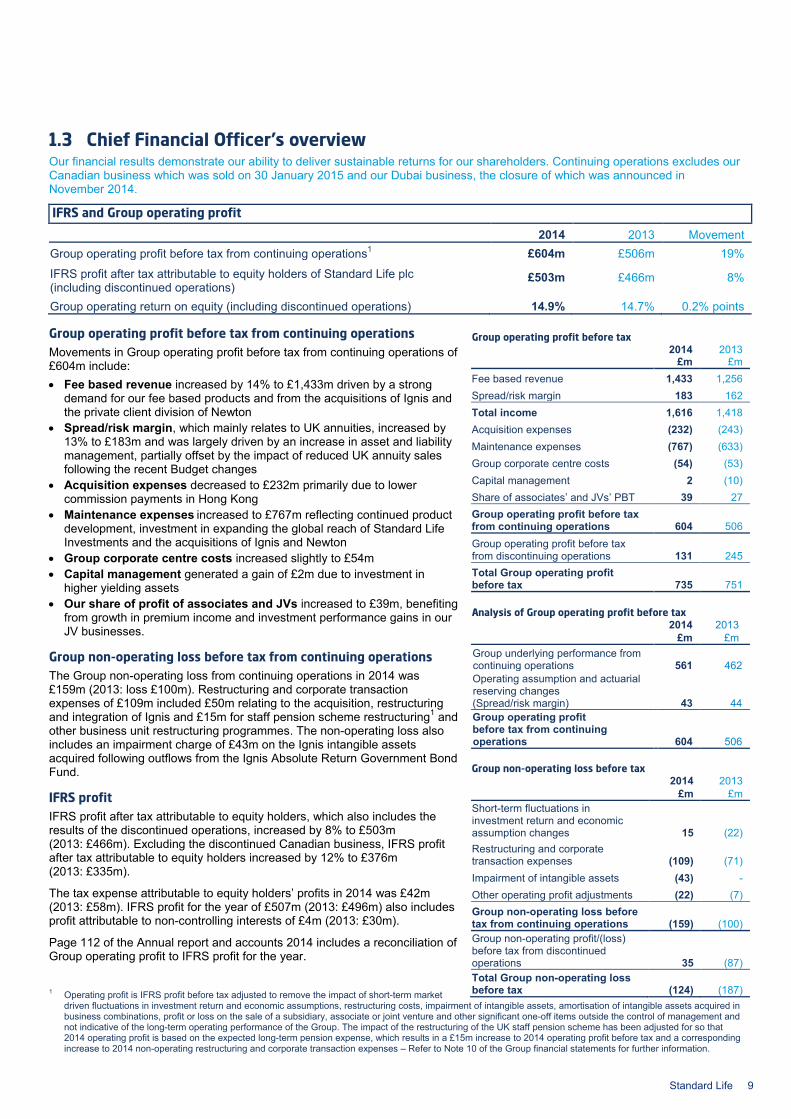
Group operating profit before tax from continuing operations
Movements in Group operating profit before tax from continuing operations of £604m include: • Fee based revenue increased by 14% to £1,433m driven by a strong
demand for our fee based products and from the acquisitions of Ignis and the private client division of Newton
• Spread/risk margin, which mainly relates to UK annuities, increased by 13% to £183m and was largely driven by an increase in asset and liability management, partially offset by the impact of reduced UK annuity sales following the recent Budget changes
• Acquisition expenses decreased to £232m primarily due to lower commission payments in Hong Kong
• Maintenance expenses increased to £767m reflecting continued product development, investment in expanding the global reach of Standard Life Investments and the acquisitions of Ignis and Newton
• Group corporate centre costs increased slightly to £54m • Capital management generated a gain of £2m due to investment in
higher yielding assets • Our share of profit of associates and JVs increased to £39m, benefiting
from growth in premium income and investment performance gains in our JV businesses.
Group non-operating loss before tax from continuing operations
The Group non-operating loss from continuing operations in 2014 was £159m (2013: loss £100m). Restructuring and corporate transaction expenses of £109m included £50m relating to the acquisition, restructuring and integration of Ignis and £15m for staff pension scheme restructuring1 and other business unit restructuring programmes. The non-operating loss also includes an impairment charge of £43m on the Ignis intangible assets acquired following outflows from the Ignis Absolute Return Government Bond Fund.
IFRS profit IFRS profit after tax attributable to equity holders, which also includes the results of the discontinued operations, increased by 8% to £503m (2013: £466m). Excluding the discontinued Canadian business, IFRS profit after tax attributable to equity holders increased by 12% to £376m (2013: £335m).
The tax expense attributable to equity holders’ profits in 2014 was £42m (2013: £58m). IFRS profit for the year of £507m (2013: £496m) also includes profit attributable to non-controlling interests of £4m (2013: £30m).
Page 112 of the Annual report and accounts 2014 includes a reconciliation of Group operating profit to IFRS profit for the year.
1 Operating profit is IFRS profit before tax adjusted to remove the impact of short-term market driven fluctuations in investment return and economic assumptions, restructuring costs, impairment of intangible assets, amortisation of intangible assets acquired in business combinations, profit or loss on the sale of a subsidiary, associate or joint venture and other significant one-off items outside the control of management and not indicative of the long-term operating performance of the Group. The impact of the restructuring of the UK staff pension scheme has been adjusted for so that 2014 operating profit is based on the expected long-term pension expense, which results in a £15m increase to 2014 operating profit before tax and a corresponding increase to 2014 non-operating restructuring and corporate transaction expenses – Refer to Note 10 of the Group financial statements for further information.
Group operating profit before tax 2014 2013 £m £m
Fee based revenue 1,433 1,256 Spread/risk margin 183 162 Total income 1,616 1,418 Acquisition expenses (232) (243) Maintenance expenses (767) (633) Group corporate centre costs (54) (53) Capital management 2 (10) Share of associates’ and JVs’ PBT 39 27 Group operating profit before tax from continuing operations 604 506 Group operating profit before tax from discontinuing operations 131 245 Total Group operating profit before tax 735 751
Analysis of Group operating profit before tax
2014 2013 £m £m
Group underlying performance from continuing operations 561 462 Operating assumption and actuarial reserving changes (Spread/risk margin) 43 44 Group operating profit before tax from continuing operations 604 506 Group non-operating loss before tax
2014 2013 £m £m
Short-term fluctuations in investment return and economic assumption changes 15 (22) Restructuring and corporate transaction expenses (109) (71) Impairment of intangible assets (43) - Other operating profit adjustments (22) (7) Group non-operating loss before tax from continuing operations (159) (100) Group non-operating profit/(loss) before tax from discontinued operations 35 (87) Total Group non-operating loss before tax (124) (187)
Standard Life 9
1. Strategic report continued
Movement in Group AUA from continuing operations
£1.0bn £60.5bn £296.6bn
Closing 31 December
2014
£214.7bn
Opening 1 January
2014
Acquisition
of Ignis
£20.4bn
Net inflows
Market/ other
movements
1.3 Chief Financial Officer’s overview continued
Group profitability including discontinued operations Group operating profit before tax including discontinued operations, which comprises our Canadian business and our operations in Dubai, reduced to £735m (2013: £751m). Operating profit before tax from the discontinued operations in Canada reduced to £136m (2013: £251m) as a result of lower management actions. The operating loss before tax for Dubai was £5m (2013: loss £6m). Find out more in Section 1.4.4 – Discontinued operations.
The Group non-operating loss including discontinued operations in 2014 was £124m (2013: loss £187m). The non-operating gain from discontinued operations of £35m (2013: loss £87m) included favourable short-term fluctuations on investment return in Canada of £73m offset by £38m restructuring and other non-operating expenses in relation to the sale of our Canadian business and the closure of Dubai.
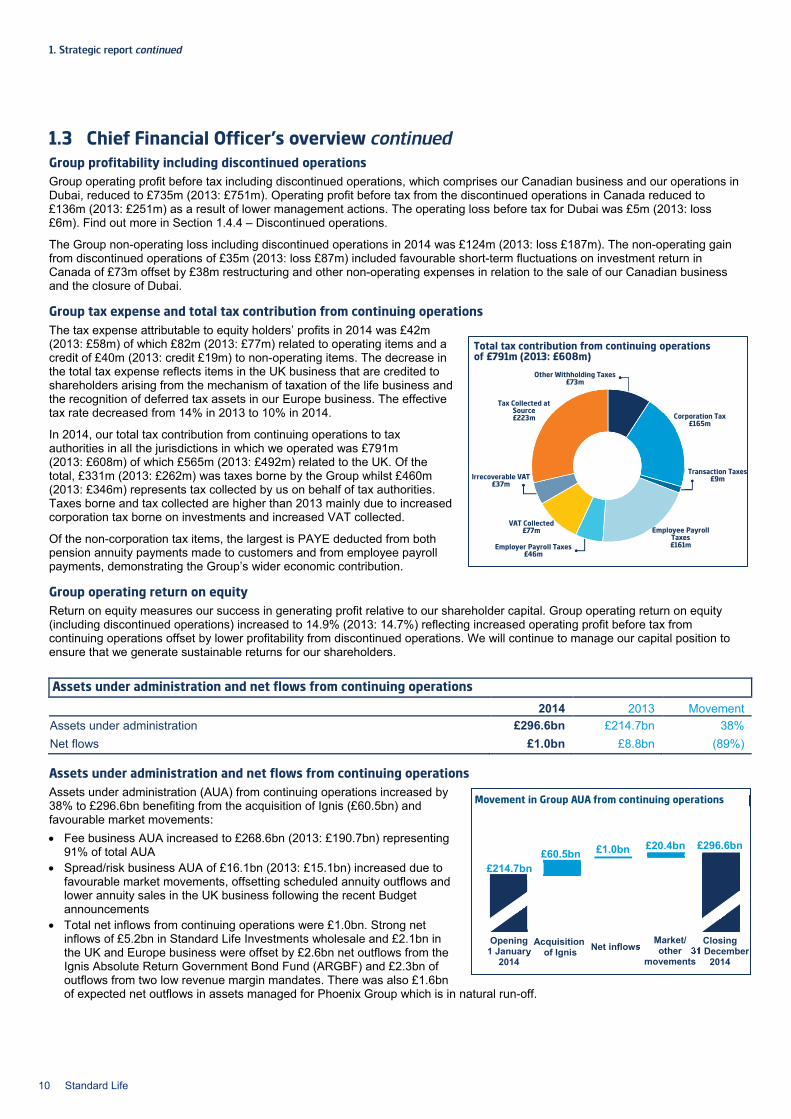
Group tax expense and total tax contribution from continuing operations The tax expense attributable to equity holders’ profits in 2014 was £42m (2013: £58m) of which £82m (2013: £77m) related to operating items and a credit of £40m (2013: credit £19m) to non-operating items. The decrease in the total tax expense reflects items in the UK business that are credited to shareholders arising from the mechanism of taxation of the life business and the recognition of deferred tax assets in our Europe business. The effective tax rate decreased from 14% in 2013 to 10% in 2014.
In 2014, our total tax contribution from continuing operations to tax authorities in all the jurisdictions in which we operated was £791m (2013: £608m) of which £565m (2013: £492m) related to the UK. Of the total, £331m (2013: £262m) was taxes borne by the Group whilst £460m (2013: £346m) represents tax collected by us on behalf of tax authorities. Taxes borne and tax collected are higher than 2013 mainly due to increased corporation tax borne on investments and increased VAT collected.
Of the non-corporation tax items, the largest is PAYE deducted from both pension annuity payments made to customers and from employee payroll payments, demonstrating the Group’s wider economic contribution.
Group operating return on equity
Return on equity measures our success in generating profit relative to our shareholder capital. Group operating return on equity (including discontinued operations) increased to 14.9% (2013: 14.7%) reflecting increased operating profit before tax from continuing operations offset by lower profitability from discontinued operations. We will continue to manage our capital position to ensure that we generate sustainable returns for our shareholders.
Assets under administration and net flows from continuing operations
2014 2013 Movement Assets under administration £296.6bn £214.7bn 38% Net flows £1.0bn £8.8bn (89%)
Assets under administration and net flows from continuing operations
Assets under administration (AUA) from continuing operations increased by 38% to £296.6bn benefiting from the acquisition of Ignis (£60.5bn) and favourable market movements: • Fee business AUA increased to £268.6bn (2013: £190.7bn) representing
91% of total AUA • Spread/risk business AUA of £16.1bn (2013: £15.1bn) increased due to
favourable market movements, offsetting scheduled annuity outflows and lower annuity sales in the UK business following the recent Budget announcements
• Total net inflows from continuing operations were £1.0bn. Strong net inflows of £5.2bn in Standard Life Investments wholesale and £2.1bn in the UK and Europe business were offset by £2.6bn net outflows from the Ignis Absolute Return Government Bond Fund (ARGBF) and £2.3bn of outflows from two low revenue margin mandates. There was also £1.6bn of expected net outflows in assets managed for Phoenix Group which is in natural run-off.
Corporation Tax £165m
Other Withholding Taxes £73m
Transaction Taxes £9m
Employee Payroll Taxes £161m Employer Payroll Taxes
£46m
VAT Collected £77m
Irrecoverable VAT £37m
Tax Collected at Source £223m
Total tax contribution from continuing operations of £791m (2013: £608m)
10 Standard Life
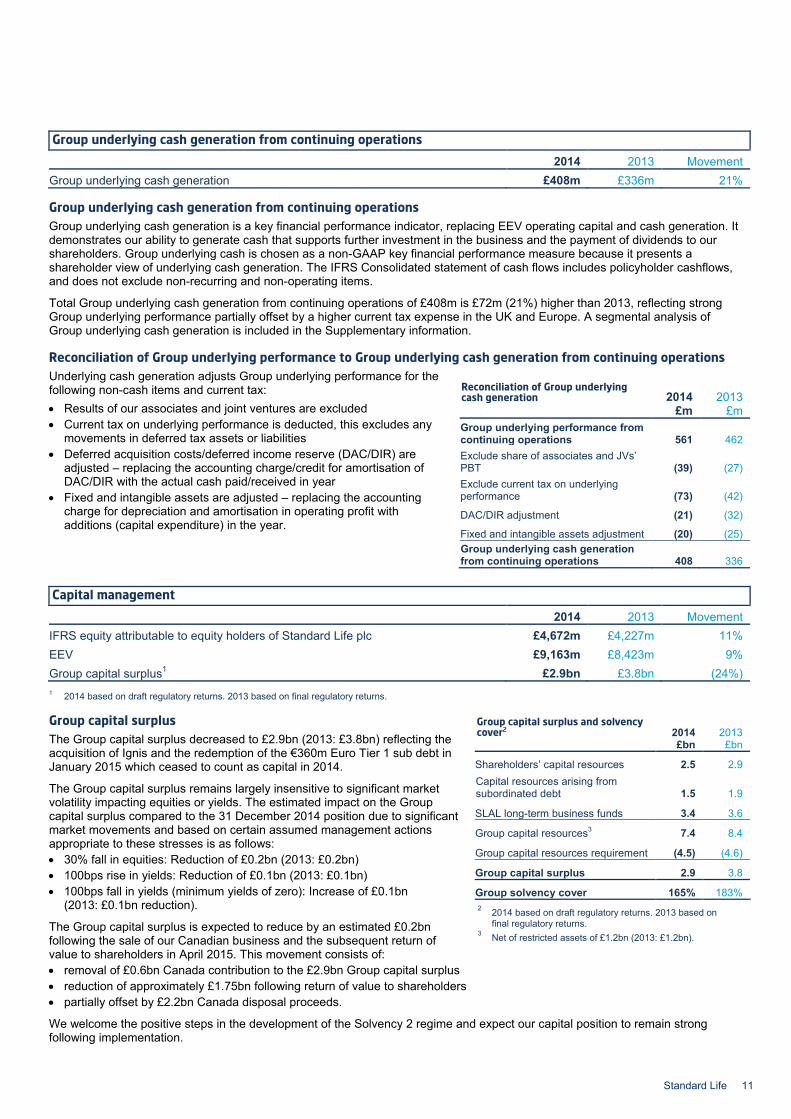
Group underlying cash generation from continuing operations
2014 2013 Movement Group underlying cash generation £408m £336m 21%
Group underlying cash generation from continuing operations
Group underlying cash generation is a key financial performance indicator, replacing EEV operating capital and cash generation. It demonstrates our ability to generate cash that supports further investment in the business and the payment of dividends to our shareholders. Group underlying cash is chosen as a non-GAAP key financial performance measure because it presents a shareholder view of underlying cash generation. The IFRS Consolidated statement of cash flows includes policyholder cashflows, and does not exclude non-recurring and non-operating items.
Total Group underlying cash generation from continuing operations of £408m is £72m (21%) higher than 2013, reflecting strong Group underlying performance partially offset by a higher current tax expense in the UK and Europe. A segmental analysis of Group underlying cash generation is included in the Supplementary information.
Reconciliation of Group underlying performance to Group underlying cash generation from continuing operations
Underlying cash generation adjusts Group underlying performance for the following non-cash items and current tax: • Results of our associates and joint ventures are excluded • Current tax on underlying performance is deducted, this excludes any
movements in deferred tax assets or liabilities • Deferred acquisition costs/deferred income reserve (DAC/DIR) are
adjusted – replacing the accounting charge/credit for amortisation of DAC/DIR with the actual cash paid/received in year
• Fixed and intangible assets are adjusted – replacing the accounting charge for depreciation and amortisation in operating profit with additions (capital expenditure) in the year.
Capital management
2014 2013 Movement IFRS equity attributable to equity holders of Standard Life plc £4,672m £4,227m 11% EEV £9,163m £8,423m 9% Group capital surplus1 £2.9bn £3.8bn (24%) 1 2014 based on draft regulatory returns. 2013 based on final regulatory returns.
Group capital surplus The Group capital surplus decreased to £2.9bn (2013: £3.8bn) reflecting the acquisition of Ignis and the redemption of the €360m Euro Tier 1 sub debt in January 2015 which ceased to count as capital in 2014.
The Group capital surplus remains largely insensitive to significant market volatility impacting equities or yields. The estimated impact on the Group capital surplus compared to the 31 December 2014 position due to significant market movements and based on certain assumed management actions appropriate to these stresses is as follows: • 30% fall in equities: Reduction of £0.2bn (2013: £0.2bn) • 100bps rise in yields: Reduction of £0.1bn (2013: £0.1bn) • 100bps fall in yields (minimum yields of zero): Increase of £0.1bn
(2013: £0.1bn reduction).
The Group capital surplus is expected to reduce by an estimated £0.2bn following the sale of our Canadian business and the subsequent return of value to shareholders in April 2015. This movement consists of: • removal of £0.6bn Canada contribution to the £2.9bn Group capital surplus • reduction of approximately £1.75bn following return of value to shareholders • partially offset by £2.2bn Canada disposal proceeds.
We welcome the positive steps in the development of the Solvency 2 regime and expect our capital position to remain strong following implementation.
Reconciliation of Group underlying cash generation 2014 2013 £m £m
Group underlying performance from continuing operations 561 462 Exclude share of associates and JVs’ PBT (39) (27) Exclude current tax on underlying performance (73) (42)
DAC/DIR adjustment (21) (32)
Fixed and intangible assets adjustment (20) (25) Group underlying cash generation from continuing operations 408 336
Group capital surplus and solvency cover2 2014 2013 £bn £bn
Shareholders’ capital resources 2.5 2.9 Capital resources arising from subordinated debt 1.5 1.9
SLAL long-term business funds 3.4 3.6
Group capital resources3 7.4 8.4
Group capital resources requirement (4.5) (4.6)
Group capital surplus 2.9 3.8
Group solvency cover 165% 183% 2 2014 based on draft regulatory returns. 2013 based on
final regulatory returns. 3 Net of restricted assets of £1.2bn (2013: £1.2bn).
Standard Life 11
1. Strategic report continued
Canada
AEM
Required capital
shareholder funds
Retained earnings
IGD basis
£7.4bn
Embedded value basis
IFRS equity basis
Valuation adjustments
for IFRS Present value of future profits
Cost of required capital
EEV net worth
External subordinated
liabilities Capital in long-term business
funds
Valuation adjustments
for EEV
£9.2bn £5.7bn
£4.0bn
£4.7bn £2.2bn
(£3.4bn)
(£1.5bn)
(£0.7bn)
(£0.5bn)
Required capital
Share capital and premium
Other reserves
Regulatory surplus
Required capital
of HWPF Free surplus
UK and Europe
Insurance Groups
Directive (IGD) regulatory
capital IFRS equity
holder funds
EEV net worth
EEV Remove policyholder
capital
Subordinated debt
recognised as a liability
IFRS intangibles and other
inadmissible assets
Long-term cost of capital
Asset and liability
valuation adjustments
Future earnings on
covered business
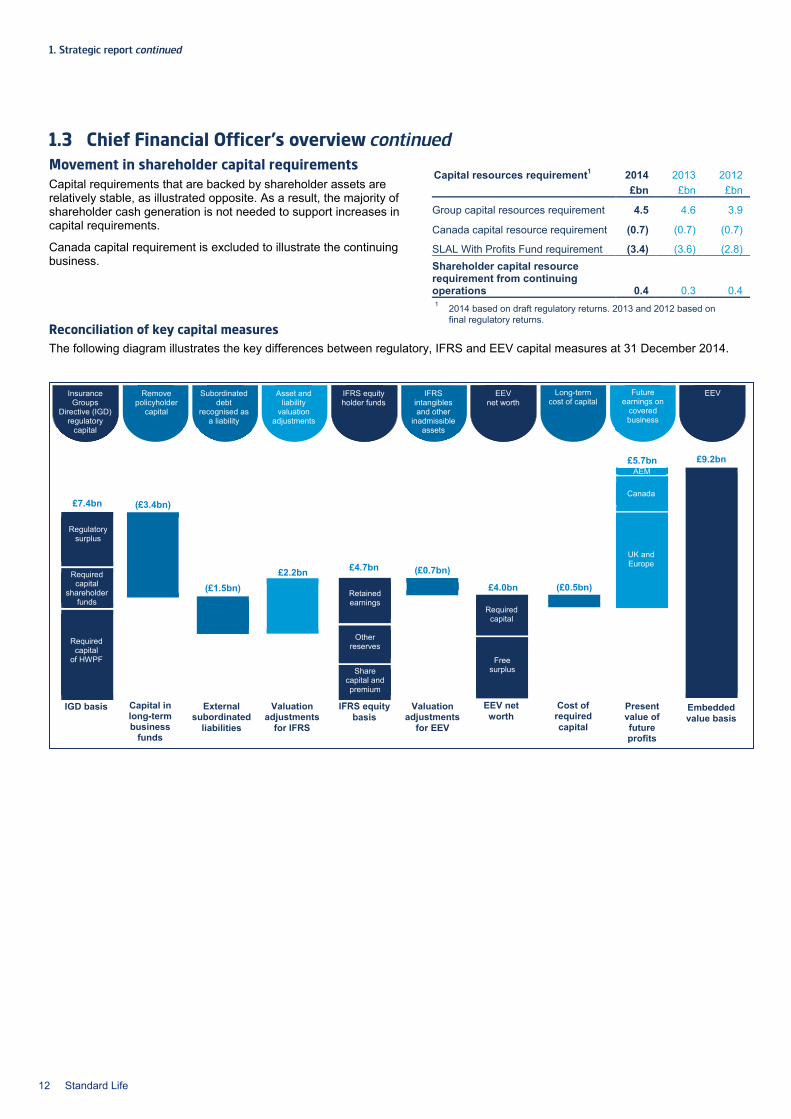
1.3 Chief Financial Officer’s overview continued Movement in shareholder capital requirements Capital requirements that are backed by shareholder assets are relatively stable, as illustrated opposite. As a result, the majority of shareholder cash generation is not needed to support increases in capital requirements.
Canada capital requirement is excluded to illustrate the continuing business.
Reconciliation of key capital measures The following diagram illustrates the key differences between regulatory, IFRS and EEV capital measures at 31 December 2014.
Capital resources requirement1 2014 2013 2012 £bn £bn £bn
Group capital resources requirement 4.5 4.6 3.9
Canada capital resource requirement (0.7) (0.7) (0.7)
SLAL With Profits Fund requirement (3.4) (3.6) (2.8) Shareholder capital resource requirement from continuing operations 0.4 0.3 0.4 1 2014 based on draft regulatory returns. 2013 and 2012 based on
final regulatory returns.
12 Standard Life
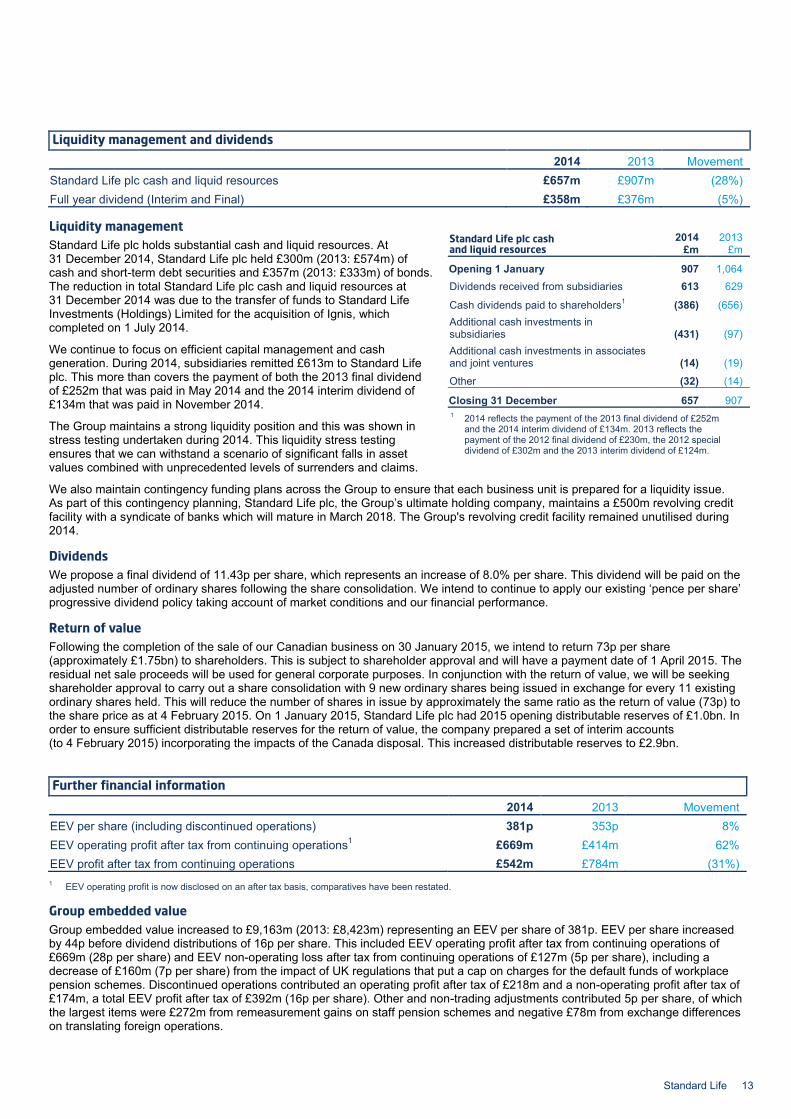
Liquidity management and dividends 2014 2013 Movement
Standard Life plc cash and liquid resources £657m £907m (28%) Full year dividend (Interim and Final) £358m £376m (5%)
Liquidity management Standard Life plc holds substantial cash and liquid resources. At 31 December 2014, Standard Life plc held £300m (2013: £574m) of cash and short-term debt securities and £357m (2013: £333m) of bonds. The reduction in total Standard Life plc cash and liquid resources at 31 December 2014 was due to the transfer of funds to Standard Life Investments (Holdings) Limited for the acquisition of Ignis, which completed on 1 July 2014.
We continue to focus on efficient capital management and cash generation. During 2014, subsidiaries remitted £613m to Standard Life plc. This more than covers the payment of both the 2013 final dividend of £252m that was paid in May 2014 and the 2014 interim dividend of £134m that was paid in November 2014.
The Group maintains a strong liquidity position and this was shown in stress testing undertaken during 2014. This liquidity stress testing ensures that we can withstand a scenario of significant falls in asset values combined with unprecedented levels of surrenders and claims.
We also maintain contingency funding plans across the Group to ensure that each business unit is prepared for a liquidity issue. As part of this contingency planning, Standard Life plc, the Group’s ultimate holding company, maintains a £500m revolving credit facility with a syndicate of banks which will mature in March 2018. The Group's revolving credit facility remained unutilised during 2014.
Dividends We propose a final dividend of 11.43p per share, which represents an increase of 8.0% per share. This dividend will be paid on the adjusted number of ordinary shares following the share consolidation. We intend to continue to apply our existing ‘pence per share’ progressive dividend policy taking account of market conditions and our financial performance.
Return of value Following the completion of the sale of our Canadian business on 30 January 2015, we intend to return 73p per share (approximately £1.75bn) to shareholders. This is subject to shareholder approval and will have a payment date of 1 April 2015. The residual net sale proceeds will be used for general corporate purposes. In conjunction with the return of value, we will be seeking shareholder approval to carry out a share consolidation with 9 new ordinary shares being issued in exchange for every 11 existing ordinary shares held. This will reduce the number of shares in issue by approximately the same ratio as the return of value (73p) to the share price as at 4 February 2015. On 1 January 2015, Standard Life plc had 2015 opening distributable reserves of £1.0bn. In order to ensure sufficient distributable reserves for the return of value, the company prepared a set of interim accounts (to 4 February 2015) incorporating the impacts of the Canada disposal. This increased distributable reserves to £2.9bn.
Further financial information 2014 2013 Movement
EEV per share (including discontinued operations) 381p 353p 8% EEV operating profit after tax from continuing operations1 £669m £414m 62% EEV profit after tax from continuing operations £542m £784m (31%) 1 EEV operating profit is now disclosed on an after tax basis, comparatives have been restated.
Group embedded value Group embedded value increased to £9,163m (2013: £8,423m) representing an EEV per share of 381p. EEV per share increased by 44p before dividend distributions of 16p per share. This included EEV operating profit after tax from continuing operations of £669m (28p per share) and EEV non-operating loss after tax from continuing operations of £127m (5p per share), including a decrease of £160m (7p per share) from the impact of UK regulations that put a cap on charges for the default funds of workplace pension schemes. Discontinued operations contributed an operating profit after tax of £218m and a non-operating profit after tax of £174m, a total EEV profit after tax of £392m (16p per share). Other and non-trading adjustments contributed 5p per share, of which the largest items were £272m from remeasurement gains on staff pension schemes and negative £78m from exchange differences on translating foreign operations.
Standard Life plc cash and liquid resources
2014 2013 £m £m
Opening 1 January 907 1,064 Dividends received from subsidiaries 613 629
Cash dividends paid to shareholders1 (386) (656) Additional cash investments in subsidiaries (431) (97) Additional cash investments in associates and joint ventures (14) (19)
Other (32) (14)
Closing 31 December 657 907 1 2014 reflects the payment of the 2013 final dividend of £252m
and the 2014 interim dividend of £134m. 2013 reflects the payment of the 2012 final dividend of £230m, the 2012 special dividend of £302m and the 2013 interim dividend of £124m.
Standard Life 13
1. Strategic report continued
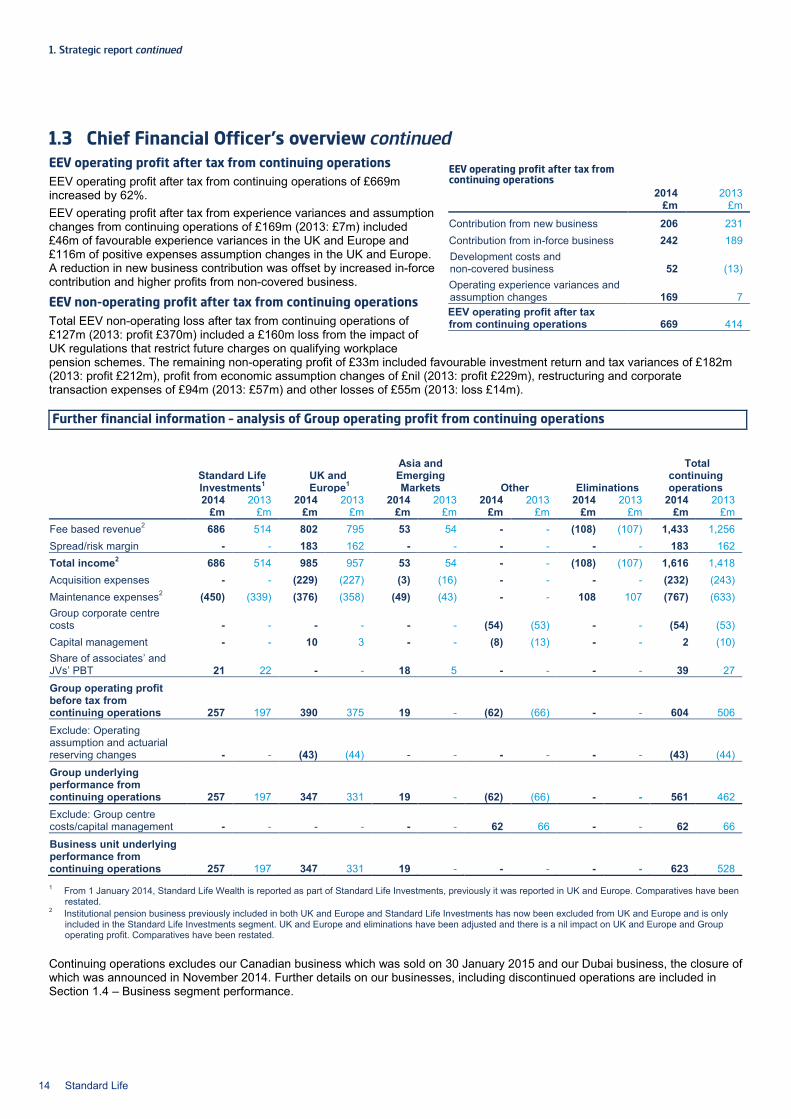
1.3 Chief Financial Officer’s overview continued EEV operating profit after tax from continuing operations
EEV operating profit after tax from continuing operations of £669m increased by 62%. EEV operating profit after tax from experience variances and assumption changes from continuing operations of £169m (2013: £7m) included £46m of favourable experience variances in the UK and Europe and £116m of positive expenses assumption changes in the UK and Europe. A reduction in new business contribution was offset by increased in-force contribution and higher profits from non-covered business.
EEV non-operating profit after tax from continuing operations
Total EEV non-operating loss after tax from continuing operations of £127m (2013: profit £370m) included a £160m loss from the impact of UK regulations that restrict future charges on qualifying workplace pension schemes. The remaining non-operating profit of £33m included favourable investment return and tax variances of £182m (2013: profit £212m), profit from economic assumption changes of £nil (2013: profit £229m), restructuring and corporate transaction expenses of £94m (2013: £57m) and other losses of £55m (2013: loss £14m).
Further financial information – analysis of Group operating profit from continuing operations
1 From 1 January 2014, Standard Life Wealth is reported as part of Standard Life Investments, previously it was reported in UK and Europe. Comparatives have been restated.
2 Institutional pension business previously included in both UK and Europe and Standard Life Investments has now been excluded from UK and Europe and is only included in the Standard Life Investments segment. UK and Europe and eliminations have been adjusted and there is a nil impact on UK and Europe and Group operating profit. Comparatives have been restated.
Continuing operations excludes our Canadian business which was sold on 30 January 2015 and our Dubai business, the closure of which was announced in November 2014. Further details on our businesses, including discontinued operations are included in Section 1.4 – Business segment performance.
EEV operating profit after tax from continuing operations 2014 2013 £m £m
Contribution from new business 206 231 Contribution from in-force business 242 189 Development costs and non-covered business 52 (13) Operating experience variances and assumption changes 169 7 EEV operating profit after tax from continuing operations 669 414
Standard Life Investments1
UK and Europe1
Asia and Emerging Markets Other Eliminations
Total continuing operations
2014 2013 2014 2013 2014 2013 2014 2013 2014 2013 2014 2013 £m £m £m £m £m £m £m £m £m £m £m £m
Fee based revenue2 686 514 802 795 53 54 - - (108) (107) 1,433 1,256 Spread/risk margin - - 183 162 - - - - - - 183 162 Total income2 686 514 985 957 53 54 - - (108) (107) 1,616 1,418 Acquisition expenses - - (229) (227) (3) (16) - - - - (232) (243) Maintenance expenses2 (450) (339) (376) (358) (49) (43) - - 108 107 (767) (633) Group corporate centre costs - - - - - - (54) (53) - - (54) (53) Capital management - - 10 3 - - (8) (13) - - 2 (10) Share of associates’ and JVs’ PBT 21 22 - - 18 5 - - - - 39 27 Group operating profit before tax from continuing operations 257 197 390 375 19 - (62) (66) - - 604 506
Exclude: Operating assumption and actuarial reserving changes - - (43) (44) - - - - - - (43) (44)
Group underlying performance from continuing operations 257 197 347 331 19 - (62) (66) - - 561 462 Exclude: Group centre costs/capital management - - - - - - 62 66 - - 62 66
Business unit underlying performance from continuing operations 257 197 347 331 19 - - - - - 623 528
14 Standard Life
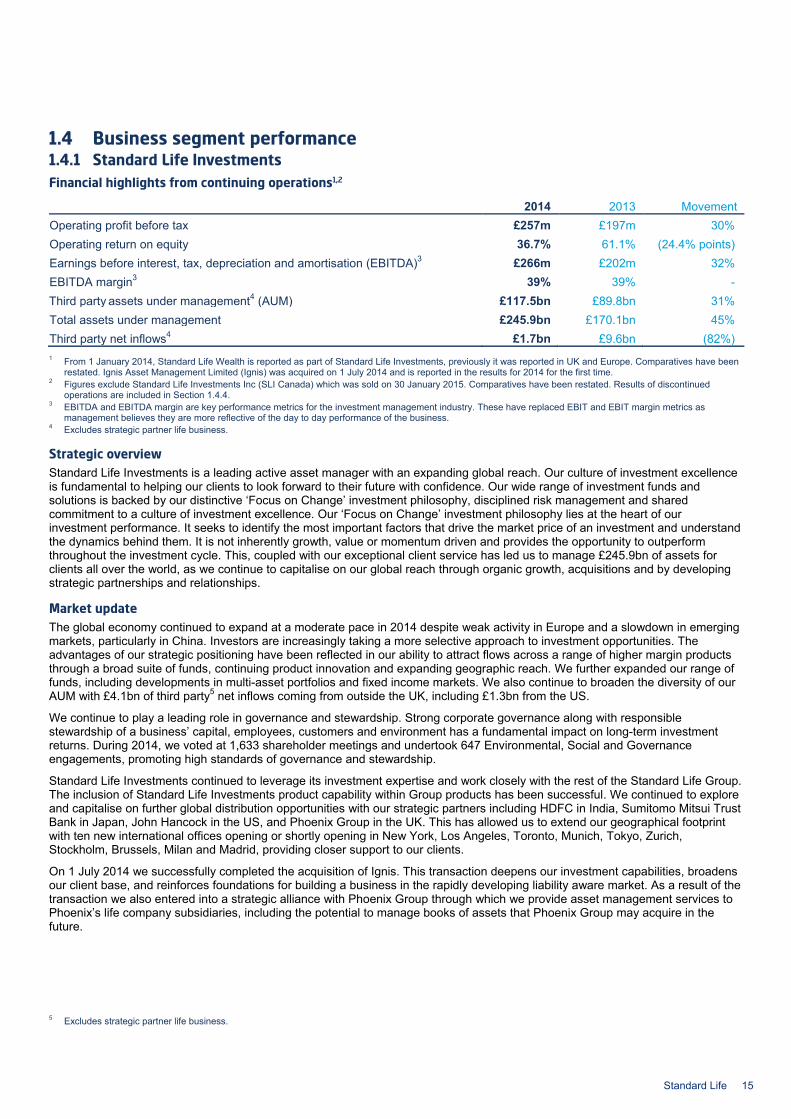
1.4 Business segment performance 1.4.1 Standard Life Investments Financial highlights from continuing operations1,2
2014 2013 Movement Operating profit before tax £257m £197m 30% Operating return on equity 36.7% 61.1% (24.4% points) Earnings before interest, tax, depreciation and amortisation (EBITDA)3 £266m £202m 32% EBITDA margin3 39% 39% - Third party assets under management4 (AUM) £117.5bn £89.8bn 31% Total assets under management £245.9bn £170.1bn 45% Third party net inflows4 £1.7bn £9.6bn (82%) 1 From 1 January 2014, Standard Life Wealth is reported as part of Standard Life Investments, previously it was reported in UK and Europe. Comparatives have been
restated. Ignis Asset Management Limited (Ignis) was acquired on 1 July 2014 and is reported in the results for 2014 for the first time. 2 Figures exclude Standard Life Investments Inc (SLI Canada) which was sold on 30 January 2015. Comparatives have been restated. Results of discontinued
operations are included in Section 1.4.4. 3 EBITDA and EBITDA margin are key performance metrics for the investment management industry. These have replaced EBIT and EBIT margin metrics as
management believes they are more reflective of the day to day performance of the business. 4 Excludes strategic partner life business.
Strategic overview Standard Life Investments is a leading active asset manager with an expanding global reach. Our culture of investment excellence is fundamental to helping our clients to look forward to their future with confidence. Our wide range of investment funds and solutions is backed by our distinctive ‘Focus on Change’ investment philosophy, disciplined risk management and shared commitment to a culture of investment excellence. Our ‘Focus on Change’ investment philosophy lies at the heart of our investment performance. It seeks to identify the most important factors that drive the market price of an investment and understand the dynamics behind them. It is not inherently growth, value or momentum driven and provides the opportunity to outperform throughout the investment cycle. This, coupled with our exceptional client service has led us to manage £245.9bn of assets for clients all over the world, as we continue to capitalise on our global reach through organic growth, acquisitions and by developing strategic partnerships and relationships.
Market update The global economy continued to expand at a moderate pace in 2014 despite weak activity in Europe and a slowdown in emerging markets, particularly in China. Investors are increasingly taking a more selective approach to investment opportunities. The advantages of our strategic positioning have been reflected in our ability to attract flows across a range of higher margin products through a broad suite of funds, continuing product innovation and expanding geographic reach. We further expanded our range of funds, including developments in multi-asset portfolios and fixed income markets. We also continue to broaden the diversity of our AUM with £4.1bn of third party5 net inflows coming from outside the UK, including £1.3bn from the US.
We continue to play a leading role in governance and stewardship. Strong corporate governance along with responsible stewardship of a business’ capital, employees, customers and environment has a fundamental impact on long-term investment returns. During 2014, we voted at 1,633 shareholder meetings and undertook 647 Environmental, Social and Governance engagements, promoting high standards of governance and stewardship.
Standard Life Investments continued to leverage its investment expertise and work closely with the rest of the Standard Life Group. The inclusion of Standard Life Investments product capability within Group products has been successful. We continued to explore and capitalise on further global distribution opportunities with our strategic partners including HDFC in India, Sumitomo Mitsui Trust Bank in Japan, John Hancock in the US, and Phoenix Group in the UK. This has allowed us to extend our geographical footprint with ten new international offices opening or shortly opening in New York, Los Angeles, Toronto, Munich, Tokyo, Zurich, Stockholm, Brussels, Milan and Madrid, providing closer support to our clients.
On 1 July 2014 we successfully completed the acquisition of Ignis. This transaction deepens our investment capabilities, broadens our client base, and reinforces foundations for building a business in the rapidly developing liability aware market. As a result of the transaction we also entered into a strategic alliance with Phoenix Group through which we provide asset management services to Phoenix’s life company subsidiaries, including the potential to manage books of assets that Phoenix Group may acquire in the future. 5 Excludes strategic partner life business.
Standard Life 15
1. Strategic report continued
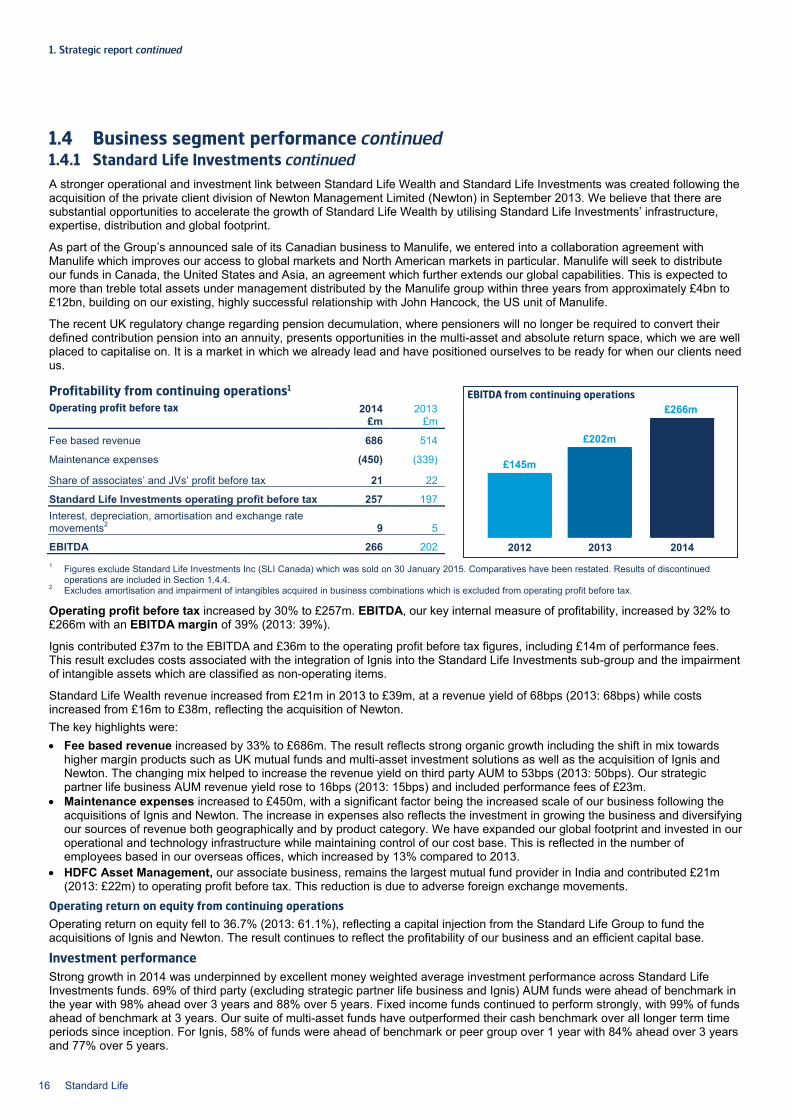
EBITDA from continuing operations
£266m
£145m
£202m
2012 2014 2013
1.4 Business segment performance continued 1.4.1 Standard Life Investments continued A stronger operational and investment link between Standard Life Wealth and Standard Life Investments was created following the acquisition of the private client division of Newton Management Limited (Newton) in September 2013. We believe that there are substantial opportunities to accelerate the growth of Standard Life Wealth by utilising Standard Life Investments’ infrastructure, expertise, distribution and global footprint.
As part of the Group’s announced sale of its Canadian business to Manulife, we entered into a collaboration agreement with Manulife which improves our access to global markets and North American markets in particular. Manulife will seek to distribute our funds in Canada, the United States and Asia, an agreement which further extends our global capabilities. This is expected to more than treble total assets under management distributed by the Manulife group within three years from approximately £4bn to £12bn, building on our existing, highly successful relationship with John Hancock, the US unit of Manulife.
The recent UK regulatory change regarding pension decumulation, where pensioners will no longer be required to convert their defined contribution pension into an annuity, presents opportunities in the multi-asset and absolute return space, which we are well placed to capitalise on. It is a market in which we already lead and have positioned ourselves to be ready for when our clients need us.
Profitability from continuing operations1
Operating profit before tax 2014 2013 £m £m
Fee based revenue 686 514
Maintenance expenses (450) (339)
Share of associates’ and JVs’ profit before tax 21 22
Standard Life Investments operating profit before tax 257 197 Interest, depreciation, amortisation and exchange rate movements2 9 5
EBITDA 266 202 1 Figures exclude Standard Life Investments Inc (SLI Canada) which was sold on 30 January 2015. Comparatives have been restated. Results of discontinued
operations are included in Section 1.4.4. 2 Excludes amortisation and impairment of intangibles acquired in business combinations which is excluded from operating profit before tax.
Operating profit before tax increased by 30% to £257m. EBITDA, our key internal measure of profitability, increased by 32% to £266m with an EBITDA margin of 39% (2013: 39%).
Ignis contributed £37m to the EBITDA and £36m to the operating profit before tax figures, including £14m of performance fees. This result excludes costs associated with the integration of Ignis into the Standard Life Investments sub-group and the impairment of intangible assets which are classified as non-operating items.
Standard Life Wealth revenue increased from £21m in 2013 to £39m, at a revenue yield of 68bps (2013: 68bps) while costs increased from £16m to £38m, reflecting the acquisition of Newton. The key highlights were: • Fee based revenue increased by 33% to £686m. The result reflects strong organic growth including the shift in mix towards
higher margin products such as UK mutual funds and multi-asset investment solutions as well as the acquisition of Ignis and Newton. The changing mix helped to increase the revenue yield on third party AUM to 53bps (2013: 50bps). Our strategic partner life business AUM revenue yield rose to 16bps (2013: 15bps) and included performance fees of £23m.
• Maintenance expenses increased to £450m, with a significant factor being the increased scale of our business following the acquisitions of Ignis and Newton. The increase in expenses also reflects the investment in growing the business and diversifying our sources of revenue both geographically and by product category. We have expanded our global footprint and invested in our operational and technology infrastructure while maintaining control of our cost base. This is reflected in the number of employees based in our overseas offices, which increased by 13% compared to 2013.
• HDFC Asset Management, our associate business, remains the largest mutual fund provider in India and contributed £21m (2013: £22m) to operating profit before tax. This reduction is due to adverse foreign exchange movements.
Operating return on equity from continuing operations Operating return on equity fell to 36.7% (2013: 61.1%), reflecting a capital injection from the Standard Life Group to fund the acquisitions of Ignis and Newton. The result continues to reflect the profitability of our business and an efficient capital base.
Investment performance Strong growth in 2014 was underpinned by excellent money weighted average investment performance across Standard Life Investments funds. 69% of third party (excluding strategic partner life business and Ignis) AUM funds were ahead of benchmark in the year with 98% ahead over 3 years and 88% over 5 years. Fixed income funds continued to perform strongly, with 99% of funds ahead of benchmark at 3 years. Our suite of multi-asset funds have outperformed their cash benchmark over all longer term time periods since inception. For Ignis, 58% of funds were ahead of benchmark or peer group over 1 year with 84% ahead over 3 years and 77% over 5 years.
16 Standard Life
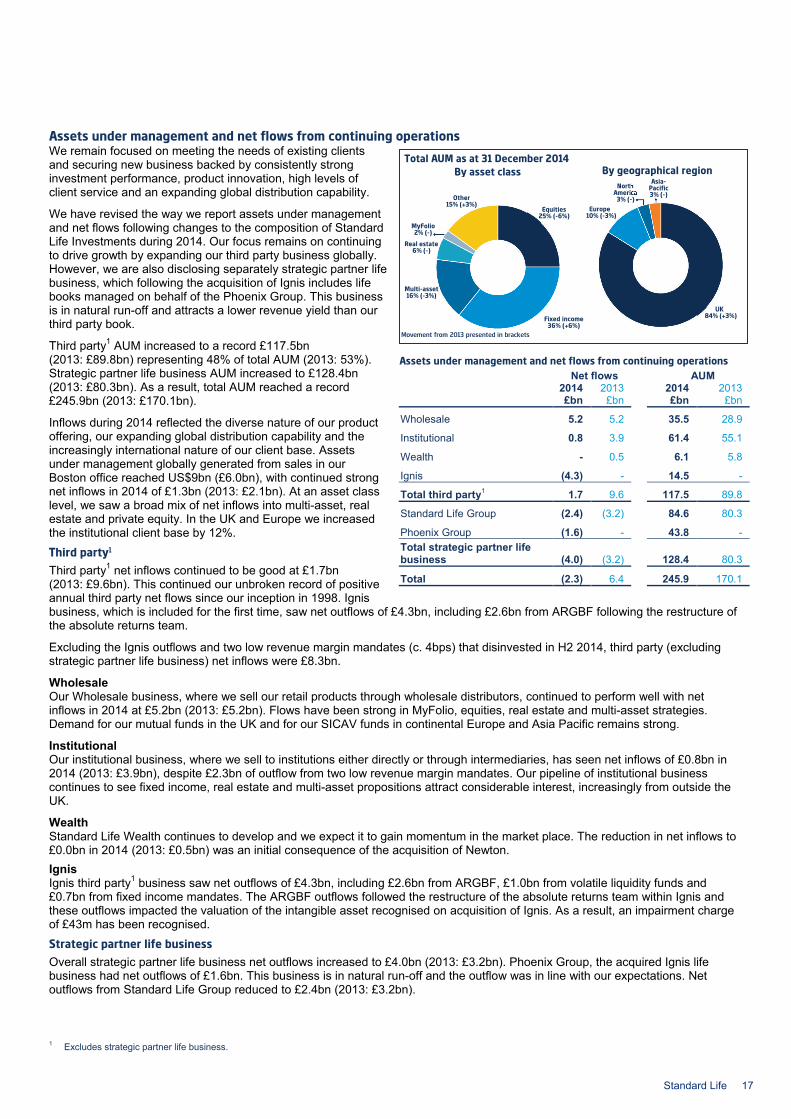
Total AUM as at 31 December 2014 By asset class By geographical region
Fixed income 36% (+6%)
Multi-asset 16% (-3%)
Real estate 6% (-)
MyFolio 2% (-)
Other 15% (+3%)
Equities
25% (-6%)
UK 84% (+3%)
Europe 10% (-3%)
North America 3% (-)
Asia- Pacific 3% (-)
Movement from 2013 presented in brackets
Assets under management and net flows from continuing operations We remain focused on meeting the needs of existing clients and securing new business backed by consistently strong investment performance, product innovation, high levels of client service and an expanding global distribution capability.
We have revised the way we report assets under management and net flows following changes to the composition of Standard Life Investments during 2014. Our focus remains on continuing to drive growth by expanding our third party business globally. However, we are also disclosing separately strategic partner life business, which following the acquisition of Ignis includes life books managed on behalf of the Phoenix Group. This business is in natural run-off and attracts a lower revenue yield than our third party book.
Third party1 AUM increased to a record £117.5bn (2013: £89.8bn) representing 48% of total AUM (2013: 53%). Strategic partner life business AUM increased to £128.4bn (2013: £80.3bn). As a result, total AUM reached a record £245.9bn (2013: £170.1bn).
Inflows during 2014 reflected the diverse nature of our product offering, our expanding global distribution capability and the increasingly international nature of our client base. Assets under management globally generated from sales in our Boston office reached US$9bn (£6.0bn), with continued strong net inflows in 2014 of £1.3bn (2013: £2.1bn). At an asset class level, we saw a broad mix of net inflows into multi-asset, real estate and private equity. In the UK and Europe we increased the institutional client base by 12%. Third party1 Third party1 net inflows continued to be good at £1.7bn (2013: £9.6bn). This continued our unbroken record of positive annual third party net flows since our inception in 1998. Ignis business, which is included for the first time, saw net outflows of £4.3bn, including £2.6bn from ARGBF following the restructure of the absolute returns team.
Excluding the Ignis outflows and two low revenue margin mandates (c. 4bps) that disinvested in H2 2014, third party (excluding strategic partner life business) net inflows were £8.3bn.
Wholesale Our Wholesale business, where we sell our retail products through wholesale distributors, continued to perform well with net inflows in 2014 at £5.2bn (2013: £5.2bn). Flows have been strong in MyFolio, equities, real estate and multi-asset strategies. Demand for our mutual funds in the UK and for our SICAV funds in continental Europe and Asia Pacific remains strong.
Institutional Our institutional business, where we sell to institutions either directly or through intermediaries, has seen net inflows of £0.8bn in 2014 (2013: £3.9bn), despite £2.3bn of outflow from two low revenue margin mandates. Our pipeline of institutional business continues to see fixed income, real estate and multi-asset propositions attract considerable interest, increasingly from outside the UK.
Wealth Standard Life Wealth continues to develop and we expect it to gain momentum in the market place. The reduction in net inflows to £0.0bn in 2014 (2013: £0.5bn) was an initial consequence of the acquisition of Newton. Ignis Ignis third party1 business saw net outflows of £4.3bn, including £2.6bn from ARGBF, £1.0bn from volatile liquidity funds and £0.7bn from fixed income mandates. The ARGBF outflows followed the restructure of the absolute returns team within Ignis and these outflows impacted the valuation of the intangible asset recognised on acquisition of Ignis. As a result, an impairment charge of £43m has been recognised. Strategic partner life business Overall strategic partner life business net outflows increased to £4.0bn (2013: £3.2bn). Phoenix Group, the acquired Ignis life business had net outflows of £1.6bn. This business is in natural run-off and the outflow was in line with our expectations. Net outflows from Standard Life Group reduced to £2.4bn (2013: £3.2bn).
1 Excludes strategic partner life business.
Assets under management and net flows from continuing operations Net flows AUM 2014 2013 2014 2013 £bn £bn £bn £bn
Wholesale 5.2 5.2 35.5 28.9
Institutional 0.8 3.9 61.4 55.1
Wealth - 0.5 6.1 5.8
Ignis (4.3) - 14.5 -
Total third party1 1.7 9.6 117.5 89.8
Standard Life Group (2.4) (3.2) 84.6 80.3
Phoenix Group (1.6) - 43.8 - Total strategic partner life business (4.0) (3.2)
128.4 80.3
Total (2.3) 6.4 245.9 170.1
Standard Life 17
1. Strategic report continued
1.4 Business segment performance continued 1.4.1 Standard Life Investments continued
Our business model Increasing assets with record third party1 AUM
• Ignis contributed third party1 AUM of £14.5bn (2013: £nil) and strategic partner life business of £43.8bn (2013: £nil) • Assets managed by investment teams in our Boston office now exceed US$25bn across equities, fixed income and real estate • Our position in the wholesale market in the UK remains strong, with a share of gross sales of 4.5% (2013: 5.0%). UK mutual
funds AUM increased by 16% to £21.8bn and represents 19% of third party1 assets. We are now the fifth largest manager, by AUM, in the UK wholesale market.
• Launched the Global Focused Strategies Fund, further developing our multi-asset portfolio of products which comprises our suite of global absolute return strategies and balanced funds
• AUM in our Global Equity Unconstrained Fund broke through the £100m mark. The Fund has produced top quartile performance in its sector over a one year period and top decile over three and five years.
• Strong pipeline of new investment initiatives positions us well to continue to meet the changing demands of our clients through new and innovative investment solutions.
Maximising revenue with continued shift in product mix towards higher margin propositions
• Sales of higher margin products enabled us to increase the revenue yield on our third party (excluding strategic partner life business and Ignis) gross sales to 59bps (2013: 58bps)
• Continued to collaborate across the Group to maximise the Group’s share of the value chain, for example our market-leading range of MyFolio risk based funds, used extensively within the long-term savings and investments businesses, remain very popular with AUM of £5.9bn
• Short Duration Credit Fund was launched in 2014 to take advantage of investment demand for funds with less vulnerability to a rise in interest rates
• Standard Life Capital Partners, our private equity business, completed first closures on the Infrastructure Equity Fund and Secondary Opportunities Fund during 2014.
Managing unit costs while investing to extend geographical footprint and support future growth
• Operating expenses expressed as a proportion of average total AUM were 22bps (2013: 21bps). This reflects the ongoing development of our investment capability and expanding distribution and geographic reach. This metric will continue to be closely managed as we move to deliver 45% EBITDA margin by 2017.
• Continued investment to extend our geographical footprint with ten new international offices opened or shortly opening in New York, Los Angeles, Toronto, Munich, Tokyo, Zurich, Stockholm, Brussels, Milan and Madrid, providing closer support to our clients
• Investment in core operational and technology infrastructure to support future growth • Sponsorship of the Ryder Cup extended the global reach and familiarity of our brand • Ongoing management of costs, combined with expansion in revenue margins, has resulted in a 20% compound annual growth
in EBITDA over the last seven years.
Awards and recognitions • Standard Life Investments won the principal Large Investment Group award at the Investment Adviser 100 Club Awards for the
second consecutive year. Also for the second year running, we completed a hat-trick of wins at the awards, having won the top awards in the UK equity income category, for our Standard Life Investments UK Equity Income Unconstrained Fund, and the Property category for the Standard Life Investments Property Income Trust Limited.
• Won the Multi-Asset Manager of the Year category at the Financial News 2014 Awards for Excellence • Standard Life Equity Income Trust won Best Investment Trust for Income at the What Investment Trust Awards • Multi-Asset Manager of the Year and Fixed Income Manager of the Year at the Professional Pensions awards 2014 • Global Absolute Return Strategies Fund won the award for the 2013 best Multi-Strategy UCITS absolute return fund at the 2013
UCITS Alternative Index (UAI) Awards. The award was based on the Fund’s three-year performance to 31 December 2013. • Celebrated success at the Moneywise Fund Awards 2014 winning the UK All Companies sector award for the second
consecutive year for the consistently strong performance of our UK Equity Unconstrained Fund • Won the UK Equity Manager of the Year category at the Professional Pensions Investment Awards • Harry Nimmo, Head of the smaller companies’ investment team was named Fund Manager of the Decade at the Quoted
Company 10th anniversary awards. The shortlist was chosen from those who have achieved the highest ten-year total returns from investing in smaller UK companies. Consistency of performance, risk-adjusted returns and the success of each Investment Trust in beating its peer group and the market were all considered.
1 Excludes strategic partner life business.
18 Standard Life
1.4.2 UK and Europe Financial highlights1
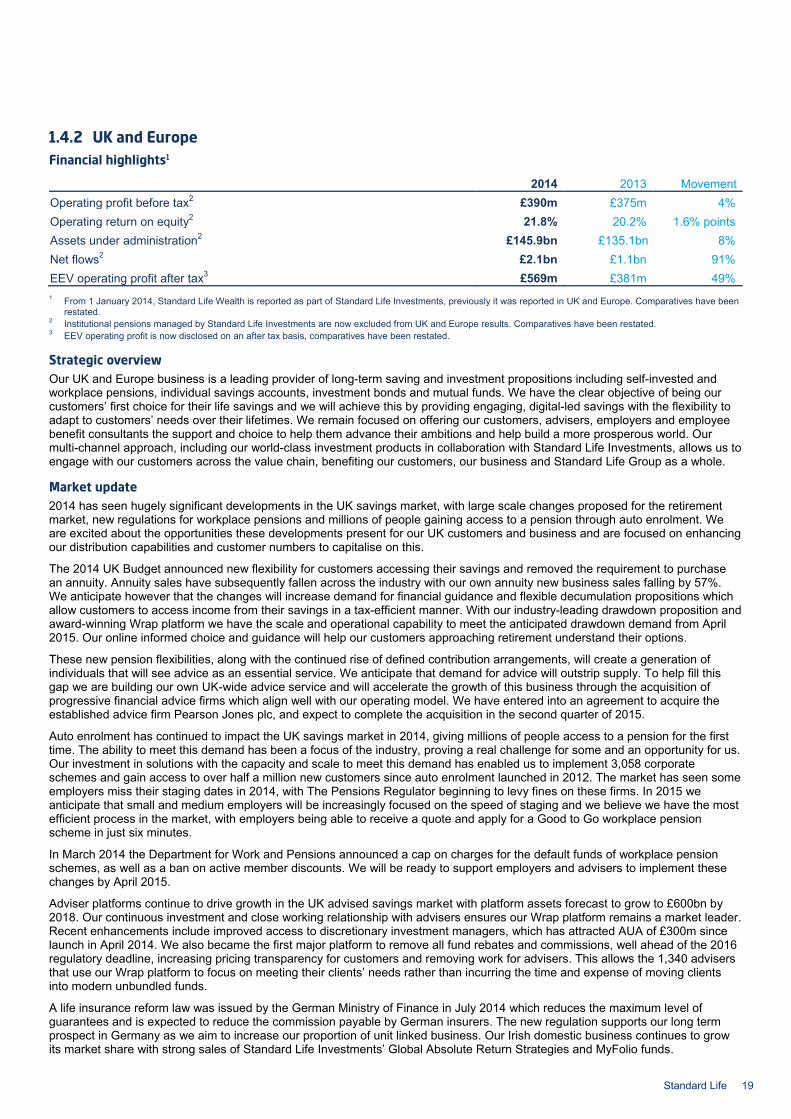
2014 2013 Movement Operating profit before tax2 £390m £375m 4% Operating return on equity2 21.8% 20.2% 1.6% points Assets under administration2 £145.9bn £135.1bn 8% Net flows2 £2.1bn £1.1bn 91% EEV operating profit after tax3 £569m £381m 49% 1 From 1 January 2014, Standard Life Wealth is reported as part of Standard Life Investments, previously it was reported in UK and Europe. Comparatives have been
restated. 2 Institutional pensions managed by Standard Life Investments are now excluded from UK and Europe results. Comparatives have been restated. 3 EEV operating profit is now disclosed on an after tax basis, comparatives have been restated.
Strategic overview Our UK and Europe business is a leading provider of long-term saving and investment propositions including self-invested and workplace pensions, individual savings accounts, investment bonds and mutual funds. We have the clear objective of being our customers’ first choice for their life savings and we will achieve this by providing engaging, digital-led savings with the flexibility to adapt to customers’ needs over their lifetimes. We remain focused on offering our customers, advisers, employers and employee benefit consultants the support and choice to help them advance their ambitions and help build a more prosperous world. Our multi-channel approach, including our world-class investment products in collaboration with Standard Life Investments, allows us to engage with our customers across the value chain, benefiting our customers, our business and Standard Life Group as a whole.
Market update 2014 has seen hugely significant developments in the UK savings market, with large scale changes proposed for the retirement market, new regulations for workplace pensions and millions of people gaining access to a pension through auto enrolment. We are excited about the opportunities these developments present for our UK customers and business and are focused on enhancing our distribution capabilities and customer numbers to capitalise on this.
The 2014 UK Budget announced new flexibility for customers accessing their savings and removed the requirement to purchase an annuity. Annuity sales have subsequently fallen across the industry with our own annuity new business sales falling by 57%. We anticipate however that the changes will increase demand for financial guidance and flexible decumulation propositions which allow customers to access income from their savings in a tax-efficient manner. With our industry-leading drawdown proposition and award-winning Wrap platform we have the scale and operational capability to meet the anticipated drawdown demand from April 2015. Our online informed choice and guidance will help our customers approaching retirement understand their options.
These new pension flexibilities, along with the continued rise of defined contribution arrangements, will create a generation of individuals that will see advice as an essential service. We anticipate that demand for advice will outstrip supply. To help fill this gap we are building our own UK-wide advice service and will accelerate the growth of this business through the acquisition of progressive financial advice firms which align well with our operating model. We have entered into an agreement to acquire the established advice firm Pearson Jones plc, and expect to complete the acquisition in the second quarter of 2015.
Auto enrolment has continued to impact the UK savings market in 2014, giving millions of people access to a pension for the first time. The ability to meet this demand has been a focus of the industry, proving a real challenge for some and an opportunity for us. Our investment in solutions with the capacity and scale to meet this demand has enabled us to implement 3,058 corporate schemes and gain access to over half a million new customers since auto enrolment launched in 2012. The market has seen some employers miss their staging dates in 2014, with The Pensions Regulator beginning to levy fines on these firms. In 2015 we anticipate that small and medium employers will be increasingly focused on the speed of staging and we believe we have the most efficient process in the market, with employers being able to receive a quote and apply for a Good to Go workplace pension scheme in just six minutes.
In March 2014 the Department for Work and Pensions announced a cap on charges for the default funds of workplace pension schemes, as well as a ban on active member discounts. We will be ready to support employers and advisers to implement these changes by April 2015.
Adviser platforms continue to drive growth in the UK advised savings market with platform assets forecast to grow to £600bn by 2018. Our continuous investment and close working relationship with advisers ensures our Wrap platform remains a market leader. Recent enhancements include improved access to discretionary investment managers, which has attracted AUA of £300m since launch in April 2014. We also became the first major platform to remove all fund rebates and commissions, well ahead of the 2016 regulatory deadline, increasing pricing transparency for customers and removing work for advisers. This allows the 1,340 advisers that use our Wrap platform to focus on meeting their clients’ needs rather than incurring the time and expense of moving clients into modern unbundled funds.
A life insurance reform law was issued by the German Ministry of Finance in July 2014 which reduces the maximum level of guarantees and is expected to reduce the commission payable by German insurers. The new regulation supports our long term prospect in Germany as we aim to increase our proportion of unit linked business. Our Irish domestic business continues to grow its market share with strong sales of Standard Life Investments’ Global Absolute Return Strategies and MyFolio funds.
Standard Life 19
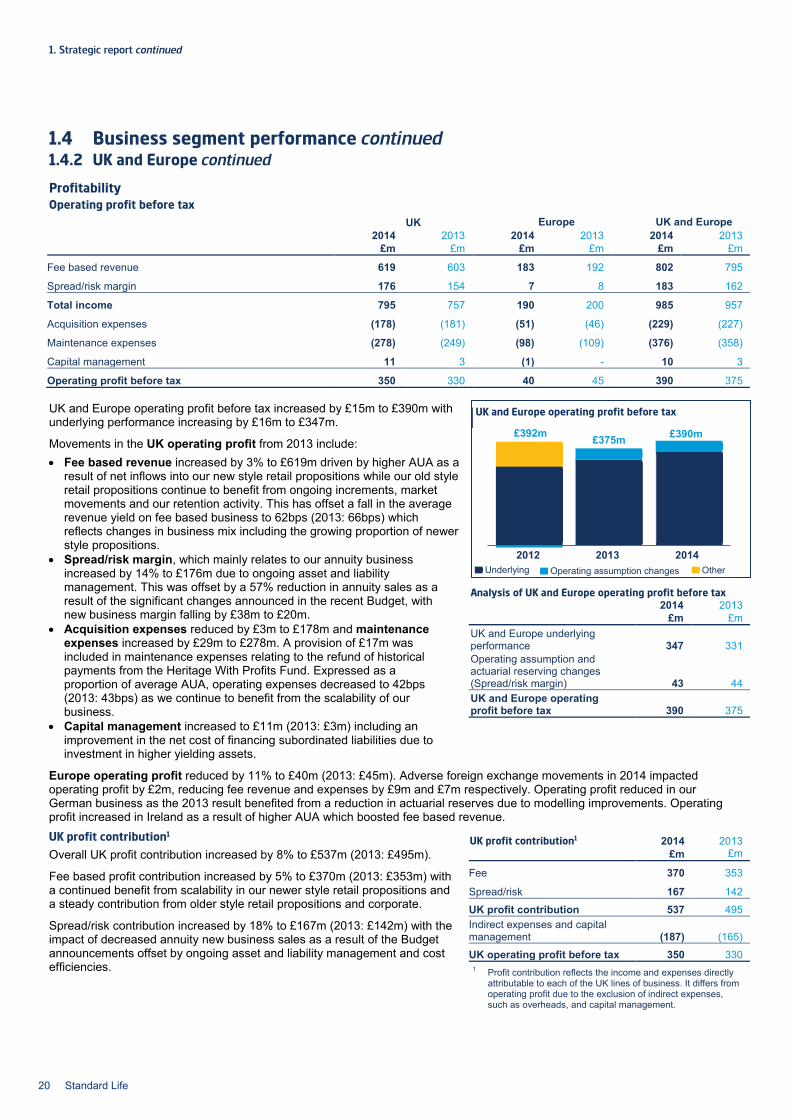
1. Strategic report continued
UK and Europe operating profit before tax
£390m £392m £375m
2012 2014 2013
Underlying
Operating assumption changes Other
1.4 Business segment performance continued 1.4.2 UK and Europe continued
Profitability Operating profit before tax
UK and Europe operating profit before tax increased by £15m to £390m with underlying performance increasing by £16m to £347m.
Movements in the UK operating profit from 2013 include: • Fee based revenue increased by 3% to £619m driven by higher AUA as a
result of net inflows into our new style retail propositions while our old style retail propositions continue to benefit from ongoing increments, market movements and our retention activity. This has offset a fall in the average revenue yield on fee based business to 62bps (2013: 66bps) which reflects changes in business mix including the growing proportion of newer style propositions.
• Spread/risk margin, which mainly relates to our annuity business increased by 14% to £176m due to ongoing asset and liability management. This was offset by a 57% reduction in annuity sales as a result of the significant changes announced in the recent Budget, with new business margin falling by £38m to £20m.
• Acquisition expenses reduced by £3m to £178m and maintenance expenses increased by £29m to £278m. A provision of £17m was included in maintenance expenses relating to the refund of historical payments from the Heritage With Profits Fund. Expressed as a proportion of average AUA, operating expenses decreased to 42bps (2013: 43bps) as we continue to benefit from the scalability of our business.
• Capital management increased to £11m (2013: £3m) including an improvement in the net cost of financing subordinated liabilities due to investment in higher yielding assets.
Europe operating profit reduced by 11% to £40m (2013: £45m). Adverse foreign exchange movements in 2014 impacted operating profit by £2m, reducing fee revenue and expenses by £9m and £7m respectively. Operating profit reduced in our German business as the 2013 result benefited from a reduction in actuarial reserves due to modelling improvements. Operating profit increased in Ireland as a result of higher AUA which boosted fee based revenue. UK profit contribution1 Overall UK profit contribution increased by 8% to £537m (2013: £495m).
Fee based profit contribution increased by 5% to £370m (2013: £353m) with a continued benefit from scalability in our newer style retail propositions and a steady contribution from older style retail propositions and corporate.
Spread/risk contribution increased by 18% to £167m (2013: £142m) with the impact of decreased annuity new business sales as a result of the Budget announcements offset by ongoing asset and liability management and cost efficiencies.
UK Europe UK and Europe 2014 2013 2014 2013 2014 2013 £m £m £m £m £m £m
Fee based revenue 619 603 183 192 802 795
Spread/risk margin 176 154 7 8 183 162
Total income 795 757 190 200 985 957
Acquisition expenses (178) (181) (51) (46) (229) (227)
Maintenance expenses (278) (249) (98) (109) (376) (358)
Capital management 11 3 (1) - 10 3
Operating profit before tax 350 330 40 45 390 375
Analysis of UK and Europe operating profit before tax 2014 2013 £m £m
UK and Europe underlying performance 347 331 Operating assumption and actuarial reserving changes (Spread/risk margin) 43 44 UK and Europe operating profit before tax 390 375
UK profit contribution1 2014 2013 £m £m
Fee 370 353
Spread/risk 167 142
UK profit contribution 537 495 Indirect expenses and capital management (187) (165)
UK operating profit before tax 350 330 1 Profit contribution reflects the income and expenses directly
attributable to each of the UK lines of business. It differs from operating profit due to the exclusion of indirect expenses, such as overheads, and capital management.
20 Standard Life
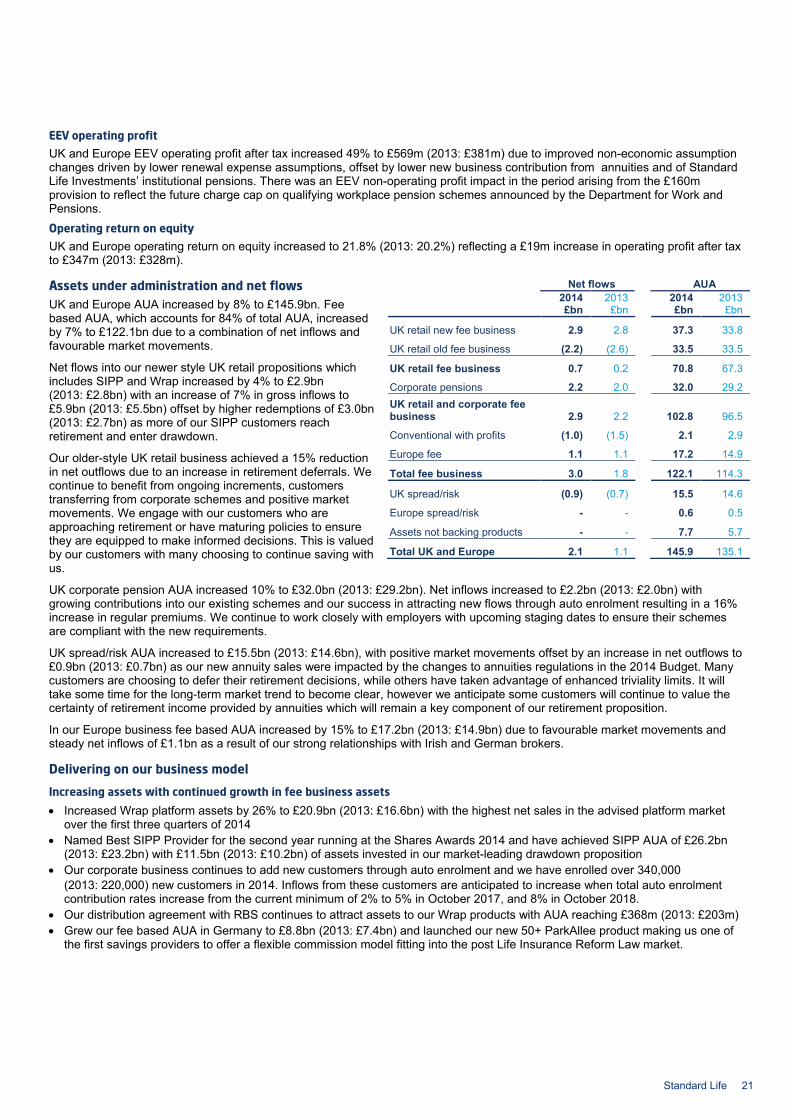
EEV operating profit UK and Europe EEV operating profit after tax increased 49% to £569m (2013: £381m) due to improved non-economic assumption changes driven by lower renewal expense assumptions, offset by lower new business contribution from annuities and of Standard Life Investments’ institutional pensions. There was an EEV non-operating profit impact in the period arising from the £160m provision to reflect the future charge cap on qualifying workplace pension schemes announced by the Department for Work and Pensions. Operating return on equity UK and Europe operating return on equity increased to 21.8% (2013: 20.2%) reflecting a £19m increase in operating profit after tax to £347m (2013: £328m).
Assets under administration and net flows UK and Europe AUA increased by 8% to £145.9bn. Fee based AUA, which accounts for 84% of total AUA, increased by 7% to £122.1bn due to a combination of net inflows and favourable market movements.
Net flows into our newer style UK retail propositions which includes SIPP and Wrap increased by 4% to £2.9bn (2013: £2.8bn) with an increase of 7% in gross inflows to £5.9bn (2013: £5.5bn) offset by higher redemptions of £3.0bn (2013: £2.7bn) as more of our SIPP customers reach retirement and enter drawdown.
Our older-style UK retail business achieved a 15% reduction in net outflows due to an increase in retirement deferrals. We continue to benefit from ongoing increments, customers transferring from corporate schemes and positive market movements. We engage with our customers who are approaching retirement or have maturing policies to ensure they are equipped to make informed decisions. This is valued by our customers with many choosing to continue saving with us.
UK corporate pension AUA increased 10% to £32.0bn (2013: £29.2bn). Net inflows increased to £2.2bn (2013: £2.0bn) with growing contributions into our existing schemes and our success in attracting new flows through auto enrolment resulting in a 16% increase in regular premiums. We continue to work closely with employers with upcoming staging dates to ensure their schemes are compliant with the new requirements.
UK spread/risk AUA increased to £15.5bn (2013: £14.6bn), with positive market movements offset by an increase in net outflows to £0.9bn (2013: £0.7bn) as our new annuity sales were impacted by the changes to annuities regulations in the 2014 Budget. Many customers are choosing to defer their retirement decisions, while others have taken advantage of enhanced triviality limits. It will take some time for the long-term market trend to become clear, however we anticipate some customers will continue to value the certainty of retirement income provided by annuities which will remain a key component of our retirement proposition.
In our Europe business fee based AUA increased by 15% to £17.2bn (2013: £14.9bn) due to favourable market movements and steady net inflows of £1.1bn as a result of our strong relationships with Irish and German brokers.
Delivering on our business model
Increasing assets with continued growth in fee business assets
• Increased Wrap platform assets by 26% to £20.9bn (2013: £16.6bn) with the highest net sales in the advised platform market over the first three quarters of 2014
• Named Best SIPP Provider for the second year running at the Shares Awards 2014 and have achieved SIPP AUA of £26.2bn (2013: £23.2bn) with £11.5bn (2013: £10.2bn) of assets invested in our market-leading drawdown proposition
• Our corporate business continues to add new customers through auto enrolment and we have enrolled over 340,000 (2013: 220,000) new customers in 2014. Inflows from these customers are anticipated to increase when total auto enrolment contribution rates increase from the current minimum of 2% to 5% in October 2017, and 8% in October 2018.
• Our distribution agreement with RBS continues to attract assets to our Wrap products with AUA reaching £368m (2013: £203m) • Grew our fee based AUA in Germany to £8.8bn (2013: £7.4bn) and launched our new 50+ ParkAllee product making us one of
the first savings providers to offer a flexible commission model fitting into the post Life Insurance Reform Law market.
Net flows AUA 2014 2013 2014 2013 £bn £bn £bn £bn
UK retail new fee business 2.9 2.8 37.3 33.8
UK retail old fee business (2.2) (2.6) 33.5 33.5
UK retail fee business 0.7 0.2 70.8 67.3
Corporate pensions 2.2 2.0 32.0 29.2 UK retail and corporate fee business 2.9 2.2
102.8 96.5
Conventional with profits (1.0) (1.5) 2.1 2.9
Europe fee 1.1 1.1 17.2 14.9
Total fee business 3.0 1.8 122.1 114.3
UK spread/risk (0.9) (0.7) 15.5 14.6
Europe spread/risk - - 0.6 0.5
Assets not backing products - - 7.7 5.7
Total UK and Europe 2.1 1.1 145.9 135.1
Standard Life 21
1. Strategic report continued
1.4 Business segment performance continued 1.4.2 UK and Europe continued Maximising revenue – ready for new retirement flexibilities and well positioned across the value chain
• We will be ready to deliver the flexibility and choice our customers expect when the 2014 Budget pension reforms come into effect in April 2015. We have contacted 450,000 customers aged over 50 to reassure them that, as the biggest drawdown provider in the UK, we are well placed to help when they need us.
• Continue to lead the way in customer engagement with our retirement communications and roadshows starting some 10 years before retirement. Our wide retirement proposition range, including SIPP, drawdown and annuities provide customers with the options required to meet their individual needs and lifestyles.
• Our MyFolio fund range, managed by Standard Life Investments, continues to secure additional revenue for the Group. This popular investment solution simplifies investment choices for customers and has attracted £5.9bn of AUA (2013: £4.0bn) since it was launched in October 2010.
• Our International Portfolio Bond continues to strengthen with a 5% growth in sales to £721m (2013: £688m), demonstrating the confidence of advisers and customers in our proposition.
Lowering unit costs through automation and greater operational efficiency Through leveraging the use of technology and focusing on our customer operations, we have been able to deliver economies of scale along with improvements in customer experience. Examples of this include: • Our Good to Go service for auto enrolment secured over 1,100 schemes in 2014. Our ability to process schemes on the same
day as application demonstrates the scalability of our business at a time when the industry is facing capacity constraints. • Direct to customer ISA launched this year which offers customers a simple online investment journey. 70% of cases are now
written online using straight through processing compared to 28% of ISA cases in 2013. • New online customer journey which enables customers to consolidate and engage more with their savings. • Launched our new UK customer website to provide customers with a simple, helpful and engaging experience • Grew our customer email address database by 60% to over 1 million (2013: 610,000). Increased digital communication is
enhancing our customer communications, generating process efficiencies and also benefiting the environment through reduced use of paper.
Awards and recognition • Platform of the Year 2014 at the Aberdeen Platform of the Year Awards • Best Large Platform Provider at the Aberdeen Platform of the Year Awards • Best SIPP Provider at the Shares Awards 2014 • Awarded the ‘Best Customer Insight and Feedback – A Different Perspective’ award for the cross-industry UK Customer
Experience Awards 2014 • Named as one of the ‘brands to watch’ and highest movers by highly regarded customer experience expert Nunwood, entering
the top 100 for the first time at number 67 out of the top 260 customer experience brands in the UK • Insurance Company of the Year at the City A.M. Awards 2014 • Auto Enrolment Innovation of the Year Award at the UK Pensions Awards for our Good to Go proposition • 5 star Defaqto rating for our Wrap Platform in 2014.
22 Standard Life
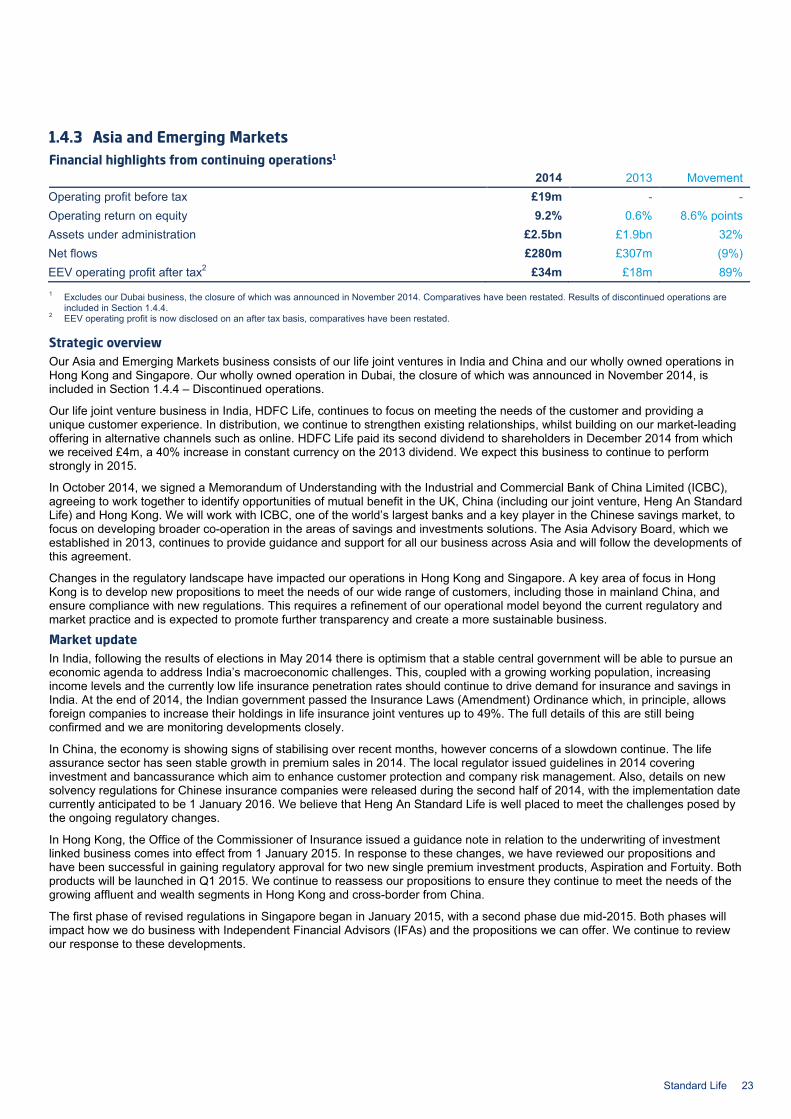
1.4.3 Asia and Emerging Markets Financial highlights from continuing operations1
2014 2013 Movement Operating profit before tax £19m - - Operating return on equity 9.2% 0.6% 8.6% points Assets under administration £2.5bn £1.9bn 32% Net flows £280m £307m (9%) EEV operating profit after tax2 £34m £18m 89% 1 Excludes our Dubai business, the closure of which was announced in November 2014. Comparatives have been restated. Results of discontinued operations are
included in Section 1.4.4. 2 EEV operating profit is now disclosed on an after tax basis, comparatives have been restated.
Strategic overview Our Asia and Emerging Markets business consists of our life joint ventures in India and China and our wholly owned operations in Hong Kong and Singapore. Our wholly owned operation in Dubai, the closure of which was announced in November 2014, is included in Section 1.4.4 – Discontinued operations.
Our life joint venture business in India, HDFC Life, continues to focus on meeting the needs of the customer and providing a unique customer experience. In distribution, we continue to strengthen existing relationships, whilst building on our market-leading offering in alternative channels such as online. HDFC Life paid its second dividend to shareholders in December 2014 from which we received £4m, a 40% increase in constant currency on the 2013 dividend. We expect this business to continue to perform strongly in 2015.
In October 2014, we signed a Memorandum of Understanding with the Industrial and Commercial Bank of China Limited (ICBC), agreeing to work together to identify opportunities of mutual benefit in the UK, China (including our joint venture, Heng An Standard Life) and Hong Kong. We will work with ICBC, one of the world’s largest banks and a key player in the Chinese savings market, to focus on developing broader co-operation in the areas of savings and investments solutions. The Asia Advisory Board, which we established in 2013, continues to provide guidance and support for all our business across Asia and will follow the developments of this agreement.
Changes in the regulatory landscape have impacted our operations in Hong Kong and Singapore. A key area of focus in Hong Kong is to develop new propositions to meet the needs of our wide range of customers, including those in mainland China, and ensure compliance with new regulations. This requires a refinement of our operational model beyond the current regulatory and market practice and is expected to promote further transparency and create a more sustainable business.
Market update In India, following the results of elections in May 2014 there is optimism that a stable central government will be able to pursue an economic agenda to address India’s macroeconomic challenges. This, coupled with a growing working population, increasing income levels and the currently low life insurance penetration rates should continue to drive demand for insurance and savings in India. At the end of 2014, the Indian government passed the Insurance Laws (Amendment) Ordinance which, in principle, allows foreign companies to increase their holdings in life insurance joint ventures up to 49%. The full details of this are still being confirmed and we are monitoring developments closely.
In China, the economy is showing signs of stabilising over recent months, however concerns of a slowdown continue. The life assurance sector has seen stable growth in premium sales in 2014. The local regulator issued guidelines in 2014 covering investment and bancassurance which aim to enhance customer protection and company risk management. Also, details on new solvency regulations for Chinese insurance companies were released during the second half of 2014, with the implementation date currently anticipated to be 1 January 2016. We believe that Heng An Standard Life is well placed to meet the challenges posed by the ongoing regulatory changes.
In Hong Kong, the Office of the Commissioner of Insurance issued a guidance note in relation to the underwriting of investment linked business comes into effect from 1 January 2015. In response to these changes, we have reviewed our propositions and have been successful in gaining regulatory approval for two new single premium investment products, Aspiration and Fortuity. Both products will be launched in Q1 2015. We continue to reassess our propositions to ensure they continue to meet the needs of the growing affluent and wealth segments in Hong Kong and cross-border from China.
The first phase of revised regulations in Singapore began in January 2015, with a second phase due mid-2015. Both phases will impact how we do business with Independent Financial Advisors (IFAs) and the propositions we can offer. We continue to review our response to these developments.
Standard Life 23
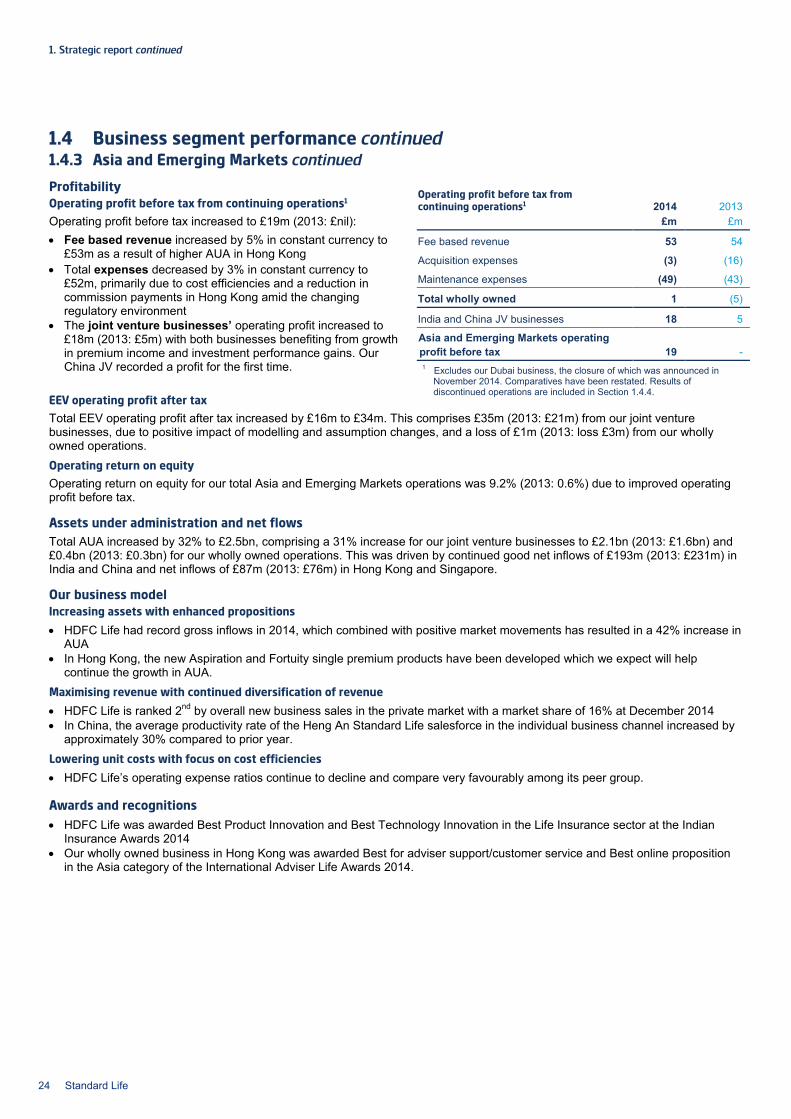
1. Strategic report continued
1.4 Business segment performance continued 1.4.3 Asia and Emerging Markets continued
Profitability Operating profit before tax from continuing operations1
Operating profit before tax increased to £19m (2013: £nil): • Fee based revenue increased by 5% in constant currency to
£53m as a result of higher AUA in Hong Kong • Total expenses decreased by 3% in constant currency to
£52m, primarily due to cost efficiencies and a reduction in commission payments in Hong Kong amid the changing regulatory environment
• The joint venture businesses’ operating profit increased to £18m (2013: £5m) with both businesses benefiting from growth in premium income and investment performance gains. Our China JV recorded a profit for the first time.
EEV operating profit after tax Total EEV operating profit after tax increased by £16m to £34m. This comprises £35m (2013: £21m) from our joint venture businesses, due to positive impact of modelling and assumption changes, and a loss of £1m (2013: loss £3m) from our wholly owned operations. Operating return on equity Operating return on equity for our total Asia and Emerging Markets operations was 9.2% (2013: 0.6%) due to improved operating profit before tax.
Assets under administration and net flows Total AUA increased by 32% to £2.5bn, comprising a 31% increase for our joint venture businesses to £2.1bn (2013: £1.6bn) and £0.4bn (2013: £0.3bn) for our wholly owned operations. This was driven by continued good net inflows of £193m (2013: £231m) in India and China and net inflows of £87m (2013: £76m) in Hong Kong and Singapore.
Our business model Increasing assets with enhanced propositions
• HDFC Life had record gross inflows in 2014, which combined with positive market movements has resulted in a 42% increase in AUA
• In Hong Kong, the new Aspiration and Fortuity single premium products have been developed which we expect will help continue the growth in AUA.
Maximising revenue with continued diversification of revenue
• HDFC Life is ranked 2nd by overall new business sales in the private market with a market share of 16% at December 2014 • In China, the average productivity rate of the Heng An Standard Life salesforce in the individual business channel increased by
approximately 30% compared to prior year. Lowering unit costs with focus on cost efficiencies
• HDFC Life’s operating expense ratios continue to decline and compare very favourably among its peer group.
Awards and recognitions • HDFC Life was awarded Best Product Innovation and Best Technology Innovation in the Life Insurance sector at the Indian
Insurance Awards 2014 • Our wholly owned business in Hong Kong was awarded Best for adviser support/customer service and Best online proposition
in the Asia category of the International Adviser Life Awards 2014.
Operating profit before tax from continuing operations1 2014 2013 £m £m
Fee based revenue 53 54
Acquisition expenses (3) (16)
Maintenance expenses (49) (43)
Total wholly owned 1 (5)
India and China JV businesses 18 5
Asia and Emerging Markets operating profit before tax 19 - 1 Excludes our Dubai business, the closure of which was announced in
November 2014. Comparatives have been restated. Results of discontinued operations are included in Section 1.4.4.
24 Standard Life
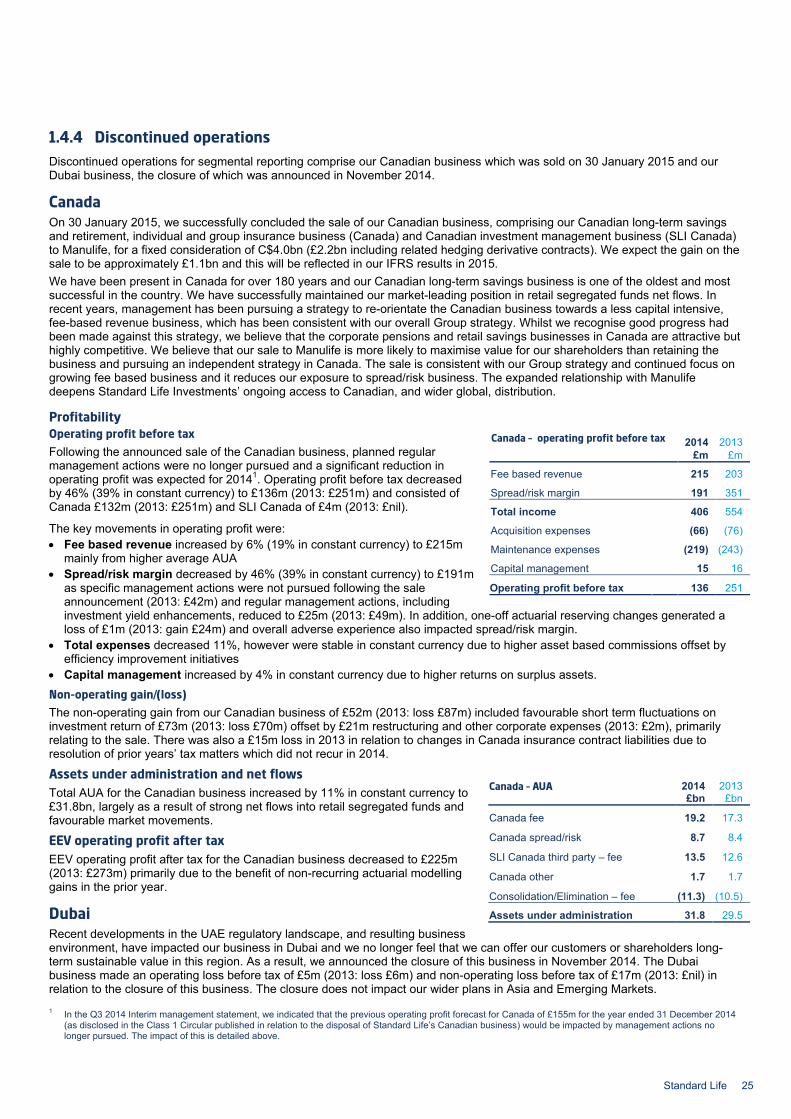
1.4.4 Discontinued operations Discontinued operations for segmental reporting comprise our Canadian business which was sold on 30 January 2015 and our Dubai business, the closure of which was announced in November 2014.
Canada
On 30 January 2015, we successfully concluded the sale of our Canadian business, comprising our Canadian long-term savings and retirement, individual and group insurance business (Canada) and Canadian investment management business (SLI Canada) to Manulife, for a fixed consideration of C$4.0bn (£2.2bn including related hedging derivative contracts). We expect the gain on the sale to be approximately £1.1bn and this will be reflected in our IFRS results in 2015. We have been present in Canada for over 180 years and our Canadian long-term savings business is one of the oldest and most successful in the country. We have successfully maintained our market-leading position in retail segregated funds net flows. In recent years, management has been pursuing a strategy to re-orientate the Canadian business towards a less capital intensive, fee-based revenue business, which has been consistent with our overall Group strategy. Whilst we recognise good progress had been made against this strategy, we believe that the corporate pensions and retail savings businesses in Canada are attractive but highly competitive. We believe that our sale to Manulife is more likely to maximise value for our shareholders than retaining the business and pursuing an independent strategy in Canada. The sale is consistent with our Group strategy and continued focus on growing fee based business and it reduces our exposure to spread/risk business. The expanded relationship with Manulife deepens Standard Life Investments’ ongoing access to Canadian, and wider global, distribution.
Profitability Operating profit before tax Following the announced sale of the Canadian business, planned regular management actions were no longer pursued and a significant reduction in operating profit was expected for 20141. Operating profit before tax decreased by 46% (39% in constant currency) to £136m (2013: £251m) and consisted of Canada £132m (2013: £251m) and SLI Canada of £4m (2013: £nil).
The key movements in operating profit were: • Fee based revenue increased by 6% (19% in constant currency) to £215m
mainly from higher average AUA • Spread/risk margin decreased by 46% (39% in constant currency) to £191m
as specific management actions were not pursued following the sale announcement (2013: £42m) and regular management actions, including investment yield enhancements, reduced to £25m (2013: £49m). In addition, one-off actuarial reserving changes generated a loss of £1m (2013: gain £24m) and overall adverse experience also impacted spread/risk margin.
• Total expenses decreased 11%, however were stable in constant currency due to higher asset based commissions offset by efficiency improvement initiatives
• Capital management increased by 4% in constant currency due to higher returns on surplus assets. Non-operating gain/(loss) The non-operating gain from our Canadian business of £52m (2013: loss £87m) included favourable short term fluctuations on investment return of £73m (2013: loss £70m) offset by £21m restructuring and other corporate expenses (2013: £2m), primarily relating to the sale. There was also a £15m loss in 2013 in relation to changes in Canada insurance contract liabilities due to resolution of prior years’ tax matters which did not recur in 2014.
Assets under administration and net flows Total AUA for the Canadian business increased by 11% in constant currency to £31.8bn, largely as a result of strong net flows into retail segregated funds and favourable market movements.
EEV operating profit after tax EEV operating profit after tax for the Canadian business decreased to £225m (2013: £273m) primarily due to the benefit of non-recurring actuarial modelling gains in the prior year.
Dubai Recent developments in the UAE regulatory landscape, and resulting business environment, have impacted our business in Dubai and we no longer feel that we can offer our customers or shareholders long-term sustainable value in this region. As a result, we announced the closure of this business in November 2014. The Dubai business made an operating loss before tax of £5m (2013: loss £6m) and non-operating loss before tax of £17m (2013: £nil) in relation to the closure of this business. The closure does not impact our wider plans in Asia and Emerging Markets.
1 In the Q3 2014 Interim management statement, we indicated that the previous operating profit forecast for Canada of £155m for the year ended 31 December 2014 (as disclosed in the Class 1 Circular published in relation to the disposal of Standard Life’s Canadian business) would be impacted by management actions no longer pursued. The impact of this is detailed above.
Canada – operating profit before tax 2014 2013
£m £m
Fee based revenue 215 203
Spread/risk margin 191 351
Total income 406 554
Acquisition expenses (66) (76)
Maintenance expenses (219) (243)
Capital management 15 16
Operating profit before tax 136 251
Canada – AUA 2014 £bn
2013 £bn
Canada fee 19.2 17.3
Canada spread/risk 8.7 8.4
SLI Canada third party – fee 13.5 12.6
Canada other 1.7 1.7
Consolidation/Elimination – fee (11.3) (10.5)
Assets under administration 31.8 29.5
Standard Life 25
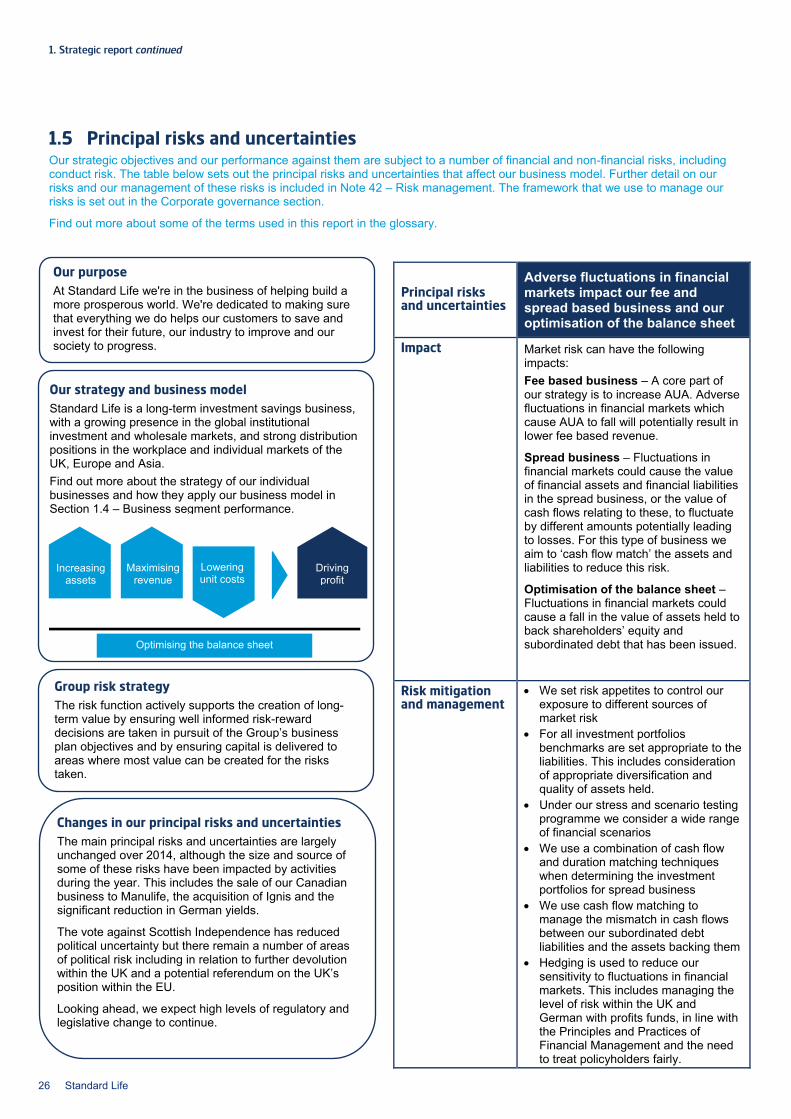
1. Strategic report continued
Our purpose At Standard Life we're in the business of helping build a more prosperous world. We're dedicated to making sure that everything we do helps our customers to save and invest for their future, our industry to improve and our society to progress.
Increasing assets
Maximising revenue
Driving profit
Lowering unit costs
1.5 Principal risks and uncertainties Our strategic objectives and our performance against them are subject to a number of financial and non-financial risks, including conduct risk. The table below sets out the principal risks and uncertainties that affect our business model. Further detail on our risks and our management of these risks is included in Note 42 – Risk management. The framework that we use to manage our risks is set out in the Corporate governance section.
Find out more about some of the terms used in this report in the glossary.
Principal risks and uncertainties
Adverse fluctuations in financial markets impact our fee and spread based business and our optimisation of the balance sheet
Impact Market risk can have the following impacts: Fee based business – A core part of our strategy is to increase AUA. Adverse fluctuations in financial markets which cause AUA to fall will potentially result in lower fee based revenue.
Spread business – Fluctuations in financial markets could cause the value of financial assets and financial liabilities in the spread business, or the value of cash flows relating to these, to fluctuate by different amounts potentially leading to losses. For this type of business we aim to ‘cash flow match’ the assets and liabilities to reduce this risk.
Optimisation of the balance sheet –Fluctuations in financial markets could cause a fall in the value of assets held to back shareholders’ equity and subordinated debt that has been issued.
Risk mitigation and management
• We set risk appetites to control our exposure to different sources of market risk
• For all investment portfolios benchmarks are set appropriate to the liabilities. This includes consideration of appropriate diversification and quality of assets held.
• Under our stress and scenario testing programme we consider a wide range of financial scenarios
• We use a combination of cash flow and duration matching techniques when determining the investment portfolios for spread business
• We use cash flow matching to manage the mismatch in cash flows between our subordinated debt liabilities and the assets backing them
• Hedging is used to reduce our sensitivity to fluctuations in financial markets. This includes managing the level of risk within the UK and German with profits funds, in line with the Principles and Practices of Financial Management and the need to treat policyholders fairly.
Our strategy and business model Standard Life is a long-term investment savings business, with a growing presence in the global institutional investment and wholesale markets, and strong distribution positions in the workplace and individual markets of the UK, Europe and Asia. Find out more about the strategy of our individual businesses and how they apply our business model in Section 1.4 – Business segment performance.
Optimising the balance sheet
Group risk strategy The risk function actively supports the creation of long-term value by ensuring well informed risk-reward decisions are taken in pursuit of the Group’s business plan objectives and by ensuring capital is delivered to areas where most value can be created for the risks taken.
Changes in our principal risks and uncertainties The main principal risks and uncertainties are largely unchanged over 2014, although the size and source of some of these risks have been impacted by activities during the year. This includes the sale of our Canadian business to Manulife, the acquisition of Ignis and the significant reduction in German yields.
The vote against Scottish Independence has reduced political uncertainty but there remain a number of areas of political risk including in relation to further devolution within the UK and a potential referendum on the UK’s position within the EU.
Looking ahead, we expect high levels of regulatory and legislative change to continue.
26 Standard Life
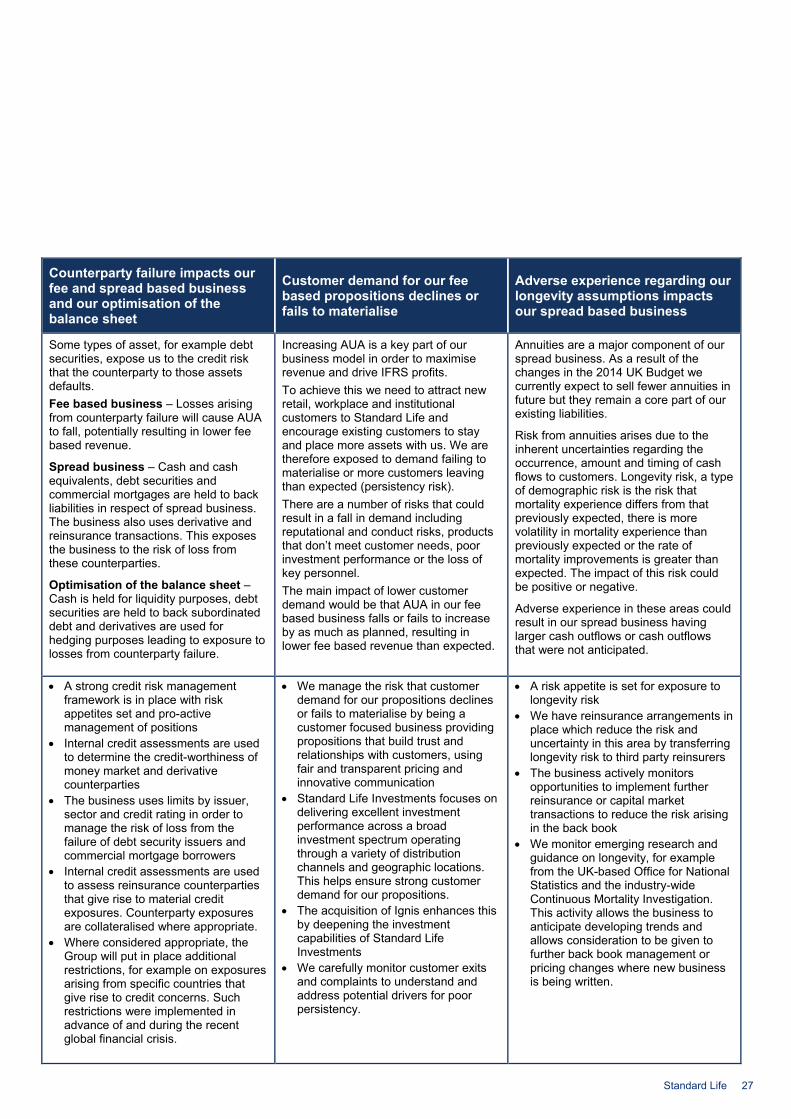
Counterparty failure impacts our fee and spread based business and our optimisation of the balance sheet
Customer demand for our fee based propositions declines or fails to materialise
Adverse experience regarding our longevity assumptions impacts our spread based business
Some types of asset, for example debt securities, expose us to the credit risk that the counterparty to those assets defaults. Fee based business – Losses arising from counterparty failure will cause AUA to fall, potentially resulting in lower fee based revenue.
Spread business – Cash and cash equivalents, debt securities and commercial mortgages are held to back liabilities in respect of spread business. The business also uses derivative and reinsurance transactions. This exposes the business to the risk of loss from these counterparties.
Optimisation of the balance sheet –Cash is held for liquidity purposes, debt securities are held to back subordinated debt and derivatives are used for hedging purposes leading to exposure to losses from counterparty failure.
Increasing AUA is a key part of our business model in order to maximise revenue and drive IFRS profits. To achieve this we need to attract new retail, workplace and institutional customers to Standard Life and encourage existing customers to stay and place more assets with us. We are therefore exposed to demand failing to materialise or more customers leaving than expected (persistency risk). There are a number of risks that could result in a fall in demand including reputational and conduct risks, products that don’t meet customer needs, poor investment performance or the loss of key personnel. The main impact of lower customer demand would be that AUA in our fee based business falls or fails to increase by as much as planned, resulting in lower fee based revenue than expected.
Annuities are a major component of our spread business. As a result of the changes in the 2014 UK Budget we currently expect to sell fewer annuities in future but they remain a core part of our existing liabilities.
Risk from annuities arises due to the inherent uncertainties regarding the occurrence, amount and timing of cash flows to customers. Longevity risk, a type of demographic risk is the risk that mortality experience differs from that previously expected, there is more volatility in mortality experience than previously expected or the rate of mortality improvements is greater than expected. The impact of this risk could be positive or negative.
Adverse experience in these areas could result in our spread business having larger cash outflows or cash outflows that were not anticipated.
• A strong credit risk management framework is in place with risk appetites set and pro-active management of positions
• Internal credit assessments are used to determine the credit-worthiness of money market and derivative counterparties
• The business uses limits by issuer, sector and credit rating in order to manage the risk of loss from the failure of debt security issuers and commercial mortgage borrowers
• Internal credit assessments are used to assess reinsurance counterparties that give rise to material credit exposures. Counterparty exposures are collateralised where appropriate.
• Where considered appropriate, the Group will put in place additional restrictions, for example on exposures arising from specific countries that give rise to credit concerns. Such restrictions were implemented in advance of and during the recent global financial crisis.
• We manage the risk that customer demand for our propositions declines or fails to materialise by being a customer focused business providing propositions that build trust and relationships with customers, using fair and transparent pricing and innovative communication
• Standard Life Investments focuses on delivering excellent investment performance across a broad investment spectrum operating through a variety of distribution channels and geographic locations. This helps ensure strong customer demand for our propositions.
• The acquisition of Ignis enhances this by deepening the investment capabilities of Standard Life Investments
• We carefully monitor customer exits and complaints to understand and address potential drivers for poor persistency.
• A risk appetite is set for exposure to longevity risk
• We have reinsurance arrangements in place which reduce the risk and uncertainty in this area by transferring longevity risk to third party reinsurers
• The business actively monitors opportunities to implement further reinsurance or capital market transactions to reduce the risk arising in the back book
• We monitor emerging research and guidance on longevity, for example from the UK-based Office for National Statistics and the industry-wide Continuous Mortality Investigation. This activity allows the business to anticipate developing trends and allows consideration to be given to further back book management or pricing changes where new business is being written.
Standard Life 27
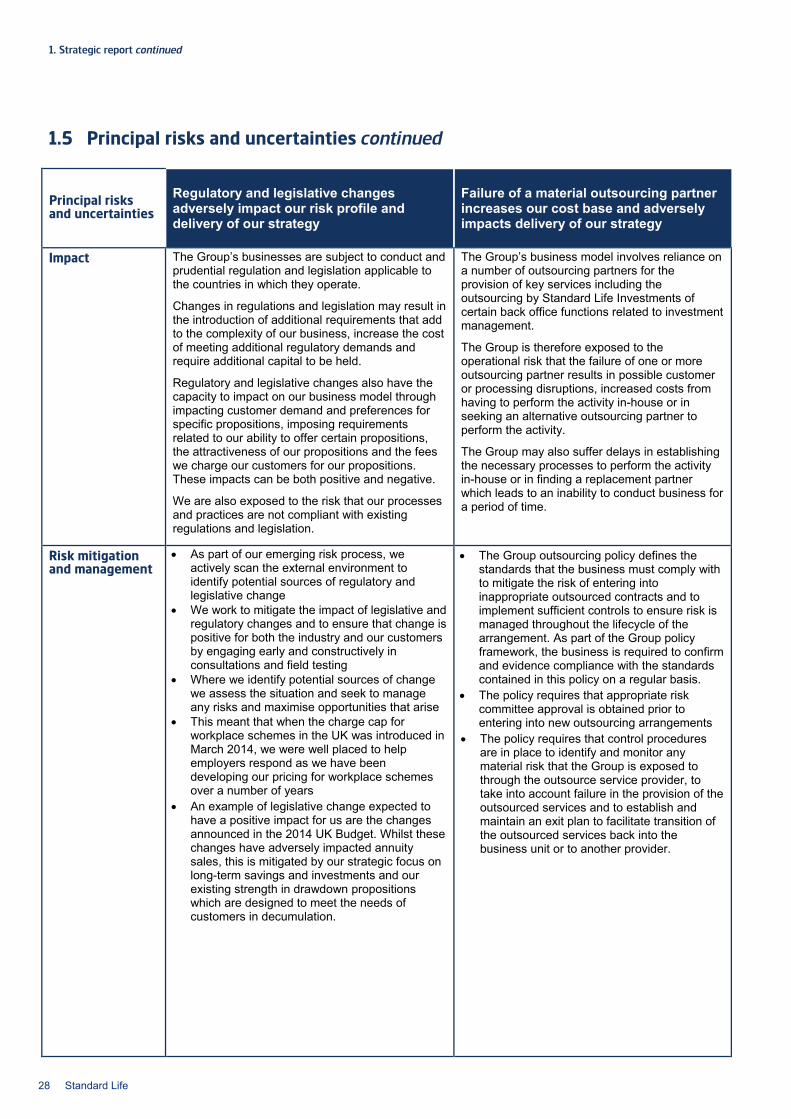
1. Strategic report continued
1.5 Principal risks and uncertainties continued
Principal risks and uncertainties
Regulatory and legislative changes adversely impact our risk profile and delivery of our strategy
Failure of a material outsourcing partner increases our cost base and adversely impacts delivery of our strategy
Impact The Group’s businesses are subject to conduct and prudential regulation and legislation applicable to the countries in which they operate.
Changes in regulations and legislation may result in the introduction of additional requirements that add to the complexity of our business, increase the cost of meeting additional regulatory demands and require additional capital to be held.
Regulatory and legislative changes also have the capacity to impact on our business model through impacting customer demand and preferences for specific propositions, imposing requirements related to our ability to offer certain propositions, the attractiveness of our propositions and the fees we charge our customers for our propositions. These impacts can be both positive and negative.
We are also exposed to the risk that our processes and practices are not compliant with existing regulations and legislation.
The Group’s business model involves reliance on a number of outsourcing partners for the provision of key services including the outsourcing by Standard Life Investments of certain back office functions related to investment management.
The Group is therefore exposed to the operational risk that the failure of one or more outsourcing partner results in possible customer or processing disruptions, increased costs from having to perform the activity in-house or in seeking an alternative outsourcing partner to perform the activity.
The Group may also suffer delays in establishing the necessary processes to perform the activity in-house or in finding a replacement partner which leads to an inability to conduct business for a period of time.
Risk mitigation and management
• As part of our emerging risk process, we actively scan the external environment to identify potential sources of regulatory and legislative change
• We work to mitigate the impact of legislative and regulatory changes and to ensure that change is positive for both the industry and our customers by engaging early and constructively in consultations and field testing
• Where we identify potential sources of change we assess the situation and seek to manage any risks and maximise opportunities that arise
• This meant that when the charge cap for workplace schemes in the UK was introduced in March 2014, we were well placed to help employers respond as we have been developing our pricing for workplace schemes over a number of years
• An example of legislative change expected to have a positive impact for us are the changes announced in the 2014 UK Budget. Whilst these changes have adversely impacted annuity sales, this is mitigated by our strategic focus on long-term savings and investments and our existing strength in drawdown propositions which are designed to meet the needs of customers in decumulation.
• The Group outsourcing policy defines the standards that the business must comply with to mitigate the risk of entering into inappropriate outsourced contracts and to implement sufficient controls to ensure risk is managed throughout the lifecycle of the arrangement. As part of the Group policy framework, the business is required to confirm and evidence compliance with the standards contained in this policy on a regular basis.
• The policy requires that appropriate risk committee approval is obtained prior to entering into new outsourcing arrangements
• The policy requires that control procedures are in place to identify and monitor any material risk that the Group is exposed to through the outsource service provider, to take into account failure in the provision of the outsourced services and to establish and maintain an exit plan to facilitate transition of the outsourced services back into the business unit or to another provider.
28 Standard Life

IT security issues, including the results of cyber-attacks, adversely impacts our operational capability and customer confidence
Failure to execute change adversely impacts our risk profile and delivery of our strategy
Political uncertainty, including the extent of further devolution within the UK and the potential for an in/out referendum on the UK’s position in the EU
The systems and processes on which the Group is dependent to serve customers are designed to ensure that the operational risks associated with the Group’s activities are identified and addressed.
IT security issues, including the results of cyber-attacks, could still arise and result in the failure of systems and processes.
This may lead to the Group incurring increased costs in implementing responses to the IT security issues. In extreme circumstances it is possible that our ability to conduct business may be impacted for a period of time and customer confidence may be damaged.
The Group runs a significant change programme that seeks to ensure we create shareholder value through being a leading, customer centric business focused on long-term savings and investments.
It includes change initiatives that are driven by external factors such as customer demand, market conditions, competitor activity and regulatory and legislative changes.
Failure to successfully execute change may adversely impact our risk profile, for example through increased costs where changes have been ineffective or inefficient, and may mean we are unable to deliver our strategy.
The result of the Scottish independence referendum on 18 September 2014 in which the Scottish electorate voted to remain within the UK has reduced the level of political risk in relation to our business.
Other sources of political risk remain, for example the recommendations of the Smith Commission on further devolution of powers to the Scottish Parliament and the possibility of an in/out referendum on the UK’s position within the EU following the 2015 UK general election.
• The threat landscape continues to evolve with regard to the tools, techniques, procedures and focus of threat ‘actors’ (including organised crime, hactivists and hackers). The threat across industries was well documented in the media during 2014-15.
• We monitor changes to this threat, working with specialist third parties and information sharing partnerships to help us better understand how it affects Standard Life given an increased awareness of the group’s brand, pension reforms and the changing nature of our digital offering.
• We have developed our defence in depth approach to cyber security throughout 2014 and into 2015. We have invested in technology, enhancing key business processes and have improved our staff education programme to reflect the evolving nature of the risk.
• Our change process is mature with a culture of continual improvement. Given the volume of change experienced in recent years, we have greater experience of making changes to the portfolio based on business priority and regulatory focus.
• We carry out change risk management as part of our operational risk management framework and change process. This provides a robust and established framework under which the business is required to identify, assess, control and monitor risks associated with change.
• Major change initiatives within the business receive full project support from an aligned change risk consultant, working alongside regulatory and technical specialists to successfully deliver change. For smaller initiatives, the change risk team champions the importance of effective risk management within business areas and has introduced guidelines to be used when implementing non-portfolio change. In 2014 significant changes to the pensions market were announced which provide additional flexibility to customers. Change risk input has been provided from initial launch of the proposition to the Group’s board and key governance forums and throughout the project lifecycle to date. Operational and conduct risks are being considered to ensure that changes to the risk profile are fully understood and mitigated prior to launch.
• We continue to closely monitor and constructively engage with the process of constitutional change across the UK in the best interests of our customers and other stakeholders
• As part of our stress and scenario testing programme we consider a wide range of scenarios including potential legislative changes. We maintain up-to-date contingency plans and these are regularly reviewed to ensure that they reflect emerging themes and changes to the business and political environment.
Standard Life 29
1. Strategic report continued
1.6 Our sustainable business overview Our Group’s purpose is to help build a more prosperous world. A big part of this is providing people from different backgrounds with ways to achieve their long-term ambitions – whether it’s through our products and services, the work we do in our communities, or the way we support our employees. It’s also about setting an example for our industry, such as through investing and managing money responsibly. Our commitment to being a sustainable business plays its part in each of these areas, and is a key driver in shaping our Group’s strategy. Our progress across our sustainability strategy’s five areas of focus can help us to create a positive outlook for our different stakeholder groups – and to continue growing responsibly as a long-term investment savings business.
Reviewing our sustainability strategy We take the time to regularly listen to our stakeholders to ensure that our sustainability approach continues to focus on the right things. In 2014, we carried out a review of our main sustainability priorities, talking to many different internal and external stakeholder groups about what’s important to them. These stakeholders included our customers, our people, shareholders, industry analysts, regulators and the media.
We grouped the feedback into themes and ranked these themes in the order of what our stakeholders found most important. We then assessed this against our business objectives to help us understand the most important sustainability issues for us. Through this review, we found that our five areas of focus remain material to our business, and continue to give us a clear picture of what’s important to our stakeholders: • Our customers and clients • Operating responsibly • Our community • Our people • Our environment.
The review also helped us gain a deeper understanding of the priorities within these areas and this has shaped our work in 2014. More information about this review is included in our full sustainability report.
All of our sustainability work in 2014 was overseen by our Board’s Corporate Responsibility Committee. To strengthen the focus we have on sustainability at Board level, we now intend to make it a key part of our plc Board agenda, with time dedicated to discussions on the topic and regular reporting. Because of this stronger sustainability focus for the plc Board, we plan to no longer have this separate committee to deal with corporate responsibility matters. 1. Our customers and clients Being a sustainable business means offering products and services built around our customers’ and clients’ needs. We aim to do this by putting customers at the centre of our decision making, with pricing that is fair and transparent, while building meaningful relationships for the long term.
Getting closer to our customers and clients Across our Group we look to capture rich insight that can inform how we develop products and services, so we can help customers and clients realise their financial ambitions. This includes things such as who our customers feel they’re responsible for, what they worry about, and what the important things are in their lives. The insight helps us understand more about the behaviour of our customers in the different countries we operate in, and can develop our services to be more relevant and engaging.
Insight and innovation to support clients worldwide In 2014, Standard Life Investments’ annual client survey provided insight from around 750 clients globally on how they feel about the services we provide. We also use studies by academics and research institutions we have established relationships with. The insight we gather helps us make sure we have the right products and capabilities to meet our clients’ diverse needs – at the same time as supporting our global growth ambitions. By the end of 2014, this kind of insight had played a big part in Standard Life Investments launching 14 new products and opening new international offices – helping to serve clients in 41 countries across five continents. Standard Life Investments now operates out of 17 countries worldwide, and we plan to open more offices in 2015.
Creating a meaningful customer experience The rich insight we gather helps us to make improvements to our service – particularly what we provide online. We saw a number of examples of improvements during 2014: • We completely redeveloped our UK retail website – www.standardlife.co.uk – with each stage of development based on
customer feedback • Customers can access some of our services via apps on mobile devices – and we launched new apps to help customers in
Hong Kong manage their money on the go • UK customers can apply for an ISA in less than five minutes, buy a pension or consolidate existing pension plans.
30 Standard Life
Supporting business to help people save for their future To help make it easier for companies to set up pension schemes for their employees, we’ve been working to make sure we can keep up with demand more quickly and efficiently. Our Good to Go proposition, for example, aims to help take the burden from smaller companies by letting them set up fully compliant workplace pension schemes online in just six minutes. Our work on Good to Go led to us winning Auto Enrolment Innovation of the Year at the 2014 UK Pensions Awards, for the second year in a row. Read more about the other awards we have won in Section 1.4 – Business segment performance.
Innovation and transparency in pricing From the feedback our stakeholders give us, an important area for our Group to focus on is making sure that we are transparent about our approach to pricing. We believe that this is an area where we can still do better, and we continue to work towards innovating and improving. We also look to build relationships with regulators in the places where we operate, working together to build a more prosperous world for our customers.
In April 2014, our Wrap platform became the UK’s first fully unbundled major adviser platform for both existing and new business. This means that all new platform business is done using clean (or unbundled) funds – where no commission or cash rebates are paid to fund groups or advisers, and charges are clearly disclosed. It’s also helped drive down the cost of investing. By doing this now, we are two years early in meeting the new platform regulations that the Financial Conduct Authority (FCA) has put in place. Our aim in working to this early deadline has been to help IFAs so they can get on with running successful, sustainable and profitable advice businesses.
Building relationships with our customers We launched a new programme in 2014 to pull together the data we hold on our UK and Ireland customers into a single, complete picture. This has helped us improve our data quality, governance and analytic capability to ensure we can talk to customers at the right time, and about the right things. Consequently, our communication capability has shifted significantly, with access to our customers by email increasing from 4% in 2013 to 30% in 2014. This resulted in an increase in the number of communications we have with our customers on topics that matter to them.
We believe we can strengthen our customer relationships by supporting positive change in our industry. One way we have done this recently is by sharing our knowledge on pension legislation. In September 2014, the UK Chancellor of the Exchequer announced the immediate scrapping of a 55% tax on inherited pensions – something that we had been actively lobbying for. We sent letters and emails with details of the changes to customers who were still within the period of time that they could choose to cancel the product they’d applied for with us. We wanted to help them make sure they had all the information they needed to make a decision that was right for them.
Our relationships with our customers extend to more than simply helping with financial matters. In Ireland we launched The New You, a guide to help customers approaching retirement plan for the next phase of their lives. It includes hints and tips on staying healthy, happy and financing life after retirement.
2. Operating responsibly Risks and opportunities To run our business responsibly we need to stay alert to opportunities to grow our business sustainably, and to improve the outlook for our customers and shareholders. When Standard Life Investments acquired Ignis Asset Management in 2014, it provided an opportunity to improve the value we offer our customers and shareholders, and our capabilities for managing their assets. The sale of our Canadian business to Manulife has also further strengthened the value we provide for shareholders.
Recent developments in the regulatory landscape in the United Arab Emirates, and the resulting business environment, have impacted our business in Dubai. As a result, we feel that we can no longer offer our customers or shareholders long-term sustainable value in this region. We therefore announced the closure of this business in November 2014.
You can read more about each of these in Section 1.4 – Business segment performance.
Running a business responsibly also means staying alert to risks that could lie ahead in our markets, and what this could mean for everyone involved. An example of this was our monitoring of the constitutional debate around the Scottish independence referendum. Our main consideration was the interests of our customers, clients and shareholders, and whether these and the sustainability of our business would be put at risk by constitutional change. We made it clear that if we felt this would be the case, we would do whatever we considered necessary to protect their interests and our competitive position.
To help grow our business in a sustainable way, it’s important that we continually consider our overall competitiveness, which includes the prices we offer our customers and our operating costs. One area of focus in 2014 was making sure that the rewards and benefits we offer our people remain competitive and consistent. We proposed changes to the way we will provide employee pensions, one of our biggest costs – so that we can offer an attractive but more sustainable way of helping our people achieve their retirement ambitions. We understand that this could mean big changes for many of our people. As a result, we’ve worked to provide our people with all the information they need to understand what the changes would mean for them, and to answer the questions they have.
Standard Life 31
1. Strategic report continued
1.6 Our sustainable business overview continued Our influence and leadership Wherever we operate around the world, we believe we have an important role to play in using our influence to encourage positive change in society. For our customers, it’s about giving them the means to fulfil their ambitions through a positive financial future. We’ve seen some great examples of how we can give them the support they need in an engaging way, such as online: • Our portal for UK customers, offers expert perspectives and articles on saving for the future – and we’ve used its MoneyPlus
blog, for example, to educate customers about the new rules on taking flexible pension withdrawals instead of annuities • Our Head of Customer Affairs became a guest author for external publications in the UK, offering tips for new parents on family
finance • Through blogs and educational events we supported Good Money Week, a national campaign to raise awareness of
sustainable, responsible and ethical finance. With our own people, we’ve used our expertise to make sure that they have the knowledge and confidence to take control of their financial future. We offer products and services at preferential prices for employees and their families, including pensions, savings, and investments and protection products. We’ve also offered information sessions to educate our people on other important elements of planning for their future.
To help shape public policy in a way that benefits our customers and contributes to wider society’s progress, we’ve kept up a programme of public affairs and policy engagement. We initiate meetings and events with policy makers and wider opinion formers on long-term savings and investments issues, and we have a presence at the major UK party conferences to make our views on this known.
We believe we have a responsibility to help the communities around us too. We’ve continued to play a leading role in our industry around our approach to employability, particularly in creating opportunities for young people. There’s more on this in the Our community section below.
We also believe this responsibility extends to our suppliers and the companies we invest in, and encouraging good business practice among them. We feel it’s important that we use a diverse range of suppliers across our Group, and that we share our knowledge to help them be more sustainable in how they do business. We ran four events in 2014 focused on making our business more accessible for small-to-medium enterprises and sharing sustainability best practice, and the feedback we’ve received has been very positive.
We keep up active engagement with the companies in which we are, or may become, a shareholder in. Through the responsible investment team at Standard Life Investments, we carry out research and analysis on how investee companies address their environmental, social and governance issues, which lets us identify any risks or opportunities we want to discuss with them. We follow this process with investee companies across the world, and we use guidelines such as the United Nations (UN) Global Compact to inform how we evaluate the approaches that they take. This includes reviewing and encouraging best practice in areas such as the environment, employee relations, human rights and business ethics. In 2014, in collaboration with almost 350 investors, we lent our support to a statement calling on governments worldwide to provide more economically meaningful charges for carbon emissions. The statement was released ahead of the UN Climate Summit, convened by the UN Secretary-General.
3. Our community Our focus on employability Employability remains the main focus for how we contribute to the communities in which we operate across the world – and a strong presence in each of our sustainability themes. For us it’s about helping to improve the opportunities that people, particularly young people, are afforded in society. It’s our responsibility as a large employer to maintain a diverse, sustainable workforce and help the people in the communities around us make real progress.
We continued and expanded our work to offer young people opportunities to begin their working or academic lives. Across Standard Life Investments, we placed eight young people in a programme that offers a 12-month paid internship. We’ve also maintained our support of Edinburgh City Council’s Edinburgh Guarantee programme, offering 39 young people paid work experience for six months across our Edinburgh offices during 2014. With support from The Prince's Trust, we've been piloting a similar programme across the UK, offering a further two placements in our London offices and one in our Glasgow office. We placed three young people through our 12 month paid modern apprenticeship scheme, giving them a broad insight into our IT operations. We also supported Leonard Cheshire Disability’s Change 100 scheme, giving a paid internship to a graduate with a disability. Each of these initiatives has improved the number of employees we have in the UK who are under the age of 25 – from 0.5% of our employees in 2010 to 5.4% in 2014 – helping us to also widen the diversity and perspectives we have among our people.
We’ve also been supporting charitable initiatives that link schools and colleges with employers to help prepare young people for working life. Our support has involved offering a number of school pupils mentoring opportunities with some of our senior people.
Our employability focus includes giving people a start in their careers outside of our company as well. Our involvement with The Prince’s Trust has extended to the Standard Life Charitable Trust supporting a programme in London, helping young people into jobs with small-to-medium sized businesses. It allowed 27 young people to take part in placements across 27 businesses during 2014. They are all given 12-month contracts and the Standard Life Charitable Trust funds the first six months of each placement.
32 Standard Life

Supporting the Living Wage Since 2012 it’s been a principle of ours to pay at least a Living Wage to all of our people, including the young people on placements with us. In 2014 we furthered this commitment by formally becoming accredited as a UK Living Wage employer. We hope that this commitment will give more people, particularly young people, the ability to save and have a future they can look forward to. It reflects our belief that, by having employment that pays enough and allows people to save for the future, we can make a big contribution to building a more prosperous society.
We also supported Living Wage Week, a UK-wide initiative to raise awareness of the topic. For us this involved hosting a breakfast for business leaders, politicians and charities to raise awareness and promote thought leadership in this area. Our work to support the Living Wage resulted in us being shortlisted for the Living Wage Champion award, which recognises the contributions of accredited employers to communities and industries by implementing and celebrating the Living Wage.
Charities and fundraising Several charities are benefiting from our employability work, and our people take part in a vote to tell us which charities we should support. For the charity partners we chose for 2014-2015, we kept our focus on helping people achieve their potential and on improving prospects in our communities. In 2014, our people raised £156,080 for our charity partners (continuing operations only).
We offer our people lots of encouragement to get involved in supporting good causes. In 2014 we launched our new Raise and Match initiative across our Group, which offers our people additional support in raising money for causes that are important to them. It means that when an employee raises money for charity, we match their fundraising up to the value of £250 a year.
4. Our people Career and talent development It’s our responsibility to listen and respond to our people, their aspirations and development needs, and make clear how their role fits with the wider contribution we make to society’s progress. It’s also important that all of our people have goals that continually motivate and challenge them to improve. This year we introduced our career partnership, which is a clearly defined agreement between the company and our people: we support our people in achieving their development goals and aspirations and we ask them to take responsibility for their career.
We continue to invest in talent programmes as part of our Group Development Framework, and we ensure that our senior leadership group have meaningful and stretching development goals. This year we have had a particular focus on external board appointment or directorships as a great way to gain experience and help talented senior leaders become ‘board ready’ for their career. We’ve also expanded our programme of individual coaching and mentoring for women in our leadership and talent pipeline.
Supporting graduate development continues to play a key part in our future growth. Through our group-wide graduate programme for 2014, we hired candidates in the UK, Hong Kong and Canada. We took on our largest number of summer interns too, and we have continued to see a strong trend for interns progressing onto the full graduate programme. Our interns programme made the prestigious Top 100 list of best intern employers by Rate My Placement, a leading UK undergraduate work experience website.
We believe great performance should be rewarded and we aim to make the process to do that clear to everyone. We want all our people to plan and save for the future. Our approach continues to support our reward principles by linking pay to performance and ensuring our remuneration remains competitive in the markets in which we operate.
Engaging our people In 2014, 87% of our employees completed our employee engagement survey, InterAction. We’ve seen a definite and positive shift in the results and the positive themes that have been emerging – such as growing trust and confidence, and increasingly positive views about our products. Our areas of development include continuing to work on how to get things done, managing employee underperformance and career development. One of the immediate actions was our decision to focus on career development (see section above).
To promote a healthy work environment, we signed up for the Global Corporate Challenge healthy living initiative. For the third year running, we achieved a top ten finish out of the 1,200 organisations that took part – including the top position in our sector. This year we reviewed our policies to ensure we offer our people the best possible support when it comes to looking after their families. We extended the help we give to employees who are carers, in recognition of the particular challenges they and their families can face. This includes flexible working, unpaid leave arrangements and a new option of taking carers' leave.
Diversity and inclusion in the workplace We have always promoted a culture that embraces diversity, fairness and equality. Our approach remains consistent with both United Nations and International Labour Organisation standards.
By fostering a culture like this – where our people can be themselves – it helps us deliver a customer experience that can be more meaningful and long lasting. Through our InterAction survey, we measured for the first time what our employees think about diversity and inclusion in our business. 80% of employees responded favourably – higher than both the financial services sector and high-performing company norm.
Standard Life 33
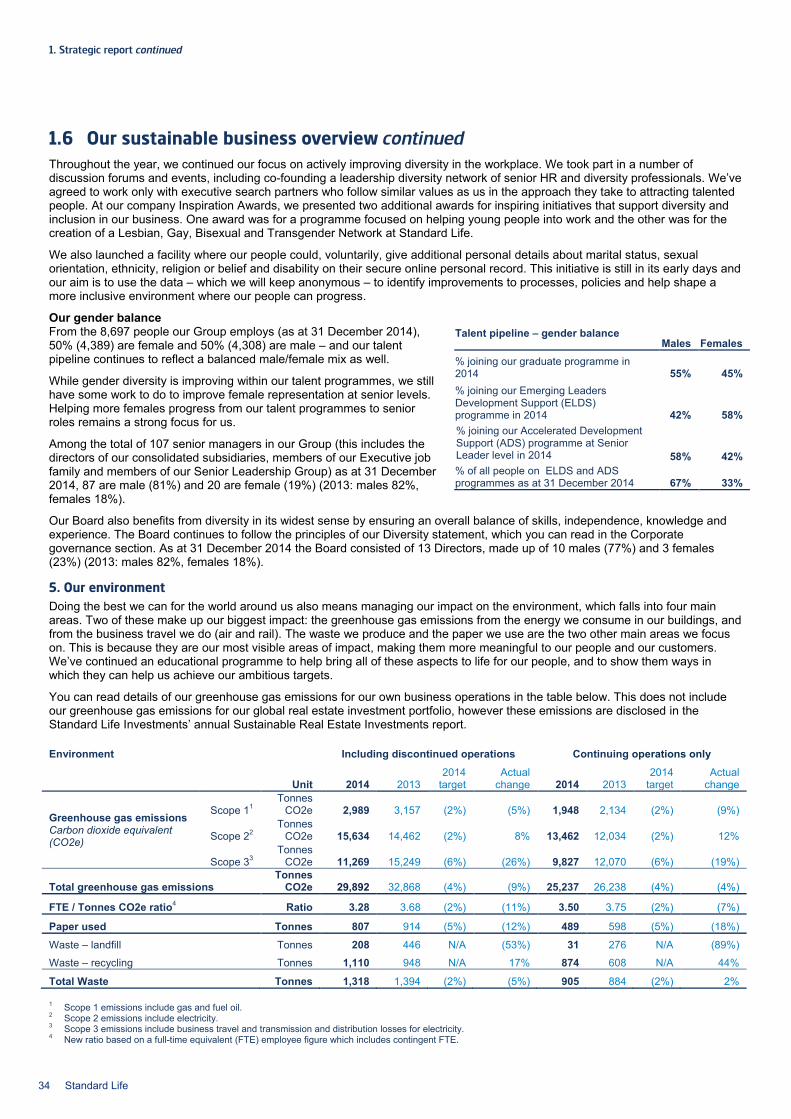
1. Strategic report continued
1.6 Our sustainable business overview continued Throughout the year, we continued our focus on actively improving diversity in the workplace. We took part in a number of discussion forums and events, including co-founding a leadership diversity network of senior HR and diversity professionals. We’ve agreed to work only with executive search partners who follow similar values as us in the approach they take to attracting talented people. At our company Inspiration Awards, we presented two additional awards for inspiring initiatives that support diversity and inclusion in our business. One award was for a programme focused on helping young people into work and the other was for the creation of a Lesbian, Gay, Bisexual and Transgender Network at Standard Life.
We also launched a facility where our people could, voluntarily, give additional personal details about marital status, sexual orientation, ethnicity, religion or belief and disability on their secure online personal record. This initiative is still in its early days and our aim is to use the data – which we will keep anonymous – to identify improvements to processes, policies and help shape a more inclusive environment where our people can progress.
Our gender balance From the 8,697 people our Group employs (as at 31 December 2014), 50% (4,389) are female and 50% (4,308) are male – and our talent pipeline continues to reflect a balanced male/female mix as well.
While gender diversity is improving within our talent programmes, we still have some work to do to improve female representation at senior levels. Helping more females progress from our talent programmes to senior roles remains a strong focus for us.
Among the total of 107 senior managers in our Group (this includes the directors of our consolidated subsidiaries, members of our Executive job family and members of our Senior Leadership Group) as at 31 December 2014, 87 are male (81%) and 20 are female (19%) (2013: males 82%, females 18%).
Our Board also benefits from diversity in its widest sense by ensuring an overall balance of skills, independence, knowledge and experience. The Board continues to follow the principles of our Diversity statement, which you can read in the Corporate governance section. As at 31 December 2014 the Board consisted of 13 Directors, made up of 10 males (77%) and 3 females (23%) (2013: males 82%, females 18%).
5. Our environment Doing the best we can for the world around us also means managing our impact on the environment, which falls into four main areas. Two of these make up our biggest impact: the greenhouse gas emissions from the energy we consume in our buildings, and from the business travel we do (air and rail). The waste we produce and the paper we use are the two other main areas we focus on. This is because they are our most visible areas of impact, making them more meaningful to our people and our customers. We’ve continued an educational programme to help bring all of these aspects to life for our people, and to show them ways in which they can help us achieve our ambitious targets.
You can read details of our greenhouse gas emissions for our own business operations in the table below. This does not include our greenhouse gas emissions for our global real estate investment portfolio, however these emissions are disclosed in the Standard Life Investments’ annual Sustainable Real Estate Investments report.
Environment Including discontinued operations Continuing operations only
Unit 2014 2013 2014
target Actual
change 2014 2013 2014
target Actual
change
Greenhouse gas emissions Carbon dioxide equivalent (CO2e)
Scope 11 Tonnes
CO2e 2,989 3,157 (2%) (5%) 1,948 2,134 (2%) (9%)
Scope 22 Tonnes
CO2e 15,634 14,462 (2%) 8% 13,462 12,034 (2%) 12%
Scope 33 Tonnes
CO2e 11,269 15,249 (6%) (26%) 9,827 12,070 (6%) (19%)
Total greenhouse gas emissions Tonnes
CO2e 29,892 32,868 (4%) (9%) 25,237 26,238 (4%) (4%)
FTE / Tonnes CO2e ratio4 Ratio 3.28 3.68 (2%) (11%) 3.50 3.75 (2%) (7%)
Paper used Tonnes 807 914 (5%) (12%) 489 598 (5%) (18%)
Waste – landfill Tonnes 208 446 N/A (53%) 31 276 N/A (89%)
Waste – recycling Tonnes 1,110 948 N/A 17% 874 608 N/A 44%
Total Waste Tonnes 1,318 1,394 (2%) (5%) 905 884 (2%) 2%
1 Scope 1 emissions include gas and fuel oil. 2 Scope 2 emissions include electricity. 3 Scope 3 emissions include business travel and transmission and distribution losses for electricity. 4 New ratio based on a full-time equivalent (FTE) employee figure which includes contingent FTE.
Talent pipeline – gender balance Males Females
% joining our graduate programme in 2014 55% 45% % joining our Emerging Leaders Development Support (ELDS) programme in 2014 42% 58% % joining our Accelerated Development Support (ADS) programme at Senior Leader level in 2014 58% 42% % of all people on ELDS and ADS programmes as at 31 December 2014 67% 33%
34 Standard Life
Where possible we aim to report on emissions from any office building containing over 1% of our FTE. In some cases, for example where we are renting space in a multi-tenanted office, this is not always feasible. Our reporting covers 95% of our FTE. For Scope 3 we’ve used the records provided by our third party travel providers for the source of data on business travel (air or rail) and kWh of electricity use for transmission and distribution. For accuracy we calculate our emissions from air travel based on travel class, rather than using average passenger. All emissions are calculated in CO2e using the DEFRA/DECC (2014) emission factors.
For waste, we surpassed our group diversion from landfill target of 80% achieving an overall figure of 97% recovery for our waste. This is due to very high waste recovery rates in both the UK and Ireland where we are sending less than 5% of our waste to landfill.
As a global business, emissions from business travel are an increasing challenge for us. Awareness and education have again played a big part here. We launched our Environmental Champions programme, educating influencers from around the business and engaging them in developing environmental communications around our Group. In November 2014, we also ran our second group-wide Green Travel Week, spotlighting the ways everyone can find greener ways to travel. This included a dedicated ‘no-fly’ week, where we allowed no air travel except where it was critical to our business. We know that air travel is unavoidable for a business like ours, but through education – in particular a focus on using digital and virtual meeting technologies – we can help foster more use of online collaboration and less use of traditional business travel.
We aimed to reduce our emissions from travel by 6% this year and exceeded this with a 22% reduction. We also met our overall target of reducing our CO2 emissions by 4% for continuing operations.
Measurement and targets In 2013 we began to develop a long-term set of high-level targets, which we would then work towards reaching by 2016. We now have plans in place to achieve them. For each of our material themes we are developing a number of commitments, and implementing measures to find out how we’re performing against these. We track our performance by looking at our direct and indirect impact on each topic area, as well as how we are influencing more widely on that topic. This plays an important part in being a leader in sustainability. This is something that we displayed in 2014 by maintaining a strong position in the FTSE4Good and the Dow Jones Sustainability Indices. These are external benchmarks that assess our sustainability each year, and performing well in these helps us to lead by example in our industry.
Through sustainability key performance indicators (KPIs), assured by independent experts PricewaterhouseCoopers LLP, we have begun to introduce these measures into our external sustainability reporting during 2014. We will continue to build on these KPIs during 2015: • Net Promoter Score • Customer complaints • Environment, social and governance engagements • Voting at shareholder meetings of investee companies • Total direct employed through employability programmes • Total funds raised by our people • Carbon footprint • Group capital surplus (IGD surplus) • Diversity in the talent pipeline • InterAction employee survey results.
You can visit www.standardlife.com/sustainability to find out how we measure up against our KPIs, and to read our full sustainability report. This tells you more about the progress we’ve been making in each area of our sustainability strategy.
Standard Life 35
1. Strategic report continued
1.7 Basis of preparation Overview Our Strategic report for the year to 31 December 2014 has been prepared in line with the Companies Act 2006 and the Disclosure and Transparency Rules (DTR) issued by the FCA. Under section 414 of the Companies Act 2006, DTR 4.1.8 and DTR 4.1.9, the Group is required to provide a fair, balanced and understandable review of the business and a description of the principal risks and uncertainties facing the Group. Principal risks and uncertainties are detailed in Section 1.5 – Principal risks and uncertainties and further information on these is contained in Note 42 – Risk management of the IFRS consolidated financial statements. To provide clear and helpful information, we have also considered the voluntary best practice principles of the Reporting statement: Operating and Financial Review issued by the Accounting Standards Board in 2006 and Guidance on the Strategic report issue by the Financial Reporting Council in 2014.
The Group’s financial statements have been prepared in accordance with International Financial Reporting Standards (IFRS), as endorsed by the European Union (EU). However, our Board believes that non-Generally Accepted Accounting Principles (non-GAAP) measures, which have been used in the Strategic report, are useful for both management and investors and make it easier to understand our Group’s performance.
The most important non-GAAP measures in the Strategic report include operating profit, assets under administration and Group underlying cash generation. All non-GAAP measures should be read together with the Group’s IFRS consolidated income statement, consolidated statement of financial position and consolidated statement of cash flows, which are presented in the Group financial statements section of this report.
Going concern After making appropriate enquiries, the Directors have a reasonable expectation that the Company and the Group as a whole have adequate resources to continue in operational existence for the foreseeable future. For this reason, they continue to adopt the going concern basis in preparing the financial statements. For more detail, see the Corporate governance section.
IFRS and EEV reporting The financial results are prepared on both an IFRS basis and an EEV basis. All EU-listed companies are required to prepare consolidated financial statements using IFRS issued by the International Accounting Standards Board as endorsed by the EU. EEV measures the net assets of the business plus the present value of future profits expected to arise from in-force long-term life assurance and pensions policies. The IFRS financial results in the Strategic report and in the Group financial statements section of this report have been prepared on the basis of the IFRS accounting policies, as amended for new standards effective from 1 January 2014, as described in the Group financial statements section of this report. The EEV basis has been determined in accordance with the EEV Principles and Guidance issued by the Chief Financial Officers Forum. The EEV financial results in the Strategic report and in the EEV financial information section have been prepared in accordance with the EEV methodology in the EEV financial information section of this report. Group operating profit and EEV operating profit The 2014 reconciliation of consolidated operating profit to IFRS profit for the year, presented on page 112 of this report, presents profit before tax expense attributable to equity holders adjusted for non-operating items. Further details on the calculation of Group operating profit is presented in the Group accounting policies (jj). Group operating profit has not been audited by our independent auditors. The 2014 EEV consolidated income statement on page 240, presents EEV profit showing both operating and non-operating items. By presenting our results in this way, the Directors believe they are presenting a more meaningful indication of the underlying business performance of the Group.
Forward-looking statements This document may contain ‘forward-looking statements’ about certain of the Standard Life Group’s current plans, goals and expectations relating to future financial conditions, performance, results, strategy and objectives. Statements containing the words: ‘believes’, ‘intends’, ‘targets’, ‘estimates’, ‘expects’, ‘plans’, ‘seeks’ and ‘anticipates’ and any other words of similar meaning are forward-looking. By their nature, all forward-looking statements involve risk and uncertainty because they relate to future events and circumstances which may be beyond the Group’s control. As a result, the Group’s actual financial condition, performance and results may differ materially from the plans, goals and expectations set out in the forward-looking statements, and persons receiving this document should not place undue reliance on forward-looking statements. The Standard Life Group undertakes no obligation to update any of the forward-looking statements in this document or any other forward-looking statements it may make. Approved by the Board and signed on its behalf by
Kenneth A Gilmour, Group Company Secretary Standard Life plc (SC286832) 20 February 2015
36 Standard Life
Keith Skeoch Executive DirectorAge: 58Tenure: 9 years Nationality: British
Luke Savage Chief Financial OfficerAge: 53Tenure: appointed August 2014Nationality: British
Qualifications: BA, University of Sussex and MA, University of Warwick. Fellow of the Chartered Institute for Securities & Investment and Fellow of the Society of Business Economists.
Qualifications: Electrical and Electronic Engineering degree (BEng), Imperial College, London. Member of the Institute of Chartered Accountants in England and Wales.
Sir Gerry Grimstone ChairmanAge: 65Tenure: 9 years Nationality: British
David Nish Chief ExecutiveAge: 54Tenure: 8 years Nationality: British
Board of Directors as at 20 February 2015
Our business is managed by our Board of Directors. Biographical details of the Directors as at 20 February 2015 are listed below. Board of Directors
Appointed Chairman in May 2007, having been deputy chairman since March 2006. He became a director of The Standard Life Assurance Company in July 2003. Sir Gerry is chairman of TheCityUK, the representative body for financial and related professional services in the UK, an independent, public interest, non-executive board member of Deloitte LLP and the lead non-executive at the Ministry of Defence. Other appointments include being a member of the shareholder executive board of the Department for Business, Innovation and Skills (BIS) and senior adviser to the board of the Abu Dhabi Commercial Bank. Previously, he held senior positions within the Department of Health and Social Security and HM Treasury. From 1986, he spent 13 years with Schroders plc in London, Hong Kong and New York. He was vice chairman of Schroders’ worldwide investment banking activities from 1998 to 1999.In the Queen’s Birthday Honours List, announced in June last year, Sir Gerry received a knighthood in recognition for his contribution to public service, particularly to defence and business.Sir Gerry is chairman of both the Nomination and Governance Committee and the Corporate Responsibility Committee.
Appointed Director in May 2006, having been a director of The Standard Life Assurance Company since March 2006. He is chief executive of Standard Life Investments Limited. Keith joined Standard Life Investments Limited in 1999 as chief investment officer after nearly 20 years’ investment experience at James Capel & Company Limited in a number of roles, including chief economist and managing director international equities. He is a director of the Investment Association and a non-executive director of the Financial Reporting Council, where he is a member of the audit committee. He has been awarded honorary doctorates from the University of Sussex and Teesside University for services to the financial services industry. In 2013, he was awarded European Personality of the Year by Funds Europe.
Appointed Director and Chief Financial Officer in August 2014. Luke was previously director of finance and operations at Lloyd’s of London. In addition, he held senior finance roles at Deutsche Bank (UK), Morgan Stanley & Company (UK) and Lloyds Bank plc. He is a member of the governing body of Queen Mary University of London.Luke was awarded Chief Financial Officer of the Year at the Insurance Insider Honours 2013.
Appointed Chief Executive in January 2010, having been group finance director since November 2006 when he was appointed to the Board. He is also deputy chairman of the board of the Association of British Insurers, a non-executive director of the UK Green Investment Bank plc, where he also chairs the audit committee, a member of the advisory council of TheCityUK and a member of the Financial Services Advisory Board of the Scottish Government.David was previously a partner with Price Waterhouse, and subsequently group finance director and executive director, infrastructure division at Scottish Power plc.David is a member of the Corporate Responsibility Committee.
Qualifications: BAcc, University of Glasgow. Member of the Institute of Chartered Accountants of Scotland.
Qualifications: MA and MSc, University of Oxford.
Standard Life 37

Pierre Danon Non-executive DirectorAge: 58Tenure: 3.5 years Nationality: French
Crawford Gillies Non-executive DirectorAge: 58Tenure: 8 years Nationality: British
Appointed Director in October 2011. Pierre is vice chairman of TDC, executive chairman of Volia, independent director of CIEL Investment Limited, a director of Cordial Consulting Limited and vice chairman of AgroGeneration. From 2000 to 2005, Pierre was chief executive officer of BT Retail and, subsequently, chief operating officer of Capgemini Group and chairman of Eircom. Until June 2012, he served as chief executive officer and then non-executive chairman of Numericable Completel in Paris.Pierre is a member of the Remuneration Committee and the Risk and Capital Committee.
Appointed Director in January 2007. Crawford is chairman of Scottish Enterprise and chairman of Control Risks Group Holdings Ltd. In July 2012, he was appointed as a non-executive director of MITIE Group PLC, and in May 2014, he was appointed as a non-executive director of Barclays PLC and is a member of its remuneration committee. He is also a member of the advisory board for the School for CEOs. Crawford spent 22 years with Bain & Company, Inc, the international management consultants, where he was managing director Europe. He was an independent member of the Department of Trade and Industry (DTI) management and strategy boards from 2002 to 2007, and chaired the DTI’s audit and risk committee from 2003 to 2007.Crawford is a member of the Risk and Capital Committee, the Nomination and Governance Committee and the Corporate Responsibility Committee.
Qualifications: Degree in Civil Engineering, Ecole Nationale des Ponts et Chaussées, Paris, Law Degree Faculté de droit, Paris, and MBA, HEC Paris.
Qualifications: Law Degree, University of Edinburgh and MBA, Harvard Business School. Member of the Institute of Chartered Accountants in England and Wales.
John Paynter Senior Independent DirectorAge: 60Tenure: 3 years Nationality: British
Appointed Director in January 2012. He is the Company’s senior independent director and the non-executive chairman of Standard Life Investments (Holdings) Limited. John is also a senior adviser to Greenhill & Co. International. From 2008 to 2014, John was a non-executive director of Standard Chartered plc, where he also sat on the audit and remuneration committees. From 2001 to 2005, John was deputy chairman of Cazenove Group plc and then vice chairman of JP Morgan Cazenove from 2005 to 2008. He served as a non-executive director of Jardine Lloyd Thompson Group plc from October 2008 until June 2012, including three years as chairman of its remuneration committee.John is a member of the Audit Committee, the Remuneration Committee and the Nomination and Governance Committee.
2. Governance information - Board of Directors continued
David Grigson Non-executive DirectorAge: 60Tenure: 5.5 years Nationality: British
Appointed Director in November 2009. David is chairman of Trinity Mirror plc and he is the senior independent director of Ocado Group plc. He also sits on the audit, remuneration and nomination committees of these companies. David is also chairman of Investis Limited. David spent much of his career in senior financial executive positions, first with Emap PLC, where he served as group finance director from 1989 to 2000, and more recently with Reuters Group PLC, where he was chief financial officer from 2000 to 2008, when Reuters Group became Thomson Reuters Limited. David is chairman of the Audit Committee and a member of the Risk and Capital Committee and the Nomination and Governance Committee.As announced, David will retire from the Board following the 2015 AGM.
Qualifications: BA, University of Manchester. Member of the Institute of Chartered Accountants in England and Wales.
Qualifications: Law Degree, University of Oxford.
38 Standard Life

Kevin Parry Non-executive DirectorAge: 53Tenure: appointed October 2014Nationality: British
Appointed Director in October 2014. Kevin is a non-executive director of Daily Mail and General Trust plc, where he is chairman of the audit committee and a member of the risk committee. He is senior independent director of Intermediate Capital Group plc, where he is chairman of both the audit committee and the risk committee, and is a member of the remuneration and nomination committees. He is also a non-executive director of the Homes and Communities Agency and deputy chairman of the board of trustees and chairman of the finance and investment committee at the Royal National Children’s Foundation.From 2009 to 2013, Kevin was chief financial officer of Schroders plc where he also chaired, from 2002 to 2008, the audit and risk committee. He was also group chief executive of Management Consulting Group PLC from 2000 to 2008.Kevin is a member of the Risk and Capital Committee and will be appointed chairman of the Audit Committee following the 2015 AGM.
Qualifications: MA (Hons) in Management Studies, University of Cambridge. Fellow of the Institute of Chartered Accountants in England and Wales.
Martin Pike Non-executive DirectorAge: 53Tenure: 1.5 years Nationality: British
Appointed Director in September 2013. Martin joined R Watson & Sons in 1983 and progressed his career with the firm to partner level, carrying out a wide range of strategic consulting projects and M&A assignments. His senior roles included head of European insurance and financial services practice, Watson Wyatt from 2006 to 2009, vice president and global practice director, insurance and financial services, Watson Wyatt during 2009 and, latterly, managing director, risk consulting & software, EMEA, Towers Watson from 2010 to 2013.Martin is a member of the Remuneration Committee and will be appointed chairman of the Risk and Capital Committee following the 2015 AGM.
Qualifications: BA and MA, University of Oxford. Fellow of the Institute and Faculty of Actuaries.
Noel Harwerth Non-executive DirectorAge: 67Tenure: 3 yearsNationality: British and American
Appointed Director in July 2012. Noel is chairman of Sumitomo Mitsui Banking Corporation Europe Limited and chairman of GE Capital Bank Limited. She also holds non-executive director appointments with Alent plc, the London Metal Exchange and the British Horseracing Authority. Last year, Noel was appointed as a director of London First. Noel was previously with Citicorp for 15 years, latterly as the chief operating officer of Citibank International and she previously held non-executive director appointments at Logica PLC, LME Holdings Limited, Avocet Mining PLC, RSA Insurance Group plc and Dominion Diamond Corporation.Noel is a member of the Audit Committee and will stand down as chairman of the Risk and Capital Committee following the 2015 AGM.
Qualifications: Law Degree, University of Texas.
Isabel Hudson Non-executive DirectorAge: 55Tenure: appointed October 2014Nationality: British
Appointed Director in October 2014. Isabel holds non-executive directorships at BT Group plc, where she is also a member of its pension committee, and at Phoenix Group Holdings, where she is also a member of its remuneration and audit committees. She is chairman of the National House Building Council. Isabel previously held the positions of chief executive officer at Synesis Life Ltd, executive director at Prudential UK, and chief financial officer of Eureko. She held non-executive director appointments at QBE Insurance Group Ltd, where she chaired the remuneration committee, the Pensions Regulator and MGM Advantage, where she chaired the audit committee. She was previously a member of the With Profits Committee of Standard Life Assurance Limited.Isabel is a member of the Audit Committee and the Risk and Capital Committee.
Qualifications: MA in French and German, University of Oxford.
Lynne Peacock Non-executive DirectorAge: 61Tenure: 3 years Nationality: British
Appointed Director in April 2012. Lynne is a non-executive director of Scottish Water, where she chairs its audit committee. She is a non-executive director of Nationwide Building Society and chairs its remuneration committee. She is also a member of its audit, risk and nomination committees. Lynne joined National Australia Bank Limited in 2003 and, from 2004 to 2011, she was chief executive officer, UK (Clydesdale Bank plc and Yorkshire Bank). Before that, Lynne was with Woolwich plc from 1983 to 2003, finishing her career there as chief executive officer.Lynne is chairman of the Remuneration Committee and is a member of the Corporate Responsibility Committee and the Audit Committee.
Qualifications: BA, North East London Polytechnic.
Standard Life 39

2. Governance information – Directors’ report
Directors’ report The Directors present their annual report on the affairs of the Standard Life group of companies (the Group), together with the audited International Financial Reporting Standards (IFRS) consolidated financial statements for the Group, European Embedded Value (EEV) financial information for the Group and financial statements for Standard Life plc (the Company) for the year ended 31 December 2014.
Reporting for the year ended 31 December 2014 The Company is the holding company of the Group. You can find out about the relevant activities of the Company’s principal subsidiary undertakings and their overseas branches in the Chief Financial Officer’s overview and Business segment performance sections of the Strategic report. During 2014, the Company’s principal undertakings operated branches in Bermuda, Canada, Dubai, Germany, Hong Kong, India, Ireland and Singapore.
The main trends and factors likely to affect the future development, performance and position of the Group are outlined in the Chief Executive’s overview section of the Strategic report. Reviews of the operating and financial performance of the Group for the year ended 31 December 2014 are given in the Strategic report.
The Chairman’s statement, the Directors’ responsibility statement and the Corporate governance section form part of the Directors’ report. The Corporate governance section is submitted by the Board.
The results of the Group on IFRS and EEV bases are presented in the Group financial statements and EEV financial information respectively. A detailed description of the basis of preparation of the IFRS (including operating profit) and EEV results are set out in the Group accounting policies section of the Group financial statements and in Note 1 to the EEV financial information respectively. More information about the Group’s use of financial instruments and related financial risk management matters can be found in Note 24 and Note 42 of the Group financial statements.
This report was prepared by the Company’s executive team together with the Board and forms part of the management report.
Dividends The Board recommends paying a final dividend for 2014 of 11.43p per new ordinary share following the share consolidation. This will be paid on 19 May 2015 to shareholders whose names are on the register of members (the Register) at the close of business on 10 April 2015.
The total payment is estimated at £224m for the final dividend and together with the interim dividend of 5.60p per share totalling £134m paid on 21 October 2014, the total dividend for 2014 will be 17.03p per share (2013: 15.80p) totalling £358m (2013: £376m).
Share capital You can find full details of the Company’s share capital, including movements in the Company’s issued ordinary share capital during the year, in Note 29 to the Group financial statements. You can also find an analysis of registered shareholdings by size, as at 31 December 2014, in the Shareholder information section.
As at 31 December 2014, there were 2,394,373,744 ordinary shares in issue held by 106,666 registered members. The Standard Life Share Account (the Company-sponsored nominee) held 925,969,894 of those shares on behalf of 1,097,356 participants. No person has any special rights of control over the Company’s share capital and all issued shares are fully paid.
During the year, and until the date this report was signed, the Company received the following notification in respect of major shareholdings and major proportions of voting rights in accordance with the Disclosure and Transparency Rules of the Financial Conduct Authority (FCA).
Shareholder Date of Transaction
Type of Transaction Number of Voting Rights Following the Transaction
Percentage of Voting Rights (%)
BlackRock, Inc. 8 December 2014 Acquisition of voting rights 119,737,536 5%
In 2014, in accordance with the terms of the Standard Life Employee Trust Deed, the Trustees of the Standard Life Employee Trust waived all entitlements to current or future dividend payments for shares they hold under option on behalf of participants in the Company’s discretionary share plans between the grant and vest dates. Details of ordinary shares under option in respect of the Company’s discretionary share plans are shown in Note 48 to the Group financial statements.
The Trustees of the Standard Life (Employee) Share Plan voted the appropriate shares in accordance with any instructions received from participants in the plan. Details of the Company’s employee share plan can be found in Note 48 to the Group financial statements.
40 Standard Life
Restrictions on the transfer of shares and securities Except where listed below, there are no specific restrictions on the size of a holding or on the transfer of shares. Both are governed by the general provisions of the Company’s articles of association (the Articles) and current legislation and regulation. The Articles can be found on our website at www.standardlife.com/about/governance You can also obtain a copy from Companies House or by writing to the Group Company Secretary at our registered address (details of which can be found in the Contact details section). The Articles may only be amended by a special resolution passed by the shareholders.
The Board may decline to register the transfer of: • A share that is not fully paid • A certificated share, unless the instrument of transfer is duly stamped or duly certified and accompanied by the relevant share
certificate or other evidence of the right to transfer, is in respect of only one class of share and is in favour of a sole transferee or no more than four joint transferees
• An uncertificated share, in the circumstances set out in the uncertificated securities rules (as defined in the Articles) and, in the case of a transfer to joint holders, where the transfer is in favour of no more than four joint transferees
• A certificated share by a person with a 0.25 per cent interest (as defined in the Articles) in the Company, if that person has been served with a restriction notice under the Articles, after failing to provide the Company with information about interests in those shares as set out in the Companies Act 2006 (unless the transfer is shown to the Board to be pursuant to an arm’s length sale under the Articles).
These restrictions are in line with the standards set out in the FCA’s Listing Rules and are considered to be standard for a listed company.
The Directors are not aware of any other agreements between holders of the Company’s shares that may result in restrictions on the transfer of securities or on voting rights.
Rights attached to shares Subject to applicable statutes, any resolution passed by the Company under the Companies Act 2006 and other shareholders’ rights, shares may be issued with such rights and restrictions as the Company may decide by ordinary resolution, or (if there is no such resolution or if it does not make specific provision) as the Board may decide. Subject to the Articles, the Companies Act 2006 and other shareholders’ rights, unissued shares are at the disposal of the Board.
Every member and duly appointed proxy present at a general meeting or class meeting has one vote on a show of hands. On a poll, every member present in person or by proxy has one vote for every share they hold. For joint shareholders, the vote of the senior joint shareholder who tenders a vote, in person or by proxy, will be accepted and will exclude the votes of the other joint shareholders. For this purpose, seniority is determined by the order that the names appear on the Register for joint shareholders.
A member will not be entitled to vote at any general meeting or class meeting in respect of any share they hold if any call or other sum then payable by them for that share remains unpaid or if they have been served with a restriction notice (as defined in the Articles) after failing to provide the Company with information about interests in those shares required to be provided under the Companies Act 2006.
The Company may, by ordinary resolution, declare dividends up to the amount recommended by the Board. Subject to the Companies Act 2006, the Board may also pay an interim dividend, and any fixed rate dividend, whenever the financial position of the Company, in the opinion of the Board, justifies its payment. If the Board acts in good faith, it is not liable to holders of shares with preferred or ‘pari passu’ rights for losses that arise from paying interim or fixed dividends on other shares.
The Board may withhold payment of all or part of any dividends or other monies payable in respect of the Company’s shares from a person with a 0.25 per cent interest (as defined in the Articles) if that person has been served with a restriction notice (as defined in the Articles) after failure to provide the Company with information about interests in those shares, which is required under the Companies Act 2006.
Subject to the Companies Act 2006, rights attached to any class of shares may be varied with the written consent of the holders of not less than three-quarters in nominal value of the issued shares of that class (excluding any shares held as treasury shares). These rights can also be varied with the sanction of a special resolution passed at a separate general meeting of the holders of those shares. At every separate general meeting (except an adjourned meeting) the quorum shall be two persons holding, or representing by proxy, not less than one third in nominal value of the issued shares of the class (calculated excluding any shares held as treasury shares).
A shareholder’s rights will not change if additional shares ranking ‘pari passu’ with their shares are created or issued – unless this is expressly provided in the rights attaching to their shares.
Standard Life 41
2. Governance information – Directors’ report continued Power to purchase the Company’s own shares At the 2014 Annual General Meeting (AGM), shareholders granted the Directors limited powers to: • Allot ordinary shares in the Company up to a maximum aggregate amount of £79,222,684 • Disapply, up to a maximum total nominal amount of £11,883,402 or 5% of its issued ordinary share capital, shareholders’
pre-emption rights in respect of new ordinary shares issued for cash • Make market purchases of the Company’s ordinary shares up to a maximum of 237,668,053 or 10% of its issued ordinary
shares. The Company did not make any market purchases of its ordinary shares during the year ended 31 December 2014, and has not done so since then and up to the date of this report.
Significant agreements There are a number of agreements to which the Company is party that entitle the counterparties to exercise termination or other rights in the event of a change of control of the Company. These agreements include: • Under a £500m revolving credit facility between the Company and the banks and financial institutions named therein as lenders
(Lender) dated 5 March 2013 (the Facility), in the event that (i) any persons or group of persons acting in concert, gain control of the Company or (ii) Standard Life Assurance Limited ceases to be a member of the Group, then any Lender may elect within a prescribed time frame to cancel its outstanding commitment under the Facility and declare its participation in all outstanding loans, together with accrued interest and all amounts accrued immediately due and payable, whereupon the commitment of that Lender under the Facility will be cancelled and all such outstanding amounts will become immediately due and payable.
• Under a shareholders' agreement dated 15 January 2002 between The Standard Life Assurance Company (re-named The Standard Life Assurance Company 2006) and Housing Development Finance Corporation Limited (HDFC), pursuant to which the relevant Group company holds its interest in HDFC Standard Life Insurance Company Limited (HDFC Standard Life), upon a change of control of the Company, HDFC potentially has the right to terminate the joint venture and to purchase, or nominate a third party to purchase, the relevant Group company’s shares in HDFC Standard Life for a price determined in accordance with the agreement.
• Under a shareholders' agreement dated 10 June 2003 (as amended) between Standard Life Investments Limited (SLI) and HDFC, pursuant to which the relevant Group company holds its interest in HDFC Asset Management Company Limited (HDFC AMC), upon a change in the ownership structure of SLI that results in the acquisition by a third party, either directly or indirectly, of more than 20% of the issued, subscribed and paid-up capital of SLI, HDFC will have 90 days from the date upon which SLI notifies it in writing of the occurrence of such a change to purchase the relevant Group company’s shares in HDFC AMC at a mutually agreed price.
• Under a joint venture agreement dated 12 October 2009 (as amended) between the Company and Tianjin TEDA International Holding (Group) Co. Limited (TEDA), pursuant to which the Company holds its interest in Heng An Standard Life Insurance Company Limited (Heng An Standard Life), upon a change of control of the Company, TEDA has the right to terminate the joint venture and to purchase, or nominate a third party to purchase, the Company’s shares in Heng An Standard Life for a price determined in accordance with the agreement.
A number of other agreements contain provisions that entitle the counterparties to exercise termination or other rights in the event of a change of control of the Company. However, these agreements are not considered to be significant in terms of their likely impact on the business of the Group as a whole.
The Directors are not aware of any agreements with any employee that would provide compensation for loss of office or employment resulting from a takeover bid. The Company also has no agreement with any Director to provide compensation for loss of office or employment resulting from a takeover.
42 Standard Life

Directors and their interests The Directors who served throughout the year were: • Sir Gerry Grimstone (Chairman) • Colin Buchan (retired on 13 May 2014) • Pierre Danon • Crawford Gillies • David Grigson • Noel Harwerth • Isabel Hudson (appointed 15 October 2014) • David Nish (Chief Executive) • Kevin Parry (appointed 27 October 2014) • John Paynter • Lynne Peacock • Martin Pike • Luke Savage (Chief Financial Officer appointed 18 August 2014) • Keith Skeoch
Biographies of the Directors can be found on pages 37 to 39.
Details of the Directors’ interests in the Company’s ordinary shares, the Standard Life (Employee) Share Plan, the Standard Life Sharesave Plan and the share-based executive long-term incentive plans (LTIPs) are set out in the Directors’ remuneration report together with details of the executive Directors’ service contracts and non-executive Directors’ appointment letters.
No Director has any interest in the Company’s listed debt securities or in any shares, debentures or loan stock of the Company’s subsidiaries. No Director has any material interest in any contract with the Company or a subsidiary undertaking which was significant in relation to the Company’s business, except for the following:
• The benefit of a continuing third-party indemnity provided by the Company (in accordance with company law and the Articles) • Service contracts between each executive Director and subsidiary undertakings (Standard Life Employee Services Limited and
Standard Life Investments Limited).
Copies of the following documents can be viewed at the Company’s registered office (details of which can be found in the Contact details section) during normal business hours (9am to 5pm Monday to Friday) and will be available for inspection at the Company’s AGM on 12 May 2015: • The Directors’ service contracts or letters of appointment • The Directors’ deeds of indemnity, entered into in connection with the indemnification of Directors provisions in the Articles • The rules of the Standard Life plc Executive Long Term Incentive Plan together with a copy incorporating the changes proposed
in resolution 7, and • The Company’s Articles, together with a copy incorporating the changes proposed in resolution 15. Further information on these
changes can be found in our AGM guide 2015 which will be available online at www.standardlife.com from 24 March 2015.
Appointment and retirement of Directors The appointment and retirement of Directors is governed by the Articles, the Companies Act 2006, the UK Corporate Governance Code and related legislation.
The UK Corporate Governance Code recommends that directors of FTSE 350 companies should stand for election every year. In line with this, all our Directors will retire at the AGM on 12 May 2015. Isabel Hudson, Kevin Parry and Luke Savage will stand for election and all remaining Directors who wish to continue in office will stand for re-election. As announced, David Grigson will retire from the Board at the conclusion of the 2015 AGM and, therefore, will not stand for re-election.
The powers of the Directors can also be found in the Articles.
Directors’ liability insurance During 2014, the Company maintained directors’ and officers’ liability insurance on behalf of its Directors and officers to provide cover should any legal action be brought against them. The Company also maintained a third-party indemnity policy for the boards of trustees of the UK, Irish and Canadian staff pension schemes. The trustees include individuals who are directors of subsidiaries within the Group.
Standard Life 43
2. Governance information – Directors’ report continued
Our people We know that our people are central to delivering our strategy. You can read about our commitment to bring out the best in them in Section 1.6 of the Strategic report – Our sustainable business overview.
The Group remains committed to creating a high-performing, diverse and healthy working environment where everyone is respected, valued and included as an individual. We treat people with disabilities fairly in relation to job applications, training, promotion and career development. Adjustments are made to train and support employees who become disabled during their employment to enable them to continue and develop in their role. As part of our performance culture, each employee takes part in regular discussions with their manager. They agree performance goals and how their aspirations, strengths and limitations can be developed and addressed at work. We believe great performance should be rewarded, and we think the process we follow to do that should be clear to everyone. Our approach continues to support our reward principles by linking pay to performance and ensuring our remuneration remains competitive to the market.
We know that positive employee relations are vital in engaging our people and achieving business goals. Constructive staff representation provides an essential means of informing the Group’s strategy through the views and insights of our people. There are separate staff representation arrangements across different jurisdictions in the Group. In the UK, most employees are represented through partnership agreements with the Group's staff associations, VIVO and Bridge. In Ireland, there is an established agreement with Unite, and a works council was established in Germany in 2008.
Despite a challenging year, we have maintained open and constructive relationships with the different staff representative bodies and a productive employee relations environment. In September 2014, we announced proposed changes to how our future employee pension would be provided. The consultation on these proposals, which involved many open and constructive conversations with our staff associations, concluded at the end of November 2014. The level of engagement was significant with all the feedback received listened to very carefully.
The Board approved the final changes to the future UK employee pension in December 2014 and these changes were announced to employees on 19 December 2014.
The key part of the final package of changes is that from 16 April 2016, pension scheme members will build up future pension in the scheme on a defined contribution basis rather than the current career average defined benefit basis.
We believe what is offered provides a consistent and competitive level of support for our people's retirement savings, as well as being sustainable for our business.
We also use our internal intranet to communicate with our staff on matters which may concern them as employees and to ensure that our employees are fully aware of any financial and economic factors which may affect the performance of the Group.
As at 31 December 2014, approximately 65% of the Group's employees were shareholders through participation in the Standard Life (Employee) Share Plan (the Plan). The Plan allows employees to buy ordinary shares in the Company directly from their earnings up to a market value of £125 per month, or an equivalent sum in a relevant currency. These are called partnership shares. For each partnership share that an employee buys under the Plan, the Company matches the purchase by allocating them ordinary shares up to a maximum total value of £25 per month, or an equivalent sum in the relevant currency. As at 31 December 2014, 3,772 (63%) of eligible employees in the UK were making a monthly average contribution of £40. A similar tax approved plan is used in Ireland and has a 60% take up. Even though the Plan cannot be structured on a tax favourable basis in Germany or Austria, at the end of the year, more than 120 employees in these countries were buying shares on a monthly basis.
The Group also encourages share ownership in the Company in the UK and Ireland through the Standard Life Sharesave Plan which was launched in August 2011. In September 2014, we launched a fourth invitation to UK employees and at the same time made a third invitation to Irish employees. On 1 November 2014, the first of the Sharesave invitations matured and participating employees have the opportunity, until 1 May 2015, to buy Standard Life plc shares at a price of £1.57 per share with their accumulated savings.
There are now over 3,100 employees in the UK and Ireland participating in Sharesave plans. The exercise price is £1.57 under the 2011 invitation; £2.21 (€2.81) under the 2012 invitations; £2.72 (€3.22) under the 2013 invitations and £2.96 (€3.70) under the 2014 invitations.
Sustainability Our sustainability strategy is mapped to our Group’s business strategy, so that the commercial aims of our business are linked to our environmental, social and governance responsibilities. You can find out more in Section 1.6 of the Strategic report – Our sustainable business overview and in the Environmental, social and governance risks paragraph of the Corporate governance section.
Greenhouse gas emissions Details of our greenhouse gas emissions can be found in Section 1.6 of the Strategic report – Our sustainable business overview.
44 Standard Life
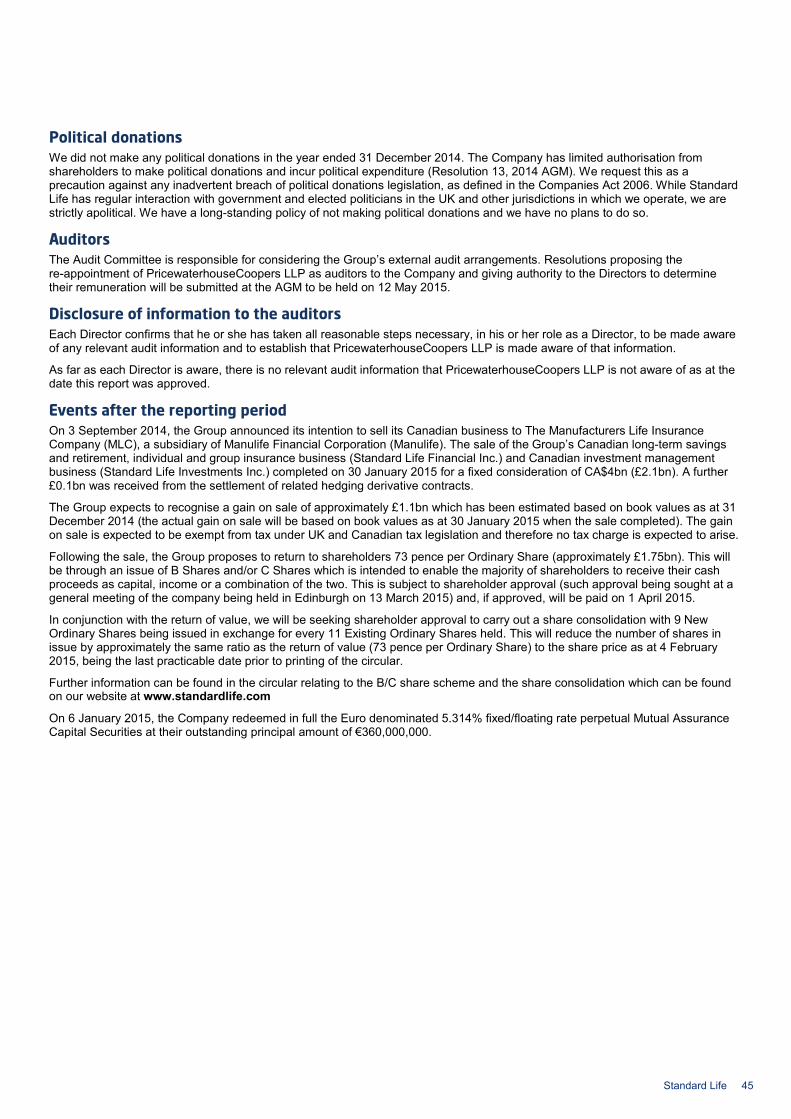
Political donations We did not make any political donations in the year ended 31 December 2014. The Company has limited authorisation from shareholders to make political donations and incur political expenditure (Resolution 13, 2014 AGM). We request this as a precaution against any inadvertent breach of political donations legislation, as defined in the Companies Act 2006. While Standard Life has regular interaction with government and elected politicians in the UK and other jurisdictions in which we operate, we are strictly apolitical. We have a long-standing policy of not making political donations and we have no plans to do so.
Auditors The Audit Committee is responsible for considering the Group’s external audit arrangements. Resolutions proposing the re-appointment of PricewaterhouseCoopers LLP as auditors to the Company and giving authority to the Directors to determine their remuneration will be submitted at the AGM to be held on 12 May 2015.
Disclosure of information to the auditors Each Director confirms that he or she has taken all reasonable steps necessary, in his or her role as a Director, to be made aware of any relevant audit information and to establish that PricewaterhouseCoopers LLP is made aware of that information.
As far as each Director is aware, there is no relevant audit information that PricewaterhouseCoopers LLP is not aware of as at the date this report was approved.
Events after the reporting period On 3 September 2014, the Group announced its intention to sell its Canadian business to The Manufacturers Life Insurance Company (MLC), a subsidiary of Manulife Financial Corporation (Manulife). The sale of the Group’s Canadian long-term savings and retirement, individual and group insurance business (Standard Life Financial Inc.) and Canadian investment management business (Standard Life Investments Inc.) completed on 30 January 2015 for a fixed consideration of CA$4bn (£2.1bn). A further £0.1bn was received from the settlement of related hedging derivative contracts.
The Group expects to recognise a gain on sale of approximately £1.1bn which has been estimated based on book values as at 31 December 2014 (the actual gain on sale will be based on book values as at 30 January 2015 when the sale completed). The gain on sale is expected to be exempt from tax under UK and Canadian tax legislation and therefore no tax charge is expected to arise.
Following the sale, the Group proposes to return to shareholders 73 pence per Ordinary Share (approximately £1.75bn). This will be through an issue of B Shares and/or C Shares which is intended to enable the majority of shareholders to receive their cash proceeds as capital, income or a combination of the two. This is subject to shareholder approval (such approval being sought at a general meeting of the company being held in Edinburgh on 13 March 2015) and, if approved, will be paid on 1 April 2015. In conjunction with the return of value, we will be seeking shareholder approval to carry out a share consolidation with 9 New Ordinary Shares being issued in exchange for every 11 Existing Ordinary Shares held. This will reduce the number of shares in issue by approximately the same ratio as the return of value (73 pence per Ordinary Share) to the share price as at 4 February 2015, being the last practicable date prior to printing of the circular. Further information can be found in the circular relating to the B/C share scheme and the share consolidation which can be found on our website at www.standardlife.com
On 6 January 2015, the Company redeemed in full the Euro denominated 5.314% fixed/floating rate perpetual Mutual Assurance Capital Securities at their outstanding principal amount of €360,000,000.
Standard Life 45
2. Governance information – Directors’ report continued
Other information
For the purposes of LR 9.8.4C R, the information required to be disclosed by LR 9.8.4 R can be found in the following locations:
Section Topic Location
1. Interest capitalised Not applicable
2. Publication of unaudited financial information Strategic report – Section 1.4.4
4. Details of long-term incentive schemes Directors’ remuneration report
5. Waiver of emoluments by a director Not applicable
6. Waiver of future emoluments by a director Not applicable
7. Non pre-emptive issues of equity for cash Not applicable
8. Item (7) in relation to major subsidiary undertakings Not applicable
9. Parent participation in a placing by a listed subsidiary Not applicable
10. Contracts of significance Not applicable
11. Provision of services by a controlling shareholder Not applicable
12. Shareholder waivers of dividends Directors’ report
13. Shareholder waivers of future dividends Directors’ report
14. Agreements with controlling shareholders Not applicable
All the information cross-referenced above is hereby incorporated by reference into this Directors’ report.
Annual General Meeting This will be held at 2pm (UK time) on Tuesday, 12 May 2015 at the Edinburgh International Conference Centre, The Exchange, 150 Morrison Street, Edinburgh EH3 8EE, Scotland. Details of the meeting content can be found in our AGM guide 2015 which will be available online at www.standardlife.com from 24 March 2015.
On behalf of the Board
Kenneth A Gilmour, Group Company Secretary Standard Life plc (SC286832) 20 February 2015
46 Standard Life
Directors’ responsibilities for preparing the financial statements The following statements should be read with the statement of auditors’ responsibilities included in the independent auditors’ reports. They are made to help shareholders distinguish between the responsibilities of the Directors and those of the auditors in relation to the financial statements for 2014.
The Directors are responsible for preparing the Annual report and accounts 2014. It is also their responsibility to state that they consider that the Annual report and accounts 2014, taken as a whole, is fair, balanced and understandable and provides the information necessary for shareholders to assess the Company’s performance, business model and strategy. Under the Companies Act 2006, the Directors are required to prepare and approve financial statements for each financial year. The Directors must only approve the financial statements when they are satisfied that they give a true and fair view of how the Group and the Company have performed at the end of the financial year, and that they give a true and fair view of the profit of the Group and the Company for that year. The financial statements of the Group and, where relevant, the Company have been prepared in accordance with: • International Financial Reporting Standards (IFRS) as adopted by the European Union (EU) • The Companies Act 2006 • The Disclosure and Transparency Rules (DTR) issued by the Financial Conduct Authority (FCA) • Article 4 of the International Accounting Standards (IAS) Regulation.
In preparing these financial statements, the Directors are required to: • Select suitable accounting policies and then apply them consistently • Make judgements and accounting estimates that are reasonable and prudent • State whether applicable IFRS as adopted by the EU have been followed, subject to any material departures disclosed and
explained in the financial statements • Prepare the financial statements on the basis that the Group is a going concern, unless it is inappropriate to presume that the
Group will continue in business.
The Directors are responsible for ensuring that proper accounting records are maintained. These must disclose, with reasonable accuracy at any time, the financial position of the Group and the Company and enable the Directors to ensure that the financial statements and the Directors’ remuneration report comply with the Companies Act 2006 and the DTR. The Directors should also make sure that the Group financial statements comply with Article 4 of the IAS Regulation.
The Directors are also responsible for: • Safeguarding the assets of the Company and the Group • Taking reasonable steps to prevent and detect fraud and other irregularities • The maintenance and integrity of the Group’s website.
UK legislation governing the preparation and dissemination of financial statements may differ from legislation in other jurisdictions.
Directors’ responsibility statement Each of the Directors, whose names and functions are listed in the Board of Directors section on pages 37 to 39, confirms that to the best of their knowledge and belief: 1. The Group and the Company financial statements, which have been prepared in accordance with IFRS as adopted by the EU,
give a true and fair view of the assets, liabilities, financial position and profit of the Group and of the Company and taken as a whole, are fair, balanced and understandable and provide the information necessary for shareholders to assess the Group’s performance, business model and strategy.
2. The Strategic report includes the information required by DTR 4.1.8 and DTR 4.1.9 – a fair review of the development and performance of the business and the position of the Group, together with a description of the principal risks and uncertainties it faces.
By order of the Board
Sir Gerry Grimstone, Chairman Luke Savage, Chief Financial Officer 20 February 2015 20 February 2015
Standard Life 47
2. Governance information – Corporate governance
Corporate governance
Introduction and report from the Chairman of the Nomination and Governance Committee “Your Board adheres to the highest standards of corporate governance and ethical behaviour in directing the Group’s affairs and in its accountability to you as shareholders. As Directors, we believe these commitments are key to understanding and managing our business effectively, providing engaged leadership, and delivering shareholder value over the longer term. Your Board takes the quality of its performance seriously and strives to improve performance through annual reviews and continuing self-assessment”. Sir Gerry Grimstone, Chairman and Chairman of the Nomination and Governance Committee.
As well as covering the formal disclosure requirements of the UK Corporate Governance Code (the Code), this statement describes how the Board meets its governance responsibilities. The Directors view the Code as an important tool in supporting how we deliver the Group’s strategy. They also see it as an opportunity to drive and support effective leadership and behaviours at Board level and across the Group.
The Nomination and Governance Committee (the Committee) oversees the governance framework so the report on its activities is integrated through the relevant parts of the statement. The Committee members are Sir Gerry Grimstone (Chairman), Crawford Gillies (appointed 13 May 2014), David Grigson and John Paynter. Colin Buchan retired from the Committee on 13 May 2014. David Nish, Chief Executive, is invited to Committee meetings to discuss relevant topics, such as talent development and management succession.
During the year, the Committee met four times. Its duties are to support the composition and effectiveness of the Board, to oversee the development and implementation of the Group’s governance framework and to oversee the Group’s activities to strengthen its talent pipeline at all levels. Here, you can read about the Committee’s role in: • Reviewing Board diversity, skills and experience • Identifying and recommending Directors to be appointed to the Board • Supporting the review of the Board’s effectiveness • Overseeing succession planning, leadership and talent development and diversity levels throughout the Group.
Ultimate responsibility for these important topics rests with the Board and the Committee reports regularly to the Board so that all Directors can be involved as appropriate.
Committee effectiveness The Committee reviews its remit and effectiveness each year. The 2014 review was carried out via an internal self-assessment questionnaire and by an independent expert, Niall FitzGerald, who was invited to observe one of the Committee meetings as part of his assessment. The review concluded that the Committee: • Continued to focus Director recruitment on the skills and experience required by the Board • Saw continued progress in the succession, talent and development, diversity and leadership programmes across the Group • Continued to support the Board and the other Directors in their governance responsibilities.
More details of Niall FitzGerald’s overall Board effectiveness review are given later in this section.
Compliance Throughout 2014, the Company complied with all of the provisions set out in the Code issued by the Financial Reporting Council (FRC) in September 2012. This is available at www.frc.org.uk With regard to Code provision C.3.7, which requires external audit contracts to be put out to tender at least every ten years, and which was introduced with transitional provisions allowing the period for tender to extend to the end of the current engagement partner’s term of appointment, the Company last tendered in 2003 and will conduct a tender in accordance with the transitional provisions. The Audit Committee keeps under review the legislation on audit tendering and rotation from the EU and the Competition and Markets Authority and further details are provided in the Audit Committee report.
Together with the Directors’ remuneration report, this statement explains how our governance framework supports the way we apply the Code’s main principles of good governance.
Governance framework The Group’s governance framework is approved by the Board and documented in the Board Charter. You can read the Board Charter in the governance section of our website at www.standardlife.com/about/governance
The Group’s Code of Business Conduct complements the Board Charter. It sets out our standards of conduct and governing principles for operational excellence, compliance responsibilities, customer service, our people, and other stakeholders.
The Board expects the Group to be a leader in corporate governance activities through its own actions and through its stewardship activities. The Nomination and Governance Committee regularly reviews the Group’s corporate governance framework against relevant generally accepted standards, guidance and best practice, and, as appropriate, recommends to the Board changes to the Board Charter. The Committee has reviewed the revisions to the Code, which will be in place for 2015, and approved the changes needed to ensure our continued compliance. To contribute to external developments, the Committee, generally on behalf of the Board, submits responses to corporate governance consultation documents. The Group Company Secretary is responsible for advising the Board on governance matters.
48 Standard Life
The governance framework also sets out the Board’s relationship with the boards of the principal subsidiaries in the Group. In particular, it identifies the matters which these subsidiaries require to refer to the Board or to a Committee of the Board for approval.
The governance framework also ensures that all decisions which require or would benefit from it, receive the independent input of the non-executive Directors.
Role and responsibilities of the Board The Board’s role is to organise and direct the affairs of the Company and the Group to maximise value for shareholders, in accordance with the Company’s constitution, all relevant laws, regulations, corporate governance and stewardship standards. The Board’s role and responsibilities, collectively and for individual Directors, are set out in the Board Charter. The Board Charter also identifies matters that are specifically reserved for decision by the Board. These include approving, overseeing and challenging:
• The development and implementation of strategy, objectives and business plans • Capital and management structures, including the return of value and share consolidation being proposed in 2015 • Dividend policy • Financial reporting, including preparation for the introduction of Solvency 2 • How risks are managed, including the Enterprise Risk Management (ERM) framework, risk strategy, risk appetite limits and
internal controls • Significant corporate and other transactions, which during 2014, focused on the proposals to acquire Ignis Asset Management
and the sale of the Canadian business • Remuneration policy • Succession planning • The sustainability of the Group’s business, our ethical standards and behaviours and our corporate responsibilities • Significant external communications • Terms of reference of Board Committees • Appointments to the Board and to Board Committees • The matters to be escalated from subsidiary boards to the Board for approval.
The Board regularly reviews reports from the Chief Executive and from the Chief Financial Officer on progress against approved strategies, plans and budgets, as well as updates from the Chief Executive of Standard Life Investments Limited on stock market and global economic conditions. There are also regular presentations from key business units and group corporate centre functions. The Chairman reports at each Board meeting on the activities he has undertaken on behalf of the Board and the Group since the previous meeting.
Roles of the Chairman and the Chief Executive The roles of the Chairman and the Chief Executive are separate. Each has clearly defined responsibilities, which are described in the Board Charter.
The Chairman: • Leads the Board and ensures that its principles and processes are maintained • Promotes high standards of corporate governance • Together with the Chief Executive and the Group Company Secretary, sets agendas for meetings of the Board • Ensures Board members receive accurate, timely and clear information on the Group and its activities • Encourages open debate and constructive discussion and decision making • Leads the Board and individual Director performance assessments and training needs • Speaks on behalf of the Board and represents the Board to shareholders.
The Chief Executive, within authorities delegated by the Board: • Leads the other executive Directors and the executive team in the day-to-day running of the Group • Develops appropriate capital, corporate, management and succession structures to support the Group’s objectives • Makes and implements operational decisions • Develops strategic plans and structures for presentation to the Board • Reports to the Board with relevant and timely information • Together with the Chairman, represents the Group to external stakeholders, including shareholders, customers, suppliers,
regulatory and governmental authorities, and the local and wider communities.
The heads of each business unit and the group corporate centre functions manage their teams within authorities set out in the Board Charter and within an approved scheme of delegation. This includes reporting to the Chief Executive on how they are complying with Group policies and performing against approved plans and budgets.
Standard Life 49
2. Governance information – Corporate governance continued
Board composition, balance and diversity The Board’s policy is to appoint and retain non-executive Directors who bring relevant expertise as well as a wide perspective to the Group and its decision-making framework. The Directors believe that at least half of the Board should be made up of independent non-executive Directors. As at 20 February 2015, the Board comprises the Chairman, nine independent non-executive Directors and three executive Directors. The Board is made up of 10 males (77%) and three females (23%) (2013: males 82%, females 18%). The Board continues to support its Diversity statement which states that it: • Believes in equal opportunities and supports the principle that due regard should be had for the benefits of diversity, including
gender, when undertaking a search for candidates, both executive and non-executive • Recognises that diversity can bring insights and behaviours that may make a valuable contribution to its effectiveness • Believes that it should have a blend of skills, experience, independence, knowledge and gender amongst its individual members
that is appropriate to its needs • Believes that it should be able to demonstrate with conviction that any new appointee can make a meaningful contribution to its
deliberations • Is committed to maintaining its diverse composition • Supports the Chief Executive’s commitment to achieve and maintain a diverse workforce, both throughout the Group, and within
his executive team.
The Board benefits from the diverse backgrounds of its members which enhance its collective business, operational and international strength. You can read more about our Directors in their biographies on pages 37 to 39.
The Nomination and Governance Committee receives updates on progress towards achieving and maintaining diversity throughout the Group. This includes reviewing statistics on age, gender and full/part time working at all levels. The Group also promotes initiatives and programmes to raise awareness of why diversity matters. You can read more about our diversity activities in Section 1.6 of the Strategic report – Our sustainable business overview.
Board changes during the period Appointments Luke Savage joined the Board on 18 August 2014 as Director and Chief Financial Officer. Luke joined from Lloyd's of London where he was director of finance and operations. Luke previously held senior finance roles at Deutsche Bank (UK) where he was global chief financial officer of equities, Morgan Stanley & Company (UK) where he was financial controller, and Lloyds Bank plc in the corporate banking and treasury department. He is a member of the Institute of Chartered Accountants in England and Wales and is a member of the governing body of Queen Mary University of London.
Isabel Hudson joined the Board on 15 October 2014 as a non-executive Director and became a member of the Audit Committee and the Risk and Capital Committee. Isabel currently holds other non-executive directorships at BT Group plc and Phoenix Group Holdings. She is also chairman of the National House Building Council. Isabel previously held the positions of chief executive officer at Synesis Life, executive director at Prudential UK and chief financial officer of Eureko. She also held non-executive director appointments at QBE Insurance Group Ltd, the Pensions Regulator and MGM Advantage and was a member of the Standard Life Assurance Limited With Profits Committee. Her appointment reflects her strong knowledge of the UK life insurance and pensions market. Prior to her appointment the Board considered fully her role as a non-executive director of Phoenix Group Holdings and concluded that this relationship did not impact her independence.
Kevin Parry joined the Board on 27 October 2014 as a non-executive Director and became a member of the Audit Committee and the Risk and Capital Committee. After the conclusion of the 2015 Annual General Meeting (AGM), Kevin will be appointed chairman of the Audit Committee. His previous appointments include chief financial officer of Schroders plc and group chief executive of Management Consulting Group PLC. Kevin currently holds other non-executive directorships at Daily Mail and General Trust plc and at the Homes and Communities Agency. He is the senior independent director of Intermediate Capital Group plc and is the deputy chairman of the board of trustees and chairman of the finance and investment committee at the Royal National Children’s Foundation. Kevin is a Fellow of the Institute of Chartered Accountants in England and Wales. Kevin’s appointment reflects his strong financial background and experience.
Retirals Colin Buchan retired at the conclusion of the 2014 AGM after more than six years’ service. David Grigson will retire at the conclusion of the 2015 AGM having served two three-year terms.
Board appointment process, terms of service and role Taking account of the Group’s strategy, as well as industry and regulatory developments, the Nomination and Governance Committee evaluates the Board’s balance of skills, diversity, knowledge and experience, in the context of the time served by non-executive Directors. The Committee uses the results of its analysis to direct its recruitment activities and appointment recommendations and reviews all recommendations to appoint independent non-executive Directors to the boards of subsidiary companies.
Having identified the capabilities needed for Board roles, and the succession timeframe, the Nomination and Governance Committee considers the related role profile submitted to external search consultants along with the request to prepare a list of suitable candidates. The Group has used the services of JCA Group, Egon Zehnder and Odgers Berndtson to support its recent recruitment searches and Egon Zehnder has also provided executive development assessment support. These consultants have no other connection with the Group.
50 Standard Life
The Committee reviews the list of potential candidates and agrees a shortlist. Following interviews with potential candidates, the Committee then makes recommendations to the Board on any proposed appointment, subject always to the satisfactory completion of all background checks and regulatory approvals. The other Board members are also offered the opportunity to meet the recommended candidates. The Committee considers the external commitments of candidates to assess their ability to meet the necessary time commitment and whether there are any conflict of interest matters to address.
Each non-executive Director is appointed for a three-year fixed term and shareholders then vote on whether to re-elect him or her at every AGM. Once a three-year term has ended, a non-executive Director can continue for further terms if the Board is satisfied with the non-executive Director’s performance, independence and ongoing time commitment. There is no specified limit to the number of terms that a non-executive Director can serve, although the Board recognises the Code provisions regarding length of service when considering whether or not their appointment should be continued. The current average length of service of the non-executive Directors (excluding the Chairman) is just over three years. The Nomination and Governance Committee oversees the process to recommend continued appointments, but members of the Committee do not take part in discussions when their own performance – or continued appointment – is being considered. During 2014, the Committee recommended to the Board that the appointments of Pierre Danon should be continued from 20 October 2014 and John Paynter from 1 January 2015.
The role of our non-executive Directors is to participate fully in the Board’s decision-making work – advising, supporting and challenging management as appropriate. You can see our standard letter of appointment on our website at www.standardlife.com/about/board or by writing to the Group Company Secretary. The letter of appointment confirms that the amount of time we expect each non-executive Director to commit to each year, once they have met all of the approval and induction requirements, is 30 to 35 days. Non-executive Directors are required to confirm that they can allocate sufficient time to carry out their duties and responsibilities effectively. You can read more about the induction and development programme later in this section.
Director election and re-election Since 2011, shareholders can vote on whether to re-elect each Director. At the 2015 AGM, all of the current Directors except David Grigson, Luke Savage, Isabel Hudson and Kevin Parry will retire and stand for re-election. Luke, Isabel and Kevin, having been appointed since the previous AGM, will retire and stand for election. David Grigson will retire from the Board following conclusion of the AGM.
You can read more background information about the Directors including the reasons why the Chairman believes you should support their election or re-election, in our AGM guide 2015, which will be published online at www.standardlife.com from 24 March 2015, and in the Board of Directors summary on pages 37 to 39.
Director independence, external activities and conflicts of interest The Board carries out a formal review of the independence of non-executive Directors annually, including an assessment of their character, judgement and their relationships or circumstances which may affect their independence. The review considers all relevant issues including the number and nature of their other appointments, any other positions they hold within the Group, any potential conflicts of interest they have identified and their length of service. Their individual circumstances are also assessed against independence criteria, including those in the Code. Following this review, the Board has concluded that all the non-executive Directors are independent.
Sir Gerry Grimstone was Chairman of the Board throughout the year. He remained Chairman of TheCityUK but will be stepping down from that role late in 2015. He has also retained his non-executive positions with Deloitte LLP, the UK Government’s Ministry of Defence and his membership of the shareholder executive board of the Department for Business, Innovation and Skills. He is also senior adviser to the board of the Abu Dhabi Commercial Bank. The Board formally reviewed his performance and is satisfied that he has sufficient time to carry out his duties. John Paynter served as the Senior Independent Director (SID) throughout the period. In this role, he supports the Chairman, and often meets with him one-to-one. He is also available to talk with our shareholders about any concerns that they may not have been able to resolve through the channels of Chairman, Chief Executive or Chief Financial Officer, or where a shareholder considers these channels are inappropriate.
The Directors continued to review and authorise Board members’ actual and potential conflicts of interest on a regular and ad hoc basis in line with the authority granted to them in the Company’s articles of association (the Articles). As part of the process to approve the appointment of a new Director, the Board considers and, where appropriate, authorises his or her potential or actual conflicts. The Board also considers whether any new outside appointment of any current Director creates a potential or actual conflict before, where appropriate, authorising it. All appointments are approved in accordance with the Group’s Outside Appointments and Conflicts of Interest policies. In January 2015, the Board reviewed all previously authorised potential and actual conflicts of interest of the Directors and their connected persons, and concluded that the authorisations should remain in place until January 2016. Under the terms of the approval, conflicted Directors can be excluded from receiving information, taking part in discussions and making decisions that relate to the potential or actual conflict. The Board’s policy encourages executive Directors to take up one external non-executive director role. David Nish continued as a non-executive director of the UK Green Investment Bank plc and Keith Skeoch continued as a non-executive director of the Financial Reporting Council. You can read more about the Directors’ outside appointments in their biographies on pages 37 to 39.
Standard Life 51
2. Governance information – Corporate governance continued
Advice Directors may sometimes need external professional advice to carry out their responsibilities. The Board’s policy is to allow them to seek this where appropriate and at the Group’s expense. Directors also have access to the advice and services of the Group Company Secretary, whose appointment and removal is a matter for the Board. No Directors sought external advice in 2014.
Board effectiveness Review process Board effectiveness is key to the Group’s success. The Board has, with the help of the Nomination and Governance Committee, developed a formal review process to assess how well the Board, its Committees, the Chairman and the Directors are performing collectively and individually and how performance could be improved.
As well as planning the 2014 review, the Committee also considered how the themes from the 2013 review had been taken forward. Risk reporting developed to introduce the “Views on Risk” from the Chief Risk Officer. In respect of engagement, the Board hosted a talent dinner where the Directors met and heard from participants in the leadership programmes and non-executive Directors took part in a new programme to support employees who take up board appointments outside the Group as part of their development. Executive Directors held regular interactive sessions open to all employees.
As mentioned above, the 2014 review was led by an external facilitator, Niall FitzGerald, who is an experienced independent director who has chaired a number of large international public company boards. The Committee believed that he would engage openly with the Directors, understand fully the context of the Board’s processes, and would be able to relate directly to the points they raised. The Committee noted that he has provided mentoring support to the Chief Executive since 2011 and, following discussion and consideration, did not believe that this would prevent him from carrying out an independent review.
Niall reviewed the results of earlier board reviews and proposed some minor changes to the self-assessment questionnaires. In 2014, he also attended the Board and Committee meetings in June, the Board meeting in September and a further Committee meeting in October. After studying the individual responses to the questionnaires, he conducted 25 hours of one-to-one interviews with Board members, members of the senior executive team and Committee secretaries to discuss their ratings and comments, with a particular focus on identifying areas for improvement. His review was complemented by the annual online self-assessment process. Directors completed questionnaires about the Board, each Committee they sit on, the Chairman’s performance and their own individual performance. They were encouraged to provide open and honest feedback, explain the ratings they gave and suggest how the Board or Committee could improve.
Outcome Following the review process, two reports were produced. The Group Company Secretary analysed the self-assessment responses and prepared a summary report. Niall FitzGerald prepared a report with the findings from his meeting observations and interviews and a series of related points for possible action. Both reports were considered in detail by the Nomination and Governance Committee at its October meeting before being formally presented to the Board in December. Niall FitzGerald attended both meetings to present his report.
The external facilitator’s report recognised the Board’s successes and strengths and proposed enhancement actions, which could take the Board’s performance from upper quartile to top decile in each of these five areas:
1. Board content and reporting – focusing on the balance between comprehensive yet concise and tailored reporting 2. Board organisation and Committees – focusing on the need for strong links from the work of the Committees to the Board 3. Strategy development – focusing on the balance between flexibility and a strong framework around setting strategy 4. Succession planning and talent – focusing on all levels throughout the organisation 5. Leadership and organisational transition – focusing on the Board’s opportunity to match talent with needs.
The Committee and the Board discussed these reports and the proposed recommendations and agreed an action plan. At the end of the exercise, the Board supported the conclusions and agreed to take forward actions including:
• Refreshing the Board’s strategy-setting process to ensure it remained fit for purpose • Refreshing the content of the Group Performance Report • giving the Board continued opportunities to discuss its succession planning and talent development needs in light of the
progressive re-shaping of the Group. Progress to implement the recommendations is monitored by the Group Company Secretary and reported to the Nomination and Governance Committee. Each Committee followed a similar questionnaire, reporting and feedback process and reviewed its own results and recommendations in detail.
52 Standard Life
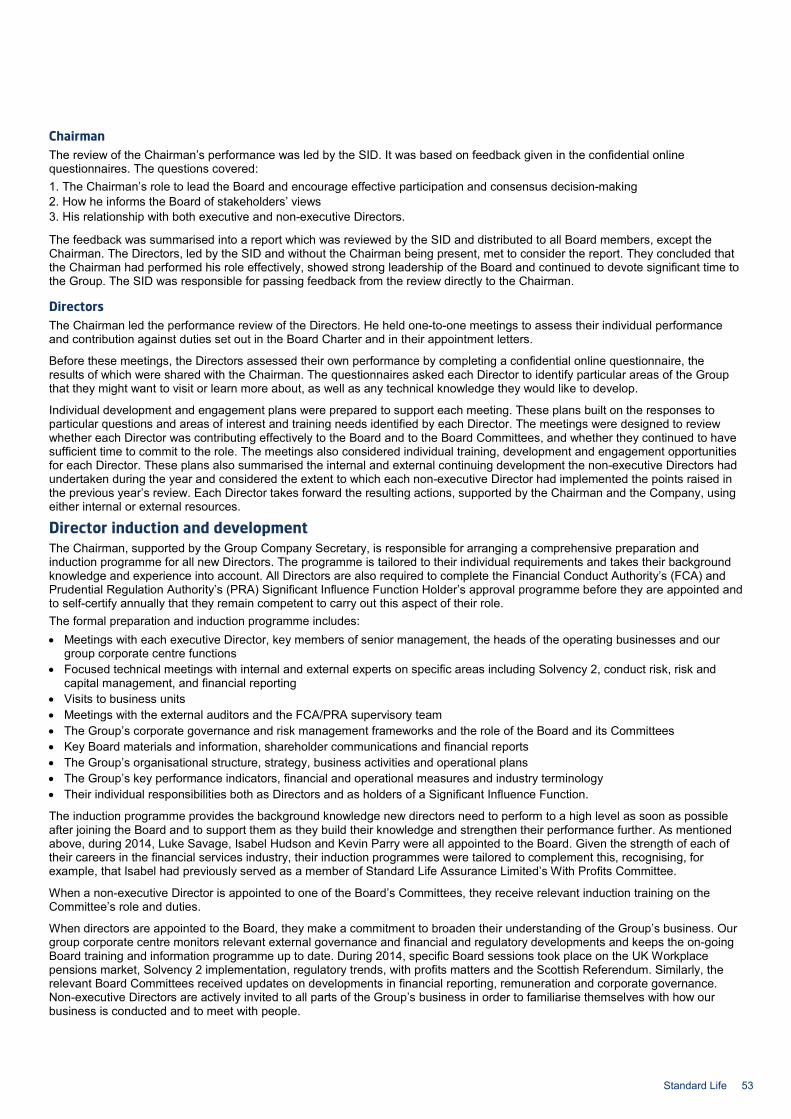
Chairman The review of the Chairman’s performance was led by the SID. It was based on feedback given in the confidential online questionnaires. The questions covered: 1. The Chairman’s role to lead the Board and encourage effective participation and consensus decision-making 2. How he informs the Board of stakeholders’ views 3. His relationship with both executive and non-executive Directors.
The feedback was summarised into a report which was reviewed by the SID and distributed to all Board members, except the Chairman. The Directors, led by the SID and without the Chairman being present, met to consider the report. They concluded that the Chairman had performed his role effectively, showed strong leadership of the Board and continued to devote significant time to the Group. The SID was responsible for passing feedback from the review directly to the Chairman.
Directors The Chairman led the performance review of the Directors. He held one-to-one meetings to assess their individual performance and contribution against duties set out in the Board Charter and in their appointment letters.
Before these meetings, the Directors assessed their own performance by completing a confidential online questionnaire, the results of which were shared with the Chairman. The questionnaires asked each Director to identify particular areas of the Group that they might want to visit or learn more about, as well as any technical knowledge they would like to develop.
Individual development and engagement plans were prepared to support each meeting. These plans built on the responses to particular questions and areas of interest and training needs identified by each Director. The meetings were designed to review whether each Director was contributing effectively to the Board and to the Board Committees, and whether they continued to have sufficient time to commit to the role. The meetings also considered individual training, development and engagement opportunities for each Director. These plans also summarised the internal and external continuing development the non-executive Directors had undertaken during the year and considered the extent to which each non-executive Director had implemented the points raised in the previous year’s review. Each Director takes forward the resulting actions, supported by the Chairman and the Company, using either internal or external resources.
Director induction and development The Chairman, supported by the Group Company Secretary, is responsible for arranging a comprehensive preparation and induction programme for all new Directors. The programme is tailored to their individual requirements and takes their background knowledge and experience into account. All Directors are also required to complete the Financial Conduct Authority’s (FCA) and Prudential Regulation Authority’s (PRA) Significant Influence Function Holder’s approval programme before they are appointed and to self-certify annually that they remain competent to carry out this aspect of their role. The formal preparation and induction programme includes: • Meetings with each executive Director, key members of senior management, the heads of the operating businesses and our
group corporate centre functions • Focused technical meetings with internal and external experts on specific areas including Solvency 2, conduct risk, risk and
capital management, and financial reporting • Visits to business units • Meetings with the external auditors and the FCA/PRA supervisory team • The Group’s corporate governance and risk management frameworks and the role of the Board and its Committees • Key Board materials and information, shareholder communications and financial reports • The Group’s organisational structure, strategy, business activities and operational plans • The Group’s key performance indicators, financial and operational measures and industry terminology • Their individual responsibilities both as Directors and as holders of a Significant Influence Function.
The induction programme provides the background knowledge new directors need to perform to a high level as soon as possible after joining the Board and to support them as they build their knowledge and strengthen their performance further. As mentioned above, during 2014, Luke Savage, Isabel Hudson and Kevin Parry were all appointed to the Board. Given the strength of each of their careers in the financial services industry, their induction programmes were tailored to complement this, recognising, for example, that Isabel had previously served as a member of Standard Life Assurance Limited’s With Profits Committee.
When a non-executive Director is appointed to one of the Board’s Committees, they receive relevant induction training on the Committee’s role and duties.
When directors are appointed to the Board, they make a commitment to broaden their understanding of the Group’s business. Our group corporate centre monitors relevant external governance and financial and regulatory developments and keeps the on-going Board training and information programme up to date. During 2014, specific Board sessions took place on the UK Workplace pensions market, Solvency 2 implementation, regulatory trends, with profits matters and the Scottish Referendum. Similarly, the relevant Board Committees received updates on developments in financial reporting, remuneration and corporate governance. Non-executive Directors are actively invited to all parts of the Group’s business in order to familiarise themselves with how our business is conducted and to meet with people.
Standard Life 53

2. Governance information – Corporate governance continued
Succession planning and talent development The Board knows that comprehensive contingency and succession planning, and talent development, are key to our effective operation and long-term success. The Nomination and Governance Committee regularly reviews the results of succession planning activities, including key man and retention risk, and talent development programmes at all levels across the Group. In 2014, executive succession planning and the future talent pipeline were key areas of focus for the Committee. At its June, October and December meetings, the Committee discussed the future leadership and talent needs of the Group and how the programmes would be revised to take account of the skills and expertise required by the Board and senior management. The programmes recognise the changing shape of the Group, and also identified both the talent available within the Group and the need for external recruitment. The programmes are led by the Chief Operating Officer, with input from the Chief Executive and supported by the Group Talent and Organisation Development team. You can read about them in Section 1.6 – Our sustainable business overview.
During the year, the Committee also received updates on how the programmes at graduate and emerging leader levels, as well as the accelerated programme for senior leaders, and the overseas placements, have operated. They received an analysis of how the Group’s executive job family had changed over recent years, evidencing the Group’s balance of actively managing performance as well as developing talent. In addition, they received updates on the specific individual development programmes in place for executive team members and their potential successors. The Board members are keen to interact with the members of the development schemes and have met with, and had presentations from, key talent across the Group. Directors have been able to join the completion events for several of the talent programmes.
The Committee believes that the plans and programmes continue to evolve to strengthen succession planning and talent development, while recognising the changing needs of the Group. The results of the Committee’s discussions are presented at least annually to the Board. In 2014, the non-executive Directors held specific discussions on Board and executive succession, the results of which fed into the overall plan.
Board meetings and meeting attendance The Board and its Committees meet regularly, operating to an agreed timetable. Meetings are usually held in Edinburgh or London and, on occasion, at the offices of one of our international businesses. During the year, the Board held specific sessions to consider the Group’s strategy and business planning. The Chairman and the non-executive Directors also met on three occasions during the year, formally and informally, without the executive Directors present. At these meetings, matters including executive performance and succession were discussed.
The Board has a formal procedure for holding unscheduled meetings. This is used when, exceptionally, decisions on matters specifically reserved for the Board need to be taken urgently. Directors are required to attend all meetings of the Board and the Committees they serve on, and to devote enough time to the Company to perform their duties. Board and Committee papers are generally distributed before meetings. The Board sometimes needs to call or rearrange meetings at short notice and it may be difficult for all Directors to attend these meetings. If Directors are not able to attend a meeting because of conflicts in their schedules, they receive all the relevant papers and have the opportunity to submit their comments in advance to the Chairman or to the Group Company Secretary. If necessary, they can follow up with the Chairman of the meeting.
Directors’ attendance at the 2014 Board and Committee meetings is shown in the following table. The Chairman is not a member of the Audit, Risk and Capital, and Remuneration Committees. He does, however, attend the meetings of all Committees, by invitation, in order to keep abreast of their discussions. The Board met nine times during the year.
54 Standard Life
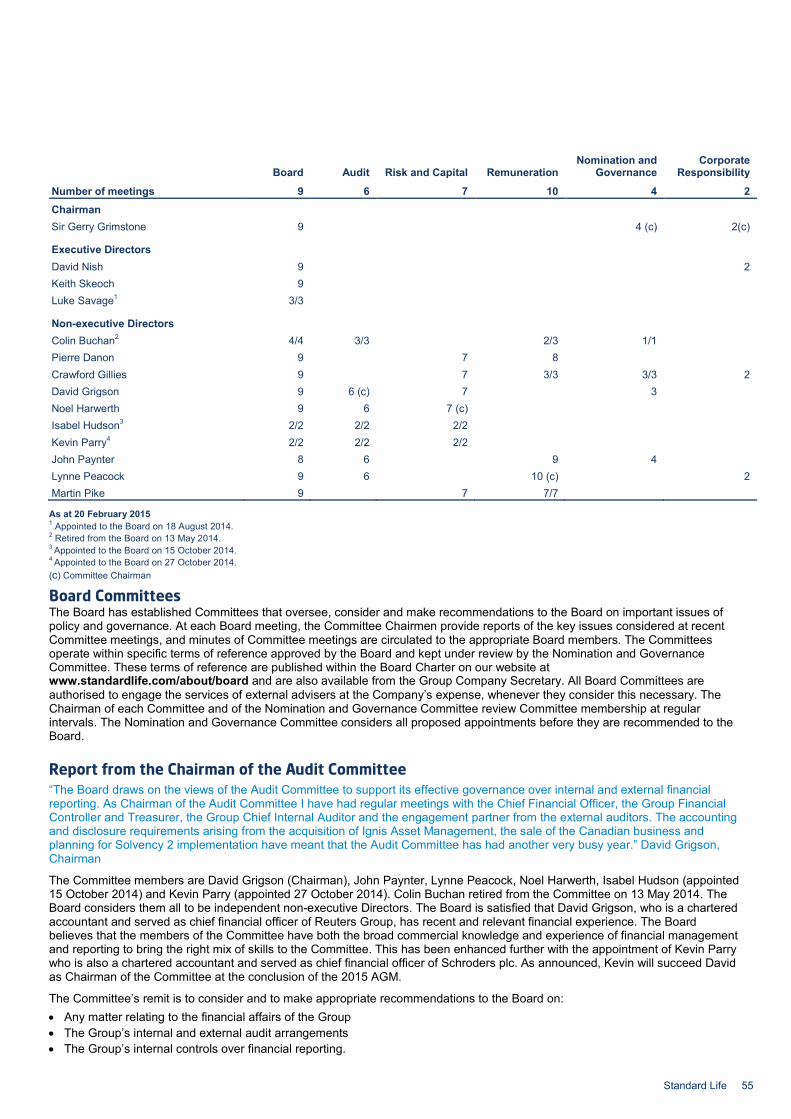
Board Audit Risk and Capital Remuneration Nomination and
Governance Corporate
Responsibility
Number of meetings 9 6 7 10 4 2 Chairman Sir Gerry Grimstone 9 4 (c) 2(c)
Executive Directors David Nish 9 2 Keith Skeoch 9 Luke Savage1 3/3
Non-executive Directors Colin Buchan2 4/4 3/3 2/3 1/1 Pierre Danon 9 7 8 Crawford Gillies 9 7 3/3 3/3 2 David Grigson 9 6 (c) 7 3 Noel Harwerth 9 6 7 (c) Isabel Hudson3 2/2 2/2 2/2 Kevin Parry4 2/2 2/2 2/2 John Paynter 8 6 9 4 Lynne Peacock 9 6 10 (c) 2 Martin Pike 9 7 7/7
As at 20 February 2015 1 Appointed to the Board on 18 August 2014. 2 Retired from the Board on 13 May 2014. 3 Appointed to the Board on 15 October 2014. 4 Appointed to the Board on 27 October 2014. (c) Committee Chairman Board Committees The Board has established Committees that oversee, consider and make recommendations to the Board on important issues of policy and governance. At each Board meeting, the Committee Chairmen provide reports of the key issues considered at recent Committee meetings, and minutes of Committee meetings are circulated to the appropriate Board members. The Committees operate within specific terms of reference approved by the Board and kept under review by the Nomination and Governance Committee. These terms of reference are published within the Board Charter on our website at www.standardlife.com/about/board and are also available from the Group Company Secretary. All Board Committees are authorised to engage the services of external advisers at the Company’s expense, whenever they consider this necessary. The Chairman of each Committee and of the Nomination and Governance Committee review Committee membership at regular intervals. The Nomination and Governance Committee considers all proposed appointments before they are recommended to the Board.
Report from the Chairman of the Audit Committee “The Board draws on the views of the Audit Committee to support its effective governance over internal and external financial reporting. As Chairman of the Audit Committee I have had regular meetings with the Chief Financial Officer, the Group Financial Controller and Treasurer, the Group Chief Internal Auditor and the engagement partner from the external auditors. The accounting and disclosure requirements arising from the acquisition of Ignis Asset Management, the sale of the Canadian business and planning for Solvency 2 implementation have meant that the Audit Committee has had another very busy year.” David Grigson, Chairman
The Committee members are David Grigson (Chairman), John Paynter, Lynne Peacock, Noel Harwerth, Isabel Hudson (appointed 15 October 2014) and Kevin Parry (appointed 27 October 2014). Colin Buchan retired from the Committee on 13 May 2014. The Board considers them all to be independent non-executive Directors. The Board is satisfied that David Grigson, who is a chartered accountant and served as chief financial officer of Reuters Group, has recent and relevant financial experience. The Board believes that the members of the Committee have both the broad commercial knowledge and experience of financial management and reporting to bring the right mix of skills to the Committee. This has been enhanced further with the appointment of Kevin Parry who is also a chartered accountant and served as chief financial officer of Schroders plc. As announced, Kevin will succeed David as Chairman of the Committee at the conclusion of the 2015 AGM.
The Committee’s remit is to consider and to make appropriate recommendations to the Board on: • Any matter relating to the financial affairs of the Group • The Group’s internal and external audit arrangements • The Group’s internal controls over financial reporting.
Standard Life 55
2. Governance information – Corporate governance continued
During the year, the Committee met six times to coincide with the Company’s financial reporting cycle requirements. It met regularly with each of the external and internal auditors without management being present to allow the Committee to discuss any issues of emerging concern in more detail. Invitations to attend the Committee meetings are extended on a regular basis to the Chairman, the Chief Executive, the Chief Financial Officer, the Chief Executive of Standard Life Investments, the Group Financial Controller and Treasurer, the Group Chief Internal Auditor (GCIA) and the Group Chief Risk Officer.
Financial reporting IFRS accounting policies, practices and areas of judgement The Committee reviewed the Group accounting policies and confirmed they were appropriate to be used for the 2014 Group financial statements. The Committee also focused on the valuation bases for the assets and liabilities, including the key assumptions used to measure the insurance and participating investment liabilities. The Committee reviewed the implications of the adoption of IFRS 10, 11 and IAS 28 consolidation standards and agreed with the approaches being applied.
The Committee discussed the significant accounting and actuarial matters affecting the 2014 Group financial statements and considered the areas below to contain the most significant levels of judgement:
Acquisition of Ignis Asset Management The acquisition of Ignis Asset Management during 2014 required an assessment of the fair value of intangible assets relating to the customer contracts acquired, and consideration of the useful lives of these intangible assets. The fair value of these intangible assets were considered again at the year end taking into account post acquisition events. An impairment of £43m was required at the year end resulting from post acquisition outflows from the Ignis Absolute Return Government Bond Fund (the fair value of intangibles recognised at the date of acquisition was £208m). The Committee considered the valuation process relating to these intangibles, and challenged the key assumptions underlying the valuations, in particular the level of future fund flows. The Committee also considered sensitivities to the key assumptions. The Committee was satisfied that the fair values of the intangible assets and the level of the year end impairment were appropriate. Actuarial assumptions The Committee reviewed the key assumptions used in calculating the insurance and participating investment contract liabilities in the UK and Canada. The most significant judgements related to annuitant mortality and, in particular, the rate at which life expectancy is expected to improve in future years. The Committee was satisfied with management’s review of these assumptions. Note 34 of the Group financial statements provides further details on the actuarial assumptions used, and note 42(d)(ii) sets out the impact of longevity sensitivities.
Sale of Canadian business Following the sale announcement in 2014, the Canadian business has been treated as a discontinued operation, with assets and liabilities shown as ‘Held for sale’. The Committee considered the accounting implications of the sale, and the presentation and disclosure of the Canadian business in the Annual report and accounts 2014. The Committee was satisfied that the accounting, presentation and disclosure were appropriate. The Committee also discussed the year end governance processes relating to the reporting of the Canadian business results and was satisfied that these were appropriate.
Valuation of financial instruments, commercial mortgages and properties The Committee’s review focused on the fair value of complex financial instruments, including private equity investments and derivatives, and securities where a recent market price was not available. The Committee also considered the fair value of commercial mortgages, taking into account increased investment into these assets during 2014, and the fair value of investment properties. The Committee was satisfied with management’s analysis. Note 44 of the Group financial statements provides further details on the fair value of assets and liabilities. For each of the matters discussed, the Committee: • Considered the management information provided to support the Committee’s review of the matter, including the strength and
operation of the controls to prevent management override and management’s responses to the challenges raised by Committee members
• Sought information from the external auditors as to whether/how the external auditors had considered each of these areas and how any areas of significant audit focus had been reported in the external auditors’ report
• Reviewed the consistency of the views of management and the external auditors.
EEV basis of preparation, methodology and areas of judgement The Committee reviewed the EEV basis of preparation and changes to the methodology, and agreed that the basis of preparation and methodology were appropriate to be used in the 2014 EEV financial information. The Committee considered the areas with the most significant levels of judgement affecting the EEV financial information to be the determination of mortality and persistency assumptions and the risk discount rates in the UK and Canada. In addition, the Committee reviewed the projected release of the future taxes included in the Canadian liabilities. The Committee also discussed the impact of the future charge cap on corporate pensions announced by the UK Department of Work and Pensions. The Committee challenged the assumptions and agreed with management’s proposals. In light of the decision to sell our Canadian business and the resultant changing shape of the Group, the Committee agreed that 2014 would be the last year when EEV reporting would be used.
56 Standard Life
Non-GAAP measures The Committee reviewed the non-GAAP measures that are presented by management and which complement the statutory IFRS results in order to give a more complete view of the performance of the business.
The key discussions on the non-GAAP measures were: • Ensuring that the allocation of items to operating profit and to underlying performance were in line with our established
accounting policies and were consistent with previous practice. The Committee was satisfied with the consistency of the measures
• Transitioning some non-GAAP measures to reflect the changing shape of the Group, including the increased focus on fee based business as discussed in Section 1.2 of the Strategic report – Group key financial performance indicators. This resulted in the decision to cease reporting of EEV from 2015 and to change the definition of the cash generation metric so that it was more closely linked to underlying performance
• To provide a clearer presentation of the source of assets under administration and net flows, particularly to reflect the significant transformation within Standard Life Investments following the integration of Standard Life Wealth in January 2014 and the acquisition of Ignis Asset Management in July 2014.
Disclosure The Committee also considered the processes to prepare and review the Annual report and accounts 2014 (ARA). In particular, the Committee sought assurance on the internal and external verification and compliance processes which had taken place as well as the quality of the internal review of the ARA. Following its review, and recognising available external comment and guidance, the Committee was able to confirm to the Board that it believed the ARA, taken as a whole, is fair, balanced and understandable.
The Committee also discussed the management information provided on: • The clarity of disclosures in the Group financial statements (including in relation to the sale of the Canadian business, the
impairment of intangible assets relating to the acquisition of Ignis, and the adoption of IFRS 12 Disclosure of Interests in Other Entities) and EEV financial information, and agreed that the Strategic report, as a whole, contained a fair, balanced and understandable view of the Group’s business, a description of the risk and uncertainties facing the business, a balanced and comprehensive analysis of the development and performance of the Group’s business during the year and the position of the Group’s business at the end of the year
• The results of management’s assessments of the Group’s going concern position and Group solvency position, including recommending to the Board that the going concern assessment was reasonable (you can read more in the Going concern section of this report)
• Relevant external financial reporting developments and guidance, including in relation to the Strategic report.
External audit The Committee monitors the external auditors’ performance. This includes reviewing how independent and objective the external audit team is and how the team maintains its professional scepticism, all in the context of regulatory requirements and professional standards. The Committee assesses the effectiveness of the external audit process and approves the terms of engagement and remuneration for audit services. As part of its ongoing review of the effectiveness of the external auditors, the Committee: • Assesses the team’s qualifications, independence, expertise and resources as well as its relationship with management and the
executive Directors • Considers the scope and planning of the external audit of the Group • Reviews the audit findings with the external audit team and the overall effectiveness of the audit.
The Committee is satisfied that the external auditors continue to fulfil the terms of the engagement.
The Committee is also responsible for making a recommendation to the Board each year on the appointment, reappointment or removal of the external auditors. The current audit firm was appointed for the 1994 financial year. The external audit was put out to tender in 2003, following which the auditors were reappointed for the financial year beginning 1 January 2004. The audit engagement partner rotates every five years in accordance with Auditing Practices Board ethical guidelines and 2014 is the third year for the current partner. The Committee believes that the present auditors’ performance and reappointment should be considered every year rather than only when a tender is due. Therefore, there is a standing annual agenda item to review the auditors’ performance in detail against the relevant duties in the Committee’s terms of reference and taking into account all other appropriate factors, governance standards and guidance. As part of this review, the Committee considers the way the audit engagement partner reports to, and interacts with, the Committee and the quality and succession planning of the audit engagement partner and the senior audit team, and how the audit team has reacted to any events and issues which arose during the year. The Committee also seeks the views of the senior members of the Group Finance team who work most closely with the audit team. The Committee considers the quality of the regular and ad hoc reports received from the audit team on the output of audit activities, considering whether this is consistent with the reports from management, and the updates about independence, internal quality processes and technical knowledge. In particular, the Committee looks for evidence that the external auditors have maintained a high level of professional scepticism, have brought a high level of professional challenge to management, and have reported transparently and comprehensively to the Committee.
Standard Life 57
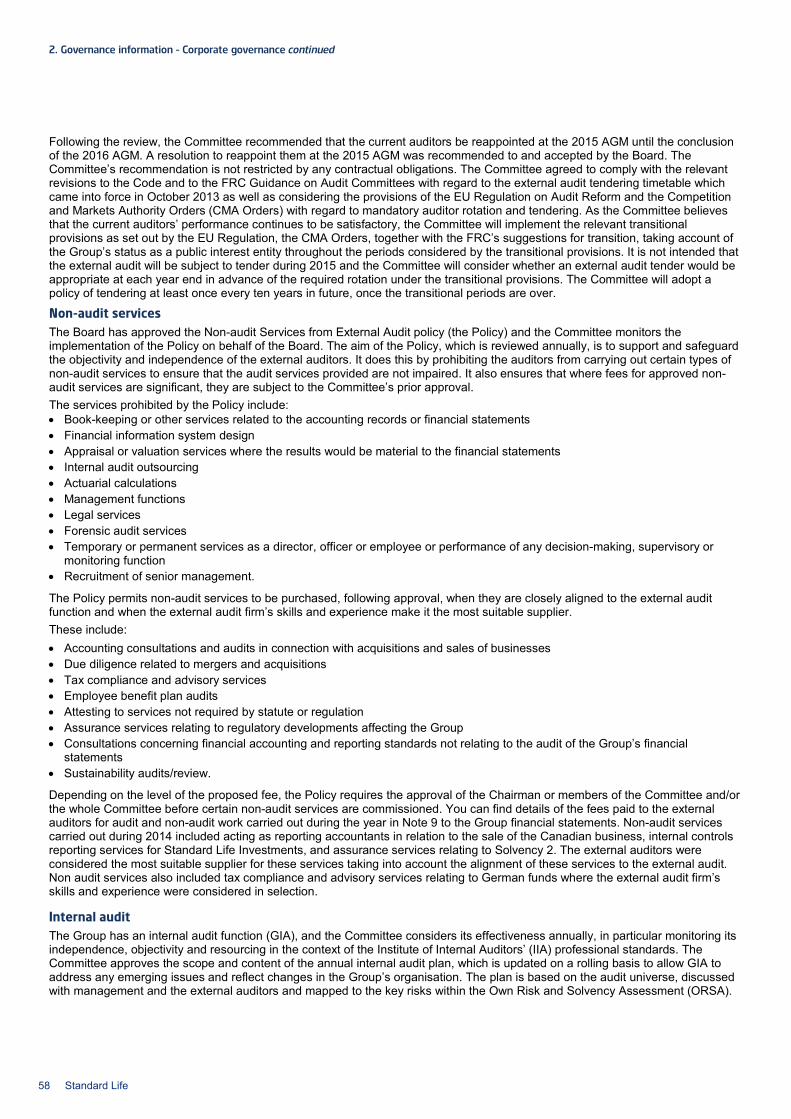
2. Governance information – Corporate governance continued
Following the review, the Committee recommended that the current auditors be reappointed at the 2015 AGM until the conclusion of the 2016 AGM. A resolution to reappoint them at the 2015 AGM was recommended to and accepted by the Board. The Committee’s recommendation is not restricted by any contractual obligations. The Committee agreed to comply with the relevant revisions to the Code and to the FRC Guidance on Audit Committees with regard to the external audit tendering timetable which came into force in October 2013 as well as considering the provisions of the EU Regulation on Audit Reform and the Competition and Markets Authority Orders (CMA Orders) with regard to mandatory auditor rotation and tendering. As the Committee believes that the current auditors’ performance continues to be satisfactory, the Committee will implement the relevant transitional provisions as set out by the EU Regulation, the CMA Orders, together with the FRC’s suggestions for transition, taking account of the Group’s status as a public interest entity throughout the periods considered by the transitional provisions. It is not intended that the external audit will be subject to tender during 2015 and the Committee will consider whether an external audit tender would be appropriate at each year end in advance of the required rotation under the transitional provisions. The Committee will adopt a policy of tendering at least once every ten years in future, once the transitional periods are over.
Non-audit services The Board has approved the Non-audit Services from External Audit policy (the Policy) and the Committee monitors the implementation of the Policy on behalf of the Board. The aim of the Policy, which is reviewed annually, is to support and safeguard the objectivity and independence of the external auditors. It does this by prohibiting the auditors from carrying out certain types of non-audit services to ensure that the audit services provided are not impaired. It also ensures that where fees for approved non-audit services are significant, they are subject to the Committee’s prior approval. The services prohibited by the Policy include: • Book-keeping or other services related to the accounting records or financial statements • Financial information system design • Appraisal or valuation services where the results would be material to the financial statements • Internal audit outsourcing • Actuarial calculations • Management functions • Legal services • Forensic audit services • Temporary or permanent services as a director, officer or employee or performance of any decision-making, supervisory or
monitoring function • Recruitment of senior management.
The Policy permits non-audit services to be purchased, following approval, when they are closely aligned to the external audit function and when the external audit firm’s skills and experience make it the most suitable supplier. These include: • Accounting consultations and audits in connection with acquisitions and sales of businesses • Due diligence related to mergers and acquisitions • Tax compliance and advisory services • Employee benefit plan audits • Attesting to services not required by statute or regulation • Assurance services relating to regulatory developments affecting the Group • Consultations concerning financial accounting and reporting standards not relating to the audit of the Group’s financial
statements • Sustainability audits/review.
Depending on the level of the proposed fee, the Policy requires the approval of the Chairman or members of the Committee and/or the whole Committee before certain non-audit services are commissioned. You can find details of the fees paid to the external auditors for audit and non-audit work carried out during the year in Note 9 to the Group financial statements. Non-audit services carried out during 2014 included acting as reporting accountants in relation to the sale of the Canadian business, internal controls reporting services for Standard Life Investments, and assurance services relating to Solvency 2. The external auditors were considered the most suitable supplier for these services taking into account the alignment of these services to the external audit. Non audit services also included tax compliance and advisory services relating to German funds where the external audit firm’s skills and experience were considered in selection.
Internal audit The Group has an internal audit function (GIA), and the Committee considers its effectiveness annually, in particular monitoring its independence, objectivity and resourcing in the context of the Institute of Internal Auditors’ (IIA) professional standards. The Committee approves the scope and content of the annual internal audit plan, which is updated on a rolling basis to allow GIA to address any emerging issues and reflect changes in the Group’s organisation. The plan is based on the audit universe, discussed with management and the external auditors and mapped to the key risks within the Own Risk and Solvency Assessment (ORSA).
58 Standard Life
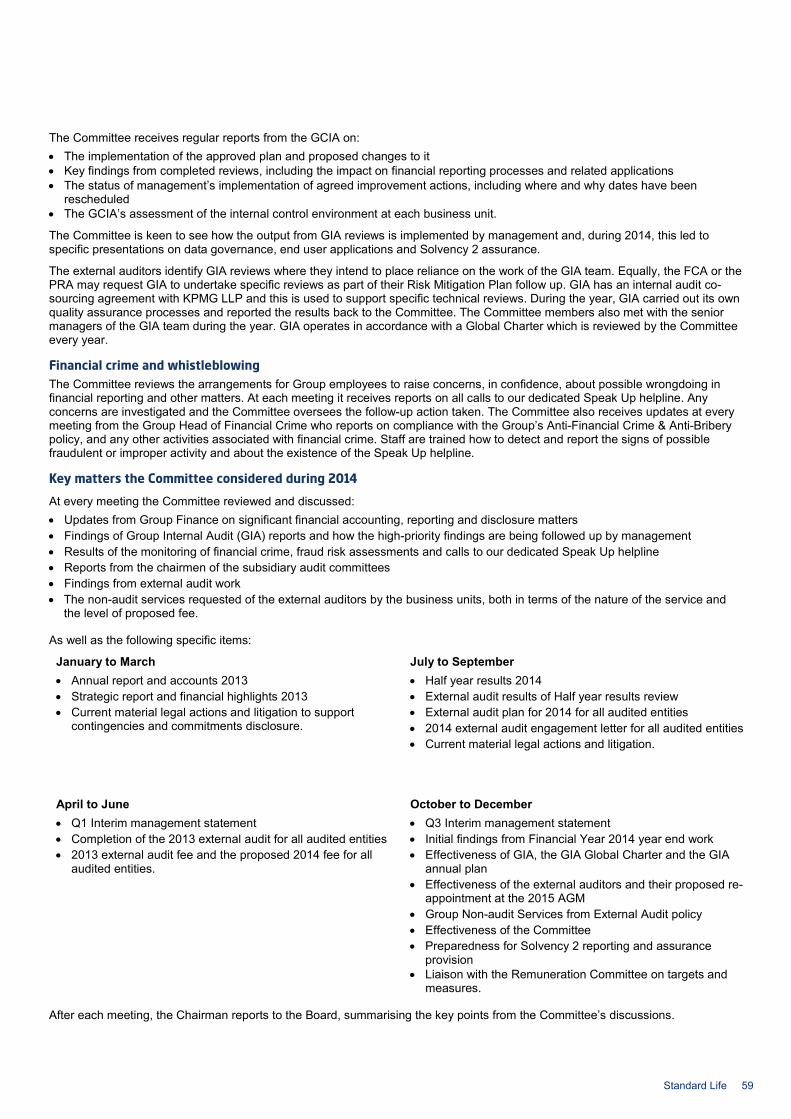
The Committee receives regular reports from the GCIA on: • The implementation of the approved plan and proposed changes to it • Key findings from completed reviews, including the impact on financial reporting processes and related applications • The status of management’s implementation of agreed improvement actions, including where and why dates have been
rescheduled • The GCIA’s assessment of the internal control environment at each business unit.
The Committee is keen to see how the output from GIA reviews is implemented by management and, during 2014, this led to specific presentations on data governance, end user applications and Solvency 2 assurance.
The external auditors identify GIA reviews where they intend to place reliance on the work of the GIA team. Equally, the FCA or the PRA may request GIA to undertake specific reviews as part of their Risk Mitigation Plan follow up. GIA has an internal audit co-sourcing agreement with KPMG LLP and this is used to support specific technical reviews. During the year, GIA carried out its own quality assurance processes and reported the results back to the Committee. The Committee members also met with the senior managers of the GIA team during the year. GIA operates in accordance with a Global Charter which is reviewed by the Committee every year.
Financial crime and whistleblowing The Committee reviews the arrangements for Group employees to raise concerns, in confidence, about possible wrongdoing in financial reporting and other matters. At each meeting it receives reports on all calls to our dedicated Speak Up helpline. Any concerns are investigated and the Committee oversees the follow-up action taken. The Committee also receives updates at every meeting from the Group Head of Financial Crime who reports on compliance with the Group’s Anti-Financial Crime & Anti-Bribery policy, and any other activities associated with financial crime. Staff are trained how to detect and report the signs of possible fraudulent or improper activity and about the existence of the Speak Up helpline.
Key matters the Committee considered during 2014
At every meeting the Committee reviewed and discussed: • Updates from Group Finance on significant financial accounting, reporting and disclosure matters • Findings of Group Internal Audit (GIA) reports and how the high-priority findings are being followed up by management • Results of the monitoring of financial crime, fraud risk assessments and calls to our dedicated Speak Up helpline • Reports from the chairmen of the subsidiary audit committees • Findings from external audit work • The non-audit services requested of the external auditors by the business units, both in terms of the nature of the service and
the level of proposed fee.
As well as the following specific items:
January to March July to September • Annual report and accounts 2013 • Strategic report and financial highlights 2013 • Current material legal actions and litigation to support
contingencies and commitments disclosure.
• Half year results 2014 • External audit results of Half year results review • External audit plan for 2014 for all audited entities • 2014 external audit engagement letter for all audited entities • Current material legal actions and litigation.
April to June October to December • Q1 Interim management statement • Completion of the 2013 external audit for all audited entities • 2013 external audit fee and the proposed 2014 fee for all
audited entities.
• Q3 Interim management statement • Initial findings from Financial Year 2014 year end work • Effectiveness of GIA, the GIA Global Charter and the GIA
annual plan • Effectiveness of the external auditors and their proposed re-
appointment at the 2015 AGM • Group Non-audit Services from External Audit policy • Effectiveness of the Committee • Preparedness for Solvency 2 reporting and assurance
provision • Liaison with the Remuneration Committee on targets and
measures.
After each meeting, the Chairman reports to the Board, summarising the key points from the Committee’s discussions.
Standard Life 59
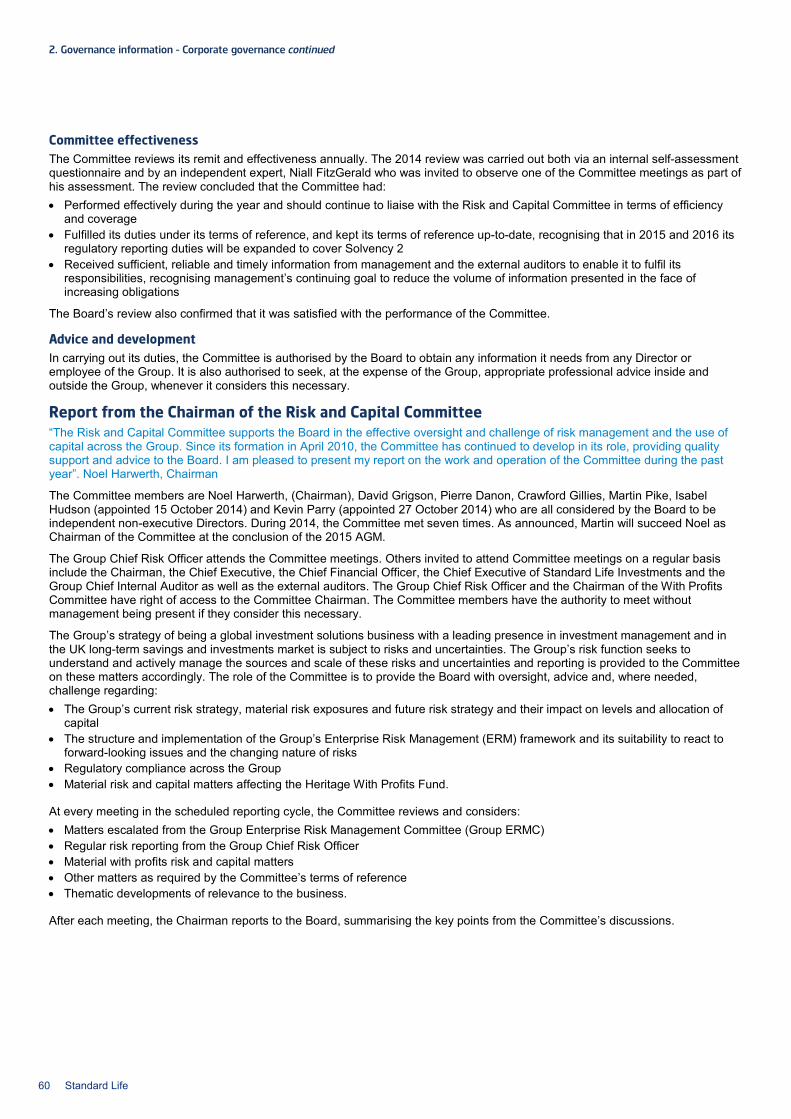
2. Governance information – Corporate governance continued
Committee effectiveness The Committee reviews its remit and effectiveness annually. The 2014 review was carried out both via an internal self-assessment questionnaire and by an independent expert, Niall FitzGerald who was invited to observe one of the Committee meetings as part of his assessment. The review concluded that the Committee had: • Performed effectively during the year and should continue to liaise with the Risk and Capital Committee in terms of efficiency
and coverage • Fulfilled its duties under its terms of reference, and kept its terms of reference up-to-date, recognising that in 2015 and 2016 its
regulatory reporting duties will be expanded to cover Solvency 2 • Received sufficient, reliable and timely information from management and the external auditors to enable it to fulfil its
responsibilities, recognising management’s continuing goal to reduce the volume of information presented in the face of increasing obligations
The Board’s review also confirmed that it was satisfied with the performance of the Committee.
Advice and development In carrying out its duties, the Committee is authorised by the Board to obtain any information it needs from any Director or employee of the Group. It is also authorised to seek, at the expense of the Group, appropriate professional advice inside and outside the Group, whenever it considers this necessary.
Report from the Chairman of the Risk and Capital Committee “The Risk and Capital Committee supports the Board in the effective oversight and challenge of risk management and the use of capital across the Group. Since its formation in April 2010, the Committee has continued to develop in its role, providing quality support and advice to the Board. I am pleased to present my report on the work and operation of the Committee during the past year”. Noel Harwerth, Chairman
The Committee members are Noel Harwerth, (Chairman), David Grigson, Pierre Danon, Crawford Gillies, Martin Pike, Isabel Hudson (appointed 15 October 2014) and Kevin Parry (appointed 27 October 2014) who are all considered by the Board to be independent non-executive Directors. During 2014, the Committee met seven times. As announced, Martin will succeed Noel as Chairman of the Committee at the conclusion of the 2015 AGM.
The Group Chief Risk Officer attends the Committee meetings. Others invited to attend Committee meetings on a regular basis include the Chairman, the Chief Executive, the Chief Financial Officer, the Chief Executive of Standard Life Investments and the Group Chief Internal Auditor as well as the external auditors. The Group Chief Risk Officer and the Chairman of the With Profits Committee have right of access to the Committee Chairman. The Committee members have the authority to meet without management being present if they consider this necessary.
The Group’s strategy of being a global investment solutions business with a leading presence in investment management and in the UK long-term savings and investments market is subject to risks and uncertainties. The Group’s risk function seeks to understand and actively manage the sources and scale of these risks and uncertainties and reporting is provided to the Committee on these matters accordingly. The role of the Committee is to provide the Board with oversight, advice and, where needed, challenge regarding: • The Group’s current risk strategy, material risk exposures and future risk strategy and their impact on levels and allocation of
capital • The structure and implementation of the Group’s Enterprise Risk Management (ERM) framework and its suitability to react to
forward-looking issues and the changing nature of risks • Regulatory compliance across the Group • Material risk and capital matters affecting the Heritage With Profits Fund.
At every meeting in the scheduled reporting cycle, the Committee reviews and considers: • Matters escalated from the Group Enterprise Risk Management Committee (Group ERMC) • Regular risk reporting from the Group Chief Risk Officer • Material with profits risk and capital matters • Other matters as required by the Committee’s terms of reference • Thematic developments of relevance to the business.
After each meeting, the Chairman reports to the Board, summarising the key points from the Committee’s discussions.
60 Standard Life
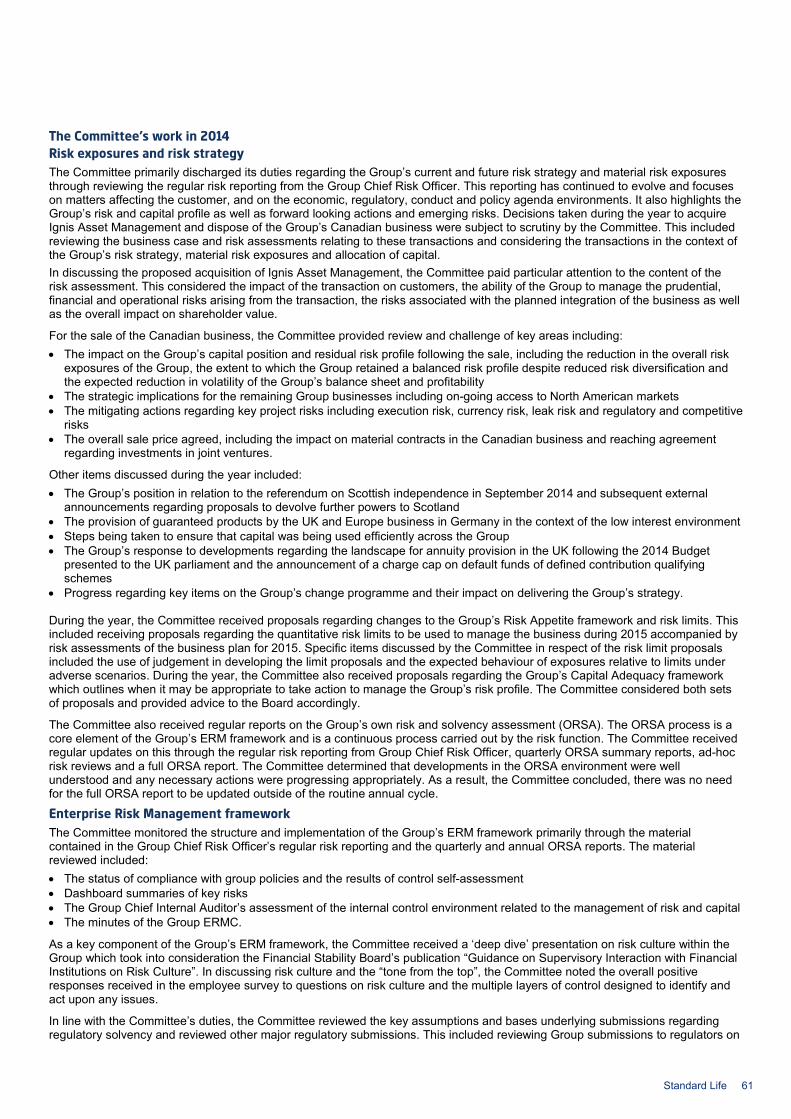
The Committee’s work in 2014 Risk exposures and risk strategy The Committee primarily discharged its duties regarding the Group’s current and future risk strategy and material risk exposures through reviewing the regular risk reporting from the Group Chief Risk Officer. This reporting has continued to evolve and focuses on matters affecting the customer, and on the economic, regulatory, conduct and policy agenda environments. It also highlights the Group’s risk and capital profile as well as forward looking actions and emerging risks. Decisions taken during the year to acquire Ignis Asset Management and dispose of the Group’s Canadian business were subject to scrutiny by the Committee. This included reviewing the business case and risk assessments relating to these transactions and considering the transactions in the context of the Group’s risk strategy, material risk exposures and allocation of capital. In discussing the proposed acquisition of Ignis Asset Management, the Committee paid particular attention to the content of the risk assessment. This considered the impact of the transaction on customers, the ability of the Group to manage the prudential, financial and operational risks arising from the transaction, the risks associated with the planned integration of the business as well as the overall impact on shareholder value.
For the sale of the Canadian business, the Committee provided review and challenge of key areas including: • The impact on the Group’s capital position and residual risk profile following the sale, including the reduction in the overall risk
exposures of the Group, the extent to which the Group retained a balanced risk profile despite reduced risk diversification and the expected reduction in volatility of the Group’s balance sheet and profitability
• The strategic implications for the remaining Group businesses including on-going access to North American markets • The mitigating actions regarding key project risks including execution risk, currency risk, leak risk and regulatory and competitive
risks • The overall sale price agreed, including the impact on material contracts in the Canadian business and reaching agreement
regarding investments in joint ventures.
Other items discussed during the year included: • The Group’s position in relation to the referendum on Scottish independence in September 2014 and subsequent external
announcements regarding proposals to devolve further powers to Scotland • The provision of guaranteed products by the UK and Europe business in Germany in the context of the low interest environment • Steps being taken to ensure that capital was being used efficiently across the Group • The Group’s response to developments regarding the landscape for annuity provision in the UK following the 2014 Budget
presented to the UK parliament and the announcement of a charge cap on default funds of defined contribution qualifying schemes
• Progress regarding key items on the Group’s change programme and their impact on delivering the Group’s strategy.
During the year, the Committee received proposals regarding changes to the Group’s Risk Appetite framework and risk limits. This included receiving proposals regarding the quantitative risk limits to be used to manage the business during 2015 accompanied by risk assessments of the business plan for 2015. Specific items discussed by the Committee in respect of the risk limit proposals included the use of judgement in developing the limit proposals and the expected behaviour of exposures relative to limits under adverse scenarios. During the year, the Committee also received proposals regarding the Group’s Capital Adequacy framework which outlines when it may be appropriate to take action to manage the Group’s risk profile. The Committee considered both sets of proposals and provided advice to the Board accordingly.
The Committee also received regular reports on the Group’s own risk and solvency assessment (ORSA). The ORSA process is a core element of the Group’s ERM framework and is a continuous process carried out by the risk function. The Committee received regular updates on this through the regular risk reporting from Group Chief Risk Officer, quarterly ORSA summary reports, ad-hoc risk reviews and a full ORSA report. The Committee determined that developments in the ORSA environment were well understood and any necessary actions were progressing appropriately. As a result, the Committee concluded, there was no need for the full ORSA report to be updated outside of the routine annual cycle. Enterprise Risk Management framework The Committee monitored the structure and implementation of the Group’s ERM framework primarily through the material contained in the Group Chief Risk Officer’s regular risk reporting and the quarterly and annual ORSA reports. The material reviewed included: • The status of compliance with group policies and the results of control self-assessment • Dashboard summaries of key risks • The Group Chief Internal Auditor’s assessment of the internal control environment related to the management of risk and capital • The minutes of the Group ERMC.
As a key component of the Group’s ERM framework, the Committee received a ‘deep dive’ presentation on risk culture within the Group which took into consideration the Financial Stability Board’s publication “Guidance on Supervisory Interaction with Financial Institutions on Risk Culture”. In discussing risk culture and the “tone from the top”, the Committee noted the overall positive responses received in the employee survey to questions on risk culture and the multiple layers of control designed to identify and act upon any issues.
In line with the Committee’s duties, the Committee reviewed the key assumptions and bases underlying submissions regarding regulatory solvency and reviewed other major regulatory submissions. This included reviewing Group submissions to regulators on
Standard Life 61

2. Governance information – Corporate governance continued
reverse stress testing, European Insurance and Occupational Pensions Authority (EIOPA) stress testing and field testing performed for the International Association of Insurance Supervisors (IAIS).
Scrutiny of with profits risk and capital matters The Committee is advised of relevant updates on with profits risk and capital matters through material contained in the Group Chief Risk Officer’s regular risk reporting. In addition, mechanisms exist for the Chairman of the Standard Life Assurance Limited With Profits Committee to highlight specific matters to the Committee.
During the year, there were no specific matters that were highlighted to the Committee by the Chairman of the Standard Life Assurance Limited With Profits Committee. Furthermore, in performing scrutiny of with profits risk and capital matters, there were no specific items identified by the Committee during the year that were sufficiently material as to require the Committee to provide advice to the Board.
Regulatory compliance At the start of the year the Committee reviewed and assessed the 2014 regulatory compliance plans detailing the planned assurance activities to be performed across the Group. The Committee also considered and agreed the proposed approach for Group Compliance to monitor and report on these assurance activities.
During the year, reporting on regulatory compliance was provided to the Committee through the Group Chief Risk Officer’s regular risk reporting. This included relevant updates on the activities contained in the 2014 plan, significant regulatory developments expected to impact the Group and the Group’s planned response to those regulatory developments.
The Committee has also received regular reporting on the Group’s progress towards the implementation of Solvency 2. These updates have focused on model development activity, the enhancement of systems and tools and the overall pace challenge associated with Solvency 2 reporting timescales.
Committee effectiveness The Committee reviews its remit and effectiveness annually. The 2014 review was carried out both via an internal self-assessment questionnaire and by an independent expert, Niall FitzGerald, who was invited to observe one of the Committee meetings as part of his assessment. The review concluded that the Committee continued to make good progress and to evolve.
Report from the Chairman of the Remuneration Committee “The Committee supports effective governance over remuneration. You can read my full introduction in the Directors’ remuneration report which follows this section”. Lynne Peacock, Chairman
The Committee members are Lynne Peacock (Chairman), Pierre Danon, John Paynter and Martin Pike (appointed 13 May 2014) – all of whom are considered by the Board to be independent non-executive Directors. Previous chairman, Crawford Gillies, and Colin Buchan retired from the Committee on 13 May 2014.
During 2014, the Committee met ten times. The Committee’s role is to approve or make recommendations to the Board in respect of the overarching Group-wide remuneration policy, including: • Rewards for the executive Directors, senior executives and the Chairman • The design and targets related to any employee share plan • The design and targets for annual cash bonus plans below the executive level • Changes to employee benefits structures (including pensions) throughout the Group.
The Chairman, Chief Executive Officer and Chief Operations Officer (who has overall responsibility for the Group's People function) are invited to attend Committee meetings on a regular basis. The Director of Group Reward and Employment Policy attends all meetings in his capacity as secretary to the Committee.
You can find details of the Group’s current remuneration policies for the Directors and senior executives as well as more information on all of the Committee’s activities during the year in the Directors’ remuneration report.
Report from the Chairman of the Corporate Responsibility Committee “The Corporate Responsibility Committee has provided oversight over sustainability issues and reported its findings and recommendations to the Board. I am pleased to present my report on the work and operation of the Committee during the year”. Sir Gerry Grimstone, Chairman
The Committee members are Sir Gerry Grimstone (Chairman), Crawford Gillies, Lynne Peacock and David Nish.
In 2014, the Committee met twice and provided guidance on the Group’s sustainability programme. It also supported the Board’s role in providing leadership on environmental and social issues. The Committee’s duties included keeping under review the Group’s sustainability strategy and policies and making recommendations to the Board on sustainability issues. During the Board effectiveness review in 2014, the Board concluded that as sustainability was central to our strategy, sustainability and corporate responsibility should form a core part of the Board’s agenda and should be reported on at each Board meeting. The Committee will therefore be stood down in early 2015.
You can find more details about the Group’s sustainability activities in Section 1.6 of the Strategic report – Our sustainable business overview and on the Group’s website at www.standardlife.com/sustainability
62 Standard Life
Report from the Chairman of the With Profits Committee of Standard Life Assurance Limited “Whilst the management of its with profits business is the direct responsibility of the Board of Standard Life Assurance Limited (SLAL), FCA regulations require that a with profits firm’s governance arrangements should make provision for independent judgement and advice. The SLAL Board has established a With Profits Committee (WPC) for this purpose. I am pleased to present my report on the work and operation of the Committee during 2014”. Niall Franklin, Chairman The Committee members are Niall Franklin (Chairman), Graham Aslet, Clifton Melvin and Ross Ainslie. The members are appointed by the SLAL Board on the recommendation of the Nomination and Governance Committee. During 2014, the WPC met seven times. Directors of the Standard Life plc and SLAL Boards and senior actuaries, in particular the UK & Europe Chief Risk Officer, the With Profits Actuary and the Actuarial Function Holder, routinely attend these meetings. SLAL has had a WPC since demutualisation. Its role is to monitor and advise the SLAL Board on the management of with profits business, providing independent judgement on the fair treatment of with profits policyholders, and to take a proactive role in raising any issues that merit further consideration. The Committee reviews all proposals that are material to the interests of SLAL’s with profits policyholders. The Committee has the authority to engage external advisers and engages with an actuary from Milliman LLP to routinely provide the members with advice. The Chairman has a right of access at all times to the Chairman of the Risk and Capital Committee but there was no requirement during the year for this right to be exercised. The Committee’s routine formal interaction with the SLAL Board is by the minutes of its meetings and by an annual report to the SLAL Board in which it reviews the management of with profits business having regard to SLAL’s duty to treat its with profits policyholders fairly and to meet their reasonable benefit expectations. The Committee has authority to make a report to the with profits policyholders. It did not do so during 2014 and would not expect to do so unless it disagreed materially with SLAL’s own annual report to its with profits policyholders (which is required by FCA regulations) on the management of the with profits business. The directors of SLAL and of the Company have an open invitation to attend any of the Committee meetings. Minutes of the Committee meetings are submitted to the Board and, in May 2014, the Committee Chairman attended a meeting of the Board at which with profits matters were discussed.
During 2014, the Committee reviewed: • The cost charged to the Heritage With Profits Fund for annuities that arise on the vesting of certain pension policies • Management of with profits assets and, in particular, the setting of investment strategy • Management of bonus rates and fair payout bases.
The Committee reviews its remit and effectiveness annually. The 2014 review was carried out by means of a self-assessment questionnaire and the Committee discussed the results of the review formally at one of its meetings. The WPC members concluded that they had used their available time effectively, focusing on the key issues and providing appropriate challenge. The Committee provides information on its composition and how the Committee protects the interests of policyholders and makes its views known at the following website www.standardlife.co.uk/1/site/uk/fund-info/with-profits/with-profits-committee
Communicating with investors The Company continues to develop a dialogue with its shareholders. As part of this, our investor relations and group secretariat teams support communication with investors. During 2014, the Group continued its programme of domestic and international presentations and meetings between the executive Directors and institutional investors, fund managers and analysts. The wide range of relevant issues discussed, in a regulatory compliant way, at investor presentations and meetings covers business strategy, financial performance, operational activities and corporate governance. The Chairman has his own investor contact programme and brings relevant issues to the attention of the Board. The Remuneration Committee also consulted with major institutional investors regarding executive remuneration during the year. More information on the consultation can be found in the Directors’ remuneration report.
The Board is equally committed to the interests of the Company’s 1.3 million individual shareholders who hold approximately 54% of the Company’s issued shares. Given this large shareholder base, it is impractical to communicate with all shareholders using the same direct engagement model we follow for our institutional investors. The Company has continued to gather and respond to shareholders’ views on the services and means of communication available to them, mainly via the Shareholder Questions mailbox and surveys conducted with shareholders contacting the shareholder helpline. Their input has informed how the Company communicates with them - particularly online - and how the Annual report and accounts, the Strategic report and the AGM guide are produced. We believe that communicating electronically with our shareholders supports our sustainability strategy, and around 430,000 shareholders receive all communications electronically. We encourage shareholders to use our share portal to access information relating to their personal shareholding and dividend history and around 300,000 have signed up to this service. Share portal participants can also change their details and dividend mandates online and receive dividend tax vouchers electronically. We also encourage our individual shareholders to hold their shares in the Standard Life Share Account where shares are held electronically in a secure environment and 85% of individual shareholders hold their shares in this way.
To give all shareholders access to the Company’s announcements, all material information reported via the London Stock Exchange’s regulatory news service is published on the Company’s website. We have continued to host formal presentations to support the release of both the full year and half year financial results together with conference calls for our two Interim Management Statements. These results-related events are also made available live on the Group’s website, with the facility for all listeners to ask questions, as well as having a permanent replay facility.
Standard Life 63
2. Governance information – Corporate governance continued
We organise several short analyst and investor events designed to give deeper insight into particular areas of our business, have created a company profile which is intended to give a high level introduction to the Group and have also created divisional profiles to give further high level insights into our business.
We also publish a monthly newsletter which features articles from senior management, to keep investors up to date on matters which may be of interest to them. These are available on the Investors section of the Group’s website. We have also maintained our Investor Relations Twitter account @sl_invrelations
The Chairman’s statement and the Strategic report in the Annual report and accounts 2014 aim to provide a balanced overall assessment of the Group’s activities, performance and prospects. This information will be supported by a presentation at the 2015 AGM – an event that provides a valuable opportunity for the Board and shareholders to communicate. Shareholders will be invited to ask questions during the meeting and have an opportunity to talk with the Directors after the formal part of the meeting. The voting results will be published on our website at www.standardlife.com after the meeting. These will include the number of votes withheld.
The 2014 AGM was held at the Edinburgh International Conference Centre on 13 May 2014. Directors were available to answer shareholders’ questions. In accordance with best practice, all resolutions were considered on a poll which was conducted by our registrars and monitored by independent scrutineers. The results, along with proxy votes lodged prior to the meeting, were made available on our website the same day. 40% of the shares in issue were voted and all resolutions were passed.
A General Meeting was held on 3 October 2014 at which shareholders were asked to consider the resolution, recommended by the Board, that Manulife’s offer to purchase our Canadian business should be accepted. Directors were available to answer shareholders’ questions and the voting procedures were consistent with our AGM process. 45% of the shares in issue were voted and the resolution was passed.
Our role as an institutional investor Standard Life Investments, the Group’s principal asset management company, understands the importance of good governance and stewardship. As a major investor, it monitors the governance of the companies it invests in. It also holds regular meetings with their senior management representatives. Standard Life Investments maintains principles and policy guidelines on corporate governance, stewardship and voting. These guidelines are applicable on a global basis. The guidelines support Standard Life Investments’ approach to engaging and to voting at shareholder meetings. Standard Life Investments also makes voting reports available to clients and publishes summary information on its website. The policy guidelines are applied pragmatically, after all relevant information has been carefully considered. When assessing the Company’s compliance with the principles and provisions of the Code, the Nomination and Governance Committee also reviewed the Company’s compliance with these principles and policy guidelines. The Committee concluded that the Company complied with the guidelines during the year.
Standard Life Investments is a strong supporter of the principles of good stewardship that are set out in the Stewardship Code, believing that it is mutually beneficial for companies and long-term investors such as Standard Life Investments to have a relationship based on accountability, engagement and trust. Standard Life Investments has made public its processes to comply with the Stewardship Code’s seven best practice principles. In line with Principle 7 of the Stewardship Code, Standard Life Investments obtains appropriate independent assurance over the policies and procedures which underpin its stewardship policy statements. You can read more about this and its governance and stewardship annual review at www.standardlifeinvestments.com
Other information You can find details of the following, as required by DTR 7.2.6, in the Directors’ report and in the Directors’ remuneration report: Share capital • Significant direct or indirect holdings of the Company’s securities • Confirmation that there are no securities carrying special rights with regard to control of the Company • Confirmation that there are no restrictions on voting rights in normal circumstances • How the Articles can be amended • The powers of the Directors, including when they can issue or buy back shares. Directors • How the Company appoints and replaces Directors • Directors’ interests in shares.
Annual review of internal control The Directors have overall responsibility for the Group’s ERM framework and system of internal control and for the ongoing review of their effectiveness. The framework is designed to manage, rather than eliminate, risk and can only provide reasonable, not absolute, assurance against material misstatement or loss. The framework covers all of the Group’s risks as set out in the ERM framework section below. GIA regularly reviews the effectiveness of internal control and the ERM framework, and reports its findings to the Audit Committee and the Risk and Capital Committee. In particular, with regard to regular financial reporting and preparing consolidated accounts, Group Finance participates in the control self-assessment and policy compliance elements of the ERM framework.
In addition, Group Finance operates a number of internal process controls around the preparation and application of methodologies used in our Group financial results.
64 Standard Life
These include: • Chairing a Technical Review Committee (TRC), attended by senior finance managers, which makes decisions on IFRS
accounting policy and reporting issues to support consistent interpretation and application across the Group • Maintaining a Group IFRS Accounting manual which details the accounting treatment to be applied during the preparation of the
financial results. Any changes to this manual are reviewed and approved by the TRC • Seeking approval from Group Finance committees, including the Financial Reporting Executive Review Group and EEV Basis
Group, for changes to certain reporting methodology, metrics and disclosures • Receiving assurance from business unit finance directors that all methodology changes have been complied with in the
preparation of the business unit results • Reviewing and challenging submissions from business unit finance teams.
In line with the Code and the further guidance in the Turnbull Report, the Board has conducted a review of the effectiveness of the risk management system which includes our system of internal control. The system was in place throughout the year and up to the date of approval of the Annual report and accounts 2014. In preparation for Solvency 2 requirements which will be introduced in 2016, the review has been expanded this year to include all elements of the system of governance as follows: • Functions (Internal Audit, Compliance, Actuarial and Risk Management) • ‘Fit and Proper’ • Boards and Committees • Outsourcing • Remuneration Policy • The ERM framework. A certification exercise was completed by each of the business unit chief executive officers, finance directors, chief risk officers and Group function executives. They were asked to confirm that: • An effectiveness review over each component of the system of governance has been conducted and that, where any material
issues had been found, recommendations have been made to restore process effectiveness. • Significant control breakdowns identified through the risk management system were reported during the year and that actions
are in place to remedy these • The external auditors had been made aware of relevant information.
In order to support these statements, business unit risk teams completed a schedule identifying the control processes supporting each of the six elements of the system of governance. Subject matter experts and process owners assessed whether the control processes were fit for purpose with output provided to business unit risk teams for review. The conclusion of these reviews was summarised in a report which was used to support the certifications. In order to support further the certifications the business unit risk teams produced reports documenting the most significant control issues during the year and the assurance activity conducted in relation to the system of internal control during the year.
These reports were reviewed by the business unit chief risk officer, chief financial officer and chief executive or Group function executives as part of their certification. Reports combining the output from these certifications were then collated by Group Risk in order that this exercise could be undertaken by the Chief Financial Officer, Chief Risk Officer and Chief Executive. Completed certifications and supporting documentation were presented to the business unit and the Group Enterprise Risk Management Committees. The results of the output from this review were presented to the Audit Committee which subsequently reported its conclusions to the Board. The internal controls relating to the joint ventures are not covered by these reports but are managed through participation on the boards and audit committees of those companies.
Going concern The Group’s business activities, together with the factors likely to affect its future development, performance and position, are set out in the Strategic report. The Strategic report includes details on our cash flow and capital management in Section 1.3 – Chief Financial Officer’s overview and our key risks in Section 1.5 – Principal risks and uncertainties. Further details of the Group's risk and capital management procedures and governance are outlined later in this section. In addition, the Group’s financial statements include notes on the Group’s borrowings and subordinated liabilities (Notes 36 and 37), management of its risks including market, credit and liquidity risk (Note 42), its contingent liabilities and commitments (Notes 46 and 47), and its capital structure and position (Note 50).
The Group continues to meet Group and individual entity capital requirements, and day-to-day liquidity needs through the Group’s available credit facilities. The Company’s revolving credit facility of £500 million was renewed on 5 March 2013 and is due to mature in March 2018. The Group has considerable financial resources together with a diversified business model, with a spread of business and geographical reach. As a consequence, the Directors believe that the Group is well placed to manage its business risks successfully.
Standard Life 65
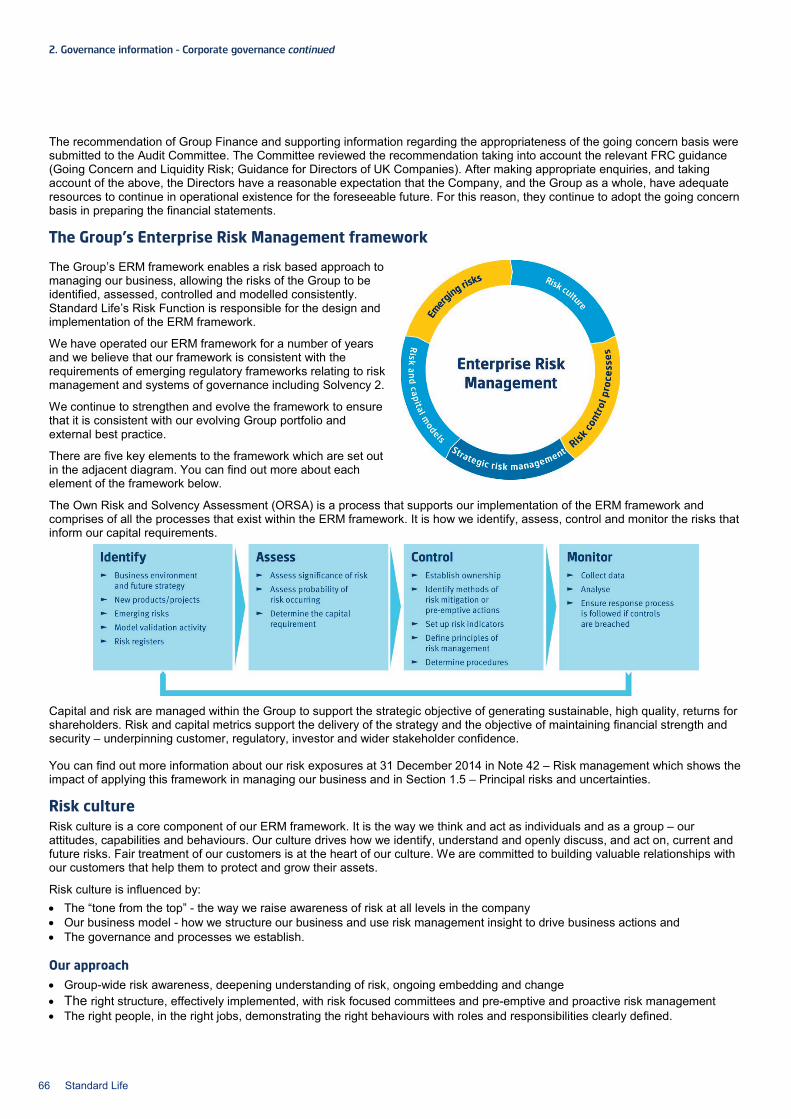
2. Governance information – Corporate governance continued
The recommendation of Group Finance and supporting information regarding the appropriateness of the going concern basis were submitted to the Audit Committee. The Committee reviewed the recommendation taking into account the relevant FRC guidance (Going Concern and Liquidity Risk; Guidance for Directors of UK Companies). After making appropriate enquiries, and taking account of the above, the Directors have a reasonable expectation that the Company, and the Group as a whole, have adequate resources to continue in operational existence for the foreseeable future. For this reason, they continue to adopt the going concern basis in preparing the financial statements.
The Group’s Enterprise Risk Management framework
The Group’s ERM framework enables a risk based approach to managing our business, allowing the risks of the Group to be identified, assessed, controlled and modelled consistently. Standard Life’s Risk Function is responsible for the design and implementation of the ERM framework.
We have operated our ERM framework for a number of years and we believe that our framework is consistent with the requirements of emerging regulatory frameworks relating to risk management and systems of governance including Solvency 2.
We continue to strengthen and evolve the framework to ensure that it is consistent with our evolving Group portfolio and external best practice.
There are five key elements to the framework which are set out in the adjacent diagram. You can find out more about each element of the framework below.
The Own Risk and Solvency Assessment (ORSA) is a process that supports our implementation of the ERM framework and comprises of all the processes that exist within the ERM framework. It is how we identify, assess, control and monitor the risks that inform our capital requirements.
Capital and risk are managed within the Group to support the strategic objective of generating sustainable, high quality, returns for shareholders. Risk and capital metrics support the delivery of the strategy and the objective of maintaining financial strength and security – underpinning customer, regulatory, investor and wider stakeholder confidence.
You can find out more information about our risk exposures at 31 December 2014 in Note 42 – Risk management which shows the impact of applying this framework in managing our business and in Section 1.5 – Principal risks and uncertainties.
Risk culture Risk culture is a core component of our ERM framework. It is the way we think and act as individuals and as a group – our attitudes, capabilities and behaviours. Our culture drives how we identify, understand and openly discuss, and act on, current and future risks. Fair treatment of our customers is at the heart of our culture. We are committed to building valuable relationships with our customers that help them to protect and grow their assets.
Risk culture is influenced by: • The “tone from the top” - the way we raise awareness of risk at all levels in the company • Our business model - how we structure our business and use risk management insight to drive business actions and • The governance and processes we establish.
Our approach • Group-wide risk awareness, deepening understanding of risk, ongoing embedding and change • The right structure, effectively implemented, with risk focused committees and pre-emptive and proactive risk management • The right people, in the right jobs, demonstrating the right behaviours with roles and responsibilities clearly defined.
66 Standard Life
Risk governance structure Our risk culture is strongly influenced by our risk governance structure including our risk committees. The Risk and Capital Committee (the RCC), is our most senior risk committee and a Committee of the Board. A full description of the attendees and objectives of the RCC can be found in the Report from the Chairman of the RCC above. At the Group Executive level the Group Enterprise Risk Management Committee (the Group ERMC) consists of the executive team which includes the Group Chief Risk Officer. The Group ERMC meets at least quarterly, and usually in conjunction with the executive team. The main role of the Group ERMC is to: • Oversee compliance with the Group’s ERM framework • Support the executive team in the management of the risk profile of the Group.
The Group ERMC is supported by the Group Credit Risk Committee which deals with all types of credit risks arising from the current and proposed activities of the Group. In addition, our internal Chief Risk Officer (CRO) Forum, comprising our business unit CROs, meets monthly to review risk matters.
Our risk function supports the operation of these risk committees (the RCC, the Group ERMC and the Group Credit Risk Committee) and provides assurance, assistance and advice to them as required. It is also responsible for providing assurance that the financial and non-financial risks inherent in business activities are identified and managed in accordance with the appetite and limits approved by the Board and relevant subsidiary boards. The function is also responsible for producing risk management information for use within the business units and for aggregation across the Group.
Three lines of defence The Group operates a ‘three lines of defence’ model of risk management, with clearly defined roles and responsibilities for committees and individuals: First line: day-to-day risk management is delegated from the Board to the Chief Executive and, through a system of delegated authorities and limits, to business managers.
Second line: risk oversight is provided by the Group CRO and established risk management committees, including the Group ERMC. These management committees are supported by the specialist Risk Management and Compliance functions across the Group.
Third line: independent verification of the adequacy and effectiveness of the internal risk and control management systems is provided by the GIA function. This is subject to supervision and challenge from the Audit Committee.
ERM reporting The risk function reviews and challenges risk reporting across the Group to ensure that accurate and adequate information is delivered to the executive team and risk committees to support their risk management mandates.
Strategic risk management Strategic risk management forms an integral part of the strategic planning process and is directly linked to the Group’s corporate objectives. This process enhances the Group’s capability to assess strategic allocation of capital and the ability to identify, monitor and manage emerging risks.
The process is based on a consideration of the general environment, the competitive environment and external events that could prevent, or impact the achievement of the strategy.
Our approach • Putting risk at the heart of our business planning • Identifying and understanding our risks and strategy and making the right decisions • Effective strategic control and allocation of capital.
The strategic, capital and business planning process links together performance management targets, capital management, and the setting of risk appetites and limits, taking into account available capital and financial strength targets to ensure our growth and projected returns reflect our risk preference.
Risk appetite framework The Group’s risk appetite framework defines the key principles under which the Group should take risks. It has eight elements - our risk strategy, risk principles, risk definitions, risk preferences, qualitative risk appetite statements, risk metrics, quantitative risk limits (setting, monitoring and managing) and roles and responsibilities. Two key elements of the framework - qualitative risk appetites and quantitative risk limits - are discussed in more detail below.
Standard Life 67
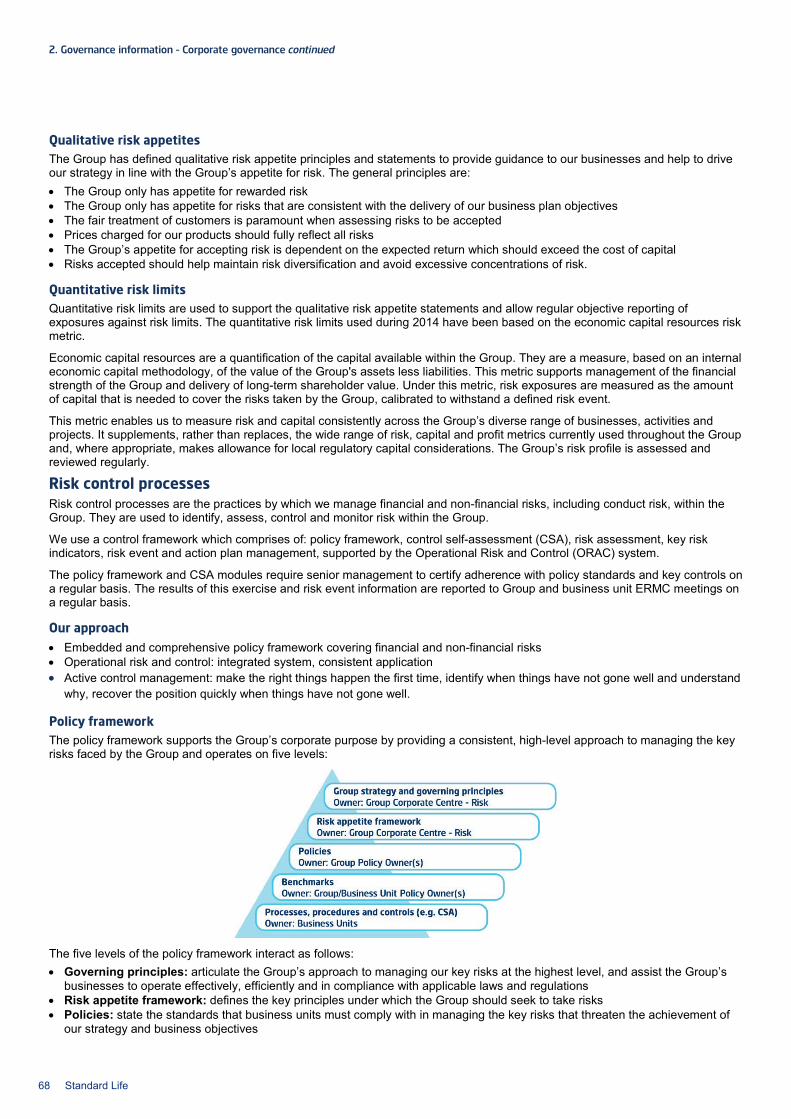
2. Governance information – Corporate governance continued
Qualitative risk appetites The Group has defined qualitative risk appetite principles and statements to provide guidance to our businesses and help to drive our strategy in line with the Group’s appetite for risk. The general principles are: • The Group only has appetite for rewarded risk • The Group only has appetite for risks that are consistent with the delivery of our business plan objectives • The fair treatment of customers is paramount when assessing risks to be accepted • Prices charged for our products should fully reflect all risks • The Group’s appetite for accepting risk is dependent on the expected return which should exceed the cost of capital • Risks accepted should help maintain risk diversification and avoid excessive concentrations of risk.
Quantitative risk limits Quantitative risk limits are used to support the qualitative risk appetite statements and allow regular objective reporting of exposures against risk limits. The quantitative risk limits used during 2014 have been based on the economic capital resources risk metric. Economic capital resources are a quantification of the capital available within the Group. They are a measure, based on an internal economic capital methodology, of the value of the Group's assets less liabilities. This metric supports management of the financial strength of the Group and delivery of long-term shareholder value. Under this metric, risk exposures are measured as the amount of capital that is needed to cover the risks taken by the Group, calibrated to withstand a defined risk event.
This metric enables us to measure risk and capital consistently across the Group’s diverse range of businesses, activities and projects. It supplements, rather than replaces, the wide range of risk, capital and profit metrics currently used throughout the Group and, where appropriate, makes allowance for local regulatory capital considerations. The Group’s risk profile is assessed and reviewed regularly.
Risk control processes Risk control processes are the practices by which we manage financial and non-financial risks, including conduct risk, within the Group. They are used to identify, assess, control and monitor risk within the Group.
We use a control framework which comprises of: policy framework, control self-assessment (CSA), risk assessment, key risk indicators, risk event and action plan management, supported by the Operational Risk and Control (ORAC) system.
The policy framework and CSA modules require senior management to certify adherence with policy standards and key controls on a regular basis. The results of this exercise and risk event information are reported to Group and business unit ERMC meetings on a regular basis.
Our approach • Embedded and comprehensive policy framework covering financial and non-financial risks • Operational risk and control: integrated system, consistent application • Active control management: make the right things happen the first time, identify when things have not gone well and understand
why, recover the position quickly when things have not gone well.
Policy framework The policy framework supports the Group’s corporate purpose by providing a consistent, high-level approach to managing the key risks faced by the Group and operates on five levels:
The five levels of the policy framework interact as follows: • Governing principles: articulate the Group’s approach to managing our key risks at the highest level, and assist the Group’s
businesses to operate effectively, efficiently and in compliance with applicable laws and regulations • Risk appetite framework: defines the key principles under which the Group should seek to take risks • Policies: state the standards that business units must comply with in managing the key risks that threaten the achievement of
our strategy and business objectives
68 Standard Life
• Benchmarks: state how each business unit will demonstrate policy compliance through providing appropriate evidence for each policy standard, in terms of processes, controls and communications
• Processes, procedures and controls: designed and implemented by business units to help ensure compliance with the standards set out in the policy.
The policy framework helps ensure that all of the Group’s businesses operate effectively, efficiently and comply with all applicable laws and regulations. Examples of how we use the policy framework in practice are set out three case studies below.
Conduct Risk Conduct risk is the risk that through our culture, strategies, decision making and behaviours we do not deliver fair outcomes for our customers. We have no appetite for behaviours and decisions that knowingly lead to unfair customer outcomes.
Our Conduct Risk Policy sets out the ways we make sure that wherever in the world we operate, we manage our conduct risk by ensuring that our customers are treated with consideration and fairness. Key principles include that: • We have no appetite for behaviours and decisions that knowingly lead to unfair customer outcomes • We will place the fair treatment of customers central to our culture • All propositions and services will be designed and reviewed in line with the needs of the identified target customers.
Tax policy and risk management As part of the policy framework, the Group operates the Tax Risk and Transfer Pricing Policy which supports the delivery of the Group’s business objectives. The key principles of this policy are: • The principles apply to all taxes and levies payable by the Group or operated/collected by the Group on behalf of governmental
authorities • We will be compliant with all legally required reporting, disclosures and approvals and will pay all tax that we consider to be
legally due in any territory acting in an open, honest and transparent manner with tax authorities and other relevant bodies at all times
• Tax shall be managed and controlled within a commercial context so that all transactions and arrangements must have a business purpose and commercial rationale
• We shall lobby and seek to influence applicable industry bodies or associations, governments and other external bodies (such as the Organisation for Economic Co-operation and Development and the EU) in the interests of all our stakeholders including customers, shareholders and employees.
The Group pro-actively manages tax risks and employs an experienced in-house tax team to oversee the tax affairs of the Group who report the Group's tax position and material tax issues to the Audit Committee.
In addition, the Group participates in the development of tax policy and legislation through engagement with tax authorities on tax consultations and involvement with representative bodies such as the Association of British Insurers and the Investment Association in alignment with our business strategy and to promote a stable environment for long term savings and investments.
Environmental, social and governance risks Our sustainability strategy is fundamental to our strategic purpose of helping to build a more prosperous world. It helps us ensure we effectively manage the environmental, social and governance (ESG) risks and recognise the opportunities that may affect the Company’s short and long term value. Details of the strategy and how we measure our progress are included in Section 1.6 of the Strategic report - Our sustainable business overview. The strategy is underpinned by our code of business conduct and ERM and policy frameworks. The following details some of our main policies and activities that support this strategy: • Our Conduct Risk policy sets out the ways we help make sure that wherever in the world we operate, we treat our customers
with consideration and fairness • Through our Tax Risk and Transfer Pricing policy, we set out our approach to managing tax risks including our disclosures,
transparency and reputational impacts • We remain committed to minimising financial crime. We have an Anti-Financial Crime & Anti-Bribery policy to protect the
Company and our customers’ information and assets, which also promotes a ‘zero tolerance’ approach to financial crime, bribery and corruption
• Our Health & Safety policy sets out our commitment to creating a safe and healthy environment for our people. This includes safety on our premises, employee health and wellbeing, and our approach to flexible working time
• Our Environment policy is in place to ensure that we minimise, as far as reasonably possible, the environmental impacts we have through our business activities. This includes minimising our greenhouse gas emissions, the waste we produce and the paper we use
• Through our Community Investment policy, we aspire to contribute actively to our communities in a positive and sustainable way. The policy lets our people know what is expected of them and provides guidance on which charities we can support.
You can read more about our sustainability strategy by visiting www.standardlife.com/sustainability
Standard Life 69
2. Governance information – Corporate governance continued
Risk and capital models The risk and capital models section of the ERM framework covers the models that we use to measure our risk exposures and capital position and the work that we do to test and understand the sensitivity of these positions. The models and the insight that they provide are integral to managing the business.
Our approach • Modelling and understanding our business • Managing complexity, achieving consistency and clarity with common metrics • Risks effectively quantified and business fully profiled.
Consistency of measurement The Group continually strives to enhance its internal risk and capital models. Our main objective is to improve the consistency of the quantitative measurement of risk and use of capital across all businesses.
Within our model, the capital of the Group is quantified according to the Economic Capital metric as described above. Businesses plan their capital consumption using internally agreed targets, which are set to ensure that strategic objectives can be delivered under a wide range of market and trading conditions. The risk exposures of the business units are assessed in response to specific risk events, covering the full range of risks to which the Group is exposed.
Stress and scenario testing programme We carry out a group-wide programme of stress and scenario testing to ensure that the Board and senior management have a strong understanding of the risks that the Group is running and their potential impact, the consequent capital requirements, and appropriate potential mitigating actions. Considered as a whole, the stress and scenario testing programme within Standard Life gives a wide-ranging picture of the range of risks run by the Group and the consequent capital requirements. It aims to ensure that the Group would have sufficient assets to meet its liabilities even after a range of severe scenarios.
Emerging risk management The aim of the emerging risk management component of the ERM framework is to identify risks before they emerge and to plan so that we are able to respond quickly as they become an active business concern. As part of this process we use our emerging risk process to inform reverse stress testing and capital adequacy requirements across the Group.
Our approach • Defined process for the identification of emerging risks • Supported by reverse stress testing of business plans • Raising awareness at executive level and across the Group.
Emerging Risk Process The Group has defined a clear and simple process for identifying and managing emerging risks which includes: • The identification of emerging financial and non-financial risks including Environmental, Social and Governance Risks • The creation of action plans and identification of early warning indicators • The effective management of emerging risks by the appropriate risk committee • The passage of any risks identified into ‘business as usual’ processes where appropriate.
Reverse Stress Testing Reverse stress testing and analysis is a key component of the emerging risk process. Reverse stress testing serves to enhance our risk processes by subjecting our business plans to a combination of stress events. This enables us to take a forward-looking view of risks driven by our business model along with any capital implication associated with these risks.
70 Standard Life
Directors’ remuneration report This report sets out the policies that will govern what and how we pay the Directors of Standard Life plc in the future and what we paid them in 2014. Where tables and charts in this report have been audited by PricewaterhouseCoopers LLP we have marked them as ‘audited’ for clarity.
Remuneration Committee Chairman’s statement Introduction I am pleased to present the Remuneration Committee’s report on Directors’ remuneration for the year ended 31 December 2014. This sets out our remuneration policy for the Directors and how our remuneration policy was applied during 2014.
The Group has had another strong year, delivering increased growth in underlying performance, Group operating profit before tax and Group operating return on equity from continuing operations. Furthermore, 2014 has been a pivotal year in the development of the Group as a global investment solutions provider. This development has been accelerated through the acquisition of Ignis and the planned sale of our Canadian business to Manulife which completed on 30 January 2015. The sale of our Canadian business was the most significant of these corporate actions in terms of size.
As a result of the scale of these corporate actions the Remuneration Committee has determined that it is appropriate to restate the financial performance targets for the long-term incentive plans and 2014 annual bonus award to account for the changes in the structure of the Group.
Performance targets The Remuneration Committee considered that the targets previously set for the long-term incentive plans and 2014 annual bonus plan had become inappropriate for rewarding our executives for the delivery of our goal of driving shareholder value. These targets were based on budgets set, and structures in place, prior to the decisions to proceed with the corporate actions noted above. As such, whilst the Remuneration Committee will continue to drive performance through the existing incentive plans, we have restated the performance targets set for the awards on a plan by plan basis. We have adjusted the targets for the awards made in 2012 and 2013 under the Group Long-Term Incentive Plan (Group LTIP) which are based on Group operating profits in the final year of the three-year performance periods and the targets for the awards made in 2014 under the Standard Life plc Executive Long Term incentive plan (Executive LTIP). We have also adjusted the targets for the 2014 annual bonus scheme. In addition, the awards made in 2012, 2013 and 2014 under the Standard Life Investments Long-Term Incentive Plan (Standard Life Investments LTIP) have been adjusted.
Leading up to and during 2014 the key objective in relation to the sale of the Canadian business, was to seek to maximise shareholder value through aligning actions and decisions to support a possible sale. As a result, the Board determined that certain initiatives and activities which would have positively impacted the Canadian business operating profit, and would have been reflected in the assessment of performance in terms of the incentive plans, should not proceed, as these may have impacted the sales process or the shareholder value to be generated. As a consequence, compared to the Group LTIP target set in 2012, a significant reduction in operating profit for the Canadian business was expected in 2014, and a smaller although still significant reduction was also expected for the Canadian business compared to the 2014 annual bonus targets set in 2013.
In respect of the 2012 Group LTIP awards the Remuneration Committee discussed a number of methods of adjustment, including attempting to restate the targets as if our Canadian business had not been sold, and trying to estimate the impact of the various management actions and business opportunities that did not proceed. However, given the complexity and subjectivity involved in making such adjustments, and with the 2012 target being based only on the profits in 2014, we decided that the most appropriate and transparent methodology for adjustment was to remove the 2014 operating profits of the Canadian business from both the target and the 2014 financial results used to determine the vesting of the 2012 award.
Whilst the principal driver behind the restatement of the targets is the sale of the Canadian business, given the increasing importance of the Newton Private Client business acquisition (which is now part of Standard Life Wealth); the Ignis acquisition and the joint ventures in delivering our strategy as a global investment solutions provider, we considered it was appropriate to include these businesses in the restated targets at the same time. The restated targets for the 2012 and 2013 Group LTIP will include Ignis and Newton Private Client business. The 2014 Executive LTIP restated targets will include Ignis (the Newton Private Client business was already in the original target). The joint ventures will be included in the restated targets for the 2013 Group LTIP and 2014 Executive LTIP.
In summary, the adjustments made to the 2014 Group operating profit targets and results for the 2012 Group LTIP, which vests in March 2015, are as follows: • Removal of Canadian business, sold in January 2015 • Inclusion of Ignis, acquired in July 2014 • Inclusion of Newton Private Client business, acquired in September 2013 • Removal of interest income no longer receivable due to Canadian capital restructuring.
In relation to the 2014 Group annual bonus plan the following adjustments have been made to the targets and results: • Removal of Canadian business, sold in January 2015 • Inclusion of Ignis, acquired in July 2014. Further details of the adjustments made to the targets for the 2013 Group LTIP and the 2014 Executive LTIP awards and details of the restated Group and Executive LTIP targets are provided on pages 91 to 94.
Standard Life 71
2. Governance information – Directors’ remuneration continued In respect of Standard Life Investments, the adjustments made to the targets and results for the 2012 and subsequent Standard Life Investments LTIP awards are as follows: • Removal of Canadian business, sold in January 2015 (in line with the approach taken for the 2012 Group LTIP) • Inclusion of Ignis, acquired in July 2014 • Inclusion of Standard Life Wealth, accounted for within Standard Life Investments from January 2014 • Use of earnings before interest, tax, depreciation and amortisation (EBITDA) rather than earnings before interest and tax (EBIT).
As a result of the impact on the Standard Life Investments’ balance sheet of the acquisition of Ignis and transfer in of Standard Life Wealth the profit measure has been amended from EBIT to EBITDA as we believe this is more reflective of the day to day performance of the business.
The expected IFRS gain on the sale of the Canadian business will be reflected in non-operating profit and will therefore not be included in the performance assessment of any long-term incentive plan or annual bonus plan.
In determining the adjustments detailed above the Remuneration Committee considers that the restated performance targets will not be materially less difficult to satisfy than the original performance targets.
The Remuneration Committee values the opportunity to listen to our shareholders’ views and is committed to maintaining an open and transparent dialogue with shareholders on executive remuneration. We therefore undertook an extensive consultation exercise with our major institutional shareholders prior to determining the LTIP and bonus plan performance target restatements, involving a number of face to face meetings, to inform our approach.
During the consultation, investors recognised the significant value of the corporate actions undertaken by the Company. They were also largely supportive of the proposed approach to the restatement and acknowledged that other methods of restatement were more complicated and less transparent. There was also an understanding that these are exceptional circumstances in terms of the scale of corporate actions and their impact on targets and value creation for shareholders.
How our remuneration policy was applied in 2014 Given the performance delivered in 2014 relative to the restated 2012 Group LTIP targets, the operating profit measured against the restated 2012 target is above the maximum resulting in 100% vesting of the award. In addition, the Remuneration Committee determined that the awards granted in 2012 under the Standard Life Investments LTIP, measured against the restated targets, should vest at 83.6% of the maximum award.
Before confirming the levels of vesting the Remuneration Committee considered whether it believed that these vesting levels reflected the underlying performance of the Group. As part of these discussions the Remuneration Committee took into account the following indicators of underlying Group performance: • The strong performance of the remaining portfolio of businesses, principally the UK business and Standard Life Investments,
which have delivered against the stretch targets, adjusted as detailed above, which were set for them 3 years ago with significant outperformance of Standard Life Investments against the targets
• As detailed above the Canadian business operating profit has been removed from the Group targets, due to the impact of the sale on the 2014 operating profit numbers. However the Remuneration Committee considered that as an individual business unit over the 3 years to 2014 the Canadian business has contributed aggregate operating profits which exceed the budgets set in 2011 for 2012 to 2014.
• The level of dividends and capital returns to shareholders which since 2010 has been £3.5bn (147p per share) made up of £1.5bn ordinary dividends paid, £0.3bn special dividend paid in 2013 and the approximate £1.75bn return of value proposed from the sale of the Canadian business
• The impact of the sale which is consistent with the Group’s strategic focus on investment solutions and brings a new distribution partnership with Manulife.
Having considered the above factors the Remuneration Committee determined these vesting levels appropriately reflected the performance of the Group, the overall shareholder value delivered to investors and the strategic value created by the sale of the Canadian business.
For purposes of transparency, the Remuneration Committee can confirm that an indicative vesting of approximately 28% would have been achieved for the 2012 Group LTIP based on the original targets, including Canadian business performance, but restated for the acquisitions of Ignis and Newton Private Client, and the Canadian capital restructuring. This indicative vesting level does not consider other factors which have impacted the Canadian results, including management actions and business opportunities which could have been executed in 2014 if the sale process had not commenced. Therefore, as explained above, due to the complexity and subjectivity involved in attempting to restate the targets as if the Canadian operations had not been sold, and the significant strategic shareholder value created by the sale, it was decided that the most appropriate methodology was to remove the 2014 operating profit of the Canadian business from both the target and the 2014 financial results used to determine the vesting of the 2012 award.
As detailed in the circular to shareholders we do not expect to make any adjustment to the number of shares over which participants have options or awards following the capital reorganisation and it is expected that the return of value and share capital consolidation will achieve a largely neutral position for holders of options.
Reflecting on the strong financial and non-financial performance including the delivery of the strategic objectives, the Remuneration Committee decided to approve payments under the Group annual bonus, for 2014, of 94.86% of the Chief Executive’s (CE) maximum potential bonus (166% of salary), 89.8% of the Chief Finance Officer’s (CFO) maximum potential bonus
72 Standard Life

(134.7% of salary), pro-rated for the period of employment during 2014 and, for the Chief Executive, Standard Life Investments (CE, Standard Life Investments) of 95.5% of his maximum potential bonus (57.3% of salary). In addition, the Remuneration Committee approved a total of 100% of the CE, Standard Life Investments maximum potential bonus (305% of salary) under the Standard Life Investments annual bonus arrangement. The Remuneration Committee reviews the way that the performance has been achieved and receives formal input from the Risk and Capital Committee to assist with its deliberations. This is in order to ensure that the performance has been achieved in a manner consistent with the Group’s risk strategy and is an appropriate reflection of the Group’s performance. The total remuneration in respect of 2014 for the CE is £5,473k, the CFO is £1,305k (for the period from 18 August 2014), and for the CE, Standard Life Investments is £5,272k reflecting the strong performance of the Group. The breakdown is set out on page 87 of this report.
In setting salaries for 2015 for the executive Directors, the Remuneration Committee considered the individual’s skills and performance; the size, complexity and responsibility of the role and the context of the anticipated salary increases to be awarded to employees across the Group. In recognition of his personal performance, and the typical level of salary increases across Standard Life, the Chief Executive has been awarded a 3.1% increase moving his base salary from £810,000 to £835,000 from 16 March 2015. The salary for the CFO, who joined the group on 18 August 2014, will remain unchanged at £600,000.
In setting the salary for the CE, Standard Life Investments, the Remuneration Committee considered the significant increase in size, complexity and responsibilities of the role, specifically the following:
• The role of Standard Life Investments in the development of a well-diversified global asset management business, which is one of the key growth engines for the group
• The organic growth and significantly expanded international reach of the Standard Life Investments business and growth of Standard Life Investments’ Assets Under Management and third party business
• The inorganic growth of Standard Life Investments with the successful acquisitions of Ignis and the transfer in of Standard Life Wealth and Newton’s private client management businesses into Standard Life Investments which has resulted in the creation of private market, liquid-alternatives and high net worth capabilities alongside the active management platform
• The continued expansion of our global distribution and extension of our global network of strategic partners, John Hancock and Manulife in North America, Sumitomo Trust and HDFC AMC in Asia.
The Remuneration Committee considers that given the above, a base salary adjustment from £450,000 to £500,000 (11.1%) reflects the growth and transformation of Standard Life Investments that has already taken place as well as the increasing importance of Standard Life Investments within the Group.
Remuneration policy Our remuneration policy report is set out on pages 75 to 86 and we propose that, subject to shareholder approval, the policy is effective from 12 May 2015 – the date of the 2015 Annual General Meeting (AGM).
During 2014 we have reviewed the remuneration policy as it relates specifically to the CE, Standard Life Investments. We are proposing the removal of the discretion for the Remuneration Committee to make an award in excess of the maximum bonus payable under the Standard Life Investments’ company bonus plan in the event that stretch targets are exceeded. We are also introducing additional bonus deferral which will apply to the Standard Life Investments’ personal and company bonuses. Details of the deferral, which will apply to bonuses paid from 2016 onwards, are provided in the Directors’ remuneration policy.
Furthermore, to support our transition to becoming a global investment solutions provider and to create alignment across our most senior leadership population we are proposing, for this population, the application of a consistent long-term incentive arrangement. In order to be able to provide a consistent long–term incentive arrangement across the leadership population two rule changes to the Executive LTIP plan rules are proposed.
Increase in the maximum grant value In line with the Group’s move towards becoming a global investment solutions provider, the leadership population to be covered by the Executive LTIP may include current participants in the Standard Life Investments LTIP. Currently such participants may receive awards up to 500% of base salary under that plan. In order to accommodate all possible leadership roles within the Executive LTIP a rule change, to increase the maximum award opportunity under the Executive LTIP from 300% to 500%, is proposed. Standard Life Investments’ participants would continue to be subject to Standard Life Investments related performance conditions to maintain their alignment to the performance of that business. Subject to the rule change being approved it is the intention of the Remuneration Committee to grant one award under the Executive LTIP to the CE, Standard Life Investments, instead of the current 200% under each of the Executive LTIP and the Standard Life Investments LTIP. This will be for grants from 2016 onwards. Performance conditions related to the performance of Standard Life Investments will continue to apply to awards made to the CE, Standard Life Investments in addition to Group performance conditions.
The rule change is not intended to result in changes to the overall grant level to participants. We are not changing the quantum of awards made to executive Directors and will not do so without consulting with our major institutional investors.
Standard Life 73
2. Governance information – Directors’ remuneration continued Deferral into funds A rule change to allow for the ability to make awards in the form of Standard Life Investments’ funds as well as over Standard Life plc shares is proposed. The intention behind this rule change is to accommodate any future regulatory change which requires remuneration to be deferred into funds. For the executive Directors, shares will continue to be the preferred deferral vehicle.
At the same time as consulting on the restatement of the performance targets with our investors, we also consulted on the proposed rule changes. During the consultation, investors understood and were supportive of the proposed rule changes.
A resolution to approve the amended plan rules will be put forward at the 2015 AGM. As a consequence our remuneration policy has been amended and is also subject to a resolution for approval.
I hope you will support these resolutions, which require your approval to take effect, and also the resolution to approve the Directors’ remuneration report.
Agenda for 2015 As the strategy and structure of the company continues to develop, and we continue to move to become a global investment solutions provider, during 2015 we will continue to review the remuneration arrangements for our executive Directors and the performance measures used to determine the vesting of the Standard Life plc Executive LTIP to ensure that the awards are aligned to the company’s strategy and structure. We will consult the Company’s major institutional investors as part of this review.
Lynne Peacock, Chairman, Remuneration Committee
74 Standard Life
Future policy report This section sets out the remuneration policy for executive Directors and non-executive Directors, which is subject to a binding vote of shareholders and will, if approved, take effect from 12 May 2015 – the date of the 2015 AGM.
Remuneration policy for executive Directors
Element
Purpose and link to strategy
Operation
Maximum opportunity
Performance metrics
Base salary To provide a core reward for undertaking the role, positioned at a level needed to recruit and retain the talent required to develop and deliver the business strategy.
The Remuneration Committee sets base salaries taking into account a range of factors including: • The individual’s skills, performance
and experience • Internal relativities and wider
workforce salary levels • External benchmark data • The size and responsibility of the role • The complexity of the business and
geographical scope • Economic indicators.
Base salaries are normally reviewed annually, with any increases usually effective from March.
Base salaries may be reviewed more frequently at the discretion of the Remuneration Committee.
Salaries for executive Directors are set at an appropriate level to attract and incentivise individuals of the calibre and with the experience required.
Whilst there is no maximum salary, any increases for executive Directors will normally be in line with the typical level of increases awarded to other employees at Standard Life and will be a reflection of their performance.
The Remuneration Committee may award increases above this level in certain circumstances, such as: • Where a new recruit or
promoted employee’s salary has been set lower than the market level for such a role and larger increases are justified as the individual becomes established in the role
• Where there is a significant increase in the size and responsibilities of the executive Director’s role.
Not applicable.
Standard Life 75

2. Governance information – Directors’ remuneration continued
Element
Purpose and link
to strategy
Operation
Maximum opportunity
Performance metrics
Benefits To provide market competitive monetary and non-monetary benefits, in a cost effective manner, to assist employees in carrying out their duties efficiently.
Executive Directors are provided with a package of core benefits funded by the Company and are invited to participate, in line with other employees, in their employing company’s voluntary benefits programme which they fund themselves through salary sacrifice.
Core benefits currently provided include health screening, private healthcare, death in service protection, disability benefit and reimbursement of membership fees of professional bodies.
Where the Remuneration Committee considers it appropriate, other benefits may be provided on recruitment or relocation.
Car allowance up to a maximum of £16,585 per annum.
There is no maximum value of the core benefit package as this is dependent on the cost to the employing company and the individual’s circumstances.
In the event of recruitment or relocation additional benefits may be provided, such as: • Housing rental costs • Education allowance • Travel and
accommodation costs • Relocation costs
(including shipping costs, legal fees and stamp duty associated with the purchase of a house and other professional advice).
Such benefits would be set at an appropriate level taking into account the individual’s circumstances and typical market practice.
Not applicable.
All-employee share plans
To promote share ownership by all employees to drive performance aligned to the Company’s shareholders’ interests.
Executive Directors can participate in the all-employee share plans operated by Standard Life on the same basis as all other employees. The two current all -employee share plans are: • The Standard Life (Employee) Share
Plan • The Standard Life Sharesave Plan.
The maximum opportunity is in line with all other employees and is as determined by the prevailing HMRC rules on maximum employee payment limits.
Not applicable.
Pension To provide a competitive, flexible retirement benefit in a way that does not create an unacceptable level of financial risk or cost to the Group.
Executive Directors are auto enrolled into the Group’s defined contribution pension plan and are offered the alternative of a cash allowance.
The level of company pension contribution and level of cash allowance are reviewed periodically taking into account: • External benchmark data • Pension legislation • Other elements of the remuneration
package.
We would continue to honour defined benefit pension arrangements in the event of an individual with a contractual entitlement to such a pension benefit being promoted to an executive Director role.
Employer contribution into the Group’s defined contribution pension plan of up to 32% of salary.
Alternatively, a cash allowance of up to 30% of salary.
Not applicable.
76 Standard Life
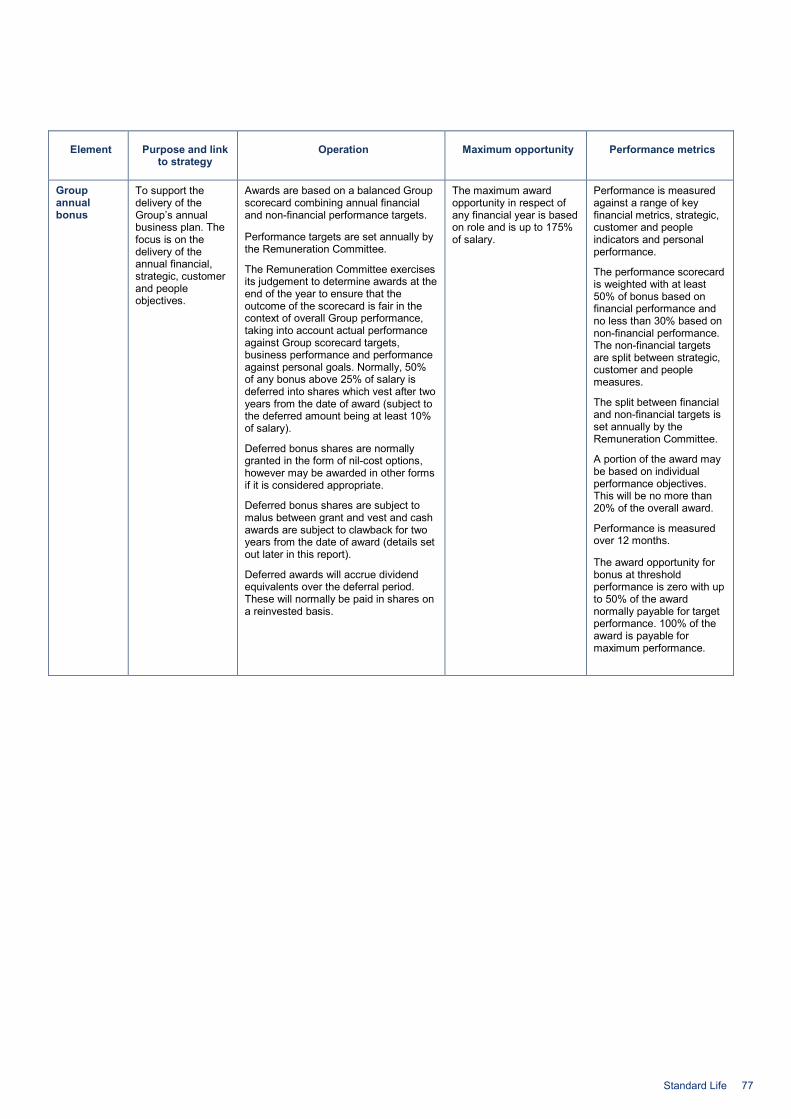
Element
Purpose and link
to strategy
Operation
Maximum opportunity
Performance metrics
Group annual bonus
To support the delivery of the Group’s annual business plan. The focus is on the delivery of the annual financial, strategic, customer and people objectives.
Awards are based on a balanced Group scorecard combining annual financial and non-financial performance targets.
Performance targets are set annually by the Remuneration Committee.
The Remuneration Committee exercises its judgement to determine awards at the end of the year to ensure that the outcome of the scorecard is fair in the context of overall Group performance, taking into account actual performance against Group scorecard targets, business performance and performance against personal goals. Normally, 50% of any bonus above 25% of salary is deferred into shares which vest after two years from the date of award (subject to the deferred amount being at least 10% of salary).
Deferred bonus shares are normally granted in the form of nil-cost options, however may be awarded in other forms if it is considered appropriate.
Deferred bonus shares are subject to malus between grant and vest and cash awards are subject to clawback for two years from the date of award (details set out later in this report).
Deferred awards will accrue dividend equivalents over the deferral period. These will normally be paid in shares on a reinvested basis.
The maximum award opportunity in respect of any financial year is based on role and is up to 175% of salary.
Performance is measured against a range of key financial metrics, strategic, customer and people indicators and personal performance.
The performance scorecard is weighted with at least 50% of bonus based on financial performance and no less than 30% based on non-financial performance. The non-financial targets are split between strategic, customer and people measures.
The split between financial and non-financial targets is set annually by the Remuneration Committee.
A portion of the award may be based on individual performance objectives. This will be no more than 20% of the overall award.
Performance is measured over 12 months.
The award opportunity for bonus at threshold performance is zero with up to 50% of the award normally payable for target performance. 100% of the award is payable for maximum performance.
Standard Life 77
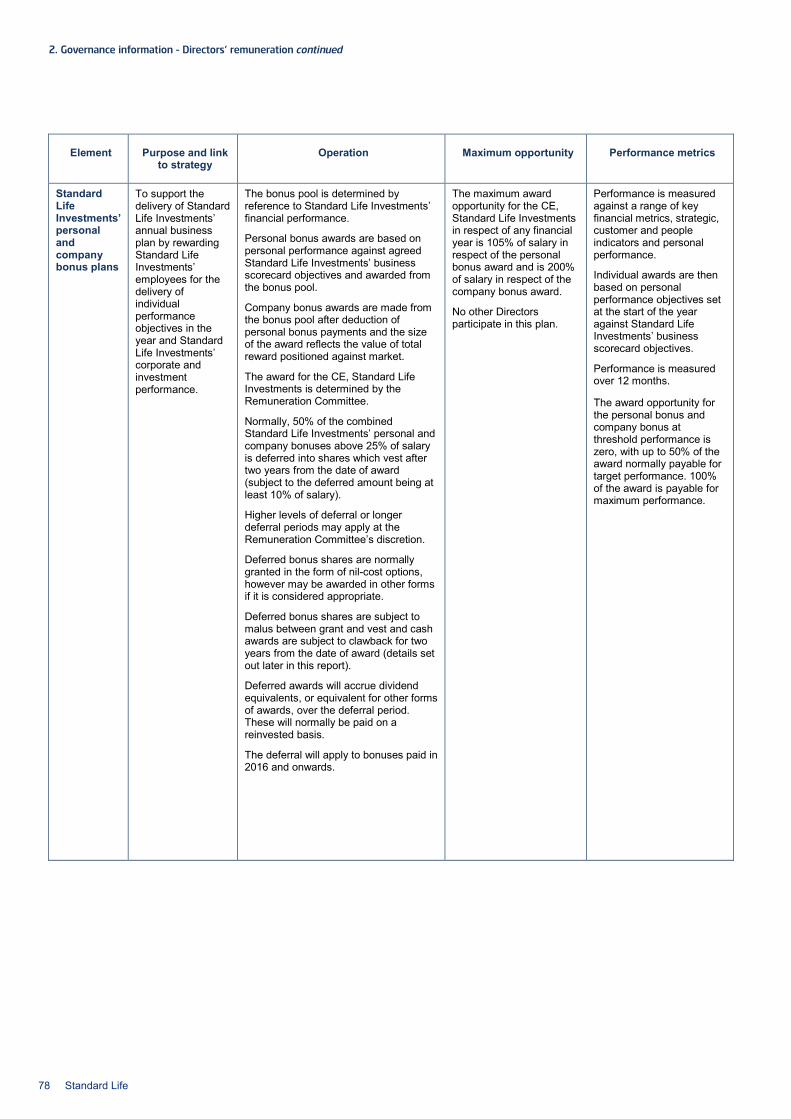
2. Governance information – Directors’ remuneration continued
Element
Purpose and link
to strategy
Operation
Maximum opportunity
Performance metrics
Standard Life Investments’ personal and company bonus plans
To support the delivery of Standard Life Investments’ annual business plan by rewarding Standard Life Investments’ employees for the delivery of individual performance objectives in the year and Standard Life Investments’ corporate and investment performance.
The bonus pool is determined by reference to Standard Life Investments’ financial performance.
Personal bonus awards are based on personal performance against agreed Standard Life Investments’ business scorecard objectives and awarded from the bonus pool.
Company bonus awards are made from the bonus pool after deduction of personal bonus payments and the size of the award reflects the value of total reward positioned against market.
The award for the CE, Standard Life Investments is determined by the Remuneration Committee.
Normally, 50% of the combined Standard Life Investments’ personal and company bonuses above 25% of salary is deferred into shares which vest after two years from the date of award (subject to the deferred amount being at least 10% of salary).
Higher levels of deferral or longer deferral periods may apply at the Remuneration Committee’s discretion.
Deferred bonus shares are normally granted in the form of nil-cost options, however may be awarded in other forms if it is considered appropriate.
Deferred bonus shares are subject to malus between grant and vest and cash awards are subject to clawback for two years from the date of award (details set out later in this report).
Deferred awards will accrue dividend equivalents, or equivalent for other forms of awards, over the deferral period. These will normally be paid on a reinvested basis.
The deferral will apply to bonuses paid in 2016 and onwards.
The maximum award opportunity for the CE, Standard Life Investments in respect of any financial year is 105% of salary in respect of the personal bonus award and is 200% of salary in respect of the company bonus award.
No other Directors participate in this plan.
Performance is measured against a range of key financial metrics, strategic, customer and people indicators and personal performance.
Individual awards are then based on personal performance objectives set at the start of the year against Standard Life Investments’ business scorecard objectives.
Performance is measured over 12 months.
The award opportunity for the personal bonus and company bonus at threshold performance is zero, with up to 50% of the award normally payable for target performance. 100% of the award is payable for maximum performance.
78 Standard Life
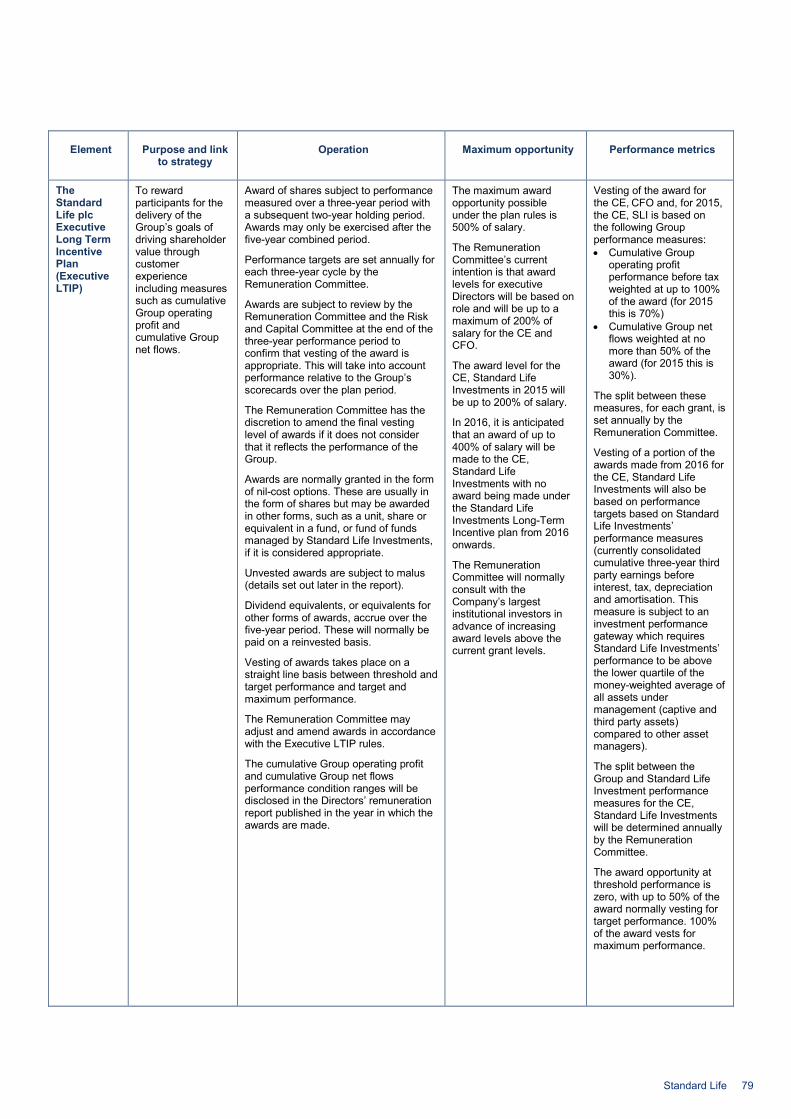
Element
Purpose and link
to strategy
Operation
Maximum opportunity
Performance metrics
The Standard Life plc Executive Long Term Incentive Plan (Executive LTIP)
To reward participants for the delivery of the Group’s goals of driving shareholder value through customer experience including measures such as cumulative Group operating profit and cumulative Group net flows.
Award of shares subject to performance measured over a three-year period with a subsequent two-year holding period. Awards may only be exercised after the five-year combined period.
Performance targets are set annually for each three-year cycle by the Remuneration Committee.
Awards are subject to review by the Remuneration Committee and the Risk and Capital Committee at the end of the three-year performance period to confirm that vesting of the award is appropriate. This will take into account performance relative to the Group’s scorecards over the plan period.
The Remuneration Committee has the discretion to amend the final vesting level of awards if it does not consider that it reflects the performance of the Group.
Awards are normally granted in the form of nil-cost options. These are usually in the form of shares but may be awarded in other forms, such as a unit, share or equivalent in a fund, or fund of funds managed by Standard Life Investments, if it is considered appropriate.
Unvested awards are subject to malus (details set out later in the report).
Dividend equivalents, or equivalents for other forms of awards, accrue over the five-year period. These will normally be paid on a reinvested basis.
Vesting of awards takes place on a straight line basis between threshold and target performance and target and maximum performance.
The Remuneration Committee may adjust and amend awards in accordance with the Executive LTIP rules.
The cumulative Group operating profit and cumulative Group net flows performance condition ranges will be disclosed in the Directors’ remuneration report published in the year in which the awards are made.
The maximum award opportunity possible under the plan rules is 500% of salary.
The Remuneration Committee’s current intention is that award levels for executive Directors will be based on role and will be up to a maximum of 200% of salary for the CE and CFO.
The award level for the CE, Standard Life Investments in 2015 will be up to 200% of salary.
In 2016, it is anticipated that an award of up to 400% of salary will be made to the CE, Standard Life Investments with no award being made under the Standard Life Investments Long-Term Incentive plan from 2016 onwards.
The Remuneration Committee will normally consult with the Company’s largest institutional investors in advance of increasing award levels above the current grant levels.
Vesting of the award for the CE, CFO and, for 2015, the CE, SLI is based on the following Group performance measures: • Cumulative Group
operating profit performance before tax weighted at up to 100% of the award (for 2015 this is 70%)
• Cumulative Group net flows weighted at no more than 50% of the award (for 2015 this is 30%).
The split between these measures, for each grant, is set annually by the Remuneration Committee.
Vesting of a portion of the awards made from 2016 for the CE, Standard Life Investments will also be based on performance targets based on Standard Life Investments’ performance measures (currently consolidated cumulative three-year third party earnings before interest, tax, depreciation and amortisation. This measure is subject to an investment performance gateway which requires Standard Life Investments’ performance to be above the lower quartile of the money-weighted average of all assets under management (captive and third party assets) compared to other asset managers).
The split between the Group and Standard Life Investment performance measures for the CE, Standard Life Investments will be determined annually by the Remuneration Committee.
The award opportunity at threshold performance is zero, with up to 50% of the award normally vesting for target performance. 100% of the award vests for maximum performance.
Standard Life 79
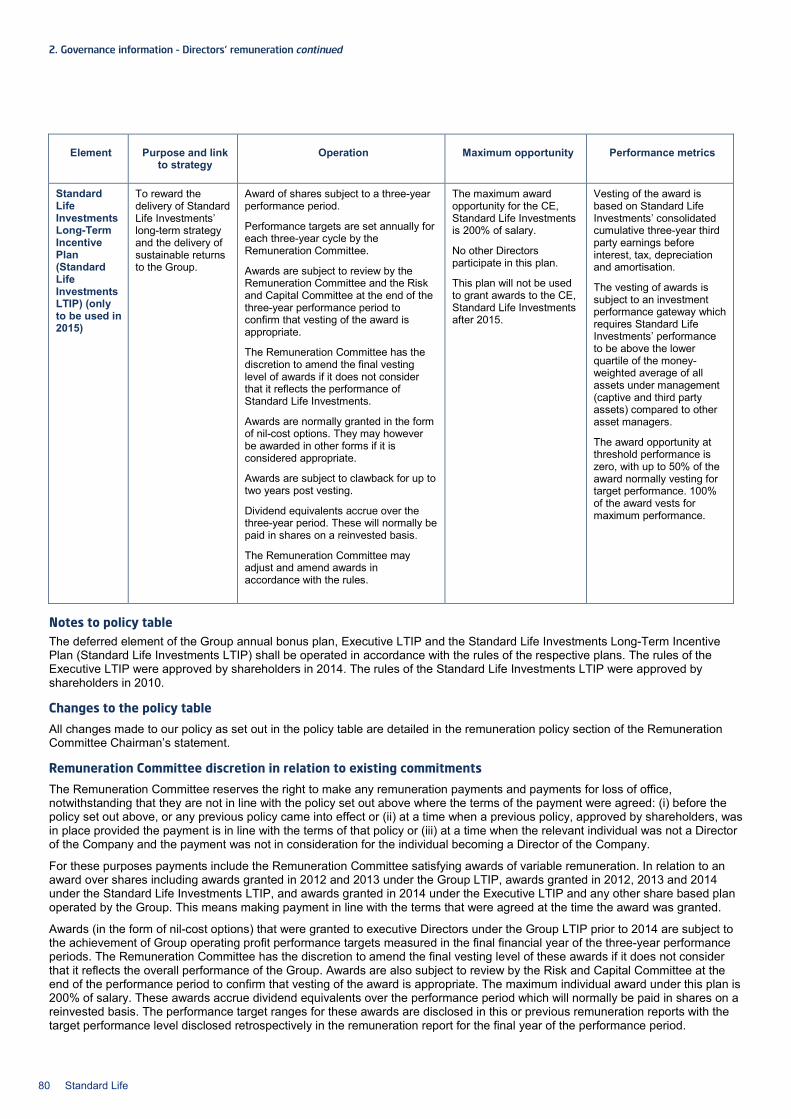
2. Governance information – Directors’ remuneration continued
Element
Purpose and link
to strategy
Operation
Maximum opportunity
Performance metrics
Standard Life Investments Long-Term Incentive Plan (Standard Life Investments LTIP) (only to be used in 2015)
To reward the delivery of Standard Life Investments’ long-term strategy and the delivery of sustainable returns to the Group.
Award of shares subject to a three-year performance period.
Performance targets are set annually for each three-year cycle by the Remuneration Committee.
Awards are subject to review by the Remuneration Committee and the Risk and Capital Committee at the end of the three-year performance period to confirm that vesting of the award is appropriate.
The Remuneration Committee has the discretion to amend the final vesting level of awards if it does not consider that it reflects the performance of Standard Life Investments.
Awards are normally granted in the form of nil-cost options. They may however be awarded in other forms if it is considered appropriate.
Awards are subject to clawback for up to two years post vesting.
Dividend equivalents accrue over the three-year period. These will normally be paid in shares on a reinvested basis.
The Remuneration Committee may adjust and amend awards in accordance with the rules.
The maximum award opportunity for the CE, Standard Life Investments is 200% of salary.
No other Directors participate in this plan.
This plan will not be used to grant awards to the CE, Standard Life Investments after 2015.
Vesting of the award is based on Standard Life Investments’ consolidated cumulative three-year third party earnings before interest, tax, depreciation and amortisation.
The vesting of awards is subject to an investment performance gateway which requires Standard Life Investments’ performance to be above the lower quartile of the money-weighted average of all assets under management (captive and third party assets) compared to other asset managers.
The award opportunity at threshold performance is zero, with up to 50% of the award normally vesting for target performance. 100% of the award vests for maximum performance.
Notes to policy table The deferred element of the Group annual bonus plan, Executive LTIP and the Standard Life Investments Long-Term Incentive Plan (Standard Life Investments LTIP) shall be operated in accordance with the rules of the respective plans. The rules of the Executive LTIP were approved by shareholders in 2014. The rules of the Standard Life Investments LTIP were approved by shareholders in 2010.
Changes to the policy table
All changes made to our policy as set out in the policy table are detailed in the remuneration policy section of the Remuneration Committee Chairman’s statement.
Remuneration Committee discretion in relation to existing commitments
The Remuneration Committee reserves the right to make any remuneration payments and payments for loss of office, notwithstanding that they are not in line with the policy set out above where the terms of the payment were agreed: (i) before the policy set out above, or any previous policy came into effect or (ii) at a time when a previous policy, approved by shareholders, was in place provided the payment is in line with the terms of that policy or (iii) at a time when the relevant individual was not a Director of the Company and the payment was not in consideration for the individual becoming a Director of the Company.
For these purposes payments include the Remuneration Committee satisfying awards of variable remuneration. In relation to an award over shares including awards granted in 2012 and 2013 under the Group LTIP, awards granted in 2012, 2013 and 2014 under the Standard Life Investments LTIP, and awards granted in 2014 under the Executive LTIP and any other share based plan operated by the Group. This means making payment in line with the terms that were agreed at the time the award was granted.
Awards (in the form of nil-cost options) that were granted to executive Directors under the Group LTIP prior to 2014 are subject to the achievement of Group operating profit performance targets measured in the final financial year of the three-year performance periods. The Remuneration Committee has the discretion to amend the final vesting level of these awards if it does not consider that it reflects the overall performance of the Group. Awards are also subject to review by the Risk and Capital Committee at the end of the performance period to confirm that vesting of the award is appropriate. The maximum individual award under this plan is 200% of salary. These awards accrue dividend equivalents over the performance period which will normally be paid in shares on a reinvested basis. The performance target ranges for these awards are disclosed in this or previous remuneration reports with the target performance level disclosed retrospectively in the remuneration report for the final year of the performance period.
80 Standard Life

Awards previously granted to the CE, Standard Life Investments under the Standard Life Investments LTIP are consistent with the remuneration policy table above.
Remuneration Committee discretion in relation to future operation of the remuneration policy
In the event of a variation of share capital, demerger, special dividend or similar event, the Remuneration Committee may adjust or amend awards in accordance with the rules of the relevant plan. The Remuneration Committee retains the discretion to amend the performance target in exceptional business or regulatory circumstances. If discretion is exercised in this way, the Remuneration Committee will consult with major shareholders as appropriate. All awards are subject to Remuneration Committee discretion and may be adjusted (or reduced to zero) where it determines that the overall level of the Company or Group performance does not warrant payment of variable remuneration, or it considers that risks (such as financial, regulatory, compliance or brand risk) have not adequately been reflected in awards.
Malus or clawback
Under the malus and clawback provisions, the Remuneration Committee can reduce awards that have not yet vested (malus) and can require the repayment of an award (clawback).
Malus or clawback may apply where stated in the policy table.
The circumstances in which malus or clawback would apply are set out below: • Where there is a material mis-statement of the Group’s financial statements through information or assumptions that are found
to be misleading prior to the date of vesting • Where there is fraud and/or any other material financial irregularity, or failure of risk management which results in material
losses being incurred • Where there is serious misconduct by a participant or team.
The Remuneration Committee will address any performance issues through their oversight of the annual Group scorecard.
No other element of remuneration is subject to malus or clawback.
Performance measures and target setting
Performance targets for the Group’s incentive arrangements are set on an annual basis by the Remuneration Committee. The Remuneration Committee takes into account a range of factors including internal business forecasts, prior year performance, degree of stretch against the performance targets in the business plan, the economic environment, market conditions and expectations.
We aim to deliver target awards for good performance. By this we mean business outcomes are delivered consistently against agreed requirements and performance expectations in terms of both what has been delivered and how this level of performance has been achieved. Maximum awards will only be earned where the performance in the Group or Standard Life Investments has significantly exceeded expectations.
The following table sets out why the performance conditions that are currently used for the annual Group performance scorecard, used to determine the Group annual bonus awards, were chosen.
Performance metric
Financial metrics Strategic metrics Customer metrics People metrics
Rationale Measures chosen to support the delivery of financial performance as set out in the Group’s annual business plan.
Measures chosen may include, but are not limited to: • Group operating profit before
tax • Operating return on equity.
Focuses management on the delivery of the business’ strategic priorities across the Group to drive improved performance in future years.
Focuses management on growing customer volumes through winning new customers and growing revenue from our existing customers which will ultimately lead, through growth in assets under management and quality revenue flows, to increasing profitability and increased shareholder value.
Develops organisational capability by building the resources for the future, and encouraging the desired behaviours.
Standard Life 81

2. Governance information – Directors’ remuneration continued The table below sets out why the performance conditions for the Executive LTIP were chosen.
Performance metric
Operating profit before tax Net flows
Rationale Chosen measure of profitability and closely linked to cash generation. A key measure of the profit the Group makes. Excludes items which create short-term volatility and that are not within management control. Targets the Group’s ability to deliver returns to the Company’s shareholders and provides an indication of the Company’s dividend paying capability.
Net flows are a measure of the assets that customers have invested with the Group during the year (premiums and deposits) minus the assets they’ve taken out (withdrawals, claims and annuity payments). This reflects the Group’s ability to win/retain business and is an indicative measure of customer satisfaction. As a result of the acquisition of Ignis and the inclusion of our overseas joint ventures in the targets, the definition of net flows has been reviewed for appropriateness and it will exclude flows arising from investment in money market and liquidity funds. These funds operate like bank accounts and customers can invest or disinvest cash with little notice and financial penalty which leads to significant volatility in the net flows and as such their inclusion is inappropriate for the purpose of rewarding growth in net flows. The net flows attributable to money market and liquidity funds will be reported each year in the Annual report and accounts.
The table below sets out why the performance conditions used in the Standard Life Investments’ personal and company bonus plan were chosen.
The following table sets out why the performance conditions for the Standard Life Investments LTIP were chosen:
Performance metric Consolidated cumulative three-year third party earnings before interest, tax, depreciation and amortisation (EBITDA).
Rationale Chosen measure of profitability which drives the growth of Standard Life Investments.
The measure has been amended to EBITDA from earnings before interest and tax (EBIT) as management believe this is more reflective of the day to day performance of the business.
Awards under the Standard Life Investments LTIP are also subject to an investment performance gateway which requires Standard Life Investments’ investment performance to be above the lower quartile of the money-weighted average of all assets under management (captive and third party assets) compared to other asset managers before the award vests. This benchmarks performance relative to other asset managers and prevents vesting for relative underperformance.
Awards will not be granted to the CE, Standard Life Investments under the Standard Life Investments LTIP after 2015. The performance conditions used in the Standard Life Investments LTIP will be included in the Executive LTIP and will apply for the CE, Standard Life Investments only.
Remuneration arrangements throughout the Group Throughout the Group the following overarching principles and practices are applied to our remuneration policy: • Remuneration is linked to performance, is transparent and is easy to understand • The policy encourages behaviours that deliver results which are aligned to the interests of the Group’s key stakeholders • Remuneration is competitive and reflects financial and personal performance and the individual’s value in the market, without
paying more than is necessary • The policy provides an appropriate balance of fixed and variable remuneration.
The scorecard used to determine annual bonuses for executive Directors is used in the determination of annual bonuses for all employees. Although the above principles apply throughout the Group, given the size of the Group and the scale of its operations, the way in which the remuneration policy is implemented varies by jurisdiction and seniority. For example participation in the Executive LTIP is at the Remuneration Committee’s discretion and is normally limited to senior management, and the Group’s defined contribution pension provision is graduated based on seniority.
Performance metric
Financial metrics Strategic metrics Customer metrics People metrics
Rationale Measures chosen to support the delivery of financial performance as set out in the Standard Life Investments’ annual business plan.
Measures chosen may include, but are not limited to: • Operating profit before tax • Earnings before interest, tax,
depreciation and amortisation (EBITDA)
• Operating return on equity.
Drives delivery against the Standard Life Investments’ strategic priorities.
Embeds a culture that places the customer at the heart of the Standard Life Investments’ business.
Embeds the Standard Life and Standard Life Investments brands to drive competitive advantage.
Continues to enhance the external profile of Standard Life Investments with key external parties.
Develops organisational capability by building resource capabilities and the behaviours needed to deliver the Standard Life Investments’ annual business plan.
82 Standard Life
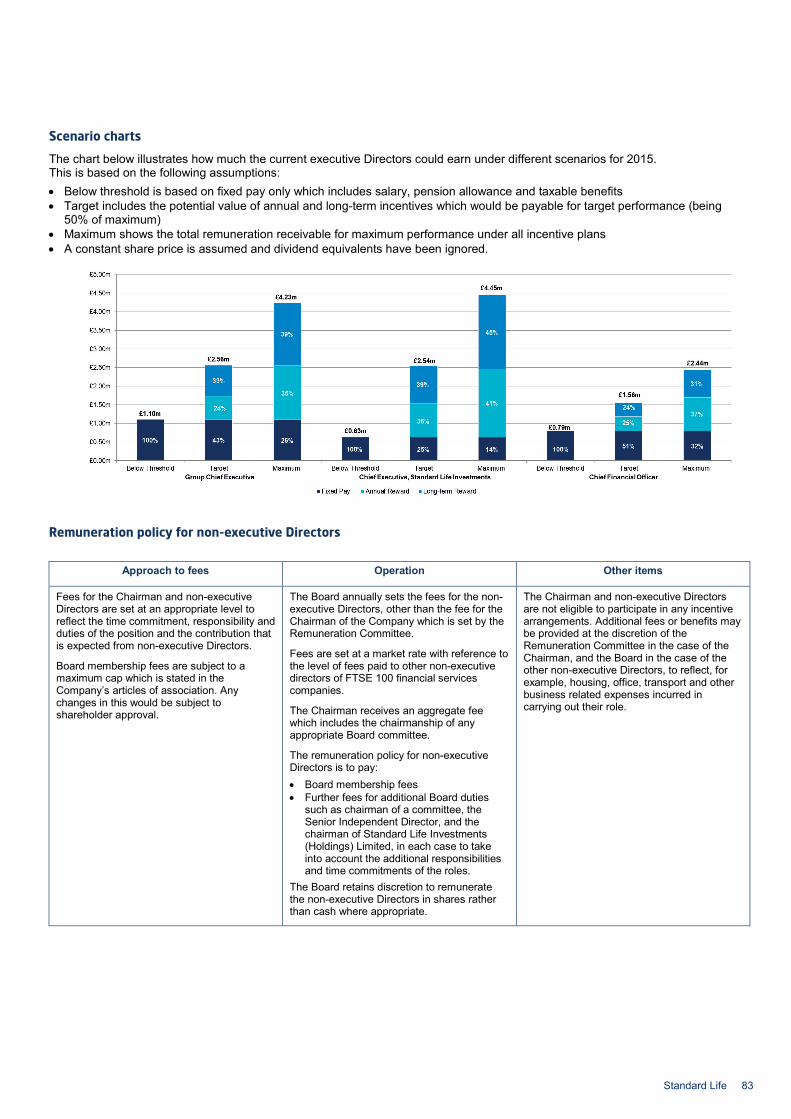
Scenario charts
The chart below illustrates how much the current executive Directors could earn under different scenarios for 2015. This is based on the following assumptions: • Below threshold is based on fixed pay only which includes salary, pension allowance and taxable benefits • Target includes the potential value of annual and long-term incentives which would be payable for target performance (being
50% of maximum) • Maximum shows the total remuneration receivable for maximum performance under all incentive plans • A constant share price is assumed and dividend equivalents have been ignored.
Remuneration policy for non-executive Directors
Approach to fees Operation Other items
Fees for the Chairman and non-executive Directors are set at an appropriate level to reflect the time commitment, responsibility and duties of the position and the contribution that is expected from non-executive Directors.
Board membership fees are subject to a maximum cap which is stated in the Company’s articles of association. Any changes in this would be subject to shareholder approval.
The Board annually sets the fees for the non-executive Directors, other than the fee for the Chairman of the Company which is set by the Remuneration Committee.
Fees are set at a market rate with reference to the level of fees paid to other non-executive directors of FTSE 100 financial services companies.
The Chairman receives an aggregate fee which includes the chairmanship of any appropriate Board committee.
The remuneration policy for non-executive Directors is to pay: • Board membership fees • Further fees for additional Board duties
such as chairman of a committee, the Senior Independent Director, and the chairman of Standard Life Investments (Holdings) Limited, in each case to take into account the additional responsibilities and time commitments of the roles.
The Board retains discretion to remunerate the non-executive Directors in shares rather than cash where appropriate.
The Chairman and non-executive Directors are not eligible to participate in any incentive arrangements. Additional fees or benefits may be provided at the discretion of the Remuneration Committee in the case of the Chairman, and the Board in the case of the other non-executive Directors, to reflect, for example, housing, office, transport and other business related expenses incurred in carrying out their role.
Standard Life 83

2. Governance information – Directors’ remuneration continued Remuneration policy for new appointments Appointment of executive Directors Principles In determining remuneration arrangements for new appointments to the Board (including internal promotions), the Remuneration Committee applies the following principles: • The Remuneration Committee takes into consideration all relevant factors, including the calibre of the individual, local market
practice and existing arrangements for other executive Directors, adhering to the underlying principle that any arrangements should reflect the best interests of the Group and its shareholders
• Remuneration arrangements for new appointments will typically align with the remuneration policy presented above • In the case of internal promotions, the Remuneration Committee will honour existing commitments entered into before
promotion • The Remuneration Committee will explain to shareholders the rationale for the relevant arrangements in the following year’s
Directors’ remuneration report; and the maximum level of bonus and long-term incentive awards which may be awarded to a new executive Director (excluding the Chief Executive, Standard Life Investments) at or shortly following recruitment shall be limited to 475% of salary. The maximum level for the Chief Executive, Standard Life Investments will be 865% of salary. These limits exclude buyout awards and are in line with the policy table above.
Components and approach The remuneration package offered to new appointments may include any element of remuneration included in the remuneration policy set out in this report, or any other element which the Remuneration Committee considers is appropriate given the particular circumstances but not exceeding the maximum level of bonus and long-term incentive awards detailed above. In considering which elements to include, and in determining the approach for all relevant elements, the Remuneration Committee will take into account a number of different factors, including (but not limited to) typical market practice, existing arrangements for other executive Directors and internal relativities, and market positioning.
Buyouts To facilitate recruitment, the Remuneration Committee may make an award to buy out remuneration terms forfeited on leaving a previous employer. In doing so, the Remuneration Committee will adhere to the FCA guidance in relation to the practice of buyout awards to new recruits and, in particular, the requirements for Code Staff (as defined by the Group’s regulators). In considering buyout levels and conditions, the Remuneration Committee will take into account such factors as the type of award and performance measures and the likelihood of performance conditions being met. The buyout award will reflect the foregone award in amount and terms (including any deferral or retention period and performance conditions) as closely as possible but within the structures and timing of equivalent Group plans. Where appropriate, the Remuneration Committee retains the discretion to utilise Listing Rule 9.4.2 (a rule, set by the United Kingdom Listing Authority, which permits an arrangement to be made without shareholder approval, specifically to facilitate, in unusual circumstances, the recruitment or retention of the relevant individual) for the purpose of making an award to ‘buy out’ remuneration terms forfeited on leaving a previous employer or to utilise any other incentive plan operated by the Group.
Appointment of non-executive Directors If a new Chairman or non-executive Director is appointed, remuneration arrangements will normally be in line with those detailed in the remuneration policy for non-executive Directors set out above.
Service Contracts Executive Directors
The executive Directors' terms and conditions of employment are detailed in individuals’ executive service contracts. In these contracts, the Remuneration Committee aims to strike the right balance between the Company's interests and those of the executive Directors, while ensuring that the contracts comply with best practice, legislation and the agreed remuneration principles. Contracts are not for a fixed term, but set out notice periods in line with the executive Director's role.
84 Standard Life
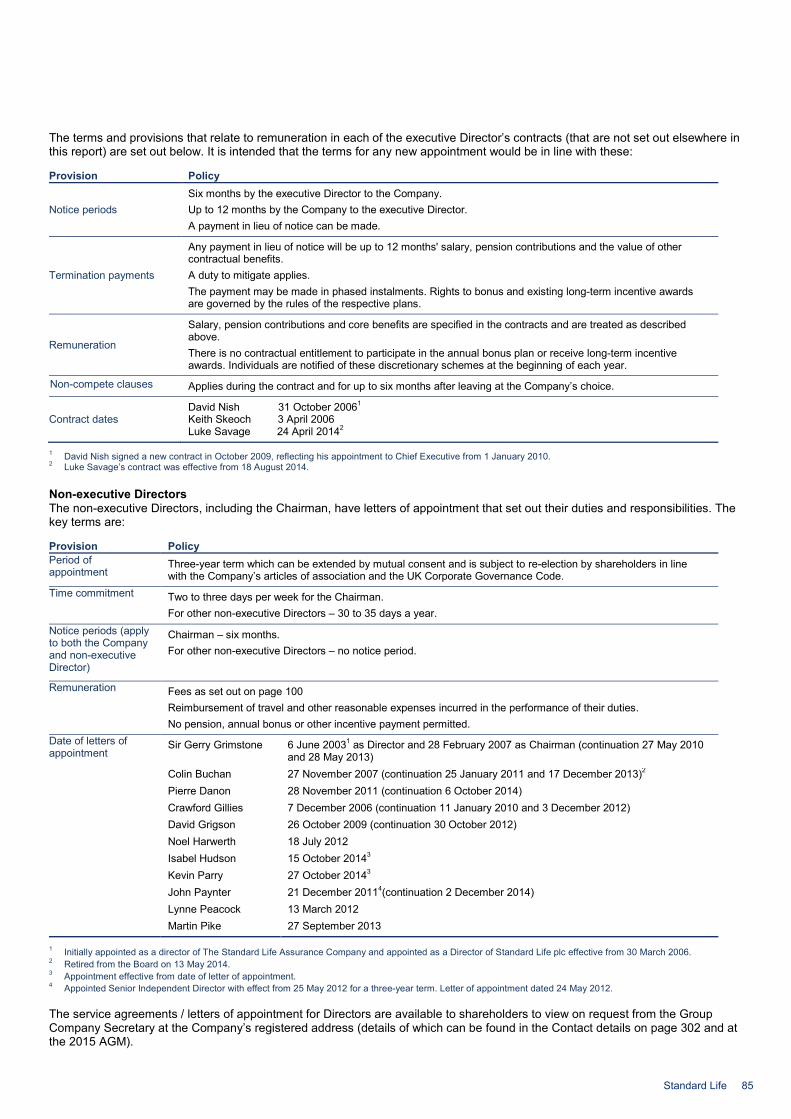
The terms and provisions that relate to remuneration in each of the executive Director’s contracts (that are not set out elsewhere in this report) are set out below. It is intended that the terms for any new appointment would be in line with these:
Provision Policy
Notice periods Six months by the executive Director to the Company. Up to 12 months by the Company to the executive Director. A payment in lieu of notice can be made.
Termination payments
Any payment in lieu of notice will be up to 12 months' salary, pension contributions and the value of other contractual benefits. A duty to mitigate applies. The payment may be made in phased instalments. Rights to bonus and existing long-term incentive awards are governed by the rules of the respective plans.
Remuneration
Salary, pension contributions and core benefits are specified in the contracts and are treated as described above. There is no contractual entitlement to participate in the annual bonus plan or receive long-term incentive awards. Individuals are notified of these discretionary schemes at the beginning of each year.
Non-compete clauses Applies during the contract and for up to six months after leaving at the Company’s choice.
Contract dates David Nish 31 October 20061 Keith Skeoch 3 April 2006 Luke Savage 24 April 20142
1 David Nish signed a new contract in October 2009, reflecting his appointment to Chief Executive from 1 January 2010. 2 Luke Savage’s contract was effective from 18 August 2014.
Non-executive Directors The non-executive Directors, including the Chairman, have letters of appointment that set out their duties and responsibilities. The key terms are:
Provision Policy Period of appointment
Three-year term which can be extended by mutual consent and is subject to re-election by shareholders in line with the Company’s articles of association and the UK Corporate Governance Code.
Time commitment Two to three days per week for the Chairman. For other non-executive Directors – 30 to 35 days a year.
Notice periods (apply to both the Company and non-executive Director)
Chairman – six months. For other non-executive Directors – no notice period.
Remuneration Fees as set out on page 100 Reimbursement of travel and other reasonable expenses incurred in the performance of their duties. No pension, annual bonus or other incentive payment permitted.
Date of letters of appointment
Sir Gerry Grimstone 6 June 20031 as Director and 28 February 2007 as Chairman (continuation 27 May 2010 and 28 May 2013)
Colin Buchan 27 November 2007 (continuation 25 January 2011 and 17 December 2013)2 Pierre Danon 28 November 2011 (continuation 6 October 2014) Crawford Gillies 7 December 2006 (continuation 11 January 2010 and 3 December 2012) David Grigson 26 October 2009 (continuation 30 October 2012) Noel Harwerth 18 July 2012 Isabel Hudson 15 October 20143 Kevin Parry 27 October 20143 John Paynter 21 December 20114(continuation 2 December 2014) Lynne Peacock 13 March 2012 Martin Pike 27 September 2013
1 Initially appointed as a director of The Standard Life Assurance Company and appointed as a Director of Standard Life plc effective from 30 March 2006. 2 Retired from the Board on 13 May 2014. 3 Appointment effective from date of letter of appointment. 4 Appointed Senior Independent Director with effect from 25 May 2012 for a three-year term. Letter of appointment dated 24 May 2012.
The service agreements / letters of appointment for Directors are available to shareholders to view on request from the Group Company Secretary at the Company’s registered address (details of which can be found in the Contact details on page 302 and at the 2015 AGM).
Standard Life 85
2. Governance information – Directors’ remuneration continued Loss of office remuneration The Remuneration Committee will consider the following factors when considering remuneration for loss of office: • The individual’s service contract and the rules of the relevant incentive plans • Circumstances of the loss of office • Performance during office • The commercial justification for any payments.
The remuneration policy for loss of office for executive Directors is as follows: • Any payment in lieu of notice will be up to 12 months' salary, pension contributions and the value of other contractual benefits • There is a duty to mitigate any termination payments • The payment may be made in phased instalments and the policy is to do this for notice periods of over six months • Rights under all-employee share plans, to bonus awards and to long-term incentive awards are governed by the rules of the
respective plans • Awards under all-employee share plans vest in accordance with their terms, under which good leavers are entitled to shares on
or shortly after cessation. Other leavers would usually forfeit awards. • Typically, for good leavers, rights to annual bonus and long-term incentive awards will be pro-rated for time in service to
termination as a proportion of the performance period and will, subject to performance, be paid at the usual time (which in the case of the Executive LTIP will normally include the holding period). Outstanding deferred share awards will typically vest in full at the date of termination.
• In certain circumstances, such as the individual’s death, the Remuneration Committee retains the discretion to accelerate payments if it is considered appropriate
• In all plans, the Remuneration Committee retains the discretion to disapply time pro-rating for good leavers (see below) and, in the case of the Group LTIP and Executive LTIP, performance pro-rating
• Typically, for other leavers, rights to annual bonus and outstanding long-term incentive awards will be forfeited • Other payments such as legal fees or outplacement costs may be paid if considered commercially appropriate.
In both the annual bonus plans’ and long-term incentive plans’ rules, the distinction is made between good leavers and other leavers. A good leaver is someone whose employment comes to an end because of death, ill health, injury, disability, redundancy or retirement as determined by their employing company, sale of the employing company or business or any other circumstance at the discretion of the Remuneration Committee. For the purposes of the Standard Life Investments LTIP, a good leaver may also include an individual who is transferred out of Standard Life Investments to another company in the Group. In determining whether an individual is a good leaver, the Remuneration Committee will exercise its judgement in a manner which seeks to be in the Company’s interests taking into account all relevant factors in relation to the departure. Where judgement has been exercised, the Remuneration Committee would provide an explanation in the following year’s Directors’ remuneration report.
In the event of a change of control, executive Directors may receive a cash bonus in respect of the year in which the change of control occurs which, unless the Remuneration Committee determines otherwise, will be time pro-rated by reference to the bonus year. Outstanding deferred share awards will typically vest in full. Long-term incentives will normally vest early, taking into account the extent to which any relevant performance conditions have been met and, unless the Remuneration Committee determines otherwise, the time that has elapsed from the beginning of the relevant performance period. If the Company undergoes a winding up or is subject to a demerger, delisting, special dividend or other event which in the opinion of the Remuneration Committee may affect the current or future share price, the Remuneration Committee may allow awards to vest on the same basis as for a change of control.
The treatment of other awards in the event of a change of control will be in line with the relevant plan rules as approved by shareholders.
There is no provision for compensation payments for loss of office for non-executive Directors.
Considering conditions elsewhere in the Group When setting the policy for executive Directors’ remuneration, the Committee takes into account the pay and employment conditions elsewhere within the Group, recognising international variance and jurisdictional differences, where appropriate. The Remuneration Committee is informed about the approach on salary increases, group-wide benefit offerings including pensions, the structure of incentive arrangements and distribution of outcomes throughout the wider organisation, as well as the take-up of all-employee share plans, employee engagement survey results and staff morale.
The Remuneration Committee does not consider it appropriate to consult employees in the Group on the remuneration policy for executive Directors. However, the Group engages with its employee associations from an early stage in the annual remuneration cycle. The areas discussed include: external relativities, economic factors, employee expectations and congruence of executive pay with that of the wider workforce in terms of overall pay budgets and approach.
Consideration of shareholder views The Remuneration Committee values the opportunity to listen to the Company’s shareholders. As explained in the Remuneration Committee Chairman’s statement, major institutional shareholders were consulted in respect of the amendments proposed to the Executive LTIP rules and restatement of targets for the outstanding Group and Executive LTIP awards.
86 Standard Life
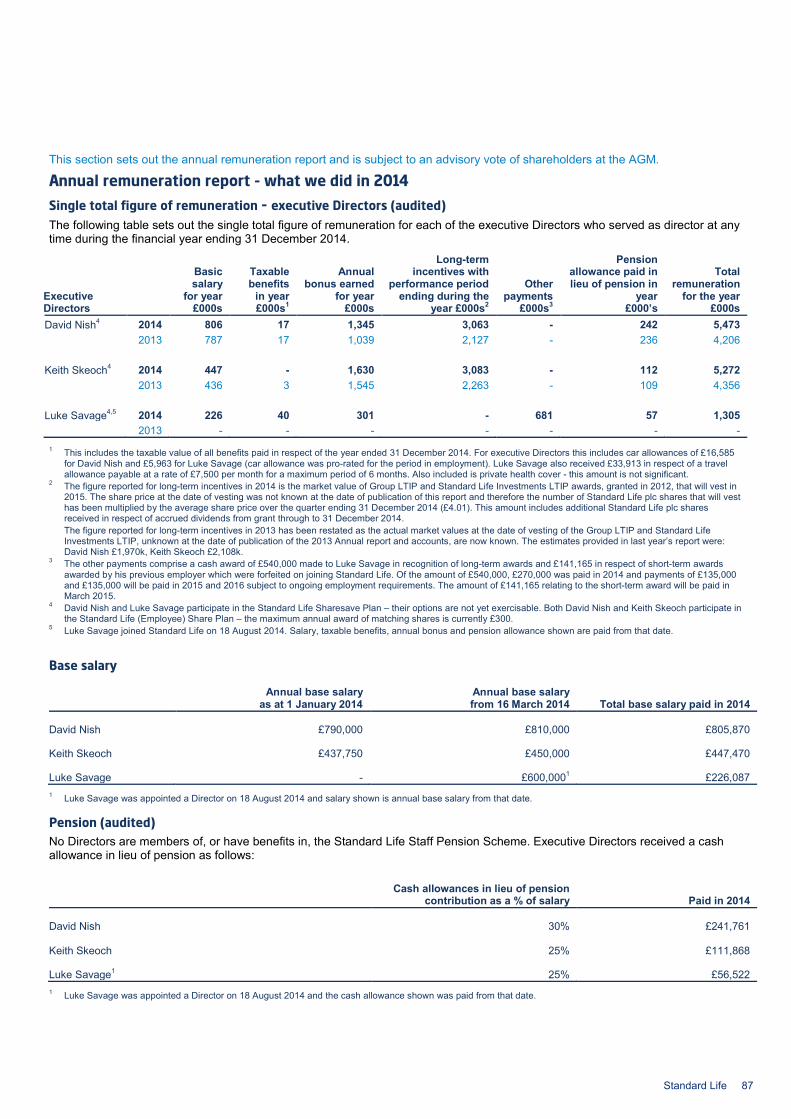
This section sets out the annual remuneration report and is subject to an advisory vote of shareholders at the AGM.
Annual remuneration report - what we did in 2014 Single total figure of remuneration - executive Directors (audited) The following table sets out the single total figure of remuneration for each of the executive Directors who served as director at any time during the financial year ending 31 December 2014.
Executive Directors
Basic salary
for year £000s
Taxable benefits
in year £000s1
Annual bonus earned
for year £000s
Long-term incentives with
performance period ending during the
year £000s2
Other payments
£000s3
Pension allowance paid in lieu of pension in
year £000’s
Total remuneration
for the year £000s
David Nish4 2014 806 17 1,345 3,063 - 242 5,473 2013 787 17 1,039 2,127 - 236 4,206
Keith Skeoch4 2014 447 - 1,630 3,083 - 112 5,272
2013 436 3 1,545 2,263 - 109 4,356
Luke Savage4,5 2014 226 40 301 - 681 57 1,305 2013 - - - - - - -
1 This includes the taxable value of all benefits paid in respect of the year ended 31 December 2014. For executive Directors this includes car allowances of £16,585 for David Nish and £5,963 for Luke Savage (car allowance was pro-rated for the period in employment). Luke Savage also received £33,913 in respect of a travel allowance payable at a rate of £7,500 per month for a maximum period of 6 months. Also included is private health cover - this amount is not significant.
2 The figure reported for long-term incentives in 2014 is the market value of Group LTIP and Standard Life Investments LTIP awards, granted in 2012, that will vest in 2015. The share price at the date of vesting was not known at the date of publication of this report and therefore the number of Standard Life plc shares that will vest has been multiplied by the average share price over the quarter ending 31 December 2014 (£4.01). This amount includes additional Standard Life plc shares received in respect of accrued dividends from grant through to 31 December 2014.
The figure reported for long-term incentives in 2013 has been restated as the actual market values at the date of vesting of the Group LTIP and Standard Life Investments LTIP, unknown at the date of publication of the 2013 Annual report and accounts, are now known. The estimates provided in last year’s report were: David Nish £1,970k, Keith Skeoch £2,108k.
3 The other payments comprise a cash award of £540,000 made to Luke Savage in recognition of long-term awards and £141,165 in respect of short-term awards awarded by his previous employer which were forfeited on joining Standard Life. Of the amount of £540,000, £270,000 was paid in 2014 and payments of £135,000 and £135,000 will be paid in 2015 and 2016 subject to ongoing employment requirements. The amount of £141,165 relating to the short-term award will be paid in March 2015.
4 David Nish and Luke Savage participate in the Standard Life Sharesave Plan – their options are not yet exercisable. Both David Nish and Keith Skeoch participate in the Standard Life (Employee) Share Plan – the maximum annual award of matching shares is currently £300.
5 Luke Savage joined Standard Life on 18 August 2014. Salary, taxable benefits, annual bonus and pension allowance shown are paid from that date.
Base salary
Annual base salary
as at 1 January 2014 Annual base salary from 16 March 2014 Total base salary paid in 2014
David Nish £790,000 £810,000 £805,870
Keith Skeoch £437,750 £450,000 £447,470
Luke Savage - £600,0001 £226,087 1 Luke Savage was appointed a Director on 18 August 2014 and salary shown is annual base salary from that date.
Pension (audited) No Directors are members of, or have benefits in, the Standard Life Staff Pension Scheme. Executive Directors received a cash allowance in lieu of pension as follows:
Cash allowances in lieu of pension contribution as a % of salary Paid in 2014
David Nish 30% £241,761
Keith Skeoch 25%
£111,868
Luke Savage1 25% £56,522 1 Luke Savage was appointed a Director on 18 August 2014 and the cash allowance shown was paid from that date.
Standard Life 87
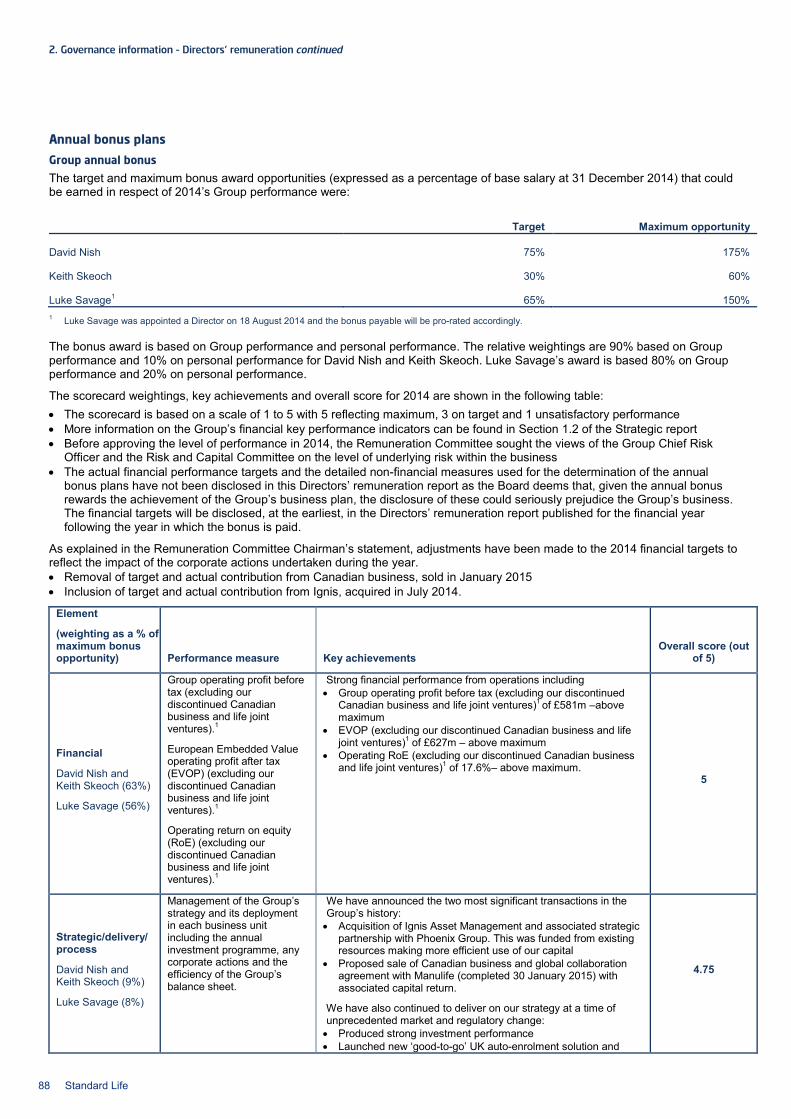
2. Governance information – Directors’ remuneration continued Annual bonus plans Group annual bonus The target and maximum bonus award opportunities (expressed as a percentage of base salary at 31 December 2014) that could be earned in respect of 2014’s Group performance were:
Target Maximum opportunity
David Nish 75% 175%
Keith Skeoch 30% 60%
Luke Savage1 65% 150% 1 Luke Savage was appointed a Director on 18 August 2014 and the bonus payable will be pro-rated accordingly.
The bonus award is based on Group performance and personal performance. The relative weightings are 90% based on Group performance and 10% on personal performance for David Nish and Keith Skeoch. Luke Savage’s award is based 80% on Group performance and 20% on personal performance.
The scorecard weightings, key achievements and overall score for 2014 are shown in the following table: • The scorecard is based on a scale of 1 to 5 with 5 reflecting maximum, 3 on target and 1 unsatisfactory performance • More information on the Group’s financial key performance indicators can be found in Section 1.2 of the Strategic report • Before approving the level of performance in 2014, the Remuneration Committee sought the views of the Group Chief Risk
Officer and the Risk and Capital Committee on the level of underlying risk within the business • The actual financial performance targets and the detailed non-financial measures used for the determination of the annual
bonus plans have not been disclosed in this Directors’ remuneration report as the Board deems that, given the annual bonus rewards the achievement of the Group’s business plan, the disclosure of these could seriously prejudice the Group’s business. The financial targets will be disclosed, at the earliest, in the Directors’ remuneration report published for the financial year following the year in which the bonus is paid.
As explained in the Remuneration Committee Chairman’s statement, adjustments have been made to the 2014 financial targets to reflect the impact of the corporate actions undertaken during the year. • Removal of target and actual contribution from Canadian business, sold in January 2015 • Inclusion of target and actual contribution from Ignis, acquired in July 2014.
Element
(weighting as a % of maximum bonus opportunity) Performance measure Key achievements
Overall score (out of 5)
Financial
David Nish and Keith Skeoch (63%)
Luke Savage (56%)
Group operating profit before tax (excluding our discontinued Canadian business and life joint ventures).1
European Embedded Value operating profit after tax (EVOP) (excluding our discontinued Canadian business and life joint ventures).1
Operating return on equity (RoE) (excluding our discontinued Canadian business and life joint ventures).1
Strong financial performance from operations including • Group operating profit before tax (excluding our discontinued
Canadian business and life joint ventures)1 of £581m –above maximum
• EVOP (excluding our discontinued Canadian business and life joint ventures)1 of £627m – above maximum
• Operating RoE (excluding our discontinued Canadian business and life joint ventures)1 of 17.6%– above maximum.
5
Strategic/delivery/ process
David Nish and Keith Skeoch (9%)
Luke Savage (8%)
Management of the Group’s strategy and its deployment in each business unit including the annual investment programme, any corporate actions and the efficiency of the Group’s balance sheet.
We have announced the two most significant transactions in the Group’s history: • Acquisition of Ignis Asset Management and associated strategic
partnership with Phoenix Group. This was funded from existing resources making more efficient use of our capital
• Proposed sale of Canadian business and global collaboration agreement with Manulife (completed 30 January 2015) with associated capital return.
We have also continued to deliver on our strategy at a time of unprecedented market and regulatory change: • Produced strong investment performance • Launched new ‘good-to-go’ UK auto-enrolment solution and
4.75
88 Standard Life
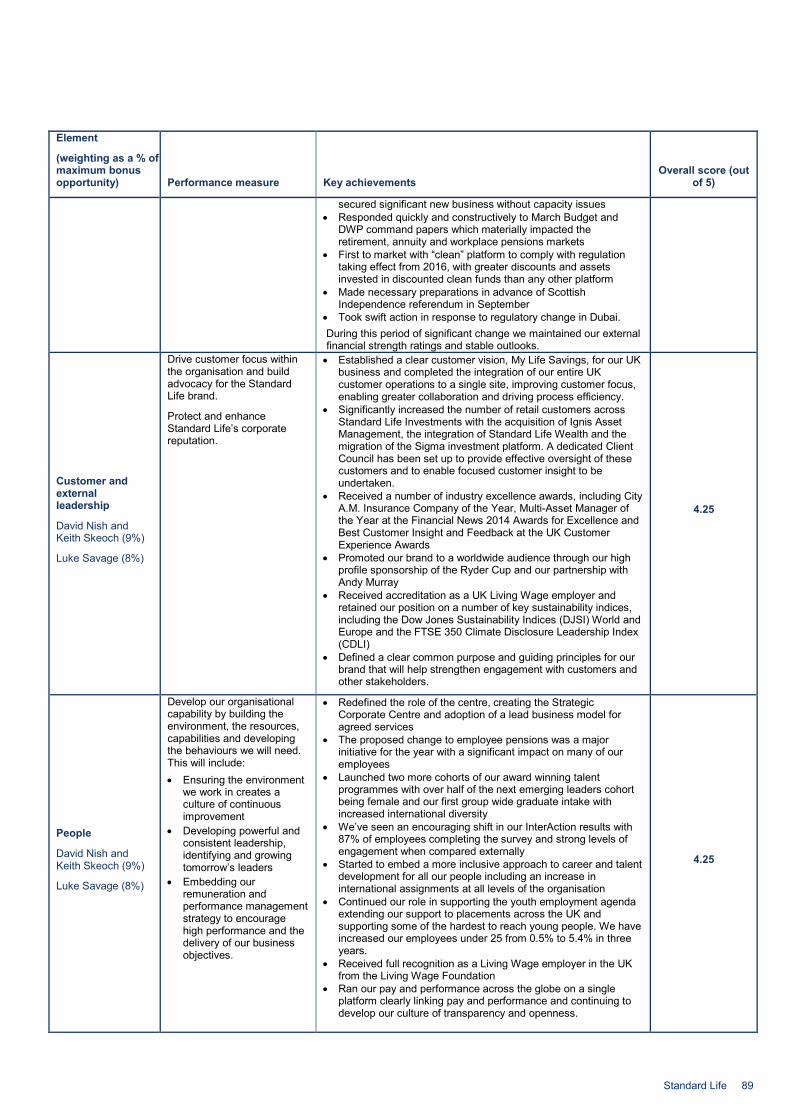
Element
(weighting as a % of maximum bonus opportunity) Performance measure Key achievements
Overall score (out of 5)
secured significant new business without capacity issues • Responded quickly and constructively to March Budget and
DWP command papers which materially impacted the retirement, annuity and workplace pensions markets
• First to market with “clean” platform to comply with regulation taking effect from 2016, with greater discounts and assets invested in discounted clean funds than any other platform
• Made necessary preparations in advance of Scottish Independence referendum in September
• Took swift action in response to regulatory change in Dubai. During this period of significant change we maintained our external financial strength ratings and stable outlooks.
Customer and external leadership
David Nish and Keith Skeoch (9%)
Luke Savage (8%)
Drive customer focus within the organisation and build advocacy for the Standard Life brand.
Protect and enhance Standard Life’s corporate reputation.
• Established a clear customer vision, My Life Savings, for our UK business and completed the integration of our entire UK customer operations to a single site, improving customer focus, enabling greater collaboration and driving process efficiency.
• Significantly increased the number of retail customers across Standard Life Investments with the acquisition of Ignis Asset Management, the integration of Standard Life Wealth and the migration of the Sigma investment platform. A dedicated Client Council has been set up to provide effective oversight of these customers and to enable focused customer insight to be undertaken.
• Received a number of industry excellence awards, including City A.M. Insurance Company of the Year, Multi-Asset Manager of the Year at the Financial News 2014 Awards for Excellence and Best Customer Insight and Feedback at the UK Customer Experience Awards
• Promoted our brand to a worldwide audience through our high profile sponsorship of the Ryder Cup and our partnership with Andy Murray
• Received accreditation as a UK Living Wage employer and retained our position on a number of key sustainability indices, including the Dow Jones Sustainability Indices (DJSI) World and Europe and the FTSE 350 Climate Disclosure Leadership Index (CDLI)
• Defined a clear common purpose and guiding principles for our brand that will help strengthen engagement with customers and other stakeholders.
4.25
People
David Nish and Keith Skeoch (9%)
Luke Savage (8%)
Develop our organisational capability by building the environment, the resources, capabilities and developing the behaviours we will need. This will include: • Ensuring the environment
we work in creates a culture of continuous improvement
• Developing powerful and consistent leadership, identifying and growing tomorrow’s leaders
• Embedding our remuneration and performance management strategy to encourage high performance and the delivery of our business objectives.
• Redefined the role of the centre, creating the Strategic Corporate Centre and adoption of a lead business model for agreed services
• The proposed change to employee pensions was a major initiative for the year with a significant impact on many of our employees
• Launched two more cohorts of our award winning talent programmes with over half of the next emerging leaders cohort being female and our first group wide graduate intake with increased international diversity
• We’ve seen an encouraging shift in our InterAction results with 87% of employees completing the survey and strong levels of engagement when compared externally
• Started to embed a more inclusive approach to career and talent development for all our people including an increase in international assignments at all levels of the organisation
• Continued our role in supporting the youth employment agenda extending our support to placements across the UK and supporting some of the hardest to reach young people. We have increased our employees under 25 from 0.5% to 5.4% in three years.
• Received full recognition as a Living Wage employer in the UK from the Living Wage Foundation
• Ran our pay and performance across the globe on a single platform clearly linking pay and performance and continuing to develop our culture of transparency and openness.
4.25
Standard Life 89

2. Governance information – Directors’ remuneration continued
Element
(weighting as a % of maximum bonus opportunity) Performance measure Key achievements
Overall score (out of 5)
Personal
David Nish and Keith Skeoch (10%)
Luke Savage (20%)
Personal scorecards.
Behaviours against our leadership model and personal development.
Not applicable
Based on performance against each of the four Group performance elements and considering the performance of the Group as a whole, the Remuneration Committee approved a rating of 4.8 out of 5 for performance against the Group scorecard during 2014.
1 Life joint ventures refers to HDFC Standard Life Insurance Company Limited and Heng An Standard Life Insurance Company Limited. As a result of the ratings approved by the Remuneration Committee, the Group annual bonus outcome as approved by the Remuneration Committee for 2014 is:
Bonus opportunity based on Group
performance as a % of total bonus
Bonus opportunity based on personal
performance as a % of total bonus
Total bonus payable as a % of bonus maximum
Total bonus payable as a % of base salary1 Total bonus
David Nish Maximum 90% 10% 100% 175%
Actual 84.86% 10% 94.86% 166% £1,344,600
Keith Skeoch Maximum 90% 10% 100% 60%
Actual 85.5% 10% 95.5% 57.3% £257,850
Luke Savage Maximum 80% 20% 100% 150%
Actual 75.47% 14.33% 89.8% 134.7% £301,138 1 Bonuses are paid based on base salary at 31 December 2014. Luke Savage’s bonus has been prorated to reflect his appointment during the performance period.
If the bonus payable amounts to more than 25% of salary, then half of the amount above 25% of salary is deferred for two years into an award over Standard Life plc shares. The deferral is not made if the amount to be deferred is less than 10% of salary.
2013 Group annual bonus – disclosure of financial targets The financial targets used in the determination of the 2013 Group annual bonuses paid in March 2014, and not previously disclosed, are shown in the following table:
Performance Target Below Threshold Threshold Maximum Group operating profit before tax (excluding life joint ventures)1 <£620m £620m £732m European Embedded Value operating profit before tax (excluding life joint ventures)1 <£865m £865m £1,267m Operating return on equity (excluding life joint ventures)1 <12.4% 12.4% 14.6%
1 Life joint ventures refers to HDFC Standard Life Insurance Company Limited and Heng An Standard Life Insurance Company Limited.
Standard Life Investments’ bonuses Keith Skeoch participated in the Standard Life Investments’ personal and company bonus plans, in addition to the Group annual bonus. These plans reward participants based on Standard Life Investments’ corporate and investment performance. Consistent with fund management practice, the amount of the bonus pool is determined by reference to Standard Life Investments’ financial performance, having regard to the total remuneration spend. • Personal bonus plan – rewards participants for personal performance in the year. Keith Skeoch’s opportunity for 2014 was
capped at 105% of salary. • Company bonus plan – Keith Skeoch’s company bonus opportunity for 2014 was equal to 200% of salary.
The determination of annual bonuses at Standard Life Investments is subject to two levels of control. First, the board of Standard Life Investments (Holdings) Limited reviews its financial results, and, after taking into account the level of overall performance and risk, its remuneration committee proposes the level of bonus payments. The second level of control is when this is referred to the Remuneration Committee which reviews these recommendations and determines the bonuses to be paid to the most senior employees within Standard Life Investments.
90 Standard Life

In 2014, Standard Life Investments continued to expand globally and had another very successful year. The key achievements during the year in which the bonus outcome was determined were: • Very strong EBITDA performance • Standard Life Investments operating profit before tax increased compared to 2013 • Total assets under management increased compared to 2013 • Maintaining strong investment performance with 98% of third-party funds ahead of the 3 year benchmark • Successful acquisition of Ignis • Collaboration agreement with Manulife.
Based on Keith Skeoch’s and Standard Life Investments’ performance in 2014, the Remuneration Committee approved a personal bonus award of 105% of salary and a company bonus award of 200% of salary.
Company bonus plan Personal bonus plan
Total as a % of bonus maximum
Total as % of base salary
Total Bonus
Keith Skeoch Maximum 200% 105% 100% 305%
Actual 200% 105% 100% 305% £1,372,500 Summary of bonus outcomes (audited) The following table shows the total bonus awards made in respect of 2014:
Group cash bonus Group deferred bonus
Standard Life Investments’ cash bonuses Total
David Nish £773,550 £571,050 - £1,334,600
Keith Skeoch £185,175 £72,675 £1,372,500 £1,630,350
Luke Savage1 £178,514 £122,624 - £301,138 1 Luke Savage was appointed a Director on 18 August 2014 and the bonus payable is pro-rated accordingly.
Annual bonus payments are not pensionable.
Long-term incentives Standard Life Long-Term Incentive Plan (Group LTIP) The plan under which awards were made in 2012 is the Group LTIP. The Executive LTIP has been used to grant awards since May 2014.
The awards granted in 2012 under the Group LTIP have a performance condition based on Group operating profit before tax (excluding profits of the life joint ventures – HDFC Standard Life Insurance Company Limited and Heng An Standard Life Insurance Company Limited). The awards are also subject to two underpins when assessing the Group performance. The first requires the Risk and Capital Committee to be satisfied that performance obtained has been achieved within acceptable defined risk parameters. The second requires the Remuneration Committee to be satisfied that Group operating profit performance reflects overall Group performance.
2012 Group LTIP awards vesting in respect of performance ending in 2014 (audited) Awards were made in March 2012 of 200% of salary to David Nish and Keith Skeoch.
As a result of the corporate actions during 2014, and as detailed more fully in the Remuneration Committee Chairman’s statement, the following adjustments have been made to the 2012 LTIP targets and results: • Removal of Canadian business, sold January 2015 • Inclusion of Ignis, acquired in July 2014 • Inclusion of Newton Private Client business, acquired in September 2013 • Removal of interest no longer receivable due to Canadian capital restructuring.
The tables below summarise the original performance targets for the awards, the amended performance targets and the outcome.
Original targets
2014 performance level Below threshold Threshold Target Maximum
2014 Group operating profit before tax (excluding life joint ventures)1 <£675m £675m £750m £825m 1 Life joint ventures refers to HDFC Standard Life Insurance Company Limited and Heng An Standard Life Insurance Company Limited.
Standard Life 91

2. Governance information – Directors’ remuneration continued Revised targets and performance outcome
2014 performance level Below threshold Threshold Target Maximum Restated 2014 Group operating profit before tax (excluding life joint ventures)1 <£460m £460m £510m £560m
Actual performance £581m 1 Life joint ventures refers to HDFC Standard Life Insurance Company Limited and Heng An Standard Life Insurance Company Limited.
In line with the above results, the Remuneration Committee determined that 100% of awards granted to David Nish and Keith Skeoch in 2012 should vest in 2015.
Standard Life Investments Long-Term Incentive Plan (Standard Life Investments LTIP) In 2012, in addition to the Group LTIP, Keith Skeoch participated in the Standard Life Investments LTIP. Under the Standard Life Investments LTIP, awards will only begin to vest if Standard Life Investments’ investment performance (three-year money-weighted average) is above the lower quartile of the money-weighted average of all assets under management (both captive and third party assets) compared to other asset managers. The level of vesting is then subject to consolidated cumulative third-party EBITDA performance as shown in the table below. The actual EBITDA targets will not be disclosed as the Board deems that this is commercially sensitive information and, if disclosed, could seriously prejudice the Group’s business. As noted in the Remuneration Committee Chairman’s statement, the performance targets and results for the 2012 award have been adjusted to reflect: • Removal of Canadian business, sold in January 2015 • Inclusion of Ignis, acquired in July 2014 • EBITDA , rather than EBIT as the appropriate profit metric • Inclusion of the business of Standard Life Wealth, accounted for within Standard Life Investments’ business from January 2014.
Performance Consolidated cumulative three-year third party EBITDA % of target award of shares that vest1
Threshold 60% of target 0%
Maximum 140% of target 200% 1 Vesting takes place on a straight line basis between 60% of target cumulative three-year third party EBITDA and 140% on target cumulative three-year third party
EBITDA.
Before an award can vest, the Risk and Capital Committee is required to verify to the Remuneration Committee that the level of vesting was not as a result of behaviour that has exposed the Group to undue risk. If the Risk and Capital Committee determines that the Group has been exposed to undue risk, the Remuneration Committee will take this into account when determining the level of vesting.
2012 Standard Life Investments LTIP awards vesting in respect of performance periods ending in 2014 In line with the above, Keith Skeoch received an award under this plan in March 2012 equivalent to 200% of salary (at maximum vesting). No other executive Director received an award under this plan.
The following table sets out performance against targets for the 2012 award.
Performance level Below threshold Threshold Target Maximum
Consolidated cumulative three-year third party EBITDA <60% of target 60% of target 100% of target 140% of target
Actual performance 126.8% of target
As performance was above the lower quartile of the money-weighted average of all assets under management (both captive and third-party assets) and the consolidated cumulative three-year third party EBITDA was 126.8% of target, the Remuneration Committee determined that 167.1% of target awards (83.6% of the maximum award) granted in 2012 should vest in March 2015.
Awards granted in 2014 Awards to executive Directors were made in 2014 under the Executive LTIP and the Standard Life Investments LTIP. As set out in the Remuneration Chairman’s report, the performance targets for the Executive LTIP and Standard Life Investments LTIP have been adjusted.
92 Standard Life
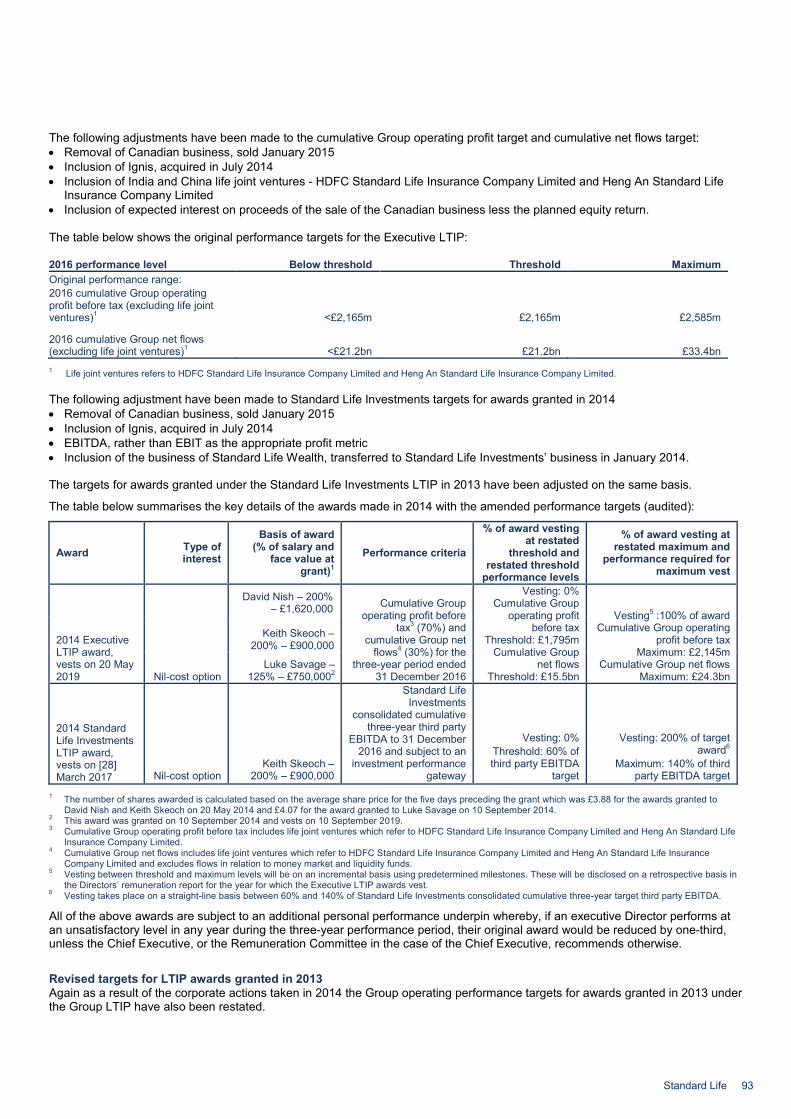
The following adjustments have been made to the cumulative Group operating profit target and cumulative net flows target: • Removal of Canadian business, sold January 2015 • Inclusion of Ignis, acquired in July 2014 • Inclusion of India and China life joint ventures - HDFC Standard Life Insurance Company Limited and Heng An Standard Life
Insurance Company Limited • Inclusion of expected interest on proceeds of the sale of the Canadian business less the planned equity return. The table below shows the original performance targets for the Executive LTIP:
2016 performance level Below threshold Threshold Maximum Original performance range: 2016 cumulative Group operating profit before tax (excluding life joint ventures)1 <£2,165m £2,165m £2,585m
2016 cumulative Group net flows (excluding life joint ventures)1 <£21.2bn £21.2bn £33.4bn 1 Life joint ventures refers to HDFC Standard Life Insurance Company Limited and Heng An Standard Life Insurance Company Limited.
The following adjustment have been made to Standard Life Investments targets for awards granted in 2014 • Removal of Canadian business, sold January 2015 • Inclusion of Ignis, acquired in July 2014 • EBITDA, rather than EBIT as the appropriate profit metric • Inclusion of the business of Standard Life Wealth, transferred to Standard Life Investments’ business in January 2014.
The targets for awards granted under the Standard Life Investments LTIP in 2013 have been adjusted on the same basis.
The table below summarises the key details of the awards made in 2014 with the amended performance targets (audited):
Award Type of interest
Basis of award (% of salary and
face value at grant)1
Performance criteria
% of award vesting at restated
threshold and restated threshold
performance levels
% of award vesting at restated maximum and
performance required for maximum vest
2014 Executive LTIP award, vests on 20 May 2019 Nil-cost option
David Nish – 200% – £1,620,000 Cumulative Group
operating profit before tax3 (70%) and
cumulative Group net flows4 (30%) for the
three-year period ended 31 December 2016
Vesting: 0% Cumulative Group
operating profit before tax
Threshold: £1,795m Cumulative Group
net flows
Threshold: £15.5bn
Vesting5 :100% of award
Cumulative Group operating profit before tax
Maximum: £2,145m Cumulative Group net flows
Maximum: £24.3bn
Keith Skeoch – 200% – £900,000
Luke Savage – 125% – £750,0002
2014 Standard Life Investments LTIP award, vests on [28] March 2017 Nil-cost option
Keith Skeoch – 200% – £900,000
Standard Life Investments
consolidated cumulative three-year third party
EBITDA to 31 December 2016 and subject to an
investment performance gateway
Vesting: 0% Threshold: 60% of third party EBITDA
target
Vesting: 200% of target award6
Maximum: 140% of third party EBITDA target
1 The number of shares awarded is calculated based on the average share price for the five days preceding the grant which was £3.88 for the awards granted to David Nish and Keith Skeoch on 20 May 2014 and £4.07 for the award granted to Luke Savage on 10 September 2014.
2 This award was granted on 10 September 2014 and vests on 10 September 2019. 3 Cumulative Group operating profit before tax includes life joint ventures which refer to HDFC Standard Life Insurance Company Limited and Heng An Standard Life
Insurance Company Limited. 4 Cumulative Group net flows includes life joint ventures which refer to HDFC Standard Life Insurance Company Limited and Heng An Standard Life Insurance
Company Limited and excludes flows in relation to money market and liquidity funds. 5 Vesting between threshold and maximum levels will be on an incremental basis using predetermined milestones. These will be disclosed on a retrospective basis in
the Directors’ remuneration report for the year for which the Executive LTIP awards vest. 6 Vesting takes place on a straight-line basis between 60% and 140% of Standard Life Investments consolidated cumulative three-year target third party EBITDA.
All of the above awards are subject to an additional personal performance underpin whereby, if an executive Director performs at an unsatisfactory level in any year during the three-year performance period, their original award would be reduced by one-third, unless the Chief Executive, or the Remuneration Committee in the case of the Chief Executive, recommends otherwise.
Revised targets for LTIP awards granted in 2013 Again as a result of the corporate actions taken in 2014 the Group operating performance targets for awards granted in 2013 under the Group LTIP have also been restated.
Standard Life 93
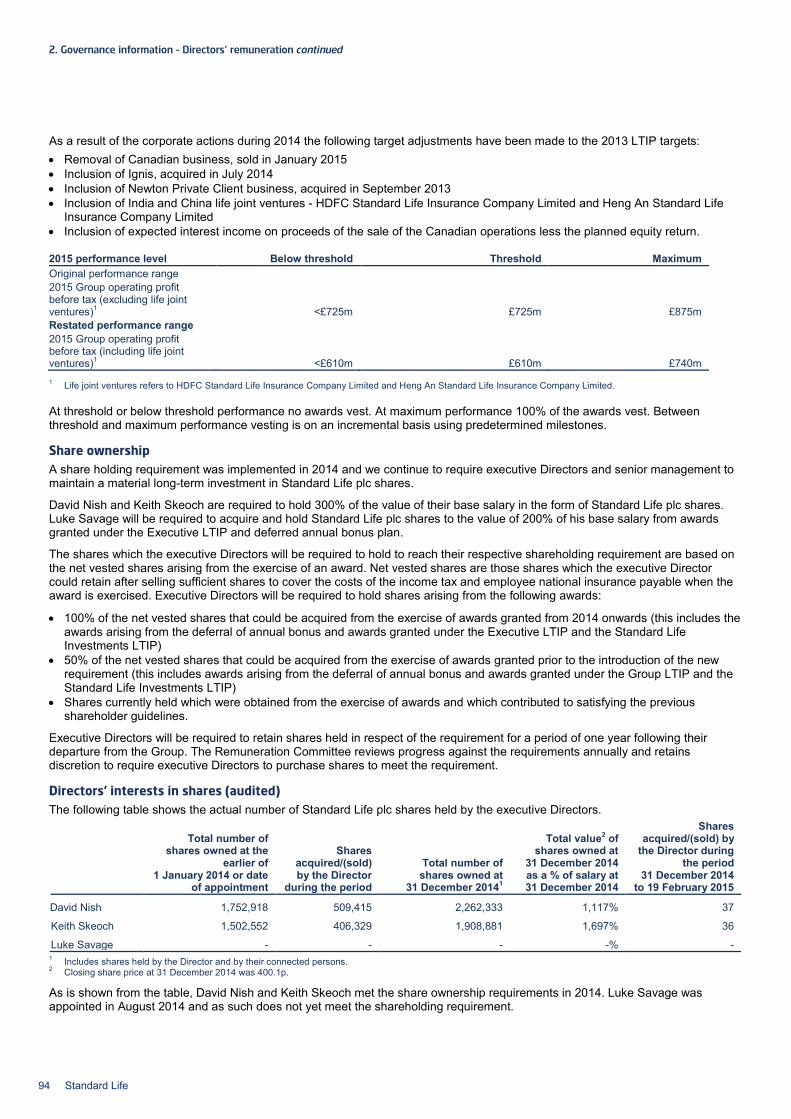
2. Governance information – Directors’ remuneration continued As a result of the corporate actions during 2014 the following target adjustments have been made to the 2013 LTIP targets: • Removal of Canadian business, sold in January 2015 • Inclusion of Ignis, acquired in July 2014 • Inclusion of Newton Private Client business, acquired in September 2013 • Inclusion of India and China life joint ventures - HDFC Standard Life Insurance Company Limited and Heng An Standard Life
Insurance Company Limited • Inclusion of expected interest income on proceeds of the sale of the Canadian operations less the planned equity return.
2015 performance level Below threshold Threshold Maximum Original performance range 2015 Group operating profit before tax (excluding life joint ventures)1 <£725m £725m £875m Restated performance range 2015 Group operating profit before tax (including life joint ventures)1 <£610m £610m £740m 1 Life joint ventures refers to HDFC Standard Life Insurance Company Limited and Heng An Standard Life Insurance Company Limited.
At threshold or below threshold performance no awards vest. At maximum performance 100% of the awards vest. Between threshold and maximum performance vesting is on an incremental basis using predetermined milestones.
Share ownership A share holding requirement was implemented in 2014 and we continue to require executive Directors and senior management to maintain a material long-term investment in Standard Life plc shares.
David Nish and Keith Skeoch are required to hold 300% of the value of their base salary in the form of Standard Life plc shares. Luke Savage will be required to acquire and hold Standard Life plc shares to the value of 200% of his base salary from awards granted under the Executive LTIP and deferred annual bonus plan.
The shares which the executive Directors will be required to hold to reach their respective shareholding requirement are based on the net vested shares arising from the exercise of an award. Net vested shares are those shares which the executive Director could retain after selling sufficient shares to cover the costs of the income tax and employee national insurance payable when the award is exercised. Executive Directors will be required to hold shares arising from the following awards:
• 100% of the net vested shares that could be acquired from the exercise of awards granted from 2014 onwards (this includes the awards arising from the deferral of annual bonus and awards granted under the Executive LTIP and the Standard Life Investments LTIP)
• 50% of the net vested shares that could be acquired from the exercise of awards granted prior to the introduction of the new requirement (this includes awards arising from the deferral of annual bonus and awards granted under the Group LTIP and the Standard Life Investments LTIP)
• Shares currently held which were obtained from the exercise of awards and which contributed to satisfying the previous shareholder guidelines.
Executive Directors will be required to retain shares held in respect of the requirement for a period of one year following their departure from the Group. The Remuneration Committee reviews progress against the requirements annually and retains discretion to require executive Directors to purchase shares to meet the requirement.
Directors’ interests in shares (audited) The following table shows the actual number of Standard Life plc shares held by the executive Directors.
Total number of shares owned at the
earlier of 1 January 2014 or date
of appointment
Shares acquired/(sold) by the Director
during the period
Total number of shares owned at
31 December 20141
Total value2 of shares owned at
31 December 2014 as a % of salary at 31 December 2014
Shares acquired/(sold) by
the Director during the period
31 December 2014 to 19 February 2015
David Nish 1,752,918 509,415 2,262,333 1,117% 37
Keith Skeoch 1,502,552 406,329 1,908,881 1,697% 36
Luke Savage - - - -% - 1 Includes shares held by the Director and by their connected persons. 2 Closing share price at 31 December 2014 was 400.1p.
As is shown from the table, David Nish and Keith Skeoch met the share ownership requirements in 2014. Luke Savage was appointed in August 2014 and as such does not yet meet the shareholding requirement.
94 Standard Life
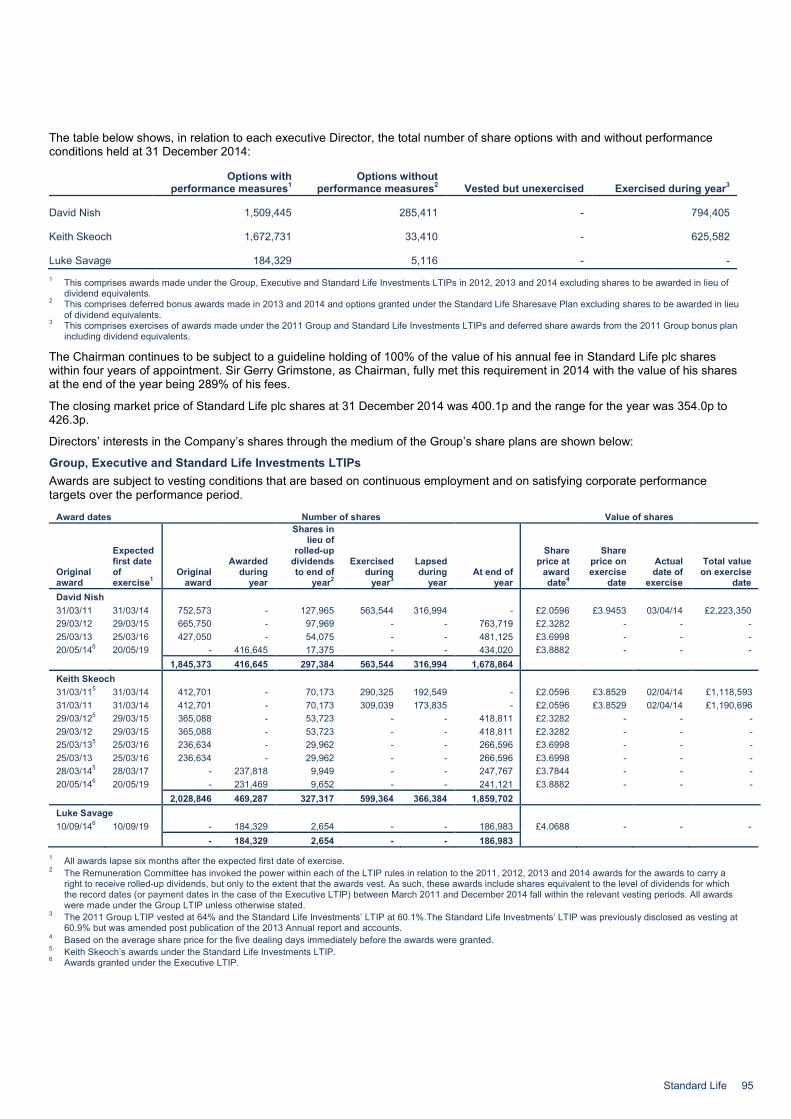
The table below shows, in relation to each executive Director, the total number of share options with and without performance conditions held at 31 December 2014:
Options with performance measures1
Options without performance measures2 Vested but unexercised Exercised during year3
David Nish 1,509,445 285,411 - 794,405
Keith Skeoch 1,672,731 33,410 - 625,582
Luke Savage 184,329 5,116 - - 1 This comprises awards made under the Group, Executive and Standard Life Investments LTIPs in 2012, 2013 and 2014 excluding shares to be awarded in lieu of
dividend equivalents. 2 This comprises deferred bonus awards made in 2013 and 2014 and options granted under the Standard Life Sharesave Plan excluding shares to be awarded in lieu
of dividend equivalents. 3 This comprises exercises of awards made under the 2011 Group and Standard Life Investments LTIPs and deferred share awards from the 2011 Group bonus plan
including dividend equivalents.
The Chairman continues to be subject to a guideline holding of 100% of the value of his annual fee in Standard Life plc shares within four years of appointment. Sir Gerry Grimstone, as Chairman, fully met this requirement in 2014 with the value of his shares at the end of the year being 289% of his fees.
The closing market price of Standard Life plc shares at 31 December 2014 was 400.1p and the range for the year was 354.0p to 426.3p.
Directors’ interests in the Company’s shares through the medium of the Group’s share plans are shown below:
Group, Executive and Standard Life Investments LTIPs Awards are subject to vesting conditions that are based on continuous employment and on satisfying corporate performance targets over the performance period.
Award dates Number of shares Value of shares
Original award
Expected first date of exercise1
Original award
Awarded during
year
Shares in lieu of
rolled-up dividends to end of
year2
Exercised during
year3
Lapsed during
year At end of
year
Share price at
award date4
Share price on exercise
date
Actual date of
exercise
Total value on exercise
date David Nish 31/03/11 31/03/14 752,573 - 127,965 563,544 316,994 - £2.0596 £3.9453 03/04/14 £2,223,350 29/03/12 29/03/15 665,750 - 97,969 - - 763,719 £2.3282 - - - 25/03/13 25/03/16 427,050 - 54,075 - - 481,125 £3.6998 - - - 20/05/146 20/05/19 - 416,645 17,375 - - 434,020 £3.8882 - - - 1,845,373 416,645 297,384 563,544 316,994 1,678,864 Keith Skeoch 31/03/115 31/03/14 412,701 - 70,173 290,325 192,549 - £2.0596 £3.8529 02/04/14 £1,118,593 31/03/11 31/03/14 412,701 - 70,173 309,039 173,835 - £2.0596 £3.8529 02/04/14 £1,190,696 29/03/125 29/03/15 365,088 - 53,723 - - 418,811 £2.3282 - - - 29/03/12 29/03/15 365,088 - 53,723 - - 418,811 £2.3282 - - - 25/03/135 25/03/16 236,634 - 29,962 - - 266,596 £3.6998 - - - 25/03/13 25/03/16 236,634 - 29,962 - - 266,596 £3.6998 - - - 28/03/145 28/03/17 - 237,818 9,949 - - 247,767 £3.7844 - - - 20/05/146 20/05/19 - 231,469 9,652 - - 241,121 £3.8882 - - - 2,028,846 469,287 327,317 599,364 366,384 1,859,702 Luke Savage 10/09/146 10/09/19 - 184,329 2,654 - - 186,983 £4.0688 - - - - 184,329 2,654 - - 186,983
1 All awards lapse six months after the expected first date of exercise. 2 The Remuneration Committee has invoked the power within each of the LTIP rules in relation to the 2011, 2012, 2013 and 2014 awards for the awards to carry a
right to receive rolled-up dividends, but only to the extent that the awards vest. As such, these awards include shares equivalent to the level of dividends for which the record dates (or payment dates in the case of the Executive LTIP) between March 2011 and December 2014 fall within the relevant vesting periods. All awards were made under the Group LTIP unless otherwise stated.
3 The 2011 Group LTIP vested at 64% and the Standard Life Investments’ LTIP at 60.1%.The Standard Life Investments’ LTIP was previously disclosed as vesting at 60.9% but was amended post publication of the 2013 Annual report and accounts.
4 Based on the average share price for the five dealing days immediately before the awards were granted. 5 Keith Skeoch’s awards under the Standard Life Investments LTIP. 6 Awards granted under the Executive LTIP.
Standard Life 95
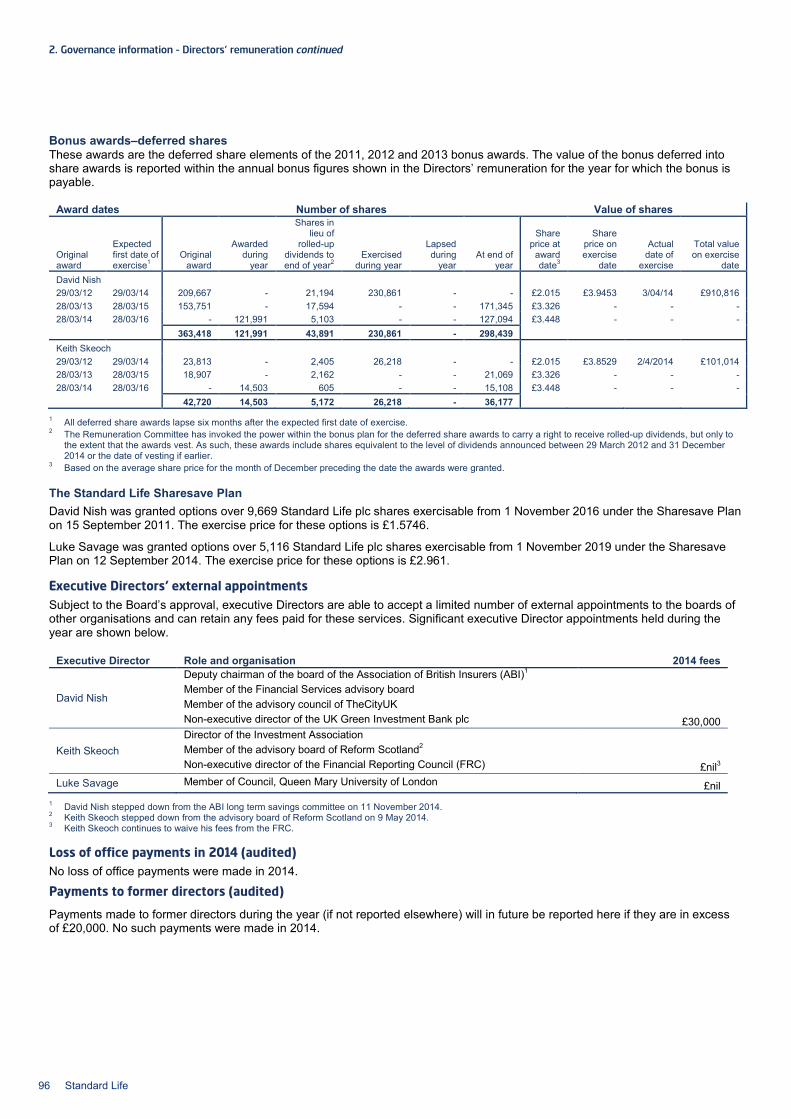
2. Governance information – Directors’ remuneration continued Bonus awards–deferred shares These awards are the deferred share elements of the 2011, 2012 and 2013 bonus awards. The value of the bonus deferred into share awards is reported within the annual bonus figures shown in the Directors’ remuneration for the year for which the bonus is payable.
Award dates Number of shares Value of shares
Original award
Expected first date of exercise1
Original award
Awarded during
year
Shares in lieu of
rolled-up dividends to end of year2
Exercised during year
Lapsed during
year At end of
year
Share price at
award date3
Share price on exercise
date
Actual date of
exercise
Total value on exercise
date David Nish 29/03/12 29/03/14 209,667 - 21,194 230,861 - - £2.015 £3.9453 3/04/14 £910,816 28/03/13 28/03/15 153,751 - 17,594 - - 171,345 £3.326 - - - 28/03/14 28/03/16 - 121,991 5,103 - - 127,094 £3.448 - - - 363,418 121,991 43,891 230,861 - 298,439 Keith Skeoch 29/03/12 29/03/14 23,813 - 2,405 26,218 - - £2.015 £3.8529 2/4/2014 £101,014 28/03/13 28/03/15 18,907 - 2,162 - - 21,069 £3.326 - - - 28/03/14 28/03/16 - 14,503 605 - - 15,108 £3.448 - - - 42,720 14,503 5,172 26,218 - 36,177
1 All deferred share awards lapse six months after the expected first date of exercise. 2 The Remuneration Committee has invoked the power within the bonus plan for the deferred share awards to carry a right to receive rolled-up dividends, but only to
the extent that the awards vest. As such, these awards include shares equivalent to the level of dividends announced between 29 March 2012 and 31 December 2014 or the date of vesting if earlier.
3 Based on the average share price for the month of December preceding the date the awards were granted.
The Standard Life Sharesave Plan David Nish was granted options over 9,669 Standard Life plc shares exercisable from 1 November 2016 under the Sharesave Plan on 15 September 2011. The exercise price for these options is £1.5746.
Luke Savage was granted options over 5,116 Standard Life plc shares exercisable from 1 November 2019 under the Sharesave Plan on 12 September 2014. The exercise price for these options is £2.961.
Executive Directors’ external appointments Subject to the Board’s approval, executive Directors are able to accept a limited number of external appointments to the boards of other organisations and can retain any fees paid for these services. Significant executive Director appointments held during the year are shown below.
Executive Director Role and organisation 2014 fees
David Nish
Deputy chairman of the board of the Association of British Insurers (ABI)1 Member of the Financial Services advisory board Member of the advisory council of TheCityUK Non-executive director of the UK Green Investment Bank plc £30,000
Keith Skeoch Director of the Investment Association Member of the advisory board of Reform Scotland2 Non-executive director of the Financial Reporting Council (FRC) £nil3
Luke Savage Member of Council, Queen Mary University of London £nil 1 David Nish stepped down from the ABI long term savings committee on 11 November 2014. 2 Keith Skeoch stepped down from the advisory board of Reform Scotland on 9 May 2014. 3 Keith Skeoch continues to waive his fees from the FRC.
Loss of office payments in 2014 (audited) No loss of office payments were made in 2014.
Payments to former directors (audited)
Payments made to former directors during the year (if not reported elsewhere) will in future be reported here if they are in excess of £20,000. No such payments were made in 2014.
96 Standard Life
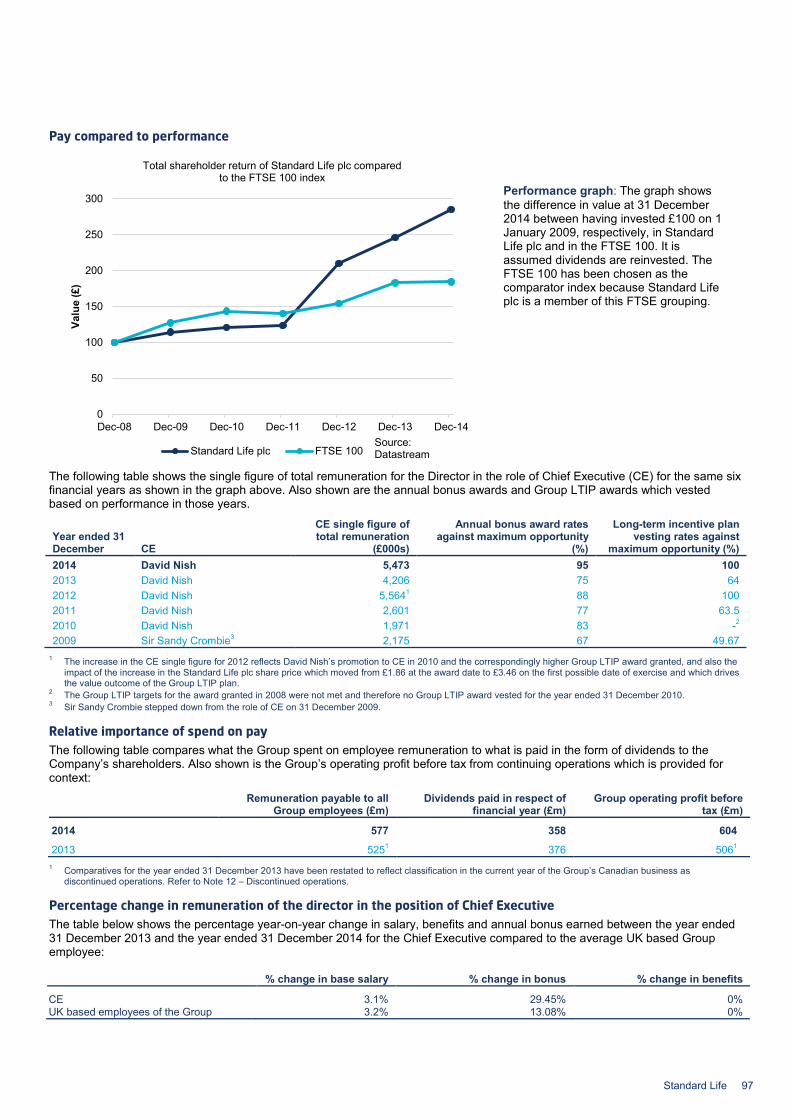
Pay compared to performance
The following table shows the single figure of total remuneration for the Director in the role of Chief Executive (CE) for the same six financial years as shown in the graph above. Also shown are the annual bonus awards and Group LTIP awards which vested based on performance in those years.
Year ended 31 December CE
CE single figure of total remuneration
(£000s)
Annual bonus award rates against maximum opportunity
(%)
Long-term incentive plan vesting rates against
maximum opportunity (%) 2014 David Nish 5,473 95 100 2013 David Nish 4,206 75 64 2012 David Nish 5,5641 88 100 2011 David Nish 2,601 77 63.5 2010 David Nish 1,971 83 -2 2009 Sir Sandy Crombie3 2,175 67 49.67
1 The increase in the CE single figure for 2012 reflects David Nish’s promotion to CE in 2010 and the correspondingly higher Group LTIP award granted, and also the impact of the increase in the Standard Life plc share price which moved from £1.86 at the award date to £3.46 on the first possible date of exercise and which drives the value outcome of the Group LTIP plan.
2 The Group LTIP targets for the award granted in 2008 were not met and therefore no Group LTIP award vested for the year ended 31 December 2010. 3 Sir Sandy Crombie stepped down from the role of CE on 31 December 2009.
Relative importance of spend on pay The following table compares what the Group spent on employee remuneration to what is paid in the form of dividends to the Company’s shareholders. Also shown is the Group’s operating profit before tax from continuing operations which is provided for context:
Remuneration payable to all Group employees (£m)
Dividends paid in respect of financial year (£m)
Group operating profit before tax (£m)
2014 577 358 604
2013 5251 376 5061 1 Comparatives for the year ended 31 December 2013 have been restated to reflect classification in the current year of the Group’s Canadian business as
discontinued operations. Refer to Note 12 – Discontinued operations.
Percentage change in remuneration of the director in the position of Chief Executive The table below shows the percentage year-on-year change in salary, benefits and annual bonus earned between the year ended 31 December 2013 and the year ended 31 December 2014 for the Chief Executive compared to the average UK based Group employee:
% change in base salary % change in bonus % change in benefits
CE 3.1% 29.45% 0% UK based employees of the Group 3.2% 13.08% 0%
0
50
100
150
200
250
300
Dec-08 Dec-09 Dec-10 Dec-11 Dec-12 Dec-13 Dec-14
Valu
e (£
)
Total shareholder return of Standard Life plc compared to the FTSE 100 index
Standard Life plc FTSE 100Source: Datastream
Performance graph: The graph shows the difference in value at 31 December 2014 between having invested £100 on 1 January 2009, respectively, in Standard Life plc and in the FTSE 100. It is assumed dividends are reinvested. The FTSE 100 has been chosen as the comparator index because Standard Life plc is a member of this FTSE grouping.
Standard Life 97
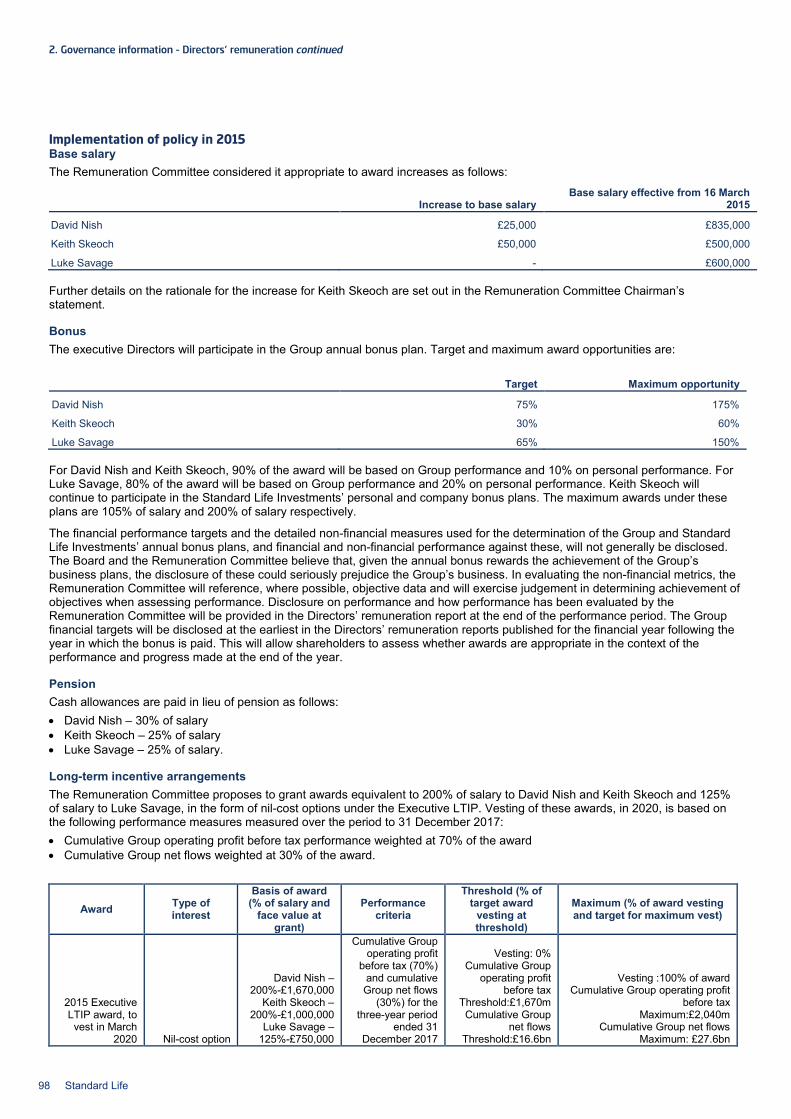
2. Governance information – Directors’ remuneration continued Implementation of policy in 2015 Base salary The Remuneration Committee considered it appropriate to award increases as follows:
Increase to base salary Base salary effective from 16 March
2015
David Nish £25,000 £835,000
Keith Skeoch £50,000 £500,000
Luke Savage - £600,000
Further details on the rationale for the increase for Keith Skeoch are set out in the Remuneration Committee Chairman’s statement.
Bonus The executive Directors will participate in the Group annual bonus plan. Target and maximum award opportunities are:
Target Maximum opportunity
David Nish 75% 175%
Keith Skeoch 30% 60%
Luke Savage 65% 150%
For David Nish and Keith Skeoch, 90% of the award will be based on Group performance and 10% on personal performance. For Luke Savage, 80% of the award will be based on Group performance and 20% on personal performance. Keith Skeoch will continue to participate in the Standard Life Investments’ personal and company bonus plans. The maximum awards under these plans are 105% of salary and 200% of salary respectively.
The financial performance targets and the detailed non-financial measures used for the determination of the Group and Standard Life Investments’ annual bonus plans, and financial and non-financial performance against these, will not generally be disclosed. The Board and the Remuneration Committee believe that, given the annual bonus rewards the achievement of the Group’s business plans, the disclosure of these could seriously prejudice the Group’s business. In evaluating the non-financial metrics, the Remuneration Committee will reference, where possible, objective data and will exercise judgement in determining achievement of objectives when assessing performance. Disclosure on performance and how performance has been evaluated by the Remuneration Committee will be provided in the Directors’ remuneration report at the end of the performance period. The Group financial targets will be disclosed at the earliest in the Directors’ remuneration reports published for the financial year following the year in which the bonus is paid. This will allow shareholders to assess whether awards are appropriate in the context of the performance and progress made at the end of the year.
Pension Cash allowances are paid in lieu of pension as follows: • David Nish – 30% of salary • Keith Skeoch – 25% of salary • Luke Savage – 25% of salary.
Long-term incentive arrangements The Remuneration Committee proposes to grant awards equivalent to 200% of salary to David Nish and Keith Skeoch and 125% of salary to Luke Savage, in the form of nil-cost options under the Executive LTIP. Vesting of these awards, in 2020, is based on the following performance measures measured over the period to 31 December 2017: • Cumulative Group operating profit before tax performance weighted at 70% of the award • Cumulative Group net flows weighted at 30% of the award.
Award Type of interest
Basis of award (% of salary and
face value at grant)
Performance criteria
Threshold (% of target award
vesting at threshold)
Maximum (% of award vesting and target for maximum vest)
2015 Executive LTIP award, to vest in March
2020 Nil-cost option
David Nish – 200%-£1,670,000
Keith Skeoch – 200%-£1,000,000
Luke Savage – 125%-£750,000
Cumulative Group operating profit
before tax (70%) and cumulative Group net flows
(30%) for the three-year period
ended 31 December 2017
Vesting: 0% Cumulative Group
operating profit before tax
Threshold:£1,670m Cumulative Group
net flows Threshold:£16.6bn
Vesting :100% of award Cumulative Group operating profit
before tax Maximum:£2,040m
Cumulative Group net flows
Maximum: £27.6bn
98 Standard Life
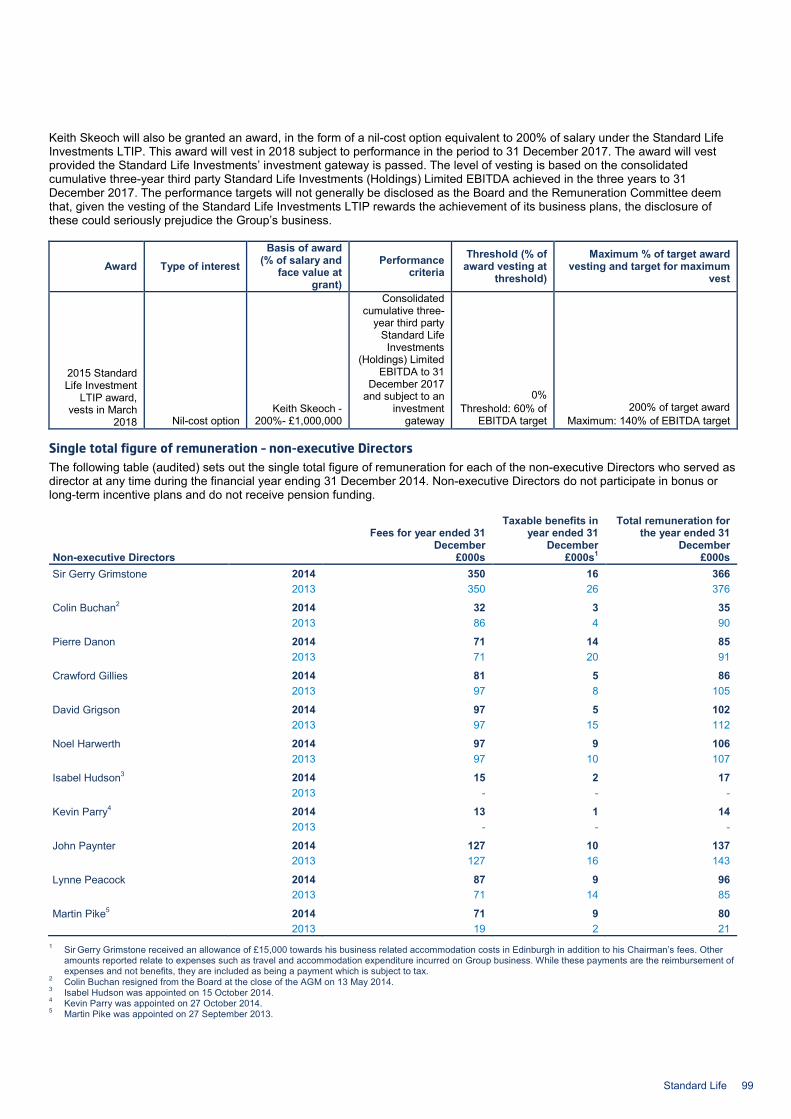
Keith Skeoch will also be granted an award, in the form of a nil-cost option equivalent to 200% of salary under the Standard Life Investments LTIP. This award will vest in 2018 subject to performance in the period to 31 December 2017. The award will vest provided the Standard Life Investments’ investment gateway is passed. The level of vesting is based on the consolidated cumulative three-year third party Standard Life Investments (Holdings) Limited EBITDA achieved in the three years to 31 December 2017. The performance targets will not generally be disclosed as the Board and the Remuneration Committee deem that, given the vesting of the Standard Life Investments LTIP rewards the achievement of its business plans, the disclosure of these could seriously prejudice the Group’s business.
Award Type of interest Basis of award
(% of salary and face value at
grant)
Performance criteria
Threshold (% of award vesting at
threshold)
Maximum % of target award vesting and target for maximum
vest
2015 Standard Life Investment
LTIP award, vests in March
2018 Nil-cost option Keith Skeoch -
200%- £1,000,000
Consolidated cumulative three-
year third party Standard Life Investments
(Holdings) Limited EBITDA to 31
December 2017 and subject to an
investment gateway
0% Threshold: 60% of
EBITDA target 200% of target award
Maximum: 140% of EBITDA target
Single total figure of remuneration – non-executive Directors The following table (audited) sets out the single total figure of remuneration for each of the non-executive Directors who served as director at any time during the financial year ending 31 December 2014. Non-executive Directors do not participate in bonus or long-term incentive plans and do not receive pension funding.
Non-executive Directors
Fees for year ended 31
December £000s
Taxable benefits in year ended 31
December £000s1
Total remuneration for the year ended 31
December £000s
Sir Gerry Grimstone 2014 350 16 366 2013 350 26 376
Colin Buchan2 2014 32 3 35 2013 86 4 90
Pierre Danon 2014 71 14 85 2013 71 20 91
Crawford Gillies 2014 81 5 86 2013 97 8 105
David Grigson 2014 97 5 102 2013 97 15 112
Noel Harwerth 2014 97 9 106 2013 97 10 107
Isabel Hudson3 2014 15 2 17 2013 - - -
Kevin Parry4 2014 13 1 14 2013 - - -
John Paynter 2014 127 10 137 2013 127 16 143
Lynne Peacock 2014 87 9 96 2013 71 14 85
Martin Pike5 2014 71 9 80 2013 19 2 21
1 Sir Gerry Grimstone received an allowance of £15,000 towards his business related accommodation costs in Edinburgh in addition to his Chairman’s fees. Other amounts reported relate to expenses such as travel and accommodation expenditure incurred on Group business. While these payments are the reimbursement of expenses and not benefits, they are included as being a payment which is subject to tax.
2 Colin Buchan resigned from the Board at the close of the AGM on 13 May 2014. 3 Isabel Hudson was appointed on 15 October 2014. 4 Kevin Parry was appointed on 27 October 2014. 5 Martin Pike was appointed on 27 September 2013.
Standard Life 99
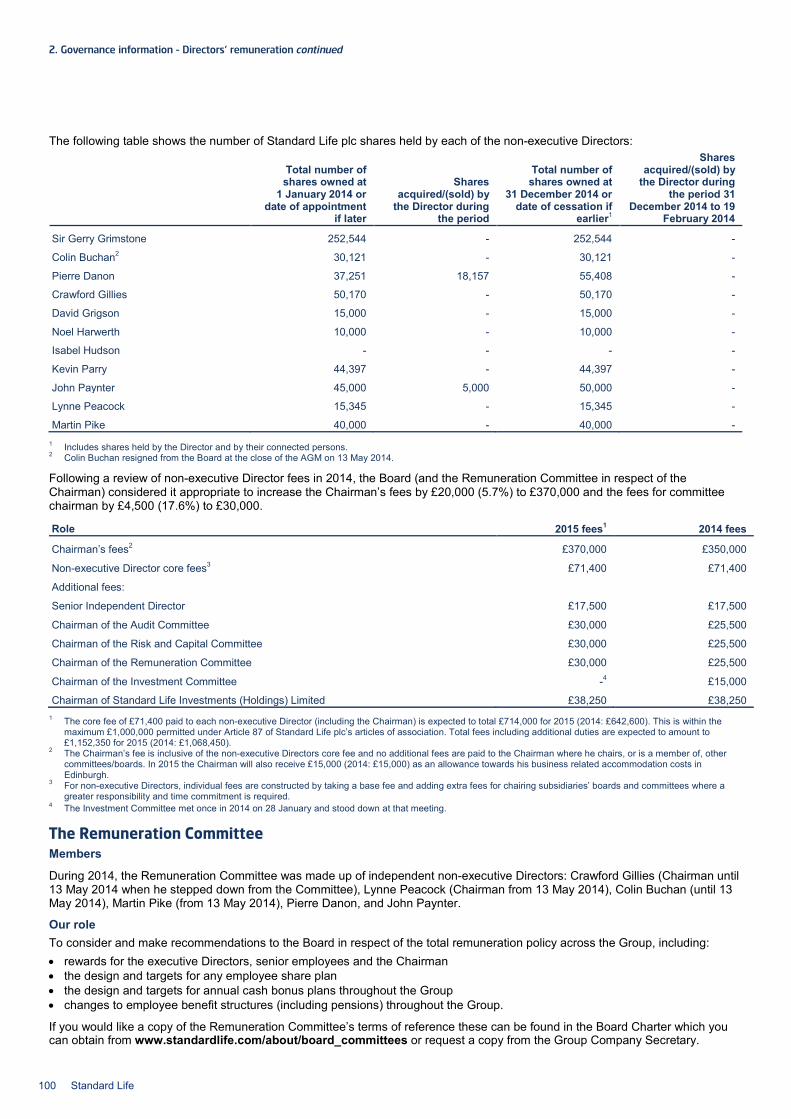
2. Governance information – Directors’ remuneration continued The following table shows the number of Standard Life plc shares held by each of the non-executive Directors:
Total number of shares owned at
1 January 2014 or date of appointment
if later
Shares acquired/(sold) by
the Director during the period
Total number of shares owned at
31 December 2014 or date of cessation if
earlier1
Shares acquired/(sold) by
the Director during the period 31
December 2014 to 19 February 2014
Sir Gerry Grimstone 252,544 - 252,544 -
Colin Buchan2 30,121 - 30,121 -
Pierre Danon 37,251 18,157 55,408 -
Crawford Gillies 50,170 - 50,170 -
David Grigson 15,000 - 15,000 -
Noel Harwerth 10,000 - 10,000 -
Isabel Hudson - - - -
Kevin Parry 44,397 - 44,397 -
John Paynter 45,000 5,000 50,000 -
Lynne Peacock 15,345 - 15,345 -
Martin Pike 40,000 - 40,000 - 1 Includes shares held by the Director and by their connected persons. 2 Colin Buchan resigned from the Board at the close of the AGM on 13 May 2014.
Following a review of non-executive Director fees in 2014, the Board (and the Remuneration Committee in respect of the Chairman) considered it appropriate to increase the Chairman’s fees by £20,000 (5.7%) to £370,000 and the fees for committee chairman by £4,500 (17.6%) to £30,000.
Role 2015 fees1 2014 fees
Chairman’s fees2 £370,000 £350,000
Non-executive Director core fees3 £71,400 £71,400
Additional fees:
Senior Independent Director £17,500 £17,500
Chairman of the Audit Committee £30,000 £25,500
Chairman of the Risk and Capital Committee £30,000 £25,500
Chairman of the Remuneration Committee £30,000 £25,500
Chairman of the Investment Committee -4 £15,000
Chairman of Standard Life Investments (Holdings) Limited £38,250 £38,250 1 The core fee of £71,400 paid to each non-executive Director (including the Chairman) is expected to total £714,000 for 2015 (2014: £642,600). This is within the
maximum £1,000,000 permitted under Article 87 of Standard Life plc’s articles of association. Total fees including additional duties are expected to amount to £1,152,350 for 2015 (2014: £1,068,450).
2 The Chairman’s fee is inclusive of the non-executive Directors core fee and no additional fees are paid to the Chairman where he chairs, or is a member of, other committees/boards. In 2015 the Chairman will also receive £15,000 (2014: £15,000) as an allowance towards his business related accommodation costs in Edinburgh.
3 For non-executive Directors, individual fees are constructed by taking a base fee and adding extra fees for chairing subsidiaries’ boards and committees where a greater responsibility and time commitment is required.
4 The Investment Committee met once in 2014 on 28 January and stood down at that meeting.
The Remuneration Committee Members
During 2014, the Remuneration Committee was made up of independent non-executive Directors: Crawford Gillies (Chairman until 13 May 2014 when he stepped down from the Committee), Lynne Peacock (Chairman from 13 May 2014), Colin Buchan (until 13 May 2014), Martin Pike (from 13 May 2014), Pierre Danon, and John Paynter.
Our role To consider and make recommendations to the Board in respect of the total remuneration policy across the Group, including: • rewards for the executive Directors, senior employees and the Chairman • the design and targets for any employee share plan • the design and targets for annual cash bonus plans throughout the Group • changes to employee benefit structures (including pensions) throughout the Group.
If you would like a copy of the Remuneration Committee’s terms of reference these can be found in the Board Charter which you can obtain from www.standardlife.com/about/board_committees or request a copy from the Group Company Secretary.
100 Standard Life
External advisers The Remuneration Committee received information on comparative pay data from Towers Watson. Pinsent Masons LLP provided legal interpretation of remuneration related regulations to the Remuneration Committee.
During the year, the Remuneration Committee also took advice from Deloitte LLP, who were appointed as external advisors to the Remuneration Committee from October 2011. Deloitte is a member of the Remuneration Consultants’ Group, which is responsible for the stewardship and development of the voluntary code of conduct in relation to executive remuneration consulting in the UK.
A representative from Deloitte LLP attends, by invitation, all Remuneration Committee meetings to provide information and updates on external developments affecting remuneration as well as specific matters raised by the Remuneration Committee. Deloitte LLP also drafted the plan rules and ancillary documentation for the Executive LTIP. Outside of the meetings, the Remuneration Committee's Chairman seeks advice on remuneration matters on an ongoing basis. As well as advising the Remuneration Committee, Deloitte LLP also provided tax, risk, data and real estate advice to the Group during the year. Deloitte Total Rewards and Benefits is an investment adviser to the trustees of the Standard Life Staff Pension Scheme. As well as providing these services, the Group is the current appointed provider for the Defined Contribution Master Plan that Deloitte LLP provides for its employees and Deloitte LLP is one of the employee benefit consultants through which Standard Life has been appointed to provide defined contribution arrangements for Deloitte’s clients through competitive tender.
Fees paid to Deloitte LLP during 2014 for professional advice to the Committee were £132,295.
Where appropriate, the Remuneration Committee receives input from the Chairman, Chief Executive, Chief Financial Officer, Group Operations Officer, Group Reward and Employment Policy Director, Group Chief Risk Officer and the Head of Corporate Governance at Standard Life Investments. This input never relates to their own remuneration.
As noted on page 37, Sir Gerry Grimstone is an independent non-executive of Deloitte LLP. He was appointed to this role to represent the public interest following a recommendation by the Financial Reporting Council that all major audit firms should have such representation. His remuneration for that role is a fixed sum and has no relationship to Deloitte's business activities. Both the Chairman and the Remuneration Committee recognised the need to ensure there is no conflict of interest arising from the appointment of Deloitte LLP to advise the Remuneration Committee. The Chairman did not play a part in the tender and selection process. We were satisfied at the date of the appointment that the nature of the Chairman's appointment to Deloitte LLP did not create a conflict of interest. We continue to monitor this position and are satisfied that the continuing appointment does not give rise to a conflict of interest. Deloitte LLP operates appropriate safeguards to maintain the independence of its advice, for example, the team responsible for providing advice to the Remuneration Committee are not rewarded for cross-selling non-related services to Standard Life and work is contracted for independently from work performed by the rest of the firm. Whilst Sir Gerry Grimstone has access to the Remuneration Committee advisor to the extent that he is invited to attend Remuneration Committee meetings, he does not meet with the Remuneration Committee advisor other than in those meetings to discuss matters relating to Standard Life. Communication between Deloitte LLP and the Remuneration Committee is on instruction from the Remuneration Committee Chairman.
The Committee reviews its remit and effectiveness annually. The 2014 review was carried out both via an internal self-assessment questionnaire and by an independent expert, Niall FitzGerald who was invited to observe one of the Committee meetings as part of his assessment. The review concluded that the Committee continued to: • recognise how the evolution of the Group impacted on remuneration policies and reward design proposals • focus on aligning remuneration structures across the Group.
Activities of the Remuneration Committee The Remuneration Committee met 10 times during 2014. The key issues discussed/approved were: January to March • 2013 Directors’ remuneration report • Approving 2014 executive Director and senior management salaries and the vesting outcomes of the long-term plans and the
2013 bonus plans • Agreeing the 2014 Group scorecard measures • Setting targets for the 2014 Executive LTIP and 2014 annual bonuses.
April to June • Confirmation of the remuneration package for the appointment of the CFO • Code staff - review of population and remuneration • Disposal of the Canadian business.
July to September • Disposal of the Canadian business. October to December • Investor consultation on restatement of targets and changes to the Executive LTIP plan rules • Chairman’s 2015 fee • Performance in 2014.
Standard Life 101
2. Governance information – Directors’ remuneration continued Shareholder voting We remain committed to on-going shareholder dialogue and take an active interest in voting outcomes. Where there are substantial votes against resolutions in relation to Directors’ remuneration, we seek to understand the reasons for any such vote, and will detail here any actions in response to it.
The following tables sets out actual voting on the remuneration policy and 2013 Directors remuneration report presented at the 2014 AGM on 13 May 2014:
For Against Withheld
Policy
(% of total votes cast) 95.8% 4.2%
Policy
(No. of votes cast) 894,269,807 39,117,295 35,158,952
For Against Withheld
2013 Directors Remuneration Report
(% of total votes cast) 97.7% 2.3%
2013 Directors Remuneration Report
(No. of votes cast) 890,059,942 21,307,143 57,170,259
Promoting all-employee share ownership We believe that share ownership by our employees helps them to understand the interests of the Company’s shareholders. On 31 December 2014, 65% of our employees were Standard Life plc shareholders through participation in our share plans. We promote employee share ownership with a range of initiatives: • The Standard Life (Employee) Share Plan which allows employees to buy Standard Life plc shares directly from their earnings.
At 31 December 2014, 3,772 employees (65% of those eligible in the UK) were making a monthly average contribution of £40. A similar tax-approved plan is used in Ireland and has a 60% take-up. Even though the plan cannot be structured on a tax-favourable basis in Germany and Austria, more than 120 employees in these countries are buying shares each month.
• The Standard Life Sharesave Plan which allows UK tax resident employees to save towards the exercise of options over Standard Life plc shares with the option price set at the beginning of the savings period at a discount of up to 20% of the market price. Sharesave invitations have been made annually since 2011 to UK employees and, as at 31 December 2014, just over 3,000 employees in the UK had accepted one or more of the Sharesave offers.
• The Standard Life Ireland Sharesave Plan which launched in August 2012. Invitations have been made annually from August 2012. As at 31 December 2014, 73 employees in Ireland had accepted one or more of the Sharesave Ireland invitations.
Share dilution limits The Executive LTIP, the previous Group LTIP, the Standard Life Investments LTIP, the Standard Life (Employee) Share Plan, the Standard Life Sharesave Plan and the Standard Life Ireland Sharesave Plan contain dilution limits that comply with the guidelines produced by The Investment Association (IA). On 31 December 2014, the Company’s standing against these dilution limits was: • 2.98% where the guideline is no more than 5% in any 10 years under all discretionary share plans in which the executive
Directors participate (Executive LTIP, Group LTIP and Standard Life Investments LTIP) • 3.7% where the guideline is no more than 10% in any 10 years under all share plans (Executive LTIP, Group LTIP, Standard
Life Investments LTIP, Standard Life (Employee) Share Plan, the Sharesave Plan and Sharesave Ireland Plan). As is normal practice, there are employee trusts that operate in conjunction with the Executive LTIP, Group LTIP and Standard Life Investments LTIP and the Standard Life (Employee) Share Plan. On 31 December 2014, the number of unallocated shares held within these trusts was 6,470 in respect of the Standard Life (Employee) Share Plan. In addition, the trusts held 1,081,758 shares acquired to satisfy deferred bonus awards, Executive LTIP, Group LTIP and Standard Life Investments’ LTIP awards and other share plan awards. Of these shares 34,653 are committed to satisfying vested but unexercised awards. The percentage of share capital held by the employee trusts is comfortably less than the 5% best practice limit endorsed by the IA.
Related party transactions All transactions between Directors and the Group are on commercial terms that are equivalent to those available to all employees. During the year to 31 December 2014, the Directors contributed £599,203 (2013: £2,869,942) to products sold by the Group.
Approval This report was approved by the Board on 20 February 2015 and signed on its behalf by:
Lynne Peacock, Chairman, Remuneration Committee 20 February 2015
102 Standard Life

Independent auditors’ report to the members of Standard Life plc Report on the Group financial statements
Our opinion In our opinion, Standard Life plc’s Group financial statements (the ‘financial statements’): • Give a true and fair view of the state of the Group’s affairs as at 31 December 2014 and of its profit and cash flows for the year
then ended • Have been properly prepared in accordance with International Financial Reporting Standards (‘IFRSs’) as adopted by the
European Union • Have been prepared in accordance with the requirements of the Companies Act 2006 and Article 4 of the IAS Regulation.
What we have audited Standard Life plc’s Group financial statements comprise: • The Consolidated statement of financial position as at 31 December 2014 • The Consolidated income statement and Consolidated statement of comprehensive income for the year then ended • The Consolidated statement of cash flows for the year then ended • The Consolidated statement of changes in equity for the year then ended • The Group accounting policies • The notes to the Group financial statements, which include other explanatory information.
We have not audited the Proforma reconciliation of consolidated operating profit for the year ended 31 December 2014 set out on page 112 which was prepared by Standard Life plc.
Certain required disclosures have been presented elsewhere in the Annual report and accounts 2014 (the ‘Annual report’), rather than in the notes to the financial statements. These are cross-referenced from the financial statements and are identified as audited.
The financial reporting framework that has been applied in the preparation of the financial statements is applicable law and IFRSs as adopted by the European Union.
Our audit approach Overview Materiality
• Overall Group materiality was set at £37 million which represents 5% of operating profit before tax.
Scoping
• We identified 9 of the Group's reporting units which, in our view, required an audit of their complete financial information, either due to their size and/or their risk characteristics. These focused on the material reporting units within the UK and Europe, Standard Life Investments and Canada.
• In addition, specific audit procedures on certain account balances and transactions were performed at a further 13 reporting units within the Group across all segments. Additional procedures were also performed at the Group level over the group consolidation and other reporting units in order to obtain further audit evidence.
• Overall we concluded that this gave us the evidence we needed for our opinion on the financial statements as a whole.
Areas of focus
• Our risk assessment identified the following as areas of focus specific to our audit of the financial statements: • The valuation of life insurance contract liabilities, focussing particularly on annuitant mortality assumptions • The valuation of identifiable intangible assets arising from business combinations, focussing on intangible assets
arising as a result of the acquisition of Ignis Asset Management Limited • The valuation of complex financial investments in the financial statements, particularly focussing on investments
where the valuations involved judgements or specialist valuation processes • The presentation and disclosure of the disposal of the Canadian business announced in 2014.
Standard Life 103
3. Financial information – Independent Auditors’ Report on the Group financial statements continued The scope of our audit and our areas of focus
We conducted our audit in accordance with International Standards on Auditing (UK and Ireland) (‘ISAs (UK & Ireland)’).
We designed our audit by determining materiality and assessing the risks of material misstatement in the financial statements. In particular, we looked at where the Directors made subjective judgements, for example in respect of significant accounting estimates that involved making assumptions and considering future events that are inherently uncertain. We also addressed the risk of management override of internal controls, including evaluating whether there was evidence of bias by the Directors that represented a risk of material misstatement due to fraud.
The risks of material misstatement that had the greatest effect on our audit, including the allocation of our resources and effort, are identified as ‘areas of focus’ in the table below. We have also set out how we tailored our audit to address these specific areas in order to provide an opinion on the financial statements as a whole, and any comments we make on the results of our procedures should be read in this context. This is not a complete list of all risks identified by our audit. Area of focus How our audit addressed the area of focus
Valuation of life insurance contract liabilities Refer to page 56 (Audit Committee Report), page120 (Critical accounting estimates and judgement), pages 129 to 131 (Accounting policies) and page 178 to 184 (notes). The Directors’ valuation of the life insurance contract liabilities involves complex judgements about future events, both internal and external to the business, for which small changes in assumptions can result in material impacts to the valuation of these liabilities.
As part of our consideration of the assumptions used to value these liabilities we gave specific focus to the annuitant mortality assumptions given the sensitivity of the Group’s profit to changes in these assumptions and the level of judgement involved in setting the assumptions.
Annuitant mortality assumptions are those related to the life expectancy of annuitants and the rate at which life expectancy is likely to improve. These assumptions are driven by past experience and assumptions about future changes which are based on the Group’s experience together with industry standard tables.
In evaluating the valuation of life insurance contract liabilities, our audit work involved the following: • We obtained audit evidence in respect of the key controls over the
key actuarial models, data collection and analysis and the assumption setting processes used by management, evaluated their design and implementation and tested their operating effectiveness
• To assist in our evaluation of the methodology applied in the models, we focused on significant changes made to those models by obtaining documentation of the key changes from management and assessing these against relevant financial and regulatory reporting requirements and industry standards
• We assessed the key changes in the methodology and the assumptions used against regulatory and financial reporting requirements and industry standards, in particular for the expected future improvements in annuitant mortality. Having ascertained the extent of a change in the methodology and/or the key assumptions that either individually or collectively could result in a material misstatement, we considered the likelihood of such a change in those key assumptions arising.
• Standard Life plc’s assumptions in the UK were also included in PwC’s independent benchmarking survey, which included 25 of the largest life insurers in the UK. This allowed us to compare the assumptions used relative to the Group’s industry peers.
In addition to the above, our audit work in respect of annuitant mortality assumptions included: • Testing of the process by which the assumptions were set,
including evaluating the controls in place over the assumption setting process
• Considering the experience investigations carried out by management on annuity contracts which compared actual experience in the last five years to the assumptions used
• Evaluating the choice of the industry standard Continuous Mortality Investigation (‘CMI’) model and the parameters used.
We determined, based on our audit work, that the assumptions used in the models were appropriate and the methodologies and models used are in line with the prior year and industry accepted practice whilst reflecting the nature of the Group’s life insurance contracts.
104 Standard Life
Area of focus How our audit addressed the area of focus
Valuation of identifiable intangible asset arising from business combinations Refer to page 56 (Audit Committee Report), page 120 (Critical accounting estimates and judgement), page 122 (Accounting policies) and page 136 (notes). The acquisition of Ignis Asset Management Limited during 2014 required the Directors to make significant judgements with respect to the identification and valuation of an intangible asset acquired, being the value of customer contracts acquired.
The value of the intangible asset was determined as at the date of the acquisition in accordance with the requirements of IFRS 3 ’Business combinations‘. The assumptions which had the biggest impact on that valuation, and which also required the Directors to make significant judgements, and were therefore the focus of our work, were those related to the expected growth from future fund flows and performance, profit margins and discount factors.
We also focused on management’s update to the valuation at the year end to reflect movements in the assumptions as a result of post-acquisition events such as fund flows, discount rate and operating margins. This resulted in an impairment charge of £43 million.
Our approach to testing the valuation of the intangible asset as at the date of acquisition included: • Evaluating the methodology applied to the valuation of customer
contracts and assessing whether the assumptions and inputs used in the model reflected the facts and circumstances as at the date of acquisition
• Challenging the assumptions used against our own independent expectations, which were based on our industry knowledge and experience, and checking the consistency of forecast data included in the model with the Group’s own forecasts and business plans approved by the Board.
We tested the value of the intangible asset at year end to assess whether movements in the assumptions were as a results of post-acquisition events, and had been reflected in the value of the intangible asset by: • Agreeing that management’s impairment assessment reflected post
acquisition events by checking that changes made to the assumptions were supported by appropriate evidence
• Evaluating and challenging changes in the forecast fund flows and obtaining evidence to support the historic accuracy of management’s forecasting process
• Challenging changes in the discount rate and obtaining evidence to support the change in risk profile of the forecasts which were being reflected in the change in the discount rate
• Considering the forecast operating margin against our own expectation of a reasonable range based on our experience across the industry.
We considered that, based on our testing: • The assumptions used in the valuation of customer contracts were
appropriate to the circumstances and plans of the Group at the acquisition date and within a reasonable range
• The impairment charge recognised in the Consolidated income statement for the year appropriately reflected post acquisition changes.
Valuation of complex financial investments Refer to page 56 (Audit Committee Report), page 120 (Critical accounting estimates and judgement), pages 125-128 (Accounting policies) and pages 163 to 164 and 168 to 170 (notes) We focused on this area as the valuation of certain complex investments, specifically in respect of derivatives and real estate investments, remains a complex area which requires the use of judgement and/or the involvement of valuation specialists by the Directors.
Due to the nature of these investments, there are a number of key judgements because there is no active market price available. These key judgements include:
• The selection of an appropriate standard market methodology and model for valuing derivatives
• The selection of future rental income and discount rate assumptions for valuing real estate investments.
In obtaining sufficient audit evidence over the valuation of derivatives and real estate investments, our testing included: • Understanding and then testing the key controls over the asset
valuation processes and techniques used in respect of the valuation of derivatives and real estate investments
• Understanding and assessing the models and inputs used for a sample of derivative investments across the investment portfolio for which there is no active market price available. This included recalculating the sample of valuations using independent models and assessing data inputs against recognised independent market data providers.
• Evaluating the methodology, inputs and assumptions used in a sample of real estate investment valuations by comparing the yields and market rents used by third party valuers against published market benchmarks in order to identify any valuations where the main driver or value movement fell outside our expected range. We also met with the third party valuers to understand and challenge the valuation approach and inputs which were in accordance with our expectations based on our own industry experience.
Based on our audit work we found that the judgements used were consistent with prior years and industry practice and that the inputs and assumptions used were within ranges which we considered to be acceptable.
Standard Life 105
3. Financial information – Independent Auditors’ Report on the Group financial statements continued
Area of focus How our audit addressed the area of focus
Presentation and disclosure of business disposals Refer to page 56 (Audit Committee Report), page 132 (Accounting policies) and pages 171 to 172 (notes) We focused on this area following the announcement of the sale of the Canadian business on 4 September 2014, and which completed on 30 January 2015.
As a result of the announcement, IFRS 5 ‘Non-current assets held for sale and discontinued operations’ required the Canadian business to be treated as a discontinued operation in the financial statements. This resulted in a number of presentational changes and disclosures in the financial statements. This could have resulted in the requirements of IFRS 5 not being fully met.
In addition, as a result of the Canadian business being treated as a discontinued operation, the comparative numbers and associated disclosures for the year ended 31 December 2013 were required to be restated.
Our work to audit the presentation and disclosure of the disposal of the Canadian business included: • Obtaining and reading the Share Purchase Agreement, Business
Transfer Agreement, Global Collaboration Agreement and Indemnity Agreement and associated correspondence in respect of the disposal of the Canadian business to assess whether the classification as ‘Held for Sale’ was appropriate
• Assessing the valuation of assets and liabilities in the Canadian business to consider whether any revaluation or impairment was required by considering the headroom between the fair value less costs to sell and the carrying value of assets and liabilities in the Group
• Assessing the completeness and accuracy of the disclosure of discontinued operations against the disclosure requirements of IFRS 5
• Testing the Group’s restatement of the comparative numbers and associated disclosures to assess whether business associated with the sale had been appropriately recognised as discontinued.
Based on the testing undertaken, the presentation and disclosures in respect of the disposal of the Canadian business as a discontinued operation are consistent with the requirements of IFRS 5.
How we tailored the audit scope We tailored the scope of our audit to ensure that we performed enough work to be able to give an opinion on the financial statements as a whole, taking into account our assessment of the risk of material misstatement for each individual account balance and the financial statements as a whole, the geographic structure of the Group, the accounting processes and controls and the industry in which the Group operates.
The Group is now reported in four segments being UK and Europe, Standard Life Investments, Asia and Emerging Markets and Other, and the Canadian operations which are treated as discontinued. These segments are disaggregated into reporting units. The Group’s financial statements are a consolidation of these reporting units.
In establishing the overall approach to the Group audit, we determined the type of work that needed to be performed at the reporting units by us, as the Group engagement team, or component auditors either within PricewaterhouseCoopers LLP or from other PricewaterhouseCoopers network firms operating under our instruction.
We identified nine of the Group's reporting units which, in our view, required an audit of their complete financial information, either due to their size and/or their risk characteristics. These focused on the material reporting units within the UK and Europe, Standard Life Investments and Canada. In addition, specific audit procedures on certain account balances and transactions were performed at a further 13 reporting units within the Group across all segments. Additional procedures were also performed at the Group-level over the Group consolidation and other reporting units in order to obtain further audit evidence. Overall we concluded that this gave us the evidence we needed for our opinion on the financial statements as a whole.
Where the work was performed by component auditors, we determined the level of involvement we needed to have in the audit work performed at those reporting units to be able to conclude whether sufficient appropriate audit evidence had been obtained as a basis for our opinion on the financial statements as a whole. As a result the Group engagement team visited the Canadian operations as the largest overseas component of the audit. This visit involved discussing the audit approach and any issues arising from their work, as well as meeting local management. In addition, the Group engagement team attended internal clearance meetings with component teams either in person or by call.
106 Standard Life
Materiality The scope of our audit was influenced by our application of materiality. We set certain quantitative thresholds for materiality. These, together with qualitative considerations, helped us to determine the scope of our audit and the nature, timing and extent of our audit procedures and to evaluate the effect of misstatements, both individually and on the financial statements as a whole.
Based on our professional judgement, we determined materiality for the financial statements as a whole as follows:
Overall Group materiality £37million (2013: £40 million).
How we determined it 5% of operating profit before tax.
Rationale for benchmark applied In determining our materiality, we have considered financial metrics which we believe to be relevant and concluded that operating profit before tax was a relevant benchmark as it is the key performance measure reported by management and used by others to reflect the underlying performance of the business in both its internal and external reporting to stakeholders, including shareholders and analysts.
We agreed with the Audit Committee that we would report to them misstatements identified during our audit above £2 million (2013: £2 million) as well as misstatements below that amount that, in our view, warranted reporting for qualitative reasons.
Going concern Under the Listing Rules we are required to review the directors’ statement, set out on page 47, in relation to going concern. We have nothing to report having performed our review.
As noted in the directors’ statement, set out on page 47, the Directors have concluded that it is appropriate to prepare the financial statements using the going concern basis of accounting. The going concern basis presumes that the Group has adequate resources to remain in operation, and that the Directors intend it to do so, for at least one year from the date the financial statements were signed. As part of our audit, we have concluded that the Directors’ use of the going concern basis is appropriate.
However, because not all future events or conditions can be predicted, these statements are not a guarantee as to the Group’s ability to continue as a going concern.
Other required reporting
Consistency of other information Companies Act 2006 opinions
In our opinion: • The information given in the Strategic report and the Directors’ report for the financial year for which the financial statements are
prepared is consistent with the financial statements • The information given in the Corporate Governance Statement set out on pages 48 to 70 with respect to internal control and risk
management systems and about share capital structures is consistent with the financial statements.
ISAs (UK & Ireland) reporting
Under ISAs (UK & Ireland) we are required to report to you if, in our opinion:
• Information in the Annual report is: • materially inconsistent with the information in the audited financial statements • apparently materially incorrect based on, or materially inconsistent with, our knowledge
of the Group acquired in the course of performing our audit • otherwise misleading.
We have no exceptions to report arising from this responsibility.
• The statement given by the Directors on page 47, in accordance with provision C.1.1 of the UK Corporate Governance Code (’the Code’), that they consider the Annual report taken as a whole to be fair, balanced and understandable and provides the information necessary for members to assess the Group’s performance, business model and strategy is materially inconsistent with our knowledge of the Group acquired in the course of performing our audit.
We have no exceptions to report arising from this responsibility.
• The section of the Annual report on pages 56 to 58, as required by provision C.3.8 of the Code, describing the work of the Group Audit Committee does not appropriately address matters communicated by us to the Group Audit Committee.
We have no exceptions to report arising from this responsibility.
Standard Life 107
3. Financial information – Independent Auditors’ Report on the Group financial statements continued Adequacy of information and explanations received Under the Companies Act 2006, we are required to report to you if, in our opinion, we have not received all the information and explanations we require for our audit. We have no exceptions to report arising from this responsibility.
Directors’ remuneration Under the Companies Act 2006, we are required to report to you if, in our opinion, certain disclosures of directors’ remuneration specified by law are not made. We have no exceptions to report arising from this responsibility.
Corporate governance statement Under the Companies Act 2006, we are required to report to you if, in our opinion, a corporate governance statement has not been prepared by the Company. We have no exceptions to report arising from this responsibility.
Under the Listing Rules, we are required to review the part of the Corporate Governance Statement relating to the Company’s compliance with ten provisions of the UK Corporate Governance Code. We have nothing to report having performed our review.
Responsibilities for the financial statements and the audit
Our responsibilities and those of the directors As explained more fully in the Directors’ responsibilities statement set out on page 47, the Directors are responsible for the preparation of the financial statements and for being satisfied that they give a true and fair view. Our responsibility is to audit and express an opinion on the financial statements in accordance with applicable law and ISAs (UK & Ireland). Those standards require us to comply with the Auditing Practices Board’s Ethical Standards for Auditors.
This report, including the opinions, has been prepared for and only for the Company’s members as a body in accordance with Chapter 3 of Part 16 of the Companies Act 2006 and for no other purpose. We do not, in giving these opinions, accept or assume responsibility for any other purpose or to any other person to whom this report is shown or into whose hands it may come save where expressly agreed by our prior consent in writing.
What an audit of financial statements involves An audit involves obtaining evidence about the amounts and disclosures in the financial statements sufficient to give reasonable assurance that the financial statements are free from material misstatement, whether caused by fraud or error. This includes an assessment of: • Whether the accounting policies are appropriate to the Group’s circumstances and have been consistently applied and
adequately disclosed • The reasonableness of significant accounting estimates made by the Directors • The overall presentation of the financial statements.
We primarily focus our work in these areas by assessing the Directors’ judgements against available evidence, forming our own judgements, and evaluating the disclosures in the financial statements.
We test and examine information, using sampling and other auditing techniques, to the extent we consider necessary to provide a reasonable basis for us to draw conclusions. We obtain audit evidence through testing the effectiveness of controls, substantive procedures or a combination of both.
In addition, we read all the financial and non-financial information in the Annual Report to identify material inconsistencies with the audited financial statements and to identify any information that is apparently materially incorrect based on, or materially inconsistent with, the knowledge acquired by us in the course of performing the audit. If we become aware of any apparent material misstatements or inconsistencies we consider the implications for our report.
108 Standard Life
Other matter
We have reported separately on the Company financial statements of Standard Life plc for the year ended 31 December 2014 and on the information in the Directors’ remuneration report that is described as having been audited.
Stephanie Bruce (Senior Statutory Auditor) for and on behalf of PricewaterhouseCoopers LLP Chartered Accountants and Statutory Auditors Edinburgh 20 February 2015
(a) The maintenance and integrity of the Standard Life plc website is the responsibility of the directors; the work carried out by the auditors does not involve consideration of these matters and, accordingly, the auditors accept no responsibility for any changes that may have occurred to the financial statements since they were initially presented on the website.
(b) Legislation in the United Kingdom governing the preparation and dissemination of financial statements may differ from legislation in other jurisdictions.
Standard Life 109
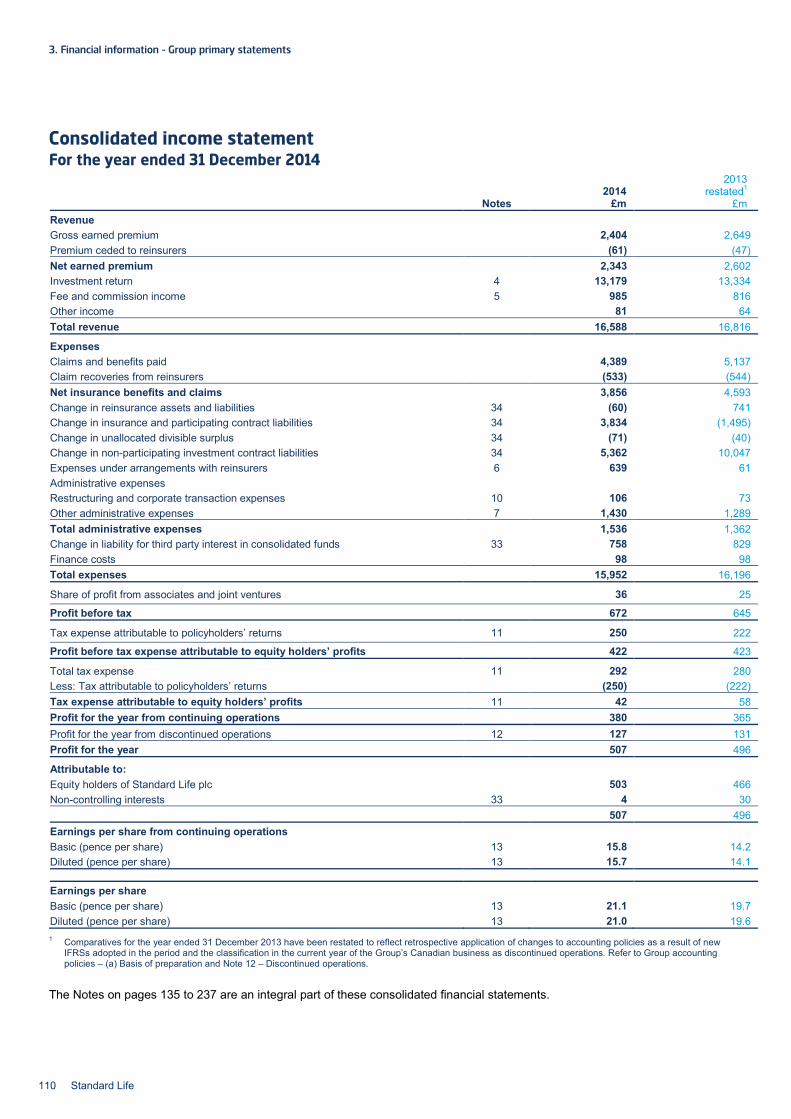
3. Financial information – Group primary statements
Consolidated income statement For the year ended 31 December 2014
2014 2013
restated1 Notes £m £m
Revenue Gross earned premium 2,404 2,649 Premium ceded to reinsurers (61) (47) Net earned premium 2,343 2,602 Investment return 4 13,179 13,334 Fee and commission income 5 985 816 Other income 81 64 Total revenue 16,588 16,816
Expenses Claims and benefits paid 4,389 5,137 Claim recoveries from reinsurers (533) (544) Net insurance benefits and claims 3,856 4,593 Change in reinsurance assets and liabilities 34 (60) 741 Change in insurance and participating contract liabilities 34 3,834 (1,495) Change in unallocated divisible surplus 34 (71) (40) Change in non-participating investment contract liabilities 34 5,362 10,047 Expenses under arrangements with reinsurers 6 639 61 Administrative expenses Restructuring and corporate transaction expenses 10 106 73 Other administrative expenses 7 1,430 1,289 Total administrative expenses 1,536 1,362 Change in liability for third party interest in consolidated funds 33 758 829 Finance costs 98 98 Total expenses 15,952 16,196
Share of profit from associates and joint ventures 36 25
Profit before tax 672 645
Tax expense attributable to policyholders’ returns 11 250 222
Profit before tax expense attributable to equity holders’ profits 422 423
Total tax expense 11 292 280 Less: Tax attributable to policyholders’ returns (250) (222) Tax expense attributable to equity holders’ profits 11 42 58 Profit for the year from continuing operations 380 365 Profit for the year from discontinued operations 12 127 131 Profit for the year 507 496
Attributable to: Equity holders of Standard Life plc 503 466 Non-controlling interests 33 4 30 507 496 Earnings per share from continuing operations Basic (pence per share) 13 15.8 14.2 Diluted (pence per share) 13 15.7 14.1
Earnings per share Basic (pence per share) 13 21.1 19.7 Diluted (pence per share) 13 21.0 19.6 1 Comparatives for the year ended 31 December 2013 have been restated to reflect retrospective application of changes to accounting policies as a result of new
IFRSs adopted in the period and the classification in the current year of the Group’s Canadian business as discontinued operations. Refer to Group accounting policies – (a) Basis of preparation and Note 12 – Discontinued operations.
The Notes on pages 135 to 237 are an integral part of these consolidated financial statements.
110 Standard Life
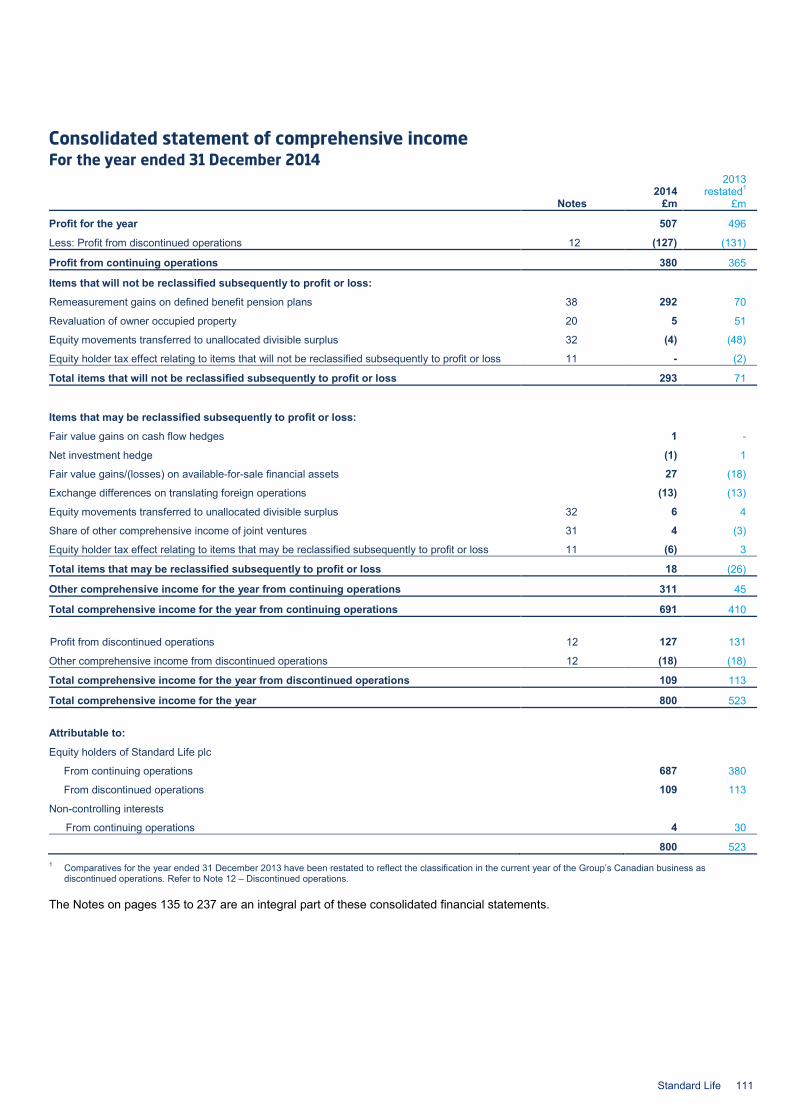
Consolidated statement of comprehensive income For the year ended 31 December 2014
2014 2013
restated1 Notes £m £m
Profit for the year 507 496
Less: Profit from discontinued operations 12 (127) (131)
Profit from continuing operations 380 365
Items that will not be reclassified subsequently to profit or loss:
Remeasurement gains on defined benefit pension plans 38 292 70
Revaluation of owner occupied property 20 5 51
Equity movements transferred to unallocated divisible surplus 32 (4) (48)
Equity holder tax effect relating to items that will not be reclassified subsequently to profit or loss 11 - (2)
Total items that will not be reclassified subsequently to profit or loss 293 71
Items that may be reclassified subsequently to profit or loss:
Fair value gains on cash flow hedges 1 -
Net investment hedge (1) 1
Fair value gains/(losses) on available-for-sale financial assets 27 (18)
Exchange differences on translating foreign operations (13) (13)
Equity movements transferred to unallocated divisible surplus 32 6 4
Share of other comprehensive income of joint ventures 31 4 (3)
Equity holder tax effect relating to items that may be reclassified subsequently to profit or loss 11 (6) 3
Total items that may be reclassified subsequently to profit or loss 18 (26)
Other comprehensive income for the year from continuing operations 311 45
Total comprehensive income for the year from continuing operations 691 410
Profit from discontinued operations 12 127 131
Other comprehensive income from discontinued operations 12 (18) (18)
Total comprehensive income for the year from discontinued operations 109 113
Total comprehensive income for the year 800 523
Attributable to:
Equity holders of Standard Life plc
From continuing operations 687 380
From discontinued operations 109 113
Non-controlling interests
From continuing operations 4 30
800 523 1 Comparatives for the year ended 31 December 2013 have been restated to reflect the classification in the current year of the Group’s Canadian business as
discontinued operations. Refer to Note 12 – Discontinued operations.
The Notes on pages 135 to 237 are an integral part of these consolidated financial statements.
Standard Life 111
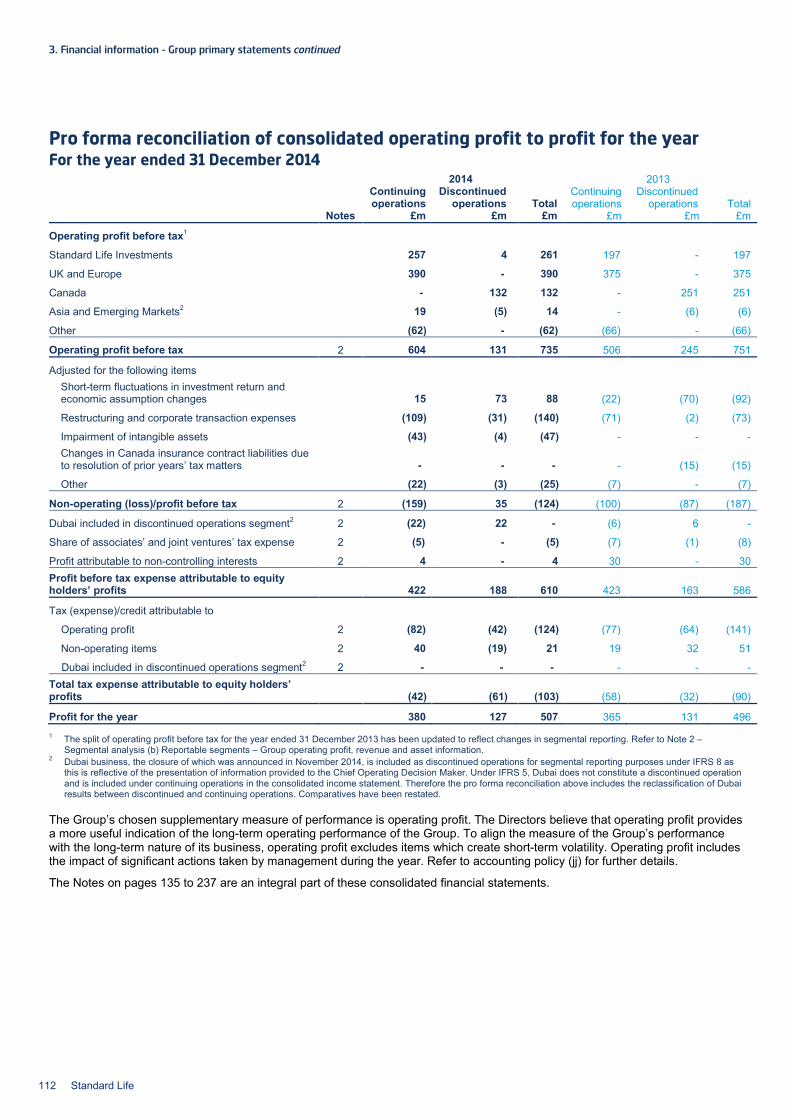
3. Financial information – Group primary statements continued
Pro forma reconciliation of consolidated operating profit to profit for the year For the year ended 31 December 2014 2014 2013
Continuing operations
Discontinued operations Total
Continuing operations
Discontinued operations Total
Notes £m £m £m £m £m £m
Operating profit before tax1
Standard Life Investments 257 4 261 197 - 197
UK and Europe 390 - 390 375 - 375
Canada - 132 132 - 251 251
Asia and Emerging Markets2 19 (5) 14 - (6) (6)
Other (62) - (62) (66) - (66)
Operating profit before tax 2 604 131 735 506 245 751
Adjusted for the following items Short-term fluctuations in investment return and economic assumption changes 15 73 88 (22) (70) (92)
Restructuring and corporate transaction expenses (109) (31) (140) (71) (2) (73)
Impairment of intangible assets (43) (4) (47) - - - Changes in Canada insurance contract liabilities due to resolution of prior years’ tax matters - - - - (15) (15)
Other (22) (3) (25) (7) - (7)
Non-operating (loss)/profit before tax 2 (159) 35 (124) (100) (87) (187)
Dubai included in discontinued operations segment2 2 (22) 22 - (6) 6 -
Share of associates’ and joint ventures’ tax expense 2 (5) - (5) (7) (1) (8)
Profit attributable to non-controlling interests 2 4 - 4 30 - 30 Profit before tax expense attributable to equity holders’ profits 422 188 610 423 163 586
Tax (expense)/credit attributable to
Operating profit 2 (82) (42) (124) (77) (64) (141)
Non-operating items 2 40 (19) 21 19 32 51
Dubai included in discontinued operations segment2 2 - - - - - - Total tax expense attributable to equity holders’ profits (42) (61) (103) (58) (32) (90)
Profit for the year 380 127 507 365 131 496 1 The split of operating profit before tax for the year ended 31 December 2013 has been updated to reflect changes in segmental reporting. Refer to Note 2 –
Segmental analysis (b) Reportable segments – Group operating profit, revenue and asset information. 2 Dubai business, the closure of which was announced in November 2014, is included as discontinued operations for segmental reporting purposes under IFRS 8 as
this is reflective of the presentation of information provided to the Chief Operating Decision Maker. Under IFRS 5, Dubai does not constitute a discontinued operation and is included under continuing operations in the consolidated income statement. Therefore the pro forma reconciliation above includes the reclassification of Dubai results between discontinued and continuing operations. Comparatives have been restated.
The Group’s chosen supplementary measure of performance is operating profit. The Directors believe that operating profit provides a more useful indication of the long-term operating performance of the Group. To align the measure of the Group’s performance with the long-term nature of its business, operating profit excludes items which create short-term volatility. Operating profit includes the impact of significant actions taken by management during the year. Refer to accounting policy (jj) for further details.
The Notes on pages 135 to 237 are an integral part of these consolidated financial statements.
112 Standard Life
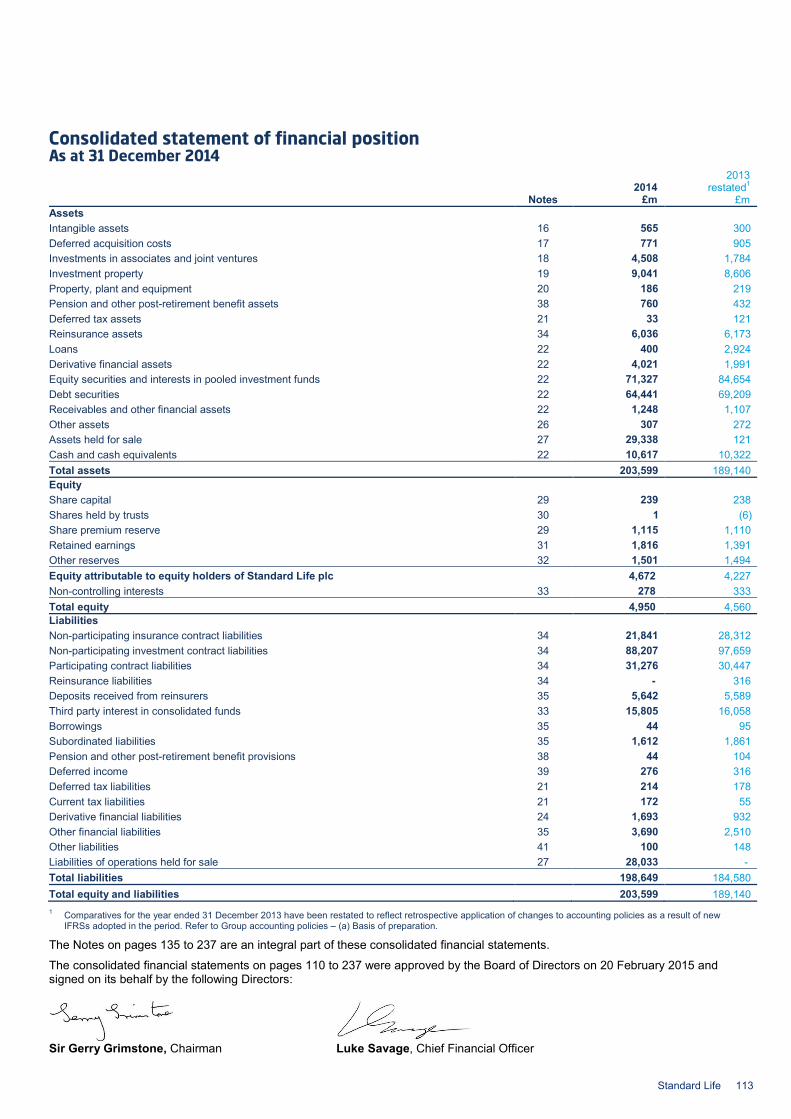
Consolidated statement of financial position As at 31 December 2014
2014 2013
restated1 Notes £m £m
Assets Intangible assets 16 565 300 Deferred acquisition costs 17 771 905 Investments in associates and joint ventures 18 4,508 1,784 Investment property 19 9,041 8,606 Property, plant and equipment 20 186 219 Pension and other post-retirement benefit assets 38 760 432 Deferred tax assets 21 33 121 Reinsurance assets 34 6,036 6,173 Loans 22 400 2,924 Derivative financial assets 22 4,021 1,991 Equity securities and interests in pooled investment funds 22 71,327 84,654 Debt securities 22 64,441 69,209 Receivables and other financial assets 22 1,248 1,107 Other assets 26 307 272 Assets held for sale 27 29,338 121 Cash and cash equivalents 22 10,617 10,322 Total assets 203,599 189,140 Equity Share capital 29 239 238 Shares held by trusts 30 1 (6) Share premium reserve 29 1,115 1,110 Retained earnings 31 1,816 1,391 Other reserves 32 1,501 1,494 Equity attributable to equity holders of Standard Life plc 4,672 4,227 Non-controlling interests 33 278 333 Total equity 4,950 4,560 Liabilities Non-participating insurance contract liabilities 34 21,841 28,312 Non-participating investment contract liabilities 34 88,207 97,659 Participating contract liabilities 34 31,276 30,447 Reinsurance liabilities 34 - 316 Deposits received from reinsurers 35 5,642 5,589 Third party interest in consolidated funds 33 15,805 16,058 Borrowings 35 44 95 Subordinated liabilities 35 1,612 1,861 Pension and other post-retirement benefit provisions 38 44 104 Deferred income 39 276 316 Deferred tax liabilities 21 214 178 Current tax liabilities 21 172 55 Derivative financial liabilities 24 1,693 932 Other financial liabilities 35 3,690 2,510 Other liabilities 41 100 148 Liabilities of operations held for sale 27 28,033 - Total liabilities 198,649 184,580 Total equity and liabilities 203,599 189,140 1 Comparatives for the year ended 31 December 2013 have been restated to reflect retrospective application of changes to accounting policies as a result of new
IFRSs adopted in the period. Refer to Group accounting policies – (a) Basis of preparation. The Notes on pages 135 to 237 are an integral part of these consolidated financial statements.
The consolidated financial statements on pages 110 to 237 were approved by the Board of Directors on 20 February 2015 and signed on its behalf by the following Directors:
Sir Gerry Grimstone, Chairman Luke Savage, Chief Financial Officer
Standard Life 113
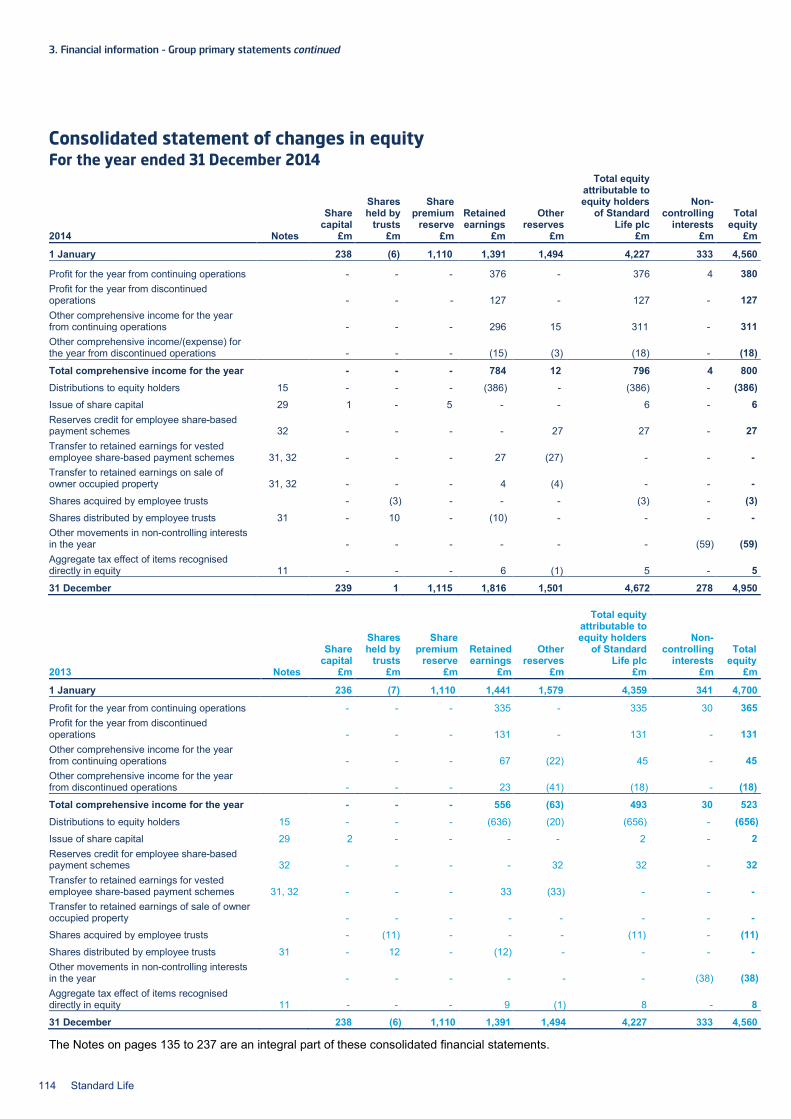
3. Financial information – Group primary statements continued
Consolidated statement of changes in equity For the year ended 31 December 2014
Share
capital
Shares held by
trusts
Share premium
reserve Retained earnings
Other reserves
Total equity attributable to equity holders
of Standard Life plc
Non-controlling
interests Total
equity 2014 Notes £m £m £m £m £m £m £m £m
1 January 238 (6) 1,110 1,391 1,494 4,227 333 4,560
Profit for the year from continuing operations - - - 376 - 376 4 380 Profit for the year from discontinued operations - - - 127 - 127 - 127 Other comprehensive income for the year from continuing operations - - - 296 15 311 - 311 Other comprehensive income/(expense) for the year from discontinued operations - - - (15) (3) (18) - (18)
Total comprehensive income for the year - - - 784 12 796 4 800 Distributions to equity holders 15 - - - (386) - (386) - (386) Issue of share capital 29 1 - 5 - - 6 - 6 Reserves credit for employee share-based payment schemes 32 - - - - 27 27 - 27 Transfer to retained earnings for vested employee share-based payment schemes 31, 32 - - - 27 (27) - - - Transfer to retained earnings on sale of owner occupied property 31, 32 - - - 4 (4) - - - Shares acquired by employee trusts - (3) - - - (3) - (3) Shares distributed by employee trusts 31 - 10 - (10) - - - - Other movements in non-controlling interests in the year - - - - - - (59) (59) Aggregate tax effect of items recognised directly in equity 11 - - - 6 (1) 5 - 5
31 December 239 1 1,115 1,816 1,501 4,672 278 4,950
Share
capital
Shares held by
trusts
Share premium
reserve Retained earnings
Other reserves
Total equity attributable to equity holders
of Standard Life plc
Non-controlling
interests Total
equity 2013 Notes £m £m £m £m £m £m £m £m
1 January 236 (7) 1,110 1,441 1,579 4,359 341 4,700
Profit for the year from continuing operations - - - 335 - 335 30 365 Profit for the year from discontinued operations - - - 131 - 131 - 131 Other comprehensive income for the year from continuing operations - - - 67 (22) 45 - 45 Other comprehensive income for the year from discontinued operations - - - 23 (41) (18) - (18)
Total comprehensive income for the year - - - 556 (63) 493 30 523 Distributions to equity holders 15 - - - (636) (20) (656) - (656) Issue of share capital 29 2 - - - - 2 - 2 Reserves credit for employee share-based payment schemes 32 - - - - 32 32 - 32 Transfer to retained earnings for vested employee share-based payment schemes 31, 32 - - - 33 (33) - - - Transfer to retained earnings of sale of owner occupied property - - - - - - - - Shares acquired by employee trusts - (11) - - - (11) - (11) Shares distributed by employee trusts 31 - 12 - (12) - - - - Other movements in non-controlling interests in the year - - - - - - (38) (38) Aggregate tax effect of items recognised directly in equity 11 - - - 9 (1) 8 - 8
31 December 238 (6) 1,110 1,391 1,494 4,227 333 4,560
The Notes on pages 135 to 237 are an integral part of these consolidated financial statements.
114 Standard Life
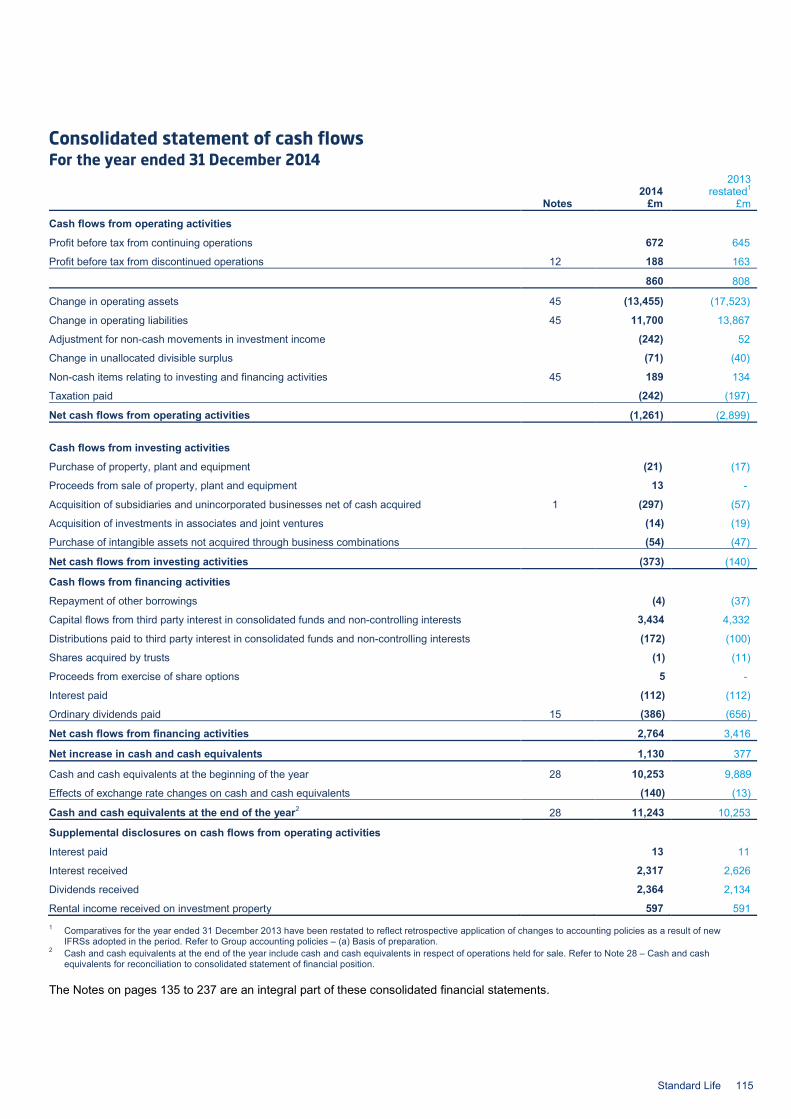
Consolidated statement of cash flows For the year ended 31 December 2014
2014 2013
restated1 Notes £m £m
Cash flows from operating activities
Profit before tax from continuing operations 672 645
Profit before tax from discontinued operations 12 188 163
860 808
Change in operating assets 45 (13,455) (17,523)
Change in operating liabilities 45 11,700 13,867
Adjustment for non-cash movements in investment income (242) 52
Change in unallocated divisible surplus (71) (40)
Non-cash items relating to investing and financing activities 45 189 134
Taxation paid (242) (197)
Net cash flows from operating activities (1,261) (2,899)
Cash flows from investing activities
Purchase of property, plant and equipment (21) (17)
Proceeds from sale of property, plant and equipment 13 -
Acquisition of subsidiaries and unincorporated businesses net of cash acquired 1 (297) (57)
Acquisition of investments in associates and joint ventures (14) (19)
Purchase of intangible assets not acquired through business combinations (54) (47)
Net cash flows from investing activities (373) (140)
Cash flows from financing activities
Repayment of other borrowings (4) (37)
Capital flows from third party interest in consolidated funds and non-controlling interests 3,434 4,332
Distributions paid to third party interest in consolidated funds and non-controlling interests (172) (100)
Shares acquired by trusts (1) (11)
Proceeds from exercise of share options 5 -
Interest paid (112) (112)
Ordinary dividends paid 15 (386) (656)
Net cash flows from financing activities 2,764 3,416
Net increase in cash and cash equivalents 1,130 377
Cash and cash equivalents at the beginning of the year 28 10,253 9,889
Effects of exchange rate changes on cash and cash equivalents (140) (13)
Cash and cash equivalents at the end of the year2 28 11,243 10,253
Supplemental disclosures on cash flows from operating activities
Interest paid 13 11
Interest received 2,317 2,626
Dividends received 2,364 2,134
Rental income received on investment property 597 591 1 Comparatives for the year ended 31 December 2013 have been restated to reflect retrospective application of changes to accounting policies as a result of new
IFRSs adopted in the period. Refer to Group accounting policies – (a) Basis of preparation. 2 Cash and cash equivalents at the end of the year include cash and cash equivalents in respect of operations held for sale. Refer to Note 28 – Cash and cash
equivalents for reconciliation to consolidated statement of financial position.
The Notes on pages 135 to 237 are an integral part of these consolidated financial statements.
Standard Life 115
3. Financial information – Group accounting policies
Group accounting policies (a) Basis of preparation These consolidated financial statements have been prepared in accordance with International Financial Reporting Standards (IFRS) issued by the International Accounting Standards Board (IASB) as endorsed by the European Union (EU), with interpretations issued by the International Financial Reporting Interpretations Committee (IFRIC), and with those parts of the Companies Act 2006 applicable to companies reporting under IFRS. The consolidated financial statements have been prepared on a going concern basis and under the historical cost convention, as modified by the revaluation of investment property, owner occupied property, available-for-sale financial assets, and financial assets and financial liabilities (including derivative instruments) at fair value through profit or loss (FVTPL).
The principal accounting policies set out below have been consistently applied to all financial reporting periods presented in these consolidated financial statements.
(a)(i) New standards, interpretations and amendments to existing standards that have been adopted by the Group The Group has adopted the following new International Financial Reporting Standards (IFRSs), International Accounting Standards (IASs), interpretations and amendments to existing standards, which are effective by EU endorsement for annual periods beginning on or after 1 January 2014 unless otherwise stated. The Group’s accounting policies have been updated to reflect these. IFRS 10 Consolidated Financial Statements and amendments to IAS 27 Separate Financial Statements IFRS 10 introduces a single consolidation model to be applied to all entities and replaces previous requirements on control and consolidation in IAS 27 Consolidated and Separate Financial Statements and Standing Interpretations Committee (SIC) 12 Consolidation – Special Purpose Entities. IFRS 10 defines control, determines how to identify if an investor controls an investee and requires an investor to consolidate entities it controls under the new definition. IFRS 10 identifies three elements, all of which must be present for an investor to control an investee, which are as follows: • Power over the investee • Exposure, or rights, to variable returns from its involvement with the investee • The ability to use that power over the investee to affect the amount of the returns.
The standard has been adopted retrospectively subject to the transition guidance which permits retrospective application only in circumstances when the outcome of the control assessment for individual entities at the date of initial application differs from the outcome under the previous accounting policy. The date of initial application for the Group’s financial statements is 1 January 2014.
The application of IFRS 10 has resulted in the consolidation of entities which were previously out of scope of consolidation. The impact of IFRS 10 on the consolidated income statement and the consolidated statement of financial position for the comparative period is shown in the tables in (a)(iii).
IFRS 11 Joint Arrangements IFRS 11 defines and establishes accounting principles for joint arrangements and replaces previous requirements in IAS 31 Interests in Joint Ventures and SIC 13 Jointly Controlled Entities – Non-Monetary Contributions by Venturers. The standard distinguishes between two types of joint arrangements – joint ventures and joint operations – based on how rights and obligations are shared by the parties to the arrangement. Joint operators should recognise their share of the assets, liabilities, revenue and expenses of the interest in accordance with applicable IFRSs. Joint venturers should apply the equity method of accounting prescribed in IAS 28 Investments in Associates and Joint Ventures 2011 to account for their interest. The adoption of IFRS 11 has resulted in six entities which were previously classified as jointly controlled entities under IAS 31 being classified as joint operations. As a result the Group’s share of these entities’ assets, liabilities, revenues and expenses are now recognised in accordance with applicable IFRS. The standard has been applied retrospectively and the impact on the consolidated income statement and the consolidated statement of financial position for the comparative period is shown in the tables in (a)(iii).
IFRS 12 Disclosure of Interests in Other Entities IFRS 12 is a single disclosure standard which applies to all entities that have an interest in a subsidiary, a joint arrangement, an associate or an unconsolidated structured entity. IFRS 12 requires entities to disclose information to enable users of the financial statements to evaluate the nature, risks and financial effects associated with interests in other entities. The required disclosures are grouped into the following main categories: • Significant judgements and assumptions • Interests in subsidiaries • Interests in joint arrangements and associates • Interests in unconsolidated structured entities.
The required disclosures are provided in the Group accounting policies, Note 1 – Group structure, Note 18 – Investments in associates and joint ventures, Note 33 – Non-controlling interests and third party interest in consolidated funds and Note 43 – Structured entities.
116 Standard Life
IAS 28 Investments in Associates and Joint Ventures (2011) IAS 28 (2011) is revised to include joint ventures as well as associates. Additionally, the scope exception within IAS 28 for investments in associates held by venture capital organisations, or mutual funds, unit trusts and similar entities, including investment linked insurance funds, has been removed and as a result the scope of the standard has been widened to include all investments in any entity over which the Group has significant influence. The standard has been revised to allow an entity to elect to measure an investment in associate at fair value through profit or loss (FVTPL) where that investment is held by, or indirectly through, venture capital organisations, or mutual funds, unit trusts and similar entities, including investment linked insurance funds.
The impact of the adoption of IAS 28 (2011) is that a number of equity investments in entities over which the Group has significant influence which were previously out of scope of IAS 28 have now been brought into scope resulting in the reclassification of these investments as investments in associates. Where the FVTPL election is available the Group has continued to measure these investments at FVTPL. All other investments in associates are measured using the equity method. The standard has been applied retrospectively and the impact on the consolidated income statement and the consolidated statement of financial position for the comparative period is shown in the tables in (a)(iii).
Other Additionally the Group has adopted the following amendments to existing standards which are effective by EU endorsement from 1 January 2014 and management considers the implementation of these amendments has had no significant impact on the Group’s financial statements: • Amendments to IAS 39 Financial Instruments: Recognition and Measurement • Amendments to IAS 32 Financial Instruments: Presentation • Amendments to IAS 36 Impairment of Assets.
(a)(ii) Standards, interpretations and amendments to existing standards that are not yet effective and have not
been early adopted by the Group Certain new standards, interpretations and amendments to existing standards have been published that are mandatory for the Group’s annual accounting periods beginning on or after 1 January 2015. The Group has not early adopted the standards, amendments and interpretations described below:
IFRS 15 Revenue from Contracts with Customers (effective for annual periods beginning on or after 1 January 2017) IFRS 15 will replace IAS 11 Construction Contracts, IAS 18 Revenue, IFRIC 13 Customer Loyalty Programmes, IFRIC 15 Agreements on the Construction of Real Estate, IFRIC 18 Transfer of Assets from Customers and SIC-31 Revenue Barter Transactions Involving Advertising Services. IFRS 15 provides a new revenue recognition model for contracts with customers. The model provides a five step process for determining recognition and measurement of revenue, and considers two approaches to recognise revenue: at a point in time or over time. Extensive new disclosure requirements and estimate and judgment thresholds have been introduced. The adoption of IFRS 15 is expected to have a significant impact on the measurement and presentation of revenue and related balances in the consolidated financial statements of the Group. The standard has not yet been endorsed by the EU.
IFRS 9 Financial Instruments (effective for annual periods beginning on or after 1 January 2018) IFRS 9 will replace IAS 39 Financial Instruments: Recognition and Measurement. IFRS 9 allows only two measurement categories for financial assets: amortised cost and fair value. All equity instruments are measured at fair value. A debt instrument is measured at amortised cost only if it is held to collect contractual cash flows and the cash flows represent principal and interest, otherwise it is measured at fair value through other comprehensive income or fair value through profit or loss (FVTPL) depending on the business model it is held within or whether the option to adopt FVTPL has been applied. IFRS 9 also introduces a new impairment model, an expected credit loss model which will replace the current incurred loss model in IAS 39. An impairment loss may now be recognised prior to a loss event occurring. Financial liabilities may be designated as at FVTPL. The amortised cost measurement basis is applied to most other financial liabilities. For financial liabilities designated as at FVTPL, changes in the fair value due to changes in the liability’s credit risk are recognised directly in other comprehensive income. Additionally IFRS 9 removes and replaces the current requirements for hedge effectiveness in IAS 39 and therefore the requirements for the application of hedge accounting. The new requirements change what qualifies as a hedged item and some of the restrictions on the use of some hedging instruments. The accounting and presentation requirements remain largely unchanged. However, entities will now be required to reclassify the gains and losses accumulated in equity on a cash flow hedge to the carrying amount of a non-financial hedged item when it is initially recognised.
As well as presentation and measurement changes, IFRS 9 also introduces additional disclosure requirements. The standard has not yet been endorsed by the EU.
The adoption of IFRS 9 is expected to have a significant impact on the measurement and presentation of financial instruments and related balances in the consolidated financial statements of the Group.
Standard Life 117
3. Financial information – Group accounting policies continued
Group accounting policies continued (a) Basis of preparation continued (a)(ii) Standards, interpretations and amendments to existing standards that are not yet effective and have not
been early adopted by the Group continued Other In addition to IFRS 9 and IFRS 15, the following interpretations and amendments to existing standards have not been early adopted and are not expected to have a significant impact on the financial statements of the Group:
Standard, amendment or interpretation
Effective Date1 Detail EU endorsement status
IFRIC 21 Levies 17 June 2014 The interpretation clarifies that an entity recognises a liability for a levy when and only when the triggering event specified in the legislation occurs.
Endorsed
Amendments to IAS 19 Defined Benefit Plans: Employee Contributions
1 July 2014 The amendments clarify the requirements for attributing employee and third party contributions to periods of service and recognising employee and third party contributions in certain situations.
Endorsed
Annual improvements 2010-2012 cycle and Annual improvements 2011-2013 cycle
1 July 2014 These annual improvement cycles make 11 minor amendments to existing standards.
Endorsed
Amendment to IAS 16 Property, Plant & Equipment and IAS 38 Intangible Assets: Depreciation and Amortisation
1 January 2016 The amendment clarifies the appropriate application of revenue based depreciation or amortisation. The amendment clarifies that revenue based depreciation is not appropriate for property, plant and equipment and, in most circumstances, revenue based amortisation is not appropriate for intangible assets however this is rebuttable.
Not yet endorsed
Amendments to IAS 27 Separate Financial Statements: Equity Method in Separate Financial Statements
1 January 2016 The amendments now permit the application of the equity method of accounting in separate financial statements for associates and joint ventures as well as subsidiaries.
Not yet endorsed
Amendment to IFRS 10 Consolidated Financial Statements and IAS 28 Investments in Associates and Joint Ventures: Sale or Contribution of Assets between an Investor and its Associate or Joint Venture
1 January 2016 The amendment addresses an inconsistency between IFRS 10 and IAS 28 and clarifies the treatment of a sale or contribution of assets between investors and associates or joint ventures.
Not yet endorsed
Amendment to IFRS 11 Joint arrangements: Accounting for Acquisitions of Interests in Joint Operations
1 January 2016 The amendment to IFRS 11 requires the application of business combination accounting for the acquisition of the interest in a joint operation which constitutes a business.
Not yet endorsed
Annual improvements 2012-2014 cycle
1 January 2016 This annual improvements cycle makes five minor amendments to existing standards.
Not yet endorsed
Amendments to IFRS 10 Consolidated Financial Statements, IFRS 12 Disclosure of Interests in Other Entities, IAS 28 Investments in Associates and Joint Ventures: Applying the Consolidation Exception
1 January 2016
The amendments allow the fair value measurement of subsidiaries of associates or joint ventures to be retained in applying the equity method of accounting for interests in associates or joint ventures that are investment entities. Additionally the amendments clarify the circumstances in which the exemption for investment entities from preparing consolidated financial statements apply and that only a subsidiary which is not an investment entity and provides support services to an investment entity is consolidated.
Not yet endorsed
Amendments to IAS 1 Presentation of Financial Instruments: Disclosure Initiative
1 January 2016 The amendments clarify guidance on presentation in relation to materiality, disaggregation and subtotals, notes, disclosure of accounting policies and other comprehensive income arising from investments accounted for under the equity method.
Not yet endorsed
1 For annual periods beginning on or after.
118 Standard Life
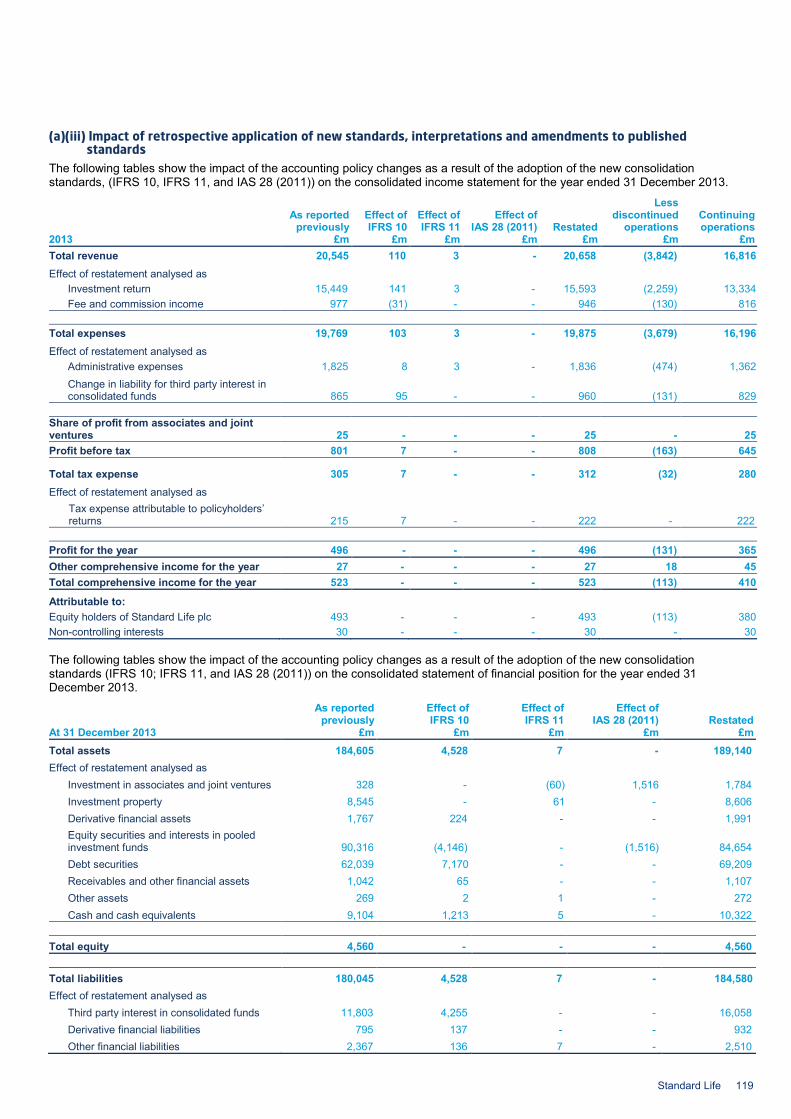
(a)(iii) Impact of retrospective application of new standards, interpretations and amendments to published
standards The following tables show the impact of the accounting policy changes as a result of the adoption of the new consolidation standards, (IFRS 10, IFRS 11, and IAS 28 (2011)) on the consolidated income statement for the year ended 31 December 2013.
As reported
previously Effect of IFRS 10
Effect of IFRS 11
Effect of IAS 28 (2011) Restated
Less discontinued
operations Continuing operations
2013 £m £m £m £m £m £m £m Total revenue 20,545 110 3 - 20,658 (3,842) 16,816 Effect of restatement analysed as
Investment return 15,449 141 3 - 15,593 (2,259) 13,334 Fee and commission income 977 (31) - - 946 (130) 816
Total expenses 19,769 103 3 - 19,875 (3,679) 16,196 Effect of restatement analysed as
Administrative expenses 1,825 8 3 - 1,836 (474) 1,362 Change in liability for third party interest in consolidated funds 865 95 - - 960 (131) 829
Share of profit from associates and joint ventures 25 - - - 25 - 25 Profit before tax 801 7 - - 808 (163) 645
Total tax expense 305 7 - - 312 (32) 280 Effect of restatement analysed as
Tax expense attributable to policyholders’ returns 215 7 - - 222 - 222
Profit for the year 496 - - - 496 (131) 365 Other comprehensive income for the year 27 - - - 27 18 45 Total comprehensive income for the year 523 - - - 523 (113) 410
Attributable to: Equity holders of Standard Life plc 493 - - - 493 (113) 380 Non-controlling interests 30 - - - 30 - 30
The following tables show the impact of the accounting policy changes as a result of the adoption of the new consolidation standards (IFRS 10; IFRS 11, and IAS 28 (2011)) on the consolidated statement of financial position for the year ended 31 December 2013.
As reported previously
Effect of IFRS 10
Effect of IFRS 11
Effect of IAS 28 (2011) Restated
At 31 December 2013 £m £m £m £m £m Total assets 184,605 4,528 7 - 189,140 Effect of restatement analysed as
Investment in associates and joint ventures 328 - (60) 1,516 1,784 Investment property 8,545 - 61 - 8,606 Derivative financial assets 1,767 224 - - 1,991 Equity securities and interests in pooled investment funds 90,316 (4,146) - (1,516) 84,654 Debt securities 62,039 7,170 - - 69,209 Receivables and other financial assets 1,042 65 - - 1,107 Other assets 269 2 1 - 272 Cash and cash equivalents 9,104 1,213 5 - 10,322
Total equity 4,560 - - - 4,560 Total liabilities 180,045 4,528 7 - 184,580 Effect of restatement analysed as
Third party interest in consolidated funds 11,803 4,255 - - 16,058 Derivative financial liabilities 795 137 - - 932 Other financial liabilities 2,367 136 7 - 2,510
Standard Life 119
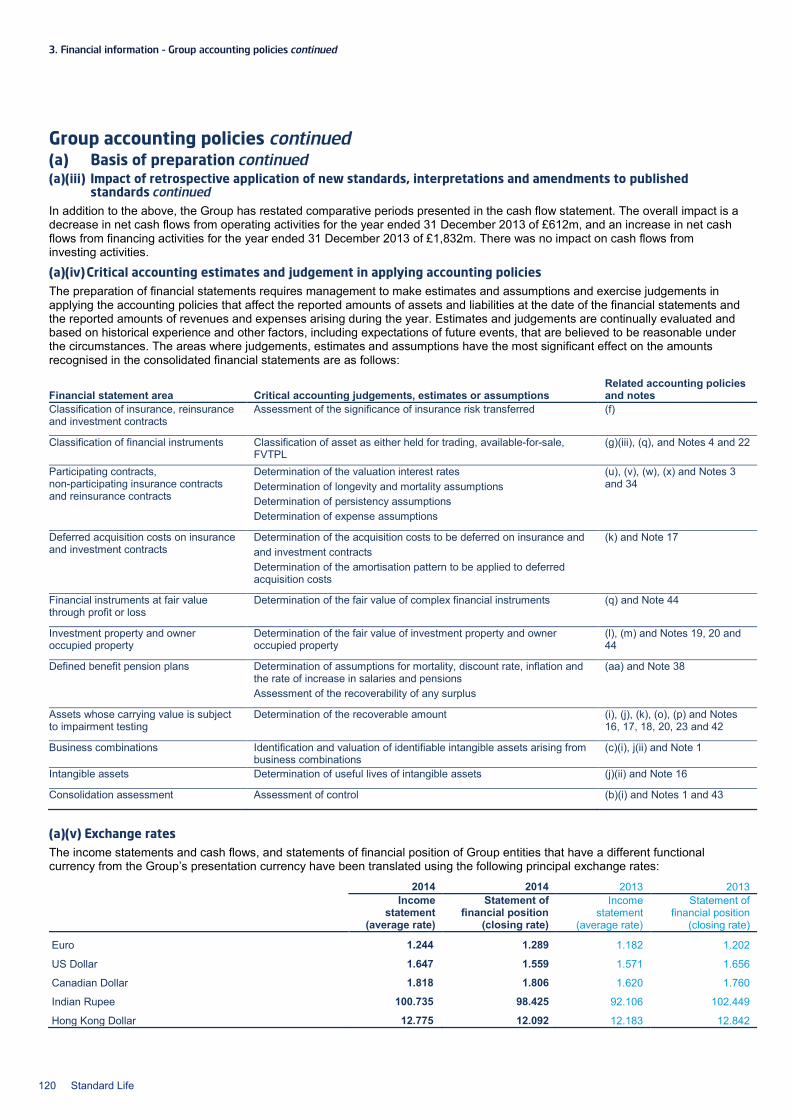
3. Financial information – Group accounting policies continued
Group accounting policies continued (a) Basis of preparation continued (a)(iii) Impact of retrospective application of new standards, interpretations and amendments to published
standards continued In addition to the above, the Group has restated comparative periods presented in the cash flow statement. The overall impact is a decrease in net cash flows from operating activities for the year ended 31 December 2013 of £612m, and an increase in net cash flows from financing activities for the year ended 31 December 2013 of £1,832m. There was no impact on cash flows from investing activities.
(a)(iv) Critical accounting estimates and judgement in applying accounting policies The preparation of financial statements requires management to make estimates and assumptions and exercise judgements in applying the accounting policies that affect the reported amounts of assets and liabilities at the date of the financial statements and the reported amounts of revenues and expenses arising during the year. Estimates and judgements are continually evaluated and based on historical experience and other factors, including expectations of future events, that are believed to be reasonable under the circumstances. The areas where judgements, estimates and assumptions have the most significant effect on the amounts recognised in the consolidated financial statements are as follows:
Financial statement area Critical accounting judgements, estimates or assumptions Related accounting policies and notes
Classification of insurance, reinsurance and investment contracts
Assessment of the significance of insurance risk transferred
(f)
Classification of financial instruments Classification of asset as either held for trading, available-for-sale, FVTPL
(g)(iii), (q), and Notes 4 and 22
Participating contracts, non-participating insurance contracts and reinsurance contracts
Determination of the valuation interest rates Determination of longevity and mortality assumptions Determination of persistency assumptions Determination of expense assumptions
(u), (v), (w), (x) and Notes 3 and 34
Deferred acquisition costs on insurance and investment contracts
Determination of the acquisition costs to be deferred on insurance and and investment contracts Determination of the amortisation pattern to be applied to deferred acquisition costs
(k) and Note 17
Financial instruments at fair value through profit or loss
Determination of the fair value of complex financial instruments (q) and Note 44
Investment property and owner occupied property
Determination of the fair value of investment property and owner occupied property
(l), (m) and Notes 19, 20 and 44
Defined benefit pension plans Determination of assumptions for mortality, discount rate, inflation and the rate of increase in salaries and pensions Assessment of the recoverability of any surplus
(aa) and Note 38
Assets whose carrying value is subject to impairment testing
Determination of the recoverable amount (i), (j), (k), (o), (p) and Notes 16, 17, 18, 20, 23 and 42
Business combinations Identification and valuation of identifiable intangible assets arising from business combinations
(c)(i), j(ii) and Note 1
Intangible assets Determination of useful lives of intangible assets (j)(ii) and Note 16
Consolidation assessment Assessment of control (b)(i) and Notes 1 and 43
(a)(v) Exchange rates The income statements and cash flows, and statements of financial position of Group entities that have a different functional currency from the Group’s presentation currency have been translated using the following principal exchange rates:
2014 2014 2013 2013 Income
statement (average rate)
Statement of financial position
(closing rate)
Income statement
(average rate)
Statement of financial position
(closing rate)
Euro 1.244 1.289 1.182 1.202
US Dollar 1.647 1.559 1.571 1.656
Canadian Dollar 1.818 1.806 1.620 1.760
Indian Rupee 100.735 98.425 92.106 102.449
Hong Kong Dollar 12.775 12.092 12.183 12.842
120 Standard Life
(b) Basis of consolidation The Group’s financial statements consolidate the financial statements of the Company and its subsidiary undertakings. Associate and joint venture undertakings are accounted for either using the equity method from the date that significant influence or joint control, respectively, commences until the date this ceases, or at fair value through profit or loss (FVTPL).
(b)(i) Subsidiaries Subsidiaries are all entities over which the Group has control. The Group is considered to control an entity when it has power over the entity, is exposed, or has rights, to variable returns from its involvement with the entity and has the ability to affect those returns through its power. For operating entities this generally accompanies a shareholding of 50% or more in the entity. For investment vehicles, including structured entities, the control assessment also considers the removal rights of other investors and whether the Group acts as principal or agent in assessing the link between power and variable returns. In determining whether the Group acts as principal, and therefore controls the entity, the scope of the Group’s decision-making authority and the magnitude of the variability associated with the returns are also taken into account. As a result, the Group often is considered to control investment vehicles in which its shareholding is less than 50%.
Subsidiaries are fully consolidated from the date on which control is transferred to the Group until the date that control ceases.
Intra-group transactions, balances and unrealised gains on intra-group transactions are eliminated. Unrealised losses are also eliminated unless the transactions provide evidence of an impairment of the asset transferred. Subsidiaries’ accounting policies have been changed where necessary to ensure consistency with the policies adopted by the Group.
Where the Group is considered to control an investment vehicle, such as an open-ended investment company, a unit trust or a limited partnership, and it is therefore consolidated, the interests of parties other than the Group are assessed to determine whether they should be classified as liabilities or as non-controlling interests. Those that are liabilities are separated into two components being an investment management services component and a financial liability. The financial liability component is recognised in the third party interest in consolidated funds line in the consolidated statement of financial position and any movements are recognised in the consolidated income statement. The financial liability is designated at FVTPL as it is implicitly managed on a fair value basis as its value is directly linked to the market value of the underlying portfolio of assets. The interests of parties other than the Group in all other types of entities are recorded as non-controlling interests.
(b)(ii) Associates and joint arrangements Associates are entities over which the Group has significant influence but not control. Significant influence is the power to participate in the financial and operating policy decisions of the investee. The Group considers itself to have significant influence over entities where, through its role as investment manager, it has decision making power over the relevant activities of that entity. As a result the Group classifies all Group managed investment vehicles as associates even though it may hold less than 20% of the voting rights of the investment vehicle.
Where the Group has an investment in an associate, a portion of which is held indirectly through a mutual fund, unit trust or similar entity, including investment-linked insurance funds, that portion of the investment is measured at fair value through profit or loss (FVTPL) in accordance with IAS 39. All other investments in associates are accounted for using the equity method.
The Group also has investments in joint arrangements which are classified as joint operations when the Group has joint control of rights to the assets and obligations for the liabilities of the arrangement and classified as joint ventures when the Group has joint control of the rights to the net assets of the arrangements.
Joint operations are accounted for by recognising the Group’s share of the assets, liabilities, revenues and expenses of the arrangement in accordance with applicable IFRSs. Joint ventures are accounted for using the equity method.
Investments in associates and joint ventures that are accounted for using the equity method are initially recognised at cost and adjusted thereafter for the post-acquisition change in the Group’s share of net assets of the associate and joint ventures. The Group’s share of post-acquisition profit or loss of its associates and joint ventures is recognised in the consolidated income statement and its share of post-acquisition movements in other comprehensive income is recognised in other comprehensive income. The cumulative post-acquisition movements are adjusted against the carrying amount of the investment.
The Group’s investment in associates and joint ventures recognised in the consolidated statement of financial position includes goodwill, net of any impairment loss, identified on acquisition.
Where the Group’s share of losses from an associate or joint venture accounted for using the equity method equals or exceeds its interest in the associate or joint venture, including any other unsecured receivables, the Group’s carrying amount is reduced to nil and recognition of further losses is discontinued except to the extent that the Group has incurred legal or constructive obligations in connection with or made payments on behalf of the associate.
Unrealised gains on transactions between the Group and its associates and joint ventures accounted for using the equity method are eliminated to the extent of the Group’s interest in the associates and joint ventures. Unrealised losses are also eliminated unless the transactions provide evidence of an impairment of the asset transferred. The accounting policies of associates and joint ventures accounted for using the equity method have been changed where necessary to ensure consistency with the policies adopted by the Group.
(b)(iii) Structured entities The Group has investments in a range of investment vehicles including open-ended investment companies (OEICs), unit trusts and limited partnerships. These vehicles are structured in such a way that voting or similar rights are not the dominant factor in deciding who controls the entity and as such are classified as structured entities. The Group’s ownership interest in these vehicles can vary
Standard Life 121
3. Financial information – Group accounting policies continued
Group accounting policies continued
(b) Basis of consolidation continued (b)(iii) Structured entities continued from day to day based on the Group and third party participation in them. Where Group companies are deemed to control such vehicles, they are consolidated. Where the Group has an investment but not control over these types of entities, the investment is classified as an investment in associate where the Group has significant influence, or as equity securities and pooled investment funds in the consolidated statement of financial position.
(c) Business combinations and Group reconstructions (c)(i) Business combinations The Group uses the acquisition method to account for business combinations. At the acquisition date the assets acquired and liabilities assumed as part of the business combination are identified and assessed for appropriate classification and designation in accordance with the contractual terms, economic circumstances and pertinent conditions as at the acquisition date. Only assets acquired and liabilities assumed as part of the exchange in the business combination are considered in applying the acquisition method of accounting.
The identifiable assets acquired and liabilities assumed are measured at their acquisition date fair values. The consideration transferred in a business combination is measured at fair value at the acquisition date. Any asset or obligation for contingent consideration arising from an acquisition is recognised at fair value at the acquisition date on the consolidated statement of financial position and subsequent changes in fair value are recorded in other income in the consolidated income statement. Acquisition-related costs are expensed when incurred.
(c)(ii) Group reconstructions The Group uses merger accounting principles to account for Group reconstructions which are not business combinations within the scope of IFRS 3 Business Combinations. Under the principles of merger accounting, assets and liabilities transferred to a new entity are recorded in the new entity at the carrying value they were measured at by the transferor. No goodwill is recognised as a result of such transactions.
(d) Foreign currency translation The consolidated financial statements are presented in millions pounds Sterling.
The statements of financial position of Group entities that have a different functional currency than the Group’s presentation currency are translated into the presentation currency at the year end exchange rate and their income statements and cash flows are translated at average exchange rates for the year. All resulting exchange differences arising are recognised in the foreign currency translation reserve in equity. Where the unallocated divisible surplus changes as a result of such exchange differences which are attributable to participating policyholders, this change in the unallocated divisible surplus is not recognised in the consolidated income statement but is recognised in equity (refer also to policy (h)(iii)).
The exchange rates used to translate financial statements of Group entities that have a different functional currency than the Group’s presentation currency are shown in (a)(v) Exchange rates.
Foreign currency transactions are translated into the functional currency at the exchange rate prevailing at the date of the transaction. Gains and losses arising from such transactions and from the translation at year end exchange rates of monetary assets and liabilities denominated in foreign currencies are recognised in the relevant line in the consolidated income statement.
Translation differences on non-monetary items, such as equity securities held at fair value through profit or loss, are reported as part of the fair value gain or loss within net investment return in the consolidated income statement. Translation differences on financial assets and liabilities held at amortised cost are included in the relevant line in the consolidated income statement.
(e) Segmental reporting The Group’s reportable segments have been identified in accordance with the way in which the Group is structured and managed and the way in which key financial information used by the executive team to review performance is presented.
(f) Classification of insurance, reinsurance and investment contracts
The measurement basis of assets and liabilities arising from life and pensions business contracts is dependent upon the classification of those contracts as either insurance or investment contracts. A contract is classified as insurance only if it transfers significant insurance risk. Insurance risk is significant if an insured event could cause an insurer to pay significant additional benefits to those payable if no insured event occurred, excluding scenarios that lack commercial substance. A contract that is classified as an insurance contract remains an insurance contract until all rights and obligations are extinguished or expire. When a policyholder exercises an option within an investment contract to utilise withdrawal proceeds from the investment contract to secure future benefits which contain significant insurance risk, the related investment contract liability is derecognised and an insurance contract liability is recognised. The withdrawal proceeds which are used to secure the insurance contract are recognised as premium income in accordance with accounting policy (g)(ii). Life and pensions business contracts that are not considered to be insurance contracts are classified as investment contracts.
The Group has written insurance and investment contracts which contain discretionary participating features (e.g. with profits business). These contracts provide a contractual right to receive additional benefits as a supplement to guaranteed benefits. These
122 Standard Life
additional benefits are based on the performance of with profits funds and their amount and timing is at the discretion of the Group. These contracts are referred to as participating contracts.
Generally, life and pensions business product classes are sufficiently homogeneous to permit a single classification at the level of the product class. However, in some cases, a product class may contain individual contracts that fall across multiple classifications (hybrid contracts). For certain significant hybrid contracts the product class is separated into the insurance element, a non-participating investment element and a participating investment element, so that each element is accounted for separately.
Contracts with reinsurers are assessed to determine whether they contain significant insurance risk. Contracts that do not give rise to a significant transfer of insurance risk to the reinsurer are considered financial reinsurance and are accounted for and disclosed in a manner consistent with financial instruments.
Contracts that give rise to a significant transfer of insurance risk to the reinsurer are assessed to determine whether they contain an element that does not transfer significant insurance risk and which can be measured separately from the insurance component. Where such elements are present, they are accounted for separately with any deposit element being accounted for and disclosed in a manner consistent with financial instruments. The remaining elements, or where no such separate elements are identified, the entire contracts, are classified as reinsurance contracts.
(g) Revenue recognition (g)(i) Deposit accounting for non-participating investment contracts Contributions received on non-participating investment contracts are treated as policyholder deposits and not reported as revenue in the consolidated income statement.
Deposit accounting is also applied to contracts with reinsurers that do not qualify as reinsurance contracts under policy (f).
The fee income associated with non-participating investment contracts is dealt with under policy (g)(iv).
(g)(ii) Premiums Premiums received on insurance contracts and participating investment contracts are recognised as revenue when due for payment, except for unit linked premiums which are accounted for when the corresponding liabilities are recognised. For single premium business, this is the date from which the policy is effective. For regular (and recurring) premium contracts, receivables are established at the date when payments are due.
(g)(iii) Net investment return Gains and losses resulting from changes in both market value and foreign exchange on investments classified as at fair value through profit or loss, including investment income received (such as interest payments), are recognised in the consolidated income statement in the period in which they occur.
Changes in the fair value of derivative financial instruments that are not hedging instruments are recognised immediately in the consolidated income statement.
For debt securities classified as available-for-sale (AFS), interest income recognised in the consolidated income statement is calculated using the effective interest rate (EIR) method.
Unrealised gains and losses on AFS financial assets are recognised in other comprehensive income unless an impairment loss is recognised. On disposal any accumulated gain or loss previously recognised in other comprehensive income is recycled to the consolidated income statement.
For loans measured at amortised cost, interest income recognised in the consolidated income statement is calculated using the EIR method.
Dividend income is recognised in the consolidated income statement when the right to receive payment is established.
Rental income is recognised in the consolidated income statement on a straight-line basis over the term of the lease.
(g)(iv) Fee and commission income All fees related to unit linked non-participating investment contracts are deemed to be associated with the provision of investment management services. Fees related to the provision of investment management services and administration services are recognised as the services are provided. Front-end fees, which are charged at the inception of service contracts, are deferred as a liability and recognised over the expected life of the contract. Ongoing fees that are charged periodically, either directly or by making a deduction from invested funds, are recognised as received, which corresponds to when the services are provided.
Commissions received or receivable are recognised as revenue on the commencement or renewal date of the related policies. However, when it is probable that the Group will be required to render further services during the life of the policy, the commission is deferred as a liability and is recognised as the services are provided.
(h) Expense recognition (h)(i) Deposit accounting for non-participating investment contracts Withdrawals paid out to policyholders on non-participating investment contracts are treated as a reduction to policyholder deposits and not recognised as expenses in the consolidated income statement.
Deposit accounting is also applied to contracts with reinsurers that do not qualify as reinsurance contracts under policy (f).
Standard Life 123

3. Financial information – Group accounting policies continued
Group accounting policies continued (h) Expense recognition continued (h)(ii) Claims and benefits paid
Claims paid on insurance contracts and participating investment contracts are recognised as expenses in the consolidated income statement.
Maturity claims and annuities are accounted for when due for payment. Surrenders are accounted for when paid or, if earlier, on the date when the policy ceases to be included within the calculation of the insurance liability. Death claims and all other claims are accounted for when notified.
Claims payable include the direct costs of settlement. Reinsurance recoveries are accounted for in the same period as the related claim.
(h)(iii) Change in insurance and participating investment contract liabilities The change in insurance and participating investment contract liabilities, comprising the full movement in the corresponding liabilities during the period, is recognised in the consolidated income statement. This also includes the movement in unallocated divisible surplus (UDS) in the period. However, where movements in assets and liabilities which are attributable to participating policyholders are taken directly to equity, the change in UDS arising from these movements is not recognised in the consolidated income statement as it is also recognised in equity. (h)(iv) Change in investment contract liabilities Investment return and related benefits credited in respect of non-participating investment contracts are recognised in the consolidated income statement as changes in investment contract liabilities.
(h)(v) Expenses under arrangements with reinsurers Expenses, including interest, arising under elements of contracts with reinsurers that do not transfer significant insurance risk are recognised as they are incurred in the consolidated income statement as expenses under arrangements with reinsurers.
(i) Impairment of non-financial assets The carrying amounts of non-financial assets are reviewed for impairment whenever events or changes in circumstances indicate that the carrying amount may not be recoverable, at least at each reporting date. An impairment loss is recognised in the consolidated income statement for the amount by which the asset’s carrying amount exceeds its recoverable amount. Non-financial assets other than goodwill, which have been impaired are reviewed for possible reversal of impairment losses at each reporting date.
The recoverable amount of an asset is the greater of its net selling price (fair value less costs to sell) and value in use. In assessing value in use, the estimated future cash flows are discounted to their present value using a pre-tax discount rate that reflects current market assessments of the time value of money and the risks specific to the asset. For an asset that does not generate largely independent cash inflows, the recoverable amount is determined for the cash-generating unit, or group of units, to which the asset belongs.
(j) Goodwill and intangible assets (j)(i) Goodwill In a business combination, goodwill represents the excess of the consideration transferred, the amount of any non-controlling interest and the fair value of any previously held interest, over the fair value of the Group’s share of the identifiable assets acquired and the liabilities and contingent liabilities assumed at the acquisition date.
For the purpose of impairment testing, goodwill acquired in a business combination is allocated, from the acquisition date, to each of the Group’s cash generating units or groups of cash generating units that are expected to benefit from the business combination. The carrying amount of goodwill for each cash generating unit or group of cash generating units is reviewed when changes in circumstances or events indicate that there may be uncertainty over its carrying value, and at least annually.
Goodwill is carried at cost less any accumulated impairment losses and is included in intangible assets.
(j)(ii) Intangible assets Intangible assets are recognised on the consolidated statement of financial position if it is probable that the relevant future economic benefits attributable to the asset will flow to the Group and they can be measured reliably and are either identified as separable (i.e. capable of being separated from the entity and sold, transferred, rented or exchanged) or they arise from contractual or other legal rights, regardless of whether those rights are transferable or separable.
Intangible assets are recognised at cost. For intangible assets acquired in a business combination, the cost is the fair value at the acquisition date.
Intangible assets are carried at initial cost less accumulated amortisation and any accumulated impairment losses. Amortisation is charged to the consolidated income statement on a straight-line basis over the estimated useful life of the intangible asset. The estimated useful life of the Group’s classes of intangible assets is as follows: • Intangible assets acquired through business combinations – between six and seventeen years • Internally developed software – between two and ten years
124 Standard Life
• Other acquired intangible assets – between two and six years.
Impairment losses are calculated and recorded on an individual basis in a manner consistent with policy (i). Amortisation commences at the time from which an intangible asset is available for use.
(k) Deferred acquisition costs (k)(i) UK and Europe – insurance and participating investment contracts Acquisition costs incurred in issuing insurance or participating investment contracts are not deferred where such costs are borne by a with profits fund that is subject to the Prudential Regulation Authority (PRA) realistic capital regime. For other participating investment contracts, incremental costs directly attributable to the issue of the contracts are deferred. For other insurance contracts, acquisition costs, which include both incremental acquisition costs and other indirect costs of acquiring and processing new business, are deferred.
Deferred acquisition costs are amortised in proportion to projected margins over the period the relevant contracts are expected to remain in force. After initial recognition, deferred acquisition costs are reviewed by category of business and written off to the extent that they are no longer considered to be recoverable.
(k)(ii) Canada and Asia and Emerging markets – insurance contracts The Group’s policy for acquisition costs incurred on insurance contracts issued by overseas subsidiaries is to apply the policy used in the issuing entity’s local statutory or regulatory reporting or, where local reporting did not explicitly or implicitly defer acquisition costs at the time the overseas subsidiary was first consolidated, to adjust those policies to apply a policy similar to that described in policy (k)(i) for non-participating insurance contracts. Implicit allowance is made for deferred acquisition costs in the Canadian Asset Liability Method (CALM). Therefore, no explicit deferred acquisition costs have been recognised separately for business written by the Canadian subsidiaries.
(k)(iii) Non-participating investment contracts Incremental costs directly attributable to securing rights to receive fees for asset management services sold with unit linked investment contracts are deferred. Where such costs are borne by a with profits fund that is subject to the PRA’s realistic capital regime, deferral is limited to the level of any related deferred income.
Deferred acquisition costs are amortised over the life of the contracts as the related revenue is recognised. After initial recognition, deferred acquisition costs are reviewed by category of business and are written off to the extent that they are no longer considered to be recoverable.
Trail or renewal commission on non-participating investment contracts where the Group does not have an unconditional legal right to avoid payment, is deferred at inception of the contract and an offsetting liability for contingent commission is established.
(l) Investment property Property held for long-term rental yields or investment gain that is not occupied by the Group and property being constructed or developed for future use as investment property are classified as investment property. Investment property is initially recognised at cost, including any directly attributable transaction costs. Subsequently investment property is measured at fair value. Fair value is determined without any deduction for transaction costs that may be incurred on sale or other disposal. Gains or losses arising from changes in fair value are recognised in the consolidated income statement. Investment property is not depreciated. Property located on land that is held under an operating lease is classified as investment property as long as it is held for long-term rental yields and is not occupied by the companies in the Group. The initial cost of the property is the lower of the fair value of the property and the present value of the minimum lease payments. Rental income from investment property is recognised in the consolidated income statement on a straight-line basis over the term of the lease. Lease incentives granted are recognised as an integral part of the total rental income and are also spread over the term of the lease.
(m) Property, plant and equipment Owner occupied property consists of land and buildings owned and occupied by the Group. Owner occupied property is recognised initially at cost and subsequently at fair value at the date of revaluation less any subsequent accumulated depreciation. Cost includes the original purchase price of the asset and the costs attributable to bringing the asset into working condition for its intended use. Any accumulated depreciation at the date of revaluation is eliminated against the gross carrying amount of the asset and the net amount is restated to the revalued amount of the asset. Prior to the demutualisation of The Standard Life Assurance Company (SLAC), increases in the fair value of owner occupied property were recognised in the unallocated divisible surplus and following the demutualisation of SLAC, all fair value increases are recognised in the revaluation reserve in equity. Where the unallocated divisible surplus changes as a result of fair value increases which are attributable to participating policyholders, this change in the unallocated divisible surplus is not recognised in the consolidated income statement but through equity. Decreases in the fair value of owner occupied property that offset previous increases in the same asset were recognised in the unallocated divisible surplus prior to the demutualisation of SLAC and are recognised in the revaluation of owner occupied property reserve in equity after the demutualisation of SLAC. All other decreases are charged to the consolidated income statement for the period.
Standard Life 125
3. Financial information – Group accounting policies continued
Group accounting policies continued (m) Property, plant and equipment continued
Owner occupied property is depreciated on a straight-line basis over its estimated useful life, generally between 30 and 50 years. The depreciable amount of an asset is determined by the difference between the fair value and the residual value. The residual value is the amount that would be received on disposal if the asset was already at the age and condition expected at the end of its useful life. Equipment is stated at historical cost less depreciation. Cost includes the original purchase price of the asset and the costs attributable to bringing the asset to its working condition for its intended use. Depreciation on equipment is charged to the consolidated income statement on a straight-line basis over its estimated useful life of between two and fifteen years. The residual values and useful lives of the assets are reviewed at each reporting date and adjusted if appropriate.
(n) Income tax The income tax expense is based on the taxable profits for the year, after adjustments in respect of prior years.
Deferred tax is provided using the liability method, on temporary differences arising between the tax bases of assets and liabilities and their carrying amounts in the consolidated financial statements. Deferred tax assets are recognised to the extent that it is probable that future taxable profits will be available against which the temporary differences can be utilised. The amount of deferred tax provided is based on the expected manner of realisation or settlement of the carrying amount of assets and liabilities.
Temporary differences arising from investments in subsidiaries and associates give rise to deferred tax only to the extent that it is probable that the temporary difference will reverse in the foreseeable future and the timing of the reversal of that difference cannot be controlled. Deferred tax is provided on unremitted earnings of subsidiaries to the extent that the temporary difference created is expected to reverse in the foreseeable future and the Group is not able to control the timing of the reversal.
Current tax and deferred tax is recognised in the consolidated income statement except when it relates to items recognised in other comprehensive income or directly in equity, in which case it is credited or charged to other comprehensive income or directly in equity respectively.
The income tax expense is determined using rates enacted or substantively enacted at the reporting date.
The Group’s long-term businesses in the UK and Ireland are subject to tax on policyholders’ investment returns on certain products and tax on equity holder profits. Policyholder tax is accounted for as an income tax and is included within the total income tax expense. Total income tax expense is analysed between equity holder tax and policyholder tax in the consolidated income statement. Equity holder tax comprises current and deferred tax on profits attributable to equity holders. Policyholder tax comprises current and deferred tax on investment returns attributable to policyholders.
(o) Reinsurance assets and reinsurance liabilities Reinsurance assets and reinsurance liabilities arise under contracts that are classified as reinsurance contracts (refer to policy (f)).
Reinsurance contracts are measured using valuation techniques and assumptions that are consistent with the valuation techniques and assumptions used in measuring the underlying policy benefits and taking into account the terms of the reinsurance contract.
Reinsurance recoveries due from reinsurers and reinsurance premiums due to reinsurers under reinsurance contracts that are contractually due at the reporting date are separately recognised in receivables and other financial assets and other financial liabilities respectively.
Reinsurance assets and reinsurance liabilities are offset and the net amount reported on the consolidated statement of financial position only when there is a legally enforceable right to offset the recognised amounts and there is an intention to settle on a net basis.
If a reinsurance asset is considered to be impaired, the carrying amount is reduced to the recoverable amount and the impairment loss is recognised in the consolidated income statement.
(p) Loans Loans are non-derivative financial assets with fixed or determinable payments that are not quoted in an active market. Financial assets classified as loans include loans secured by mortgages and loans secured on policies.
Management determines the classification of loans at initial recognition. Certain loans are designated as at fair value through profit or loss (FVTPL) as they are part of groups of assets which are managed and whose performance is evaluated on a fair value basis so as to maximise returns either for policyholders or equity holders. All other loans are classified as loans and receivables. Loans classified as at FVTPL are measured at fair value with changes in fair value recognised in the consolidated income statement.
Loans classified as loans and receivables are initially measured at fair value plus directly attributable transaction costs. Subsequently, they are measured at amortised cost, using the effective interest rate (EIR) method, less any impairment losses. Revenue from financial assets classified as loans is recognised in the consolidated income statement on an EIR basis.
Impairment on individual loans is determined at each reporting date. Objective evidence that a financial asset or group of assets is impaired includes observable data that comes to the attention of the Group. This would include a measurable decrease in the estimated future cash flow from a group of financial assets since the initial recognition of those assets, although the decrease
126 Standard Life
cannot yet be identified with the individual financial assets in the Group. The Group first assesses whether objective evidence of impairment exists individually for financial assets that are individually significant.
If there is objective evidence that an impairment loss has been incurred on loans carried at amortised cost, the amount of the impairment loss is calculated as the difference between the present value of future cash flows, discounted at the loan's original effective rate, and the loan’s current carrying value. The carrying amount of the asset is reduced through the use of an allowance account and the amount of the loss is recognised in the consolidated income statement. Subsequent recoveries are credited to the consolidated income statement.
If there is no evidence of impairment on an individual basis, a collective impairment review is undertaken whereby the assets are grouped together, on the basis of similar credit risk characteristics, in order to calculate a collective impairment loss. Assets that are individually assessed for impairment and for which an impairment loss is or continues to be recognised are not included in a collective assessment of impairment.
Loans which are subject to collective impairment assessment and whose terms have been renegotiated are no longer considered to be past due but are treated as new loans after the minimum number of payments under the renegotiated terms have been collected. Individually significant loans whose terms have been renegotiated are subject to ongoing review to determine whether they remain impaired or past due.
(q) Equity securities, debt securities and derivatives Management determines the classification of equity securities, debt securities and derivatives at initial recognition.
All of the Group’s equity securities and certain debt securities are designated as at fair value through profit or loss (FVTPL) as they are part of groups of assets which are managed and whose performance is evaluated on a fair value basis so as to maximise returns either for policyholders or equity holders. All other debt securities are designated as available-for-sale (AFS).
All derivative instruments are classified as held for trading (HFT) except those designated as part of a hedging relationship. Hedge accounting policies are described in policy (q)(i).
Equity securities, debt securities and derivatives are recognised at fair value on the trade date of the transaction. In the case of derivatives, where no initial premium is paid or received, the initial measurement value is nil. For instruments classified as HFT or designated as at FVTPL, directly attributable transaction costs are not included in the initial measurement value but are recognised in the consolidated income statement. AFS debt securities are initially recognised at fair value plus directly related transaction costs.
Where a valuation technique is used to establish the fair value of a financial instrument, a difference could arise between the fair value at initial recognition and the amount that would be determined at that date using the valuation technique. When unobservable market data has an impact on the valuation of derivatives, the entire initial change in fair value indicated by the valuation technique is recognised over the life of the transaction on an appropriate basis, or when the inputs become observable, or when the derivative matures or is closed out.
Instruments classified as HFT or as at FVTPL are measured at fair value with changes in fair value recognised in the consolidated income statement.
Debt securities designated as AFS are measured at fair value. For these instruments interest calculated using the effective interest rate method is recognised in the consolidated income statement. Other changes in fair value and any related tax are recognised in other comprehensive income and recorded in a separate reserve within equity until disposal or impairment, when the cumulative gain or loss is recognised in the consolidated income statement with a corresponding movement through other comprehensive income. An AFS debt security is impaired if there is objective evidence that a loss event has occurred which has impaired the expected cash flows.
(q)(i) Hedge accounting A hedge relationship will qualify for hedge accounting by the Group if, and only if, the following conditions are met: • Formal hedging documentation at inception of the hedge is completed, detailing the hedging instrument, hedged item, risk
management objective, strategy, effectiveness testing methodology and hedge relationship • The hedge relationship is expected to be highly effective at inception in achieving offsetting changes in fair value or cash flow
attributable to the hedged risk • The effectiveness of the hedge can be reliably measured and the hedge is assessed for effectiveness regularly during the
reporting period for which the hedge was designated to demonstrate that it is has been highly effective.
The Group discontinues hedge accounting in the following circumstances: • It is evident from effectiveness tests that the hedge is not, or ceased to be, highly effective • The hedging instrument expires, or is sold, terminated or has been exercised, or • The hedged item matures or is sold or repaid.
Cash flow hedge relationships A cash flow hedge is a hedge of the exposure to variability in cash flows that is attributable to a particular risk associated with a recognised asset or liability or a highly probable forecast transaction and could affect the consolidated income statement. A cash flow hedge is therefore used to hedge exposure to variability in cash flows such as those on variable rate assets and liabilities. Where a derivative is designated and qualifies as a cash flow hedge, the effective part of any gain or loss resulting from the
Standard Life 127
3. Financial information – Group accounting policies continued
Group accounting policies continued (q) Equity securities, debt securities and derivatives continued (q)(i) Hedge accounting continued change in fair value of the derivative is recognised directly in the cash flow hedges reserve in equity. Any ineffectiveness is recognised immediately in the consolidated income statement. Amounts that have been recognised directly in the cash flow hedge reserve are recognised in the consolidated income statement in the same period or periods during which the hedged item affects the profit or loss.
If a cash flow hedge no longer meets the relevant hedging criteria, hedge accounting is discontinued and no further changes in the fair value of the derivative are recognised in the cash flow hedges reserve. Amounts that have already been recognised directly in the cash flow hedges reserve are recognised in the consolidated income statement in the same period or periods during which the hedged item affects the profit or loss.
Where the forecast transaction is no longer expected to occur or the asset or liability is derecognised, the associated accumulated amounts in the cash flow hedges reserve are recognised immediately in the consolidated income statement.
Net investment hedge relationships A hedge of net investments in foreign operations is the hedge against the effects of changes in exchange rates in the net investment in a foreign operation, that is, the hedge of the translation gains or losses that are recognised in equity.
A hedge of net investments in foreign operations is accounted for in a similar way to cash flow hedges. Any gain or loss on the hedging instrument relating to the effective portion of the hedge is recognised in equity; the gain or loss relating to the ineffective portion is recognised immediately in the consolidated income statement. In the event of disposal of the foreign operation, gains and losses accumulated in equity are included in the consolidated income statement.
If the net investment hedge ceases to meet the relevant hedging criteria, hedge accounting is discontinued and gains and losses accumulated in equity remain in equity until the disposal of the net investment, at which point the amounts are included in the consolidated income statement.
(q)(ii) Embedded derivatives Options, guarantees and other derivatives embedded in a host contract are separated and recognised as a derivative unless they are either considered closely related to the host contract, meet the definition of an insurance contract or if the host contract itself is measured at fair value with changes in fair value recognised in income.
(r) Financial guarantee contracts The Group recognises and measures financial guarantee contracts in accordance with IAS 39 Financial Instruments: Recognition and Measurement. The Group initially recognises and measures a financial guarantee contract at its fair value. At each subsequent reporting date, the Group measures the financial guarantee contract at the higher of the initial fair value recognised less, when appropriate, cumulative amortisation recognised in accordance with IAS 18 Revenue and the best estimate of the expenditure required to meet the obligations under the contract at the reporting date, determined in accordance with IAS 37 Provisions, Contingent Liabilities and Contingent Assets.
(s) Cash and cash equivalents Cash and cash equivalents include cash in hand, money held at call and short notice with banks and any highly liquid investments with less than three months to maturity from the date of acquisition. Cash and cash equivalents are categorised for measurement purposes as loans and receivables and are therefore measured at amortised cost. For the purposes of the consolidated statement of cash flows, cash and cash equivalents also include bank overdrafts, which are included in borrowings on the consolidated statement of financial position. (t) Equity (t)(i) Share capital and shares held by trusts An equity instrument is any contract that evidences a residual interest in the assets of an entity after deducting all of its liabilities. Shares are classified as equity instruments when there is no contractual obligation to deliver cash or other assets to another entity on terms that may be unfavourable. The difference between the proceeds received on issue of the shares and the nominal value of the shares issued is recorded in the share premium reserve. Incremental costs directly attributable to the issue of new equity instruments are shown in the share premium reserve as a deduction from the proceeds, net of tax. Incremental costs directly attributable to the issue of equity instruments in a business combination are excluded from the consideration transferred.
If the Company or its subsidiaries purchase any equity instruments of the Company, the consideration paid is treated as a deduction from total equity. Any corresponding obligation to deliver a fixed number of the Company’s equity instruments is offset within the shares held by trusts balance in equity. Where such shares are sold, if the proceeds are equal to or less than the purchase price paid, the proceeds are treated as a realised profit in equity. If the proceeds exceed the purchase price, the excess over the purchase price is transferred to the share premium reserve.
128 Standard Life
(t)(ii) Merger reserve If the Company issues shares at a premium in connection with the acquisition of an equity holding in another entity and the conditions for merger relief under section 612 of the Companies Act 2006 are met, which permits the difference between the issue value and nominal value of the shares issued to be transferred to a reserve other than the share premium account, such differences are transferred to the merger reserve. A component of the merger reserve attached to the acquisition of an entity is released to retained earnings on disposal, part disposal or impairment of the interest in that entity.
(t)(iii) Reserve arising on Group reconstruction The reserve arising on Group reconstruction represents the difference between the fair value and book value of the assets and liabilities of the Group at the time when merger accounting principles are applied under accounting policy (c)(ii) on Group reconstructions. A component of the reserve arising on Group reconstruction is released to retained earnings on disposal of entities that were involved in the related Group reconstruction.
(u) Insurance and investment contract liabilities For insurance contracts and participating investment contracts, IFRS 4 Insurance Contracts permits the continued application, for measurement purposes, of previously applied Generally Accepted Accounting Principles (GAAP), except where a change is deemed to make the financial statements more relevant to the economic decision-making needs of users and no less reliable, or more reliable, and no less relevant to those needs. The Group therefore adopts UK GAAP, including the requirements of Financial Reporting Standard 27 Life Assurance in relation to its UK-regulated with profits funds, for the measurement of its insurance and participating investment contract liabilities. As permitted under UK GAAP, the Group adopts local regulatory valuation methods, adjusted for consistency with asset measurement policies, for the measurement of liabilities under insurance contracts and participating investment contracts issued by overseas subsidiaries.
Further details on these policies and the policies for the measurement of non-participating investment contracts are given in policies (v), (w) and (x).
(v) Participating contract liabilities and non-participating insurance contracts (v)(i) Participating contract liabilities Participating contract liabilities are analysed into the following components: • Participating insurance contract liabilities • Participating investment contract liabilities • Unallocated divisible surplus • Present value of future profits on non-participating contracts, which is treated as a deduction from gross participating contract
liabilities.
The policy for measuring each component is noted below.
UK and Europe Participating contract liabilities arising under contracts issued by a with profits fund falling within the scope of the Prudential Regulation Authority (PRA) realistic capital regime are measured on the PRA realistic basis. Under this approach, the value of participating insurance and participating investment contract liabilities in each with profits fund is calculated as: • With profits benefits reserves (WPBR) for the fund as determined under the PRA realistic basis, plus • Future policy related liabilities (FPRL) for the fund as determined under the PRA realistic basis, less • Any amounts due to equity holders included in FPRL, less • The portion of future profits on non-participating contracts included in FPRL not due to equity holders, where this portion can be
separately identified.
The WPBR is primarily based on the retrospective calculation of accumulated assets shares. The aggregate value of individual policy asset shares reflects the actual premium, expense and charge history of each policy. The net investment return credited to the asset shares is consistent with the return achieved on the assets notionally backing participating business. Any mortality deductions are based on published mortality tables adjusted where necessary for experience variations. For those asset shares on an expense basis, the allowance for expenses attributed to the asset share is, as far as practical, the appropriate share of the actual expenses incurred or charged to the fund. For those on a charges basis, the allowance is consistent with the charges for an equivalent unit linked policy. The FPRL comprises other components such as a market consistent stochastic valuation of the cost of options and guarantees.
The Group’s principal with profits fund is the Heritage With Profits Fund (HWPF) operated by Standard Life Assurance Limited (SLAL). The participating contracts held in the HWPF were issued by a with profits fund falling within the scope of the PRA realistic capital regime. Under the Scheme of Demutualisation (the Scheme), the residual estate of the HWPF exists to meet amounts which may be charged to the HWPF under the Scheme. However, to the extent that SLAL’s board is satisfied that there is an excess residual estate, it shall be distributed over time as an enhancement to final bonuses payable on the remaining eligible policies invested in the HWPF. This planned enhancement to the benefits under with profits contracts held in the HWPF is included in the FPRL under the PRA realistic basis, resulting in a realistic surplus of nil. Applying the policy noted above, this planned enhancement is therefore included within the measurement of participating contract liabilities.
Standard Life 129
3. Financial information – Group accounting policies continued
Group accounting policies continued
(v) Participating contract liabilities and non-participating insurance contracts continued (v)(i) Participating contract liabilities continued The Scheme provides that certain defined cash flows (recourse cash flows) arising in the HWPF on specified blocks of UK and Irish business, both participating and non-participating, may be transferred out of that fund when they emerge, being transferred to the Shareholder Fund (SHF) or the Proprietary Business Fund (PBF) of SLAL, and thus accrue to the ultimate benefit of equity holders of the Company. Under the Scheme, such transfers are subject to certain constraints in order to protect policyholders. The Scheme also provides for additional expenses to be charged by the PBF to the HWPF in respect of German branch business in SLAL.
Under the PRA realistic basis, the discounted value of expected future cash flows on participating contracts not reflected in the WPBR is included in FPRL (as a reduction in FPRL where future cash flows are expected to be positive). The discounted value of expected future cash flows on non-participating contracts not reflected in the measure on non-participating liabilities is recognised as a separate asset (where future cash flows are expected to be positive). The Scheme requirement to transfer future recourse cash flows out of the HWPF is recognised as an addition to FPRL. The discounted value of expected future cash flows on non-participating contracts can be apportioned between those included in the recourse cash flows and those retained in the HWPF for the benefit of policyholders.
Applying the policy noted above: • The value of participating insurance and participating investment contract liabilities is reduced by future expected (net positive)
cash flows arising on participating contracts • Future expected cash flows on non-participating contracts are not recognised as an asset of the HWPF. However, future
expected cash flows on non-participating contracts that are not recourse cash flows under the Scheme are used to adjust the value of participating insurance and participating investment contract liabilities.
Some participating contracts are issued by a non-participating fund with a with profits investment element then transferred to a with profits fund within SLAL falling within the scope of the PRA’s realistic capital regime. The with profits investment element of such contracts is measured as described above. Any liability for insurance features retained in the non-participating fund is measured using the gross premium method applicable to non-participating contracts (see policy (v)(ii)).
Canada The Group’s policy for measuring liabilities for participating contracts issued by overseas subsidiaries is to apply the valuation technique used in the issuing entity’s local statutory or regulatory reporting. Therefore, for participating contracts issued by The Standard Life Assurance Company of Canada (SLCC), the Canadian regulatory valuation technique is applied, under which for most participating business the value of participating policy liabilities is set equal to the value of the assets set aside in a separate fund for this business, unless this is insufficient to cover guaranteed benefits, in which case a higher liability is recognised.
Unallocated divisible surplus (UDS) The UDS comprises the difference between the assets and all other recognised liabilities in the Group’s with profits funds. This amount is recognised as a liability as it is not considered to be allocated to shareholders due to uncertainty regarding transfers from these funds to equity holders.
In relation to the HWPF, amounts are considered to be allocated to equity holders when they emerge as recourse cash flows within the HWPF. The Scheme permits the HWPF to enter into loans, the repayment of which is contingent on the emergence of recourse cash flows (contingent loan agreement). The Scheme requires that an amount equal to the loan proceeds received on a contingent loan agreement (securitisation receipt) is transferred to the SHF or PBF of SLAL. When the HWPF enters into a contingent loan agreement and the securitisation receipt transferred to the SHF or PBF is in the form of an instrument whose cash flows are contingent on the emergence of recourse cash flows within the HWPF, the obligation to transfer, and the subsequent transfer of, the securitisation receipt is not treated as an allocation to equity holders from the HWPF. In this case the obligation of the HWPF to repay the contingent loan agreement, in excess of repayments reflecting emerged recourse cash flows, is not considered to be a recognised liability of the HWPF in the determination of the UDS.
As a result of the policies for measuring the HWPF’s assets and all its other recognised liabilities: • The UDS of the HWPF comprises the value of future recourse cash flows in participating contracts (but not the value of future
recourse cash flows on non-participating contracts), the value of future additional expenses to be charged on German branch business and the effect of any measurement differences between the Realistic Balance Sheet value and IFRS accounting policy value of all assets and all liabilities other than participating contract liabilities recognised in the HWPF
• The recourse cash flows are recognised as they emerge as an addition to equity holders’ profits if positive or as a deduction if negative. As the additional expenses are charged in respect of the German branch business, they are recognised as an addition to equity holders’ profits.
Present value of future profits (PVFP) on non-participating contracts held in a with profits fund For with profits funds falling within the scope of the PRA’s realistic capital regime, an amount is recognised for the PVFP on non-participating contracts where the determination of the realistic value of liabilities for with profits contracts in that with profits fund takes account of this value directly or indirectly. The amount is recognised as a deduction from liabilities. Where this amount can be apportioned between an amount recognised in the realistic value of with profits contract liabilities and an amount recognised in UDS, the apportioned amounts are reflected in the measurement of participating contract liabilities and UDS
130 Standard Life
respectively. Otherwise it is recognised as a separate amount reflected in liabilities comprising participating contract liabilities and UDS.
(v)(ii) Non-participating insurance contract liabilities UK and Europe The liability for annuity in payment contracts is measured by discounting the expected future annuity payments together with an appropriate estimate of future expenses at an assumed rate of interest derived from yields on the underlying assets.
Other non-participating insurance contracts are measured using the gross premium method. In general terms, a gross premium valuation basis is one in which the premiums brought into account are the full amounts receivable under the contract. The method includes explicit estimates of premiums, expected claims and costs of maintaining contracts. Cash flows are discounted at the valuation rate of interest determined in accordance with Prudential Regulation Authority (PRA) requirements.
Canada and Asia and Emerging Markets The Group’s policy for measuring liabilities for non-participating insurance contracts issued by overseas subsidiaries is to apply the valuation technique used in the issuing entity’s local statutory or regulatory reporting.
For non-participating insurance contracts issued by SLCC, the Canadian regulatory valuation technique is applied. Under Canadian regulations, liabilities are determined according to the Canadian Asset Liability Method (CALM). Assets and liabilities are projected under a number of different economic scenarios. These scenarios include the current yield curve as at the valuation date and a number of various rising and falling interest rate environments. Under each scenario, the assets required to support the liabilities are the value of assets which will achieve zero surplus at the end of the projection period. In this valuation allowance is made for income taxes arising from differences between tax and accounting bases that are policy related. Under CALM the deferred taxes recognised under IAS 12 relating directly to policy related items included in the computation of liabilities are eliminated in the liabilities and discounted deferred taxes are added. The liability is set equal to the greatest value of the required assets.
Liabilities for non-participating insurance contracts issued by subsidiaries in Ireland and Hong Kong are measured using local reporting valuation techniques.
(w) Non-participating investment contract liabilities Unit linked non-participating investment contracts are separated into two components being an investment management services component and a financial liability. All fees and related administrative expenses are deemed to be associated with the investment management services component (refer to policies (g)(iv), (k)(iii) and (bb)). The financial liability component is designated at FVTPL as it is implicitly managed on a fair value basis as its value is directly linked to the market value of the underlying portfolio of assets.
(x) Liability adequacy test The Group applies a liability adequacy test at each reporting date to ensure that the insurance and participating contract liabilities (less related deferred acquisition costs) are adequate in the light of the estimated future cash flows. This test is performed by comparing the carrying value of the liability and the discounted projections of future cash flows.
If a deficiency is found in the liability (i.e. the carrying value amount of its insurance liabilities is less than the future expected cash flows), that deficiency is provided for in full. The deficiency is recognised in the consolidated income statement.
(y) Borrowings Borrowings include bank overdrafts and are recognised initially at fair value, less attributable transaction costs. Subsequent to initial recognition, borrowings are carried at amortised cost with any difference between the carrying value and redemption value being recognised in the consolidated income statement over the period of the borrowings on an effective interest rate basis.
(z) Subordinated liabilities Subordinated liabilities are initially recognised at the value of proceeds received net of issue expenses. The total finance costs are charged to the consolidated income statement over the relevant term of the instrument using the effective interest rate. The carrying amount of the debt is increased by the finance cost in respect of the reporting period and reduced by payments made in respect of the debt in the period.
(aa) Pension costs and other post-retirement benefits The Group operates a number of defined benefit and defined contribution plans, the assets of which are held in separate trustee-administered funds. The pension plans are funded by payments from employees and by the relevant Group companies, determined by periodic actuarial calculations.
For defined benefit plans, the liability recognised on the consolidated statement of financial position is the present value of the defined benefit obligation less the fair value of plan assets. If the fair value of the plan assets exceeds the defined benefit obligation, a pension surplus is only recognised if the Group considers that it has an unconditional right to a refund. The amount of surplus recognised will be limited by tax and expenses. Plan assets exclude any insurance contracts or non-transferable financial instruments issued by the Group. The defined benefit obligation is calculated annually by independent actuaries using the projected unit credit method whereby estimated future cash outflows are discounted using interest rates of high quality corporate
Standard Life 131
3. Financial information – Group accounting policies continued
Group accounting policies continued
(aa) Pension costs and other post-retirement benefits continued bonds denominated in the currency in which the benefits will be paid of similar term as the pension liability. Where appropriate these interest rates are adjusted to take account of abnormal market conditions. Remeasurements, which include gains and losses as a result of changes in actuarial assumptions, the effect of the asset ceiling and returns on plan assets (other than amounts included in net interest) are recognised in other comprehensive income in the period in which they occur. Remeasurements are not reclassified to profit or loss in subsequent periods.
For defined contribution plans, the Group pays contributions to publicly or privately administered pension insurance plans. The Group has no further payment obligations once the contributions have been paid. The contributions are recognised in staff costs and other employee-related costs when they are due.
(bb) Deferred income Front-end fees on service contracts, including investment management service contracts, are deferred as a liability and amortised on a straight-line basis to the consolidated income statement over the period services are provided.
(cc) Provisions, contingent liabilities and contingent assets Provisions for restructuring costs and legal claims are recognised when the Group has a present legal or constructive obligation as a result of past events, it is more likely than not that an outflow of resources will be required to settle the obligation and the amount has been reliably estimated. Provisions are not recognised for future operating losses. Where there are a number of similar obligations, the likelihood that an outflow will be required in settlement is determined by considering the class of obligations as a whole.
Contingent liabilities are disclosed if the future obligation is less than probable but greater than remote or if the obligation is probable but the amount cannot be reliably estimated.
Contingent assets are disclosed if the inflow of economic benefits is probable, but not virtually certain.
(dd) Non-current assets held for sale Assets and liabilities of operations and individual non-current assets which have been classified as held for sale are presented separately in the consolidated statement of financial position. Operations and individual non-current assets are classified as held for sale when their carrying amount will be recovered principally through a sale transaction.
An operation classified as held for sale is measured at the lower of its aggregate carrying amount and its aggregate fair value, less the estimated incremental costs that are directly attributable to the disposal (excluding finance costs and income tax expense). No depreciation or amortisation is charged on assets of an operation once it has been classified as held for sale. Any impairment charge arising is recognised firstly against assets of the operation other than financial assets, investment property, assets arising under insurance contracts, assets arising from employee benefits or deferred tax assets.
Individual non-current assets classified as held for sale are measured at the lower of their carrying amount and their fair value, less the estimated incremental costs that are directly attributable to the disposal (excluding finance costs and income tax expense), other than financial assets and investment property which continues to be measured based on the accounting policies that applied before they were classified as held for sale. No depreciation or amortisation is charged on an asset once it has been classified as held for sale.
(ee) Dividend distribution Final dividends on share capital classified as equity instruments are recognised in equity when they have been approved by equity holders. Interim dividends on these shares are recognised in equity in the period in which they are paid.
(ff) Leases Leases, where a significant portion of the risks and rewards of ownership are retained by the lessor, are classified as operating leases. Where the Group is the lessee, payments made under operating leases, net of any incentives received from the lessor, are charged to the consolidated income statement on a straight-line basis over the period of the lease.
Where the Group is the lessor, lease income from operating leases is recognised in the consolidated income statement on a straight-line basis over the lease term. Initial direct costs incurred in arranging an operating lease are added to the carrying amount of the leased asset and recognised as an expense over the lease term on the same basis as the lease income.
The Group has not entered into any material finance lease arrangements as either lessor or lessee.
(gg) Employee share-based payments The Group operates share incentive plans for all employees, share-based long-term incentive plans and restricted stock plans for senior employees and may award annual performance shares or options to all eligible employees when the Group’s profit exceeds certain targets. Further details of the schemes are set out in Note 48 – Employee share-based payments. For share-based payment employee transactions, services received are measured at fair value.
Fair value of options granted under each scheme is determined using a relevant valuation technique, such as the Black Scholes option pricing model.
132 Standard Life
For cash-settled share-based payment transactions, services received are measured at the fair value of the liability. The fair value of the liability is remeasured at each reporting date and any changes in fair value are recognised in the consolidated income statement.
For equity-settled share-based payment transactions, the fair value of services received is measured by reference to the fair value of the equity instruments granted. The fair value of those equity instruments is measured at the grant date, which is the date that the Group and the employees have a shared understanding of the terms and conditions of the award. If that award is subject to an approval process then the grant date is the date when that approval is obtained. Market vesting conditions and non-vesting conditions, such as the requirement of employees to save in a save-as-you-earn scheme, are included in the calculation of the fair value of the instruments at the date of grant. Vesting conditions which are not market conditions are included in assumptions about the number of instruments that are expected to vest.
If the equity instruments granted vest immediately, the employees become unconditionally entitled to those equity instruments. Therefore, the Group immediately recognises the charge in respect of the services received in full in the consolidated income statement with a corresponding credit to the equity compensation reserve in equity.
If the equity instruments do not vest until the employee has fulfilled specified vesting conditions, the Group presumes that the services to be rendered by the employee as consideration for those equity instruments will be received in the future, during the period of those vesting conditions (vesting period). Therefore, the Group recognises the charge in respect of those services as they are rendered during the vesting period with a corresponding credit to the equity compensation reserve in equity.
Cancellations of awards granted arise where non-vesting conditions attached to the award are not met during the vesting period. Cancellations are accounted for as an acceleration of vesting and the remaining unrecognised expense in respect of the fair value of the award is recognised immediately.
At each period end the Group reassesses the number of equity instruments expected to vest and recognises any difference between the revised and original estimate in the consolidated income statement with a corresponding adjustment to the equity compensation reserve.
At the time the equity instruments vest, the amount recognised in the equity compensation reserve in respect of those equity instruments is transferred to retained earnings.
(hh) Derecognition and offset of financial assets and liabilities A financial asset (or a part of a group of similar financial assets) is derecognised where: • The rights to receive cash flows from the asset have expired • The Group retains the right to receive cash flows from the asset, but has assumed an obligation to pay them in full without
material delay to a third party under a ‘pass through’ arrangement • The Group has transferred its rights to receive cash flows from the asset and has either transferred substantially all the risks and
rewards of the asset, or has neither transferred nor retained substantially all the risks and rewards of the asset, but has transferred control of the asset.
A financial liability is derecognised when the obligation under the liability is discharged, cancelled or expires.
Financial assets and liabilities are offset and the net amount reported on the consolidated statement of financial position only when there is a legally enforceable right to offset the recognised amounts and there is an intention to settle on a net basis, or to realise the asset and settle the liability simultaneously.
(ii) Securities lending agreements The Group undertakes securities lending agreements under which securities are loaned to third parties. Where they do not meet the criteria for derecognition under IAS 39 Financial Instruments: Recognition and Measurement, the loaned securities are not derecognised and continue to be classified in accordance with the Group’s policy. The collateral received from securities borrowers typically consists of debt securities. Non-cash collateral arising from securities lending arrangements is only recognised on the consolidated statement of financial position where the criteria for recognition is met.
(jj) Operating profit The Group’s chosen supplementary measure of performance is operating profit. Operating profit excludes impacts arising from short-term fluctuations in investment return and economic assumption changes. It is calculated based on expected returns on investments backing equity holder funds, with consistent allowance for the corresponding expected movements in equity holder liabilities. Impacts arising from the difference between the expected return and actual return on investments, and the corresponding impact on equity holder liabilities except where they are directly related to a significant management action, are excluded from operating profit and are presented within profit before tax. The impact of certain changes in economic assumptions is also excluded from operating profit and is presented within profit before tax.
Standard Life 133
3. Financial information – Group accounting policies continued
Group accounting policies continued
(jj) Operating profit continued Operating profit also excludes the impact of the following items: • Restructuring costs and significant corporate transaction expenses • Impairment of intangible assets • Profit or loss arising on the disposal of a subsidiary, joint venture or associate • Amortisation of intangibles acquired in business combinations • Changes in Canada insurance contract liabilities as a result of the resolution of the tax position of individual matters relating to
prior years • Items which are one-off in nature and outside the control of management and which, due to their size or nature, are not
indicative of the long-term operating performance of the Group.
(kk) Earnings per share Basic earnings per share is calculated by dividing profit attributable to ordinary equity holders by the weighted average number of ordinary shares in issue during the year less the weighted average number of shares owned by the Company and employee trusts that have not vested unconditionally to employees.
Diluted earnings per share is calculated by adjusting the weighted average number of ordinary shares in issue during the year to assume the conversion of all dilutive potential ordinary shares, such as share options granted to employees.
Diluted earnings per share can also be calculated by adjusting profit or loss for the effects of changes in income, expenses, tax and dividends that would have occurred had the dilutive potential ordinary shares been converted into ordinary shares.
Alternative earnings per share is calculated on operating profit before tax. Refer to policy (jj) for details of the adjusted items.
134 Standard Life
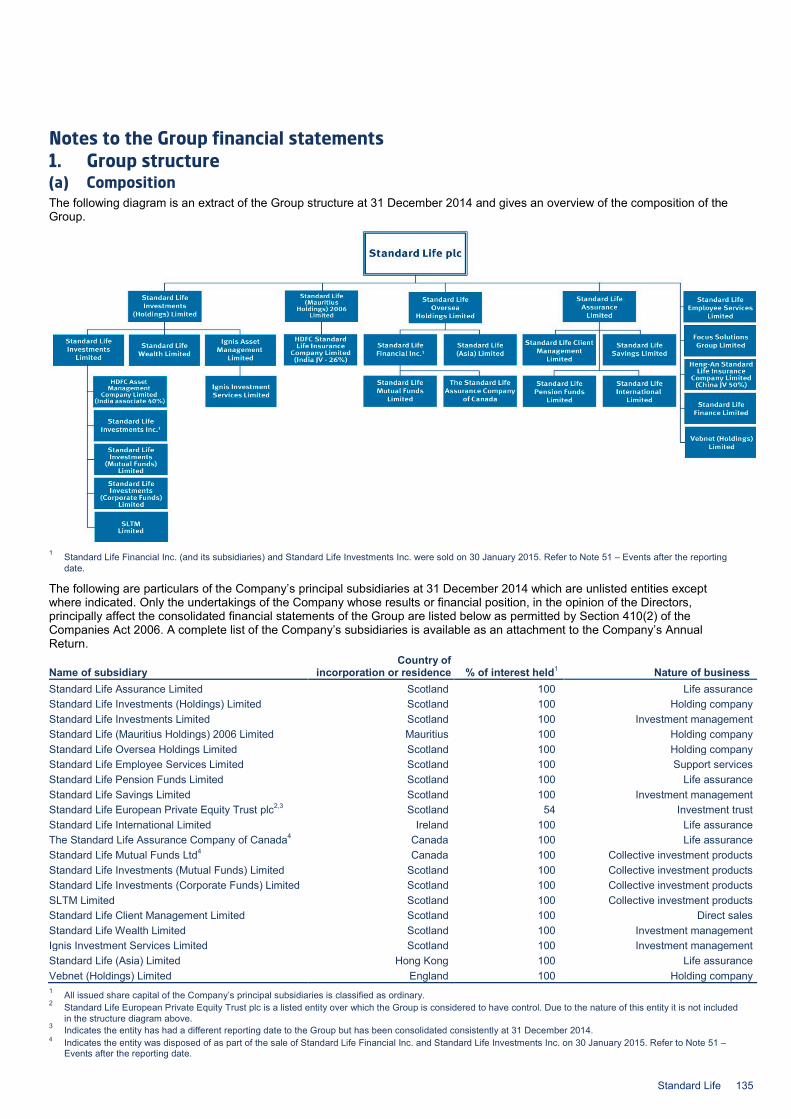
Notes to the Group financial statements 1. Group structure (a) Composition The following diagram is an extract of the Group structure at 31 December 2014 and gives an overview of the composition of the Group.
1 Standard Life Financial Inc. (and its subsidiaries) and Standard Life Investments Inc. were sold on 30 January 2015. Refer to Note 51 – Events after the reporting
date.
The following are particulars of the Company’s principal subsidiaries at 31 December 2014 which are unlisted entities except where indicated. Only the undertakings of the Company whose results or financial position, in the opinion of the Directors, principally affect the consolidated financial statements of the Group are listed below as permitted by Section 410(2) of the Companies Act 2006. A complete list of the Company’s subsidiaries is available as an attachment to the Company’s Annual Return. Name of subsidiary
Country of incorporation or residence % of interest held1 Nature of business
Standard Life Assurance Limited Scotland 100 Life assurance Standard Life Investments (Holdings) Limited Scotland 100 Holding company Standard Life Investments Limited Scotland 100 Investment management Standard Life (Mauritius Holdings) 2006 Limited Mauritius 100 Holding company Standard Life Oversea Holdings Limited Scotland 100 Holding company Standard Life Employee Services Limited Scotland 100 Support services Standard Life Pension Funds Limited Scotland 100 Life assurance Standard Life Savings Limited Scotland 100 Investment management Standard Life European Private Equity Trust plc2,3 Scotland 54 Investment trust Standard Life International Limited Ireland 100 Life assurance The Standard Life Assurance Company of Canada4 Canada 100 Life assurance Standard Life Mutual Funds Ltd4 Canada 100 Collective investment products Standard Life Investments (Mutual Funds) Limited Scotland 100 Collective investment products Standard Life Investments (Corporate Funds) Limited Scotland 100 Collective investment products SLTM Limited Scotland 100 Collective investment products Standard Life Client Management Limited Scotland 100 Direct sales Standard Life Wealth Limited Scotland 100 Investment management Ignis Investment Services Limited Scotland 100 Investment management Standard Life (Asia) Limited Hong Kong 100 Life assurance Vebnet (Holdings) Limited England 100 Holding company 1 All issued share capital of the Company’s principal subsidiaries is classified as ordinary. 2 Standard Life European Private Equity Trust plc is a listed entity over which the Group is considered to have control. Due to the nature of this entity it is not included
in the structure diagram above. 3 Indicates the entity has had a different reporting date to the Group but has been consolidated consistently at 31 December 2014. 4 Indicates the entity was disposed of as part of the sale of Standard Life Financial Inc. and Standard Life Investments Inc. on 30 January 2015. Refer to Note 51 –
Events after the reporting date.
Standard Life 135
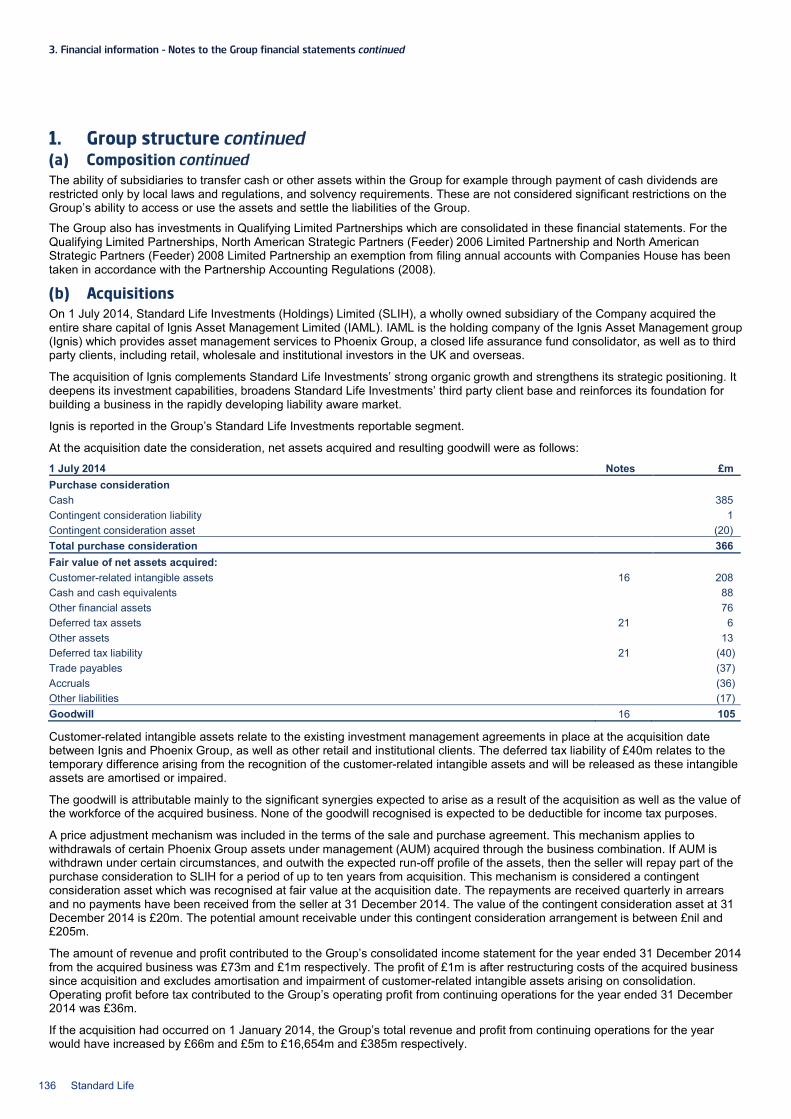
3. Financial information – Notes to the Group financial statements continued
1. Group structure continued (a) Composition continued The ability of subsidiaries to transfer cash or other assets within the Group for example through payment of cash dividends are restricted only by local laws and regulations, and solvency requirements. These are not considered significant restrictions on the Group’s ability to access or use the assets and settle the liabilities of the Group. The Group also has investments in Qualifying Limited Partnerships which are consolidated in these financial statements. For the Qualifying Limited Partnerships, North American Strategic Partners (Feeder) 2006 Limited Partnership and North American Strategic Partners (Feeder) 2008 Limited Partnership an exemption from filing annual accounts with Companies House has been taken in accordance with the Partnership Accounting Regulations (2008).
(b) Acquisitions On 1 July 2014, Standard Life Investments (Holdings) Limited (SLIH), a wholly owned subsidiary of the Company acquired the entire share capital of Ignis Asset Management Limited (IAML). IAML is the holding company of the Ignis Asset Management group (Ignis) which provides asset management services to Phoenix Group, a closed life assurance fund consolidator, as well as to third party clients, including retail, wholesale and institutional investors in the UK and overseas.
The acquisition of Ignis complements Standard Life Investments’ strong organic growth and strengthens its strategic positioning. It deepens its investment capabilities, broadens Standard Life Investments’ third party client base and reinforces its foundation for building a business in the rapidly developing liability aware market.
Ignis is reported in the Group’s Standard Life Investments reportable segment.
At the acquisition date the consideration, net assets acquired and resulting goodwill were as follows:
1 July 2014 Notes £m Purchase consideration Cash 385 Contingent consideration liability 1 Contingent consideration asset (20) Total purchase consideration 366 Fair value of net assets acquired: Customer-related intangible assets 16 208 Cash and cash equivalents 88 Other financial assets 76 Deferred tax assets 21 6 Other assets 13 Deferred tax liability 21 (40) Trade payables (37) Accruals (36) Other liabilities (17) Goodwill 16 105
Customer-related intangible assets relate to the existing investment management agreements in place at the acquisition date between Ignis and Phoenix Group, as well as other retail and institutional clients. The deferred tax liability of £40m relates to the temporary difference arising from the recognition of the customer-related intangible assets and will be released as these intangible assets are amortised or impaired.
The goodwill is attributable mainly to the significant synergies expected to arise as a result of the acquisition as well as the value of the workforce of the acquired business. None of the goodwill recognised is expected to be deductible for income tax purposes.
A price adjustment mechanism was included in the terms of the sale and purchase agreement. This mechanism applies to withdrawals of certain Phoenix Group assets under management (AUM) acquired through the business combination. If AUM is withdrawn under certain circumstances, and outwith the expected run-off profile of the assets, then the seller will repay part of the purchase consideration to SLIH for a period of up to ten years from acquisition. This mechanism is considered a contingent consideration asset which was recognised at fair value at the acquisition date. The repayments are received quarterly in arrears and no payments have been received from the seller at 31 December 2014. The value of the contingent consideration asset at 31 December 2014 is £20m. The potential amount receivable under this contingent consideration arrangement is between £nil and £205m.
The amount of revenue and profit contributed to the Group’s consolidated income statement for the year ended 31 December 2014 from the acquired business was £73m and £1m respectively. The profit of £1m is after restructuring costs of the acquired business since acquisition and excludes amortisation and impairment of customer-related intangible assets arising on consolidation. Operating profit before tax contributed to the Group’s operating profit from continuing operations for the year ended 31 December 2014 was £36m.
If the acquisition had occurred on 1 January 2014, the Group’s total revenue and profit from continuing operations for the year would have increased by £66m and £5m to £16,654m and £385m respectively.
136 Standard Life
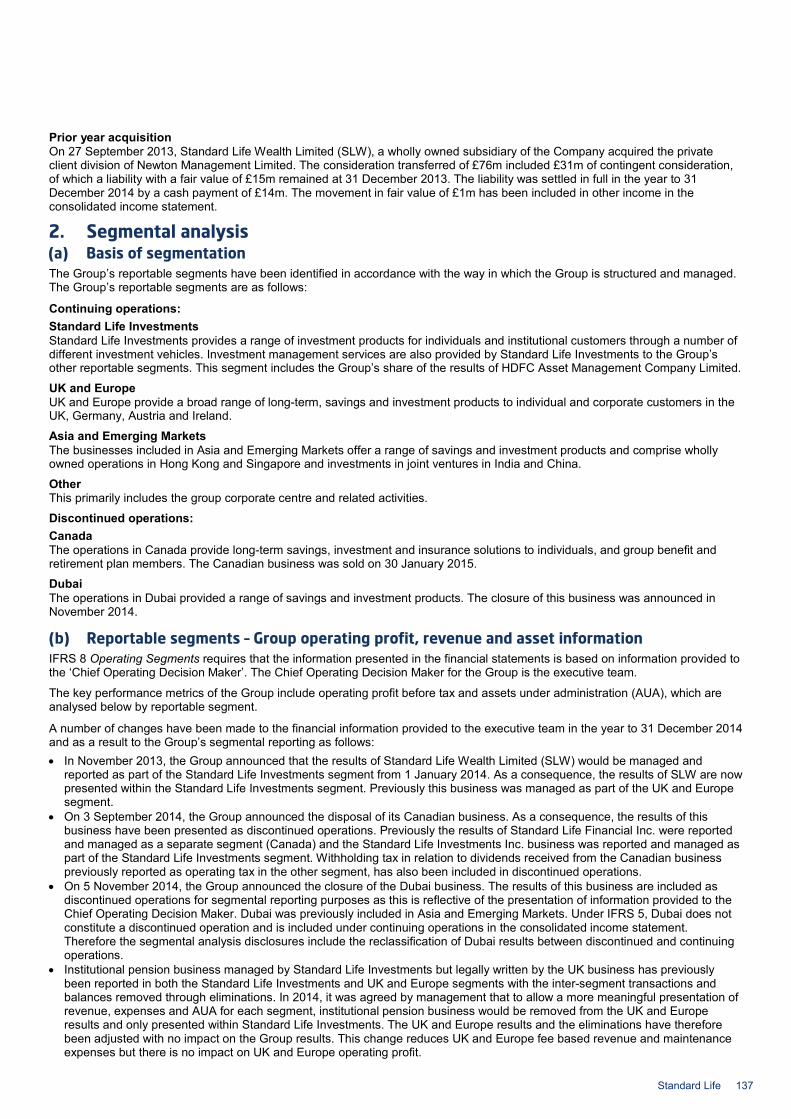
Prior year acquisition On 27 September 2013, Standard Life Wealth Limited (SLW), a wholly owned subsidiary of the Company acquired the private client division of Newton Management Limited. The consideration transferred of £76m included £31m of contingent consideration, of which a liability with a fair value of £15m remained at 31 December 2013. The liability was settled in full in the year to 31 December 2014 by a cash payment of £14m. The movement in fair value of £1m has been included in other income in the consolidated income statement.
2. Segmental analysis (a) Basis of segmentation The Group’s reportable segments have been identified in accordance with the way in which the Group is structured and managed. The Group’s reportable segments are as follows:
Continuing operations: Standard Life Investments Standard Life Investments provides a range of investment products for individuals and institutional customers through a number of different investment vehicles. Investment management services are also provided by Standard Life Investments to the Group’s other reportable segments. This segment includes the Group’s share of the results of HDFC Asset Management Company Limited.
UK and Europe UK and Europe provide a broad range of long-term, savings and investment products to individual and corporate customers in the UK, Germany, Austria and Ireland.
Asia and Emerging Markets The businesses included in Asia and Emerging Markets offer a range of savings and investment products and comprise wholly owned operations in Hong Kong and Singapore and investments in joint ventures in India and China.
Other This primarily includes the group corporate centre and related activities.
Discontinued operations: Canada The operations in Canada provide long-term savings, investment and insurance solutions to individuals, and group benefit and retirement plan members. The Canadian business was sold on 30 January 2015.
Dubai The operations in Dubai provided a range of savings and investment products. The closure of this business was announced in November 2014.
(b) Reportable segments – Group operating profit, revenue and asset information IFRS 8 Operating Segments requires that the information presented in the financial statements is based on information provided to the ‘Chief Operating Decision Maker’. The Chief Operating Decision Maker for the Group is the executive team.
The key performance metrics of the Group include operating profit before tax and assets under administration (AUA), which are analysed below by reportable segment.
A number of changes have been made to the financial information provided to the executive team in the year to 31 December 2014 and as a result to the Group’s segmental reporting as follows: • In November 2013, the Group announced that the results of Standard Life Wealth Limited (SLW) would be managed and
reported as part of the Standard Life Investments segment from 1 January 2014. As a consequence, the results of SLW are now presented within the Standard Life Investments segment. Previously this business was managed as part of the UK and Europe segment.
• On 3 September 2014, the Group announced the disposal of its Canadian business. As a consequence, the results of this business have been presented as discontinued operations. Previously the results of Standard Life Financial Inc. were reported and managed as a separate segment (Canada) and the Standard Life Investments Inc. business was reported and managed as part of the Standard Life Investments segment. Withholding tax in relation to dividends received from the Canadian business previously reported as operating tax in the other segment, has also been included in discontinued operations.
• On 5 November 2014, the Group announced the closure of the Dubai business. The results of this business are included as discontinued operations for segmental reporting purposes as this is reflective of the presentation of information provided to the Chief Operating Decision Maker. Dubai was previously included in Asia and Emerging Markets. Under IFRS 5, Dubai does not constitute a discontinued operation and is included under continuing operations in the consolidated income statement. Therefore the segmental analysis disclosures include the reclassification of Dubai results between discontinued and continuing operations.
• Institutional pension business managed by Standard Life Investments but legally written by the UK business has previously been reported in both the Standard Life Investments and UK and Europe segments with the inter-segment transactions and balances removed through eliminations. In 2014, it was agreed by management that to allow a more meaningful presentation of revenue, expenses and AUA for each segment, institutional pension business would be removed from the UK and Europe results and only presented within Standard Life Investments. The UK and Europe results and the eliminations have therefore been adjusted with no impact on the Group results. This change reduces UK and Europe fee based revenue and maintenance expenses but there is no impact on UK and Europe operating profit.
Standard Life 137
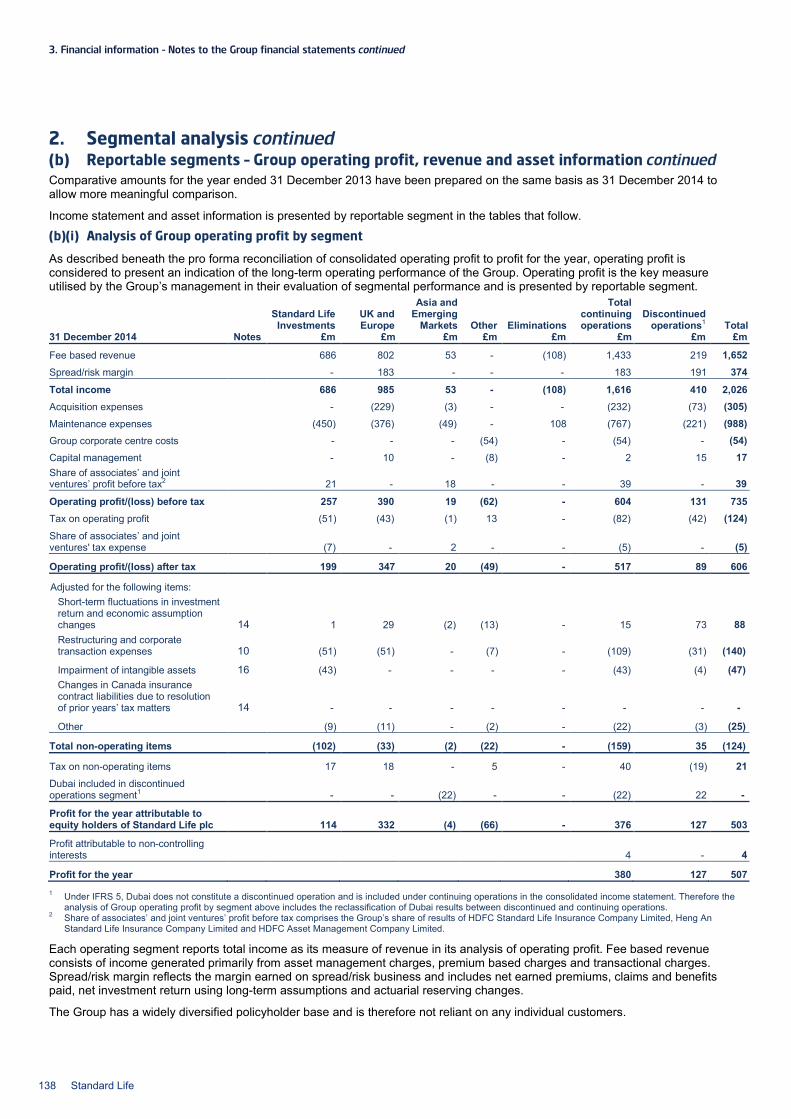
3. Financial information – Notes to the Group financial statements continued
2. Segmental analysis continued (b) Reportable segments – Group operating profit, revenue and asset information continued Comparative amounts for the year ended 31 December 2013 have been prepared on the same basis as 31 December 2014 to allow more meaningful comparison.
Income statement and asset information is presented by reportable segment in the tables that follow.
(b)(i) Analysis of Group operating profit by segment
As described beneath the pro forma reconciliation of consolidated operating profit to profit for the year, operating profit is considered to present an indication of the long-term operating performance of the Group. Operating profit is the key measure utilised by the Group’s management in their evaluation of segmental performance and is presented by reportable segment.
Standard Life Investments
UK and Europe
Asia and Emerging
Markets Other Eliminations
Total continuing operations
Discontinued operations1 Total
31 December 2014 Notes £m £m £m £m £m £m £m £m
Fee based revenue 686 802 53 - (108) 1,433 219 1,652 Spread/risk margin - 183 - - - 183 191 374
Total income 686 985 53 - (108) 1,616 410 2,026 Acquisition expenses - (229) (3) - - (232) (73) (305) Maintenance expenses (450) (376) (49) - 108 (767) (221) (988) Group corporate centre costs - - - (54) - (54) - (54) Capital management - 10 - (8) - 2 15 17 Share of associates’ and joint ventures’ profit before tax2 21 - 18 - - 39 - 39
Operating profit/(loss) before tax 257 390 19 (62) - 604 131 735 Tax on operating profit (51) (43) (1) 13 - (82) (42) (124) Share of associates’ and joint ventures' tax expense
(7) - 2 - - (5) - (5)
Operating profit/(loss) after tax 199 347 20 (49) - 517 89 606
Adjusted for the following items:
Short-term fluctuations in investment return and economic assumption changes 14 1 29 (2) (13) - 15 73 88 Restructuring and corporate transaction expenses 10 (51) (51) - (7) - (109) (31) (140)
Impairment of intangible assets 16 (43) - - - - (43) (4) (47) Changes in Canada insurance contract liabilities due to resolution of prior years’ tax matters 14 - - - - - - - -
Other
(9) (11) - (2) - (22) (3) (25)
Total non-operating items (102) (33) (2) (22) - (159) 35 (124)
Tax on non-operating items
17 18 - 5 - 40 (19) 21 Dubai included in discontinued operations segment1
- - (22) - - (22) 22 -
Profit for the year attributable to equity holders of Standard Life plc
114 332 (4) (66) - 376 127 503
Profit attributable to non-controlling interests
4 - 4
Profit for the year 380 127 507
1 Under IFRS 5, Dubai does not constitute a discontinued operation and is included under continuing operations in the consolidated income statement. Therefore the analysis of Group operating profit by segment above includes the reclassification of Dubai results between discontinued and continuing operations.
2 Share of associates’ and joint ventures’ profit before tax comprises the Group’s share of results of HDFC Standard Life Insurance Company Limited, Heng An Standard Life Insurance Company Limited and HDFC Asset Management Company Limited.
Each operating segment reports total income as its measure of revenue in its analysis of operating profit. Fee based revenue consists of income generated primarily from asset management charges, premium based charges and transactional charges. Spread/risk margin reflects the margin earned on spread/risk business and includes net earned premiums, claims and benefits paid, net investment return using long-term assumptions and actuarial reserving changes.
The Group has a widely diversified policyholder base and is therefore not reliant on any individual customers.
138 Standard Life

Standard Life Investments
UK and Europe
Asia and Emerging
Markets Other Eliminations
Total continuing operations
Discontinued operations1 Total
31 December 2013 Notes £m £m £m £m £m £m £m £m Fee based revenue 514 795 54 - (107) 1,256 203 1,459 Spread/risk margin - 162 - - - 162 351 513 Total income 514 957 54 - (107) 1,418 554 1,972 Acquisition expenses - (227) (16) - - (243) (82) (325) Maintenance expenses (339) (358) (43) - 107 (633) (243) (876) Group corporate centre costs - - - (53) - (53) - (53) Capital management - 3 - (13) - (10) 16 6 Share of associates’ and joint ventures’ profit before tax2
22 - 5 - - 27 - 27
Operating profit/(loss) before tax 197 375 - (66) - 506 245 751 Tax on operating profit (41) (47) - 11 - (77) (64) (141) Share of associates’ and joint ventures' tax expense
(7) - - - - (7) (1) (8)
Operating profit/(loss) after tax 149 328 - (55) - 422 180 602 Adjusted for the following items
Short-term fluctuations in investment return and economic assumption changes 14 1 (11) (2) (10) - (22) (70) (92) Restructuring and corporate transaction expenses 10 (13) (48) (5) (5) - (71) (2) (73)
Impairment of intangible assets 16 - - - - - - - - Changes in Canada insurance contract liabilities due to resolution of prior years’ tax matters
- - - - - - (15) (15) Other - (5) - (2) - (7) - (7)
Total non-operating items (12) (64) (7) (17) - (100) (87) (187) Tax on non-operating items 2 12 1 4 - 19 32 51 Dubai included in discontinued operations segment1
- - (6) - - (6) 6 -
Profit/(loss) for the year attributable to equity holders of Standard Life plc
139 276 (12) (68) - 335 131 466 Profit attributable to non-controlling interests
30 - 30
Profit for the year 365 131 496 1 Under IFRS 5, Dubai does not constitute a discontinued operation and is included under continuing operations in the consolidated income statement. Therefore the
analysis of Group operating profit by segment above includes the reclassification of Dubai results between discontinued and continuing operations. 2 Share of associates’ and joint ventures’ profit before tax comprises the Group’s share of results of HDFC Standard Life Insurance Company Limited, Heng An
Standard Life Insurance Company Limited and HDFC Asset Management Company Limited.
Standard Life 139
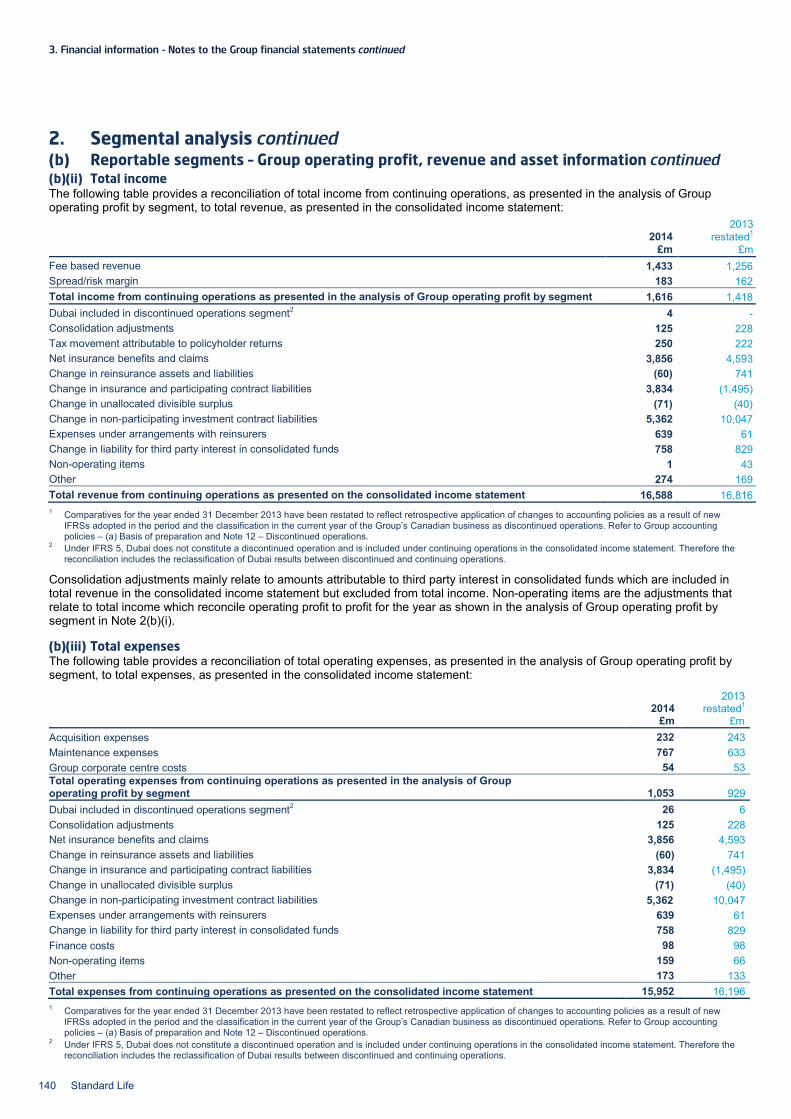
3. Financial information – Notes to the Group financial statements continued
2. Segmental analysis continued (b) Reportable segments – Group operating profit, revenue and asset information continued (b)(ii) Total income The following table provides a reconciliation of total income from continuing operations, as presented in the analysis of Group operating profit by segment, to total revenue, as presented in the consolidated income statement:
2014 2013
restated1 £m £m Fee based revenue 1,433 1,256 Spread/risk margin 183 162 Total income from continuing operations as presented in the analysis of Group operating profit by segment 1,616 1,418 Dubai included in discontinued operations segment2 4 - Consolidation adjustments 125 228 Tax movement attributable to policyholder returns 250 222 Net insurance benefits and claims 3,856 4,593 Change in reinsurance assets and liabilities (60) 741 Change in insurance and participating contract liabilities 3,834 (1,495) Change in unallocated divisible surplus (71) (40) Change in non-participating investment contract liabilities 5,362 10,047 Expenses under arrangements with reinsurers 639 61 Change in liability for third party interest in consolidated funds 758 829 Non-operating items 1 43 Other 274 169 Total revenue from continuing operations as presented on the consolidated income statement 16,588 16,816 1 Comparatives for the year ended 31 December 2013 have been restated to reflect retrospective application of changes to accounting policies as a result of new
IFRSs adopted in the period and the classification in the current year of the Group’s Canadian business as discontinued operations. Refer to Group accounting policies – (a) Basis of preparation and Note 12 – Discontinued operations.
2 Under IFRS 5, Dubai does not constitute a discontinued operation and is included under continuing operations in the consolidated income statement. Therefore the reconciliation includes the reclassification of Dubai results between discontinued and continuing operations.
Consolidation adjustments mainly relate to amounts attributable to third party interest in consolidated funds which are included in total revenue in the consolidated income statement but excluded from total income. Non-operating items are the adjustments that relate to total income which reconcile operating profit to profit for the year as shown in the analysis of Group operating profit by segment in Note 2(b)(i). (b)(iii) Total expenses The following table provides a reconciliation of total operating expenses, as presented in the analysis of Group operating profit by segment, to total expenses, as presented in the consolidated income statement:
1 Comparatives for the year ended 31 December 2013 have been restated to reflect retrospective application of changes to accounting policies as a result of new IFRSs adopted in the period and the classification in the current year of the Group’s Canadian business as discontinued operations. Refer to Group accounting policies – (a) Basis of preparation and Note 12 – Discontinued operations.
2 Under IFRS 5, Dubai does not constitute a discontinued operation and is included under continuing operations in the consolidated income statement. Therefore the reconciliation includes the reclassification of Dubai results between discontinued and continuing operations.
2014 2013
restated1 £m £m Acquisition expenses 232 243 Maintenance expenses 767 633 Group corporate centre costs 54 53 Total operating expenses from continuing operations as presented in the analysis of Group operating profit by segment 1,053 929 Dubai included in discontinued operations segment2 26 6 Consolidation adjustments 125 228 Net insurance benefits and claims 3,856 4,593 Change in reinsurance assets and liabilities (60) 741 Change in insurance and participating contract liabilities 3,834 (1,495) Change in unallocated divisible surplus (71) (40) Change in non-participating investment contract liabilities 5,362 10,047 Expenses under arrangements with reinsurers 639 61 Change in liability for third party interest in consolidated funds 758 829 Finance costs 98 98 Non-operating items 159 66 Other 173 133 Total expenses from continuing operations as presented on the consolidated income statement 15,952 16,196
140 Standard Life
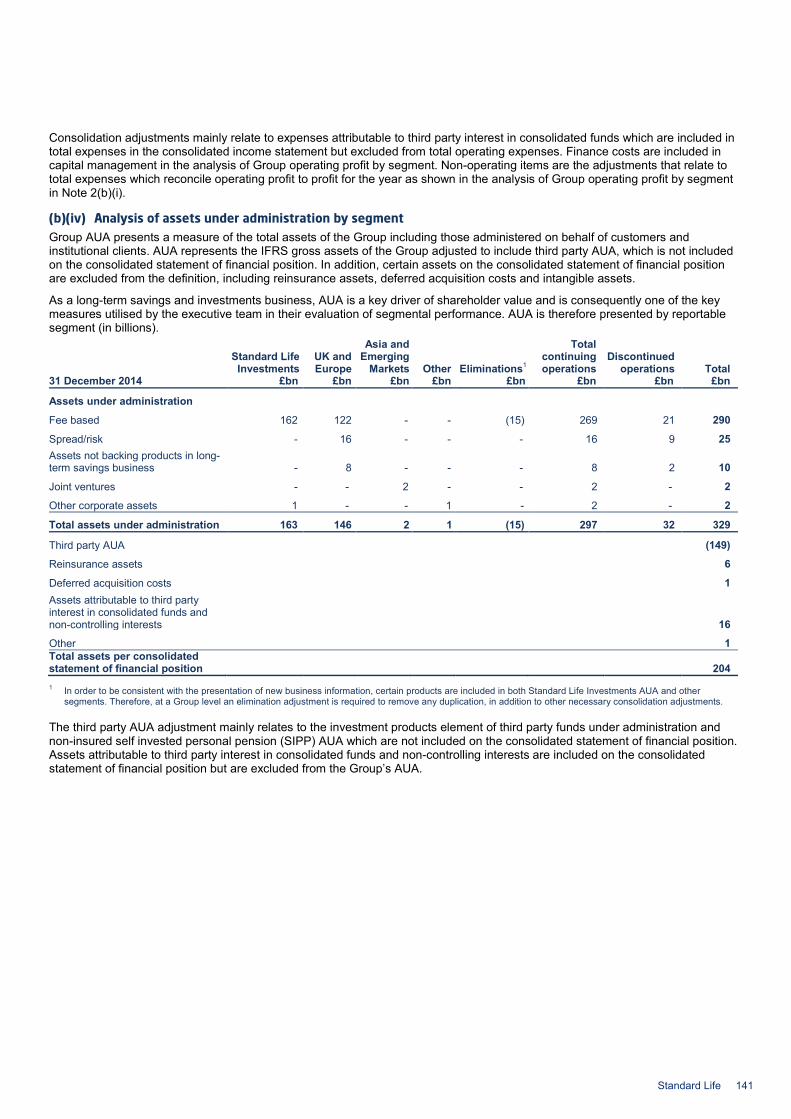
Consolidation adjustments mainly relate to expenses attributable to third party interest in consolidated funds which are included in total expenses in the consolidated income statement but excluded from total operating expenses. Finance costs are included in capital management in the analysis of Group operating profit by segment. Non-operating items are the adjustments that relate to total expenses which reconcile operating profit to profit for the year as shown in the analysis of Group operating profit by segment in Note 2(b)(i).
(b)(iv) Analysis of assets under administration by segment Group AUA presents a measure of the total assets of the Group including those administered on behalf of customers and institutional clients. AUA represents the IFRS gross assets of the Group adjusted to include third party AUA, which is not included on the consolidated statement of financial position. In addition, certain assets on the consolidated statement of financial position are excluded from the definition, including reinsurance assets, deferred acquisition costs and intangible assets.
As a long-term savings and investments business, AUA is a key driver of shareholder value and is consequently one of the key measures utilised by the executive team in their evaluation of segmental performance. AUA is therefore presented by reportable segment (in billions).
Standard Life Investments
UK and Europe
Asia and Emerging
Markets Other Eliminations1
Total continuing operations
Discontinued operations Total
31 December 2014 £bn £bn £bn £bn £bn £bn £bn £bn
Assets under administration
Fee based 162 122 - - (15) 269 21 290
Spread/risk - 16 - - - 16 9 25 Assets not backing products in long-term savings business - 8 - - - 8 2 10
Joint ventures - - 2 - - 2 - 2
Other corporate assets 1 - - 1 - 2 - 2
Total assets under administration 163 146 2 1 (15) 297 32 329
Third party AUA (149)
Reinsurance assets 6
Deferred acquisition costs 1 Assets attributable to third party interest in consolidated funds and non-controlling interests 16
Other 1 Total assets per consolidated statement of financial position 204 1 In order to be consistent with the presentation of new business information, certain products are included in both Standard Life Investments AUA and other
segments. Therefore, at a Group level an elimination adjustment is required to remove any duplication, in addition to other necessary consolidation adjustments.
The third party AUA adjustment mainly relates to the investment products element of third party funds under administration and non-insured self invested personal pension (SIPP) AUA which are not included on the consolidated statement of financial position. Assets attributable to third party interest in consolidated funds and non-controlling interests are included on the consolidated statement of financial position but are excluded from the Group’s AUA.
Standard Life 141
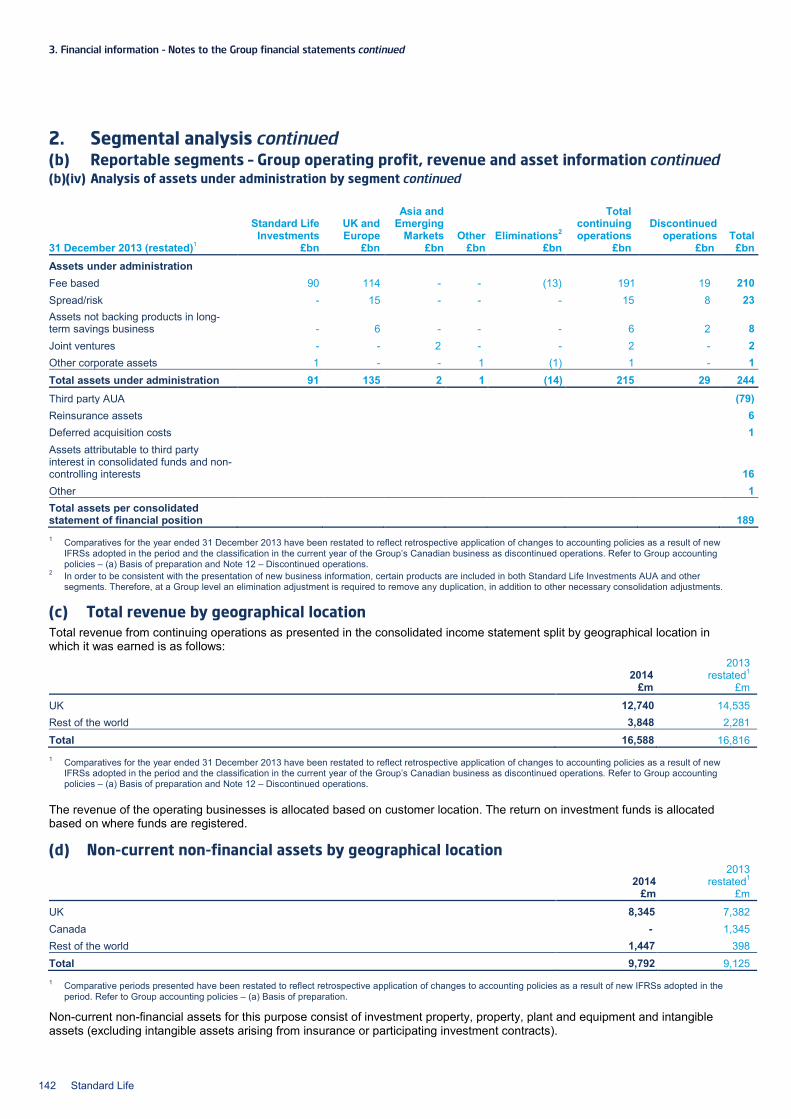
3. Financial information – Notes to the Group financial statements continued
2. Segmental analysis continued (b) Reportable segments – Group operating profit, revenue and asset information continued (b)(iv) Analysis of assets under administration by segment continued
Standard Life
Investments UK and Europe
Asia and Emerging
Markets Other Eliminations2
Total continuing operations
Discontinued operations Total
31 December 2013 (restated)1 £bn £bn £bn £bn £bn £bn £bn £bn Assets under administration Fee based 90 114 - - (13) 191 19 210 Spread/risk - 15 - - - 15 8 23 Assets not backing products in long-term savings business - 6 - - - 6 2 8 Joint ventures - - 2 - - 2 - 2 Other corporate assets 1 - - 1 (1) 1 - 1 Total assets under administration 91 135 2 1 (14) 215 29 244 Third party AUA (79) Reinsurance assets 6 Deferred acquisition costs 1 Assets attributable to third party interest in consolidated funds and non-controlling interests 16 Other 1 Total assets per consolidated statement of financial position 189 1 Comparatives for the year ended 31 December 2013 have been restated to reflect retrospective application of changes to accounting policies as a result of new
IFRSs adopted in the period and the classification in the current year of the Group’s Canadian business as discontinued operations. Refer to Group accounting policies – (a) Basis of preparation and Note 12 – Discontinued operations.
2 In order to be consistent with the presentation of new business information, certain products are included in both Standard Life Investments AUA and other segments. Therefore, at a Group level an elimination adjustment is required to remove any duplication, in addition to other necessary consolidation adjustments.
(c) Total revenue by geographical location Total revenue from continuing operations as presented in the consolidated income statement split by geographical location in which it was earned is as follows:
2014
2013 restated1
£m £m
UK 12,740 14,535 Rest of the world 3,848 2,281 Total 16,588 16,816 1 Comparatives for the year ended 31 December 2013 have been restated to reflect retrospective application of changes to accounting policies as a result of new
IFRSs adopted in the period and the classification in the current year of the Group’s Canadian business as discontinued operations. Refer to Group accounting policies – (a) Basis of preparation and Note 12 – Discontinued operations.
The revenue of the operating businesses is allocated based on customer location. The return on investment funds is allocated based on where funds are registered.
(d) Non-current non-financial assets by geographical location
2014 2013
restated1 £m £m
UK 8,345 7,382 Canada - 1,345 Rest of the world 1,447 398 Total 9,792 9,125 1 Comparative periods presented have been restated to reflect retrospective application of changes to accounting policies as a result of new IFRSs adopted in the
period. Refer to Group accounting policies – (a) Basis of preparation.
Non-current non-financial assets for this purpose consist of investment property, property, plant and equipment and intangible assets (excluding intangible assets arising from insurance or participating investment contracts).
142 Standard Life
3. Business written in the Group’s insurance entities (a) How the business is held in the Group’s insurance entities The Group’s insurance and investment contracts are held by the regulated entities within each reportable segment. Each regulated entity operates various funds and how the business is held within these funds is outlined below by reportable segment.
(a)(i) UK and Europe Standard Life Assurance Limited The main entity in the UK and Europe reportable segment that issues insurance and investment contracts is Standard Life Assurance Limited (SLAL). SLAL operates a fund structure which was established on the demutualisation of The Standard Life Assurance Company on 10 July 2006, under which its recognised assets and liabilities are allocated to one of the following funds: • Shareholder Fund (SHF) • Proprietary Business Fund (PBF) – includes UK, German and Irish branches • Heritage With Profits Fund (HWPF) – includes UK, German and Irish branches • German With Profits Fund (GWPF) • German Smoothed Managed With Profits Fund (GSMWPF) • UK Smoothed Managed With Profits Fund (UKSMWPF).
SLAL – Insurance and investment contracts issued since demutualisation The liabilities and associated supporting assets for contracts issued since demutualisation are held in the PBF except for the element of any contract where the customer has chosen to invest in a with profits (i.e. participating) fund. The assets and associated liabilities, including liabilities for financial guarantees, for such with profits investment elements are held in the GWPF, GSMWPF or UKSMWPF. The PBF is sub-divided into internal linked funds (unit linked funds) and a non-unit linked fund. Where a customer invests on a unit linked basis, the assets and corresponding liabilities for such unit linked investment elements are held in the unit linked funds. Asset management charges are transferred from the unit linked funds to the non-unit linked sub-fund of the PBF as they arise. Any liabilities for insurance features or financial guarantees contained within a contract that has a unit linked investment element are held in the non-unit linked sub-fund of the PBF. Any liabilities for insurance features contained within a contract that has a with profits element are held in the non-unit linked sub-fund of the PBF. Deferred income and deferred acquisition costs arising on contracts that have a unit linked investment element or a with profits investment element are held in the non-unit linked sub-fund of the PBF.
SLAL – Insurance and investment contracts issued before demutualisation The liabilities and associated supporting assets for contracts, both participating and non-participating, issued prior to demutualisation are mostly held in the HWPF except for (i) the assets and corresponding liabilities for unit linked investment elements of such contracts, and (ii) the supporting assets and associated liabilities for longevity risk and investment risk on certain annuity contracts. The assets and associated liabilities for these two contract components are held in the PBF. Asset management charges arising on unit linked investment elements are transferred from the PBF to HWPF as they arise. Any liabilities for insurance features or financial guarantees contained within a contract that has a unit linked investment element or a with profits investment element are held in the HWPF. Deferred income and deferred acquisition costs arising on contracts that have a unit linked investment element or a with profits investment element are also held in the HWPF.
Under the Scheme of Demutualisation (the Scheme) the residual estate of the HWPF exists to meet amounts which may be charged to the HWPF under the Scheme. However, to the extent that the board of SLAL is satisfied that there is an excess residual estate, it shall be distributed over time as an enhancement to final bonuses payable on the remaining eligible policies invested in the HWPF. The Scheme provides that certain defined cash flows (recourse cash flows (RCF)) arising in the HWPF on specified blocks of UK and Irish business, both participating and non-participating, may be transferred out of that fund when they emerge, being transferred to the SHF, and thus accrue to the ultimate benefit of equity holders of the Company. The Scheme also provides for additional expenses to be charged by the PBF to the HWPF in respect of German branch business. Under these mechanisms, profits, on an RCF basis, on non-participating business excluding investment spread profits on annuities and profits, on an RCF basis or German additional expenses basis, on unitised with profits contracts, are transferred to the SHF. All investment return on HWPF investments is retained in the HWPF for the ultimate benefit of participating policyholders. Under the Scheme, transfers to the SHF are subject to certain constraints in order to protect policyholders.
Standard Life International Limited The UK and Europe reportable segment also contains the International Bond issued by Standard Life International Limited (SLIL) to UK residents. Note (b)(i) contains a description of the fund structure operated by SLIL.
(a)(ii) Asia and Emerging Markets The entities in the Asia and Emerging Markets reportable segment that issue insurance and investment contracts, other than joint ventures, are SLIL and Standard Life (Asia) Limited (SLA). These entities operate using a shareholder fund and a long-term business fund which is sub-divided into unit linked funds and a non-unit linked fund. Where a customer invests on a unit linked basis, the assets and associated liabilities for such unit linked investment elements are held in the unit linked funds. Any liabilities for insurance features contained within a contract that has a unit linked investment element are held in the non-unit linked fund. Deferred income and deferred acquisition costs arising on contracts that have a unit linked investment element are held in the non-unit linked fund.
Standard Life 143
3. Financial information – Notes to the Group financial statements continued
3. Business written in the Group’s insurance entities continued (a) How the business is held in the Group’s insurance entities continued (a)(iii) Canada The Canadian business is included as discontinued operations following the announcement on 3 September 2014. The main entity in the Canada reportable segment that issues insurance and investment contracts is The Standard Life Assurance Company of Canada (SLCC). SLCC operates a fund structure under which certain recognised assets and associated liabilities are allocated to either segregated funds or a participating fund. Its remaining recognised assets are managed together to support other contract liabilities and to contribute to equity holders surplus. Where a customer chooses to invest on a segregated fund basis, the assets and associated liabilities for such segregated fund investment elements are held in the segregated funds. SLCC’s segregated funds operate on a similar basis to SLAL’s unit linked funds. Any liabilities for insurance features or financial guarantees contained within a contract that has a segregated fund investment element are held outside the segregated funds. Deferred income and deferred acquisition costs arising on contracts that have a segregated fund investment element are also held outside the segregated funds.
SLAL operates a Canada branch. A separate sub-fund of the PBF is maintained for this branch. All contracts issued from SLAL’s Canadian PBF are wholly reinsured to SLCC.
(b) Insurance, investment and reinsurance contract terms including guarantees and options Details of the significant types of insurance and investment contracts issued by the Group, the nature of any guarantees and options provided under these contracts and details of significant reinsurance contracts are given below.
(b)(i) UK and Europe – Insurance and investment contracts issued since demutualisation UK annuity-in-payment contracts (spread/risk business) This class of business consists of single premium contracts that provide guaranteed annuity payments. The payments depend on the survival of a life or lives with or without a guaranteed period and may reduce on a specified death or increase each year at a predefined rate or based on the movement in UK RPI. These contracts are classified as non-participating insurance contracts.
The total liability at 31 December 2014 for RPI linked annuities in payment (including any guaranteed minimum rate of escalation) is £373m (2013: £320m) and this represents approximately 9% (2013: 9%) of the total liability for UK annuity in payment contracts held within the PBF. There is a subset of annuities where the RPI linked annuity payment cannot fall or is guaranteed to increase at a minimum rate; the majority of such annuities are those whose payment cannot fall. If the market moves in line with the adverse scenarios as shown in the market risk sensitivity analysis in Note 42(b), then the impact on shareholder equity from these RPI linked annuities and corresponding assets is not significant.
For those annuities in payment which increase at a predefined rate, the total liability at 31 December 2014 is £343m (2013: £274m) and this represents approximately 8% (2013: 8%) of the total liability for UK annuity in payment contracts held in the PBF. If the market moves in line with the adverse market conditions as shown in the market risk sensitivity analysis, the impact on the shareholder equity from those annuities with a predefined rate of increase and the corresponding assets is not significant.
UK and Irish unit linked pension contracts (fee business) This class of business comprises single or regular premium contracts under which a percentage of the premium is used to allocate units in one or more unit linked funds. These contracts do not provide significant death benefits in excess of the accumulated value of investment fund. They are classified as non-participating investment contracts.
Contracts are categorised as retail (e.g. UK Active Money Self Invested Personal Pensions (SIPP), UK Active Money Personal Pension, UK Stakeholder, Irish Synergy Personal Pension), corporate (e.g. UK Group SIPP, UK Group Flexible Retirement Plan, UK Group Stakeholder) and institutional (Trustee Investment Plan). These contracts do not contain a with profits investment option except for UK Group Stakeholder and UK Stakeholder, under which customers may invest in the UKSMWPF.
The costs of contracts invested in unit linked funds are recovered by deduction of an asset management charge from the unit linked funds. Under Stakeholder contracts, this asset management charge has a specified maximum limit. There are no other guarantees on these contracts with the exception that the unit prices of certain cash funds are guaranteed not to fall.
Under UK SIPP contracts, as well as investing in unit linked funds offered by SLAL, policyholders can choose to invest in a wide range of other permitted investments. These other investments are not recognised on the Group’s consolidated statement of financial position.
UK unit linked investment bonds (fee business) Unit linked investment bonds issued by SLAL (e.g. Capital Investment Bond) are single premium whole of life contracts under which a percentage of the premium is used to allocate units in one or more unit linked funds. These contracts do not provide significant death benefits in excess of the accumulated value of investment fund. They are classified as non-participating investment contracts. There are no other guarantees on these contracts with the exception that the unit prices of certain cash funds are guaranteed not to fall.
The International Bond is issued by SLIL to UK residents. It is a single premium whole of life investment bond. The customer has the option to invest in unit linked funds offered by SLIL and mutual funds and deposit accounts offered by other providers. The mutual funds and deposit accounts are recognised as assets by the Group and are classified as unit linked business along with a corresponding liability. On death of the last life assured an additional benefit of 0.1% of the surrender value is paid unless the death is accidental when an additional benefit of 10% of the surrender value is paid subject to a £1m cap. These contracts are
144 Standard Life
classified as insurance contracts where it is considered that the accidental death benefit transfers significant insurance risk. No other guarantees apply to this contract. German unitised with profits deferred annuity contracts (fee business) German unitised with profits deferred annuities contracts are written in the PBF with the participating investment elements being transferred to the GWPF and, to a significantly lesser extent, to the GSMWPF. The death benefit under all of the deferred annuities is the greater of the sum assured on death, 100% of the current surrender value, the nominal fund, and, for regular premium paying contracts and certain single premium contracts, a refund of premiums. These contracts are classified as participating insurance contracts.
The maturity value of contracts invested in the GWPF is subject to guaranteed minimum amounts. In addition, certain contracts are subject to guaranteed annuity amounts or guaranteed annuity factors and certain unit prices in the GWPF are guaranteed not to decrease.
The GWPF is operated such that all investment return on assets held in the fund will be distributed to participating policyholders over time subject to deductions of asset management charges and deductions for guarantees.
(b)(ii) UK and Europe – Insurance and investment contracts issued before demutualisation and related reinsurance contracts
HWPF participating contract allocations of regular and final bonuses This section firstly describes the method used by the Group to determine the regular and final bonuses allocated to participating contracts held in the HWPF. It then describes the significant types of insurance and investment contracts held in that fund, the nature of any guarantees provided and significant reinsurance contracts. As shown in the market risk sensitivity analysis in Note 42(b), there is no impact on shareholder equity arising from contracts in the HWPF for either of the market movements scenarios. As explained in the limitations of the sensitivity analysis, this is because although shareholders are potentially exposed to the full cost if the assets of the HWPF are insufficient to meet policyholder obligations, the assumption changes given are not severe enough for such an event to occur.
Regular bonuses are declared at the discretion of the Group in accordance with the Principles and Practices of Financial Management (PPFM) of the HWPF for UK business and similar principles for European business and are set at levels which aim to achieve a gradual build-up in guaranteed participating policy benefits whilst not unduly constraining investment freedom and the prospects for final bonuses. In setting these rates, the financial position (both current and projected) of the HWPF is taken into account, and were it necessary, regular bonus rates would be set to zero. Regular bonus rates are set for each relevant class of participating policy and/or internal fund and reflect its characteristics, including any guarantees. For some contracts, final bonuses may also be paid. These bonuses are not guaranteed and can be withdrawn at any time.
The Group’s aim is that, subject to meeting all contractual obligations and maintaining an adequate financial position, payouts on a participating policy (including any final bonus applying) should fairly reflect the experience of the HWPF applicable to such a policy, after any adjustments for smoothing, and any distribution of the residual estate deemed appropriate by the Group.
When setting payout levels, the Group seeks to ensure fair treatment between those participating policyholders who choose to withdraw and those who remain.
Asset shares are used as a tool to determine fair treatment. The calculation of asset shares varies between products, for example calculations can be on the basis of representative policies or on an individual policy basis.
The methodology and parameters used in payout calculations may, of necessity, involve some measure of approximation. The Group reviews regularly the methodology and parameters used and sets parameters on bases appropriate for the participating class and/or internal fund concerned.
In normal circumstances the Group seeks to offer some smoothing of investment returns to participating policyholders at the time of claims due to maturity for life policies or for pension policies where the Group has no right to reduce benefits as defined in the relevant contractual terms and conditions. The Group may, at its discretion, also provide some smoothing of investment returns for death claims and some types of withdrawal at the time of payment. The Group aims to operate smoothing of investment returns in such a way as to be neutral for participating policyholders as a whole over time. The Group monitors the anticipated cost of smoothing on a regular basis and, in most circumstances, will reflect the costs in payouts and in some circumstances adjust the approach to smoothing.
When calculating asset shares, the Group may, at its discretion, make fair deductions to reflect its assessment of the cost of guarantees. The Group takes an allowance for the assessed costs of guarantees when determining final bonuses payable on claims, calculating policy switch values and calculating surrender and transfer values. These allowances vary between types of policies, reflecting the nature of the guarantees provided. These allowances are kept under review. A deduction is also taken from participating asset shares determined on an expense basis of 0.5% pa as a contribution to the capital of the HWPF.
Eligible policies covered by the Mortgage Endowment Promise may receive ‘top up’ amounts, in accordance with the Scheme.
UK conventional with profits contracts (no impact on equity holder profits in the absence of burnthrough) Conventional (i.e. non-unitised) with profits contracts consist of single or regular premium endowment, whole life and pension contracts held in the HWPF. Under endowment and whole life contracts, guaranteed benefits are payable on death. Regular bonuses may be added to the guaranteed sum assured over the term of the policy and, in addition, a final bonus may be paid on death and maturity. Certain endowment assurances have minimum surrender value provisions and minimum paid-up values.
Standard Life 145

3. Financial information – Notes to the Group financial statements continued
3. Business written in the Group’s insurance entities continued (b) Insurance, investment and reinsurance contract terms including guarantees and options
continued (b)(ii) UK and Europe – Insurance and investment contracts issued before demutualisation and related reinsurance
contracts continued Under pension contracts, a minimum level of benefit is set at the outset and applies at the date(s) specified in the policy, for example under pure endowment contracts. Regular bonuses may be added to this initial minimum over the term of the policy and, in addition, a final bonus may be paid. Guaranteed annuity options providing for payment of a minimum annuity, in lieu of a cash sum, are available under pure endowment contracts. Under some of these contracts the guarantee applies only at the maturity date. Under other contracts, the option also applies for a specified period preceding the maturity date, in which case the sum assured and bonuses are reduced by specified factors and different guaranteed annuity rates apply.
All conventional with profits contracts are classified as participating insurance contracts.
UK and Irish unitised with profits pension contracts (fee business via RCF) This class of business comprises single or regular premium contracts held in the HWPF under which a percentage of the premium is used to allocate units on a participating basis. Such contracts include hybrid contracts (see accounting policy (f)) resulting in the unitised with profits investment elements being classified as participating investment contracts, although there are some contracts that are classified as participating insurance contracts, for example those with guaranteed minimum pensions. The major unitised with profits pension contracts include Individual Personal Pension Plans (retail), Group Personal Pension Plans, Executive Pensions and Stakeholder (corporate) and Trustee Investment Plans (institutional).
The significant options and guarantees under these contracts are the following: • Contracts where, subject to specified conditions, it is guaranteed either that the unit price will rise at an annual rate of at least
4% per year or that the unit price will not fall, and, that there will be no unit price adjustment (UPA) at specified retirement dates or death
• Certain Trustee Investment Plan contracts where, subject to specified conditions and limits, it is guaranteed that there will be no unit price adjustment (UPA) when units are encashed.
UK and Irish unitised with profits life contracts (fee business via RCF) Unitised with profits life business comprises single or regular premium endowment and whole life contracts held in the HWPF under which a percentage of the premium is used to allocate units on a participating basis. The death benefit under regular premium contracts is the greater of the bid value of units allocated and sum assured under the contract. Some contracts also contain critical illness cover providing for payment of a critical illness sum assured on diagnosis of certain defined serious illnesses. These contracts, principally Homeplan, With Profits Bonds and Versatile Investment Plans, are classified as participating insurance contracts.
The significant options and guarantees under these contracts are the following: • Contracts where, subject to specified conditions, it is guaranteed on death and maturity either that the unit price will rise at an
annual rate of at least 3% a year or that the unit price will not fall, and, that there will be no UPA at maturity • For bonds it is guaranteed that no UPA will apply on regular withdrawals up to certain specified limits.
Under contracts effected in connection with house purchase, the death benefit is guaranteed. Under other regular premium contracts, at any time after the first ten years, the Group may review the status of the contract and, if it deems it necessary, the sum assured may be reduced, within the limits permitted.
Under some contracts effected in connection with house purchase, provided the original contract is still in force, the following options can normally be exercised at any time before the 55th birthday of the life assured: • Future insurability option under which a new contract can be effected on then current premium rates, in connection with a further
loan, up to the level of life and basic critical illness cover available on the original contract, without any further evidence of health • Term extension option on then current premium rates under which the term of the contract may be extended by a whole number
of years if the lender agrees to extend the term of the loan.
German unitised with profits contracts (fee business via German additional expenses basis) Unitised with profits German contracts held in the HWPF mainly consist of endowment assurances and deferred annuities, under which a percentage of each premium is applied to purchase units on a participating basis. The death benefit under endowment assurances is the greater of the sum assured on death or 105% of the current surrender value. The death benefit under deferred annuities is the greater of the sum assured on death, 100% of the current surrender value, the nominal fund and, for regular premium paying contracts and certain single premium contracts, a refund of premiums. These contracts are classified as participating insurance contracts.
The maturity value, and for certain contracts the surrender benefits, are subject to guaranteed minimum amounts. For some participating unitised policies it is guaranteed that there will be no UPA on claims on or after the surrender option date. Certain contracts are subject to guaranteed annuity amounts or guaranteed annuity factors. In addition certain unit prices in the HWPF are guaranteed not to decrease.
UK and Irish unit linked pension contracts (fee business via RCF) This class of business comprises single or regular premium contracts under which a percentage of the premium is used to allocate units in one or more unit linked funds held in the PBF. Such contracts include hybrid contracts (see accounting policy (f)) resulting
146 Standard Life
in the unit linked investment elements being classified as non-participating investment contracts. The major unit linked pension contracts include Individual Personal Pension Plans (retail), Group Personal Pension Plans, Executive Pensions and Stakeholder (corporate) and Trustee Investment Plans (institutional).
The costs of contracts invested in unit linked funds are recovered by deduction of asset management charges from the unit linked funds which are transferred from the PBF to the HWPF. Under Stakeholder contracts, this asset management charge has a maximum limit. There are no other guarantees on these contracts with the exception that the unit prices of certain cash funds are guaranteed not to fall.
UK and Irish unit linked life contracts (fee business via RCF) This class of business comprises principally unit linked investment bonds (e.g. Capital Investment Bonds), classified as non-participating investment contracts and the unit linked investment element of Homeplan contracts, classified as non-participating insurance contracts. No significant guarantees, other than the guaranteed death benefit on Homeplan contracts, are provided under these contracts. The costs of contracts invested in unit linked funds are recovered by deduction of asset management charges from the unit linked funds which are transferred from the PBF to the HWPF.
UK and Irish annuity-in-payment contracts (spread/risk business in relation to longevity risk transferred to PBF otherwise no impact on shareholder profits in absence of burnthrough) This class of business consists of the same type of contracts described in (b)(i) and also includes the With Profit Pension Annuity (WPPA), under which changes to the level of annuity are based on a declared rate of return but reductions in the level of the annuity are limited. These contracts are classified as non-participating insurance contracts, except for the WPPA which is classified as a participating insurance contract.
SLAL has reinsured both the longevity and market risk arising on a portfolio of annuity-in-payment contracts held within the HWPF with Canada Life International Re (the reinsurer). In order to limit counterparty credit exposure, the reinsurer was required to deposit back an amount equal to the reinsurance premium of £6.3bn (referred to as ‘the deposit’). Interest is payable on the deposit at a floating rate. In respect of this arrangement SLAL holds a ring fenced pool of assets within the HWPF. See Note 42(c) on credit exposure and Note 6 – Expenses under arrangements with reinsurers for further details of the deposit back. A floating charge over the ring fenced pool of assets has been granted to the reinsurer.
The longevity risk on certain non-participating annuity-in-payment contracts held in the HWPF has been transferred to the PBF. The market risk on certain annuities has been transferred to the PBF.
For those annuities in payment which increase at a predefined rate the total liability at 31 December 2014 is £3,127m (2013: £2,977m) and this represents approximately 33% (2013: 32%) of the total liability for UK annuity in payments contracts held within the HWPF.
The total liability at 31 December 2014 for RPI linked annuities in payment (including any guaranteed minimum rate of escalation) is £1,972m (2013: £2,113m) and this represents approximately 21% (2013: 22%) of the total liability for UK annuity contracts held within the HWPF. There is a subset of annuities where the RPI linked annuity payment cannot fall or is guaranteed to increase at a minimum rate; the majority of such annuities are those whose payment cannot fall.
UK other non-participating contracts (spread/risk business via RCF) This class of business consists primarily of deferred annuities that provide guaranteed annuity payments from the retirement age associated with the relevant pension plan. The payments depend on the survival of a life or lives with or without a guarantee period and may reduce on a specified death or increase each year at a predefined rate or in line with the increase in UK RPI. These contracts are classified as non-participating insurance contracts. (b)(iii) Asia and Emerging Markets – Insurance and investment contracts Unit linked life contracts (fee business) The main contract issued by SLA is the Harvest 101 product. It is a regular premium savings product with a term ranging from five to 25 years. The customer has the option to invest in unit linked funds offered by SLA and mutual funds and deposit accounts offered by other providers. The mutual funds and deposit accounts are recognised as assets by the Group and are classified as unit linked business along with a corresponding liability. On death of the life insured, a benefit of 101% of the fund value is paid. If the death is accidental then an additional benefit of 10% of the initial account value is paid subject to a USD10,000 cap. These contracts are classified as insurance contracts where it is considered that the accidental death benefit transfers significant insurance risk. No other guarantees apply to this contract. (b)(iv) Canada – Insurance, investment and reinsurance contracts The Canadian business is included as discontinued operations following the announcement on 3 September 2014.
Annuity-in-payment contracts (spread/risk business) This class of business consists of single premium contracts that provide guaranteed annuity payments based on the survival of a life or lives or for a specified period. The majority of the portfolio are life contingent annuities and are classified as non-participating insurance contracts. However, there are some term certain annuities classified as investment contracts. The benefits may increase each year at a predefined rate or in line with increases in the Canadian Consumer Price Index (CPI). For contracts under which benefits increase in line with the CPI, benefits will not decrease in periods of deflation.
For those annuities which increase at a predefined rate, the total liability at 31 December 2014 is £595m (2013: £652m) and these represent approximately 15% (2013: 16%) of the total liability for Canadian annuity-in-payment contracts. The liability for annuities
Standard Life 147
3. Financial information – Notes to the Group financial statements continued
3. Business written in the Group’s insurance entities continued (b) Insurance, investment and reinsurance contract terms including guarantees and options
continued (b)(iv) Canada – Insurance, investment and reinsurance contracts continued linked to CPI is approximately £346m (2013: £394m). This represents approximately 9% (2013: 9%) of the total liability for Canadian annuity-in-payment contracts.
For CPI-linked annuities, a 1% increase in the CPI would increase liabilities by £29m (2013: £65m). However, inflation risk on these annuities is mitigated by investments in assets linked to inflation.
Universal Life contracts (fee business and spread/risk business) The main Universal Life contract, Perspecta, is a non-participating whole life assurance contract. Perspecta was closed to new business in 2012. Premiums may be invested in term investment funds (TIFs), segregated funds or mutual funds. Premiums invested in TIFs are placed on deposit at rates of interest guaranteed for periods from one day to 20 years. The rate offered is determined with reference to the financial conditions at the time of premium payment. The contract provides life cover and, in addition, on death the value of the segregated funds is guaranteed never to be less than 75% of premiums deposited into those funds, adjusted for expense charges and any withdrawals. At 31 December 2014, the liability for these policies is £1,668m (2013: £1,227m).
Perspecta contracts issued up to November 2003 provided the following interest rate guarantees: • 0% for the Daily Interest Fund.
For each TIF, the greatest of 90% of the Government of Canada Bond rate for the same term, less 1.75%, and: • 0% for the 1-year TIF • 1% for the 3-year TIF • 2% for the 5-year TIF • 3% for the 10, 15 and 20-year TIF.
Furthermore, it was guaranteed that at least one TIF at a minimum guaranteed interest rate of 3% would be offered as long as the policy is in-force.
Perspecta contracts issued after November 2003 provide lower interest rate guarantees for terms of at least three years. There is no guarantee that a term with a 3% minimum guaranteed rate will be offered and the TIF investment option can be withdrawn.
In addition, on all Perspecta policies the value of the investment account may increase on guaranteed terms at specified policy anniversaries. The level of increase depends upon various conditions, including when the contract was effected.
Perspecta policyholders have the option to switch into TIFs some or all of their investments in the other investment options and can increase their premiums up to statutory limits. The guarantees that then apply are those set when the contract was effected.
A reduction of 1% in the yield curve would increase the value of the guarantees by £29m (2013: £19m). At 31 December 2014, the liability for all the TIFs (i.e. pre and post November 2003) is £55m (2013: £74m).
SLCC has entered into contracts to reinsure mortality risk arising under these Universal Life contracts. Under these reinsurance contracts, the reinsurers receive regular reinsurance premiums throughout the period until death claims arise on the underlying contracts based on payment schedules established at inception of the reinsurance contract. SLCC receives payments from the reinsurers on the death of the Universal Life policyholders to cover the death benefit due. Registered and non-registered savings plans (fee business and spread/risk business) This category comprises individual and group non-participating savings contracts. These contracts permit investment into term funds or segregated funds.
Premiums invested in term funds are placed on deposit at rates of interest guaranteed for a selected term. The rate offered depends on financial conditions at the time of deposit. Proceeds at the end of a guarantee period may be reinvested at the then current rates. The components of contracts invested in term funds are classified as non-participating investment contracts, for all contracts sold prior to May 2014. Individual Ideal Savings term funds issued after 1 May 2014 have an accidental death benefit in the contract, and are therefore classified as non-participating insurance contracts.
Where premiums on individual contracts are invested in segregated funds a death benefit guarantee applies being the greater of the segregated fund value and 100% of the net deposits. In addition provided that the monies have been invested for a minimum of 10 years, the maturity benefit is the greater of the segregated fund value at the maturity date and 75% or 100% of premiums invested, depending on the guarantee option selected, less any cash values previously paid out. Otherwise the maturity benefit is the fund value. The cost of all these guarantees including those in respect of registered retirement income plans (see below), net of supporting fees, has been calculated in accordance with local regulations and results in a increase in liabilities of £32m (2013: decrease £6m) being required. The components of individual contracts invested in segregated funds are classified as non-participating insurance contracts.
Where premiums on group contracts are invested in segregated funds, no guarantees on death or maturity are given. The components of group contracts invested in segregated funds are classified as non-participating investment contracts.
148 Standard Life
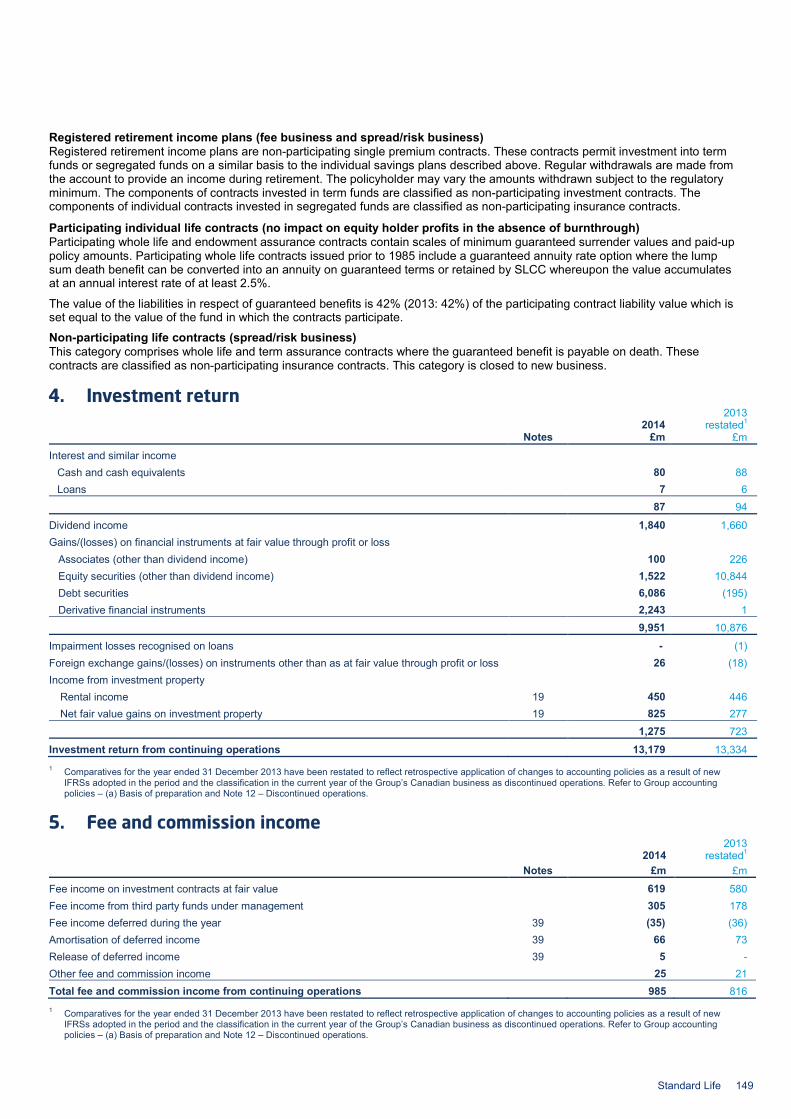
Registered retirement income plans (fee business and spread/risk business) Registered retirement income plans are non-participating single premium contracts. These contracts permit investment into term funds or segregated funds on a similar basis to the individual savings plans described above. Regular withdrawals are made from the account to provide an income during retirement. The policyholder may vary the amounts withdrawn subject to the regulatory minimum. The components of contracts invested in term funds are classified as non-participating investment contracts. The components of individual contracts invested in segregated funds are classified as non-participating insurance contracts.
Participating individual life contracts (no impact on equity holder profits in the absence of burnthrough) Participating whole life and endowment assurance contracts contain scales of minimum guaranteed surrender values and paid-up policy amounts. Participating whole life contracts issued prior to 1985 include a guaranteed annuity rate option where the lump sum death benefit can be converted into an annuity on guaranteed terms or retained by SLCC whereupon the value accumulates at an annual interest rate of at least 2.5%.
The value of the liabilities in respect of guaranteed benefits is 42% (2013: 42%) of the participating contract liability value which is set equal to the value of the fund in which the contracts participate.
Non-participating life contracts (spread/risk business) This category comprises whole life and term assurance contracts where the guaranteed benefit is payable on death. These contracts are classified as non-participating insurance contracts. This category is closed to new business.
4. Investment return 2014
2013 restated1
Notes £m £m
Interest and similar income Cash and cash equivalents 80 88 Loans 7 6
87 94
Dividend income 1,840 1,660 Gains/(losses) on financial instruments at fair value through profit or loss
Associates (other than dividend income) 100 226 Equity securities (other than dividend income) 1,522 10,844 Debt securities 6,086 (195) Derivative financial instruments 2,243 1 9,951 10,876
Impairment losses recognised on loans - (1) Foreign exchange gains/(losses) on instruments other than as at fair value through profit or loss 26 (18) Income from investment property
Rental income 19 450 446 Net fair value gains on investment property 19 825 277
1,275 723
Investment return from continuing operations 13,179 13,334 1 Comparatives for the year ended 31 December 2013 have been restated to reflect retrospective application of changes to accounting policies as a result of new
IFRSs adopted in the period and the classification in the current year of the Group’s Canadian business as discontinued operations. Refer to Group accounting policies – (a) Basis of preparation and Note 12 – Discontinued operations.
5. Fee and commission income
2014 2013
restated1 Notes £m £m
Fee income on investment contracts at fair value 619 580 Fee income from third party funds under management 305 178 Fee income deferred during the year 39 (35) (36) Amortisation of deferred income 39 66 73 Release of deferred income 39 5 - Other fee and commission income 25 21 Total fee and commission income from continuing operations 985 816 1 Comparatives for the year ended 31 December 2013 have been restated to reflect retrospective application of changes to accounting policies as a result of new
IFRSs adopted in the period and the classification in the current year of the Group’s Canadian business as discontinued operations. Refer to Group accounting policies – (a) Basis of preparation and Note 12 – Discontinued operations.
Standard Life 149
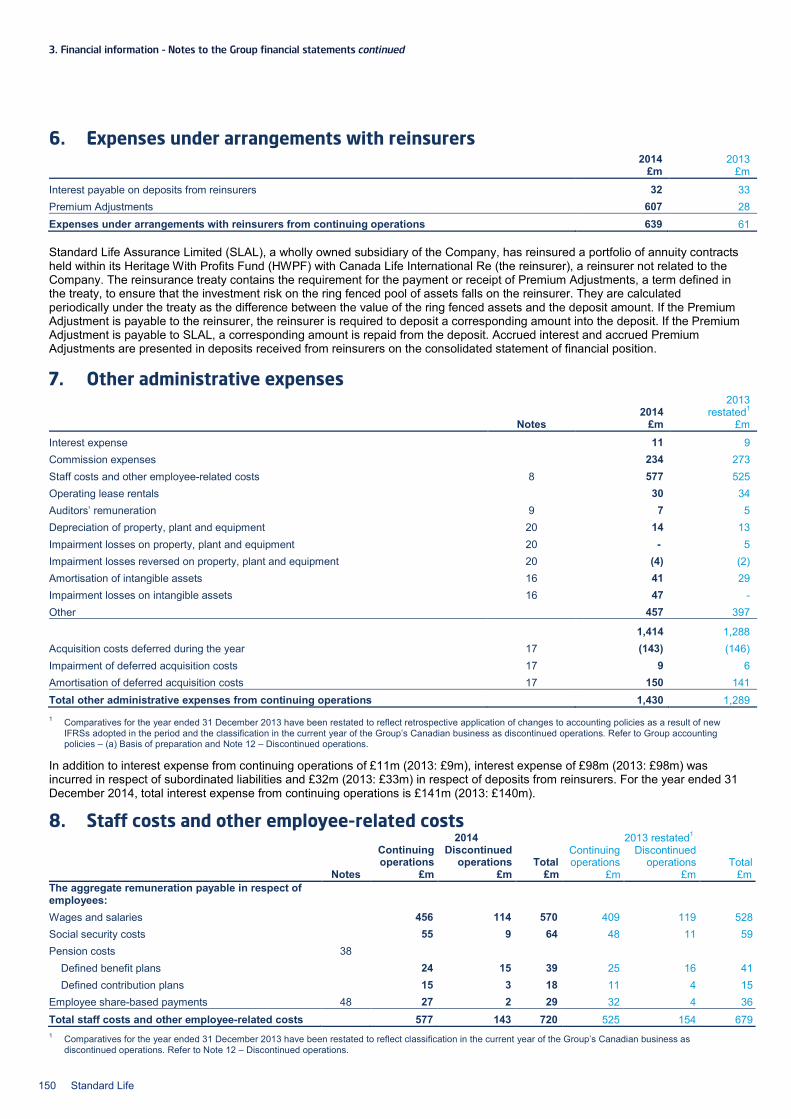
3. Financial information – Notes to the Group financial statements continued
6. Expenses under arrangements with reinsurers 2014 2013 £m £m
Interest payable on deposits from reinsurers 32 33 Premium Adjustments 607 28 Expenses under arrangements with reinsurers from continuing operations 639 61
Standard Life Assurance Limited (SLAL), a wholly owned subsidiary of the Company, has reinsured a portfolio of annuity contracts held within its Heritage With Profits Fund (HWPF) with Canada Life International Re (the reinsurer), a reinsurer not related to the Company. The reinsurance treaty contains the requirement for the payment or receipt of Premium Adjustments, a term defined in the treaty, to ensure that the investment risk on the ring fenced pool of assets falls on the reinsurer. They are calculated periodically under the treaty as the difference between the value of the ring fenced assets and the deposit amount. If the Premium Adjustment is payable to the reinsurer, the reinsurer is required to deposit a corresponding amount into the deposit. If the Premium Adjustment is payable to SLAL, a corresponding amount is repaid from the deposit. Accrued interest and accrued Premium Adjustments are presented in deposits received from reinsurers on the consolidated statement of financial position.
7. Other administrative expenses
2014 2013
restated1 Notes £m £m
Interest expense 11 9 Commission expenses 234 273 Staff costs and other employee-related costs 8 577 525 Operating lease rentals 30 34 Auditors’ remuneration 9 7 5 Depreciation of property, plant and equipment 20 14 13 Impairment losses on property, plant and equipment 20 - 5 Impairment losses reversed on property, plant and equipment 20 (4) (2) Amortisation of intangible assets 16 41 29 Impairment losses on intangible assets 16 47 - Other 457 397
1,414 1,288 Acquisition costs deferred during the year 17 (143) (146) Impairment of deferred acquisition costs 17 9 6 Amortisation of deferred acquisition costs 17 150 141 Total other administrative expenses from continuing operations 1,430 1,289 1 Comparatives for the year ended 31 December 2013 have been restated to reflect retrospective application of changes to accounting policies as a result of new
IFRSs adopted in the period and the classification in the current year of the Group’s Canadian business as discontinued operations. Refer to Group accounting policies – (a) Basis of preparation and Note 12 – Discontinued operations.
In addition to interest expense from continuing operations of £11m (2013: £9m), interest expense of £98m (2013: £98m) was incurred in respect of subordinated liabilities and £32m (2013: £33m) in respect of deposits from reinsurers. For the year ended 31 December 2014, total interest expense from continuing operations is £141m (2013: £140m).
8. Staff costs and other employee-related costs 2014 2013 restated1
Continuing operations
Discontinued operations Total
Continuing operations
Discontinued operations Total
Notes £m £m £m £m £m £m The aggregate remuneration payable in respect of employees:
Wages and salaries 456 114 570 409 119 528 Social security costs 55 9 64 48 11 59 Pension costs 38
Defined benefit plans 24 15 39 25 16 41 Defined contribution plans 15 3 18 11 4 15
Employee share-based payments 48 27 2 29 32 4 36 Total staff costs and other employee-related costs 577 143 720 525 154 679 1 Comparatives for the year ended 31 December 2013 have been restated to reflect classification in the current year of the Group’s Canadian business as
discontinued operations. Refer to Note 12 – Discontinued operations.
150 Standard Life
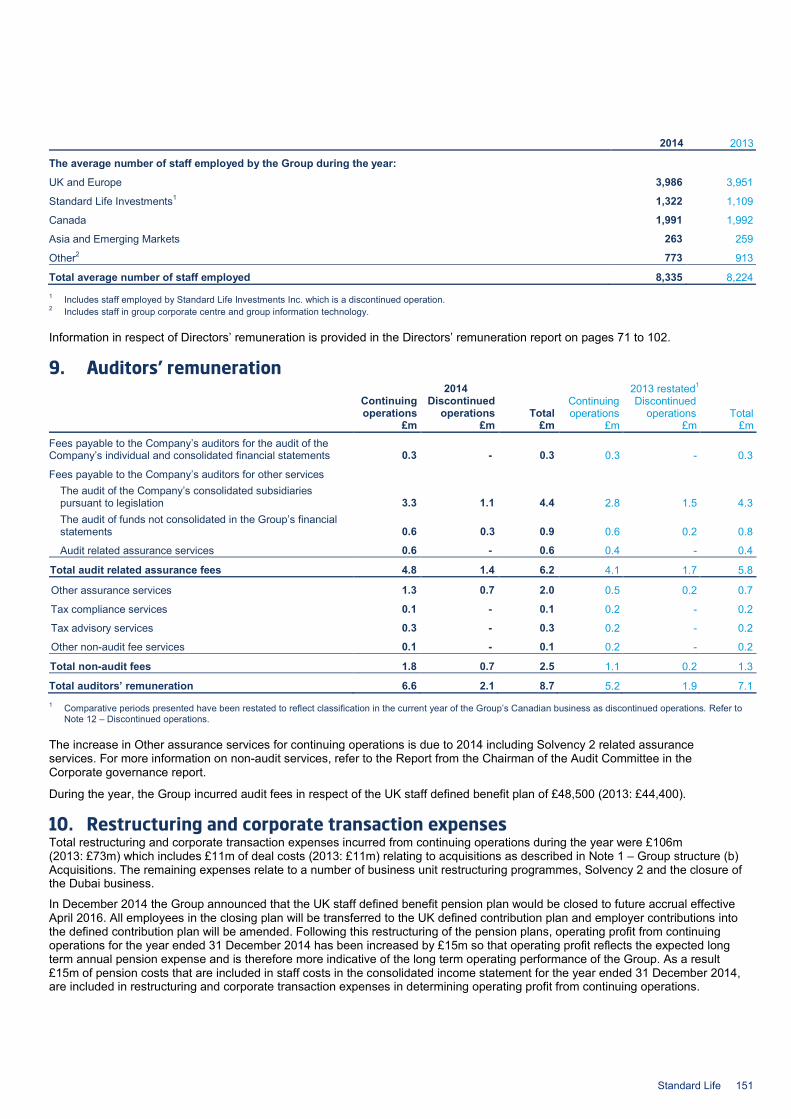
2014 2013
The average number of staff employed by the Group during the year:
UK and Europe 3,986 3,951
Standard Life Investments1 1,322 1,109
Canada 1,991 1,992
Asia and Emerging Markets 263 259
Other2 773 913
Total average number of staff employed 8,335 8,224 1 Includes staff employed by Standard Life Investments Inc. which is a discontinued operation. 2 Includes staff in group corporate centre and group information technology.
Information in respect of Directors’ remuneration is provided in the Directors’ remuneration report on pages 71 to 102.
9. Auditors’ remuneration 2014 2013 restated1
Continuing operations
Discontinued operations Total
Continuing operations
Discontinued operations Total
£m £m £m £m £m £m
Fees payable to the Company’s auditors for the audit of the Company’s individual and consolidated financial statements 0.3 - 0.3 0.3 - 0.3
Fees payable to the Company’s auditors for other services The audit of the Company’s consolidated subsidiaries pursuant to legislation 3.3 1.1 4.4 2.8 1.5 4.3 The audit of funds not consolidated in the Group’s financial statements 0.6 0.3 0.9 0.6 0.2 0.8
Audit related assurance services 0.6 - 0.6 0.4 - 0.4
Total audit related assurance fees 4.8 1.4 6.2 4.1 1.7 5.8
Other assurance services 1.3 0.7 2.0 0.5 0.2 0.7
Tax compliance services 0.1 - 0.1 0.2 - 0.2
Tax advisory services 0.3 - 0.3 0.2 - 0.2
Other non-audit fee services 0.1 - 0.1 0.2 - 0.2
Total non-audit fees 1.8 0.7 2.5 1.1 0.2 1.3
Total auditors’ remuneration 6.6 2.1 8.7 5.2 1.9 7.1 1 Comparative periods presented have been restated to reflect classification in the current year of the Group’s Canadian business as discontinued operations. Refer to
Note 12 – Discontinued operations.
The increase in Other assurance services for continuing operations is due to 2014 including Solvency 2 related assurance services. For more information on non-audit services, refer to the Report from the Chairman of the Audit Committee in the Corporate governance report.
During the year, the Group incurred audit fees in respect of the UK staff defined benefit plan of £48,500 (2013: £44,400).
10. Restructuring and corporate transaction expenses Total restructuring and corporate transaction expenses incurred from continuing operations during the year were £106m (2013: £73m) which includes £11m of deal costs (2013: £11m) relating to acquisitions as described in Note 1 – Group structure (b) Acquisitions. The remaining expenses relate to a number of business unit restructuring programmes, Solvency 2 and the closure of the Dubai business.
In December 2014 the Group announced that the UK staff defined benefit pension plan would be closed to future accrual effective April 2016. All employees in the closing plan will be transferred to the UK defined contribution plan and employer contributions into the defined contribution plan will be amended. Following this restructuring of the pension plans, operating profit from continuing operations for the year ended 31 December 2014 has been increased by £15m so that operating profit reflects the expected long term annual pension expense and is therefore more indicative of the long term operating performance of the Group. As a result £15m of pension costs that are included in staff costs in the consolidated income statement for the year ended 31 December 2014, are included in restructuring and corporate transaction expenses in determining operating profit from continuing operations.
Standard Life 151
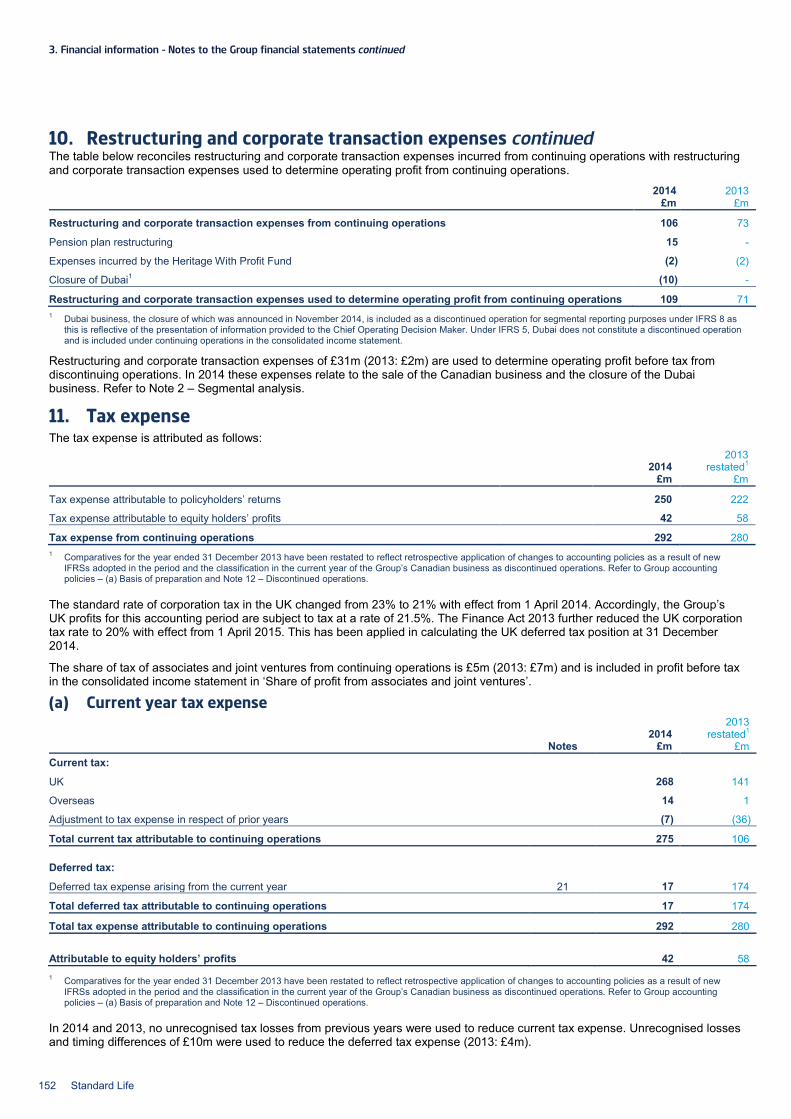
3. Financial information – Notes to the Group financial statements continued
10. Restructuring and corporate transaction expenses continued The table below reconciles restructuring and corporate transaction expenses incurred from continuing operations with restructuring and corporate transaction expenses used to determine operating profit from continuing operations.
2014 2013 £m £m
Restructuring and corporate transaction expenses from continuing operations 106 73
Pension plan restructuring 15 -
Expenses incurred by the Heritage With Profit Fund (2) (2)
Closure of Dubai1 (10) -
Restructuring and corporate transaction expenses used to determine operating profit from continuing operations 109 71 1 Dubai business, the closure of which was announced in November 2014, is included as a discontinued operation for segmental reporting purposes under IFRS 8 as
this is reflective of the presentation of information provided to the Chief Operating Decision Maker. Under IFRS 5, Dubai does not constitute a discontinued operation and is included under continuing operations in the consolidated income statement.
Restructuring and corporate transaction expenses of £31m (2013: £2m) are used to determine operating profit before tax from discontinuing operations. In 2014 these expenses relate to the sale of the Canadian business and the closure of the Dubai business. Refer to Note 2 – Segmental analysis.
11. Tax expense The tax expense is attributed as follows:
2014 2013
restated1 £m £m
Tax expense attributable to policyholders’ returns 250 222
Tax expense attributable to equity holders’ profits 42 58
Tax expense from continuing operations 292 280 1 Comparatives for the year ended 31 December 2013 have been restated to reflect retrospective application of changes to accounting policies as a result of new
IFRSs adopted in the period and the classification in the current year of the Group’s Canadian business as discontinued operations. Refer to Group accounting policies – (a) Basis of preparation and Note 12 – Discontinued operations.
The standard rate of corporation tax in the UK changed from 23% to 21% with effect from 1 April 2014. Accordingly, the Group’s UK profits for this accounting period are subject to tax at a rate of 21.5%. The Finance Act 2013 further reduced the UK corporation tax rate to 20% with effect from 1 April 2015. This has been applied in calculating the UK deferred tax position at 31 December 2014.
The share of tax of associates and joint ventures from continuing operations is £5m (2013: £7m) and is included in profit before tax in the consolidated income statement in ‘Share of profit from associates and joint ventures’.
(a) Current year tax expense
2014 2013
restated1 Notes £m £m Current tax:
UK 268 141
Overseas 14 1
Adjustment to tax expense in respect of prior years (7) (36)
Total current tax attributable to continuing operations 275 106 Deferred tax:
Deferred tax expense arising from the current year 21 17 174
Total deferred tax attributable to continuing operations 17 174
Total tax expense attributable to continuing operations 292 280
Attributable to equity holders’ profits 42 58 1 Comparatives for the year ended 31 December 2013 have been restated to reflect retrospective application of changes to accounting policies as a result of new
IFRSs adopted in the period and the classification in the current year of the Group’s Canadian business as discontinued operations. Refer to Group accounting policies – (a) Basis of preparation and Note 12 – Discontinued operations.
In 2014 and 2013, no unrecognised tax losses from previous years were used to reduce current tax expense. Unrecognised losses and timing differences of £10m were used to reduce the deferred tax expense (2013: £4m).
152 Standard Life
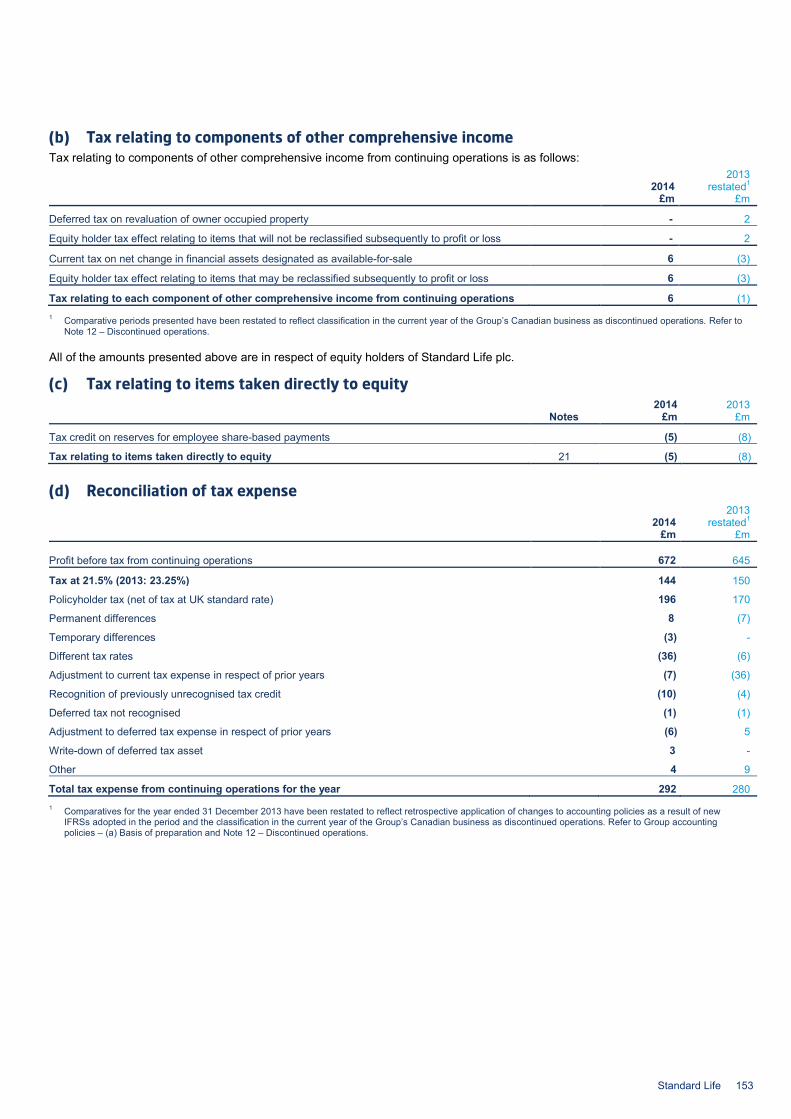
(b) Tax relating to components of other comprehensive income Tax relating to components of other comprehensive income from continuing operations is as follows:
2014
2013 restated1
£m £m
Deferred tax on revaluation of owner occupied property - 2
Equity holder tax effect relating to items that will not be reclassified subsequently to profit or loss - 2
Current tax on net change in financial assets designated as available-for-sale 6 (3)
Equity holder tax effect relating to items that may be reclassified subsequently to profit or loss 6 (3)
Tax relating to each component of other comprehensive income from continuing operations 6 (1) 1 Comparative periods presented have been restated to reflect classification in the current year of the Group’s Canadian business as discontinued operations. Refer to
Note 12 – Discontinued operations.
All of the amounts presented above are in respect of equity holders of Standard Life plc.
(c) Tax relating to items taken directly to equity 2014 2013
Notes £m £m
Tax credit on reserves for employee share-based payments (5) (8)
Tax relating to items taken directly to equity 21 (5) (8) (d) Reconciliation of tax expense
2014 2013
restated1 £m £m
Profit before tax from continuing operations 672
645
Tax at 21.5% (2013: 23.25%) 144 150
Policyholder tax (net of tax at UK standard rate) 196 170
Permanent differences 8 (7)
Temporary differences (3) -
Different tax rates (36) (6)
Adjustment to current tax expense in respect of prior years (7) (36)
Recognition of previously unrecognised tax credit (10) (4)
Deferred tax not recognised (1) (1)
Adjustment to deferred tax expense in respect of prior years (6) 5
Write-down of deferred tax asset 3 -
Other 4 9
Total tax expense from continuing operations for the year 292 280 1 Comparatives for the year ended 31 December 2013 have been restated to reflect retrospective application of changes to accounting policies as a result of new
IFRSs adopted in the period and the classification in the current year of the Group’s Canadian business as discontinued operations. Refer to Group accounting policies – (a) Basis of preparation and Note 12 – Discontinued operations.
Standard Life 153
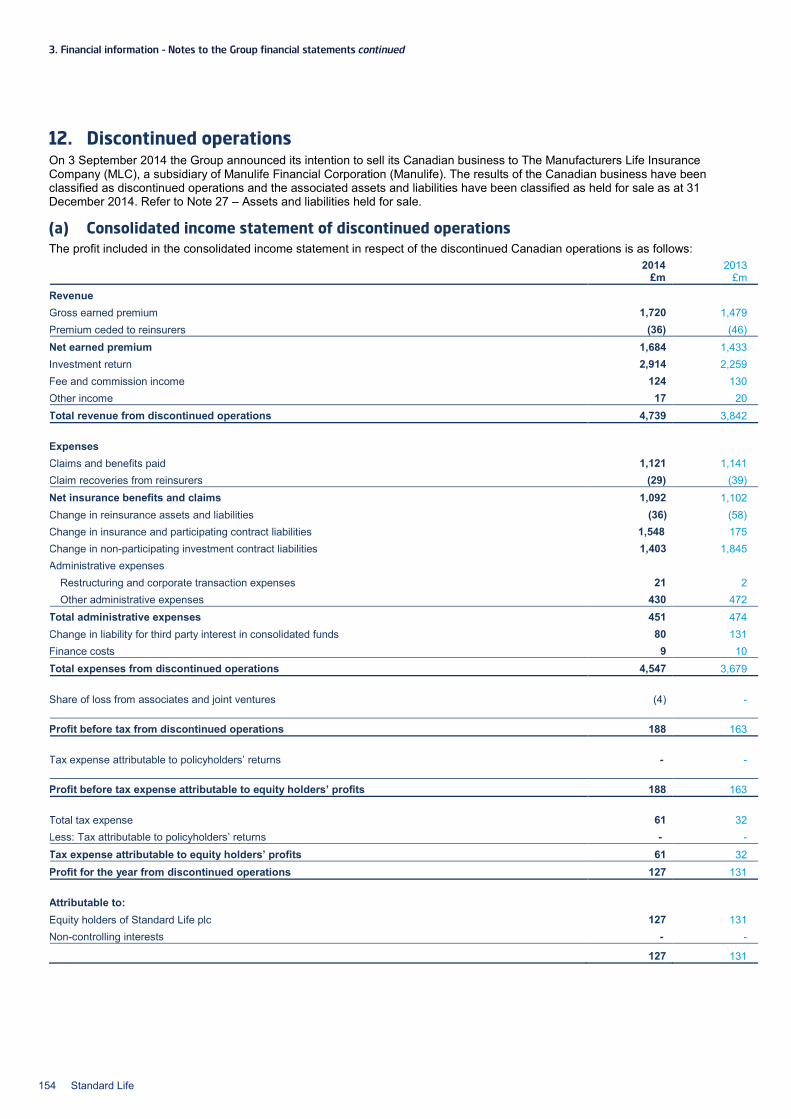
3. Financial information – Notes to the Group financial statements continued
12. Discontinued operations On 3 September 2014 the Group announced its intention to sell its Canadian business to The Manufacturers Life Insurance Company (MLC), a subsidiary of Manulife Financial Corporation (Manulife). The results of the Canadian business have been classified as discontinued operations and the associated assets and liabilities have been classified as held for sale as at 31 December 2014. Refer to Note 27 – Assets and liabilities held for sale.
(a) Consolidated income statement of discontinued operations The profit included in the consolidated income statement in respect of the discontinued Canadian operations is as follows:
2014 2013 £m £m
Revenue Gross earned premium 1,720 1,479 Premium ceded to reinsurers (36) (46) Net earned premium 1,684 1,433 Investment return 2,914 2,259 Fee and commission income 124 130 Other income 17 20 Total revenue from discontinued operations 4,739 3,842 Expenses Claims and benefits paid 1,121 1,141 Claim recoveries from reinsurers (29) (39) Net insurance benefits and claims 1,092 1,102 Change in reinsurance assets and liabilities (36) (58) Change in insurance and participating contract liabilities 1,548 175 Change in non-participating investment contract liabilities 1,403 1,845 Administrative expenses
Restructuring and corporate transaction expenses 21 2 Other administrative expenses 430 472
Total administrative expenses 451 474 Change in liability for third party interest in consolidated funds 80 131 Finance costs 9 10 Total expenses from discontinued operations 4,547 3,679 Share of loss from associates and joint ventures (4) - Profit before tax from discontinued operations 188 163 Tax expense attributable to policyholders’ returns - - Profit before tax expense attributable to equity holders’ profits 188 163 Total tax expense 61 32 Less: Tax attributable to policyholders’ returns - - Tax expense attributable to equity holders’ profits 61 32 Profit for the year from discontinued operations 127 131 Attributable to: Equity holders of Standard Life plc 127 131 Non-controlling interests - -
127 131
154 Standard Life
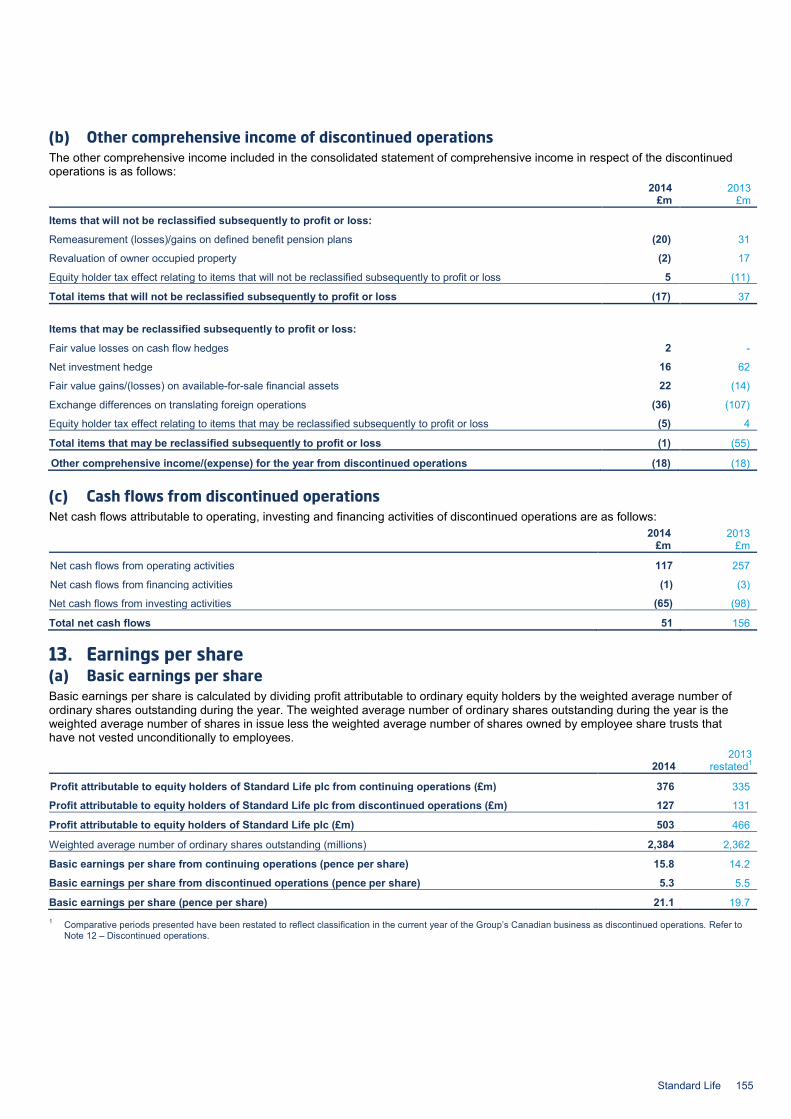
(b) Other comprehensive income of discontinued operations The other comprehensive income included in the consolidated statement of comprehensive income in respect of the discontinued operations is as follows:
2014 2013 £m £m
Items that will not be reclassified subsequently to profit or loss:
Remeasurement (losses)/gains on defined benefit pension plans (20) 31
Revaluation of owner occupied property (2) 17
Equity holder tax effect relating to items that will not be reclassified subsequently to profit or loss 5 (11)
Total items that will not be reclassified subsequently to profit or loss (17) 37
Items that may be reclassified subsequently to profit or loss:
Fair value losses on cash flow hedges 2 -
Net investment hedge 16 62
Fair value gains/(losses) on available-for-sale financial assets 22 (14)
Exchange differences on translating foreign operations (36) (107)
Equity holder tax effect relating to items that may be reclassified subsequently to profit or loss (5) 4
Total items that may be reclassified subsequently to profit or loss (1) (55)
Other comprehensive income/(expense) for the year from discontinued operations (18) (18)
(c) Cash flows from discontinued operations Net cash flows attributable to operating, investing and financing activities of discontinued operations are as follows:
2014 2013 £m £m
Net cash flows from operating activities 117 257
Net cash flows from financing activities (1) (3)
Net cash flows from investing activities (65) (98)
Total net cash flows 51 156
13. Earnings per share (a) Basic earnings per share Basic earnings per share is calculated by dividing profit attributable to ordinary equity holders by the weighted average number of ordinary shares outstanding during the year. The weighted average number of ordinary shares outstanding during the year is the weighted average number of shares in issue less the weighted average number of shares owned by employee share trusts that have not vested unconditionally to employees.
2014 2013
restated1
Profit attributable to equity holders of Standard Life plc from continuing operations (£m) 376 335
Profit attributable to equity holders of Standard Life plc from discontinued operations (£m) 127 131
Profit attributable to equity holders of Standard Life plc (£m) 503 466
Weighted average number of ordinary shares outstanding (millions) 2,384 2,362
Basic earnings per share from continuing operations (pence per share) 15.8 14.2
Basic earnings per share from discontinued operations (pence per share) 5.3 5.5
Basic earnings per share (pence per share) 21.1 19.7 1 Comparative periods presented have been restated to reflect classification in the current year of the Group’s Canadian business as discontinued operations. Refer to
Note 12 – Discontinued operations.
Standard Life 155
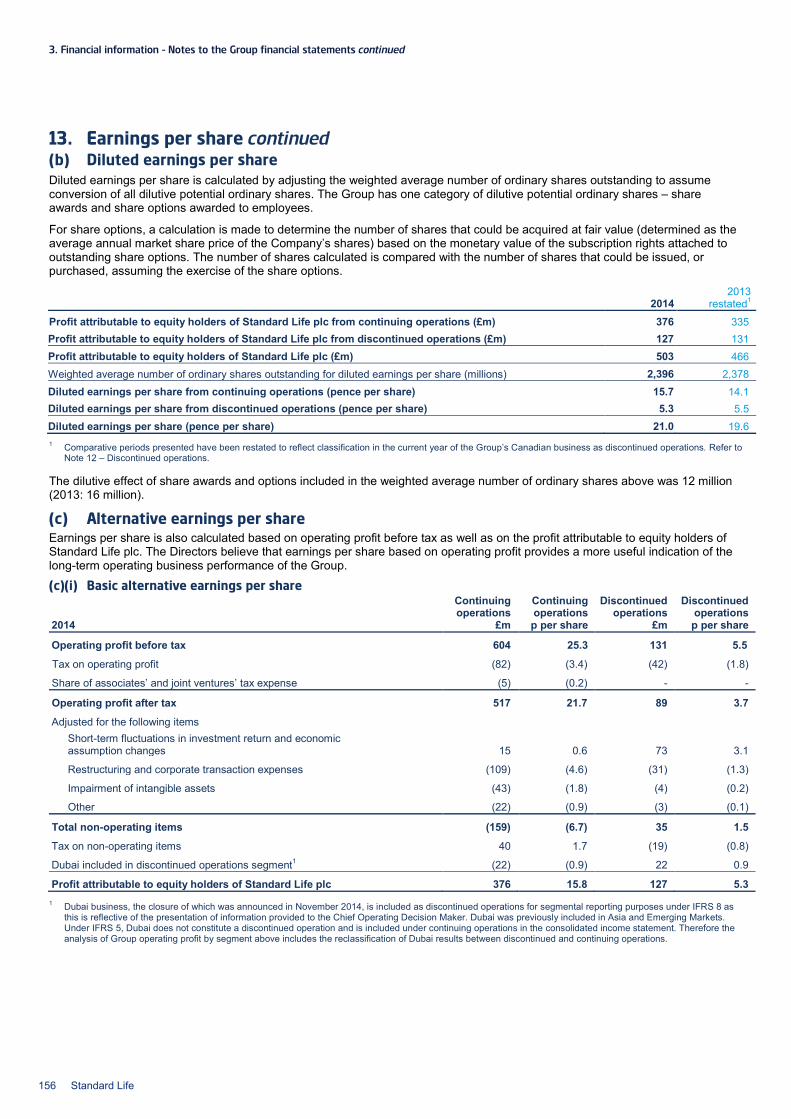
3. Financial information – Notes to the Group financial statements continued
13. Earnings per share continued (b) Diluted earnings per share Diluted earnings per share is calculated by adjusting the weighted average number of ordinary shares outstanding to assume conversion of all dilutive potential ordinary shares. The Group has one category of dilutive potential ordinary shares – share awards and share options awarded to employees.
For share options, a calculation is made to determine the number of shares that could be acquired at fair value (determined as the average annual market share price of the Company’s shares) based on the monetary value of the subscription rights attached to outstanding share options. The number of shares calculated is compared with the number of shares that could be issued, or purchased, assuming the exercise of the share options.
2014 2013
restated1
Profit attributable to equity holders of Standard Life plc from continuing operations (£m) 376 335 Profit attributable to equity holders of Standard Life plc from discontinued operations (£m) 127 131 Profit attributable to equity holders of Standard Life plc (£m) 503 466 Weighted average number of ordinary shares outstanding for diluted earnings per share (millions) 2,396 2,378 Diluted earnings per share from continuing operations (pence per share) 15.7 14.1 Diluted earnings per share from discontinued operations (pence per share) 5.3 5.5 Diluted earnings per share (pence per share) 21.0 19.6 1 Comparative periods presented have been restated to reflect classification in the current year of the Group’s Canadian business as discontinued operations. Refer to
Note 12 – Discontinued operations.
The dilutive effect of share awards and options included in the weighted average number of ordinary shares above was 12 million (2013: 16 million).
(c) Alternative earnings per share Earnings per share is also calculated based on operating profit before tax as well as on the profit attributable to equity holders of Standard Life plc. The Directors believe that earnings per share based on operating profit provides a more useful indication of the long-term operating business performance of the Group.
(c)(i) Basic alternative earnings per share
Continuing operations
Continuing operations
Discontinued operations
Discontinued operations
2014 £m p per share £m p per share
Operating profit before tax 604 25.3 131 5.5
Tax on operating profit (82) (3.4) (42) (1.8)
Share of associates’ and joint ventures’ tax expense (5) (0.2) - -
Operating profit after tax 517 21.7 89 3.7
Adjusted for the following items Short-term fluctuations in investment return and economic assumption changes 15 0.6 73 3.1
Restructuring and corporate transaction expenses (109) (4.6) (31) (1.3)
Impairment of intangible assets (43) (1.8) (4) (0.2)
Other (22) (0.9) (3) (0.1)
Total non-operating items (159) (6.7) 35 1.5
Tax on non-operating items 40 1.7 (19) (0.8)
Dubai included in discontinued operations segment1 (22) (0.9) 22 0.9
Profit attributable to equity holders of Standard Life plc 376 15.8 127 5.3 1 Dubai business, the closure of which was announced in November 2014, is included as discontinued operations for segmental reporting purposes under IFRS 8 as
this is reflective of the presentation of information provided to the Chief Operating Decision Maker. Dubai was previously included in Asia and Emerging Markets. Under IFRS 5, Dubai does not constitute a discontinued operation and is included under continuing operations in the consolidated income statement. Therefore the analysis of Group operating profit by segment above includes the reclassification of Dubai results between discontinued and continuing operations.
156 Standard Life
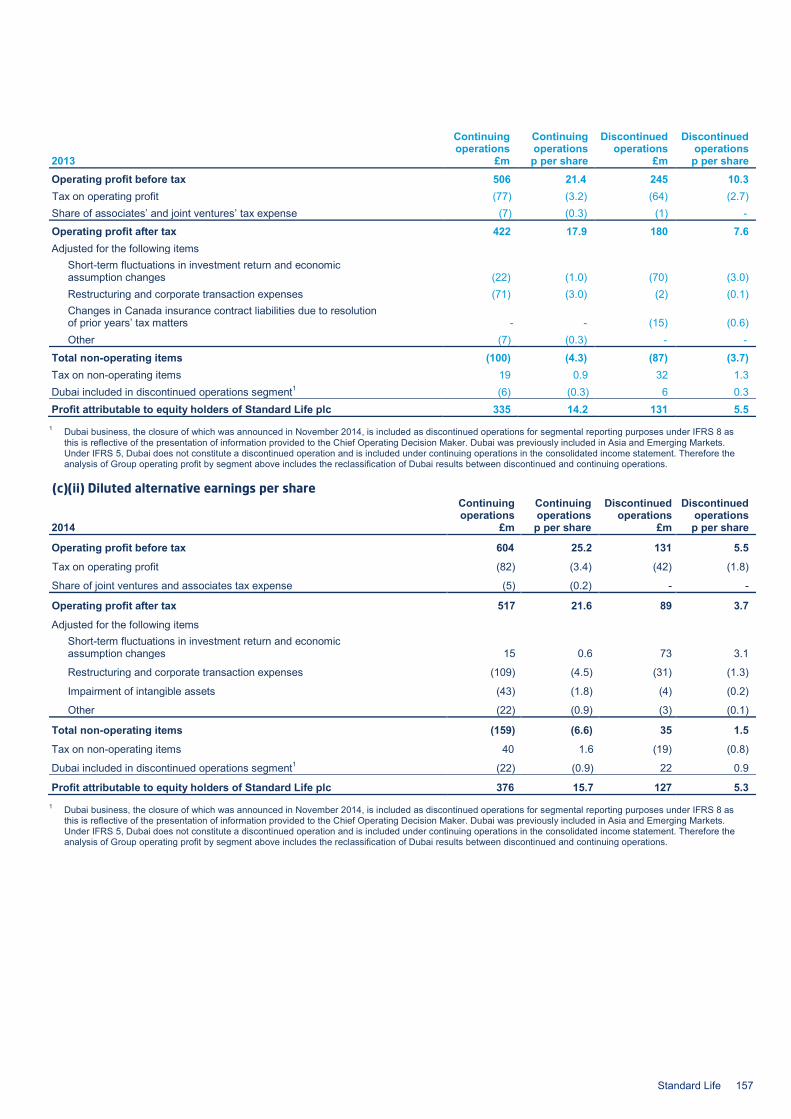
Continuing operations
Continuing operations
Discontinued operations
Discontinued operations
2013 £m p per share £m p per share Operating profit before tax 506 21.4 245 10.3 Tax on operating profit (77) (3.2) (64) (2.7) Share of associates’ and joint ventures’ tax expense (7) (0.3) (1) -
Operating profit after tax 422 17.9 180 7.6 Adjusted for the following items
Short-term fluctuations in investment return and economic assumption changes (22) (1.0) (70) (3.0) Restructuring and corporate transaction expenses (71) (3.0) (2) (0.1) Changes in Canada insurance contract liabilities due to resolution of prior years’ tax matters - - (15) (0.6) Other (7) (0.3) - -
Total non-operating items (100) (4.3) (87) (3.7) Tax on non-operating items 19 0.9 32 1.3 Dubai included in discontinued operations segment1 (6) (0.3) 6 0.3 Profit attributable to equity holders of Standard Life plc 335 14.2 131 5.5
1 Dubai business, the closure of which was announced in November 2014, is included as discontinued operations for segmental reporting purposes under IFRS 8 as this is reflective of the presentation of information provided to the Chief Operating Decision Maker. Dubai was previously included in Asia and Emerging Markets. Under IFRS 5, Dubai does not constitute a discontinued operation and is included under continuing operations in the consolidated income statement. Therefore the analysis of Group operating profit by segment above includes the reclassification of Dubai results between discontinued and continuing operations.
(c)(ii) Diluted alternative earnings per share
Continuing operations
Continuing operations
Discontinued operations
Discontinued operations
2014 £m p per share £m p per share
Operating profit before tax 604 25.2 131 5.5
Tax on operating profit (82) (3.4) (42) (1.8)
Share of joint ventures and associates tax expense (5) (0.2) - -
Operating profit after tax 517 21.6 89 3.7
Adjusted for the following items Short-term fluctuations in investment return and economic assumption changes 15 0.6 73 3.1
Restructuring and corporate transaction expenses (109) (4.5) (31) (1.3)
Impairment of intangible assets (43) (1.8) (4) (0.2)
Other (22) (0.9) (3) (0.1)
Total non-operating items (159) (6.6) 35 1.5
Tax on non-operating items 40 1.6 (19) (0.8)
Dubai included in discontinued operations segment1 (22) (0.9) 22 0.9
Profit attributable to equity holders of Standard Life plc 376 15.7 127 5.3 1 Dubai business, the closure of which was announced in November 2014, is included as discontinued operations for segmental reporting purposes under IFRS 8 as
this is reflective of the presentation of information provided to the Chief Operating Decision Maker. Dubai was previously included in Asia and Emerging Markets. Under IFRS 5, Dubai does not constitute a discontinued operation and is included under continuing operations in the consolidated income statement. Therefore the analysis of Group operating profit by segment above includes the reclassification of Dubai results between discontinued and continuing operations.
Standard Life 157
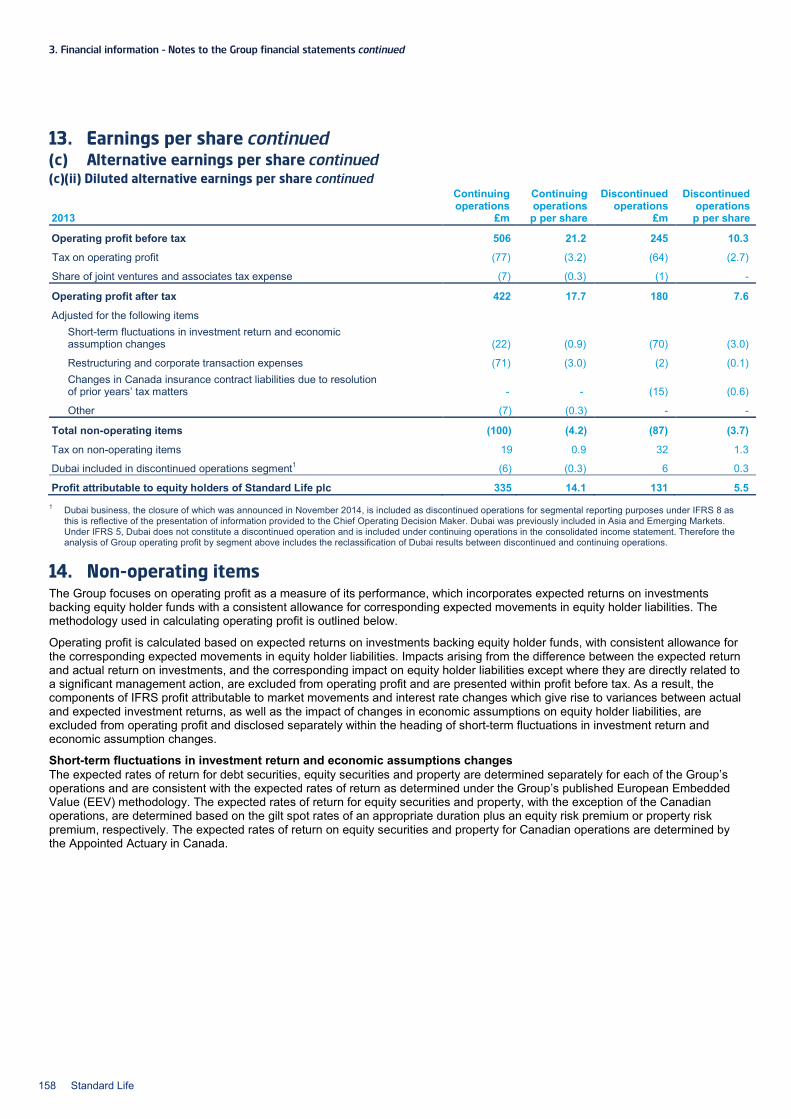
3. Financial information – Notes to the Group financial statements continued
13. Earnings per share continued (c) Alternative earnings per share continued (c)(ii) Diluted alternative earnings per share continued
Continuing operations
Continuing operations
Discontinued operations
Discontinued operations
2013 £m p per share £m p per share
Operating profit before tax 506 21.2 245 10.3
Tax on operating profit (77) (3.2) (64) (2.7)
Share of joint ventures and associates tax expense (7) (0.3) (1) -
Operating profit after tax 422 17.7 180 7.6
Adjusted for the following items Short-term fluctuations in investment return and economic assumption changes (22) (0.9) (70) (3.0)
Restructuring and corporate transaction expenses (71) (3.0) (2) (0.1) Changes in Canada insurance contract liabilities due to resolution of prior years’ tax matters - - (15) (0.6)
Other (7) (0.3) - -
Total non-operating items (100) (4.2) (87) (3.7)
Tax on non-operating items 19 0.9 32 1.3
Dubai included in discontinued operations segment1 (6) (0.3) 6 0.3
Profit attributable to equity holders of Standard Life plc 335 14.1 131 5.5 1 Dubai business, the closure of which was announced in November 2014, is included as discontinued operations for segmental reporting purposes under IFRS 8 as
this is reflective of the presentation of information provided to the Chief Operating Decision Maker. Dubai was previously included in Asia and Emerging Markets. Under IFRS 5, Dubai does not constitute a discontinued operation and is included under continuing operations in the consolidated income statement. Therefore the analysis of Group operating profit by segment above includes the reclassification of Dubai results between discontinued and continuing operations.
14. Non-operating items The Group focuses on operating profit as a measure of its performance, which incorporates expected returns on investments backing equity holder funds with a consistent allowance for corresponding expected movements in equity holder liabilities. The methodology used in calculating operating profit is outlined below.
Operating profit is calculated based on expected returns on investments backing equity holder funds, with consistent allowance for the corresponding expected movements in equity holder liabilities. Impacts arising from the difference between the expected return and actual return on investments, and the corresponding impact on equity holder liabilities except where they are directly related to a significant management action, are excluded from operating profit and are presented within profit before tax. As a result, the components of IFRS profit attributable to market movements and interest rate changes which give rise to variances between actual and expected investment returns, as well as the impact of changes in economic assumptions on equity holder liabilities, are excluded from operating profit and disclosed separately within the heading of short-term fluctuations in investment return and economic assumption changes.
Short-term fluctuations in investment return and economic assumptions changes The expected rates of return for debt securities, equity securities and property are determined separately for each of the Group’s operations and are consistent with the expected rates of return as determined under the Group’s published European Embedded Value (EEV) methodology. The expected rates of return for equity securities and property, with the exception of the Canadian operations, are determined based on the gilt spot rates of an appropriate duration plus an equity risk premium or property risk premium, respectively. The expected rates of return on equity securities and property for Canadian operations are determined by the Appointed Actuary in Canada.
158 Standard Life
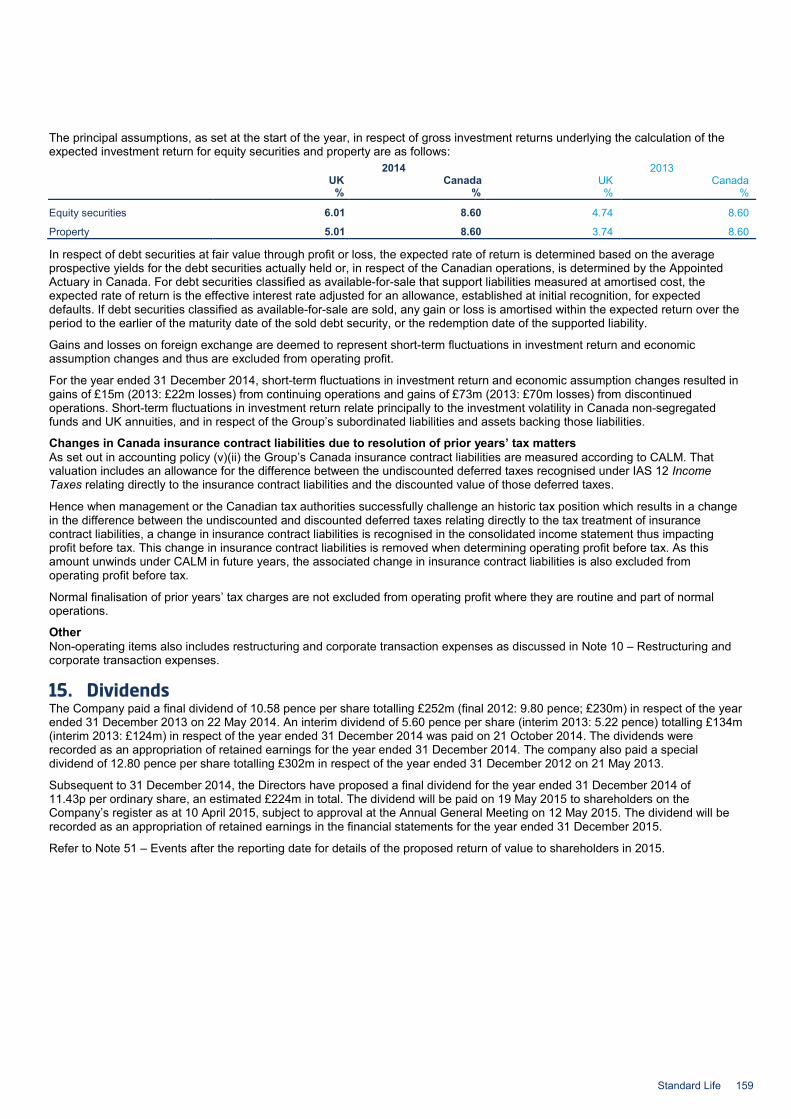
The principal assumptions, as set at the start of the year, in respect of gross investment returns underlying the calculation of the expected investment return for equity securities and property are as follows: 2014 2013 UK Canada UK Canada % % % %
Equity securities 6.01 8.60 4.74 8.60
Property 5.01 8.60 3.74 8.60
In respect of debt securities at fair value through profit or loss, the expected rate of return is determined based on the average prospective yields for the debt securities actually held or, in respect of the Canadian operations, is determined by the Appointed Actuary in Canada. For debt securities classified as available-for-sale that support liabilities measured at amortised cost, the expected rate of return is the effective interest rate adjusted for an allowance, established at initial recognition, for expected defaults. If debt securities classified as available-for-sale are sold, any gain or loss is amortised within the expected return over the period to the earlier of the maturity date of the sold debt security, or the redemption date of the supported liability.
Gains and losses on foreign exchange are deemed to represent short-term fluctuations in investment return and economic assumption changes and thus are excluded from operating profit.
For the year ended 31 December 2014, short-term fluctuations in investment return and economic assumption changes resulted in gains of £15m (2013: £22m losses) from continuing operations and gains of £73m (2013: £70m losses) from discontinued operations. Short-term fluctuations in investment return relate principally to the investment volatility in Canada non-segregated funds and UK annuities, and in respect of the Group’s subordinated liabilities and assets backing those liabilities.
Changes in Canada insurance contract liabilities due to resolution of prior years’ tax matters As set out in accounting policy (v)(ii) the Group’s Canada insurance contract liabilities are measured according to CALM. That valuation includes an allowance for the difference between the undiscounted deferred taxes recognised under IAS 12 Income Taxes relating directly to the insurance contract liabilities and the discounted value of those deferred taxes.
Hence when management or the Canadian tax authorities successfully challenge an historic tax position which results in a change in the difference between the undiscounted and discounted deferred taxes relating directly to the tax treatment of insurance contract liabilities, a change in insurance contract liabilities is recognised in the consolidated income statement thus impacting profit before tax. This change in insurance contract liabilities is removed when determining operating profit before tax. As this amount unwinds under CALM in future years, the associated change in insurance contract liabilities is also excluded from operating profit before tax.
Normal finalisation of prior years’ tax charges are not excluded from operating profit where they are routine and part of normal operations.
Other Non-operating items also includes restructuring and corporate transaction expenses as discussed in Note 10 – Restructuring and corporate transaction expenses.
15. Dividends The Company paid a final dividend of 10.58 pence per share totalling £252m (final 2012: 9.80 pence; £230m) in respect of the year ended 31 December 2013 on 22 May 2014. An interim dividend of 5.60 pence per share (interim 2013: 5.22 pence) totalling £134m (interim 2013: £124m) in respect of the year ended 31 December 2014 was paid on 21 October 2014. The dividends were recorded as an appropriation of retained earnings for the year ended 31 December 2014. The company also paid a special dividend of 12.80 pence per share totalling £302m in respect of the year ended 31 December 2012 on 21 May 2013.
Subsequent to 31 December 2014, the Directors have proposed a final dividend for the year ended 31 December 2014 of 11.43p per ordinary share, an estimated £224m in total. The dividend will be paid on 19 May 2015 to shareholders on the Company’s register as at 10 April 2015, subject to approval at the Annual General Meeting on 12 May 2015. The dividend will be recorded as an appropriation of retained earnings in the financial statements for the year ended 31 December 2015.
Refer to Note 51 – Events after the reporting date for details of the proposed return of value to shareholders in 2015.
Standard Life 159

3. Financial information – Notes to the Group financial statements continued
16. Intangible assets
Goodwill
Intangible assets acquired through
business combinations
Internally developed
software Other acquired
intangible assets Total Notes £m £m £m £m £m
Gross amount At 1 January 2013 71 30 177 37 315 Additions 40 29 25 22 116 Other - - - (2) (2) At 31 December 2013 111 59 202 57 429 Reclassified to held for sale during the year - - - (4) (4) Additions 1 105 208 33 10 356 Impairment losses recognised 7 - (43) (4) - (47) Other - - (1) - (1) At 31 December 2014 216 224 230 63 733 Accumulated amortisation At 1 January 2013 - (13) (73) (15) (101) Amortisation charge for the year1 - (5) (20) (5) (30) Other - - - 2 2 At 31 December 2013 - (18) (93) (18) (129) Reclassified to held for sale during the year - - - 2 2 Amortisation charge for the year 7 - (15) (21) (5) (41) At 31 December 2014 - (33) (114) (21) (168) Carrying amount At 1 January 2013 71 17 104 22 214 At 31 December 2013 111 41 109 39 300 At 31 December 2014 216 191 116 42 565 1 The amortisation charge for the year ended 31 December 2013 includes £1m in respect of discontinued operations.
Additions to intangible assets acquired through business combinations during the year to 31 December 2014 relate to the acquisition of Ignis (refer to Note 1 – Group structure) and comprises life company contracts of £80m, institutional client contracts of £90m and retail client contracts of £38m. Each of these categories form a cash-generating unit.
During 2014, subsequent to the acquisition of Ignis, there was a significant change in the management structure of the Absolute Return Government Bond Fund, which makes up the majority of the institutional client contracts cash-generating unit carrying value at 31 December 2014. This has resulted in outflows of assets under management and reduced projections of inflows and revenue, with a consequential fall in the recoverable amount of this cash-generating unit. The recoverable amount of the institutional client contracts cash-generating unit at 31 December 2014 is £44m which is its value in use. The discount rate used to calculate value in use at 31 December 2014 was 14%. The most significant judgements used in determining the recoverable amount are estimated net flow projections for the next five years and forecasted operating profit margins. The useful economic lives of the intangible assets is between 10 and 15 years and therefore the projected cash flows used to determine value in use cover a period of longer than five years. The impairment loss of £43m recognised during the year to 31 December 2014 relates to this decrease in recoverable amount.
The Group’s goodwill of £216m (2013: £111m) has been acquired through a series of business combinations, and additions in the year to 31 December 2014 relate to the acquisition of Ignis. The cash-generating units to which goodwill is attributed is £71m (2013: £111m) to the UK and Europe business unit and £145m (2013: £nil) to the Standard Life Investments business unit.
Goodwill is reviewed annually for impairment by comparing the carrying value of each of the investments including goodwill with its recoverable amount. The recoverable amount of the investments is determined by calculating its value in use.
The value in use calculation uses cash flow projections based on business plans for a maximum period of five years. The following key assumptions have been applied by management to the calculations after considering past experience and market expectations for future growth: • A growth rate of 3% has been used to extrapolate new business contributions beyond the business plan period, and is based on
management’s estimate of future growth rates for the industry and the UK economy • Additional net flows into assets under administration and increased market share have been assumed due to enhanced product
offerings • Cost savings have been assumed due to synergies expected • A risk-adjusted discount rate ranging from 10% to 15% has been applied.
As a result of the impairment testing carried out, no goodwill was considered to be impaired at 31 December 2014 or 31 December 2013.
160 Standard Life
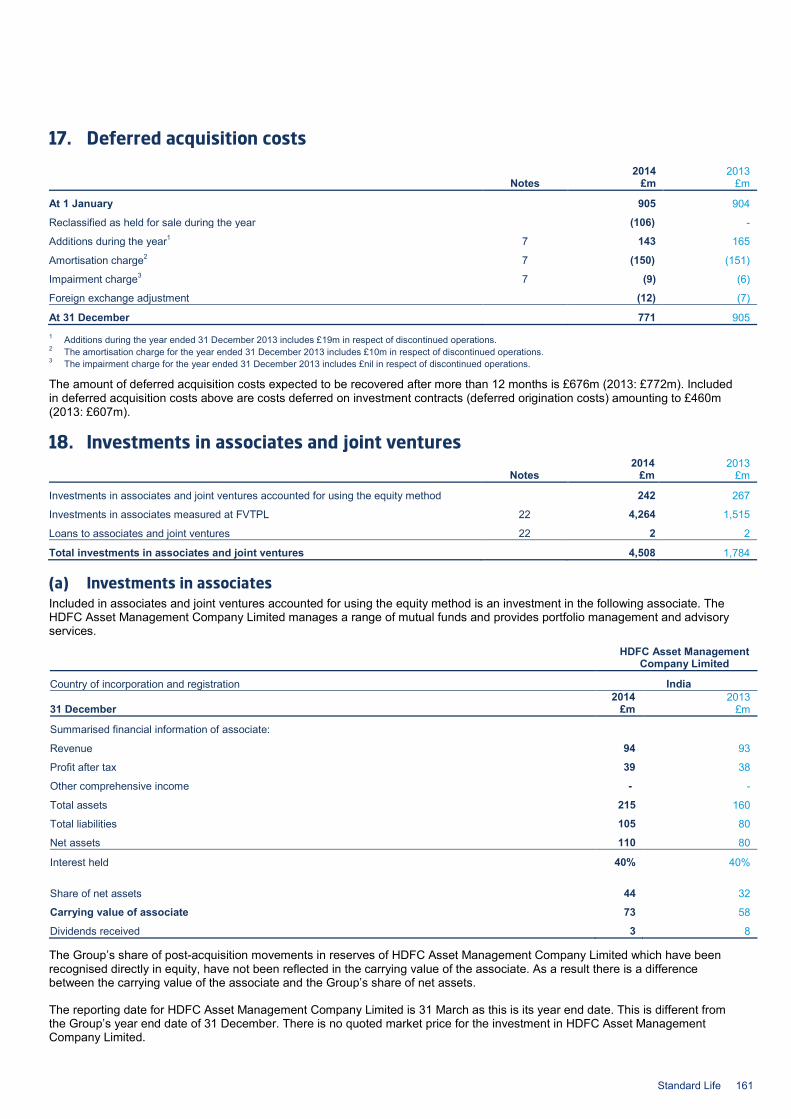
17. Deferred acquisition costs
2014 2013 Notes £m £m
At 1 January 905 904
Reclassified as held for sale during the year (106) -
Additions during the year1 7 143 165
Amortisation charge2 7 (150) (151)
Impairment charge3 7 (9) (6)
Foreign exchange adjustment (12) (7)
At 31 December 771 905 1 Additions during the year ended 31 December 2013 includes £19m in respect of discontinued operations. 2 The amortisation charge for the year ended 31 December 2013 includes £10m in respect of discontinued operations. 3 The impairment charge for the year ended 31 December 2013 includes £nil in respect of discontinued operations.
The amount of deferred acquisition costs expected to be recovered after more than 12 months is £676m (2013: £772m). Included in deferred acquisition costs above are costs deferred on investment contracts (deferred origination costs) amounting to £460m (2013: £607m).
18. Investments in associates and joint ventures 2014 2013 Notes £m £m
Investments in associates and joint ventures accounted for using the equity method 242 267
Investments in associates measured at FVTPL 22 4,264 1,515
Loans to associates and joint ventures 22 2 2
Total investments in associates and joint ventures 4,508 1,784
(a) Investments in associates Included in associates and joint ventures accounted for using the equity method is an investment in the following associate. The HDFC Asset Management Company Limited manages a range of mutual funds and provides portfolio management and advisory services.
HDFC Asset Management
Company Limited
Country of incorporation and registration India 2014 2013 31 December £m £m
Summarised financial information of associate:
Revenue 94 93
Profit after tax 39 38
Other comprehensive income - -
Total assets 215 160
Total liabilities 105 80
Net assets 110 80
Interest held 40% 40%
Share of net assets 44 32
Carrying value of associate 73 58
Dividends received 3 8
The Group’s share of post-acquisition movements in reserves of HDFC Asset Management Company Limited which have been recognised directly in equity, have not been reflected in the carrying value of the associate. As a result there is a difference between the carrying value of the associate and the Group’s share of net assets.
The reporting date for HDFC Asset Management Company Limited is 31 March as this is its year end date. This is different from the Group’s year end date of 31 December. There is no quoted market price for the investment in HDFC Asset Management Company Limited.
Standard Life 161
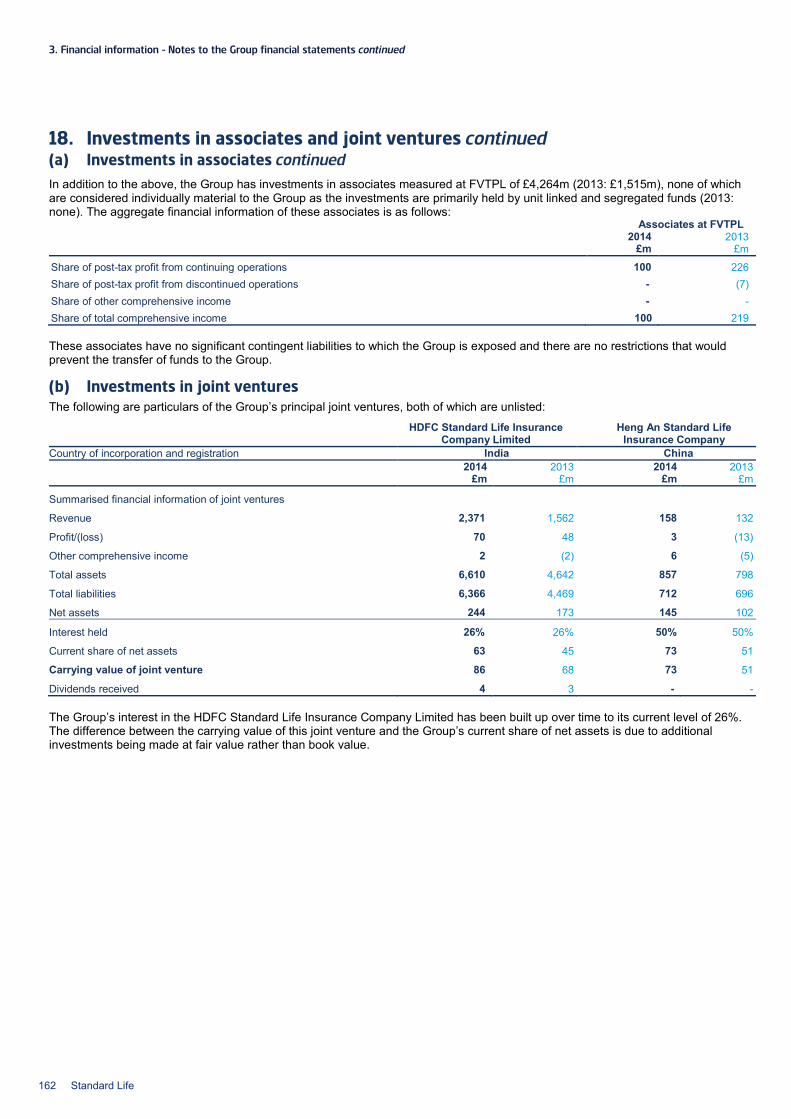
3. Financial information – Notes to the Group financial statements continued
18. Investments in associates and joint ventures continued (a) Investments in associates continued In addition to the above, the Group has investments in associates measured at FVTPL of £4,264m (2013: £1,515m), none of which are considered individually material to the Group as the investments are primarily held by unit linked and segregated funds (2013: none). The aggregate financial information of these associates is as follows:
Associates at FVTPL 2014 2013 £m £m
Share of post-tax profit from continuing operations 100 226 Share of post-tax profit from discontinued operations - (7) Share of other comprehensive income - - Share of total comprehensive income 100 219
These associates have no significant contingent liabilities to which the Group is exposed and there are no restrictions that would prevent the transfer of funds to the Group.
(b) Investments in joint ventures The following are particulars of the Group’s principal joint ventures, both of which are unlisted:
HDFC Standard Life Insurance
Company Limited Heng An Standard Life
Insurance Company Country of incorporation and registration India China 2014 2013 2014 2013 £m £m £m £m
Summarised financial information of joint ventures
Revenue 2,371 1,562 158 132
Profit/(loss) 70 48 3 (13)
Other comprehensive income 2 (2) 6 (5)
Total assets 6,610 4,642 857 798
Total liabilities 6,366 4,469 712 696
Net assets 244 173 145 102
Interest held 26% 26% 50% 50%
Current share of net assets 63 45 73 51
Carrying value of joint venture 86 68 73 51
Dividends received 4 3 - - The Group’s interest in the HDFC Standard Life Insurance Company Limited has been built up over time to its current level of 26%. The difference between the carrying value of this joint venture and the Group’s current share of net assets is due to additional investments being made at fair value rather than book value.
162 Standard Life
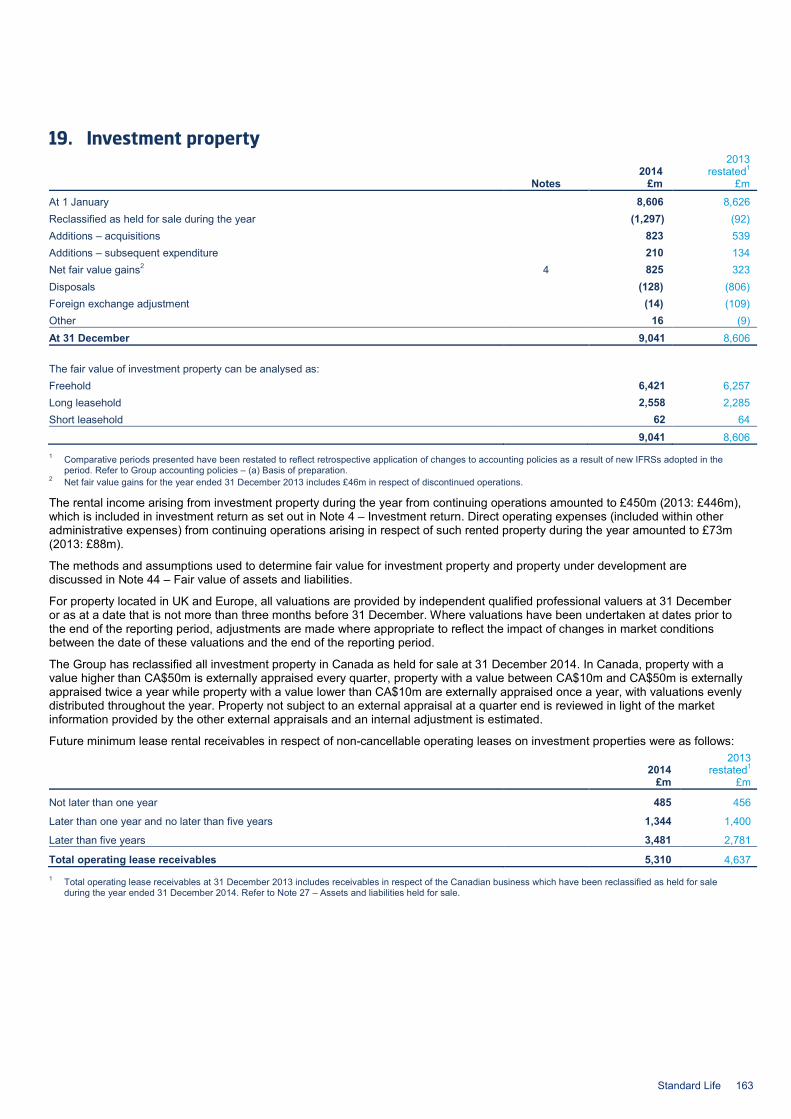
19. Investment property
2014 2013
restated1
Notes £m £m
At 1 January 8,606 8,626 Reclassified as held for sale during the year (1,297) (92) Additions – acquisitions 823 539 Additions – subsequent expenditure 210 134 Net fair value gains2 4 825 323 Disposals (128) (806) Foreign exchange adjustment (14) (109) Other 16 (9) At 31 December 9,041 8,606
The fair value of investment property can be analysed as: Freehold 6,421 6,257 Long leasehold 2,558 2,285 Short leasehold 62 64 9,041 8,606 1 Comparative periods presented have been restated to reflect retrospective application of changes to accounting policies as a result of new IFRSs adopted in the
period. Refer to Group accounting policies – (a) Basis of preparation. 2 Net fair value gains for the year ended 31 December 2013 includes £46m in respect of discontinued operations.
The rental income arising from investment property during the year from continuing operations amounted to £450m (2013: £446m), which is included in investment return as set out in Note 4 – Investment return. Direct operating expenses (included within other administrative expenses) from continuing operations arising in respect of such rented property during the year amounted to £73m (2013: £88m).
The methods and assumptions used to determine fair value for investment property and property under development are discussed in Note 44 – Fair value of assets and liabilities.
For property located in UK and Europe, all valuations are provided by independent qualified professional valuers at 31 December or as at a date that is not more than three months before 31 December. Where valuations have been undertaken at dates prior to the end of the reporting period, adjustments are made where appropriate to reflect the impact of changes in market conditions between the date of these valuations and the end of the reporting period.
The Group has reclassified all investment property in Canada as held for sale at 31 December 2014. In Canada, property with a value higher than CA$50m is externally appraised every quarter, property with a value between CA$10m and CA$50m is externally appraised twice a year while property with a value lower than CA$10m are externally appraised once a year, with valuations evenly distributed throughout the year. Property not subject to an external appraisal at a quarter end is reviewed in light of the market information provided by the other external appraisals and an internal adjustment is estimated.
Future minimum lease rental receivables in respect of non-cancellable operating leases on investment properties were as follows:
2014 2013
restated1 £m £m
Not later than one year 485 456
Later than one year and no later than five years 1,344 1,400
Later than five years 3,481 2,781
Total operating lease receivables 5,310 4,637 1 Total operating lease receivables at 31 December 2013 includes receivables in respect of the Canadian business which have been reclassified as held for sale
during the year ended 31 December 2014. Refer to Note 27 – Assets and liabilities held for sale.
Standard Life 163

3. Financial information – Notes to the Group financial statements continued
20. Property, plant and equipment Owner occupied
property Equipment Total Notes £m £m £m
Cost or valuation
At 1 January 2013 112 110 222
Additions - 17 17
Disposals and adjustments1 - (6) (6)
Revaluations2 32 68 - 68
Impairment losses reversed3,4 7 2 - 2
Impairment losses recognised3,4 7 (5) - (5)
Foreign exchange adjustment (5) - (5)
At 31 December 2013 172 121 293
Reclassified as held for sale during the year (43) (9) (52)
Additions - 19 19
Disposals and adjustments1 - (1) (1)
Revaluations 5 - 5
Impairment losses reversed3 7 4 - 4
At 31 December 2014 138 130 268
Accumulated depreciation
At 1 January 2013 - (66) (66)
Depreciation charge for the year5 7 - (14) (14)
Disposals and adjustments1 - 6 6
At 31 December 2013 - (74) (74)
Reclassified as held for sale during the year - 5 5
Depreciation charge for the year 7 - (14) (14)
Disposals and adjustments1 - 1 1
At 31 December 2014 - (82) (82)
Carrying amount
At 1 January 2013 112 44 156
At 31 December 2013 172 47 219
At 31 December 2014 138 48 186 1 For the year ended 31 December 2014 £1m (2013: £6m) of disposals and adjustments relates to equipment with net book value of £nil and is no longer in use. 2 Revaluations for the year ended 31 December 2013 includes £17m in respect of discontinued operations. 3 The impairment reversed/(recognised) arose due to changes in the market value of a number of properties relative to their original deemed cost. 4 Impairment losses reversed/(recognised) for the year ended 31 December 2013 includes £nil in respect of discontinued operations. 5 Depreciation charge for the year ended 31 December 2013 includes £1m in respect of discontinued operations.
If owner occupied property was measured using the cost model, the historical cost before impairment would be £155m (2013: £180m). Where the expected residual value of owner occupied property is in line with the current fair value, no depreciation is charged. Equipment primarily consists of computer equipment.
The methods and assumptions used to value owner occupied property are set out in Note 44 – Fair value of assets and liabilities.
164 Standard Life
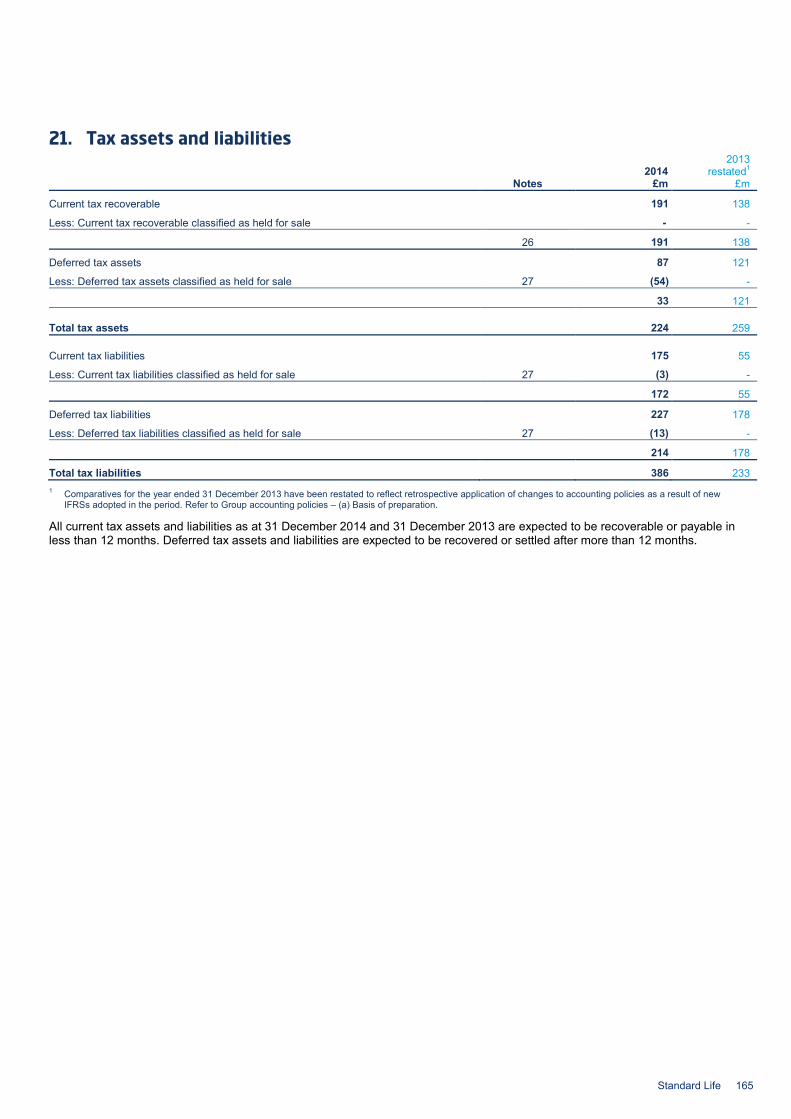
21. Tax assets and liabilities
2014 2013
restated1 Notes £m £m
Current tax recoverable 191 138
Less: Current tax recoverable classified as held for sale - -
26 191 138
Deferred tax assets 87 121
Less: Deferred tax assets classified as held for sale 27 (54) -
33 121
Total tax assets 224 259
Current tax liabilities 175 55
Less: Current tax liabilities classified as held for sale 27 (3) -
172 55
Deferred tax liabilities 227 178
Less: Deferred tax liabilities classified as held for sale 27 (13) -
214 178
Total tax liabilities 386 233 1 Comparatives for the year ended 31 December 2013 have been restated to reflect retrospective application of changes to accounting policies as a result of new
IFRSs adopted in the period. Refer to Group accounting policies – (a) Basis of preparation.
All current tax assets and liabilities as at 31 December 2014 and 31 December 2013 are expected to be recoverable or payable in less than 12 months. Deferred tax assets and liabilities are expected to be recovered or settled after more than 12 months.
Standard Life 165
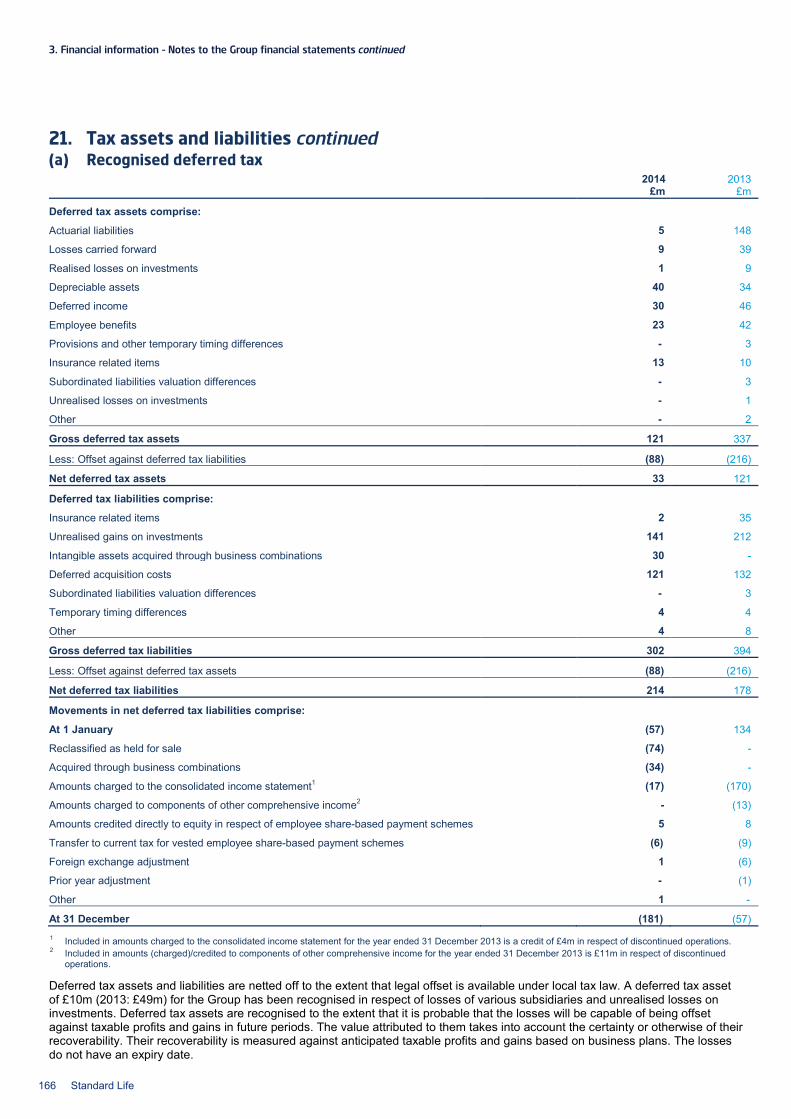
3. Financial information – Notes to the Group financial statements continued
21. Tax assets and liabilities continued (a) Recognised deferred tax
2014 2013 £m £m
Deferred tax assets comprise:
Actuarial liabilities 5 148
Losses carried forward 9 39
Realised losses on investments 1 9
Depreciable assets 40 34
Deferred income 30 46
Employee benefits 23 42
Provisions and other temporary timing differences - 3
Insurance related items 13 10
Subordinated liabilities valuation differences - 3
Unrealised losses on investments - 1
Other - 2
Gross deferred tax assets 121 337
Less: Offset against deferred tax liabilities (88) (216)
Net deferred tax assets 33 121
Deferred tax liabilities comprise:
Insurance related items 2 35
Unrealised gains on investments 141 212
Intangible assets acquired through business combinations 30 -
Deferred acquisition costs 121 132
Subordinated liabilities valuation differences - 3
Temporary timing differences 4 4
Other 4 8
Gross deferred tax liabilities 302 394
Less: Offset against deferred tax assets (88) (216)
Net deferred tax liabilities 214 178
Movements in net deferred tax liabilities comprise:
At 1 January (57) 134
Reclassified as held for sale (74) -
Acquired through business combinations (34) -
Amounts charged to the consolidated income statement1 (17) (170)
Amounts charged to components of other comprehensive income2 - (13)
Amounts credited directly to equity in respect of employee share-based payment schemes 5 8
Transfer to current tax for vested employee share-based payment schemes (6) (9)
Foreign exchange adjustment 1 (6)
Prior year adjustment - (1)
Other 1 -
At 31 December (181) (57) 1 Included in amounts charged to the consolidated income statement for the year ended 31 December 2013 is a credit of £4m in respect of discontinued operations. 2 Included in amounts (charged)/credited to components of other comprehensive income for the year ended 31 December 2013 is £11m in respect of discontinued
operations.
Deferred tax assets and liabilities are netted off to the extent that legal offset is available under local tax law. A deferred tax asset of £10m (2013: £49m) for the Group has been recognised in respect of losses of various subsidiaries and unrealised losses on investments. Deferred tax assets are recognised to the extent that it is probable that the losses will be capable of being offset against taxable profits and gains in future periods. The value attributed to them takes into account the certainty or otherwise of their recoverability. Their recoverability is measured against anticipated taxable profits and gains based on business plans. The losses do not have an expiry date.
166 Standard Life
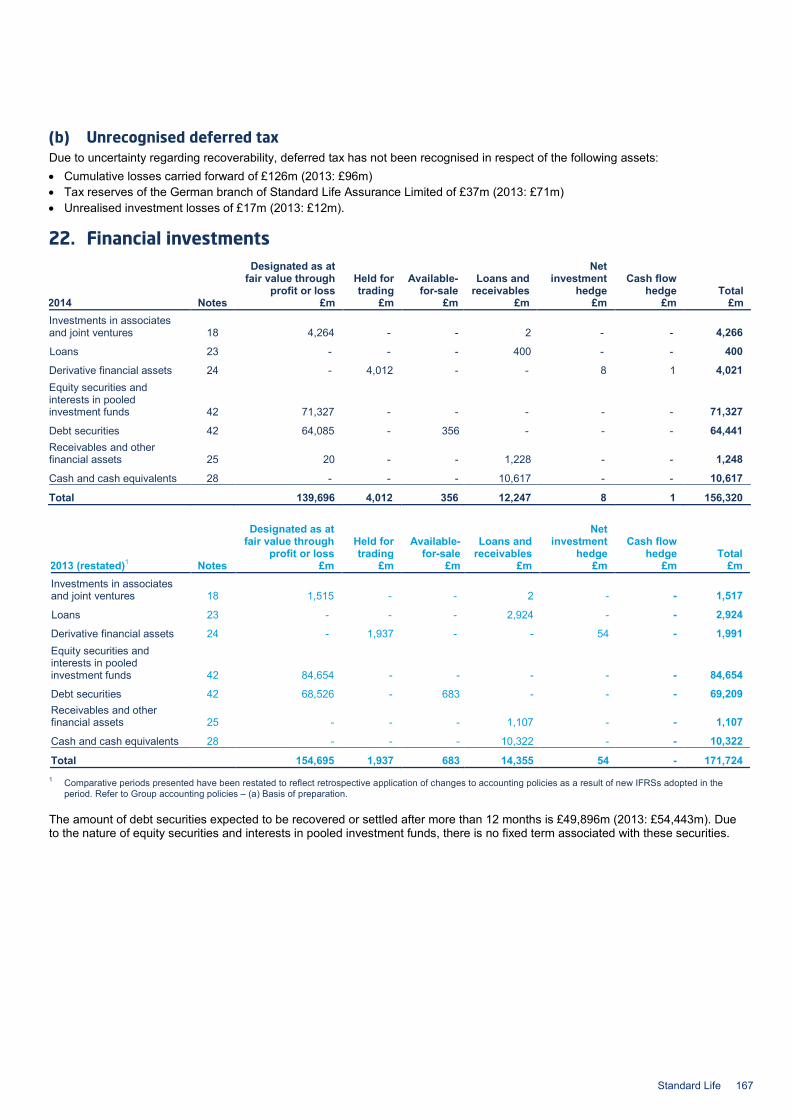
(b) Unrecognised deferred tax Due to uncertainty regarding recoverability, deferred tax has not been recognised in respect of the following assets: • Cumulative losses carried forward of £126m (2013: £96m) • Tax reserves of the German branch of Standard Life Assurance Limited of £37m (2013: £71m) • Unrealised investment losses of £17m (2013: £12m).
22. Financial investments
Designated as at fair value through
profit or loss Held for trading
Available-for-sale
Loans and receivables
Net investment
hedge Cash flow
hedge Total 2014 Notes £m £m £m £m £m £m £m Investments in associates and joint ventures 18 4,264 - - 2 - - 4,266
Loans 23 - - - 400 - - 400
Derivative financial assets 24 - 4,012 - - 8 1 4,021 Equity securities and interests in pooled investment funds 42 71,327 - - - - - 71,327
Debt securities 42 64,085 - 356 - - - 64,441 Receivables and other financial assets 25 20 - - 1,228 - - 1,248
Cash and cash equivalents 28 - - - 10,617 - - 10,617
Total 139,696 4,012 356 12,247 8 1 156,320
Designated as at fair value through
profit or loss Held for trading
Available-for-sale
Loans and receivables
Net investment
hedge Cash flow
hedge Total 2013 (restated)1 Notes £m £m £m £m £m £m £m Investments in associates and joint ventures 18 1,515 - - 2 - - 1,517
Loans 23 - - - 2,924 - - 2,924
Derivative financial assets 24 - 1,937 - - 54 - 1,991 Equity securities and interests in pooled investment funds 42 84,654 - - - - - 84,654
Debt securities 42 68,526 - 683 - - - 69,209 Receivables and other financial assets 25 - - - 1,107 - - 1,107
Cash and cash equivalents 28 - - - 10,322 - - 10,322
Total 154,695 1,937 683 14,355 54 - 171,724 1 Comparative periods presented have been restated to reflect retrospective application of changes to accounting policies as a result of new IFRSs adopted in the
period. Refer to Group accounting policies – (a) Basis of preparation.
The amount of debt securities expected to be recovered or settled after more than 12 months is £49,896m (2013: £54,443m). Due to the nature of equity securities and interests in pooled investment funds, there is no fixed term associated with these securities.
Standard Life 167
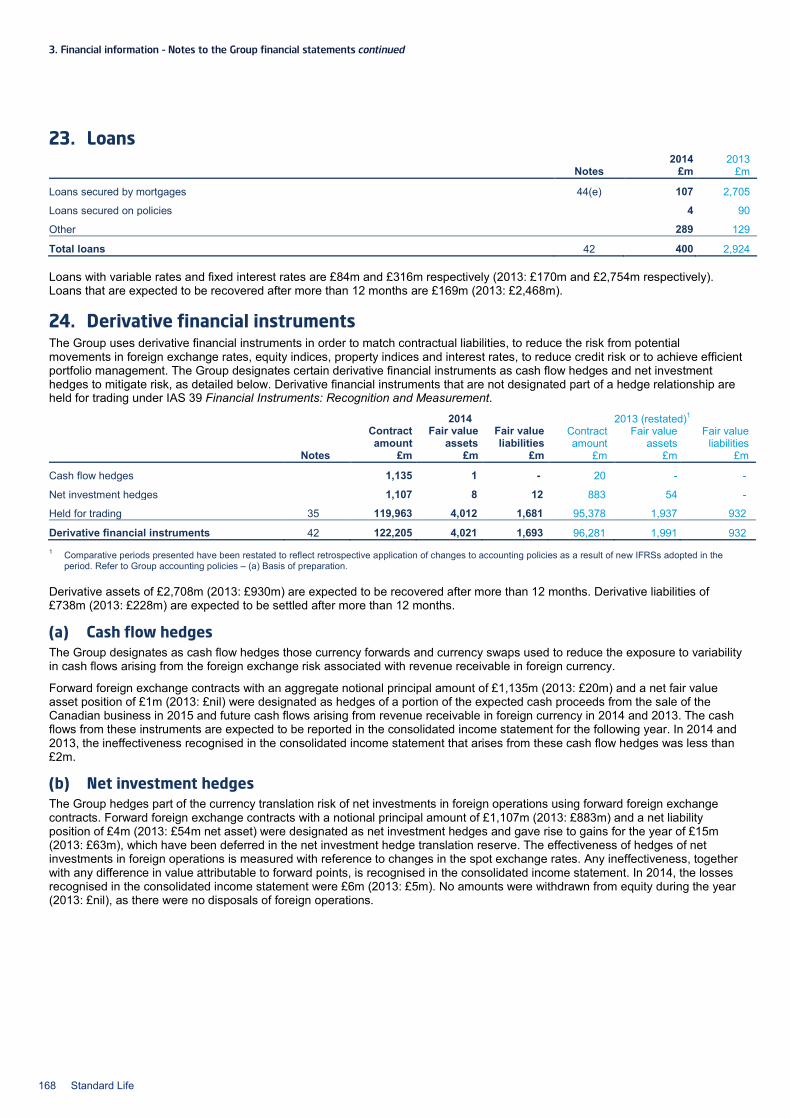
3. Financial information – Notes to the Group financial statements continued
23. Loans
2014 2013 Notes £m £m
Loans secured by mortgages 44(e) 107 2,705
Loans secured on policies 4 90
Other 289 129
Total loans 42 400 2,924
Loans with variable rates and fixed interest rates are £84m and £316m respectively (2013: £170m and £2,754m respectively). Loans that are expected to be recovered after more than 12 months are £169m (2013: £2,468m).
24. Derivative financial instruments The Group uses derivative financial instruments in order to match contractual liabilities, to reduce the risk from potential movements in foreign exchange rates, equity indices, property indices and interest rates, to reduce credit risk or to achieve efficient portfolio management. The Group designates certain derivative financial instruments as cash flow hedges and net investment hedges to mitigate risk, as detailed below. Derivative financial instruments that are not designated part of a hedge relationship are held for trading under IAS 39 Financial Instruments: Recognition and Measurement.
2014 2013 (restated)1 Contract
amount Fair value
assets Fair value liabilities
Contract amount
Fair value assets
Fair value liabilities
Notes £m £m £m £m £m £m
Cash flow hedges 1,135 1 - 20 - -
Net investment hedges 1,107 8 12 883 54 -
Held for trading 35 119,963 4,012 1,681 95,378 1,937 932
Derivative financial instruments 42 122,205 4,021 1,693 96,281 1,991 932 1 Comparative periods presented have been restated to reflect retrospective application of changes to accounting policies as a result of new IFRSs adopted in the
period. Refer to Group accounting policies – (a) Basis of preparation.
Derivative assets of £2,708m (2013: £930m) are expected to be recovered after more than 12 months. Derivative liabilities of £738m (2013: £228m) are expected to be settled after more than 12 months.
(a) Cash flow hedges The Group designates as cash flow hedges those currency forwards and currency swaps used to reduce the exposure to variability in cash flows arising from the foreign exchange risk associated with revenue receivable in foreign currency.
Forward foreign exchange contracts with an aggregate notional principal amount of £1,135m (2013: £20m) and a net fair value asset position of £1m (2013: £nil) were designated as hedges of a portion of the expected cash proceeds from the sale of the Canadian business in 2015 and future cash flows arising from revenue receivable in foreign currency in 2014 and 2013. The cash flows from these instruments are expected to be reported in the consolidated income statement for the following year. In 2014 and 2013, the ineffectiveness recognised in the consolidated income statement that arises from these cash flow hedges was less than £2m.
(b) Net investment hedges The Group hedges part of the currency translation risk of net investments in foreign operations using forward foreign exchange contracts. Forward foreign exchange contracts with a notional principal amount of £1,107m (2013: £883m) and a net liability position of £4m (2013: £54m net asset) were designated as net investment hedges and gave rise to gains for the year of £15m (2013: £63m), which have been deferred in the net investment hedge translation reserve. The effectiveness of hedges of net investments in foreign operations is measured with reference to changes in the spot exchange rates. Any ineffectiveness, together with any difference in value attributable to forward points, is recognised in the consolidated income statement. In 2014, the losses recognised in the consolidated income statement were £6m (2013: £5m). No amounts were withdrawn from equity during the year (2013: £nil), as there were no disposals of foreign operations.
168 Standard Life
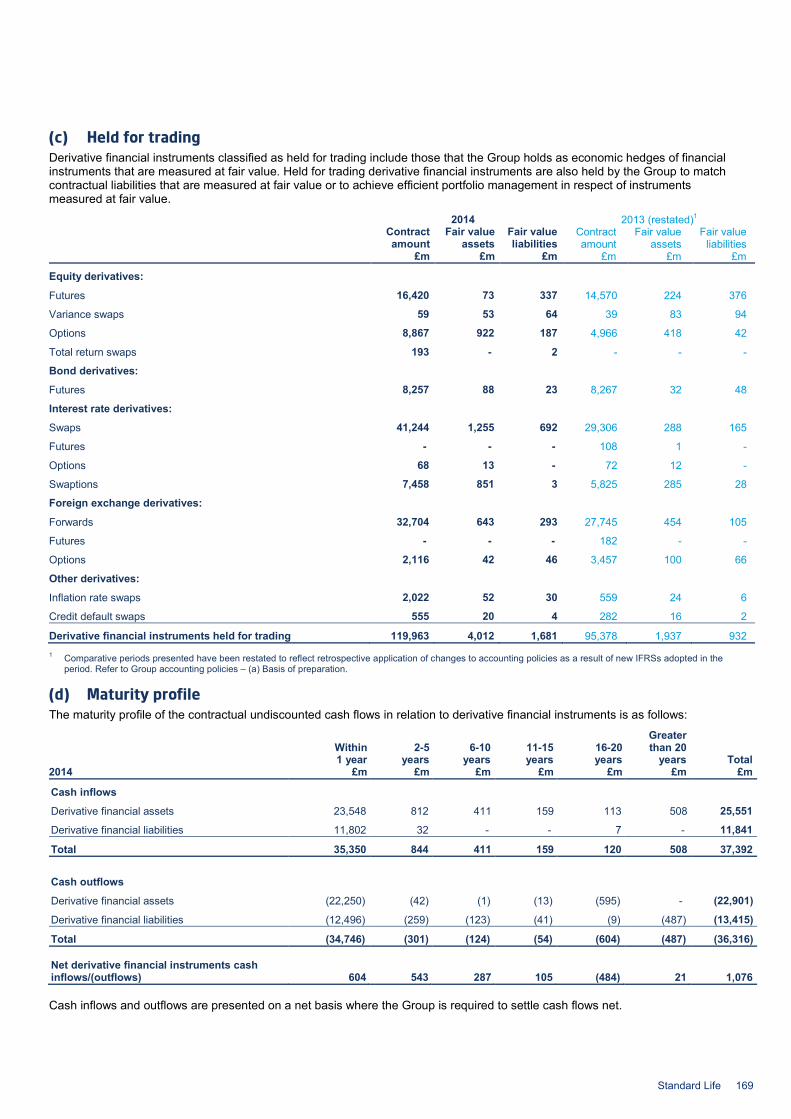
(c) Held for trading Derivative financial instruments classified as held for trading include those that the Group holds as economic hedges of financial instruments that are measured at fair value. Held for trading derivative financial instruments are also held by the Group to match contractual liabilities that are measured at fair value or to achieve efficient portfolio management in respect of instruments measured at fair value.
2014 2013 (restated)1 Contract
amount Fair value
assets Fair value liabilities
Contract amount
Fair value assets
Fair value liabilities
£m £m £m £m £m £m
Equity derivatives:
Futures 16,420 73 337 14,570 224 376
Variance swaps 59 53 64 39 83 94
Options 8,867 922 187 4,966 418 42
Total return swaps 193 - 2 - - -
Bond derivatives:
Futures 8,257 88 23 8,267 32 48
Interest rate derivatives:
Swaps 41,244 1,255 692 29,306 288 165
Futures - - - 108 1 -
Options 68 13 - 72 12 -
Swaptions 7,458 851 3 5,825 285 28
Foreign exchange derivatives:
Forwards 32,704 643 293 27,745 454 105
Futures - - - 182 - -
Options 2,116 42 46 3,457 100 66
Other derivatives:
Inflation rate swaps 2,022 52 30 559 24 6
Credit default swaps 555 20 4 282 16 2
Derivative financial instruments held for trading 119,963 4,012 1,681 95,378 1,937 932 1 Comparative periods presented have been restated to reflect retrospective application of changes to accounting policies as a result of new IFRSs adopted in the
period. Refer to Group accounting policies – (a) Basis of preparation.
(d) Maturity profile The maturity profile of the contractual undiscounted cash flows in relation to derivative financial instruments is as follows:
Within 1 year
2-5 years
6-10 years
11-15 years
16-20 years
Greater than 20
years Total 2014 £m £m £m £m £m £m £m
Cash inflows
Derivative financial assets 23,548 812 411 159 113 508 25,551
Derivative financial liabilities 11,802 32 - - 7 - 11,841
Total 35,350 844 411 159 120 508 37,392
Cash outflows
Derivative financial assets (22,250) (42) (1) (13) (595) - (22,901)
Derivative financial liabilities (12,496) (259) (123) (41) (9) (487) (13,415)
Total (34,746) (301) (124) (54) (604) (487) (36,316) Net derivative financial instruments cash inflows/(outflows) 604 543 287 105 (484) 21 1,076
Cash inflows and outflows are presented on a net basis where the Group is required to settle cash flows net.
Standard Life 169
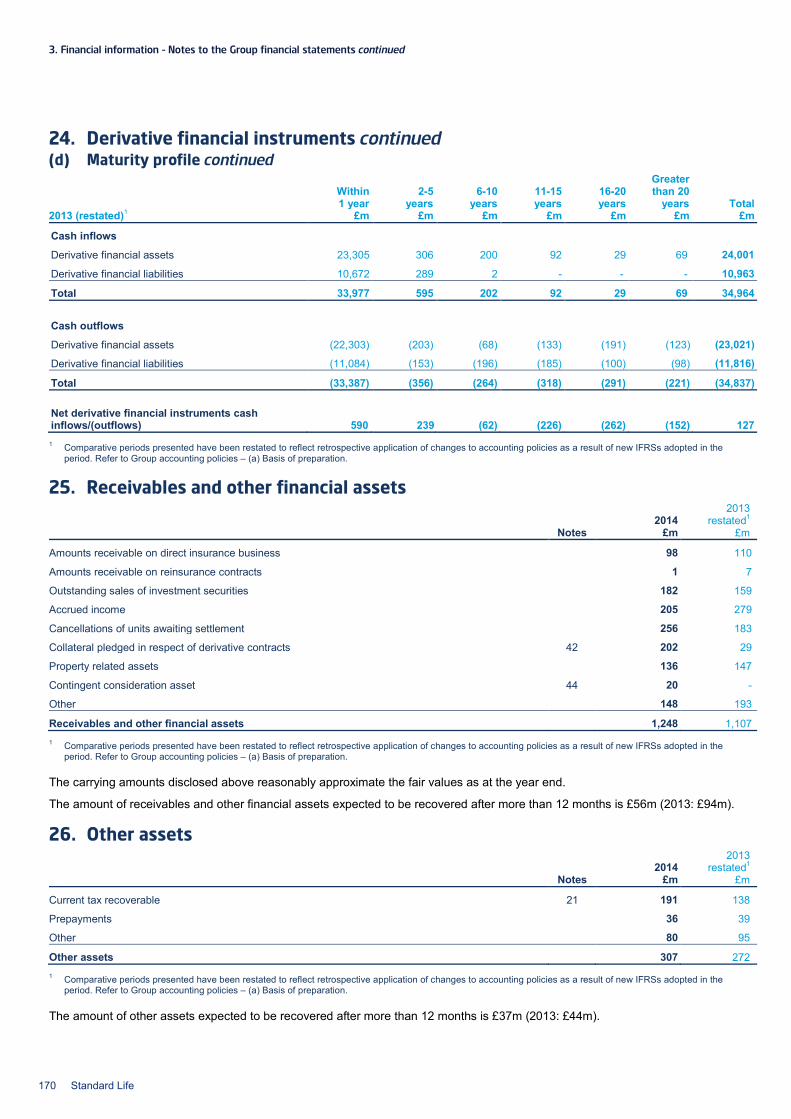
3. Financial information – Notes to the Group financial statements continued
24. Derivative financial instruments continued (d) Maturity profile continued Within
1 year 2-5
years 6-10
years 11-15 years
16-20 years
Greater than 20
years Total 2013 (restated)1 £m £m £m £m £m £m £m
Cash inflows
Derivative financial assets 23,305 306 200 92 29 69 24,001
Derivative financial liabilities 10,672 289 2 - - - 10,963
Total 33,977 595 202 92 29 69 34,964
Cash outflows
Derivative financial assets (22,303) (203) (68) (133) (191) (123) (23,021)
Derivative financial liabilities (11,084) (153) (196) (185) (100) (98) (11,816)
Total (33,387) (356) (264) (318) (291) (221) (34,837) Net derivative financial instruments cash inflows/(outflows) 590 239 (62) (226) (262) (152) 127
1 Comparative periods presented have been restated to reflect retrospective application of changes to accounting policies as a result of new IFRSs adopted in the period. Refer to Group accounting policies – (a) Basis of preparation.
25. Receivables and other financial assets
2014 2013
restated1 Notes £m £m
Amounts receivable on direct insurance business 98 110
Amounts receivable on reinsurance contracts 1 7
Outstanding sales of investment securities 182 159
Accrued income 205 279
Cancellations of units awaiting settlement 256 183
Collateral pledged in respect of derivative contracts 42 202 29
Property related assets 136 147
Contingent consideration asset 44 20 -
Other 148 193
Receivables and other financial assets 1,248 1,107 1 Comparative periods presented have been restated to reflect retrospective application of changes to accounting policies as a result of new IFRSs adopted in the
period. Refer to Group accounting policies – (a) Basis of preparation.
The carrying amounts disclosed above reasonably approximate the fair values as at the year end.
The amount of receivables and other financial assets expected to be recovered after more than 12 months is £56m (2013: £94m).
26. Other assets
2014 2013
restated1 Notes £m £m
Current tax recoverable 21 191 138
Prepayments 36 39
Other 80 95
Other assets 307 272 1 Comparative periods presented have been restated to reflect retrospective application of changes to accounting policies as a result of new IFRSs adopted in the
period. Refer to Group accounting policies – (a) Basis of preparation.
The amount of other assets expected to be recovered after more than 12 months is £37m (2013: £44m).
170 Standard Life
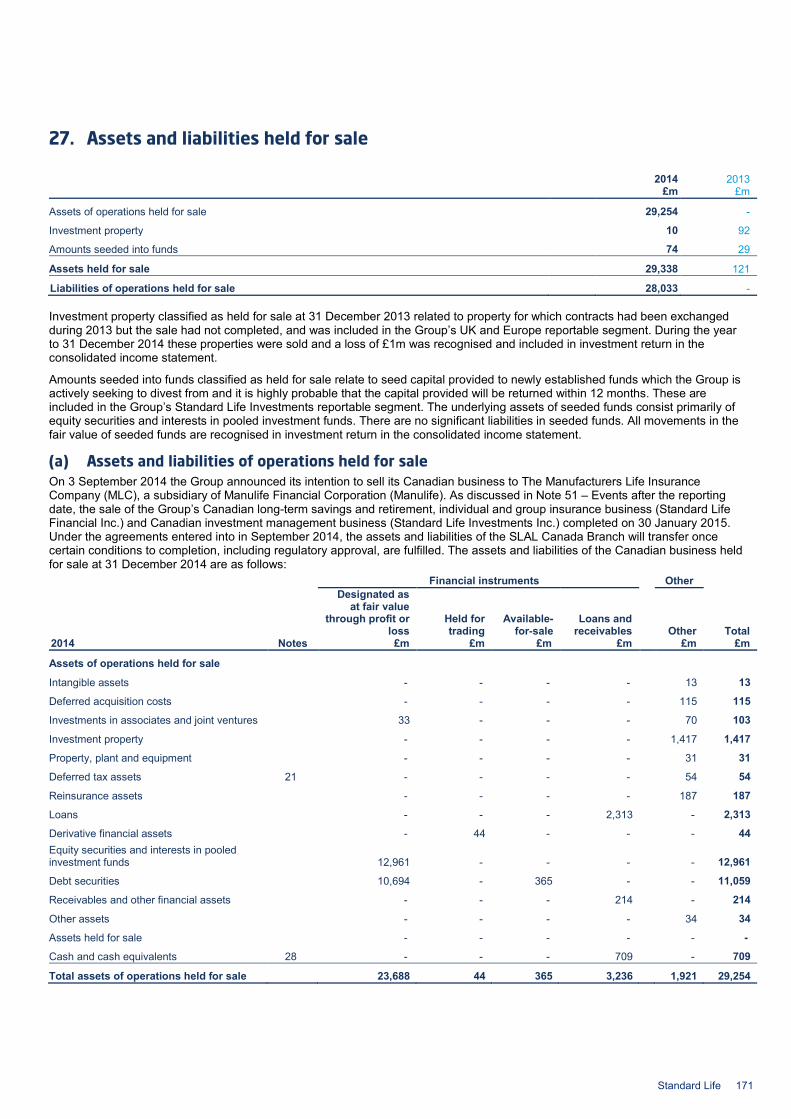
27. Assets and liabilities held for sale
2014 2013 £m £m
Assets of operations held for sale 29,254 -
Investment property 10 92
Amounts seeded into funds 74 29
Assets held for sale 29,338 121
Liabilities of operations held for sale 28,033 -
Investment property classified as held for sale at 31 December 2013 related to property for which contracts had been exchanged during 2013 but the sale had not completed, and was included in the Group’s UK and Europe reportable segment. During the year to 31 December 2014 these properties were sold and a loss of £1m was recognised and included in investment return in the consolidated income statement.
Amounts seeded into funds classified as held for sale relate to seed capital provided to newly established funds which the Group is actively seeking to divest from and it is highly probable that the capital provided will be returned within 12 months. These are included in the Group’s Standard Life Investments reportable segment. The underlying assets of seeded funds consist primarily of equity securities and interests in pooled investment funds. There are no significant liabilities in seeded funds. All movements in the fair value of seeded funds are recognised in investment return in the consolidated income statement.
(a) Assets and liabilities of operations held for sale On 3 September 2014 the Group announced its intention to sell its Canadian business to The Manufacturers Life Insurance Company (MLC), a subsidiary of Manulife Financial Corporation (Manulife). As discussed in Note 51 – Events after the reporting date, the sale of the Group’s Canadian long-term savings and retirement, individual and group insurance business (Standard Life Financial Inc.) and Canadian investment management business (Standard Life Investments Inc.) completed on 30 January 2015. Under the agreements entered into in September 2014, the assets and liabilities of the SLAL Canada Branch will transfer once certain conditions to completion, including regulatory approval, are fulfilled. The assets and liabilities of the Canadian business held for sale at 31 December 2014 are as follows:
Financial instruments Other
Designated as at fair value
through profit or loss
Held for trading
Available-for-sale
Loans and receivables
Other Total 2014 Notes £m £m £m £m £m £m
Assets of operations held for sale
Intangible assets - - - - 13 13
Deferred acquisition costs - - - - 115 115
Investments in associates and joint ventures 33 - - - 70 103
Investment property - - - - 1,417 1,417
Property, plant and equipment - - - - 31 31
Deferred tax assets 21 - - - - 54 54
Reinsurance assets - - - - 187 187
Loans - - - 2,313 - 2,313
Derivative financial assets - 44 - - - 44 Equity securities and interests in pooled investment funds
12,961 - - - - 12,961
Debt securities 10,694 - 365 - - 11,059
Receivables and other financial assets - - - 214 - 214
Other assets - - - - 34 34
Assets held for sale - - - - - -
Cash and cash equivalents 28 - - - 709 - 709
Total assets of operations held for sale 23,688 44 365 3,236 1,921 29,254
Standard Life 171
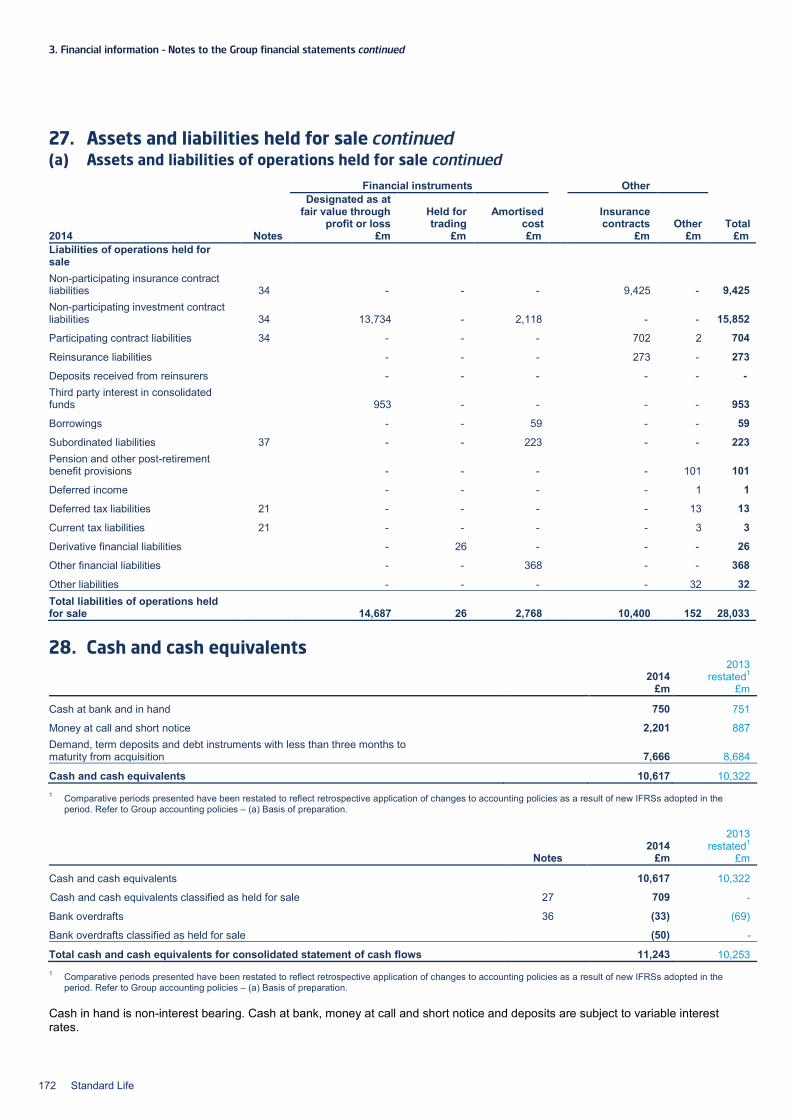
3. Financial information – Notes to the Group financial statements continued
27. Assets and liabilities held for sale continued (a) Assets and liabilities of operations held for sale continued
Financial instruments Other
Designated as at fair value through
profit or loss Held for trading
Amortised cost
Insurance contracts Other Total
2014 Notes £m £m £m £m £m £m Liabilities of operations held for sale
Non-participating insurance contract liabilities 34 - - -
9,425 - 9,425
Non-participating investment contract liabilities 34 13,734 - 2,118
- - 15,852
Participating contract liabilities 34 - - - 702 2 704
Reinsurance liabilities - - - 273 - 273
Deposits received from reinsurers - - - - - - Third party interest in consolidated funds 953 - -
- - 953
Borrowings - - 59 - - 59
Subordinated liabilities 37 - - 223 - - 223 Pension and other post-retirement benefit provisions - - -
- 101 101
Deferred income - - - - 1 1
Deferred tax liabilities 21 - - - - 13 13
Current tax liabilities 21 - - - - 3 3
Derivative financial liabilities - 26 - - - 26
Other financial liabilities - - 368 - - 368
Other liabilities - - - - 32 32 Total liabilities of operations held for sale
14,687 26 2,768
10,400 152 28,033
28. Cash and cash equivalents
2014
2013 restated1
£m £m
Cash at bank and in hand 750 751
Money at call and short notice 2,201 887 Demand, term deposits and debt instruments with less than three months to maturity from acquisition 7,666 8,684
Cash and cash equivalents 10,617 10,322 1 Comparative periods presented have been restated to reflect retrospective application of changes to accounting policies as a result of new IFRSs adopted in the
period. Refer to Group accounting policies – (a) Basis of preparation.
2014
2013 restated1
Notes £m £m
Cash and cash equivalents 10,617 10,322
Cash and cash equivalents classified as held for sale 27 709 -
Bank overdrafts 36 (33) (69)
Bank overdrafts classified as held for sale (50) -
Total cash and cash equivalents for consolidated statement of cash flows 11,243 10,253 1 Comparative periods presented have been restated to reflect retrospective application of changes to accounting policies as a result of new IFRSs adopted in the
period. Refer to Group accounting policies – (a) Basis of preparation.
Cash in hand is non-interest bearing. Cash at bank, money at call and short notice and deposits are subject to variable interest rates.
172 Standard Life
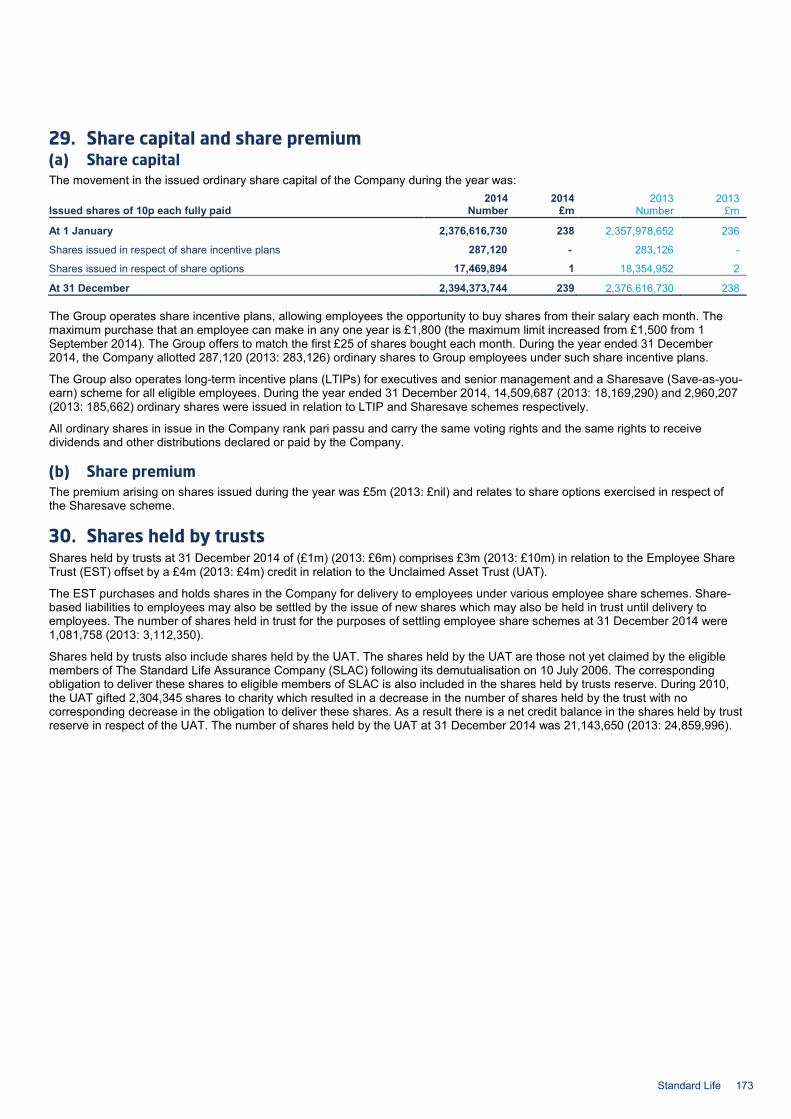
29. Share capital and share premium (a) Share capital The movement in the issued ordinary share capital of the Company during the year was:
2014 2014 2013 2013 Issued shares of 10p each fully paid Number £m Number £m
At 1 January 2,376,616,730 238 2,357,978,652 236
Shares issued in respect of share incentive plans 287,120 - 283,126 -
Shares issued in respect of share options 17,469,894 1 18,354,952 2
At 31 December 2,394,373,744 239 2,376,616,730 238
The Group operates share incentive plans, allowing employees the opportunity to buy shares from their salary each month. The maximum purchase that an employee can make in any one year is £1,800 (the maximum limit increased from £1,500 from 1 September 2014). The Group offers to match the first £25 of shares bought each month. During the year ended 31 December 2014, the Company allotted 287,120 (2013: 283,126) ordinary shares to Group employees under such share incentive plans.
The Group also operates long-term incentive plans (LTIPs) for executives and senior management and a Sharesave (Save-as-you-earn) scheme for all eligible employees. During the year ended 31 December 2014, 14,509,687 (2013: 18,169,290) and 2,960,207 (2013: 185,662) ordinary shares were issued in relation to LTIP and Sharesave schemes respectively.
All ordinary shares in issue in the Company rank pari passu and carry the same voting rights and the same rights to receive dividends and other distributions declared or paid by the Company.
(b) Share premium The premium arising on shares issued during the year was £5m (2013: £nil) and relates to share options exercised in respect of the Sharesave scheme.
30. Shares held by trusts Shares held by trusts at 31 December 2014 of (£1m) (2013: £6m) comprises £3m (2013: £10m) in relation to the Employee Share Trust (EST) offset by a £4m (2013: £4m) credit in relation to the Unclaimed Asset Trust (UAT).
The EST purchases and holds shares in the Company for delivery to employees under various employee share schemes. Share-based liabilities to employees may also be settled by the issue of new shares which may also be held in trust until delivery to employees. The number of shares held in trust for the purposes of settling employee share schemes at 31 December 2014 were 1,081,758 (2013: 3,112,350).
Shares held by trusts also include shares held by the UAT. The shares held by the UAT are those not yet claimed by the eligible members of The Standard Life Assurance Company (SLAC) following its demutualisation on 10 July 2006. The corresponding obligation to deliver these shares to eligible members of SLAC is also included in the shares held by trusts reserve. During 2010, the UAT gifted 2,304,345 shares to charity which resulted in a decrease in the number of shares held by the trust with no corresponding decrease in the obligation to deliver these shares. As a result there is a net credit balance in the shares held by trust reserve in respect of the UAT. The number of shares held by the UAT at 31 December 2014 was 21,143,650 (2013: 24,859,996).
Standard Life 173
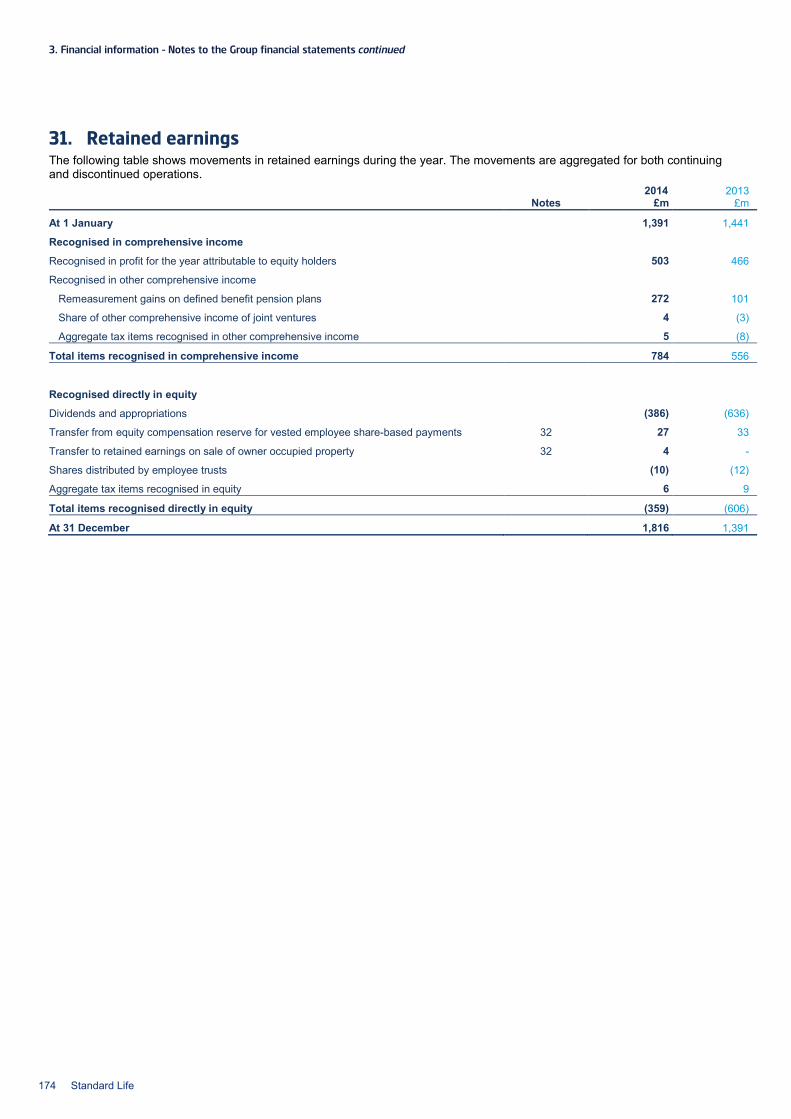
3. Financial information – Notes to the Group financial statements continued
31. Retained earnings The following table shows movements in retained earnings during the year. The movements are aggregated for both continuing and discontinued operations.
2014 2013 Notes £m £m
At 1 January 1,391 1,441
Recognised in comprehensive income
Recognised in profit for the year attributable to equity holders 503 466
Recognised in other comprehensive income
Remeasurement gains on defined benefit pension plans 272 101
Share of other comprehensive income of joint ventures 4 (3)
Aggregate tax items recognised in other comprehensive income 5 (8)
Total items recognised in comprehensive income 784 556
Recognised directly in equity
Dividends and appropriations (386) (636)
Transfer from equity compensation reserve for vested employee share-based payments 32 27 33
Transfer to retained earnings on sale of owner occupied property 32 4 -
Shares distributed by employee trusts (10) (12)
Aggregate tax items recognised in equity 6 9
Total items recognised directly in equity (359) (606)
At 31 December 1,816 1,391
174 Standard Life
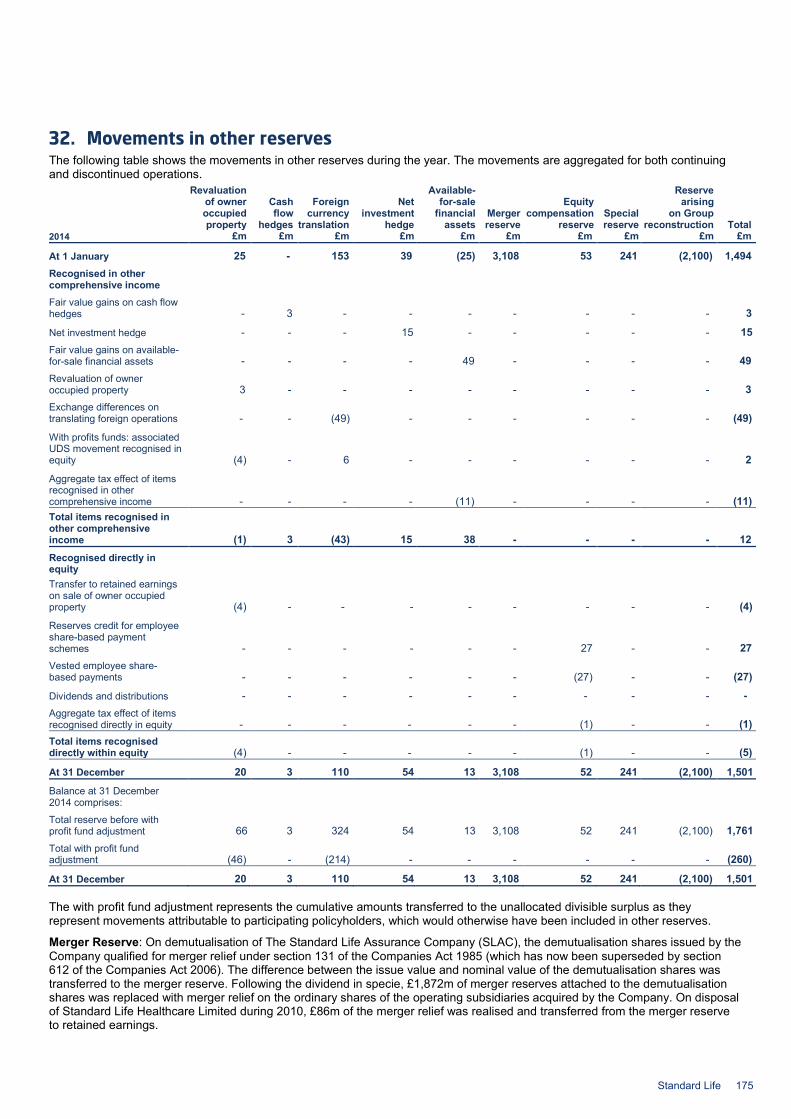
32. Movements in other reserves The following table shows the movements in other reserves during the year. The movements are aggregated for both continuing and discontinued operations.
Revaluation of owner occupied property
Cash flow
hedges
Foreign currency
translation
Net investment
hedge
Available-for-sale
financial assets
Merger reserve
Equity compensation
reserve Special reserve
Reserve arising
on Group reconstruction Total
2014 £m £m £m £m £m £m £m £m £m £m
At 1 January 25 - 153 39 (25) 3,108 53 241 (2,100) 1,494 Recognised in other comprehensive income Fair value gains on cash flow hedges - 3 - - - - - - - 3
Net investment hedge - - - 15 - - - - - 15 Fair value gains on available-for-sale financial assets - - - - 49 - - - - 49 Revaluation of owner occupied property 3 - - - - - - - - 3 Exchange differences on translating foreign operations - - (49) - - - - - - (49)
With profits funds: associated UDS movement recognised in equity (4) - 6 - - - - - - 2
Aggregate tax effect of items recognised in other comprehensive income - - - - (11) - - - - (11) Total items recognised in other comprehensive income (1) 3 (43) 15 38 - - - - 12 Recognised directly in equity Transfer to retained earnings on sale of owner occupied property (4) - - - - - - - - (4)
Reserves credit for employee share-based payment schemes - - - - - - 27 - - 27 Vested employee share-based payments - - - - - - (27) - - (27)
Dividends and distributions - - - - - - - - - - Aggregate tax effect of items recognised directly in equity - - - - - - (1) - - (1) Total items recognised directly within equity (4) - - - - - (1) - - (5)
At 31 December 20 3 110 54 13 3,108 52 241 (2,100) 1,501
Balance at 31 December 2014 comprises: Total reserve before with profit fund adjustment 66 3 324 54 13 3,108 52 241 (2,100) 1,761 Total with profit fund adjustment (46) - (214) - - - - - - (260)
At 31 December 20 3 110 54 13 3,108 52 241 (2,100) 1,501
The with profit fund adjustment represents the cumulative amounts transferred to the unallocated divisible surplus as they represent movements attributable to participating policyholders, which would otherwise have been included in other reserves.
Merger Reserve: On demutualisation of The Standard Life Assurance Company (SLAC), the demutualisation shares issued by the Company qualified for merger relief under section 131 of the Companies Act 1985 (which has now been superseded by section 612 of the Companies Act 2006). The difference between the issue value and nominal value of the demutualisation shares was transferred to the merger reserve. Following the dividend in specie, £1,872m of merger reserves attached to the demutualisation shares was replaced with merger relief on the ordinary shares of the operating subsidiaries acquired by the Company. On disposal of Standard Life Healthcare Limited during 2010, £86m of the merger relief was realised and transferred from the merger reserve to retained earnings.
Standard Life 175
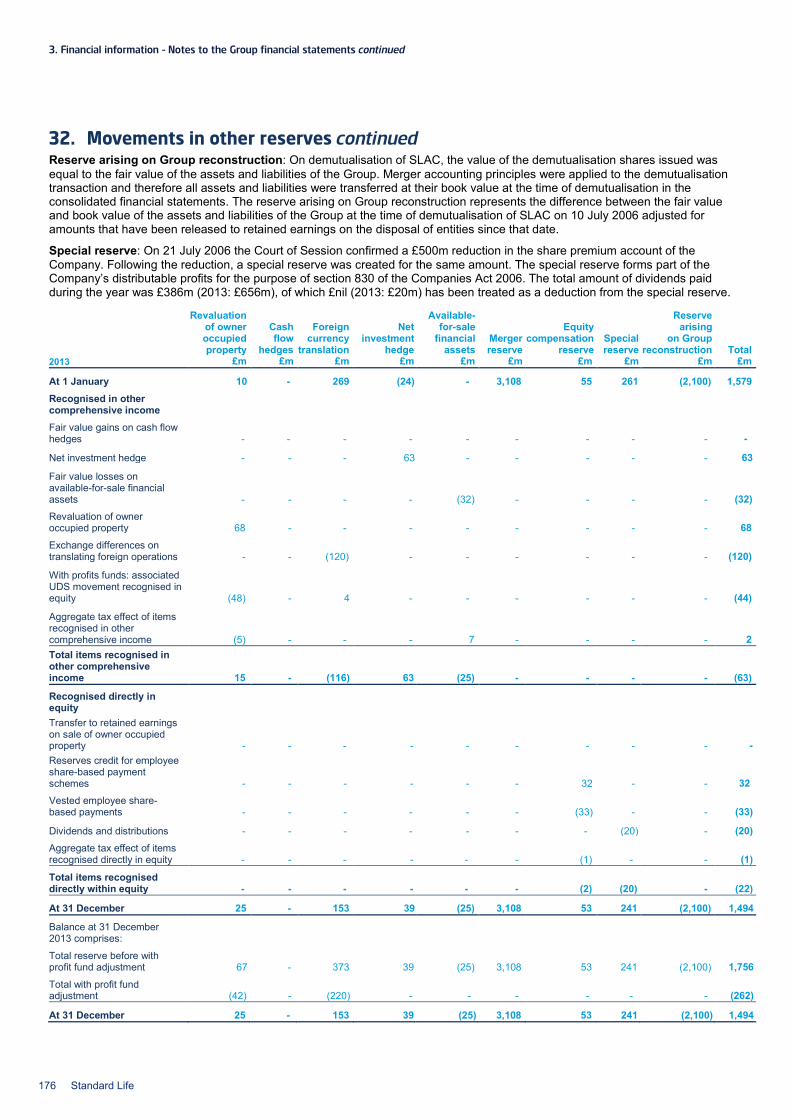
3. Financial information – Notes to the Group financial statements continued
32. Movements in other reserves continued Reserve arising on Group reconstruction: On demutualisation of SLAC, the value of the demutualisation shares issued was equal to the fair value of the assets and liabilities of the Group. Merger accounting principles were applied to the demutualisation transaction and therefore all assets and liabilities were transferred at their book value at the time of demutualisation in the consolidated financial statements. The reserve arising on Group reconstruction represents the difference between the fair value and book value of the assets and liabilities of the Group at the time of demutualisation of SLAC on 10 July 2006 adjusted for amounts that have been released to retained earnings on the disposal of entities since that date.
Special reserve: On 21 July 2006 the Court of Session confirmed a £500m reduction in the share premium account of the Company. Following the reduction, a special reserve was created for the same amount. The special reserve forms part of the Company’s distributable profits for the purpose of section 830 of the Companies Act 2006. The total amount of dividends paid during the year was £386m (2013: £656m), of which £nil (2013: £20m) has been treated as a deduction from the special reserve.
Revaluation of owner occupied property
Cash flow
hedges
Foreign currency
translation
Net investment
hedge
Available-for-sale
financial assets
Merger reserve
Equity compensation
reserve Special reserve
Reserve arising
on Group reconstruction Total
2013 £m £m £m £m £m £m £m £m £m £m
At 1 January 10 - 269 (24)) - 3,108 55 261 (2,100) 1,579 Recognised in other comprehensive income Fair value gains on cash flow hedges - - - - - - - - - -
Net investment hedge - - - 63 - - - - - 63
Fair value losses on available-for-sale financial assets - - - - (32) - - - - (32) Revaluation of owner occupied property 68 - - - - - - - - 68 Exchange differences on translating foreign operations - - (120) - - - - - - (120)
With profits funds: associated UDS movement recognised in equity (48) - 4 - - - - - - (44)
Aggregate tax effect of items recognised in other comprehensive income (5) - - - 7 - - - - 2 Total items recognised in other comprehensive income 15 - (116) 63 (25) - - - - (63)
Recognised directly in equity Transfer to retained earnings on sale of owner occupied property - - - - - - - - - - Reserves credit for employee share-based payment schemes - - - - - - 32 - - 32 Vested employee share-based payments - - - - - - (33) - - (33)
Dividends and distributions - - - - - - - (20) - (20) Aggregate tax effect of items recognised directly in equity - - - - - - (1) - - (1)
Total items recognised directly within equity - - - - - - (2) (20) - (22)
At 31 December 25 - 153 39 (25) 3,108 53 241 (2,100) 1,494
Balance at 31 December 2013 comprises: Total reserve before with profit fund adjustment 67 - 373 39 (25) 3,108 53 241 (2,100) 1,756 Total with profit fund adjustment (42) - (220) - - - - - - (262)
At 31 December 25 - 153 39 (25) 3,108 53 241 (2,100) 1,494
176 Standard Life
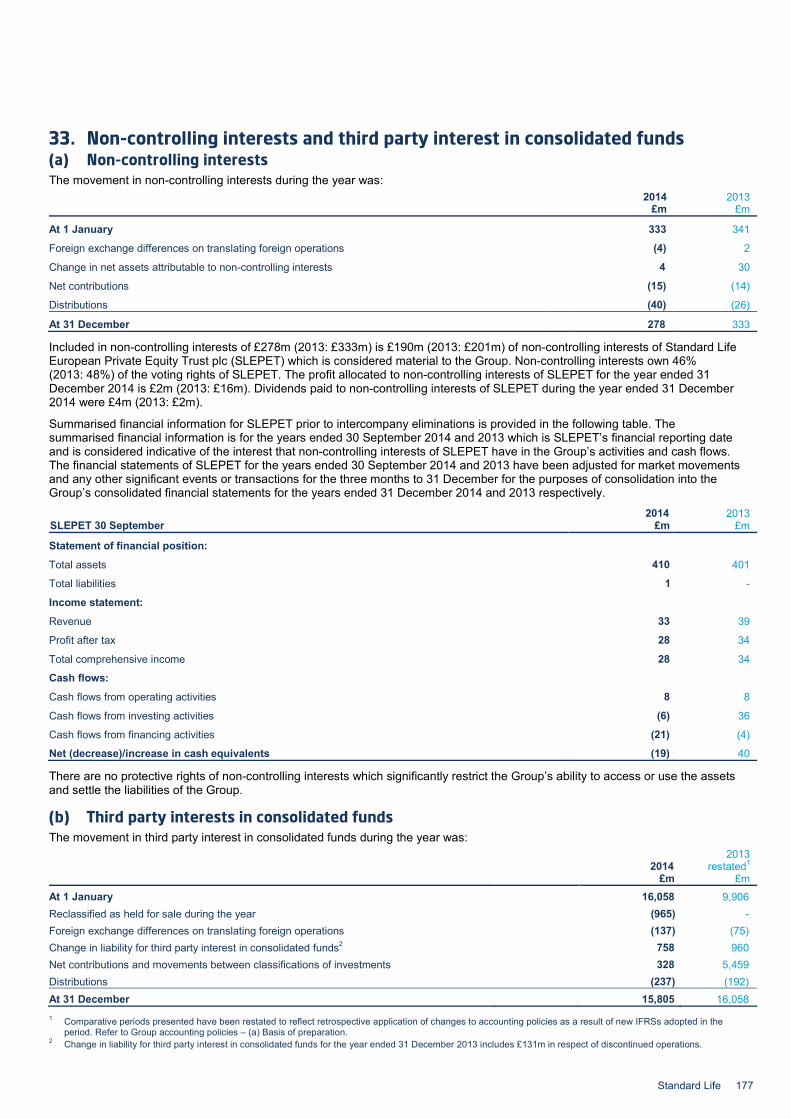
33. Non-controlling interests and third party interest in consolidated funds (a) Non-controlling interests The movement in non-controlling interests during the year was:
2014 2013 £m £m
At 1 January 333 341
Foreign exchange differences on translating foreign operations (4) 2
Change in net assets attributable to non-controlling interests 4 30
Net contributions (15) (14)
Distributions (40) (26)
At 31 December 278 333
Included in non-controlling interests of £278m (2013: £333m) is £190m (2013: £201m) of non-controlling interests of Standard Life European Private Equity Trust plc (SLEPET) which is considered material to the Group. Non-controlling interests own 46% (2013: 48%) of the voting rights of SLEPET. The profit allocated to non-controlling interests of SLEPET for the year ended 31 December 2014 is £2m (2013: £16m). Dividends paid to non-controlling interests of SLEPET during the year ended 31 December 2014 were £4m (2013: £2m).
Summarised financial information for SLEPET prior to intercompany eliminations is provided in the following table. The summarised financial information is for the years ended 30 September 2014 and 2013 which is SLEPET’s financial reporting date and is considered indicative of the interest that non-controlling interests of SLEPET have in the Group’s activities and cash flows. The financial statements of SLEPET for the years ended 30 September 2014 and 2013 have been adjusted for market movements and any other significant events or transactions for the three months to 31 December for the purposes of consolidation into the Group’s consolidated financial statements for the years ended 31 December 2014 and 2013 respectively.
2014 2013 SLEPET 30 September £m £m
Statement of financial position:
Total assets 410 401
Total liabilities 1 -
Income statement:
Revenue 33 39
Profit after tax 28 34
Total comprehensive income 28 34
Cash flows:
Cash flows from operating activities 8 8
Cash flows from investing activities (6) 36
Cash flows from financing activities (21) (4)
Net (decrease)/increase in cash equivalents (19) 40
There are no protective rights of non-controlling interests which significantly restrict the Group’s ability to access or use the assets and settle the liabilities of the Group. (b) Third party interests in consolidated funds The movement in third party interest in consolidated funds during the year was:
2014
2013 restated1
£m £m
At 1 January 16,058 9,906 Reclassified as held for sale during the year (965) - Foreign exchange differences on translating foreign operations (137) (75) Change in liability for third party interest in consolidated funds2 758 960 Net contributions and movements between classifications of investments 328 5,459 Distributions (237) (192) At 31 December 15,805 16,058 1 Comparative periods presented have been restated to reflect retrospective application of changes to accounting policies as a result of new IFRSs adopted in the
period. Refer to Group accounting policies – (a) Basis of preparation. 2 Change in liability for third party interest in consolidated funds for the year ended 31 December 2013 includes £131m in respect of discontinued operations.
Standard Life 177
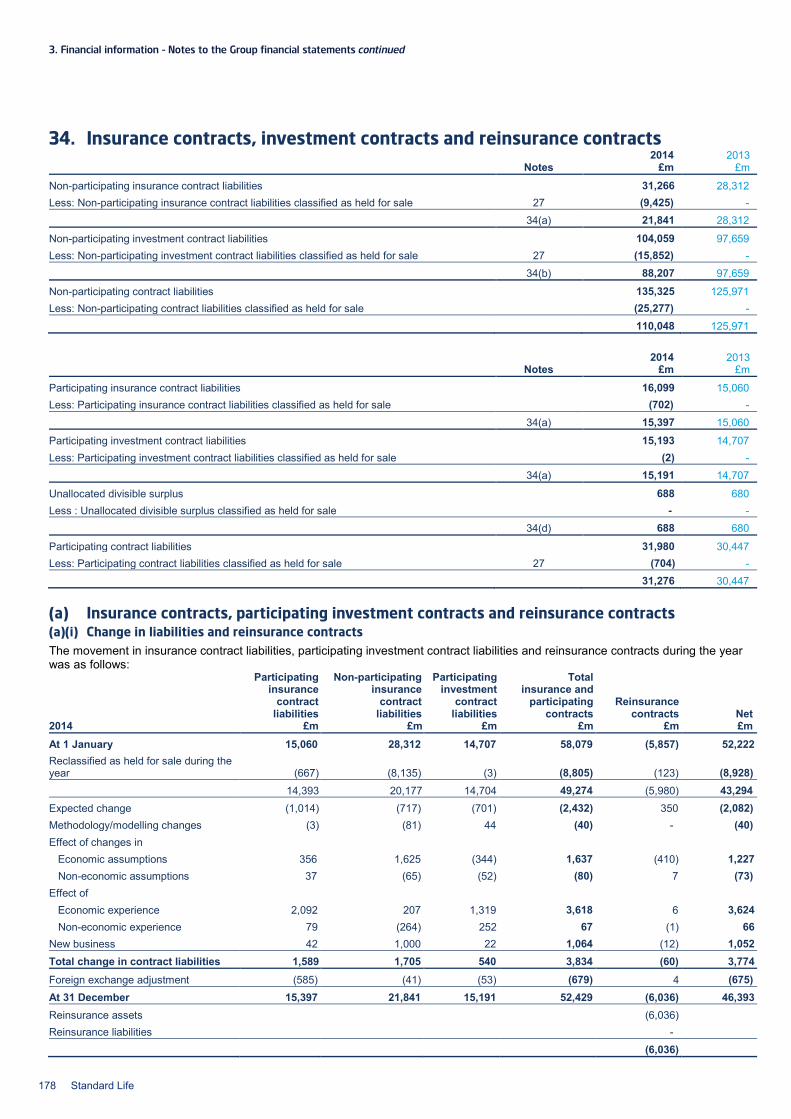
3. Financial information – Notes to the Group financial statements continued
34. Insurance contracts, investment contracts and reinsurance contracts 2014 2013 Notes £m £m
Non-participating insurance contract liabilities 31,266 28,312 Less: Non-participating insurance contract liabilities classified as held for sale 27 (9,425) - 34(a) 21,841 28,312
Non-participating investment contract liabilities 104,059 97,659 Less: Non-participating investment contract liabilities classified as held for sale 27 (15,852) - 34(b) 88,207 97,659
Non-participating contract liabilities 135,325 125,971 Less: Non-participating contract liabilities classified as held for sale (25,277) - 110,048 125,971
2014 2013 Notes £m £m
Participating insurance contract liabilities 16,099 15,060 Less: Participating insurance contract liabilities classified as held for sale (702) - 34(a) 15,397 15,060
Participating investment contract liabilities 15,193 14,707 Less: Participating investment contract liabilities classified as held for sale (2) - 34(a) 15,191 14,707
Unallocated divisible surplus 688 680 Less : Unallocated divisible surplus classified as held for sale - - 34(d) 688 680
Participating contract liabilities 31,980 30,447 Less: Participating contract liabilities classified as held for sale 27 (704) - 31,276 30,447
(a) Insurance contracts, participating investment contracts and reinsurance contracts (a)(i) Change in liabilities and reinsurance contracts The movement in insurance contract liabilities, participating investment contract liabilities and reinsurance contracts during the year was as follows:
Participating insurance
contract liabilities
Non-participating insurance
contract liabilities
Participating investment
contract liabilities
Total insurance and
participating contracts
Reinsurance contracts Net
2014 £m £m £m £m £m £m At 1 January 15,060 28,312 14,707 58,079 (5,857) 52,222 Reclassified as held for sale during the year (667) (8,135) (3) (8,805) (123) (8,928) 14,393 20,177 14,704 49,274 (5,980) 43,294 Expected change (1,014) (717) (701) (2,432) 350 (2,082) Methodology/modelling changes (3) (81) 44 (40) - (40) Effect of changes in Economic assumptions 356 1,625 (344) 1,637 (410) 1,227 Non-economic assumptions 37 (65) (52) (80) 7 (73) Effect of Economic experience 2,092 207 1,319 3,618 6 3,624 Non-economic experience 79 (264) 252 67 (1) 66 New business 42 1,000 22 1,064 (12) 1,052 Total change in contract liabilities 1,589 1,705 540 3,834 (60) 3,774 Foreign exchange adjustment (585) (41) (53) (679) 4 (675) At 31 December 15,397 21,841 15,191 52,429 (6,036) 46,393 Reinsurance assets (6,036) Reinsurance liabilities - (6,036)
178 Standard Life
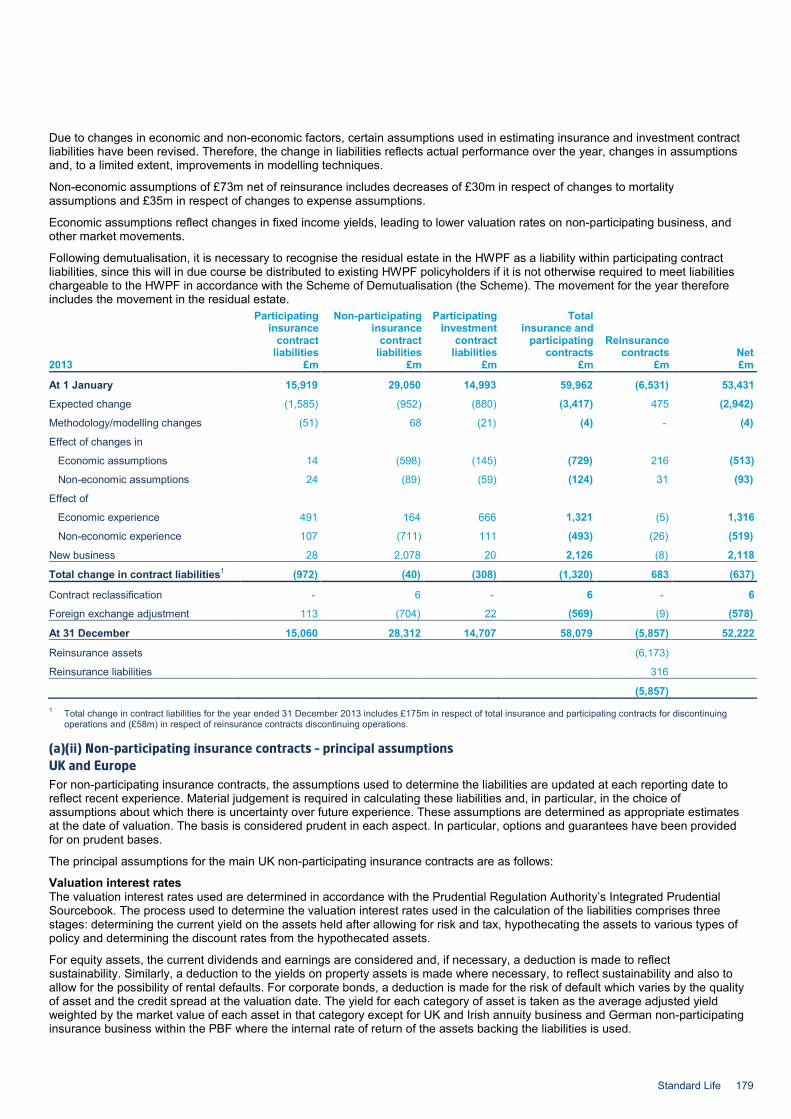
Due to changes in economic and non-economic factors, certain assumptions used in estimating insurance and investment contract liabilities have been revised. Therefore, the change in liabilities reflects actual performance over the year, changes in assumptions and, to a limited extent, improvements in modelling techniques.
Non-economic assumptions of £73m net of reinsurance includes decreases of £30m in respect of changes to mortality assumptions and £35m in respect of changes to expense assumptions.
Economic assumptions reflect changes in fixed income yields, leading to lower valuation rates on non-participating business, and other market movements.
Following demutualisation, it is necessary to recognise the residual estate in the HWPF as a liability within participating contract liabilities, since this will in due course be distributed to existing HWPF policyholders if it is not otherwise required to meet liabilities chargeable to the HWPF in accordance with the Scheme of Demutualisation (the Scheme). The movement for the year therefore includes the movement in the residual estate.
Participating insurance
contract liabilities
Non-participating insurance
contract liabilities
Participating investment
contract liabilities
Total insurance and
participating contracts
Reinsurance contracts Net
2013 £m £m £m £m £m £m
At 1 January 15,919 29,050 14,993 59,962 (6,531) 53,431
Expected change (1,585) (952) (880) (3,417) 475 (2,942)
Methodology/modelling changes (51) 68 (21) (4) - (4)
Effect of changes in
Economic assumptions 14 (598) (145) (729) 216 (513)
Non-economic assumptions 24 (89) (59) (124) 31 (93)
Effect of
Economic experience 491 164 666 1,321 (5) 1,316
Non-economic experience 107 (711) 111 (493) (26) (519)
New business 28 2,078 20 2,126 (8) 2,118
Total change in contract liabilities1 (972) (40) (308) (1,320) 683 (637)
Contract reclassification - 6 - 6 - 6
Foreign exchange adjustment 113 (704) 22 (569) (9) (578)
At 31 December 15,060 28,312 14,707 58,079 (5,857) 52,222
Reinsurance assets (6,173)
Reinsurance liabilities 316
(5,857) 1 Total change in contract liabilities for the year ended 31 December 2013 includes £175m in respect of total insurance and participating contracts for discontinuing
operations and (£58m) in respect of reinsurance contracts discontinuing operations.
(a)(ii) Non-participating insurance contracts – principal assumptions UK and Europe For non-participating insurance contracts, the assumptions used to determine the liabilities are updated at each reporting date to reflect recent experience. Material judgement is required in calculating these liabilities and, in particular, in the choice of assumptions about which there is uncertainty over future experience. These assumptions are determined as appropriate estimates at the date of valuation. The basis is considered prudent in each aspect. In particular, options and guarantees have been provided for on prudent bases.
The principal assumptions for the main UK non-participating insurance contracts are as follows:
Valuation interest rates The valuation interest rates used are determined in accordance with the Prudential Regulation Authority’s Integrated Prudential Sourcebook. The process used to determine the valuation interest rates used in the calculation of the liabilities comprises three stages: determining the current yield on the assets held after allowing for risk and tax, hypothecating the assets to various types of policy and determining the discount rates from the hypothecated assets.
For equity assets, the current dividends and earnings are considered and, if necessary, a deduction is made to reflect sustainability. Similarly, a deduction to the yields on property assets is made where necessary, to reflect sustainability and also to allow for the possibility of rental defaults. For corporate bonds, a deduction is made for the risk of default which varies by the quality of asset and the credit spread at the valuation date. The yield for each category of asset is taken as the average adjusted yield weighted by the market value of each asset in that category except for UK and Irish annuity business and German non-participating insurance business within the PBF where the internal rate of return of the assets backing the liabilities is used.
Standard Life 179
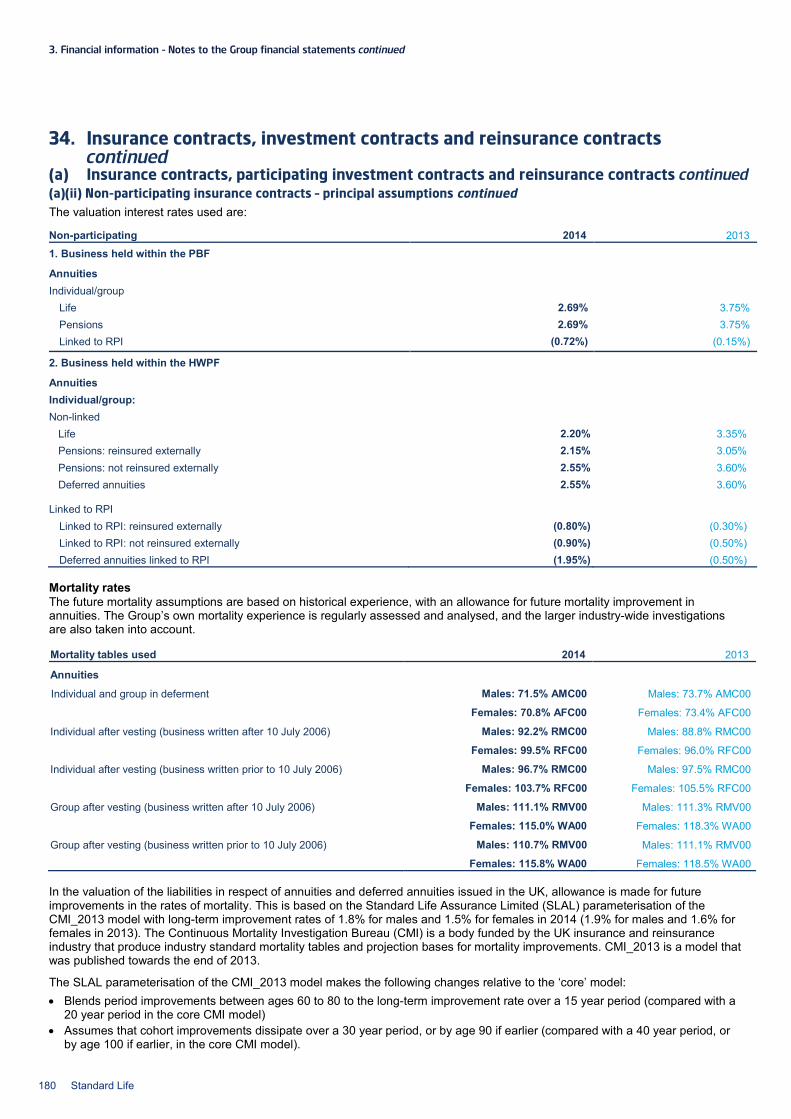
3. Financial information – Notes to the Group financial statements continued
34. Insurance contracts, investment contracts and reinsurance contracts continued
(a) Insurance contracts, participating investment contracts and reinsurance contracts continued (a)(ii) Non-participating insurance contracts – principal assumptions continued The valuation interest rates used are:
Non-participating 2014 2013
1. Business held within the PBF
Annuities Individual/group
Life 2.69% 3.75% Pensions 2.69% 3.75% Linked to RPI (0.72%) (0.15%)
2. Business held within the HWPF
Annuities Individual/group: Non-linked
Life 2.20% 3.35% Pensions: reinsured externally 2.15% 3.05% Pensions: not reinsured externally 2.55% 3.60% Deferred annuities 2.55% 3.60%
Linked to RPI Linked to RPI: reinsured externally (0.80%) (0.30%) Linked to RPI: not reinsured externally (0.90%) (0.50%) Deferred annuities linked to RPI (1.95%) (0.50%)
Mortality rates The future mortality assumptions are based on historical experience, with an allowance for future mortality improvement in annuities. The Group’s own mortality experience is regularly assessed and analysed, and the larger industry-wide investigations are also taken into account.
Mortality tables used 2014 2013
Annuities
Individual and group in deferment Males: 71.5% AMC00 Males: 73.7% AMC00
Females: 70.8% AFC00 Females: 73.4% AFC00
Individual after vesting (business written after 10 July 2006) Males: 92.2% RMC00 Males: 88.8% RMC00
Females: 99.5% RFC00 Females: 96.0% RFC00
Individual after vesting (business written prior to 10 July 2006) Males: 96.7% RMC00 Males: 97.5% RMC00
Females: 103.7% RFC00 Females: 105.5% RFC00
Group after vesting (business written after 10 July 2006) Males: 111.1% RMV00 Males: 111.3% RMV00
Females: 115.0% WA00 Females: 118.3% WA00
Group after vesting (business written prior to 10 July 2006) Males: 110.7% RMV00 Males: 111.1% RMV00
Females: 115.8% WA00 Females: 118.5% WA00
In the valuation of the liabilities in respect of annuities and deferred annuities issued in the UK, allowance is made for future improvements in the rates of mortality. This is based on the Standard Life Assurance Limited (SLAL) parameterisation of the CMI_2013 model with long-term improvement rates of 1.8% for males and 1.5% for females in 2014 (1.9% for males and 1.6% for females in 2013). The Continuous Mortality Investigation Bureau (CMI) is a body funded by the UK insurance and reinsurance industry that produce industry standard mortality tables and projection bases for mortality improvements. CMI_2013 is a model that was published towards the end of 2013.
The SLAL parameterisation of the CMI_2013 model makes the following changes relative to the ‘core’ model: • Blends period improvements between ages 60 to 80 to the long-term improvement rate over a 15 year period (compared with a
20 year period in the core CMI model) • Assumes that cohort improvements dissipate over a 30 year period, or by age 90 if earlier (compared with a 40 year period, or
by age 100 if earlier, in the core CMI model).
180 Standard Life

For contingent spouses' benefits an assumption is also made with regard to the proportions married, based on SLAL’s historic experience.
Expenses The assumptions for future policy expense levels are determined from the Group’s recent expense analyses. No allowance has been made for potential expense improvement and the costs of projects to improve expense efficiency have been ignored. The assumed future expense levels incorporate an annual inflation rate allowance of 3.61% (2013: 4.00%) for UK business derived from the expected RPI implied by current investment yields and an additional allowance for earnings inflation.
For non-participating immediate and deferred annuity contracts, an explicit allowance for maintenance expenses is included in the liabilities. An allowance for investment expenses is reflected in the valuation rate of interest.
In calculating the liabilities for unitised regular premium non-participating insurance contracts, the administration expenses are assumed to be identical to the expense charges made against each policy. Similar assumptions are made, where applicable, in respect of mortality, morbidity and the risk benefit charges made to meet such costs. Withdrawals For non-participating insurance business appropriate allowances are made for withdrawals on certain term assurance contracts.
Ireland The assumptions for business in Ireland are derived in a similar manner to those above.
Canada The liabilities of the Canadian business have been classified as held for sale at 31 December 2014. The Canadian economic environment at the reporting date is used to determine the expected interest rates for the current valuation. The expected experience scenario of risk free rates is derived from the yield curve of Canadian federal bonds at that date, as summarised below:
Yield curve – by duration 2014 2013
6 months 0.88% 0.94%
1 year 0.93% 0.97%
2 years 0.91% 1.11%
3 years 1.00% 1.37%
5 years 1.29% 2.04%
7 years 1.41% 2.41%
10 years 1.74% 2.87%
20 years 2.16% 3.15%
30 years 2.29% 3.23%
The following table shows other key investment returns used in the asset and liability projections under Canadian Asset Liability Method (CALM):
Investment returns 2014 2013
Equity securities 7.05% 6.94%
Property 6.93% 6.72%
These investment returns are net of investment expenses and are prudent assumptions as they include risk margins determined in line with Canadian standards of practice. A further drop in the asset values of 30% for equity securities and 20% for property is applied, consistent with Canadian standards of practice, to allow for adverse deviations in projecting cash flows arising from capital gains on non-fixed income assets.
Standard Life 181
3. Financial information – Notes to the Group financial statements continued
34. Insurance contracts, investment contracts and reinsurance contracts continued
(a) Insurance contracts, participating investment contracts and reinsurance contracts continued (a)(ii) Non-participating insurance contracts – principal assumptions continued
Mortality tables used 2014 2013 1. Assurances Perspecta Universal Life and Term Life 65%-121% of base table (where base
table is 67-72% of CIA 97-04) internally developed projection scale CAN1921-2004 M/F (2015)
65%-121% of base table (where base table is 71-75% of CIA 97-04)
internally developed projection scale CAN1921-2004 M/F (2014)
Participating and non-participating life, closed to new business 66%-94% of CIA 97-04 72%-99% of CIA 97-04
internally developed projection scale CAN1921-2004 M/F (2015)
internally developed projection scale CAN1921-2004 M/F (2014)
2. Annuities
Individual after vesting 16%-100% of IAM83M/IAM83F 20%-101% of IAM83M/IAM83F
internally developed projection scale CAN1921-2004 M/F (2015)
internally developed projection scale CAN1921-2004 M/F (2014)
Group after vesting 80%-100% of GAM94M/GAM94F 82%-100% of GAM94M/GAM94F
internally developed projection scale CAN1921-2004 M/F (2015)
internally developed projection scale CAN1921-2004 M/F (2014)
Mortality assumptions are derived from studies performed during 2014, with data to 2013, using a blend of industry and The Standard Life Assurance Company of Canada’s (SLCC) experience. The rates are expressed as a percentage per the tables shown. For assurance business, the percentages vary depending on the underwriting classification and the duration of the contracts. For annuity business, the percentages vary depending on the gender of the annuitant.
(a)(iii) Present value of future profits on non-participating contracts in the Heritage With Profits Fund The HWPF was established as part of the demutualisation transaction on 10 July 2006. Under the Scheme certain non-participating contracts were transferred to the HWPF. The present value of future profits (PVFP) on these non-participating contracts can be apportioned between the component related to contracts whose future cash flows under the Scheme are expected to be transferred out of the HWPF to equity holders, and the component related to contracts whose future cash flows will remain in the HWPF, to be applied either to meet amounts that may be charged to the HWPF under the Scheme or distributed over time as enhancements to final bonuses payable on the remaining policies invested in the fund.
These components are apportioned in arriving at the amount of participating contract liabilities and unallocated divisible surplus as follows: 2014 2013 £m £m
Participating contract liabilities before apportionment 31,216 29,660
Apportionment of non-participating PVFP 76 107
31,292 29,767
Participating insurance contracts 16,099 15,060
Participating investment contracts 15,193 14,707
Participating contract liabilities after apportionment 31,292 29,767
Unallocated divisible surplus before apportionment 1,712 1,776
Apportionment of non-participating PVFP (1,024) (1,096)
Unallocated divisible surplus after apportionment 688 680
182 Standard Life
Assumptions used in the calculation of the present value of future profits on non-participating insurance and investment contracts were as follows: Economic assumptions
2014 2013
Risk discount rate 3.06% - 3.27% 4.21% - 4.38%
Investment returns
Equity securities 1.86% 3.01%
Property 1.86% 3.01%
Fixed interest – annuity/protection 2.07% 3.18%
Fixed interest – other business 1.86% 3.01%
Expense inflation 3.61% 4.00%
The table above shows the changes in the basis between 2013 and 2014. The risk discount rates are calculated on a market consistent basis and are set equal to the risk free rate plus a margin to allow for the non-market risks inherent in the cash flows being discounted.
The investment returns are the risk free rate of returns that are used to value the non-participating business on a market consistent basis.
Non-economic assumptions The expense and mortality assumptions are best estimate assumptions determined from the Group’s recent analyses. They are consistent with the assumptions for non-participating insurance contracts and any explicit margins for prudence are removed.
A withdrawal investigation is carried out each year and assumptions are set with reference to recent levels taking into account any trends evident. However, in general the participating business is not particularly sensitive to the overall level of withdrawals. For non-participating insurance business, appropriate allowances are made for withdrawals on certain term assurance contracts.
(b) Non-participating investment contracts The change in non-participating investment contract liabilities was as follows: 2014 2013 Notes £m £m
At 1 January 97,659 84,201
Reclassified as held for sale during the year (15,097) -
Contributions 11,261 13,740
Initial charges and reduced allocations (3) (4)
Account balances paid on surrender and other terminations in the year (10,230) (10,498) Change in non-participating investment contracts recognised in the consolidated income statement 5,362 11,892
Foreign exchange adjustment (306) (1,243)
Contract reclassification - (6)
Recurring management charges (439) (423)
At 31 December 35 88,207 97,659 1 Change in non-participating investment contracts recognised in the consolidated income statement includes £1,845m in respect of discontinued operations.
(c) Expected settlement and recovery An indication of the term to contracted maturity/repricing date for insurance and investment contract liabilities is given in Note 42 – Risk management. Reinsurance contracts are generally structured to match liabilities on a class of business basis. This has a mixture of terms. The reinsurance assets are therefore broadly expected to be realised in line with the settlement of liabilities (as per the terms of the particular treaty) within a reinsured class of business.
Standard Life 183
3. Financial information – Notes to the Group financial statements continued
34. Insurance contracts, investment contracts and reinsurance contracts continued
(d) Movement in components of unallocated divisible surplus (UDS) The movement in UDS was as follows: 2014 2013 £m £m
At 1 January 680 706
Change in UDS recognised in the consolidated income statement (71) (40)
Change in UDS not recognised in the consolidated income statement (2) 44
Foreign exchange adjustment 81 (30)
At 31 December 688 680
35. Financial liabilities
Designated as at fair value through
profit or loss Held for trading
Net investment
hedge
Financial liabilities
measured at amortised cost Total
2014 Notes £m £m £m £m £m Non-participating investment contract liabilities 42 88,203 - - 4 88,207
Deposits received from reinsurers 42 - - - 5,642 5,642
Third party interest in consolidated funds 42 15,805 - - - 15,805
Borrowings 36 - - - 44 44
Subordinated liabilities 37 - - - 1,612 1,612
Derivative financial liabilities 24 - 1,681 12 - 1,693
Other financial liabilities 40 3 - - 3,687 3,690
Total 104,011 1,681 12 10,989 116,693
Designated as at fair value through
profit or loss Held for trading
Net investment
hedge
Financial liabilities
measured at amortised cost Total
2013 (restated)1 Notes £m £m £m £m £m Non-participating investment contract liabilities 42 95,267 - - 2,392 97,659
Deposits received from reinsurers 42 - - - 5,589 5,589
Third party interest in consolidated funds 42 16,058 - - - 16,058
Borrowings 36 - - - 95 95
Subordinated liabilities 37 - - - 1,861 1,861
Derivative financial liabilities 24 - 932 - - 932
Other financial liabilities 40 15 - - 2,495 2,510
Total 111,340 932 - 12,432 124,704 1 Comparative periods presented have been restated to reflect retrospective application of changes to accounting policies as a result of new IFRSs adopted in the
period. Refer to Group accounting policies – (a) Basis of preparation.
36. Borrowings 2014 2013 Notes £m £m
Bank overdrafts 28 33 69
Other 11 26
Borrowings 42 44 95
The amount of borrowings expected to be settled after more than 12 months is £8m (2013: £23m). Included within bank overdrafts of £33m (2013: £69m) is £nil (2013: £26m) relating to unpresented cheques.
184 Standard Life
37. Subordinated liabilities 2014 2013 Principal
amount Carrying
value Principal amount
Carrying value
Notes £m £m
Subordinated notes 5.5% Sterling fixed rate due 4 December 2042 £500,000,000 499 £500,000,000 499 3.938% Canadian dollar fixed/floating rate due 21 September 2022 CA$400,000,000 223 CA$400,000,000 229
Subordinated guaranteed bonds 6.75% Sterling fixed rate perpetual £500,000,000 502 £500,000,000 502
Mutual Assurance Capital Securities 6.546% Sterling fixed rate perpetual £300,000,000 317 £300,000,000 316 5.314% Euro fixed/floating rate perpetual €360,000,000 294 €360,000,000 315
Subordinated liabilities 1,835 1,861
Less: Subordinated liabilities classified as held for sale 3.938% Canadian dollar fixed/floating rate due 21 September 2022 27 CA$400,000,000 (223) - - Total subordinated liabilities 42 1,612 1,861
The difference between the fair value and carrying value of the subordinated liabilities is presented in Note 44 – Fair value of assets and liabilities.
Subordinated liabilities are considered current if the contractual repricing or maturity dates are within one year. On 6 January 2015 the Company redeemed in full the 5.314% Euro fixed/floating rate perpetual Mutual Assurance Capital Securities at their outstanding principal amount of €360,000,000. Accrued interest of £15m relating to these securities was also settled. The principal amount of all other subordinated liabilities is expected to be settled after more than 12 months. The accrued interest on the remaining subordinated liabilities, which are not classified as held for sale, of £37m (2013: £56m) is expected to be settled within 12 months.
The classification of amounts due under the subordinated guaranteed bonds and Mutual Assurance Capital Securities are determined by the interaction of these arrangements with the internal subordinated loan note issued by Standard Life Assurance Limited (SLAL) to the Company, as set out below.
Subordinated notes The Sterling subordinated notes were issued by the Company on 4 December 2012 pursuant to its EUR3,000,000,000 Euro Medium Term Note Programme dated 10 May 2012. The maturity date of the notes is 4 December 2042. Interest is payable each six months in arrears. The Company has the option to redeem the notes at par on 4 December 2022 and on every interest payment date thereafter until maturity. If the notes are not redeemed the interest rate payable will be reset on 4 December 2022 and on each fifth anniversary thereafter to 4.85% over the five year gilt rate. The notes are direct, unsecured obligations of the Company that rank subordinate to all senior creditors of the Company.
The Canadian dollar subordinated debenture notes were issued by The Standard Life Assurance Company of Canada (SLCC) on 21 September 2012 and have been classified as held for sale at 31 December 2014. The maturity date of the notes is 21 September 2022. SLCC has the option to redeem the notes at par on or after 21 September 2017. If the notes are not redeemed the interest rate payable will be reset each quarter to 2.1% over the three month Canadian Dealer Offered Rate (CDOR) rate payable quarterly in arrears. Interest is payable each six months in arrears up to 21 September 2017. The notes are direct, unsecured obligations of SLCC that rank subordinate to all policyholder liabilities and senior creditors of SLCC.
Subordinated guaranteed bonds The subordinated guaranteed bonds were issued on 12 July 2002. The payment of principal and interest in respect of the bonds has been irrevocably and unconditionally guaranteed by SLAL. The claims of the bondholders to payment under the guarantee will rank below the claims of all senior creditors of SLAL including policyholders.
The bonds are perpetual securities and as such have no fixed redemption date. However, the bonds are redeemable at par at the option of the Company on 12 July 2027 and on every fifth anniversary thereafter. If the bonds are not redeemed on 12 July 2027, the interest rate payable will be reset to 2.85% over the gross redemption yield on the appropriate five year benchmark gilt on the reset date. The Company can elect to defer the payment of interest on the bonds. Interest will accrue on any interest deferred at the then current rate of interest on the bonds. Any interest deferred becomes immediately due and payable on: the date of declaration or payment of dividends, interest or other payment in respect of any pari passu ranking securities or securities that rank junior to the bonds; the date any of the securities are purchased by the Company, SLAL or a subsidiary of the Company; the date fixed for any payment under a guarantee that ranks junior to the bonds; the date of any redemption or purchase of bonds; or the commencement of winding up of the Company or SLAL.
Mutual Assurance Capital Securities (MACS) The MACS were issued on 4 November 2004. The payment of principal and interest in respect of the MACS is irrevocably and unconditionally guaranteed by SLAL. The claims of the holders of the MACS to payment under the guarantee will rank below the
Standard Life 185
3. Financial information – Notes to the Group financial statements continued
37. Subordinated liabilities continued claims of all senior creditors of SLAL including policyholders. The MACS are perpetual securities and as such have no fixed redemption date. The Sterling denominated MACS started accruing interest from 4 November 2004 and bear interest at a rate of 6.546% per annum payable annually in arrears on 6 January each year, commencing on 6 January 2006. The Euro denominated MACS started accruing interest from 4 November 2004 and bear interest at a rate of 5.314% per annum payable annually in arrears on 6 January, commencing on 6 January 2006.
The payment of interest can be deferred at the option of the Company on an interest payment date and is mandatorily deferred on any interest payment date on which the Company does not satisfy certain specified solvency conditions. SLAL has corresponding mandatory deferral rights in relation to payments under the guarantee. Any interest deferred becomes immediately due and payable on the date the payment of interest is resumed by the Company or SLAL, the date fixed for the redemption or purchase of MACS by the Company, the commencement of winding up of the Company or the date of any declaration or payment of securities that rank junior to MACS or the date any of these junior securities are purchased by the Company, SLAL or a subsidiary of the Company.
The obligation to pay any deferred interest must be satisfied with cash raised from the issue of ordinary shares or the sale of treasury shares.
Internal subordinated loan note SLAL issued a subordinated loan note to the Company on 10 July 2006. The loan note at all times ranks senior to ordinary share capital and junior to Innovative Tier 1 capital of SLAL. There is no fixed redemption date for the note, but interest payments cannot be deferred and must be paid on the date they become due and payable. The note is ranked junior to the subordinated guaranteed bonds and MACS, therefore any interest deferred on the Sterling guaranteed bonds or MACS becomes immediately due and payable on the date of interest payment in respect of the note. This removes the discretionary nature of the interest payments on the Sterling guaranteed bonds and MACS.
38. Pension and other post-retirement benefit provisions The Group operates post-retirement defined benefit and defined contribution plans for staff employed by the Group.
As a result of the agreement announced by the Group on 3 September 2014 to sell its Canadian business, the Group will no longer operate a defined benefit and defined contribution plan for employees in Canada. All assets and liabilities relating to the defined benefit plan have been included in the sale and reclassified as held for sale for the year ended 31 December 2014.
In December 2014, following a consultation with employees, the Group announced that the UK staff defined benefit pension plan would be closed to future accrual effective April 2016. From April 2016, all UK employees will accrue a pension through an enhanced defined contribution plan.
The Trustees of the UK defined benefit plan set the investment strategy to protect the funding ratio of the Trustees’ funding position. The funding position is a Trustee measure that reflects the amount of assets required to pay future benefits and it is this position that determines contributions that the Group pays into the plan. Whilst the IAS 19 surplus of the UK scheme has increased significantly over 2014 the funding ratio has remained comparatively stable.
Defined benefit Defined contribution UK The Group’s largest defined benefit plan is for employees in the UK. It closed to new
entrants in November 2004 and changed from a final salary basis to a revalued career average salary basis in 2008. Employees will stop accruing further defined benefit pension under the plan from April 2016.
The plan is governed by a trustee board which comprises both employer and employee nominated trustees and an independent trustee. The plan is subject to the statutory funding objective requirements of the Pensions Act 2004. The objective requires that the plan is funded to at least the level of its technical provisions (an actuarial estimate of the assets needed to provide for benefits already built-up under the plan). The Trustees perform regular valuations to check that the statutory funding objective continues to be met.
The trustees, after consulting with the employer, prepare statements of funding and investment principles and, based on the funding valuation, set out future contributions in a schedule of contributions including a recovery plan, if needed, to restore funding to the level of the technical provisions. No recovery plan is currently required.
At the 31 December 2010 triennial actuarial valuation the plan was 102% funded on the Trustees’ technical provisions basis. The 31 December 2013 triennial valuation is ongoing and is expected to conclude in early 2015.
The 2014 administration expenses of this plan were met by the Group.
The Group currently contributes 9% of pensionable salary to each employee’s plan.
In December 2014 the Group announced that the contribution rate will be increased in April 2016 to 12% plus a further employer contribution (matching employee contributions) of up to 4%. Separate arrangements exist for some employees e.g. those in the executive job family.
All UK employees will be offered membership of the plan from April 2016 – including those currently in the defined benefit plan.
The Group has no further payment obligation once the contributions are paid.
186 Standard Life
Defined benefit Defined contribution Other The defined benefit plan for employees in Ireland has been closed to new entrants
from 31 December 2009, with future accrual from that point on a career average revalued earnings (CARE) basis.
At the last actuarial valuation effective 1 January 2013 the plan was 99% funded on an ongoing basis. The effective date of the next valuation is 1 January 2016.
The Group also operates a small unfunded defined benefit plan for employees in Germany.
The Group contributes 9% of members’ pensionable salaries to a group flexible retirement plan. The Group has no further payment obligation once the contributions are paid.
Canada
The defined benefit pension plan for employees in Canada closed to new entrants on 31 December 2013 but remains open to future accrual, providing a pension based on final average earnings and years of service.
The last actuarial valuation of the plan was effective 31 December 2013, at which time the plan was 113% funded on an ongoing basis.
Additional unfunded pension and post-retirement medical benefits are also provided to senior employees.
The Group pays contributions based on a member’s age and years of service to privately administered plans. The Group has no further payment obligation once the contributions are paid.
Plan regulations The plans are administered according to local regulations in each country. Responsibility for the governance of the plans rests with the relevant trustee boards (or equivalent). Trustee boards comprise a mixture of company nominated, member nominated and independent representatives.
Contributions to plans Defined benefit Defined contribution 2014 2013 2014 2013 £m £m £m £m
UK 37 39 14 10
Other 1 2 1 1
Canada 9 10 3 4
Expected contributions to the plans in 2015 are as follows: Defined
benefit Defined
contribution 2015 2015 £m £m
UK 3 22
Other 1 1 (a) Analysis of amounts recognised in the consolidated income statement The amounts recognised in the consolidated income statement for defined contribution and defined benefit plans are as follows:
2014
2013 restated1
Notes £m £m
Current service cost (60) (55)
Interest income 21 19
Past service cost and losses on settlements - -
Expense recognised in the consolidated income statement 8 (39) (36) 1 Comparative periods presented have been restated to reflect classification in the current year of the Group’s Canadian business as discontinued operations. Refer to
Note 12 – Discontinued operations.
Contributions made to defined contribution plans are included within current service cost, with the balance attributed to the Group’s defined benefit plans.
Standard Life 187
3. Financial information – Notes to the Group financial statements continued
38. Pension and other post-retirement benefit provisions continued (b) Analysis of amounts recognised in the consolidated statement of financial position
2014 2013
UK Other Total Canada1 UK Other Canada Total
£m £m £m £m £m £m £m £m
Present value of funded obligation (2,816) (98) (2,914) (242) (2,327) (76) (209) (2,612)
Present value of unfunded obligation - (8) (8) (73) - (7) (64) (71)
Fair value of plan assets 3,990 62 4,052 214 2,992 60 192 3,244
Effect of limit on plan surplus (414) - (414) - (233) - - (233)
Net asset/(liability) 760 (44) 716 (101) 432 (23) (81) 328 1 The net liability for the Canada plan has been classified as held for sale at 31 December 2014.
The UK plan surplus is considered to be recoverable as a right to a refund exists. The surplus has been reduced by 35% to reflect an authorised surplus payments charge that would arise on a refund and an additional small deferred tax adjustment.
(c) Movement in the net defined benefit asset
Present value of
obligation Fair value of plan assets Total
Effect of limit on plan
surpluses Total 2014 £m £m £m £m £m At 1 January (2,683) 3,244 561 (233) 328
Reclassified as held for sale 273 (192) 81 - 81
Total expense
Current service cost (45) - (45) - (45)
Interest (expense)/income (108) 129 21 - 21 Total expense recognised in consolidated income statement (153) 129 (24) - (24)
Remeasurements Return on plan assets, excluding amounts included in interest income - 896 896 - 896
Gain from change in demographic assumptions (56) - (56) - (56)
Gain from change in financial assumptions (375) - (375) - (375)
Experience gains 8 - 8 - 8
Change in effect of limit on plan surplus - - - (181) (181) Remeasurement (losses)/gains recognised in other comprehensive income (423) 896 473 (181) 292
Exchange differences 5 (4) 1 - 1
Employer contributions - 38 38 - 38
Benefit payments 59 (59) - - -
At 31 December (2,922) 4,052 1,130 (414) 716
188 Standard Life
The following table shows the movement in the defined benefit asset for the year ended 31 December 2013:
Present value of
obligation Fair value of plan assets Total
Effect of limit on plan
surpluses Total 2013 £m £m £m £m £m At 1 January (2,500) 2,891 391 (182) 209
Current service cost (55) - (55) - (55)
Interest (expense)/income (110) 124 14 - 14 Total expense recognised in consolidated income statement1 (165) 124 (41) - (41)
Remeasurements Return on plan assets, excluding amounts included in interest expense - 248 248 - 248
Gain from change in demographic assumptions (25) - (25) - (25)
Gain from change in financial assumptions (70) - (70) - (70)
Experience gains (1) - (1) - (1)
Change in effect of limit on plan surplus - - - (51) (51) Remeasurement (losses)/gains recognised in other comprehensive income2 (96) 248 152 (51) 101
Exchange differences 21 (15) 6 - 6
Employer contributions - 51 51 - 51
Benefit payments 57 (55) 2 - 2
At 31 December (2,683) 3,244 561 (233) 328 1 Total expense includes £16m for the year ended 31 December 2013 in respect of discontinued operations. 2 Remeasurement (losses)/gains includes £31m for the year ended 31 December 2013 in respect of discontinued operations.
(d) Plan assets Investment strategy is directed by the relevant trustee boards who pursue different strategies according to the characteristics and maturity profile of each plan’s liabilities. To provide more information on the approach used to determine and measure the fair value of the plan assets, the fair value hierarchy has been used as defined in Note 44 – Fair value of assets and liabilities. Those assets which cannot be classified as level 1 have been presented together as level 2 or 3. The distribution of the fair value of the assets of the Group’s funded plans at 31 December 2014 is as follows:
UK Other Canada Total 2014 2013 2014 2013 2014 2013 2014 2013
£m £m £m £m £m £m £m £m
Assets measured at fair value based on level 1 inputs
Derivatives 38 3 - - - - 38 3
Equity securities and interests in pooled investment funds 1,220 1,405 49 51 146 134 1,415 1,590
Debt securities 1,239 442 - - - - 1,239 442
Total assets measured at fair value based on level 1 inputs 2,497 1,850 49 51 146 134 2,692 2,035
Assets measured at fair value based on level 2 or 3 inputs
Derivatives 827 321 13 9 - - 840 330
Equity securities and interests in pooled investment funds 92 54 - - - - 92 54
Debt securities 325 275 - - 59 51 384 326
Qualifying insurance policies 4 5 - - - - 4 5
Total assets measured at fair value based on level 2 or 3 inputs 1,248 655 13 9 59 51 1,320 715
Cash and cash equivalents 245 487 - - 9 7 254 494
Total 3,990 2,992 62 60 214 192 4,266 3,244
Derivative financial instruments are used to modify the profile of the assets of the plans to better match the plans’ liabilities and to execute specific strategies as defined within the plans’ investment guidelines. Derivative holdings may lead to increased or decreased exposures to the physical asset categories disclosed above.
Defined benefit plans also use pooled investment vehicles to access a variety of asset classes in an efficient way. The underlying assets of the pooled investment vehicles include, but are not limited to, equity securities, property, debt securities and absolute return portfolios.
Standard Life 189
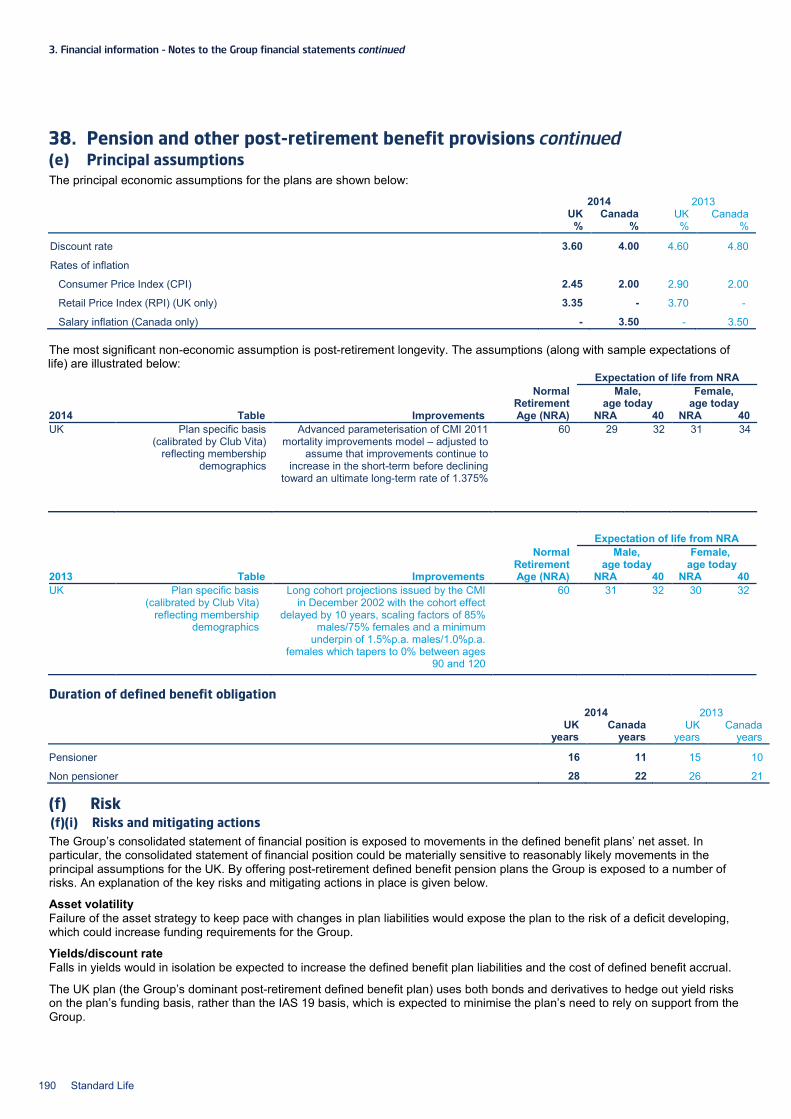
3. Financial information – Notes to the Group financial statements continued
38. Pension and other post-retirement benefit provisions continued (e) Principal assumptions The principal economic assumptions for the plans are shown below:
2014 2013
UK Canada UK Canada
% % % %
Discount rate 3.60 4.00 4.60 4.80
Rates of inflation
Consumer Price Index (CPI) 2.45 2.00 2.90 2.00
Retail Price Index (RPI) (UK only) 3.35 - 3.70 -
Salary inflation (Canada only) - 3.50 - 3.50
The most significant non-economic assumption is post-retirement longevity. The assumptions (along with sample expectations of life) are illustrated below:
Normal
Retirement Age (NRA)
Expectation of life from NRA
Male,
age today Female,
age today 2014 Table Improvements NRA 40 NRA 40 UK Plan specific basis
(calibrated by Club Vita) reflecting membership
demographics
Advanced parameterisation of CMI 2011 mortality improvements model – adjusted to
assume that improvements continue to increase in the short-term before declining
toward an ultimate long-term rate of 1.375%
60 29 32 31 34
Normal Retirement Age (NRA)
Expectation of life from NRA
Male,
age today Female,
age today 2013 Table Improvements NRA 40 NRA 40 UK Plan specific basis
(calibrated by Club Vita) reflecting membership
demographics
Long cohort projections issued by the CMI in December 2002 with the cohort effect
delayed by 10 years, scaling factors of 85% males/75% females and a minimum
underpin of 1.5%p.a. males/1.0%p.a. females which tapers to 0% between ages
90 and 120
60 31 32 30 32
Duration of defined benefit obligation 2014 2013
UK Canada UK Canada
years years years years
Pensioner 16 11 15 10
Non pensioner 28 22 26 21
(f) Risk (f)(i) Risks and mitigating actions The Group’s consolidated statement of financial position is exposed to movements in the defined benefit plans’ net asset. In particular, the consolidated statement of financial position could be materially sensitive to reasonably likely movements in the principal assumptions for the UK. By offering post-retirement defined benefit pension plans the Group is exposed to a number of risks. An explanation of the key risks and mitigating actions in place is given below.
Asset volatility Failure of the asset strategy to keep pace with changes in plan liabilities would expose the plan to the risk of a deficit developing, which could increase funding requirements for the Group.
Yields/discount rate Falls in yields would in isolation be expected to increase the defined benefit plan liabilities and the cost of defined benefit accrual.
The UK plan (the Group’s dominant post-retirement defined benefit plan) uses both bonds and derivatives to hedge out yield risks on the plan’s funding basis, rather than the IAS 19 basis, which is expected to minimise the plan’s need to rely on support from the Group.
190 Standard Life
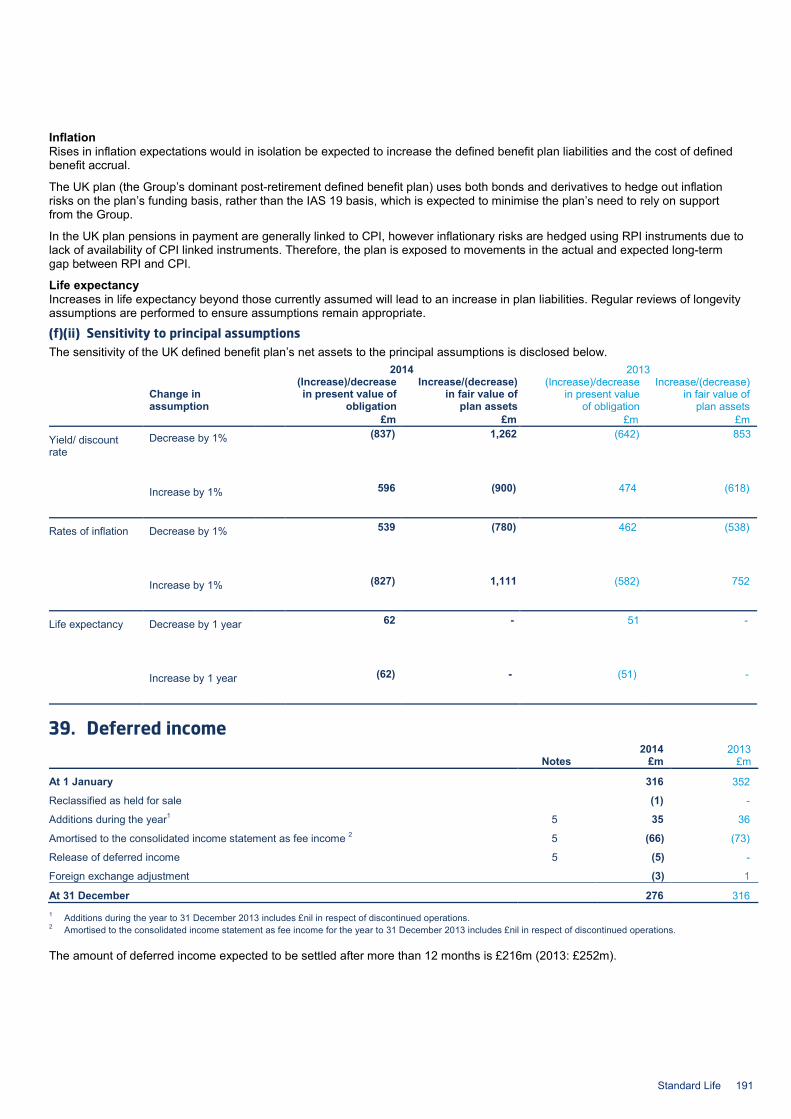
Inflation Rises in inflation expectations would in isolation be expected to increase the defined benefit plan liabilities and the cost of defined benefit accrual.
The UK plan (the Group’s dominant post-retirement defined benefit plan) uses both bonds and derivatives to hedge out inflation risks on the plan’s funding basis, rather than the IAS 19 basis, which is expected to minimise the plan’s need to rely on support from the Group.
In the UK plan pensions in payment are generally linked to CPI, however inflationary risks are hedged using RPI instruments due to lack of availability of CPI linked instruments. Therefore, the plan is exposed to movements in the actual and expected long-term gap between RPI and CPI.
Life expectancy Increases in life expectancy beyond those currently assumed will lead to an increase in plan liabilities. Regular reviews of longevity assumptions are performed to ensure assumptions remain appropriate.
(f)(ii) Sensitivity to principal assumptions The sensitivity of the UK defined benefit plan’s net assets to the principal assumptions is disclosed below. 2014 2013
Change in assumption
(Increase)/decrease in present value of
obligation
Increase/(decrease) in fair value of
plan assets
(Increase)/decrease in present value
of obligation
Increase/(decrease) in fair value of
plan assets £m £m £m £m
Yield/ discount rate
Decrease by 1% (837) 1,262 (642) 853
Increase by 1% 596 (900) 474 (618)
Rates of inflation Decrease by 1% 539 (780) 462 (538)
Increase by 1% (827) 1,111 (582) 752
Life expectancy Decrease by 1 year 62 - 51 -
Increase by 1 year (62) - (51) -
39. Deferred income 2014 2013 Notes £m £m
At 1 January 316 352
Reclassified as held for sale (1) -
Additions during the year1 5 35 36
Amortised to the consolidated income statement as fee income 2 5 (66) (73)
Release of deferred income 5 (5) -
Foreign exchange adjustment (3) 1
At 31 December 276 316 1 Additions during the year to 31 December 2013 includes £nil in respect of discontinued operations. 2 Amortised to the consolidated income statement as fee income for the year to 31 December 2013 includes £nil in respect of discontinued operations.
The amount of deferred income expected to be settled after more than 12 months is £216m (2013: £252m).
Standard Life 191
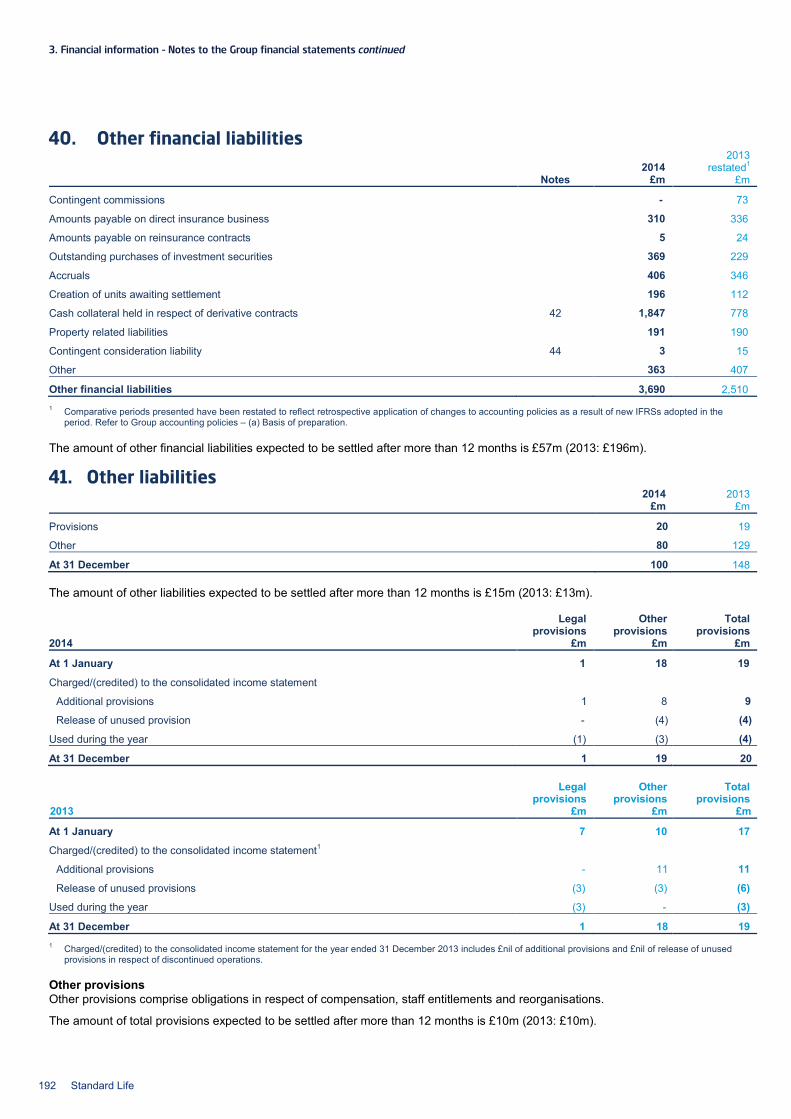
3. Financial information – Notes to the Group financial statements continued
40. Other financial liabilities 2014
2013 restated1
Notes £m £m
Contingent commissions - 73
Amounts payable on direct insurance business 310 336
Amounts payable on reinsurance contracts 5 24
Outstanding purchases of investment securities 369 229
Accruals 406 346
Creation of units awaiting settlement 196 112
Cash collateral held in respect of derivative contracts 42 1,847 778
Property related liabilities 191 190
Contingent consideration liability 44 3 15
Other 363 407
Other financial liabilities 3,690 2,510 1 Comparative periods presented have been restated to reflect retrospective application of changes to accounting policies as a result of new IFRSs adopted in the
period. Refer to Group accounting policies – (a) Basis of preparation.
The amount of other financial liabilities expected to be settled after more than 12 months is £57m (2013: £196m).
41. Other liabilities 2014 2013 £m £m
Provisions 20 19
Other 80 129
At 31 December 100 148
The amount of other liabilities expected to be settled after more than 12 months is £15m (2013: £13m).
Legal provisions
Other provisions
Total provisions
2014 £m £m £m
At 1 January 1 18 19
Charged/(credited) to the consolidated income statement
Additional provisions 1 8 9
Release of unused provision - (4) (4)
Used during the year (1) (3) (4)
At 31 December 1 19 20
Legal provisions
Other provisions
Total provisions
2013 £m £m £m
At 1 January 7 10 17
Charged/(credited) to the consolidated income statement1
Additional provisions - 11 11
Release of unused provisions (3) (3) (6)
Used during the year (3) - (3)
At 31 December 1 18 19 1 Charged/(credited) to the consolidated income statement for the year ended 31 December 2013 includes £nil of additional provisions and £nil of release of unused
provisions in respect of discontinued operations.
Other provisions Other provisions comprise obligations in respect of compensation, staff entitlements and reorganisations.
The amount of total provisions expected to be settled after more than 12 months is £10m (2013: £10m).
192 Standard Life
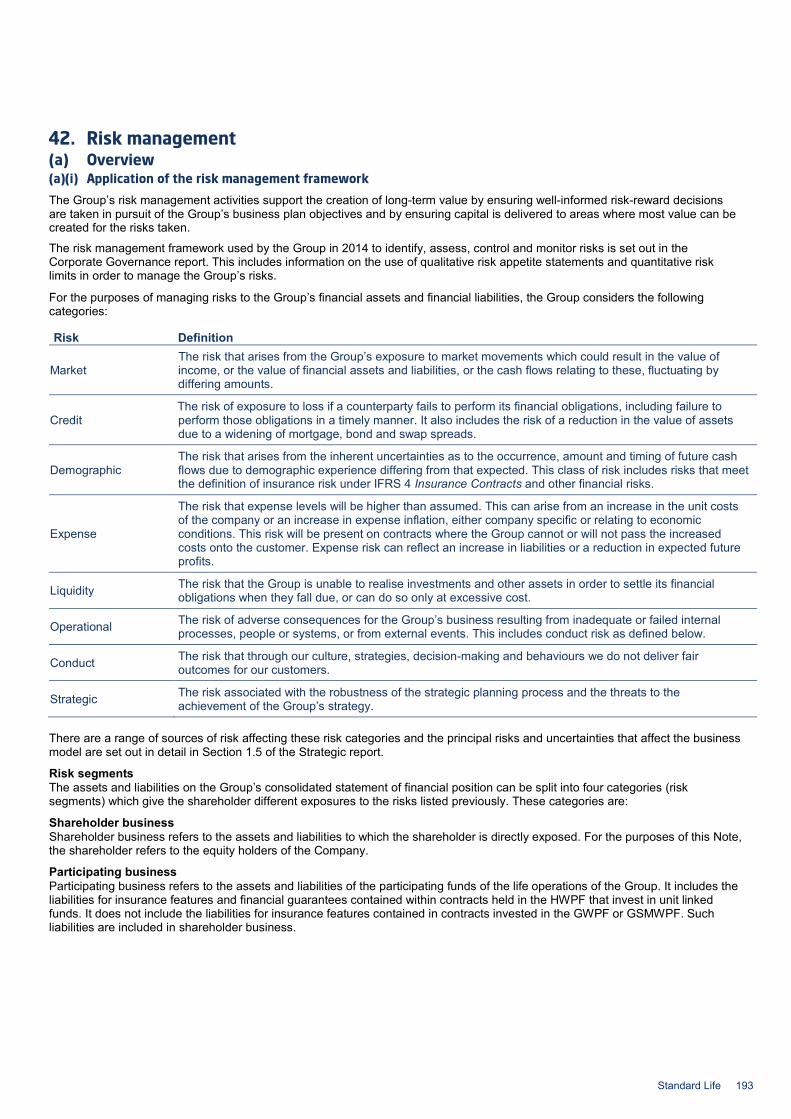
42. Risk management (a) Overview (a)(i) Application of the risk management framework
The Group’s risk management activities support the creation of long-term value by ensuring well-informed risk-reward decisions are taken in pursuit of the Group’s business plan objectives and by ensuring capital is delivered to areas where most value can be created for the risks taken.
The risk management framework used by the Group in 2014 to identify, assess, control and monitor risks is set out in the Corporate Governance report. This includes information on the use of qualitative risk appetite statements and quantitative risk limits in order to manage the Group’s risks.
For the purposes of managing risks to the Group’s financial assets and financial liabilities, the Group considers the following categories:
Risk Definition
Market The risk that arises from the Group’s exposure to market movements which could result in the value of income, or the value of financial assets and liabilities, or the cash flows relating to these, fluctuating by differing amounts.
Credit The risk of exposure to loss if a counterparty fails to perform its financial obligations, including failure to perform those obligations in a timely manner. It also includes the risk of a reduction in the value of assets due to a widening of mortgage, bond and swap spreads.
Demographic The risk that arises from the inherent uncertainties as to the occurrence, amount and timing of future cash flows due to demographic experience differing from that expected. This class of risk includes risks that meet the definition of insurance risk under IFRS 4 Insurance Contracts and other financial risks.
Expense
The risk that expense levels will be higher than assumed. This can arise from an increase in the unit costs of the company or an increase in expense inflation, either company specific or relating to economic conditions. This risk will be present on contracts where the Group cannot or will not pass the increased costs onto the customer. Expense risk can reflect an increase in liabilities or a reduction in expected future profits.
Liquidity The risk that the Group is unable to realise investments and other assets in order to settle its financial obligations when they fall due, or can do so only at excessive cost.
Operational The risk of adverse consequences for the Group’s business resulting from inadequate or failed internal processes, people or systems, or from external events. This includes conduct risk as defined below.
Conduct The risk that through our culture, strategies, decision-making and behaviours we do not deliver fair outcomes for our customers.
Strategic The risk associated with the robustness of the strategic planning process and the threats to the achievement of the Group’s strategy.
There are a range of sources of risk affecting these risk categories and the principal risks and uncertainties that affect the business model are set out in detail in Section 1.5 of the Strategic report.
Risk segments The assets and liabilities on the Group’s consolidated statement of financial position can be split into four categories (risk segments) which give the shareholder different exposures to the risks listed previously. These categories are:
Shareholder business Shareholder business refers to the assets and liabilities to which the shareholder is directly exposed. For the purposes of this Note, the shareholder refers to the equity holders of the Company.
Participating business Participating business refers to the assets and liabilities of the participating funds of the life operations of the Group. It includes the liabilities for insurance features and financial guarantees contained within contracts held in the HWPF that invest in unit linked funds. It does not include the liabilities for insurance features contained in contracts invested in the GWPF or GSMWPF. Such liabilities are included in shareholder business.
Standard Life 193
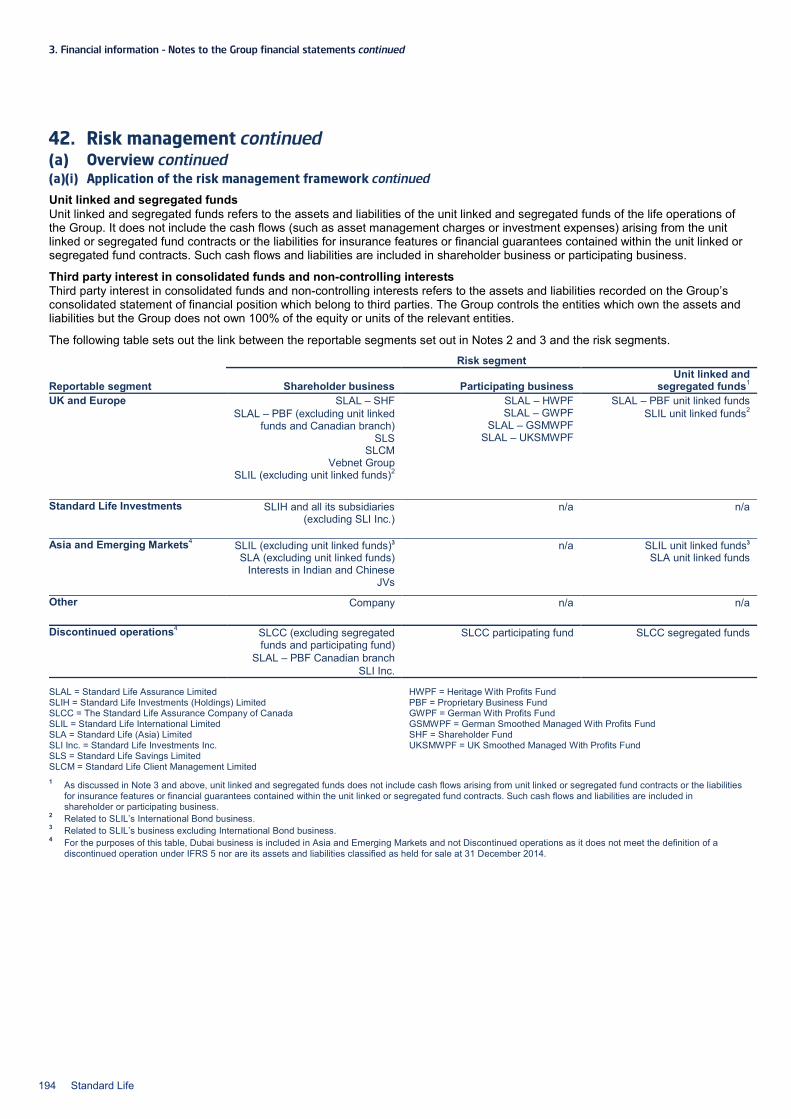
3. Financial information – Notes to the Group financial statements continued
42. Risk management continued (a) Overview continued (a)(i) Application of the risk management framework continued
Unit linked and segregated funds Unit linked and segregated funds refers to the assets and liabilities of the unit linked and segregated funds of the life operations of the Group. It does not include the cash flows (such as asset management charges or investment expenses) arising from the unit linked or segregated fund contracts or the liabilities for insurance features or financial guarantees contained within the unit linked or segregated fund contracts. Such cash flows and liabilities are included in shareholder business or participating business.
Third party interest in consolidated funds and non-controlling interests Third party interest in consolidated funds and non-controlling interests refers to the assets and liabilities recorded on the Group’s consolidated statement of financial position which belong to third parties. The Group controls the entities which own the assets and liabilities but the Group does not own 100% of the equity or units of the relevant entities.
The following table sets out the link between the reportable segments set out in Notes 2 and 3 and the risk segments.
Risk segment
Reportable segment Shareholder business Participating business Unit linked and
segregated funds1 UK and Europe SLAL – SHF
SLAL – PBF (excluding unit linked funds and Canadian branch)
SLS SLCM
Vebnet Group SLIL (excluding unit linked funds)2
SLAL – HWPF SLAL – GWPF
SLAL – GSMWPF SLAL – UKSMWPF
SLAL – PBF unit linked funds SLIL unit linked funds2
Standard Life Investments SLIH and all its subsidiaries (excluding SLI Inc.)
n/a n/a
Asia and Emerging Markets4 SLIL (excluding unit linked funds)3 SLA (excluding unit linked funds)
Interests in Indian and Chinese JVs
n/a SLIL unit linked funds3 SLA unit linked funds
Other Company n/a n/a
Discontinued operations4 SLCC (excluding segregated funds and participating fund)
SLAL – PBF Canadian branch SLI Inc.
SLCC participating fund SLCC segregated funds
SLAL = Standard Life Assurance Limited SLIH = Standard Life Investments (Holdings) Limited SLCC = The Standard Life Assurance Company of Canada SLIL = Standard Life International Limited SLA = Standard Life (Asia) Limited SLI Inc. = Standard Life Investments Inc. SLS = Standard Life Savings Limited SLCM = Standard Life Client Management Limited
HWPF = Heritage With Profits Fund PBF = Proprietary Business Fund GWPF = German With Profits Fund GSMWPF = German Smoothed Managed With Profits Fund SHF = Shareholder Fund UKSMWPF = UK Smoothed Managed With Profits Fund
1 As discussed in Note 3 and above, unit linked and segregated funds does not include cash flows arising from unit linked or segregated fund contracts or the liabilities for insurance features or financial guarantees contained within the unit linked or segregated fund contracts. Such cash flows and liabilities are included in shareholder or participating business.
2 Related to SLIL’s International Bond business. 3 Related to SLIL’s business excluding International Bond business. 4 For the purposes of this table, Dubai business is included in Asia and Emerging Markets and not Discontinued operations as it does not meet the definition of a
discontinued operation under IFRS 5 nor are its assets and liabilities classified as held for sale at 31 December 2014.
194 Standard Life
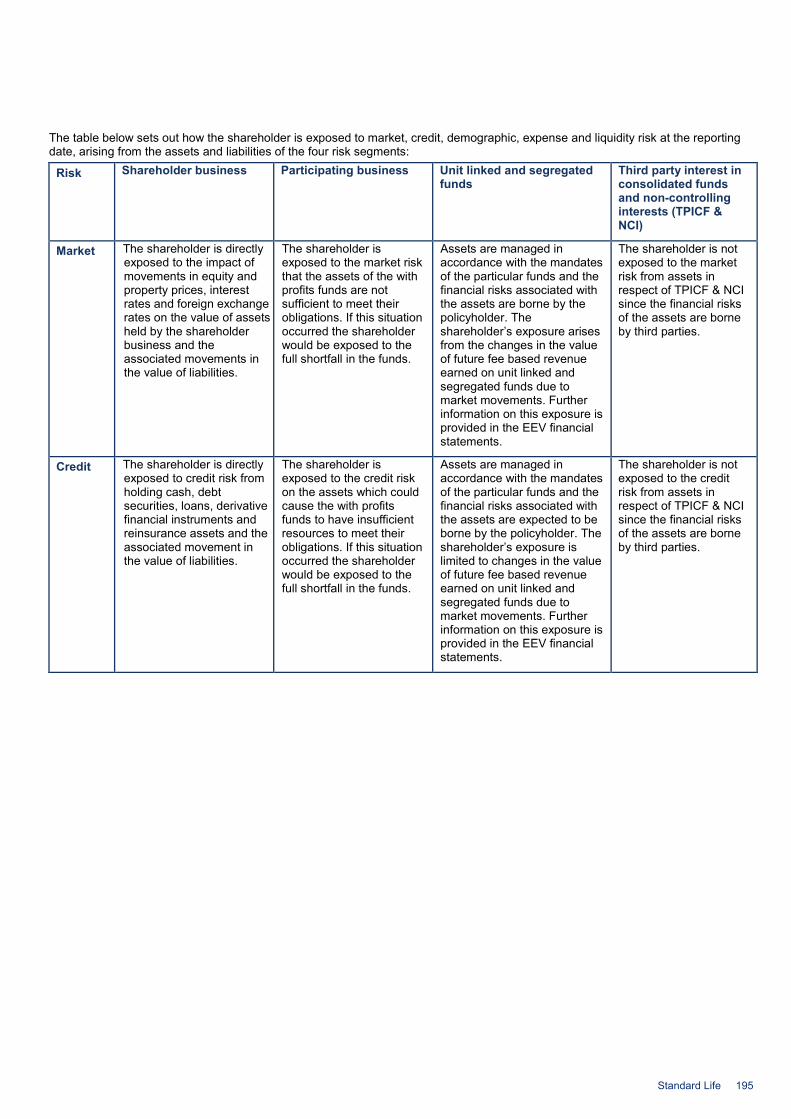
The table below sets out how the shareholder is exposed to market, credit, demographic, expense and liquidity risk at the reporting date, arising from the assets and liabilities of the four risk segments:
Risk Shareholder business Participating business Unit linked and segregated funds
Third party interest in consolidated funds and non-controlling interests (TPICF & NCI)
Market The shareholder is directly exposed to the impact of movements in equity and property prices, interest rates and foreign exchange rates on the value of assets held by the shareholder business and the associated movements in the value of liabilities.
The shareholder is exposed to the market risk that the assets of the with profits funds are not sufficient to meet their obligations. If this situation occurred the shareholder would be exposed to the full shortfall in the funds.
Assets are managed in accordance with the mandates of the particular funds and the financial risks associated with the assets are borne by the policyholder. The shareholder’s exposure arises from the changes in the value of future fee based revenue earned on unit linked and segregated funds due to market movements. Further information on this exposure is provided in the EEV financial statements.
The shareholder is not exposed to the market risk from assets in respect of TPICF & NCI since the financial risks of the assets are borne by third parties.
Credit The shareholder is directly exposed to credit risk from holding cash, debt securities, loans, derivative financial instruments and reinsurance assets and the associated movement in the value of liabilities.
The shareholder is exposed to the credit risk on the assets which could cause the with profits funds to have insufficient resources to meet their obligations. If this situation occurred the shareholder would be exposed to the full shortfall in the funds.
Assets are managed in accordance with the mandates of the particular funds and the financial risks associated with the assets are expected to be borne by the policyholder. The shareholder’s exposure is limited to changes in the value of future fee based revenue earned on unit linked and segregated funds due to market movements. Further information on this exposure is provided in the EEV financial statements.
The shareholder is not exposed to the credit risk from assets in respect of TPICF & NCI since the financial risks of the assets are borne by third parties.
Standard Life 195
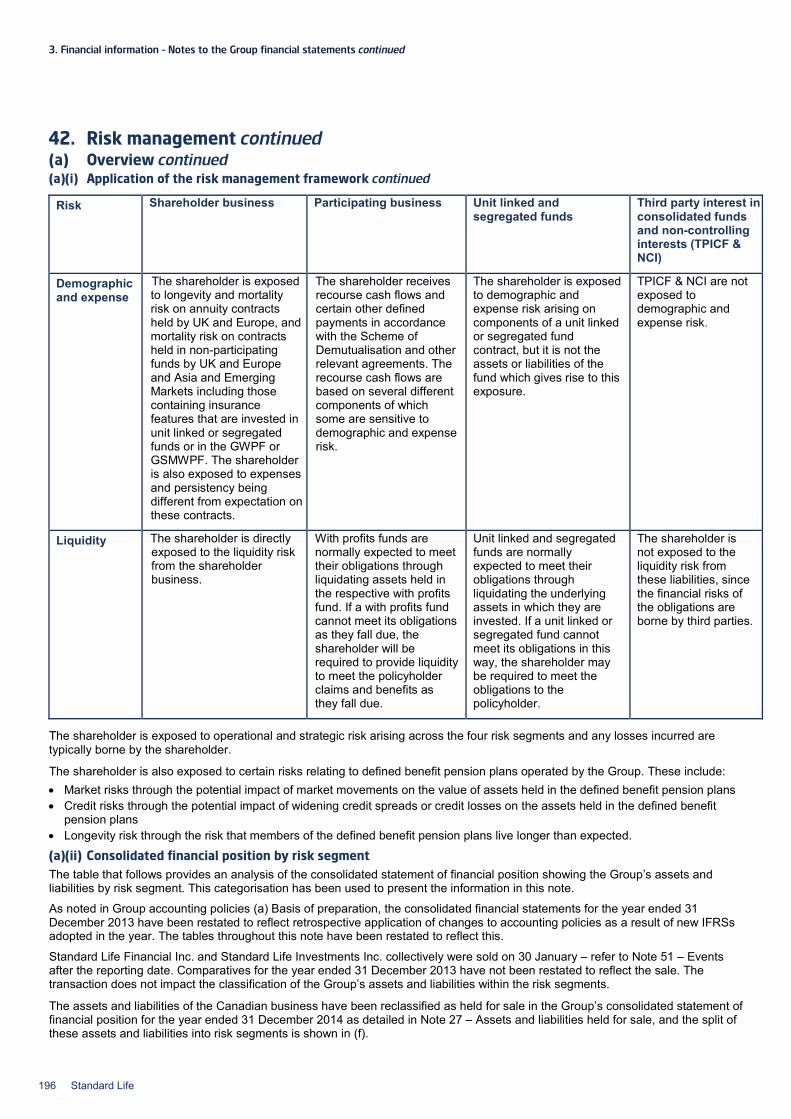
3. Financial information – Notes to the Group financial statements continued
42. Risk management continued (a) Overview continued (a)(i) Application of the risk management framework continued
Risk Shareholder business Participating business Unit linked and segregated funds
Third party interest in consolidated funds and non-controlling interests (TPICF & NCI)
Demographic and expense
The shareholder is exposed to longevity and mortality risk on annuity contracts held by UK and Europe, and mortality risk on contracts held in non-participating funds by UK and Europe and Asia and Emerging Markets including those containing insurance features that are invested in unit linked or segregated funds or in the GWPF or GSMWPF. The shareholder is also exposed to expenses and persistency being different from expectation on these contracts.
The shareholder receives recourse cash flows and certain other defined payments in accordance with the Scheme of Demutualisation and other relevant agreements. The recourse cash flows are based on several different components of which some are sensitive to demographic and expense risk.
The shareholder is exposed to demographic and expense risk arising on components of a unit linked or segregated fund contract, but it is not the assets or liabilities of the fund which gives rise to this exposure.
TPICF & NCI are not exposed to demographic and expense risk.
Liquidity The shareholder is directly exposed to the liquidity risk from the shareholder business.
With profits funds are normally expected to meet their obligations through liquidating assets held in the respective with profits fund. If a with profits fund cannot meet its obligations as they fall due, the shareholder will be required to provide liquidity to meet the policyholder claims and benefits as they fall due.
Unit linked and segregated funds are normally expected to meet their obligations through liquidating the underlying assets in which they are invested. If a unit linked or segregated fund cannot meet its obligations in this way, the shareholder may be required to meet the obligations to the policyholder.
The shareholder is not exposed to the liquidity risk from these liabilities, since the financial risks of the obligations are borne by third parties.
The shareholder is exposed to operational and strategic risk arising across the four risk segments and any losses incurred are typically borne by the shareholder.
The shareholder is also exposed to certain risks relating to defined benefit pension plans operated by the Group. These include: • Market risks through the potential impact of market movements on the value of assets held in the defined benefit pension plans • Credit risks through the potential impact of widening credit spreads or credit losses on the assets held in the defined benefit
pension plans • Longevity risk through the risk that members of the defined benefit pension plans live longer than expected.
(a)(ii) Consolidated financial position by risk segment The table that follows provides an analysis of the consolidated statement of financial position showing the Group’s assets and liabilities by risk segment. This categorisation has been used to present the information in this note.
As noted in Group accounting policies (a) Basis of preparation, the consolidated financial statements for the year ended 31 December 2013 have been restated to reflect retrospective application of changes to accounting policies as a result of new IFRSs adopted in the year. The tables throughout this note have been restated to reflect this.
Standard Life Financial Inc. and Standard Life Investments Inc. collectively were sold on 30 January – refer to Note 51 – Events after the reporting date. Comparatives for the year ended 31 December 2013 have not been restated to reflect the sale. The transaction does not impact the classification of the Group’s assets and liabilities within the risk segments.
The assets and liabilities of the Canadian business have been reclassified as held for sale in the Group’s consolidated statement of financial position for the year ended 31 December 2014 as detailed in Note 27 – Assets and liabilities held for sale, and the split of these assets and liabilities into risk segments is shown in (f).
196 Standard Life

Shareholder
business Participating
business Unit linked and
segregated funds
Third party interest in consolidated funds and non-controlling
interests Total
2014 2013 2014 2013 2014 2013 2014 2013 2014 2013
restated £m £m £m £m £m £m £m £m £m £m
Intangible assets 565 298 - 2 - - - - 565 300
Deferred acquisition costs 717 842 54 63 - - - - 771 905
Investments in associates and joint ventures 260 288 535 354 3,568 1,089 145 53 4,508 1,784
Investment property - 491 2,090 1,995 5,223 4,830 1,728 1,290 9,041 8,606
Property, plant and equipment 50 93 136 126 - - - - 186 219
Pension and other post-retirement benefit assets 760 432 - - - - - - 760 432
Deferred tax assets 33 121 - - - - - - 33 121
Reinsurance assets 47 182 5,989 5,991 - - - - 6,036 6,173
Loans 4 2,549 194 199 166 176 36 - 400 2,924
Derivative financial assets 18 111 1,649 661 1,711 832 643 387 4,021 1,991
Equity securities and interests in pooled investment funds at FVTPL 31 172 9,658 10,952 55,471 66,475 6,167 7,055 71,327 84,654
Debt securities
At FVTPL 6,879 11,133 27,785 26,939 23,597 24,775 5,824 5,679 64,085 68,526
At available-for-sale 356 683 - - - - - - 356 683
Receivables and other financial assets 468 471 98 97 534 441 148 98 1,248 1,107
Other assets 79 90 40 42 176 129 12 11 307 272
Assets held for sale 9,837 29 857 - 17,679 59 965 33 29,338 121
Cash and cash equivalents 976 959 1,778 1,049 5,751 6,032 2,112 2,282 10,617 10,322
Total assets 21,080 18,944 50,863 48,470 113,876 104,838 17,780 16,888 203,599 189,140 Non-participating insurance contract liabilities 5,276 9,172 10,753 11,124 5,812 8,016 - - 21,841 28,312
Non-participating investment contract liabilities 4 2,392 - - 88,203 95,267 - - 88,207 97,659
Participating insurance contract liabilities - - 15,397 15,060 - - - - 15,397 15,060
Participating investment contract liabilities - - 15,191 14,707 - - - - 15,191 14,707
Unallocated divisible surplus - - 688 680 - - - - 688 680
Reinsurance liabilities - 316 - - - - - - - 316
Deposits received from reinsurers - - 5,642 5,589 - - - - 5,642 5,589
Third party interest in consolidated funds - - - - - - 15,805 16,058 15,805 16,058
Borrowings - 58 7 9 30 27 7 1 44 95
Subordinated liabilities 1,612 1,861 - - - - - - 1,612 1,861
Pension and other post-retirement benefit provisions 44 104 - - - - - - 44 104
Deferred income 216 244 60 72 - - - - 276 316
Deferred tax liabilities 86 50 79 77 49 51 - - 214 178
Current tax liabilities 38 7 73 (5) 56 47 5 6 172 55
Derivative financial liabilities 17 41 80 134 1,187 519 409 238 1,693 932
Other financial liabilities 966 921 1,541 696 898 662 285 231 3,690 2,510
Other liabilities 52 86 17 21 16 27 15 14 100 148
Liabilities of operations held for sale 8,725 - 858 - 17,492 - 958 - 28,033 -
Total liabilities 17,036 15,252 50,386 48,164 113,743 104,616 17,484 16,548 198,649 184,580
Net inter-segment assets/(liabilities) 628 535 (477) (306) (133) (222) (18) (7) - -
Net assets 4,672 4,227 - - - - 278 333 4,950 4,560
Standard Life 197
3. Financial information – Notes to the Group financial statements continued
42. Risk management continued (b) Market risk As described in the table on pages 195 to 196, the shareholder is exposed to market risk from the shareholder and participating businesses and as a result the following quantitative market risk disclosures are provided in respect of the financial assets of the shareholder and participating businesses.
Quantitative market risk disclosures are not provided in respect of the assets of the unit linked and segregated funds since the shareholder is not exposed to market risks from these assets. The shareholder’s exposure to market risk on these assets is limited to variations in the value of future fee based revenue earned on the contracts as fees are based on a percentage of the fund value. The sensitivity to market risk analysis includes the impact on those statement of financial position items which are affected by changes in future fee based revenue due to the market stresses changing the value of assets held by the unit linked and segregated funds. The shareholder is also not exposed to the market risk from the assets held by third parties in consolidated funds and non-controlling interests and therefore they have been excluded from the following quantitative disclosures.
The Group manages market risks through the use of a number of controls and techniques including: • Defined lists of permitted securities and/or application of investment constraints and portfolio limits • Clearly defined investment benchmarks for policyholder and shareholder funds • Stochastic and deterministic asset/liability modelling • Active use of derivatives to improve the matching characteristics of assets and liabilities.
The specific controls and techniques used to manage the market risks in the shareholder and participating businesses are discussed below:
Shareholder business Assets in the shareholder business are managed against benchmarks that ensure they are diversified across a range of asset classes, instruments and geographies that are appropriate to the liabilities or are held to match the cash flows anticipated to arise in the business. A combination of limits by name, sector and credit rating are used where relevant to reduce concentration risk among the assets held.
Participating business The assets of the participating business are principally managed to support the liabilities of those funds and are appropriately diversified by both asset class and geography.
The key considerations in the asset and liability management of the participating business are: • The economic liability and how this varies with market conditions • The need to invest the assets in a manner consistent with participating policyholders' reasonable expectations and, where
appropriate, the Scheme of Demutualisation and the Principles and Practices of Financial Management (PPFM) • The need to ensure that regulatory and capital requirements are met.
In practice, an element of market risk arises as a consequence of the need to balance these considerations, for example, in certain instances participating policyholders may expect that equity market risk will be taken on their behalf and derivative instruments may be used to manage these risks.
(b)(i) Elements of market risk The main elements of market risk to which the Group is exposed are equity and property risk, interest rate risk and foreign currency risk, which are discussed on the following pages. As a result of the diversity of the products offered by the Group and the different regulatory environments in which it operates, the Group employs a range of methods of asset and liability management across its business units.
Information on the methods used to determine fair values for each major category of financial instrument and investment property measured at fair value is presented in Note 44 – Fair value of assets and liabilities and Note 19 – Investment property.
(b)(i)(i) Group exposure to equity risk The Group is subject to equity price risk due to daily changes in the market values and returns on the holdings in its equity securities portfolio. The Group’s shareholders are exposed to the following sources of equity risk: • Direct equity shareholdings in the shareholder business and the Group defined benefit pension funds • Burnthrough from the with profits funds where adverse movements in the market values and returns on holdings in the equity
portfolios of these funds mean the assets of the with profits funds are not sufficient to meet their obligations • The indirect impact from changes in the value of equities held in funds from which management charges are taken.
198 Standard Life
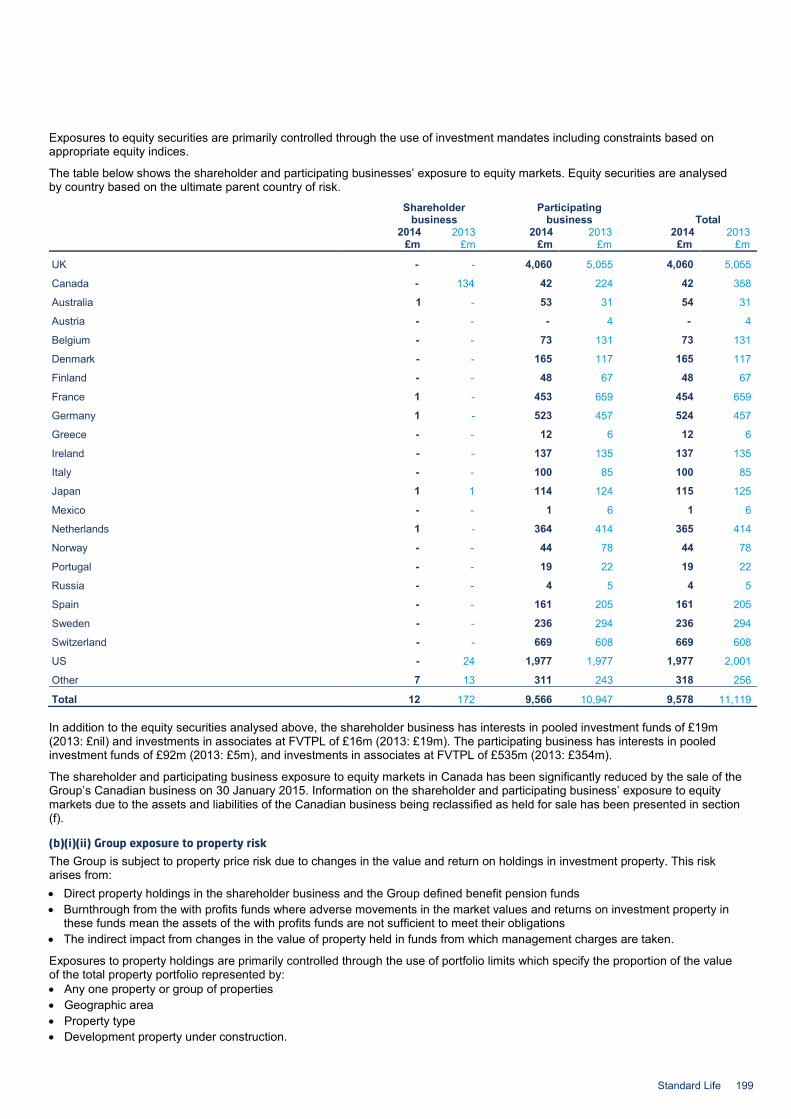
Exposures to equity securities are primarily controlled through the use of investment mandates including constraints based on appropriate equity indices.
The table below shows the shareholder and participating businesses’ exposure to equity markets. Equity securities are analysed by country based on the ultimate parent country of risk.
Shareholder
business Participating
business Total 2014 2013 2014 2013 2014 2013 £m £m £m £m £m £m
UK - - 4,060 5,055 4,060 5,055
Canada - 134 42 224 42 358
Australia 1 - 53 31 54 31
Austria - - - 4 - 4
Belgium - - 73 131 73 131
Denmark - - 165 117 165 117
Finland - - 48 67 48 67
France 1 - 453 659 454 659
Germany 1 - 523 457 524 457
Greece - - 12 6 12 6
Ireland - - 137 135 137 135
Italy - - 100 85 100 85
Japan 1 1 114 124 115 125
Mexico - - 1 6 1 6
Netherlands 1 - 364 414 365 414
Norway - - 44 78 44 78
Portugal - - 19 22 19 22
Russia - - 4 5 4 5
Spain - - 161 205 161 205
Sweden - - 236 294 236 294
Switzerland - - 669 608 669 608
US - 24 1,977 1,977 1,977 2,001
Other 7 13 311 243 318 256
Total 12 172 9,566 10,947 9,578 11,119
In addition to the equity securities analysed above, the shareholder business has interests in pooled investment funds of £19m (2013: £nil) and investments in associates at FVTPL of £16m (2013: £19m). The participating business has interests in pooled investment funds of £92m (2013: £5m), and investments in associates at FVTPL of £535m (2013: £354m).
The shareholder and participating business exposure to equity markets in Canada has been significantly reduced by the sale of the Group’s Canadian business on 30 January 2015. Information on the shareholder and participating business’ exposure to equity markets due to the assets and liabilities of the Canadian business being reclassified as held for sale has been presented in section (f).
(b)(i)(ii) Group exposure to property risk The Group is subject to property price risk due to changes in the value and return on holdings in investment property. This risk arises from: • Direct property holdings in the shareholder business and the Group defined benefit pension funds • Burnthrough from the with profits funds where adverse movements in the market values and returns on investment property in
these funds mean the assets of the with profits funds are not sufficient to meet their obligations • The indirect impact from changes in the value of property held in funds from which management charges are taken.
Exposures to property holdings are primarily controlled through the use of portfolio limits which specify the proportion of the value of the total property portfolio represented by: • Any one property or group of properties • Geographic area • Property type • Development property under construction.
Standard Life 199
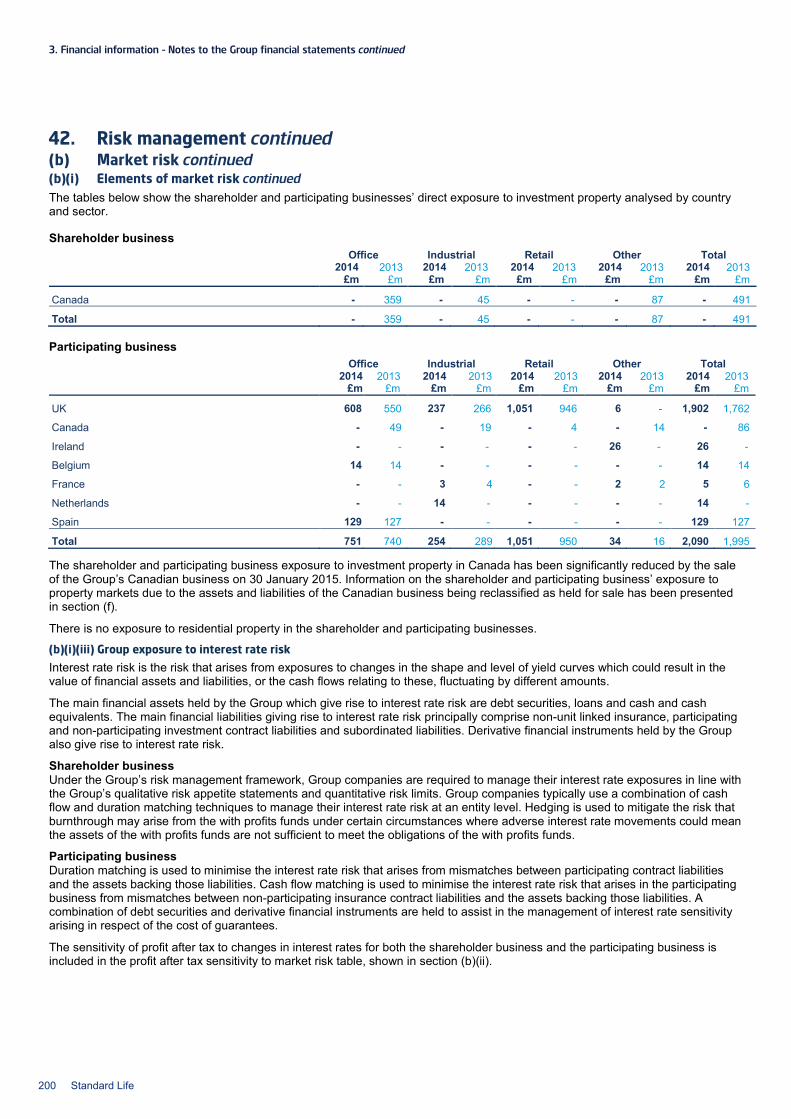
3. Financial information – Notes to the Group financial statements continued
42. Risk management continued (b) Market risk continued (b)(i) Elements of market risk continued The tables below show the shareholder and participating businesses’ direct exposure to investment property analysed by country and sector.
Shareholder business Office Industrial Retail Other Total 2014 2013 2014 2013 2014 2013 2014 2013 2014 2013 £m £m £m £m £m £m £m £m £m £m
Canada - 359 - 45 - - - 87 - 491
Total - 359 - 45 - - - 87 - 491
Participating business Office Industrial Retail Other Total 2014 2013 2014 2013 2014 2013 2014 2013 2014 2013 £m £m £m £m £m £m £m £m £m £m
UK 608 550 237 266 1,051 946 6 - 1,902 1,762
Canada - 49 - 19 - 4 - 14 - 86
Ireland - - - - - - 26 - 26 -
Belgium 14 14 - - - - - - 14 14
France - - 3 4 - - 2 2 5 6
Netherlands - - 14 - - - - - 14 -
Spain 129 127 - - - - - - 129 127
Total 751 740 254 289 1,051 950 34 16 2,090 1,995
The shareholder and participating business exposure to investment property in Canada has been significantly reduced by the sale of the Group’s Canadian business on 30 January 2015. Information on the shareholder and participating business’ exposure to property markets due to the assets and liabilities of the Canadian business being reclassified as held for sale has been presented in section (f).
There is no exposure to residential property in the shareholder and participating businesses.
(b)(i)(iii) Group exposure to interest rate risk Interest rate risk is the risk that arises from exposures to changes in the shape and level of yield curves which could result in the value of financial assets and liabilities, or the cash flows relating to these, fluctuating by different amounts.
The main financial assets held by the Group which give rise to interest rate risk are debt securities, loans and cash and cash equivalents. The main financial liabilities giving rise to interest rate risk principally comprise non-unit linked insurance, participating and non-participating investment contract liabilities and subordinated liabilities. Derivative financial instruments held by the Group also give rise to interest rate risk.
Shareholder business Under the Group’s risk management framework, Group companies are required to manage their interest rate exposures in line with the Group’s qualitative risk appetite statements and quantitative risk limits. Group companies typically use a combination of cash flow and duration matching techniques to manage their interest rate risk at an entity level. Hedging is used to mitigate the risk that burnthrough may arise from the with profits funds under certain circumstances where adverse interest rate movements could mean the assets of the with profits funds are not sufficient to meet the obligations of the with profits funds.
Participating business Duration matching is used to minimise the interest rate risk that arises from mismatches between participating contract liabilities and the assets backing those liabilities. Cash flow matching is used to minimise the interest rate risk that arises in the participating business from mismatches between non-participating insurance contract liabilities and the assets backing those liabilities. A combination of debt securities and derivative financial instruments are held to assist in the management of interest rate sensitivity arising in respect of the cost of guarantees.
The sensitivity of profit after tax to changes in interest rates for both the shareholder business and the participating business is included in the profit after tax sensitivity to market risk table, shown in section (b)(ii).
200 Standard Life
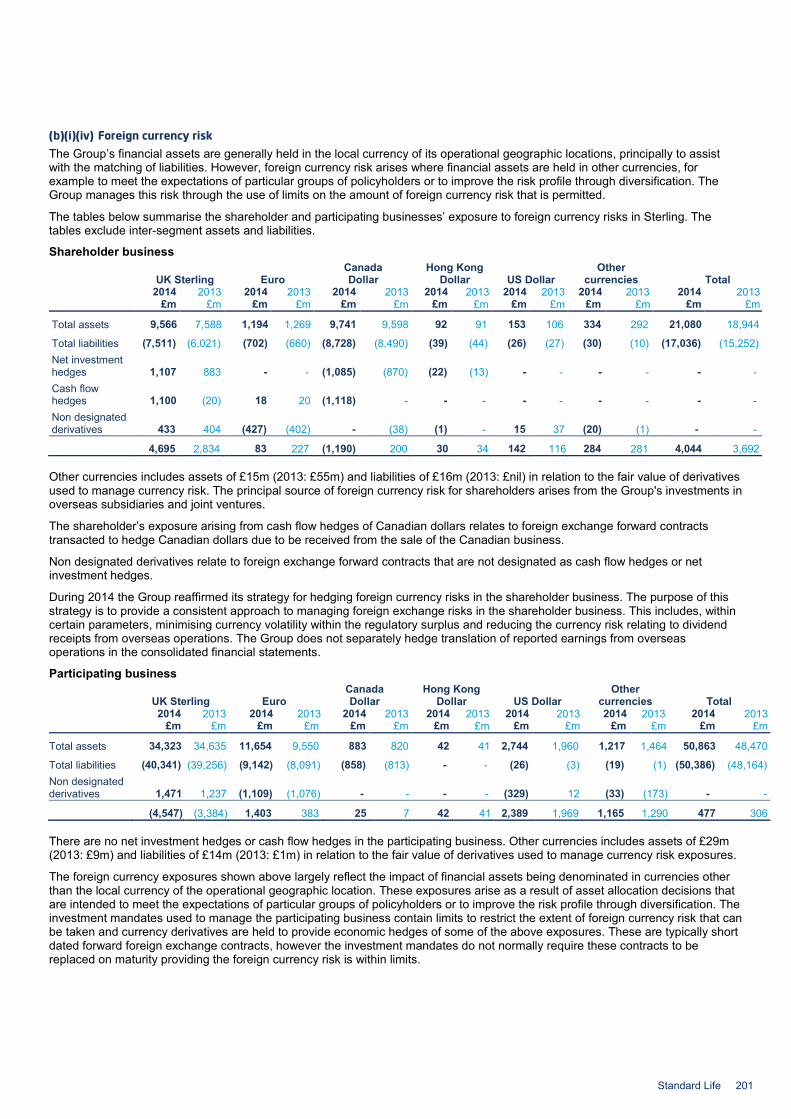
(b)(i)(iv) Foreign currency risk The Group’s financial assets are generally held in the local currency of its operational geographic locations, principally to assist with the matching of liabilities. However, foreign currency risk arises where financial assets are held in other currencies, for example to meet the expectations of particular groups of policyholders or to improve the risk profile through diversification. The Group manages this risk through the use of limits on the amount of foreign currency risk that is permitted.
The tables below summarise the shareholder and participating businesses’ exposure to foreign currency risks in Sterling. The tables exclude inter-segment assets and liabilities.
Shareholder business
UK Sterling Euro Canada Dollar
Hong Kong Dollar US Dollar
Other currencies Total
2014 2013 2014 2013 2014 2013 2014 2013 2014 2013 2014 2013 2014 2013 £m £m £m £m £m £m £m £m £m £m £m £m £m £m
Total assets 9,566 7,588 1,194 1,269 9,741 9,598 92 91 153 106 334 292 21,080 18,944
Total liabilities (7,511) (6,021) (702) (660) (8,728) (8,490) (39) (44) (26) (27) (30) (10) (17,036) (15,252) Net investment hedges 1,107 883 - - (1,085) (870) (22) (13) - - - - - - Cash flow hedges 1,100 (20) 18 20 (1,118) - - - - - - - - - Non designated derivatives 433 404 (427) (402) - (38) (1) - 15 37 (20) (1) - -
4,695 2,834 83 227 (1,190) 200 30 34 142 116 284 281 4,044 3,692
Other currencies includes assets of £15m (2013: £55m) and liabilities of £16m (2013: £nil) in relation to the fair value of derivatives used to manage currency risk. The principal source of foreign currency risk for shareholders arises from the Group's investments in overseas subsidiaries and joint ventures.
The shareholder’s exposure arising from cash flow hedges of Canadian dollars relates to foreign exchange forward contracts transacted to hedge Canadian dollars due to be received from the sale of the Canadian business.
Non designated derivatives relate to foreign exchange forward contracts that are not designated as cash flow hedges or net investment hedges.
During 2014 the Group reaffirmed its strategy for hedging foreign currency risks in the shareholder business. The purpose of this strategy is to provide a consistent approach to managing foreign exchange risks in the shareholder business. This includes, within certain parameters, minimising currency volatility within the regulatory surplus and reducing the currency risk relating to dividend receipts from overseas operations. The Group does not separately hedge translation of reported earnings from overseas operations in the consolidated financial statements.
Participating business
UK Sterling Euro Canada Dollar
Hong Kong Dollar US Dollar
Other currencies Total
2014 2013 2014 2013 2014 2013 2014 2013 2014 2013 2014 2013 2014 2013 £m £m £m £m £m £m £m £m £m £m £m £m £m £m
Total assets 34,323 34,635 11,654 9,550 883 820 42 41 2,744 1,960 1,217 1,464 50,863 48,470
Total liabilities (40,341) (39,256) (9,142) (8,091) (858) (813) - - (26) (3) (19) (1) (50,386) (48,164) Non designated derivatives 1,471 1,237 (1,109) (1,076) - - - - (329) 12 (33) (173) - -
(4,547) (3,384) 1,403 383 25 7 42 41 2,389 1,969 1,165 1,290 477 306
There are no net investment hedges or cash flow hedges in the participating business. Other currencies includes assets of £29m (2013: £9m) and liabilities of £14m (2013: £1m) in relation to the fair value of derivatives used to manage currency risk exposures.
The foreign currency exposures shown above largely reflect the impact of financial assets being denominated in currencies other than the local currency of the operational geographic location. These exposures arise as a result of asset allocation decisions that are intended to meet the expectations of particular groups of policyholders or to improve the risk profile through diversification. The investment mandates used to manage the participating business contain limits to restrict the extent of foreign currency risk that can be taken and currency derivatives are held to provide economic hedges of some of the above exposures. These are typically short dated forward foreign exchange contracts, however the investment mandates do not normally require these contracts to be replaced on maturity providing the foreign currency risk is within limits.
Standard Life 201
3. Financial information – Notes to the Group financial statements continued
42. Risk management continued (b) Market risk continued (b)(ii) Sensitivity to market risk analysis The Group’s profit after tax and equity from continuing operations are sensitive to variations in respect of the Group’s market risk exposures and a sensitivity analysis is presented on the following pages. The analysis has been performed by calculating the sensitivity of profit after tax from continuing operations and equity to changes in equity security and property prices and to changes in interest rates as at the reporting date applied to assets and liabilities other than those classified as held for sale. For each sensitivity ‘test’, the impact of a reasonably possible change in a single sensitivity factor is presented, while the other sensitivity factors remain unchanged. Correlations between the different risks and/or other factors may mean that experience would differ from that expected if more than one risk event occurred simultaneously.
Changes in equity security and property prices and/or fluctuations in interest rates will affect non-participating unit linked liabilities and the associated assets by the same amount. Therefore, whilst the profit impact on unit linked and segregated funds is included in the sensitivity analysis where there is an impact on the value of other statement of financial position items, the change in unit linked liabilities and the corresponding asset movement has not been presented. This is also true of the other with profits funds with the exception of the German With Profits Fund (GWPF). As at 31 December 2014 there is no direct impact of market risk on the sensitivity of GWPF. However, there is an indirect impact on the PBF due to a realistic Capital Support Arrangement (CSA) that was introduced during 2011 for the GWPF. This provides support by reducing the liability to transfer future annual management charges to the PBF hence increasing the assets on the statement of financial position to the extent necessary to avoid a realistic deficit (if possible). There is no impact on GWPF participating liabilities. At 31 December 2014 support is provided under the realistic CSA and there is an increase in expense reserves in the PBF. Further realistic support would be required for the decrease in interest rate sensitivity and this is included within the non-participating insurance contract liabilities in the table below. Earnings over a period may be reduced as a consequence of the impact of market movements on charges levied on unit linked business, segregated fund business and other with profits fund business. For example, if the tests had been applied as at 1 January, the profit during the year would have varied due to the different level of funds under management. In illustrating the impact of equity/property risk, the assumption has been made, where relevant, that expectations of corporate earnings and rents remain unchanged and thus yields change accordingly. The sensitivities take into account the likely impact on individual Group companies of local regulatory standards under such a scenario.
The recourse cash flows have been determined in accordance with the Scheme and consider the extent to which shareholders participate in the investment returns and surpluses of the HWPF. The Scheme, and in particular the Capital Support Mechanism, requires the financial state of the HWPF to be considered before recourse cash flows are transferred to the Shareholder Fund and, under certain circumstances, the payment of recourse cash flow can be withheld to support the financial strength of the HWPF. Therefore, the HWPF has been treated as a whole for the purpose of this sensitivity analysis.
Limitations The sensitivity of the Group’s profit after tax and equity from continuing operations is non-linear and larger or smaller impacts should not be derived from these results. The sensitivity analysis represents the impact on profit at the year end that the changes in market conditions can have. The sensitivity will vary with time, both due to changes in market conditions and changes in the actual asset mix, and this mix is being actively managed. The results of the sensitivity analysis may also have been different from those illustrated had the sensitivity factors been applied at a date other than the reporting date.
For the participating business, in particular the HWPF and the GWPF, the risk to shareholders is that the assets of the fund are insufficient to meet the obligations to policyholders.
For the HWPF, whilst shareholders are only entitled to the recourse cash flows in respect of this business, there can be potential exposure to the full impact of any shortfall if the assets of the fund are insufficient to meet policyholder obligations. The sensitivities presented in the table are not sufficiently severe to have restricted recourse cash flows in 2014 and 2013. When assessing the impact of the sensitivity tests on the recourse cash flows, and in particular the risk that the assets of the HWPF may be insufficient to meet the obligations to policyholders, dynamic management actions have been assumed in a manner consistent with the relevant Principles and Practices of Financial Management (PPFM).
202 Standard Life
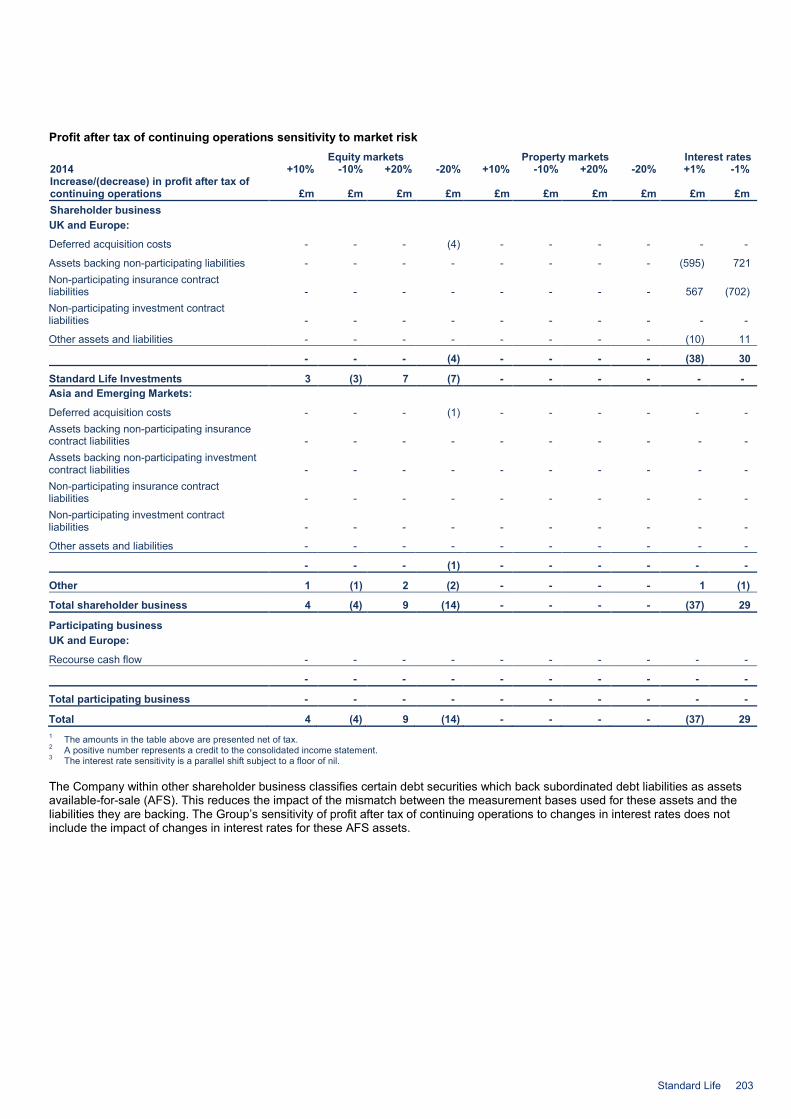
Profit after tax of continuing operations sensitivity to market risk
Equity markets Property markets Interest rates 2014 +10% -10% +20% -20% +10% -10% +20% -20% +1% -1% Increase/(decrease) in profit after tax of continuing operations £m £m £m £m £m £m £m £m £m £m Shareholder business UK and Europe:
Deferred acquisition costs - - - (4) - - - - - -
Assets backing non-participating liabilities - - - - - - - - (595) 721 Non-participating insurance contract liabilities - - - - - - - - 567 (702) Non-participating investment contract liabilities - - - - - - - - - -
Other assets and liabilities - - - - - - - - (10) 11
- - - (4) - - - - (38) 30
Standard Life Investments 3 (3) 7 (7) - - - - - - Asia and Emerging Markets:
Deferred acquisition costs - - - (1) - - - - - - Assets backing non-participating insurance contract liabilities - - - - - - - - - - Assets backing non-participating investment contract liabilities - - - - - - - - - - Non-participating insurance contract liabilities - - - - - - - - - - Non-participating investment contract liabilities - - - - - - - - - -
Other assets and liabilities - - - - - - - - - -
- - - (1) - - - - - -
Other 1 (1) 2 (2) - - - - 1 (1)
Total shareholder business 4 (4) 9 (14) - - - - (37) 29
Participating business UK and Europe:
Recourse cash flow - - - - - - - - - -
- - - - - - - - - -
Total participating business - - - - - - - - - -
Total 4 (4) 9 (14) - - - - (37) 29
1 The amounts in the table above are presented net of tax. 2 A positive number represents a credit to the consolidated income statement. 3 The interest rate sensitivity is a parallel shift subject to a floor of nil.
The Company within other shareholder business classifies certain debt securities which back subordinated debt liabilities as assets available-for-sale (AFS). This reduces the impact of the mismatch between the measurement bases used for these assets and the liabilities they are backing. The Group’s sensitivity of profit after tax of continuing operations to changes in interest rates does not include the impact of changes in interest rates for these AFS assets.
Standard Life 203
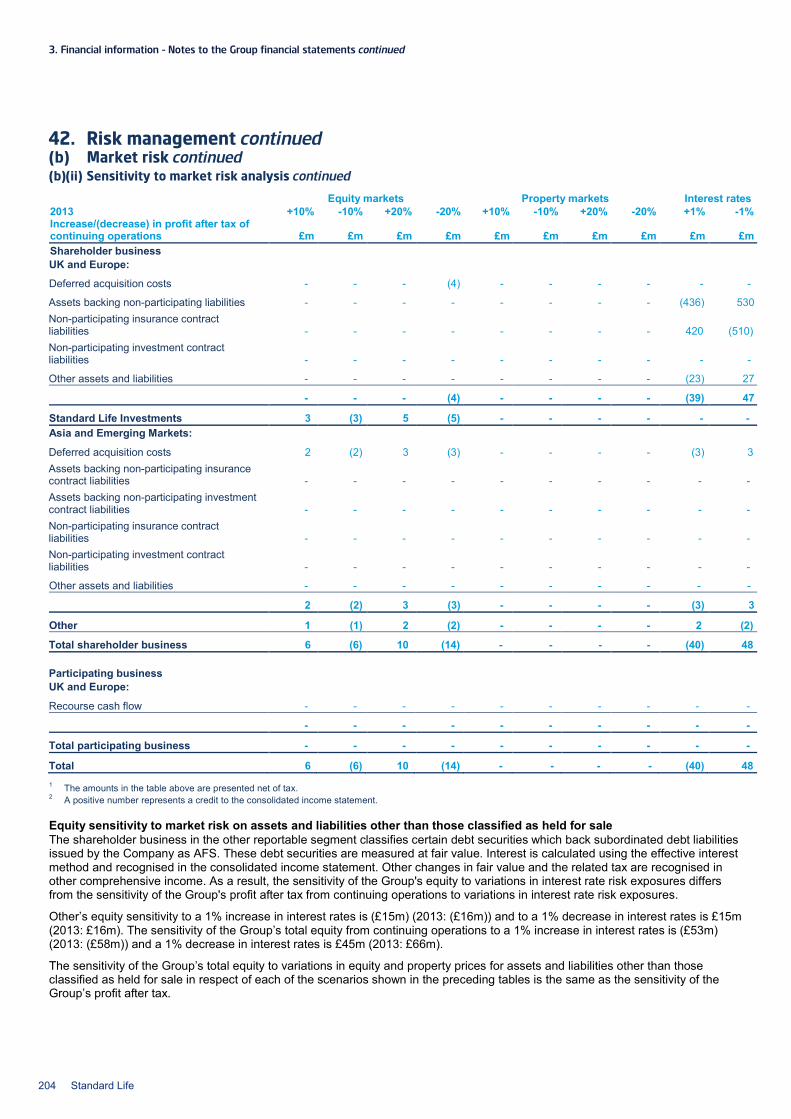
3. Financial information – Notes to the Group financial statements continued
42. Risk management continued (b) Market risk continued (b)(ii) Sensitivity to market risk analysis continued
Equity markets Property markets Interest rates 2013 +10% -10% +20% -20% +10% -10% +20% -20% +1% -1% Increase/(decrease) in profit after tax of continuing operations £m £m £m £m £m £m £m £m £m £m Shareholder business UK and Europe:
Deferred acquisition costs - - - (4) - - - - - -
Assets backing non-participating liabilities - - - - - - - - (436) 530 Non-participating insurance contract liabilities - - - - - - - - 420 (510) Non-participating investment contract liabilities - - - - - - - - - -
Other assets and liabilities - - - - - - - - (23) 27
- - - (4) - - - - (39) 47
Standard Life Investments 3 (3) 5 (5) - - - - - - Asia and Emerging Markets:
Deferred acquisition costs 2 (2) 3 (3) - - - - (3) 3 Assets backing non-participating insurance contract liabilities - - - - - - - - - - Assets backing non-participating investment contract liabilities - - - - - - - - - - Non-participating insurance contract liabilities - - - - - - - - - - Non-participating investment contract liabilities - - - - - - - - - -
Other assets and liabilities - - - - - - - - - -
2 (2) 3 (3) - - - - (3) 3
Other 1 (1) 2 (2) - - - - 2 (2)
Total shareholder business 6 (6) 10 (14) - - - - (40) 48
Participating business UK and Europe:
Recourse cash flow - - - - - - - - - -
- - - - - - - - - -
Total participating business - - - - - - - - - -
Total 6 (6) 10 (14) - - - - (40) 48 1 The amounts in the table above are presented net of tax. 2 A positive number represents a credit to the consolidated income statement.
Equity sensitivity to market risk on assets and liabilities other than those classified as held for sale The shareholder business in the other reportable segment classifies certain debt securities which back subordinated debt liabilities issued by the Company as AFS. These debt securities are measured at fair value. Interest is calculated using the effective interest method and recognised in the consolidated income statement. Other changes in fair value and the related tax are recognised in other comprehensive income. As a result, the sensitivity of the Group's equity to variations in interest rate risk exposures differs from the sensitivity of the Group's profit after tax from continuing operations to variations in interest rate risk exposures.
Other’s equity sensitivity to a 1% increase in interest rates is (£15m) (2013: (£16m)) and to a 1% decrease in interest rates is £15m (2013: £16m). The sensitivity of the Group’s total equity from continuing operations to a 1% increase in interest rates is (£53m) (2013: (£58m)) and a 1% decrease in interest rates is £45m (2013: £66m).
The sensitivity of the Group’s total equity to variations in equity and property prices for assets and liabilities other than those classified as held for sale in respect of each of the scenarios shown in the preceding tables is the same as the sensitivity of the Group’s profit after tax.
204 Standard Life
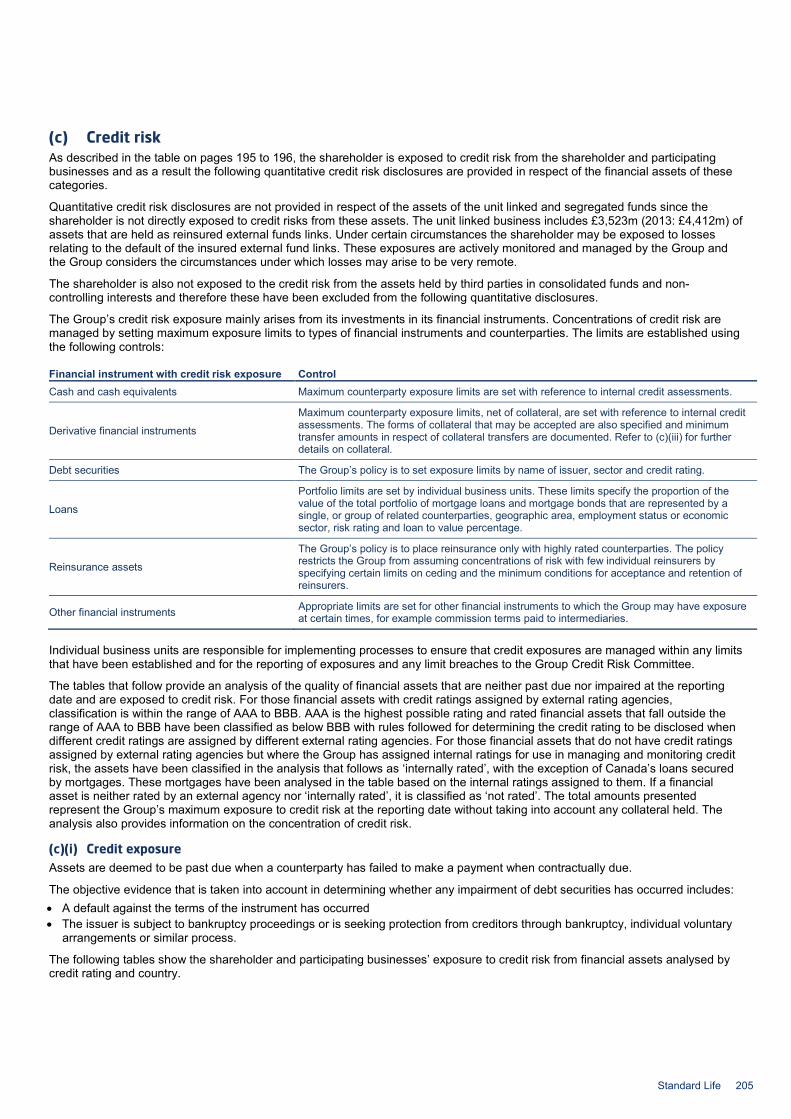
(c) Credit risk As described in the table on pages 195 to 196, the shareholder is exposed to credit risk from the shareholder and participating businesses and as a result the following quantitative credit risk disclosures are provided in respect of the financial assets of these categories.
Quantitative credit risk disclosures are not provided in respect of the assets of the unit linked and segregated funds since the shareholder is not directly exposed to credit risks from these assets. The unit linked business includes £3,523m (2013: £4,412m) of assets that are held as reinsured external funds links. Under certain circumstances the shareholder may be exposed to losses relating to the default of the insured external fund links. These exposures are actively monitored and managed by the Group and the Group considers the circumstances under which losses may arise to be very remote.
The shareholder is also not exposed to the credit risk from the assets held by third parties in consolidated funds and non-controlling interests and therefore these have been excluded from the following quantitative disclosures.
The Group’s credit risk exposure mainly arises from its investments in its financial instruments. Concentrations of credit risk are managed by setting maximum exposure limits to types of financial instruments and counterparties. The limits are established using the following controls:
Financial instrument with credit risk exposure Control Cash and cash equivalents Maximum counterparty exposure limits are set with reference to internal credit assessments.
Derivative financial instruments
Maximum counterparty exposure limits, net of collateral, are set with reference to internal credit assessments. The forms of collateral that may be accepted are also specified and minimum transfer amounts in respect of collateral transfers are documented. Refer to (c)(iii) for further details on collateral.
Debt securities The Group’s policy is to set exposure limits by name of issuer, sector and credit rating.
Loans
Portfolio limits are set by individual business units. These limits specify the proportion of the value of the total portfolio of mortgage loans and mortgage bonds that are represented by a single, or group of related counterparties, geographic area, employment status or economic sector, risk rating and loan to value percentage.
Reinsurance assets
The Group’s policy is to place reinsurance only with highly rated counterparties. The policy restricts the Group from assuming concentrations of risk with few individual reinsurers by specifying certain limits on ceding and the minimum conditions for acceptance and retention of reinsurers.
Other financial instruments Appropriate limits are set for other financial instruments to which the Group may have exposure at certain times, for example commission terms paid to intermediaries.
Individual business units are responsible for implementing processes to ensure that credit exposures are managed within any limits that have been established and for the reporting of exposures and any limit breaches to the Group Credit Risk Committee.
The tables that follow provide an analysis of the quality of financial assets that are neither past due nor impaired at the reporting date and are exposed to credit risk. For those financial assets with credit ratings assigned by external rating agencies, classification is within the range of AAA to BBB. AAA is the highest possible rating and rated financial assets that fall outside the range of AAA to BBB have been classified as below BBB with rules followed for determining the credit rating to be disclosed when different credit ratings are assigned by different external rating agencies. For those financial assets that do not have credit ratings assigned by external rating agencies but where the Group has assigned internal ratings for use in managing and monitoring credit risk, the assets have been classified in the analysis that follows as ‘internally rated’, with the exception of Canada’s loans secured by mortgages. These mortgages have been analysed in the table based on the internal ratings assigned to them. If a financial asset is neither rated by an external agency nor ‘internally rated’, it is classified as ‘not rated’. The total amounts presented represent the Group’s maximum exposure to credit risk at the reporting date without taking into account any collateral held. The analysis also provides information on the concentration of credit risk.
(c)(i) Credit exposure Assets are deemed to be past due when a counterparty has failed to make a payment when contractually due.
The objective evidence that is taken into account in determining whether any impairment of debt securities has occurred includes: • A default against the terms of the instrument has occurred • The issuer is subject to bankruptcy proceedings or is seeking protection from creditors through bankruptcy, individual voluntary
arrangements or similar process.
The following tables show the shareholder and participating businesses’ exposure to credit risk from financial assets analysed by credit rating and country.
Standard Life 205
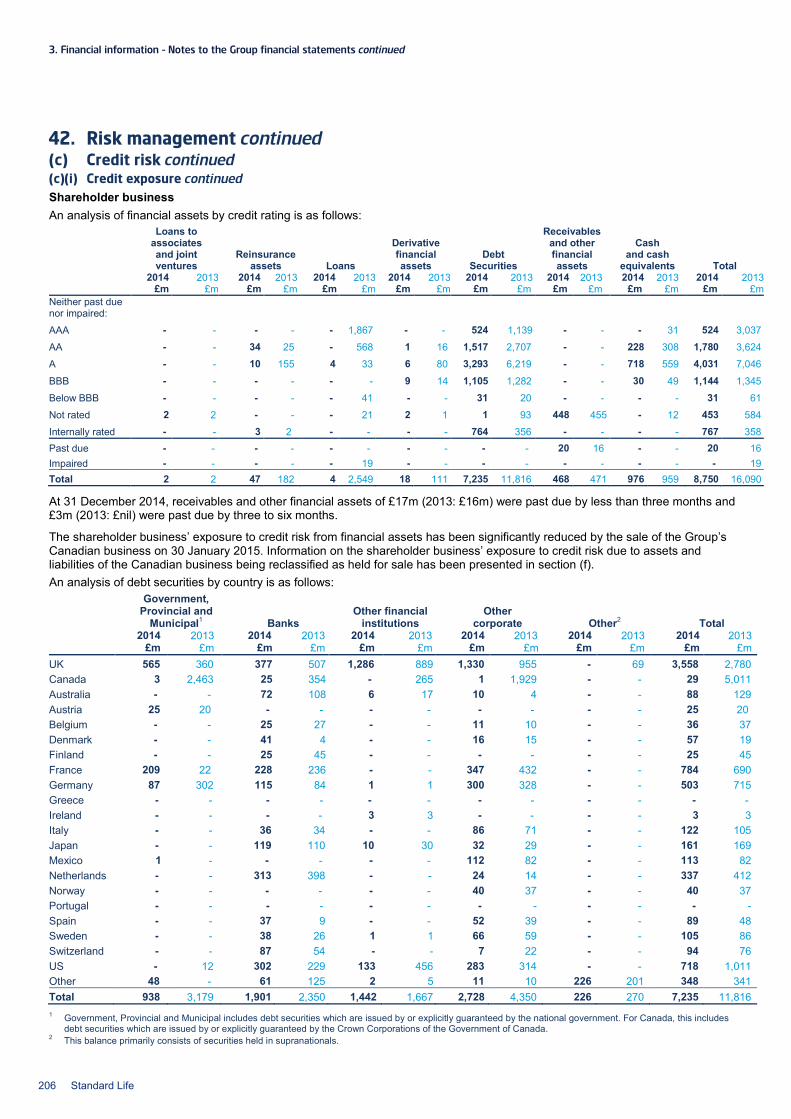
3. Financial information – Notes to the Group financial statements continued
42. Risk management continued (c) Credit risk continued (c)(i) Credit exposure continued Shareholder business An analysis of financial assets by credit rating is as follows:
Loans to associates and joint ventures
Reinsurance assets Loans
Derivative financial assets
Debt Securities
Receivables and other financial assets
Cash and cash
equivalents Total 2014 2013 2014 2013 2014 2013 2014 2013 2014 2013 2014 2013 2014 2013 2014 2013 £m £m £m £m £m £m £m £m £m £m £m £m £m £m £m £m
Neither past due nor impaired:
AAA - - - - - 1,867 - - 524 1,139 - - - 31 524 3,037
AA - - 34 25 - 568 1 16 1,517 2,707 - - 228 308 1,780 3,624
A - - 10 155 4 33 6 80 3,293 6,219 - - 718 559 4,031 7,046
BBB - - - - - - 9 14 1,105 1,282 - - 30 49 1,144 1,345
Below BBB - - - - - 41 - - 31 20 - - - - 31 61
Not rated 2 2 - - - 21 2 1 1 93 448 455 - 12 453 584
Internally rated - - 3 2 - - - - 764 356 - - - - 767 358 Past due - - - - - - - - - - 20 16 - - 20 16 Impaired - - - - - 19 - - - - - - - - - 19 Total 2 2 47 182 4 2,549 18 111 7,235 11,816 468 471 976 959 8,750 16,090
At 31 December 2014, receivables and other financial assets of £17m (2013: £16m) were past due by less than three months and £3m (2013: £nil) were past due by three to six months.
The shareholder business’ exposure to credit risk from financial assets has been significantly reduced by the sale of the Group’s Canadian business on 30 January 2015. Information on the shareholder business’ exposure to credit risk due to assets and liabilities of the Canadian business being reclassified as held for sale has been presented in section (f). An analysis of debt securities by country is as follows:
Government, Provincial and
Municipal1 Banks Other financial
institutions Other
corporate Other2 Total 2014 2013 2014 2013 2014 2013 2014 2013 2014 2013 2014 2013 £m £m £m £m £m £m £m £m £m £m £m £m UK 565 360 377 507 1,286 889 1,330 955 - 69 3,558 2,780 Canada 3 2,463 25 354 - 265 1 1,929 - - 29 5,011 Australia - - 72 108 6 17 10 4 - - 88 129 Austria 25 20 - - - - - - - - 25 20 Belgium - - 25 27 - - 11 10 - - 36 37 Denmark - - 41 4 - - 16 15 - - 57 19 Finland - - 25 45 - - - - - - 25 45 France 209 22 228 236 - - 347 432 - - 784 690 Germany 87 302 115 84 1 1 300 328 - - 503 715 Greece - - - - - - - - - - - - Ireland - - - - 3 3 - - - - 3 3 Italy - - 36 34 - - 86 71 - - 122 105 Japan - - 119 110 10 30 32 29 - - 161 169 Mexico 1 - - - - - 112 82 - - 113 82 Netherlands - - 313 398 - - 24 14 - - 337 412 Norway - - - - - - 40 37 - - 40 37 Portugal - - - - - - - - - - - - Spain - - 37 9 - - 52 39 - - 89 48 Sweden - - 38 26 1 1 66 59 - - 105 86 Switzerland - - 87 54 - - 7 22 - - 94 76 US - 12 302 229 133 456 283 314 - - 718 1,011 Other 48 - 61 125 2 5 11 10 226 201 348 341 Total 938 3,179 1,901 2,350 1,442 1,667 2,728 4,350 226 270 7,235 11,816 1 Government, Provincial and Municipal includes debt securities which are issued by or explicitly guaranteed by the national government. For Canada, this includes
debt securities which are issued by or explicitly guaranteed by the Crown Corporations of the Government of Canada. 2 This balance primarily consists of securities held in supranationals.
206 Standard Life
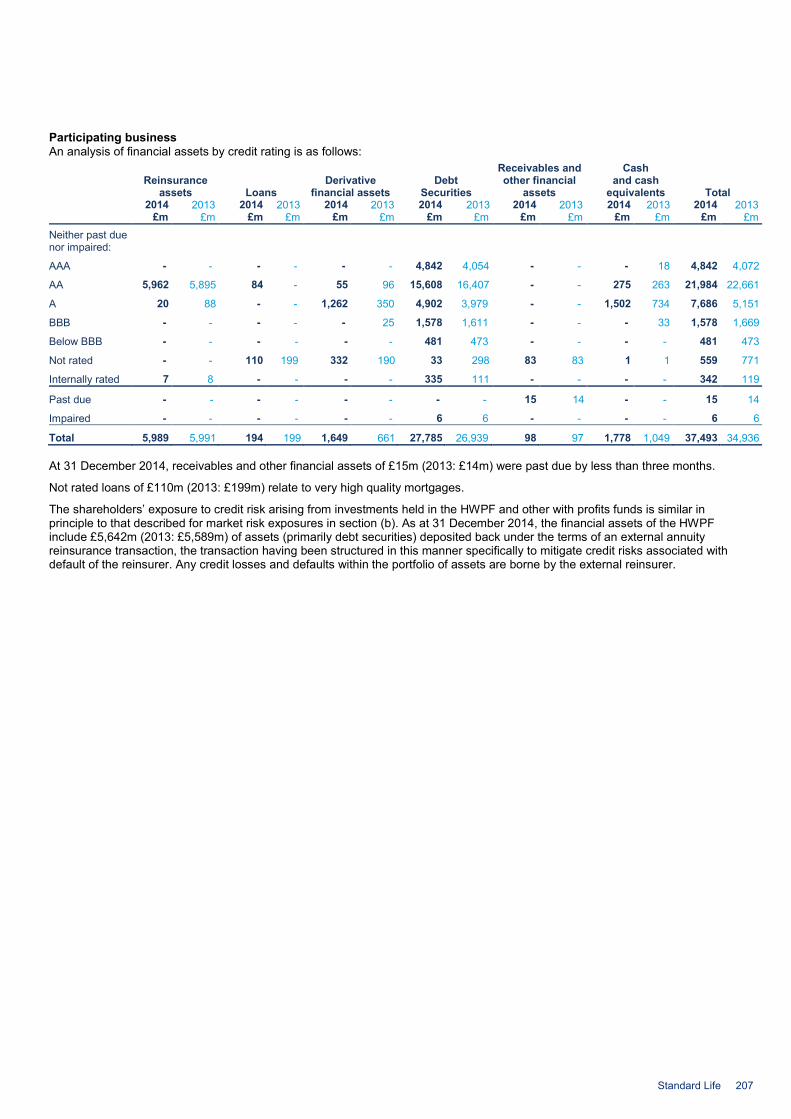
Participating business An analysis of financial assets by credit rating is as follows:
Reinsurance
assets Loans Derivative
financial assets Debt
Securities
Receivables and other financial
assets
Cash and cash
equivalents Total 2014 2013 2014 2013 2014 2013 2014 2013 2014 2013 2014 2013 2014 2013 £m £m £m £m £m £m £m £m £m £m £m £m £m £m
Neither past due nor impaired:
AAA - - - - - - 4,842 4,054 - - - 18 4,842 4,072
AA 5,962 5,895 84 - 55 96 15,608 16,407 - - 275 263 21,984 22,661
A 20 88 - - 1,262 350 4,902 3,979 - - 1,502 734 7,686 5,151
BBB - - - - - 25 1,578 1,611 - - - 33 1,578 1,669
Below BBB - - - - - - 481 473 - - - - 481 473
Not rated - - 110 199 332 190 33 298 83 83 1 1 559 771
Internally rated 7 8 - - - - 335 111 - - - - 342 119
Past due - - - - - - - - 15 14 - - 15 14
Impaired - - - - - - 6 6 - - - - 6 6
Total 5,989 5,991 194 199 1,649 661 27,785 26,939 98 97 1,778 1,049 37,493 34,936
At 31 December 2014, receivables and other financial assets of £15m (2013: £14m) were past due by less than three months.
Not rated loans of £110m (2013: £199m) relate to very high quality mortgages.
The shareholders’ exposure to credit risk arising from investments held in the HWPF and other with profits funds is similar in principle to that described for market risk exposures in section (b). As at 31 December 2014, the financial assets of the HWPF include £5,642m (2013: £5,589m) of assets (primarily debt securities) deposited back under the terms of an external annuity reinsurance transaction, the transaction having been structured in this manner specifically to mitigate credit risks associated with default of the reinsurer. Any credit losses and defaults within the portfolio of assets are borne by the external reinsurer.
Standard Life 207
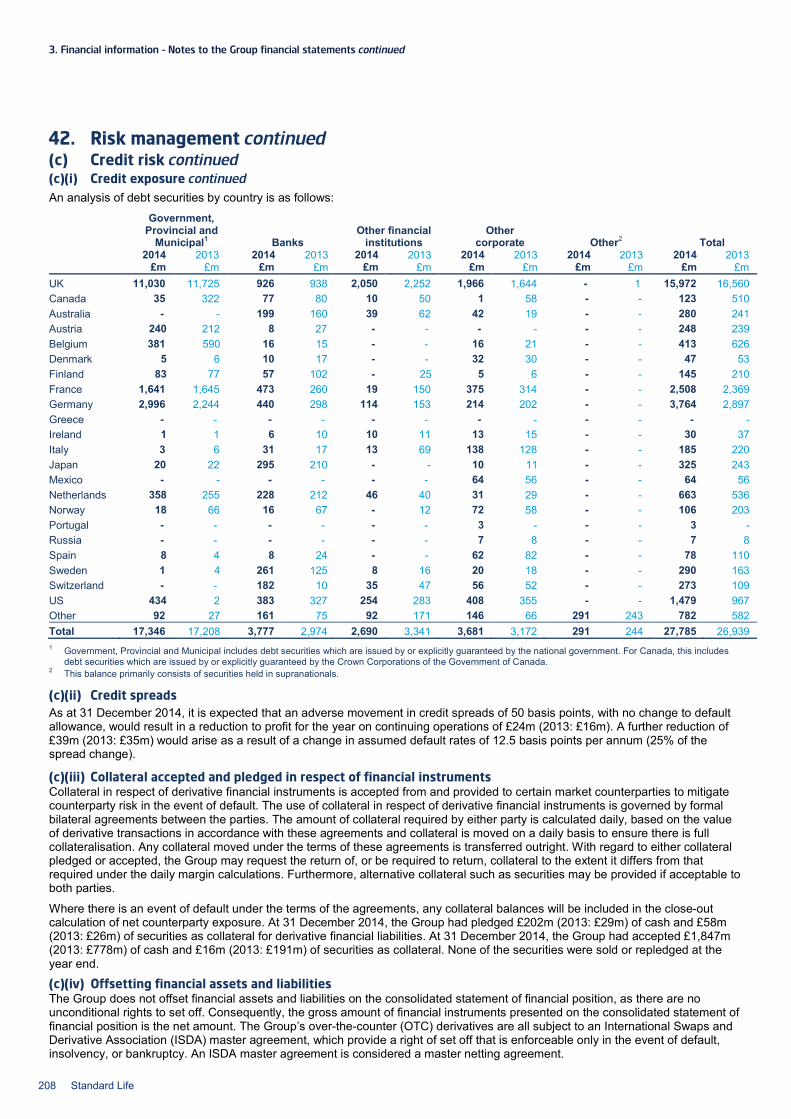
3. Financial information – Notes to the Group financial statements continued
42. Risk management continued (c) Credit risk continued (c)(i) Credit exposure continued An analysis of debt securities by country is as follows:
Government, Provincial and
Municipal1 Banks Other financial
institutions Other
corporate Other2 Total 2014 2013 2014 2013 2014 2013 2014 2013 2014 2013 2014 2013 £m £m £m £m £m £m £m £m £m £m £m £m UK 11,030 11,725 926 938 2,050 2,252 1,966 1,644 - 1 15,972 16,560 Canada 35 322 77 80 10 50 1 58 - - 123 510 Australia - - 199 160 39 62 42 19 - - 280 241 Austria 240 212 8 27 - - - - - - 248 239 Belgium 381 590 16 15 - - 16 21 - - 413 626 Denmark 5 6 10 17 - - 32 30 - - 47 53 Finland 83 77 57 102 - 25 5 6 - - 145 210 France 1,641 1,645 473 260 19 150 375 314 - - 2,508 2,369 Germany 2,996 2,244 440 298 114 153 214 202 - - 3,764 2,897 Greece - - - - - - - - - - - - Ireland 1 1 6 10 10 11 13 15 - - 30 37 Italy 3 6 31 17 13 69 138 128 - - 185 220 Japan 20 22 295 210 - - 10 11 - - 325 243 Mexico - - - - - - 64 56 - - 64 56 Netherlands 358 255 228 212 46 40 31 29 - - 663 536 Norway 18 66 16 67 - 12 72 58 - - 106 203 Portugal - - - - - - 3 - - - 3 - Russia - - - - - - 7 8 - - 7 8 Spain 8 4 8 24 - - 62 82 - - 78 110 Sweden 1 4 261 125 8 16 20 18 - - 290 163 Switzerland - - 182 10 35 47 56 52 - - 273 109 US 434 2 383 327 254 283 408 355 - - 1,479 967 Other 92 27 161 75 92 171 146 66 291 243 782 582 Total 17,346 17,208 3,777 2,974 2,690 3,341 3,681 3,172 291 244 27,785 26,939 1 Government, Provincial and Municipal includes debt securities which are issued by or explicitly guaranteed by the national government. For Canada, this includes
debt securities which are issued by or explicitly guaranteed by the Crown Corporations of the Government of Canada. 2 This balance primarily consists of securities held in supranationals.
(c)(ii) Credit spreads As at 31 December 2014, it is expected that an adverse movement in credit spreads of 50 basis points, with no change to default allowance, would result in a reduction to profit for the year on continuing operations of £24m (2013: £16m). A further reduction of £39m (2013: £35m) would arise as a result of a change in assumed default rates of 12.5 basis points per annum (25% of the spread change).
(c)(iii) Collateral accepted and pledged in respect of financial instruments Collateral in respect of derivative financial instruments is accepted from and provided to certain market counterparties to mitigate counterparty risk in the event of default. The use of collateral in respect of derivative financial instruments is governed by formal bilateral agreements between the parties. The amount of collateral required by either party is calculated daily, based on the value of derivative transactions in accordance with these agreements and collateral is moved on a daily basis to ensure there is full collateralisation. Any collateral moved under the terms of these agreements is transferred outright. With regard to either collateral pledged or accepted, the Group may request the return of, or be required to return, collateral to the extent it differs from that required under the daily margin calculations. Furthermore, alternative collateral such as securities may be provided if acceptable to both parties.
Where there is an event of default under the terms of the agreements, any collateral balances will be included in the close-out calculation of net counterparty exposure. At 31 December 2014, the Group had pledged £202m (2013: £29m) of cash and £58m (2013: £26m) of securities as collateral for derivative financial liabilities. At 31 December 2014, the Group had accepted £1,847m (2013: £778m) of cash and £16m (2013: £191m) of securities as collateral. None of the securities were sold or repledged at the year end.
(c)(iv) Offsetting financial assets and liabilities The Group does not offset financial assets and liabilities on the consolidated statement of financial position, as there are no unconditional rights to set off. Consequently, the gross amount of financial instruments presented on the consolidated statement of financial position is the net amount. The Group’s over-the-counter (OTC) derivatives are all subject to an International Swaps and Derivative Association (ISDA) master agreement, which provide a right of set off that is enforceable only in the event of default, insolvency, or bankruptcy. An ISDA master agreement is considered a master netting agreement.
208 Standard Life
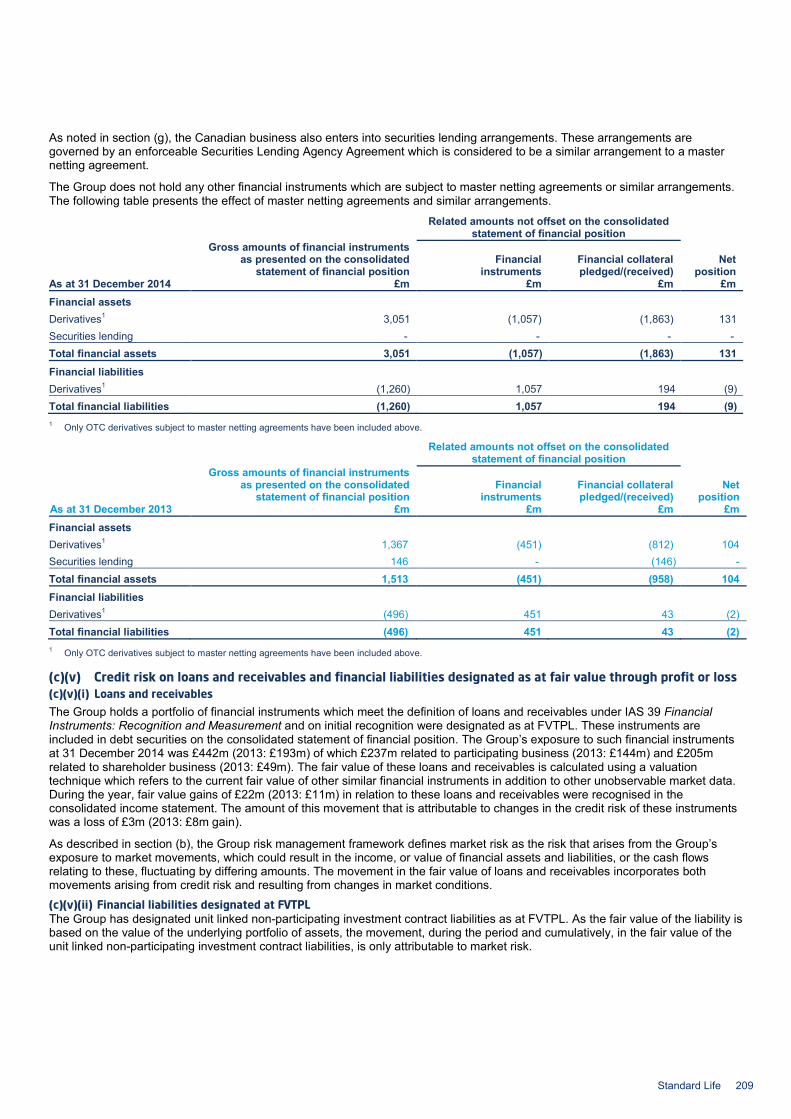
As noted in section (g), the Canadian business also enters into securities lending arrangements. These arrangements are governed by an enforceable Securities Lending Agency Agreement which is considered to be a similar arrangement to a master netting agreement.
The Group does not hold any other financial instruments which are subject to master netting agreements or similar arrangements. The following table presents the effect of master netting agreements and similar arrangements.
Related amounts not offset on the consolidated
statement of financial position
Gross amounts of financial instruments as presented on the consolidated
statement of financial position Financial
instruments Financial collateral pledged/(received)
Net position
As at 31 December 2014 £m £m £m £m Financial assets Derivatives1 3,051 (1,057) (1,863) 131 Securities lending - - - - Total financial assets 3,051 (1,057) (1,863) 131 Financial liabilities Derivatives1 (1,260) 1,057 194 (9) Total financial liabilities (1,260) 1,057 194 (9) 1 Only OTC derivatives subject to master netting agreements have been included above.
Related amounts not offset on the consolidated
statement of financial position
Gross amounts of financial instruments as presented on the consolidated
statement of financial position Financial
instruments Financial collateral pledged/(received)
Net position
As at 31 December 2013 £m £m £m £m Financial assets Derivatives1 1,367 (451) (812) 104 Securities lending 146 - (146) - Total financial assets 1,513 (451) (958) 104 Financial liabilities Derivatives1 (496) 451 43 (2) Total financial liabilities (496) 451 43 (2) 1 Only OTC derivatives subject to master netting agreements have been included above.
(c)(v) Credit risk on loans and receivables and financial liabilities designated as at fair value through profit or loss (c)(v)(i) Loans and receivables The Group holds a portfolio of financial instruments which meet the definition of loans and receivables under IAS 39 Financial Instruments: Recognition and Measurement and on initial recognition were designated as at FVTPL. These instruments are included in debt securities on the consolidated statement of financial position. The Group’s exposure to such financial instruments at 31 December 2014 was £442m (2013: £193m) of which £237m related to participating business (2013: £144m) and £205m related to shareholder business (2013: £49m). The fair value of these loans and receivables is calculated using a valuation technique which refers to the current fair value of other similar financial instruments in addition to other unobservable market data. During the year, fair value gains of £22m (2013: £11m) in relation to these loans and receivables were recognised in the consolidated income statement. The amount of this movement that is attributable to changes in the credit risk of these instruments was a loss of £3m (2013: £8m gain).
As described in section (b), the Group risk management framework defines market risk as the risk that arises from the Group’s exposure to market movements, which could result in the income, or value of financial assets and liabilities, or the cash flows relating to these, fluctuating by differing amounts. The movement in the fair value of loans and receivables incorporates both movements arising from credit risk and resulting from changes in market conditions. (c)(v)(ii) Financial liabilities designated at FVTPL The Group has designated unit linked non-participating investment contract liabilities as at FVTPL. As the fair value of the liability is based on the value of the underlying portfolio of assets, the movement, during the period and cumulatively, in the fair value of the unit linked non-participating investment contract liabilities, is only attributable to market risk.
Standard Life 209
3. Financial information – Notes to the Group financial statements continued
42. Risk management continued (d) Demographic and expense risk As described in the table on pages 195 to 196, the shareholder is directly exposed to demographic and expense risk from shareholder business and participating business and, as a result, quantitative demographic and expense risk disclosures are provided in respect of these categories.
Demographic and expense risk is managed by assessing certain characteristics based on experience and statistical data and by making certain assumptions on the risks associated with the policy during the period that it is in-force. Assumptions that are deemed to be financially significant are reviewed at least annually for pricing and reporting purposes. In analysing demographic and expense risk exposures, the Group considers: • Historic experience of relevant demographic and expense risks • The potential for future experience to differ from that expected or observed historically • The financial impact of variances in expectations • Other factors relevant to their specific markets, for example obligations to treat customers fairly.
Reinsurance and other risk transfer mechanisms are used to manage risk exposures and are taken into account in the Group’s assessment of demographic and expense risk exposures.
(d)(i) Elements of demographic and expense risk The main elements of demographic and expense risk that give rise to the exposure are discussed below. (d)(i)(i) Components of insurance risk as defined by IFRS 4 Insurance Contracts Longevity The Group defines longevity risk as the risk that the policyholder lives longer than expected and therefore gives rise to a loss. This risk is relevant for contracts where payments are made until the death of the policyholder, for example, annuities. This may arise from current experience differing from that expected, more volatility of experience than expected, or the rate of improvement in mortality being greater than anticipated.
Experience can vary as a result of statistical uncertainty or as a consequence of systemic (and previously unexpected) changes in the life expectancy of the insured portfolio. The profitability of such business will reduce should policyholders live longer than the Group’s expectations and reported profits will be impacted as and when such variances are recognised in liabilities.
Morbidity The Group defines morbidity risk as the risk that paid claims dependent on the state of health of a policyholder are incurred at a higher than expected rate or, in the case of income benefits, continue for a longer duration or start earlier than those assumed. This risk will be present on disability income, healthcare and critical illness contracts. This includes the risk of anti-selection that results in a requirement to pay claims that the Group had not expected, for example, due to non-disclosure.
Income protection contracts have the risk that claim duration may be longer than anticipated.
Mortality The Group defines mortality risk as the risk that paid death claims are at a higher rate or are more volatile than assumed. This risk will exist on any contracts where the payment on death is greater than the reserve held. This includes the risk of anti-selection that results in a requirement to pay claims that the Group had not expected, for example due to non-disclosure.
(d)(i)(ii) Other financial risks Persistency – withdrawals and lapse rates The Group defines persistency risk as the risk that business lapses or becomes paid-up at a different rate than assumed. This risk may arise if persistency rates are greater or less than assumed or if policyholders selectively lapse when it is beneficial for them. If the benefits payable on lapse or being paid-up are greater than the reserve held then the risk will be of a worsening of persistency and if benefits are paid out that are lower than the reserve then the risk will be that fewer policyholders will lapse or become paid-up.
Persistency risk also reflects the risk of a reduction in expected future profits arising from early retirements, surrenders – either partial or in full – and similar policyholder options.
Variances in persistency will affect equity holder profits to the extent that charges levied against policies are dependent upon the number of policies in force and/or the average size of those policies. The policies primarily relate to unit linked, unitised with profits and Canada’s segregated fund business. Profit may also be at risk if it is considered necessary, or prudent, to increase liabilities on certain lines of business.
Expenses The Group defines expense risk as the risk that expense levels will be higher than assumed. This can arise from an increase in the unit costs of the Group or its businesses or an increase in expense inflation, either Group specific or relating to economic conditions. This risk will be present on contracts where the Group cannot or will not pass the increased costs onto the customer. Expense risk can reflect an increase in liabilities or a reduction in expected future profits.
Profit is directly exposed to the risk of expenses being higher than otherwise expected. They can be further affected if it is considered necessary, or prudent, to increase provisions to reflect increased expectations of future costs of policy administration.
210 Standard Life
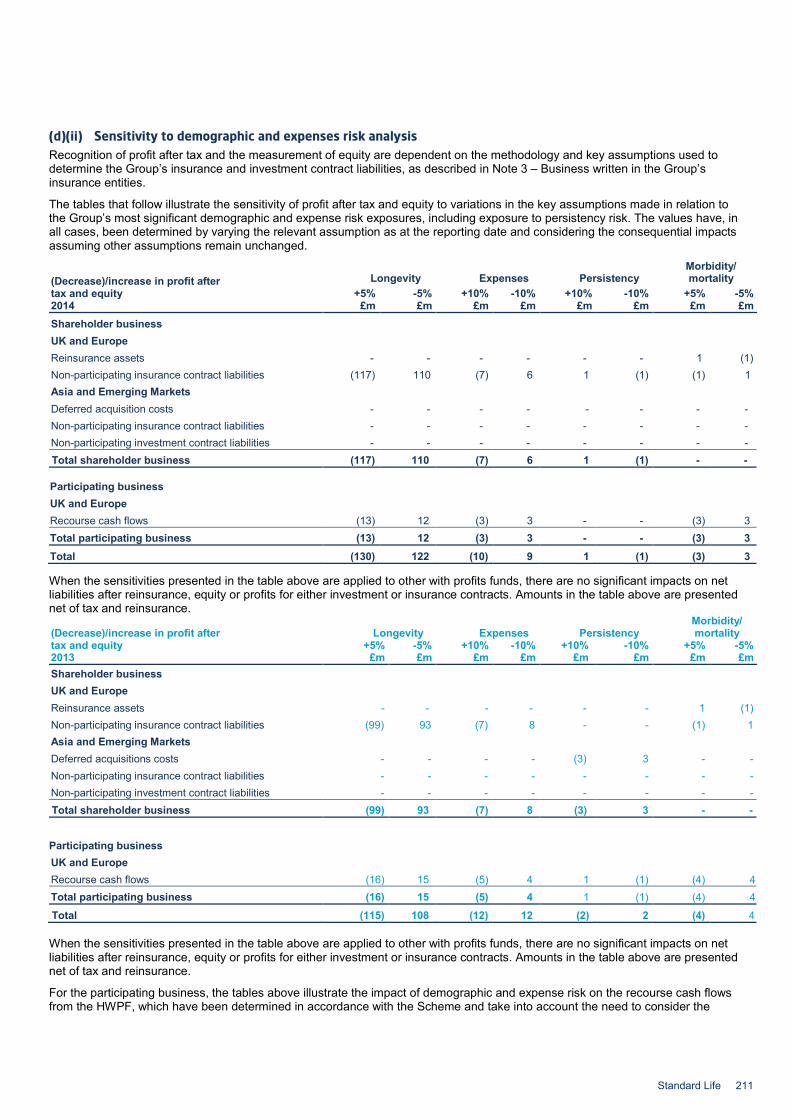
(d)(ii) Sensitivity to demographic and expenses risk analysis Recognition of profit after tax and the measurement of equity are dependent on the methodology and key assumptions used to determine the Group’s insurance and investment contract liabilities, as described in Note 3 – Business written in the Group’s insurance entities.
The tables that follow illustrate the sensitivity of profit after tax and equity to variations in the key assumptions made in relation to the Group’s most significant demographic and expense risk exposures, including exposure to persistency risk. The values have, in all cases, been determined by varying the relevant assumption as at the reporting date and considering the consequential impacts assuming other assumptions remain unchanged.
(Decrease)/increase in profit after tax and equity
Longevity Expenses Persistency Morbidity/ mortality
+5% -5% +10% -10% +10% -10% +5% -5% 2014 £m £m £m £m £m £m £m £m Shareholder business UK and Europe Reinsurance assets - - - - - - 1 (1) Non-participating insurance contract liabilities (117) 110 (7) 6 1 (1) (1) 1 Asia and Emerging Markets Deferred acquisition costs - - - - - - - - Non-participating insurance contract liabilities - - - - - - - - Non-participating investment contract liabilities - - - - - - - - Total shareholder business (117) 110 (7) 6 1 (1) - -
Participating business UK and Europe Recourse cash flows (13) 12 (3) 3 - - (3) 3 Total participating business (13) 12 (3) 3 - - (3) 3 Total (130) 122 (10) 9 1 (1) (3) 3
When the sensitivities presented in the table above are applied to other with profits funds, there are no significant impacts on net liabilities after reinsurance, equity or profits for either investment or insurance contracts. Amounts in the table above are presented net of tax and reinsurance.
(Decrease)/increase in profit after tax and equity
Longevity Expenses Persistency Morbidity/ mortality
+5% -5% +10% -10% +10% -10% +5% -5% 2013 £m £m £m £m £m £m £m £m Shareholder business UK and Europe Reinsurance assets - - - - - - 1 (1) Non-participating insurance contract liabilities (99) 93 (7) 8 - - (1) 1 Asia and Emerging Markets Deferred acquisitions costs - - - - (3) 3 - - Non-participating insurance contract liabilities - - - - - - - - Non-participating investment contract liabilities - - - - - - - - Total shareholder business (99) 93 (7) 8 (3) 3 - -
Participating business UK and Europe Recourse cash flows (16) 15 (5) 4 1 (1) (4) 4 Total participating business (16) 15 (5) 4 1 (1) (4) 4
Total (115) 108 (12) 12 (2) 2 (4) 4
When the sensitivities presented in the table above are applied to other with profits funds, there are no significant impacts on net liabilities after reinsurance, equity or profits for either investment or insurance contracts. Amounts in the table above are presented net of tax and reinsurance.
For the participating business, the tables above illustrate the impact of demographic and expense risk on the recourse cash flows from the HWPF, which have been determined in accordance with the Scheme and take into account the need to consider the
Standard Life 211
3. Financial information – Notes to the Group financial statements continued
42. Risk management continued (d) Demographic and expense risk continued (d)(ii) Sensitivity to demographic and expenses risk analysis continued impact of risk on the financial position of the HWPF before any recourse cash flows can be transferred to the SHF. The terms of the Scheme provide for the retention of recourse cash flows under certain circumstances to support the financial position of the HWPF. Refer to Section (b)(ii).
The shareholder business of UK and Europe currently bears longevity risk both on contracts written in the PBF and on contracts written in the HWPF for which the longevity risk has been transferred to the PBF.
Limitations The financial impact of certain risks is non-linear and consequently the sensitivity of other events may differ from expectations based on those presented in the table. Correlations between the different risks and/or other factors may mean that experience would differ from that expected if more than one risk event occurred simultaneously. The analysis has been assessed as at the reporting date. The results of the sensitivity analysis may vary as a consequence of the passage of time or as a consequence of changes in underlying market or financial conditions. The sensitivity analysis in respect of longevity risk has been performed on the relevant annuity business and presents, for a +5% longevity test, the impact of a 5% reduction in the underlying mortality rates (and vice versa). It has also been based on instantaneous change in the mortality assumption at all ages, rather than considering gradual changes in mortality rate.
(e) Liquidity risk As described in the table on pages 195 to 196, the shareholder is exposed to liquidity risk from shareholder business, participating business and unit linked and segregated funds and, as a result, the following quantitative liquidity risk disclosures are provided in respect of the financial liabilities of these categories.
The shareholder is not exposed to the liquidity risk from the assets held by third parties in consolidated funds and non-controlling interests and therefore these have been excluded from the following quantitative disclosures.
Business units employ risk management techniques relevant to their product types with the objective of mitigating exposures to liquidity risk. For annuity, with profits, and unit linked business, liquidity risk is primarily managed by holding a range of diversified instruments which are assessed against estimated cash flow and funding requirements.
For annuity contracts, assets are held which are specifically chosen with the intention of matching the expected timing of annuity payments. Business units actively manage and monitor the performance of these assets against liability benchmarks and liquidity risk is minimised through the process of planned asset and liability matching. The Group’s assets are analysed in Section (b)(i) and Section (c)(i) of this Note. For UK and Europe, the reinsurance treaty between the Group and Canada Life International Re provides for the cash settlement of amounts owed by Canada Life International Re.
For with profits contracts, a portfolio of assets is maintained in the relevant funds appropriate to the nature and term of the expected pattern of payments of liabilities. Within that portfolio, liquidity is provided by substantial holdings of cash and highly liquid assets (principally government bonds).
Where it is necessary to sell less liquid assets within the relevant portfolios, then any incurred losses are generally passed onto policyholders in accordance with policyholders’ reasonable expectations. Such losses are managed and mitigated through actively anticipating net disinvestment based on policyholder behaviour and seeking to execute sales of underlying assets in such a way that the cost to policyholders is minimised.
For non-participating unit linked contracts, a core portfolio of assets is maintained and invested in accordance with the mandates of the relevant unit linked funds. Policyholder behaviour and the trading position of asset classes are actively monitored. The unit price and value of any associated contracts would reflect the proceeds of any sales of assets. If considered necessary, deferral terms within the policy conditions applying to the majority of the Group’s contracts are invoked. As at 31 December 2014 and 31 December 2013, none of the funds under management were subject to deferral.
Business units undertake periodic investigations into liquidity requirements, which include consideration of cash flows in normal conditions, as well as investigation of scenarios where cash flows differ markedly from those expected (primarily due to extreme policyholder behaviour).
All business units are required to monitor, assess, manage and control liquidity risk in accordance with the relevant principles within the Group’s policy framework. Oversight is provided both at a Group level and within the business unit. In addition, all business units benefit from membership of a larger Group to the extent that, centrally, the Group: • Coordinates strategic planning and funding requirements • Monitors, assesses and oversees the investment of assets within the Group • Monitors and manages risk, capital requirements and available capital on a group-wide basis • Maintains a portfolio of committed bank facilities • Maintains a Euro Medium Term Note Programme.
The Group’s committed bank facilities are currently undrawn and there is no outstanding senior debt issued under the Euro Medium Term Note Programme.
212 Standard Life
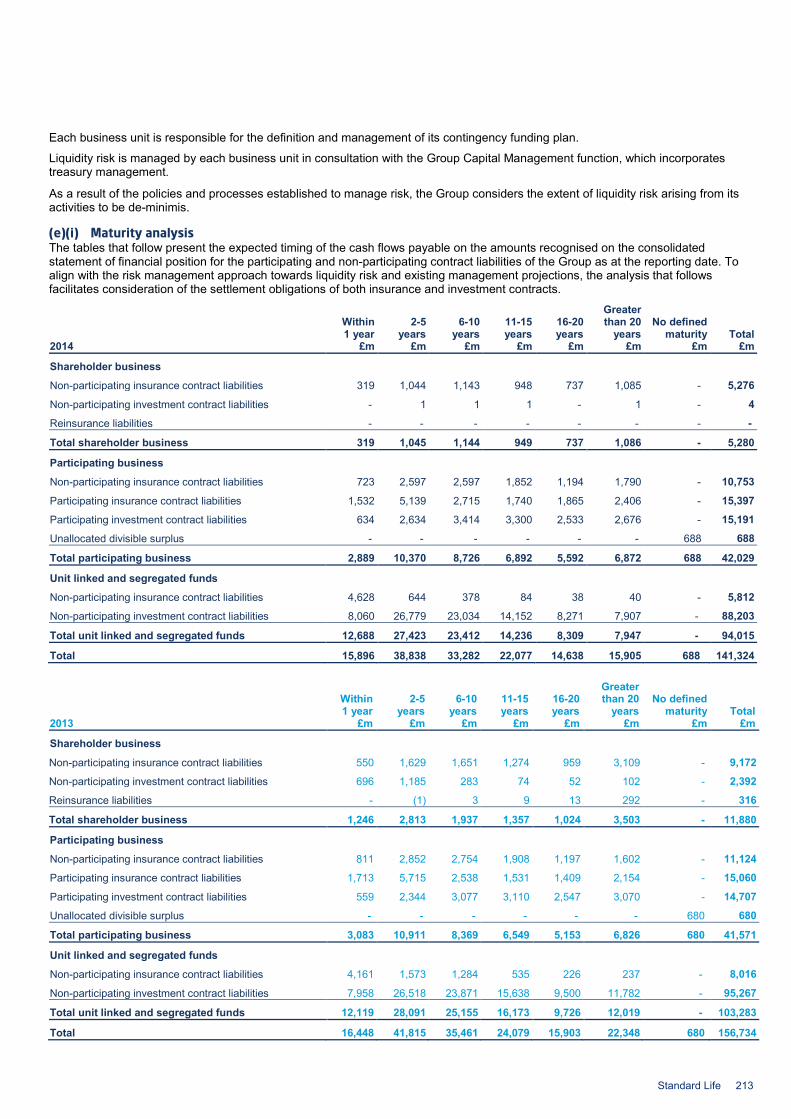
Each business unit is responsible for the definition and management of its contingency funding plan.
Liquidity risk is managed by each business unit in consultation with the Group Capital Management function, which incorporates treasury management.
As a result of the policies and processes established to manage risk, the Group considers the extent of liquidity risk arising from its activities to be de-minimis.
(e)(i) Maturity analysis The tables that follow present the expected timing of the cash flows payable on the amounts recognised on the consolidated statement of financial position for the participating and non-participating contract liabilities of the Group as at the reporting date. To align with the risk management approach towards liquidity risk and existing management projections, the analysis that follows facilitates consideration of the settlement obligations of both insurance and investment contracts.
Within 1 year
2-5 years
6-10 years
11-15 years
16-20 years
Greater than 20
years No defined
maturity Total 2014 £m £m £m £m £m £m £m £m
Shareholder business
Non-participating insurance contract liabilities 319 1,044 1,143 948 737 1,085 - 5,276
Non-participating investment contract liabilities - 1 1 1 - 1 - 4
Reinsurance liabilities - - - - - - - -
Total shareholder business 319 1,045 1,144 949 737 1,086 - 5,280
Participating business
Non-participating insurance contract liabilities 723 2,597 2,597 1,852 1,194 1,790 - 10,753
Participating insurance contract liabilities 1,532 5,139 2,715 1,740 1,865 2,406 - 15,397
Participating investment contract liabilities 634 2,634 3,414 3,300 2,533 2,676 - 15,191
Unallocated divisible surplus - - - - - - 688 688
Total participating business 2,889 10,370 8,726 6,892 5,592 6,872 688 42,029
Unit linked and segregated funds
Non-participating insurance contract liabilities 4,628 644 378 84 38 40 - 5,812
Non-participating investment contract liabilities 8,060 26,779 23,034 14,152 8,271 7,907 - 88,203
Total unit linked and segregated funds 12,688 27,423 23,412 14,236 8,309 7,947 - 94,015
Total 15,896 38,838 33,282 22,077 14,638 15,905 688 141,324
Within 1 year
2-5 years
6-10 years
11-15 years
16-20 years
Greater than 20
years No defined
maturity Total 2013 £m £m £m £m £m £m £m £m
Shareholder business
Non-participating insurance contract liabilities 550 1,629 1,651 1,274 959 3,109 - 9,172
Non-participating investment contract liabilities 696 1,185 283 74 52 102 - 2,392
Reinsurance liabilities - (1) 3 9 13 292 - 316
Total shareholder business 1,246 2,813 1,937 1,357 1,024 3,503 - 11,880
Participating business
Non-participating insurance contract liabilities 811 2,852 2,754 1,908 1,197 1,602 - 11,124
Participating insurance contract liabilities 1,713 5,715 2,538 1,531 1,409 2,154 - 15,060
Participating investment contract liabilities 559 2,344 3,077 3,110 2,547 3,070 - 14,707
Unallocated divisible surplus - - - - - - 680 680
Total participating business 3,083 10,911 8,369 6,549 5,153 6,826 680 41,571
Unit linked and segregated funds
Non-participating insurance contract liabilities 4,161 1,573 1,284 535 226 237 - 8,016
Non-participating investment contract liabilities 7,958 26,518 23,871 15,638 9,500 11,782 - 95,267
Total unit linked and segregated funds 12,119 28,091 25,155 16,173 9,726 12,019 - 103,283
Total 16,448 41,815 35,461 24,079 15,903 22,348 680 156,734
Standard Life 213
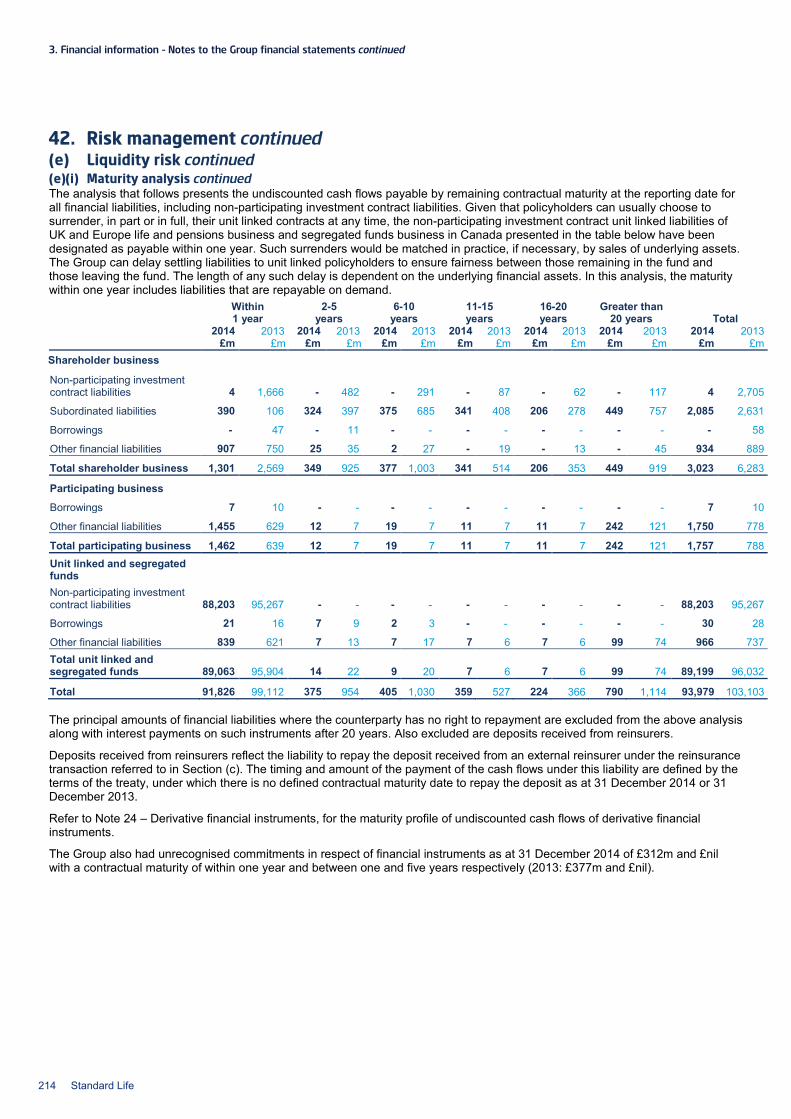
3. Financial information – Notes to the Group financial statements continued
42. Risk management continued (e) Liquidity risk continued (e)(i) Maturity analysis continued The analysis that follows presents the undiscounted cash flows payable by remaining contractual maturity at the reporting date for all financial liabilities, including non-participating investment contract liabilities. Given that policyholders can usually choose to surrender, in part or in full, their unit linked contracts at any time, the non-participating investment contract unit linked liabilities of UK and Europe life and pensions business and segregated funds business in Canada presented in the table below have been designated as payable within one year. Such surrenders would be matched in practice, if necessary, by sales of underlying assets. The Group can delay settling liabilities to unit linked policyholders to ensure fairness between those remaining in the fund and those leaving the fund. The length of any such delay is dependent on the underlying financial assets. In this analysis, the maturity within one year includes liabilities that are repayable on demand.
Within 1 year
2-5 years
6-10 years
11-15 years
16-20 years
Greater than 20 years Total
2014 2013 2014 2013 2014 2013 2014 2013 2014 2013 2014 2013 2014 2013 £m £m £m £m £m £m £m £m £m £m £m £m £m £m Shareholder business Non-participating investment contract liabilities 4 1,666 - 482 - 291 - 87 - 62 - 117 4 2,705
Subordinated liabilities 390 106 324 397 375 685 341 408 206 278 449 757 2,085 2,631
Borrowings - 47 - 11 - - - - - - - - - 58
Other financial liabilities 907 750 25 35 2 27 - 19 - 13 - 45 934 889
Total shareholder business 1,301 2,569 349 925 377 1,003 341 514 206 353 449 919 3,023 6,283
Participating business
Borrowings 7 10 - - - - - - - - - - 7 10
Other financial liabilities 1,455 629 12 7 19 7 11 7 11 7 242 121 1,750 778
Total participating business 1,462 639 12 7 19 7 11 7 11 7 242 121 1,757 788 Unit linked and segregated funds Non-participating investment contract liabilities 88,203 95,267 - - - - - - - - - - 88,203 95,267
Borrowings 21 16 7 9 2 3 - - - - - - 30 28
Other financial liabilities 839 621 7 13 7 17 7 6 7 6 99 74 966 737 Total unit linked and segregated funds 89,063 95,904 14 22 9 20 7 6 7 6 99 74 89,199 96,032
Total 91,826 99,112 375 954 405 1,030 359 527 224 366 790 1,114 93,979 103,103
The principal amounts of financial liabilities where the counterparty has no right to repayment are excluded from the above analysis along with interest payments on such instruments after 20 years. Also excluded are deposits received from reinsurers.
Deposits received from reinsurers reflect the liability to repay the deposit received from an external reinsurer under the reinsurance transaction referred to in Section (c). The timing and amount of the payment of the cash flows under this liability are defined by the terms of the treaty, under which there is no defined contractual maturity date to repay the deposit as at 31 December 2014 or 31 December 2013.
Refer to Note 24 – Derivative financial instruments, for the maturity profile of undiscounted cash flows of derivative financial instruments.
The Group also had unrecognised commitments in respect of financial instruments as at 31 December 2014 of £312m and £nil with a contractual maturity of within one year and between one and five years respectively (2013: £377m and £nil).
214 Standard Life
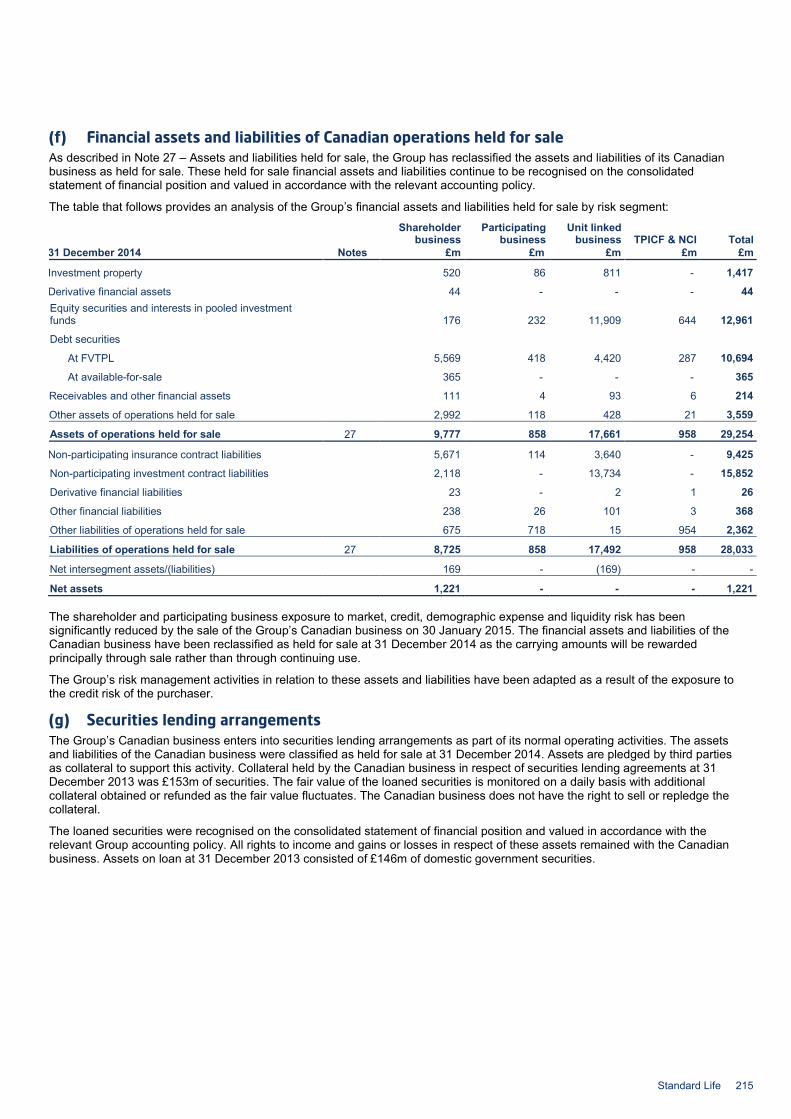
(f) Financial assets and liabilities of Canadian operations held for sale As described in Note 27 – Assets and liabilities held for sale, the Group has reclassified the assets and liabilities of its Canadian business as held for sale. These held for sale financial assets and liabilities continue to be recognised on the consolidated statement of financial position and valued in accordance with the relevant accounting policy.
The table that follows provides an analysis of the Group’s financial assets and liabilities held for sale by risk segment:
Notes
Shareholder business
Participating business
Unit linked business TPICF & NCI Total
31 December 2014 £m £m £m £m £m
Investment property 520 86 811 - 1,417
Derivative financial assets 44 - - - 44 Equity securities and interests in pooled investment funds 176 232 11,909 644 12,961
Debt securities
At FVTPL 5,569 418 4,420 287 10,694
At available-for-sale 365 - - - 365
Receivables and other financial assets 111 4 93 6 214
Other assets of operations held for sale 2,992 118 428 21 3,559
Assets of operations held for sale 27 9,777 858 17,661 958 29,254
Non-participating insurance contract liabilities 5,671 114 3,640 - 9,425
Non-participating investment contract liabilities 2,118 - 13,734 - 15,852
Derivative financial liabilities 23 - 2 1 26
Other financial liabilities 238 26 101 3 368
Other liabilities of operations held for sale 675 718 15 954 2,362
Liabilities of operations held for sale 27 8,725 858 17,492 958 28,033
Net intersegment assets/(liabilities) 169 - (169) - -
Net assets 1,221 - - - 1,221
The shareholder and participating business exposure to market, credit, demographic expense and liquidity risk has been significantly reduced by the sale of the Group’s Canadian business on 30 January 2015. The financial assets and liabilities of the Canadian business have been reclassified as held for sale at 31 December 2014 as the carrying amounts will be rewarded principally through sale rather than through continuing use.
The Group’s risk management activities in relation to these assets and liabilities have been adapted as a result of the exposure to the credit risk of the purchaser.
(g) Securities lending arrangements The Group’s Canadian business enters into securities lending arrangements as part of its normal operating activities. The assets and liabilities of the Canadian business were classified as held for sale at 31 December 2014. Assets are pledged by third parties as collateral to support this activity. Collateral held by the Canadian business in respect of securities lending agreements at 31 December 2013 was £153m of securities. The fair value of the loaned securities is monitored on a daily basis with additional collateral obtained or refunded as the fair value fluctuates. The Canadian business does not have the right to sell or repledge the collateral.
The loaned securities were recognised on the consolidated statement of financial position and valued in accordance with the relevant Group accounting policy. All rights to income and gains or losses in respect of these assets remained with the Canadian business. Assets on loan at 31 December 2013 consisted of £146m of domestic government securities.
Standard Life 215
3. Financial information – Notes to the Group financial statements continued
42. Risk management continued (h) Operational and conduct risk The Group defines operational risk as the risk of loss, or adverse consequences for the Group’s business, resulting from inadequate or failed internal processes, people or systems, or from external events. This includes conduct risk which is defined as the risk that through our culture, strategies, decision-making and behaviours we do not deliver fair outcomes for our customers.
The policy framework, which includes the Group operational risk policy and the Group conduct risk policy, is used to support the management of operational and conduct risks. Business units adopt the relevant minimum standards and limits contained within these policies and are required to manage risk in accordance with the policies, taking mitigating action as appropriate to operate within appetites.
The types of operational risk to which the Group is exposed are identified using the following operational risk categories: • Fraud or irregularities • Regulatory or legal • Customer treatment • Business interruption • Supplier failure • Planning • Process execution • People.
Activities undertaken to ensure the practical operation of controls over financial risks, that is, market, credit, liquidity and demographic and expense risk, are treated as an operational risk.
Operational risk exposures are controlled using one or a combination of the following: modifying operations such that there is no exposure to the risk; accepting exposure to the risk and choosing not to control the risk; or accepting exposure to the risk and controlling the exposure by risk transfer or risk treatment. The factors on which the level of control and nature of the controls implemented are based include: • The potential cause and impact of the risk • The likelihood of the risk being realised in the absence of any controls • The ease with which the risk could be insured against • The cost of implementing controls to reduce the likelihood of the risk being realised • Operational risk appetite.
Control Self Assessment (CSA) is a monitoring activity where business managers assess the operation of the controls for which they are responsible and the adequacy of these controls to manage key operational risks and associated business processes. The assessment completed by business managers is validated and challenged by Group Risk in its role of ‘second line of defence’. Independent assurance as to the effectiveness of the CSA process is provided by Group Internal Audit in its role of ‘third line of defence’. The results of CSA are reported through the risk governance structure. The assessment of operational risk exposures is performed on a qualitative basis using a combination of impact and likelihood, and on a quantitative basis using objective and verifiable measures. The maximum amount of operational risk the Group is willing to retain is defined using both quantitative limits, for example financial impact, and also qualitative statements of principle that articulate the event, or effect, that needs to be limited.
The operational risks faced by each business unit and its exposure to these risks forms its operational risk profile. Each business unit is required to understand and review its profile based on a combination of the estimated impact and likelihood of risk events occurring in the future, the results of CSA and a review of risk exposures relative to approved limits.
The impact of a new product, a significant change, or any one-off transaction on the operational risk profile of each business unit is assessed and managed in accordance with established guidelines or standards.
Strategic risk The Group defines strategic risk as the risk associated with the robustness of the strategic planning process and the threats to the achievement of the strategy. Strategic risks are considered across the Group through the business planning process. The strategic risks to which the Group is exposed are quantified in terms of profitability and severity and are reviewed on a regular basis.
216 Standard Life

43. Structured entities A structured entity is defined as an entity where control is not necessarily held through voting rights linked to ownership stake but rather through rights arising from contractual agreements that give power to direct the relevant activities. The Group’s interests in structured entities is comprised of investments in a range of investment vehicles. The principal types of structured entities in which the Group has an interest include: • Pooled investment funds managed internally and externally, including OEICs, SICAV, unit trusts and limited partnerships • Debt securitisation vehicles which issue asset-backed securities.
(a) Consolidated structured entities The Group consolidates structured entities which it controls. As at 31 December 2014, the Group has not provided any non-contractual financial or other support to any consolidated structured entity and there are no current intentions to do so.
(b) Unconsolidated structured entities The Group has both investments in and other interests in unconsolidated structured entities. The Group has not provided any non-contractual financial or other support to any unconsolidated structured entities and there are no current intentions to do so.
(b)(i) Investments in unconsolidated structured entities The following table shows the carrying value of the Group’s investments in unconsolidated structured entities by line items in the consolidated statement of financial position and by risk segment as defined in Note 42 – Risk management.
Shareholder business
Participating business
Unit linked and segregated funds
Third party interest in consolidated funds and non-controlling
interests Total 2014 £m £m £m £m £m
Investment in associates
16 535 3,568 145
4,264 Equity securities and interests in pooled investment funds 19 92 15,845 1,199
17,155
Debt securities
358 793 851 79
2,081
Total 393 1,420 20,264 1,423 23,500
The asset value of these unconsolidated structured entities including the portion in which the Group has no interest is as follows:
2014
£m
Investment in associates 28,266
Equity securities and interests in pooled investment funds 433,879
Debt securities 31,046
Total 493,191
The Group’s maximum exposure to loss in respect of the interests presented above is the carrying value of the Group’s investment. As noted in Note 42 – Risk management, the shareholder is not exposed to market or credit risk in respect of investments held in the unit linked and segregated funds, and third party interests in consolidated funds and non-controlling interests risk segments.
Additional information on how the Group manages its exposure to risk can be found in Note 42 – Risk management.
(b)(ii) Other interests in unconsolidated structured entities The Group also has interests in structured entities through asset management fees and other fees received. For those structured entities which the Group receives asset management or other fees from but has no direct investment, the maximum exposure to loss is loss of future fees. Total assets under management of structured entities in which the Group has no direct investments but has other interests in are £13,153m at 31 December 2014. The fees received in respect of these assets under management during the year to 31 December 2014 were £65m.
Standard Life 217
3. Financial information – Notes to the Group financial statements continued
44. Fair value of assets and liabilities (a) Determination of fair value hierarchy To provide further information on the approach used to determine and measure the fair value of certain assets and liabilities, the following fair value hierarchy categorisation has been used: Level 1 Fair values measured using quoted prices (unadjusted) in active markets for identical assets or liabilities. An active
market exists where transactions take place with sufficient frequency and volume to provide pricing information on an ongoing basis.
Level 2 Fair values measured using inputs other than quoted prices included within level 1 that are observable for the asset or liability, either directly (i.e. as prices) or indirectly (i.e. derived from prices).
Level 3 Fair values measured using inputs that are not based on observable market data (unobservable inputs).
As noted in Group accounting policies (a) Basis of preparation, the consolidated financial statements for the year ended 31 December 2013 have been restated to reflect retrospective application of changes to accounting policies as a result of new IFRSs adopted in the year. The tables throughout this note have been restated to reflect this.
(b) Financial investments and financial liabilities An analysis of the Group’s financial investments and financial liabilities in accordance with the categories of financial instrument set out in IAS 39 Financial Instruments: Recognition and Measurement is presented in Notes 22 and 35 and includes those financial assets and liabilities held at fair value.
(c) Non-financial investments An analysis of the Group’s investment property and owner occupied property within property, plant and equipment in accordance with IAS 40 – Investment property and IAS 16 – Property, plant and equipment is presented in Notes 19 and 20 respectively and includes those assets held at fair value.
(d) Methods and assumptions used to determine fair value of assets and liabilities Information on the methods and assumptions used to determine fair values for each major category of instrument measured at fair value is given below. These methods and assumptions include those used to fair value assets and liabilities held for sale, including the individual assets and liabilities of operations held for sale.
Investments in associates at FVTPL, equity securities and interests in pooled investment funds, and amounts seeded into funds classified as held for sale
Investments in associates at FVTPL are valued in the same manner as the Group’s equity securities and interests in pooled investment funds.
Equity instruments listed on a recognised exchange are valued using prices sourced from the primary exchange on which they are listed. These instruments are generally considered to be quoted in an active market and are therefore categorised as level 1 instruments within the fair value hierarchy.
Unlisted equities are valued using an adjusted net asset value. The Group’s exposure to unlisted equity securities primarily relates to private equity investments. The majority of the Group’s private equity investments are carried out through European fund of funds structures, where the Group receives valuations from the investment managers of the underlying funds.
The valuations received from investment managers of the underlying funds are reviewed and where appropriate adjustments are made to reflect the impact of changes in market conditions between the date of the valuation and the end of the reporting period. The valuation of these securities is largely based on inputs that are not based on observable market data, and accordingly these instruments are categorised as level 3 instruments within the fair value hierarchy. Where appropriate, reference is made to observable market data.
Where pooled investment funds have been seeded and the investments in the fund have been classified as held for sale, the costs to sell are assumed to be negligible. The fair value of pooled investment funds held for sale is calculated as equal to the observable unit price.
Investment property and owner occupied property The fair value of investment property and all owner occupied property is valued by external property valuation experts. The current use is considered the best indicator of the highest and best use of the Group’s property from a market participants’ perspective. No adjustment has been made for vacant possession for the Group’s owner occupied property.
In UK and Europe valuations are completed in accordance with the Royal Institution of Chartered Surveyors (RICS) valuation standards and predominantly an income capitalisation method is used. In Canada all valuations are completed in accordance with International Valuation Standards (IVS) and predominantly a discounted cash flow method is used. Both valuation techniques are income approaches as they consider the income that an asset will generate over its useful life and estimate fair value through a capitalisation process. Capitalisation involves the conversion of income into a capital sum through the application of an appropriate discount rate.
The determination of the fair value of investment property and all owner occupied property requires the use of estimates such as future cash flows from the assets for example, future rental income and discount rates applicable to those assets.
218 Standard Life
Where it is not possible to use an income approach a market approach will be used whereby comparisons are made to recent transactions with similar characteristics and locations to those of the Group’s assets. Where appropriate, adjustments will be made by the valuer to reflect any differences.
Where an income approach, or a market approach with significant unobservable adjustments, has been used, valuations are predominantly based on unobservable inputs and accordingly these assets are categorised as level 3 within the fair value hierarchy. Where a market approach valuation does not include significant unobservable adjustments, these assets are categorised as level 2.
Derivative financial assets and derivative financial liabilities The majority of the Group’s derivatives are over-the-counter (OTC) derivatives which are fair valued using valuation techniques based on observable market data and are therefore categorised as level 2 investments within the fair value hierarchy.
Exchange traded derivatives are valued using prices sourced from the relevant exchange. They are considered to be instruments quoted in an active market and are therefore categorised as level 1 instruments within the fair value hierarchy.
Non-performance risk arising from the credit risk of each counterparty has been considered on a net exposure basis in line with the Group’s risk management policies. At 31 December 2014 and 31 December 2013 the residual credit risk is considered immaterial and therefore no credit risk adjustment has been made.
Debt securities For debt securities, the Group has determined a hierarchy of pricing sources. The hierarchy consists of reputable external pricing providers who generally use observable market data. If prices are not available from these providers or are considered to be stale, the Group has established procedures to arrive at an internal assessment of the fair value. These procedures are based largely on inputs that are not based on observable market data. A further analysis by category of debt security is as follows:
• Government, including provincial and municipal, and supranational institution bonds These instruments are valued using prices received from external pricing providers who generally base the price on quotes received from a number of market participants. They are categorised as level 1 or level 2 instruments within the fair value hierarchy depending upon the nature of the underlying pricing information used for valuation purposes.
• Corporate bonds listed or quoted in an established over-the-counter market including asset-backed securities These instruments are generally valued using prices received from external pricing providers who generally consolidate quotes received from a panel of banks into a composite price. As the market becomes less active the quotes provided by some banks may be based on modelled prices rather than on actual transactions. These sources are based largely on observable market data, and therefore these instruments are categorised as level 2 instruments within the fair value hierarchy. When prices received from external pricing providers are based on a single broker indicative quote the instruments are categorised as level 3 instruments.
For instruments for which prices are either not available from external pricing providers or the prices provided are considered to be stale, the Group performs its own assessment of the fair value of these instruments. This assessment is largely based on inputs that are not based on observable market data, principally single broker indicative quotes, and accordingly these instruments are categorised as level 3 instruments within the fair value hierarchy.
• Other corporate bonds including unquoted bonds, commercial paper and certificates of deposit These instruments are valued using models. For unquoted bonds the model uses inputs from comparable bonds and includes credit spreads which are obtained from brokers or estimated internally. Commercial paper and certificates of deposit are valued using standard valuation formulas. The categorisation of these instruments within the fair value hierarchy will be either level 2 or 3 depending upon the nature of the underlying pricing information used for valuation purposes.
• Commercial mortgages These instruments are valued using models. The models use a discount rate adjustment technique which is an income approach. The key inputs for the valuation models are contractual future cash flows, which are discounted using a discount rate that is determined by adding a spread to the current base rate. The spread is derived from a pricing matrix which incorporates data on current spreads for similar assets and which may include an internal underwriting rating. These inputs are generally observable with the exception of the spread adjustment arising from the internal underwriting rating. The classification of these instruments within the fair value hierarchy will be either level 2 or 3 depending on whether the spread is adjusted by an internal underwriting rating.
Contingent consideration asset and contingent consideration liability A contingent consideration asset was recognised during the year in respect of a purchase price adjustment mechanism relating to the acquisition of Ignis as discussed in Note 1 – Group structure (b) Acquisitions. The fair value of the asset has been calculated using a binominal tree model. The main inputs are management fee income and expected probabilities of payouts. These are considered unobservable and as a result the asset is classified as level 3 in the fair value hierarchy. A contingent consideration liability was also recognised as a result of business combinations in the year to 31 December 2013, and was valued using a valuation model. The inputs into the model included unobservable inputs due to assumptions made regarding expected movements in assets under management and therefore the liability was classified as level 3 in the fair value hierarchy.
Standard Life 219
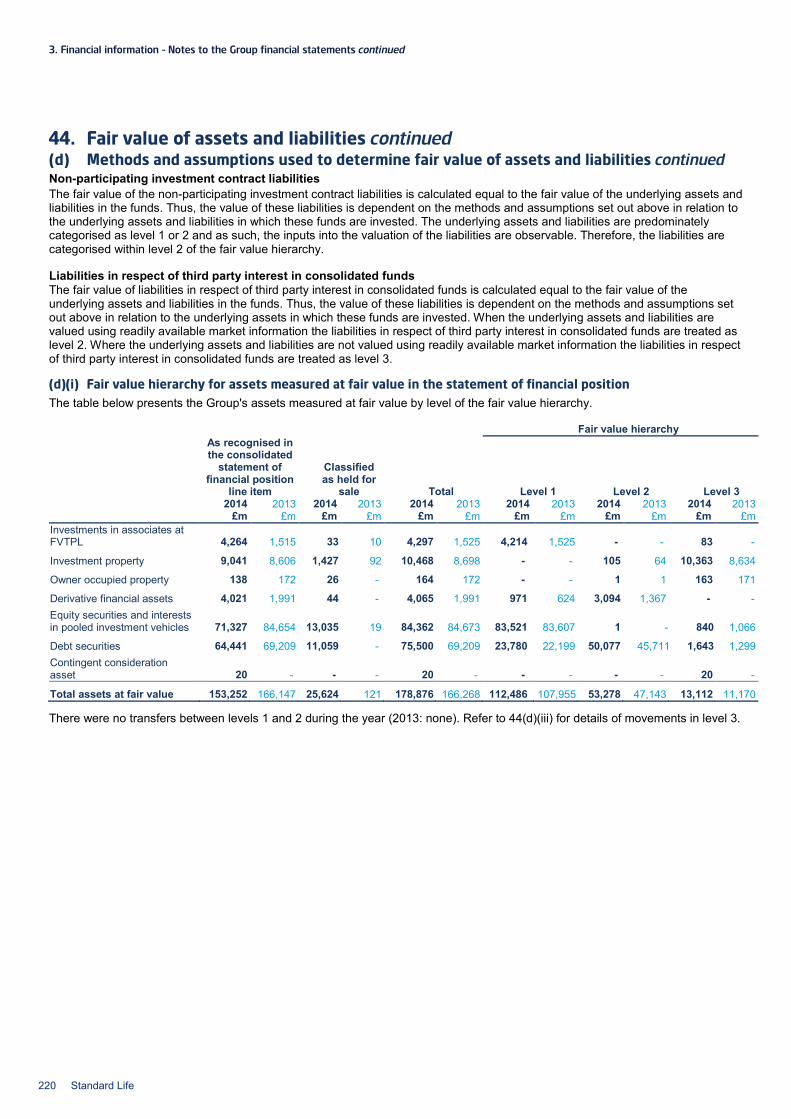
3. Financial information – Notes to the Group financial statements continued
44. Fair value of assets and liabilities continued (d) Methods and assumptions used to determine fair value of assets and liabilities continued Non-participating investment contract liabilities The fair value of the non-participating investment contract liabilities is calculated equal to the fair value of the underlying assets and liabilities in the funds. Thus, the value of these liabilities is dependent on the methods and assumptions set out above in relation to the underlying assets and liabilities in which these funds are invested. The underlying assets and liabilities are predominately categorised as level 1 or 2 and as such, the inputs into the valuation of the liabilities are observable. Therefore, the liabilities are categorised within level 2 of the fair value hierarchy.
Liabilities in respect of third party interest in consolidated funds The fair value of liabilities in respect of third party interest in consolidated funds is calculated equal to the fair value of the underlying assets and liabilities in the funds. Thus, the value of these liabilities is dependent on the methods and assumptions set out above in relation to the underlying assets in which these funds are invested. When the underlying assets and liabilities are valued using readily available market information the liabilities in respect of third party interest in consolidated funds are treated as level 2. Where the underlying assets and liabilities are not valued using readily available market information the liabilities in respect of third party interest in consolidated funds are treated as level 3.
(d)(i) Fair value hierarchy for assets measured at fair value in the statement of financial position The table below presents the Group's assets measured at fair value by level of the fair value hierarchy.
Fair value hierarchy
As recognised in the consolidated
statement of financial position
line item
Classified as held for
sale Total Level 1 Level 2 Level 3 2014 2013 2014 2013 2014 2013 2014 2013 2014 2013 2014 2013 £m £m £m £m £m £m £m £m £m £m £m £m
Investments in associates at FVTPL 4,264 1,515 33 10 4,297 1,525 4,214 1,525 - - 83 -
Investment property 9,041 8,606 1,427 92 10,468 8,698 - - 105 64 10,363 8,634
Owner occupied property 138 172 26 - 164 172 - - 1 1 163 171
Derivative financial assets 4,021 1,991 44 - 4,065 1,991 971 624 3,094 1,367 - - Equity securities and interests in pooled investment vehicles 71,327 84,654 13,035 19 84,362 84,673 83,521 83,607 1 - 840 1,066
Debt securities 64,441 69,209 11,059 - 75,500 69,209 23,780 22,199 50,077 45,711 1,643 1,299 Contingent consideration asset 20 - - - 20 - - - - - 20 -
Total assets at fair value 153,252 166,147 25,624 121 178,876 166,268 112,486 107,955 53,278 47,143 13,112 11,170
There were no transfers between levels 1 and 2 during the year (2013: none). Refer to 44(d)(iii) for details of movements in level 3.
220 Standard Life
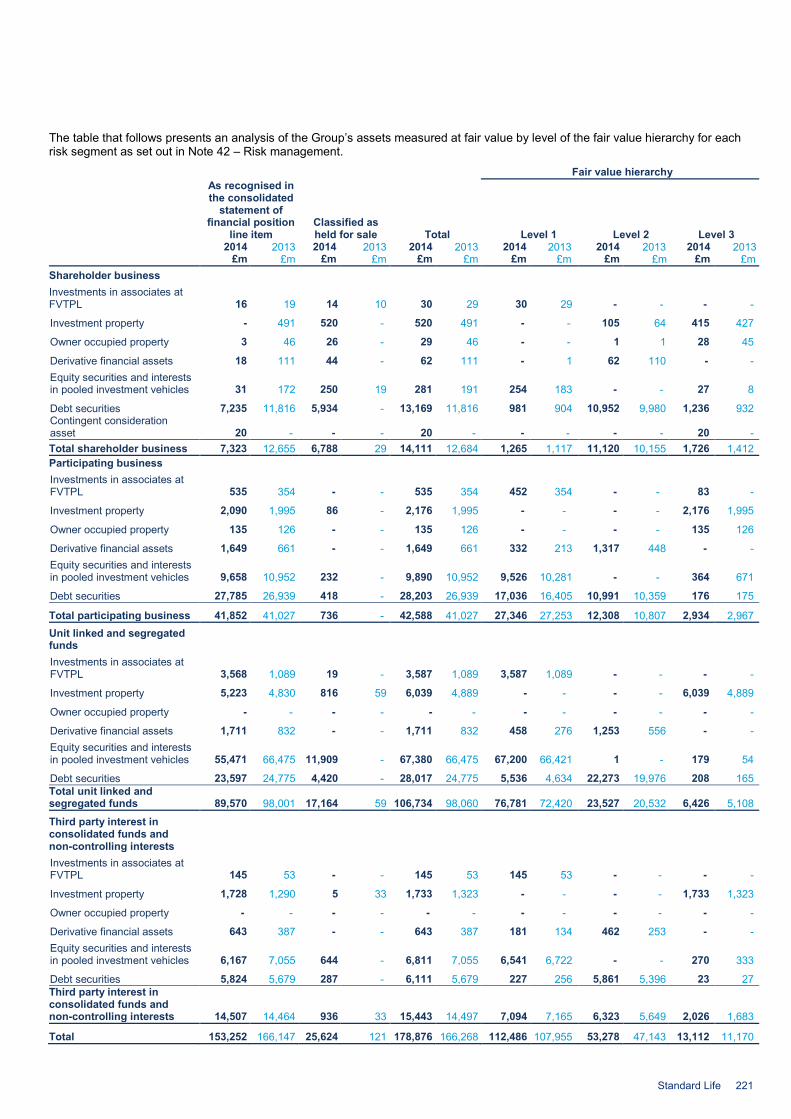
The table that follows presents an analysis of the Group’s assets measured at fair value by level of the fair value hierarchy for each risk segment as set out in Note 42 – Risk management.
Fair value hierarchy
As recognised in the consolidated
statement of financial position
line item Classified as held for sale Total Level 1 Level 2 Level 3
2014 2013 2014 2013 2014 2013 2014 2013 2014 2013 2014 2013 £m £m £m £m £m £m £m £m £m £m £m £m Shareholder business Investments in associates at FVTPL 16 19 14 10 30 29 30 29 - - - -
Investment property - 491 520 - 520 491 - - 105 64 415 427
Owner occupied property 3 46 26 - 29 46 - - 1 1 28 45
Derivative financial assets 18 111 44 - 62 111 - 1 62 110 - - Equity securities and interests in pooled investment vehicles 31 172 250 19 281 191 254 183 - - 27 8
Debt securities 7,235 11,816 5,934 - 13,169 11,816 981 904 10,952 9,980 1,236 932 Contingent consideration asset 20 - - - 20 - - - - - 20 - Total shareholder business 7,323 12,655 6,788 29 14,111 12,684 1,265 1,117 11,120 10,155 1,726 1,412 Participating business Investments in associates at FVTPL 535 354 - - 535 354 452 354 - - 83 -
Investment property 2,090 1,995 86 - 2,176 1,995 - - - - 2,176 1,995
Owner occupied property 135 126 - - 135 126 - - - - 135 126
Derivative financial assets 1,649 661 - - 1,649 661 332 213 1,317 448 - - Equity securities and interests in pooled investment vehicles 9,658 10,952 232 - 9,890 10,952 9,526 10,281 - - 364 671
Debt securities 27,785 26,939 418 - 28,203 26,939 17,036 16,405 10,991 10,359 176 175
Total participating business 41,852 41,027 736 - 42,588 41,027 27,346 27,253 12,308 10,807 2,934 2,967 Unit linked and segregated funds Investments in associates at FVTPL 3,568 1,089 19 - 3,587 1,089 3,587 1,089 - - - -
Investment property 5,223 4,830 816 59 6,039 4,889 - - - - 6,039 4,889
Owner occupied property - - - - - - - - - - - -
Derivative financial assets 1,711 832 - - 1,711 832 458 276 1,253 556 - - Equity securities and interests in pooled investment vehicles 55,471 66,475 11,909 - 67,380 66,475 67,200 66,421 1 - 179 54
Debt securities 23,597 24,775 4,420 - 28,017 24,775 5,536 4,634 22,273 19,976 208 165 Total unit linked and segregated funds 89,570 98,001 17,164 59 106,734 98,060 76,781 72,420 23,527 20,532 6,426 5,108
Third party interest in consolidated funds and non-controlling interests Investments in associates at FVTPL 145 53 - - 145 53 145 53 - - - -
Investment property 1,728 1,290 5 33 1,733 1,323 - - - - 1,733 1,323
Owner occupied property - - - - - - - - - - - -
Derivative financial assets 643 387 - - 643 387 181 134 462 253 - - Equity securities and interests in pooled investment vehicles 6,167 7,055 644 - 6,811 7,055 6,541 6,722 - - 270 333
Debt securities 5,824 5,679 287 - 6,111 5,679 227 256 5,861 5,396 23 27 Third party interest in consolidated funds and non-controlling interests 14,507 14,464 936 33 15,443 14,497 7,094 7,165 6,323 5,649 2,026 1,683
Total 153,252 166,147 25,624 121 178,876 166,268 112,486 107,955 53,278 47,143 13,112 11,170
Standard Life 221
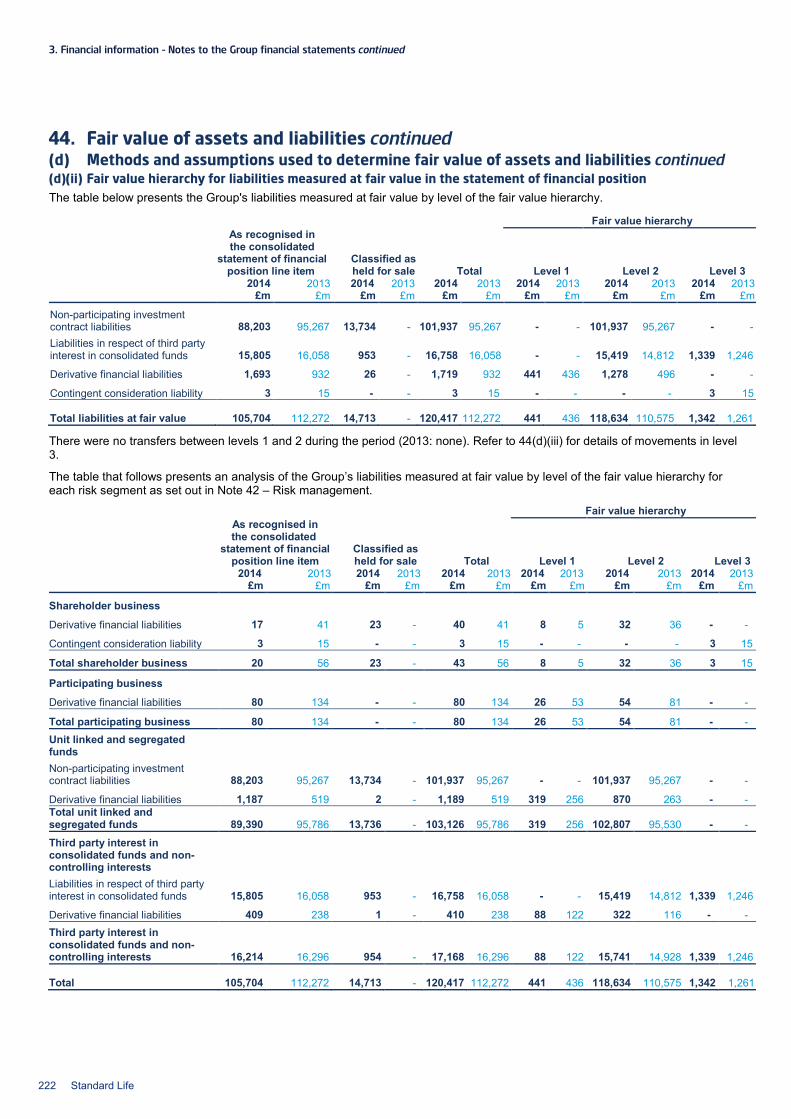
3. Financial information – Notes to the Group financial statements continued
44. Fair value of assets and liabilities continued (d) Methods and assumptions used to determine fair value of assets and liabilities continued (d)(ii) Fair value hierarchy for liabilities measured at fair value in the statement of financial position The table below presents the Group's liabilities measured at fair value by level of the fair value hierarchy.
Fair value hierarchy
As recognised in the consolidated
statement of financial position line item
Classified as held for sale Total Level 1 Level 2 Level 3
2014 2013 2014 2013 2014 2013 2014 2013 2014 2013 2014 2013 £m £m £m £m £m £m £m £m £m £m £m £m
Non-participating investment contract liabilities 88,203 95,267 13,734 -
101,937 95,267 - - 101,937 95,267 - -
Liabilities in respect of third party interest in consolidated funds 15,805 16,058 953 -
16,758 16,058 - - 15,419 14,812 1,339 1,246
Derivative financial liabilities 1,693 932 26 - 1,719 932 441 436 1,278 496 - -
Contingent consideration liability 3 15 - - 3 15 - - - - 3 15
Total liabilities at fair value 105,704 112,272 14,713 -
120,417 112,272 441 436 118,634 110,575 1,342 1,261
There were no transfers between levels 1 and 2 during the period (2013: none). Refer to 44(d)(iii) for details of movements in level 3.
The table that follows presents an analysis of the Group’s liabilities measured at fair value by level of the fair value hierarchy for each risk segment as set out in Note 42 – Risk management.
Fair value hierarchy
As recognised in the consolidated
statement of financial position line item
Classified as held for sale Total Level 1 Level 2 Level 3
2014 2013 2014 2013 2014 2013 2014 2013 2014 2013 2014 2013 £m £m £m £m £m £m £m £m £m £m £m £m
Shareholder business
Derivative financial liabilities 17 41 23 - 40 41 8 5 32 36 - -
Contingent consideration liability 3 15 - - 3 15 - - - - 3 15
Total shareholder business 20 56 23 - 43 56 8 5 32 36 3 15
Participating business
Derivative financial liabilities 80 134 - - 80 134 26 53 54 81 - -
Total participating business 80 134 - - 80 134 26 53 54 81 - - Unit linked and segregated funds Non-participating investment contract liabilities 88,203 95,267 13,734 - 101,937 95,267 - -
101,937 95,267 - -
Derivative financial liabilities 1,187 519 2 - 1,189 519 319 256 870 263 - - Total unit linked and segregated funds 89,390 95,786 13,736 -
103,126 95,786 319 256 102,807 95,530 - -
Third party interest in consolidated funds and non-controlling interests Liabilities in respect of third party interest in consolidated funds 15,805 16,058 953 -
16,758 16,058 - - 15,419 14,812
1,339 1,246
Derivative financial liabilities 409 238 1 - 410 238 88 122 322 116 - - Third party interest in consolidated funds and non-controlling interests 16,214 16,296 954 -
17,168 16,296 88 122 15,741 14,928
1,339 1,246
Total
105,704 112,272 14,713 - 120,417 112,272 441 436 118,634 110,575 1,342 1,261
222 Standard Life
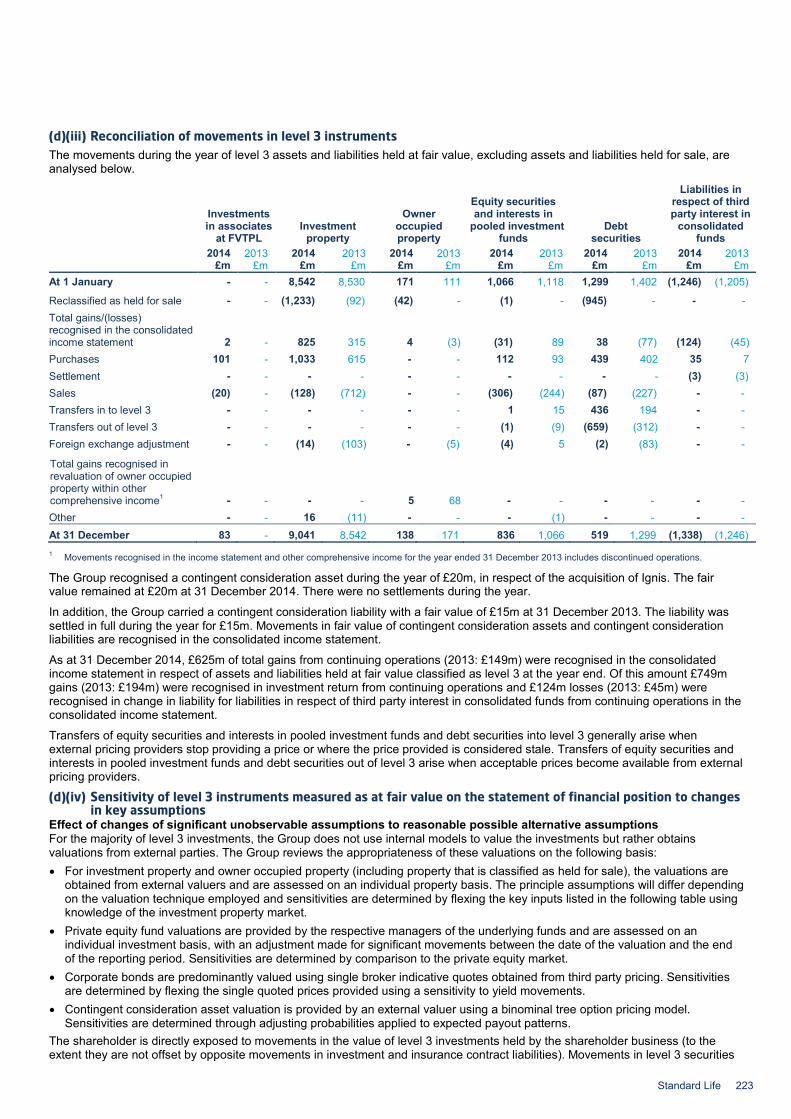
(d)(iii) Reconciliation of movements in level 3 instruments The movements during the year of level 3 assets and liabilities held at fair value, excluding assets and liabilities held for sale, are analysed below.
Investments in associates
at FVTPL Investment
property
Owner occupied property
Equity securities and interests in
pooled investment funds
Debt securities
Liabilities in respect of third party interest in
consolidated funds
2014 2013 2014 2013 2014 2013 2014 2013 2014 2013 2014 2013 £m £m £m £m £m £m £m £m £m £m £m £m
At 1 January - - 8,542 8,530 171 111 1,066 1,118 1,299 1,402 (1,246) (1,205)
Reclassified as held for sale - - (1,233) (92) (42) - (1) - (945) - - - Total gains/(losses) recognised in the consolidated income statement 2 - 825 315 4 (3) (31) 89 38 (77) (124) (45) Purchases 101 - 1,033 615 - - 112 93 439 402 35 7 Settlement - - - - - - - - - - (3) (3) Sales (20) - (128) (712) - - (306) (244) (87) (227) - - Transfers in to level 3 - - - - - - 1 15 436 194 - - Transfers out of level 3 - - - - - - (1) (9) (659) (312) - - Foreign exchange adjustment - - (14) (103) - (5) (4) 5 (2) (83) - -
Total gains recognised in revaluation of owner occupied property within other comprehensive income1 - - - - 5 68 - - - - - - Other - - 16 (11) - - - (1) - - - - At 31 December 83 - 9,041 8,542 138 171 836 1,066 519 1,299 (1,338) (1,246) 1 Movements recognised in the income statement and other comprehensive income for the year ended 31 December 2013 includes discontinued operations.
The Group recognised a contingent consideration asset during the year of £20m, in respect of the acquisition of Ignis. The fair value remained at £20m at 31 December 2014. There were no settlements during the year.
In addition, the Group carried a contingent consideration liability with a fair value of £15m at 31 December 2013. The liability was settled in full during the year for £15m. Movements in fair value of contingent consideration assets and contingent consideration liabilities are recognised in the consolidated income statement.
As at 31 December 2014, £625m of total gains from continuing operations (2013: £149m) were recognised in the consolidated income statement in respect of assets and liabilities held at fair value classified as level 3 at the year end. Of this amount £749m gains (2013: £194m) were recognised in investment return from continuing operations and £124m losses (2013: £45m) were recognised in change in liability for liabilities in respect of third party interest in consolidated funds from continuing operations in the consolidated income statement.
Transfers of equity securities and interests in pooled investment funds and debt securities into level 3 generally arise when external pricing providers stop providing a price or where the price provided is considered stale. Transfers of equity securities and interests in pooled investment funds and debt securities out of level 3 arise when acceptable prices become available from external pricing providers.
(d)(iv) Sensitivity of level 3 instruments measured as at fair value on the statement of financial position to changes in key assumptions
Effect of changes of significant unobservable assumptions to reasonable possible alternative assumptions For the majority of level 3 investments, the Group does not use internal models to value the investments but rather obtains valuations from external parties. The Group reviews the appropriateness of these valuations on the following basis: • For investment property and owner occupied property (including property that is classified as held for sale), the valuations are
obtained from external valuers and are assessed on an individual property basis. The principle assumptions will differ depending on the valuation technique employed and sensitivities are determined by flexing the key inputs listed in the following table using knowledge of the investment property market.
• Private equity fund valuations are provided by the respective managers of the underlying funds and are assessed on an individual investment basis, with an adjustment made for significant movements between the date of the valuation and the end of the reporting period. Sensitivities are determined by comparison to the private equity market.
• Corporate bonds are predominantly valued using single broker indicative quotes obtained from third party pricing. Sensitivities are determined by flexing the single quoted prices provided using a sensitivity to yield movements.
• Contingent consideration asset valuation is provided by an external valuer using a binominal tree option pricing model. Sensitivities are determined through adjusting probabilities applied to expected payout patterns.
The shareholder is directly exposed to movements in the value of level 3 investments held by the shareholder business (to the extent they are not offset by opposite movements in investment and insurance contract liabilities). Movements in level 3 securities
Standard Life 223
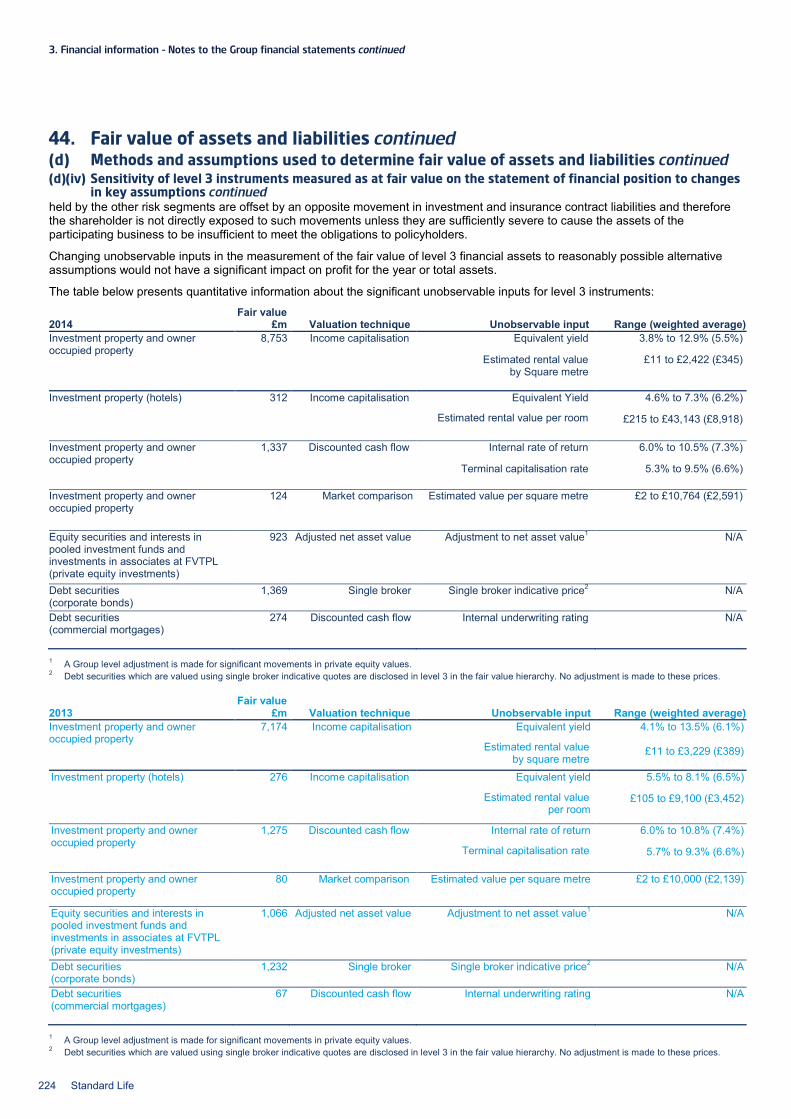
3. Financial information – Notes to the Group financial statements continued
44. Fair value of assets and liabilities continued (d) Methods and assumptions used to determine fair value of assets and liabilities continued (d)(iv) Sensitivity of level 3 instruments measured as at fair value on the statement of financial position to changes
in key assumptions continued held by the other risk segments are offset by an opposite movement in investment and insurance contract liabilities and therefore the shareholder is not directly exposed to such movements unless they are sufficiently severe to cause the assets of the participating business to be insufficient to meet the obligations to policyholders.
Changing unobservable inputs in the measurement of the fair value of level 3 financial assets to reasonably possible alternative assumptions would not have a significant impact on profit for the year or total assets.
The table below presents quantitative information about the significant unobservable inputs for level 3 instruments:
Fair value 2014 £m Valuation technique Unobservable input Range (weighted average) Investment property and owner occupied property
8,753 Income capitalisation Equivalent yield
Estimated rental value by Square metre
3.8% to 12.9% (5.5%)
£11 to £2,422 (£345)
Investment property (hotels) 312 Income capitalisation Equivalent Yield
Estimated rental value per room
4.6% to 7.3% (6.2%)
£215 to £43,143 (£8,918)
Investment property and owner occupied property
1,337 Discounted cash flow Internal rate of return
Terminal capitalisation rate
6.0% to 10.5% (7.3%)
5.3% to 9.5% (6.6%)
Investment property and owner occupied property
124 Market comparison Estimated value per square metre
£2 to £10,764 (£2,591)
Equity securities and interests in pooled investment funds and investments in associates at FVTPL (private equity investments)
923 Adjusted net asset value Adjustment to net asset value1 N/A
Debt securities (corporate bonds)
1,369 Single broker Single broker indicative price2 N/A
Debt securities (commercial mortgages)
274 Discounted cash flow Internal underwriting rating N/A
1 A Group level adjustment is made for significant movements in private equity values. 2 Debt securities which are valued using single broker indicative quotes are disclosed in level 3 in the fair value hierarchy. No adjustment is made to these prices.
Fair value 2013 £m Valuation technique Unobservable input Range (weighted average) Investment property and owner occupied property
7,174 Income capitalisation Equivalent yield
Estimated rental value by square metre
4.1% to 13.5% (6.1%)
£11 to £3,229 (£389)
Investment property (hotels) 276 Income capitalisation Equivalent yield
Estimated rental value per room
5.5% to 8.1% (6.5%)
£105 to £9,100 (£3,452)
Investment property and owner occupied property
1,275 Discounted cash flow Internal rate of return
Terminal capitalisation rate
6.0% to 10.8% (7.4%)
5.7% to 9.3% (6.6%)
Investment property and owner occupied property
80 Market comparison Estimated value per square metre £2 to £10,000 (£2,139)
Equity securities and interests in pooled investment funds and investments in associates at FVTPL (private equity investments)
1,066 Adjusted net asset value Adjustment to net asset value1 N/A
Debt securities (corporate bonds)
1,232 Single broker Single broker indicative price2 N/A
Debt securities (commercial mortgages)
67 Discounted cash flow Internal underwriting rating N/A
1 A Group level adjustment is made for significant movements in private equity values. 2 Debt securities which are valued using single broker indicative quotes are disclosed in level 3 in the fair value hierarchy. No adjustment is made to these prices.
224 Standard Life
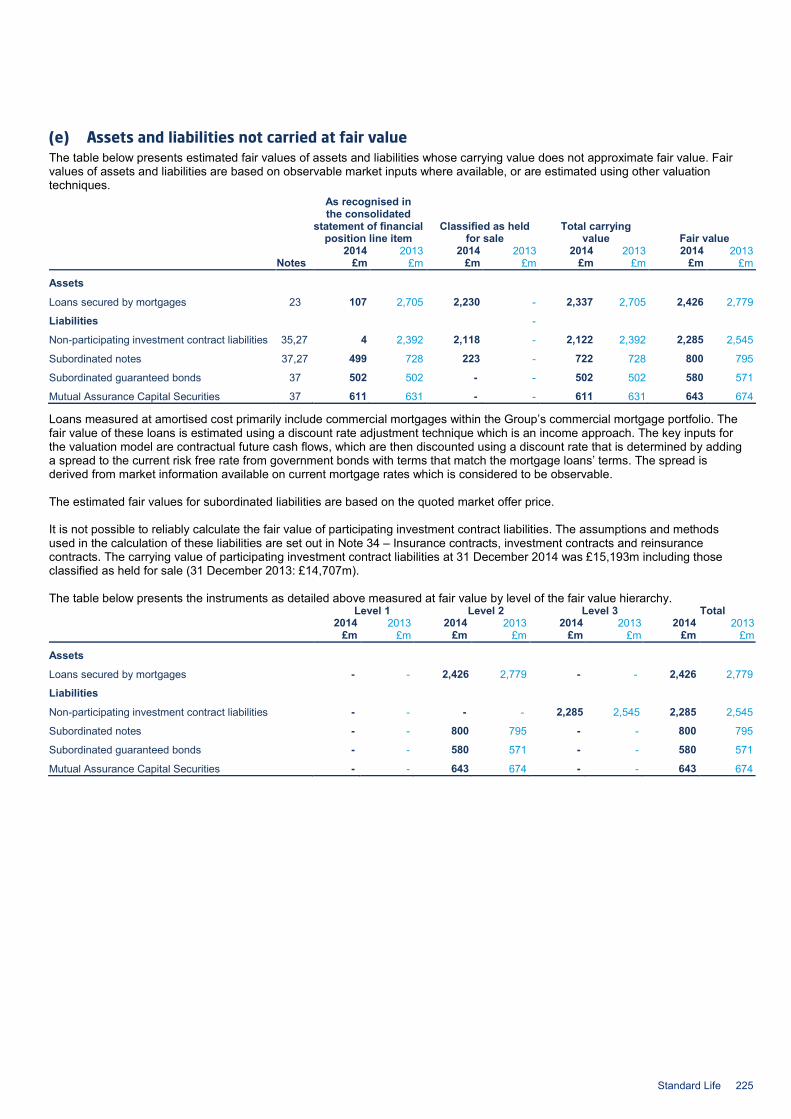
(e) Assets and liabilities not carried at fair value The table below presents estimated fair values of assets and liabilities whose carrying value does not approximate fair value. Fair values of assets and liabilities are based on observable market inputs where available, or are estimated using other valuation techniques.
As recognised in the consolidated
statement of financial position line item
Classified as held for sale
Total carrying value Fair value
2014 2013 2014 2013 2014 2013 2014 2013 Notes £m £m £m £m £m £m £m £m
Assets
Loans secured by mortgages 23 107 2,705 2,230 - 2,337 2,705 2,426 2,779
Liabilities -
Non-participating investment contract liabilities 35,27 4 2,392 2,118 - 2,122 2,392 2,285 2,545
Subordinated notes 37,27 499 728 223 - 722 728 800 795
Subordinated guaranteed bonds 37 502 502 - - 502 502 580 571
Mutual Assurance Capital Securities 37 611 631 - - 611 631 643 674
Loans measured at amortised cost primarily include commercial mortgages within the Group’s commercial mortgage portfolio. The fair value of these loans is estimated using a discount rate adjustment technique which is an income approach. The key inputs for the valuation model are contractual future cash flows, which are then discounted using a discount rate that is determined by adding a spread to the current risk free rate from government bonds with terms that match the mortgage loans’ terms. The spread is derived from market information available on current mortgage rates which is considered to be observable. The estimated fair values for subordinated liabilities are based on the quoted market offer price. It is not possible to reliably calculate the fair value of participating investment contract liabilities. The assumptions and methods used in the calculation of these liabilities are set out in Note 34 – Insurance contracts, investment contracts and reinsurance contracts. The carrying value of participating investment contract liabilities at 31 December 2014 was £15,193m including those classified as held for sale (31 December 2013: £14,707m). The table below presents the instruments as detailed above measured at fair value by level of the fair value hierarchy.
Level 1 Level 2 Level 3 Total 2014 2013 2014 2013 2014 2013 2014 2013 £m £m £m £m £m £m £m £m
Assets
Loans secured by mortgages - - 2,426 2,779 - - 2,426 2,779
Liabilities
Non-participating investment contract liabilities - - - - 2,285 2,545 2,285 2,545
Subordinated notes - - 800 795 - - 800 795
Subordinated guaranteed bonds - - 580 571 - - 580 571
Mutual Assurance Capital Securities - - 643 674 - - 643 674
Standard Life 225
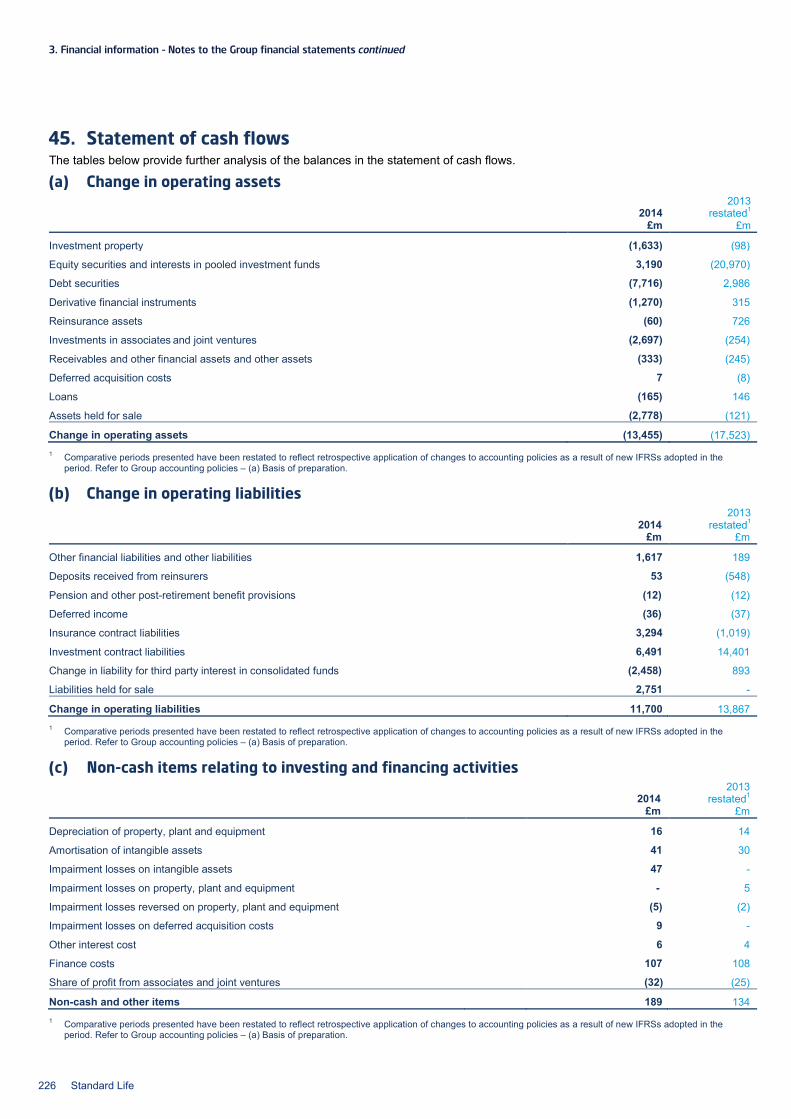
3. Financial information – Notes to the Group financial statements continued
45. Statement of cash flows The tables below provide further analysis of the balances in the statement of cash flows.
(a) Change in operating assets
2014 2013
restated1 £m £m
Investment property (1,633) (98)
Equity securities and interests in pooled investment funds 3,190 (20,970)
Debt securities (7,716) 2,986
Derivative financial instruments (1,270) 315
Reinsurance assets (60) 726
Investments in associates and joint ventures (2,697) (254)
Receivables and other financial assets and other assets (333) (245)
Deferred acquisition costs 7 (8)
Loans (165) 146
Assets held for sale (2,778) (121)
Change in operating assets (13,455) (17,523) 1 Comparative periods presented have been restated to reflect retrospective application of changes to accounting policies as a result of new IFRSs adopted in the
period. Refer to Group accounting policies – (a) Basis of preparation.
(b) Change in operating liabilities
2014 2013
restated1 £m £m
Other financial liabilities and other liabilities 1,617 189
Deposits received from reinsurers 53 (548)
Pension and other post-retirement benefit provisions (12) (12)
Deferred income (36) (37)
Insurance contract liabilities 3,294 (1,019)
Investment contract liabilities 6,491 14,401
Change in liability for third party interest in consolidated funds (2,458) 893
Liabilities held for sale 2,751 -
Change in operating liabilities 11,700 13,867 1 Comparative periods presented have been restated to reflect retrospective application of changes to accounting policies as a result of new IFRSs adopted in the
period. Refer to Group accounting policies – (a) Basis of preparation.
(c) Non-cash items relating to investing and financing activities
2014 2013
restated1 £m £m
Depreciation of property, plant and equipment 16 14
Amortisation of intangible assets 41 30
Impairment losses on intangible assets 47 -
Impairment losses on property, plant and equipment - 5
Impairment losses reversed on property, plant and equipment (5) (2)
Impairment losses on deferred acquisition costs 9 -
Other interest cost 6 4
Finance costs 107 108
Share of profit from associates and joint ventures (32) (25)
Non-cash and other items 189 134 1 Comparative periods presented have been restated to reflect retrospective application of changes to accounting policies as a result of new IFRSs adopted in the
period. Refer to Group accounting policies – (a) Basis of preparation.
226 Standard Life
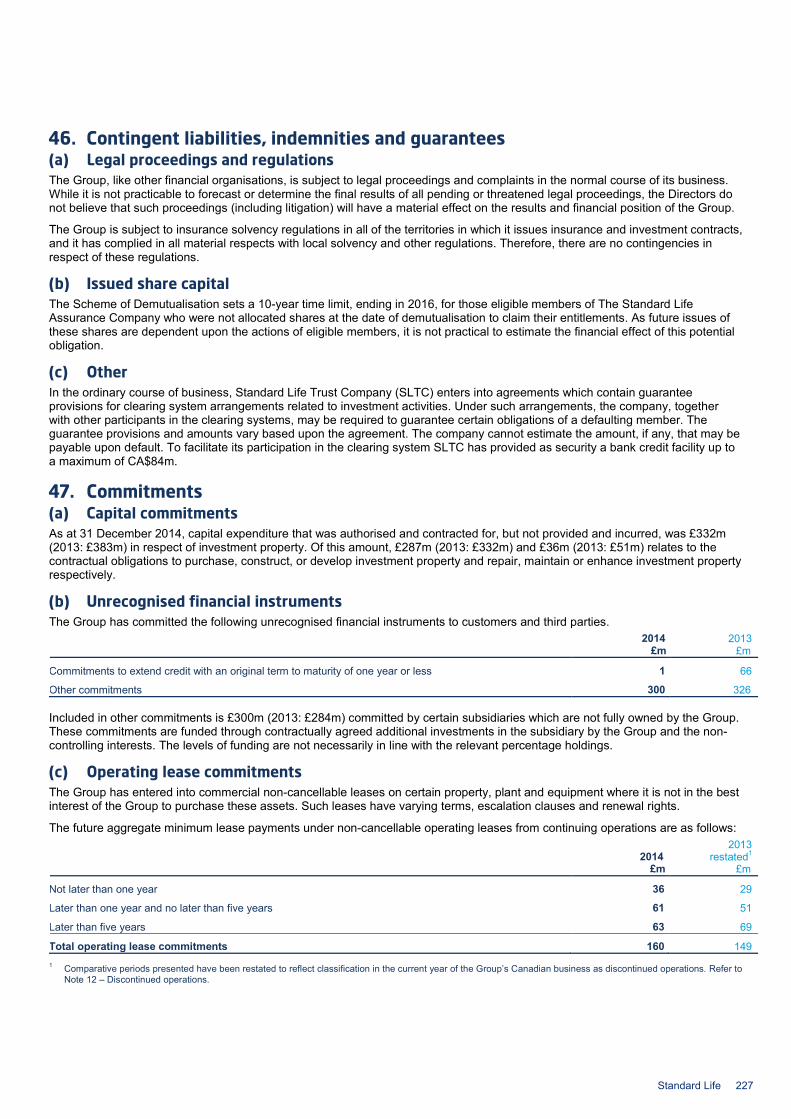
46. Contingent liabilities, indemnities and guarantees (a) Legal proceedings and regulations The Group, like other financial organisations, is subject to legal proceedings and complaints in the normal course of its business. While it is not practicable to forecast or determine the final results of all pending or threatened legal proceedings, the Directors do not believe that such proceedings (including litigation) will have a material effect on the results and financial position of the Group.
The Group is subject to insurance solvency regulations in all of the territories in which it issues insurance and investment contracts, and it has complied in all material respects with local solvency and other regulations. Therefore, there are no contingencies in respect of these regulations.
(b) Issued share capital The Scheme of Demutualisation sets a 10-year time limit, ending in 2016, for those eligible members of The Standard Life Assurance Company who were not allocated shares at the date of demutualisation to claim their entitlements. As future issues of these shares are dependent upon the actions of eligible members, it is not practical to estimate the financial effect of this potential obligation.
(c) Other In the ordinary course of business, Standard Life Trust Company (SLTC) enters into agreements which contain guarantee provisions for clearing system arrangements related to investment activities. Under such arrangements, the company, together with other participants in the clearing systems, may be required to guarantee certain obligations of a defaulting member. The guarantee provisions and amounts vary based upon the agreement. The company cannot estimate the amount, if any, that may be payable upon default. To facilitate its participation in the clearing system SLTC has provided as security a bank credit facility up to a maximum of CA$84m.
47. Commitments (a) Capital commitments As at 31 December 2014, capital expenditure that was authorised and contracted for, but not provided and incurred, was £332m (2013: £383m) in respect of investment property. Of this amount, £287m (2013: £332m) and £36m (2013: £51m) relates to the contractual obligations to purchase, construct, or develop investment property and repair, maintain or enhance investment property respectively.
(b) Unrecognised financial instruments The Group has committed the following unrecognised financial instruments to customers and third parties. 2014 2013 £m £m
Commitments to extend credit with an original term to maturity of one year or less 1 66
Other commitments 300 326
Included in other commitments is £300m (2013: £284m) committed by certain subsidiaries which are not fully owned by the Group. These commitments are funded through contractually agreed additional investments in the subsidiary by the Group and the non-controlling interests. The levels of funding are not necessarily in line with the relevant percentage holdings.
(c) Operating lease commitments The Group has entered into commercial non-cancellable leases on certain property, plant and equipment where it is not in the best interest of the Group to purchase these assets. Such leases have varying terms, escalation clauses and renewal rights.
The future aggregate minimum lease payments under non-cancellable operating leases from continuing operations are as follows:
2014 2013
restated1 £m £m
Not later than one year 36 29
Later than one year and no later than five years 61 51
Later than five years 63 69
Total operating lease commitments 160 149 1 Comparative periods presented have been restated to reflect classification in the current year of the Group’s Canadian business as discontinued operations. Refer to
Note 12 – Discontinued operations.
Standard Life 227
3. Financial information – Notes to the Group financial statements continued
48. Employee share-based payments The Group has established a number of share-based payment schemes for employees. Details of these arrangements are as follows:
Share options (i) Long-term incentive plans The Group operates the following long-term incentive plans. Plan Recipients Conditions which must be met prior to vesting Long-term incentive plan (LTIP)
Executives and senior management Service and performance conditions as set out in the Directors’ remuneration report
Standard Life Investments long-term incentive plan (Standard Life Investments LTIP)
Executives and senior management of Standard Life Investments
Service and performance conditions as set out in the Directors’ remuneration report
Restricted stock plan (RSP)
Executives (other than executive Directors) and senior management
Service, or service and performance conditions. These are tailored to the individual award
All of the awards are equity-settled other than awards made under the Standard Life Investments LTIP in respect of employees in the US, France and Asia which are cash-settled.
(ii) Short-term incentive plan (annual bonus deferred shares) The majority of the members of the executive and senior management including executive Directors participate in the Group annual bonus. Under the terms of the 2014 and 2013 annual bonus, half of any bonus earned by executive Directors and members of the executive team above 25% of salary will be settled in nil-cost options which are deferred for a period of two years, subject to the deferred amount being worth 10% or more of salary. Further details of the annual bonus are set out in the Directors’ remuneration report.
Employees may forfeit some or all of awards made under any of the above share-based payment schemes if they leave the Group prior to the end of the awards vesting period.
(iii) Sharesave (Save-as-you-earn) The Group operates Save-as-you-earn (SAYE) plans, which allow eligible employees in the UK and Ireland the opportunity to save a monthly amount from their salaries, over either a three or five year period, which can be used to purchase shares in the Company. The shares can be purchased at the end of the savings period at a predetermined price. Employees are granted a predetermined number of options based on the monthly savings amount and duration of their contract. The conditions attached to the options are that the employee remains in employment for three years after the grant date of the options and that the employee satisfies the monthly savings requirement. Settlement will be made in the form of shares.
Share awards (i) Share incentive plan The Group operates a share incentive plan, allowing employees the opportunity to buy shares from their salary each month. The maximum purchase that an employee can make in any year is £1,800 (the maximum limit increased from £1,500 from 1 September 2014). The Group offers to match the number of shares bought up to a value of £25 each month. The matching shares awarded under the share incentive plan are granted at the end of each month. The matching shares are generally subject to a three year service period.
228 Standard Life
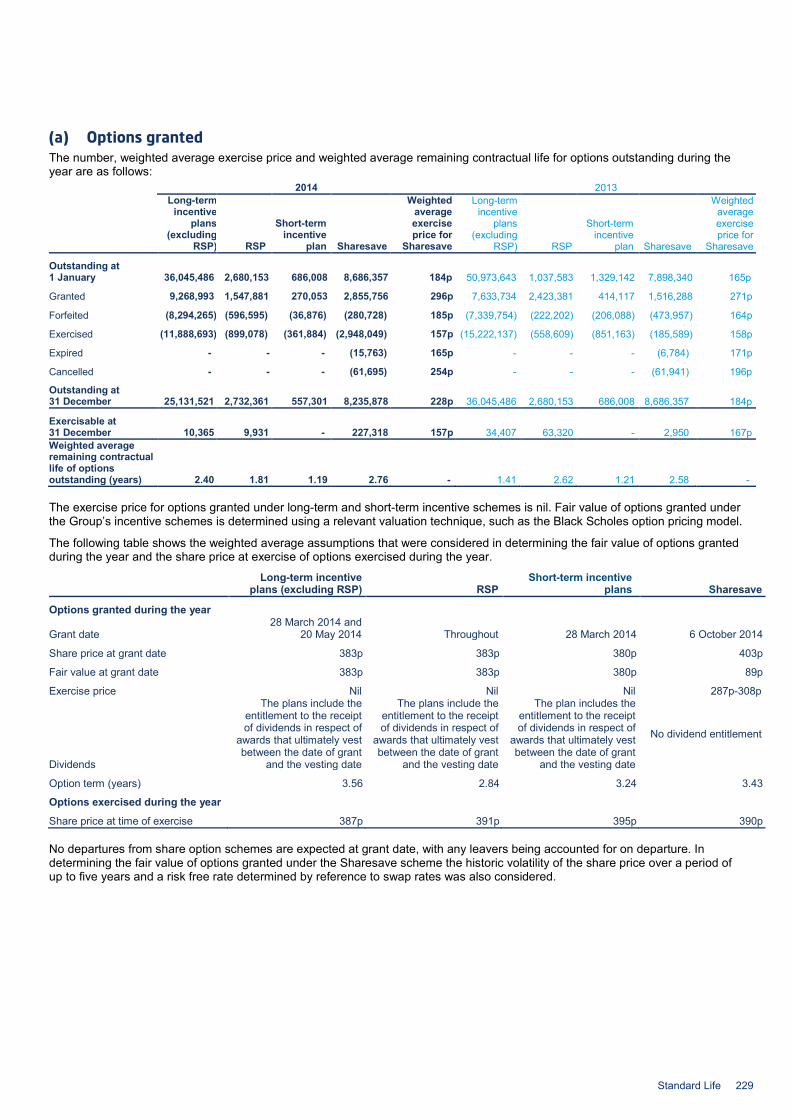
(a) Options granted The number, weighted average exercise price and weighted average remaining contractual life for options outstanding during the year are as follows:
2014 2013
Long-term incentive
plans (excluding
RSP) RSP
Short-term incentive
plan Sharesave
Weighted average exercise price for
Sharesave
Long-term incentive
plans (excluding
RSP) RSP
Short-term incentive
plan Sharesave
Weighted average exercise price for
Sharesave
Outstanding at 1 January 36,045,486 2,680,153 686,008 8,686,357 184p 50,973,643 1,037,583 1,329,142 7,898,340 165p
Granted 9,268,993 1,547,881 270,053 2,855,756 296p 7,633,734 2,423,381 414,117 1,516,288 271p
Forfeited (8,294,265) (596,595) (36,876) (280,728) 185p (7,339,754) (222,202) (206,088) (473,957) 164p
Exercised (11,888,693) (899,078) (361,884) (2,948,049) 157p (15,222,137) (558,609) (851,163) (185,589) 158p
Expired - - - (15,763) 165p - - - (6,784) 171p
Cancelled - - - (61,695) 254p - - - (61,941) 196p
Outstanding at 31 December 25,131,521 2,732,361 557,301 8,235,878 228p 36,045,486 2,680,153 686,008 8,686,357 184p
Exercisable at 31 December 10,365 9,931 - 227,318 157p 34,407 63,320 - 2,950 167p Weighted average remaining contractual life of options outstanding (years) 2.40 1.81 1.19 2.76 - 1.41 2.62 1.21 2.58 -
The exercise price for options granted under long-term and short-term incentive schemes is nil. Fair value of options granted under the Group’s incentive schemes is determined using a relevant valuation technique, such as the Black Scholes option pricing model.
The following table shows the weighted average assumptions that were considered in determining the fair value of options granted during the year and the share price at exercise of options exercised during the year.
Long-term incentive plans (excluding RSP) RSP
Short-term incentive plans Sharesave
Options granted during the year
Grant date 28 March 2014 and
20 May 2014 Throughout 28 March 2014 6 October 2014
Share price at grant date 383p 383p 380p 403p
Fair value at grant date 383p 383p 380p 89p
Exercise price Nil Nil Nil 287p-308p
Dividends
The plans include the entitlement to the receipt of dividends in respect of
awards that ultimately vest between the date of grant
and the vesting date
The plans include the entitlement to the receipt of dividends in respect of
awards that ultimately vest between the date of grant
and the vesting date
The plan includes the entitlement to the receipt of dividends in respect of
awards that ultimately vest between the date of grant
and the vesting date
No dividend entitlement
Option term (years) 3.56 2.84 3.24 3.43
Options exercised during the year
Share price at time of exercise 387p 391p 395p 390p
No departures from share option schemes are expected at grant date, with any leavers being accounted for on departure. In determining the fair value of options granted under the Sharesave scheme the historic volatility of the share price over a period of up to five years and a risk free rate determined by reference to swap rates was also considered.
Standard Life 229

3. Financial information – Notes to the Group financial statements continued
48. Employee share-based payments continued (a) Options granted continued The following table shows the range of exercise prices of options outstanding at 31 December 2014. All options are exercisable for a period of six months after the vesting date.
2014 2013 Number of options outstanding Number of options outstanding
Long-term incentive plans
£nil 27,863,882 38,725,639
Short-term incentive plan
£nil 557,301 686,008
Sharesave
157p 3,129,728 6,281,020
218p-234p 823,405 894,547
250p-272p 1,465,743 1,510,790
287p-308p 2,817,002 -
Outstanding at 31 December 36,657,061 48,098,004
(b) Share incentive plans The terms and conditions of the ongoing arrangements are set out in the table below and are based on the weighted average number of awards. 2014 2013
Number of instruments granted1 318,208 349,865
Share price at date of grant 389p 361p
Fair value per granted instrument at grant date 389p 361p 1 Included in the number of instruments granted are 53,598 (2013: 58,657) rights to shares granted to eligible employees in Canada, Germany and Austria.
The fair value of instruments granted under the share incentive plan is calculated by reference to the share price at grant date. The plan includes the entitlement to the receipt of dividends in respect of awards that ultimately vest between the date of grant and the vesting date. At the grant date all awards are expected to vest. No departures are expected at the grant date, with leavers being accounted for on departure.
(c) Employee share-based payment expense The amounts recognised as an expense in Note 8 for equity-settled share-based payment transactions with employees are as follows:
2014 2013
restated1 £m £m
Share options granted under long-term incentive plans 22 26
Share options granted under Sharesave 1 1
Share options granted under short-term incentive plans 1 1
Matching shares granted under share incentive plans 1 1
Expense from continuing operations 25 29
Expense from discontinued operations 2 3
27 32 1 Comparative periods presented have been restated to reflect classification in the current year of the Group’s Canadian business as discontinued operations. Refer to
Note 12 – Discontinued operations.
Additionally, the Group incurred an expense for cash-settled share-based payment schemes from continuing operations of £2m in 2014 (2013: £3m) and £nil (2013: £1m) from discontinued operations. The liability for cash-settled share-based payments outstanding at 31 December 2014 is £6m (2013: £5m).
230 Standard Life

49. Related party transactions (a) Transactions and balances with related parties In the normal course of business, the Group enters into transactions with related parties that relate to insurance and investment management business.
Transactions with related parties carried out by the Group during the year were as follows:
2014 2013
restated1 £m £m Sale to
Associates 451 717 Joint ventures 1 13 Other related parties 94 31
546 761 Purchase from
Associates 816 663 Joint ventures 14 24
830 687 1 Comparatives for the year ended 31 December 2013 have been restated to reflect retrospective application of changes to accounting policies as a result of new
IFRSs adopted in the period and the classification in the current year of the Group’s Canadian business as discontinued operations. Refer to Group accounting policies – (a) Basis of preparation and Note 12 – Discontinued operations.
Sales to and amounts due from other related parties include management fees received/receivable from non-consolidated investment vehicles managed by Standard Life Investments.
The year end balances arising from transactions carried out by the Group with related parties are as follows: 2014 2013 £m £m Due from related parties
Associates 16 16 Joint ventures 2 3
18 19
In addition to the amounts shown above, the Group’s defined benefit pension plans have assets of £1,553m (2013: £782m) invested in investment vehicles managed by the Group.
(b) Compensation of key management personnel Key management personnel comprise 19 people (2013: 19 people) within the Group, including all Directors, both executive and non-executive and the direct reports of the position of Chief Executive. Detailed disclosures of Directors’ remuneration for the year and transactions in which the Directors are interested are contained within the audited section of the Directors’ remuneration report.
The summary of compensation of key management personnel is as follows:
2014 2013
restated1 £m £m Salaries and other short-term employee benefits 9 8 Post-employment benefits 1 1 Share-based payments 4 5 Termination benefits - 1 Total compensation of key management personnel 14 15 1 Comparative periods presented have been restated to reflect classification in the current year of the Group’s Canadian business as discontinued operations. Refer to
Note 12 – Discontinued operations.
(c) Transactions with key management personnel and their close family members All transactions between key management and their close family members, and the Group during the year are on terms which are equivalent to those available to all employees of the Group.
During the year to 31 December 2014, key management personnel and their close family members contributed £1m (2013: £3m) to products sold by the Group.
Standard Life 231
3. Financial information – Notes to the Group financial statements continued
50. Capital statement Capital management policies and risk management objectives Capital can be measured on a number of different bases, which are set out in the Strategic report Section 1.3 – Chief Financial Officer’s overview. The capital statement shows capital based on definitions used for regulatory reporting purposes.
Managing capital is the ongoing process of determining and maintaining the quantity and quality of capital appropriate for the Group, and ensuring capital is deployed in a manner consistent with the expectations of our stakeholders. For these purposes, the Board considers our key stakeholders to be the providers of capital (our equity holders, policyholders and holders of our subordinated liabilities) and the Prudential Regulation Authority (PRA).
There are two primary objectives of capital management within the Group. The first objective is to ensure that capital is, and will continue to be, adequate to maintain the required level of safety and stability of the Group and hence to provide an appropriate degree of security to our stakeholders – this aspect is measured by the Group’s regulatory solvency position. The second objective is to create equity holder value by driving profit attributable to equity holders.
The capital management policy forms one pillar of the Group’s overall management framework. Most notably, it operates alongside, and complements, the strategic investment policy and the Group risk policy. By integrating policies in this way, the Group is working towards a capital management framework that robustly links the process of capital allocation, value creation and risk management.
The capital requirements of each business unit are forecast on a periodic basis, and the requirements are assessed against both forecast available capital and local regulatory capital requirements. In addition, internal rates of return achieved on capital invested are assessed against hurdle rates, which are intended to represent the minimum acceptable return given the risks associated with each investment. The capital planning process is the responsibility of the Chief Financial Officer. Capital plans are ultimately subject to approval by the Board.
The formal procedures for identifying and assessing risks that could affect the capital position of the Group are described in the risk management policies set out in Note 42 – Risk management.
Regulatory capital The Group operates in a number of geographical regions, and local regulators, primarily the PRA, specify rules and guidance for the minimum level of capital required to meet local requirements.
The PRA requires all insurance companies and financial conglomerates to maintain capital resources in excess of their capital resources requirement (CRR). Capital resources include the assets in excess of liabilities, valued on a regulatory basis, and certain other components of capital. Certain items that are classified as liabilities under IAS 32 Financial Instruments: Disclosure and Presentation are treated as capital under the regulatory basis. For the Group, this applies to its subordinated guaranteed bonds, Mutual Assurance Capital Securities and subordinated notes. The CRR represents the total of the individual capital resources requirements of each regulated company in the Group.
In addition to the requirement to maintain capital resources in excess of its CRR, each regulated company in the Group is required to identify the major risks it faces and, if appropriate, quantifies the amount and type of capital it believes is appropriate to mitigate those risks. This individual capital assessment (ICA) reflects each company's view of the adequacy of its capital resources.
There are many factors which affect the Group’s capital resources. The determination of the liabilities includes various assumptions including potential changes in market conditions and the actions management might take as a result of those changes. Changes in market conditions and other variables have the potential to significantly affect the capital position. Poor investment returns could depress capital resources, but this could be mitigated by changing the asset portfolio and by the level of bonuses declared. Future annuitant longevity could be significantly different from that assumed in the calculation of the liabilities. European Union developments on solvency requirements could also have a significant impact on the future capital position.
Capital structure The Group is classified as an insurance group by the PRA. The largest regulated entity within the Group is Standard Life Assurance Limited (SLAL), which undertakes life assurance and pension business principally in the UK, Ireland and Germany.
The majority of life assurance and pensions business undertaken by UK regulated entities is written within long-term business funds within each regulated company. These long-term business funds are distinct from the equity holders’ funds. Business written prior to demutualisation, and the increments to that business, are written in the Heritage With Profits Fund (HWPF). Business written after demutualisation is written in the other long-term business funds, principally the Proprietary Business Fund (PBF).
232 Standard Life

The HWPF’s capital resources of £4,317m at 31 December 2014 (2013: £4,700m) and future surplus arising can be used to provide support for the HWPF, enhance payments to with profits policyholders or, in relation to the recourse cash flows (as explained in accounting policy (v)), transfer defined amounts out of the fund to accrue to the benefit of equity holders. Additional restrictions are placed on the HWPF by the Scheme of Demutualisation (the Scheme), which provides that the recourse cash flows will be subject to a solvency test which restricts transfers of the recourse cash flows if, as a result of the transfer, the HWPF would have a realistic deficit or would have a regulatory surplus below the level which the board of SLAL considers necessary to declare bonuses, in accordance with reasonable benefit expectations of with profits policyholders, without creating a regulatory deficit.
Any surplus within the PBF is attributable to equity holders. Capital within the PBF may be made available to meet requirements elsewhere in the Group subject to meeting the regulatory requirements of the fund and any further restrictions imposed by the Scheme. The regulatory results of SLAL have the most significant impact on the Group capital position. The other significant components are the held for sale insurance entities in Canada and insurance entities in Asia and non-insurance entities, including Standard Life Investments Limited and Standard Life plc.
The Group’s capital position is analysed between UK regulated life business, overseas life operations and other activities. The UK regulated life business is analysed by the nature of the underlying funds and includes German and Irish business written by branches of UK regulated companies. Other activities mainly comprise investment management and group corporate centre. The Group’s capital position, based on draft regulatory returns, is set out in the following table. This includes the capital position and contract liabilities of the Canadian business classified as held for sale in the consolidated statement of financial position.
Standard Life 233
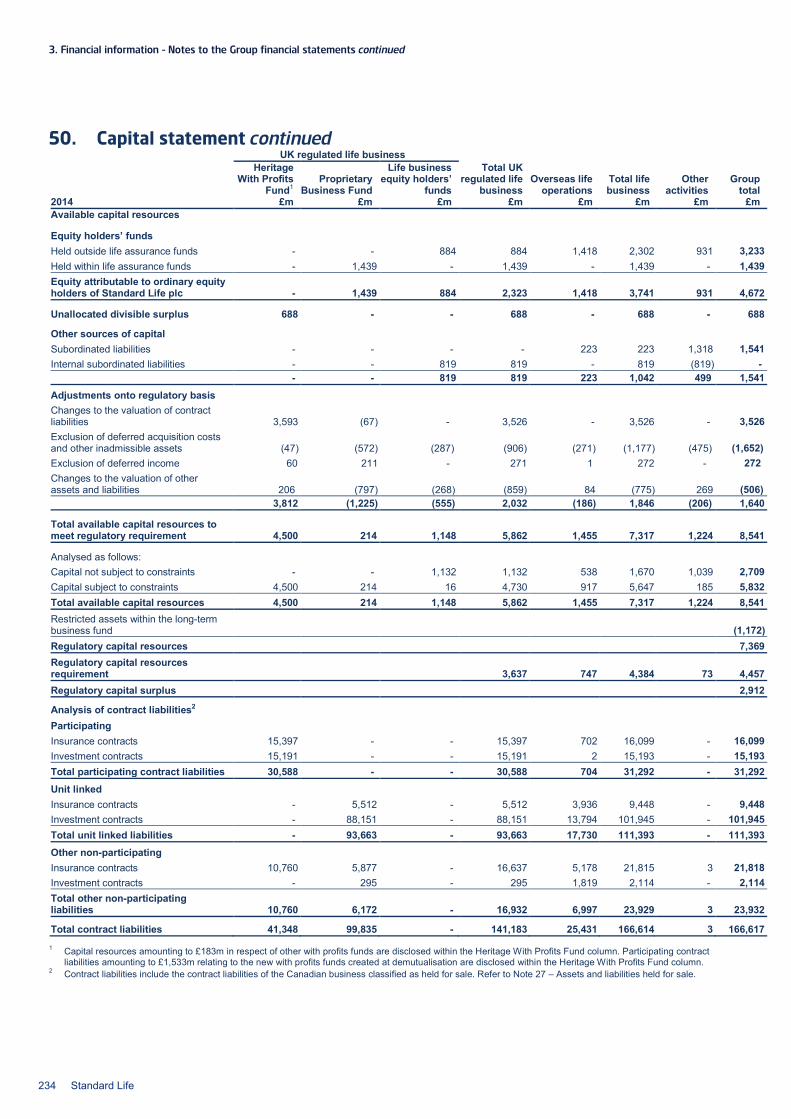
3. Financial information – Notes to the Group financial statements continued
50. Capital statement continued UK regulated life business
Heritage With Profits
Fund1 Proprietary
Business Fund
Life business equity holders’
funds
Total UK regulated life
business Overseas life
operations Total life business
Other activities
Group total
2014 £m £m £m £m £m £m £m £m Available capital resources
Equity holders’ funds
Held outside life assurance funds - - 884 884 1,418 2,302 931 3,233 Held within life assurance funds - 1,439 - 1,439 - 1,439 - 1,439 Equity attributable to ordinary equity holders of Standard Life plc - 1,439 884 2,323 1,418 3,741 931 4,672
Unallocated divisible surplus 688 - - 688 - 688 - 688
Other sources of capital Subordinated liabilities - - - - 223 223 1,318 1,541 Internal subordinated liabilities - - 819 819 - 819 (819) -
- - 819 819 223 1,042 499 1,541
Adjustments onto regulatory basis Changes to the valuation of contract liabilities 3,593 (67) - 3,526 - 3,526 - 3,526 Exclusion of deferred acquisition costs and other inadmissible assets (47) (572) (287) (906) (271) (1,177) (475) (1,652) Exclusion of deferred income 60 211 - 271 1 272 - 272 Changes to the valuation of other assets and liabilities 206 (797) (268) (859) 84 (775) 269 (506) 3,812 (1,225) (555) 2,032 (186) 1,846 (206) 1,640
Total available capital resources to meet regulatory requirement 4,500 214 1,148 5,862 1,455 7,317 1,224 8,541
Analysed as follows: Capital not subject to constraints - - 1,132 1,132 538 1,670 1,039 2,709 Capital subject to constraints 4,500 214 16 4,730 917 5,647 185 5,832 Total available capital resources 4,500 214 1,148 5,862 1,455 7,317 1,224 8,541 Restricted assets within the long-term business fund (1,172) Regulatory capital resources 7,369 Regulatory capital resources requirement 3,637 747 4,384 73 4,457 Regulatory capital surplus 2,912
Analysis of contract liabilities2
Participating Insurance contracts 15,397 - - 15,397 702 16,099 - 16,099 Investment contracts 15,191 - - 15,191 2 15,193 - 15,193 Total participating contract liabilities 30,588 - - 30,588 704 31,292 - 31,292
Unit linked Insurance contracts - 5,512 - 5,512 3,936 9,448 - 9,448 Investment contracts - 88,151 - 88,151 13,794 101,945 - 101,945 Total unit linked liabilities - 93,663 - 93,663 17,730 111,393 - 111,393
Other non-participating Insurance contracts 10,760 5,877 - 16,637 5,178 21,815 3 21,818 Investment contracts - 295 - 295 1,819 2,114 - 2,114 Total other non-participating liabilities 10,760 6,172 - 16,932 6,997 23,929 3 23,932
Total contract liabilities 41,348 99,835 - 141,183 25,431 166,614 3 166,617 1 Capital resources amounting to £183m in respect of other with profits funds are disclosed within the Heritage With Profits Fund column. Participating contract
liabilities amounting to £1,533m relating to the new with profits funds created at demutualisation are disclosed within the Heritage With Profits Fund column. 2 Contract liabilities include the contract liabilities of the Canadian business classified as held for sale. Refer to Note 27 – Assets and liabilities held for sale.
234 Standard Life
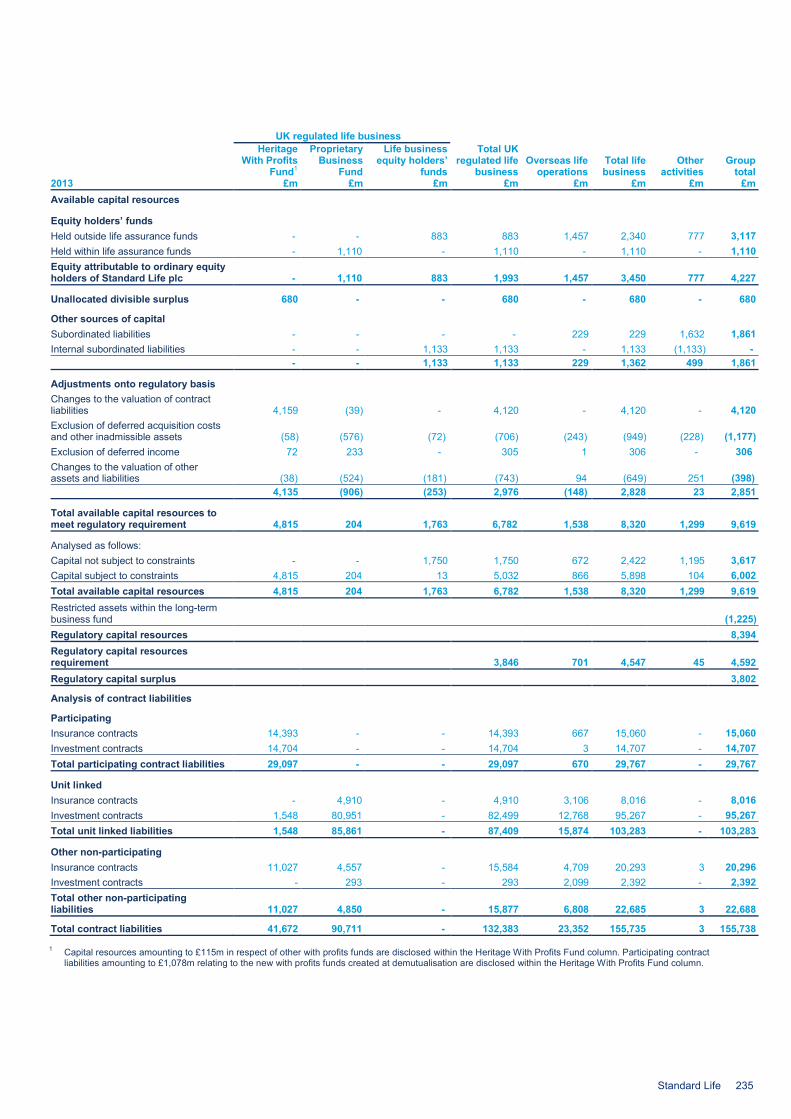
UK regulated life business
Heritage With Profits
Fund1
Proprietary Business
Fund
Life business equity holders’
funds
Total UK regulated life
business Overseas life
operations Total life business
Other activities
Group total
2013 £m £m £m £m £m £m £m £m Available capital resources
Equity holders’ funds
Held outside life assurance funds - - 883 883 1,457 2,340 777 3,117 Held within life assurance funds - 1,110 - 1,110 - 1,110 - 1,110 Equity attributable to ordinary equity holders of Standard Life plc - 1,110 883 1,993 1,457 3,450 777 4,227
Unallocated divisible surplus 680 - - 680 - 680 - 680
Other sources of capital Subordinated liabilities - - - - 229 229 1,632 1,861 Internal subordinated liabilities - - 1,133 1,133 - 1,133 (1,133) -
- - 1,133 1,133 229 1,362 499 1,861
Adjustments onto regulatory basis Changes to the valuation of contract liabilities 4,159 (39) - 4,120 - 4,120 - 4,120 Exclusion of deferred acquisition costs and other inadmissible assets (58) (576) (72) (706) (243) (949) (228) (1,177) Exclusion of deferred income 72 233 - 305 1 306 - 306 Changes to the valuation of other assets and liabilities (38) (524) (181) (743) 94 (649) 251 (398) 4,135 (906) (253) 2,976 (148) 2,828 23 2,851
Total available capital resources to meet regulatory requirement 4,815 204 1,763 6,782 1,538 8,320 1,299 9,619
Analysed as follows: Capital not subject to constraints - - 1,750 1,750 672 2,422 1,195 3,617 Capital subject to constraints 4,815 204 13 5,032 866 5,898 104 6,002 Total available capital resources 4,815 204 1,763 6,782 1,538 8,320 1,299 9,619 Restricted assets within the long-term business fund (1,225) Regulatory capital resources 8,394 Regulatory capital resources requirement 3,846 701 4,547 45 4,592 Regulatory capital surplus 3,802
Analysis of contract liabilities
Participating Insurance contracts 14,393 - - 14,393 667 15,060 - 15,060 Investment contracts 14,704 - - 14,704 3 14,707 - 14,707 Total participating contract liabilities 29,097 - - 29,097 670 29,767 - 29,767
Unit linked Insurance contracts - 4,910 - 4,910 3,106 8,016 - 8,016 Investment contracts 1,548 80,951 - 82,499 12,768 95,267 - 95,267 Total unit linked liabilities 1,548 85,861 - 87,409 15,874 103,283 - 103,283
Other non-participating Insurance contracts 11,027 4,557 - 15,584 4,709 20,293 3 20,296 Investment contracts - 293 - 293 2,099 2,392 - 2,392 Total other non-participating liabilities 11,027 4,850 - 15,877 6,808 22,685 3 22,688
Total contract liabilities 41,672 90,711 - 132,383 23,352 155,735 3 155,738
1 Capital resources amounting to £115m in respect of other with profits funds are disclosed within the Heritage With Profits Fund column. Participating contract liabilities amounting to £1,078m relating to the new with profits funds created at demutualisation are disclosed within the Heritage With Profits Fund column.
Standard Life 235
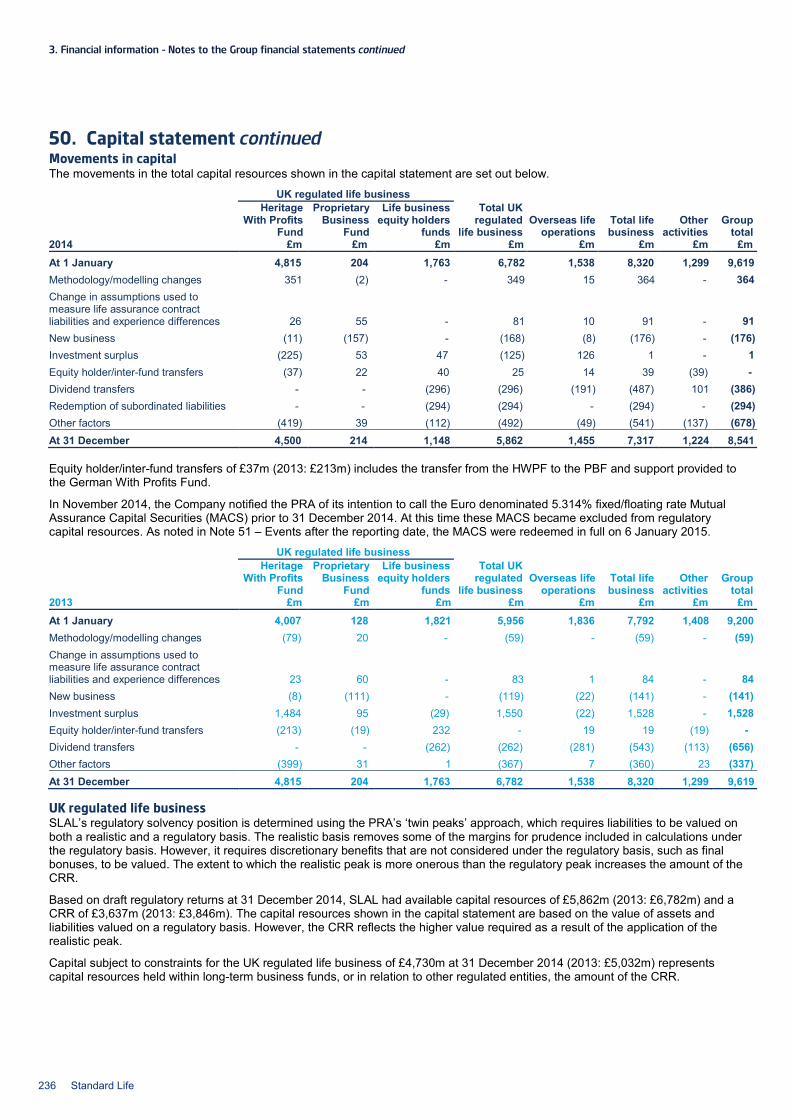
3. Financial information – Notes to the Group financial statements continued
50. Capital statement continued Movements in capital The movements in the total capital resources shown in the capital statement are set out below.
UK regulated life business
Heritage With Profits
Fund
Proprietary Business
Fund
Life business equity holders
funds
Total UK regulated
life business Overseas life
operations Total life business
Other activities
Group total
2014 £m £m £m £m £m £m £m £m At 1 January 4,815 204 1,763 6,782 1,538 8,320 1,299 9,619 Methodology/modelling changes 351 (2) - 349 15 364 - 364 Change in assumptions used to measure life assurance contract liabilities and experience differences 26 55 - 81 10 91 - 91 New business (11) (157) - (168) (8) (176) - (176) Investment surplus (225) 53 47 (125) 126 1 - 1 Equity holder/inter-fund transfers (37) 22 40 25 14 39 (39) - Dividend transfers - - (296) (296) (191) (487) 101 (386) Redemption of subordinated liabilities - - (294) (294) - (294) - (294) Other factors (419) 39 (112) (492) (49) (541) (137) (678) At 31 December 4,500 214 1,148 5,862 1,455 7,317 1,224 8,541
Equity holder/inter-fund transfers of £37m (2013: £213m) includes the transfer from the HWPF to the PBF and support provided to the German With Profits Fund.
In November 2014, the Company notified the PRA of its intention to call the Euro denominated 5.314% fixed/floating rate Mutual Assurance Capital Securities (MACS) prior to 31 December 2014. At this time these MACS became excluded from regulatory capital resources. As noted in Note 51 – Events after the reporting date, the MACS were redeemed in full on 6 January 2015.
UK regulated life business
Heritage With Profits
Fund
Proprietary Business
Fund
Life business equity holders
funds
Total UK regulated
life business Overseas life
operations Total life business
Other activities
Group total
2013 £m £m £m £m £m £m £m £m At 1 January 4,007 128 1,821 5,956 1,836 7,792 1,408 9,200 Methodology/modelling changes (79) 20 - (59) - (59) - (59) Change in assumptions used to measure life assurance contract liabilities and experience differences 23 60 - 83 1 84 - 84 New business (8) (111) - (119) (22) (141) - (141) Investment surplus 1,484 95 (29) 1,550 (22) 1,528 - 1,528 Equity holder/inter-fund transfers (213) (19) 232 - 19 19 (19) - Dividend transfers - - (262) (262) (281) (543) (113) (656) Other factors (399) 31 1 (367) 7 (360) 23 (337) At 31 December 4,815 204 1,763 6,782 1,538 8,320 1,299 9,619 UK regulated life business SLAL’s regulatory solvency position is determined using the PRA’s ‘twin peaks’ approach, which requires liabilities to be valued on both a realistic and a regulatory basis. The realistic basis removes some of the margins for prudence included in calculations under the regulatory basis. However, it requires discretionary benefits that are not considered under the regulatory basis, such as final bonuses, to be valued. The extent to which the realistic peak is more onerous than the regulatory peak increases the amount of the CRR.
Based on draft regulatory returns at 31 December 2014, SLAL had available capital resources of £5,862m (2013: £6,782m) and a CRR of £3,637m (2013: £3,846m). The capital resources shown in the capital statement are based on the value of assets and liabilities valued on a regulatory basis. However, the CRR reflects the higher value required as a result of the application of the realistic peak.
Capital subject to constraints for the UK regulated life business of £4,730m at 31 December 2014 (2013: £5,032m) represents capital resources held within long-term business funds, or in relation to other regulated entities, the amount of the CRR.
236 Standard Life
Overseas life operations Capital resources of £1,455m (2013: £1,538m), which relate mainly to operations in Canada classified as held for sale at 31 December 2014, also include operations in Asia. The Canadian regulator sets the minimum required capital for the Canadian regulated entities. It also requires certain assets to be held in trust to increase policyholder protection (vested assets). As a result of the combination of the capital requirement and vested assets, the overseas life capital subject to constraints amounted to £917m at 31 December 2014 (2013: £866m).
Other activities At 31 December 2014, capital resources of £1,224m (2013: £1,299m) and capital subject to constraints of £185m (2013: £104m) relate to the Group’s investment management businesses and group corporate centre activities.
Intra-group transactions The Group, through subsidiaries and joint ventures, provides insurance and other financial services in the UK, Canada, Hong Kong, India and China. The Group also provides such services in Ireland, Germany and Singapore. With the exception of the requirements of the Scheme and the intra-group subordinated debt referred to below and the capital support mechanisms, there are no formal arrangements to provide capital to particular funds or business units. Any allocations of capital would need to be approved on a case-by-case basis by the Board.
SLAL has issued subordinated loans to the Company, which SLAL treats as capital for regulatory purposes. At Group level only subordinated liabilities issued to external parties are included in the Group’s capital resources.
Group capital requirement The Group must also calculate a group regulatory capital position under the Insurance Groups Directive (IGD). The IGD calculation is a prudent aggregate value for the Group’s capital resources. The capital held within the long-term business funds of approximately £4,714m (2013: £5,019m) is restricted to the level of the CRR of those funds of £3,637m (2013: £3,846m). Therefore, the Group recognises no net surplus in respect of capital within the long-term business funds.
On an IGD basis, the estimated regulatory capital position at 31 December 2014 is a surplus of £2,912m (2013: £3,802m). The decrease in the estimated regulatory capital surplus is as a result of the acquisition of Ignis Asset Management Limited and the call of the Euro denominated 5.314% fixed/floating rate perpetual MACS.
In respect of Group IGD regulatory reporting there were no breaches of regulatory capital requirements at any time during the year.
Contract liabilities The process used to determine the assumptions that have the greatest effect on the measurement of contract liabilities (including options and guarantees), the quantified disclosure of those assumptions, and the terms and conditions of options and guarantees relating to life assurance contracts that could in aggregate have a material effect on future cash flows are disclosed in Note 3 – Business written in the Group’s insurance entities and Note 34 – Insurance contracts, investment contracts and reinsurance contracts. The sensitivity of contract liabilities to changes in market conditions, key assumptions and other variables, and assumptions about management actions in response to changes in market conditions, are disclosed in Note 42 – Risk management.
51. Events after the reporting date On 3 September 2014 the Group announced its intention to sell its Canadian business to The Manufacturers Life Insurance Company (MLC), a subsidiary of Manulife Financial Corporation (Manulife). The sale of the Group’s Canadian long-term savings and retirement, individual and group insurance business (Standard Life Financial Inc.) and Canadian investment management business (Standard Life Investments Inc.) completed on 30 January 2015 for a fixed consideration of CA$4bn (£2.1bn). A further £0.1bn was received from the settlement of related hedging derivative contracts.
The Group expects to recognise a gain on sale of approximately £1.1bn which has been estimated based on book values as at 31 December 2014 (the actual gain on sale will be based on book values as at 30 January 2015 when the sale completed). The gain on sale is expected to be exempt from tax under UK and Canadian tax legislation and therefore no tax charge is expected to arise.
Following the sale the Group proposes to return to shareholders 73 pence per Ordinary Share (approximately £1.75bn). This will be through an issue of B Shares and/or C Shares which is intended to enable the majority of shareholders to receive their cash proceeds as capital, income or a combination of the two. In conjunction with the return of value, the Company will undertake a share consolidation.
On 6 January 2015 the Company redeemed in full the Euro denominated 5.314% fixed/floating rate perpetual Mutual Assurance Capital Securities at their outstanding principal amount of €360,000,000.
Standard Life 237
3. Financial information – independent Auditors’ Report on EEV financial information
Independent Auditors’ Report to the Directors of Standard Life plc Report on the European Embedded Value – financial information
Our opinion In our opinion, the EEV financial information, defined below, for the year ended 31 December 2014 has been properly prepared, in all material respects, in accordance with the EEV basis set out in Notes 1 and 12 to the EEV financial information.
This opinion is to be read in the context of what we say in the remainder of this report.
What we have audited The European Embedded Value financial information (the EEV financial information) basis, which is prepared by Standard Life plc (the ‘Company’), comprises: • The EEV consolidated income statement and EEV consolidated statement of comprehensive income for the year then ended • The EEV consolidated statement of financial position as at 31 December 2014 • The notes to the EEV financial information, which includes the EEV basis set out in Notes 1 to 12 and other explanatory
information.
We primarily focus our work in these areas by assessing the directors’ judgements against available evidence, forming our own judgements, and evaluating the disclosures in the financial information.
We test and examine information, using sampling and other auditing techniques, to the extent we consider necessary to provide a reasonable basis for us to draw conclusions. We obtain audit evidence through testing the effectiveness of controls, substantive procedures or a combination of both.
The financial reporting framework that has been applied in its preparation is the EEV basis set out in Notes 1 and 12 to the EEV financial information.
What an audit of the EEV financial information involves We conducted our audit in accordance with International Standards on Auditing (UK and Ireland) (ISAs (UK & Ireland)). An audit involves obtaining evidence about the amounts and disclosures in the EEV financial information sufficient to give reasonable assurance that the EEV financial information is free from material misstatement, whether caused by fraud or error. This includes an assessment of: • Whether the accounting policies are appropriate to the Group’s circumstances and have been consistently applied and
adequately disclosed • The reasonableness of significant accounting estimates made by the Directors • The overall presentation of the EEV financial information.
In addition, we read all the financial and non-financial information in the Annual report and accounts 2014 to identify material inconsistencies with the audited EEV financial information and to identify any information that is apparently materially incorrect based on, or materially inconsistent with, the knowledge acquired by us in the course of performing the audit. If we become aware of any apparent material misstatements or inconsistencies we consider the implications for our report.
238 Standard Life
Responsibilities for the EEV financial information and the audit
Our responsibilities and those of the Directors The Directors are responsible for the preparation of the EEV financial information in accordance with the EEV basis set out in Notes 1 and 12 to the EEV financial information.
Our responsibility is to audit and express an opinion on the EEV financial information in accordance with applicable laws and ISAs (UK & Ireland). Those standards require us to comply with the Auditing Practices Board’s Ethical Standards for Auditors.
This report, including the opinion, has been prepared for and only for the Company’s directors as a body in accordance with our letter of engagement dated 31 July 2014 and for no other purpose. We do not, in giving this opinion, accept or assume responsibility for any other purpose or to any other person to whom this report is shown or into whose hands it may come save where expressly agreed by our prior consent in writing.
PricewaterhouseCoopers LLP Chartered Accountants Edinburgh 20 February 2015
Notes: (a) The maintenance and integrity of the Standard Life plc website is the responsibility of the directors; the work carried out by the auditors does
not involve consideration of these matters and, accordingly, the auditors accept no responsibility for any changes that may have occurred to the financial statements since they were initially presented on the website.
(b) Legislation in the United Kingdom governing the preparation and dissemination of financial statements may differ from legislation in other jurisdictions.
Standard Life 239
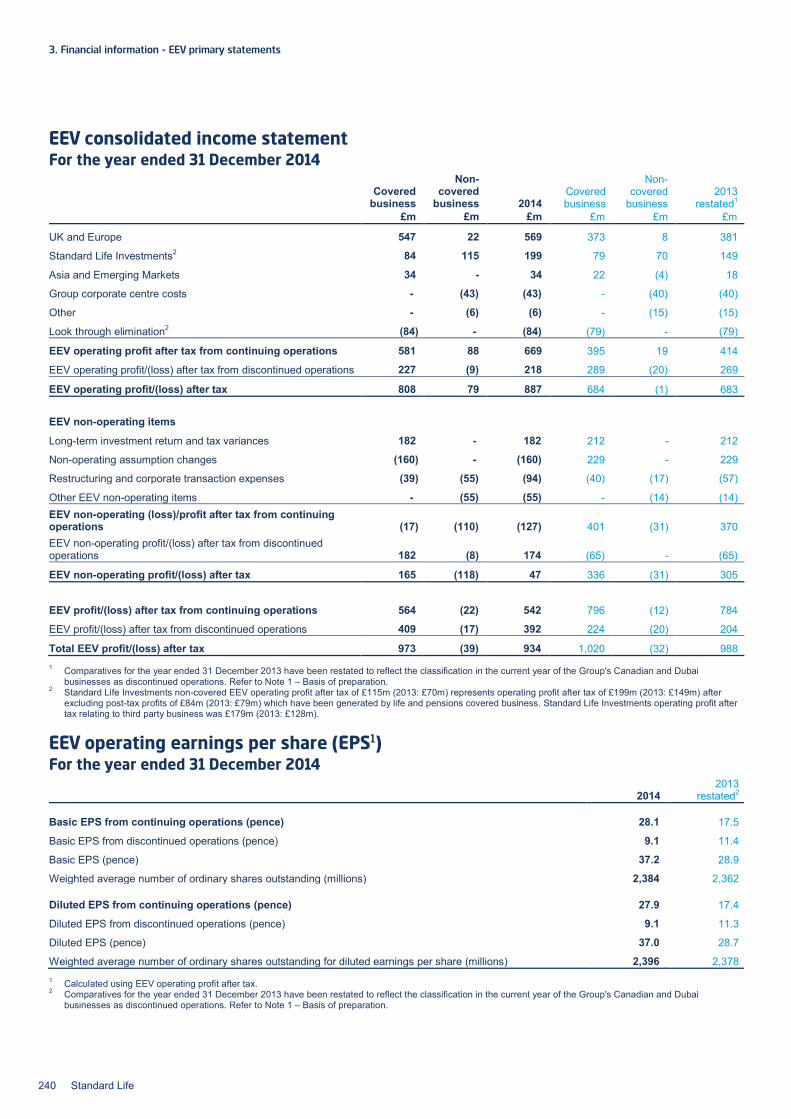
3. Financial information - EEV primary statements
EEV consolidated income statement For the year ended 31 December 2014
Covered
business
Non-covered
business 2014 Covered business
Non-covered
business 2013
restated1 £m £m £m £m £m £m
UK and Europe 547 22 569 373 8 381
Standard Life Investments2 84 115 199 79 70 149
Asia and Emerging Markets 34 - 34 22 (4) 18
Group corporate centre costs - (43) (43) - (40) (40)
Other - (6) (6) - (15) (15)
Look through elimination2 (84) - (84) (79) - (79)
EEV operating profit after tax from continuing operations 581 88 669 395 19 414
EEV operating profit/(loss) after tax from discontinued operations 227 (9) 218 289 (20) 269
EEV operating profit/(loss) after tax 808 79 887 684 (1) 683
EEV non-operating items
Long-term investment return and tax variances 182 - 182 212 - 212
Non-operating assumption changes (160) - (160) 229 - 229
Restructuring and corporate transaction expenses (39) (55) (94) (40) (17) (57)
Other EEV non-operating items - (55) (55) - (14) (14) EEV non-operating (loss)/profit after tax from continuing operations (17) (110) (127) 401 (31) 370 EEV non-operating profit/(loss) after tax from discontinued operations 182 (8) 174 (65) - (65)
EEV non-operating profit/(loss) after tax 165 (118) 47 336 (31) 305
EEV profit/(loss) after tax from continuing operations 564 (22) 542 796 (12) 784
EEV profit/(loss) after tax from discontinued operations 409 (17) 392 224 (20) 204
Total EEV profit/(loss) after tax 973 (39) 934 1,020 (32) 988 1 Comparatives for the year ended 31 December 2013 have been restated to reflect the classification in the current year of the Group's Canadian and Dubai
businesses as discontinued operations. Refer to Note 1 – Basis of preparation. 2 Standard Life Investments non-covered EEV operating profit after tax of £115m (2013: £70m) represents operating profit after tax of £199m (2013: £149m) after
excluding post-tax profits of £84m (2013: £79m) which have been generated by life and pensions covered business. Standard Life Investments operating profit after tax relating to third party business was £179m (2013: £128m).
EEV operating earnings per share (EPS1) For the year ended 31 December 2014
2014 2013
restated2
Basic EPS from continuing operations (pence) 28.1 17.5
Basic EPS from discontinued operations (pence) 9.1 11.4
Basic EPS (pence) 37.2 28.9
Weighted average number of ordinary shares outstanding (millions) 2,384 2,362
Diluted EPS from continuing operations (pence) 27.9 17.4
Diluted EPS from discontinued operations (pence) 9.1 11.3
Diluted EPS (pence) 37.0 28.7
Weighted average number of ordinary shares outstanding for diluted earnings per share (millions) 2,396 2,378 1 Calculated using EEV operating profit after tax. 2 Comparatives for the year ended 31 December 2013 have been restated to reflect the classification in the current year of the Group's Canadian and Dubai
businesses as discontinued operations. Refer to Note 1 – Basis of preparation.
240 Standard Life
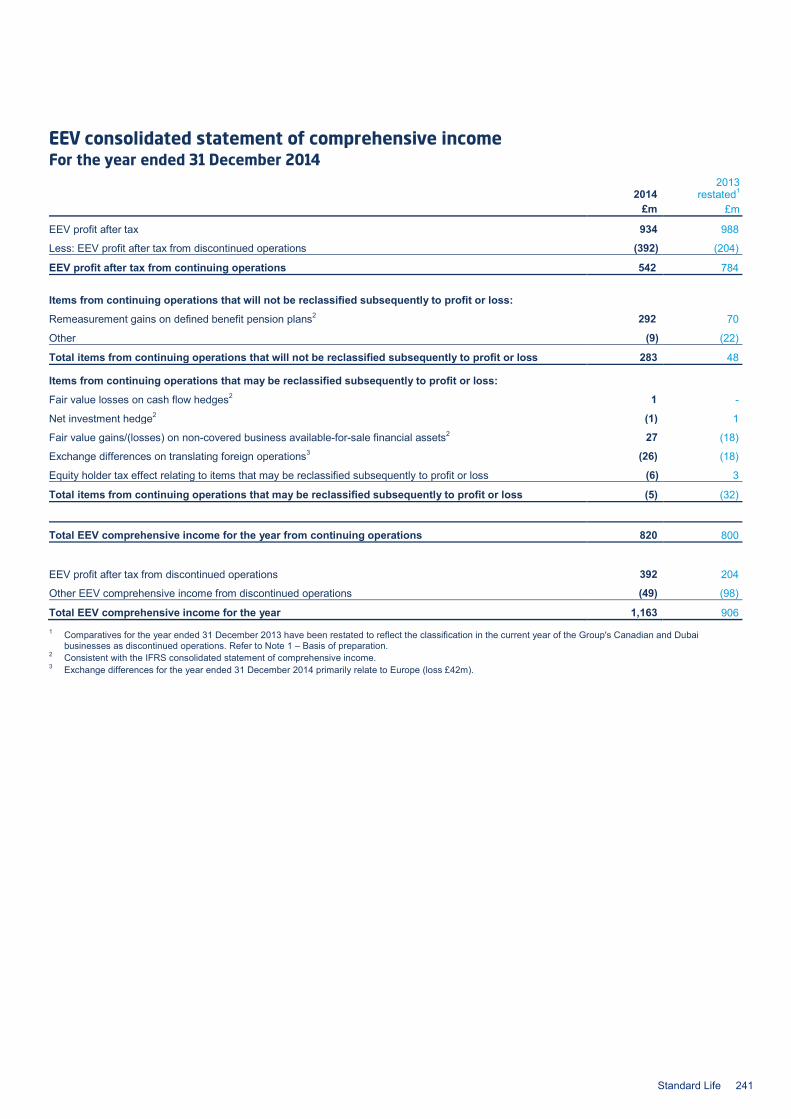
EEV consolidated statement of comprehensive income For the year ended 31 December 2014
2014 2013
restated1 £m £m
EEV profit after tax 934 988
Less: EEV profit after tax from discontinued operations (392) (204)
EEV profit after tax from continuing operations 542 784
Items from continuing operations that will not be reclassified subsequently to profit or loss:
Remeasurement gains on defined benefit pension plans2 292 70
Other (9) (22)
Total items from continuing operations that will not be reclassified subsequently to profit or loss 283 48
Items from continuing operations that may be reclassified subsequently to profit or loss:
Fair value losses on cash flow hedges2 1 -
Net investment hedge2 (1) 1
Fair value gains/(losses) on non-covered business available-for-sale financial assets2 27 (18)
Exchange differences on translating foreign operations3 (26) (18)
Equity holder tax effect relating to items that may be reclassified subsequently to profit or loss (6) 3
Total items from continuing operations that may be reclassified subsequently to profit or loss (5) (32)
Total EEV comprehensive income for the year from continuing operations 820 800
EEV profit after tax from discontinued operations 392 204
Other EEV comprehensive income from discontinued operations (49) (98)
Total EEV comprehensive income for the year 1,163 906 1 Comparatives for the year ended 31 December 2013 have been restated to reflect the classification in the current year of the Group's Canadian and Dubai
businesses as discontinued operations. Refer to Note 1 – Basis of preparation. 2 Consistent with the IFRS consolidated statement of comprehensive income. 3 Exchange differences for the year ended 31 December 2014 primarily relate to Europe (loss £42m).
Standard Life 241
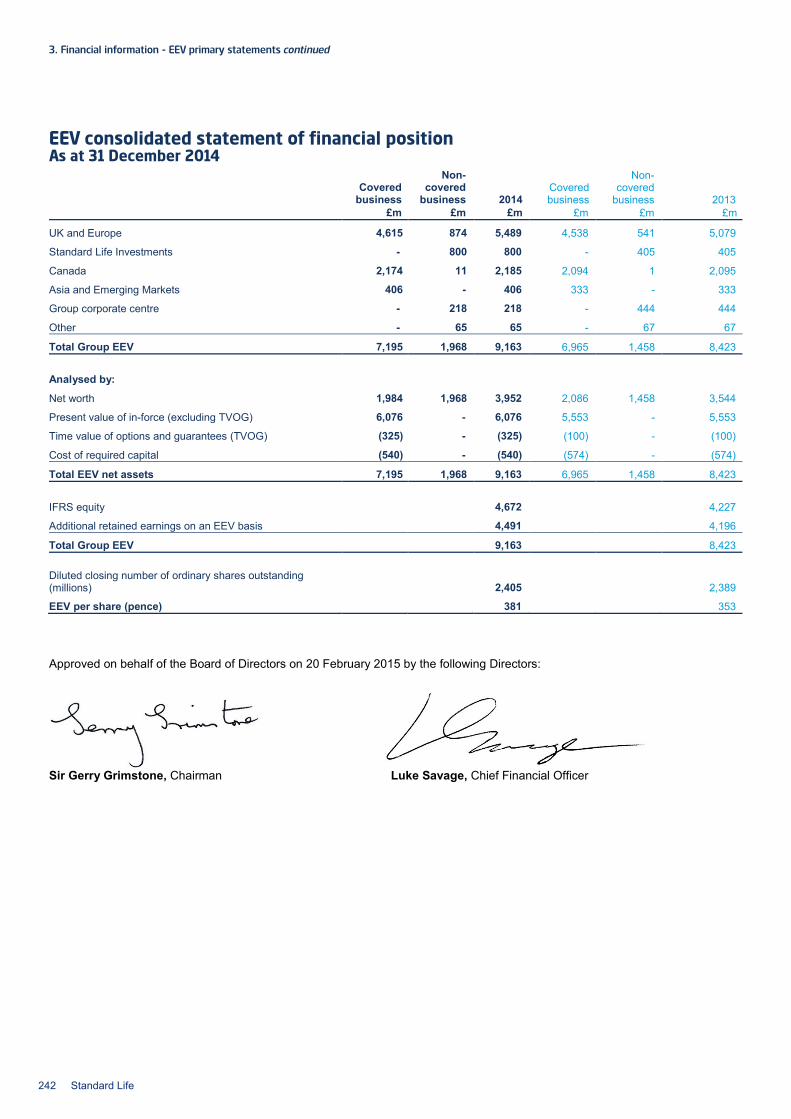
3. Financial information - EEV primary statements continued
EEV consolidated statement of financial position
As at 31 December 2014
Covered
business
Non-covered
business 2014 Covered business
Non-covered
business 2013 £m £m £m £m £m £m
UK and Europe 4,615 874 5,489 4,538 541 5,079
Standard Life Investments - 800 800 - 405 405
Canada 2,174 11 2,185 2,094 1 2,095
Asia and Emerging Markets 406 - 406 333 - 333
Group corporate centre - 218 218 - 444 444
Other - 65 65 - 67 67
Total Group EEV 7,195 1,968 9,163 6,965 1,458 8,423
Analysed by:
Net worth 1,984 1,968 3,952 2,086 1,458 3,544
Present value of in-force (excluding TVOG) 6,076 - 6,076 5,553 - 5,553
Time value of options and guarantees (TVOG) (325) - (325) (100) - (100)
Cost of required capital (540) - (540) (574) - (574)
Total EEV net assets 7,195 1,968 9,163 6,965 1,458 8,423
IFRS equity 4,672 4,227
Additional retained earnings on an EEV basis 4,491 4,196
Total Group EEV 9,163 8,423 Diluted closing number of ordinary shares outstanding (millions) 2,405 2,389
EEV per share (pence) 381 353
Approved on behalf of the Board of Directors on 20 February 2015 by the following Directors:
Sir Gerry Grimstone, Chairman Luke Savage, Chief Financial Officer
242 Standard Life
Notes to the EEV financial information
1. Basis of preparation The European Embedded Value (EEV) basis results have been prepared in accordance with the EEV Principles and Guidance issued by the CFO Forum of European Insurance Companies. EEV reports the value of business in-force based on a set of best estimate assumptions, allowing for the impact of uncertainty inherent in future assumptions, the cost of holding required capital and the value of free surplus. The total profit recognised over the lifetime of a policy is the same as under International Financial Reporting Standards (IFRS) but the timing of recognition of profits is different. EEV includes the net assets of the businesses that are owned by equity holders of Standard Life plc (the Company) plus the present value of future profits expected to arise from in-force long-term insurance policies (PVIF) where these future profits are attributable to equity holders.
A detailed description of EEV methodology is provided in Note 12 – EEV methodology. There have been no significant changes to EEV methodology from that adopted in the previous reporting period, except as noted below. The sensitivities specified by the EEV Principles and Guidance are included in Note 11 - Sensitivity analysis – economic and non-economic assumptions. No sensitivities have been provided for discontinued operations.
EEV operating profit and EEV profit Until 31 December 2013, EEV operating profit and EEV profit were disclosed on both a before and after tax basis. EEV profit before tax was derived by grossing up profit after tax at the long-term rate of corporation tax appropriate for each territory. From 2014, EEV profit and related metrics (including new business contribution and EEV operating profit) are only disclosed on an after tax basis and comparative amounts have been restated. Where EEV operating profit before tax has been included within the company’s incentive arrangements, targets have been restated to an after tax basis.
Segmentation Under the EEV Principles and Guidance, we are required to provide business classifications which are consistent with those used for the primary statements. In the Group financial statements, the Group’s reportable segments have been identified in accordance with the way in which the Group is structured and managed, as required under IFRS 8 Operating segments. The EEV segmentation has been prepared in a consistent manner, whilst also distinguishing between covered and non-covered business.
In November 2013, the Group announced that the results of Standard Life Wealth Limited (SLW) would be managed and reported as part of the Standard Life Investments segment from 1 January 2014. Previously, this business was managed as part of the UK and Europe segment and reported within UK and Europe non-covered business. Comparative amounts for the year ended 31 December 2013 have been prepared on the same basis to allow more meaningful comparison.
Sale of Canada and closure of Dubai As explained in Note 51 to the IFRS consolidated financial information, on 3 September 2014 the Group announced that it had entered into an agreement to sell its Canadian business to The Manufacturers Life Insurance Company. The sale of the Group’s Canadian long-term savings and retirement, individual and group insurance business (Standard Life Financial Inc.) and Canadian investment management business (Standard Life Investments Inc.) completed on 30 January 2015 and the results of the Canadian business, including Canada non-covered business and Standard Life Investments Inc., are reported as EEV Discontinued operations. Comparative amounts for the year ended 31 December 2013 are reported on the same basis to allow more meaningful comparison. EEV results for Discontinued operations include a closing non-trading adjustment at 31 December 2014 to value the Canadian business at sale proceeds less estimated costs to sell.
On 5 November 2014, the Group announced the closure of the Dubai business. The results of this business are included as EEV Discontinued operations, consistent with the IFRS segmental reporting treatment. Dubai was previously included in Asia and Emerging Markets. Comparative amounts for the year ended 31 December 2013 have been restated. EEV results for Discontinued operations include a non-operating adjustment to eliminate the PVIF for the Dubai business.
Acquisition of Ignis As explained in Note 1 to the IFRS consolidated financial information, on 1 July 2014 Standard Life Investments (Holdings) Limited, a wholly owned subsidiary of the Company, acquired the entire share capital of Ignis Asset Management Limited (Ignis). The acquired business is reported as non-covered business within the Standard Life Investments segment in the EEV financial information.
Standard Life Savings Limited Standard Life Savings Limited, which was previously treated as a non-covered entity within UK and Europe with a look through in covered business relating to mutual funds profits, was transferred to covered business on the closing EEV consolidated statement of financial position at 31 December 2013. From 1 January 2014, there is no longer a look through and transfer back of net worth in respect of Standard Life Savings Limited.
Pensions Act 2014 The Pensions Act 2014 contains powers to allow the UK government to restrict charges in defined contribution workplace pensions, including a cap on management charges in default funds and the cessation of active member discounts for qualifying workplace pension schemes. The EEV results for the year to 31 December 2014 include a provision of £160m (post-tax loss) within EEV non-operating profit, representing our best estimate of the reduction in EEV that will result from these changes.
Standard Life 243
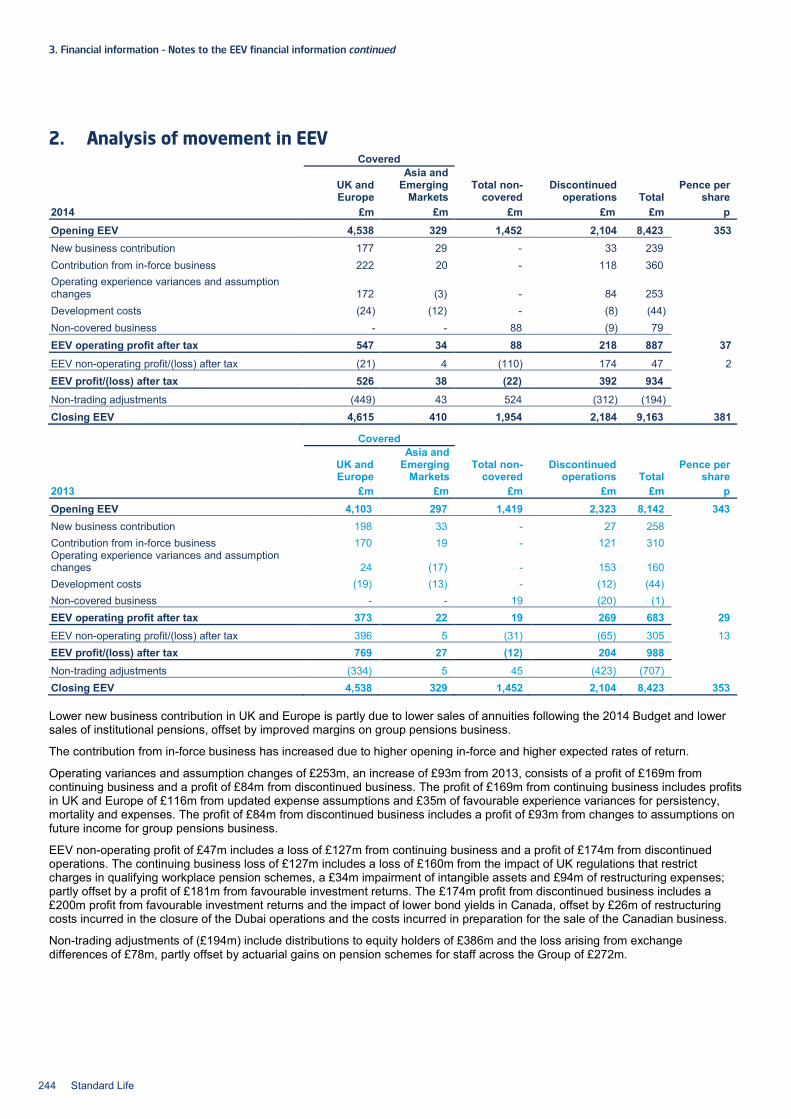
3. Financial information – Notes to the EEV financial information continued
2. Analysis of movement in EEV Covered
UK and Europe
Asia and Emerging
Markets Total non-
covered Discontinued
operations Total Pence per
share 2014 £m £m £m £m £m p Opening EEV 4,538 329 1,452 2,104 8,423 353 New business contribution 177 29 - 33 239 Contribution from in-force business 222 20 - 118 360 Operating experience variances and assumption changes 172 (3) - 84 253 Development costs (24) (12) - (8) (44) Non-covered business - - 88 (9) 79 EEV operating profit after tax 547 34 88 218 887 37 EEV non-operating profit/(loss) after tax (21) 4 (110) 174 47 2 EEV profit/(loss) after tax 526 38 (22) 392 934 Non-trading adjustments (449) 43 524 (312) (194) Closing EEV 4,615 410 1,954 2,184 9,163 381
Covered
UK and Europe
Asia and Emerging
Markets Total non-
covered Discontinued
operations Total Pence per
share 2013 £m £m £m £m £m p Opening EEV 4,103 297 1,419 2,323 8,142 343 New business contribution 198 33 - 27 258 Contribution from in-force business 170 19 - 121 310 Operating experience variances and assumption changes 24 (17) - 153 160 Development costs (19) (13) - (12) (44) Non-covered business - - 19 (20) (1) EEV operating profit after tax 373 22 19 269 683 29 EEV non-operating profit/(loss) after tax 396 5 (31) (65) 305 13 EEV profit/(loss) after tax 769 27 (12) 204 988
Non-trading adjustments (334) 5 45 (423) (707) Closing EEV 4,538 329 1,452 2,104 8,423 353
Lower new business contribution in UK and Europe is partly due to lower sales of annuities following the 2014 Budget and lower sales of institutional pensions, offset by improved margins on group pensions business.
The contribution from in-force business has increased due to higher opening in-force and higher expected rates of return.
Operating variances and assumption changes of £253m, an increase of £93m from 2013, consists of a profit of £169m from continuing business and a profit of £84m from discontinued business. The profit of £169m from continuing business includes profits in UK and Europe of £116m from updated expense assumptions and £35m of favourable experience variances for persistency, mortality and expenses. The profit of £84m from discontinued business includes a profit of £93m from changes to assumptions on future income for group pensions business.
EEV non-operating profit of £47m includes a loss of £127m from continuing business and a profit of £174m from discontinued operations. The continuing business loss of £127m includes a loss of £160m from the impact of UK regulations that restrict charges in qualifying workplace pension schemes, a £34m impairment of intangible assets and £94m of restructuring expenses; partly offset by a profit of £181m from favourable investment returns. The £174m profit from discontinued business includes a £200m profit from favourable investment returns and the impact of lower bond yields in Canada, offset by £26m of restructuring costs incurred in the closure of the Dubai operations and the costs incurred in preparation for the sale of the Canadian business.
Non-trading adjustments of (£194m) include distributions to equity holders of £386m and the loss arising from exchange differences of £78m, partly offset by actuarial gains on pension schemes for staff across the Group of £272m.
244 Standard Life
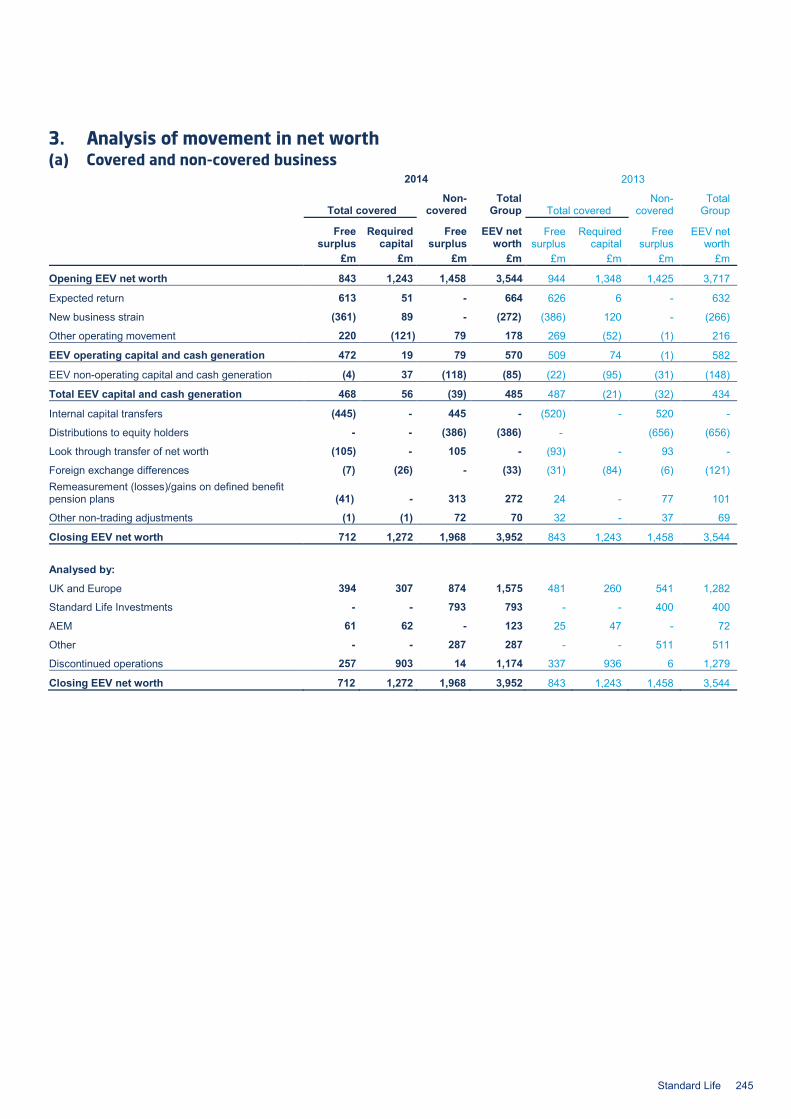
3. Analysis of movement in net worth
(a) Covered and non-covered business 2014 2013
Total covered Non-
covered Total
Group Total covered Non-
covered Total
Group Free
surplus Required
capital Free
surplus EEV net
worth Free
surplus Required
capital Free
surplus EEV net
worth £m £m £m £m £m £m £m £m
Opening EEV net worth 843 1,243 1,458 3,544 944 1,348 1,425 3,717
Expected return 613 51 - 664 626 6 - 632
New business strain (361) 89 - (272) (386) 120 - (266)
Other operating movement 220 (121) 79 178 269 (52) (1) 216
EEV operating capital and cash generation 472 19 79 570 509 74 (1) 582
EEV non-operating capital and cash generation (4) 37 (118) (85) (22) (95) (31) (148)
Total EEV capital and cash generation 468 56 (39) 485 487 (21) (32) 434
Internal capital transfers (445) - 445 - (520) - 520 -
Distributions to equity holders - - (386) (386) - (656) (656)
Look through transfer of net worth (105) - 105 - (93) - 93 -
Foreign exchange differences (7) (26) - (33) (31) (84) (6) (121) Remeasurement (losses)/gains on defined benefit pension plans (41) - 313 272 24 - 77 101
Other non-trading adjustments (1) (1) 72 70 32 - 37 69
Closing EEV net worth 712 1,272 1,968 3,952 843 1,243 1,458 3,544
Analysed by:
UK and Europe 394 307 874 1,575 481 260 541 1,282
Standard Life Investments - - 793 793 - - 400 400
AEM 61 62 - 123 25 47 - 72
Other - - 287 287 - - 511 511
Discontinued operations 257 903 14 1,174 337 936 6 1,279
Closing EEV net worth 712 1,272 1,968 3,952 843 1,243 1,458 3,544
Standard Life 245
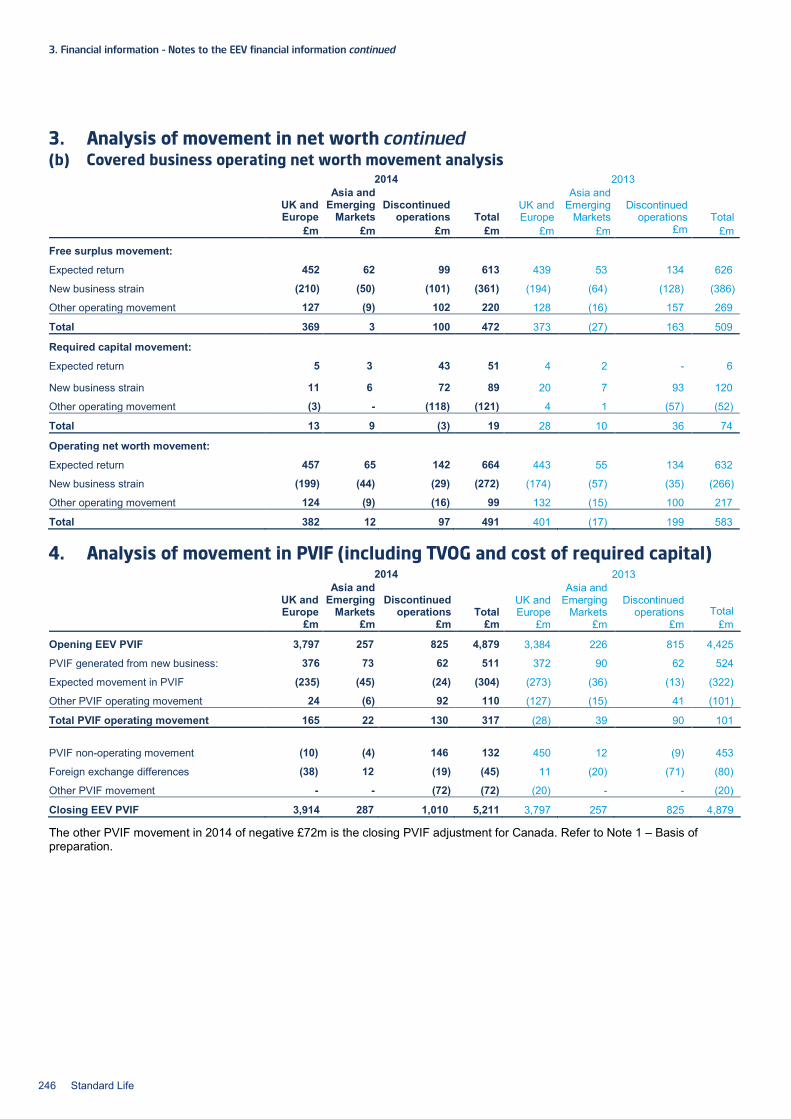
3. Financial information – Notes to the EEV financial information continued
3. Analysis of movement in net worth continued (b) Covered business operating net worth movement analysis
4. Analysis of movement in PVIF (including TVOG and cost of required capital) 2014 2013
UK and Europe
Asia and Emerging
Markets Discontinued
operations Total UK and Europe
Asia and Emerging
Markets Discontinued
operations
Total £m £m £m £m £m £m £m £m
Opening EEV PVIF 3,797 257 825 4,879 3,384 226 815 4,425
PVIF generated from new business: 376 73 62 511 372 90 62 524
Expected movement in PVIF (235) (45) (24) (304) (273) (36) (13) (322)
Other PVIF operating movement 24 (6) 92 110 (127) (15) 41 (101)
Total PVIF operating movement 165 22 130 317 (28) 39 90 101
PVIF non-operating movement (10) (4) 146 132 450 12 (9) 453
Foreign exchange differences (38) 12 (19) (45) 11 (20) (71) (80)
Other PVIF movement - - (72) (72) (20) - - (20)
Closing EEV PVIF 3,914 287 1,010 5,211 3,797 257 825 4,879
The other PVIF movement in 2014 of negative £72m is the closing PVIF adjustment for Canada. Refer to Note 1 – Basis of preparation.
2014 2013
UK and Europe
Asia and Emerging
Markets Discontinued
operations Total UK and Europe
Asia and Emerging
Markets Discontinued
operations Total £m £m £m £m £m £m £m £m
Free surplus movement:
Expected return 452 62 99 613 439 53 134 626
New business strain (210) (50) (101) (361) (194) (64) (128) (386)
Other operating movement 127 (9) 102 220 128 (16) 157 269
Total 369 3 100 472 373 (27) 163 509
Required capital movement:
Expected return 5 3 43 51 4 2 - 6
New business strain 11 6 72 89 20 7 93 120
Other operating movement (3) - (118) (121) 4 1 (57) (52)
Total 13 9 (3) 19 28 10 36 74
Operating net worth movement:
Expected return 457 65 142 664 443 55 134 632
New business strain (199) (44) (29) (272) (174) (57) (35) (266)
Other operating movement 124 (9) (16) 99 132 (15) 100 217
Total 382 12 97 491 401 (17) 199 583
246 Standard Life
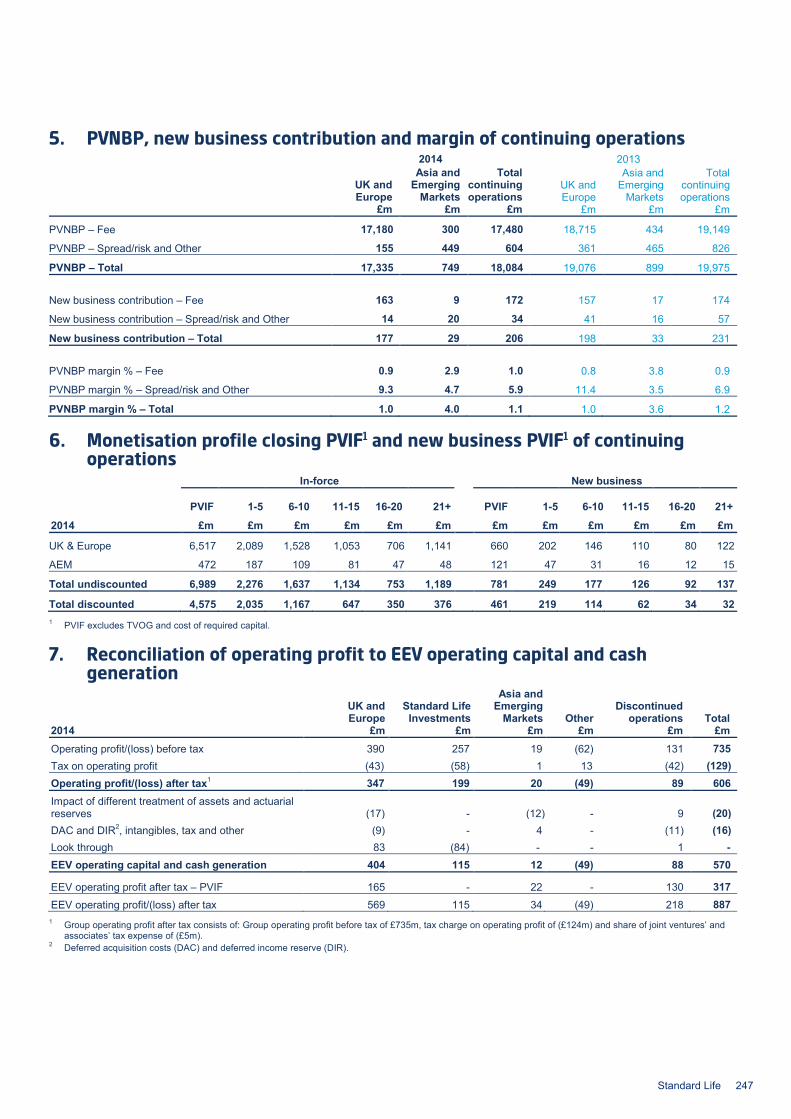
5. PVNBP, new business contribution and margin of continuing operations 2014 2013
UK and Europe
Asia and Emerging
Markets
Total continuing operations
UK and Europe
Asia and Emerging
Markets
Total continuing operations
£m £m £m £m £m £m
PVNBP – Fee 17,180 300 17,480 18,715 434 19,149
PVNBP – Spread/risk and Other 155 449 604 361 465 826
PVNBP – Total 17,335 749 18,084 19,076 899 19,975
New business contribution – Fee 163 9 172 157 17 174
New business contribution – Spread/risk and Other 14 20 34 41 16 57
New business contribution – Total 177 29 206 198 33 231
PVNBP margin % – Fee 0.9 2.9 1.0 0.8 3.8 0.9
PVNBP margin % – Spread/risk and Other 9.3 4.7 5.9 11.4 3.5 6.9
PVNBP margin % – Total 1.0 4.0 1.1 1.0 3.6 1.2
6. Monetisation profile closing PVIF1 and new business PVIF1 of continuing operations
In-force New business
PVIF 1-5 6-10 11-15 16-20 21+
PVIF 1-5 6-10 11-15 16-20 21+
2014 £m £m £m £m £m £m £m £m £m £m £m £m
UK & Europe 6,517 2,089 1,528 1,053 706 1,141 660 202 146 110 80 122
AEM 472 187 109 81 47 48 121 47 31 16 12 15
Total undiscounted 6,989 2,276 1,637 1,134 753 1,189 781 249 177 126 92 137
Total discounted 4,575 2,035 1,167 647 350 376 461 219 114 62 34 32 1 PVIF excludes TVOG and cost of required capital.
7. Reconciliation of operating profit to EEV operating capital and cash generation
UK and Europe
Standard Life Investments
Asia and Emerging
Markets Other Discontinued
operations Total 2014 £m £m £m £m £m £m Operating profit/(loss) before tax 390 257 19 (62) 131 735 Tax on operating profit (43) (58) 1 13 (42) (129) Operating profit/(loss) after tax1 347 199 20 (49) 89 606 Impact of different treatment of assets and actuarial reserves (17) - (12) - 9 (20) DAC and DIR2, intangibles, tax and other (9) - 4 - (11) (16) Look through 83 (84) - - 1 - EEV operating capital and cash generation 404 115 12 (49) 88 570
EEV operating profit after tax – PVIF 165 - 22 - 130 317 EEV operating profit/(loss) after tax 569 115 34 (49) 218 887
1 Group operating profit after tax consists of: Group operating profit before tax of £735m, tax charge on operating profit of (£124m) and share of joint ventures’ and associates’ tax expense of (£5m).
2 Deferred acquisition costs (DAC) and deferred income reserve (DIR).
Standard Life 247
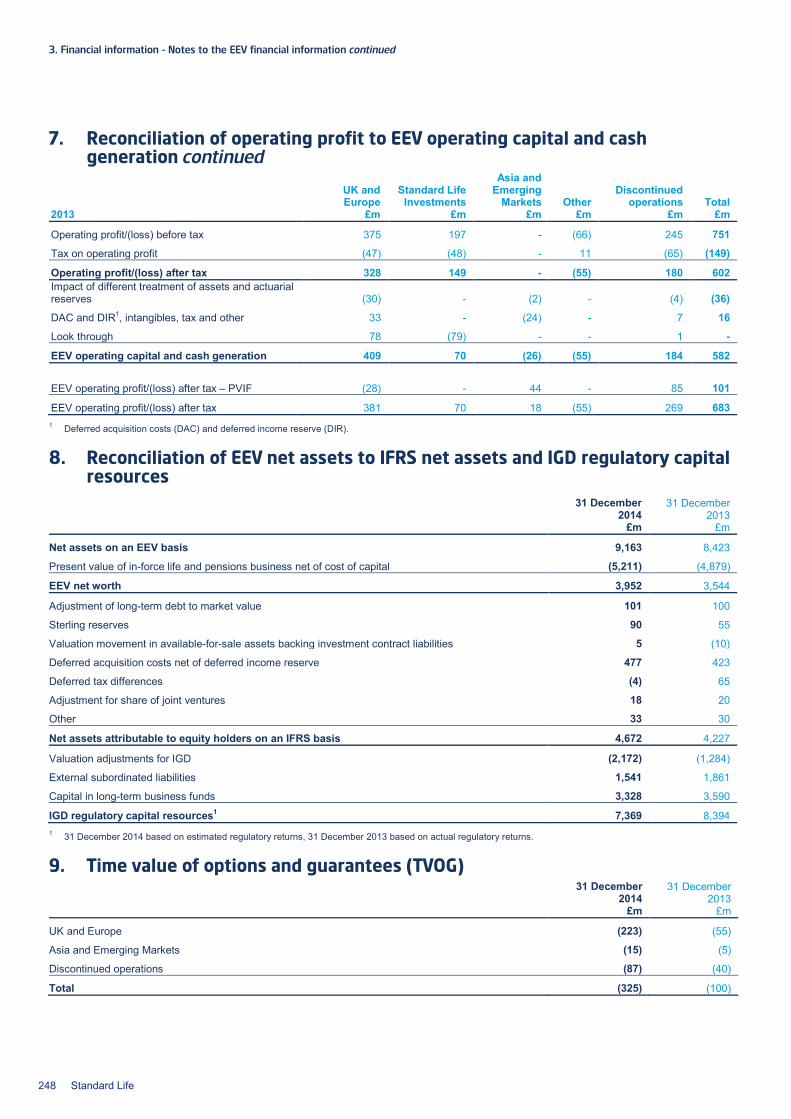
3. Financial information – Notes to the EEV financial information continued
7. Reconciliation of operating profit to EEV operating capital and cash generation continued
UK and Europe
Standard Life Investments
Asia and Emerging
Markets Other Discontinued
operations Total 2013 £m £m £m £m £m £m
Operating profit/(loss) before tax 375 197 - (66) 245 751
Tax on operating profit (47) (48) - 11 (65) (149)
Operating profit/(loss) after tax 328 149 - (55) 180 602 Impact of different treatment of assets and actuarial reserves (30) - (2) - (4) (36)
DAC and DIR1, intangibles, tax and other 33 - (24) - 7 16
Look through 78 (79) - - 1 -
EEV operating capital and cash generation 409 70 (26) (55) 184 582
EEV operating profit/(loss) after tax – PVIF (28) - 44 - 85 101
EEV operating profit/(loss) after tax 381 70 18 (55) 269 683 1 Deferred acquisition costs (DAC) and deferred income reserve (DIR).
8. Reconciliation of EEV net assets to IFRS net assets and IGD regulatory capital resources
31 December
2014 31 December
2013 £m £m
Net assets on an EEV basis 9,163 8,423
Present value of in-force life and pensions business net of cost of capital (5,211) (4,879)
EEV net worth 3,952 3,544
Adjustment of long-term debt to market value 101 100
Sterling reserves 90 55
Valuation movement in available-for-sale assets backing investment contract liabilities 5 (10)
Deferred acquisition costs net of deferred income reserve 477 423
Deferred tax differences (4) 65
Adjustment for share of joint ventures 18 20
Other 33 30
Net assets attributable to equity holders on an IFRS basis 4,672 4,227
Valuation adjustments for IGD (2,172) (1,284)
External subordinated liabilities 1,541 1,861
Capital in long-term business funds 3,328 3,590
IGD regulatory capital resources1 7,369 8,394 1 31 December 2014 based on estimated regulatory returns, 31 December 2013 based on actual regulatory returns.
9. Time value of options and guarantees (TVOG)
31 December
2014 31 December
2013 £m £m
UK and Europe (223) (55)
Asia and Emerging Markets (15) (5)
Discontinued operations (87) (40)
Total (325) (100)
248 Standard Life
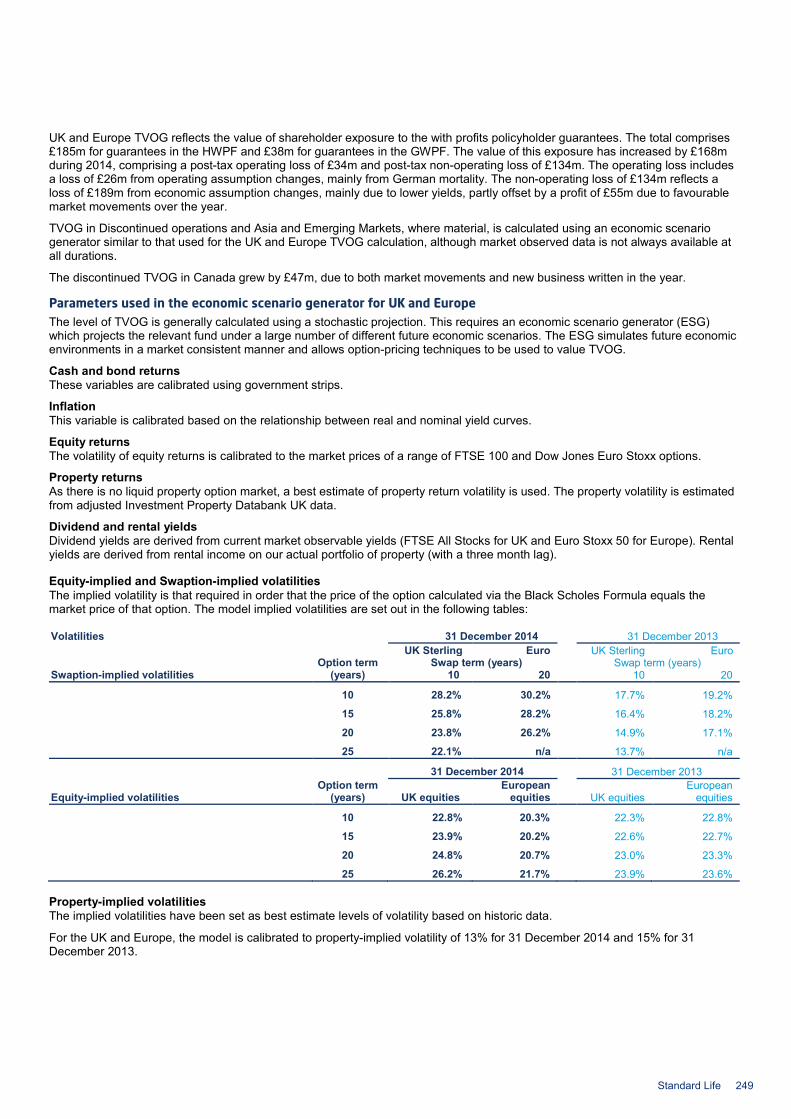
UK and Europe TVOG reflects the value of shareholder exposure to the with profits policyholder guarantees. The total comprises £185m for guarantees in the HWPF and £38m for guarantees in the GWPF. The value of this exposure has increased by £168m during 2014, comprising a post-tax operating loss of £34m and post-tax non-operating loss of £134m. The operating loss includes a loss of £26m from operating assumption changes, mainly from German mortality. The non-operating loss of £134m reflects a loss of £189m from economic assumption changes, mainly due to lower yields, partly offset by a profit of £55m due to favourable market movements over the year.
TVOG in Discontinued operations and Asia and Emerging Markets, where material, is calculated using an economic scenario generator similar to that used for the UK and Europe TVOG calculation, although market observed data is not always available at all durations.
The discontinued TVOG in Canada grew by £47m, due to both market movements and new business written in the year.
Parameters used in the economic scenario generator for UK and Europe The level of TVOG is generally calculated using a stochastic projection. This requires an economic scenario generator (ESG) which projects the relevant fund under a large number of different future economic scenarios. The ESG simulates future economic environments in a market consistent manner and allows option-pricing techniques to be used to value TVOG.
Cash and bond returns These variables are calibrated using government strips.
Inflation This variable is calibrated based on the relationship between real and nominal yield curves.
Equity returns The volatility of equity returns is calibrated to the market prices of a range of FTSE 100 and Dow Jones Euro Stoxx options.
Property returns As there is no liquid property option market, a best estimate of property return volatility is used. The property volatility is estimated from adjusted Investment Property Databank UK data.
Dividend and rental yields Dividend yields are derived from current market observable yields (FTSE All Stocks for UK and Euro Stoxx 50 for Europe). Rental yields are derived from rental income on our actual portfolio of property (with a three month lag).
Equity-implied and Swaption-implied volatilities The implied volatility is that required in order that the price of the option calculated via the Black Scholes Formula equals the market price of that option. The model implied volatilities are set out in the following tables:
Volatilities 31 December 2014 31 December 2013 UK Sterling Euro UK Sterling Euro Option term
(years) Swap term (years) Swap term (years)
Swaption-implied volatilities 10 20 10 20
10 28.2% 30.2% 17.7% 19.2%
15 25.8% 28.2% 16.4% 18.2%
20 23.8% 26.2% 14.9% 17.1%
25 22.1% n/a 13.7% n/a
31 December 2014 31 December 2013
Equity-implied volatilities Option term
(years) UK equities European
equities
UK equities European
equities
10 22.8% 20.3% 22.3% 22.8%
15 23.9% 20.2% 22.6% 22.7%
20 24.8% 20.7% 23.0% 23.3%
25 26.2% 21.7% 23.9% 23.6%
Property-implied volatilities The implied volatilities have been set as best estimate levels of volatility based on historic data.
For the UK and Europe, the model is calibrated to property-implied volatility of 13% for 31 December 2014 and 15% for 31 December 2013.
Standard Life 249

3. Financial information – Notes to the EEV financial information continued
10. Principal economic assumptions – deterministic calculations – covered business 31 December 2014 31 December 2013
In-force
business New
business In-force
business New
business % % % %
Risk-free rate: UK / SLIL 1.86 3.01 3.01 1.74 Europe 0.54 1.94 1.94 1.32 Canada 2.23 3.16 3.16 2.32 Hong Kong 1.99 1.92 1.92 0.91 India1 7.55 - 8.01 - China1 3.93 - 4.94 -
Corporate bond returns, excluding Canada2: UK 2.65 3.76 3.76 2.34 Hong Kong 2.77 2.73 2.73 1.66
Total investment returns (annuities) : UK non index-linked annuities 3.15 * 4.26 * UK index-linked annuities 2.85 * 3.69 *
Equity returns: Canada 8.60 8.60 Other Risk-free rate + 3%pa Risk-free rate + 3%pa
Property returns: Canada 8.60 8.60 Other Risk-free rate + 2%pa Risk-free rate + 2%pa
Risk discount rate risk margin: UK HWPF 3.80 2.50 4.10 2.70 UK PBF 2.60 3.30 2.40 3.10 Europe HWPF 1.90 2.70 2.80 2.50 Europe PBF 1.50 2.00 1.50 1.60 SLIL 2.80 2.80 2.20 2.30 Canada 4.30 3.00 3.40 2.70 Hong Kong 2.90 2.90 2.90 2.90
Risk discount rate: UK HWPF 5.66 5.51 7.11 4.44 UK PBF 4.46 6.31 5.41 4.84 Europe HWPF 2.44 4.64 4.74 3.82 Europe PBF 2.04 3.94 3.44 2.92 SLIL 4.66 5.81 5.21 4.04 Canada 6.53 6.16 6.56 5.02 Hong Kong 4.89 4.82 4.82 3.81
Expense inflation:
UK / SLIL 3.61 4.00 4.00 3.39 Europe (Germany) 0.84 1.60 1.60 1.87 Europe (Ireland) 1.90 2.69 2.69 2.84 Canada3 1.50 1.50 1.50 1.50 Hong Kong 2.50 2.50 2.50 2.50
1 The PVIF and cost of required capital of the Asia joint ventures are calculated using a ‘risk neutral’ approach. 2 For Canada, with the exception of AFS assets used to back investment contract liabilities at amortised cost, current holdings are assumed to yield in future years the
earned rate for the year preceding the valuation and future reinvestments are assumed to be in a mixture of government and corporate bonds. For AFS assets used to back investment contract liabilities at amortised cost, yields are calculated at acquisition and subsequent changes are ignored.
3 This represents the current rate. The rate in subsequent years is based on a moving 30-year bond yield less a 2% deduction, subject to a floor of 1.50%. * For UK immediate annuity new business, economic assumptions are updated every quarter.
For UK, Europe and SLIL, the change in the in-force business risk margins are mainly due to a change in the allowance for non-market risk. The changes in the new business risk margins are primarily due to changes in business mix and asset allocations. The impact of the changes in risk discount rates has been included in non-operating assumption changes in the EEV income statement. The amounts within these totals that relate to the changes in risk discount rate are for UK and Europe: profit £432m, for Asia and Emerging Markets: loss £7m, and for Discontinued operations: profit £89m.
250 Standard Life
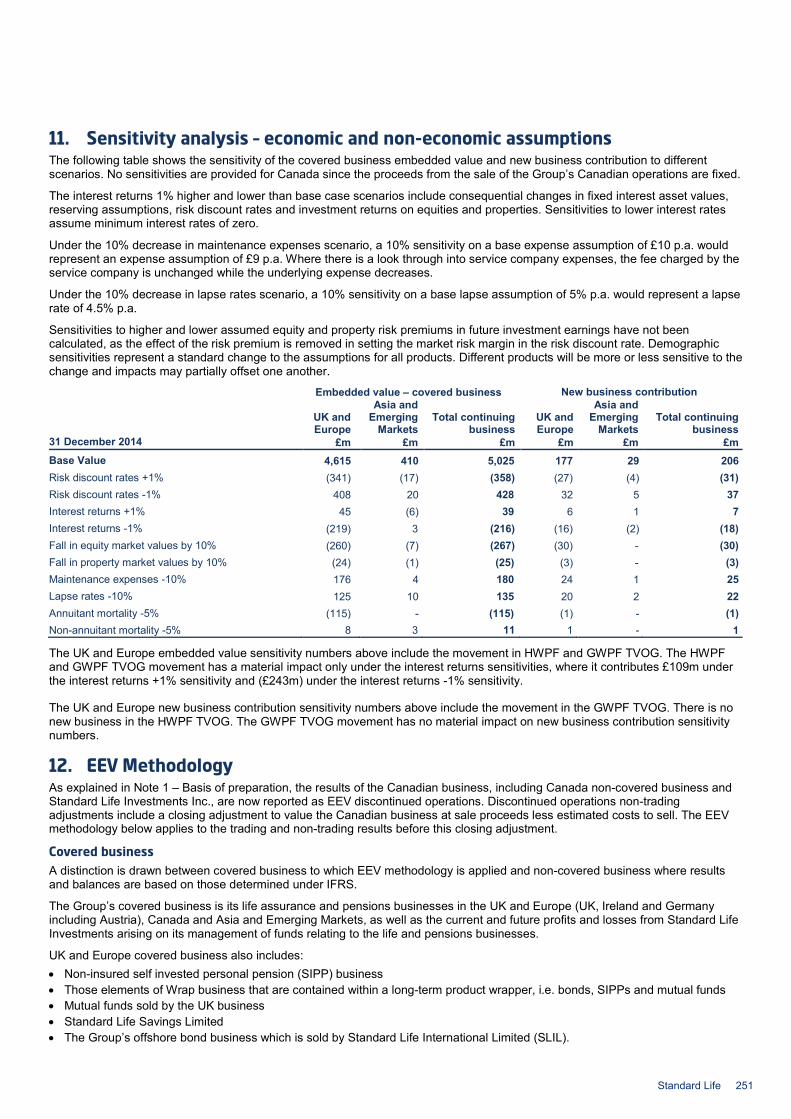
11. Sensitivity analysis – economic and non-economic assumptions The following table shows the sensitivity of the covered business embedded value and new business contribution to different scenarios. No sensitivities are provided for Canada since the proceeds from the sale of the Group’s Canadian operations are fixed.
The interest returns 1% higher and lower than base case scenarios include consequential changes in fixed interest asset values, reserving assumptions, risk discount rates and investment returns on equities and properties. Sensitivities to lower interest rates assume minimum interest rates of zero.
Under the 10% decrease in maintenance expenses scenario, a 10% sensitivity on a base expense assumption of £10 p.a. would represent an expense assumption of £9 p.a. Where there is a look through into service company expenses, the fee charged by the service company is unchanged while the underlying expense decreases.
Under the 10% decrease in lapse rates scenario, a 10% sensitivity on a base lapse assumption of 5% p.a. would represent a lapse rate of 4.5% p.a.
Sensitivities to higher and lower assumed equity and property risk premiums in future investment earnings have not been calculated, as the effect of the risk premium is removed in setting the market risk margin in the risk discount rate. Demographic sensitivities represent a standard change to the assumptions for all products. Different products will be more or less sensitive to the change and impacts may partially offset one another.
Embedded value – covered business New business contribution
UK and Europe
Asia and Emerging
Markets Total continuing
business UK and Europe
Asia and Emerging
Markets Total continuing
business 31 December 2014 £m £m £m £m £m £m Base Value 4,615 410 5,025 177 29 206 Risk discount rates +1% (341) (17) (358) (27) (4) (31) Risk discount rates -1% 408 20 428 32 5 37 Interest returns +1% 45 (6) 39 6 1 7 Interest returns -1% (219) 3 (216) (16) (2) (18) Fall in equity market values by 10% (260) (7) (267) (30) - (30) Fall in property market values by 10% (24) (1) (25) (3) - (3) Maintenance expenses -10% 176 4 180 24 1 25 Lapse rates -10% 125 10 135 20 2 22 Annuitant mortality -5% (115) - (115) (1) - (1) Non-annuitant mortality -5% 8 3 11 1 - 1
The UK and Europe embedded value sensitivity numbers above include the movement in HWPF and GWPF TVOG. The HWPF and GWPF TVOG movement has a material impact only under the interest returns sensitivities, where it contributes £109m under the interest returns +1% sensitivity and (£243m) under the interest returns -1% sensitivity. The UK and Europe new business contribution sensitivity numbers above include the movement in the GWPF TVOG. There is no new business in the HWPF TVOG. The GWPF TVOG movement has no material impact on new business contribution sensitivity numbers.
12. EEV Methodology As explained in Note 1 – Basis of preparation, the results of the Canadian business, including Canada non-covered business and Standard Life Investments Inc., are now reported as EEV discontinued operations. Discontinued operations non-trading adjustments include a closing adjustment to value the Canadian business at sale proceeds less estimated costs to sell. The EEV methodology below applies to the trading and non-trading results before this closing adjustment.
Covered business A distinction is drawn between covered business to which EEV methodology is applied and non-covered business where results and balances are based on those determined under IFRS.
The Group’s covered business is its life assurance and pensions businesses in the UK and Europe (UK, Ireland and Germany including Austria), Canada and Asia and Emerging Markets, as well as the current and future profits and losses from Standard Life Investments arising on its management of funds relating to the life and pensions businesses.
UK and Europe covered business also includes: • Non-insured self invested personal pension (SIPP) business • Those elements of Wrap business that are contained within a long-term product wrapper, i.e. bonds, SIPPs and mutual funds • Mutual funds sold by the UK business • Standard Life Savings Limited • The Group’s offshore bond business which is sold by Standard Life International Limited (SLIL).
Standard Life 251
3. Financial information – Notes to the EEV financial information continued
12. EEV Methodology continued Asia and Emerging Markets covered business consists of: • The Group’s business in Hong Kong (Standard Life (Asia) Limited) • International savings and investment business in Singapore and Dubai sold by SLIL • The Group’s share of results in the JVs in India (HDFC Standard Life Insurance Company Limited) and China (Heng An
Standard Life Insurance Company Limited).
Canada covered business also includes mutual funds.
Non-covered business The Group’s non-covered business predominantly consists of: • Within UK and Europe, the Group’s UK pension plan, other UK subsidiaries and until 31 December 2013, the non-covered
results of Standard Life Savings Limited • Within Standard Life Investments – Standard Life Wealth Limited, the non-covered third party business of Standard Life
Investments, including Ignis • Within other and group corporate centre, Standard Life plc and other non life and pensions entities.
Non-covered business EEV operating profit after tax is represented by operating profit after tax as adjusted for Standard Life Investments and other look through profits which are recognised in covered business.
Transfer back of look through net worth from covered business Covered business includes the profits and losses arising from non-covered businesses providing investment management and other services to the Group’s life and pensions businesses (‘look through’). As a result, the profits and losses on an IFRS basis have been removed from the relevant non-covered segments and are instead included within the EEV results of the covered businesses.
The capitalised values of the future profits and losses from such service companies are included in the opening and closing embedded value for the relevant businesses, but the net assets remain within the relevant non-covered businesses. A transfer of profits from the covered business to the non-covered business is deemed to occur in order to reconcile the profits and losses arising in the financial period within each segment with the opening and closing EEV net assets.
Value of in-force covered business The value of future equity holders’ cash flows is calculated for each material business unit on an after-tax basis, projected using best estimate future assumptions. No allowance has been made for the change in reserving or required capital bases anticipated under Solvency 2. Allowance is made for external reinsurance and reinsurance within the Group. The cash flows include the profits and losses arising in Group companies providing investment management and other services where these relate to covered business, this is referred to as the ‘look through’ into service companies.
The projected cash flows are discounted to the valuation date using a risk discount rate which is intended to make sufficient allowance for the risks associated with the emergence of these cash flows, other than those risks allowed for elsewhere in the EEV calculations. In particular, a deduction is made from the present value of the best estimate cash flows to reflect the risks associated with the existence of financial options and guarantees, this deduction being assessed using stochastic techniques.
Free surplus The free surplus is the market value of any assets allocated to, but not required to support, the in-force covered business at the valuation date. In the UK, this comprises the market value of the assets in the equity holders’ fund, plus the value of the equity holders’ interests in the surplus of the long-term fund, after appropriate allowance for tax, less the required capital supporting the covered business.
For some assets and liabilities where market value is not the normal basis for accounting, the free surplus is restated to market value, adjusted as required to allow for the present value of any tax which would become payable if the assets were realised.
Allowance for risk Under the EEV Principles and Guidance, risks within the covered business are allowed for in the following ways: • Application of risk discount rates to projected cash flows, which are derived by adding a risk margin to a risk free rate • Holding of required capital for the covered business, determined by reference to both regulatory requirements and internal
economic capital assessments • Allowing for the time value of options and guarantees (TVOG).
Risk discount rates Under the EEV methodology, a risk discount rate is required to calculate the present value of expected future distributable profits as a single value at a particular date. The risk discount rate comprises a risk free rate (represented by a government bond yield) plus a risk margin. Separate risk margins are determined for market risk and non-market risk, with a reduction to allow for any cost of required capital (excluding double taxation cost) which is already reflected within the EEV.
252 Standard Life
The market risk margin effectively removes the impact of assuming higher than risk free returns on the discounted EEV result. In this way, the benefits of assuming higher than risk free investment returns on future cash flows are largely offset by using a higher discount rate. The market risk margin does not remove returns above risk free on illiquid assets (e.g. corporate bonds and mortgages) where these are matched to appropriate liabilities (e.g. immediate annuities). The non-market risk margin is intended to allow for the risk that non-market experience in future years may differ from that assumed. Allowance has been made for non-market risk by applying stress tests to PVIF using our internal capital model, and quantifying an additional risk margin based on the results of the stress tests. The main elements of non-market risk which are allowed for are persistency, mortality, operational and expense risk assumptions. Benefits of diversification between risk types are allowed for in deriving the non-market risk margins in line with our internal capital model. Separate risk discount rates are calculated for in-force and new business for the principal geographic segments (UK, Europe, SLIL UK, Canada and Hong Kong). In addition, for UK and Europe, separate risk margins are calculated for business that originated in the HWPF and the PBF.
Market risk margins and any cost of required capital adjustment are reviewed at each valuation date, with non-market risk margins generally reviewed in detail once a year.
Within the EEV results for the India and China JV businesses, PVIF and cost of required capital are calculated using a ‘risk neutral’ approach, whereby projected investment returns and discount rates are based on risk free rates. As a result, there is no need for an additional market risk margin in the discount rate. Non-market risk is deducted directly from PVIF using a ‘cost of capital’ approach on the risk capital arising from the key sources of non-market risk. For the India and China JV businesses, this methodology would give a similar result to the methodology used in the UK, Europe, Canada and Hong Kong, since the calibration of a risk discount rate would have allowed for the market and non-market risks.
Required capital Required capital represents the amount of assets over and above those required to back the liabilities in respect of the covered business whose distribution to equity holders is restricted. As a minimum, this will represent the capital requirement of the local regulator.
The levels of required capital are reviewed in detail at least once a year.
We have set required capital to be the higher of regulatory capital and our own internally assessed risk based capital requirement. In determining the required capital for the purposes of assessing EEV, the Group excludes any capital which is provided by the existing surplus in the HWPF, as this capital is provided by policyholders. Any required capital in excess of that provided by the existing surplus in the HWPF would need to be provided by assets in the equity holders’ funds. As part of the annual assessment, projections of the expected surplus in the HWPF, on best estimate assumptions, are carried out to assess whether this is sufficient to cover the level of required capital in respect of the HWPF. Required capital used in the EEV is also net of any capital that is assumed to be available from subordinated liabilities.
The levels of required capital in the current EEV calculations are therefore as follows: • UK and Europe (business in HWPF) – no capital requirement in excess of statutory reserves or asset shares is valued in the
EEV • UK and Europe (business in equity holder owned funds) – 100% of EU minimum regulatory capital, which is higher in aggregate
than Standard Life’s internal risk-based capital requirement • Canada – the level of required capital is taken as 160% of minimum continuing capital and surplus requirements (MCCSR) • Asia and Emerging Markets – required capital is generally based on the local statutory capital requirements.
The cost of required capital has been calculated using assumptions consistent with those used in the value of in-force (VIF) calculations.
Time value of options and guarantees (TVOG) TVOG represents the potential additional cost to equity holders where a financial option exists which affects policyholder benefits and is exercisable at the option of the policyholder.
UK and Europe – HWPF The main source of TVOG in the Group EEV arises from the HWPF. Under the terms of the Scheme, equity holder cash flows from the HWPF are held back if required to cover HWPF liabilities on the Prudential Regulation Authority realistic or regulatory basis. This option for the UK, Germany and Ireland results in the loss of cash flows when the HWPF has insufficient assets to pay guaranteed policy benefits. The main options and guarantees within the HWPF in respect of UK and Europe business relate to with profits business and include minimum guaranteed rates of return.
The value of TVOG arising from the HWPF at any point in time will be sensitive to: • The level of the residual estate (working capital in the HWPF) • Investment conditions in terms of bond yields, equity and property values, and implied market volatility • The investment profile of the assets backing the applicable policies, the residual estate and non profit business in the fund at the
time TVOG is calculated.
Standard Life 253
3. Financial information – Notes to the EEV financial information continued
12. EEV Methodology continued The level of TVOG has been calculated by a model which projects the HWPF under a large number of different future economic scenarios. Particular features of this calculation are: • The projected economic scenarios and the methodology used to discount equity holder cash flows are based on
market-consistent assumptions • The total cost includes an allowance for non-market risk • Changes in policyholder behaviour are allowed for according to the particular economic scenario • Changes in management actions, including the dynamic guarantee deductions, are allowed for according to the particular
economic scenario, such actions being expected to be consistent with the way that the HWPF will be managed in future as described in the Scheme and in the Principles and Practices of Financial Management (PPFM)
• Each projection allows for the gradual release of the residual estate over time to policyholders where there are sufficient funds.
UK and Europe – other Most with profits business written post demutualisation is managed in a number of new with profits funds. For the present reporting period, the only significant volumes of this type of new business have arisen in Germany. These policies have guarantees relating to benefits available on the policy maturity date, some of which increase each year with the addition of bonuses.
Equity holder assets are at risk if the resources of these with profits funds are insufficient to pay the guaranteed benefits. The level of TVOG has been calculated using stochastic techniques. TVOG has reduced both NBC and closing PVIF for Germany.
An adjustment is made within free surplus to allow for the potential cost of a selection of guaranteed annuity benefits on unit linked and smoothed-managed business within Germany.
Asia and Emerging Markets TVOG in the Asia businesses within Asia and Emerging Markets arises from guarantees and options given to with profits business written in India and China.
Canada The main options and guarantees within the Canada business are in respect of minimum investment returns, guaranteed maturity and death benefits, and vested bonuses, which apply to certain investment and insurance contracts. TVOG has reduced both NBC and closing PVIF for Canada.
Other economic assumptions The assumed investment returns reflect our estimates of expected returns on principal asset classes and are, in general, based on market conditions at the date of calculation of the EEV.
The inflation rates assumed are, in general, based on the market implied long-term price inflation plus a margin to allow for salary inflation.
The Group’s international savings and investment business, which is sold via branches in Singapore and Dubai, is included within Asia and Emerging Markets results but has the same other economic assumptions as the SLIL International bond business.
Non-economic assumption changes Non-economic assumptions for the main classes of business, including most expense assumptions, are reviewed in full on an annual basis. Other non-economic assumption changes, not relating to the full annual review of non-economic assumptions, may be reflected in the Half year results, for example non-economic assumption changes resulting from management action or modelling changes.
Expense assumptions Expense assumptions on a per policy basis have been derived based on an analysis of management expenses performed by each business, and are split between acquisition and maintenance assumptions. For mature businesses, no credit is taken for future cost reduction programmes until the benefits have been delivered. For start-up businesses, expense over-runs are permitted where these are expected to be short-lived.
In determining future expenses in relation to covered business, no allowance has been made in the EEV or NBC for any allocation of group corporate centre costs.
Development expenses represent specific expenses incurred which are considered temporary in nature and are not expected to occur again.
Costs related to restructuring have been excluded from the EEV results where it has been agreed that these costs are to be met by the HWPF and therefore would not form part of the surplus cash flows.
Investment management expenses are also allowed for, and the assumptions for these reflect the actual investment expenses of Standard Life Investments in providing investment management services to the life and pensions businesses rather than the investment fees actually charged.
Restructuring and corporate transaction expenses are consistent with those identified in the Group operating profit adjustments. Refer to the Group financial statements Note 10 – Restructuring and corporate transaction expenses for further detail. In addition, restructuring and corporate transaction expenses for covered business include associated impacts on PVIF and cost of required
254 Standard Life

capital. Acquisition costs used within the calculation of NBC reflect the full acquisition expenses incurred in writing new business in the period.
Expenses – pension plans Pension plans have been included in accordance with International Accounting Standard (IAS) 19 Employee Benefits and IFRIC 14 IAS 19 The Limit on a Defined Benefit Asset, Minimum Funding Requirements.
Other non-economic experience assumptions Assumptions are made in respect of future levels of mortality, morbidity, premium terminations, option take-up, surrenders and withdrawals. The assumptions reflect our best estimates of the likely future experience, and are based on recent experience and relevant industry data, where available.
Annuitant mortality assumptions use a combination of base mortality rates, which are generally set by reference to recent experience, and expected future changes in mortality. The latter uses company-specific considerations, along with data provided by the Continuous Mortality Investigation Bureau in the UK and the Canadian Institute of Actuaries in Canada.
Assumptions regarding option take-up, surrenders and withdrawals are assumed to vary, where appropriate, according to the investment scenario under consideration when deriving TVOG, to reflect our best estimate of how policyholder behaviour may vary in such circumstances.
New business Definition of new business New business includes new policies written during the period and some increments to existing policies. The value of new business includes the value of expected renewal premiums where these are (i) contractual, (ii) non-contractual but reasonably predictable, or (iii) recurrent single premiums that are deemed likely to renew.
Additional considerations for each territory are noted below. For the UK and Ireland: • Pensions vesting into annuity contracts under existing group defined benefits contracts are not included as new business • Pensions vesting under other group contracts and individual pensions are included as new business • All increments and indexations to existing policies, including new members, and increments and indexations paid by existing
members of group schemes, are deemed to be new business when received.
For Germany, new business comprises new contracts written into the PBF with the exception of vesting annuities for tax layer 1 deferred annuities sold before September 2009. The NBC assumes a specific level of future premium indexation and also assumes that premiums on ‘low start’ policies increase at the end of the low start period.
For Canada, expected renewal premiums on new group pension and savings contracts are included at inception. Since all deposits (new and renewal) in individual segregated funds business attract a new business/first year commission, these deposits are treated as new business when received.
New business contribution (NBC) The contribution generated by new business written during the period is the present value of the projected stream of after-tax distributable profit from that business. NBC is calculated as at the end of the reporting period.
The economic assumptions used are those at the start of the reporting period, and the non-economic assumptions are those at the end of the reporting period. An exception to this approach is annuity business in the UK and Ireland where, to ensure consistency between the economic assumptions used in NBC and those used in pricing the business and in the calculation of mathematical reserves, the economic assumptions used are the average rates for each quarter during the reporting period, and the asset allocations are those used in the pricing basis.
Present value of new business premiums (PVNBP) New business sales are expressed as PVNBP calculated as total single premiums received in the period plus the discounted value of regular premiums expected to be received over the term of the new contracts, and is expressed at the point of sale. The premium volumes and projection assumptions used to calculate the present value of regular premiums are the same as those used to calculate NBC, except that PVNBP is discounted using the relevant opening risk free rate rather than the risk discount rate.
Tax Tax assumptions used are based upon the best estimate of the actual tax expected to arise.
Assets designated as available-for-sale under IFRS The Group has designated certain financial assets used to back subordinated liabilities and investment contract liabilities as available-for-sale (AFS) under IFRS accounting.
Where AFS assets are held by an EEV covered business entity and these assets are used to back investment contract liabilities accounted for under local solvency regulations at amortised cost, then the assets are also included within EEV on an amortised cost basis and EEV operating profit after tax reflects the long-term investment return on the assets calculated at acquisition.
Standard Life 255
3. Financial information – Notes to the EEV financial information continued
12. EEV Methodology continued Where AFS assets are held by an EEV covered business entity and these assets are used to back subordinated liabilities which are accounted for in EEV at market value, then the assets are also included within EEV on a market value basis. EEV operating profit after tax reflects the long-term investment return on the assets and unrealised gains and losses are included within EEV non-operating profit.
Where AFS assets are held by an EEV non-covered entity, unrealised gains and losses do not impact EEV profit after tax and are recorded within the EEV consolidated statement of comprehensive income.
Subordinated liabilities The liabilities in respect of the UK subordinated debt plus the subordinated debt issued by Canada form part of covered business and have been deducted at market value within EEV.
For non-covered business, no adjustment is made to the IFRS valuation of debt.
Foreign exchange Embedded value and other items within the EEV consolidated statement of financial position denominated in foreign currencies have been translated to Sterling using the appropriate closing exchange rates. NBC and other items within the EEV consolidated statement of comprehensive income have been translated using the appropriate average exchange rates. Gains and losses arising from foreign exchange differences on consolidation are presented separately within the EEV consolidated statement of comprehensive income.
EEV capital and cash generation Covered business EEV operating capital and cash generation represents the EEV operating profit net worth (free surplus and required capital) on an after-tax basis. Non-covered business EEV operating capital and cash generation represents non-covered operating profit after tax as adjusted for Standard Life Investments look through profits after tax and the after-tax return on mutual funds which are recognised in covered business.
EEV non-operating capital and cash generation comprises covered business non-operating profit items (non-operating net worth movement after tax) and non-covered business non-operating profit items on an after-tax basis.
256 Standard Life
Independent auditors’ report to the members of Standard Life plc
Our opinion In our opinion the financial statements, defined below: • Give a true and fair view of the state of the company’s affairs as at 31 December 2014 and of its profit and cash flows for the
year then ended • Have been properly prepared in accordance with International Financial Reporting Standards (IFRSs) as adopted by the
European Union • Have been prepared in accordance with the requirements of the Companies Act 2006.
This opinion is to be read in the context of what we say in the remainder of this report.
What we have audited The financial statements, which are prepared by Standard Life plc, comprise: • The Company statement of financial position as at 31 December 2014 • The Company statement of comprehensive income for the year then ended • The Company statement of cash flows for the year then ended • The Company statement of changes in equity for the year then ended • The accounting policies • The notes to the financial statements, which include other explanatory information.
The financial reporting framework that has been applied in their preparation is applicable law and IFRSs as adopted by the European Union.
Certain disclosures required by the financial reporting framework have been presented elsewhere in the Company financial statements (the ‘Annual report’), rather than in the notes to the financial statements. These are cross-referenced from the financial statements and are identified as audited.
What an audit of financial statements involves We conducted our audit in accordance with International Standards on Auditing (UK and Ireland) (‘ISAs (UK & Ireland)’). An audit involves obtaining evidence about the amounts and disclosures in the financial statements sufficient to give reasonable assurance that the financial statements are free from material misstatement, whether caused by fraud or error. This includes an assessment of: • Whether the accounting policies are appropriate to the company’s circumstances and have been consistently applied and
adequately disclosed • The reasonableness of significant accounting estimates made by the Directors • The overall presentation of the financial statements.
We primarily focus our work in these areas by assessing the directors’ judgements against available evidence, forming our own judgements, and evaluating the disclosures in the financial information.
We test and examine information, using sampling and other auditing techniques, to the extent we consider necessary to provide a reasonable basis for us to draw conclusions. We obtain audit evidence through testing the effectiveness of controls, substantive procedures or a combination of both.
In addition, we read all the financial and non-financial information in the Annual report to identify material inconsistencies with the audited financial statements and to identify any information that is apparently materially incorrect based on, or materially inconsistent with, the knowledge acquired by us in the course of performing the audit. If we become aware of any apparent material misstatements or inconsistencies we consider the implications for our report.
Opinions on other matters prescribed by the Companies Act 2006
In our opinion: • The information given in the Strategic report and the Directors’ report for the financial year for which the financial statements are
prepared is consistent with the financial statements • The part of the Directors’ remuneration report to be audited has been properly prepared in accordance with the Companies Act
2006.
Standard Life 257
3. Financial information – Independent auditors’ report on Company financial statements continued
Other matters on which we are required to report by exception
Adequacy of accounting records and information and explanations received Under the Companies Act 2006 we are required to report to you if, in our opinion: • We have not received all the information and explanations we require for our audit • Adequate accounting records have not been kept, or returns adequate for our audit have not been received from branches not
visited by us • The financial statements and the part of the Directors’ remuneration report to be audited are not in agreement with the
accounting records and returns.
We have no exceptions to report arising from this responsibility.
Directors’ remuneration
Under the Companies Act 2006 we are required to report to you if, in our opinion, certain disclosures of directors’ remuneration specified by law are not made, and under the Listing Rules we are required to review certain elements of the report to shareholders by the Board on directors’ remuneration. We have no exceptions to report arising from these responsibilities.
Other information in the Annual report
Under ISAs (UK & Ireland) we are required to report to you if, in our opinion, information in the Annual report is: • Materially inconsistent with the information in the audited financial statements • Apparently materially incorrect based on, or materially inconsistent with, our knowledge of the company acquired in the course
of performing our audit • Is otherwise misleading.
We have no exceptions to report arising from this responsibility.
Responsibilities for the Company financial statements and the audit
Our responsibilities and those of the directors
As explained more fully in the Directors’ responsibility statement set out on page 47, the directors are responsible for the preparation of the financial statements and for being satisfied that they give a true and fair view.
Our responsibility is to audit and express an opinion on the financial statements in accordance with applicable law and ISAs (UK & Ireland). Those standards require us to comply with the Auditing Practices Board’s Ethical Standards for Auditors.
This report, including the opinions, has been prepared for and only for the company’s members as a body in accordance with Chapter 3 of Part 16 of the Companies Act 2006 and for no other purpose. We do not, in giving these opinions, accept or assume responsibility for any other purpose or to any other person to whom this report is shown or into whose hands it may come save where expressly agreed by our prior consent in writing.
Other matters
We have reported separately on the Group financial statements of Standard Life plc for the year ended 31 December 2014.
Stephanie Bruce (Senior Statutory Auditor) for and on behalf of PricewaterhouseCoopers LLP Chartered Accountants and Statutory Auditors Edinburgh 20 February 2015 (a) The maintenance and integrity of the Standard Life website is the responsibility of the directors; the work carried out by the auditors does not
involve consideration of these matters and, accordingly, the auditors accept no responsibility for any changes that may have occurred to the financial statements since they were initially presented on the website.
(b) Legislation in the United Kingdom governing the preparation and dissemination of financial statements may differ from legislation in other jurisdiction.
258 Standard Life
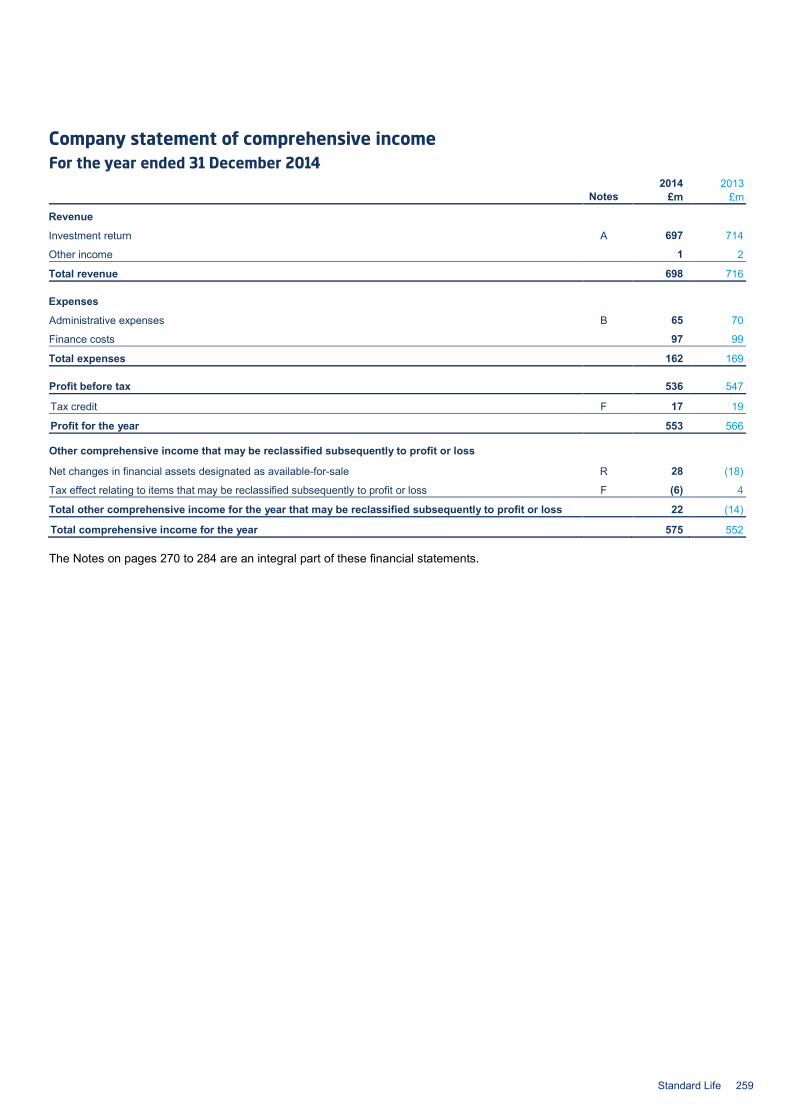
Company statement of comprehensive income For the year ended 31 December 2014
2014 2013 Notes £m £m
Revenue
Investment return A 697 714
Other income 1 2
Total revenue 698 716
Expenses
Administrative expenses B 65 70
Finance costs 97 99
Total expenses 162 169
Profit before tax 536 547
Tax credit F 17 19
Profit for the year 553 566
Other comprehensive income that may be reclassified subsequently to profit or loss
Net changes in financial assets designated as available-for-sale R 28 (18)
Tax effect relating to items that may be reclassified subsequently to profit or loss F (6) 4
Total other comprehensive income for the year that may be reclassified subsequently to profit or loss 22 (14)
Total comprehensive income for the year 575 552
The Notes on pages 270 to 284 are an integral part of these financial statements.
Standard Life 259
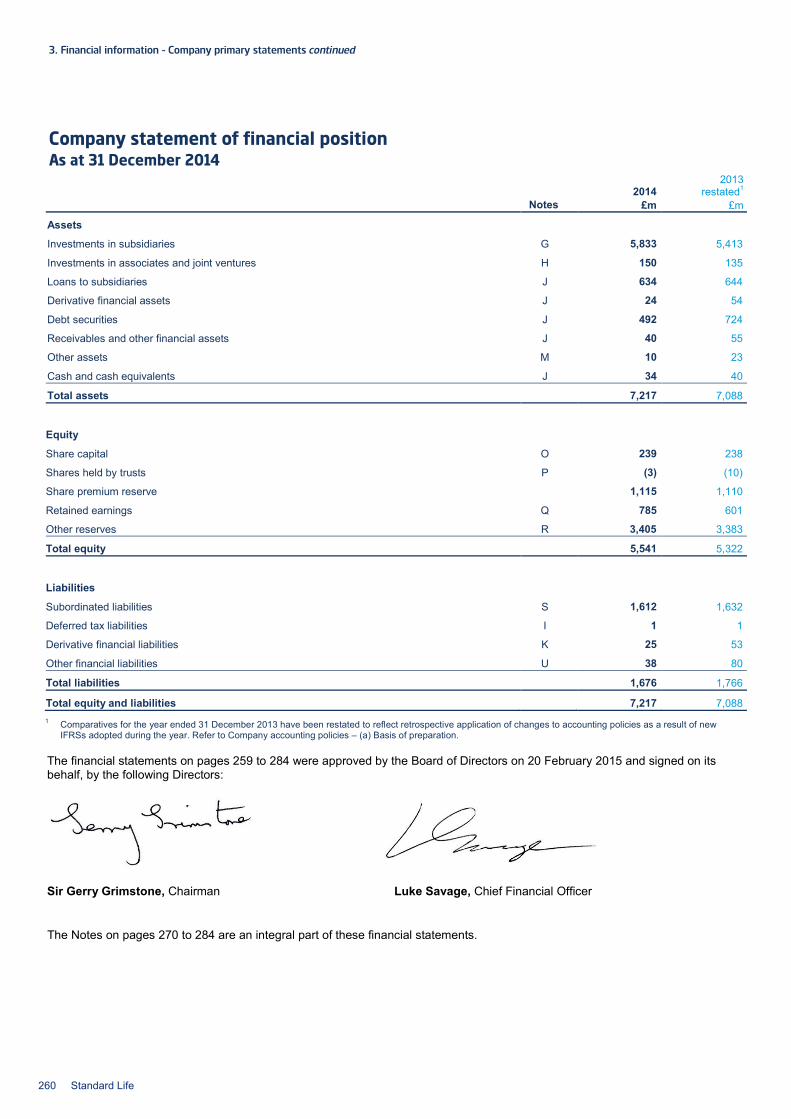
3. Financial information – Company primary statements continued
Company statement of financial position As at 31 December 2014
2014 2013
restated1 Notes £m £m
Assets
Investments in subsidiaries G 5,833 5,413
Investments in associates and joint ventures H 150 135
Loans to subsidiaries J 634 644
Derivative financial assets J 24 54
Debt securities J 492 724
Receivables and other financial assets J 40 55
Other assets M 10 23
Cash and cash equivalents J 34 40
Total assets 7,217 7,088
Equity
Share capital O 239 238
Shares held by trusts P (3) (10)
Share premium reserve 1,115 1,110
Retained earnings Q 785 601
Other reserves R 3,405 3,383
Total equity 5,541 5,322
Liabilities
Subordinated liabilities S 1,612 1,632
Deferred tax liabilities I 1 1
Derivative financial liabilities K 25 53
Other financial liabilities U 38 80
Total liabilities 1,676 1,766
Total equity and liabilities 7,217 7,088 1 Comparatives for the year ended 31 December 2013 have been restated to reflect retrospective application of changes to accounting policies as a result of new
IFRSs adopted during the year. Refer to Company accounting policies – (a) Basis of preparation.
The financial statements on pages 259 to 284 were approved by the Board of Directors on 20 February 2015 and signed on its behalf, by the following Directors:
Sir Gerry Grimstone, Chairman Luke Savage, Chief Financial Officer
The Notes on pages 270 to 284 are an integral part of these financial statements.
260 Standard Life

Company statement of changes in equity For the year ended 31 December 2014
Share
capital
Shares held by
trusts
Share premium
reserve Retained earnings
Other reserves
Total equity
2014 Notes £m £m £m £m £m £m
1 January 238 (10) 1,110 601 3,383 5,322
Profit for the year - - - 553 - 553
Other comprehensive income for the year - - - - 22 22
Total comprehensive income for the year - - - 553 22 575
Distributions to equity holders - - - (386) - (386)
Issue of share capital O 1 - 5 - - 6 Reserves credit for employee share-based payment schemes R - - - - 27 27 Transfer to retained earnings for vested employee share-based payment schemes Q, R - - - 27 (27) -
Shares acquired by employee trusts - (3) - - - (3)
Shares distributed by employee trusts Q - 10 - (10) - -
31 December 239 (3) 1,115 785 3,405 5,541
Share
capital
Shares held by
trusts
Share premium
reserve Retained earnings
Other reserves
Total equity
2013 Notes £m £m £m £m £m £m
1 January 236 (11) 1,110 650 3,418 5,403
Profit for the year - - - 566 - 566
Other comprehensive income for the year - - - - (14) (14)
Total comprehensive income for the year - - - 566 (14) 552
Distributions to equity holders - - - (636) (20) (656)
Issue of share capital O 2 - - - - 2 Reserves credit for employee share-based payment schemes R - - - - 32 32 Transfer to retained earnings for vested employee share-based payment schemes Q, R - - - 33 (33) -
Shares acquired by employee trusts - (11) - - - (11)
Shares distributed by employee trusts Q - 12 - (12) - -
31 December 238 (10) 1,110 601 3,383 5,322
The Notes on pages 270 to 284 are an integral part of these financial statements.
Standard Life 261
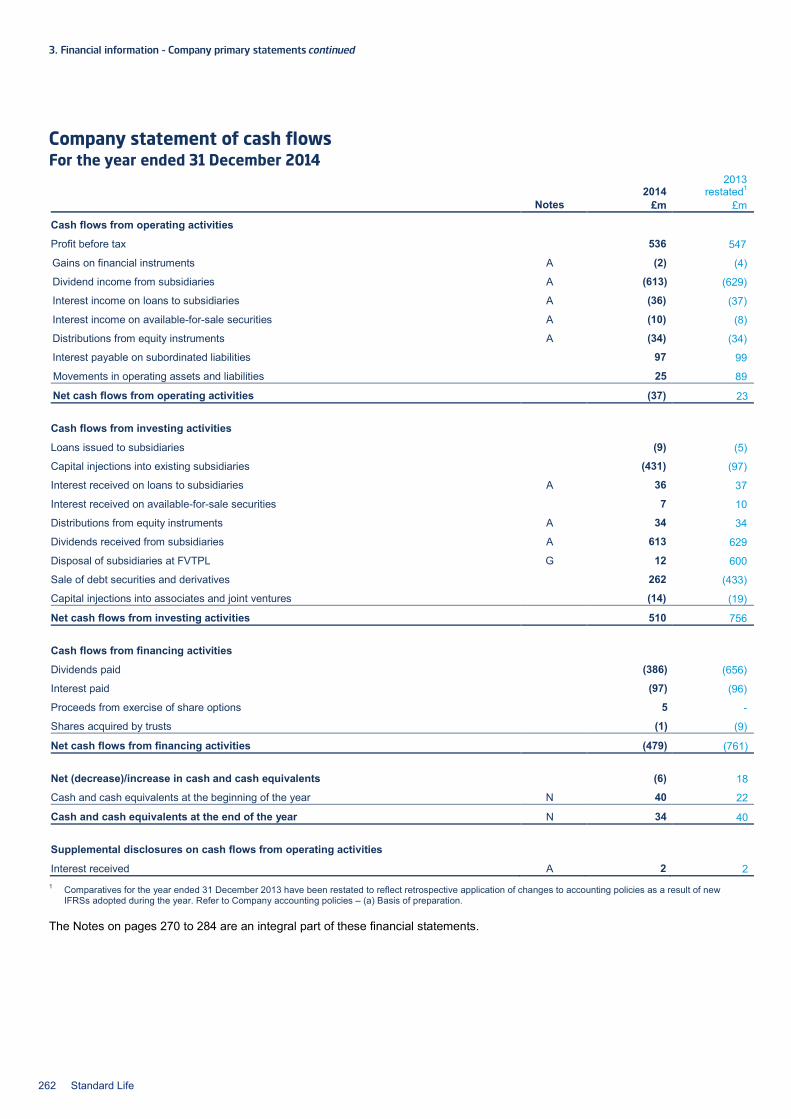
3. Financial information – Company primary statements continued
Company statement of cash flows For the year ended 31 December 2014
2014 2013
restated1 Notes £m £m
Cash flows from operating activities
Profit before tax 536 547
Gains on financial instruments A (2) (4)
Dividend income from subsidiaries A (613) (629)
Interest income on loans to subsidiaries A (36) (37)
Interest income on available-for-sale securities A (10) (8)
Distributions from equity instruments A (34) (34)
Interest payable on subordinated liabilities 97 99
Movements in operating assets and liabilities 25 89
Net cash flows from operating activities (37) 23
Cash flows from investing activities
Loans issued to subsidiaries (9) (5)
Capital injections into existing subsidiaries (431) (97)
Interest received on loans to subsidiaries A 36 37
Interest received on available-for-sale securities 7 10
Distributions from equity instruments A 34 34
Dividends received from subsidiaries A 613 629
Disposal of subsidiaries at FVTPL G 12 600
Sale of debt securities and derivatives 262 (433)
Capital injections into associates and joint ventures (14) (19)
Net cash flows from investing activities 510 756
Cash flows from financing activities
Dividends paid (386) (656)
Interest paid (97) (96)
Proceeds from exercise of share options 5 -
Shares acquired by trusts (1) (9)
Net cash flows from financing activities (479) (761)
Net (decrease)/increase in cash and cash equivalents (6) 18
Cash and cash equivalents at the beginning of the year N 40 22
Cash and cash equivalents at the end of the year N 34 40
Supplemental disclosures on cash flows from operating activities
Interest received A 2 2 1 Comparatives for the year ended 31 December 2013 have been restated to reflect retrospective application of changes to accounting policies as a result of new
IFRSs adopted during the year. Refer to Company accounting policies – (a) Basis of preparation.
The Notes on pages 270 to 284 are an integral part of these financial statements.
262 Standard Life
Company accounting policies (a) Basis of preparation These financial statements have been prepared in accordance with International Financial Reporting Standards (IFRS) issued by the International Accounting Standards Board (IASB) as endorsed by the European Union (EU), with interpretations issued by the IFRS Interpretations Committee and with those parts of the Companies Act 2006 applicable to companies reporting under IFRS. The financial statements have been prepared on a going concern basis and under the historical cost convention, as modified by the revaluation of available-for-sale financial assets and financial assets and financial liabilities (including derivative instruments) at fair value through profit or loss.
The principal accounting policies set out below have been consistently applied to all financial reporting periods presented in these financial statements.
(a)(i) New standards, interpretations and amendments to published standards that have been adopted by the Company
The Company has adopted the following new IFRSs, International Accounting Standards (IASs), interpretations and amendments to existing standards which are effective by EU endorsement for annual periods beginning on or after 1 January 2014 unless otherwise stated: IAS 27 Separate Financial Statements and IFRS 10 Consolidated Financial Statements The amendment to IAS 27 requires companies to adopt a new definition of control as set out in IFRS 10. IFRS 10 defines control, determines how to identify if an investor controls an investee and requires an investor to consolidate entities it controls under the new standard. IFRS 10 identifies three elements, all of which must be present for an investor to control an investee, which are as follows: • Power over the investee • Exposure, or rights, to variable returns from its involvement with the investee • The ability to use that power over the investee to affect the amount of the returns.
The standard has been adopted retrospectively subject to the transition guidance which permits retrospective application only in circumstances when the outcome of the control assessment for individual entities at the date of initial application differs from the outcome under the previous accounting policy.
The impact of the adoption of IAS 27 is that investment vehicles such as open-ended investment companies (OEIC’s), unit trusts and limited partnerships over which the Company is deemed to have control must be classified as investments in subsidiaries. The Company has elected to measure this category of investment in subsidiaries at fair value through profit and loss (FVTPL). This results in an investment in a highly liquid short-term investment fund being reclassified from cash and cash equivalents to investments in subsidiaries at FVTPL.
The impact on the statement of financial position at 31 December 2013 as a result of the retrospective application of the amendment to IAS 27 (2011), is a decrease in cash and cash equivalents of £142m and an increase in investments in subsidiaries of £142m. There is no impact from this new standard on the statement of comprehensive income for the year ended 31 December 2013.
In addition to the above, the Company has restated the statement of cash flows for the year ended 31 December 2013. The overall impact is a decrease in net cash flows from operating activities for the year ended 31 December 2013 of £1m, and an increase in net cash flows from investing activities for the year ended 31 December 2013 of £600m and a decrease in cash and cash equivalents at the beginning of the year of £741m due to the classification of a highly liquid short term investment fund being reclassified from cash and cash equivalents to investments in subsidiaries at FVTPL. There was no impact on cash flows from financing activities.
IAS 28 Investments in Associates and Joint Ventures (2011) IAS 28 (2011) is revised to include joint ventures as well as associates. Additionally, the scope exception within IAS 28 for investments in associates held by venture capital organisations, or mutual funds, unit trusts and similar entities, including investment linked insurance funds, has been removed and as a result the scope of the standard has been widened to include all investments in any entity over which the Company has significant influence. The standard has been revised to allow an entity to elect to measure an investment in associate at fair value through profit or loss (FVTPL) where that investment is held by, or indirectly through, venture capital organisations, or mutual funds, unit trusts and similar entities, including investment linked insurance funds.
The impact of the adoption of IAS 28 (2011) is that an equity investment in an entity over which the Company has significant influence which was previously out of scope of IAS 28 has now been brought into scope resulting in the reclassification of this investment as an investments in associates on the statement of financial position. The Company has elected to continue to measure this investment at FVTPL.
The impact on the statement of financial position at 31 December 2013 as a result of the retrospective application of IAS 28 (2011), is a decrease in equity securities and interests in pooled investment funds of £12m and an increase in investments in associates and joint ventures of £12m. There is no impact from this new standard on the statement of comprehensive income or statement of cash flows for the year ended 31 December 2013.
Standard Life 263
3. Financial information – Company accounting policies continued
Company accounting policies continued (a) Basis of preparation continued (a)(i) New standards, interpretations and amendments to published standards that have been adopted by the
Company continued Additionally, the Company has adopted the following amendments to existing standards which are effective by EU endorsement from 1 January 2014 and the implementation the implementation of these amendments has had no significant impact on the Company’s financial statements: • IFRS 11 Joint Arrangements • IFRS 12 Disclosure of Interests on Other Entities • Amendments to IAS 39 Financial Instruments: Recognition and Measurement and amendments to IAS 32 Financial Instruments:
Presentation and IAS 36 Impairment of Assets. (a)(ii) Standards, interpretations and amendments to published standards that are not yet effective and have not
been early adopted by the Company Certain new standards, interpretations and amendments to existing standards have been published that are mandatory for the Company’s annual accounting periods beginning on or after 1 January 2015. The Company has not early adopted the standards, interpretations and amendments described below:
IFRS 9 Financial Instruments (effective for annual periods beginning on or after 1 January 2018) IFRS 9 will replace IAS 39 Financial Instruments: Recognition and Measurement. IFRS 9 allows only two measurement categories for financial assets: amortised cost and fair value. All equity instruments are measured at fair value. A debt instrument is measured at amortised cost only if it is held to collect contractual cash flows and the cash flows represent principal and interest, otherwise it is measured at fair value through other comprehensive income or FVTPL depending on the business model it is held within or whether the option to adopt FVTPL has been applied. IFRS 9 also introduces a new impairment model, an expected credit loss model which will replace the current incurred loss model in IAS 39. An impairment loss may now be recognised prior to a loss event occurring. Financial liabilities may be designated as at FVTPL. The amortised cost measurement basis is applied to most other financial liabilities. For financial liabilities designated as at FVTPL, changes in the fair value due to changes in the liability’s credit risk are recognised directly in other comprehensive income. Additionally, IFRS 9 removes and replaces the current requirements for hedge effectiveness in IAS 39 and therefore the requirements for the application of hedge accounting. The new requirements change what qualifies as a hedged item and some of the restrictions on the use of some hedging instruments. The accounting and presentation requirements remain largely unchanged. However, entities will now be required to reclassify the gains and losses accumulated in equity on a cash flow hedge to the carrying amount of a non-financial hedged item when it is initially recognised. Additional disclosures on hedge accounting are also required.
As well as presentation and measurement changes, IFRS 9 also introduces additional disclosure requirements. The standard has not yet been endorsed by the EU.
The adoption of IFRS 9 is expected to have an impact on the measurement and presentation of financial instruments and related balances in the consolidated financial statements of the Company.
(a)(iii) Standards, interpretations and amendments to existing standards that are not yet effective and are not expected to have a significant impact on the Company’s operations or to the preparation of separate financial statements
• IFRS 15 Revenue from Contracts with Customers (effective for annual periods beginning on or after 1 January 2017) • IFRIC 21 Levies (effective for annual periods beginning on or after 17 June 2014) • Amendments to IAS 19 Defined Benefit Plans: Employee Contributions (effective for annual periods beginning on or after 1 July
2014) • Annual improvements 2010-2012 cycle and annual improvements 2011-2013 cycle (effective for annual periods beginning on or
after 1 July 2014) • Amendment to IAS 16 Property, Plant & Equipment and IAS 38 Intangible Assets: Depreciation and Amortisation (effective for
annual periods beginning on or after 1 January 2016) • Amendments to IAS 27 Separate Financial Statements: Equity Method in Separate Financial Statements (effective for annual
periods beginning on or after 1 January 2016) • Amendment to IFRS 11 Joint arrangements: Accounting for Acquisitions of Interests in Joint Operations (effective for annual
periods beginning on or after 1 January 2016) • Annual improvements 2012-2014 cycle (effective for annual periods beginning on or after 1 January 2016) • Amendments to IFRS 10 Consolidated Financial Statements, IFRS 12 Disclosure of Interests in Other Entities, IAS 28
Investments in Associates and Joint Ventures: Applying the Consolidation Exception (effective for annual periods beginning on or after 1 January 2016)
• Amendments to IAS 1 Presentation of Financial Instruments: Disclosure Initiative (effective for annual periods beginning on or after 1 January 2016).
264 Standard Life

(a)(iv) Critical accounting estimates and judgement in applying accounting policies The preparation of financial statements requires management to make estimates and assumptions and exercise judgements in applying the accounting policies that affect the reported amounts of assets and liabilities at the date of the financial statements and the reported amounts of revenues and expenses arising during the year. Estimates and judgements are continually evaluated and based on historical experience and other factors, including expectations of future events that are believed to be reasonable under the circumstances. The areas where judgements, estimates and assumptions have the most significant effect on the amounts recognised in the consolidated financial statements are as follows:
Financial statement area Critical accounting judgements, estimates or assumptions Related accounting policies and notes
Assets whose carrying value is subject to impairment testing
Determination of the recoverable amount (b), (e), (g) and Notes G, H and V
(b) Subsidiaries, associates and joint arrangements Subsidiaries are all entities, including structured entities, over which the Company has control.
The Company has certain subsidiaries which are investment vehicles such as open-ended investment companies (OEIC’s), unit trusts and limited partnerships whose primary function is to generate capital or income growth through holding investments. This category of subsidiary is held at FVTPL since they are managed on a fair value basis.
Investments in subsidiaries include loans to subsidiaries that meet the definition of equity instruments. Refer to (g) for more information on the measurement of loans to subsidiaries.
Associates are entities over which the Company has significant influence but not control. Significant influence is the power to participate in the financial and operating policy decisions of the investee either directly or through another Group company acting as a defacto agent.
Where the Company has an investment in associate, a portion of which is held indirectly through a mutual fund, unit trust or similar entity, including investment-linked insurance funds, that portion of the investment is measured at fair value through profit or loss (FVTPL) in accordance with IAS 39.
Joint arrangements are classified as joint ventures when the Company and other parties have joint control of the rights to the net assets of the joint arrangement.
Investments in subsidiaries (other than those measured at FVTPL), associates (other than those measured at FVTPL) and joint ventures are initially recognised at cost and subsequently held at cost less any impairment charge. An impairment charge is recognised when the carrying amount of the investment exceeds its recoverable amount. Any gain or loss on disposal of a subsidiary, associate or joint venture is recognised in the statement of comprehensive income.
(c) Foreign currency translation These financial statements are presented in millions pound Sterling, which is the Company’s functional currency.
Foreign currency transactions are translated at the exchange rate prevailing at the date of the transaction. Gains and losses arising from such transactions and from the translation at year end exchange rates of monetary assets and liabilities denominated in foreign currencies are recognised in the statement of comprehensive income.
Translation differences on non-monetary items, such as equity securities held at FVTPL, are reported as part of the fair value gain or loss within investment return in the statement of comprehensive income. Translation differences on financial assets and liabilities held at amortised cost are included in the relevant line in the statement of comprehensive income.
(d) Revenue recognition Gains and losses resulting from changes in both market value and foreign exchange on investments classified as at FVTPL, including investment income received (such as dividends and interest payments), are recognised in the statement of comprehensive income in the period in which they occur.
Changes in the fair value of derivative financial instruments that are not hedging instruments are recognised immediately in the statement of comprehensive income.
For debt securities classified as available-for-sale (AFS), interest income recognised in the statement of comprehensive income is calculated using the effective interest rate (EIR) method.
Unrealised gains and losses on AFS financial assets are recognised in other comprehensive income unless an impairment loss is recognised. On disposal any accumulated gain or loss previously recognised in other comprehensive income is recycled to the income statement.
For loans measured at amortised cost, interest income recognised in the statement of comprehensive income is calculated using the EIR method.
Dividend income and distributions from securities that are classified by the issuer as equity instruments are recognised in the statement of comprehensive income when the right to receive payment is established.
Standard Life 265

3. Financial information – Company accounting policies continued
Company accounting policies continued (e) Impairment of non-financial assets The carrying amounts of non-financial assets are reviewed for impairment whenever events or changes in circumstances indicate that the carrying amount may not be recoverable, at least at each reporting date. An impairment loss is recognised in the statement of comprehensive income for the amount by which the asset’s carrying amount exceeds its recoverable amount.
The recoverable amount of an asset is the greater of its net selling price (fair value less costs to sell) and the value in use. In assessing value in use, the estimated future cash flows are discounted to their present value using a pre-tax discount rate that reflects current market assessments of the time value of money and the risks specific to the asset. For an asset that does not generate largely independent cash inflows, the recoverable amount is determined for the cash generating unit, or group of units, to which the asset belongs.
(f) Income tax The income tax expense is based on the taxable profits for the year, after adjustments in respect of prior years.
Deferred tax is provided using the liability method on temporary differences arising between the tax bases of assets and liabilities and their carrying amounts in the consolidated financial statements. Deferred tax assets are recognised to the extent that it is probable that future taxable profits will be available against which the temporary differences can be utilised. The amount of deferred tax provided is based on the expected manner of realisation or settlement of the carrying amount of assets and liabilities.
Temporary differences arising from investments in subsidiaries and associates give rise to deferred tax only to the extent that it is probable that the temporary difference will reverse in the foreseeable future and the timing of the reversal of that difference cannot be controlled.
Current and deferred tax is recognised in the income statement except when it relates to items recognised in other comprehensive income or directly in equity, in which case it is credited or charged to other comprehensive income or directly in equity respectively.
The income tax expense is determined using rates enacted or substantively enacted at the reporting date.
(g) Loans Loans are non-derivative financial assets with fixed or determinable payments that are not quoted in an active market.
Management determines the classification of loans at initial recognition. Certain loans are designated as at FVTPL as they are part of groups of assets which are managed and whose performance is evaluated on a fair value basis so as to maximise returns either for policyholders or equity holders. All other loans are classified as loans and receivables. Loans classified as at FVTPL are measured at fair value with changes in fair value recognised in the consolidated income statement.
Loans classified as loans and receivables are initially measured at fair value plus directly attributable transaction costs. Subsequently, they are measured at amortised cost, using the EIR method, less any impairment losses. Revenue from financial assets classified as loans are recognised in the consolidated income statement on an EIR basis.
Impairment on individual loans is determined at each reporting date. Objective evidence that a financial asset or group of assets is impaired includes observable data that comes to the attention of the Company. This would include a measurable decrease in the estimated future cash flow from a group of financial assets since the initial recognition of those assets, although the decrease cannot yet be identified with the individual financial assets in the Company. The Company first assesses whether objective evidence of impairment exists individually for financial assets that are individually significant.
If there is objective evidence that an impairment loss has been incurred on loans carried at amortised cost, the amount of the impairment loss is calculated as the difference between the present value of future cash flows, discounted at the loan's original effective rate, and the loan’s current carrying value. The carrying amount of the asset is reduced through the use of an allowance account and the amount of the loss is recognised in the consolidated income statement. Subsequent recoveries are credited to the consolidated income statement.
If there is no evidence of impairment on an individual basis, a collective impairment review is undertaken whereby the assets are grouped together, on the basis of similar credit risk characteristics, in order to calculate a collective impairment loss. Assets that are individually assessed for impairment and for which an impairment loss is or continues to be recognised are not included in a collective assessment of impairment.
Loans which are subject to collective impairment assessment and whose terms have been renegotiated are no longer considered to be past due but are treated as new loans after the minimum number of payments under the renegotiated terms have been collected. Individually significant loans whose terms have been renegotiated are subject to on-going review to determine whether they remain impaired or past due.
(h) Debt securities and derivatives Management determines the classification of debt securities and derivatives at initial recognition.
Certain debt securities are designated as at FVTPL as they are part of groups of assets which are managed and whose performance is evaluated on a fair value basis so as to maximise returns either for policyholders or equity holders. All other debt securities are designated as AFS.
266 Standard Life
All derivative instruments are classified as held for trading (HFT).
Debt securities and derivatives are recognised at fair value on the trade date of the transaction. In the case of derivatives, where no initial premium is paid or received, the initial measurement value is nil. For instruments classified as HFT or designated as at FVTPL, directly attributable transaction costs are not included in the initial measurement value but are recognised in the consolidated income statement. AFS debt securities are initially recognised at fair value plus directly related transaction costs.
Where a valuation technique is used to establish the fair value of a financial instrument, a difference could arise between the fair value at initial recognition and the amount that would be determined at that date using the valuation technique. When unobservable market data has an impact on the valuation of derivatives, the entire initial change in fair value indicated by the valuation technique is recognised over the life of the transaction on an appropriate basis, or when the inputs become observable, or when the derivative matures or is closed out.
Instruments classified as HFT or as at FVTPL are measured at fair value with changes in fair value recognised in the statement of comprehensive income.
Debt securities designated as AFS are measured at fair value. For these instruments interest calculated using the effective interest method is recognised in the consolidated income statement. Other changes in fair value and any related tax are recognised in other comprehensive income and recorded in a separate reserve within equity until disposal or impairment, when the cumulative gain or loss is recognised in the consolidated income statement with a corresponding movement through other comprehensive income. An AFS debt security is impaired if there is objective evidence that a loss event has occurred which has impaired the expected cash flows.
(i) Financial guarantee contracts A financial guarantee contract is a contract that requires the Company to make specified payments to reimburse the holder for a loss it incurs because a specified debtor fails to make payment when due in accordance with the original or modified terms of a debt instrument. The Company recognises and measures financial guarantee contracts in accordance with IAS 39 Financial Instruments: Recognition and Measurement. The Company initially recognises and measures a financial guarantee contract at its fair value. At each subsequent reporting date, the Company measures the financial guarantee contract at the higher of the initial fair value recognised less, when appropriate, cumulative amortisation recognised in accordance with IAS 18 Revenue and the best estimate of the expenditure required to meet the obligations under the contract at the reporting date, determined in accordance with IAS 37 Provisions, Contingent Liabilities and Contingent Assets.
(j) Cash and cash equivalents Cash and cash equivalents include demand and term deposits and other short-term investments with less than three months to maturity from the date of acquisition. Cash and cash equivalents are categorised for measurement purposes as loans and receivables and are therefore measured at amortised cost.
(k) Equity (k)(i) Share capital and shares held by trusts An equity instrument is any contract that evidences a residual interest in the assets of an entity after deducting all of its liabilities. Shares are classified as equity instruments when there is no contractual obligation to deliver cash or other assets to another entity on terms that may be unfavourable. The difference between the proceeds received on issue of the shares and the nominal value of the shares issued is recorded in the share premium reserve. Incremental costs directly attributable to the issue of new equity instruments are shown in the share premium reserve as a deduction from the proceeds, net of tax. Incremental costs directly attributable to the issue of equity instruments in a business combination are excluded from the consideration transferred.
If the Company purchases any of its equity instruments the consideration paid is treated as a deduction from total equity. Where such shares are sold, if the proceeds are equal to or less than the purchase price paid, the proceeds are treated as a realised profit in equity. If the proceeds exceed the purchase price, the excess over the purchase price is transferred to the share premium account.
(k)(ii) Merger reserve If the Company issues shares at a premium in connection with the acquisition of an equity holding in another entity and the conditions for merger relief under section 612 of the UK Companies Act 2006 are met, which permits the difference between the issue value and nominal value of the shares issued to be transferred to a reserve other than the share premium account, such differences are transferred to the merger reserve. A component of the merger reserve attached to the acquisition of an entity is released to retained earnings on disposal, part disposal or impairment of the interest in that entity.
(l) Subordinated liabilities Subordinated liabilities are initially recognised at the value of proceeds received net of issue expenses. The total finance costs are charged to the statement of comprehensive income over the relevant term of the instrument using the EIR method. The carrying amount of the debt is increased by the finance cost in respect of the reporting period and reduced by payments made in respect of the debt in the period.
Standard Life 267
3. Financial information – Company accounting policies continued
Company accounting policies continued (m) Pension costs and other post-retirement benefits The Group operates a number of defined benefit and defined contribution plans, the assets of which are held in separate trustee administered funds. The pension plans are funded by payments from employees and by the Group companies, determined by periodic actuarial calculations. The sponsoring employer for the defined benefit plan is Standard Life Assurance Limited (SLAL), and therefore the net defined benefit cost of the plan is recognised by SLAL. As a result, the Company treats its participation in the defined benefit plan as a defined contribution plan. Consequently the costs of this plan and the UK defined contribution plan represent the contributions payable for the accounting period.
For the defined contribution plan, the Company pays contributions to separately administered pension insurance plans. The contributions are recognised in staff costs and other employee-related costs when they are due.
(n) Provisions and contingent liabilities Provisions for restructuring costs and legal claims are recognised when the Company has a present legal or constructive obligation as a result of past events, it is more likely than not that an outflow of resources will be required to settle the obligation and the amount has been reliably estimated. Provisions are not recognised for future operating losses. Where there are a number of similar obligations, the likelihood that an outflow will be required in settlement is determined by considering the class of obligations as a whole.
Contingent liabilities are disclosed if the future obligation is less than probable but greater than remote or if the obligation is probable but the amount cannot be reasonably estimated.
(o) Dividend distribution Final dividends on share capital classified as equity instruments are recognised in equity when they have been approved by equity holders. Interim dividends on these shares are recognised in equity in the period in which they are paid.
(p) Employee share-based payments The Company operates share incentive plans for all employees, share-based long-term incentive plans for senior employees and may award annual performance shares to all eligible employees when the Group’s profit targets are met. Further details of the plans are set out in Note 48 of the Group financial statements. For share-based payment employee transactions, services received are measured at fair value.
Fair value of options granted under share incentive plans is determined using a relevant valuation technique, such as the Black Scholes option pricing model. For cash-settled share-based payment transactions, services received are measured at the fair value of the liability using an option pricing model. The fair value of the liability is remeasured at each reporting date and any changes in fair value are recognised in the statement of comprehensive income for the year.
For equity-settled share-based payment transactions, the fair value of services received is measured by reference to the fair value of the equity instruments granted. The fair value of those equity instruments is measured at the grant date, which is the date that the Group and the employees have a shared understanding of the terms and conditions of the award. If that award is subject to an approval process then the grant date is the date when that approval is obtained. Market vesting conditions and non-vesting conditions, such as the requirement of employees to save in the Save-as-you-earn scheme, are included in the calculation of the fair value of the instruments at the date of grant. Vesting conditions which are not market conditions are included in assumptions about the number of instruments that are expected to vest. The charge in respect of the services received is recharged by the Company to the subsidiary which receives the services of the employees.
If the equity instruments granted vest immediately, the employees become unconditionally entitled to those equity instruments. Therefore, the Company immediately recognises an amount due from subsidiaries in respect of the services received in full with a corresponding credit to the equity compensation reserve in equity.
If the equity instruments do not vest until the employee has fulfilled specified vesting conditions, the Group presumes that the services to be rendered by the employee as consideration for those equity instruments will be received in the future, during the period of those vesting conditions (vesting period). Therefore, the Company recognises an amount due from subsidiaries in respect of those services as they are rendered during the vesting period with a corresponding credit to the equity compensation reserve in equity.
Cancellations of awards granted arise where non-vesting conditions attached to the award are not met during the vesting period. Cancellations are accounted for as an acceleration of vesting and the remaining unrecognised expense in respect of the fair value of the award is recognised immediately.
At each period end the Company reassesses the number of equity instruments expected to vest and recognises any difference between the revised and original estimate in the statement of comprehensive income with a corresponding adjustment to the equity compensation reserve.
At the time the equity instruments vest, the amount recognised in the equity compensation reserve in respect of those equity instruments is transferred to retained earnings.
268 Standard Life
(q) Derecognition and offset of financial assets and liabilities A financial asset (or a part of a group of similar financial assets) is derecognised where: • The rights to receive cash flows from the asset have expired • The Company retains the right to receive cash flows from the asset, but has assumed an obligation to pay them in full without
material delay to a third party under a ‘pass through’ arrangement • The Company has transferred its rights to receive cash flows from the asset and has either transferred substantially all the risks
and rewards of the asset, or has neither transferred nor retained substantially all the risks and rewards of the asset, but has transferred control of the asset.
A financial liability is derecognised when the obligation under the liability is discharged, cancelled or expires.
Financial assets and liabilities are offset and the net amount reported on the statement of financial position only when there is a legally enforceable right to offset the recognised amounts and there is an intention to settle on a net basis, or to realise the asset and settle the liability simultaneously. When financial assets and liabilities are offset, any related interest income and expense is offset in the company statement of comprehensive income.
Standard Life 269
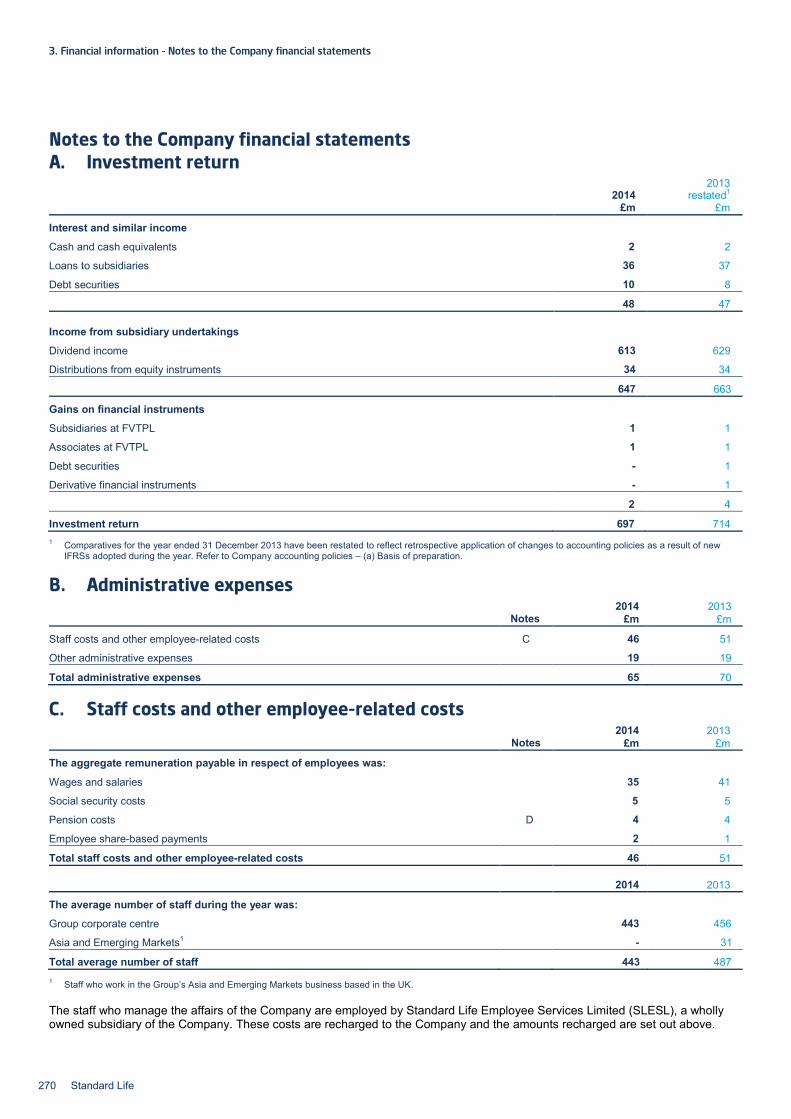
3. Financial information – Notes to the Company financial statements
Notes to the Company financial statements A. Investment return
2014 2013
restated1 £m £m
Interest and similar income
Cash and cash equivalents 2 2
Loans to subsidiaries 36 37
Debt securities 10 8
48 47
Income from subsidiary undertakings
Dividend income 613 629
Distributions from equity instruments 34 34
647 663
Gains on financial instruments
Subsidiaries at FVTPL 1 1
Associates at FVTPL 1 1
Debt securities - 1
Derivative financial instruments - 1
2 4
Investment return 697 714 1 Comparatives for the year ended 31 December 2013 have been restated to reflect retrospective application of changes to accounting policies as a result of new
IFRSs adopted during the year. Refer to Company accounting policies – (a) Basis of preparation.
B. Administrative expenses 2014 2013
Notes £m £m
Staff costs and other employee-related costs C 46 51
Other administrative expenses 19 19
Total administrative expenses 65 70
C. Staff costs and other employee-related costs 2014 2013 Notes £m £m
The aggregate remuneration payable in respect of employees was:
Wages and salaries 35 41
Social security costs 5 5
Pension costs D 4 4
Employee share-based payments 2 1
Total staff costs and other employee-related costs 46 51 2014 2013
The average number of staff during the year was:
Group corporate centre 443 456
Asia and Emerging Markets1 - 31
Total average number of staff 443 487 1 Staff who work in the Group’s Asia and Emerging Markets business based in the UK.
The staff who manage the affairs of the Company are employed by Standard Life Employee Services Limited (SLESL), a wholly owned subsidiary of the Company. These costs are recharged to the Company and the amounts recharged are set out above.
270 Standard Life
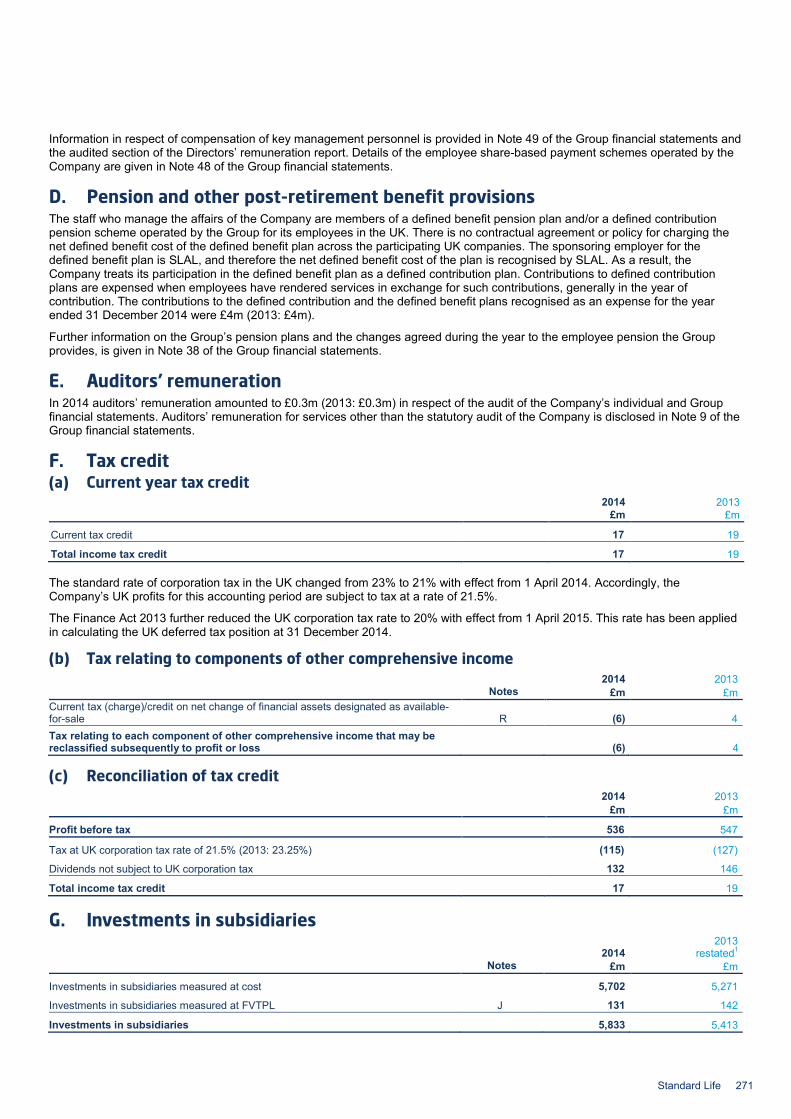
Information in respect of compensation of key management personnel is provided in Note 49 of the Group financial statements and the audited section of the Directors’ remuneration report. Details of the employee share-based payment schemes operated by the Company are given in Note 48 of the Group financial statements.
D. Pension and other post-retirement benefit provisions The staff who manage the affairs of the Company are members of a defined benefit pension plan and/or a defined contribution pension scheme operated by the Group for its employees in the UK. There is no contractual agreement or policy for charging the net defined benefit cost of the defined benefit plan across the participating UK companies. The sponsoring employer for the defined benefit plan is SLAL, and therefore the net defined benefit cost of the plan is recognised by SLAL. As a result, the Company treats its participation in the defined benefit plan as a defined contribution plan. Contributions to defined contribution plans are expensed when employees have rendered services in exchange for such contributions, generally in the year of contribution. The contributions to the defined contribution and the defined benefit plans recognised as an expense for the year ended 31 December 2014 were £4m (2013: £4m).
Further information on the Group’s pension plans and the changes agreed during the year to the employee pension the Group provides, is given in Note 38 of the Group financial statements.
E. Auditors’ remuneration In 2014 auditors’ remuneration amounted to £0.3m (2013: £0.3m) in respect of the audit of the Company’s individual and Group financial statements. Auditors’ remuneration for services other than the statutory audit of the Company is disclosed in Note 9 of the Group financial statements.
F. Tax credit (a) Current year tax credit
2014 2013 £m £m
Current tax credit 17 19
Total income tax credit 17 19
The standard rate of corporation tax in the UK changed from 23% to 21% with effect from 1 April 2014. Accordingly, the Company’s UK profits for this accounting period are subject to tax at a rate of 21.5%.
The Finance Act 2013 further reduced the UK corporation tax rate to 20% with effect from 1 April 2015. This rate has been applied in calculating the UK deferred tax position at 31 December 2014.
(b) Tax relating to components of other comprehensive income 2014 2013 Notes £m £m Current tax (charge)/credit on net change of financial assets designated as available-for-sale R (6) 4 Tax relating to each component of other comprehensive income that may be reclassified subsequently to profit or loss
(6) 4
(c) Reconciliation of tax credit 2014 2013 £m £m
Profit before tax 536 547
Tax at UK corporation tax rate of 21.5% (2013: 23.25%) (115) (127)
Dividends not subject to UK corporation tax 132 146
Total income tax credit 17 19
G. Investments in subsidiaries
2014 2013
restated1 Notes £m £m
Investments in subsidiaries measured at cost 5,702 5,271
Investments in subsidiaries measured at FVTPL J 131 142
Investments in subsidiaries 5,833 5,413
Standard Life 271
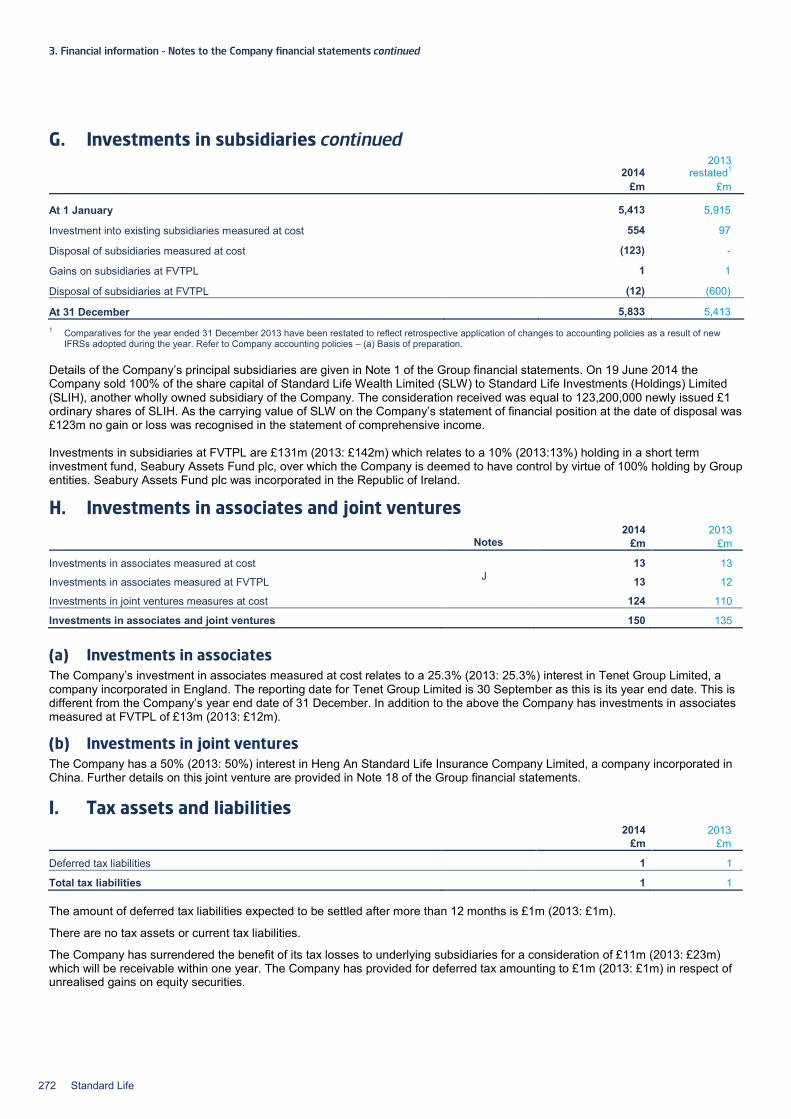
3. Financial information – Notes to the Company financial statements continued
G. Investments in subsidiaries continued
2014 2013 restated1
£m £m
At 1 January 5,413 5,915
Investment into existing subsidiaries measured at cost 554 97
Disposal of subsidiaries measured at cost (123) -
Gains on subsidiaries at FVTPL 1 1
Disposal of subsidiaries at FVTPL (12) (600)
At 31 December 5,833 5,413 1 Comparatives for the year ended 31 December 2013 have been restated to reflect retrospective application of changes to accounting policies as a result of new
IFRSs adopted during the year. Refer to Company accounting policies – (a) Basis of preparation. Details of the Company’s principal subsidiaries are given in Note 1 of the Group financial statements. On 19 June 2014 the Company sold 100% of the share capital of Standard Life Wealth Limited (SLW) to Standard Life Investments (Holdings) Limited (SLIH), another wholly owned subsidiary of the Company. The consideration received was equal to 123,200,000 newly issued £1 ordinary shares of SLIH. As the carrying value of SLW on the Company’s statement of financial position at the date of disposal was £123m no gain or loss was recognised in the statement of comprehensive income. Investments in subsidiaries at FVTPL are £131m (2013: £142m) which relates to a 10% (2013:13%) holding in a short term investment fund, Seabury Assets Fund plc, over which the Company is deemed to have control by virtue of 100% holding by Group entities. Seabury Assets Fund plc was incorporated in the Republic of Ireland.
H. Investments in associates and joint ventures 2014 2013 Notes £m £m
Investments in associates measured at cost 13 13
Investments in associates measured at FVTPL J 13 12
Investments in joint ventures measures at cost 124 110
Investments in associates and joint ventures 150 135 (a) Investments in associates The Company’s investment in associates measured at cost relates to a 25.3% (2013: 25.3%) interest in Tenet Group Limited, a company incorporated in England. The reporting date for Tenet Group Limited is 30 September as this is its year end date. This is different from the Company’s year end date of 31 December. In addition to the above the Company has investments in associates measured at FVTPL of £13m (2013: £12m).
(b) Investments in joint ventures The Company has a 50% (2013: 50%) interest in Heng An Standard Life Insurance Company Limited, a company incorporated in China. Further details on this joint venture are provided in Note 18 of the Group financial statements.
I. Tax assets and liabilities 2014 2013 £m £m
Deferred tax liabilities 1 1
Total tax liabilities 1 1
The amount of deferred tax liabilities expected to be settled after more than 12 months is £1m (2013: £1m).
There are no tax assets or current tax liabilities.
The Company has surrendered the benefit of its tax losses to underlying subsidiaries for a consideration of £11m (2013: £23m) which will be receivable within one year. The Company has provided for deferred tax amounting to £1m (2013: £1m) in respect of unrealised gains on equity securities.
272 Standard Life

Recognised deferred tax 2014 2013 £m £m
Deferred tax liabilities comprise:
Unrealised gains on investments (1) (1)
Net deferred tax liabilities (1) (1)
Movements in deferred tax liabilities comprise:
At 1 January (1) (1)
Amounts credited to net profit - -
At 31 December (1) (1)
J. Financial investments
Designated as at fair
value through profit or loss
Held for trading
Available-for-sale
Loans and receivables Total
2014 Notes £m £m £m £m £m
Investments in subsidiaries at FVTPL 131 - - - 131
Investments in associates at FVTPL 13 - - - 13
Loans to subsidiaries - - - 634 634
Derivative financial assets K - 24 - - 24
Debt securities 135 - 357 - 492 Receivables and other financial assets L - - - 40 40
Cash and cash equivalents N - - - 34 34
Total 279 24 357 708 1,368
Designated as at fair
value through profit or loss
Held for trading
Available-for-sale
Loans and receivables Total
2013 (restated1) Notes £m £m £m £m £m
Investments in subsidiaries at FVTPL 142 - - - 142
Investments in associates at FVTPL 12 - - - 12
Loans to subsidiaries - - - 644 644
Derivative financial assets K - 54 - - 54
Debt securities 391 - 333 - 724
Receivables and other financial assets L - - - 55 55
Cash and cash equivalents N - - - 40 40
Total 545 54 333 739 1,671 1 Comparatives for the year ended 31 December 2013 have been restated to reflect retrospective application of changes to accounting policies as a result of new
IFRSs adopted during the year. Refer to Company accounting policies – (a) Basis of preparation.
The amount of debt securities expected to be recovered or settled after more than 12 months is £357m (2013: £333m). Due to the nature of investments in associates at FVTPL, there is no fixed term associated with these securities.
The amount of loans and receivables expected to be recovered or settled after more than 12 months is £634m (2013: £644m).
K. Derivative financial instruments The Company uses derivative financial instruments in order to reduce the risk from potential movements in foreign exchange rates, equity indices and interest rates, to reduce credit risk or to achieve efficient portfolio management. These instruments are designated as held for trading in the Company’s financial statements.
Included within derivative financial instruments held for trading are certain forward foreign exchange contracts which for the Group hedge part of the currency translation risk of net investments in foreign operations and a portion of the expected cash proceeds for the sale of the Canadian business on 30 January 2015. For details refer to Note 24 of the Group financial statements.
Standard Life 273
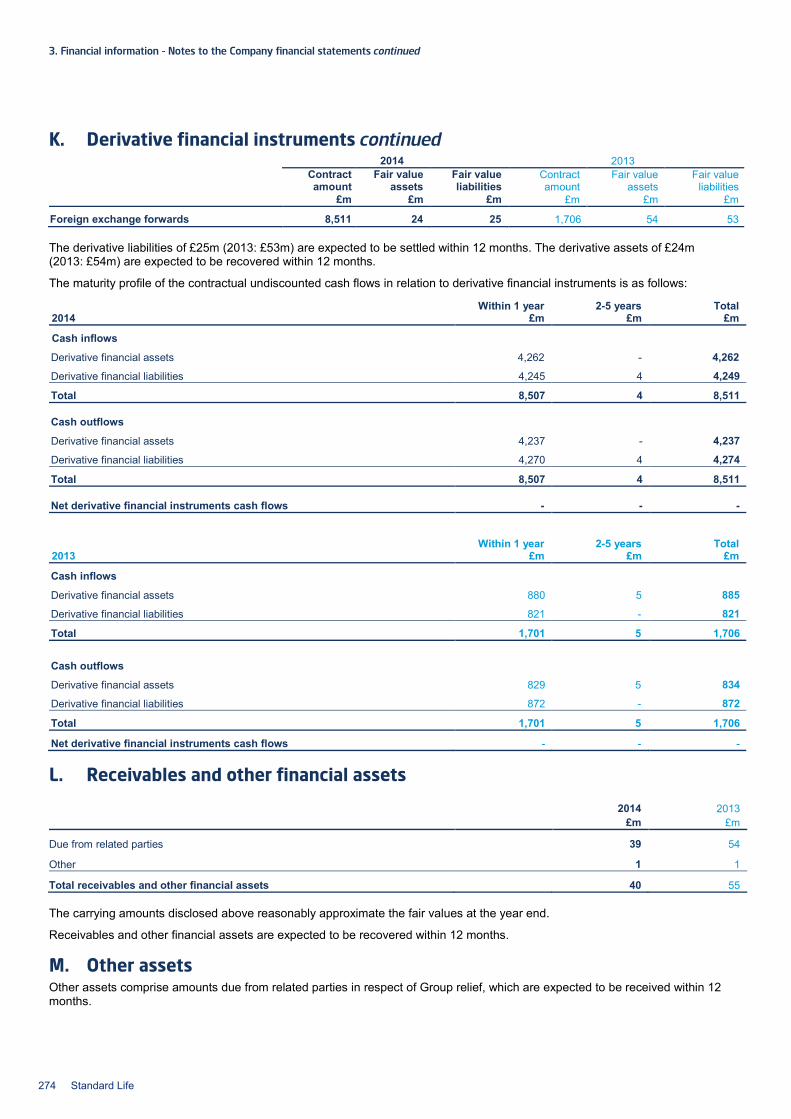
3. Financial information – Notes to the Company financial statements continued
K. Derivative financial instruments continued 2014 2013 Contract
amount Fair value
assets Fair value liabilities
Contract amount
Fair value assets
Fair value liabilities
£m £m £m £m £m £m
Foreign exchange forwards 8,511 24 25 1,706 54 53
The derivative liabilities of £25m (2013: £53m) are expected to be settled within 12 months. The derivative assets of £24m (2013: £54m) are expected to be recovered within 12 months.
The maturity profile of the contractual undiscounted cash flows in relation to derivative financial instruments is as follows:
Within 1 year 2-5 years Total 2014 £m £m £m
Cash inflows
Derivative financial assets 4,262 - 4,262
Derivative financial liabilities 4,245 4 4,249
Total 8,507 4 8,511
Cash outflows
Derivative financial assets 4,237 - 4,237
Derivative financial liabilities 4,270 4 4,274
Total 8,507 4 8,511
Net derivative financial instruments cash flows - - -
Within 1 year 2-5 years Total
2013 £m £m £m
Cash inflows
Derivative financial assets 880 5 885
Derivative financial liabilities 821 - 821
Total 1,701 5 1,706
Cash outflows
Derivative financial assets 829 5 834
Derivative financial liabilities 872 - 872
Total 1,701 5 1,706
Net derivative financial instruments cash flows - - -
L. Receivables and other financial assets
2014 2013 £m £m
Due from related parties 39 54
Other 1 1
Total receivables and other financial assets 40 55
The carrying amounts disclosed above reasonably approximate the fair values at the year end.
Receivables and other financial assets are expected to be recovered within 12 months.
M. Other assets Other assets comprise amounts due from related parties in respect of Group relief, which are expected to be received within 12 months.
274 Standard Life
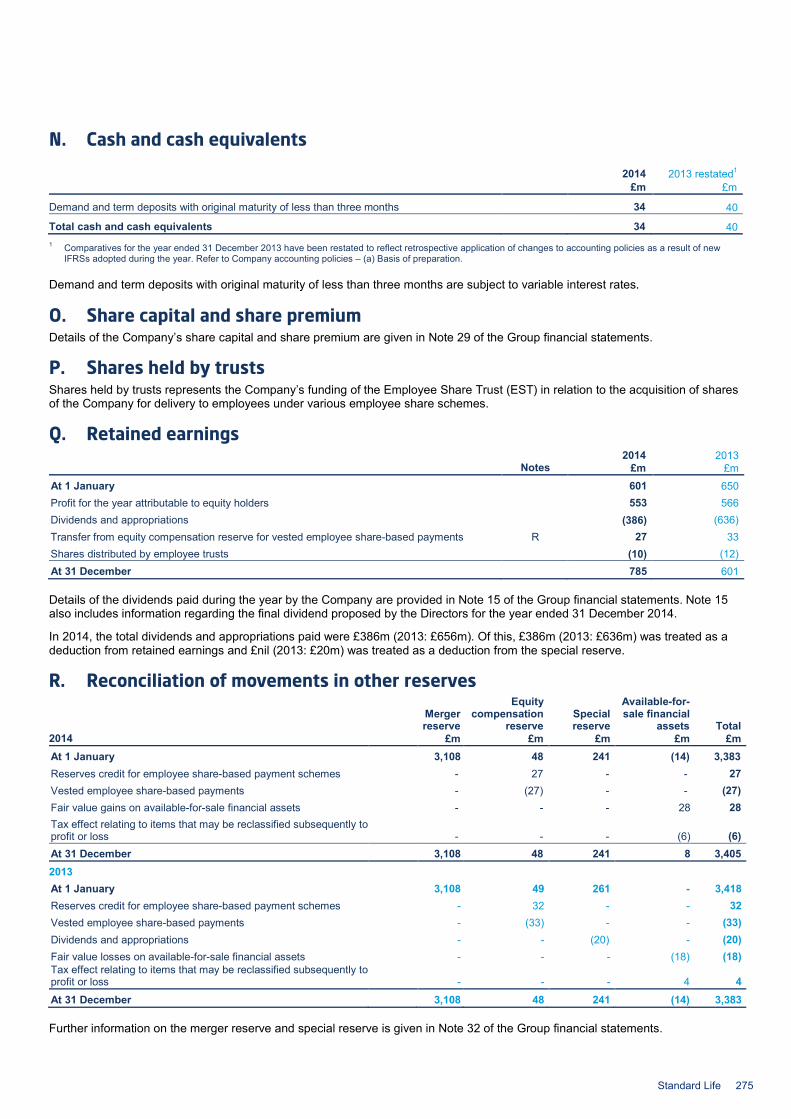
N. Cash and cash equivalents
2014 2013 restated1 £m £m
Demand and term deposits with original maturity of less than three months 34 40
Total cash and cash equivalents 34 40 1 Comparatives for the year ended 31 December 2013 have been restated to reflect retrospective application of changes to accounting policies as a result of new
IFRSs adopted during the year. Refer to Company accounting policies – (a) Basis of preparation.
Demand and term deposits with original maturity of less than three months are subject to variable interest rates.
O. Share capital and share premium Details of the Company’s share capital and share premium are given in Note 29 of the Group financial statements.
P. Shares held by trusts Shares held by trusts represents the Company’s funding of the Employee Share Trust (EST) in relation to the acquisition of shares of the Company for delivery to employees under various employee share schemes.
Q. Retained earnings 2014 2013 Notes £m £m
At 1 January 601 650 Profit for the year attributable to equity holders 553 566 Dividends and appropriations (386) (636) Transfer from equity compensation reserve for vested employee share-based payments R 27 33 Shares distributed by employee trusts (10) (12) At 31 December 785 601
Details of the dividends paid during the year by the Company are provided in Note 15 of the Group financial statements. Note 15 also includes information regarding the final dividend proposed by the Directors for the year ended 31 December 2014.
In 2014, the total dividends and appropriations paid were £386m (2013: £656m). Of this, £386m (2013: £636m) was treated as a deduction from retained earnings and £nil (2013: £20m) was treated as a deduction from the special reserve.
R. Reconciliation of movements in other reserves
Merger reserve
Equity compensation
reserve Special reserve
Available-for-sale financial
assets Total 2014 £m £m £m £m £m At 1 January 3,108 48 241 (14) 3,383 Reserves credit for employee share-based payment schemes - 27 - - 27 Vested employee share-based payments - (27) - - (27) Fair value gains on available-for-sale financial assets - - - 28 28 Tax effect relating to items that may be reclassified subsequently to profit or loss - - - (6) (6) At 31 December 3,108 48 241 8 3,405 2013
At 1 January 3,108 49 261 - 3,418 Reserves credit for employee share-based payment schemes - 32 - - 32 Vested employee share-based payments - (33) - - (33) Dividends and appropriations - - (20) - (20) Fair value losses on available-for-sale financial assets - - - (18) (18) Tax effect relating to items that may be reclassified subsequently to profit or loss - - - 4 4 At 31 December 3,108 48 241 (14) 3,383
Further information on the merger reserve and special reserve is given in Note 32 of the Group financial statements.
Standard Life 275
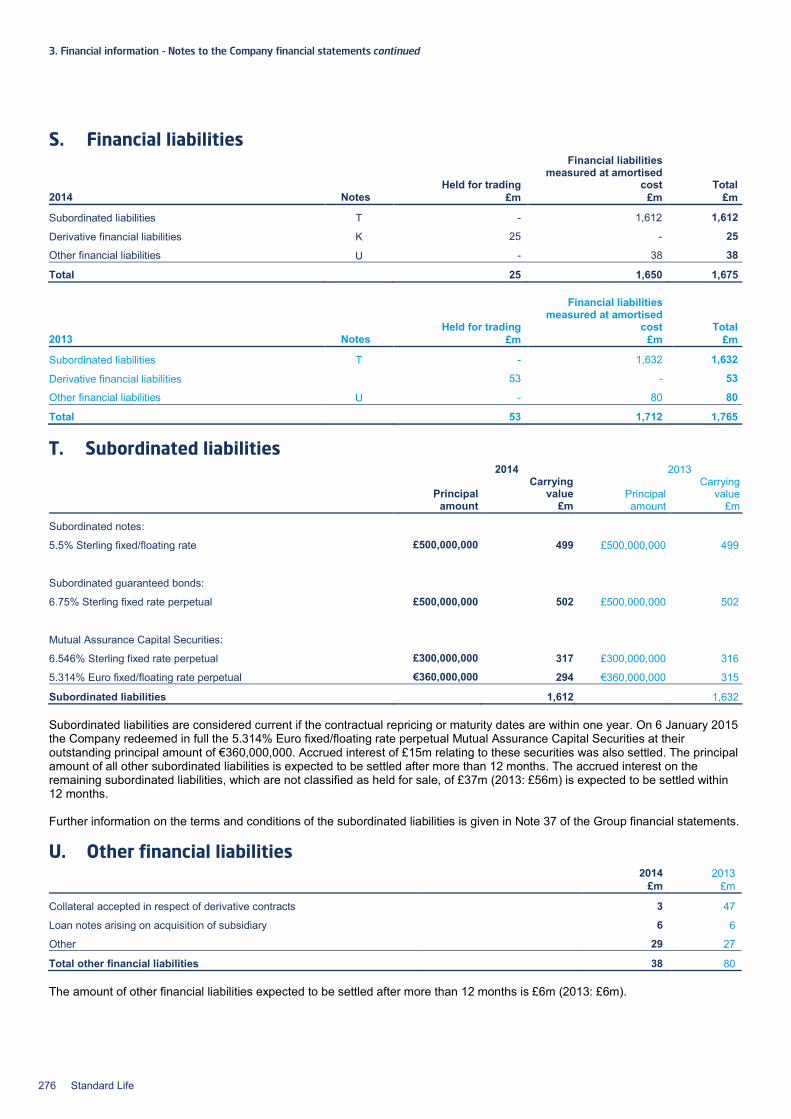
3. Financial information – Notes to the Company financial statements continued
S. Financial liabilities
Held for trading
Financial liabilities measured at amortised
cost Total 2014 Notes £m £m £m
Subordinated liabilities T - 1,612 1,612
Derivative financial liabilities K 25 - 25
Other financial liabilities U - 38 38
Total 25 1,650 1,675
Held for trading
Financial liabilities measured at amortised
cost Total 2013 Notes £m £m £m
Subordinated liabilities T - 1,632 1,632
Derivative financial liabilities 53 - 53
Other financial liabilities U - 80 80
Total 53 1,712 1,765
T. Subordinated liabilities 2014 2013
Principal Carrying
value Principal Carrying
value amount £m amount £m
Subordinated notes:
5.5% Sterling fixed/floating rate £500,000,000 499 £500,000,000 499
Subordinated guaranteed bonds:
6.75% Sterling fixed rate perpetual £500,000,000 502 £500,000,000 502
Mutual Assurance Capital Securities:
6.546% Sterling fixed rate perpetual £300,000,000 317 £300,000,000 316
5.314% Euro fixed/floating rate perpetual €360,000,000 294 €360,000,000 315
Subordinated liabilities 1,612 1,632
Subordinated liabilities are considered current if the contractual repricing or maturity dates are within one year. On 6 January 2015 the Company redeemed in full the 5.314% Euro fixed/floating rate perpetual Mutual Assurance Capital Securities at their outstanding principal amount of €360,000,000. Accrued interest of £15m relating to these securities was also settled. The principal amount of all other subordinated liabilities is expected to be settled after more than 12 months. The accrued interest on the remaining subordinated liabilities, which are not classified as held for sale, of £37m (2013: £56m) is expected to be settled within 12 months. Further information on the terms and conditions of the subordinated liabilities is given in Note 37 of the Group financial statements.
U. Other financial liabilities 2014 2013 £m £m
Collateral accepted in respect of derivative contracts 3 47
Loan notes arising on acquisition of subsidiary 6 6
Other 29 27
Total other financial liabilities 38 80
The amount of other financial liabilities expected to be settled after more than 12 months is £6m (2013: £6m).
276 Standard Life

V. Risk management (a) Overview An overview of the Group risk management framework and policies is provided in Note 42 of the Group financial statements.
The Company is exposed to market, credit and liquidity risks.
(b) Market risk The Group defines market risk as the risk that arises from the Group’s exposure to market movements which could result in the value of income, or the value of financial assets and liabilities, or the cash flows relating to these, fluctuating by different amounts.
The most significant element of market risk for the Company arises from its exposure to fluctuations in interest rates and equity markets. The Company is exposed to fluctuations in the fair value of future cash flows of financial instruments caused by changes in market interest rates. Financial assets and liabilities which are subject to the most significant exposure to interest rate risk include corporate bonds, money market instruments, derivative financial instruments and subordinated liabilities. The Company is also exposed to fluctuations in the equity securities markets, and as a result, changes in the value of its holdings and the return on those holdings.
Market risk is managed through the Group market risk policy. The Company is required to manage risk in accordance with the policy and to take mitigating action as appropriate to operate within defined risk appetites. The Company ensures that risks remain within the approved market risk appetite through the use of a number of specific controls and techniques, including defined lists of permitted securities and/or application of investment constraints and the active use of derivatives to improve the matching characteristics of assets and liabilities.
The Company’s investments and liabilities are generally held in its functional currency. However, for strategic and capital reasons the Company may hold investments and liabilities in other currencies. In these cases, derivative financial instruments may be employed to manage currency exposure so that the Company has no remaining significant exposure to foreign exchange fluctuations.
Derivative instruments may also be utilised to reduce risk arising from exposure to fluctuations in interest rates and equity indices. Transactions in derivatives are undertaken on a regulated market or are with an approved counterparty. In employing derivatives, the Company must always have sufficient cash and cash equivalents or underlying assets to cover any potential obligation or exercise right following reasonably foreseeable adverse variations.
(b)(i) Market risk concentrations The Group manages market risk concentrations by ensuring that exposure is divided among a number of instruments. For each type of asset within a portfolio, responsibility for setting adequately diversified benchmarks and for limiting the structure of market risk exposure is set by the Company.
The following table provides information regarding the market risk exposure of the Company at 31 December 2014 and 31 December 2013, showing diversification by asset type and geographic region.
The geographic classification for loans and cash and cash equivalents is determined by the currency of the underlying financial instruments. Geography UK Europe Other Total
2014 2013
restated1 2014 2013 2014 2013
restated1 2014 2013
restated1 £m £m £m £m £m £m £m £m
Investments in subsidiaries at FVTPL 131 142 - - - - 131 142
Investments in associates at FVTPL - - - - 13 12 13 12
Loans to subsidiaries 317 316 294 315 23 13 634 644
Derivative financial assets 24 54 - - - - 24 54
Debt securities 277 519 181 150 34 55 492 724
Cash and cash equivalents 30 23 4 17 - - 34 40
779 1,054 479 482 70 80 1,328 1,616
Receivables and other financial assets 40 55
Financial investments 1,368 1,671 1 Comparatives for the year ended 31 December 2013 have been restated to reflect retrospective application of changes to accounting policies as a result of new
IFRSs adopted during the year. Refer to Company accounting policies – (a) Basis of preparation.
The market risk exposure to foreign currency assets is either matched by liabilities held in the same currency or managed using derivative financial instruments.
Standard Life 277

3. Financial information – Notes to the Company financial statements continued
V. Risk management continued (b) Market risk continued (b)(ii) Sensitivity analysis – market risk The table below illustrates the sensitivity of profit after tax and equity to reasonably possible variations in the key assumptions made in relation to the Company’s most significant market risk exposures. The sensitivity analysis has been performed by calculating the sensitivity of profit after tax and equity to changes in equity security prices and to changes in interest rates as at the reporting date, assuming other assumptions remain unchanged. When illustrating the impact of equity risk, the expectations of corporate earnings remain unchanged. Correlation between the different risks and/or other factors may mean that experience would differ from that expected if more than one risk event occurred simultaneously.
Equity Interest +20% -20% +10% -10% +1% -1% 2014 2013 2014 2013 2014 2013 2014 2013 2014 2013 2014 2013 £m £m £m £m £m £m £m £m £m £m £m £m
Impact on profit after tax 3 2 (3) (2) 1 1 (1) (1) 1 1 1 (1)
Equity sensitivity to market risk The company classifies certain debt securities which back subordinated debt liabilities as AFS. These debt securities are measured at fair value. Interest is calculated using the effective interest method and recognised in the income statement. Other changes in fair value and the related tax are recognised in other comprehensive income. As a result, the sensitivity of the Company's equity to variations in interest rate risk exposures differs from the sensitivity of the Company's profit after tax to variations in interest rate risk exposures.
The Company’s equity sensitivity to a 1% increase in interest rates is (£17m) (2013: (£17m)) and to a 1% decrease in interest rates is £17m (2013: £17m).
The sensitivity of the Company’s total equity to variations in equity markets in respect of each of the scenarios shown in the preceding tables is the same as the sensitivity of the Company’s profit after tax.
Limitations The sensitivity analysis is non-linear and larger or smaller impacts should not be derived from these results. The sensitivity analysis represents the impact on profit at the year end that the changes in assumptions can have. The sensitivity will vary with time, both due to changes in market conditions and changes in the actual asset mix, and this mix is being actively managed. The results of the sensitivity analysis may also have been different from those illustrated had the tests been applied at a date other than the reporting date.
(c) Credit risk The Group defines credit risk as the risk of exposure to loss if a counterparty fails to perform its financial obligations, including failure to perform these obligations in a timely manner. It also includes the risk of a reduction in the value of assets due to widening of mortgage, bond and swap spreads.
Credit risk is managed through the Group credit risk policy. The Company is required to manage risk in accordance with the Group policy and to take mitigating action as appropriate to operate within defined risk appetites.
In managing credit risk, maximum counterparty exposure limits are used for financial instruments where the Company has significant credit risk.
For cash and cash equivalents, the Company maintains exposures within limits that are set with reference to internal credit assessments. For derivative financial instruments, maximum counterparty exposure limits, net of collateral, are set with reference to internal credit assessments. The forms of collateral that may be accepted are also specified and minimum transfer amounts in respect of collateral transfers are documented. No credit limits are set in respect of loans to subsidiaries, where the main exposure is to SLAL, a wholly owned subsidiary undertaking, with long-term ratings of A+ from Standard & Poor’s and A1 from Moody’s. Any loans to subsidiaries require approval from the Group Enterprise Risk Management Committee prior to being transacted.
(c)(i) Credit exposure of financial assets The following table provides an analysis of the quality of financial assets that are neither past due nor impaired at the reporting date and are exposed to credit risk. For those financial assets with credit ratings assigned by external rating agencies, classification is within the range of AAA to BBB. AAA is the highest possible rating and rated financial assets that fall outside the range of AAA to BBB have been classified as below BBB. For those financial assets that do not have credit ratings assigned by external rating agencies but where the Company has assigned internal ratings for use in managing and monitoring credit risk, the assets have been classified in the analysis that follows as ‘internally rated’. If a financial asset is neither rated by an external agency nor ‘internally rated’, it is classified as ‘not rated’. The total amounts presented represent the Company’s maximum exposure to credit risk at the reporting date without taking into account any collateral held. The analysis also provides information on the concentration of credit risk.
278 Standard Life
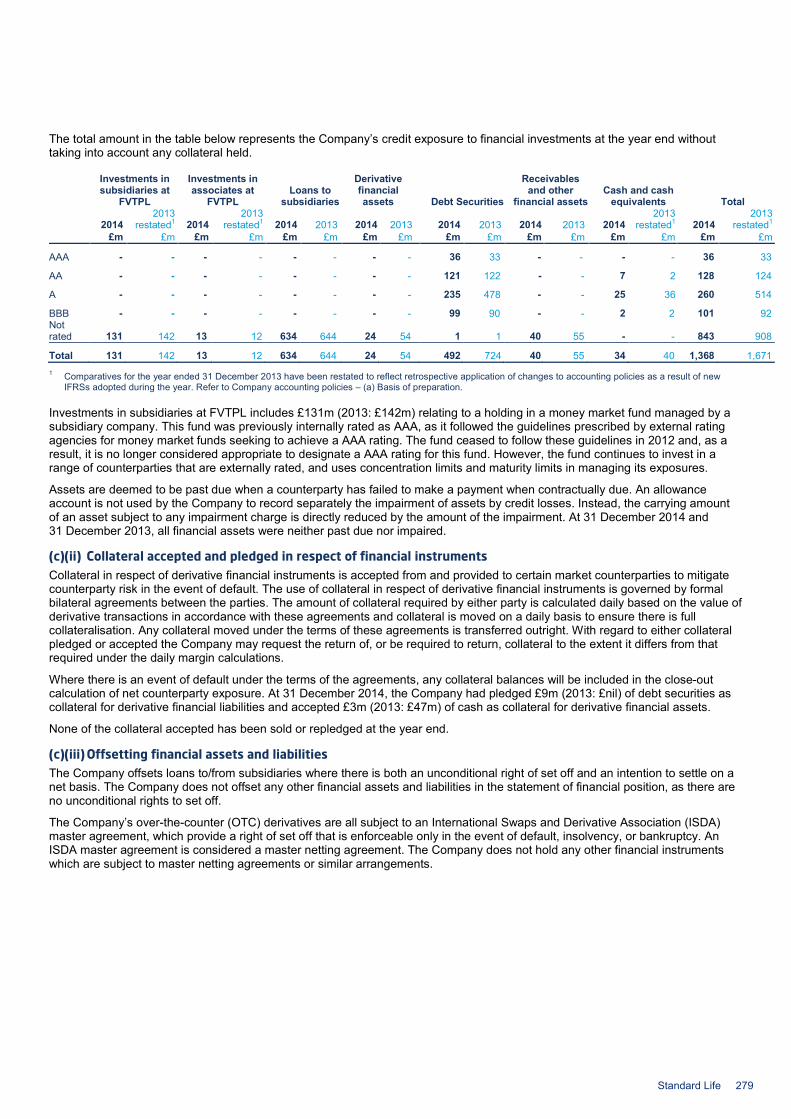
The total amount in the table below represents the Company’s credit exposure to financial investments at the year end without taking into account any collateral held.
Investments in subsidiaries at
FVTPL
Investments in associates at
FVTPL Loans to
subsidiaries
Derivative financial assets Debt Securities
Receivables and other
financial assets Cash and cash
equivalents Total
2014 2013
restated1 2014 2013
restated1 2014 2013 2014 2013 2014 2013 2014 2013 2014 2013
restated1 2014 2013
restated1 £m £m £m £m £m £m £m £m £m £m £m £m £m £m £m £m
AAA - - - - - - - - 36 33 - - - - 36 33
AA - - - - - - - - 121 122 - - 7 2 128 124
A - - - - - - - - 235 478 - - 25 36 260 514
BBB - - - - - - - - 99 90 - - 2 2 101 92 Not rated 131 142 13 12 634 644 24 54 1 1 40 55 - - 843 908
Total 131 142 13 12 634 644 24 54 492 724 40 55 34 40 1,368 1,671 1 Comparatives for the year ended 31 December 2013 have been restated to reflect retrospective application of changes to accounting policies as a result of new
IFRSs adopted during the year. Refer to Company accounting policies – (a) Basis of preparation.
Investments in subsidiaries at FVTPL includes £131m (2013: £142m) relating to a holding in a money market fund managed by a subsidiary company. This fund was previously internally rated as AAA, as it followed the guidelines prescribed by external rating agencies for money market funds seeking to achieve a AAA rating. The fund ceased to follow these guidelines in 2012 and, as a result, it is no longer considered appropriate to designate a AAA rating for this fund. However, the fund continues to invest in a range of counterparties that are externally rated, and uses concentration limits and maturity limits in managing its exposures.
Assets are deemed to be past due when a counterparty has failed to make a payment when contractually due. An allowance account is not used by the Company to record separately the impairment of assets by credit losses. Instead, the carrying amount of an asset subject to any impairment charge is directly reduced by the amount of the impairment. At 31 December 2014 and 31 December 2013, all financial assets were neither past due nor impaired.
(c)(ii) Collateral accepted and pledged in respect of financial instruments Collateral in respect of derivative financial instruments is accepted from and provided to certain market counterparties to mitigate counterparty risk in the event of default. The use of collateral in respect of derivative financial instruments is governed by formal bilateral agreements between the parties. The amount of collateral required by either party is calculated daily based on the value of derivative transactions in accordance with these agreements and collateral is moved on a daily basis to ensure there is full collateralisation. Any collateral moved under the terms of these agreements is transferred outright. With regard to either collateral pledged or accepted the Company may request the return of, or be required to return, collateral to the extent it differs from that required under the daily margin calculations.
Where there is an event of default under the terms of the agreements, any collateral balances will be included in the close-out calculation of net counterparty exposure. At 31 December 2014, the Company had pledged £9m (2013: £nil) of debt securities as collateral for derivative financial liabilities and accepted £3m (2013: £47m) of cash as collateral for derivative financial assets.
None of the collateral accepted has been sold or repledged at the year end.
(c)(iii) Offsetting financial assets and liabilities The Company offsets loans to/from subsidiaries where there is both an unconditional right of set off and an intention to settle on a net basis. The Company does not offset any other financial assets and liabilities in the statement of financial position, as there are no unconditional rights to set off.
The Company’s over-the-counter (OTC) derivatives are all subject to an International Swaps and Derivative Association (ISDA) master agreement, which provide a right of set off that is enforceable only in the event of default, insolvency, or bankruptcy. An ISDA master agreement is considered a master netting agreement. The Company does not hold any other financial instruments which are subject to master netting agreements or similar arrangements.
Standard Life 279
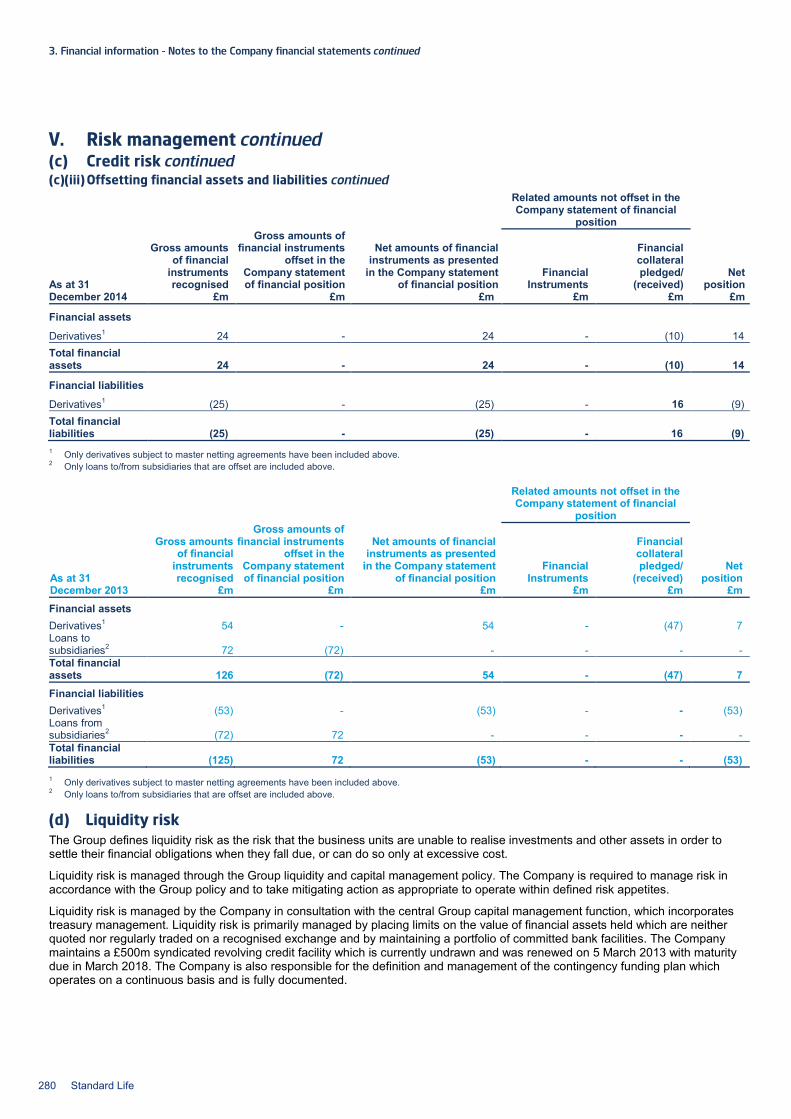
3. Financial information – Notes to the Company financial statements continued
V. Risk management continued (c) Credit risk continued (c)(iii) Offsetting financial assets and liabilities continued
Related amounts not offset in the Company statement of financial
position
As at 31 December 2014
Gross amounts of financial
instruments recognised
Gross amounts of financial instruments
offset in the Company statement of financial position
Net amounts of financial instruments as presented
in the Company statement of financial position
Financial Instruments
Financial collateral pledged/
(received) Net
position £m £m £m £m £m £m
Financial assets
Derivatives1 24 - 24 - (10) 14 Total financial assets 24 - 24 - (10) 14
Financial liabilities
Derivatives1 (25) - (25) - 16 (9) Total financial liabilities (25) - (25) - 16 (9) 1 Only derivatives subject to master netting agreements have been included above. 2 Only loans to/from subsidiaries that are offset are included above.
Related amounts not offset in the Company statement of financial
position
As at 31 December 2013
Gross amounts of financial
instruments recognised
Gross amounts of financial instruments
offset in the Company statement of financial position
Net amounts of financial instruments as presented
in the Company statement of financial position
Financial Instruments
Financial collateral pledged/
(received) Net
position £m £m £m £m £m £m
Financial assets Derivatives1 54 - 54 - (47) 7 Loans to subsidiaries2 72 (72) - - - - Total financial assets 126 (72) 54 - (47) 7 Financial liabilities Derivatives1 (53) - (53) - - (53) Loans from subsidiaries2 (72) 72 - - - - Total financial liabilities (125) 72 (53) - - (53) 1 Only derivatives subject to master netting agreements have been included above. 2 Only loans to/from subsidiaries that are offset are included above.
(d) Liquidity risk The Group defines liquidity risk as the risk that the business units are unable to realise investments and other assets in order to settle their financial obligations when they fall due, or can do so only at excessive cost.
Liquidity risk is managed through the Group liquidity and capital management policy. The Company is required to manage risk in accordance with the Group policy and to take mitigating action as appropriate to operate within defined risk appetites.
Liquidity risk is managed by the Company in consultation with the central Group capital management function, which incorporates treasury management. Liquidity risk is primarily managed by placing limits on the value of financial assets held which are neither quoted nor regularly traded on a recognised exchange and by maintaining a portfolio of committed bank facilities. The Company maintains a £500m syndicated revolving credit facility which is currently undrawn and was renewed on 5 March 2013 with maturity due in March 2018. The Company is also responsible for the definition and management of the contingency funding plan which operates on a continuous basis and is fully documented.
280 Standard Life
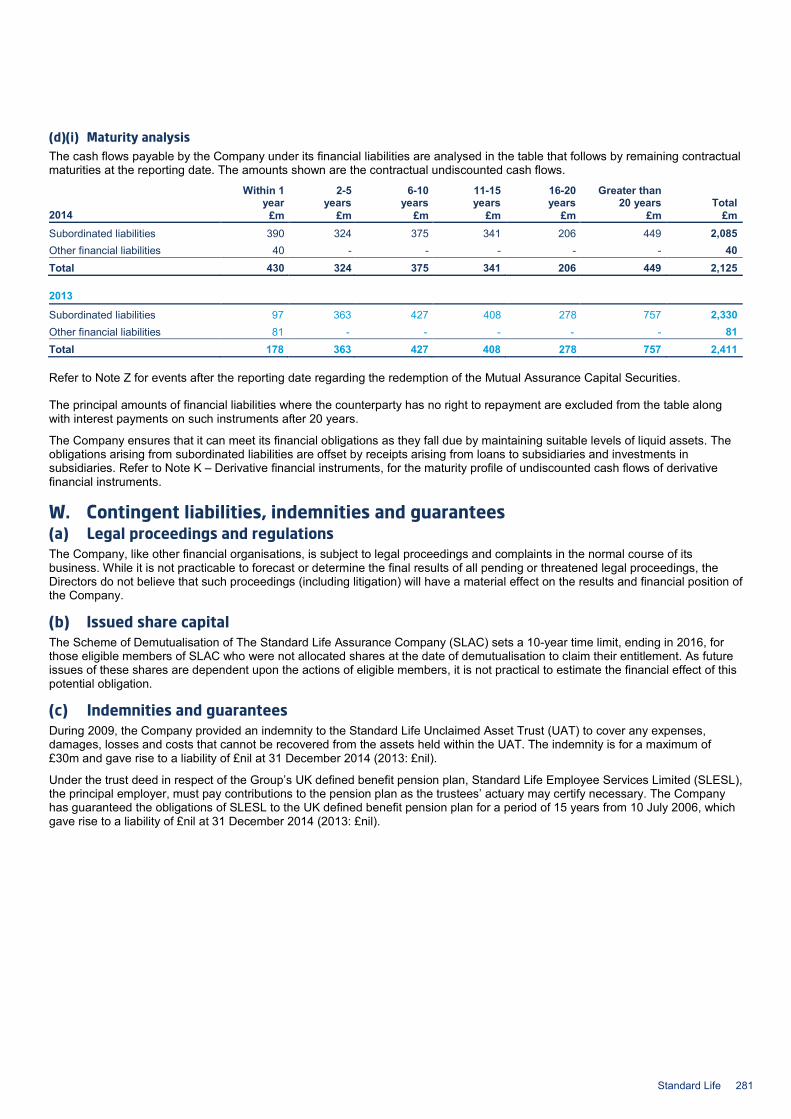
(d)(i) Maturity analysis The cash flows payable by the Company under its financial liabilities are analysed in the table that follows by remaining contractual maturities at the reporting date. The amounts shown are the contractual undiscounted cash flows.
Within 1 year
2-5 years
6-10 years
11-15 years
16-20 years
Greater than 20 years Total
2014 £m £m £m £m £m £m £m Subordinated liabilities 390 324 375 341 206 449 2,085 Other financial liabilities 40 - - - - - 40 Total 430 324 375 341 206 449 2,125 2013
Subordinated liabilities 97 363 427 408 278 757 2,330 Other financial liabilities 81 - - - - - 81 Total 178 363 427 408 278 757 2,411
Refer to Note Z for events after the reporting date regarding the redemption of the Mutual Assurance Capital Securities.
The principal amounts of financial liabilities where the counterparty has no right to repayment are excluded from the table along with interest payments on such instruments after 20 years.
The Company ensures that it can meet its financial obligations as they fall due by maintaining suitable levels of liquid assets. The obligations arising from subordinated liabilities are offset by receipts arising from loans to subsidiaries and investments in subsidiaries. Refer to Note K – Derivative financial instruments, for the maturity profile of undiscounted cash flows of derivative financial instruments.
W. Contingent liabilities, indemnities and guarantees (a) Legal proceedings and regulations The Company, like other financial organisations, is subject to legal proceedings and complaints in the normal course of its business. While it is not practicable to forecast or determine the final results of all pending or threatened legal proceedings, the Directors do not believe that such proceedings (including litigation) will have a material effect on the results and financial position of the Company.
(b) Issued share capital The Scheme of Demutualisation of The Standard Life Assurance Company (SLAC) sets a 10-year time limit, ending in 2016, for those eligible members of SLAC who were not allocated shares at the date of demutualisation to claim their entitlement. As future issues of these shares are dependent upon the actions of eligible members, it is not practical to estimate the financial effect of this potential obligation.
(c) Indemnities and guarantees During 2009, the Company provided an indemnity to the Standard Life Unclaimed Asset Trust (UAT) to cover any expenses, damages, losses and costs that cannot be recovered from the assets held within the UAT. The indemnity is for a maximum of £30m and gave rise to a liability of £nil at 31 December 2014 (2013: £nil).
Under the trust deed in respect of the Group’s UK defined benefit pension plan, Standard Life Employee Services Limited (SLESL), the principal employer, must pay contributions to the pension plan as the trustees’ actuary may certify necessary. The Company has guaranteed the obligations of SLESL to the UK defined benefit pension plan for a period of 15 years from 10 July 2006, which gave rise to a liability of £nil at 31 December 2014 (2013: £nil).
Standard Life 281

3. Financial information – Notes to the Company financial statements continued
X. Related party transactions (a) Transactions with and balances from/(to) related parties In the normal course of business, the Company enters into transactions with related parties. The year end balances arising from such transactions are as follows:
2014
2013 restated1
£m £m Due from related parties: Subsidiaries 49 77 Loans to subsidiaries 634 644 683 721
Transactions with related parties carried out by the Company during the year were as follows:
2014 2013 £m £m
Revenues from related parties: Subsidiaries 684 701 Associates 1 1 685 702
Expenses to related parties: Subsidiaries 64 66 64 66
Where financial instruments arising from transactions with related parties are offset in the statement of financial position, the net position is presented in the tables above.
(b) Compensation of key management personnel The Directors and key management personnel of the Company are considered to be the same as for the Group. Information on both Company and Group compensation paid to Directors and key management personnel can be found in Note 49 of the Group financial statements. Information on transactions with/from and balances from/to key management personnel and their close family members can also be found in Note 49 of the Group financial statements.
Y. Fair value of assets and liabilities (a) Determination of fair value hierarchy To provide further information on the approach used to determine and measure the fair value of certain assets and liabilities, the following fair value hierarchy categorisation has been used: Level 1 Fair values measured using quoted prices (unadjusted) in active markets for identical assets or liabilities. An active
market exists where transactions take place with sufficient frequency and volume to provide pricing information on an ongoing basis.
Level 2 Fair values measured using inputs other than quoted prices included within level 1 that are observable for the asset or liability, either directly (i.e. as prices) or indirectly (i.e. derived from prices).
Level 3 Fair values measured using inputs that are not based on observable market data (unobservable inputs).
(b) Financial investments and financial liabilities An analysis of the Company’s financial investments and financial liabilities in accordance with the categories of financial instrument set out in IAS 39 Financial Instruments: Recognition and Measurement is presented in Notes J and S and includes those financial assets and liabilities held at fair value.
(c) Methods and assumptions used to determine fair value of assets and liabilities Information on the methods and assumptions used to determine fair values for each major category of instrument measured at fair value is given in the following note:
282 Standard Life
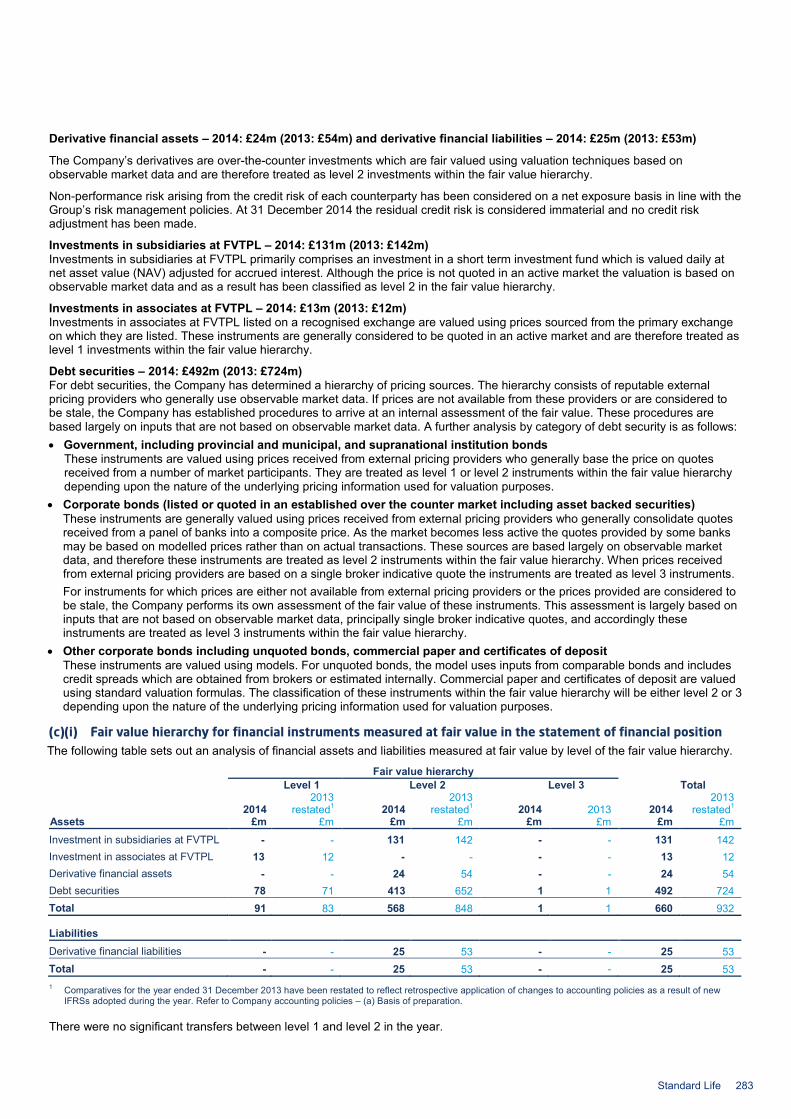
Derivative financial assets – 2014: £24m (2013: £54m) and derivative financial liabilities – 2014: £25m (2013: £53m)
The Company’s derivatives are over-the-counter investments which are fair valued using valuation techniques based on observable market data and are therefore treated as level 2 investments within the fair value hierarchy.
Non-performance risk arising from the credit risk of each counterparty has been considered on a net exposure basis in line with the Group’s risk management policies. At 31 December 2014 the residual credit risk is considered immaterial and no credit risk adjustment has been made.
Investments in subsidiaries at FVTPL – 2014: £131m (2013: £142m) Investments in subsidiaries at FVTPL primarily comprises an investment in a short term investment fund which is valued daily at net asset value (NAV) adjusted for accrued interest. Although the price is not quoted in an active market the valuation is based on observable market data and as a result has been classified as level 2 in the fair value hierarchy.
Investments in associates at FVTPL – 2014: £13m (2013: £12m) Investments in associates at FVTPL listed on a recognised exchange are valued using prices sourced from the primary exchange on which they are listed. These instruments are generally considered to be quoted in an active market and are therefore treated as level 1 investments within the fair value hierarchy.
Debt securities – 2014: £492m (2013: £724m) For debt securities, the Company has determined a hierarchy of pricing sources. The hierarchy consists of reputable external pricing providers who generally use observable market data. If prices are not available from these providers or are considered to be stale, the Company has established procedures to arrive at an internal assessment of the fair value. These procedures are based largely on inputs that are not based on observable market data. A further analysis by category of debt security is as follows: • Government, including provincial and municipal, and supranational institution bonds
These instruments are valued using prices received from external pricing providers who generally base the price on quotes received from a number of market participants. They are treated as level 1 or level 2 instruments within the fair value hierarchy depending upon the nature of the underlying pricing information used for valuation purposes.
• Corporate bonds (listed or quoted in an established over the counter market including asset backed securities) These instruments are generally valued using prices received from external pricing providers who generally consolidate quotes received from a panel of banks into a composite price. As the market becomes less active the quotes provided by some banks may be based on modelled prices rather than on actual transactions. These sources are based largely on observable market data, and therefore these instruments are treated as level 2 instruments within the fair value hierarchy. When prices received from external pricing providers are based on a single broker indicative quote the instruments are treated as level 3 instruments. For instruments for which prices are either not available from external pricing providers or the prices provided are considered to be stale, the Company performs its own assessment of the fair value of these instruments. This assessment is largely based on inputs that are not based on observable market data, principally single broker indicative quotes, and accordingly these instruments are treated as level 3 instruments within the fair value hierarchy.
• Other corporate bonds including unquoted bonds, commercial paper and certificates of deposit These instruments are valued using models. For unquoted bonds, the model uses inputs from comparable bonds and includes credit spreads which are obtained from brokers or estimated internally. Commercial paper and certificates of deposit are valued using standard valuation formulas. The classification of these instruments within the fair value hierarchy will be either level 2 or 3 depending upon the nature of the underlying pricing information used for valuation purposes.
(c)(i) Fair value hierarchy for financial instruments measured at fair value in the statement of financial position The following table sets out an analysis of financial assets and liabilities measured at fair value by level of the fair value hierarchy.
Fair value hierarchy Level 1 Level 2 Level 3 Total
2014
2013 restated1 2014
2013 restated1 2014 2013 2014
2013 restated1
Assets £m £m £m £m £m £m £m £m
Investment in subsidiaries at FVTPL - - 131 142 - - 131 142 Investment in associates at FVTPL 13 12 - - - - 13 12 Derivative financial assets - - 24 54 - - 24 54 Debt securities 78 71 413 652 1 1 492 724 Total 91 83 568 848 1 1 660 932 Liabilities
Derivative financial liabilities - - 25 53 - - 25 53 Total - - 25 53 - - 25 53 1 Comparatives for the year ended 31 December 2013 have been restated to reflect retrospective application of changes to accounting policies as a result of new
IFRSs adopted during the year. Refer to Company accounting policies – (a) Basis of preparation.
There were no significant transfers between level 1 and level 2 in the year.
Standard Life 283
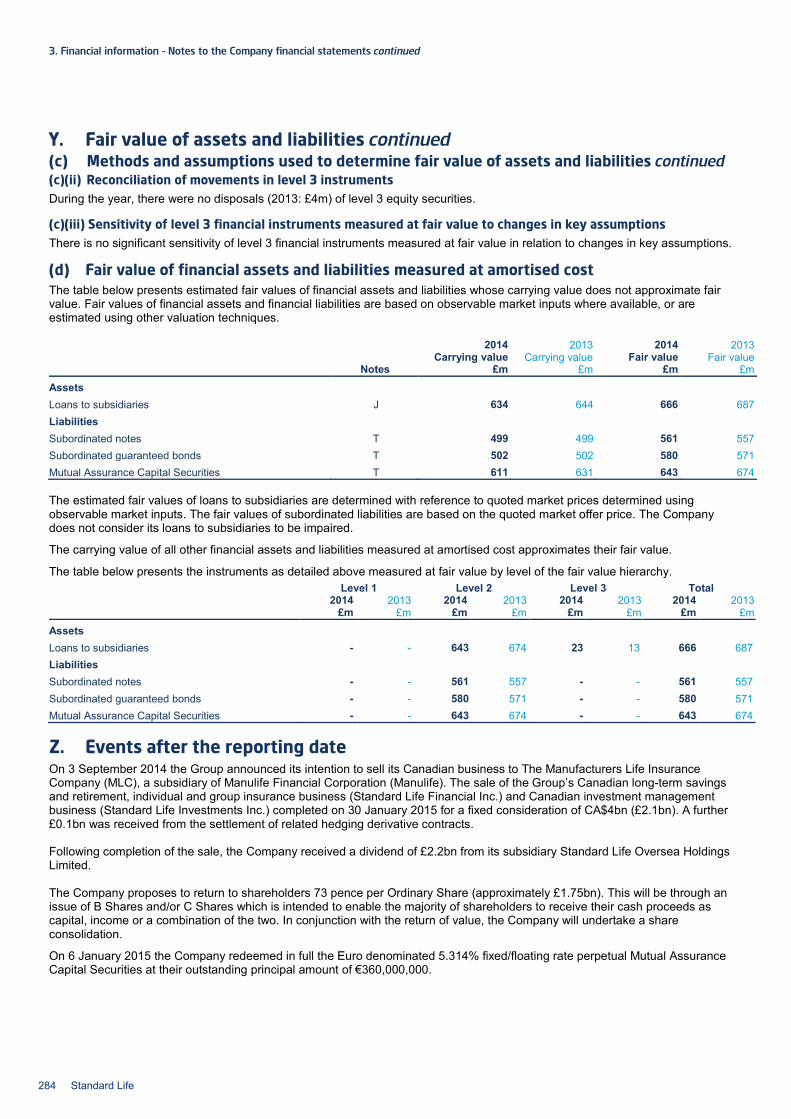
3. Financial information – Notes to the Company financial statements continued
Y. Fair value of assets and liabilities continued (c) Methods and assumptions used to determine fair value of assets and liabilities continued (c)(ii) Reconciliation of movements in level 3 instruments During the year, there were no disposals (2013: £4m) of level 3 equity securities.
(c)(iii) Sensitivity of level 3 financial instruments measured at fair value to changes in key assumptions There is no significant sensitivity of level 3 financial instruments measured at fair value in relation to changes in key assumptions.
(d) Fair value of financial assets and liabilities measured at amortised cost The table below presents estimated fair values of financial assets and liabilities whose carrying value does not approximate fair value. Fair values of financial assets and financial liabilities are based on observable market inputs where available, or are estimated using other valuation techniques.
2014 2013 2014 2013 Carrying value Carrying value Fair value Fair value Notes £m £m £m £m
Assets
Loans to subsidiaries J 634 644 666 687 Liabilities Subordinated notes T 499 499 561 557 Subordinated guaranteed bonds T 502 502 580 571 Mutual Assurance Capital Securities T 611 631 643 674
The estimated fair values of loans to subsidiaries are determined with reference to quoted market prices determined using observable market inputs. The fair values of subordinated liabilities are based on the quoted market offer price. The Company does not consider its loans to subsidiaries to be impaired.
The carrying value of all other financial assets and liabilities measured at amortised cost approximates their fair value.
The table below presents the instruments as detailed above measured at fair value by level of the fair value hierarchy. Level 1 Level 2 Level 3 Total 2014 2013 2014 2013 2014 2013 2014 2013 £m £m £m £m £m £m £m £m
Assets Loans to subsidiaries - - 643 674 23 13 666 687 Liabilities Subordinated notes - - 561 557 - - 561 557 Subordinated guaranteed bonds - - 580 571 - - 580 571 Mutual Assurance Capital Securities - - 643 674 - - 643 674
Z. Events after the reporting date On 3 September 2014 the Group announced its intention to sell its Canadian business to The Manufacturers Life Insurance Company (MLC), a subsidiary of Manulife Financial Corporation (Manulife). The sale of the Group’s Canadian long-term savings and retirement, individual and group insurance business (Standard Life Financial Inc.) and Canadian investment management business (Standard Life Investments Inc.) completed on 30 January 2015 for a fixed consideration of CA$4bn (£2.1bn). A further £0.1bn was received from the settlement of related hedging derivative contracts. Following completion of the sale, the Company received a dividend of £2.2bn from its subsidiary Standard Life Oversea Holdings Limited. The Company proposes to return to shareholders 73 pence per Ordinary Share (approximately £1.75bn). This will be through an issue of B Shares and/or C Shares which is intended to enable the majority of shareholders to receive their cash proceeds as capital, income or a combination of the two. In conjunction with the return of value, the Company will undertake a share consolidation.
On 6 January 2015 the Company redeemed in full the Euro denominated 5.314% fixed/floating rate perpetual Mutual Assurance Capital Securities at their outstanding principal amount of €360,000,000.
284 Standard Life
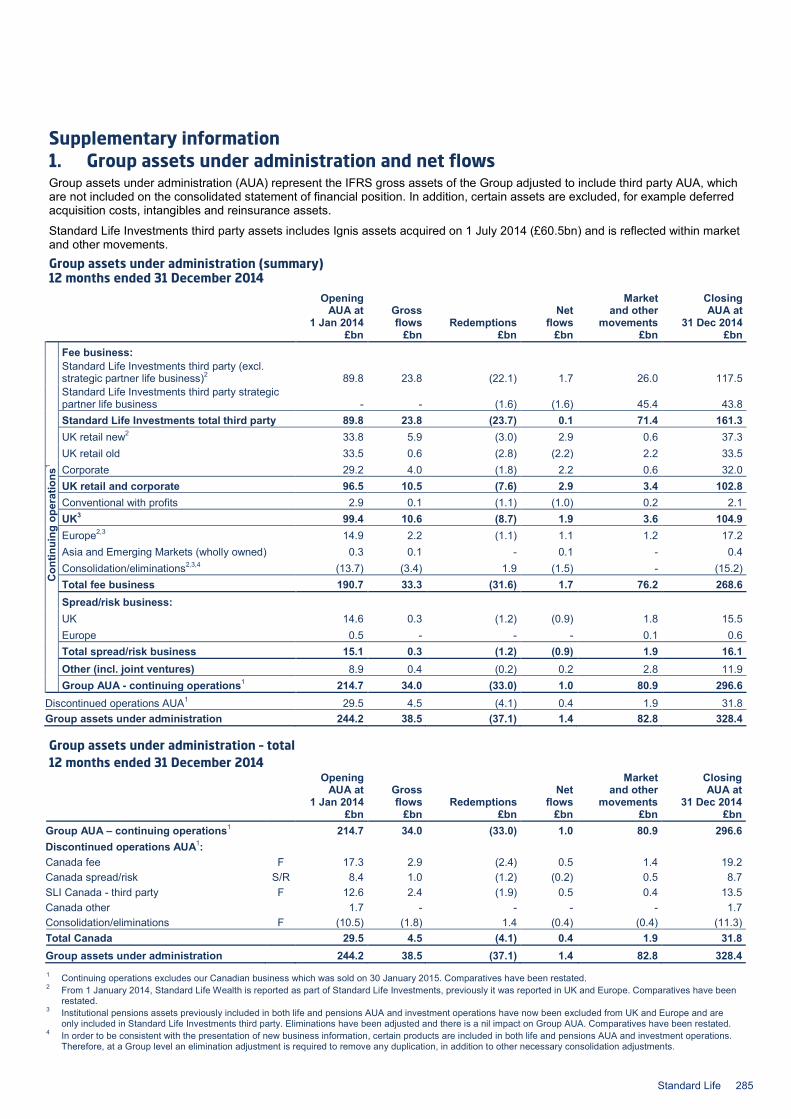
Supplementary information 1. Group assets under administration and net flows Group assets under administration (AUA) represent the IFRS gross assets of the Group adjusted to include third party AUA, which are not included on the consolidated statement of financial position. In addition, certain assets are excluded, for example deferred acquisition costs, intangibles and reinsurance assets.
Standard Life Investments third party assets includes Ignis assets acquired on 1 July 2014 (£60.5bn) and is reflected within market and other movements. Group assets under administration (summary) 12 months ended 31 December 2014
Opening AUA at
1 Jan 2014 Gross flows Redemptions
Net flows
Market and other
movements
Closing AUA at
31 Dec 2014 £bn £bn £bn £bn £bn £bn
Con
tinui
ng o
pera
tions
1
Fee business: Standard Life Investments third party (excl. strategic partner life business)2 89.8 23.8 (22.1) 1.7 26.0 117.5 Standard Life Investments third party strategic partner life business - - (1.6) (1.6) 45.4 43.8 Standard Life Investments total third party 89.8 23.8 (23.7) 0.1 71.4 161.3 UK retail new2 33.8 5.9 (3.0) 2.9 0.6 37.3 UK retail old 33.5 0.6 (2.8) (2.2) 2.2 33.5 Corporate 29.2 4.0 (1.8) 2.2 0.6 32.0 UK retail and corporate 96.5 10.5 (7.6) 2.9 3.4 102.8 Conventional with profits 2.9 0.1 (1.1) (1.0) 0.2 2.1 UK3 99.4 10.6 (8.7) 1.9 3.6 104.9 Europe2,3 14.9 2.2 (1.1) 1.1 1.2 17.2 Asia and Emerging Markets (wholly owned) 0.3 0.1 - 0.1 - 0.4 Consolidation/eliminations2,3,4 (13.7) (3.4) 1.9 (1.5) - (15.2) Total fee business 190.7 33.3 (31.6) 1.7 76.2 268.6 Spread/risk business: UK 14.6 0.3 (1.2) (0.9) 1.8 15.5 Europe 0.5 - - - 0.1 0.6 Total spread/risk business 15.1 0.3 (1.2) (0.9) 1.9 16.1 Other (incl. joint ventures) 8.9 0.4 (0.2) 0.2 2.8 11.9 Group AUA - continuing operations1 214.7 34.0 (33.0) 1.0 80.9 296.6
Discontinued operations AUA1 29.5 4.5 (4.1) 0.4 1.9 31.8 Group assets under administration 244.2 38.5 (37.1) 1.4 82.8 328.4
Group assets under administration – total 12 months ended 31 December 2014
Opening AUA at
1 Jan 2014 Gross flows Redemptions
Net flows
Market and other
movements
Closing AUA at
31 Dec 2014 £bn £bn £bn £bn £bn £bn Group AUA – continuing operations1 214.7 34.0 (33.0) 1.0 80.9 296.6 Discontinued operations AUA1: Canada fee F 17.3 2.9 (2.4) 0.5 1.4 19.2 Canada spread/risk S/R 8.4 1.0 (1.2) (0.2) 0.5 8.7 SLI Canada - third party F 12.6 2.4 (1.9) 0.5 0.4 13.5 Canada other 1.7 - - - - 1.7 Consolidation/eliminations F (10.5) (1.8) 1.4 (0.4) (0.4) (11.3) Total Canada 29.5 4.5 (4.1) 0.4 1.9 31.8 Group assets under administration 244.2 38.5 (37.1) 1.4 82.8 328.4 1 Continuing operations excludes our Canadian business which was sold on 30 January 2015. Comparatives have been restated. 2 From 1 January 2014, Standard Life Wealth is reported as part of Standard Life Investments, previously it was reported in UK and Europe. Comparatives have been
restated. 3 Institutional pensions assets previously included in both life and pensions AUA and investment operations have now been excluded from UK and Europe and are
only included in Standard Life Investments third party. Eliminations have been adjusted and there is a nil impact on Group AUA. Comparatives have been restated. 4 In order to be consistent with the presentation of new business information, certain products are included in both life and pensions AUA and investment operations.
Therefore, at a Group level an elimination adjustment is required to remove any duplication, in addition to other necessary consolidation adjustments.
Standard Life 285
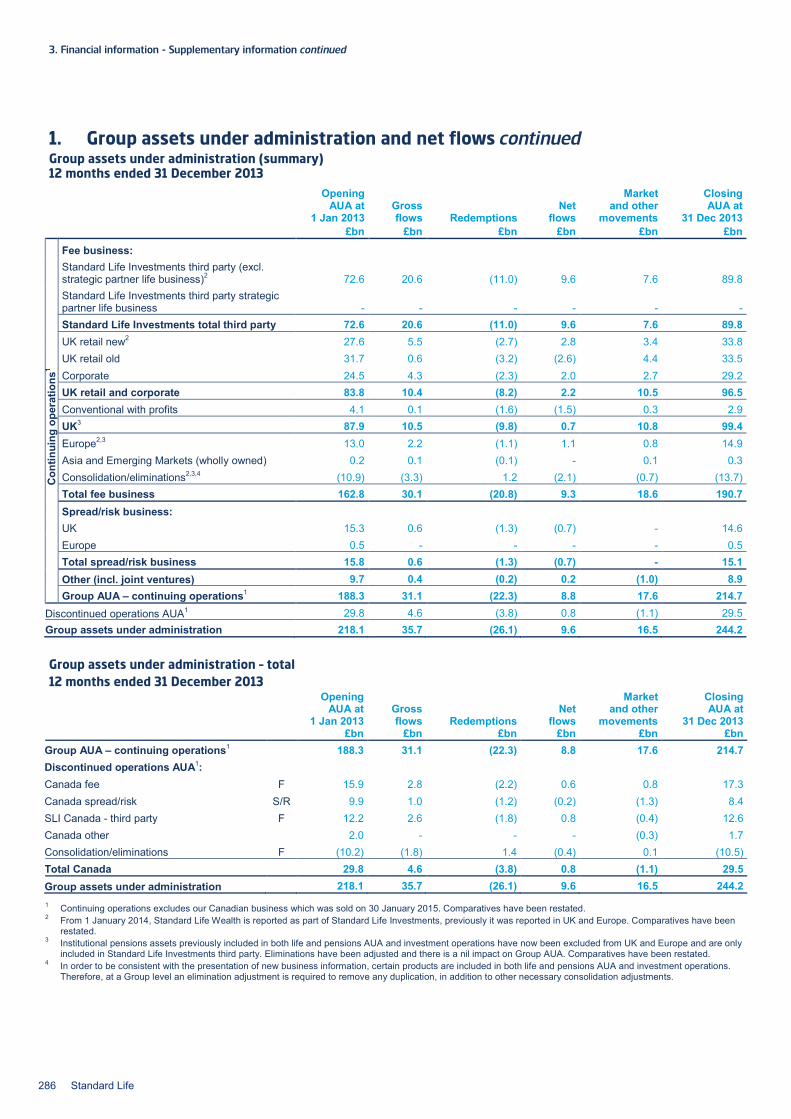
3. Financial information - Supplementary information continued
1. Group assets under administration and net flows continued Group assets under administration (summary) 12 months ended 31 December 2013
Opening AUA at
1 Jan 2013 Gross flows Redemptions
Net flows
Market and other
movements
Closing AUA at
31 Dec 2013 £bn £bn £bn £bn £bn £bn
Con
tinui
ng o
pera
tions
1
Fee business: Standard Life Investments third party (excl. strategic partner life business)2 72.6 20.6 (11.0) 9.6 7.6 89.8 Standard Life Investments third party strategic partner life business - - - - - - Standard Life Investments total third party 72.6 20.6 (11.0) 9.6 7.6 89.8 UK retail new2 27.6 5.5 (2.7) 2.8 3.4 33.8 UK retail old 31.7 0.6 (3.2) (2.6) 4.4 33.5 Corporate 24.5 4.3 (2.3) 2.0 2.7 29.2 UK retail and corporate 83.8 10.4 (8.2) 2.2 10.5 96.5 Conventional with profits 4.1 0.1 (1.6) (1.5) 0.3 2.9 UK3 87.9 10.5 (9.8) 0.7 10.8 99.4 Europe2,3 13.0 2.2 (1.1) 1.1 0.8 14.9 Asia and Emerging Markets (wholly owned) 0.2 0.1 (0.1) - 0.1 0.3 Consolidation/eliminations2,3,4 (10.9) (3.3) 1.2 (2.1) (0.7) (13.7) Total fee business 162.8 30.1 (20.8) 9.3 18.6 190.7 Spread/risk business: UK 15.3 0.6 (1.3) (0.7) - 14.6 Europe 0.5 - - - - 0.5 Total spread/risk business 15.8 0.6 (1.3) (0.7) - 15.1 Other (incl. joint ventures) 9.7 0.4 (0.2) 0.2 (1.0) 8.9 Group AUA – continuing operations1 188.3 31.1 (22.3) 8.8 17.6 214.7
Discontinued operations AUA1 29.8 4.6 (3.8) 0.8 (1.1) 29.5 Group assets under administration 218.1 35.7 (26.1) 9.6 16.5 244.2 Group assets under administration – total 12 months ended 31 December 2013
Opening AUA at
1 Jan 2013 Gross flows Redemptions
Net flows
Market and other
movements
Closing AUA at
31 Dec 2013 £bn £bn £bn £bn £bn £bn Group AUA – continuing operations1 188.3 31.1 (22.3) 8.8 17.6 214.7 Discontinued operations AUA1: Canada fee F 15.9 2.8 (2.2) 0.6 0.8 17.3 Canada spread/risk S/R 9.9 1.0 (1.2) (0.2) (1.3) 8.4 SLI Canada - third party F 12.2 2.6 (1.8) 0.8 (0.4) 12.6 Canada other 2.0 - - - (0.3) 1.7 Consolidation/eliminations F (10.2) (1.8) 1.4 (0.4) 0.1 (10.5) Total Canada 29.8 4.6 (3.8) 0.8 (1.1) 29.5 Group assets under administration 218.1 35.7 (26.1) 9.6 16.5 244.2 1 Continuing operations excludes our Canadian business which was sold on 30 January 2015. Comparatives have been restated. 2 From 1 January 2014, Standard Life Wealth is reported as part of Standard Life Investments, previously it was reported in UK and Europe. Comparatives have been
restated. 3 Institutional pensions assets previously included in both life and pensions AUA and investment operations have now been excluded from UK and Europe and are only
included in Standard Life Investments third party. Eliminations have been adjusted and there is a nil impact on Group AUA. Comparatives have been restated. 4 In order to be consistent with the presentation of new business information, certain products are included in both life and pensions AUA and investment operations.
Therefore, at a Group level an elimination adjustment is required to remove any duplication, in addition to other necessary consolidation adjustments.
286 Standard Life
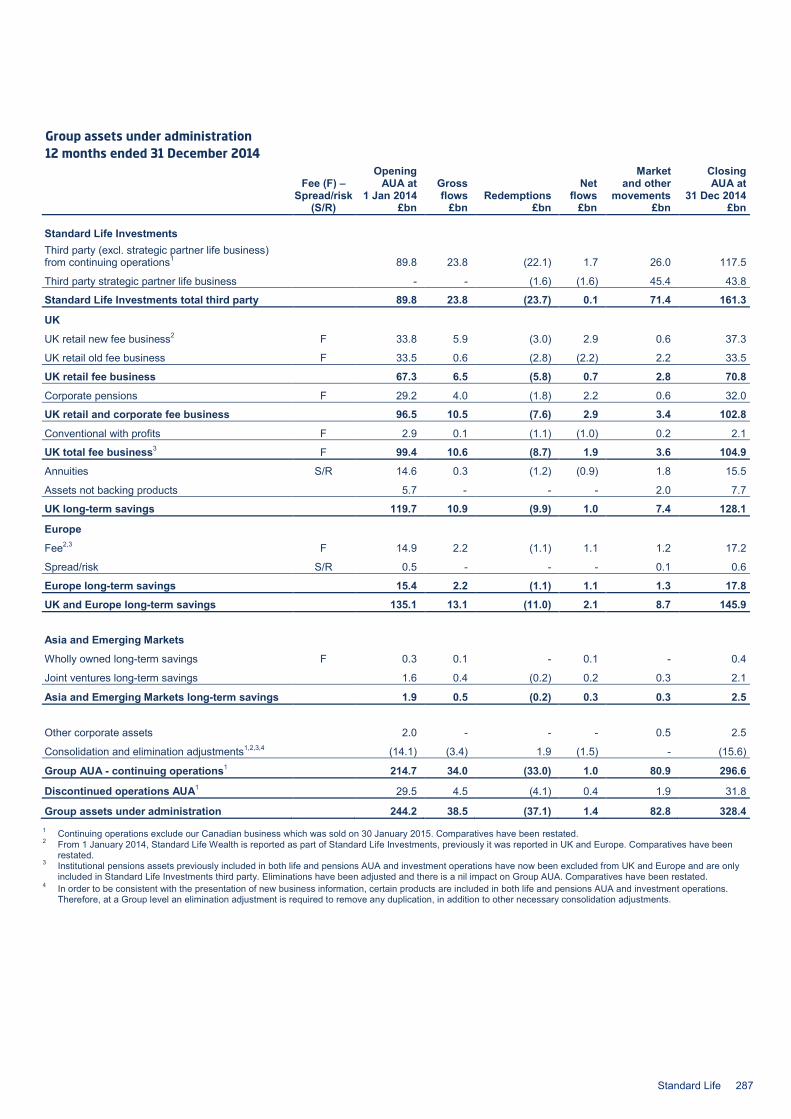
Group assets under administration 12 months ended 31 December 2014
Fee (F) – Spread/risk
(S/R)
Opening AUA at
1 Jan 2014 Gross flows Redemptions
Net flows
Market and other
movements
Closing AUA at
31 Dec 2014 £bn £bn £bn £bn £bn £bn
Standard Life Investments Third party (excl. strategic partner life business) from continuing operations1 89.8 23.8 (22.1) 1.7 26.0 117.5
Third party strategic partner life business - - (1.6) (1.6) 45.4 43.8
Standard Life Investments total third party 89.8 23.8 (23.7) 0.1 71.4 161.3
UK
UK retail new fee business2 F 33.8 5.9 (3.0) 2.9 0.6 37.3
UK retail old fee business F 33.5 0.6 (2.8) (2.2) 2.2 33.5
UK retail fee business 67.3 6.5 (5.8) 0.7 2.8 70.8
Corporate pensions F 29.2 4.0 (1.8) 2.2 0.6 32.0
UK retail and corporate fee business 96.5 10.5 (7.6) 2.9 3.4 102.8
Conventional with profits F 2.9 0.1 (1.1) (1.0) 0.2 2.1
UK total fee business3 F 99.4 10.6 (8.7) 1.9 3.6 104.9
Annuities S/R 14.6 0.3 (1.2) (0.9) 1.8 15.5
Assets not backing products 5.7 - - - 2.0 7.7
UK long-term savings 119.7 10.9 (9.9) 1.0 7.4 128.1
Europe
Fee2,3 F 14.9 2.2 (1.1) 1.1 1.2 17.2
Spread/risk S/R 0.5 - - - 0.1 0.6
Europe long-term savings 15.4 2.2 (1.1) 1.1 1.3 17.8
UK and Europe long-term savings 135.1 13.1 (11.0) 2.1 8.7 145.9
Asia and Emerging Markets
Wholly owned long-term savings F 0.3 0.1 - 0.1 - 0.4
Joint ventures long-term savings 1.6 0.4 (0.2) 0.2 0.3 2.1
Asia and Emerging Markets long-term savings 1.9 0.5 (0.2) 0.3 0.3 2.5
Other corporate assets 2.0 - - - 0.5 2.5
Consolidation and elimination adjustments1,2,3,4 (14.1) (3.4) 1.9 (1.5) - (15.6)
Group AUA - continuing operations1 214.7 34.0 (33.0) 1.0 80.9 296.6
Discontinued operations AUA1 29.5 4.5 (4.1) 0.4 1.9 31.8
Group assets under administration 244.2 38.5 (37.1) 1.4 82.8 328.4 1 Continuing operations exclude our Canadian business which was sold on 30 January 2015. Comparatives have been restated. 2 From 1 January 2014, Standard Life Wealth is reported as part of Standard Life Investments, previously it was reported in UK and Europe. Comparatives have been
restated. 3 Institutional pensions assets previously included in both life and pensions AUA and investment operations have now been excluded from UK and Europe and are only
included in Standard Life Investments third party. Eliminations have been adjusted and there is a nil impact on Group AUA. Comparatives have been restated. 4 In order to be consistent with the presentation of new business information, certain products are included in both life and pensions AUA and investment operations.
Therefore, at a Group level an elimination adjustment is required to remove any duplication, in addition to other necessary consolidation adjustments.
Standard Life 287
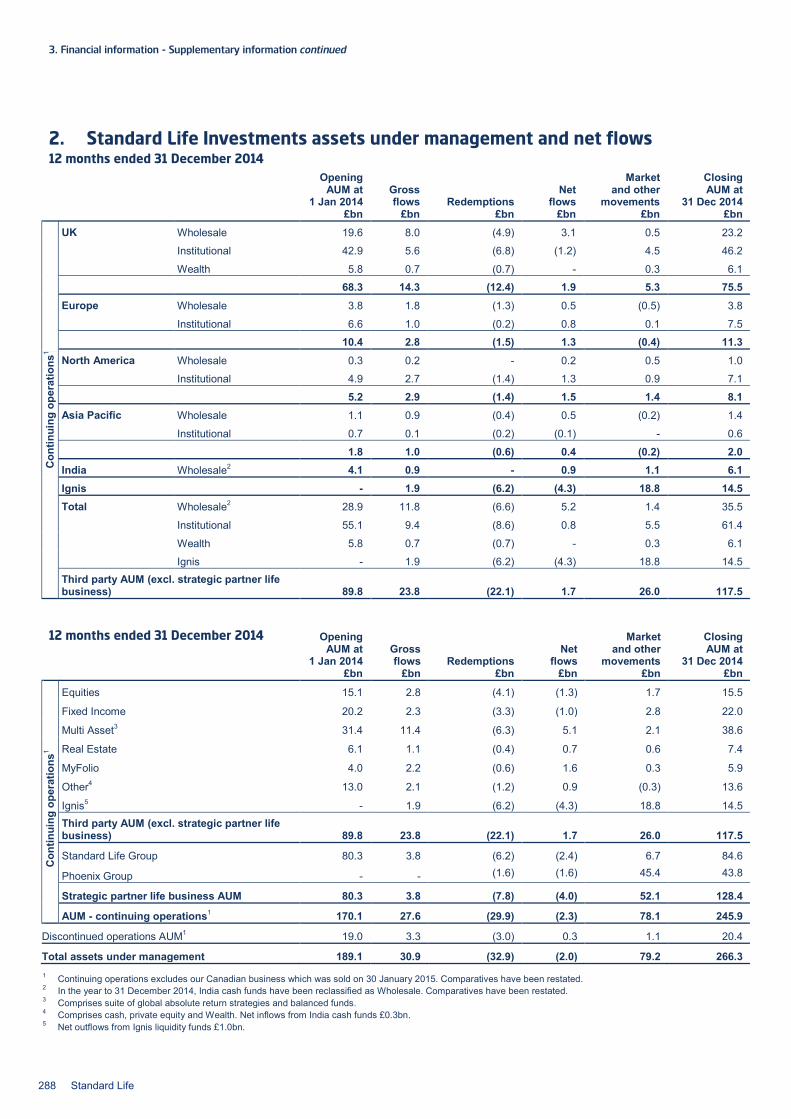
3. Financial information - Supplementary information continued
2. Standard Life Investments assets under management and net flows 12 months ended 31 December 2014
Opening AUM at
1 Jan 2014 Gross flows Redemptions
Net flows
Market and other
movements
Closing AUM at
31 Dec 2014 £bn £bn £bn £bn £bn £bn
Con
tinui
ng o
pera
tions
1
UK Wholesale 19.6 8.0 (4.9) 3.1 0.5 23.2
Institutional 42.9 5.6 (6.8) (1.2) 4.5 46.2
Wealth 5.8 0.7 (0.7) - 0.3 6.1
68.3 14.3 (12.4) 1.9 5.3 75.5 Europe Wholesale 3.8 1.8 (1.3) 0.5 (0.5) 3.8
Institutional 6.6 1.0 (0.2) 0.8 0.1 7.5
10.4 2.8 (1.5) 1.3 (0.4) 11.3 North America Wholesale 0.3 0.2 - 0.2 0.5 1.0
Institutional 4.9 2.7 (1.4) 1.3 0.9 7.1
5.2 2.9 (1.4) 1.5 1.4 8.1 Asia Pacific Wholesale 1.1 0.9 (0.4) 0.5 (0.2) 1.4
Institutional 0.7 0.1 (0.2) (0.1) - 0.6
1.8 1.0 (0.6) 0.4 (0.2) 2.0 India Wholesale2 4.1 0.9 - 0.9 1.1 6.1 Ignis - 1.9 (6.2) (4.3) 18.8 14.5 Total Wholesale2 28.9 11.8 (6.6) 5.2 1.4 35.5
Institutional 55.1 9.4 (8.6) 0.8 5.5 61.4
Wealth 5.8 0.7 (0.7) - 0.3 6.1
Ignis - 1.9 (6.2) (4.3) 18.8 14.5 Third party AUM (excl. strategic partner life business) 89.8 23.8 (22.1) 1.7 26.0 117.5
12 months ended 31 December 2014
Opening
AUM at 1 Jan 2014
Gross flows Redemptions
Net flows
Market and other
movements
Closing AUM at
31 Dec 2014 £bn £bn £bn £bn £bn £bn
Con
tinui
ng o
pera
tions
1
Equities 15.1 2.8 (4.1) (1.3) 1.7 15.5
Fixed Income 20.2 2.3 (3.3) (1.0) 2.8 22.0
Multi Asset3 31.4 11.4 (6.3) 5.1 2.1 38.6
Real Estate 6.1 1.1 (0.4) 0.7 0.6 7.4
MyFolio 4.0 2.2 (0.6) 1.6 0.3 5.9
Other4 13.0 2.1 (1.2) 0.9 (0.3) 13.6
Ignis5 - 1.9 (6.2) (4.3) 18.8 14.5 Third party AUM (excl. strategic partner life business) 89.8 23.8 (22.1) 1.7 26.0 117.5
Standard Life Group 80.3 3.8 (6.2) (2.4) 6.7 84.6
Phoenix Group - - (1.6) (1.6) 45.4 43.8
Strategic partner life business AUM 80.3 3.8 (7.8) (4.0) 52.1 128.4
AUM - continuing operations1 170.1 27.6 (29.9) (2.3) 78.1 245.9
Discontinued operations AUM1 19.0 3.3 (3.0) 0.3 1.1 20.4
Total assets under management 189.1 30.9 (32.9) (2.0) 79.2 266.3 1 Continuing operations excludes our Canadian business which was sold on 30 January 2015. Comparatives have been restated. 2 In the year to 31 December 2014, India cash funds have been reclassified as Wholesale. Comparatives have been restated. 3 Comprises suite of global absolute return strategies and balanced funds. 4 Comprises cash, private equity and Wealth. Net inflows from India cash funds £0.3bn. 5 Net outflows from Ignis liquidity funds £1.0bn.
288 Standard Life
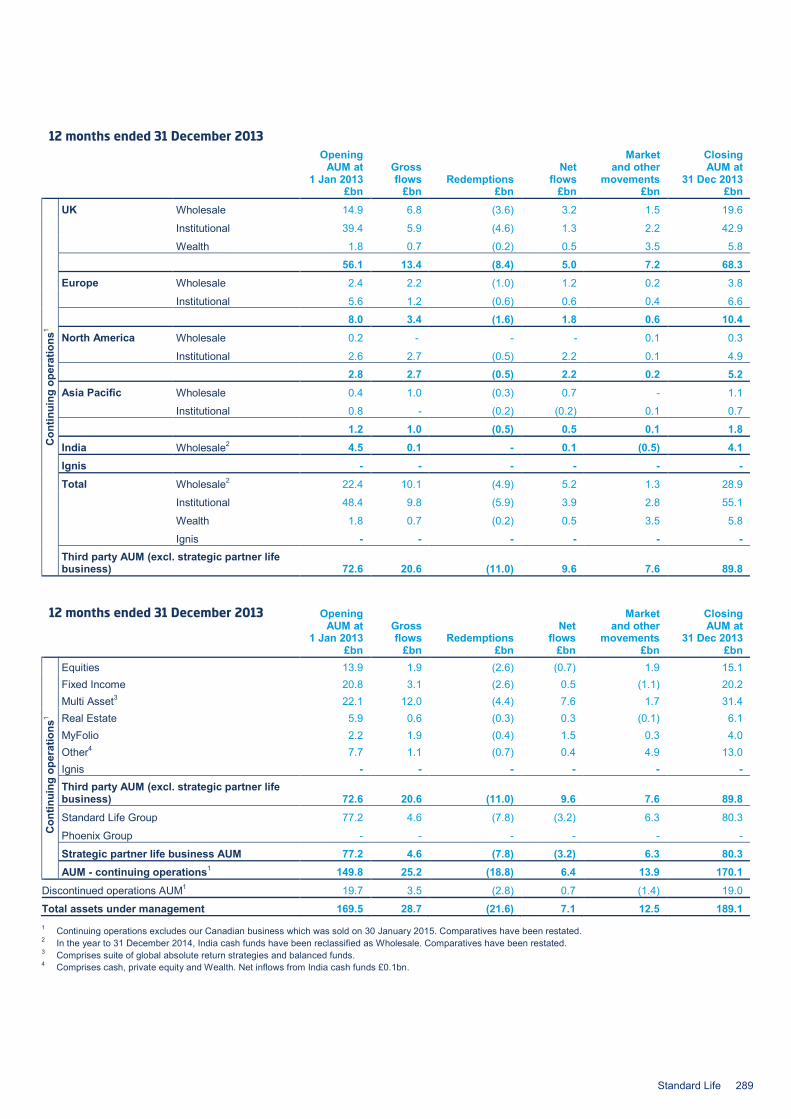
12 months ended 31 December 2013
Opening AUM at
1 Jan 2013 Gross flows Redemptions
Net flows
Market and other
movements
Closing AUM at
31 Dec 2013 £bn £bn £bn £bn £bn £bn
Con
tinui
ng o
pera
tions
1
UK Wholesale 14.9 6.8 (3.6) 3.2 1.5 19.6
Institutional 39.4 5.9 (4.6) 1.3 2.2 42.9
Wealth 1.8 0.7 (0.2) 0.5 3.5 5.8
56.1 13.4 (8.4) 5.0 7.2 68.3 Europe Wholesale 2.4 2.2 (1.0) 1.2 0.2 3.8
Institutional 5.6 1.2 (0.6) 0.6 0.4 6.6
8.0 3.4 (1.6) 1.8 0.6 10.4 North America Wholesale 0.2 - - - 0.1 0.3
Institutional 2.6 2.7 (0.5) 2.2 0.1 4.9
2.8 2.7 (0.5) 2.2 0.2 5.2 Asia Pacific Wholesale 0.4 1.0 (0.3) 0.7 - 1.1
Institutional 0.8 - (0.2) (0.2) 0.1 0.7
1.2 1.0 (0.5) 0.5 0.1 1.8 India Wholesale2 4.5 0.1 - 0.1 (0.5) 4.1 Ignis - - - - - - Total Wholesale2 22.4 10.1 (4.9) 5.2 1.3 28.9
Institutional 48.4 9.8 (5.9) 3.9 2.8 55.1
Wealth 1.8 0.7 (0.2) 0.5 3.5 5.8
Ignis - - - - - - Third party AUM (excl. strategic partner life business) 72.6 20.6 (11.0) 9.6 7.6 89.8
12 months ended 31 December 2013
Opening
AUM at 1 Jan 2013
Gross flows Redemptions
Net flows
Market and other
movements
Closing AUM at
31 Dec 2013 £bn £bn £bn £bn £bn £bn
Con
tinui
ng o
pera
tions
1
Equities 13.9 1.9 (2.6) (0.7) 1.9 15.1 Fixed Income 20.8 3.1 (2.6) 0.5 (1.1) 20.2 Multi Asset3 22.1 12.0 (4.4) 7.6 1.7 31.4 Real Estate 5.9 0.6 (0.3) 0.3 (0.1) 6.1 MyFolio 2.2 1.9 (0.4) 1.5 0.3 4.0 Other4 7.7 1.1 (0.7) 0.4 4.9 13.0 Ignis - - - - - - Third party AUM (excl. strategic partner life business) 72.6 20.6 (11.0) 9.6 7.6 89.8 Standard Life Group 77.2 4.6 (7.8) (3.2) 6.3 80.3
Phoenix Group - - - - - -
Strategic partner life business AUM 77.2 4.6 (7.8) (3.2) 6.3 80.3 AUM - continuing operations1 149.8 25.2 (18.8) 6.4 13.9 170.1
Discontinued operations AUM1 19.7 3.5 (2.8) 0.7 (1.4) 19.0
Total assets under management 169.5 28.7 (21.6) 7.1 12.5 189.1 1 Continuing operations excludes our Canadian business which was sold on 30 January 2015. Comparatives have been restated. 2 In the year to 31 December 2014, India cash funds have been reclassified as Wholesale. Comparatives have been restated. 3 Comprises suite of global absolute return strategies and balanced funds. 4 Comprises cash, private equity and Wealth. Net inflows from India cash funds £0.1bn.
Standard Life 289
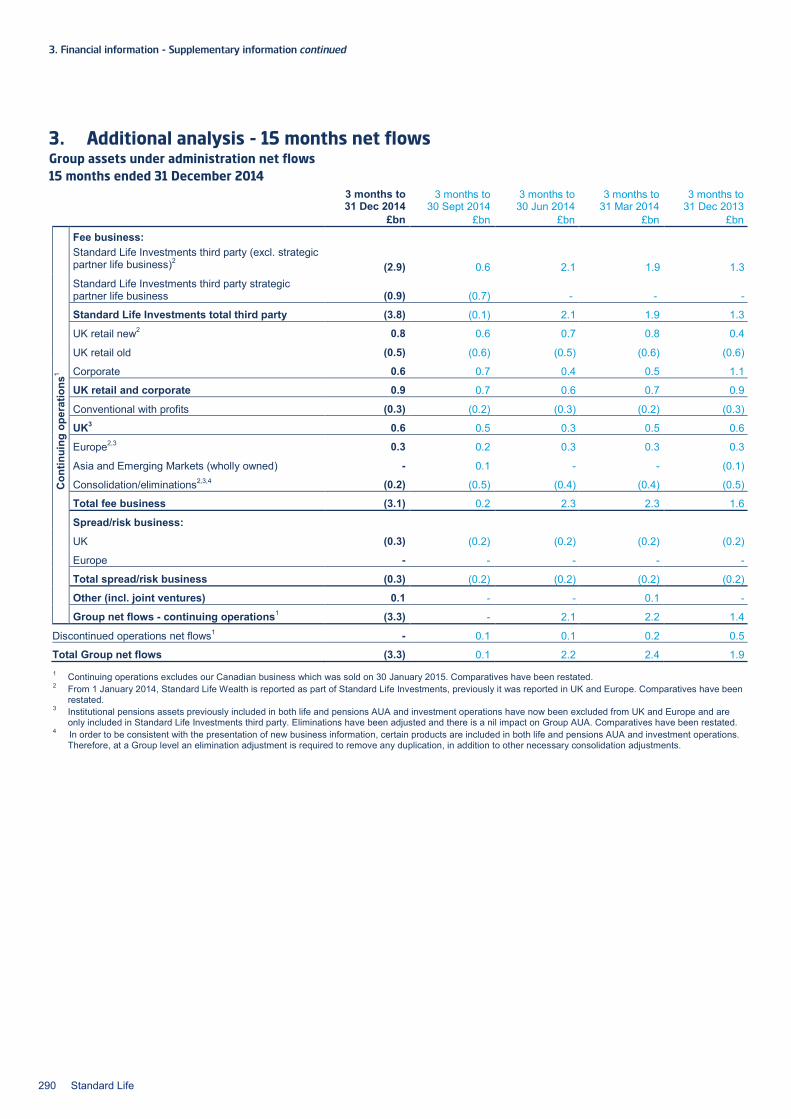
3. Financial information - Supplementary information continued
3. Additional analysis - 15 months net flows Group assets under administration net flows 15 months ended 31 December 2014 3 months to
31 Dec 2014 3 months to
30 Sept 2014 3 months to 30 Jun 2014
3 months to 31 Mar 2014
3 months to 31 Dec 2013
£bn £bn £bn £bn £bn
Con
tinui
ng o
pera
tions
1
Fee business:
Standard Life Investments third party (excl. strategic partner life business)2 (2.9) 0.6 2.1 1.9 1.3 Standard Life Investments third party strategic partner life business (0.9) (0.7) - - -
Standard Life Investments total third party (3.8) (0.1) 2.1 1.9 1.3
UK retail new2 0.8 0.6 0.7 0.8 0.4
UK retail old (0.5) (0.6) (0.5) (0.6) (0.6)
Corporate 0.6 0.7 0.4 0.5 1.1
UK retail and corporate 0.9 0.7 0.6 0.7 0.9
Conventional with profits (0.3) (0.2) (0.3) (0.2) (0.3)
UK3 0.6 0.5 0.3 0.5 0.6
Europe2,3 0.3 0.2 0.3 0.3 0.3
Asia and Emerging Markets (wholly owned) - 0.1 - - (0.1)
Consolidation/eliminations2,3,4 (0.2) (0.5) (0.4) (0.4) (0.5)
Total fee business (3.1) 0.2 2.3 2.3 1.6
Spread/risk business:
UK (0.3) (0.2) (0.2) (0.2) (0.2)
Europe - - - - -
Total spread/risk business (0.3) (0.2) (0.2) (0.2) (0.2)
Other (incl. joint ventures) 0.1 - - 0.1 -
Group net flows - continuing operations1 (3.3) - 2.1 2.2 1.4
Discontinued operations net flows1 - 0.1 0.1 0.2 0.5
Total Group net flows (3.3) 0.1 2.2 2.4 1.9 1 Continuing operations excludes our Canadian business which was sold on 30 January 2015. Comparatives have been restated. 2 From 1 January 2014, Standard Life Wealth is reported as part of Standard Life Investments, previously it was reported in UK and Europe. Comparatives have been
restated. 3 Institutional pensions assets previously included in both life and pensions AUA and investment operations have now been excluded from UK and Europe and are
only included in Standard Life Investments third party. Eliminations have been adjusted and there is a nil impact on Group AUA. Comparatives have been restated. 4 In order to be consistent with the presentation of new business information, certain products are included in both life and pensions AUA and investment operations.
Therefore, at a Group level an elimination adjustment is required to remove any duplication, in addition to other necessary consolidation adjustments.
290 Standard Life
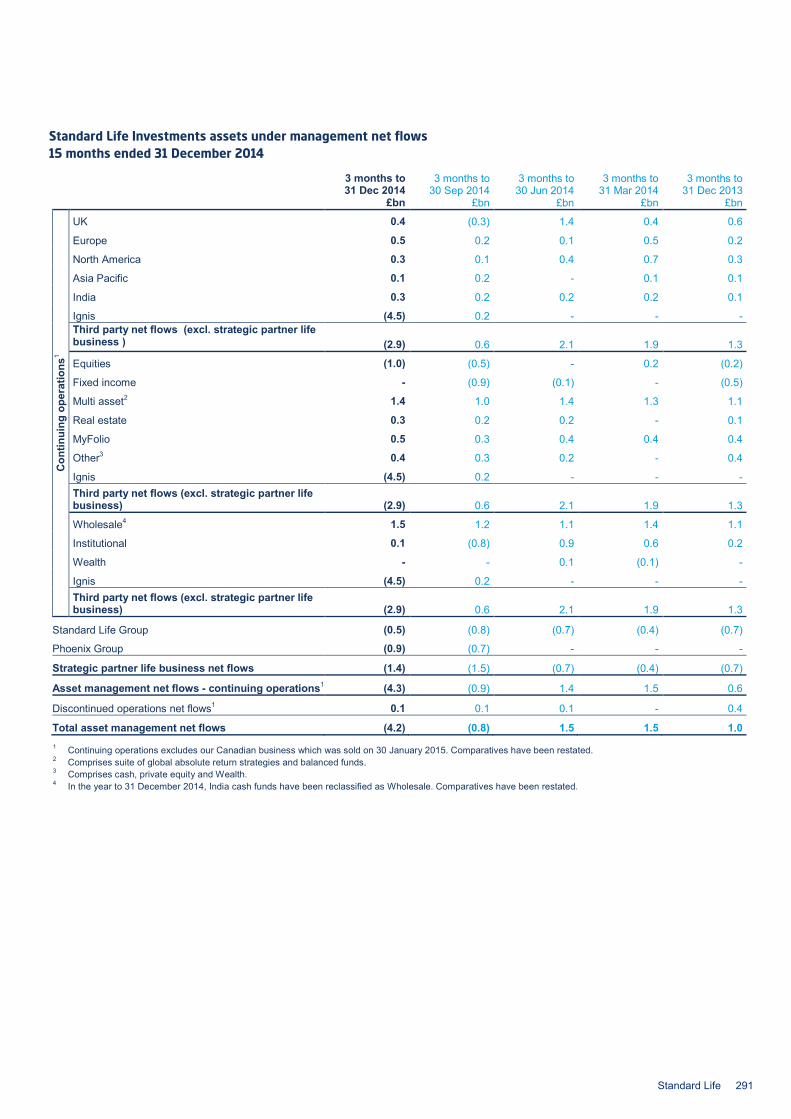
Standard Life Investments assets under management net flows 15 months ended 31 December 2014
3 months to 31 Dec 2014
3 months to 30 Sep 2014
3 months to 30 Jun 2014
3 months to 31 Mar 2014
3 months to 31 Dec 2013
£bn £bn £bn £bn £bn
Con
tinui
ng o
pera
tions
1
UK 0.4 (0.3) 1.4 0.4 0.6
Europe 0.5 0.2 0.1 0.5 0.2
North America 0.3 0.1 0.4 0.7 0.3
Asia Pacific 0.1 0.2 - 0.1 0.1
India 0.3 0.2 0.2 0.2 0.1
Ignis (4.5) 0.2 - - - Third party net flows (excl. strategic partner life business )
(2.9) 0.6 2.1 1.9 1.3
Equities (1.0) (0.5) - 0.2 (0.2)
Fixed income - (0.9) (0.1) - (0.5)
Multi asset2 1.4 1.0 1.4 1.3 1.1
Real estate 0.3 0.2 0.2 - 0.1
MyFolio 0.5 0.3 0.4 0.4 0.4
Other3 0.4 0.3 0.2 - 0.4
Ignis (4.5) 0.2 - - - Third party net flows (excl. strategic partner life business) (2.9) 0.6 2.1 1.9 1.3
Wholesale4 1.5 1.2 1.1 1.4 1.1
Institutional 0.1 (0.8) 0.9 0.6 0.2
Wealth - - 0.1 (0.1) -
Ignis (4.5) 0.2 - - - Third party net flows (excl. strategic partner life business) (2.9) 0.6 2.1 1.9 1.3
Standard Life Group (0.5) (0.8) (0.7) (0.4) (0.7)
Phoenix Group (0.9) (0.7) - - -
Strategic partner life business net flows (1.4) (1.5) (0.7) (0.4) (0.7)
Asset management net flows - continuing operations1 (4.3) (0.9) 1.4 1.5 0.6
Discontinued operations net flows1 0.1 0.1 0.1 - 0.4
Total asset management net flows (4.2) (0.8) 1.5 1.5 1.0 1 Continuing operations excludes our Canadian business which was sold on 30 January 2015. Comparatives have been restated. 2 Comprises suite of global absolute return strategies and balanced funds. 3 Comprises cash, private equity and Wealth. 4 In the year to 31 December 2014, India cash funds have been reclassified as Wholesale. Comparatives have been restated.
Standard Life 291
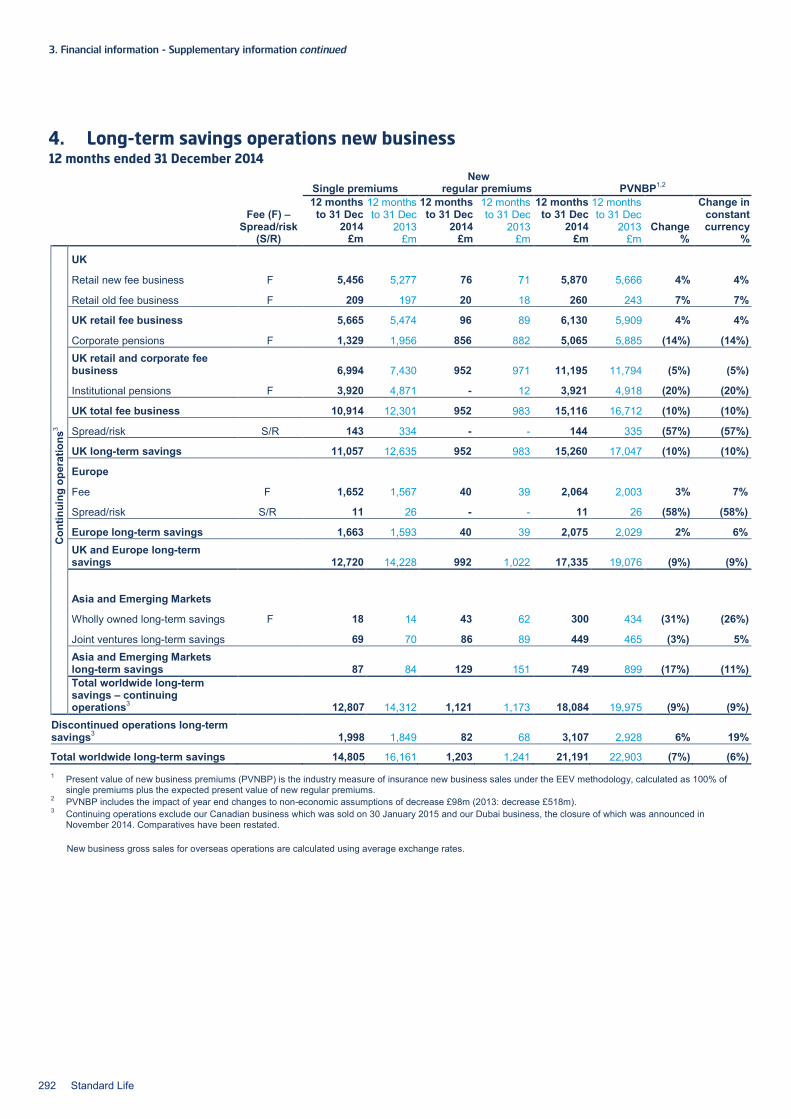
3. Financial information - Supplementary information continued
4. Long-term savings operations new business 12 months ended 31 December 2014
Single premiums New
regular premiums PVNBP1,2
Fee (F) – Spread/risk
(S/R)
12 months to 31 Dec
2014
12 months to 31 Dec
2013
12 months to 31 Dec
2014
12 months to 31 Dec
2013
12 months to 31 Dec
2014
12 months to 31 Dec
2013 Change
Change in constant currency
£m £m £m £m £m £m % %
Con
tinui
ng o
pera
tions
3
UK
Retail new fee business F 5,456 5,277 76 71 5,870 5,666 4% 4%
Retail old fee business F 209 197 20 18 260 243 7% 7%
UK retail fee business 5,665 5,474 96 89 6,130 5,909 4% 4%
Corporate pensions F 1,329 1,956 856 882 5,065 5,885 (14%) (14%) UK retail and corporate fee business 6,994 7,430 952 971 11,195 11,794 (5%) (5%)
Institutional pensions F 3,920 4,871 - 12 3,921 4,918 (20%) (20%)
UK total fee business 10,914 12,301 952 983 15,116 16,712 (10%) (10%)
Spread/risk S/R 143 334 - - 144 335 (57%) (57%)
UK long-term savings 11,057 12,635 952 983 15,260 17,047 (10%) (10%)
Europe
Fee F 1,652 1,567 40 39 2,064 2,003 3% 7%
Spread/risk S/R 11 26 - - 11 26 (58%) (58%)
Europe long-term savings 1,663 1,593 40 39 2,075 2,029 2% 6% UK and Europe long-term savings 12,720 14,228 992 1,022 17,335 19,076 (9%) (9%)
Asia and Emerging Markets
Wholly owned long-term savings F 18 14 43 62 300 434 (31%) (26%)
Joint ventures long-term savings 69 70 86 89 449 465 (3%) 5% Asia and Emerging Markets long-term savings 87 84 129 151 749 899 (17%) (11%) Total worldwide long-term savings – continuing operations3 12,807 14,312 1,121 1,173 18,084 19,975 (9%) (9%)
Discontinued operations long-term savings3 1,998 1,849 82 68 3,107 2,928 6% 19%
Total worldwide long-term savings 14,805 16,161 1,203 1,241 21,191 22,903 (7%) (6%) 1 Present value of new business premiums (PVNBP) is the industry measure of insurance new business sales under the EEV methodology, calculated as 100% of
single premiums plus the expected present value of new regular premiums. 2 PVNBP includes the impact of year end changes to non-economic assumptions of decrease £98m (2013: decrease £518m). 3 Continuing operations exclude our Canadian business which was sold on 30 January 2015 and our Dubai business, the closure of which was announced in
November 2014. Comparatives have been restated.
New business gross sales for overseas operations are calculated using average exchange rates.
292 Standard Life
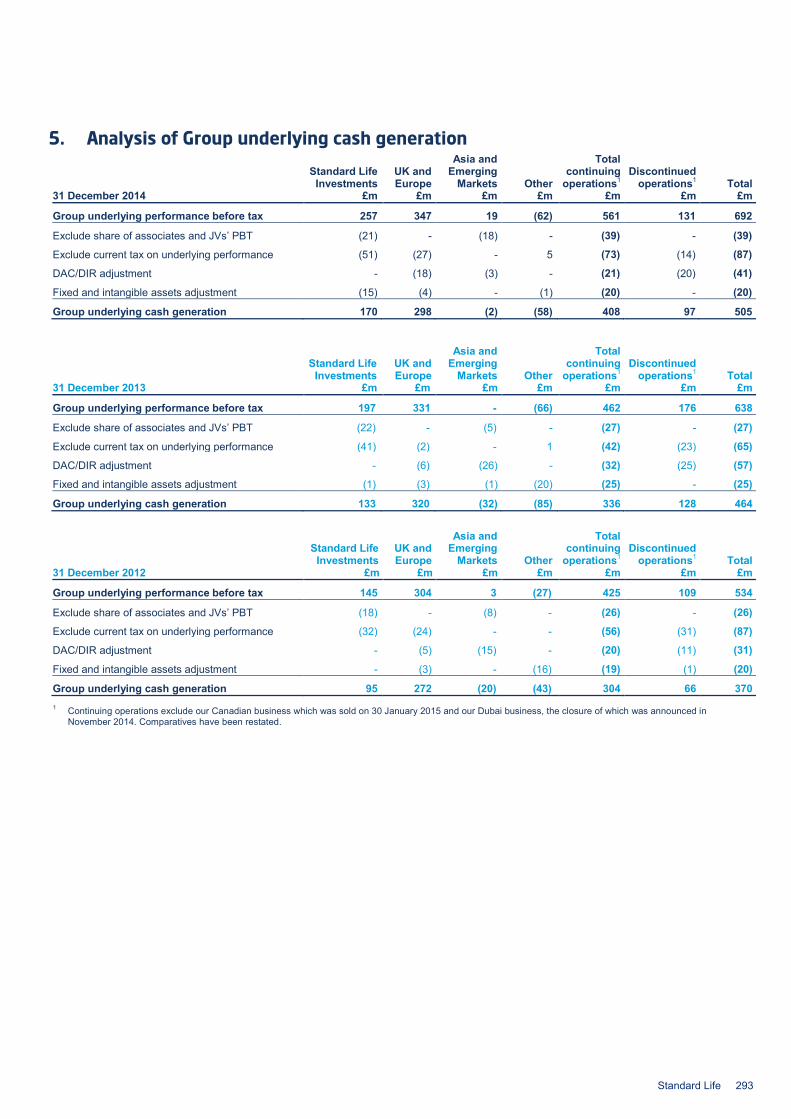
5. Analysis of Group underlying cash generation
Standard Life Investments
UK and Europe
Asia and Emerging
Markets Other
Total continuing
operations1 Discontinued
operations1 Total 31 December 2014 £m £m £m £m £m £m £m
Group underlying performance before tax 257 347 19 (62) 561 131 692
Exclude share of associates and JVs’ PBT (21) - (18) - (39) - (39)
Exclude current tax on underlying performance (51) (27) - 5 (73) (14) (87)
DAC/DIR adjustment - (18) (3) - (21) (20) (41)
Fixed and intangible assets adjustment (15) (4) - (1) (20) - (20)
Group underlying cash generation 170 298 (2) (58) 408 97 505
Standard Life Investments
UK and Europe
Asia and Emerging
Markets Other
Total continuing
operations1 Discontinued
operations1 Total 31 December 2013 £m £m £m £m £m £m £m
Group underlying performance before tax 197 331 - (66) 462 176 638
Exclude share of associates and JVs’ PBT (22) - (5) - (27) - (27)
Exclude current tax on underlying performance (41) (2) - 1 (42) (23) (65)
DAC/DIR adjustment - (6) (26) - (32) (25) (57)
Fixed and intangible assets adjustment (1) (3) (1) (20) (25) - (25)
Group underlying cash generation 133 320 (32) (85) 336 128 464
Standard Life Investments
UK and Europe
Asia and Emerging
Markets Other
Total continuing
operations1 Discontinued
operations1 Total 31 December 2012 £m £m £m £m £m £m £m
Group underlying performance before tax 145 304 3 (27) 425 109 534
Exclude share of associates and JVs’ PBT (18) - (8) - (26) - (26)
Exclude current tax on underlying performance (32) (24) - - (56) (31) (87)
DAC/DIR adjustment - (5) (15) - (20) (11) (31)
Fixed and intangible assets adjustment - (3) - (16) (19) (1) (20)
Group underlying cash generation 95 272 (20) (43) 304 66 370 1 Continuing operations exclude our Canadian business which was sold on 30 January 2015 and our Dubai business, the closure of which was announced in
November 2014. Comparatives have been restated.
Standard Life 293
4. Other information – Shareholder information
Shareholder information Registered office Standard Life plc Standard Life House 30 Lothian Road Edinburgh EH1 2DH Scotland
Company registration number: SC286832
Phone: 0800 634 7474* or 0131 225 2552*
For shareholder services call 0845 113 0045*
Registrar Capita Registrars Limited (trading as Capita Asset Services)
Auditors PricewaterhouseCoopers LLP
Solicitors Slaughter and May
Brokers JP Morgan Cazenove Deutsche Bank
Shareholder services We offer a wide range of shareholder services, some details of which are included on the following pages. If you need any further information about any of these services, please: • contact our registrar, Capita, on 0845 113 0045* if calling from the UK. International (and non-0845) numbers for Capita can be
found on the last page of this report • visit our share portal at www.standardlifeshareportal.com
Sign up for ecommunications By registering at www.standardlifeshareportal.com you can receive your shareholder communications electronically. The benefits include: • email alerts when documents like the Annual report and accounts and AGM guide are available online • online voting instructions for the Annual General Meeting • being able to download your dividend tax vouchers when you need them • viewing your Standard Life Share Account statement online.
All our ecommunications contain the same information as paper versions. By registering you are helping us to reduce the amount of paper we use and the impact we make on the environment.
Dividends You can choose to receive your dividends as cash – paid directly into your bank account or by cheque – or you can sign up for the dividend reinvestment plan (DRIP) where your dividends will be reinvested in additional ordinary shares.
You can receive cash dividends in a number of ways. This includes automatic local currency payments for shareholders who live in certain countries outside the UK, and a choice of some major currencies for transfers to banks outside the UK. You can find out more about these shareholder services at www.standardlife.com/shareholders
* Calls may be monitored and/or recorded to protect both you and us and help with our training. Call charges will vary.
294 Standard Life
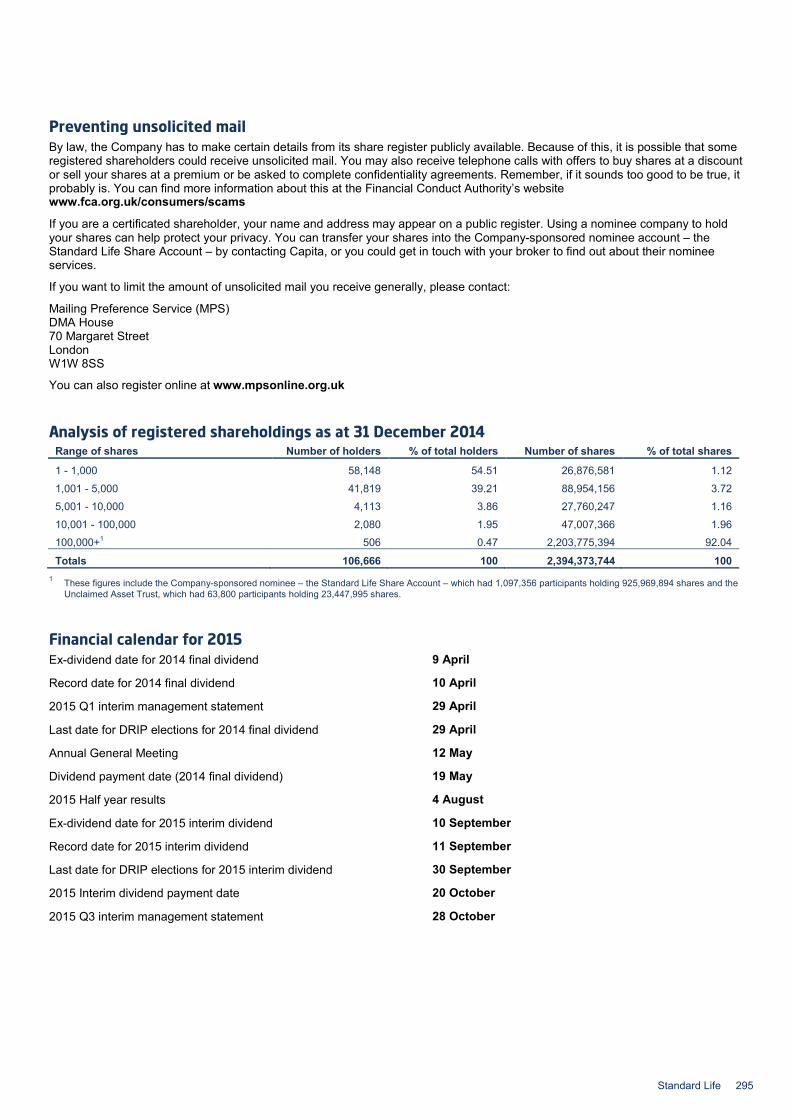
Preventing unsolicited mail By law, the Company has to make certain details from its share register publicly available. Because of this, it is possible that some registered shareholders could receive unsolicited mail. You may also receive telephone calls with offers to buy shares at a discount or sell your shares at a premium or be asked to complete confidentiality agreements. Remember, if it sounds too good to be true, it probably is. You can find more information about this at the Financial Conduct Authority’s website www.fca.org.uk/consumers/scams
If you are a certificated shareholder, your name and address may appear on a public register. Using a nominee company to hold your shares can help protect your privacy. You can transfer your shares into the Company-sponsored nominee account – the Standard Life Share Account – by contacting Capita, or you could get in touch with your broker to find out about their nominee services.
If you want to limit the amount of unsolicited mail you receive generally, please contact:
Mailing Preference Service (MPS) DMA House 70 Margaret Street London W1W 8SS
You can also register online at www.mpsonline.org.uk
Analysis of registered shareholdings as at 31 December 2014
Range of shares Number of holders % of total holders Number of shares % of total shares
1 - 1,000 58,148 54.51 26,876,581 1.12
1,001 - 5,000 41,819 39.21 88,954,156 3.72
5,001 - 10,000 4,113 3.86 27,760,247 1.16
10,001 - 100,000 2,080 1.95 47,007,366 1.96
100,000+1 506 0.47 2,203,775,394 92.04
Totals 106,666 100 2,394,373,744 100 1 These figures include the Company-sponsored nominee – the Standard Life Share Account – which had 1,097,356 participants holding 925,969,894 shares and the
Unclaimed Asset Trust, which had 63,800 participants holding 23,447,995 shares.
Financial calendar for 2015 Ex-dividend date for 2014 final dividend 9 April
Record date for 2014 final dividend 10 April
2015 Q1 interim management statement 29 April
Last date for DRIP elections for 2014 final dividend 29 April
Annual General Meeting 12 May
Dividend payment date (2014 final dividend) 19 May
2015 Half year results 4 August
Ex-dividend date for 2015 interim dividend 10 September
Record date for 2015 interim dividend 11 September
Last date for DRIP elections for 2015 interim dividend 30 September
2015 Interim dividend payment date 20 October
2015 Q3 interim management statement 28 October
Standard Life 295
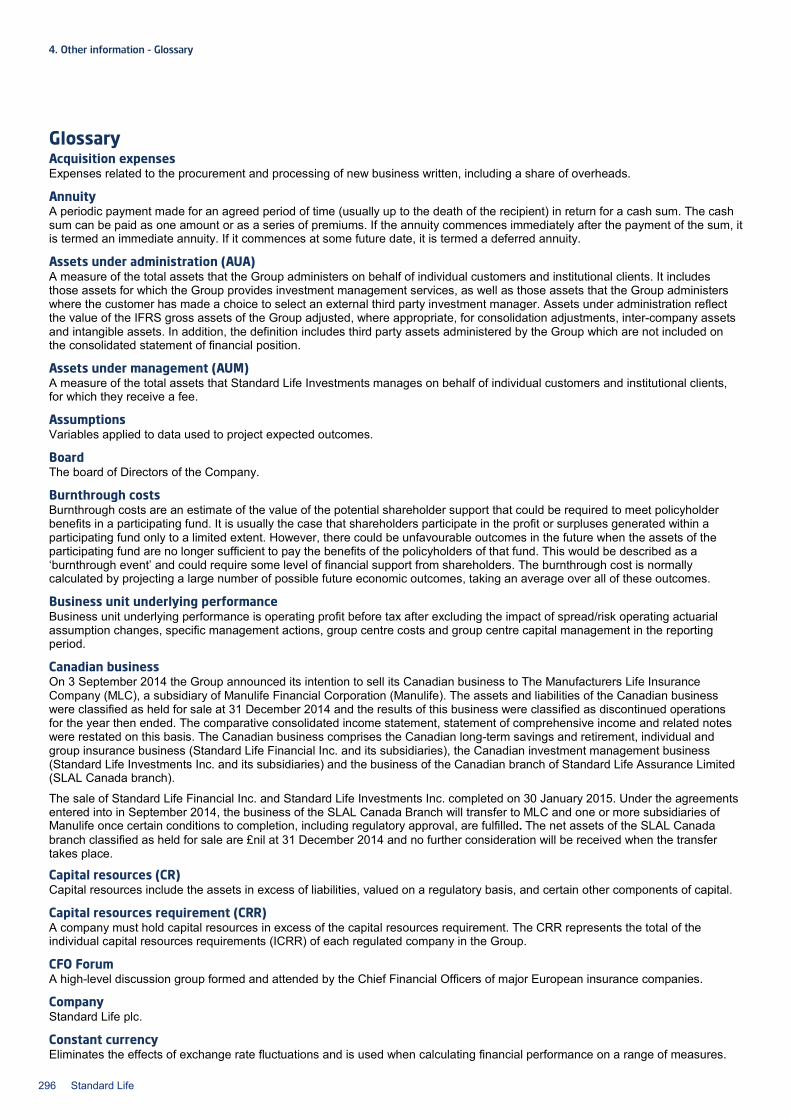
4. Other information – Glossary
Glossary Acquisition expenses Expenses related to the procurement and processing of new business written, including a share of overheads.
Annuity A periodic payment made for an agreed period of time (usually up to the death of the recipient) in return for a cash sum. The cash sum can be paid as one amount or as a series of premiums. If the annuity commences immediately after the payment of the sum, it is termed an immediate annuity. If it commences at some future date, it is termed a deferred annuity.
Assets under administration (AUA) A measure of the total assets that the Group administers on behalf of individual customers and institutional clients. It includes those assets for which the Group provides investment management services, as well as those assets that the Group administers where the customer has made a choice to select an external third party investment manager. Assets under administration reflect the value of the IFRS gross assets of the Group adjusted, where appropriate, for consolidation adjustments, inter-company assets and intangible assets. In addition, the definition includes third party assets administered by the Group which are not included on the consolidated statement of financial position.
Assets under management (AUM) A measure of the total assets that Standard Life Investments manages on behalf of individual customers and institutional clients, for which they receive a fee.
Assumptions Variables applied to data used to project expected outcomes.
Board The board of Directors of the Company.
Burnthrough costs Burnthrough costs are an estimate of the value of the potential shareholder support that could be required to meet policyholder benefits in a participating fund. It is usually the case that shareholders participate in the profit or surpluses generated within a participating fund only to a limited extent. However, there could be unfavourable outcomes in the future when the assets of the participating fund are no longer sufficient to pay the benefits of the policyholders of that fund. This would be described as a ‘burnthrough event’ and could require some level of financial support from shareholders. The burnthrough cost is normally calculated by projecting a large number of possible future economic outcomes, taking an average over all of these outcomes.
Business unit underlying performance Business unit underlying performance is operating profit before tax after excluding the impact of spread/risk operating actuarial assumption changes, specific management actions, group centre costs and group centre capital management in the reporting period.
Canadian business On 3 September 2014 the Group announced its intention to sell its Canadian business to The Manufacturers Life Insurance Company (MLC), a subsidiary of Manulife Financial Corporation (Manulife). The assets and liabilities of the Canadian business were classified as held for sale at 31 December 2014 and the results of this business were classified as discontinued operations for the year then ended. The comparative consolidated income statement, statement of comprehensive income and related notes were restated on this basis. The Canadian business comprises the Canadian long-term savings and retirement, individual and group insurance business (Standard Life Financial Inc. and its subsidiaries), the Canadian investment management business (Standard Life Investments Inc. and its subsidiaries) and the business of the Canadian branch of Standard Life Assurance Limited (SLAL Canada branch).
The sale of Standard Life Financial Inc. and Standard Life Investments Inc. completed on 30 January 2015. Under the agreements entered into in September 2014, the business of the SLAL Canada Branch will transfer to MLC and one or more subsidiaries of Manulife once certain conditions to completion, including regulatory approval, are fulfilled. The net assets of the SLAL Canada branch classified as held for sale are £nil at 31 December 2014 and no further consideration will be received when the transfer takes place.
Capital resources (CR) Capital resources include the assets in excess of liabilities, valued on a regulatory basis, and certain other components of capital.
Capital resources requirement (CRR) A company must hold capital resources in excess of the capital resources requirement. The CRR represents the total of the individual capital resources requirements (ICRR) of each regulated company in the Group.
CFO Forum A high-level discussion group formed and attended by the Chief Financial Officers of major European insurance companies.
Company Standard Life plc.
Constant currency Eliminates the effects of exchange rate fluctuations and is used when calculating financial performance on a range of measures.
296 Standard Life
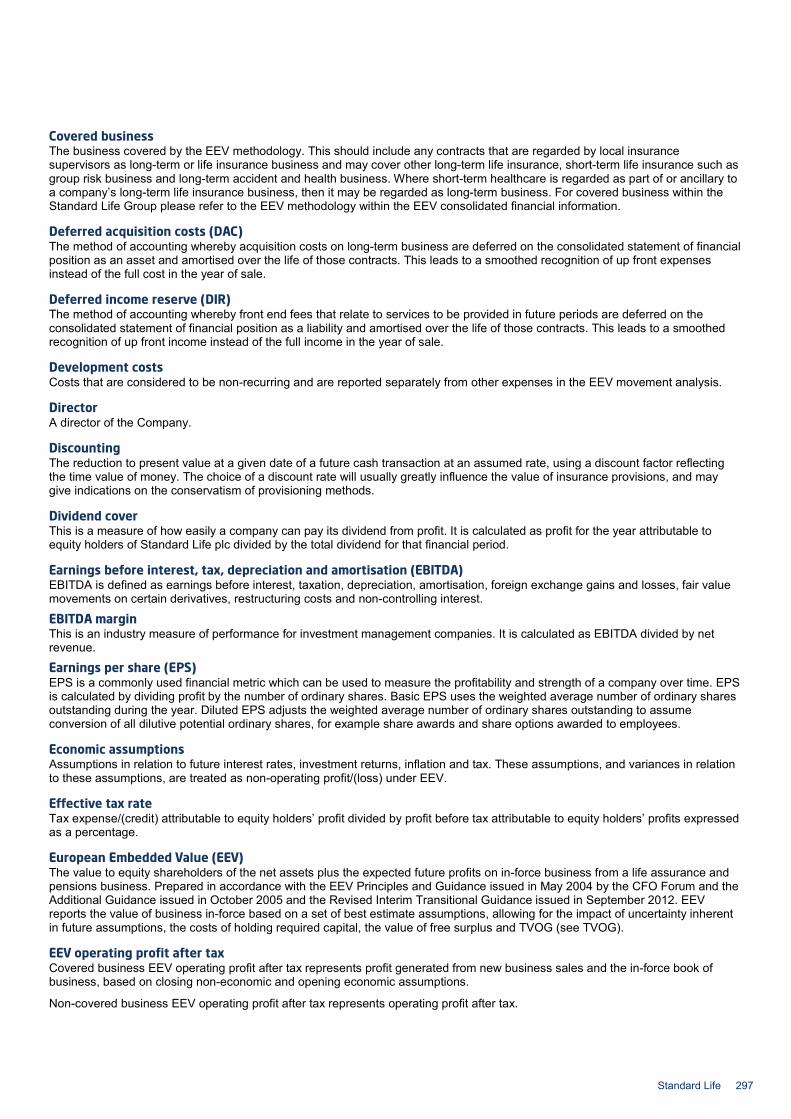
Covered business The business covered by the EEV methodology. This should include any contracts that are regarded by local insurance supervisors as long-term or life insurance business and may cover other long-term life insurance, short-term life insurance such as group risk business and long-term accident and health business. Where short-term healthcare is regarded as part of or ancillary to a company’s long-term life insurance business, then it may be regarded as long-term business. For covered business within the Standard Life Group please refer to the EEV methodology within the EEV consolidated financial information.
Deferred acquisition costs (DAC) The method of accounting whereby acquisition costs on long-term business are deferred on the consolidated statement of financial position as an asset and amortised over the life of those contracts. This leads to a smoothed recognition of up front expenses instead of the full cost in the year of sale.
Deferred income reserve (DIR) The method of accounting whereby front end fees that relate to services to be provided in future periods are deferred on the consolidated statement of financial position as a liability and amortised over the life of those contracts. This leads to a smoothed recognition of up front income instead of the full income in the year of sale.
Development costs Costs that are considered to be non-recurring and are reported separately from other expenses in the EEV movement analysis.
Director A director of the Company.
Discounting The reduction to present value at a given date of a future cash transaction at an assumed rate, using a discount factor reflecting the time value of money. The choice of a discount rate will usually greatly influence the value of insurance provisions, and may give indications on the conservatism of provisioning methods.
Dividend cover This is a measure of how easily a company can pay its dividend from profit. It is calculated as profit for the year attributable to equity holders of Standard Life plc divided by the total dividend for that financial period.
Earnings before interest, tax, depreciation and amortisation (EBITDA) EBITDA is defined as earnings before interest, taxation, depreciation, amortisation, foreign exchange gains and losses, fair value movements on certain derivatives, restructuring costs and non-controlling interest.
EBITDA margin This is an industry measure of performance for investment management companies. It is calculated as EBITDA divided by net revenue.
Earnings per share (EPS) EPS is a commonly used financial metric which can be used to measure the profitability and strength of a company over time. EPS is calculated by dividing profit by the number of ordinary shares. Basic EPS uses the weighted average number of ordinary shares outstanding during the year. Diluted EPS adjusts the weighted average number of ordinary shares outstanding to assume conversion of all dilutive potential ordinary shares, for example share awards and share options awarded to employees.
Economic assumptions Assumptions in relation to future interest rates, investment returns, inflation and tax. These assumptions, and variances in relation to these assumptions, are treated as non-operating profit/(loss) under EEV.
Effective tax rate Tax expense/(credit) attributable to equity holders’ profit divided by profit before tax attributable to equity holders’ profits expressed as a percentage.
European Embedded Value (EEV) The value to equity shareholders of the net assets plus the expected future profits on in-force business from a life assurance and pensions business. Prepared in accordance with the EEV Principles and Guidance issued in May 2004 by the CFO Forum and the Additional Guidance issued in October 2005 and the Revised Interim Transitional Guidance issued in September 2012. EEV reports the value of business in-force based on a set of best estimate assumptions, allowing for the impact of uncertainty inherent in future assumptions, the costs of holding required capital, the value of free surplus and TVOG (see TVOG).
EEV operating profit after tax Covered business EEV operating profit after tax represents profit generated from new business sales and the in-force book of business, based on closing non-economic and opening economic assumptions.
Non-covered business EEV operating profit after tax represents operating profit after tax.
Standard Life 297
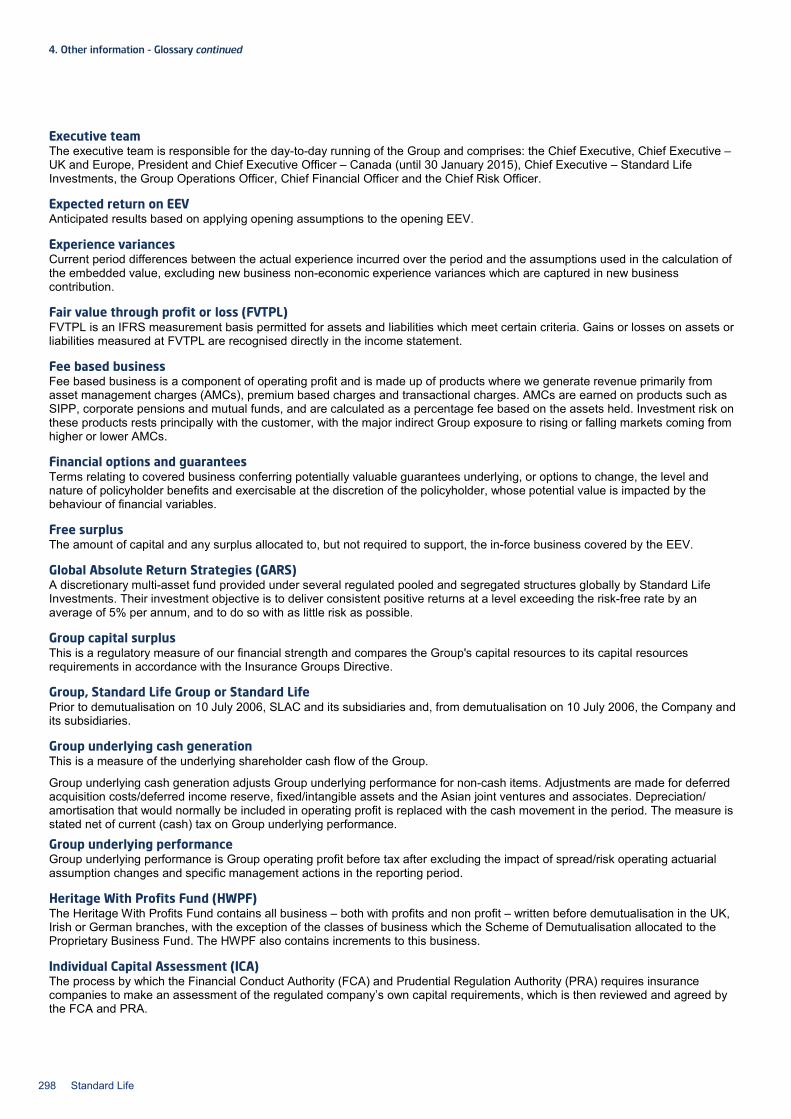
4. Other information – Glossary continued Executive team The executive team is responsible for the day-to-day running of the Group and comprises: the Chief Executive, Chief Executive – UK and Europe, President and Chief Executive Officer – Canada (until 30 January 2015), Chief Executive – Standard Life Investments, the Group Operations Officer, Chief Financial Officer and the Chief Risk Officer.
Expected return on EEV Anticipated results based on applying opening assumptions to the opening EEV.
Experience variances Current period differences between the actual experience incurred over the period and the assumptions used in the calculation of the embedded value, excluding new business non-economic experience variances which are captured in new business contribution.
Fair value through profit or loss (FVTPL) FVTPL is an IFRS measurement basis permitted for assets and liabilities which meet certain criteria. Gains or losses on assets or liabilities measured at FVTPL are recognised directly in the income statement.
Fee based business Fee based business is a component of operating profit and is made up of products where we generate revenue primarily from asset management charges (AMCs), premium based charges and transactional charges. AMCs are earned on products such as SIPP, corporate pensions and mutual funds, and are calculated as a percentage fee based on the assets held. Investment risk on these products rests principally with the customer, with the major indirect Group exposure to rising or falling markets coming from higher or lower AMCs.
Financial options and guarantees Terms relating to covered business conferring potentially valuable guarantees underlying, or options to change, the level and nature of policyholder benefits and exercisable at the discretion of the policyholder, whose potential value is impacted by the behaviour of financial variables.
Free surplus The amount of capital and any surplus allocated to, but not required to support, the in-force business covered by the EEV.
Global Absolute Return Strategies (GARS) A discretionary multi-asset fund provided under several regulated pooled and segregated structures globally by Standard Life Investments. Their investment objective is to deliver consistent positive returns at a level exceeding the risk-free rate by an average of 5% per annum, and to do so with as little risk as possible.
Group capital surplus This is a regulatory measure of our financial strength and compares the Group's capital resources to its capital resources requirements in accordance with the Insurance Groups Directive.
Group, Standard Life Group or Standard Life Prior to demutualisation on 10 July 2006, SLAC and its subsidiaries and, from demutualisation on 10 July 2006, the Company and its subsidiaries.
Group underlying cash generation This is a measure of the underlying shareholder cash flow of the Group.
Group underlying cash generation adjusts Group underlying performance for non-cash items. Adjustments are made for deferred acquisition costs/deferred income reserve, fixed/intangible assets and the Asian joint ventures and associates. Depreciation/ amortisation that would normally be included in operating profit is replaced with the cash movement in the period. The measure is stated net of current (cash) tax on Group underlying performance.
Group underlying performance Group underlying performance is Group operating profit before tax after excluding the impact of spread/risk operating actuarial assumption changes and specific management actions in the reporting period.
Heritage With Profits Fund (HWPF) The Heritage With Profits Fund contains all business – both with profits and non profit – written before demutualisation in the UK, Irish or German branches, with the exception of the classes of business which the Scheme of Demutualisation allocated to the Proprietary Business Fund. The HWPF also contains increments to this business.
Individual Capital Assessment (ICA) The process by which the Financial Conduct Authority (FCA) and Prudential Regulation Authority (PRA) requires insurance companies to make an assessment of the regulated company’s own capital requirements, which is then reviewed and agreed by the FCA and PRA.
298 Standard Life
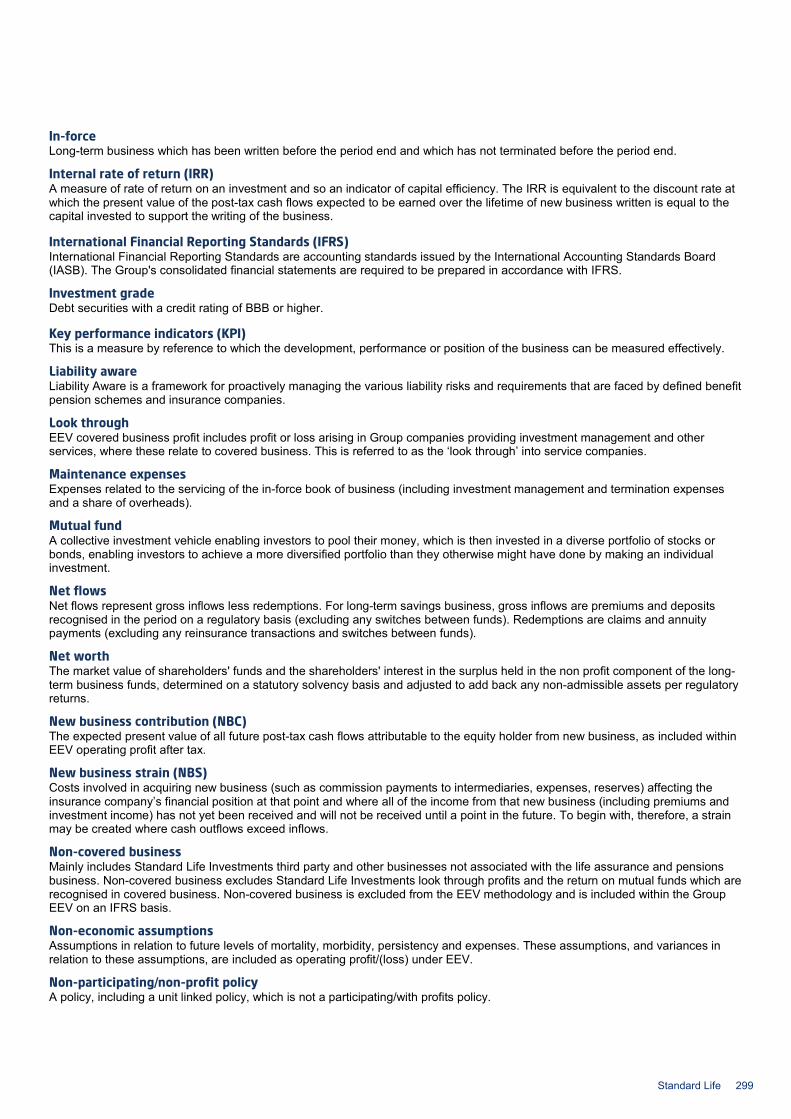
In-force Long-term business which has been written before the period end and which has not terminated before the period end.
Internal rate of return (IRR) A measure of rate of return on an investment and so an indicator of capital efficiency. The IRR is equivalent to the discount rate at which the present value of the post-tax cash flows expected to be earned over the lifetime of new business written is equal to the capital invested to support the writing of the business.
International Financial Reporting Standards (IFRS) International Financial Reporting Standards are accounting standards issued by the International Accounting Standards Board (IASB). The Group's consolidated financial statements are required to be prepared in accordance with IFRS.
Investment grade Debt securities with a credit rating of BBB or higher.
Key performance indicators (KPI) This is a measure by reference to which the development, performance or position of the business can be measured effectively.
Liability aware Liability Aware is a framework for proactively managing the various liability risks and requirements that are faced by defined benefit pension schemes and insurance companies.
Look through EEV covered business profit includes profit or loss arising in Group companies providing investment management and other services, where these relate to covered business. This is referred to as the ‘look through’ into service companies.
Maintenance expenses Expenses related to the servicing of the in-force book of business (including investment management and termination expenses and a share of overheads).
Mutual fund A collective investment vehicle enabling investors to pool their money, which is then invested in a diverse portfolio of stocks or bonds, enabling investors to achieve a more diversified portfolio than they otherwise might have done by making an individual investment.
Net flows Net flows represent gross inflows less redemptions. For long-term savings business, gross inflows are premiums and deposits recognised in the period on a regulatory basis (excluding any switches between funds). Redemptions are claims and annuity payments (excluding any reinsurance transactions and switches between funds).
Net worth The market value of shareholders' funds and the shareholders' interest in the surplus held in the non profit component of the long-term business funds, determined on a statutory solvency basis and adjusted to add back any non-admissible assets per regulatory returns.
New business contribution (NBC) The expected present value of all future post-tax cash flows attributable to the equity holder from new business, as included within EEV operating profit after tax.
New business strain (NBS) Costs involved in acquiring new business (such as commission payments to intermediaries, expenses, reserves) affecting the insurance company’s financial position at that point and where all of the income from that new business (including premiums and investment income) has not yet been received and will not be received until a point in the future. To begin with, therefore, a strain may be created where cash outflows exceed inflows.
Non-covered business Mainly includes Standard Life Investments third party and other businesses not associated with the life assurance and pensions business. Non-covered business excludes Standard Life Investments look through profits and the return on mutual funds which are recognised in covered business. Non-covered business is excluded from the EEV methodology and is included within the Group EEV on an IFRS basis.
Non-economic assumptions Assumptions in relation to future levels of mortality, morbidity, persistency and expenses. These assumptions, and variances in relation to these assumptions, are included as operating profit/(loss) under EEV.
Non-participating/non-profit policy A policy, including a unit linked policy, which is not a participating/with profits policy.
Standard Life 299
4. Other information – Glossary continued Operating profit The Group’s chosen supplementary measure of performance is operating profit. This is a non-Generally Accepted Accounting Principles (GAAP) measure. Operating profit excludes impacts arising from short-term fluctuations in investment return and economic assumption changes. It is calculated based on expected returns on investments backing equity holder funds, with consistent allowance for the corresponding expected movements in equity holder liabilities. Impacts arising from the difference between the expected return and actual return on investments, and the corresponding impact on equity holder liabilities except where they are directly related to a significant management action, are excluded from operating profit and are presented within profit before tax. The impact of certain changes in economic assumptions is also excluded from operating profit and is presented within profit before tax.
Operating profit also excludes the impact of the following items: • Restructuring costs and significant corporate transaction expenses • Impairment of intangible assets • Profit or loss arising on the disposal of a subsidiary, joint venture or associate • Amortisation of intangibles acquired in business combinations • Where Canadian insurance contract liabilities have changed as a result of a challenge, by either management or a tax authority,
to an uncertain tax treatment which has resulted in a change in deferred tax assets for prior years • Items which are one-off in nature and outside the control of management and which, due to their size or nature, are not
indicative of the long-term operating performance of the Group.
Participating/with profits policy A policy where, in addition to guaranteed benefits specified in the policy, additional bonuses may be payable from relevant surplus. The declaration of such bonuses (usually annually) reflects, amongst other things, the overall investment performance of the fund of which the policy forms part.
Personal pension plan An individual pension arrangement with particular tax advantages whereby individuals who are self-employed or those who are not members of employer-sponsored pension scheme arrangements can make provision for retirement or provide benefits for their dependents in a tax efficient manner.
Present value of in-force business (PVIF) The present value of the projected future distributable profit after tax attributable to equity holders from the covered business in-force at the valuation date, adjusted where appropriate to take account of TVOG (see TVOG).
Present value of new business premiums (PVNBP) The industry measure of insurance new business sales under the EEV methodology. It is calculated as 100% of single premiums plus the expected present value of new regular premiums.
Profit contribution Profit contribution reflects the income and expenses directly attributable to each of the UK lines of business. It differs from operating profit due to the exclusion of indirect expenses, such as overheads, and capital management.
Proprietary Business Fund The Proprietary Business Fund in Standard Life Assurance Limited (SLAL) contains, amongst other things, most new insurance business written after demutualisation in the UK, Ireland and Germany and certain classes of business – pension contribution insurance policies, income protection plan policies and a number of SIPP policies written before demutualisation.
PVNBP margin PVNBP margin is NBC expressed as a percentage of PVNBP.
Recourse cash flow (RCF) Certain cash flows arising in the HWPF on specified blocks of UK and Irish business, which are transferred out of the fund on a monthly basis and accrue to the ultimate benefit of equity holders, as determined by the Scheme of Demutualisation.
Regular premium A regular premium contract (as opposed to a single premium contract), is one where the policyholder agrees at inception to make regular payments throughout the term of the contract.
Required capital The amount of assets, over and above the value placed on liabilities in respect of covered business, whose distribution to equity holders is restricted.
Return on equity (RoE) The annualised post-tax profit on an IFRS basis expressed as a percentage of the opening IFRS equity, adjusted for time apportioned dividends paid to equity holders. Operating RoE is based on operating profit after tax and total RoE is based on IFRS profit after tax attributable to equity holders.
Scheme of Demutualisation (the Scheme) The scheme pursuant to Part VII of, and Schedule 12 to, the Financial Services and Markets Act 2000, under which substantially all of the long-term business of SLAC was transferred to Standard Life Assurance Limited on 10 July 2006.
300 Standard Life
SICAV A SICAV (société d’investissement à capital variable) is an open-ended collective investment scheme common in Western Europe. SICAVs can be cross-border marketed in the EU under the Undertakings for Collective Investment in Transferable Securities (UCITS) directive.
Single premium A single premium contract (as opposed to a regular premium contract), involves the payment of one premium at inception with no obligation for the policyholder to make subsequent additional payments.
SIPP A self invested personal pension which provides the policyholder with greater choice and flexibility as to the range of investments made, how those investments are managed, the administration of those assets and how retirement benefits are taken.
SLAC The Standard Life Assurance Company (renamed The Standard Life Assurance Company 2006 on 10 July 2006).
SLAL Standard Life Assurance Limited.
SLIL Standard Life International Limited.
Spread/risk based business Spread/risk based business is a component of operating profit and mainly comprises products where we provide a guaranteed level of income for our customers in return for an investment. A good example of this product line is annuities. The ‘spread’ referred to in the title primarily relates to the difference between the guaranteed amount we pay to customers and the actual return on the assets over the period of the contract.
Spread/risk margin Spread/risk margin reflects the margin earned on spread/risk business. This includes net earned premiums, claims and benefits paid, net investment return using long-term assumptions and reserving changes.
Strategic partner life business A measure of the assets that Standard Life Investments manages on behalf of Standard Life Group companies and under other long-term life book partnership agreements, such as Phoenix Group.
Third party (excluding strategic partner life business) A measure of the assets that Standard Life Investments manages on behalf of individual customers and institutional clients, for which they receive a fee. This measure excludes the assets that are managed on behalf of strategic partners in life assurance books.
Time value of options and guarantees (TVOG) Represents the potential additional cost to equity holders where a financial option or guarantee exists which affects policyholder benefits and is exercisable at the option of the policyholder.
Total shareholder return This is a measure of the overall return to shareholders and includes the movement in the share price and any dividends paid and reinvested.
UK corporate UK corporate provides workplace pensions, savings and benefits to UK employers and employees. These are sold through corporate benefit consultants, independent financial advisers, or directly to employers.
UK retail This relates to business where we have a relationship with the customer either directly or through an independent financial adviser. We analyse this type of business into new and old categories. Retail new includes the products, platforms, investment solutions and services of our UK retail business that we continue to market actively to our customers. Retail old includes business that was predominantly written before demutualisation.
Undiscounted payback period A measure of capital efficiency that measures the time at which the value of expected undiscounted post-tax cash flows (after tax) is sufficient to recover the capital invested to support the writing of new business.
Unit linked policy A policy where the benefits are determined by reference to the investment performance of a specified pool of assets referred to as the unit linked fund.
Wrap platform An investment platform which is essentially a trading platform enabling investment funds, pensions, direct equity holdings and some life assurance contracts to be held in the same administrative account rather than as separate holdings.
Standard Life 301
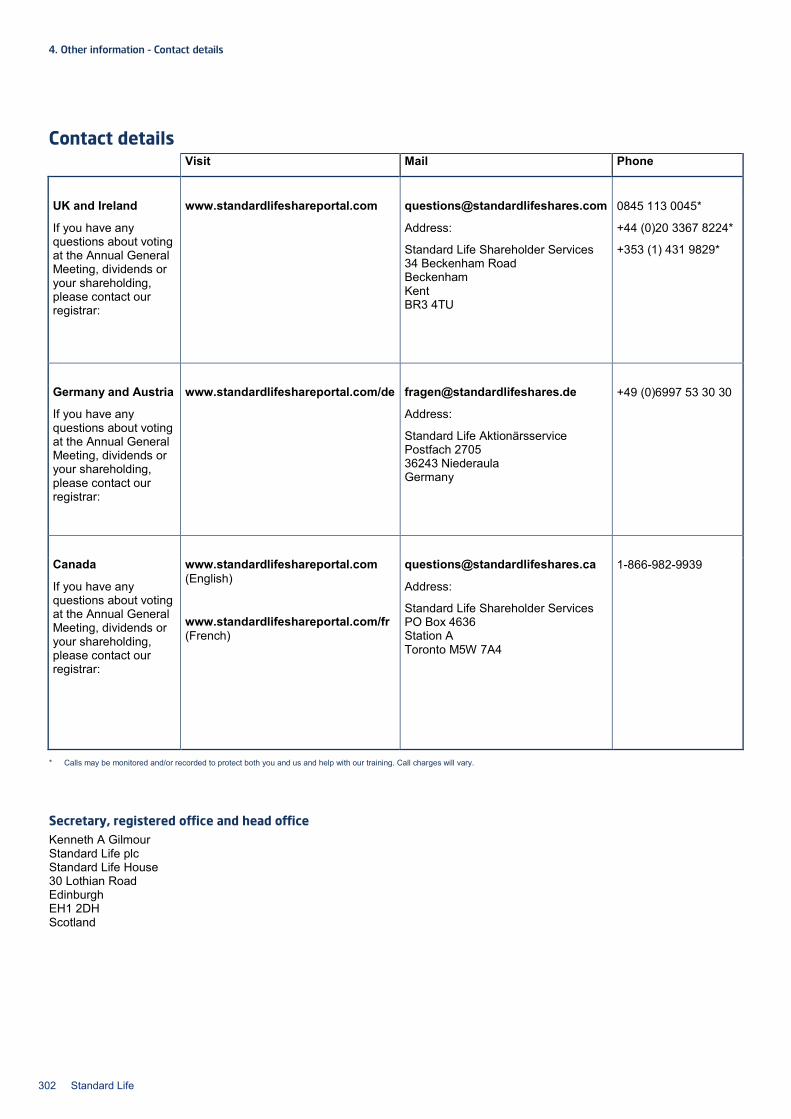
4. Other information – Contact details
Contact details Visit Mail Phone
UK and Ireland
If you have any questions about voting at the Annual General Meeting, dividends or your shareholding, please contact our registrar:
www.standardlifeshareportal.com
Address:
Standard Life Shareholder Services 34 Beckenham Road Beckenham Kent BR3 4TU
0845 113 0045*
+44 (0)20 3367 8224*
+353 (1) 431 9829*
Germany and Austria
If you have any questions about voting at the Annual General Meeting, dividends or your shareholding, please contact our registrar:
www.standardlifeshareportal.com/de
Address:
Standard Life Aktionärsservice Postfach 2705 36243 Niederaula Germany
+49 (0)6997 53 30 30
Canada
If you have any questions about voting at the Annual General Meeting, dividends or your shareholding, please contact our registrar:
www.standardlifeshareportal.com (English)
www.standardlifeshareportal.com/fr (French)
Address:
Standard Life Shareholder Services PO Box 4636 Station A Toronto M5W 7A4
1-866-982-9939
* Calls may be monitored and/or recorded to protect both you and us and help with our training. Call charges will vary.
Secretary, registered office and head office Kenneth A Gilmour Standard Life plc Standard Life House 30 Lothian Road Edinburgh EH1 2DH Scotland
302 Standard Life


UKARA14 0215
www.standardlife.com
Please remember that the value of shares can go down as well as up and you may not get back the full amount invested or any income from it. All figures and share price information have been calculated as at 31 December 2014 (unless otherwise indicated).
This document has been published by Standard Life plc for information only. It is based on our understanding as at February 2015 and does not provide financial or legal advice.
Standard Life plc is registered in Scotland (SC286832) at Standard Life House, 30 Lothian Road, Edinburgh EH1 2DH. www.standardlife.com © 2015 Standard Life, images reproduced under licence