
Pace Annual Report & Accounts 2011
84
A world leader in digital and broadband technologies Annual Report & Accounts 2011
-
Upload
khangminh22 -
Category
Documents
-
view
0 -
download
0
Transcript of Pace Annual Report & Accounts 2011

A world leader in digital and broadband technologiesAnnual Report & Accounts 2011
Annu
al R
epor
t & A
ccou
nts
2011
MKT-R&A2011
Front & back cover.indd 1-3 12/03/2012 12:40

02 Highlights
04 Chairman’s Letter
05 Chief Executive Officer’s Review
08 Chief Financial Officer’s Review
11 Report of the Directors
22 Directors’ Remuneration Report
31 Statement of Directors’ Responsibilities
32 Independent Auditors’ Report
35 Financial Statements
42 Notes to the Financial Statements
78 Directors, Secretary and Advisers
79 Five Year Record and Shareholder Information
Contents
01 | Pace plc 2011 Annual Report Pace plc 2011 Annual Report |
Front & back cover.indd 4-6 12/03/2012 12:40
83
applemac15
Distance Measurement
3.01 mm
applemac15
Distance Measurement
15.64 mm
applemac15
Distance Measurement
2.95 mm

Pace plc 2011Annual Report | 02
North America Revenues
$1,065m (+27%)
Europe Revenues
$458m (-19%)
Rest of the World Revenues
$318m (+13%)
Latin America Revenues
$469m (+25%)
Revenue $2,309.3m (2010 restated: $2,062.9m) +11.9%
Underlying earnings1 $141.4m (2010 restated: $160.6m) -12.0%
Return on sales2 6.1% (2010 restated: 7.8%) -1.7ppt
Operating profit pre-exceptionals $85.7m (2010 restated: $142.5m) -39.9%
Profit before tax $54.7m (2010 restated: $110.2m) -50.4%
Adjusted3 basic EPS 29.7c (2010 restated: 37.1c) -19.9%Full year proposed dividend per ordinary share 3.75c (2010 restated: 3.37c) +11.3%
Financial Highlights
Global Revenues
Pace’s customers, which today include over 160 of the world’s leading PayTV and broadband operators, are shaping the in-home entertainment and communications experience with their digital, HD, hybrid, home networking and broadband services.
Pace’s capabilities address a PayTV operator’s requirements whatever their stage or rate of development.
Pace is growing a broad platform across hardware, software and services for PayTV operators
1 Underlying earnings are operating profit before exceptional costs and amortisation of other intangibles and are also expressed as adjusted EBITA
2 Adjusted EBITA as a per cent of sales is expressed as return on sales
3 Adjusted EPS is based on earnings before the post tax value of exceptional costs and amortisation of other intangibles
Front end 2011 V10.indd 3 16/03/2012 11:25
creo

Pace plc 2011 Annual Report | 0403 | Pace plc 2011 Annual Report
We are now fi rmly focused on execution and delivering a fi tter, more profi table business with strong cash fl ow.
“I am pleased to report results in line with the guidance issued in November 2011. Following the Strategic Review and actions subsequently taken there is a clear route to delivering a successful 2012 for Pace. Our focus on operational improvement and effi ciency is already starting to deliver tangible results and will contribute further to our future competitive advantage. We continue to strategically invest in leveraging our technology assets across our markets.”
Mike Pulli Chief Executive Offi cer
Chairman’s Letter
Through the ‘ups and bumps’, the Group has made progress in key areas during the year, including the successful integration of the businesses we acquired during 2010, development of advanced technologies such as the set-top box for the “X1” platform for Comcast and the Home Media Centre for DirecTV and the strong growth we continue to see in developing markets, particularly Latin America.
Pace’s core is its engineering excellence, complemented by strong customer-focused skills and delivery capabilities.
Following the appointment of Mike Pulli as Chief Executive Offi cer in December 2011, we have the right leader to deliver on the opportunities to grow shareholder value identifi ed by our Strategic Review. It confi rmed that Pace operates in large, growing and profi table markets with differentiated capabilities, and established as the Group’s primary objectives:
• Tobuildonourpositionasaworldleadingset-topboxandresidential gateway company;
• Toimproveonoperationalexcellence;and
• Toaccelerate‘wideningout’bypursuingopportunitiestoprovide Software & Services assets.
Executing on these objectives will lead to a realistic medium term operating margin target of up to 9%, as well as increasing the Group’s ‘sticky profi ts’ – which translates to enhanced quality of earnings and therefore multiple.
Despite challenges experienced during 2011, operational focus undertaken since the Strategic Review and confi dence in the long-term earnings potential from our markets gives the Board confi dence to continue building on the progressive dividend policy that was introduced in 2009. Therefore the Board is recommending a fi nal dividend of 2.50c per share, giving a full year dividend of 3.75c per share, an 11.3% increase on 2010.
If you have any comments on my letter or any part of the Annual Report, I would be delighted to hear from you either by writing to me at Pace or by email at [email protected]
Yours sincerely
Allan LeightonChairman
6 March 2012
Dear Shareholder
2011 has been a challenging year for Pace but, despite this, the Board believes that there is real potential for Pace to become a ‘great technology company’ and confi dence that the areas of focus identifi ed through our Strategic Review undertaken during the year provides a path to unlocking its full value.
Front end 2011 V10.indd 4-5 16/03/2012 11:25

Pace plc 2011 Annual Report | 0605 | Pace plc 2011 Annual Report
Chief Executive
Officer’s Review
Key highlights of the yearPace’s markets have remained resilient during the year, with PayTV continuing to show growth despite difficult global economic conditions. Overall digital PayTV subscribers are expected to grow at circa 10% CAGR between 2011 and 2015*. Over-the-top (OTT) delivery is expected to be complementary to continued PayTV growth. PayTV in advanced markets has embraced IP and internet delivery, with next generation ‘IP fluent’ devices having become a market reality. In addition, home networking technologies such as Wi-Fi are becoming increasingly important as is the emergence of TV Everywhere technology. Pace is at the forefront of enabling operators to address the opportunities presented by these advanced technologies. Further opportunities exist for Pace in emerging markets as these continue greenfield growth and their conversion to digital.
2011 has been a challenging year operationally for Pace, with the Company addressing inventory management issues and reduced profitability in Pace Europe as well as the impact of two major natural disasters. The disruption to Hard Disk Drive (HDD) supply resulting from flooding in Thailand was a major challenge in the final quarter of 2011 and will continue to impact results during 2012, with the impact to be predominantly felt during the first half of the year. Through keen operational focus, working closely with suppliers and customers, the impact of this issue was
contained to $36m of revenue and $9m of operating profit in 2011.
Pace generated 2011 revenues of $2,309.3m, up 11.9% on 2010 due to the full-year effect of 2010 acquisitions, and adjusted EBITA of $141.4m, equivalent to 6.1% of revenues, down 1.7ppt on 2010. Our Strategic Review highlighted opportunities for improving both the level and quality of our earnings; we are actively delivering to this plan.
I am pleased to be able to report the 2011 annual results for Pace, the first since my appointment as Chief Executive Officer on 14 December 2011. Whilst Pace has faced a number of operational challenges in 2011, our Strategic Review identified a number of opportunities which, if well executed, will deliver significant value for shareholders over the coming years.
All of the businesses acquired by Pace in 2010 have been successfully integrated, with the related synergies realised ahead of and in excess of our expectations. In particular, the acquisition of 2Wire continues to deliver benefits to the Group, both through increased revenue and profitability, and through the technology assets which enable us to offer operators the additional applications and services that consumers are demanding. In the more developed markets in which Pace operates, there is a shift towards the use of internet delivery technology for the distribution and viewing of content. The combination of Gateway expertise acquired with 2Wire and Bewan, and the existing set-top box (STB) technology within Pace, provides a strong platform from which to capitalise on these opportunities.
North AmericaThe PayTV market in North America is the most technologically advanced, characterised by the increasing emergence of whole home STBs and VDSL triple-play gateways, as services demand higher speeds. We believe the digital PayTV market in North America will continue to see low single digit annual growth in subscribers for the foreseeable future.
Total revenues in North America increased by 27% to $1,065m in 2011, driven by the full year impact of the 2Wire acquisition in October 2010. Organic revenues, comprising STB sales in the Cable and Satellite markets, decreased by 17.7% to $595m reflecting lower sales of Personal Video Recorder (PVR) products and a normalisation of our leadership position achieved in 2010 on certain customer specific products. Volumes of STBs in North America increased by 3.3% reflecting a higher number of lower-value Digital Television Adapter (DTA) shipments in the year. Whilst other STB volumes declined, Pace did introduce a number of advanced products in the developed North America market, including the STB for the “X1” platform for Comcast and a whole home solution for DirecTV. These confirmed Pace’s continued position of technological leadership in our sector and we remain optimistic about the long-term strength of the market for our products in North America.
Gateway revenues increased by $294m to $392m reflecting the full year of trading from 2Wire; on a like-for-like basis revenue decreased 8% as a result of a pull forward of ADSL product into 2010 (underlying growth adjusted for this was 10%).
Software & Services revenues in North America increased by $60m to $78m (up 11% on a like-for-like basis). This revenue is primarily comprised of customer care, system management products and professional services.
Latin America The Latin America market displays strong subscriber growth and ongoing conversion to digital and is heavily influenced by the US market showing a strong appetite for High Definition (HD) products.
Total revenues in Latin America increased by 25% to $469m in 2011, with strong underlying growth from both Satellite and Cable operators as Pace continued to experience very high market share in these expanding markets, particularly in Brazil.
Growth was entirely from the organic business and mirrored growth in our customers’ subscriber bases. Volume growth was ahead of revenue growth at 77% reflecting a higher proportion of lower value, Standard Definition (SD) boxes. The businesses acquired during 2010 had relatively little activity in this region, however there are opportunities in these markets to deliver integrated solutions comprising Pace hardware and software.
Over the last two years Pace’s performance has been particularly strong in Latin America as we have been first to market with new products during digital conversion, such as HD boxes and PVRs, again demonstrating technological leadership in the sector. However, this has resulted in an unsustainably high market share in these territories which we expect to normalise in the next 12 – 24 months as competition in the market for the supply of these products increases.
EuropeThe market in Europe is characterised by high levels of HD and PVR penetration, addition of hybrid services and increasing levels of home networking.
Revenues in Europe declined by 19% to $458m in 2011, driven by a decline in the STB business as Pace ceased retail sales and exited from low margin business in Italy.
The well-developed Western European market is primarily focused on HD-conversion with over 90% of revenues relating to HD products. Furthermore, over 35% of European STB sales included a PVR functionality.
Residential gateways remain a small proportion of the overall European business with revenue of $29m. Software & Services revenue of $18m includes the Latens content protection systems, device software and maintenance services in support of STB sales. The Strategic Review identified significant opportunities among mid-tier operators in Europe for integrated solutions incorporating our software assets, and we are focused on developing opportunities in this segment of the market.
* Source: IHS Screen Digest, February 2012
Front end 2011 V10.indd 6-7 16/03/2012 11:25

Pace plc 2011 Annual Report | 0807 | Pace plc 2011 Annual Report
Chief ExecutiveOfficer’s Review continued
Our Strategic Review identified that significant value would be delivered through operational excellence and widening out our customer offering. In 2012 we will be focused on executing against these goals.
A consistent trend we are seeing is that customers in the more developed European markets are showing an increased interest in more complex products, for example those incorporating home networking and Customer Management Systems. This trend is directly aligned with the widening out objective identified in our Strategic Review and provides an opportunity for increased product margins and greater quality of earnings.
Rest of WorldRevenues in the Rest of the World increased by 13% to $318m, driven by growth in the STB business. Pace operates in a mixture of developed (notably Australia and New Zealand) and developing markets (including India and sub-Saharan Africa).
Growth in developed markets has been driven by moves towards more technologically advanced products reflecting similar trends as in Europe, with operators wanting products with increased functionality such as WiFi. Widening out our offering in these areas is key to the delivery of our Strategic Review.
In developing markets growth to date has been at the high end of the market with HD and PVR products comprising the majority of sales. We do see significant opportunities in these markets for further growth as the uptake of PayTV and digitisation continues and greenfield opportunities allow Pace to build its footprint with new customers.
In SummaryOur Strategic Review confirmed that Pace operates in large, profitable and growing markets. It also identified that significant value to shareholders would be delivered through increasing operational excellence and widening out the customer offering to leverage our software and services assets. 2012 will be the year in which our progress towards these goals is dependent on our ability to execute on these focuses.
Mike Pulli Chief Executive Officer
6 March 2012
Chief Financial
Officer’s Review
2011 proved a challenging year operationally for Pace, due to two natural disasters, Group inventory management issues and reduced profitability within Pace Europe. Despite this, $2,309.3m of revenue and $141.4m of adjusted EBITA were delivered.
The first natural disaster was the Japanese Tsunami in March which impacted the supply chain. Mitigating actions were taken and the situation is now resolved. The second was the severe flooding in Thailand in October, which impacted the supply of HDD. This affected revenue by $36.3m and profits by $8.9m in 2011 and is expected to be felt throughout 2012. Our revised estimate of the impact on 2012 operating profit is $25m-$35m of which the majority will fall in the first half.
The Group inventory management issues gave rise to excess inventory build-up in the first half of 2011 and actions to resolve this matter were implemented. Year-end inventory of $150m was low due to the HDD shortage and we anticipate normal levels of inventory at circa $180m in 2012.
Profitability issues identified within Pace Europe are being addressed and a reorganisation, as part of our Strategic Review, is underway. Annualised savings of circa $7m are targeted with an exceptional charge of $11.1m taken in 2011. Integration of the 2010 acquisitions was successful, with the targeted $30m annual synergies delivered both sooner and larger than originally anticipated.
With a broader product base, encompassing STBs, residential gateways and software & services, the Group is well positioned for 2012 and beyond.
CurrencyFollowing the full integration of the 2010 acquisitions into the Group, the business incurs and sources a significant majority of revenues and costs in US Dollars.
The strategic decision was made to reduce the foreign exchange risk within the business and change both the functional and presentational currency of the Group and Company to US Dollars from 1 January 2011. This decision allows the Financial Statements to be presented in the currency of the primary economic environment in which it operates. Comparative information has been re-stated in US Dollars to reflect this change.
Summary Financials Restated 2011 2010 $m $m
Revenue 2,309.3 2,062.9
Gross profit 443.3 395.1
Gross margin % 19.2% 19.2%
Administrative expenses before exceptional costs and amortisation 301.9 234.5
Adjusted EBITA1 141.4 160.6
Adjusted EBITA% 6.1% 7.8%
Exceptional costs (12.7) (29.5)
Amortisation of other intangibles (55.7) (18.1)
Net finance expense (18.3) (2.8)
Tax charge (15.9) (32.9)
Profit after tax 38.8 77.3
Adjusted basic earnings per share 29.7c 37.1c
Net debt2 (321.7) (311.1)
Working capital3 178.8 115.0
Free cashflow4 36.1 59.0
Each of the above measures are used within the business as Key Performance Indicators (KPIs)
Group Trading and ResultsRevenues of $2,309.3m (2010 restated: $2,062.9m) increased by 11.9% due to the full year effect of the 2010 acquisitions, which contributed $521.3m to revenue. Our organic business, saw a 7.1% decrease in revenues, of which 1.9ppt related to HDD supply shortages in Q4; 5.2ppt of the decline reflects ceasing retail sales and exiting low margin business in Europe. Adjusted EBITA of $141.4m (2010 restated: $160.6m) which, at 6.1% of sales revenue was down 1.7ppt on 2010.
Gross profit of $443.3m (2010 restated: $395.1m) was consistent as a percentage of revenue at 19.2% (2010: 19.2%). Gross margin in the organic business was down 2.3ppt from 2010 at 16.3%, impacted by the profitability issues disclosed in our May Interim Management Statement and the HDD impact in Q4. Gross margin in the acquired businesses improved 1.9ppt to 29.1% which was partly attributable to a non-recurring release of deferred revenue.
Overheads increased by $67.4m to $301.9m (2010 restated: $234.5m) driven by the full year effect of 2010 acquisitions at $92.4m; these were lower than the comparative full year charge in 2010 due to the operational synergies delivered ahead of plan in the first half. Overheads in the organic business at $209.4m were 0.7% lower year on year.
1 Adjusted EBITA is operating profit before exceptional costs and amortisation of other intangibles2 Net debt is borrowings net of cash and cash equivalents3 Working capital is inventories, trade and other receivables net of trade and other payables4 Free cash flow is set out in note 31 to the Financial Statements
Front end 2011 V10.indd 8-9 16/03/2012 11:25

Pace plc 2011 Annual Report | 1009 | Pace plc 2011 Annual Report
Amortisation of other intangibles, reflecting a full year charge of assets arising from acquisitions, increased to $55.7m (2010 restated: $18.1m). Net financing charges of $18.3m (2010 restated: $2.8m) reflects a full year charge from debt raised in 2010 to fund acquisitions. Tax was $15.9m (2010 restated: $32.9m) which gave an effective tax rate of 29.1% (2010: 29.9%).
Adjusted basic earnings per share was 29.7c (2010 restated: 37.1c) and basic earnings per share was 13.2c (2010 restated: 26.4c).
Exceptional costs of $12.7m arose from the programme to reorganise Pace Europe and the change in CEO.
Segmental AnalysisFollowing the integration of the 2010 acquisitions into the Group, coupled with a restructuring of the business, the Group now operates through Strategic Business Units (SBUs), which comprise Pace Americas, Pace Europe, Pace Enterprise and Pace India.
The SBUs, are deemed by the Board to represent operating segments under IFRS 8, with revenues and adjusted EBITA as follows:
Restated 2011 2010 $m $m
Revenue:
Pace Americas 1,350.6 1,120.6
Pace Europe 871.8 918.8
Pace Enterprise 54.0 21.0
Unallocated 32.9 2.5
Total Revenue 2,309.3 2,062.9
Adjusted EBITA:
Pace Americas 157.9 146.7
Pace Europe 68.3 85.7
Pace Enterprise (12.1) (7.4)
Unallocated (72.7) (64.4)
Total adjusted EBITA 141.4 160.6
Although not wholly consistent, revenues in North America belong primarily to the Americas SBU, revenues in Europe and Rest of World belong largely to the Europe SBU, revenues in Latin America belong to both the Americas and Europe SBUs and Pace Enterprise revenues are derived from North America, Europe and Rest of World.
Pace Americas’ revenue increased by 20.5% to $1,350.6m and includes the impact on the US business from the 2Wire acquisition which completed in October 2010. Pace Enterprise revenue increased by 157.1% to $54.0m and includes the non-US 2Wire business, Bewan, acquired in April 2010, and Latens, acquired in November 2010.
Pace Europe revenue decreased by 5.1% to $871.8m as a result of exiting low margin business. The reportable result for each of the SBUs is consistent with the impact on our organic business and acquisitions described throughout this report.
Unallocated revenues increased $30.4m to $32.9m of which the majority relates to Pace India and, due to immateriality, does not warrant separate disclosure. Unallocated adjusted EBITA includes the profit impact from such revenues, in addition to head office costs and other unallocated overheads.
Financial PositionBalance SheetGoodwill decreased by $2.8m from the previously stated Sterling equivalent at 31 December 2010 to $335.6m as adjustments were made to the provisional fair values of prior year acquisitions within the measurement period. Details of the adjustments made are shown within note 11 to the Financial Statements.
Intangible development expenditure assets increased by $9.3m primarily as a result of the capitalisation of project costs within the former 2Wire business.
Tangible fixed assets increased by $10.3m as the Group invested $41.5m in additions (2010 restated: $31.5m). The increase from the previous year was mainly due to planned non-recurring capital expenditure on existing and new facilities throughout the Group of $12.1m.
Provisions of $87.0m (2010 restated: $86.8m) include $10.5m in respect of the restructuring plan in France which was announced in November.
Liquidity and cash flowsWorking capital was $178.8m (2010 restated: $115.0m). The increase was due to the lower level of trade and other payables in 2011 compared to 2010, which was partly offset by reductions in both inventory and trade and other receivables.
Year end net debt was $321.7m (2010 restated: $311.8m). During the year two scheduled facility re-payment instalments were paid of $37.5m each at June and December 2011. The remaining facility continues to be repaid through payments of $37.5m every six months, with a final payment of $75m due in 2014.
The directors are confident that the Company will be strongly cash flow positive in 2012. Plans and processes are in place to achieve this end.
The Company’s committed bank facilities are more than sufficient to meet our short to medium term funding needs and visibility of our forward orders for 2012 is good.
Chief FinancialOfficer’s Review continued
The Board recommends a final dividend of 2.50c per ordinary share. The full year proposed dividend increases 11.3% to 3.75c per ordinary share.
Critical accounting policiesThe directors consider that the Group has the following critical accounting policies, as they require the use of estimates and are subjective in their nature.
• Revenuerecognition
• Impairment
• Taxation
• Provisions
• Intangibleassets
• Hedgeaccounting
Details of accounting policies and estimates can be found within the notes to the Financial Statements.
DividendIn line with the progressive dividend policy, the Board has recommended a final dividend of 2.50c per ordinary share (2010 restated: 2.25c). The full year proposed dividend increases 11.3% to 3.75c per share (2010 restated: 3.37c).
OutlookWe enter 2012 in a strong financial position which will allow us to manage the impact of HDD supply disruption and deliver on the opportunities identified in the Strategic Review.
Stuart Hall Chief Financial Officer
6 March 2012
Front end 2011 V10.indd 10-11 16/03/2012 11:25

Pace plc 2011 Annual Report | 1211 | Pace plc 2011 Annual Report
Report of
the Directors
Principal ActivitiesThe Group’s principal activities are the development, design and distribution of technologies and products for managed subscription television, telephony and broadband services and the provision of engineering design, and software applications to its STB and gateway customers. The Group also provides related support services including systems integration and customer care centres.
Business and Financial ResultsThe information that fulfils the requirements of the Business Review and Management Report, including a review of the Group’s activities, developments and the financial results for the year, and the key financial performance indicators relevant to the business of the Company (principally revenue, gross margin %, EBITA, profit before tax, return on sales and net debt), can be found in the Chief Executive Officer’s Review and the Chief Financial Officer’s Review on pages 5 to 10. The aforementioned information is incorporated in this report by reference. There is no information which falls to be disclosed pursuant to s. 417 (5) of the Companies Act 2006, other than as noted in the risks and uncertainties section below.
Risks and UncertaintiesThe following are the key risks and uncertainties relevant to the business of the Group:
Customers and Markets
Orders placed by the Group’s PayTV and telecoms customers are typically large one-off orders for delivery over a number of months with supplemental orders for additional volumes. As the eventual deployment of the STBs or gateways can be unpredictable, revenues can be volatile. The difficulty in predicting the Group’s business flow and its risks can be exacerbated by a number of other factors including, for example, the development process for an advanced STB, which can take over 12 months. The Group works on long lead times (e.g. 4 months or more) for component supply and manufacture, typical of the industry. In the US market, in particular, customers’ firm order lead times may be less than the component lead times. There are third party delivery risks, for example, difficulties in the delivery of components or software code, and the final order for manufacture and firm contractual commitment is usually dependent on product approvals and acceptance both from the operator and sometimes from third parties. The Group is also exposed to the industry wide inherent risk of supply chain failure. The Group has put in place procedures to monitor the financial and operating strength of key suppliers. In addition, it utilises dual or multi source suppliers where appropriate to mitigate this risk.
Product Liability Claims
In common with many companies in the industry, the Group is exposed to the risk of product liability claims made by customers or affected third parties, should the Group’s products not fulfil the terms of the contracts under which they are sold. The Group has in place quality control and other operational procedures to mitigate this risk.
Credit Risk
The finance function of the Group obtains reports from third party sources in respect of the credit worthiness of key customers and suppliers and sets individual credit limits as appropriate. A credit insurance policy is maintained, which provides cover over certain debtors where it is economically viable, subject to excesses, and the exposure to credit risk is monitored on an ongoing basis. Deposit investments are generally undertaken only in liquid securities and with counterparties that have appropriate credit ratings.
Royalties
The Group’s products incorporate third party technology, usually under licence. Inadvertent actions may expose the Group to the risk of infringing third party intellectual property rights. Potential claims can be submitted many years after a product has been deployed.
Regulatory
The Group is subject to a broad range of laws, regulations and standards and remains exposed to changes in the regulatory environment, including potential modifications to import duty regimes, and legislation relevant to the Group’s products and services. It is Pace’s policy to require that all its subsidiaries comply with applicable laws, regulations and standards.
Currency Risks
The standard ‘industry currency’ is the US Dollar, with the majority of components and manufacturing capacity purchased in this currency. However, due to part of the Group’s revenues being in Sterling and Euros, the Group is exposed to the risk of foreign currency movements. To manage this risk, the Group’s treasury policy is progressively to cover cash flows when these are sufficiently certain and to seek price variations through contractual mechanisms where significant currency movements occur.
Financial ResultsThe consolidated income statement for the year is set out on page 35. The profit before tax was $54.7m (2010 restated: $110.2m) and the profit before tax, interest, exceptional items and amortisation of other intangibles was $141.4m (2010 restated: $160.6m).
Foreign CurrencyDuring the year the Board determined to change the Company’s functional and Group’s presentational currency to US Dollars (USD) given that the significant majority of revenues and costs are generated and incurred in USD.
DividendThe directors recommend the payment of a final dividend of 2.50c per ordinary share (2010 restated: 2.25c) to be paid on 4 July 2012 to shareholders on the register at the close of business on 8 June 2012. An interim dividend of 1.25c per ordinary share was paid during the year (2010 restated: 1.12c).
Dividends will be paid in sterling equivalent to 1.575 pence per ordinary share. This is based on an exchange rate of £ = $1.587, being the rate applicable on 5 March 2012.
Share CapitalDetails of the Company’s share capital including changes for the year and the rights attaching to the ordinary shares are contained in Note 21, and are incorporated in this report by reference.
Significant Shareholdings The Company has been notified of the following significant shareholdings as at 5 March 2012.
Number % of issued of shares share capital
Prudential plc Group of Companies 45,433,616 14.89 Capital Research and Management Company 19,553,500 6.41David Hood and related family trusts 16,117,539 5.20 Norges Bank 15,398,465 5.05Black Rock Inc 15,142,824 4.96 Gartmore Investment Management 14,931,083 4.89Multiflight Ltd* 10,000,000 3.28Legal & General Group plc 9,960,795 3.27 Pace plc Employee Benefits Trust 9,744,470 3.19
* Owned and controlled by David Hood
The directors present their report to shareholders on pages 11 to 21 together with the audited Financial Statements for the year ended 31 December 2011 (year) (prior financial period, year ended 31 December 2010).
Front end 2011 V10.indd 12-13 16/03/2012 11:25

Pace plc 2011 Annual Report | 1413 | Pace plc 2011 Annual Report
During the year Mike McTighe (retired 21 June 2011), Neil Gaydon (retired 14 December 2011) and David McKinney (retired 6 January 2012) also held office as directors.
Pat Chapman-Pincher, John Grant and Mike Inglis will retire at the forthcoming Annual General Meeting of the Company and offer themselves for re-election. The Board has determined that all of these directors continue to make a very effective contribution to the Board and demonstrate a high level of commitment. Allan Leighton, Mike Pulli and Roddy Murray, having been appointed by the Board subsequent to the last Annual General Meeting will hold office until the forthcoming Annual General Meeting and will then offer themselves for election at that meeting. Details of the executive directors’ service contracts and the non-executive directors’ letters of appointment are disclosed in the Remuneration Report on page 25.
Payment to SuppliersIt is the policy of the Group to agree terms and conditions for its business transactions with suppliers, which are varied from time to time. Payment is made in accordance with those terms, subject to the other terms and conditions being met by the supplier. The Group does not follow any code or standard on payment practice. Creditor days at the end of the period for the Group were 73 days (31 December 2010: 69 days).
Research and DevelopmentThe directors regard it as fundamental to the future success of the Group to engage in a substantial ongoing programme of research and development of new products, spending $169.7m in the year (2010 restated: $124.9m) and charging $160.6m (2010 restated: $120.0m) to the income statement during the year following the treatment under IAS38.
DonationsDuring the period the Group donated $150,746 (2010 restated: $84,246) to charitable causes. No political donations were made. Further details of the charitable and community-related activities of the Group are given on page 19.
Corporate GovernanceAs referred to on page 24 the Company granted an Appointment Share Award to Allan Leighton on his appointment as Non-executive Chairman. Save in respect of this Appointment Share Award, the directors believe that the Company has complied throughout the period with the UK Corporate Governance Code, as revised and adopted by the Financial Reporting Council. The Board confirms that it has established the necessary procedures designed to maintain a sound system of internal control and that there is an ongoing process for identifying, evaluating and managing the significant risks faced by the Company.
Board of DirectorsThe Group is controlled through the Board of Directors, which comprises two executive and four non-executive directors who bring a wide range of skills and experience to the Board. Biographical details of all directors are to be found on page 13. The Chairman, Allan Leighton, is mainly responsible for the running of the Board ensuring, together with the Company Secretary, that it receives timely and clear information appropriate to enable it to discharge its duties. The responsibilities of the Chief Executive Officer, Mike Pulli, are to focus on running the Group’s business and implementing Group strategy. The Chief Executive Officer is assisted in managing the business on a day-to-day basis by the Executive Committee as further described below. All the non-executive directors (other than the Chairman) are deemed by the Board to be independent and the Chairman was independent on his appointment, as required by the UK Corporate Governance Code. In addition, the Board has designated Pat Chapman-Pincher as the Senior Independent Director. All directors have access to the advice and services of the Company Secretary and are able to take independent professional advice at the Company’s expense in the furtherance of their duties, if necessary. All directors, have submitted themselves for re-election at least once every three years and commencing this year, each of them will submit themselves for re-election on an annual basis. New directors receive a programme of tailored induction on joining the Board and all directors are offered the opportunity to continually update their skills and knowledge by attending external training events. The Company has in place procedures to deal with directors’ conflicts of interest and the Board is satisfied that these procedures operate effectively.
DirectorsThe names of the current directors of the Company are shown below. Other than as described below in respect of Allan Leighton, Roddy Murray and Mike Pulli, all those listed held office throughout the year.
Allan Leighton
Allan was appointed a Non-executive Director in May 2011 and became Chairman on 21 June 2011. He is currently Chairman of Pandora A/S, Office Retail Group Limited and Music Magpie.co.uk. Previously he has held a wide range of public and private company roles including CEO at ASDA, Chairman of Royal Mail and Lastminute.com, and Non-executive Director of British Sky Broadcasting plc, Dyson Applications and Scottish Power plc. He is patron of Breast Cancer Care and has an honorary degree from Cranfield University and an Honorary Fellowship at the University of Lancaster.
Mike PulliMike was appointed Chief Executive Officer on 14 December 2011, after nearly eight years as President of Pace Americas. In his role as CEO, Mike is responsible for leading Pace’s global strategy. As President of Pace Americas, Mike was responsible for the company’s businesses in the USA, Canada and Latin America (LatAm). Prior to joining Pace in 2004, Mike was CEO of broadcasting company Digital Latin America (DLA). Previously Mike spent eight years at Motorola in various senior management positions, including Vice President of International Operations, and served in a variety of financial positions at Allied-Signal, Inc. Mike holds a Bachelor’s degree in Accounting from Rider University and an MBA from Farleigh Dickinson University.
Roddy Murray
Roddy was appointed an Executive Director on 25 February 2012 and becomes Chief Financial Officer today, 6 March 2012, in place of Stuart Hall. Roddy was previously CFO of The BSS Group Plc and CFO of Moss Bros Group Plc. Prior to that he held a number of financial roles in MacKays Stores, United Distillers and British Airways. He qualified as a Chartered Accountant at the Scottish Institute before joining Price Waterhouse. He holds a Bachelor’s degree in Administration from Dundee University.
Pat Chapman-Pincher
Pat was appointed a Non-executive Director in February 2005 and became Senior Independent Director in May 2006. She has over 30 years’ experience in the communications industry from senior roles in multinational Internet and telecoms companies to participating in technology company start-ups. A founding partner and Chairman of the Cavell Group, which specialises in operational consultancy IP and wireless technologies, she is a Board Advisor to the British Standards Institute and a member of the Advisory Board of Bradford School of Management.
John Grant
John was appointed a Non-executive Director in August 2008. John spent his executive career in a variety of senior international roles within the automotive industry and other engineering businesses. He was Chief Executive of Ascot plc between 1997 and 2000. Prior to that, he was Group Finance Director of Lucas Industries plc (subsequently Lucas Varity plc) between 1992 and 1996. He previously held a number of senior positions within Ford Motor Company in Europe and the USA. John is a Non-executive Director of Melrose plc, MHP S.A. and Wolfson Microelectronics plc.
Stuart Hall
Stuart was appointed Chief Financial Officer and joined the Board in April 2007. Before joining the Company he was Group Finance Director of IQE plc and prior to that Finance Director of Energis Squared Limited and Director of Performance Management for Energis Group plc. He has also been Finance Director at WBF Ltd, part of the Adare Printing Group plc, Carnography plc and Race Electronics. He qualified as a Chartered Accountant with BDO Binder Hamlyn. Stuart Hall ceases to hold office as a director and Chief Financial Officer on 6 March 2012.
Mike Inglis
Mike was appointed a Non-executive Director in July 2008. He is currently Executive Vice President and General Manager of the Processor Division of ARM Holdings having previously been EVP, Sales and Marketing. Before joining ARM, he worked in management consultancy with A.T. Kearney and held a number of senior operational and marketing positions at Motorola. He previously worked in semiconductor sales, marketing, design and consultancy with Texas Instruments, Fairchild and BIS Macintosh and gained his initial industrial experience with GEC Telecommunications. He is a Chartered Engineer and a Member of the Chartered Institute of Marketing.
Report ofthe Directors continued
Front end 2011 V10.indd 14-15 16/03/2012 11:25

Pace plc 2011 Annual Report | 1615 | Pace plc 2011 Annual Report
The Board has a formal schedule of matters specifically reserved to it and normally meets at least eight times each year. It is responsible for overall Group strategy, acquisition and divestment policy, approval of major capital expenditure projects and consideration of significant financing matters. It reviews the strategic direction of the Group and conducts formal strategy reviews together with other senior executives within the Group at least once a year. The Chairman holds meetings with the non-executive directors without the executive directors being present at least twice during the year. It is the policy of the Board to undertake a formal review and evaluation of its performance including the performance of its committees, the Chairman and individual directors on an annual basis. This is generally concluded by written feedback in standardised form from each director to the Chairman or the Senior Independent Director in the case of appraisal of the Chairman. The Board will consider appointing an independent facilitator for the evaluation process at least once every three years and last did so in 2009 with the review concluding in 2010.
Board CommitteesThe Board has established the following committees, each of which has written terms of reference specifying its authority and duties and copies of which are publicly available on the Company’s website: www.pace.com.
The Audit & Risk Committee is comprised of independent designated non-executive directors, Pat Chapman-Pincher, Mike Inglis and John Grant, who is the Chairman of the Committee. John Grant was previously Group Finance Director of a listed business and is considered by the Board to have the necessary recent and relevant financial experience for his role as Chairman. Details of the role and of the primary responsibilities of the Audit & Risk Committee are explained on page 16.
The Executive Committee is chaired by Mike Pulli as Chief Executive Officer. The Committee generally meets once a month and ensures that the strategy, plans and policies previously agreed or delegated by the Board are implemented.
The Executive Committee comprises the executive directors together with the following senior executives:
Anthony Dixon General Counsel
Jill Ezard Director of Human Resources
Mark Loughran President, Pace Europe and Pace Enterprise
Tim O’Loughlin President, Pace Americas
Scott Sheldon Chief Strategy Officer
The Remuneration Committee is comprised of Allan Leighton and independent designated non-executive directors John Grant and Pat Chapman-Pincher, who is the Chairman of the Committee. The Committee is responsible for setting the remuneration of the executive directors and other members of the Executive Committee including making recommendations regarding the grant of share incentive awards. The members of the Committee have no personal interest, other than as shareholders, in the matters to be decided, no potential conflicts of interest arising from cross-directorships and no day-to-day involvement in the running of the business.
The Nominations Committee is comprised of non-executive directors Pat Chapman-Pincher, John Grant, Mike Inglis and is chaired by Allan Leighton. Its principal purpose is to consider and make recommendations to the Board regarding the appointment of new directors. The Nominations Committee meets at least once a year or as required. External search consultants were appointed by the Committee in connection with the appointment of Allan Leighton and Roddy Murray.
Board and Committee Meetings Attendance
Board Audit & Risk Remuneration Nominations Committee Committee Committee
Total Meetings 12 3 2 1 Allan Leighton** 7 - 1 1David McKinney 12 - - -John Grant 12 3 2 1Mike Inglis 11 2 2 1Mike McTighe 6 - 1 -Mike Pulli* - - - -Neil Gaydon 11 - - -Pat Chapman-Pincher 12 3 2 1 Stuart Hall 12 - - -
* There were no meetings held after Mike Pulli’s appointment on 14 December 2011** Appointed 31 May and attended all meetings since appointment
Directors’ RemunerationThe Remuneration Committee reviews the performance of the executive directors and other members of the Executive Committee as a prelude to recommending their annual remuneration, bonus awards and award of share options to the Board. The final determinations are made by the Board as a whole but no director plays a part in any discussions concerning their own remuneration. There are no agreements between the Company and its directors or employees providing for compensation for loss of office or employment (whether through resignation, purported redundancy or otherwise) that occurs as a result of a takeover bid.
The Remuneration Report of the Directors to shareholders is set out on pages 22 to 30 and includes the remuneration policy of the Company and details of directors’ incentive payments and the related performance criteria.
Authority to Purchase Own SharesAt the Annual General Meeting in 2011 the Company was authorised by shareholders to purchase up to 45,681,000 of its own ordinary shares, representing 15 per cent of its issued share capital as at March 2011. The Company did not utilise this authority during the year. The authority for the Company to purchase its own shares expires at the conclusion of the Annual General Meeting in 2012 and a resolution to renew it will be proposed at that meeting.
Accountability and AuditA detailed review of the performance of the Group’s business is contained in the Chief Executive Officer’s Review and the Chief Financial Officer’s Review. These statements, together with the Letter from the Chairman and the Report of the Directors, are intended to present a balanced assessment of the Group’s position and prospects. The directors’ responsibility for the financial statements is described on page 31 and the responsibilities of the auditors are described on page 32.
Audit & Risk CommitteeDuring the year the Committee undertook the annual review of its terms of reference. The review focused primarily on extending the Committee’s role in relation to assurance and oversight of risk management within the Group. Following this review the Committee was re-named the Audit & Risk Committee to emphasise its strengthened role in relation to risk.
The Audit & Risk Committee is responsible for:
• MonitoringtheintegrityofthefinancialstatementsoftheCompanyandformalannouncementsrelatingtothe Company’s financial performance and reviewing any significant financial reporting judgements contained therein;
• ReviewingtheCompany’sinternalfinancialandoperationalcontrolandriskmanagementsystems;
• MonitoringtheeffectivenessoftheCompany’sinternalauditfunctionandreviewingitsmaterialfindings;
• Reviewingaccountingpolicies,accountingtreatmentsanddisclosuresinthefinancialstatementstoensureclarity and completeness;
• OverseeingtheCompany’srelationshipwithitsexternalauditors,includingmakingrecommendationsastotheappointment or re-appointment of the external auditors, reviewing their terms of engagement and monitoring their independence and ensuring that policy surrounding their engagement to provide non-audit services is appropriately applied; and
• ReviewingtheeffectivenessoftheCompany’swhistleblowingprocedures.
Internal AuditThe Company’s Head of Risk Assurance, Damien Wilkinson, who has direct access to the Audit & Risk Committee primarily through the Chairman of the Committee, manages an internal audit function provided by external qualified auditing professionals.
The Audit & Risk Committee reviews annually the arrangements for internal audit and during the year the Committee re-appointed BDO LLP (BDO) to act as internal auditors, performing an agreed programme of internal audits in collaboration with the Company’s Head of Risk Assurance and management. BDO attended and presented their reports to each of the Audit & Risk Committee meetings during the year.
Report ofthe Directors continued
Front end 2011 V10.indd 16-17 16/03/2012 11:25

Pace plc 2011 Annual Report | 1817 | Pace plc 2011 Annual Report
The Committee has, amongst other things, considered the quality of reporting to the Committee and impartiality of the internal auditors, and has concluded that the effectiveness of Internal Audit during the year was satisfactory.
External AuditThe Audit & Risk Committee has satisfied itself that the external auditor, KPMG Audit Plc (KPMG) acted independent of the Group. Previous appointments of KPMG and the extent of other work undertaken by it were considered inter-alia in this regard.
It is the Audit & Risk Committee’s opinion that there were no limitations imposed by management on KPMG whilst performing their duties during the review period.
The Audit & Risk Committee, in consultation with the Group’s executive management, agreed to the terms of the KPMG engagement letter, audit plan and budgeted audit fees for the 2011 financial year.
A formal framework governs the process through which the Group’s auditor is considered to render non-audit services. The Audit & Risk Committee has approved a policy in relation to the provision of non-audit services by the external auditor and the nature and extent of non-audit services that the external auditor could provide within the scope of the policy during the financial year.
It was the Audit & Risk Committee’s recommendation that KPMG defer the rotation of engagement partner by one year in order to ensure that the acquisition and integration work in respect of previous year acquisitions was appropriately seen through to completion. The Audit & Risk Committee note the involvement of an additional partner in the 2011 audit and confirms its opinion that this constituted both a benefit to audit quality and an appropriate safeguard against the perceived independence risk which could have arisen from the engagement partner, Chris Hearld, signing a sixth audit opinion.
Internal ControlsOverall responsibility for the Group’s system of internal control rests with the Board. The Board has delegated certain of its powers to the Audit & Risk Committee to review the effectiveness of the systems of control and to receive reports from the auditors (internal and external) and from the management relating to the interim and annual accounts and the control systems in use throughout the Group.
During the year and up to the date of this report, the Board carried out reviews of the effectiveness of the Group’s internal controls. The reviews were undertaken in accordance with the Financial Reporting Council’s guidance under the following headings and were aimed at clearly identifying the systems already in place and the action plans necessary to improve areas of control weakness.
The Control EnvironmentSubject to those powers and limits of authority reserved by the Board, and to the Group policies and guidelines they have established, the conduct of the business of the Group is delegated within a clearly defined organisational structure and approved level of authority. The Board has also adopted a Code of Business Ethics, which has been incorporated into the Employee Handbook issued to all employees.
Risk AssessmentThe directors and senior managers are responsible for identifying and monitoring sources of potential business risk and financial risk, and for taking such preventative and protective actions as they consider necessary to manage such risks effectively. During the year a risk assessment review of the Group’s business has been conducted by the Head of Risk Assurance and BDO acting as internal auditors in conjunction with members of the Executive Committee. The Board has received and considered this review as part of an annual risk and control assessment.
The Group’s systems are designed to identify and manage, rather than eliminate, significant business risks, including the risk of failure to achieve business objectives but can provide only reasonable not absolute assurance against material misstatement or loss. Business risks are identified, evaluated and managed through functional line management reporting to divisional meetings, Executive Committee meetings and Board meetings as appropriate. Each member of the Executive Committee is required to highlight and report on any significant business risks identified within their sphere of responsibility.
The key business risks associated with the timely completion of long-term development projects and ongoing business risks, including alleged infringement of third party intellectual property rights and supply chain interruption, are managed by cross-functional teams of senior employees. Business continuity plans addressing physical risks to the Group’s development sites and maintenance of IT services are maintained. The Group has adopted Customer Account Teams (CATs) grouped within SBUs so as to focus the business on customer needs. The senior managers within the CATs also monitor the financial and business risks, including competitor risks, associated with the delivery of agreed plans, reviewing such matters at Business Review Meetings held on a regular basis and attended by members of the Executive Committee. During the year particular focus of these risk management systems was required in respect of the consequences of the Japanese Tsunami and floods in Thailand.
Financial Control and Information SystemsThe Group’s strategic direction is reviewed regularly by the Board and plans, budgets and performance targets are reviewed and approved at least annually. Directors receive monthly summaries of financial results which compare actual performance with targets, together with detailed management reports that identify the reasons for variances and the progress achieved. Business planning documents are revised on a regular basis in line with actual and expected performance. A review of the consolidated financial statements is completed by the centralised Group Finance Function to ensure that the financial position and results of the Group are appropriately reflected in the consolidated accounts.
Control ProceduresFinancial control procedures have been developed for all of the main business functions and in relation to the Company’s financial reporting process and the Group’s process for the preparation of consolidated accounts, and have been documented in a procedures manual. Authorisation limits for purchases and capital expenditure are specified and procedures are in place for minimising exposure to potential weaknesses in the receipt, handling and despatch of goods. The Group’s main premises have received accreditation for BSI ISO 9001: 2000.
Monitoring SystemsMonitoring of the internal control systems is carried out by Head of Risk Assurance in conjunction with the internal auditors, BDO.
Although no system of internal financial control can provide absolute assurance against material misstatement or loss, the Group’s systems are designed to provide the directors with reasonable assurance that transactions are authorised and completely and accurately recorded, that assets are safeguarded and that material errors, irregularities and actions contrary to Group policies and directions are either prevented or promptly discovered.
Going ConcernThe Group has borrowing facilities in place until March 2014. At 31 December 2011 these are in the form of a $225m term loan which is subject to repayment through instalments of $37.5m each due every six months, plus a final bullet payment of $75m, and a $150m revolver credit facility. These facilities are subject to financial performance covenants which the Group currently complies with.
The Board’s assessment of the Group and Company’s ability to continue as a going concern has taken into account the effect of the current economic climate, current market position and the level of borrowings in the year. The principal risks that the Group is challenged with have been set out in the Risks and Uncertainties section of this report along with how the directors intend to mitigate those risks.
The Board has prepared a financial and working capital forecast upon trading assumptions and other medium term plans and has concluded that the Group will continue to meet its financial performance covenants and will have adequate working capital available to continue in operational existence for the foreseeable future.
Corporate Social Responsibility
Employment PoliciesThe directors recognise the importance of the Group’s employees to its success and future development and are committed to providing an environment that will attract, motivate and reward high quality employees. The Group continues to invest in a range of internal and external initiatives to promote employee development.
Report ofthe Directors continued
Front end 2011 V10.indd 18-19 16/03/2012 11:25

Employees are kept informed of matters affecting them as employees and factors affecting the performance of the Group through regular employee meetings/briefings and a Company newsletter.
The Group welcomes applications for employment from all sectors of the community and promotes equality of opportunity in employment regardless of age, sex, sexual orientation, disability or ethnic origin. It is the Group’s policy that training, career development and promotion opportunities should be available to all employees. In the event that an employee becomes disabled, the Group makes reasonable adjustments where any aspect of premises or working practices puts such a disabled employee at a substantial disadvantage compared with a non-disabled employee.
Health and SafetyEach SBU in the Group has an established Health and Safety Committee made up of health and safety representatives, the designated health and safety officer and other persons with expert knowledge who review health and safety issues relevant to the Group’s business. Other safety-related committees also conduct periodic reviews of specific work practices. These actions complement the UK Government’s “Health, Work, Wellbeing” (HWW) initiative which has been adopted and implemented by the Company.
Part of the HWW incorporates return to work programmes and the Group’s operations in Saltaire and Americas West and Americas East have adopted similar policies. Each division incorporates, where appropriate, their ergonomic risk assessments. The Group’s businesses in India, the UK, Americas West and Americas East provide training for First Aid, Fire Evacuation and Fire Wardens. Americas West undertakes earthquake training and Americas East undertakes hurricane training. All of these initiatives are backed up by appropriate risk assessments. “Tool-box talks”, short presentations on specific aspects of health and safety, are also published on the Group’s intranet and shared between different parts of the Group.
The number of workplace accidents during the year for Saltaire was 4. Outside the UK, there were 14 accidents in the Americas West and Americas East operations and none in India. None of these accidents was regarded by the relevant local Health and Safety Committee as serious. A report concerning health and safety aspects of the Group’s business and copies of specific Group safety policy documents can be obtained from the Company Secretary.
Charitable and Community SupportThe Group has an established Charitable Donations Committee comprising employees based at the Group’s premises in the UK and the USA. The committee, considers all requests for charitable and community project assistance from employees and external charities within a financial budget and criteria approved by the Board on an annual basis.
The Group’s support through the committee is focused on the local geographical area of Pace’s premises in the UK, France, India and the USA as well as the charitable and community initiatives of Group employees. The corporate charity policy focus is to support local charities of benefit to the local area and people living close to each Group site.
During the year, a number of requests for support were considered by the committee, of which 107 satisfied the criteria and received financial support amounting to $106,675 in total. The participation of employees of the Group in community and charitable activities outside work hours has been encouraged by the provision of funds to match individual sponsorship raised. Donations amounting to $44,071 were made to local charitable causes pursuant to the CEO’s discretion or prior Board approval.
Pace has continued as lead sponsor of the Leeds Ahead education strand of business engagement in the UK’s West Yorkshire region following its acceptance of this role for a two year period in 2010. This has enabled Leeds Ahead to develop and roll-out their Make the Grade business education partnership model in the West Yorkshire region.
In addition, Pace has partnered with Teach First to support the Science, Technology, Engineering and Maths (STEM) teachers in Yorkshire and the Humber. Pace will fund the provision of personal development coaches to Teach First participants in their second year of teaching. Teach First recruits, trains and supports teachers working in schools in low income communities to raise the achievement, aspirations and access to opportunity of children from low socio-economic backgrounds.
Supply ChainPace is a member of the Electronic Industry Citizen Coalition (EICC) and applies to the EICC Code of Conduct in its business. A programme of assessment and auditing is maintained at the regular business review meetings held with the Group’s principal suppliers. During the year, two members of the Pace Quality Team undertook training and were certified as EICC-GeSI Labour and Ethics Lead Auditors.
AccreditationPace is a member of Business in the Community (BITC), which operates in the UK and internationally through a network of partners world-wide. Membership allows Pace to further develop and promote responsibility in business through access to the expertise and experience of the BITC team and their membership base.
In the second half of the year, the Company participated in the BITC CR Index. The BITC CR Index is an internationally recognised index of how effectively businesses identify, address and integrates the management of their environmental and social impacts. Participation provides the Group with a benchmark and gap analysis with best practice. We are pleased to report that we achieved a Silver ranking for our CSR programme.
Environmental ManagementDuring the year the Company set environmental targets and achieved the following outcomes in respect of its chosen measures of environmental impact:
Start Date End date Objective Target Status
2011 Dec -11 Drive a reduction in the overall environmental emissions associated with Pace's site operations
Achieve a 5% reduction in overall CO2 Intensity (Scope 1, 2 and 3) by 2011 - Scope 3 emissions as defined in 2010
Not Achieved
2011 Dec -11 Drive innovation on the reduction of the environmental impact of Pace products
Seek to reduce average STB CO2 emissions by 5%
Target Achieved Total Reduction 8.8%
Seek to ensure that 90% of the hardware design of Pace STBs will comply with or exceed the EU Code of Conduct, Energy Star and MEPS guidelines as appropriate
Target Achieved 100% H/w designs comply
All STBs designed in 2011 to exceed a score of 80% during Pace’s design for Environment(DFE) programme
Target Achieved Average Score: 86%
2011 Dec -12 Drive a reduction in the environmental impact of Pace’s STB manufacture
Measure the CO2 emission associated with the production of STBs (Pace Scope 3 Manufacturing partners emissions)
On Target
2011 Dec -11 Commitment to Offset Investigate and develop an offsetting strategy appropriate to Pace
Complete and not being progressed
2011 Dec -12 Align recent acquisitions with Pace’s environmental principles and direction
Increase Pace’s 14001 footprint to include Pace Americas West and Brazil by 2012
On Target
The Company has maintained certification to the international management standard ISO 14001 at its Saltaire, Florida, Bangalore and Paris sites and for the first time achieved certification at the Tempe and San Antonio sites. The Group Environmental Policy has been applied to all Pace sites worldwide.
The Company is a signatory to the European Code of Conduct on Energy Efficiency of Digital TV Service Systems (EU Code of Conduct), ENERGY STAR Program Requirements for STBs and MEPS (Minimum Energy Performance Standard). Pace is committed to ensure that all products are designed to minimise energy consumption through its ‘Design for Environment’ programme.
* This year we have included information and data from our manufacturing facility in Manaus (Brazil) and the three facilities of Pace West located in San Jose, San Antonio and Tempe (formerly 2Wire, the US-based business we acquired in 2010. This has had the effect of
increasing our absolute and normalised carbon emissions.
Pace plc 2011 Annual Report | 2019 | Pace plc 2011 Annual Report
Report ofthe Directors continued
Front end 2011 V10.indd 20-21 16/03/2012 11:25

Pace plc 2011 Annual Report | 2221 | Pace plc 2011 Annual Report
AuditorsKPMG held office as auditors during the year. The Audit Committee reviews the independence and objectivity of the auditors, considering whether, taken as a whole, the various relationships (if any) between the Group and the auditors impair, or appear to impair, the auditors’ judgement or independence. The Committee was satisfied throughout the year that the objectivity and independence of KPMG was not in any way impaired by either the nature of the non-audit related services undertaken during the year, the level of the non-audit fees charged or any other fact or circumstances.
Having considered the results of the Committee’s work, the Board is recommending the re-appointment of KPMG as auditors. A resolution for the re-appointment of KPMG will be proposed at the forthcoming Annual General Meeting.
Each of the directors who held office at the date of approval of this Report of the Directors confirms that, so far as they are aware, there is no relevant audit information of which the Company’s auditors are unaware; and the directors have each taken all the steps that they ought to have taken as a director to make themselves aware of any relevant audit information and to establish that the Company’s auditors are aware of that information.
Relations with ShareholdersThe Board has continued to establish and maintain relationships with institutional shareholders and communicates with investors through the Group’s web site (www.pace.com). A programme of meetings with institutional shareholders is in place (at which institutional shareholders are offered the opportunity to meet with non-executive directors) and analyst presentations are made following announcement of the interim and annual results. Shareholders are welcome to participate at the Annual General Meeting at which the Board will be available for questions.
Annual General MeetingThe Annual General Meeting of the Company will be held on 16 April 2012 at the offices of the Company at Salts Mill, Victoria Road, Saltaire, West Yorkshire, BD18 3LF. Full details of the business to be transacted at the meeting will be set out in the Notice of Annual General Meeting.
Responsibility Statement of the DirectorsA statement of the responsibilities of the directors is contained on page 31. The directors whose names appear on page 13 confirm that to the best of their knowledge:
• thefinancialstatements,preparedinaccordancewiththeapplicablesetofaccountingstandards,giveatrueand fair view of the assets, liabilities, financial position and profit or loss of the Company and the undertakings included in the consolidation taken as a whole; and
• theReportoftheDirectorsincludesafairreviewofthedevelopmentandperformanceofthebusinessandtheposition of the Company and the undertakings included in the consolidation taken as a whole, together with the description of the principal risks and uncertainties that they face.
By order of the Board
Anthony J Dixon Company Secretary
6 March 2012
The directors present their report to shareholders on pages 22 to 30 regarding remuneration matters in respect of the year ended 31 December 2011.
Remuneration CommitteeThe Remuneration Committee (the Committee) is responsible for setting the individual remuneration of the executive directors and other members of the Executive Committee within the framework of the remuneration policy described below, which is set by the Board.
The directors who were members of the Committee during the year were Pat Chapman-Pincher (Chairman of the Committee), Allan Leighton (from June 2011), Mike McTighe (until resignation) and John Grant. For guidance, the Committee makes use of surveys of executive pay and knowledge of market rates. The CEO and Director of HR also attended Remuneration Committee meetings during the year by invitation and provided advice to the Committee to enable it to reach informed decisions. No director was present when their remuneration was being discussed. The Committee was assisted in its consideration of remuneration matters by Kepler Associates who were appointed by the Committee. Kepler Associates provided no other services to the Group in the year. Pinsent Masons, legal advisers to the Company, also advised the Committee regarding certain equity incentive related issues.
Remuneration PolicyThe Board believes that it is necessary to ensure that the remuneration packages of the executive directors remain competitive in order to attract, retain and motivate executive directors and senior managers of a high calibre and to reward them for performance. The policy is for a significant proportion of executive directors’ total remuneration to be capable of being earned from variable, performance-based incentives, through annual bonuses and share based incentives. The objective of this policy is to provide rewards and incentives that reflect corporate and individual performance and align management’s objectives directly with those of the shareholders. More than half of an executive director’s remuneration is variable and is linked to corporate performance.
The Board’s policy in relation to non-executive directors continues to be to pay fees that are competitive with the fees paid by comparable quoted companies. Non-executive directors’ fees are determined by the Board as a whole within the limits set out in the Company’s Articles of Association. Non-executive directors are not eligible for performance bonuses or pension contributions and do not participate in the equity incentive plans, save in respect of Allan Leighton’s Appointment Share Award which was a one-off exception to the policy. Non-executive remuneration is reviewed annually.
SalaryBasic salary for each executive director is determined by the Committee, taking into account the performance of the individual and information from independent sources on external market salary levels for comparable jobs with a view to salaries being set around the median to upper quartile level for comparable companies. In setting senior executives’ salaries, the Committee also takes into account pay and employment conditions in the Group as a whole. Salary is generally reviewed at the commencement of each financial year. As a result of the review in January 2012, there were no increases in salaries of the executive directors for 2012 in line with Group salaries. The salary of Mike Pulli was fixed at $750,000 per annum upon his appointment as CEO in December 2011, and the salary of Roddy Murray was fixed at $503,750 upon his appointment in February 2012.
Performance BonusThe Company established a non-pensionable performance-related bonus plan for the executive directors and other key members of management for the year, which was based on the successful achievement of corporate and individual objectives. The corporate objectives were linked to the key drivers of value creation for shareholders and the key measure therefore was the profitability of the Group for the full financial year. Achievement of the 2011 bonus was dependent on the Group’s pre-tax profits (before certain exceptional items) exceeding $176m with the capacity to earn additional bonus increments upon achievement of higher profit targets up to a ceiling of $196m. In addition, a number of individual personal objectives were set for each director and manager, which were aligned with the objectives of the Group for the year. The maximum bonus achievable by the executive directors in the event that all corporate and individual targets were met was 150% of basic annual salary with one third of any bonus outcome achieved being deferred into shares in the Company for a period of two years under the Group Deferred Share Bonus Plan. The Committee retained a discretion to reduce the bonus otherwise payable by up to 20% based on their assessment of the management of the Company’s cash position during the year. The
Directors’
Remuneration Report
Front end 2011 V10.indd 22-23 16/03/2012 11:25

Pace plc 2011 Annual Report | 2423 | Pace plc 2011 Annual Report
Committee, having regard to the performance of the business during the period, determined to award no bonus to any of Neil Gaydon, Stuart Hall and David McKinney.
Mike Pulli (who was appointed a director on 14 December 2011) had a similarly structured bonus opportunity but primarily based on the performance of the Pace Americas SBU during the year but also dependent as to a portion (15%) on the Group’s pre-tax profits. Having regard to the performance of the Pace Americas SBU during the year, which exceeded its 2011 budget targets, the Committee determined to award maximum bonus to Mike Pulli referable to the performance of Pace Americas but no portion of the bonus was payable referable to the Group’s pre-tax profits.
Prior to 2011 the Committee had offered members of the Executive Committee the opportunity to earn an “exceptional” bonus up to 100% of salary. In respect of the 2011 financial year, the Committee reviewed the executive bonus structure with its remuneration advisers. The outcome of this review was a revised bonus structure which no longer had an opportunity for executives to earn a discretionary “exceptional” bonus and replaced this feature by a specific additional performance objective which could boost normal bonus outcomes achieved under the Group pre-tax profit targets and individual objectives described above by up to two-thirds, but only if a positive bonus outcome is first achieved under the normal Group pre-tax profits target and individual objectives. Potential maximum bonus outcomes are capped at 225% of base salary and one-third of all bonus outcomes achieved up to 150% of base salary deferred into shares for two years, with deferral also applying on these terms to any bonus outcomes achieved between 150% and 225% of base salary. This outline structure has been maintained in respect of the 2012 financial year except that earnings before interest, tax and amortisation of other intangibles (EBITA) will be used as the corporate target instead of PBT recognising the short term impact of acquisition-related items including amortisation of intangibles and interest. The Committee retains a discretion to reduce the bonus otherwise payable by up to 50% based on their assessment of the management of inventory levels during the year and achievement of targets on debtor days.
Benefits in KindEach UK based executive director is entitled to benefits such as the provision of a fully expensed company car plus fuel (or cash alternative), private medical insurance, permanent health insurance, life insurance and where applicable relocation assistance. Mike Pulli has equivalent benefits to the extent consistent with US labor market practice.
Pension ContributionsIn the year ending 31 December 2011, contributions were paid into the executive directors’ pension schemes at rates determined by the Board. Contributions have continued to be paid during the current year at the rate of 15% of each director’s basic salary. The Group does not operate any defined benefit schemes.
Performance Share PlansFollowing the approval of shareholders at the 2009 AGM, a new Performance Share Plan (PSP) was introduced, with all Group employees (including executive directors) eligible to participate. Under the PSP, employees receive a conditional right to receive shares for no cost, which will normally vest after 3 years subject to continued employment and the achievement of stretching performance conditions.
PSP awards granted prior to 2012 will vest subject to the achievement of 3-year targets based on cumulative profit before tax (PBT) for the Group. During the year awards made to all employees across the Group including executive directors were based on 3-year Group PBT. The cumulative Group PBT targets that apply to the awards made in 2011 are set out in Note 4 to the directors’ share options table on page 29.
The Company’s policy is that PSP awards will generally be satisfied using shares purchased in the market via the Pace Employee Benefits Share Trust. During the year the executive directors received PSP awards over shares worth 100% of their basic salary.
Cumulative EBITA targets are proposed for 2012 awards rather than cumulative PBT targets with cumulative EBITA being measured over the three financial years 2012–2014. For these purposes EBITA and previous PBT targets will be adjusted to exclude the amortisation of other intangibles, exceptional items and other items that the Committee determines to be appropriate to ensure it reflects underlying long-term performance. These PBT / EBITA target figures have been re-stated to reflect the switch to US Dollar reporting. The use of EBITA targets for 2012 PSP awards was considered to be appropriate as it aligns the focus of Pace senior executives on a key measure of financial performance which is highly visible internally and externally and which is regularly monitored and reported.
Following the General Meeting of the Company held on 18 October 2010 shareholders approved the adoption of a new performance share plan, the International Performance Share Plan (IPSP). The IPSP follows closely the terms of the PSP; however Executive directors may not participate.
Share Option PlansAt present, the executive directors may participate in two share option plans:
• astandardHMRCapprovedall-employeesharesaveplan;
• theCompany’s2005discretionaryshareoptionplans(HMRCApprovedandUnapprovedplans).
In 2011, executive directors were granted sharesave options and also received option grants under the 2005 discretionary share option plans. Details of the performance conditions applying to all outstanding share options held by the executive directors, including options granted in 2011, are set out in the footnotes to the directors’ share options table on page 29.
The maximum award of options to any employee pursuant to the HMRC Approved plan is $46,500. The maximum award of options under the Unapproved plan to any employee in each year is 200% of salary or, in exceptional circumstances, as determined by the Committee, 400% of salary. Option awards are targeted at the Company’s most senior executives and are based on a fixed number of options (subject always to the discretion of the Committee to utilise other award criteria in exceptional circumstances). Option awards vest subject to real EPS growth (as noted on page 29). The Committee believes EPS targets to be appropriate to enhance alignment of the senior executives with shareholder interests whilst still maintaining focus on profitability.
Share Award ContractsThe following information is given pursuant to Listing Rule 9.4.3.
As part of the terms on which Allan Leighton was appointed, he agreed to purchase $310,000 of Pace shares and the Company agreed to match this personal investment on a two-for-one basis that will vest on the third anniversary of his appointment which occurred on 31 May 2011. An additional award over 600,000 Pace shares was made at the same time and will vest dependent on share price performance over a four year period: 25% of this award will vest at a share price of 145p with full vesting at 190p. Both awards are subject to the shares being retained until at least the fifth anniversary of appointment. The awards will normally lapse on cessation of the office within three years. On a change of control the awards will vest, with vesting of the share-price related awards dependent on share price performance. Vesting may also occur on certain other corporate events. The maximum number of shares awarded under this arrangement is 938,810 shares. The Remuneration Committee considered the circumstances relating to this appointment unusual because of the significant personal financial investment that Allan Leighton was prepared to make in the Company and the need to secure his unique experience at a time when the business was facing a number of challenges.
In March 2010 the Remuneration Committee agreed to make an individual award of contingent shares (the “2010 Share Award”) to Mike Pulli equivalent to 1 x annual salary (171,480 ordinary shares). Vesting of the 2010 Share Award was dependent on achievement of budget by Pace Americas in each of 2010 and 2011 financial years. Vesting is expected to be achieved in full on 15 March 2012 and particulars of this award are contained in the table on page 29.
Minimum ShareholdingFollowing the review of the Group’s remuneration policies completed in February 2009 the Committee introduced individual shareholding target requirements for members of the Executive Committee (including executive directors) with a requirement (subject to a discretion of the Remuneration Committee) for such executives to retain a portion of any net awards (ie. after tax and exercise cost) of newly vested share-based incentives until the target shareholding level is reached. The target shareholding is approximately 100% of the executive’s annual salary and up to 50% of shares earned but held under the Company’s Deferred Share Bonus Plan are deemed to count towards the ownership target. Each executive is required to achieve target ownership level within a period of five years.
Directors’Remuneration Report continued
Front end 2011 V10.indd 24-25 16/03/2012 11:25

Pace plc 2011 Annual Report | 2625 | Pace plc 2011 Annual Report
Service ContractsCompany policy is that executive directors’ notice periods should not exceed 1 year. Each of the executive directors has a service contract with the Company. Each of these agreements is terminable by the Company on 12 months’ prior written notice or by the relevant director on not less than 6 months’ prior written notice. At the option of the Company, each agreement may be terminated forthwith subject to the Company paying a sum equivalent to 12 months’ salary, benefits and pension contributions.
It is the Company’s policy to honour its obligations with regard to directors’ service agreements and where the employment of a director is terminated in accordance with the aforementioned contractual process the Company will pay the sum specified in the relevant service agreement as payable or otherwise pay fair and reasonable compensation.
The service agreement of Mike Pulli with Pace Americas, Inc. became effective on 13 November 2003, was amended on 26 October 2004 and was most recently amended by decision of the Remuneration Committee to reflect his appointment as CEO and new terms as outlined above (but varied to reflect US practice and custom) on 14 December 2011. The service agreement of Stuart Hall became effective on 2 April 2007 and was most recently amended on 26 January 2011. The service agreement of Roddy Murray became effective on 23 February 2012. Save for the notice periods referred to in the above paragraph, these contracts have no unexpired term.
Each of the non-executive directors is appointed under a letter of appointment which is terminable at any time by the Company without contractual notice where notice is not given, termination is generally subject to payment of an amount equal to three months’ directors’ fees. Each of the directors (and certain officers of subsidiaries of the Company) has a letter of indemnity issued by the Company which provides an indemnity in respect of liabilities incurred in the course of their office to the extent permitted by the Company’s Articles of Association and the provisions of the Companies Act.
Copies of the service contracts of the executive directors and the letters of appointment of the non-executive directors, together with the share award contracts and letters of indemnity referred to above, are available for inspection during normal business hours (Saturdays, Sundays and Public Holidays excepted) at the registered office of the Company.
The Company maintains directors’ and officers’ liability insurance in respect of senior employees and officers of the Group including the directors. The consent of the Board is required in the event that an executive director wishes to accept an external appointment. It has been the practice of the Company to permit a director to retain non-executive fees arising from any such appointment but during the year none of the current executive directors held such external appointments.
The auditors are required to report on the information disclosed on pages 26 to 29.
Directors’ RemunerationTotal directors’ remuneration in respect of qualifying services for the year ended 31 December 2011 was as follows:
Restated
2011 2010
$000 $000
Fees 532 467
Salaries, benefits in kind and termination payments 2,792 1,702
Performance-related bonuses 24 1,628
Pension contributions 219 296
3,567 4,093
The remuneration of individual directors in respect of qualifying services for the year ended 31 December 2011 is
set out in the table below:
Salaries Performance Termination Total Pension fees and Bounus*** payment remuneration contributions benefits in kind Restated Restated 2011 2010 2011 2010Executive Directors $000 $000 $000 $000 $000 $000 $000
Mike Pulli* 35 24 - 59 - 5 -
Neil Gaydon** 803 - 915 1,718 1,454 82 170
David McKinney 512 - - 512 922 73 67
Stuart Hall 527 - - 527 953 59 59
1,877 24 915 2,816 3,329 219 296
Non-Executive Directors
Allan Leighton* 146 - - 146 - - -
Mike McTighe* 167 - - 167 246 - -
Pat Chapman-Pincher 77 - - 77 77 - -
Jon Grant 77 - - 77 77 - -
Mike Inglis 65 - - 65 65 - -
2,409 24 915 3,348 3,794 219 296
* Remuneration referable only to the period of the financial year from date of appointment or up to retirement from the Board.
** A termination payment of $914,500 was payable to Neil Gaydon by way of compensation for termination of employment payable in two tranches, $604,500 paid 17 January 2012 and $310,000 is payable on 7 April 2012.
*** Figures relate to the cash element of the annual performance related bonus pro-rated to reflect the period during the year that Mike Pulli was a Director. The additional amount of $260,286 was awarded to Mike Pulli and will be deferred into shares of the Company for a period of two years under the terms of the Group Deferred Share Bonus Plan and normally subject to forfeiture if he leaves the Company during the period.
Directors’Remuneration Report continued
Front end 2011 V10.indd 26-27 16/03/2012 11:25

Pace plc 2011 Annual Report | 2827 | Pace plc 2011 Annual Report
Directors’ Interests in Shares and Share OptionsThe interests of directors holding office at the year-end, and those of their immediate families, in the ordinary share capital of the Company at 31 December 2011 and at the beginning of the period are set out below:
31 December 2011 Shares 1 January 2011 Shares
Non Under Non Under
Beneficial Beneficial option Beneficial Beneficial option
Allan Leighton 169,405 - 938,810 - - -
Pat Chapman-Pincher 15,551 - - 15,000 - -
John Grant 65,000 - - - - -
Mike Inglis 25,344 - - 20,000 - -
Mike Pulli 109,028 - 3,270,138 - - 1,493,003
Stuart Hall 128,411 - 2,739,127 12,739 - 2,242,388
David McKinney 63,307 - 2,137,041 38,159 - 1,640,523
Neil Gaydon 176,070 - 1,546,805 52,483 - 2,955,007
On 6 January 2012 583,989 options over shares in the Company lapsed in respect of David McKinney’s interest as a result of the terms of his termination of employment.
There were no changes in the directors’ interests in the ordinary share capital of the Company between 31
December 2011 and 6 March 2012. Roddy Murray is the beneficial owner of 100,000 ordinary shares in the
Company purchased by him prior to his appointment.
Directors’ Share OptionsDetails of the options and/or contingent awards over the ordinary shares of 5p each in the Company held by the directors who held office during the year were as follows:
Notes At Number of options At Vesting
31 Dec 31 Dec Exercise Period
2010 Granted Exercised Lapsed 2011 Price From To
Neil Gaydon*
2000 Unapproved Plan 1 20,000 - - - 20,000 51.0p 17.08.05 31.12.12
2005 Approved Plan 16,977 - - 16,977 - 176.7p 08.03.13 07.03.20
2005 Unapproved Plan 3 467,836 - - - 467,836 85.5p 24.06.11 31.12.12
2005 Unapproved Plan 3 350,000 - - - 350,000 75.0p 11.03.12 10.03.13
2005 Unapproved Plan 3 333,023 - - 333,023 - 176.7p 08.03.13 07.03.20
2005 Unapproved Plan 3 684,342 - - 684,342 - 178.5p 11.03.13 10.03.20
2005 Unapproved Plan 3 - 350,000 - 350,000 - 153.5p 04.04.14 03.04.21
Deferred Share Bonus 243,407 - 243,407 - - 0.0p 27.02.11 26.08.11
Deferred Share Bonus 325,320 - - - 325,320 0.0p 26.02.12 25.02.20
Deferred Share Bonus - 148,355 - - 148,355 0.0p 28.02.13 27.02.14
Performance Share Plan 4 235,294 - - - 235,294 0.0p 05.05.12 05.05.12
Performance Share Plan 4 268,848 - - 268,848 - 0.0p 08.03.13 07.03.20
Performance Share Plan 4 - 322,511 - 322,511 - 0.0p 04.04.14 03.04.21
Sharesave Plan 7,014 - - 7,014 - 67.0p 01.10.11 30.03.12
Sharesave Plan 2,946 - - 2,946 - 154.0p 01.06.13 31.11.13
* in the case of Neil Gaydon information given as at date of cessation of employment, 31 December 2011
Mike Pulli
2010 Share Award 171,480 - - - 171,480 0.0p 15.03.12 15.03.12
2005 Unapproved Plan 3 177,614 - - - 177,614 85.5p 24.06.11 23.06.18
2005 Unapproved Plan 3 250,000 - - - 250,000 75.0p 11.03.12 10.03.19
2005 Unapproved Plan 3 250,000 - - - 250,000 176.7p 08.03.13 07.03.20
2005 Unapproved Plan 3 - 250,000 - - 250,000 153.5p 04.04.14 03.04.21
2005 Unapproved Plan 3 - 1,395,275 - - 1,395,275 69.75p 15.12.14 14.12.21
Deferred Share Bonus 172,007 - 172,007 - - 0.0p 27.02.11 26.08.11
Deferred Share Bonus 214,350 - - - 214,350 0.0p 26.02.12 25.02.20
Deferred Share Bonus - 120,474 - - 120,474 0.0p 28.02.13 27.02.21
Performance Share Plan 4 117,898 - - - 117,898 0.0p 05.05.12 05.05.12
Performance Share Plan 4 139,654 - - - 139,654 0.0p 08.03.13 07.03.13
Performance Share Plan 4 - 181,061 - - 181,061 0.0p 04.04.14 03.04.14
US Sharesave Plan - 2,332 - - 2,332 136.0p 04.06.12 07.09.12
David McKinney
2005 Approved Plan 16,977 - - - 16,977 176.7p 08.03.13 07.03.20
2005 Unapproved Plan 3 280,701 - - - 280,701 85.5p 24.06.11 23.06.18
2005 Unapproved Plan 3 350,000 - - - 350,000 75.0p 11.03.12 10.03.19
2005 Unapproved Plan 3 333,023 - - - 333,023 176.7p 08.03.13 07.03.20
2005 Unapproved Plan 3 - 350,000 - - 350,000 153.5p 04.04.14 03.04.21
Deferred Share Bonus 146,044 - 146,044 - - 0.0p 27.02.11 26.08.11
Deferred Share Bonus 195,192 - - - 195,192 0.0p 26.02.12 25.02.20
Deferred Share Bonus - 93,528 - - 93,528 0.0p 28.02.13 27.02.21
Performance Share Plan 4 141,176 - - - 141,176 0.0p 05.05.12 05.05.12
Performance Share Plan 4 169,491 - - - 169,491 0.0p 08.03.13 07.03.20
Performance Share Plan 4 - 203,182 - - 203,182 0.0p 04.04.14 03.04.21
Sharesave Plan 4,148 - 4,148 - - 82.0p 01.10.10 31.03.11
Sharesave Plan 3,771 - - - 3,771 154.0p 01.10.13 31.03.14
Stuart Hall
2005 Approved Plan 2 40,955 - - - 40,955 73.3p 03.04.10 02.04.17
2005 Unapproved Plan 2 505,120 - - - 505,120 73.3p 03.04.10 02.04.17
2005 Unapproved Plan 3 298,245 - - - 298,245 85.5p 24.06.11 23.06.18
2005 Unapproved Plan 3 350,000 - - - 350,000 75.0p 11.03.12 10.03.19
2005 Unapproved Plan 3 350,000 - - - 350,000 176.7p 08.03.13 07.03.20
2005 Unapproved Plan 3 - 350,000 - - 350,000 153.5p 04.04.14 03.04.21
Deferred Share Bonus 155,172 - 155,172 - - 0.0p 27.02.11 26.08.11
Deferred Share Bonus 206,036 - - - 206,036 0.0p 26.02.12 25.02.20
Deferred Share Bonus - 96,753 - - 96,753 0.0p 28.02.13 27.02.21
Performance Share Plan 4 150,000 - - - 150,000 0.0p 05.05.12 05.05.12
Performance Share Plan 4 175,336 - - - 175,336 0.0p 08.03.13 07.03.20
Performance Share Plan 4 - 209,632 - - 209,632 0.0p 04.04.14 03.04.21
Sharesave Plan 11,524 - 11,524 - - 82.0p 01.10.10 31.03.11
Sharesave Plan - 7,050 - - 7,050 128.0p 01.16.14 31.11.14
Allan Leighton
Share-price award - 600,000 - - 600,000 5.0p 31.05.14 31.05.15
Matching award 5 - 338,810 - - 338,810 5.0p 31.05.14 31.05.14
Directors’Remuneration Report continued
Front end 2011 V10.indd 28-29 16/03/2012 11:25

Pace plc 2011 Annual Report | 3029 | Pace plc 2011 Annual Report
On 29 July 2011 David McKinney exercised 146,044 shares under the Deferred Share Bonus Plan and retained 11,000 shares. The share price at this date was 109.45p, giving a gain of $247,760. On 14 March 2011 David McKinney also exercised and retained 4,148 shares under the Sharesave Plan. The share price at this date was 171.0p.
On 10 August 2011 Neil Gaydon exercised 243,407 shares under the Deferred Share Bonus Plan and retained 116,386 shares. The share price at this date was 96.23p, giving a gain of $234,230.
On 12 August 2011 Stuart Hall exercised 155,172 shares under the Deferred Share Bonus Plan and retained 74,148 shares. The share price at this date was 96.16p, giving a gain of $232,345. On 25 March 2011 Stuart Hall also exercised and retained 11,524 shares under the Sharesave Plan. The share price at this date was 161.6p.
Notes: Performance Conditions
1. Under the 2000 Unapproved Scheme performance conditions of 6% per annum compound above RPI were applied to the grant of options.
2. Options subject to performance conditions based on growth in the pre-tax profits of the Group (PBT) over a period of three financial years with 25% of options vesting at $10.7 million PBT in the third financial year and 100% of options vesting at $26.7 million PBT in the third financial year, with vesting on a sliding scale between these two target thresholds.
3. Options granted in FY 2008 are subject to performance conditions based on cumulative growth in EPS requiring a minimum growth in EPS of 4% per annum above inflation over a three-year period at which level there is 25% vesting. Cumulative growth of 8% per annum above inflation is required for 100% vesting. Options granted in FY 2009, FY 2010, FY 2011 and FY 2012 are subject to performance conditions based on similar cumulative EPS growth but with increased EPS growth required for maximum vesting from RPI + 8% to RPI + 15% per annum. In order to assess whether the performance conditions have been met, the Committee will utilize the earnings figures derived from the audited Financial Statements of the Group adjusted to exclude exceptional or other items that the Committee determines appropriate to ensure they reflect underlying long term performance.
4. PSP awards will vest subject to the achievement of 3-year targets based on cumulative PBT for the Group prior to 2012 and awards granted in 2012 will vest subject to achievement of three year targets based on cumulative EBITA for the Group.
Cumulative PBT over 3 years% of total award shares vesting
2009 awards 2010 awards 2011 awards
100%
Between 25% and 100%
pro rata
25%
Nil
$225 million
Between $132 million and
$225 million
$132 million
Less than $132 million
$442 million
Between $395 million and
$442 million
$395 million
Less than $395 million
$682 million
Between $519 million and
$682 million
$519 million
Less than $519 million
5. The Allan Leighton Appointment Share Award shares which vest dependent on share price, vest as to 25% on achievement of the threshold price of £1.45, with full vesting at £1.90 and straight line vesting in between.
The mid-market price of shares in the Company on 31 December 2011 was 72.0p. The lowest and highest closing mid-market prices of shares in the Company during the year were 44.04p and 231.80p respectively.
Employee Benefits TrustThe Company has established the Pace plc Employee Benefits Trust, which is capable of acquiring shares in the Company in the market and using them for the purposes of satisfying new awards granted under the Company’s Share Option Plans, the Deferred Share Bonus Plan and the Performance Share Plans.
Performance GraphSet out below is a performance graph showing the total shareholder return of the Company for the 5 financial years ended 31 December 2011 compared to the total shareholder return of the FTSE Electronics and Electrical Equipment sector index which is considered by the Board to be an appropriate benchmark index against which to compare the Company’s performance having regard to the principal activities of the Group.
0p
50p
100p
150p
200p
250p
300p
Jan-07 Jan-08 Jan-09 Jan-10 Jan-11 Jan-12
Pace FTSE All-Share Electronic & Electrical Equipment (reb.)
By order of the Board
Anthony J Dixon Company Secretary
6 March 2012
Directors’Remuneration Report continued
Front end 2011 V10.indd 30-31 16/03/2012 11:25

Pace plc 2011 Annual Report | 3231 | Pace plc 2011 Annual Report
Statement of Directors’ ResponsibilitiesThe directors are responsible for preparing the Annual Report and Accounts and the Group and Company financial statements in accordance with applicable law and regulations.
Company law requires the directors to prepare Group and Company Financial Statements for each financial year. Under that law they are required to prepare the Group Financial Statements in accordance with IFRSs as adopted by the EU and applicable law and have elected to prepare the Company financial statements on the same basis.
Under company law the directors must not approve the Financial Statements unless they are satisfied that they give a true and fair view of the state of affairs of the Group and the Company and of their profit or loss for that period. In preparing each of the Group and Company Financial Statements, the Directors are required to:
• selectsuitableaccountingpoliciesandthenapplythemconsistently;
• makejudgementsandaccountingestimatesthatarereasonableandprudent;
• statewhethertheyhavebeenpreparedinaccordancewithIFRSsasadoptedbytheEU;and
• preparetheFinancialStatementsonthegoingconcernbasisunlessitisinappropriatetopresumethattheGroupand Company will continue in business.
The directors are responsible for keeping adequate accounting records that are sufficient to show and explain the Company’s transactions and disclose with reasonable accuracy at any time the financial position of the Company and the Group and enable them to ensure that the Financial Statements and the Directors’ Remuneration Report comply with the Companies Act 2006. They have general responsibility for taking such steps as are reasonably open to them to safeguard the assets of the Group and to prevent and detect fraud and other irregularities.
Under applicable law and regulations, the directors are also responsible for preparing a Directors’ Report, Directors’ Remuneration Report and Corporate Governance Statement that complies with that law and those regulations.
The directors are responsible for the maintenance and integrity of the corporate and financial information included on the Company’s website. Legislation in the United Kingdom governing the preparation and dissemination of financial statements may differ from legislation in other jurisdictions.
Independent Auditors’ Report to the members of Pace plcWe have audited the Financial Statements of Pace Plc for the year ended 31 December 2011 set out on pages 35 to 77.
The financial reporting framework that has been applied in their preparation is applicable law and International Financial Reporting Standards (IFRSs) as adopted by the EU and, as regards the parent Company Financial Statements, as applied in accordance with the provisions of the Companies Act 2006
This report is made solely to the Company’s members, as a body, in accordance with Chapter 3 of Part 16 of the Companies Act 2006. Our audit work has been undertaken so that we might state to the Company’s members those matters we are required to state to them in an auditor’s report and for no other purpose. To the fullest extent permitted by law, we do not accept or assume responsibility to anyone other than the Company and the Company’s members, as a body, for our audit work, for this report, or for the opinions we have formed.
Respective responsibilities of directors and auditor
As explained more fully in the Directors’ Responsibilities Statement set out on page 31, the directors are responsible for the preparation of the Financial Statements and for being satisfied that they give a true and fair view. Our responsibility is to audit, and express an opinion on, the Financial Statements in accordance with applicable law and International Standards on Auditing (UK and Ireland). Those standards require us to comply with the Auditing Practices Board’s (APB’s) Ethical Standards for Auditors.
Scope of the audit of the financial statements
A description of the scope of an audit of financial statements is provided on the APB’s website at www.frc.org.uk/apb/scope/UKP
Opinion on financial statements
In our opinion:
• theFinancialStatementsgiveatrueandfairviewofthestateoftheGroup’sandoftheparentCompany’saffairsas at 31 December 2011 and of the Group’s profit for the year then ended;
• theGroupFinancialStatementshavebeenproperlypreparedinaccordancewithIFRSsasadoptedbytheEU;
• theparentCompanyFinancialStatementshavebeenproperlypreparedinaccordancewithIFRSsasadoptedbythe EU and as applied in accordance with the provisions of the Companies Act 2006; and
• theFinancialStatementshavebeenpreparedinaccordancewiththerequirementsoftheCompaniesAct2006and, as regards the Group Financial Statements, Article 4 of the IAS Regulation.
Opinion on other matters prescribed by the Companies Act 2006
In our opinion:
• thepartoftheDirectors’RemunerationReporttobeauditedhasbeenproperlypreparedinaccordancewiththeCompanies Act 2006; and
• theinformationgivenintheDirectors’Reportforthefinancialyearforwhichthefinancialstatementsarepreparedis consistent with the Financial Statements
Matters on which we are required to report by exception
We have nothing to report in respect of the following:
Under the Companies Act 2006 we are required to report to you if, in our opinion:
• adequateaccountingrecordshavenotbeenkeptbytheparentcompany,orreturnsadequateforouraudithavenot been received from branches not visited by us; or
• theparentCompanyFinancialStatementsandthepartoftheDirectors’RemunerationReporttobeauditedarenot in agreement with the accounting records and returns; or
• certaindisclosuresofdirectors’remunerationspecifiedbylawarenotmade;or
• wehavenotreceivedalltheinformationandexplanationswerequireforouraudit
Statement of
Directors’ ResponsibilitiesIndependent
Auditors’ Report
Front end 2011 V10.indd 32-33 16/03/2012 11:25

Under the Listing Rules we are required to review:
• thedirectors’statement,setoutonpage18,inrelationtogoingconcern;
• thepartoftheCorporateGovernanceStatementintheReportoftheDirectorsrelatingtotheCompany’scompliance with the nine provisions of the UK Corporate Governance Code specified for our review; and
• certainelementsofthereporttoshareholdersbytheBoardondirectors’remuneration.
Chris Hearld (Senior Statutory Auditor) for and on behalf of KPMG Audit Plc, Statutory Auditor Chartered Accountants 1 The Embankment Neville Street Leeds LS1 4DW
6 March 2012
Pace plc 2011 Annual Report | 3433 | Pace plc 2011 Annual Report
IndependentAuditors’ Report continued
35 Financial Statements
42 Notes to the Financial Statements
78 Directors, Secretary and Advisers
79 Five Year Record and Shareholder Information
Financial StatementsContents
Front end 2011 V10.indd 34-35 16/03/2012 11:25

35 | Pace plc 2011 Annual Report
Consolidated Income StatementFor the year ended 31 December 2011
Restated 2011 2010 Notes $m $m
Revenue 3 2,309.3 2,062.9Cost of sales (1,866.0) (1,667.8)
Gross profi t 443.3 395.1 Administrative expenses: Research and development expenditure 4 (160.6) (120.0) Other administrative expenses Before exceptional costs 4 (141.3) (114.5) Exceptional costs 5 (12.7) (29.5) Amortisation of intangibles 11 (55.7) (18.1)
Total administrative expenses (370.3) (282.1) Operating profi t 73.0 113.0Finance income – interest receivable 6 0.2 1.2Finance expenses – interest payable 6 (18.5) (4.0)
Profi t before tax 54.7 110.2Tax charge 8 (15.9) (32.9)
Profi t for the year 38.8 77.3 Profi t attributable to: Equity holders of the Company 38.8 77.3 Earnings per ordinary share: Basic earnings per ordinary share (cents) 9 13.2 26.4Diluted earnings per ordinary share (cents) 9 12.5 25.0
Pace R&A 2012.indd 35 12/03/2012 14:55
creo

Pace plc 2011 Annual Report | 36
Restated 2011 2010 $m $m
Profi t for the year 38.8 77.3Other comprehensive income: Exchange differences on translating foreign operations (8.1) 3.3Exchange differences on change in presentational currency - (11.8)Net change in fair value of cash fl ow hedges transferred to profi t or loss gross of tax 15.0 (19.4)Deferred tax adjustment on above (4.0) 6.2Effective portion of changes in fair value of cash fl ow hedges gross of tax (8.1) 14.1Deferred tax adjustment on above 2.2 (4.7)Other comprehensive income for the year, net of tax (3.0) (12.3)
Total comprehensive income for the year 35.8 65.0 Attributable to: Equity holders of the Company 35.8 65.0
Consolidated Statement of Comprehensive IncomeFor the year ended 31 December 2011
Pace R&A 2012.indd 36 12/03/2012 14:55
creo

37 | Pace plc 2011 Annual Report
Restated Restated 2011 2010 1 Jan 2010 Notes $m $m $m
ASSETS Non-Current Assets Property, plant and equipment 12 63.0 52.7 31.6Intangible assets – goodwill 11 335.6 335.6 113.3Intangible assets – other intangibles 11 218.0 273.7 22.5Intangible assets – development expenditure 11 53.9 44.6 46.2Deferred tax assets 14 67.2 69.9 10.3
Total Non-Current Assets 737.7 776.5 223.9
Current Assets Inventories 15 150.0 222.7 140.2Trade and other receivables 16 402.3 433.4 340.8Cash and cash equivalents 18 48.7 131.4 118.3Current tax assets 4.6 1.9 4.2
Total Current Assets 605.6 789.4 603.5
Total Assets 1,343.3 1,565.9 827.4 EQUITY Issued capital 21 28.3 28.2 28.2Share premium 22 73.1 72.6 71.5Merger reserve 23 109.9 109.9 109.9Hedging reserve 2.9 (2.2) 1.6Translation reserve (52.1) (44.0) (35.5)Retained earnings 24 245.0 211.4 140.2
Total Equity 407.1 375.9 315.9
LIABILITIES Non-Current Liabilities Other payables - 6.2 3.7Deferred tax liabilities 14 95.7 108.5 23.7Provisions 20 41.6 43.9 31.1Borrowings 18 147.3 219.8 -
Total Non-Current Liabilities 284.6 378.4 58.5
Current Liabilities Trade and other payables 17 373.5 538.4 422.8Current tax liabilities 9.6 7.6 6.9Provisions 20 45.4 42.9 23.3Borrowings 18 223.1 222.7 -
Total Current Liabilities 651.6 811.6 453.0
Total Liabilities 936.2 1,190.0 511.5
Total Equity and Liabilities 1,343.3 1,565.9 827.4
These fi nancial statements were approved by the Board of Directors on 6 March 2012 and were signed on its behalf by:Michael Pulli Chief Executive Offi cerStuart Hall Chief Financial Offi cer
Consolidated Balance SheetAt 31 December 2011
Pace R&A 2012.indd 37 12/03/2012 14:55
creo

Pace plc 2011 Annual Report | 38
Restated Restated 2011 2010 1 Jan 2010 Notes $m $m $m
ASSETS Non-Current Assets Property, plant and equipment 12 29.5 24.6 19.8Intangible assets – development expenditure 11 35.9 29.1 26.7Investments in group and other companies 13 448.6 354.5 114.1Loans to group companies 13 190.6 197.2 5.5Deferred tax assets 14 2.2 4.2 5.2
Total Non-Current Assets 706.8 609.6 171.3
Current Assets Inventories 15 49.3 32.9 34.6Trade and other receivables 16 436.7 392.3 322.0Cash and cash equivalents 13.8 77.8 42.4Current tax assets 2.0 - 4.2
Total Current Assets 501.8 503.0 403.2
Total Assets 1,208.6 1,112.6 574.5 EQUITY Issued capital 21 28.3 28.2 28.2Share premium 22 73.1 72.6 71.5Merger reserve 23 109.9 109.9 109.9Hedging reserve 2.8 (5.3) (0.9)Translation reserve (52.5) (50.3) (40.4)Retained earnings 24 235.8 133.7 95.3
Total Equity 397.4 288.8 263.6
LIABILITIES Non-Current Liabilities Other payables - - 3.5Deferred tax liabilities 14 5.8 6.2 5.6Provisions 20 23.2 38.0 22.5Borrowings 18 147.3 219.8 -
Total Non-Current Liabilities 176.3 264.0 31.6
Current Liabilities Trade and other payables 17 385.1 314.3 268.4Current tax liabilities 1.7 7.1 -Provisions 20 25.0 15.7 10.9Borrowings 18 223.1 222.7 -
Total Current Liabilities 634.9 559.8 279.3
Total Liabilities 811.2 823.8 310.9
Total Equity and Liabilities 1,208.6 1,112.6 574.5
These fi nancial statements were approved by the Board of Directors on 6 March 2012 and were signed on its behalf by:Michael Pulli Chief Executive Offi cerStuart Hall Chief Financial Offi cerPace plcRegistered number: 01672847
Company Balance SheetAt 31 December 2011
Pace R&A 2012.indd 38 12/03/2012 14:55
creo

39 | Pace plc 2011 Annual Report
Share Share Merger Hedging Translation Retained Total capital premium reserve reserve reserve earnings equityGroup $m $m $m $m $m $m $m
Balance at January 2010 (restated) 28.2 71.5 109.9 1.6 (35.5) 140.2 315.9Profi t for the year - - - - - 77.3 77.3Other comprehensive income - - - (3.8) (8.5) - (12.3)
Total comprehensive income for the year - - - (3.8) (8.5) 77.3 65.0Transactions with owners:
Deferred tax on share options - - - - - (2.2) (2.2)Dividends to equity shareholders - - - - - (8.0) (8.0)Employee share incentive charges - - - - - 9.4 9.4Movement in employee share trusts - - - - - (5.3) (5.3)Issue of shares - 1.1 - - - - 1.1
Balance at December 2010 (restated) 28.2 72.6 109.9 (2.2) (44.0) 211.4 375.9Profi t for the year - - - - - 38.8 38.8Other comprehensive income - - - 5.1 (8.1) - (3.0)
Total comprehensive income for the year - - - 5.1 (8.1) 38.8 35.8Transactions with owners:
Deferred tax on share options - - - - - (2.9) (2.9)Dividends to equity shareholders - - - - - (10.1) (10.1)Employee share incentive charges - - - - - 7.8 7.8Issue of shares 0.1 0.5 - - - - 0.6
Balance at December 2011 28.3 73.1 109.9 2.9 (52.1) 245.0 407.1
Share Share Merger Hedging Translation Retained Total capital premium reserve reserve reserve earnings equityCompany $m $m $m $m $m $m $m
Balance at January 2010 (restated) 28.2 71.5 109.9 (0.9) (40.4) 95.3 263.6Profi t for the year - - - - - 44.5 44.5Other comprehensive income - - - (4.4) (9.9) - (14.3)
Total comprehensive income for the year - - - (4.4) (9.9) 44.5 30.2Transactions with owners:
Deferred tax on share options - - - - - (2.2) (2.2)Dividends to equity shareholders - - - - - (8.0) (8.0)Employee share incentive charges - - - - - 9.4 9.4Movement in employee share trusts - - - - - (5.3) (5.3)Issue of shares - 1.1 - - - - 1.1
Balance at December 2010 (restated) 28.2 72.6 109.9 (5.3) (50.3) 133.7 288.8Profi t for the year - - - - - 107.3 107.3Other comprehensive income - - - 8.1 (2.2) - 5.9
Total comprehensive income for the year - - - 8.1 (2.2) 107.3 113.2Transactions with owners:
Deferred tax on share options - - - - - (2.9) (2.9)Dividends to equity shareholders - - - - - (10.1) (10.1)Employee share incentive charges - - - - - 7.8 7.8Issue of shares 0.1 0.5 - - - - 0.6
Balance at December 2011 28.3 73.1 109.9 2.8 (52.5) 235.8 397.4
Statements of Changes in Shareholders’ Equity
Pace R&A 2012.indd 39 12/03/2012 14:55
creo

Pace plc 2011 Annual Report | 40
Restated 2011 2010 $m $m
Cash fl ows from operating activities Profi t before tax 54.7 110.2Adjustments for: Share based payments charge 7.8 9.4 Depreciation of property, plant and equipment 29.0 16.3 Amortisation of development expenditure 47.9 52.0 Amortisation of other intangibles 55.7 18.1 Loss on sale of property, plant and equipment 1.6 0.5 Net fi nance expense 18.3 2.8 Movement in trade and other receivables 30.3 (15.6) Movement in trade and other payables (170.2) (23.4) Movement in inventories 72.2 (32.2) Movement in provisions 2.7 (0.3)
Cash generated from operations 150.0 137.8Interest paid (13.8) (2.8)Tax paid (29.7) (39.2)
Net cash generated from operating activities 106.5 95.8
Cash fl ows from investing activities Acquisition of subsidiaries, net of cash acquired (6.4) (422.4)Purchase of property, plant and equipment (41.5) (30.5)Development expenditure (57.0) (56.9)Interest received 0.2 1.2
Net cash used in investing activities (104.7) (508.6)
Cash fl ows from fi nancing activities Proceeds from external borrowings - 442.5Repayment of long-term debt (75.0) -Proceeds from issue of share capital 0.6 1.1Dividend paid (10.1) (8.0)Purchase of own shares by employee benefi t trust - (5.3)
Net cash (used in) / generated from fi nancing activities (84.5) 430.3
Net change in cash and cash equivalents (82.7) 17.5Cash and cash equivalents at the start of the year 131.4 118.3Effect of exchange rate fl uctuations on cash held - (4.4)
Cash and cash equivalents at the end of the year 48.7 131.4
Consolidated Statement of Cash FlowsFor the year ended 31 December 2011
Pace R&A 2012.indd 40 12/03/2012 14:55
creo

41 | Pace plc 2011 Annual Report
Restated 2011 2010 $m $m
Cash fl ows from operating activities Profi t before tax 114.0 63.6Adjustments for: Share based payments charge 7.8 9.4 Depreciation of property, plant and equipment 10.8 8.8 Loss on sale of property, plant and equipment 0.1 - Amortisation of development expenditure 27.4 32.9 Net fi nance expense 9.1 0.8 Movement in trade and other receivables (41.5) (201.0) Movement in trade and other payables 81.8 (26.5) Movement in inventories (15.7) 0.5 Movement in provisions (4.8) 21.1
Cash generated from / (used in) operations 189.0 (90.4)Interest paid (11.9) (1.4)Tax paid (16.4) (8.8)
Net cash generated from / (used in) operating activities 160.7 (100.6)
Cash fl ows from investing activities Acquisition of subsidiaries, net of cash acquired (97.7) (243.4)Purchase of property, plant and equipment (15.8) (13.5)Development expenditure (34.2) (36.3)Interest received 7.5 0.6
Net cash used in investing activities (140.2) (292.6)
Cash fl ows from fi nancing activities Proceeds from external borrowings - 442.5Repayment of long-term debt (75.0) -Proceeds from issue of share capital 0.6 1.1Dividend paid (10.1) (8.1)Purchase of own shares by employee benefi t trust - (5.3)
Net cash (used in) / generated from fi nancing activities (84.5) 430.2
Net change in cash and cash equivalents (64.0) 37.0Cash and cash equivalents at the start of the year 77.8 42.4Effect of exchange rate fl uctuations on cash held - (1.6)
Cash and cash equivalents at the end of the year 13.8 77.8
Company Statement of Cash FlowsFor the year ended 31 December 2011
Pace R&A 2012.indd 41 12/03/2012 14:55
creo

Pace plc 2011 Annual Report | 42
1 Basis of preparation and business environmentThe following accounting policies have been applied consistently in dealing with items which are considered material in relation to the fi nancial statements.
Basis of preparationThe fi nancial statements have been prepared in accordance with applicable accounting standards and under the historical cost convention as modifi ed by the revaluation of derivative instruments.
International Financial Reporting StandardsThe Group’s fi nancial statements have been prepared in accordance with International Financial Reporting Standards (“IFRS”) as endorsed by the European Union and International Financial Reporting Interpretations Committee (“IFRIC”) interpretations and with those parts of the Companies Act 2006 applicable to companies reporting under IFRS. The Company’s Financial Statements have been prepared on the same basis and as permitted by section 408 of the Companies Act 2006, no income statement is presented for the Company. The result of the Company for the year is shown in note 25.
Financial year endThe current year’s fi nancial statements are for the year ended 31 December 2011 and the previous year’s fi nancial statements are for the year ended 31 December 2010.
Basis of consolidationThe Group fi nancial statements consolidate those of the Company and of its subsidiary undertakings (note 13) drawn up to 31 December 2011. Subsidiaries are entities controlled by the Company. Control exists when the Company has the power, directly or indirectly, to govern the fi nancial and operating policies of an entity so as to obtain benefi ts from its activities. In assessing control, potential voting rights that presently are exercisable or convertible are taken into account. Intra-group transactions, including sales, profi ts, receivables and payables, have been eliminated on the Group consolidation. Investments in subsidiaries are carried at cost less any impairment loss in the fi nancial statements of the Company.
Change in functional currencyIAS 21, ‘The Effects of Changes in Foreign Exchange Rates’, describes functional currency as “the currency of the primary economic environment in which an entity operates”. The Group and Company incur and source a signifi cant majority of revenues and costs in US dollars.
A change in functional currency refl ects the accumulation over time of those factors which are the main determinants of functional currency. Having considered the aggregate effect of all relevant factors, the Directors concluded that this point was reached in the fi rst quarter of 2011, following the integration of 2Wire Inc into the Pace Group. Accordingly, the Directors determined that the functional currency of Pace plc had changed to USD from 1 January 2011.
In accordance with IAS 21 this change has been accounted for prospectively from this date.
Change in presentation currencyFrom 1 January 2011 the Group also changed its presentation currency to USD. Comparative information has been restated in USD in accordance with the guidance defi ned in IAS 21. The 2010 fi nancial statements and associated notes have been retranslated from Sterling to USD using the procedures outlined below:
• Assets and liabilities were translated into USD at closing rates of exchange at 31 December 2010 and opening rates of exchange at 1 January 2010.
• Trading results were translated into USD at the rates of exchange prevailing at the dates of transaction, or average rates where they are a suitable proxy.
• Share capital, share premium and other capital reserves were translated at the historic rates prevailing at the dates of transactions.
• Differences resulting from the retranslation of the opening net assets and the results for the year have been taken to reserves.
Signifi cant judgements, key assumptions and estimation uncertaintyThe Group’s main accounting policies affecting its results of operations and fi nancial condition are set out on pages 43 to 49. Judgements and assumptions have been required by management in applying the Group’s accounting policies in many areas. Actual results may differ from the estimates calculated using these judgements and assumptions. Key areas of estimation uncertainty and critical accounting judgements are as follows:
Notes
Pace R&A 2012.indd 42 12/03/2012 14:55
creo

43 | Pace plc 2011 Annual Report
1 Basis of preparation and business environment (continued)WarrantiesPace provides product warranties for its products. Although it is diffi cult to make accurate predictions of potential failure rates or the possibility of an epidemic failure, as a warranty estimate must be calculated at the outset of a product before fi eld deployment data is available, these estimates improve during the lifetime of the product in the fi eld.
A provision for warranties is recognised when the underlying products are sold. The provision is based on historical warranty data and a weighting of all possible outcomes against their associated probabilities. The level of warranty provision required is reviewed on a product by product basis and provisions adjusted accordingly in the light of actual performance.
RoyaltiesPace’s products incorporate third party technology, usually under licence. Inadvertent actions may expose Pace to the risk of infringing third party intellectual property rights. Potential claims can still be submitted many years after a product has been deployed. Any such claims are always vigorously defended.
A provision for royalties is recognised where the owners of patents covering technology allegedly used by the Group have indicated claims for royalties relating to the Group’s use (including past usage) of that technology. Having taken legal advice, the board considers that there are defences available that should mitigate the amounts being sought. The Group will vigorously negotiate or defend all claims but, in the absence of agreement, the amounts provided may prove to be different from the amounts at which the potential liabilities are fi nally settled. The provision is based on the latest information available.
Operating segmentsOperating segments are reported in a manner consistent with the internal reporting provided to the chief operating decision maker. The chief operating decision maker, who is responsible for allocating resources and assessing performance of the operating segments, has been identifi ed as the Board of Directors. The Board of Directors has determined that, based on its current internal reporting framework and management structure, it has three reportable segments.
Such determination is necessarily judgmental in its nature and has been determined for the preparation of the fi nancial statements. The level of disclosure of segmental and other information is determined by such assessment. Further details of the considerations made and the resulting disclosures are provided in note 3 to the fi nancial statements.
Intangible assetsThe Group’s business includes a signifi cant element of research and development activity. Under accounting standards, principally IAS 38 ‘Intangible Assets’, there is a requirement to capitalise and amortise development spend to match costs to expected benefi ts from projects deemed to be commercially viable. The application of this policy involves the ongoing consideration by management of the forecasted economic benefi t from such projects compared to the level of capitalised costs, together with the selection of amortisation periods appropriate to the life of the associated revenues from the product.
Going concernThe Group has borrowing facilities in place until March 2014. At 31 December 2011 these are in the form of a $225m term loan, which is subject to repayment through instalments of $37.5m each, due every six months plus a fi nal payment of $75m, and a $150m revolver credit facility. These facilities are subject to fi nancial performance covenants which the Group currently complies with.
The Group has prepared a fi nancial and working capital forecast based upon trading assumptions and other short term and medium term plans. The Group has sensitised these plans for a number of potential scenarios, including working capital management and revenue reduction and has concluded that the Group will continue to meet its fi nancial performance covenants and will have adequate working capital available to continue in operational existence for the foreseeable future.
2 Accounting policiesBusiness combinationsControl is the power to govern the fi nancial and operating policies of an entity so as to obtain benefi ts from its activities. In assessing control, the Group takes into consideration potential voting rights that currently are exercisable. The acquisition date is the date on which control is transferred to the acquirer. Judgement is applied in determining the acquisition date and determining whether control is transferred from one party to another.
Goodwill
Goodwill that arises upon the acquisition of subsidiaries is included in intangible assets.
NotesContinued
Pace R&A 2012.indd 43 12/03/2012 14:55
creo

Pace plc 2011 Annual Report | 44
2 Accounting policies (continued) Initial measurementThe Group measures goodwill as the fair value of the consideration transferred including the recognised amount of any non-controlling interest in the acquiree, less the net recognised amount (generally fair value) of the identifi able assets acquired and liabilities assumed, all measured as of the acquisition date. Consideration transferred includes the fair values of the assets transferred, liabilities incurred by the Group to the previous owners of the acquiree, and equity interests issued by the Group. Consideration transferred also includes the fair value of any contingent consideration and share-based payment awards of the acquiree that are replaced mandatorily in the business combination. If a business combination results in the termination of pre-existing relationships between the Group and the acquiree, then the lower of the termination amount, as contained in the agreement, and the value of the off-market element is deducted from the consideration transferred and recognised in other expenses.
A contingent liability of the acquiree is assumed in a business combination only if such a liability represents a present obligation and arises from a past event, and its fair value can be measured reliably.
The Group measures any non-controlling interest at its proportionate interest in the identifi able net assets of the acquiree. Transaction costs that the Group incurs in connection with a business combination, such as fi nder’s fees, legal fees, due diligence fees, and other professional and consulting fees are expensed as incurred.
Subsequent measurementGoodwill is measured at cost less accumulated impairment losses. In respect of equity accounted investees, the carrying amount of goodwill is included in the carrying amount of the investment, and an impairment loss on such an investment is not allocated to any asset, including goodwill, that forms part of the carrying amount of the equity accounted investee.
As permitted by IFRS 1 ‘First-time Adoption of IFRS’, goodwill arising on acquisitions before 29 May 2004 (date of transition to Adopted IFRS) has been frozen at the UK GAAP amounts subject to being tested for impairment annually. The Group performs its annual impairment review at the cash-generating unit level.
Other intangiblesOther intangible assets that are acquired by the Group, which have fi nite useful lives, are measured at cost less accumulated amortisation and accumulated impairment losses.
Amortisation of other intangibles is done on a straight line basis over the estimated useful economic lives of the particular asset categories as follows:
Customer contracts and relationships 3-10 years Technology and patents 1-10 years Other 3 years
Research and development expenditureAll on-going research expenditure is expensed in the period in which it is incurred. Where a product is technically feasible, production and sales are intended, a market exists, and suffi cient resources are available to complete the project, development costs are capitalised and subsequently amortised on a straight-line basis over the estimated useful life of the product concerned from commercial launch. The expenditure capitalised includes the cost of materials, direct labour and an appropriate proportion of overheads. Where these conditions are not met development expenditure is recognised as an expense in the period in which it is incurred. Capitalised development expenditure is stated at cost less accumulated amortisation and impairment losses. The estimated useful lives for development expenditure are estimated to be in a range of between 6 and 18 months.
Capitalised development expenditure is not treated as a realised loss for the purpose of determining the Company’s distributable profi ts as the costs meet the conditions required to be treated as an asset in accordance with IAS 38.
The amortisation of capitalised development expenditure is charged to the Income Statement in research and development expenditure within the Administrative expenses category.
Impairment chargesThe carrying amounts of the Group’s non-fi nancial assets, other than inventories and deferred tax assets, are reviewed at each reporting date to determine whether there is any indication of impairment. If any such indication exists, then the asset’s recoverable amount is estimated. For goodwill, and intangible assets that have indefi nite useful lives or that are not yet available for use, the recoverable amount is estimated each year at the same time. An impairment loss is recognised if the carrying amount of an asset or its related cash-generating unit (CGU) exceeds its estimated recoverable amount.
NotesContinued
Pace R&A 2012.indd 44 12/03/2012 14:55
creo

45 | Pace plc 2011 Annual Report
2 Accounting policies (continued) The recoverable amount of an asset or CGU is the greater of its value in use and its fair value less costs to sell. In assessing value in use, the estimated future cash fl ows are discounted to their present value using a pre-tax discount rate that refl ects current market assessments of the time value of money and the risks specifi c to the asset or CGU. For the purpose of impairment testing, CGUs to which goodwill has been allocated are aggregated so that the level at which impairment testing is performed refl ects the lowest level at which goodwill is monitored for internal reporting purposes. Goodwill acquired in a business combination is allocated to groups of CGUs that are expected to benefi t from the synergies of the combination.
The Group’s corporate assets do not generate separate cash infl ows and are utilised by more than one CGU. Corporate assets are allocated to CGUs on a reasonable and consistent basis and tested for impairment as part of the testing of the CGU to which the corporate asset is allocated. Impairment losses are recognised in profi t or loss. Any impairment losses recognised in respect of CGUs are allocated fi rst to reduce the carrying amount of any goodwill allocated to the CGU and then to reduce the carrying amounts of the assets in the CGU on a pro rata basis.
An impairment loss in respect of goodwill is not reversed. In respect of other assets, impairment losses recognised in prior periods are assessed at each reporting date for any indications that the loss has decreased or no longer exists. An impairment loss is reversed if there has been a change in the estimates used to determine the recoverable amount. An impairment loss is reversed only to the extent that the asset’s carrying amount does not exceed the carrying amount that would have been determined, net of depreciation or amortisation, if no impairment loss had been recognised.
Exceptional itemsItems which are signifi cant by virtue of their size or nature and which are considered non-recurring are classifi ed as exceptional operating items. Such items, which include for instance the costs of opening or closing premises, costs of signifi cant restructurings and profi ts and losses made on the disposal of properties are included within the appropriate consolidated income statement category, albeit analysed as a separate line within that category, and are highlighted separately in the notes to the fi nancial statements. Exceptional operating items are excluded from the profi t measures used by the Board to monitor underlying performance.
Revenue recognitionRevenue comprises the value of sales of goods and services to third party customers occurring in the period, stated exclusive of value added tax and net of trade discounts and rebates.
Revenue on the sale of goods is recognised when substantially all of the risks and rewards in the product have passed to the customer, and substantially all of the Group’s work is completed which is usually upon delivery to the customer, or his agent.
Revenue in respect of services rendered, including engineering consultancy and support and software services, is recognised over the period over which they are performed, in relation to the level of work undertaken, project milestones achieved and any future obligations remaining.
When a single sales transaction requires the delivery of more than one product or service (multiple components), the revenue recognition criteria are applied to the separately identifi able components. A component is considered to be separately identifi able if the product or service delivered has standalone value to that customer and the fair value associated with the product or service can be measured reliably. The amount recognised as revenue for each component is the fair value of the element in relation to the fair value of the arrangement as a whole. This requires a degree of management judgement, and the fair value allocations are, by their nature, best estimates. The timing and amount of revenue recognition can vary depending on what assessments have been made. Where there is no separate selling price of an element management determine fair value based on equivalent available products.
The Group does not recognise revenue before delivery has occurred, the risks and rewards of ownership have been transferred to the customer, the amount of revenue can be measured reliably, and collection of the related receivable is reasonably assured. The determination of whether the amount of revenue can be measured reliably or whether receivables are collectible is inherently judgemental.
Finance income and fi nance costsFinance income comprises interest income on funds invested and dividend income. Interest income is recognised as it accrues in profi t or loss, using the effective interest method.
Finance costs comprise interest expense on borrowings and impairment losses recognised on fi nancial assets. Borrowing costs that are not directly attributable to the acquisition, construction or production of a qualifying asset are recognised in profi t or loss using the effective interest method.
Foreign currency gains and losses are reported on a net basis.
NotesContinued
Pace R&A 2012.indd 45 12/03/2012 14:55
creo

Pace plc 2011 Annual Report | 46
2 Accounting policies (continued) Government grantsGrants in respect of specifi c research and development projects are credited to research and development costs within the income statement or against the capitalised development expenditure as appropriate to match to the project’s related expenditure.
Cash and cash equivalentsCash and cash equivalents comprise cash balances and call deposits. The Company considers all highly liquid investments with original maturity dates of three months or less to be cash equivalents. Bank overdrafts that are repayable on demand and form an integral part of the Group’s cash management system are included as a component of cash and cash equivalents for the purpose of the statement of cash fl ows.
Allowance for doubtful debtsTrade receivables are assessed individually for impairment, or collectively where the receivables are not individually signifi cant. Where necessary, provisions for doubtful debts are recorded in the income statement.
InventoryInventory is stated at the lower of cost and net realisable value. Cost is determined on a fi rst-in-fi rst-out basis and includes appropriate transport and handling costs but excludes royalties due only on ultimate sale. Where necessary, provision is made for obsolete, slow-moving and defective inventory.
Property, plant and equipmentThe cost of items of property, plant and equipment is its purchase cost, together with any incidental costs of acquisition.
Depreciation is calculated so as to write off, on a straight-line basis over the expected useful economic lives of the asset concerned, the cost of property, plant and equipment, less any estimated residual values, which are adjusted, if appropriate, at each balance sheet date. The principal economic lives used for this purpose are:
Long Leasehold properties Period of lease Short Leasehold properties Period of lease Plant and machinery 1-10 years Motor vehicles 4 years
Provision is made against the carrying value of items of property, plant and equipment where an impairment in value is deemed to have occurred.
Leased assetsLeases in terms of which the Group assumes substantially all the risks and rewards of ownership are classifi ed as fi nance leases. Assets held under fi nance leases and hire purchase contracts are capitalised in the balance sheet and depreciated over their expected useful lives. The interest element of leasing payments represents a constant proportion of the capital balance outstanding and is charged to the income statement over the period of the lease.
All other leases are regarded as operating leases and the payments made under them are charged to the income statement on a straight-line basis over the lease term.
Foreign currencyTransactions in foreign currencies are translated to the respective functional currencies of Group entities at the foreign exchange rate ruling at the date of the transaction. Monetary assets and liabilities denominated in foreign currencies at the balance sheet date are retranslated to the functional currency at the foreign exchange rate ruling at that date. Foreign exchange differences arising on translation are recognised in the income statement. Non-monetary assets and liabilities that are measured in terms of historical cost in a foreign currency are translated using the exchange rate at the date of the transaction. Non-monetary assets and liabilities denominated in foreign currencies that are stated at fair value are retranslated to the functional currency at foreign exchange rates ruling at the dates the fair value was determined.
The assets and liabilities of foreign operations, including goodwill and fair value adjustments arising on consolidation, are translated to the Group’s presentational currency at foreign exchange rates ruling at the balance sheet date. The revenues and expenses of foreign operations are translated at an average rate for the year where this rate approximates to the foreign exchange rates ruling at the dates of the transactions. Exchange differences arising from this translation of foreign operations are taken directly to
NotesContinued
Pace R&A 2012.indd 46 12/03/2012 14:55
creo

47 | Pace plc 2011 Annual Report
2 Accounting policies (continued) the translation reserve. When a foreign operation is disposed of such that control is lost, the cumulative amount in the translation reserve is reclassifi ed to the income statement as part of the gain or loss on disposal.
Derivative fi nancial instrumentsThe Group uses derivative fi nancial instruments, usually forward foreign exchange contracts, to hedge its exposure to foreign exchange risks arising from operational, fi nancing and investment activities. In accordance with its treasury policy, the Group does not hold or issue derivative fi nancial instruments for trading purposes. The directors have determined that the instruments qualify for cash fl ow hedge accounting.
Derivative fi nancial instruments are classifi ed as cash-fl ow hedges when they hedge the Group’s exposure to variability in cash fl ows that are either attributable to a particular risk associated with a recognised asset or liability, or a highly probable forecast transaction.
Derivatives are reviewed quarterly for effectiveness. Where a derivative fi nancial instrument is designated as a hedge of the variability in cash fl ows of a recognised asset or liability, or highly probable forecast transaction, the effective part of any gain or loss on the movement in fair value of the derivative fi nancial instrument is recognised directly in equity.
The gain or loss on any ineffective part of the hedge is immediately recognised in the income statement within fi nance income/costs. If a hedge of a forecast transaction subsequently results in the recognition of a fi nancial asset or liability, the associated cumulative gains or losses that were recognised directly in equity are reclassifi ed into the income statement when the transaction occurs.
TaxesCurrent tax, including UK Corporation tax and foreign tax, is provided at amounts expected to be paid (or recovered) using the tax rates that have been enacted or substantively enacted by the balance sheet date.
Deferred tax is provided using the balance sheet liability method, providing where relevant for temporary differences between the carrying amounts of assets and liabilities for fi nancial reporting purposes and the amounts used for taxation purposes. Deferred tax is measured using the tax rates that have been enacted or substantively enacted by the balance sheet date and are expected to apply when the asset is realised or the liability settled.
A net deferred tax asset is recognised only when it is probable that suffi cient taxable profi ts will be available in the foreseeable future from which the reversal of the temporary differences can be deducted.
Share-based paymentsThe grant-date fair value of share-based payment awards granted to employees is recognised as an employee expense, with a corresponding increase in equity, over the period that the employees unconditionally become entitled to the awards. The amount recognised as an expense is adjusted to refl ect the number of awards for which the related service and non-market vesting conditions are expected to be met, such that the amount ultimately recognised as an expense is based on the number of awards that meet the related service and non-market performance conditions at the vesting date. For share-based payment awards with non-vesting conditions, the grant-date fair value of the share-based payment is measured to refl ect such conditions and there is no true-up for differences between expected and actual outcomes.
The fair value of the amount payable to employees in respect of share appreciation rights, which are settled in cash, is recognised as an expense with a corresponding increase in liabilities, over the period that the employees unconditionally become entitled to payment. The liability is re-measured at each reporting date and at settlement date. Any changes in the fair value of the liability are recognised as personnel expenses in profi t or loss.
Employee share ownership plansThe material assets, liabilities, income and costs of the Pace plc Employee Benefi ts Trust are treated as being those of the Company. Until such time as the Company’s own shares vest unconditionally with employees, the consideration paid for the shares is deducted in arriving at equity.
Employee benefi tsObligations for contributions to defi ned contribution pension plans are recognised as an expense in the income statement as incurred. The Group has no defi ned benefi t arrangements in place.
NotesContinued
Pace R&A 2012.indd 47 12/03/2012 14:55
creo

Pace plc 2011 Annual Report | 48
2 Accounting policies (continued) Interest-bearing borrowingsInterest-bearing borrowings are recognised initially at fair value less attributable transaction costs. Subsequent to initial recognition, interest-bearing borrowings are stated at amortised cost using the effective interest method, less any impairment losses.
Equity instruments
Equity instruments issued by the Company are recorded at the proceeds received, net of direct issue costs.
Dividends payableDistributions to equity holders are disclosed as a component of the movement in shareholders’ equity. A liability is recorded for a fi nal dividend when the dividend is approved by the Company’s shareholders, and, for an interim dividend, when the dividend is paid.
ProvisionsA provision is recognised in the balance sheet when the Group has a present legal or constructive obligation as a result of a past event, and it is probable that an outfl ow of economic benefi ts will be required to settle the obligation.
(a) RoyaltiesA provision for royalties is recognised where the owners of patents covering technology allegedly used by the Group have indicated claims for royalties relating to the Group’s use (including past usage) of that technology. The provision is based on the latest information available.
(b) WarrantiesA provision for warranties is recognised when the underlying products or services are sold. The provision is based on historical warranty data and a weighting of all possible outcomes against their associated probabilities. The level of warranty provision required is reviewed on a product by product basis and provisions adjusted accordingly in the light of actual performance.
(c) RestructuringA provision for restructuring is recognised when the Group has approved a detailed and formal restructuring plan, and the restructuring has either commenced or has been announced publicly. Provisions are not recognised for future operating losses.
(d) Onerous contractsA provision for onerous contracts is recognised when the expected benefi ts to be derived by the Group from a contract are lower than the unavoidable cost of meeting its obligations under the contract.
(e) Deferred considerationA provision is recognised for deferred consideration relating to acquisitions, based on the expected fair value of the outfl ow.
Changes in accounting policy and disclosuresa) New and amended standards adopted by the Group
There are no new IFRSs or IFRIC interpretations that are effective for the fi rst time for the fi nancial year beginning on or after 1 January 2011 that would be expected to have a material impact on the Group
b) New standards, amendments and interpretations issued but not effective for the fi nancial year beginning 1 January 2011 and not early adopted
IAS 19, ‘Employee benefi ts’ was amended in June 2011. The amendment does not impact the Group.
IFRS 9, ‘Financial Instruments’, addresses the classifi cation, measurement and recognition of fi nancial assets and fi nancial liabilities. IFRS 9 was issued in November 2009 and October 2010. It replaces the parts of IAS 39 that relate to the classifi cation and measurement of fi nancial instruments. The Group is yet to assess IFRS 9’s full impact and intends to adopt IFRS 9 no later than the accounting period beginning on or after 1 January 2015, subject to endorsement by the EU.
IFRS 10, ‘Consolidated Financial Statements’, builds on existing principles by identifying the concept of control as the determining factor in whether an entity should be included within the consolidated fi nancial statements of the parent company. The Group is yet to assess IFRS 10’s full impact and intends to adopt IFRS 10 no later than the accounting period beginning on or after 1 January 2013, subject to endorsement by the EU.
NotesContinued
Pace R&A 2012.indd 48 12/03/2012 14:55
creo

49 | Pace plc 2011 Annual Report
2 Accounting policies (continued) IFRS 12, ‘Disclosures of Interests in Other Entities’, includes the disclosure requirements for all forms of interest in other entities, including joint arrangements, associates, special purpose vehicles and other off balance sheet vehicles. The Group is yet to assess IFRS 12’s full impact and intends to adopt IFRS 12 no later than the accounting period beginning on or after 1 January 2013, subject to endorsement by the EU.
IFRS 13, ‘Fair Value Measurement’, aims to improve consistency and reduce complexity by providing a precise defi nition of fair value and a single source of fair value measurement and disclosure requirements for use across IFRSs. The Group is yet to assess IFRS 13’s full impact and intends to adopt IFRS 13 no later than the accounting period beginning on or after 1 January 2012, subject to endorsement by the EU.
There are no other IFRSs or IFRIC interpretations that are not yet effective that would be expected to have a material impact on the Group.
3 Segmental analysisIn accordance with IFRS 8 ‘Operating Segments’, the chief operating decision-maker (“CODM”) has been identifi ed as the Board of Directors which reviews internal monthly management reports, budget and forecast information to evaluate the performance of the business and make decisions.
During the year the Group changed how it determines operating segments following the continued integration of prior year acquisitions. Segmental information is now provided on the basis of Strategic Business Unit (“SBU”) areas, being the basis on which the Group manages its worldwide interests. This assessment was made based on the current internal reporting framework and management structure, following the conclusion of the Strategic Review announced by the Chairman in 2011.
The Group has the following reportable segments:
• Pace Americas• Pace Europe• Pace Enterprise• Unallocated
Unallocated amounts include central and unallocated revenue, costs and other immaterial SBUs, which are operating segments that are allowed to be aggregated under IFRS 8.
Reconciliations between Pace Americas, Pace Europe, Pace Enterprise and the geographical revenue disclosure given are not possible, due to the different revenue streams which sit under each reportable segment.
Performance is measured based on segmental adjusted EBITA, as included in the internal management information which is reviewed by the CODM. EBITA before exceptional items is used to measure performance as management believes that such information is the most relevant in evaluating the results of certain segments, relative to other entities that operate within these industries.
Revenues disclosed below materially represent revenues to external customers and where appropriate, pricing is determined on an arm’s length basis. There are no material Inter-segment transactions.
The tables below present segmental information on the revised basis, with prior periods amended to conform to the current period presentation.
NotesContinued
Pace R&A 2012.indd 49 15/03/2012 13:01
creo

Pace plc 2011 Annual Report | 50
3 Segmental analysis (continued)
Year ended 31 December 2011 Pace Pace Pace Americas Europe Enterprise Unallocated Total $m $m $m $m $m
Segmental income statement Revenues 1,350.6 871.8 54.0 32.9 2,309.3Adjusted EBITA 157.9 68.3 (12.1) (72.7) 141.4
Exceptional items (12.7)Amortisation (55.7)Interest (18.3)Tax (15.9)
Profi t for the year 38.8
Year ended 31 December 2010 (restated) Pace Pace Pace Americas Europe Enterprise Unallocated Total $m $m $m $m $m
Segmental income statement Revenues 1,120.6 918.8 21.0 2.5 2,062.9Adjusted EBITA 146.7 85.7 (7.4) (64.4) 160.6
Exceptional items (29.5)Amortisation (18.1)Interest (2.8)Tax (32.9)
Profi t for the year 77.3
Major customersTransactions with the Group’s two largest customers represented 27% (2010: 17%) of the Group’s total revenues and are disclosed within the Pace Americas reporting segment.
Geographical analysisIn presenting information on the basis of geographical segments, segment revenue is based on the geographical location of customers
Revenue by destination Restated 2011 2010 $m $m
Europe 457.7 568.2North America 1,065.1 838.9Latin America 469.0 375.6Rest of World 317.5 280.2
2,309.3 2,062.9
NotesContinued
Pace R&A 2012.indd 50 12/03/2012 14:55
creo

51 | Pace plc 2011 Annual Report
3 Segmental analysis (continued) Segment assets are based on the geographical location of the assets. The split of non-current assets by location is as follows:
Non-current assets Restated 2011 2010 $m $m
UK 65.7 54.0Europe 183.9 198.5Latin America 5.4 -North America 412.6 445.6Rest of world 2.9 8.5
670.5 706.6
Non-current assets relate to property, plant and equipment and intangible assets, and, as required under IFRS 8, exclude deferred tax assets, fi nancial instruments and post-employment benefi t assets.
The Group has three main revenue streams, being STB, Gateways and Software & Services. These revenue streams arise in each operating segment and are not defi ned by geographical locations. The following table provides an analysis of the Group’s revenue streams according to those classifi cations.
In 2010 the majority of revenues were derived from the provision of STB, and disclosure of other revenue streams was not considered necessary based on their nature.
Following the acquisitions in 2010, further disclosure is now considered appropriate.
Restated 2011 2010 $m $m
Set-top boxes 1,775.4 1,935.9Gateways 433.5 107.4Software & Services 100.4 19.6
2,309.3 2,062.9
NotesContinued
Pace R&A 2012.indd 51 12/03/2012 14:55
creo

Pace plc 2011 Annual Report | 52
4 Expenses and auditors’ remuneration Restated 2011 2010 $m $m
Fees payable to the Company’s auditors for the audit of: Company’s annual fi nancial statements 0.6 0.4 Fees payable to the Company’s auditors and its associates for other services to the Group: Audit of the Company’s subsidiaries fi nancial statements pursuant to legislation 0.2 0.4Other services relating to taxation 0.2 0.1Services relating to corporate fi nance - 1.2Other services pursuant to interim reporting legislation 0.1 0.1Other services 0.2 - Depreciation of property, plant and equipment Owned 29.0 16.3 Other operating lease rentals Land and buildings 9.7 9.6 Loss on disposal of property, plant and equipment 1.6 0.5 Net foreign exchange losses recognised within operating profi t 0.7 0.2 Research and development expenditure recognised as an expense 160.6 120.0
5 Exceptional items Restated 2011 2010 $m $m
Restructuring and reorganisation costs 11.1 16.1Director’s loss of offi ce 1.6 -Acquisition transaction costs - 9.1Retail business exit costs - 4.3
12.7 29.5
The restructuring and reorganisation costs relate to a restructuring programme within the Group, which was announced in November 2011 and represent the costs of redundancy and associated professional fees. The restructuring and reorganisation costs for the year ended 31 December 2010 relate to the integration of acquisitions into the Group and employee costs in relation to the new Group structure that has been implemented to manage the enlarged Group.
6 Finance income / (costs) Restated 2011 2010 $m $m
Finance income – interest on bank deposits 0.2 1.2
Finance costs Bank borrowings (16.7) (3.4)Other fi nance costs (1.8) (0.6)
(18.5) (4.0)
NotesContinued
Pace R&A 2012.indd 52 15/03/2012 13:01
creo
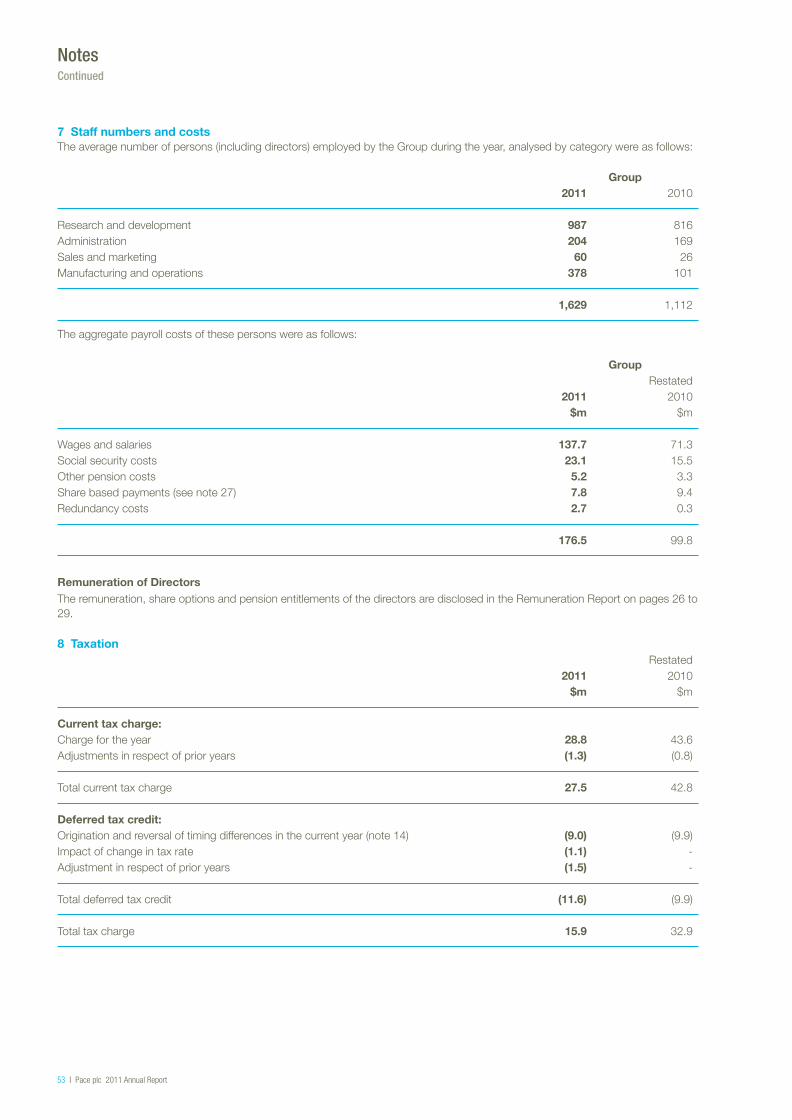
53 | Pace plc 2011 Annual Report
7 Staff numbers and costsThe average number of persons (including directors) employed by the Group during the year, analysed by category were as follows:
Group 2011 2010 Research and development 987 816Administration 204 169Sales and marketing 60 26Manufacturing and operations 378 101
1,629 1,112
The aggregate payroll costs of these persons were as follows:
Group Restated 2011 2010 $m $m Wages and salaries 137.7 71.3Social security costs 23.1 15.5Other pension costs 5.2 3.3Share based payments (see note 27) 7.8 9.4Redundancy costs 2.7 0.3
176.5 99.8
Remuneration of DirectorsThe remuneration, share options and pension entitlements of the directors are disclosed in the Remuneration Report on pages 26 to 29.
8 Taxation Restated 2011 2010 $m $m
Current tax charge: Charge for the year 28.8 43.6Adjustments in respect of prior years (1.3) (0.8)
Total current tax charge 27.5 42.8 Deferred tax credit: Origination and reversal of timing differences in the current year (note 14) (9.0) (9.9)Impact of change in tax rate (1.1) -Adjustment in respect of prior years (1.5) -
Total deferred tax credit (11.6) (9.9)
Total tax charge 15.9 32.9
NotesContinued
Pace R&A 2012.indd 53 12/03/2012 14:55
creo

Pace plc 2011 Annual Report | 54
8 Taxation (continued)Reconciliation of effective tax rate to UK statutory rate of 26.5% (2010: 28%):
Restated 2011 2010 $m $m
Profi t before tax 54.7 110.2 Tax using UK statutory tax rate at 26.5% (2010: 28%) 14.5 30.8 Effects of: Expenses not deductible for tax purposes 3.6 3.7Research and development tax credit (2.6) (3.9)Overseas tax not at 26.5% (2010: 28%) 4.3 3.1Impact of change in tax rate (1.1) -Adjustments to tax charge in respect of previous periods (2.8) (0.8)
Total tax charge 15.9 32.9
During the year, as a result of the change in the Corporation tax rate from 28% to 25%, that was substantively enacted on 5 July 2011 and that will be effective from 1 April 2012, the relevant deferred tax balances have been re-measured.
Deferred tax expected to reverse in the future has been measured using the effective rate that will apply for the period (25%). Further reductions to the Corporation tax rate have been announced. The changes, which are expected to be enacted separately each year, propose to reduce the rate by 1% per annum to 23% by 1 April 2014. These changes had not been substantively enacted at the balance sheet date and, therefore, are not recognised in these fi nancial statements.
9 Earnings per ordinary share Restated 2011 2010
Basic earnings per ordinary share 13.2c 26.4c Diluted earnings per ordinary share 12.5c 25.0c
Adjusted basic earnings per ordinary share 29.7c 37.1c Adjusted diluted earnings per ordinary share 28.1c 35.2c
The calculation of basic earnings per share is based on a profi t after tax of $38.8m (2010 restated: $77.3m) divided by the weighted average number of ordinary shares in issue of 294,189,977 (2010: 293,700,084), excluding shares held by the Employee Benefi ts Trust.
2011 2010
Number of shares (million) Weighted average number of ordinary shares in issue during the year 294.2 293.7Dilutive effect of options outstanding 16.8 15.5
Diluted weighted average number of ordinary shares in issue during the year 311.0 309.2
Diluted earnings per ordinary share varies from basic earnings per ordinary share due to the effect of the notional exercise of outstanding share options.
NotesContinued
Pace R&A 2012.indd 54 12/03/2012 14:55
creo

55 | Pace plc 2011 Annual Report
9 Earnings per ordinary share (continued)To better refl ect underlying performance, adjusted earnings per share is also calculated (adjusting profi t after tax to remove amortisation of other intangibles and exceptional items, post tax). The earnings amount is calculated as follows: Restated 2011 2010 $m $m
Profi t after tax 38.8 77.3Amortisation charge 55.7 18.1Tax effect of above (16.2) (6.0)Exceptional items 12.7 29.5Tax effect of above (3.7) (9.9)
Adjusted profi t after tax 87.3 109.0
The Group’s effective tax rate has been used to calculate the tax effect of adjusted items.
10 Dividend per ordinary share Restated 2011 2010 Per share $m Per share $m
2010 Final: paid 6 July 2011 2.25c 6.6 1.55c 4.72011 Interim: paid 9 December 2011 1.25c 3.5 1.12c 3.3
3.50c 10.1 2.67c 8.0
In addition, the directors are proposing a fi nal dividend for 2011 of 2.50 cents per ordinary share. This will be payable on 4 July 2012 to shareholders on the register at 8 June 2012, subject to approval by shareholders at the forthcoming Annual General Meeting, and has not been included as a liability in these fi nancial statements.
NotesContinued
Pace R&A 2012.indd 55 12/03/2012 14:55
creo

Pace plc 2011 Annual Report | 56
11 Intangible assets Group Customer Development contracts and Technology Other Goodwill expenditure relationships and patents Other intangibles $m $m $m $m $m $m
Cost At 31 December 2009 (restated) 113.3 132.8 22.2 16.6 - 38.8Exchange adjustments (8.5) (4.9) (1.3) (0.9) - (2.2)Additions 233.6 56.9 - - - -Acquisitions - 0.2 143.4 116.1 10.9 270.4Retirement of assets - (21.2) - - - -
At 31 December 2010 (restated) 338.4 163.8 164.3 131.8 10.9 307.0
Fair value adjustment (2.8) - - - - -
At 31 December 2010 (restated) 335.6 163.8 164.3 131.8 10.9 307.0
Additions - 57.0 - - - -Retirement of assets - (10.9) - - - -
At 31 December 2011 335.6 209.9 164.3 131.8 10.9 307.0 Amortisation At 31 December 2009 (restated) - 86.6 9.2 7.1 - 16.3Exchange adjustments - (2.3) (0.7) (0.4) - (1.1)Provided in the year - 56.1 9.8 7.7 0.6 18.1Retirement of assets - (21.2) - - - -
At 31 December 2010 (restated) - 119.2 18.3 14.4 0.6 33.3
Exchange adjustments - (0.2) - - - -Provided in the year - 47.9 21.0 30.6 4.1 55.7Retirement of assets - (10.9) - - - -
At 31 December 2011 - 156.0 39.3 45.0 4.7 89.0 Net book value at 31 December 2009 (restated) 113.3 46.2 13.0 9.5 - 22.5 Net book value at 31 December 2010 (restated) 335.6 44.6 146.0 117.4 10.3 273.7 Net book value at 31 December 2011 335.6 53.9 125.0 86.8 6.2 218.0
GoodwillAll goodwill has arisen from business combinations and relates to the following acquisitions:• XCom Multimedia Communications SA (now Pace France SAS) in February 2001;• The set-top box and connectivity solutions business of Royal Philips Electronics (Pace France) in April 2008;• Bewan Systems SA (Bewan) in April 2010;• 2Wire, Inc (2Wire) in October 2010; and• Latens Systems Limited (Latens) in November 2010.
NotesContinued
Pace R&A 2012.indd 56 12/03/2012 14:55
creo

57 | Pace plc 2011 Annual Report
11 Intangible assets (continued) The carrying amount of goodwill is allocated across Cash Generating Units (CGUs) as follows:• $101.8m within Pace Europe;• $181.6m within Pace Americas; and• $52.2m within Pace Enterprise.
These CGUs are independent sources of income streams and represent the lowest level within the Group at which the associated goodwill is monitored for management purposes. The Group tests goodwill annually for impairment, or more frequently if there are indications that goodwill might be impaired.
The recoverable amount of CGUs is determined from value in use calculations using cash fl ow projections based on a combination of individual fi nancial forecasts of varying time periods, which have been approved by management, and an appropriate long term growth rate of 1% (2010: between 1% and 2%).
To prepare value in use calculations, the cash fl ow forecasts are discounted back to present value using an appropriate market-based discount rate. The pre-tax discount rate used to calculate the value in use was 9.55% (2010: between 10% and 14%).
The Directors have reviewed the recoverable amounts of the CGUs and have also considered reasonable changes in the assumptions, being increases in the pre-tax discount rate of up to an additional 10%. The Directors consider that there is suffi cient headroom within the value in use calculations at 31 December 2011.
Adjustments to the carrying value of Goodwill made in the adjustment period have been presented as prior year adjustments and relate to the following:
• $3.2m reduction in respect of adjustments to the provisional fair value of deferred revenue in 2Wire;• $6.9m reduction in respect of tax losses brought forward in 2Wire which were found to be recognisable;• $6.9m addition in respect of an adjustment to the deferred tax calculation on other timing differences; and• $0.4m addition in respect of Trade Receivables within Latens which were found to be unrecoverable.
Other intangiblesOther intangibles relate to trademarks and licence agreements, customer contracts and relationships recognised as part of the acquisition of the Pace France business.
NotesContinued
Pace R&A 2012.indd 57 12/03/2012 14:55
creo

Pace plc 2011 Annual Report | 58
11 Intangible assets (continued)
Company Development expenditure $m
Cost At 31 December 2009 (restated) 103.7Exchange adjustments (3.9)Additions 36.3Disposals (13.3)
At 31 December 2010 (restated) 122.8
Additions 34.2Retirement of assets (9.9)
At 31 December 2011 147.1 Amortisation At 31 December 2009 (restated) 77.0Exchange adjustments (2.9)Provided in the year 32.9Disposals (13.3)
At 31 December 2010 (restated) 93.7
Provided in the year 27.4Retirement of assets (9.9)
At 31 December 2011 111.2 Net book value at 31 December 2009 (restated) 26.7 Net book value at 31 December 2010 (restated) 29.1 Net book value at 31 December 2011 35.9
NotesContinued
Pace R&A 2012.indd 58 12/03/2012 14:55
creo

59 | Pace plc 2011 Annual Report
12 Property, plant and equipmentGroup Short Plant, Long leasehold machinery leasehold land and and motor buildings buildings vehicles Total $m $m $m $m
Cost At 31 December 2009 (restated) - 18.4 84.3 102.7Exchange adjustments - (0.7) (4.0) (4.7)Additions - 9.0 22.5 31.5Acquisitions 0.9 - 6.7 7.6Disposals (0.3) (0.7) (4.2) (5.2)
At 31 December 2010 (restated) 0.6 26.0 105.3 131.9
Exchange adjustments - - (1.1) (1.1)Additions - 13.0 28.5 41.5Disposals (0.6) (2.4) (11.6) (14.6) At 31 December 2011 - 36.6 121.1 157.7 Depreciation At 31 December 2009 (restated) - 9.1 62.0 71.1Exchange adjustments - (0.3) (3.2) (3.5)Provided in the year 0.2 3.1 13.0 16.3Disposals - (0.5) (4.2) (4.7)
At 31 December 2010 (restated) 0.2 11.4 67.6 79.2
Exchange adjustments - - (0.5) (0.5)Provided in the year - 6.1 22.9 29.0Disposals (0.2) (1.4) (11.4) (13.0)
At 31 December 2011 - 16.1 78.6 94.7 Net book value at 31 December 2009 (restated) - 9.3 22.3 31.6 Net book value at 31 December 2010 (restated) 0.4 14.6 37.7 52.7 Net book value at 31 December 2011 - 20.5 42.5 63.0
NotesContinued
Pace R&A 2012.indd 59 12/03/2012 14:55
creo

Pace plc 2011 Annual Report | 60
12 Property, plant and equipment (continued)Company Short Plant, leasehold machinery land and and motor buildings vehicles Total $m $m $m
Cost At 31 December 2009 (restated) 15.2 41.7 56.9Exchange adjustments (0.6) (1.6) (2.2)Additions 4.8 9.6 14.4Disposals - (0.2) (0.2)
At 31 December 2010 (restated) 19.4 49.5 68.9
Additions 3.9 11.9 15.8Disposals - (0.3) (0.3)
At 31 December 2011 23.3 61.1 84.4
Depreciation At 31 December 2009 (restated) 8.2 28.9 37.1Exchange adjustments (0.3) (1.1) (1.4)Provided in the year 2.2 6.6 8.8Disposals - (0.2) (0.2)
At 31 December 2010 (restated) 10.1 34.2 44.3
Provided in the year 3.2 7.6 10.8Disposals - (0.2) (0.2)
At 31 December 2011 13.3 41.6 54.9 Net book value at 31 December 2009 (restated) 7.0 12.8 19.8
Net book value at 31 December 2010 (restated) 9.3 15.3 24.6 Net book value at 31 December 2011 10.0 19.5 29.5
NotesContinued
Pace R&A 2012.indd 60 12/03/2012 14:55
creo

61 | Pace plc 2011 Annual Report
13 Investments in and loans to group and other companiesCompany Shares in group Intra-group loans undertakings $m $m
Cost At 31 December 2009 (restated) 107.7 114.1Exchange adjustments (4.0) (4.2)Additions 191.9 244.6
At 31 December 2010 (restated) 295.6 354.5
Conversion of intra-group loans to shares (94.1) 94.1Repayment (1.8) -
At 31 December 2011 199.7 448.6 Impairment At 31 December 2009 (restated) 102.2 -Exchange adjustments (3.8) -
At 31 December 2010 (restated) 98.4 -
Reversal of impairment (89.3) -
At 31 December 2011 9.1 - Net book value at 31 December 2009 (restated) 5.5 114.1 Net book value at 31 December 2010 (restated) 197.2 354.5 Net book value at 31 December 2011 190.6 448.6
During the year the Company converted $94.1m of debt owed by Pace Distribution (Overseas) Limited into additional equity in that entity. An impairment of $89.3m, which had previously been charged against the loan through the income statement, was reversed as the conversion meant that the impairment was no longer required.
NotesContinued
Pace R&A 2012.indd 61 12/03/2012 14:55
creo

Pace plc 2011 Annual Report | 62
13 Investments in and loans to group and other companies (continued)At 31 December 2011 the Company had a benefi cial interest in the equity of the following subsidiary undertakings:
Nature of Directly owned Percentage Country of operations by (Note a) holding incorporation Pace Advanced Consumer Electronics Limited Dormant 1 100% UKPace Asia Pacifi c Limited Support 1 100% Hong KongPace Distribution GmbH Dormant 1 100% GermanyPace Distribution (Overseas) Limited Holding Company 1 100% UKPace Micro Technology Limited Dormant 1 100% UKPace (HK) Limited Dormant 1 100% Hong KongPace Australia Pty Limited Support 1 100% AustraliaPace Americas Limited Holding Company 4 100% UKPace Americas, Inc Trading 5 100% USAPace Europe SAS Support 4 100% FrancePace Micro Technology GmbH Support 1 100% GermanyPace Micro Technology (India) Private Ltd Support 1 100% IndiaPace Overseas Distribution Limited Trading 4 100% UKPace France SAS Trading 1 100% FrancePace USA Inc Trading 10 100% USAPace Belgium NV Dormant 3 100% BelgiumPace Asia Home Networks Sdn BHD Support 3 100% MalaysiaPace Software and Services Limited Trading 3 100% UKPace Brasil – Industria Electronica e Comercio Ltda Trading 14 100% BrazilPace Iberia SL Trading 3 100% SpainSTB Anchor Mexicana SA DE CV Trading 13 100% MexicoPace China Operations Support 2 100% ChinaPace Operations South Africa (Propriety) Limited Support 6 100% South AfricaPace Americas Holdings Inc. Holding 1 100% USAPace Americas Investments LLC Holding 9 100% USALatens Systems Ltd Trading 1 100% UKLatens Systems (Canada) Ltd Support 8 100% CanadaLatens Services Ltd Trading 8 100% UKLatens Systems LLC Trading 8 100% USALatens Systems (India) Private Ltd Support 8 100% India2Wire, Inc Trading 11 100% USA2Wire Asia Pacifi c Limited Dormant 7 100% Hong Kong2Wire (B.C.) Limited Support 7 100% Canada2Wire International Ltd Dormant 7 100% UKKenati Technologies Inc Holding 7 100% USA2Wire Singapore Pte Ltd Support 7 100% Singapore 2Wire Development Center Private Ltd Support 12 100% India
Note a Directly owned by:1 Pace plc 8 Latens Systems Limited2 Pace Asia Pacifi c Limited 9 Pace Americas Holdings Inc.3 Pace France SAS 10 Pace Americas, Inc4 Pace Distribution (Overseas) Limited 11 Pace Americas Investments LLC5 Pace Americas Limited 12 Kenati Technologies Inc6 Pace Overseas Distribution Limited 13 Pace USA Inc (98%), Pace France SAS (2%)7 2Wire, Inc 14 Pace France SAS (99.99998%), Pace Distribution (Overseas) Limited (0.00002%)
Each of the subsidiary undertakings listed above has been consolidated in the Group’s fi nancial statements.
Each of the subsidiary undertakings listed above has a fi nancial year end of 31 December with the exception of Pace Micro Technology (India) Private Limited, Latens Systems (India) Private Ltd and 2Wire Development Centre Private Ltd (31 March).
The class of share capital held is Ordinary with the exception of Pace Distribution (Overseas) Limited where there is Preference share capital in addition to Ordinary share capital.
NotesContinued
Pace R&A 2012.indd 62 12/03/2012 14:55
creo

63 | Pace plc 2011 Annual Report
14 Deferred tax assets / (liabilities)The movements in deferred tax assets and liabilities during the year are shown below:
Group Short Property, plant term timing and equipment Trading losses Intangibles differences Total $m $m $m $m $m
Recognised asset / (liabilities) At 31 December 2009 (restated) 1.6 - (23.8) 8.8 (13.4)Exchange adjustments - - 1.0 (0.3) 0.7Credited / (charged) to income statement (1.4) 1.1 6.2 4.0 9.9Credited / (charged) to other comprehensive income - - - (3.3) (3.3)Arising on acquisitions - 37.6 (91.9) 21.8 (32.5)
At 31 December 2010 (restated) 0.2 38.7 (108.5) 31.0 (38.6)
Fair value adjustment - 6.9 (6.9) - -
At 31 December 2010 (restated) 0.2 45.6 (115.4) 31.0 (38.6)
Credited / (charged) to income statement (0.9) (7.5) 21.2 (1.2) 11.6Credited / (charged) to other comprehensive income - - - (1.5) (1.5)
At 31 December 2011 (0.7) 38.1 (94.2) 28.3 (28.5) Shown as deferred tax assets 0.8 38.1 - 28.3 67.2Shown as deferred tax liabilities (1.5) - (94.2) - (95.7)
Company Short Property, plant term timing and equipment Trading losses Intangibles differences Total $m $m $m $m $m
Recognised asset / (liabilities) At 31 December 2009 (restated) 1.7 - (5.6) 3.5 (0.4)Exchange adjustments (0.1) - 0.2 (0.1) -Credited / (charged) to income statement (1.4) - - 3.1 1.7Credited / (charged) to other comprehensive income - - - (3.3) (3.3)
At 31 December 2010 (restated) 0.2 - (5.4) 3.2 (2.0)
Credited / (charged) to income statement 0.6 - (0.4) (0.3) (0.1)Credited / (charged) to other comprehensive income - - - (1.5) (1.5)
At 31 December 2011 0.8 - (5.8) 1.4 (3.6) Shown as deferred tax assets 0.8 - - 1.4 2.2Shown as deferred tax liabilities - - (5.8) - (5.8)
No deferred tax asset has been recognised on unused tax losses, outside the UK, of $3.5m (2010 restated: $2.0m) as it is not considered probable that suffi cient taxable profi t will be available against which the tax losses can be utilised.
NotesContinued
Pace R&A 2012.indd 63 12/03/2012 14:55
creo

Pace plc 2011 Annual Report | 64
15 Inventories Group Company Restated Restated 2011 2010 2011 2010 $m $m $m $m Raw materials and consumable stores 38.9 37.8 26.2 23.1Finished goods 111.1 184.9 23.1 9.8
150.0 222.7 49.3 32.9
16 Trade and other receivables Group Company Restated Restated 2011 2010 2011 2010 $m $m $m $m Trade receivables 369.8 399.8 97.2 94.9Amounts owed by subsidiary undertakings - - 327.4 290.8Other receivables 22.8 25.6 7.0 4.3Prepayments and accrued income 9.7 8.0 5.1 2.3
402.3 433.4 436.7 392.3
Group trade receivables of $399.8m at 31 December 2010 have been reduced by $0.4m as a fair value adjustment was made within the measurement period. See note 11 for further details.
17 Trade and other payables Group Company Restated Restated 2011 2010 2011 2010 $m $m $m $m
Trade payables 287.9 455.7 194.7 219.0Amounts payable to subsidiary undertakings - - 177.0 76.4Social security and other taxes 3.9 3.4 1.5 1.2Other payables 24.4 11.4 0.4 0.6Accruals 57.3 67.9 11.5 17.1
373.5 538.4 385.1 314.3
Group other payables of $11.4m at 31 December 2010 have been reduced by $3.2m as a fair value adjustment was made within the measurement period. See note 11 for further details.
18 Interest bearing loans and borrowingsThe Group’s interest-bearing loans and borrowings are measured at amortised cost. For more information about the Group’s exposure to interest rate, foreign currency and liquidity risk, see note 19.
The Company has a facility underwritten by RBS and HSBC incorporating Lloyds TSB, Barclays, Santander and Yorkshire Bank in a syndicated deal.
The main facilities at 31 December 2011, which are all denominated in US Dollars, consist of a $225m term loan facility together with a $150m revolving credit facility.
The facilities have a termination date of 31 March 2014. Amortisation of the original $300m term loan commenced on 20 June 2011 with repayments of $37.5m made every six months until 20 December 2013. A fi nal bullet repayment of $75m is due to be made on 31 March 2014.
NotesContinued
Pace R&A 2012.indd 64 12/03/2012 14:55
creo

65 | Pace plc 2011 Annual Report
NotesContinued
18 Interest bearing loans and borrowings (continued)Interest is payable on the facilities at LIBOR plus a specifi ed margin. The margin is subject to a ratchet linked to overall leverage conditions of the Group.
Facility arrangement and associated fees of $9m were capitalised and are being amortised over the life of the facilities and included within the overall interest costs.
There are certain fi nancial covenants with regard to the facilities. These are principally linked to interest cover and net leverage.
In addition to the main facilities, a Bi-lateral Bonding Facility with RBS was also entered into and covers bank guarantees, principally in respect of Duty and Deferment requirements ($155,000).
The carrying value of the year end borrowings position is as follows. Restated 2011 2010 $m $m
Non-current liabilities Bank term loans 147.3 219.8 Current liabilities Bank term loans 73.1 72.7Bank revolving credit facility 150.0 150.0
223.1 222.7
The face value of the borrowings was $150m (2010 restated: $225m) in respect of the bank term loans within non-current liabilities, $75m (2010 restated: $75m) in respect of the bank term loans within current liabilities and $150m (2010 restated: $150m) in respect of the bank revolving credit facility.
The difference between the face value amounts and the amounts in the above table is $2.7m (2010 restated: $5.2m) in non-current liabilities and $1.9m (2010 restated: $2.3m) in current liabilities which represents facility arrangement fees and accrued interest costs. Reconciliation of net cash fl ow to movement in net debt Restated 2011 2010 $m $m
Cash and cash equivalents at end of the year 48.7 131.4Current borrowings (223.1) (222.7)Non-current borrowings (147.3) (219.8)
Closing net debt (321.7) (311.1)
Pace R&A 2012.indd 65 12/03/2012 14:55
creo

Pace plc 2011 Annual Report | 66
19 Derivatives and other fi nancial instrumentsShort term debtors and creditors that meet the defi nition of a fi nancial asset or liability respectively have been excluded from all the following analysis, other than the currency risk exposures.
This note provides information about the contractual terms of the Group and Company’s interest bearing loans and borrowings. For more information about the Group and Company’s exposure to interest rate, credit risk and foreign currency risk, see pages 11 and 12 of the Report of the Directors.
(a) Interest rate risk profi le of cash/bank overdrafts Floating rate Interest free Total $m $m $m
Currency At 31 December 2011: Sterling 2.1 (0.4) 1.7US Dollar (372.0) 22.7 (349.3)Euro (15.2) 16.3 1.1Other 21.2 3.6 24.8
Total (363.9) 42.2 (321.7) At 31 December 2010 (restated): Sterling (0.2) 1.1 0.9US Dollar (373.6) 7.0 (366.6)Euro 29.9 2.2 32.1Other 3.4 19.1 22.5
Total (340.5) 29.4 (311.1)
The interest rates on Sterling, US Dollar, Euro and other fl oating rate fi nancial assets are linked to the relevant bank base rates.
(b) Currency exposures
The table below shows the Group’s currency exposures that give rise to the net currency gains and losses recognised in the income statement. Such exposures comprise the monetary assets and monetary liabilities of the Group which are not denominated in the operating or functional currency of the operating unit involved.
Net foreign currency monetary assets / (liabilities) Sterling US Dollar Euro Other Total $m $m $m $m $m
Functional currency of group operation At 31 December 2011: Sterling - 0.3 1.4 (0.1) 1.6US Dollar (5.9) - 32.3 (0.3) 26.1Euro 2.8 (33.4) - (0.1) (30.7)Other - (4.9) - - (4.9)
Total (3.1) (38.0) 33.7 (0.5) (7.9) At 31 December 2010 (restated): Sterling - (517.9) 63.4 3.9 (450.6)US Dollar - - - - -Euro 0.6 (63.8) - (0.5) (63.7)Other - 8.5 - - 8.5
Total 0.6 (573.2) 63.4 3.4 (505.8)
NotesContinued
Pace R&A 2012.indd 66 12/03/2012 14:55
creo

67 | Pace plc 2011 Annual Report
19 Derivatives and other fi nancial instruments (continued)
(c) Gains and losses on currency derivatives
The majority of the Group’s production costs are denominated in US Dollars. The Group endeavours to obtain as much of its income as possible in US Dollars. The Group’s policy is to hedge forward progressively against movements in the value of foreign currencies, in respect of cash receipts and payments expected from transactions over the next 12 months.
Outstanding currency derivatives: Sell Buy Principal Average currency currency amount rate Maturity
At 31 December 2011 US Dollar GBP $101.9m 0.64 Jan 12 - Dec 12 Euro US Dollar $105.5m 1.35 Jan 12 - Nov 12
At 31 December 2010 (restated) Euro US Dollar $239.5m 1.35 Jan 11 – Mar 12
The Group’s derivatives contracts qualify for hedge accounting and have a fair value at the balance sheet date of $4.5m (2010 restated: $2.3m).
(d) Credit risk
The Group’s credit risk is primarily attributable to its trade debtors. Credit risk is managed by monitoring the aggregate amount and duration of exposure to any one customer depending upon their credit rating. The Group does not require collateral in respect of fi nancial assets. There were no signifi cant impairments in the periods under review.
Credit riskExposure to credit riskThe carrying amount of fi nancial assets represents the maximum credit exposure. The maximum exposure to credit risk at the reporting date was:
Carrying amount Restated 2011 2010 $m $m
Trade receivables 369.8 399.8Cash and cash equivalents 48.7 131.4Forward exchange contracts used for hedging Assets 4.8 5.9
423.3 537.1
The maximum exposure to credit risk for receivables at the reporting date by geographic region was:
Carrying amount Restated 2011 2010 $m $m
Domestic 94.9 21.0Euro-zone countries 24.0 96.3United States 195.1 190.7Other regions 55.8 91.8
369.8 399.8
NotesContinued
Pace R&A 2012.indd 67 12/03/2012 14:55
creo

Pace plc 2011 Annual Report | 68
19 Derivatives and other fi nancial instruments (continued) The credit risk on liquid funds is limited because counterparties are banks with high credit ratings. At each balance sheet date there was no signifi cant concentration of credit risk, other than those customers with revenues in excess of 10% of the Group’s total revenues, as explained in note 3.
Of the trade receivables at 31 December 2011 94% were within terms (2010: 91%). Of the balance 4% were less than 30 days past due, with the remaining amounts over 30 days due (2010: 100% less than 30 days past due). There were no material bad debts provisions deemed necessary against such balances, in the current or preceding years.
(e) Liquidity risk
The Group manages liquidity risk by maintaining adequate cash balances and banking facilities, continuously monitoring forecast and actual cash fl ows and matching the maturity profi les of fi nancial assets and liabilities.
Liquidity riskThe following are the contractual maturities of fi nancial liabilities, including estimated interest payments and excluding the impact of netting arrangements.
Carrying Contractual 6 months 6-12 1-2 2-3 3-4 amount cash fl ows or less months years years years $m $m $m $m $m $m $m
At 31 December 2011: Non-derivative fi nancial liabilities Trade and other payables within one year 373.5 (373.5) (373.5) - - - -External borrowings 370.4 (393.6) (42.6) (42.0) (82.5) (226.5) -Deferred consideration 15.7 (15.7) (15.7) - - - -Derivative fi nancial liabilities Forward exchange contracts used for hedging Outfl ow - (207.4) (128.8) (78.6) - - - Infl ow 4.5 211.9 131.3 80.6 - - -
Total 764.1 (778.3) (429.3) (40.0) (82.5) (226.5) -
At 31 December 2010 (restated): Non-derivative fi nancial liabilities Trade and other payables within one year 538.4 (538.4) (538.4) - - - -External borrowings 442.5 (478.0) (41.2) (40.8) (80.1) (78.3) (237.6)Deferred and contingent consideration 19.1 (19.1) - - (19.1) - -Derivative fi nancial liabilities Forward exchange contracts used for hedging Outfl ow - (677.4) (581.7) (91.5) (4.2) - - Infl ow 2.3 679.7 583.7 92.0 4.0 - -
Total 1,002.3 (1,033.2) (577.6) (40.3) (99.4) (78.3) (237.6)
It is not expected that the cash fl ows included in the maturity analysis could occur signifi cantly earlier, or at signifi cantly different amounts.
The directors have considered the periods in which the cash fl ows associated with derivatives that are cash fl ow hedges are expected to occur, together with the timing of impact on profi t or loss, and have determined that the timings are as disclosed in the above table.
(f) Sensitivity analysis
In managing interest rate and currency risks the Group aims to reduce the impact of short term fl uctuations on the Group’s earnings. The Directors consider that a change of 100 basis points in interest rates during a twelve month period would have a $0.9m impact on cash fl ows (2010 restated: $2.8m).
NotesContinued
Pace R&A 2012.indd 68 12/03/2012 14:55
creo

69 | Pace plc 2011 Annual Report
19 Derivatives and other fi nancial instruments (continued) The Group’s key foreign exchange exposures are in respect of the Euro and Sterling. A 1% strengthening in the US Dollar against these would have an adverse impact of $0.9m on the profi t reported in the year ended 31 December 2011 and an adverse impact of $4.4m on equity. In the year ended 31 December 2010, prior to the change in the Group’s functional and presentational currency, the Group’s key foreign exchange exposures were in respect of the Euro and US Dollar.
(g) Capital management
Capital risk managementThe Group and Company manage their capital being the net assets base, to ensure their ability to continue as a going concern and to maintain an optimal capital structure to reduce the cost of capital. The capital structure of the Group and Company comprises equity attributable to equity holders of Pace plc, consisting of issued ordinary share capital, reserves and retained earnings as disclosed in notes 21, 22 and 24 and cash and cash equivalents and borrowings as disclosed in note 18.
The Group and Company maintain or adjust their capital structure through the payment of dividends to shareholders, issue of new shares and buy-back of existing shares and issuing new borrowings or repaying existing borrowings.
Note 21 to the Financial Statements provides details regarding the Company’s share capital and movements in the period. There were no breaches of any requirements with regard to any relevant conditions imposed by either the UKLA or the Company’s Articles of Association during the periods under review.
Details of the Company’s facilities are given in note 18. Such facilities are subject to certain fi nancial performance covenants. There have been no breaches of these covenants in the period under review.
(h) Fair value
Fair value versus carrying amountsThe directors have considered the fair values of fi nancial assets and liabilities and have determined that these are not materially different from the carrying amounts shown in the Group balance sheet.
Fair value hierarchyThe Group’s fi nancial instruments, namely forward exchange contracts, have been determined to represent Level 1 instruments (characterised by the existence of quoted prices (unadjusted) in active markets for identical assets or liabilities).
(i) Exchange rates
The following signifi cant exchange rates applied during the year:
Average rate Spot rate 2011 2010 2011 2010 Euro 1.39 1.16 1.31 1.18US Dollar - 1.55 - 1.55Sterling 0.62 - 0.64 -
The 2010 rates above refl ect those presented in the prior year fi nancial statements when the functional and presentational currency of the Group was Sterling.
NotesContinued
Pace R&A 2012.indd 69 15/03/2012 13:02
creo

Pace plc 2011 Annual Report | 70
20 ProvisionsGroup Royalties under negotiation Warranties Other Total $m $m $m $m
At 31 December 2009 (restated) 17.5 31.4 5.5 54.4Acquisitions - 5.6 - 5.6Net charge for the year 6.8 31.0 23.3 61.1Utilised (8.7) (21.1) (1.6) (31.4)Exchange adjustments (0.6) (1.8) (0.5) (2.9)
At 31 December 2010 (restated) 15.0 45.1 26.7 86.8
Net charge for the year 8.1 14.7 11.9 34.7Utilised (2.9) (24.7) (8.5) (36.1)Transfer 0.6 - 0.1 0.7Exchange adjustments - 0.7 0.2 0.9
At 31 December 2011 20.8 35.8 30.4 87.0 Due within one year - 18.2 27.2 45.4Due after one year 20.8 17.6 3.2 41.6
Company Royalties under negotiation Warranties Other Total $m $m $m $m
At 31 December 2009 (restated) 17.5 15.9 - 33.4Net charge for the year 5.0 20.3 15.5 40.8Utilised (8.5) (10.8) - (19.3)Exchange adjustments (0.6) (0.6) - (1.2)
At 31 December 2010 (restated) 13.4 24.8 15.5 53.7
Net charge for the year 3.6 11.6 - 15.2Utilised (2.9) (18.0) - (20.9)Exchange adjustments - - 0.2 0.2
At 31 December 2011 14.1 18.4 15.7 48.2 Due within one year - 9.3 15.7 25.0Due after one year 14.1 9.1 - 23.2
Royalties under negotiationThe owners of patents covering technology allegedly used by the Group have indicated claims for royalties relating to the Group’s use (including past usage) of that technology. Negotiations over these liabilities continue for long periods of time. The directors have made provision for the potential royalties payable based on the latest information available. Having taken legal advice, the Board considers that there are defences available that should mitigate the amounts being sought. The Group will vigorously negotiate or defend all claims but, in the absence of agreement, the amounts provided may prove to be different from the amounts at which the potential liabilities are fi nally settled.
Given the nature of the claims it is not possible to be more specifi c with regard to the timing of outfl ows.
The directors consider that to disclose the amounts unused following the negotiation of royalty claims during the year would be seriously prejudicial to other royalty claims under negotiation, in litigation or dispute. Accordingly the directors have aggregated amounts released unused with additional provisions made in order to arrive at the net charge for the year shown above.
Other provisionsOther provisions relate to retirement and exceptional restructuring provisions within Pace Europe and deferred consideration in relation to the Latens acquisition.
NotesContinued
Pace R&A 2012.indd 70 12/03/2012 14:55
creo

71 | Pace plc 2011 Annual Report
20 Provisions (continued)WarrantiesPace provides product warranties for its set-top boxes from the point of sale and a provision for warranties is recognised when the underlying products are sold. The provision is based on historical warranty data, principally historical failure rates and related cost of repair information, and a weighting of all possible outcomes against their associated probabilities. The level of warranty provision required is reviewed on a product by product basis and provisions adjusted accordingly in the light of actual performance.
Although it is diffi cult to make accurate predictions of potential failure rates or the possibility of an epidemic failure, as a warranty estimate must be calculated at the outset of product shipment before fi eld deployment data is available, these estimates improve during the lifetime of the product in the fi eld.
The directors consider that to disclose the amounts unused following the settlement of warranty claims during the year would be seriously prejudicial to other claims under negotiation. Accordingly the directors have aggregated amounts released unused with additional provisions made in order to arrive at the net charge for the year shown above.
It is expected that the expenditure with regard to warranties will be incurred within fi ve years of the balance sheet date.
21 Share capital 2011 Restated 2010 Number $m Number $m
Authorised Ordinary shares of 5p each 500,000,000 38.8 500,000,000 38.8 Allocated, called up and fully paid Ordinary shares of 5p each 305,046,066 28.3 304,452,503 28.2
The ordinary share capital of Pace plc is designated in Sterling.
During the year, the Company also allotted ordinary shares as follows:
Nominal value Consideration Number $000 $000
Employee share option plan (67.0 pence) 194,858 15 202Employee share option plan (74.0 pence) 20,164 2 23Employee share option plan (82.0 pence) 110,849 9 141Employee share option plan (154.0 pence) 869 - 2Employee share option plan (85.5 pence) 266,823 20 354
593,563 46 722
There are no special rights or obligations attaching to the ordinary shares, and there are no shares in the Company with special rights with regard to control of the Company. The articles of association of the Company may be amended by special resolution of the Company’s shareholders.
The Company’s articles of association provide that the Company may refuse to transfer shares in the following customary circumstances: where the share is not a fully paid share; where the Company has a lien; where the share transfer has not been duly stamped with correct amount of stamp duty; where the transfer is in favour of more than four joint transferees; where the share is a certifi ed share and is not accompanied by the relevant share certifi cate(s) and such other evidence as the Board of Directors may reasonably require to prove the title of the transferor; or where the instrument of transfer is in respect of more than one class of share. These restrictions are in addition to any which are applicable to all UK listed companies imposed by law or regulation.
The notice of the Annual General Meeting specifi es deadlines for exercising voting rights and appointing a proxy or proxies to vote in relation to resolutions to be passed at the Annual General Meeting. All proxy votes are counted and numbers for, against or withheld in relation to each resolution are announced at the Annual General Meeting and published on the Company’s website after the meeting.
At the Annual General Meeting to be held on 16 April 2012, shareholders will be asked to renew the directors’ power to allot shares and buy back shares in the Company and to renew the disapplication of pre-emption rights.
NotesContinued
Pace R&A 2012.indd 71 12/03/2012 14:55
creo

Pace plc 2011 Annual Report | 72
21 Share capital (continued)The Company is not aware of any agreements between shareholders which may result in restrictions on the transfer of securities and/or on voting rights.
There are no signifi cant agreements to which the Company is a party that may take effect, alter or terminate upon a change of controls following a takeover bid other than in relation to (i) employee share plans and (ii) the Company’s borrowings, which would become repayable on a takeover being completed.
The Company’s articles of association provide that (i) all directors must stand for election at the fi rst annual general meeting after having been appointed to the Board and (ii) at each annual general meeting, one third of the directors who are subject to retirement by rotation must retire from offi ce and may seek re-election. The articles set out the procedure for determining the identity of the directors to retire at a particular annual general meeting.
Shares in the Company are held in the Pace plc Employee Benefi t Trust (“Trust”) for the purpose of satisfying awards made under the Company’s employees’ share plans. The Trustees of the Trust may exercise the voting rights attaching to shares held in the Trust in respect of which the benefi cial interest has not vested in any benefi ciary provided that they are satisfi ed that to do so is in the benefi ciaries’ interests. The trustees have waived their right to vote in respect of any such shares held above 5%.
The Company has granted options which are subsisting (including directors’ options) and contingent share awards in respect of the following presently unissued ordinary shares of 5p each.
Number of ordinary shares subject to option Exercise period Price per share (pence)
507,539 1 October 2011 to 31 March 2012 67.0706,759 1 June 2012 to 30 November 2012 74.0207,994 1 June 2013 to 30 November 2013 154.0516,737 1 June 2014 to 30 November 2014 128.0421,618 4 June 2012 to 7 September 2012 135.616,337 18 January 2005 to 17 January 2012 357.0140,000 22 October 2003 to 21 October 2012 15.7530,000 26 August 2004 to 25 August 2013 51.050,000 17 August 2005 to 16 August 2014 51.0401,999 2 October 2009 to 1 October 2016 58.7550,000 19 February 2010 to 18 February 2017 69.5508,746 1 November 2010 to 31 October 2017 97.751,914,990 24 June 2011 to 23 June 2018 85.51,167,917 24 June 2011 to 23 June 2013 85.5455,889 24 June 2012 to 23 June 2014 85.5175,094 24 June 2012 to 23 June 2018 85.5300,000 18 December 2012 to 17 December 2018 47.082,560 18 December 2011 to 17 December 2018 47.0201,519 11 March 2013 to 10 March 2019 75.02,146,977 11 March 2012 to 10 March 2019 75.0501,882 30 July 2012 to 29 July 2019 199.252,081,630 8 March 2013 to 7 March 2020 176.7173,958 8 March 2014 to 7 March 2020 176.7150,000 14 April 2013 to 13 April 2020 196.891,346 7 September 2013 to 6 September 2020 208.0250,000 15 October 2013 to 14 October 2020 188.4140,000 17 March 2014 to 16 March 2021 165.8225,000 4 April 2014 to 4 April 2021 153.5338,810 31 May 2014 – contingent share award 5.0600,000 31 May 2014 – contingent share award 5.0
14,555,301
NotesContinued
Pace R&A 2012.indd 72 12/03/2012 14:55
creo

73 | Pace plc 2011 Annual Report
21 Share capital (continued)The Pace plc Employee Benefi ts Trust has granted options over existing shares to satisfy certain options. Details of these additional options are shown in note 24.
22 Share premium accountGroup and Company $m
At 31 December 2010 (restated) 72.6Premium on allotments 0.5
At 31 December 2011 73.1
The shares allotted during the year are listed in note 21.
23 Merger reserveGroup and Company $m
At 31 December 2010 (restated) and 31 December 2011 109.9
The merger reserve was created upon the acquisition of the set-top box and connectivity solutions business of Royal Philips Electronics.
24 Retained earningsGroup $m
At 31 December 2010 (restated) 211.4Retained profi t for the year 38.8Dividends to equity shareholders (10.1)Deferred tax adjustments (2.9)Employee share incentive charges 7.8
At 31 December 2011 245.0
Company $m
At 31 December 2010 (restated) 133.7Retained profi t for the year 107.3Dividends to equity shareholders (10.1)Deferred tax adjustments (2.9)Employee share incentive charges 7.8
At 31 December 2011 235.8
Own shares heldAt 31 December 2011 the Pace plc Employee Benefi ts Trust held 9,744,470 (2010: 11,263,524) shares in the Company which cost $16.0m (2010 restated: $16.0m). These shares are held to satisfy options granted to employees.
The amounts arising on settlement of share options from the employee share trusts represents cash receipts from the exercise of relevant share options.
NotesContinued
Pace R&A 2012.indd 73 12/03/2012 14:55
creo

Pace plc 2011 Annual Report | 74
24 Retained earnings (continued)The Pace plc Employee Benefi ts Trust has granted options and contingent share awards to employees (including directors’ options) over ordinary shares of 5p each as follows:
Number of ordinary shares subject to option Exercise period Price per share (pence)
244,988 26 August 2004 to 25 August 2013 51.0175,000 17 August 2005 to 16 August 2014 51.038,829 2 October 2009 to 1 October 2016 58.8546,075 3 April 2010 to 2 April 2017 73.31,687,291 4 April 2014 to 3 April 2021 153.51,895,275 March 2015 to 15 December 2021 69.8
4,587,458
The Pace plc Employee Benefi ts Trust holds the following shares to satisfy the International Performance Share Plan, Performance Share Plan, Deferred Share Bonus and Share Award Plans operated by the Company.
Number of ordinary shares subject to option Exercise period 272,943 3 August 2012 to 1 August 2019 2,268,691 5 May 2012 to 4 May 2019 301,978 18 May 2012 to 17 May 2019 1,824,345 26 February 2012 to 25 February 2020 171,480 15 March 2012 to 15 March 2012 2,800,298 8 March 2013 to 7 March 2020 56,126 7 September 2013 to 6 September 2020 4,290,342 4 April 2014 to 3 April 2021 1,722,095 18 March 2012 to 17 March 2014 1,060,408 28 February 2013 to 27 February 2021 200,000 March 2014
14,968,706
25 Profi t for the yearThe parent Company has taken advantage of Section 408 of the Companies Act 2006 and has not included its own income statement in these fi nancial statements. The Group profi t includes a parent Company profi t after tax of $107.3m (2010 restated: profi t after tax of $44.5m).
26 Capital commitmentsGroup and Company Restated 2011 2010 $m $m
Contracted but not provided for 2.0 2.8
NotesContinued
Pace R&A 2012.indd 74 12/03/2012 14:55
creo

75 | Pace plc 2011 Annual Report
27 Employee benefi tsPension plansThe Group contributes to several defi ned contribution Group Personal Pension Plans, which all executive directors and employees are entitled to join. The total expense relating to these plans in the current year was $5.2m (2010 restated: $3.6m). At 31 December 2011 contributions of $Nil (2010: $Nil) were outstanding.
Share based payments Details of the Company’s share option plans are included in notes 21 and 24 and the Remuneration Report. The number and weighted average exercise price of share options is as follows:
Restated Weighted weighted average average exercise Number exercise Number price of options price of options 2011 2011 2010 2010
Outstanding at the beginning of the period 176.2c 16,240,965 159.5c 13,378,742Granted during the period 187.1c 5,629,830 251.1c 4,770,273Forfeited during the period 271.4c (3,073,283) 458.8c (1,064,178)Exercised during the period 121.6c (593,563) 117.8c (843,872)
Outstanding at the end of the period 165.6c 18,203,949 176.2c 16,240,965
Exercisable at the end of the period 119.8c 5,874,980 156.6c 2,898,498
Outstanding options were as follows:
Range of exercise prices (pence) Weighted average Weighted Number remaining average at 31 December contractual life exercise 2011 months price
15.75p – 49p 522,560 75 60c51p – 75p 6,994,960 53 108c85.5p – 97.75p 4,222,636 89 135c128p – 357p 6,463,793 74 257c 18,203,949 69 166c
The weighted average exercise price of options granted in the period was 187.1c (2010 restated: 251.1c).
The weighted average fair value at the measurement date of options granted in the year was 72.3c (2010 restated: 31.0c).
The weighted average exercise price at the date of exercise for options exercised in the year was 121.6c (2010 restated: 117.8c).
The weighted average share price during the year was 291.4c (2010 restated: 300.7c).
The fair value of services received in return for share options granted are measured by reference to the fair value of share options granted. The estimate of the fair value of the services received is measured based on a Black-Scholes model. The following table gives the assumptions applied to the options granted in the respective periods shown. Expectations of early exercise are incorporated into the model, where appropriate.
NotesContinued
Pace R&A 2012.indd 75 12/03/2012 14:55
creo

Pace plc 2011 Annual Report | 76
27 Employee benefi ts (continued) Restated 2011 2010
Average share price (cents) 191.9c 288.7cWeighted average exercise price (cents) 165.6c 176.2cExpected volatility (%) 50% 50%Option life (years) 10 10Dividend yield (%) 1.4% 1.4%Risk free interest rate (%) 5.0% 5.0%
The expected volatility is based on the historic volatility (calculated based on the weighted average remaining life of the share options), adjusted for any expected changes to future volatility due to publicly available information.
The charge for share based payments is $7.8m (2010 restated: $9.4m) which is comprised entirely of equity settled transactions.
28 Leasing commitments Total amounts payable under non-cancellable operating lease rentals are as follows:
Group Company Restated Restated 2011 2010 2011 2010 $m $m $m $m
Land and buildings Within one year 9.2 9.8 1.2 1.1Between two and fi ve years 24.1 26.0 4.8 4.8In fi ve years or more 9.6 11.6 - 1.2
42.9 47.4 6.0 7.1
29 Related partiesIdentity of related parties The Group has a related party relationship with its subsidiaries and with its directors.
Transactions with subsidiaries The main transactions between the Company and its subsidiaries consist mainly of payments by the Company for distribution, engineering and administrative support services provided by Pace Americas Inc., Pace Europe SAS and Pace Micro Technology (India) Private Ltd. Total transactions of $759.5m were made in the year (2010 restated: $719.8m).
The amounts due to and from these subsidiaries are shown within notes 16 and 17.
Transactions with key management personnel Key management of the Group is through the executive directors of the Company. The main transactions with these individuals are disclosed in the Remuneration Report on pages 26 to 29.
Of the share based payments charge of $7.8m (2010 restated: $9.4m) made in the period, 42% (2010: 39%) relates to options granted to the executive directors.
NotesContinued
Pace R&A 2012.indd 76 12/03/2012 14:55
creo

77 | Pace plc 2011 Annual Report
30 AcquisitionsBusiness combinations in the year ended 31 December 2011There has been no business combinations in the year ended 31 December 2011.
Business Combinations in the year ended 31 December 2010During the year ended 31 December 2010 the Group acquired the following businesses:
• Bewan Systems SA• 2Wire, Inc.• Latens Systems Limited
Adjustments have been made to the net assets acquired within the adjustment period for 2Wire, Inc. and Latens Systems Limited during the year ended 31 December 2011. These adjustments are described further in note 11.
The balance sheet at 31 December 2010 included deferred and contingent consideration payable of $3.6m in respect of Bewan Systems SA, of which $3.6m has been paid during the year; and $15.5m in respect of Latens Systems Limited, of which $nil has been paid during the year.
31 Free cash fl ow and cash investment in acquisitions Restated 2011 2010 $m $m
Free cash fl ow Cash generated from operations 150.0 137.8Tax paid (29.7) (39.2)Purchase of property, plant and equipment (41.5) (30.6)Development expenditure (57.0) (56.9)Exceptional expenditure paid in the year 14.3 16.9Acquisitions working capital increase from date of acquisition to year end - 31.0
Free cash fl ow 36.1 59.0
Restated 2011 2010 $m $m
Cash investment in acquisitions in the year Acquisition of subsidiaries, net of cash acquired (6.4) (422.4)Acquisitions working capital increase from date of acquisition to year end - (31.0)
Cash investment in acquisitions in the year (6.4) (453.4)
32 Post balance sheet events There are no signifi cant or disclosable post balance sheet events.
NotesContinued
Pace R&A 2012.indd 77 12/03/2012 14:55
creo

Pace plc 2011 Annual Report | 78
Directors, Secretary and Advisers
Directorsall of Victoria Road, Saltaire, BD18 3LF, England
Allan Leighton Non-executive ChairmanMike Pulli Chief Executive Offi cerStuart Hall Chief Financial Offi cerRoddy Murray Executive DirectorPatricia Chapman-Pincher Non-executive DirectorJohn Grant Non-executive DirectorMike Inglis Non-executive Director
Company SecretaryAnthony John Dixon
Registered and Head Offi ceVictoria RoadSaltaire BD18 3LFEnglandRegistered Number 01672847
AuditorsKPMG Audit Plc1 The EmbankmentNeville StreetLeedsLS1 4DW
RegistrarsCapita Registrars LtdThe Registry134 Beckenham RoadBeckenhamKentBR3 4TU
StockbrokersJefferies Hoare Govett250 BishopsgateLondonEC2M 4AA
JP Morgan Cazenove20 MoorgateLondonEC2R 6DA
Pace R&A 2012.indd 78 15/03/2012 13:02
creo

79 | Pace plc 2011 Annual Report
Restated Restated Restated Restated 7 months Year ended Year ended Year ended Year ended ended 31 Dec 2011 31 Dec 2010 31 Dec 2009 31 Dec 2008 31 Dec 2007 $m $m $m $m $m
Revenue 2,309.3 2,062.9 1,779.6 1,371.7 504.8Profi t before tax 54.7 110.2 109.8 25.4 31.1Profi t before interest, exceptional items, 141.4 160.6 120.0 53.7 32.1amortisation and tax Profi t after tax 38.8 77.3 80.8 20.4 29.1Basic EPS 13.2c 26.4c 27.8c 7.4c 12.7cBasic EPS before exceptional items 29.7c 37.1c 30.3c 14.4c 12.7cTotal equity 407.1 375.9 315.9 264.8 136.6
Shareholder Information
Annual General Meeting The Company’s Annual General Meeting will be held at 10:30am on 16 April 2012, at the Company’s head offi ce, Victoria Road, Saltaire, West Yorkshire BD18 3LF.
Capita RegistrarsEnquiries regarding shareholdings, change of address or other particulars should be directed in the fi rst instance to the Company’s Registrars, Capita Registrars Ltd, The Registry, 134 Beckenham Road, Beckenham, Kent, BR3 4TU, or by telephone on 0871 664 0300. They also provide a range of online shareholder information services at www.capitashareportal.com where shareholders can check their holdings and fi nd practical help on transferring shares or updating their details.
Multiple Accounts on the Shareholder Register If you have received two or more copies of this document, this means that there is more than one account in your name on the shareholder register. This may be caused by either your name or address appearing on each account in a slightly different way. For security reasons, the Registrars will not amalgamate the accounts without your consent. If you would like any multiple accounts combined into one account, please write to Capita Registrars at the address given above.
Unsolicited Mail The Company is obliged by law to make its share register available upon request to the public and to other organisations, which may use it as a mailing list, resulting in shareholders receiving unsolicited mail. Shareholders wishing to limit the receipt of such mail should write to the Mailing Preference Service, DMA House, 70 Margaret Street, London W1W 8SS, or call +44 (0) 20 7291 3310 for an application form or visit www.mps-online.org.uk
Pace WebsiteShareholders are encouraged to visit our website, www.pace.com, which has a wealth of information about the Company.
Five Year Record and Shareholder Information
Pace R&A 2012.indd 79 12/03/2012 14:55
creo

Pace plc 2011 Annual Report | 80
Notes
Pace R&A 2012.indd 80 12/03/2012 14:55
creo

81 | Pace plc 2011 Annual Report
Notes
Pace R&A 2012.indd 81 12/03/2012 14:55
creo

02 Highlights
04 Chairman’s Letter
05 Chief Executive Officer’s Review
08 Chief Financial Officer’s Review
11 Report of the Directors
22 Directors’ Remuneration Report
31 Statement of Directors’ Responsibilities
32 Independent Auditors’ Report
35 Financial Statements
42 Notes to the Financial Statements
78 Directors, Secretary and Advisers
79 Five Year Record and Shareholder Information
Contents
01 | Pace plc 2011 Annual Report Pace plc 2011 Annual Report |
Front & back cover.indd 4-6 12/03/2012 12:40
83

A world leader in digital and broadband technologiesAnnual Report & Accounts 2011
Annu
al R
epor
t & A
ccou
nts
2011
MKT-R&A2011
Front & back cover.indd 1-3 12/03/2012 12:40