DISCOM RENEWABLE ENERGY PROCUREMENT ... - Pace-D
357
Disclaimer: The views expressed in this publication do not necessarily reflect the views of the United States Agency for International Development or the United States Government. It is prepared under the Scaling Up Renewable Energy (SURE) project by Tetra Tech ES, Inc., the prime contractor under Contract Number AID- OAA-I-13-00019/AID-OAA-TO-17-00011. DISCOM RENEWABLE ENERGY PROCUREMENT OPTIMIZATION & SMART ESTIMATION SOFTWARE TOOL (DISCOM REPOSE) USER MANUAL
-
Upload
khangminh22 -
Category
Documents
-
view
1 -
download
0
Transcript of DISCOM RENEWABLE ENERGY PROCUREMENT ... - Pace-D

Disclaimer: The views expressed in this publication do not necessarily reflect the views of the United States
Agency for International Development or the United States Government. It is prepared under the Scaling Up
Renewable Energy (SURE) project by Tetra Tech ES, Inc., the prime contractor under Contract Number AID-
OAA-I-13-00019/AID-OAA-TO-17-00011.
DISCOM RENEWABLE ENERGY PROCUREMENT
OPTIMIZATION & SMART ESTIMATION SOFTWARE TOOL
(DISCOM REPOSE) USER MANUAL


(DELETE THIS BLANK PAGE AFTER CREATING PDF. IT’S HERE TO MAKE FACING PAGES AND
LEFT/RIGHT PAGE NUMBERS SEQUENCE CORRECTLY IN WORD. BE CAREFUL TO NOT
DELETE THIS SECTION BREAK EITHER, UNTIL AFTER YOU HAVE GENERATED A FINAL PDF.
IT WILL THROW OFF THE LEFT/RIGHT PAGE LAYOUT

DATA DISCLAIMER: The data, information and assumptions (hereinafter ‘data-set’) used in this
document are in good faith and from the source to the best of PACE-D 2.0 RE (the program)
knowledge. The program does not represent or warrant that any dataset used will be error-free or
provide specific results. The results and the findings are delivered on "as-is" and "as-available" dataset.
All dataset provided are subject to change without notice and vary the outcomes, recommendations,
and results. The program disclaims any responsibility for the accuracy or correctness of the dataset.
The burden of fitness of the dataset lies entirely with the user. In using the data-set data source,
timelines, the users, and the readers of the report further agree to indemnify, defend, and hold
harmless the program and the entities involved for all liability of any nature.
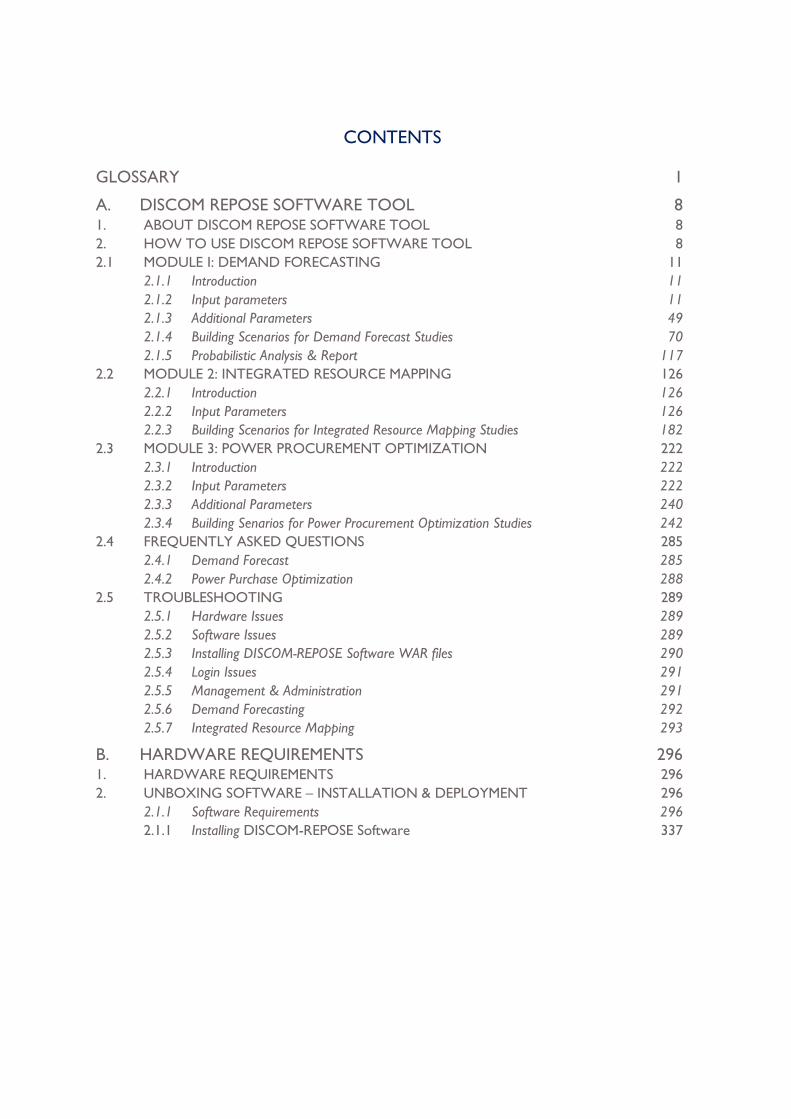
CONTENTS
GLOSSARY 1
A. DISCOM REPOSE SOFTWARE TOOL 8
1. ABOUT DISCOM REPOSE SOFTWARE TOOL 8
2. HOW TO USE DISCOM REPOSE SOFTWARE TOOL 8
2.1 MODULE I: DEMAND FORECASTING 11
2.1.1 Introduction 11
2.1.2 Input parameters 11
2.1.3 Additional Parameters 49
2.1.4 Building Scenarios for Demand Forecast Studies 70
2.1.5 Probabilistic Analysis & Report 117
2.2 MODULE 2: INTEGRATED RESOURCE MAPPING 126
2.2.1 Introduction 126
2.2.2 Input Parameters 126
2.2.3 Building Scenarios for Integrated Resource Mapping Studies 182
2.3 MODULE 3: POWER PROCUREMENT OPTIMIZATION 222
2.3.1 Introduction 222
2.3.2 Input Parameters 222
2.3.3 Additional Parameters 240
2.3.4 Building Senarios for Power Procurement Optimization Studies 242
2.4 FREQUENTLY ASKED QUESTIONS 285
2.4.1 Demand Forecast 285
2.4.2 Power Purchase Optimization 288
2.5 TROUBLESHOOTING 289
2.5.1 Hardware Issues 289
2.5.2 Software Issues 289
2.5.3 Installing DISCOM-REPOSE Software WAR files 290
2.5.4 Login Issues 291
2.5.5 Management & Administration 291
2.5.6 Demand Forecasting 292
2.5.7 Integrated Resource Mapping 293
B. HARDWARE REQUIREMENTS 296
1. HARDWARE REQUIREMENTS 296
2. UNBOXING SOFTWARE – INSTALLATION & DEPLOYMENT 296
2.1.1 Software Requirements 296
2.1.1 Installing DISCOM-REPOSE Software 337

TABLE OF FIGURES
Figure 1. Login Screen of DISCOM-REPOSE Software ................................................................................... 11
Figure 2. DISCOM – REPOSE Home page ......................................................................................................... 11
Figure 3. Demand Forecast Home Page .............................................................................................................. 14
Figure 4. Energy Sales as Dependent Variable ................................................................................................... 15
Figure 5. Page to Enter Variable Data .................................................................................................................. 16
Figure 6. Variable Name .......................................................................................................................................... 16
Figure 7. Updated Variable Page ........................................................................................................................... 17
Figure 8. Upload State Data Icon .......................................................................................................................... 18
Figure 9. Introduction on Variable Data Page .................................................................................................... 18
Figure 10. Annual History Data of Variable ....................................................................................................... 19
Figure 11. Annual Forecast Data of Variable ..................................................................................................... 20
Figure 12. Seasonal History Data of Variable ..................................................................................................... 21
Figure 13. Seasonal Forecast Data of Variable ................................................................................................... 22
Figure 14. Page to Enter Category List ............................................................................................................... 23
Figure 15. Adding Category and Mapping Variables ......................................................................................... 24
Figure 16. Updated Category Page ....................................................................................................................... 25
Figure 17. Licensee page ......................................................................................................................................... 26
Figure 18. Introduction to Energy tab on Licensee page................................................................................. 27
Figure 19. Licensee Added...................................................................................................................................... 27
Figure 20. Adding Distribution Licensee ............................................................................................................ 28
Figure 21. Page after Adding Distribution Licensee ......................................................................................... 29
Figure 22. Annual Energy Sales Data .................................................................................................................... 30
Figure 23. Seasonal Energy Sales Data ................................................................................................................. 32
Figure 24. Understanding the Load Profile Page ............................................................................................... 34
Figure 25. Load Profile Data Uploading Page ..................................................................................................... 34
Figure 26. Download Load Profile Template ..................................................................................................... 35
Figure 27. Downloaded Template for Load Profile .......................................................................................... 35
Figure 28. Load Profile Data Template Downloaded....................................................................................... 35
Figure 29. Template Filled in with Appropriate Data ...................................................................................... 36
Figure 30. Selecting the Filled in Template File to Upload.............................................................................. 36
Figure 31. Select the Demand Template and IMPORT the Profile Data ..................................................... 37
Figure 32. Load Factor Calculation after Uploading Load Profile ................................................................. 38
Figure 33. Load Profile Data page to Update Load Factor Details Manually.............................................. 39
Figure 34. Steps to Add New Policy .................................................................................................................... 41
Figure 35. Uploading Policy Data for the Category ......................................................................................... 42
Figure 36. Viewing Licensee ................................................................................................................................... 43
Figure 37. Editing Enegy Sales Data on Energy Page ........................................................................................ 44
Figure 38. Editing Energy Sales Data .................................................................................................................... 45
Figure 39. Editing Load Profile Data ..................................................................................................................... 46
Figure 40. Editing Load Factor Data Manually ................................................................................................... 47
Figure 41. Editing Policy Data ................................................................................................................................ 48
Figure 42. Introduction To System Config Page................................................................................................ 50
Figure 43. Adding Seasons ...................................................................................................................................... 51
Figure 44. View/Edit/Delete Seasons .................................................................................................................... 52
Figure 45. Addition T & D Loss ............................................................................................................................ 54
Figure 46. Introduction to Drivers Page ............................................................................................................. 56
Figure 47. Configuring Open Access (OA) Data .............................................................................................. 57
Figure 48. Configuring Captive Power Procurement (CPP) Data ................................................................ 59

Figure 49. Configuring DER category .................................................................................................................. 61
Figure 50. DER Configuration Page ...................................................................................................................... 62
Figure 51. Configuring DER Specification Under DER Configuration.......................................................... 63
Figure 52. Configuring Generation Profile Under DER Configuration ........................................................ 64
Figure 53. Uploaded Generation Profile ............................................................................................................. 65
Figure 54. Configuring EV category ...................................................................................................................... 66
Figure 55. EV Configuration Page ......................................................................................................................... 67
Figure 56. Configuring Electric Vehicle Specifications ..................................................................................... 67
Figure 57. Configuring EV’s Count ....................................................................................................................... 68
Figure 58. Configuring EV Charging Profile ........................................................................................................ 69
Figure 59. Uploaded Charging Profile .................................................................................................................. 70
Figure 60. DISCOM – REPOSE Home Page ....................................................................................................... 72
Figure 61. Blank Record to Create Scenario for DFC Studies ...................................................................... 72
Figure 62. Creating BAU Scenario & Adding LDFC Details ........................................................................... 73
Figure 63. Adding MDFC Details .......................................................................................................................... 74
Figure 64. BAU Scenario in Scenario List ........................................................................................................... 75
Figure 65. Scenario List and Scenario Features ................................................................................................. 75
Figure 66. Edit in Scenario List Page..................................................................................................................... 76
Figure 67. Manage Demand Forecast Data ......................................................................................................... 77
Figure 68. Manage Licensee Projection Data ..................................................................................................... 78
Figure 69. Edit Licensee Configuration Data ...................................................................................................... 79
Figure 70. Configuring Econometric Variable Data of Category................................................................... 80
Figure 71. Configuring the Category .................................................................................................................... 81
Figure 72. Configuring LDFC Methods ................................................................................................................ 82
Figure 73. Configuring User Defined Method.................................................................................................... 83
Figure 74. Configuring CAGR Method ................................................................................................................ 84
Figure 75. Configuring Trend Method ................................................................................................................. 85
Figure 76. Configuring PEUM Method ................................................................................................................. 86
Figure 77. Editing Seasonal Licensee Data .......................................................................................................... 87
Figure 78. Configuring Load Profile for the Scenario ....................................................................................... 88
Figure 79. Manage State Projection Data ............................................................................................................ 89
Figure 80. Edit/Save State Projection Data ......................................................................................................... 90
Figure 81. Manage T & D Loss Data .................................................................................................................... 91
Figure 82. Edit/Save T & D Loss Data .................................................................................................................. 92
Figure 83. Finalized BAU Scenario ........................................................................................................................ 93
Figure 84. Select Scenario to be Executed ......................................................................................................... 93
Figure 85. Execution of Demand Forecast ......................................................................................................... 94
Figure 86. Result Page .............................................................................................................................................. 95
Figure 87. View the Scenario ................................................................................................................................. 95
Figure 88. Result Page for Viewing ....................................................................................................................... 96
Figure 89. Results in Graphical Form ................................................................................................................... 97
Figure 90. Consolidating Demand Results .......................................................................................................... 98
Figure 91. Consolidated LDFC State Results ..................................................................................................... 99
Figure 92. Consolidated MDFC State Results ................................................................................................... 99
Figure 93. Consolidated LDFC Licensee Results ........................................................................................... 100
Figure 94. Consolidated LDFC Category Results .......................................................................................... 101
Figure 95. First page of Business as Usual PDF Report ................................................................................ 102
Figure 96. Text Report Output .......................................................................................................................... 103
Figure 97. Creating Scenario with Drivers ...................................................................................................... 104

Figure 98. Scenario with Drivers in Scenario List .......................................................................................... 104
Figure 99. Manage Open Access Data .............................................................................................................. 106
Figure 100. Edit/Save Open Access Data ......................................................................................................... 107
Figure 101. Manage Captive Power Plant Data .............................................................................................. 108
Figure 102. Edit /Save Captive Power Plant Data .......................................................................................... 109
Figure 103. Manage Distributed Energy Resources Data ............................................................................. 110
Figure 104. Edit/Save DER Specification Data ................................................................................................. 111
Figure 105. Edit/Save Generation Profile Data ............................................................................................... 112
Figure 106. Manage Electric Vehicle Data ........................................................................................................ 113
Figure 107. Edit/Save Eectric Vehicle Specifications ...................................................................................... 114
Figure 108. Edit/Save Electric Vehicle Count .................................................................................................. 115
Figure 109. Edit/Save Electric Vehicle Charging Profile ................................................................................ 116
Figure 110. Finalized Scenario with Drivers .................................................................................................... 117
Figure 111. First Step to Run Probabilistic Analysis ...................................................................................... 118
Figure 112. Selecting the Categories to Participate in Forecast Studies and Consolidate ................... 119
Figure 113. Scaling of the Results....................................................................................................................... 120
Figure 114. Consolidated Results Page ............................................................................................................. 120
Figure 115. Probabilistic Analysis Page ............................................................................................................. 121
Figure 116. Graphical Representation of Probabilistic Analysis ................................................................. 122
Figure 117. Tabular Representation of Probabilistic Analysis ..................................................................... 122
Figure 118. Downloading PDF Report ............................................................................................................. 123
Figure 119. Probabilistic Curve Reflected in PDF Report............................................................................ 125
Figure 120. DISCOM – REPOSE Home page ................................................................................................. 126
Figure 121. Generation Page ............................................................................................................................... 127
Figure 122. Steps to Add Cost Characteristics Library ................................................................................ 129
Figure 123. Cost Characteristics Empty Record ............................................................................................ 130
Figure 124. Sample Cost Library ........................................................................................................................ 130
Figure 125. Updated Cost Library ..................................................................................................................... 132
Figure 126. Sample Cost Library for Different Cost Type .......................................................................... 132
Figure 127. Steps to Add Fuel Contract Library ............................................................................................ 133
Figure 128. Fuel Contract Empty Record ........................................................................................................ 134
Figure 129. Addition of Multiple Rows ............................................................................................................. 134
Figure 130. Sample Fuel Library ......................................................................................................................... 135
Figure 131. Updated Fuel Library ...................................................................................................................... 136
Figure 132. Steps to Add Emission Characteristics Library ........................................................................ 137
Figure 133. Emission Library Empty Record ................................................................................................... 138
Figure 134. Sample Emission Library ................................................................................................................. 138
Figure 135. Updated Emission Library .............................................................................................................. 140
Figure 136. Steps to Add RE Plant ..................................................................................................................... 141
Figure 137. Blank Record for Adding RE Plant ............................................................................................... 142
Figure 138. Sample RE Plant Data ...................................................................................................................... 143
Figure 139. Updated RE Plant ............................................................................................................................. 144
Figure 140. List of Configured RE Plants .......................................................................................................... 145
Figure 141. Steps to Add Historical RE Historical Generation Profile ..................................................... 146
Figure 142. Download RE generation profile template ................................................................................ 147
Figure 143. Select RE Generation Profile Date .............................................................................................. 147
Figure 144. Downloaded RE Generation Profile Template ......................................................................... 148
Figure 145. Steps to Import RE Generation Profile ...................................................................................... 148
Figure 146. Imported RE Generation Profile .................................................................................................. 149

Figure 147. Steps to Add Hydro Plant .............................................................................................................. 150
Figure 148. Blank Record for Adding Hydro Plant ........................................................................................ 152
Figure 149. Sample Hydro Plant Data ............................................................................................................... 153
Figure 150. Updated Hydro Plant ...................................................................................................................... 154
Figure 151. List of Configured Hydro Plants ................................................................................................... 155
Figure 152. Steps to Add Historical Hydro Generation Profile ................................................................. 156
Figure 153. Download Hydro Generation Profile Template ...................................................................... 157
Figure 154. Select Hydro Generation Profile Date ....................................................................................... 157
Figure 155. Downloaded Hydro Generation Profile Template .................................................................. 158
Figure 156. Filled in Hydro Plant Template ..................................................................................................... 159
Figure 157. Steps to Import Hydro Generation Profile ............................................................................... 159
Figure 158. Imported Hydro Generation Profile ........................................................................................... 160
Figure 159. Steps to Add Thermal Plant .......................................................................................................... 161
Figure 160. Blank Record for Adding Thermal Plant .................................................................................... 163
Figure 161. Sample Thermal Plant Data ........................................................................................................... 164
Figure 162. Updated Thermal Plant................................................................................................................... 165
Figure 163. List of Configured Thermal Plants ............................................................................................... 166
Figure 164. Adding Hydro Generation Portfolio ........................................................................................... 167
Figure 165. Blank Record to Create Hydro Generation Portfolio ............................................................ 168
Figure 166. Saving Hydro Generation Portfolio ............................................................................................. 168
Figure 167. Configured Hydro Generation Portfolio ................................................................................... 169
Figure 168. Downloading Hydro Generation Profile Template ................................................................. 170
Figure 169. Downloaded Hydro Generation Profile Template .................................................................. 171
Figure 170. Steps to Import Hydro Generation Profile ............................................................................... 172
Figure 171. Imported Hydro Generation Profile ........................................................................................... 172
Figure 172. Exported Hydro Generation Profile ........................................................................................... 173
Figure 173. Uploaded Profile Indication ........................................................................................................... 173
Figure 174. Successfully Created Hydro Generation Portfolio .................................................................. 174
Figure 175. Steps to add RE Generation Portfolio ........................................................................................ 175
Figure 176. Blank Record to Create RE Generation Portfolio ................................................................... 176
Figure 177. Saving RE Generation Portfolio .................................................................................................... 176
Figure 178. Configured RE Generation Portfolio .......................................................................................... 177
Figure 179. Downloading RE Generation Profile Template ........................................................................ 178
Figure 180. Downloaded RE Generation Profile Template ......................................................................... 179
Figure 181. Steps to import RE Generation Profile ...................................................................................... 180
Figure 182. Imported RE Generation Profile .................................................................................................. 180
Figure 183. Exported RE Generation Profile .................................................................................................. 181
Figure 184. Uploaded Profile Indication ........................................................................................................... 182
Figure 185. Successfully Created RE Generation Portfolio ......................................................................... 182
Figure 186. DISCOM – REPOSE Home Page ................................................................................................. 183
Figure 187. Blank Record to Create Scenario for IRM Studies .................................................................. 184
Figure 188. Creating Annual IRM Study Period .............................................................................................. 184
Figure 189. Creating Weekly IRM Study Period ............................................................................................ 185
Figure 190. IRM Scenario in Scenario List Page .............................................................................................. 186
Figure 191. Editing IRM Scenario ....................................................................................................................... 187
Figure 192. Manage Demand Data ..................................................................................................................... 188
Figure 193. Blank Record for Demand Data ................................................................................................... 189
Figure 194. Configured Demand Data .............................................................................................................. 190
Figure 195. Exported Demand and Reserve Data ......................................................................................... 191

Figure 196. Downloading Demand Data Template ....................................................................................... 191
Figure 197. Downloaded Demand Data Template ........................................................................................ 192
Figure 198. Imported Demand Data ................................................................................................................. 193
Figure 199. Manage Hydro Plant Data .............................................................................................................. 194
Figure 200. Uploading Hydro Generation Portfolio to Hydro Plants ....................................................... 194
Figure 201. Selecting Hydro Generation Portfolio ........................................................................................ 195
Figure 202. Successfully Configured Hydro Generation Portfolio ............................................................. 196
Figure 203. Edit/View Configured Hydro Generation Portfolio for Plant ............................................... 196
Figure 204. Updated Hydro Generation Profile of Hydro Plant ................................................................ 197
Figure 205. Configuring Hydro Plants for IRM scenario .............................................................................. 198
Figure 206. Saving Configured Hydro Plant ..................................................................................................... 199
Figure 207. Successfully Configured Hydro Plant .......................................................................................... 200
Figure 208. List of Successfully Configured Hydro Plants ............................................................................ 201
Figure 209. Manage Thermal Plant Data .......................................................................................................... 201
Figure 210. Configuring Thermal Plants for IRM Scenario .......................................................................... 202
Figure 211. Saving Configured Thermal Plant ................................................................................................. 203
Figure 212. Successfully Configured Thermal Plant ....................................................................................... 204
Figure 213. List of Successfully Configured Thermal Plants ........................................................................ 205
Figure 214. Manage RE Plant Data ..................................................................................................................... 205
Figure 215. Uploading RE Generation Portfolio to RE Plants ..................................................................... 206
Figure 216. Selecting RE Generation Portfolio ............................................................................................... 206
Figure 217. Successful Configuration of RE Generation Portfolio ............................................................. 207
Figure 218. Edit/View Configured RE Generation Portfolio for Plant ...................................................... 208
Figure 219. Updated RE Generation Profile of RE Plant .............................................................................. 209
Figure 220. Configuring RE Plants for IRM Scenario ..................................................................................... 210
Figure 221. Saving Configured RE Plant ............................................................................................................ 211
Figure 222. Successful Configuration of RE Plant ......................................................................................... 212
Figure 223. List of Successful Configured RE Plants ...................................................................................... 212
Figure 224. Finalized IRM Scenario .................................................................................................................... 213
Figure 225. Select IRM Scenario to Execute ................................................................................................... 213
Figure 226. Execution of IRM.............................................................................................................................. 214
Figure 227. Result Page ........................................................................................................................................ 215
Figure 228. View IRM Scenario .......................................................................................................................... 215
Figure 229 Result Page of IRM Scenario ........................................................................................................... 216
Figure 230. Results in Graphical Form.............................................................................................................. 217
Figure 231. Results in Tabular Form ................................................................................................................. 218
Figure 232. Resource Mapping Report IRM Base Case PDF Report ....................................................... 219
Figure 233. Downloading PDF and Text Reports .......................................................................................... 220
Figure 234. Downloaded Text Report in Zip File Format ........................................................................... 220
Figure 235. Delete IRM Scenario ....................................................................................................................... 221
Figure 236. DISCOM – REPOSE Home page ................................................................................................. 222
Figure 237. Procurement Page ........................................................................................................................... 223
Figure 238. Blank record to add ST exchange data ....................................................................................... 224
Figure 239. Uploading Historical Exchange Data ........................................................................................... 224
Figure 240. Uploading Future Exchange Data ................................................................................................. 226
Figure 241. Blank Record to add Contract plant ........................................................................................... 228
Figure 242. Added Contract Plant ..................................................................................................................... 229
Figure 243. List of Configured Contract Plants .............................................................................................. 230
Figure 244. Steps to add RE Contract Portfolio ............................................................................................ 231

Figure 245. Saving RE Contract Generation Portfolio .................................................................................. 231
Figure 246. Configured RE Contract Generation Portfolio ........................................................................ 232
Figure 247. Downloading RE Contract Generation Profile Template ...................................................... 233
Figure 248. Downloaded RE Contract Generation Profile Template ....................................................... 234
Figure 249. Steps to import RE Contract Generation Profile .................................................................... 235
Figure 250. Imported RE Generation Profile .................................................................................................. 235
Figure 251. Exported RE Contract Generation Profile ................................................................................ 236
Figure 252. Uploaded Profile Indication ........................................................................................................... 236
Figure 253. Successfully Created RE Generation Portfolio ......................................................................... 237
Figure 254. Steps to Add Storage Plant ............................................................................................................ 238
Figure 255. Blank Record for Adding Storage Plant ...................................................................................... 239
Figure 256. Saving Sample Storage Plant .......................................................................................................... 239
Figure 257. List of Configured Storage Plants ................................................................................................. 240
Figure 258. Steps to Add RPO Targets Data .................................................................................................. 241
Figure 259. Saving RPO Target Data ................................................................................................................. 242
Figure 260. DISCOM – REPOSE Home Page ................................................................................................. 243
Figure 261. Blank Record to Create Scenario for PPO Studies ................................................................. 243
Figure 262. Creating PPO Study Period ........................................................................................................... 244
Figure 263. PPO Scenario in Scenario List Page ............................................................................................. 245
Figure 264. Editing PPO Scenario ...................................................................................................................... 246
Figure 265. Managing Power Procurement Data ........................................................................................... 247
Figure 266. Demand, Hydro, Thermal, RE Data configured to PPO Scenario ....................................... 248
Figure 267. Manage Procurement Data ............................................................................................................ 248
Figure 268. Uploading mtlt Portfolio for RE Contracts ............................................................................... 249
Figure 269. Selecting RE Contract Generation Portfolio ............................................................................. 250
Figure 270. Successfully Configured RE Contract Generation Portfolio ................................................. 251
Figure 271. Edit/View Configured RE Contract Generation Portfolio ..................................................... 251
Figure 272. Updated RE Contract Generation Portfolio of RE Contract ................................................ 252
Figure 273. Configuring Contracts for PPO Scenario ................................................................................... 253
Figure 274. Saving Configured Contracts ........................................................................................................ 254
Figure 275. Successfully Configured Contract ................................................................................................ 255
Figure 276. List of Successfully Configured Contracts ................................................................................. 255
Figure 277. Manage Exchange Data ................................................................................................................... 256
Figure 278. Configuring Historical Exchange Data ........................................................................................ 257
Figure 279. Configuring Future Exchange Data .............................................................................................. 258
Figure 280. Manage RPO Targets Data ............................................................................................................ 259
Figure 281. Configuring/Saving RPO Targets .................................................................................................. 259
Figure 282. Manage Energy Storage Data ........................................................................................................ 260
Figure 283. Configuring Storage Plant for PPO Scenario ............................................................................. 261
Figure 284. Saving Configured Storage Plant ................................................................................................... 262
Figure 285. Successfully Configured Storage Plant ........................................................................................ 263
Figure 286. List of Successfully Configured Storage Plant............................................................................ 263
Figure 287. Finalized PPO Scenario ................................................................................................................... 264
Figure 288. Select PPO Scenario to Execute .................................................................................................. 265
Figure 289. Execution of PPO ............................................................................................................................. 266
Figure 290. Result Page ........................................................................................................................................ 266
Figure 291. View PPO Scenario.......................................................................................................................... 267
Figure 292. Result Page of PPO Scenario ......................................................................................................... 268
Figure 293. Results in Graphical Form.............................................................................................................. 270

Figure 294. Results in Tabular Form ................................................................................................................. 271
Figure 295. Power Procurement Report PPO Base Case PDF Report .................................................... 272
Figure 296. Downloading PDF and Text Reports .......................................................................................... 273
Figure 297. Downloaded Text Report in Zip File Format ........................................................................... 273
Figure 298. Delete PPO Scenario ...................................................................................................................... 274
Figure 299. PPO Consolidated Reports ........................................................................................................... 275
Figure 300. Plotting the Graphs for Generation Dispatch Cost Summary .............................................. 276
Figure 301. Generation Dispatch Cost Graph - RE Plant ............................................................................ 277
Figure 302. Generation Dispatch Cost Graph - Thermal ............................................................................ 278
Figure 303. Average Cost Summary for Study Period Selected ................................................................. 278
Figure 304. Recommendations Report Option in PPO Results Page ........................................................ 279
Figure 305. Recommendations Report Options ............................................................................................ 280
Figure 306. Optimization Type Selection ......................................................................................................... 280
Figure 307. Generate Optimization Tables ..................................................................................................... 281
Figure 308. Select the Optimization Graphs ................................................................................................... 282
Figure 309. Demand Trend - Demand, Unmet Demand, Peak Demand, Peak Unmet ........................ 282
Figure 310. Demand Trend - Demand with Peak Demand and Peak Unmet ......................................... 283
Figure 311. Demand Trend with Peak Unmet ................................................................................................ 283
Figure 312. Demand .............................................................................................................................................. 284
Figure 313. Demand Unmet ................................................................................................................................ 284
Figure 314. Download JAVA JDK ...................................................................................................................... 296
Figure 315. Java Installation Begins .................................................................................................................... 297
Figure 316. Change Location to Install Java in a Different Folder .............................................................. 297
Figure 317. Browse For Folder .......................................................................................................................... 298
Figure 318. Make New Folder ............................................................................................................................ 298
Figure 319. Java Installation Folder Changed .................................................................................................. 299
Figure 320. Installing Java Page ............................................................................................................................ 299
Figure 321. Java Installation Successful Page .................................................................................................... 300
Figure 322. Apache Tomcat Setup ..................................................................................................................... 300
Figure 323. License Agreement .......................................................................................................................... 301
Figure 324. Choose Components Page ............................................................................................................ 301
Figure 325. Configuration Settings .................................................................................................................... 302
Figure 326. Java Virtual Machine Page ............................................................................................................... 302
Figure 327. Choose Install Location .................................................................................................................. 303
Figure 328. Installing .............................................................................................................................................. 303
Figure 329. Setup Completed Page ................................................................................................................... 304
Figure 330. Python Website ................................................................................................................................ 305
Figure 331. Download Tab .................................................................................................................................. 305
Figure 332. Downloading python-3.7.2.exe ..................................................................................................... 306
Figure 333. Location of the Downloaded File ................................................................................................. 306
Figure 334. Run Dialog ......................................................................................................................................... 306
Figure 335. Python Setup Dialog-A ................................................................................................................... 307
Figure 336. Python Setup Dialog-B .................................................................................................................... 307
Figure 337. Create a Python Folder in C Drive ............................................................................................. 308
Figure 338. Advanced Options- Customize Install Location ....................................................................... 308
Figure 339. Select Python Folder ....................................................................................................................... 309
Figure 340. Setup Progress .................................................................................................................................. 309
Figure 341. Setup Successful ............................................................................................................................... 310
Figure 342. Python in the Windows - Start Menu ......................................................................................... 310

Figure 343. Windows Advanced Settings ......................................................................................................... 311
Figure 344. Python Folder ................................................................................................................................... 311
Figure 345. New User Variable .......................................................................................................................... 312
Figure 346. Edit Environment Variables ........................................................................................................... 312
Figure 347. Edit System Variable Dialog ........................................................................................................... 313
Figure 348. Python - Installation check ............................................................................................................. 314
Figure 349. Image Package Installation .............................................................................................................. 314
Figure 350. Numpy Package Installation ........................................................................................................... 315
Figure 351. Matplotlib Package Installation ...................................................................................................... 315
Figure 352. Pandas Package Installation ............................................................................................................ 316
Figure 353. Sklearn Package Installation ........................................................................................................... 316
Figure 354. Karas Package Installation .............................................................................................................. 317
Figure 355. Statsmodels Package Installation .................................................................................................. 317
Figure 356. Mlxtend Package Installation ......................................................................................................... 318
Figure 357. TensorFlow Package Installation .................................................................................................. 319
Figure 358. OR Tools Package Installation ...................................................................................................... 319
Figure 359. "xlsxwriter" Package Installation .................................................................................................. 320
Figure 360. Lists all Libraries ............................................................................................................................... 321
Figure 361. Check List of Libraries .................................................................................................................... 321
Figure 362. PostgreSQL Server Setup Progress Page ............................................................................... 322
Figure 363. Setup –PostgreSQL Page ................................................................................................................ 323
Figure 364. Installation Directory Page ............................................................................................................ 323
Figure 365. Select Components Page ............................................................................................................... 324
Figure 366. Remove Stack Builder Page ........................................................................................................... 324
Figure 367. Data Directory Page ....................................................................................................................... 325
Figure 368. Password Page .................................................................................................................................. 325
Figure 369. Setup the Port Page ......................................................................................................................... 326
Figure 370. Advanced Options Page ................................................................................................................. 326
Figure 371. Pre Installation Summary Page ...................................................................................................... 327
Figure 372. Ready to Install Page ....................................................................................................................... 327
Figure 373. Installation in Progress Page .......................................................................................................... 328
Figure 374. Installation Completed.................................................................................................................... 328
Figure 375. PostgreSQL Server V.10 ................................................................................................................ 329
Figure 376. Connect to Server with a Password ........................................................................................... 329
Figure 377. Create Tablespace ........................................................................................................................... 329
Figure 378. Create Tablespace – General Tab Details ................................................................................. 330
Figure 379. Tablespace Creation- Definition Tab Details ............................................................................ 330
Figure 380. Create Database .............................................................................................................................. 330
Figure 381. Create Database - General Tab Details ..................................................................................... 331
Figure 382. Create Database - Definition Tab Details ................................................................................. 331
Figure 383. DISOM-REPOSE Database ............................................................................................................ 332
Figure 384. Create - Login/ Group Role .......................................................................................................... 332
Figure 385. Create User - General Tab Details ............................................................................................. 333
Figure 386. Create User - Definition Tab Password Details ...................................................................... 333
Figure 387. Create User - Privileges Tab Details ........................................................................................... 334
Figure 388. Create Schema ................................................................................................................................. 334
Figure 389. Create Schema - General Tab Details ........................................................................................ 335
Figure 390. PostgreSQL Installation Completed ............................................................................................ 336
Figure 391. Tomcast Installation Directory ..................................................................................................... 337

Figure 392. Tomcat Folder .................................................................................................................................. 338
Figure 393. Command Prompt to Deploy ....................................................................................................... 338
Figure 394. DISCOM Folder ............................................................................................................................... 339
Figure 395. Configure the Database Properties File ..................................................................................... 339
Figure 396. Edit the Property Values according to DB details ................................................................... 339
Figure 397. Configuring Reports Folder ........................................................................................................... 340
Figure 398. Study Execution Results Location Configuration ..................................................................... 340
Figure 399. Start Tomcat File.............................................................................................................................. 340
Figure 400. Select Tomcat File to Remove ...................................................................................................... 341
Figure 401. Tomcat Properties Dialog Box ..................................................................................................... 341
Figure 402. War File to be Removed ................................................................................................................ 342
LIST OF TABLES
Table 1. Sample Categories and Econometric Variables ................................................................................. 12
Table 2. Sample Annual Data ................................................................................................................................. 12
Table 3. Sample Seasonal Data .............................................................................................................................. 13
Table 4. Sample Policy Data Impacting HT-1 HT Domestic Category ........................................................ 13
Table 5. Seasons List ................................................................................................................................................ 50
Table 6. Sample Cost Characteristics Data ..................................................................................................... 127
Table 7. Sample Fuel Contract Data ................................................................................................................. 128
Table 8: Indicative Category – Variable Mapping List ................................................................................... 286
Table 9: Indicative Data Source .......................................................................................................................... 287
Table 10: Growth Indicators for each Category ............................................................................................ 287
Table 11 DISCOM-REPOSE System Requirements Information ............................................................... 296

1 | DISCOM – REPOSE USER MANUAL USAID.GOV
GLOSSARY
TERMS
S.NO TERMS DEFINITION
1. ANN
ANNs are a form of artificial intelligence, which attempts
to mimic the function of real neurons found in the human
brain. As opposed to the traditional statistical methods
such as regression, which need prior knowledge about the
nature of the relationships between the data, ANNs are
self-adaptive methods that learn from data, and only few a
priori assumptions about data are needed.
2.
Annual
Demand
Profile
HISTORICAL ANNUAL DEMAND PROFILE for
past years is the basis for arriving at the future load
profile. The hourly data from the load profile is
considered for computation of load factor for each
discom.
3. ARIMA
ARIMA is a popular and widely used statistical method
for time series forecasting. This acronym is descriptive,
capturing the key aspects of the model itself. Briefly, they
are:
i. AR (Auto regression) - A model that uses the
dependent relationship between an observation and
some number of lagged observations
ii. I (Integrated)- The use of differencing of raw
observations (e.g. subtracting an observation from an
observation at the previous time step) in order to make
the time series stationary
iii. MA (Moving Average)- A model that uses the
dependency between an observation and a residual error
from a moving average model applied to lagged
observations.
4. CAGR
CAGR is a specific term for the geometric progression
ration that provides a constant growth rate over the time
period. This method dampens the effect of volatility of
periodic changes that can render arithmetic means
irrelevant. It is a useful measure of growth over multiple
time periods. The following equation corresponds to
CAGR method-
Y = {(Current value/Base value)[1/(no of years-1)]}-1
Where, Y denotes the CAGR.
5.
Captive
Power Plants
(CPP)
CAPTIVE POWER PLANTS (CPPS) are those huge
power plants established as part of huge industries or
commercial facilities that generate power. They can fall

2 | DISCOM – REPOSE USER MANUAL USAID.GOV
into any category or the power generators.
Consumption of power from these sources is on the rise
in the recent times. The percentage of CPP based power
consumption also impacts the demand forecasted.
6. Category
CATEGORY refers to the various consumer types that
are identified and associated with a distribution licensee.
Each of these consumer types is associated with
independent and dependent variables that are grouped
and mapped to it.
7. Dashboard
DASHBOARD is technically defined a tool used by the
users to track/access their routine works, reports,
activities and communications within the application. It
also gives the user access to one’s profile.
8. Demand
Profile
This refers to the demand profile of each of the
DISCOMs.
9.
Distributed
Energy
Resources
(DERs)
DISTRIBUTED ENERGY RESOURCES (DERS)
are electricity generating units (typically 3 kW to 50 MW)
within the distribution system or close by to the
consumer. The rapid rise in the number of such units
and the energy consumed from these units impact the
demand forecasting.
10. Drivers
DRIVERS are the factors that impact the rise and fall in
the demand experienced by the DISCOMs. Based on the
values derived from these drivers, the quantum of energy
generated, distributed and purchased may alter from
time to time. The list of common drivers dealt in the
application are the following: Open Access (OA),
Captive Power Plant(CPP), Distributed Energy
Resources (DERs) and Electric Vehicles (EV)
11.
ECONOMET
RIC
ANALYSIS
An econometric forecast determines energy demand by
considering the influence of independent variables such
as population, income, economic growth, cost, industrial
& commercial activity and also other socio economic
variables. Econometric models are estimate equations
that relate electricity demand to external factors. An
important aspect to solve in econometric method is the
selection of the correct independent variables.
12. Electric
Vehicles(EV)
EV stands for Electric Vehicles (EVs). The stark rise in
the number of EVs impact the demand experienced by
the generators and DISCOMs. The penetration of EVs
shall hugely affect the demand forecast of the DISCOMs.
13.
Energy sales
HISTORICAL ENERGY SALES DATA for each
consumer category is required for determining the future
energy sales for the categories. This variable acts as the

3 | DISCOM – REPOSE USER MANUAL USAID.GOV
dependent variable being forecasted by the application.
Based on the forecasted energy sales for each category,
the total DISCOM demand and thus the State demand
can be evaluated.
14.
Integrated
Resource
Mapping
(IRM)
INTEGRATED RESOURCE MAPPING is a
futuristic approach that considers both supply side and
demand side management while planning for the power
generation and supply in the recent times. Ideally this
results in generating a public planning process to evaluate
the optimal mix of utility resources and options.
15. LDFC Long term Demand Forecasting
16. Licensee
The software shall allow the user to model one or more
Distribution Licensees of a State. The distribution
licensee could be a state distribution utility, a private
DISCOM or a franchisee. The data necessary for each
DISCOM are discussed in the below subsections.
17. Load Factor
LOAD FACTOR is also a key aspect for forecasting the
peak demand. Based on the historical annual energy
consumption and peak demand, the load factor shall be
computed for each historical year. The load factor for
future years can be projected based on the historical
trend.
18. MDFC Medium term Demand Forecasting
19. TAB BAR
TAB BAR is part of the module interface which gives
access to all TAB items in the application. This application
has demand, system config and user as the TAB items on
the TAB BAR.
20. Open access
(OA)
OPEN ACCESS (OA) allows the consumers to
purchaser power for lesser prices in the market as
compared to consumption through the DISCOMs. The
percentage of power purchased from other sources for
a competitive price other than DISCOMs should be
considered for predicting the demand forecast as there
seems to be a rise in the OA factor annually. While
considering the generation plan, OA factor amounts to a
significant difference in the final power to be generated.
21. Operations
An OPERATION is defined as the combination of
access rights + actions based on role. Each user is
assigned to operations based on the role in the
application.
22.
Per Capita
Energy
Consumption
It is another important parameter which is required for
forecasting demand. The energy demand is a direct
function of population and total energy consumption.

4 | DISCOM – REPOSE USER MANUAL USAID.GOV
Typically, statistical departments will calculate the Per
capita energy consumption for future years by the
following formula:
𝑃𝐶𝐸
= 𝐸𝑠𝑡𝑖𝑚𝑎𝑡𝑒 𝑜𝑓 𝑡𝑜𝑡𝑎𝑙 𝑒𝑛𝑒𝑟𝑔𝑦 𝑐𝑜𝑛𝑠𝑢𝑚𝑝𝑡𝑖𝑜𝑛 𝑑𝑢𝑟𝑖𝑛𝑔 𝑡ℎ𝑒 𝑦𝑒𝑎𝑟
𝐸𝑠𝑡𝑖𝑚𝑎𝑡𝑒𝑑 𝑚𝑖𝑑 − 𝑦𝑒𝑎𝑟 𝑝𝑜𝑝𝑢𝑙𝑎𝑡𝑖𝑜𝑛 𝑜𝑓 𝑡ℎ𝑎𝑡 𝑦𝑒𝑎𝑟
23. PEUM
End Use is a Bottom-Up approach that directly estimates
energy consumption by using extensive information on
end use by end users, such as appliances, the customer
use, their age, sizes of houses, and so on. These models
are based on the principle that electricity demand is
derived from customer’s demand for light, cooling,
heating, refrigeration, irrigation etc. This method is highly
data intensive, which is challenging in a developing
country like India. It is especially challenging to establish
a robust link between a macroscopic scenario and the
dependent variable.
Partial End-Use Method is a combination of time series
analysis and end-use method. The time series method
shall be used to project growth indicators which shall
then be used for forecasting electricity demand. The
consumption of power is assumed to be a measure of the
indigenous requirements. The future demand is not
projected directly out of past demand data but from the
power utilized in end products, which is measured
through growth indicators.
24. Policies
GOVERNMENT OF INDIA (GOI) and MINISTRY
OF POWER (MOP) keep updating the policies on
electricity generation to distribution.
25.
Power
Trading
Optimization(
PTO)
The results of execution of the medium and long term
demand forecasting gives a consolidated view on the
demand to be incident for a specific duration. If a deficit
in generation is predicted, it is met by purchasing power
from other resources.
26. Roles
The roles defined for users who use the application. It is
mandatory for all users to have a role configured for
them.
27. Seasonal
trends
Every consumer category sees seasonal fluctuations.
Weather changes influence products and services that
consumers want. At residential level, use of AC or
heater may vary with season. Similarly, at industrial level,
production of some products could vary with season.
This implies, impact of season could be different for
different categories. User shall be allowed to configure

5 | DISCOM – REPOSE USER MANUAL USAID.GOV
seasons at monthly levels. As indicated, seasons could be
categorized broadly as summer, winter and monsoon or
into further subcategories.
28. T&D LOSSES
TRANSMISSION & DISTRIBUTION Losses is one
of the factors that affect the demand. A reduction in total
T&D losses reduces the total demand.
29. TREND
Trend Analysis is a deterministic extrapolation technique
that involves fitting trend curves to basic historical data
adjusted to reflect the growth trend itself. With a trend
cove, the forecast is obtained by evaluating the trend
curve function at the desired future point. In trend
analysis, the following standard analytical functions are
used in trend curve fitting.
● Straight line: Y = a + bx
● Parabola: Y = a + bx + cx2
● S Curve: Y = a + bx + cx2 + dx3
● Exponential: Y = cedx
● Gompertz: Y = ln-1(a+ cedx)
Wherein, x is the independent variable, a,b,c and d are
constant coefficients used for trending and Y is the
dependent (forecasted) variable.
Curve fitting technique is used wherein by the method of
least squares the coefficients “a”, “b”, “c” and “d” of a
function are computed.
30. User
The list of people and their details are configured using
this module. A user can be an operations specialist,
administrator, field engineer and so on. Every user can be
either a domain user or an external user to the
application. Each user is provided with a user name and a
password (Exception: domain user, as they login using
their windows password.)
31. Variables
The software allows you to configure a list of variables
that impact demand forecasted using the methods. The
variables are classified into Dependent and Independent
variables considering many factors grouped under the
following: historic energy sales, econometric variables,
weather conditions, demographic variables, demand
factors and so on. The user has the freedom to choose
and configure the variables necessary for the demand
forecasting.

6 | DISCOM – REPOSE USER MANUAL USAID.GOV
32. Crew
Constant
Crew constant refers the number of crews in active state
at the hydro-plant units while it participates in resource
mapping.
33. Domain User
The term refers to the users who work in the utility and
can use their respective system credentials (windows
username/password) to login to the software.
34. Non-Domain
User
The non-utility members who need to work on the
software can create a username and password exclusively
to access and work in the software.
35. Contracts
The power purchase agreements that a utility makes with
any power generator for either a hourly based agreement
or days to months or years agreements are called
contracts.
36. Exchange The short-term contracts are called exchange in the
software.
37. Procurement The long-term contracts are called procurement in the
software.
38. MILP
Mixed Integer Linear Programming method used in
Resource Mapping and Power Purchase Optimization
modules in the software.
39. RPO Renewables Procurement Obligations
40.
Cost
Characteristic
s
It defines the collection of various costs incurred that are
classified as cost coordinates, cost coefficients, fuel cost,
heat rate and heat rate coefficients, and fixed and variable
cost values.
41. Fuel
contracts
The fuel contracts specify the details of cost associated
with the purchase and transport of fuel for the plants.
42. Emission
Library
It lists out all the possible emission characteristics that
the plant have.
43. Generation
Portfolio
The plant-wise generation profiles of all types of plants
are grouped as libraries for each category of plant types.
44. Energy
Exchange
The energy exchange procured in MUs is added as an
input for the short-term exchange module.
45. Exchange
Rate
The energy exchange rates observed in the historical data
of the power exchanges are used to predict the future
rates of the exchange that might be procured by the
utilities to meet the demand.
46. State-owned The state-owned generators information is provided to
distinguish when a few units of the plants participate in

7 | DISCOM – REPOSE USER MANUAL USAID.GOV
contracts or as a resource in the generators mix
considered in resource mapping.
47. IPP
Independent Power Producers are the non-state-owned
power generators who generate power and share it with
utilities via contracts or participate in the generation
planned by utilities. These IPP storage units have different
charging and discharging cycles in a given day as they
accommodate more RE sources. These are modeled in
the software as they participate in power procurement
module as contract units.
48. Grid
Dependent
A few battery storage RE contracts are called Grid
Dependent based on the discharging characteristics of
the storage systems. They only exhibit energy discharging
characteristics and they are modeled for a time period as
contracts in the software.

8 | DISCOM – REPOSE USER MANUAL USAID.GOV
A. DISCOM REPOSE SOFTWARE TOOL
1. ABOUT DISCOM REPOSE SOFTWARE TOOL
DISCOM Renewable Energy Procurement Optimization and Smart Estimation (REPOSE) is a
sophisticated, interactive, robust and dynamic software with a comprehensive set of advanced and
scientific demand forecast methods, integrated resource mapping models and power procurement
optimization technology built into three modules. This software helps distribution companies
(DISCOMs) forecast demand, establish resource plans and optimize future procurement costs.
DISCOM REPOSE provides utilities with hourly, weekly and yearly visualizations of demand and
resource adequacy (type, amount and time) over a 15-year horizon.
This software lets DISCOMs study a variety of scenarios to optimize their power procurement plans
with a generation mix from available resources, future contracts and renewable energy maximization,
while considering renewable energy’s uncertainty and variability. DISCOM REPOSE provides insights
into how DISCOMs can reduce their overall generation cost, provides granular projections of demand
and generation adequacy, and helps to increase renewable energy penetration.
2. HOW TO USE DISCOM REPOSE SOFTWARE TOOL
The DISCOM REPOSE is designed to provide step-by-step guidance on how to perform end to end
Demand Forecasting, Integrated Resource Mapping and Power Procurement Optimization using the
modules in the software. The Demand Forecast module shall discuss the input parameters, additional
parameters, configuration of Business As Usual (BAU) scenario, and the impact of drivers on the BAU
scenario, and probabilistic analysis of the results obtained for BAU and complete analysis of results.
The IRM module shall discuss the input parameters, how to create scenarios, how to edit the
parameters to suit the study, executing the scenario, and analyzing the results.
The demand results obtained from the demand forecasting scenario are taken as input for IRM and
PPO studies. The IRM studies provides the results and analysis for demand obtained by considering
only the existing power plants whereas the PPO module will help us to preform studies by considering
the contract plants, and other procurement options by taking same demand as input.
DEMAND FORECASTING
Demand forecasting is of great importance for the management of power systems. Long-term forecasts
of the electricity demand (both energy & peak load) are needed for capacity planning and maintenance
scheduling while the Medium-term demand forecasts (both energy & peak load) are required for power
system planning or adequacy analysis.
The development of an accurate, fast and robust demand forecasting methodology is of importance to
both the electric utility and its customers. More generally, the error in predicting electricity demand
has significant cost implications for companies operating in competitive power markets.

9 | DISCOM – REPOSE USER MANUAL USAID.GOV
Globally, the demand forecasting is a key aspect of Integrated Resource Mapping. It is forecasted for a
long/medium-term horizon, typically for 10 years. More sophisticated tools and advanced methods are
used for forecasting the demand. It considers several existing and proposed drivers to assess the annual
energy consumption and the peak demand for future years. Further, the hourly load profile is also
estimated for future years in medium-term analysis.
MEDIUM TERM DEMAND FORECASTING: It is used to estimate yearly energy demand for duration
of 1-3 years considering seasonal and economic developments that impact the energy consumption
during those years. In our case, it reads the input data provided by the user and internally uses the
historical data for computing the forecasting. The results are saved in a specific database for future
usage. It is good to have at least 1- 3 years of historical data for medium forecasting to predict a better
demand.
LONG TERM DEMAND FORECASTING: The long-term demand forecasting is used to predict
demand for a longer duration such as more than 10 years. It considers the input data provided by the
user and internally uses the historical data for performing the forecasting. Then the results are saved
in database for future usage. It is ideal to have at least 5- 10 years of historical data while performing
long-term demand forecasting as that enables you to generate near-realistic demand forecast.
INTEGRATED RESOURCE MAPPING
Resource Mapping is one of the prime beneficial planning activities of any DISCOM, as it focuses on
creating energy generation plans that are low-cost, low-risk, and with outcomes that minimize the
environmental and societal impacts. Energy efficiency and Demand-Side Management are the key
concepts, or the desired results expected out of using the IRM module.
There are two challenges faced in such a planning. The under-estimation of the demand forecasted
shall lead to a lack of energy supply resulting in blackouts and brownouts. Whereas, the over-
estimation of demand may lead to surplus energy or establishing generation plants that are fueled and
not matured to assist in supplying the expected demand. In either of the cases, the cost involved in
investment and operations of such plants can be detrimental to the utility as inability to match the
generation at optimal cost with demand forecasted may lead to a major setback in the economic
growth of the country. To eradicate such disasters, appropriate planning is a must.
An efficient planning process considers a complete range of investments in the power sector to meet
the new age electricity demand by including newer energy sources while keeping in mind the
transmission, distribution and also demand side management measures such as energy efficiency and
an optimized operational cost.
An ideal IRM plan integrates the environmental, socio-economic, strategic policy changes in the
country, regulatory compliances constraints, and other general costs and benefits to serve the power
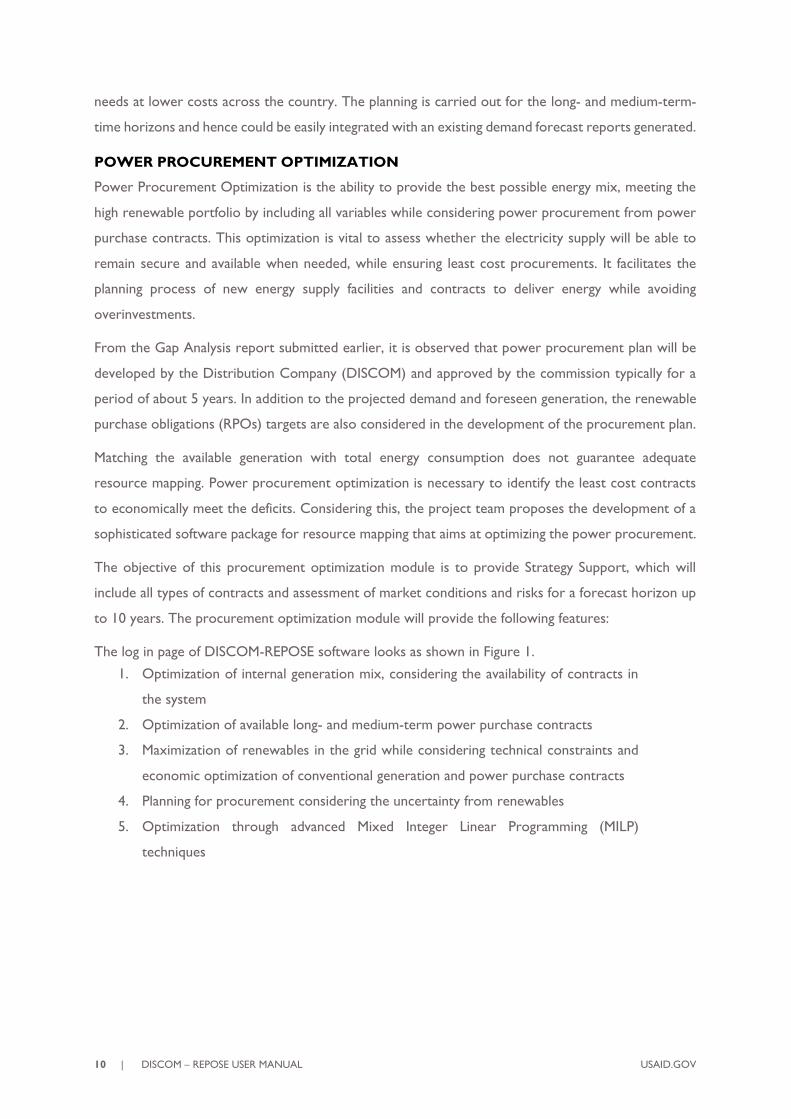
10 | DISCOM – REPOSE USER MANUAL USAID.GOV
needs at lower costs across the country. The planning is carried out for the long- and medium-term-
time horizons and hence could be easily integrated with an existing demand forecast reports generated.
POWER PROCUREMENT OPTIMIZATION
Power Procurement Optimization is the ability to provide the best possible energy mix, meeting the
high renewable portfolio by including all variables while considering power procurement from power
purchase contracts. This optimization is vital to assess whether the electricity supply will be able to
remain secure and available when needed, while ensuring least cost procurements. It facilitates the
planning process of new energy supply facilities and contracts to deliver energy while avoiding
overinvestments.
From the Gap Analysis report submitted earlier, it is observed that power procurement plan will be
developed by the Distribution Company (DISCOM) and approved by the commission typically for a
period of about 5 years. In addition to the projected demand and foreseen generation, the renewable
purchase obligations (RPOs) targets are also considered in the development of the procurement plan.
Matching the available generation with total energy consumption does not guarantee adequate
resource mapping. Power procurement optimization is necessary to identify the least cost contracts
to economically meet the deficits. Considering this, the project team proposes the development of a
sophisticated software package for resource mapping that aims at optimizing the power procurement.
The objective of this procurement optimization module is to provide Strategy Support, which will
include all types of contracts and assessment of market conditions and risks for a forecast horizon up
to 10 years. The procurement optimization module will provide the following features:
The log in page of DISCOM-REPOSE software looks as shown in Figure 1.
1. Optimization of internal generation mix, considering the availability of contracts in
the system
2. Optimization of available long- and medium-term power purchase contracts
3. Maximization of renewables in the grid while considering technical constraints and
economic optimization of conventional generation and power purchase contracts
4. Planning for procurement considering the uncertainty from renewables
5. Optimization through advanced Mixed Integer Linear Programming (MILP)
techniques

11 | DISCOM – REPOSE USER MANUAL USAID.GOV
Figure 1. Login Screen of DISCOM-REPOSE Software
2.1 MODULE I: DEMAND FORECASTING
2.1.1 Introduction
Demand forecasting is the first component in DISCOM-REPOSE software using which we can perform
long term demand forecasting (LDFC) and medium-term demand forecasting (MDFC).
Once you login to the software, you will see the page as shown in Figure 2.
Figure 2. DISCOM – REPOSE Home page
Let us see the input parameters required, how to model the database, and how to obtain the results
in following sections.
Note: We have considered Assam state’s database as an example in this document.
2.1.2 Input Parameters

12 | DISCOM – REPOSE USER MANUAL USAID.GOV
For performing demand forecast studies, we have to collect a certain set of data that will be
considered as input for the studies.
Inputs to be considered are the following
• Categories (Consumers) of respective DISCOM/State
• Historical & Forecasted Econometric variables related to the selected categories
• Historical energy sales of each category
Let us consider two sample categories of Assam shown in Table 1 and discuss how to upload
and execute the demand forecast studies.
Table 1. Sample Categories and Econometric Variables
SL. NO. CATEGORIES ECONOMETRIC VARIABLES
1 HT-1 HT Domestic 25kVA (20 KW) and
above
Per capita income - Constant
Gross Domestic Product - Constant
Installations
Specific energy
Average Temperature
Average Humidity
2 LT-1 Jeevan dhara 0.5kW and 1kWh/day
Population
Gross Domestic Product - Constant
Average Temperature
Average Humidity
Table 2 shows the annual input data required for performing Long term demand forecast (LDFC)
studies.
Table 2. Sample Annual Data
YEAR HT-1 HT DOMESTIC
(Energy Sales in MU)
GROSS DOMESTIC PRODUCT –
CONSTANT
(in Lakhs)
2009 30.760 6403256
2010 29.054 6979387
- - -
- - -
2018 31.000 20114394
2019 22.100 21286959
- - -
- - -
2040 - 69960641

13 | DISCOM – REPOSE USER MANUAL USAID.GOV
Table 3 shows the Seasonal input data required for performing medium term demand forecast (MDFC)
studies.
Table 3. Sample Seasonal Data
YEAR HT-1 HT DOMESTIC
(Energy Sales in MU)
GROSS DOMESTIC PRODUCT –
CONSTANT
(in Lakhs)
2014-April 2.74 15550359
2014-May 2.93 15648178
2014-June 3.59 15745997
- - -
- - -
2019-February 1.54 21183681
2019-March 1.31 21286959
- - -
- - -
2024-March - 28258363
Table 4 shows the Annual input data for policy named ‘LED-PENETRATION’ impacting on HT-1 HT
DOMESTIC CATEGORY.
Table 4. Sample Policy Data Impacting HT-1 HT
Domestic Category
YEAR LED PENETRATION
2020 -1.186
2021 -2.372
- -
- -
2040 -18.976
1. Login to the software and click on the Demand tab, the Demand tab appears as shown in Figure
3.
Three options appear on page under which the user has to upload the input data and they are
the following:
i. Variables
ii. Category

14 | DISCOM – REPOSE USER MANUAL USAID.GOV
iii. Licensee
2. You have to enter the variables and variables data under Variable tab.
3. The list of categories for respective DISCOM/State is to be entered under Category tab.
4. The historical energy sales and other licensee data of each category have to be entered under
Licensee tab.
Figure 3. Demand Forecast Home Page
This section guides you to configure DEMAND Forecast variables. Demand forecasting is crucial
while creating the operational plan for optimized resource scheduling and generation. There are many
variables that affect/impact demand forecast.
Note:
• All Econometric/Independent variables will be kept as Licensee/State variables and are of
independent type.
• One default variable known as Energy Sales to be created which should be a Licensee and
Dependent type as shown in Figure 4.

15 | DISCOM – REPOSE USER MANUAL USAID.GOV
Figure 4. Energy Sales as Dependent Variable
The variables thus identified can be configured using the variable functionality in the software.
STEPS TO ADD VARIABLE
1. Login to the software and access Demand tab. The Demand tab appears.
2. Click on the Variable tab. The Variable tab appears.
After you click on Variable tab the software page looks like as shown in Figure 5.
3. Click on the Add Variable icon. An empty record appears.
4. Use the slider Licensee or State and Count or Decimal to choose between the appropriate
values.
5. Enter the name of the variable in the Name field.
6. Enter the unit in the Units field.
7. Select the variable type from Type drop-down.

16 | DISCOM – REPOSE USER MANUAL USAID.GOV
Figure 5. Page to Enter Variable Data
You have to enter the variable details as shown in Figure 6
Figure 6. Variable Name
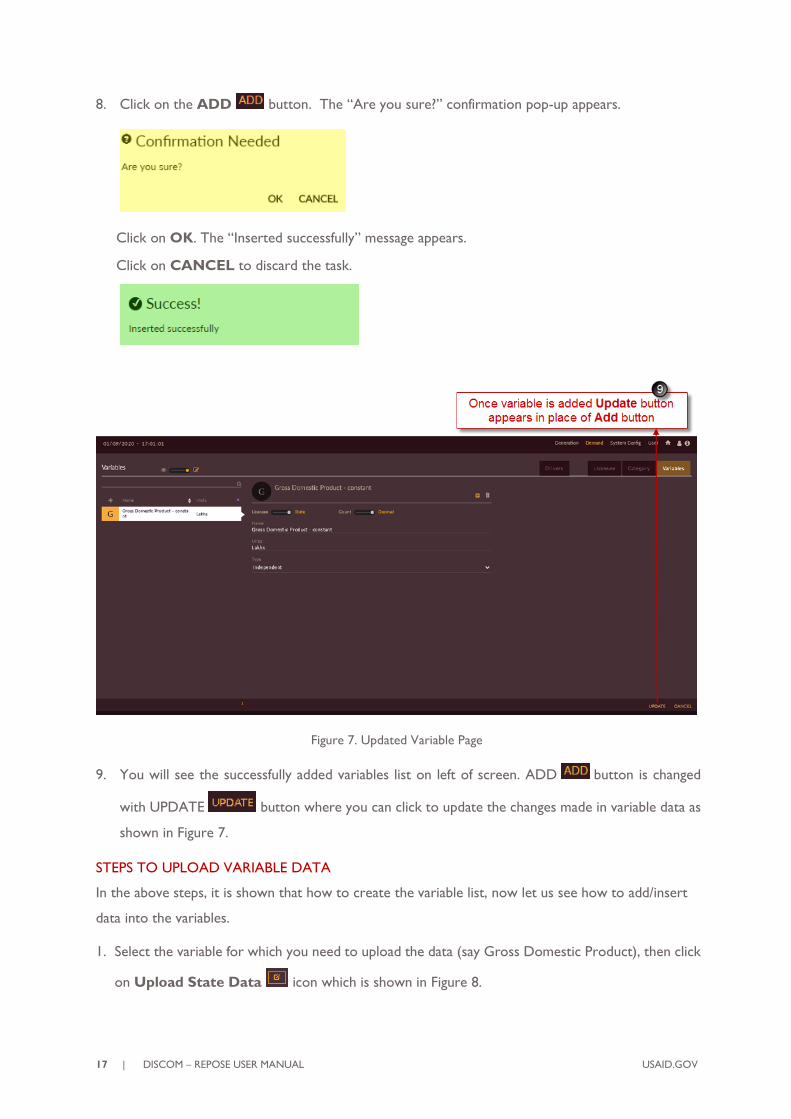
17 | DISCOM – REPOSE USER MANUAL USAID.GOV
8. Click on the ADD button. The “Are you sure?” confirmation pop-up appears.
Click on OK. The “Inserted successfully” message appears.
Click on CANCEL to discard the task.
Figure 7. Updated Variable Page
9. You will see the successfully added variables list on left of screen. ADD button is changed
with UPDATE button where you can click to update the changes made in variable data as
shown in Figure 7.
STEPS TO UPLOAD VARIABLE DATA
In the above steps, it is shown that how to create the variable list, now let us see how to add/insert
data into the variables.
1. Select the variable for which you need to upload the data (say Gross Domestic Product), then click
on Upload State Data icon which is shown in Figure 8.

18 | DISCOM – REPOSE USER MANUAL USAID.GOV
Figure 8. Upload State Data Icon
2. The following page appears as shown in Figure 9.
Figure 9. Introduction on Variable Data Page

19 | DISCOM – REPOSE USER MANUAL USAID.GOV
3. Refer Table 2 for annual econometric variable data and Table 3 for seasonal econometric variable
data of ‘Gross Domestic Product’.
4. Figure 10 shows uploading of historical annual data for variable ‘Gross Domestic Product’.
a) Toggle the icon to HISTORY tab
b) Toggle the icon to ANNUAL tab , then upload the data available for
historical years of Gross Domestic Product (Table 2).
c) Click on SAVE button . The “Are you sure?” confirmation pop-up appears.
Click on OK. The “Inserted successfully” message appears. Click on CANCEL to discard
the task.
Figure 10. Annual History Data of Variable
5. Figure 11 shows uploading of future annual data for variable ‘Gross Domestic Product’.
d) Toggle the icon to FORECAST tab
e) Toggle the icon to ANNUAL tab , then upload the data available for
future years of Gross Domestic Product (Table 2).

20 | DISCOM – REPOSE USER MANUAL USAID.GOV
f) Click on SAVE button . The “Are you sure?” confirmation pop-up appears.
Click on OK. The “Inserted successfully” message appears. Click on CANCEL to discard
the task.
Figure 11. Annual Forecast Data of Variable
6. Figure 12 shows uploading of historical seasonal data for variable ‘Gross Domestic Product’.
g) Toggle the icon to HISTORY tab
h) Toggle the icon to SEASONAL tab, then upload the data
available for historical months of Gross Domestic Product (Table 3).
i) Click on SAVE button . The “Are you sure?” confirmation pop-up appears.
Click on OK. The “Inserted successfully” message appears. Click on CANCEL to discard the task.

21 | DISCOM – REPOSE USER MANUAL USAID.GOV
Figure 12. Seasonal History Data of Variable
7. Figure 13 shows uploading of future seasonal data for variable ‘Gross Domestic Product’.
j) Toggle the icon to FORECAST tab
k) Toggle the icon to SEASONAL tab , then upload the data available for
future months of Gross Domestic Product (Table 3).
l) Click on SAVE button . The “Are you sure?” confirmation pop-up appears.
Click on OK. The “Inserted successfully” message appears. Click on CANCEL to discard
the task.

22 | DISCOM – REPOSE USER MANUAL USAID.GOV
Figure 13. Seasonal Forecast Data of Variable
Repeat the above steps to add all the available variables for DISCOM/State you are carrying out the
demand forecast studies.
This section gives you the description and steps to manage the categories.
CATEGORY refers to the various consumer types that are identified and associated with a
distribution licensee. Each of these consumer types is associated with independent and dependent
variables that are grouped and mapped to it.
The variables thus added can be configured to each category using the ADD variable functionality
under Category tab in the software.
STEPS TO ADD CATEGORY
1. Login to the software and access Demand tab. The Demand tab appears.
2. Click on the Category tab. The Category tab appears.
After user clicks on Category tab the software page looks like as shown in Figure 14
3. Click on the Add Category icon. An empty record appears.
4. Enter the name of the variable in the Name field.
5. Enter the code in the Code field.

23 | DISCOM – REPOSE USER MANUAL USAID.GOV
6. Click on the Add Variable icon. An empty record appears.
7. The Copy From icon is used to repeat the map same variables for different categories.
Figure 14. Page to Enter Category List
You have to enter the category details as shown in Figure 15.
Here as shown in Figure 15 you have to map select the independent variables which will
be impacting on energy sales of respective category.
Example: In Figure 15 we have shown HT Domestic category. The HT Domestic energy
sales are affected by GDP, domestic installations, specific energy, temperature and
humidity. Therefore, all those variables which affect HT Domestic category are mapped.

24 | DISCOM – REPOSE USER MANUAL USAID.GOV
Figure 15. Adding Category and Mapping Variables
8. Click on the ADD button. The “Are you sure?” confirmation pop-up appears.
Click on OK. The “Inserted successfully” message appears.
Click on CANCEL to discard the task.

25 | DISCOM – REPOSE USER MANUAL USAID.GOV
Figure 16. Updated Category Page
9. ADD button is changed with UPDATE button.
10. Use the DELETE icon to delete the category or to un-map the variable.
11. The inserted category list appears in the list of categories on left of the page.
Repeat the above steps to add all the available categories and mapping the variables with DISCOM/State
you are carrying out the demand forecast studies for.
This section describes how to configure the licensee details in the software.
The LICENSEE module is used to model one or more distribution licensees of a State. The
distribution licensee could be a state distribution utility, a private DISCOM or a franchisee. The data
necessary for each DISCOM are discussed in the below subsections.
Each licensee/DISCOM and its associated parameters are configured using this module. Each of the
licensee/DISCOM has a unique Name and a Code. The type of the Licensee/DISCOM can be
configured to be any one of the following: State Distribution, Private DISCOM and Franchisee. The
parameters such as Energy (MU) of each of the licensee, the Load Profile (MW) met by each of
the licensee and Policies that are mandated by the governing bodies to be strictly adhered to are
configured.
Steps to access LICENSEE:
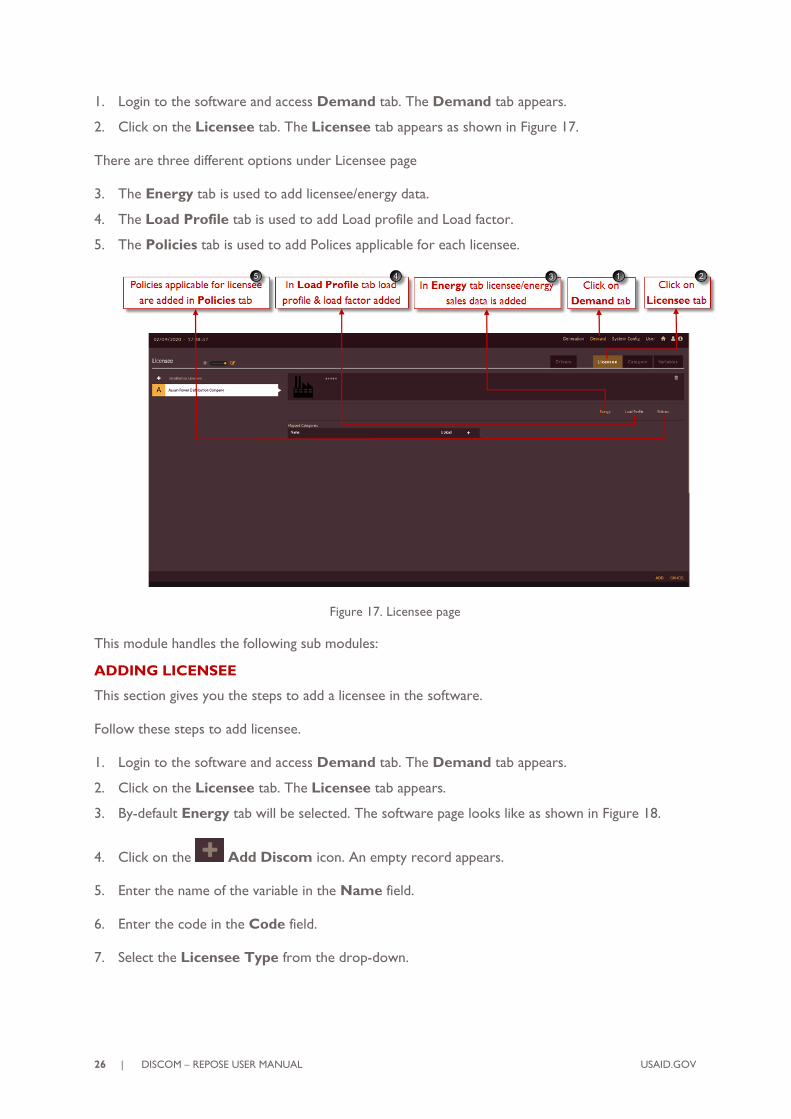
26 | DISCOM – REPOSE USER MANUAL USAID.GOV
1. Login to the software and access Demand tab. The Demand tab appears.
2. Click on the Licensee tab. The Licensee tab appears as shown in Figure 17.
There are three different options under Licensee page
3. The Energy tab is used to add licensee/energy data.
4. The Load Profile tab is used to add Load profile and Load factor.
5. The Policies tab is used to add Polices applicable for each licensee.
Figure 17. Licensee page
This module handles the following sub modules:
ADDING LICENSEE
This section gives you the steps to add a licensee in the software.
Follow these steps to add licensee.
1. Login to the software and access Demand tab. The Demand tab appears.
2. Click on the Licensee tab. The Licensee tab appears.
3. By-default Energy tab will be selected. The software page looks like as shown in Figure 18.
4. Click on the Add Discom icon. An empty record appears.
5. Enter the name of the variable in the Name field.
6. Enter the code in the Code field.
7. Select the Licensee Type from the drop-down.

27 | DISCOM – REPOSE USER MANUAL USAID.GOV
Figure 18. Introduction to Energy tab on Licensee page
8. Click on the ADD button. The “Are you sure?” confirmation pop-up appears.
Click on OK. The “Inserted successfully” message appears.
Click on CANCEL to discard the task.
The inserted licensee appears in the list of licensees as shown in Figure 19.
Figure 19. Licensee Added
ADDING ENERGY
This section gives you the steps to add Energy details associated with the licensee/Discom.

28 | DISCOM – REPOSE USER MANUAL USAID.GOV
Follow these steps to add Energy details.
1. Login to the software and access Demand tab. The Demand tab appears.
2. Click on the Licensee tab. The Licensee tab appears.
3. By-default Energy tab is selected. The Energy tab appears.
4. Click on previously added Distribution Licensee that appears on left of screen as shown in
Figure 20.
5. The Distribution Licensee Information appears on top.
6. Select which all categories to be involved in the study from the Drop-down below.
7. Click on the Add Category icon to select categories for the studies.
Figure 20. Adding Distribution Licensee
8. Click on the ADD button. The “Are you sure?” confirmation pop-up appears.
Click on OK. The “Inserted successfully” message appears.
Click on CANCEL to discard the task.

29 | DISCOM – REPOSE USER MANUAL USAID.GOV
Once Distribution Licensee is added, the licensee page appears as shown in Figure 21.
9. Select Distribution Licensee you added i.e. ‘Assam Power Distribution Company’.
10. The Pi-Chart on Energy sales appears on the right of the page based on categories selected.
11. To upload energy sales data click Upload icon for category which you need to upload data.
Figure 21. Page after Adding Distribution Licensee
(In the current example, we have considered HT-1 HT Domestic 25kVA (20 KW) category to show
how to upload energy sakes data)
Refer Table 2 for annual energy sales data and Table 3 for seasonal energy sales data of HT-1 HT
Domestic 25kVA (20 KW) category.
Figure 22 shows uploading the historical annual energy sales for HT-1 HT Domestic 25kVA (20 KW)
category.
12. Toggle the icon to HISTORY option .
13. Toggle the icon to ANNUAL option .
14. Then upload the energy sales data available for historical years of HT-1 HT Domestic 25kVA (20
KW) category (Table 2).
15. Click on SAVE button
The “Are you sure?” confirmation pop-up appears.

30 | DISCOM – REPOSE USER MANUAL USAID.GOV
Click on OK. The “Inserted successfully” message appears. Click on CANCEL to discard the task.
16. Upon successful upoloading & saving of the data, the graph appears on the page that reflects the
data uploaded.
Figure 22. Annual Energy Sales Data
Figure 23 shows uploading of historical seasonal energy sales for HT-1 HT Domestic 25kVA (20 KW)
category.
17. Toggle the icon to SEASONAL tab

31 | DISCOM – REPOSE USER MANUAL USAID.GOV
18. Then upload the energy sales data available for historical months of HT-1 HT Domestic 25kVA (20
KW) category (Table 3).
19. Click on SAVE button
The “Are you sure?” confirmation pop-up appears.
Click on OK. The “Inserted successfully” message appears. Click on CANCEL to discard the task.
20. After saving the data, the corresponding graph appears on the page for the data uploaded.

32 | DISCOM – REPOSE USER MANUAL USAID.GOV
Figure 23. Seasonal Energy Sales Data
Validations set are as follows:
a) Name of the licensee should be unique: When the user attempts to add a licensee with an
already existing name, the software throws the following error message.
b) Licensee/Discom name is a mandatory field. Hence, if no details are added, the software
throws the following error message.
c) Licensee/Discom Code field is a mandatory field. Hence, if no details are added, the software
throws the following error message.

33 | DISCOM – REPOSE USER MANUAL USAID.GOV
NOTE: The same steps can be used for editing the values of Energy Sales of all the associated
consumer categories by using the UPDATE icon on the same page in Edit mode.
Repeat the above steps to add energy sales data for the categories of the respective distribution
Licensee/State to perform the demand forecast studies.
ADDING LOAD PROFILE
This section gives you the steps to add LOAD PROFILE details associated with the licensee/Discom.
You can configure the Load Profile Data and Load factor using this functionality.
Load Profile Data
The load profile data section provides a download option to download the empty load profile template,
an import option to import the filled in load profile data and an export to export the load profile that
is saved in the software. This exported data can serve as a reference document in the future.
Load Factor
The load factor functionality allows you to populate load factor data for ‘n’ years. This can be either
historical or forecast data
Follow these steps to access load profile page.
1. Login to the software and access the Demand tab. The Demand tab appears.
2. Click on the Licensee tab. The Licensee tab appears.
3. Click on the Load Profile tab. The Load Profile tab appears.
After you click on Load Profile tab, the Load Profile data page appears as shown in Figure 24.
4. The pre-configured distribution licensee ‘Assam Power Distribution Company’ is displayed.
5. Load Profile Data is the option where you can upload the load profile
available.
6. Load Factor is the option where you can either upload load factor manually or
generate load factor by uploading Load Profile Data.
7. Export is the option where you can download the uploaded/imported load profile.

34 | DISCOM – REPOSE USER MANUAL USAID.GOV
Figure 24. Understanding the Load Profile Page
Follow these steps to add load profile details.
Repeat steps from 1 to 3 in section ADDING LOAD PROFILE
4. Do the following to configure Load Profile Data
Figure 25. Load Profile Data Uploading Page
a) Click on the DOWNLOAD TEMPLATE icon. The Download Load Profile
Template pop-up appears. Enter “From” and “To” date and click on the Download icon.

35 | DISCOM – REPOSE USER MANUAL USAID.GOV
Figure 26. Download Load Profile Template
The demand template gets downloaded as template in a separate browser tab.
Figure 27. Downloaded Template for Load Profile
The “Demand template downloaded successfully” message appears. Click on CLOSE icon
to close the pop-up window.
Figure 28. Load Profile Data Template Downloaded
b) Enter the required data in the template and save it.

36 | DISCOM – REPOSE USER MANUAL USAID.GOV
Figure 29. Template Filled in with Appropriate Data
c) Click on Choose File icon to add the Load profile data. The Windows Open dialog appears.
Figure 30. Selecting the Filled in Template File to Upload
d) Choose the filled in load profile file and click on the IMPORT button. The file gets imported.
The name appears below “File Name” and the size of the file appears under “File Size.”

37 | DISCOM – REPOSE USER MANUAL USAID.GOV
Figure 31. Select the Demand Template and IMPORT the Profile Data
The “Are you sure?” confirmation message appears.
Click on OK icon. The success message appears.
If the file submitted is correct, the success message “Demand data imported successfully” appears.
5. Once you upload Load profile, the other parameters like Load factor, Energy, Peak Demand &
Unmet Demand is calculated automatically and the page appears as shown in Figure 32.
a) You can see the parameters like Load factor, Energy, Peak Demand & Unmet Demand
calculated based on the Load profile data. You can view the data by selecting either Gross
Demand or Met Demand based on Load profile you have chosen.
b) You can see that once the Load profile is uploaded the range of years, he selected appears in
the Export button. You can download the uploaded profile by clicking on Export
button.
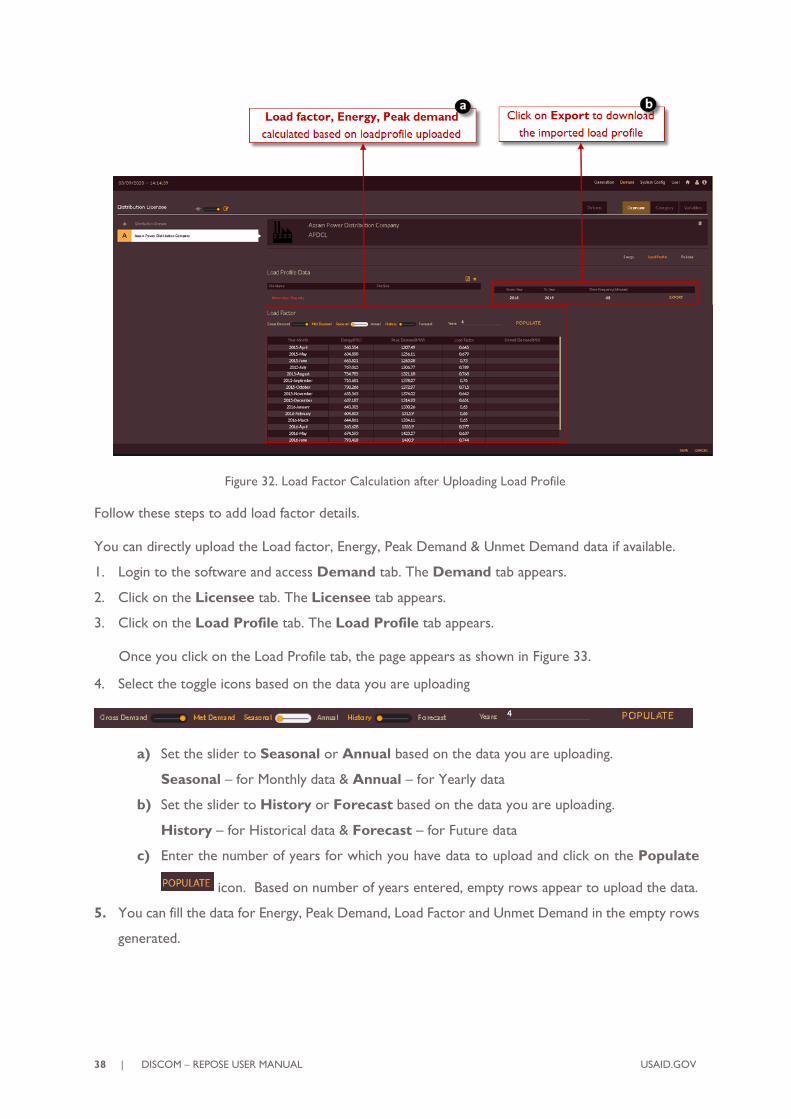
38 | DISCOM – REPOSE USER MANUAL USAID.GOV
Figure 32. Load Factor Calculation after Uploading Load Profile
Follow these steps to add load factor details.
You can directly upload the Load factor, Energy, Peak Demand & Unmet Demand data if available.
1. Login to the software and access Demand tab. The Demand tab appears.
2. Click on the Licensee tab. The Licensee tab appears.
3. Click on the Load Profile tab. The Load Profile tab appears.
Once you click on the Load Profile tab, the page appears as shown in Figure 33.
4. Select the toggle icons based on the data you are uploading
a) Set the slider to Seasonal or Annual based on the data you are uploading.
Seasonal – for Monthly data & Annual – for Yearly data
b) Set the slider to History or Forecast based on the data you are uploading.
History – for Historical data & Forecast – for Future data
c) Enter the number of years for which you have data to upload and click on the Populate
icon. Based on number of years entered, empty rows appear to upload the data.
5. You can fill the data for Energy, Peak Demand, Load Factor and Unmet Demand in the empty rows
generated.

39 | DISCOM – REPOSE USER MANUAL USAID.GOV
Figure 33. Load Profile Data page to Update Load Factor Details Manually
6. Click on the SAVE button.
The “Are you sure?” confirmation message appears.
Click on OK icon. The “Saved Successfully” message appears.
ADDING POLICIES
This section gives the steps to add policies for the licensee/Discom. You can add policies and map
them from the library using this module. While adding a new policy, it is important to add the name
of the policy, the years it is active, for which category the policy is for and the factors it impacts to
learn the load forecasting.

40 | DISCOM – REPOSE USER MANUAL USAID.GOV
FOLLOW THESE STEPS TO ADD NEW POLICIES INTO THE SOFTWARE
Let us consider government has introduced new policy which will be impacting on Licensee or
Category or Variable.
The new policy introduced will not be present in software as pre-configured, in such a case you have
to create new policy and configure it into the software.
1. Login to the software and access Demand tab. The Demand tab appears.
2. Click on the Licensee tab. The Licensee tab appears.
3. Click on the Policies tab. The Policies tab appears.
4. Set slider to New and Annual/Seasonal based on data to be uploaded.
Uploading new policy data is shown in Figure 34.
5. Enter the Policy Name in Name field.
6. Choose the option from drop-down on which the new policy impacts (Licensee, category or
variable).
7. Click on Add Year tab to add new rows and Remove Year tab to delete
the rows based on data and study period.
8. Zeros will be pre-filled in the page; you have to upload the policy data for which Licensee or
Category or Variable it is impacting.

41 | DISCOM – REPOSE USER MANUAL USAID.GOV
Figure 34. Steps to Add New Policy
9. Click on SAVE button to save the data.
The “Are you sure?” confirmation pop-up appears.
Click on OK icon.
The “Saved Successfully “confirmation message appears.
Repeat the above steps to add new policies into the software which will impact on the pre-configured
State/DISCOM Licensee or Category or Variable for carrying out the demand forecast studies.
Let us consider we have only added list of policies into the application and no data is added. Once
policies are configured, we have to add data into it.

42 | DISCOM – REPOSE USER MANUAL USAID.GOV
FOLLOW THESE STEPS TO ADD POLICIES’ DETAILS
Let us consider Policy named LED PENETRATION which is configured in software is impacting on
HT 1- HT DOMESTIC category and sample data is shown in Table 4.
1. Login to the software and access Demand tab. The Demand tab appears.
2. Click on the Licensee tab. The Licensee tab appears.
3. Click on the Policies tab. The Policies tab appears.
4. Set slider to Uploaded and Annual as required
Uploading policy data is shown in Figure 35.
5. Select the policy which you need for studies say here ‘LED Penetration’.
6. Automatically impact of policy will be mapped say here selected policy has impact on ‘Category’.
7. Upload the data for category which is getting impacted by selected policy say here ‘HT-1 HT
Domestic’ category.
Figure 35. Uploading Policy Data for the Category
8. Click on SAVE button to save the data.
The “Are you sure?” confirmation pop-up appears.

43 | DISCOM – REPOSE USER MANUAL USAID.GOV
Click on OK icon. The “Saved Successfully “confirmation message appears.
VIEWING LICENSEE
This section gives you the steps to view the licensee details.
Repeat first two steps of
ADDING LICENSEE section
3. Move the View or Edit slider to View side.
4. The Licensee page appears as shown in Figure 36.
Figure 36. Viewing Licensee

44 | DISCOM – REPOSE USER MANUAL USAID.GOV
EDITING LICENSEE
This section gives you the steps to edit the licensee details. You are allowed to edit the energy, load
profile and policies data of a licensee using these editing options.
Editing Energy Data:
Repeat first three steps of ADDING ENERGY section
You will see the page as shown in Figure 37
4. Move the View or Edit slider to Edit .
5. Click on the Upload Energy Data icon for which category you need to edit energy sales.
In manual it is shown for HT-1HT Domestic category.
Figure 37. Editing Enegy Sales Data on Energy Page
As you click edit icon the Energy page appears as shown in Figure 38.
6. Double-click on the row to make the table editable and make the changes in the table by altering
a specific value of energy sales as needed and as shown in below Figure 38.

45 | DISCOM – REPOSE USER MANUAL USAID.GOV
Figure 38. Editing Energy Sales Data
7. Click on SAVE button to make the changes.
The “Are you sure?” confirmation message appears.
Click on OK icon. The “Updated successfully” message appears. Click on CANCEL to discard
the changes.
The edited record appears in the list and graph gets updated.
Repeat the above steps to edit energy sales data for other categories.
Editing Existing Load Profile Data:
This section gives you the steps to edit the existing load profile data of a licensee.
Repeat first three steps of ADDING LOAD PROFILE section
The Load Profile page appears as shown in Figure 39.
4. Follow these steps to edit the uploaded load profile. :
a) Download the previously imported load profile by clicking on Export button.

46 | DISCOM – REPOSE USER MANUAL USAID.GOV
b) Downloaded file will appear on Task bar of the page in .xlsx format.
Figure 39. Editing Load Profile Data
You can edit the profile and can import it again by repeating the steps shown in ADDING LOAD
PROFILE section.
Editing Existing Load Factor Data:
Follow the following steps to edit the load factor uploaded manually by user
1. Login to the software and access Demand tab. The Demand tab appears.
2. Click on the Licensee tab. The Licensee tab appears.
3. Click on the Load Profile tab. The Load Profile tab appears.
After you click on Load Profile tab, the page appears as shown in Figure 40.
4. Move the View or Edit slider to Edit side
5. You have to select the toggle icons based on the you need to edit
d) Set the slider on Seasonal or Annual based on the data you need to edit.
Seasonal – for Monthly data & Annual – for Yearly data
e) Set the slider on History or Forecast based on the data you need to edit.
History – for Historical data & Forecast – for Future data

47 | DISCOM – REPOSE USER MANUAL USAID.GOV
f) Enter number of years based on data to edit and click on Populate tab, based on
number of year’s uploaded data will appear on page.
6. To edit data, double click on the cell you need to edit.
As you change Energy/Peak Demand value Load Factor will get automatically updated in Load
factor column.
Figure 40. Editing Load Factor Data Manually
7. Click on SAVE button.
The “Are you sure?” confirmation message appears.
Click on OK to make the changes. Click on CANCEL to discard the changes.
The “Updated successfully” message appears.

48 | DISCOM – REPOSE USER MANUAL USAID.GOV
The updated details appear on the page.
Editing Existing Policies Data:
This section will help user to edit policy data by following the given steps
1. Login to the software and access the Demand tab. The Demand tab appears.
2. Click on the Licensee tab. The Licensee tab appears.
3. Click on the Policies tab. The Policies tab appears.
After you click on Policies tab, the page appears as shown in Figure 41.
4. Move the View or Edit slider to Edit side
5. Set the slider to Uploaded option and select Seasonal/Annual and
Policy name based on you need to edit the data for policy.
Here example is shown for editing data of LED Penetration policy
6. Double click on the row which you need to edit the data.
Figure 41. Editing Policy Data

49 | DISCOM – REPOSE USER MANUAL USAID.GOV
7. Click on SAVE button to save the data.
The “Are you sure?” confirmation pop-up appears.
Click on OK button. Click on the CANCEL button to discard the changes.
The “Saved Successfully “confirmation message appears.
The Edited policy details appear on the page.
Repeat the above steps to edit other policy data for other categories.
2.1.3 Additional Parameters
The additional parameters include the system configuration information such as seasons and
Transmission & Distribution Losses as both these parameters are observed to have higher impact on
the demand experienced by the utility. The seasons and T&D modules are provided under SYSTEM
CONFIG tab.
Steps to access SYSTEM CONFIG page:
1. Login to the software and access System Config tab. The System Config tab appears
After you click on System Config tab the software page looks like as shown in Figure 42.
2. Seasons tab is used to enter seasons data
3. T & D Loss tab is used to configure transmission – distribution losses in to system.
4. Click on the Add Season data icon to add the season’s data.
5. RPO tab is used to enter RPO targets data.

50 | DISCOM – REPOSE USER MANUAL USAID.GOV
Figure 42. Introduction To System Config Page
Along with the demand parameters considered for demand forecasting, the additional parameters
such as seasons and T&D Losses are to be considered. This section gives the introduction and steps
to configure the seasons’ variable that gets used in the execution of load forecast studies. In general,
the seasons are of four types as shown in Table 5.
Table 5. Seasons List
SL. NO. SEASONS FROM – TO PERIOD
1 Autumn July - August
2 Monsoon September – November
3 Summer March – June
4 Winter December - February
STEPS TO ADD SEASONS DATA
1. Login to the software and access System Config tab. The System Config tab appears.
2. Click on the Seasons tab. The Seasons tab appears.
After you click on Seasons tab the software page looks like as shown in Figure 43.
3. Click on the Add Season Data icon. An empty record appears.
4. Add name in Name field and select “From” & “To” period from the calendar as shown in Figure
43.

51 | DISCOM – REPOSE USER MANUAL USAID.GOV
Figure 43. Adding Seasons
5. Click on the ADD button. The “Are you sure?” confirmation pop-up appears.
Click on OK. The “Inserted successfully” message appears.
Click on CANCEL to discard the task.
6. The inserted seasons’ list will appear on left of the page in alphabetic order.
STEPS TO VIEW/EDIT/DELETE SEASONS DATA:
Repeat first two steps as given in SEASONS section
3. Select which season data you need to view/edit/delete.
(In Figure 44, January is selected as an example)
4. Set the View-Edit slider as user requirement.

52 | DISCOM – REPOSE USER MANUAL USAID.GOV
5. If you need to edit data set slider to edit option and make the changes required like name, from &
to period.
Figure 44. View/Edit/Delete Seasons
6. Click on UPDATE button to save the changes.
The “Are you sure?” confirmation message appears.
Click on OK to accept the changes made. The “Updated successfully” message appears.
The updated record appears in the list.
7. You can also delete the record by clicking on Delete icon.
The “Are you sure?” confirmation message appears.

53 | DISCOM – REPOSE USER MANUAL USAID.GOV
Click on OK. The “Season details deleted successfully” message appears.
The deleted record is removed from the list.
This section gives the description on Transmission and Distribution losses and this functionality gives
the steps to configure, add, view, edit and delete T & D losses in the software.
T&D losses also account for a reduction in the total demand of a State. Programs like Ujjwal Discom
Assurance Yojana (UDAY), Integrated Power Development Scheme (IPDS), and etc. aim at bringing
down the AT&C losses of the country. For instance, IPDS aims at reducing the AT&C losses by
strengthening of sub-transmission and distribution network and by metering of distribution
transformers /feeders / consumers in the urban areas. This is supported by establishment of IT enabled
energy accounting / auditing system, improvement in billed energy based on metered consumption and
improvement in collection efficiency. In line with this program, DISCOMs have developed trajectories
of loss reduction, which shall be considered in Demand Forecast. In addition to these trajectories, the
actual reduction of T&D losses in the past years shall also be weighed to arrive at the most probably
rate of loss reduction.
You can choose either the historical data or the forecast data. When you choose the historical data,
by default 16 years data is considered. The percentage of loss against the number of years is populated
as both graph and table data.
STEPS TO CONFIGURE TRANSMISSION & DISTRIBUTION LOSSES INTO THE
SOFTWARE:
1. Login to the software and access System Config tab. The System Config tab appears.
2. Click on the T & D Loss tab. The T & D Loss tab appears.
After you click on T & D Loss tab the software page looks like as shown in Figure 45.
3. Set Seasonal/Annual, History/Forecast and number of Years based on data configuration then
click on POPULATE icon.
4. Upload the data for T&D Losses in Loss(%) column.

54 | DISCOM – REPOSE USER MANUAL USAID.GOV
Figure 45. Addition T & D Loss
5. Click on SAVE button.
The” Are you sure?” confirmation message appears.
Click on OK to confirm adding the role. The “Inserted successfully” message appears. Click
CANCEL to discard the task.
6. Click Refresh icon, the graph gets generated and it shows T & D Losses percentage
for populated years.
7. The same data is also provided in tabular format below the graph.
8. You can also modify the data and save using the icon and regenerate the graph.

55 | DISCOM – REPOSE USER MANUAL USAID.GOV
This section describes the driving factors that impact the load pattern for the selected period of time.
The resultant assessed variations are either added or subtracted from the proposed generation to
match the demand.
The factors included for the execution are the following:
Open Access (OA)
Open access is the share of energy that is consumed from sources other than the Licensee/DISCOMs
by the consumers. The increase or decrease in Open Access energy is configured annually for “n”
years selected by the user. This value is subtracted from the total generation figure for the Discom.
The OA module allows the user to configure the OA values for a selected period of time and use it
for final estimation.
Captive Power Plant (CPP)
A captive Power Plant is a facility that provides a localized source of power to an energy user. Usually
these are the industries or large facilities or commercial office units. They can operate in two modes:
Island mode – where the CPP works independently of the local electricity distribution systems and
Grid Parallel mode – where these facilities are capable of exporting their surplus power to the local
electricity distribution network. Captive power plants are a form of distributed generation, generating
power close to the source of use. Distributed generation facilitates the high fuel efficiency along with
minimizing losses associated with the transmission of electricity from centralized power plants.
The CPP module allows you to configure the energy share that is taken from the CPPs and not from
DISCOMS. Hence this share is subtracted from the estimated power to be generated.
Distributed Energy Resources (DER)
DER stands for Distributed Energy Resources. These are the micro-grids (solar/rooftop solar) units
of power generation sources that provide power to the consumers locally. The share of DERs are
essential to be subtracted from the estimated load on the Discom, hence the generation can be
optimized accordingly.
The DER module allows you to configure the DER categories and DER configuration details that
participates in the demand forecast.
Electric Vehicles (EV)
Based on the policies, the increase in the number of electric vehicles is expected to rise rapidly. The
grid is expected to experience a higher EV penetration. In order to provide the exact demand
experienced by the utility, it is essential to include the EV penetration data therefore; EV data should
be added for the estimated load on Discom. This module allows you to create the categories of EVs,
the configure the EVs’ specifications, and the quantum of energy these consumes, the re-charging cycles

56 | DISCOM – REPOSE USER MANUAL USAID.GOV
and all other details essential to determine the impact of EVs in the demand forecast. The EV module
is used to configure the EV category and EV configuration data.
ACCESSING DRIVERS DETAILS
This section gives you the steps to access Driver details in the software.
Prerequisite
• The Licensee/DISCOM should be mapped with appropriate variables before uploading the OA
Values.
• You must have appropriate rights to configure the data.
Follow these steps to access Drivers page.
1. Login to the software and access Demand tab. The Demand tab appears.
2. Click on the Drivers tab. The Drivers tab appears.
Then you will see the page as shown in Figure 46
3. The Drivers tab details appear. It has four sub-tabs: OA, CPP, DER, and EV.
4. By default, OA – Open Access is selected.
Figure 46. Introduction to Drivers Page
CONFIGURING OPEN ACCESS (OA)
STEPS TO CONFIGURE OPEN ACCESS (OA)
Repeat first two steps given in ACCESSING DRIVERS DETAILS.

57 | DISCOM – REPOSE USER MANUAL USAID.GOV
3. You have to select History/Forecast and number of Years based on you need to upload the
data then click on Populate icon.
4. Initially the chart shows Open Access value as “0”, you have to enter the data for respective
years manually.
Figure 47. Configuring Open Access (OA) Data
5. Click on button to save the open access values to be considered for the final calculation of
the generation value. The table gets saved.
The “Are you sure?” confirmation message appears.
Click on OK to save the details. Click on CANCEL to discard the changes.
The “Saved Successfully” message appears.

58 | DISCOM – REPOSE USER MANUAL USAID.GOV
Click on the Refresh Graph icon. The energy share value across years appears on the page.
6. You can View/Edit by setting slider in required mode.
CONFIGURING CAPTIVE POWER PROCUREMENT (CPP)
This section gives you the steps to configure the demand variations expected owing to CPP values in
Million Units (MU) against the year in which the CPP serves the consumers. These values can be
configured either for the historic data or for the forecast data.
STEPS TO CONFIGURE CAPTIVE POWER PROCUREMENT (CPP)
Follow these steps to configure CPP.
Repeat the first two steps given in ACCESSING DRIVERS DETAILS

59 | DISCOM – REPOSE USER MANUAL USAID.GOV
3. Click on CPP icon.
4. You have to select History/Forecast and number of Years for which you need to enter the data
then click on Populate icon.
5. Initially chart area shows Captive Power Procurement Energy Shares value as “0”, you have
to upload the data for respective years.
Figure 48. Configuring Captive Power Procurement (CPP) Data
6. Click on button to save the open access values to be considered for the final calculation of
the generation value. The table gets saved.
The “Are you sure?” confirmation message appears.
Click on OK to save the details. Click on CANCEL to discard the changes.
The “Saved Successfully” message appears.

60 | DISCOM – REPOSE USER MANUAL USAID.GOV
Click on the Refresh Graph icon. The energy share value across years appears on the
page.
7. User can View/Edit by setting slider in required mode.
Note:
• The CPP data shown in Figure 48 is an imaginary data considered as there is no CPP data
available for Assam state.
CONFIGURING DISTRIBUTED ENERGY RESOURCES (DER)
This section gives you the steps to configure DERs in the software.
There are sub categories to be configured under DER Drivers options and are.
i. DER Category
ii. DER Configuration
• DER Specification
• Generation Profile
STEPS TO CONFIGURE DER CATEGORY
Repeat first two steps given in ACCESSING DRIVERS DETAILS
Click on DER icon
Once you click DER then page will appear as shown in Figure 49.
Set the View/Edit slider to Edit option.
By default, DER Category tab is selected.
Click on the Add Category icon to add new DER Category. To delete category, click on Delete
Category icon.
An empty row appears. Enter the Name and Code of the DER category. In this example, it is Solar
and the code is PV.

61 | DISCOM – REPOSE USER MANUAL USAID.GOV
Figure 49. Configuring DER category
Click on SAVE button.
The “Are you sure?” confirmation message appears.
Click on OK to save the details. Click on CANCEL to discard the changes.
The “Saved Successfully” message appears.
STEPS TO CONFIGURE DER SPECIFICATION
After saving DER Category, next step is to add data under DER CONFIGURATION
Click on DER Configuration icon.
Once you click DER Configuration tab then page will appear as shown in Figure 50.

62 | DISCOM – REPOSE USER MANUAL USAID.GOV
Figure 50. DER Configuration Page
Click on the name of the utility you have configured: here we have Assam Power Distribution
Company. The DER Specification table appears as shown in Figure 51.
Click on the Specification icon to add data, empty table appears with single row pre-filled with ‘0’.
Click on Add year icon to add more years to the table. Click on Delete Last Row icon to
delete extra rows.
The year on year data on installed capacity of the solar equipment and its CUF has to upload for
respective year.
• IC - Installed Capacity
• CUF – Capacity Utilization Factor (%) are configured for the historic period and the forecasting
period.
Enter the IC values and the CUF percentages in the table.
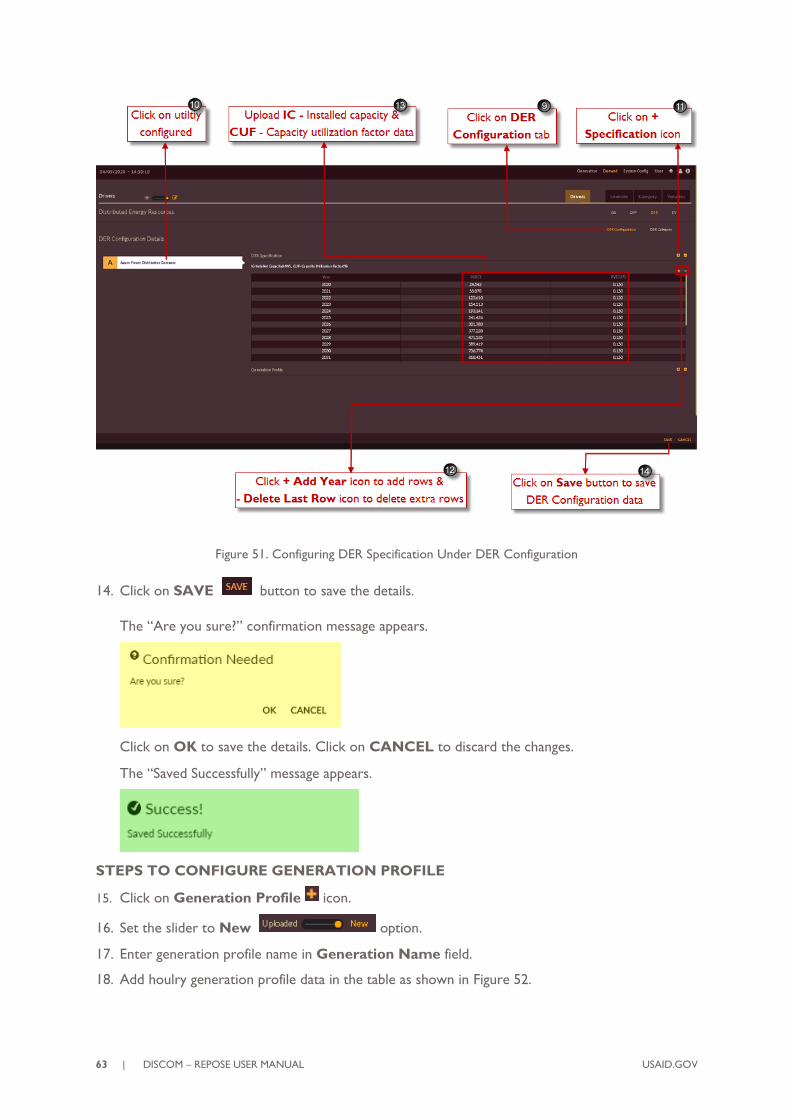
63 | DISCOM – REPOSE USER MANUAL USAID.GOV
Figure 51. Configuring DER Specification Under DER Configuration
14. Click on SAVE button to save the details.
The “Are you sure?” confirmation message appears.
Click on OK to save the details. Click on CANCEL to discard the changes.
The “Saved Successfully” message appears.
STEPS TO CONFIGURE GENERATION PROFILE
15. Click on Generation Profile icon.
16. Set the slider to New option.
17. Enter generation profile name in Generation Name field.
18. Add houlry generation profile data in the table as shown in Figure 52.

64 | DISCOM – REPOSE USER MANUAL USAID.GOV
Figure 52. Configuring Generation Profile Under DER Configuration
19. Click on SAVE button to save the details.
The “Are you sure?” confirmation message appears.
Click on OK icon to add the values. Click on CANCEL to discard the changes.
The “Saved successfully” added message appears.
STEPS TO VIEW CONFIGURED GENERATION PROFILE
20. Set the slider to Uploaded option as shown in Figure 53.
21. You can view the uploaded Generation profile by selecting from Drop-down.
You can also edit the generation profile and save.

65 | DISCOM – REPOSE USER MANUAL USAID.GOV
Figure 53. Uploaded Generation Profile
CONFIGURING ELECTRIC VEHICLES (EV)
This section gives you the steps to configure the variations in the demand caused by EV penetration.
The module allows you to configure both EV Specifications using EV configuration and EV Category.
There are sub categories to be configured under EV Drivers options and are.
i. EV Category
ii. EV Configuration
• EV Vehicle Specifications
• Count
• Charging Profile
STEPS TO CONFIGURE EV CATEGORY
Repeat first two steps given in ACCESSING DRIVERS DETAILS
3. Click on EV icon
Once you click EV then page will appear as shown in Figure 54.
Set the View/Edit slider to Edit option.
By default, EV Category tab is selected.
Click on the Add Category icon to add new EV Category. To delete category, click on
Delete Category icon.
An empty row appears. Enter the Name and Code of the EV category. In this example, it
is 4W-PV, Bus, 3W and 2W code shown.

66 | DISCOM – REPOSE USER MANUAL USAID.GOV
Figure 54. Configuring EV category
Click on SAVE button.
The “Are you sure?” confirmation message appears.
Click on OK to save the details. Click on CANCEL to discard the changes.
The “Saved Successfully” message appears.
STEPS TO CONFIGURE ELECTRIC VEHICLE SPECIFICATIONS
Once you save EV Category, next step is to add data under EV CONFIGURATION
Click on EV Configuration button.
Once you click EV Configuration tab then page will appear as shown in Figure 55.

67 | DISCOM – REPOSE USER MANUAL USAID.GOV
Figure 55. EV Configuration Page
Click on the name of the utility you have configured: here we have Assam Power Distribution
Company. The EV Specification table appears as shown in Figure 56
Click on the Electric Vehicle Specification icon to add data, empty table appears with vehicle
category what user has added while configuring EV Category and rows are pre-filled with ‘0’. Click
Collapse icon to cancel.
Add the data available for Avg battery size, Complete charging cycle efficiency, Avg km
run/day, Energy requirement per km & Charging cycles per hour for each vehicle category.
Figure 56. Configuring Electric Vehicle Specifications

68 | DISCOM – REPOSE USER MANUAL USAID.GOV
Click on SAVE button.
The “Are you sure?” confirmation message appears.
Click on OK to save the details. Click on CANCEL to discard the changes.
The “Saved Successfully” message appears.
STEPS TO CONFIGURE EV COUNT
Click on the Count icon to add empty table with vehicle category as heading one row pre-filled ‘0’.
Click Collapse icon to cancel.
Once you click Count icon, the count page appears as shown in Figure 57.
Click on the Add Year icon to add multiple rows.
Add count of vehicle for the category you added like 2W, 3W, 4W-PV & Bus.
Figure 57. Configuring EV’s Count

69 | DISCOM – REPOSE USER MANUAL USAID.GOV
Click on SAVE button.
The “Are you sure?” confirmation message appears.
Click on OK to save the details. Click on CANCEL to discard the changes.
The “Saved Successfully” message appears.
STEPS TO CONFIGURE EV CHARGING PROFILE
Click on Charging Profile icon.
Set the slider to “New” option.
Enter name in Profile Name field. Example shown is Typical Charging Profile.
Add houlry charging profile data in the table as shown in Figure 58.
Figure 58. Configuring EV Charging Profile

70 | DISCOM – REPOSE USER MANUAL USAID.GOV
Click on SAVE button.
The “Are you sure?” confirmation message appears.
Click on OK to save the details. Click on CANCEL to discard the changes.
The “Saved Successfully” message appears.
STEPS TO VIEW CONFIGURED CHARGING PROFILE
23. Set the slider to Uploaded option as shown in Figure 59.
24. You can view the uploaded Charging profile by selecting from drop-down.
You can also edit the charging profile and save.
Figure 59. Uploaded Charging Profile
2.1.4 Building Scenarios for Demand Forecast Studies
Once you update all the inputs to the software, you can perform the Demand Forecast Studies.
For performing demand forecast studies in DISCOM – REPOSE software you have to create study
scenarios.
Let us perform our studies with and without drivers.
71 | DISCOM – REPOSE USER MANUAL USAID.GOV
For performing studies without the impact of drivers on Discom load you have to create a scenario
say – Business As usual (BAU).
For performing studies with the impact of drivers on Discom load you have to create a scenario say –
Scenario with Drivers.
All the LDFC and MDFC executions are run based on the scenarios that are configured. The user is
allowed to configure the scenarios for both or either of long term or medium term forecast studies.
The configuration details include the method, history data and forecast data period to run the load
forecast.
Note:
• LDFC – Long term demand forecast is the study period of more than 5 years
• MDFC - Medium term demand forecast is the study period of 1 year to 5 years
BAU-Business As Usual is the scenario for performing both Medium - term (LDFC) and Long- term
(MDFC) demand forecast studies for the defined duration.
CREATE BAU SCENARIO
This section gives you the steps to access and create BAU scenario.
Follow these steps to add a scenario.
1. Login to the software. The Dashboard/ Home page appears.
Alternatively, click on Home icon to access the execution page. The page will appear as shown
in Figure 60.
2. Click on settings option provided on LDFC or MDFC block to add the scenario creation
page.

72 | DISCOM – REPOSE USER MANUAL USAID.GOV
Figure 60. DISCOM – REPOSE Home Page
Once you click settings icon, an empty record appears on the page as shown in Figure 61.
Figure 61. Blank Record to Create Scenario for DFC Studies
3. By default LDFC option will be selected.
4. Give appropriate scenario name in Scenario Name field, here we have named as ‘Business As
Usual’.
5. Add LDFC data as shown in Figure 62.
• Select LDFC Method Type from the drop-down

73 | DISCOM – REPOSE USER MANUAL USAID.GOV
• Select historical from and to period and forecast from and to period
• Set Compute Load Profile slider on No/Yes option if required.
Figure 62. Creating BAU Scenario & Adding LDFC Details
6. Click on the SAVE button to save LDFC scenario settings.
The “Are you sure?” confirmation message appears.
Click on the OK icon to save the scenario.
The “Saved Successfully” message appears.
7. Click on MDFC tab to add medium term study details.
You will see the page as shown in Figure 63.
8. Add MDFC data; as shown in Figure 63.
• Select MDFC Method Type from the drop-down

74 | DISCOM – REPOSE USER MANUAL USAID.GOV
• Select historical from and to period and forecast from and to period
• Set Compute Load Profile slider on No/Yes option if required.
Figure 63. Adding MDFC Details
9. Click on the SAVE button to save MDFC scenario settings.
The “Are you sure?” confirmation message appears.
Click on the OK icon to save the scenario.
The “Saved Successfully” message appears.
10. The scenario appears in the scenario list as shown in Figure 64.

75 | DISCOM – REPOSE USER MANUAL USAID.GOV
Figure 64. BAU Scenario in Scenario List
The scenario page and the scenario will be having following features;
Figure 65. Scenario List and Scenario Features
• icon to sort the records.
• View Result icon to view the results.
• Edit Scenario icon to edit the scenario.
• Delete icon to remove the scenario from the list.
EDIT BAU SCENARIO
When a scenario is created and it appears on the page, it will not be having any data, you have to
configure all the data which you have given as input.
This section gives explains how to edit the scenario.
Follow these steps to edit a scenario.
1. In the scenario list shown in Figure 66 click on the Edit scenario icon.
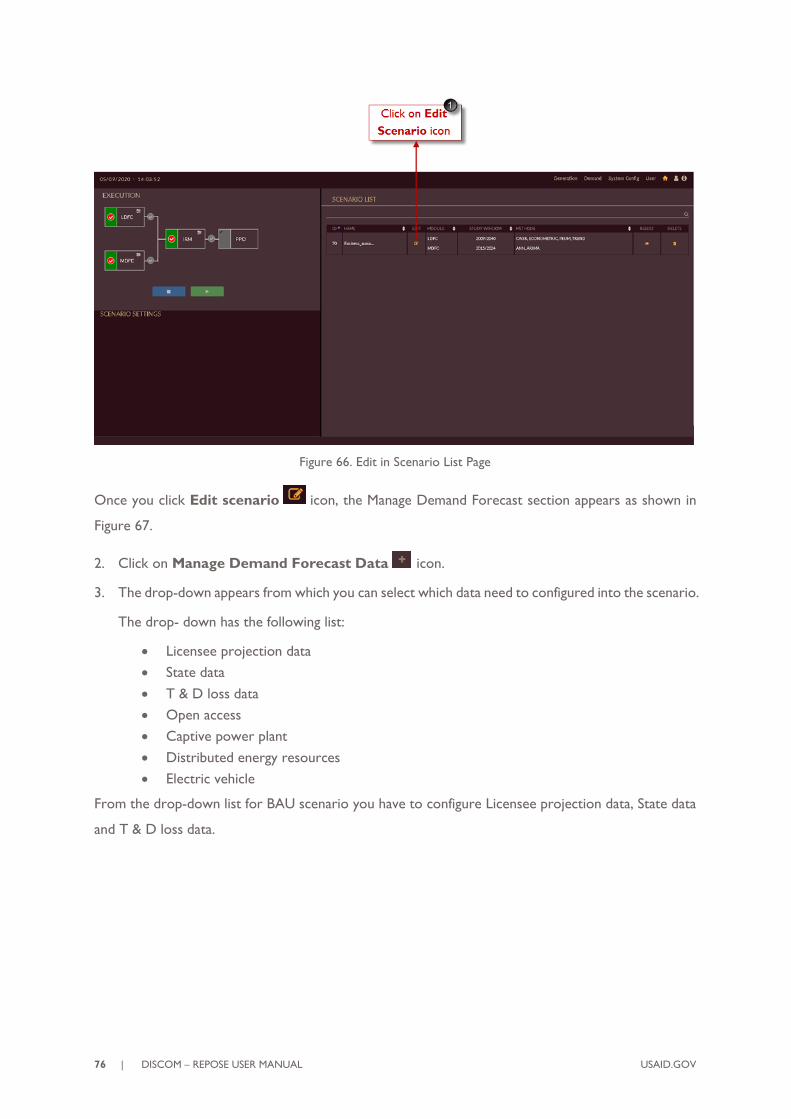
76 | DISCOM – REPOSE USER MANUAL USAID.GOV
Figure 66. Edit in Scenario List Page
Once you click Edit scenario icon, the Manage Demand Forecast section appears as shown in
Figure 67.
2. Click on Manage Demand Forecast Data icon.
3. The drop-down appears from which you can select which data need to configured into the scenario.
The drop- down has the following list:
• Licensee projection data
• State data
• T & D loss data
• Open access
• Captive power plant
• Distributed energy resources
• Electric vehicle
From the drop-down list for BAU scenario you have to configure Licensee projection data, State data
and T & D loss data.

77 | DISCOM – REPOSE USER MANUAL USAID.GOV
Figure 67. Manage Demand Forecast Data
Once Scenario is created you need add the required data for studies from raw data section by selecting
required data’s from Manage Demand Forecast Data drop-down list.
STEPS TO EDIT/CONFIGURE LICENSEE PROJECTION DATA
1. Click on Manage Demand Forecast Data icon and select Licensee projection data from
the drop-down list as shown in Figure 68.

78 | DISCOM – REPOSE USER MANUAL USAID.GOV
Figure 68. Manage Licensee Projection Data
Once you click on Licensee Projection Data link, the scenario specific Licensee Configuration
data page appears shown in Figure 69.
2. By default, Energy option will be selected.
3. Select all the categories you need to consider in the scenario for the studies.
4. Set Seasonal /Annual slider to Annual option to configure annual licensee data.
5. Click Edit icon for the categories whose data need to edit
Here HT-1 HT Domestic category is shown.

79 | DISCOM – REPOSE USER MANUAL USAID.GOV
Figure 69. Edit Licensee Configuration Data
As you click on edit icon of the category the data page will open as shown in Figure 70.
6. Table shows the data for all the variables mapped to categories (seen in CATEGORY section) the
variables selected here by checking the check box will participate in Econometric method of
LDFC.
7. By clicking Add dummy icon you can add column for adding dummy variables.

80 | DISCOM – REPOSE USER MANUAL USAID.GOV
Figure 70. Configuring Econometric Variable Data of Category
8. Click on Update button the changes made will be updated.
The above steps explained the configuration LDFC using the econometric method. Figure 71 shows
configuration of data for LDFC methods using CAGR, TREND and PEUM methods.
9. Click Config icon for repective categories. Here HT-1 HT Domestic category is shown.

81 | DISCOM – REPOSE USER MANUAL USAID.GOV
Figure 71. Configuring the Category
Once you click Config icon, the page as shown in Figure 72 appears.
10. There are four different options under Config of each category;
• UD – User Defined
• CAGR – Coumpound Annual Growth Rate
• Trend
• PEUM – Partial End Use Method

82 | DISCOM – REPOSE USER MANUAL USAID.GOV
Figure 72. Configuring LDFC Methods
Steps to configure User defined – UD method:
Figure 73 shows the steps to configure user defined method to LDFC studies.
a) By default UD icon will be selected
b) You have to enter the percentage gowth rate for respective forecast years in Growth rate
(%) column. Automatically Forecast Energy (MU) will be calculated and displayed by the
software.

83 | DISCOM – REPOSE USER MANUAL USAID.GOV
Figure 73. Configuring User Defined Method
c) Click on the SAVE button to save the configured UD growth rate.
The “Are you sure?” confirmation message appears.
Click on the OK icon to save the scenario.
The “Saved Successfully” message appears.
Steps to configure Compound Annual Growth Rate – CAGR method:
Figure 74 shows the steps to configure CAGR method to LDFC studies.
d) Click on CAGR button.
e) You have to select History Period From and History Period To from the calender option
whcich will be applied for CAGR current and base year formula.

84 | DISCOM – REPOSE USER MANUAL USAID.GOV
Figure 74. Configuring CAGR Method
f) Click on the SAVE button to save the configured CAGR years.
The “Are you sure?” confirmation message appears.
Click on the OK icon to save the scenario.
The “Saved Successfully” message appears.
Steps to configure TREND method:
Figure 75 shows the steps to configure TREND method to LDFC studies.
g) Click on TREND button.
h) You have to select the Curve Option from the list required for TREND method LDFC
studies.

85 | DISCOM – REPOSE USER MANUAL USAID.GOV
Figure 75. Configuring Trend Method
i) Click on the SAVE button to save the configured TREND curve.
The “Are you sure?” confirmation message appears.
Click on the OK icon to save the scenario.
The “Saved Successfully” message appears.
Steps to configure Partial End Use Method - PEUM:
Figure 76 shows the steps to configure PEUM method to LDFC studies.
j) Click on PEUM button.
k) List of Idependent Variables mapped to category will appear in table with Variable Name
and Short Code.
l) You have to enter the Equation required to compute energy sales using PEUM method.
m) Once equation is entered click on Refresh icon.
n) Energy calculated will be displayed in table along with the independent variabled used in
equation.

86 | DISCOM – REPOSE USER MANUAL USAID.GOV
Figure 76. Configuring PEUM Method
o) Click on the SAVE button to save the configured PEUM equation and results.
The “Are you sure?” confirmation message appears.
Click on the OK icon to save the scenario.
The “Saved Successfully” message appears.
11. Set Seasonal /Annual slider to Seasonal option to configure monthly licensee data.
12. Enter suitable or calculated P/D/Q values in the boxes.

87 | DISCOM – REPOSE USER MANUAL USAID.GOV
Figure 77. Editing Seasonal Licensee Data
13. Click on the SAVE button.
The “Are you sure?” confirmation message appears.
Click on the OK icon to save the scenario.
The “Saved Successfully” message appears.
Steps to configure Load Profile into the Licensee data:
Repeat the first step of STEPS TO EDIT/CONFIGURE LICENSEE PROJECTION DATA
section.
14. Click on Load Profile button.
15. Select the Reference Year For Load Profile from the drop-down.

88 | DISCOM – REPOSE USER MANUAL USAID.GOV
Figure 78. Configuring Load Profile for the Scenario
16. Click on the SAVE button.
The “Are you sure?” confirmation message appears.
Click on the OK icon to save the scenario.
The “Saved Successfully” message appears.
STEPS TO EDIT/CONFIGURE STATE DATA:
1. Click on Manage Demand Forecast Data icon and select State Data from the drop-down
list as shown in Figure 79.

89 | DISCOM – REPOSE USER MANUAL USAID.GOV
Figure 79. Manage State Projection Data
Once you click State Data, software will take user to State Variable Data Configuration page
of Business As Usual senario as shown in Figure 80.
2. You will observe the graph generated for all the independent variables selected for ecoometric
method in Licensee manage data.
3. Yearly values of independent variables will be tabulated in the table whereas, dependent variables
(energy sales of each category) columns will be empty filled with ‘-‘ .
4. You can view/edit seasonal & annual data by setting slider to Seasonal/Annual option.

90 | DISCOM – REPOSE USER MANUAL USAID.GOV
Figure 80. Edit/Save State Projection Data
5. Click on Save button to save the state data, Update button to update the changes made in state
data and Cancel icon to discard the changes made in state data.
STEPS TO EDIT/CONFIGURE T & D LOSS DATA:
1. Click on Manage Demand Forecast Data icon and select T & D Loss from the drop-down
list as shown in Figure 81.

91 | DISCOM – REPOSE USER MANUAL USAID.GOV
Figure 81. Manage T & D Loss Data
On clicking T & D Loss ffrom the drop-down, the software navigates to the Transmission &
Distribution Lossess page of Business As Usual senario as shown in Figure 82.
2. Select Seasonal/Annual option to view or edit T & D Loss data.
3. Loss(%) data configured in STEPS TO CONFIGURE TRANSMISSION &
DISTRIBUTION LOSSES INTO THE SOFTWARE: section will be displayed in tabular
form. You can edit T & D Loss data by doble clicking th row.
4. Click on Refresh icon to generate graph if Loss(%) data is modified.
5. Graph with respect to Loss(%) data will be generated.

92 | DISCOM – REPOSE USER MANUAL USAID.GOV
Figure 82. Edit/Save T & D Loss Data
6. Click on Save button to save the state data, Update button to update the changes made in state
data and Cancel icon to discard the changes made in state data.
7. After saving all Licensee, State and T & D data into the Business As Usual (BAU) scenario user will
see the page as shown in Figure 83.

93 | DISCOM – REPOSE USER MANUAL USAID.GOV
Figure 83. Finalized BAU Scenario
EXECUTE BAU SCENARIO
Now that all configurations are completed, we shall see how to execute the demand forecast (LDFC
& MDFC).
This section gives you the steps to execute the scenario created.
1. Go to scenario list page as shown in Figure 84 and click on Edit Scenario icon for the scenario
which you need to execute.
Figure 84. Select Scenario to be Executed

94 | DISCOM – REPOSE USER MANUAL USAID.GOV
2. Select the method i.e, LDFC function and MDFC function by clicking the
red tick mark of respective methods.
3. Click on the Execute icon on the left-side shown in Figure 85.
4. Orange line appears on the top of the software page indicating that scenario is getting executed.
Figure 85. Execution of Demand Forecast
The “Executed Successfully” message appears.
Upon successful execution of the scenario, you’re navigated to the results page as shown in Figure 86.

95 | DISCOM – REPOSE USER MANUAL USAID.GOV
Figure 86. Result Page
DOWNLOAD/EXPORT/VIEW BAU SCENARIO RESULTS
This section gives the steps to view, export and download results of demand profile that is executed.
STEPS TO VIEW & EXPORT BAU-DFC RESULTS:
Login to the software. The Dashboard/Home page appears. The Scenario List appears on the right
of the home page.
1. Click on the View Result icon on the scenario that you wish to view. In this example, we
see the results of the scenario 70, Business as usual.
Figure 87. View the Scenario

96 | DISCOM – REPOSE USER MANUAL USAID.GOV
Once you click View icon, the result page of selected scenario, Business As Usual will open as
shown in Figure 88.
2. In the result page LDFC methods will be pre-selected by software based on best 𝑅2 value.
3. Click on Chart/Graph icon to view results in graphical format.
Once you click icon, the result page will appear in the form of graphical rpresentation as shown
in Figure 89. Move the Graph or Table data slider to Table. The same data appears
as table.
4. Click on Consolidate icon to view results in consolidated format.
Figure 88. Result Page for Viewing

97 | DISCOM – REPOSE USER MANUAL USAID.GOV
Figure 89. Results in Graphical Form
Once you click Consolidate icon, the drop-down appears as shown in Figure 90.
5. The drop-down has following options
When LDFC is selected, the results of MDFC and Average of both are scaled to match the results of
LDFC. Whereas when MDFC is selected, the values of LDFC and Average of both get scaled to match
with the MDFC results.
In this example, LDFC is selected. Click on Proceed icon to generate the consolidated result.
The Consolidated results page appears.

98 | DISCOM – REPOSE USER MANUAL USAID.GOV
Figure 90. Consolidating Demand Results
Once you click on Proceed icon, the “Consolidated Results” page appears in a few seconds
as shown in Figure 91.
6. By default, the slider will be set on LDFC option.
7. By default, the State results are displayed.
8. Click on the Download PDF Report icon to download the PDF report file of the
consolidated report on LDFC & MDFC.

99 | DISCOM – REPOSE USER MANUAL USAID.GOV
Figure 91. Consolidated LDFC State Results
Figure 92 shows consolidated MDFC state results.
9. Set the slider to MDFC to view medium forecasted results
seasonally or monthly.
Figure 92. Consolidated MDFC State Results
Figure 93 shows consolidated LDFC licensee results.

100 | DISCOM – REPOSE USER MANUAL USAID.GOV
10. If you need to view demand results for each licensee you have to click on Licensee
tab.
Figure 93. Consolidated LDFC Licensee Results
Figure 94 shows consolidated LDFC category results.
11. To view demand results for each category you have to click on Category
tab.
Here you can select any category from the drop-down list and can view the results in detail.

101 | DISCOM – REPOSE USER MANUAL USAID.GOV
Figure 94. Consolidated LDFC Category Results
STEPS TO DOWNLOAD BAU-DFC RESULTS:
This section gives you the steps to download results.
Repeat steps from 1 to 5 from STEPS TO VIEW & EXPORT BAU-DFC RESULTS:.
1. Click on the Download PDF icon to download the PDF report file of the consolidated report
on LDFC & MDFC. PDF report will be downloaded with scenario name. First page of PDF report
for Business as usual scenario is shown in Figure 95.

102 | DISCOM – REPOSE USER MANUAL USAID.GOV
Figure 95. First page of Business as Usual PDF Report
2. Click on Download Text Reports icon. The Scenario Text Reports get downloaded.
3. Click on Download Excel Reports icon.
The Text Reports get downloaded. A snapshot of the report is given:

103 | DISCOM – REPOSE USER MANUAL USAID.GOV
Figure 96. Text Report Output
Note: For carrying out Integrated Resources Mapping – IRM studies by taking demand results from
BAU scenarios as input for IRM you have to download Load Profiles for study years of MDFC
and LDFC seen in consolidated results in Figure 91 and Figure 92.
BAU-Business As Usual is the scenario for performing both Long term (LDFC) and Medium term
(MDFC) demand forecast studies for defined period without including the impacts of inputs given to
drivers like OA, CPP, DER and EV.
Now let us see the same scenario with the impact of drivers configured in the DRIVERS section.
The drivers are seen to have both positive and negative impacts on the demand experienced by the
utility. The drivers CPP, OA, DERs have negative impact as the consumption is routed to CPP, DER
and OA sources thereby reducing the power consumption from the utility while the charging units for
EVs and operation of EVs need more power, it positively impacts the power consumption from the
utility. To study the impact of drivers on our DISCOM load, let us create a new scenario named
“Scenario with Drivers”.

104 | DISCOM – REPOSE USER MANUAL USAID.GOV
CREATE SCENARIO WITH DRIVERS
To create the scenario, follow the same steps shown in CREATE BAU SCENARIO section.
1. Set scenario name as “Scenario with Drivers” as shown in Figure 97.
Figure 97. Creating Scenario with Drivers
2. Once scenario with drivers is created and saved, it will reflect in scenario list page as shown in
Figure 98.
Figure 98. Scenario with Drivers in Scenario List

105 | DISCOM – REPOSE USER MANUAL USAID.GOV
EDIT SCENARIO WITH DRIVERS
As soon as the scenario is created, it gets listed in the list of scenarios on the homepage. However,
the data required for the scenario is yet to be configured. You have to edit the data to execute the
scenario.
User has to select the manage data from drop-down.
The drop-down has following list:
• Licensee projection data
• State data
• T & D loss data
• Open access
• Captive power plant
• Distributed energy resources
• Electric vehicle
➢ User has to follow same steps as shown in EDIT BAU SCENARIO section.
➢ Follow STEPS TO EDIT/CONFIGURE LICENSEE PROJECTION DATA section to
manage licensee data.
➢ Follow STEPS TO EDIT/CONFIGURE STATE DATA: section to manage state data.
➢ Follow STEPS TO EDIT/CONFIGURE T & D LOSS DATA: section to manage T & D loss
data.
Now let us see how to manage Drivers data into the scenario.
STEPS TO EDIT OPEN ACCESS DATA:
1. Click on Manage Demand Forecast Data icon and select Open Access from the drop-
down list as shown in Figure 99.

106 | DISCOM – REPOSE USER MANUAL USAID.GOV
Figure 99. Manage Open Access Data
Once you click Open Access, you will be navigated to the Open Access Data Configuration page
of Scenario with Drivers senario as shown in Figure 100.
2. Open access data configured in CONFIGURING OPEN ACCESS (OA) section will reflect in
the table. Double-click on the rows in the table to edit the Open Acceess energy shares.
3. Graph for the respective Open access energy shares is generated.

107 | DISCOM – REPOSE USER MANUAL USAID.GOV
Figure 100. Edit/Save Open Access Data
4. Click on Save icon to save the open access energy sales data.
STEPS TO EDIT CAPTIVE POWER PLANT DATA:
1. Click on Manage Demand Forecast Data icon and select Captive Power Plant from the
drop-down list as shown in Figure 101.

108 | DISCOM – REPOSE USER MANUAL USAID.GOV
Figure 101. Manage Captive Power Plant Data
Once you click Captive Power Plant, you will be navigated to the Captive Power Plant Data
Configuration page of Scenario with Drivers senario as shown in Figure 102.
2. Captive power plant data configured in CONFIGURING CAPTIVE POWER
PROCUREMENT (CPP) section will reflect in the table. Double-click on the rows to enter
/edit the captive power plant energy shares by double clicking the row.
3. The respective graph for the captive power plant energy shares is generated.
Note: We have considered imaginary CPP data for scenario with drivers due unabilability of CPP
data for Assam state.

109 | DISCOM – REPOSE USER MANUAL USAID.GOV
Figure 102. Edit /Save Captive Power Plant Data
4. Click on Save button to save, Update button to update save the changes made and Back icon
to discard the changes made in captive power plant data respectively
STEPS TO EDIT DISTRIBUTED ENERGY RESOURCES DATA:
1. Click on Manage Demand Forecast Data icon and select Distribued Energy Resources
from the drop-down list as shown in Figure 103.

110 | DISCOM – REPOSE USER MANUAL USAID.GOV
Figure 103. Manage Distributed Energy Resources Data
Once you click on the Distribued Energy Resources, you are navigated to the Distribued
Energy Resources page of Scenario with Drivers senario as shown in Figure 104.
2. Click on DER Specification icon.
3. The installed capacity [PV(IC)] and capacity utilisation factor [PV(CUF)] configured
STEPS TO CONFIGURE DER SPECIFICATION section will reflect in the table. Double-
click on the row ad edit the IC & CUF data. .

111 | DISCOM – REPOSE USER MANUAL USAID.GOV
Figure 104. Edit/Save DER Specification Data
4. Click on Save button to save the DER Specification data, Update button to update the changes
and Back icon to discard the changes made in DER Specification data.
5. Click on Generation Profile icon, the generation profile page appears as shown in Figure
105.
6. Hourly PV profile will be tabulated in the table.
(Since we have not configured Generation profile data in STEPS TO CONFIGURE
GENERATION PROFILE section here it is diplaying as ‘0’)

112 | DISCOM – REPOSE USER MANUAL USAID.GOV
Figure 105. Edit/Save Generation Profile Data
7. Click on Save button to save the generation profile data, Update button to update the changes
and Back icon to discard the changes made in generation profile data.
STEPS TO EDIT ELECTRIC VEHICLE DATA:
1. Click on Manage Demand Forecast Data icon and select Electric Vehicle from the drop-
down list as shown in Figure 106.

113 | DISCOM – REPOSE USER MANUAL USAID.GOV
Figure 106. Manage Electric Vehicle Data
Once you click Electric Vehicle, you are navigated to the Electric Vehicle page of Scenario with
Drivers senario as shown in Figure 107.
2. Click on the Electric Vehicle Specifications icon.
3. Table will be displayed in which data configured in STEPS TO CONFIGURE ELECTRIC
VEHICLE SPECIFICATIONS section for EV Category. You could make changes in the data
if required or leave the data that is already configured.

114 | DISCOM – REPOSE USER MANUAL USAID.GOV
Figure 107. Edit/Save Eectric Vehicle Specifications
4. Click on the Save button to save the Electric Vehicle Specifications data.
5. Click on Count icon.
6. Table will be displayed in which data configured in STEPS TO CONFIGURE EV COUNT
section for EV Count. Year on year, an increase in the adoption of EVs is expected to rise and
change. The changes could be entered using this table.

115 | DISCOM – REPOSE USER MANUAL USAID.GOV
Figure 108. Edit/Save Electric Vehicle Count
7. Click on Save button to save the Electric Vehicle Count data.
8. Click on Charging Profile icon.
9. Table will be displayed in which data configured in STEPS TO CONFIGURE EV CHARGING
PROFILE section for EV Charging Profile. Make the necessary changes to the values in this
table if any is required.

116 | DISCOM – REPOSE USER MANUAL USAID.GOV
Figure 109. Edit/Save Electric Vehicle Charging Profile
10. Click on Save button to save the EV chargingprofile data, Update button to update the changes
and Back icon to discard the changes made in EV charging profile data.
11. After saving all the parameters such as Licensee, State, T & D Loss, Open Access, Captive Power
Plant, Distributed Energy Resources and Electric Vehicle data into the Scenario with Drivers you
will see the page as shown in Figure 110.

117 | DISCOM – REPOSE USER MANUAL USAID.GOV
Figure 110. Finalized Scenario with Drivers
EXECUTE SCENARIO WITH DRIVERS
Once the scenario is built and finalized, you can execute the demand forecast (LDFC & MDFC) to
study the impact (positive and negative) of drivers on the demand forecasted
For execution of ‘Scenario with Drivers’ follow the same steps described in EXECUTE BAU
SCENARIO section.
DOWNLOAD/EXPORT/VIEW SCENARIO RESULTS
To view/export results and download reports, PDF’s, text files you can follow same steps described
in DOWNLOAD/EXPORT/VIEW BAU SCENARIO RESULTS section.
2.1.5 Probabilistic Analysis & Report
This section gives you the steps to compute the results using the probabilistic approach to address the
degree of variations expected in the values of the independent variables that participate in the demand
forecast.
The historic data are used and various methods are used on the samples to predict the forecast values.
Now, there is a level of uncertainty expected while considering the projected data of the independent
variables which impact the categories and the expected demand for any time horizon.
STUDYING VARIATIONS IN DEMAND FORECAST
To eradicate the uncertainty, the probabilistic approach allows variations in the values of the
independent variables that participate in the demand forecast. This module provides the features to
compute the variables with variations that might be seen in these values. Again, the percentage of
variations is observed from a probabilistic view which may or may not resonate with the actuals in the
future.
SELECTING DATASET FOR PROBABILITY ANALYSIS

118 | DISCOM – REPOSE USER MANUAL USAID.GOV
This section gives information on how to select the data to perform the probabilistic analysis to study
the variations that independent variables could bring in.
We have created two study scenarios i.e. Business As Usual and Scenario with Drivers.
Let us see steps to execute probabilistic analysis for Business As Usual scenario (same steps holds
good for Scenario with Drivers.)
1. Click on the View Results icon on the Scenarios list table. We have shown for Business as
Usual scenario in Figure 111.
Figure 111. First Step to Run Probabilistic Analysis
Once you click on the View Results icon, the demand forecast results page appears as shown
in Figure 112.
2. Select the categories and method from the list to participate in the studies.
3. Click on Consolidate icon.

119 | DISCOM – REPOSE USER MANUAL USAID.GOV
Figure 112. Selecting the Categories to Participate in Forecast Studies and Consolidate
Once you click on the Consolidate icon, the scaling the results page will appear as shown in
Figure 113.
4. Select suitable Scaled up reference method from the drop-down.
When LDFC is selected, the results of MDFC and Average of both are scaled to match the results of
LDFC. Whereas when MDFC is selected, the values of LDFC and Average of both get scaled to match
with the MDFC results.

120 | DISCOM – REPOSE USER MANUAL USAID.GOV
Figure 113. Scaling of the Results
In this example, LDFC is selected. Click on Proceed icon to generate the consolidated result.
The Consolidated results page appears as shown in Figure 114.
5. Click on Probabilistic analysis icon.
Figure 114. Consolidated Results Page

121 | DISCOM – REPOSE USER MANUAL USAID.GOV
Once you click Probabilistic analysis icon page will navigate to Business As Usual scenario
Probabilistic analysis page as shown in Figure 115.
6. Select the reference year from the drop-down for which analysis to be done.
7. Fill the Standard Deviation (%) values for respective independent variables.
8. Required No. Of Samples to be entered.
Figure 115. Probabilistic Analysis Page
9. Click on the CALCULATE icon.
10. The respective graph appears on the page as shown in Figure 116.

122 | DISCOM – REPOSE USER MANUAL USAID.GOV
Figure 116. Graphical Representation of Probabilistic Analysis
11. Move the Graph or Table data slider to Table. The same data appears as table.
12. Table contains the values like Maximum Deviation, Mean and Minimum Deviation.
Figure 117. Tabular Representation of Probabilistic Analysis

123 | DISCOM – REPOSE USER MANUAL USAID.GOV
13. Click on SAVE button to save the data and Back icon to discard.
DOWNLOAD/ VIEW PROBABILISTIC RESULTS
After executing and saving the probabilistic analysis results it will be saved in respective scenario, let
us see how to download it.
Steps to download:
14. Go to consolidated results page, click on Download PDF icon. PDF report will be downloaded
and user will observe the probabilistic analysis curve for independent variables as shown in Figure
119 in Probabilistic analysis section in PDF report.
Figure 118. Downloading PDF Report

124 | DISCOM – REPOSE USER MANUAL USAID.GOV

125 | DISCOM – REPOSE USER MANUAL USAID.GOV
Figure 119. Probabilistic Curve Reflected in PDF Report
Probabilistic analysis is part which is printed last section of DFC PDF reports i.e. in Business as Usual
and Scenario with Drivers.
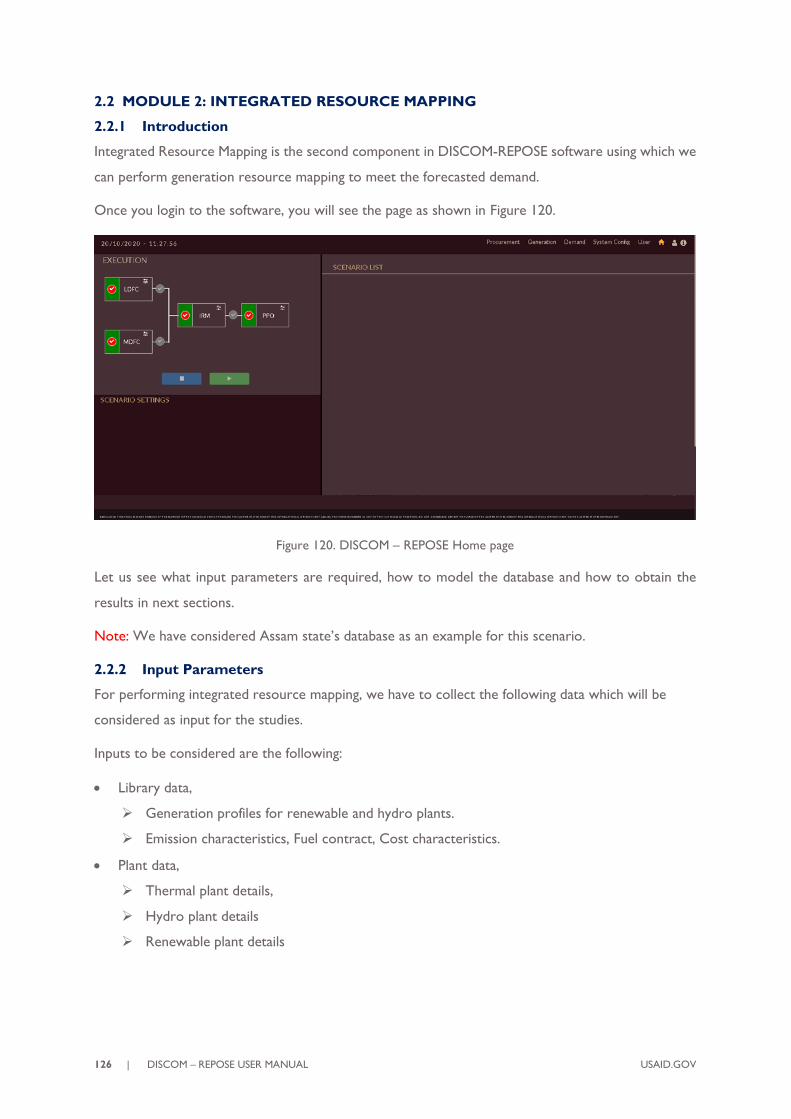
126 | DISCOM – REPOSE USER MANUAL USAID.GOV
2.2 MODULE 2: INTEGRATED RESOURCE MAPPING
2.2.1 Introduction
Integrated Resource Mapping is the second component in DISCOM-REPOSE software using which we
can perform generation resource mapping to meet the forecasted demand.
Once you login to the software, you will see the page as shown in Figure 120.
Figure 120. DISCOM – REPOSE Home page
Let us see what input parameters are required, how to model the database and how to obtain the
results in next sections.
Note: We have considered Assam state’s database as an example for this scenario.
2.2.2 Input Parameters
For performing integrated resource mapping, we have to collect the following data which will be
considered as input for the studies.
Inputs to be considered are the following:
• Library data,
➢ Generation profiles for renewable and hydro plants.
➢ Emission characteristics, Fuel contract, Cost characteristics.
• Plant data,
➢ Thermal plant details,
➢ Hydro plant details
➢ Renewable plant details

127 | DISCOM – REPOSE USER MANUAL USAID.GOV
Figure 121. Generation Page
The sequence to be followed to feed input data for IRM studies is given as follows
1. Configure the Cost characteristics data under Library tab.
2. Configure the Fuel contract data under Library tab.
3. Add the Emission characteristics data under Library tab.
4. Add and configure the plant details under Plant tab. i.e. Renewable, Hydro & Thermal plant details
5. Add the Hydro generation profiles under Library tab
6. Add the RE generation profiles under Library tab.
Let us consider the sample library input data of Assam shown in Table 6 and Table 7 and learn
how to upload and execute the integrated resource mapping scenario
Table 6. Sample Cost Characteristics Data
PLANT/UNIT COST
LTPS
Fixed & Variable
Fixed cost (INR/MWh) Variable cost
(INR/MWh)
1980 3340
KLHEP
Cost Coordinates
Generation (MW) Cost (INR)
2.5 7550
50 151000

128 | DISCOM – REPOSE USER MANUAL USAID.GOV
Table 7. Sample Fuel Contract Data
PLANT/UNIT START
DATE END DATE
FUEL
QUANTITY
(TONNES)
LTPS_5_6
01/04/2020 31/03/2021 43800.000
01/04/2021 31/03/2022 43800.000
01/04/2022 31/03/2023 43800.000
BGTPP
01/04/2020 31/03/2021 2523456.408
01/04/2021 31/03/2022 2523456.408
01/04/2022 31/03/2023 2523456.408
This section helps you to configure cost characteristics for available power generation plants and units.
Follow below steps to configure cost characteristics library,
1. Click on Generation tab. The Generation tab appears as shown in Figure 122.
2. By default, Library tab will be selected.
3. Click on Cost Characteristics tab.
4. Click on Add Cost Characteristics Library icon to add new cost library for power
plant/unit.

129 | DISCOM – REPOSE USER MANUAL USAID.GOV
Figure 122. Steps to Add Cost Characteristics Library
Once you click on Add Cost Characteristics Library icon, an empty record appears as shown
in Figure 123.
5. Enter appropriate cost library name in Name field.
6. Select cost characteristics Type from the “Type “drop-down based on data of cost available for
the plant/unit.

130 | DISCOM – REPOSE USER MANUAL USAID.GOV
Figure 123. Cost Characteristics Empty Record
Figure 124 shows the sample data of cost entered for LTPS plant by selecting Fixed & Variable Cost
type (Refer Table 6 for sample cost data).
Figure 124. Sample Cost Library
7. Click on the ADD button. The “Are you sure?” confirmation pop-up appears.

131 | DISCOM – REPOSE USER MANUAL USAID.GOV
Click on OK. The “Inserted successfully” message appears.
Click on CANCEL to discard the task.
8. The list of successfully added cost library appears on left of the page.
9. You can change the cost data if required, click on Update button to save the changes
made.
The “Are you sure?” confirmation message appears.
Click on OK to confirm the changes. Click on CANCEL to discard the changes. The “Saved
successfully” message appears.
10. Click on Delete icon to remove the record. The “Are you sure?” confirmation pop-up
appears.
Click on OK. The “Cost Library details deleted successfully” message appears. Click on CANCEL
to discard the task.

132 | DISCOM – REPOSE USER MANUAL USAID.GOV
Figure 125. Updated Cost Library
Repeat the above steps to add different cost characteristics libraries for different plants/units. Figure
126 shows the sample cost library data for different Cost Characteristics type and list of various
cost libraries created.
Figure 126. Sample Cost Library for Different Cost Type
This section helps you to configure fuel contract for available power generation plants and units.

133 | DISCOM – REPOSE USER MANUAL USAID.GOV
Follow the steps to configure fuel contract library:
1. Click on Generation tab. The Generation tab appears as shown in Figure 127
2. By default, the Library tab will be selected.
3. Click on Fuel Contract tab.
4. Click on Add Fuel Contract Library icon to add new fuel library for power plant/unit.
Figure 127. Steps to Add Fuel Contract Library
Once you click on Add Fuel Contract Library icon, an empty record appears as shown in
Figure 128.
5. Enter an appropriate fuel library name in Name field.
6. Click on Add icon for adding rows to add fuel contract data for respective plant/unit.
7. Click on Copy icon to copy previously added fuel contract library data to newly adding fuel
contract library if data is same.

134 | DISCOM – REPOSE USER MANUAL USAID.GOV
Figure 128. Fuel Contract Empty Record
8. Select the fuel contract period by selecting the Contract Start date and Contract End date
from the calendar drop-down.
9. Enter the Fuel Quantity available in Tonnes.
Figure 129. Addition of Multiple Rows

135 | DISCOM – REPOSE USER MANUAL USAID.GOV
Figure 130 shows the sample data of fuel contract entered for LTPS_5_6 unit for certain period (Refer
Table 7 for sample cost data).
Figure 130. Sample Fuel Library
10. Click on the ADD button. The “Are you sure?” confirmation pop-up appears.
Click on OK. The “Inserted successfully” message appears.
Click on CANCEL to discard the task.
11. The list of successfully added fuel contract library appears on left of the software page.
12. You can change the fuel data and also you can delete selected row by clicking on Delete
icon of respective row.
13. Click on Update button to save the changes made.
14. Click on Delete icon to remove the record. The “Are you sure?” confirmation pop-up
appears.

136 | DISCOM – REPOSE USER MANUAL USAID.GOV
Click on OK. The “Fuel Contract Library details deleted successfully” message appears.
Click on CANCEL to discard the task.
Figure 131. Updated Fuel Library
This section helps you to configure emission characteristics for available power generation plants and
units.
Follow below steps to configure emission characteristics library,
1. Click on Generation tab. The Generation tab appears as shown in Figure 132.
2. By default, Library tab will be selected.
3. Click on Emission Characteristics tab.
4. Click on Add Emission Library icon to add new emission library for power plant/unit.

137 | DISCOM – REPOSE USER MANUAL USAID.GOV
Figure 132. Steps to Add Emission Characteristics Library
Once you click on Add Emission Library icon, an empty record appears as shown in Figure
133.
5. Enter the appropriate emission library name in Name field.
6. Click on Add icon for adding rows to add emission library data for respective plant/unit.
7. Click on Copy icon to copy previously added emission characteristics library data to newly
adding emission characteristics library if data is same.

138 | DISCOM – REPOSE USER MANUAL USAID.GOV
Figure 133. Emission Library Empty Record
Figure 134 shows the sample data of emission characteristics entered for LTPS plant for certain
generation.
8. Enter Emission in mg/N𝐦𝟑 details data available for plants/units.
Figure 134. Sample Emission Library

139 | DISCOM – REPOSE USER MANUAL USAID.GOV
Note: Emission data entered in Figure 134 are assumed and not the actual data. Actual values may
vary.
9. Click on the ADD button. The “Are you sure?” confirmation pop-up appears.
Click on OK. The “Inserted successfully” message appears.
Click on CANCEL to discard the task.
10. The list of successfully added emission characteristics library appears on left of the software page.
11. You can change the emission data and also you can delete selected row if not required by clicking
on Delete of respective row.
12. Click on Update icon to save the changes made.
13. Click on Delete icon to remove the record. The “Are you sure?” confirmation pop-up
appears.
Click on OK. The “Emission Library details deleted successfully” message appears.
Click on CANCEL to discard the task.

140 | DISCOM – REPOSE USER MANUAL USAID.GOV
Figure 135. Updated Emission Library
RE – Renewable plants are the plants which generate electricity from Solar, Wind, Biomass, Small
hydro etc.
This section helps you to add available RE Plants in State required for carrying out Integrated Resource
Mapping – IRM studies.
STEPS TO ADD RE PLANTS:

141 | DISCOM – REPOSE USER MANUAL USAID.GOV
1. Click on Generation tab. The Generation tab appears.
2. Click on Plant tab. The Plant tab appears as shown in Figure 136
3. By default, RE Plant tab will be selected.
4. Click on Add RE Plant icon for configuring new RE Plant into the software.
Figure 136. Steps to Add RE Plant
Once you click on Add RE Plant, a blank record appears for adding plant information as
shown in Figure 137
5. Fill the correct plant information available for respective State/Region. Plant information like;
1. Enter plant name in Name field.
2. Enter suitable plant code in Code field.
3. Select Plant Type from the drop-down i.e. PV, Wind, Small Hydro, Bio mass or Other.
4. Select Type for which category the RE plant belongs to from the drop-down i.e. State, IPP or
CGS.
5. Enter Installed Capacity of the plant in MW.
6. Enter Maximum Generation of the plant in MW.
7. Enter Uncertainty of RE plant in percentage (%).

142 | DISCOM – REPOSE USER MANUAL USAID.GOV
8. Enter Feed In Tarrif in INR/MWh.
9. Choose Date Of Commissioning and Date Of Retirement of the plant.
[Note: * marked field are mandatory to fill.]
6. The Ownership Status of RE plant can be set as State Owned/Contract by using
toggle icon. RE plant can be made as must run plant or not if required by setting
Off/On toggle icon.
[Note: When Ownership is set as contract the feed in tariff field will be disabled as it will not
participate for contracted RE plant.]
7. RE plant can be made in-service or out-of-service if required by setting Out Of Service/In
Service toggle icon.
8. Click on Copy From icon to copy plant information from previously added RE plant if data is
same.
Figure 137. Blank Record for Adding RE Plant

143 | DISCOM – REPOSE USER MANUAL USAID.GOV
9. Figure 138 shows the sample RE plant data entered for NVVN Solar plant of Assam state.
Figure 138. Sample RE Plant Data
10. After entering the plant information, click on Add button. The “Are you sure?” confirmation pop-
up appears.
Click on OK. The “Inserted successfully” message appears.
Click on CANCEL to discard the task.
11. Configured RE plant list will appear on left of the page as shown in Figure 139.
12. You can select the configured plant, and can make changes if required. Click on Update
button to save the changes made.
13. Click on Delete icon to remove the record. The “Are you sure?” confirmation pop-up appears.
Click on OK. The “Deleted successfully” message appears.

144 | DISCOM – REPOSE USER MANUAL USAID.GOV
Click on CANCEL to discard the task.
Figure 139. Updated RE Plant
Repeat above steps to add and update new RE plants into the software.

145 | DISCOM – REPOSE USER MANUAL USAID.GOV
14. Once all the RE plants are added and configured the final RE page will appear as shown in Figure
140. List of all the RE plants will appear on left of the applicication page.
Figure 140. List of Configured RE Plants

146 | DISCOM – REPOSE USER MANUAL USAID.GOV
STEPS TO IMPORT HISTORICAL GENEATION PROFILE FOR RE PLANTS:
1. Select the plant from the configured list for which you need to upload generation profile. Here
NVVN solar plant is selected.
2. Click on Upload Historical Generation Profile icon.
Figure 141. Steps to Add Historical RE Historical Generation Profile
Once you click on Upload Historical Generation Profile icon for selected RE plant page will
appear as shown in Figure 142.

147 | DISCOM – REPOSE USER MANUAL USAID.GOV
3. Click on Download Template icon.
Figure 142. Download RE generation profile template
4. Software will ask to choose From & To date. Choose dates from calender drop-down, and click
on Download icon to download the template.
Figure 143. Select RE Generation Profile Date

148 | DISCOM – REPOSE USER MANUAL USAID.GOV
Template will be downloaded in .xlsx format with selected plant name (here NVVN Solar) for chosen
dates as shown in Figure 144. Upload the historical generation profile available for respective plant and
save the file in .xlsx format only.
Figure 144. Downloaded RE Generation Profile Template
After file is saved, you have to upload it in software.
5. Click on Select Files To Upload icon, select the saved template.
6. Once you select the template, File Name will be displayed along with File Size.
7. Click on Import button to upload the profile into the software.
Figure 145. Steps to Import RE Generation Profile
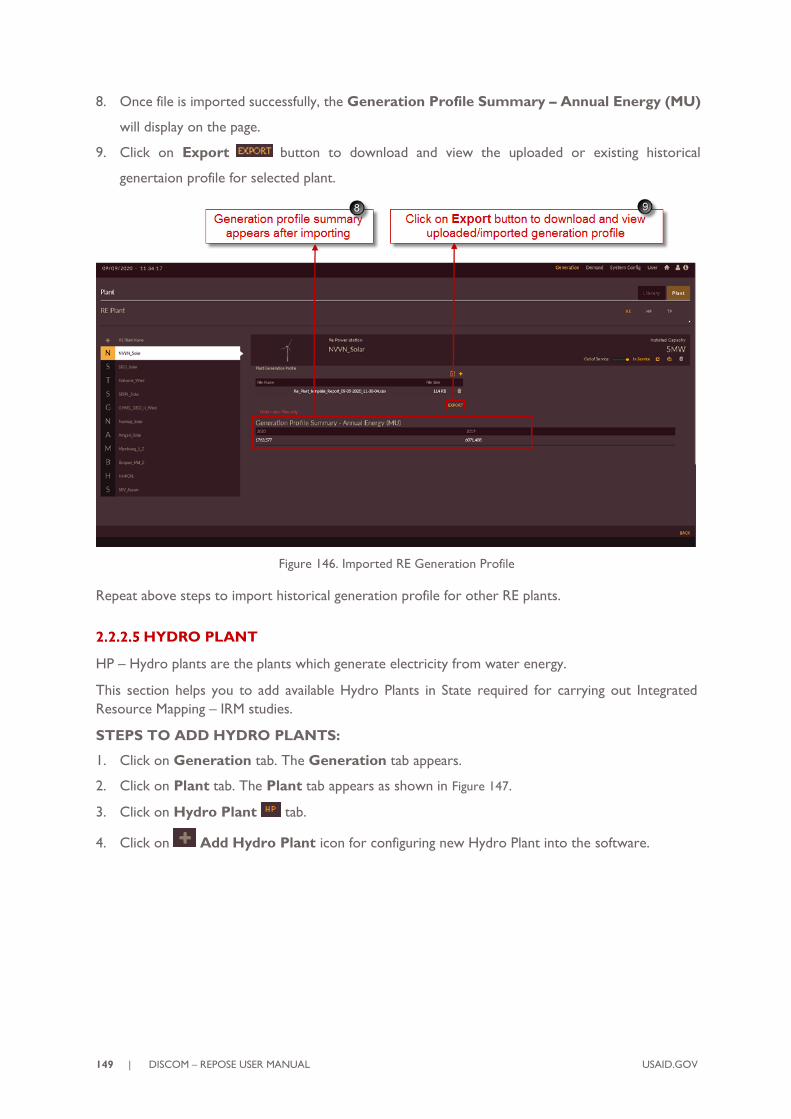
149 | DISCOM – REPOSE USER MANUAL USAID.GOV
8. Once file is imported successfully, the Generation Profile Summary – Annual Energy (MU)
will display on the page.
9. Click on Export button to download and view the uploaded or existing historical
genertaion profile for selected plant.
Figure 146. Imported RE Generation Profile
Repeat above steps to import historical generation profile for other RE plants.
HP – Hydro plants are the plants which generate electricity from water energy.
This section helps you to add available Hydro Plants in State required for carrying out Integrated
Resource Mapping – IRM studies.
STEPS TO ADD HYDRO PLANTS:
1. Click on Generation tab. The Generation tab appears.
2. Click on Plant tab. The Plant tab appears as shown in Figure 147.
3. Click on Hydro Plant tab.
4. Click on Add Hydro Plant icon for configuring new Hydro Plant into the software.

150 | DISCOM – REPOSE USER MANUAL USAID.GOV
Figure 147. Steps to Add Hydro Plant
Once you click on Add Hydro Plant, a blank record appears for adding plant information as
shown in Figure 148.
5. Fill the correct Plant Information available for respective State/Region. Plant information like;
• Enter plant name in Name field.
• Enter suitable plant code in Code field.
• Select Hydroelectric System Type from the drop-down i.e. Run Of River or Reservoir
Based.
• Select Type for which category the Hydro plant belongs to from the drop-down i.e. State, IPP
or CGS.
• Select Crew Constraint from drop-down if available.
6. Fill the correct Unit Information available for respective added plant. Unit information to be
entered like;
• Unit name in Unit Name field.
• Unit code in Unit Code field.

151 | DISCOM – REPOSE USER MANUAL USAID.GOV
• Initial Generation of the unit in MW.
• Minimum Generation and Maximum Generation of the unit in MW.
• Auxiliary Consumption and Annual Unavailability (Forced Outage Rate) in
percentage (%).
• Select suitable Generation Cost Library configured in “COST CHARACTERISTICS”
section from the drop-down for respective unit.
• Reserve Allocation in % and Reserve Cost in INR/MWh details.
• Ramp Up Rate and Ramp Down Rate in MW/Min.
• Minimum Up time and Minimum Down Time in Hours (Hrs).
• Start Up Cost in INR, Startup Time in Hours (Hrs) and Start Ups/Week details.
• Choose Date Of Commissioning and Date Of Retirement of the unit.
• Unit can be made as must run unit or not if required by setting Off/On toggle icon.
• Unit can be made in-service or out-of-service if required by setting Out Of Service/In
Service toggle icon.
• Unit’s Ownership status can be chosen as State Owned/Contract using
Ownership Status toggle.
[Note: When Ownership is set as contract the fields like generation cost library, must run
status, Start Up Cost, Startup Time and Start Ups/Week will be disabled as they do not
participate for contracted hydro units.]
• If there is any maintenance for the unit, dates of maintenance can be scheduled in
Maintenance Schedule option.
• By clicking on Add Unit icon we can add multiple units in for one hydro plant.
[Note: * marked field are mandatory to fill.]

152 | DISCOM – REPOSE USER MANUAL USAID.GOV
7. Hydro plant can be made in-service or out-of-service if required by setting Out Of Service/In
Service toggle icon.
8. Click on Copy From icon to copy plant information from previously added Hydro plant if data
is same.
Figure 148. Blank Record for Adding Hydro Plant

153 | DISCOM – REPOSE USER MANUAL USAID.GOV
9. Figure 149 shows the sample Hydro plant data entered for KLHEP HYDRO plant of Assam state.
Figure 149. Sample Hydro Plant Data
10. After entering the plant information, click on Add button. The “Are you sure?” confirmation pop-
up appears.
Click on OK. The “Inserted successfully” message appears.
Click on CANCEL to discard the task.

154 | DISCOM – REPOSE USER MANUAL USAID.GOV
11. Configured Hydro plant list will appear on left of the page as shown in Figure 150.
12. You can select the configured plant, and can make changes if required. Click on Update
button to save the changes made.
13. Click on Delete icon to remove the entire plant or particular unit record. The “Are you
sure?” confirmation pop-up appears.
Click on OK. The “Deleted successfully” message appears.
Click on CANCEL to discard the task.
Figure 150. Updated Hydro Plant
Repeat above steps to add and update new Hydro plants into the software.

155 | DISCOM – REPOSE USER MANUAL USAID.GOV
14. Once all the Hydro plants are added and configured the final Hydro plant - HP page will appear as
shown in Figure 151. List of all the Hydro plants will appear on left of the applicication page.
Figure 151. List of Configured Hydro Plants
STEPS TO IMPORT HISTORICAL GENEATION PROFILE FOR HYDRO PLANTS:

156 | DISCOM – REPOSE USER MANUAL USAID.GOV
1. Select the plant from the configured list for which you need to upload generation profile. Here
KLHEP hydro plant is selected.
2. Click on Upload Historical Generation Profile icon.
Figure 152. Steps to Add Historical Hydro Generation Profile
Once you click on Upload Historical Generation Profile icon for selected Hydro plant page
will appear as shown in Figure 153.
3. Click on Download Template icon.

157 | DISCOM – REPOSE USER MANUAL USAID.GOV
Figure 153. Download Hydro Generation Profile Template
4. Select the From & To date. Choose dates from calender drop-down, and click on Download
icon to download the template.
Figure 154. Select Hydro Generation Profile Date
The Template gets downloaded in .xlsx format with selected plant name (here KLHEP Hydro) for
chosen dates as shown in Figure 155.
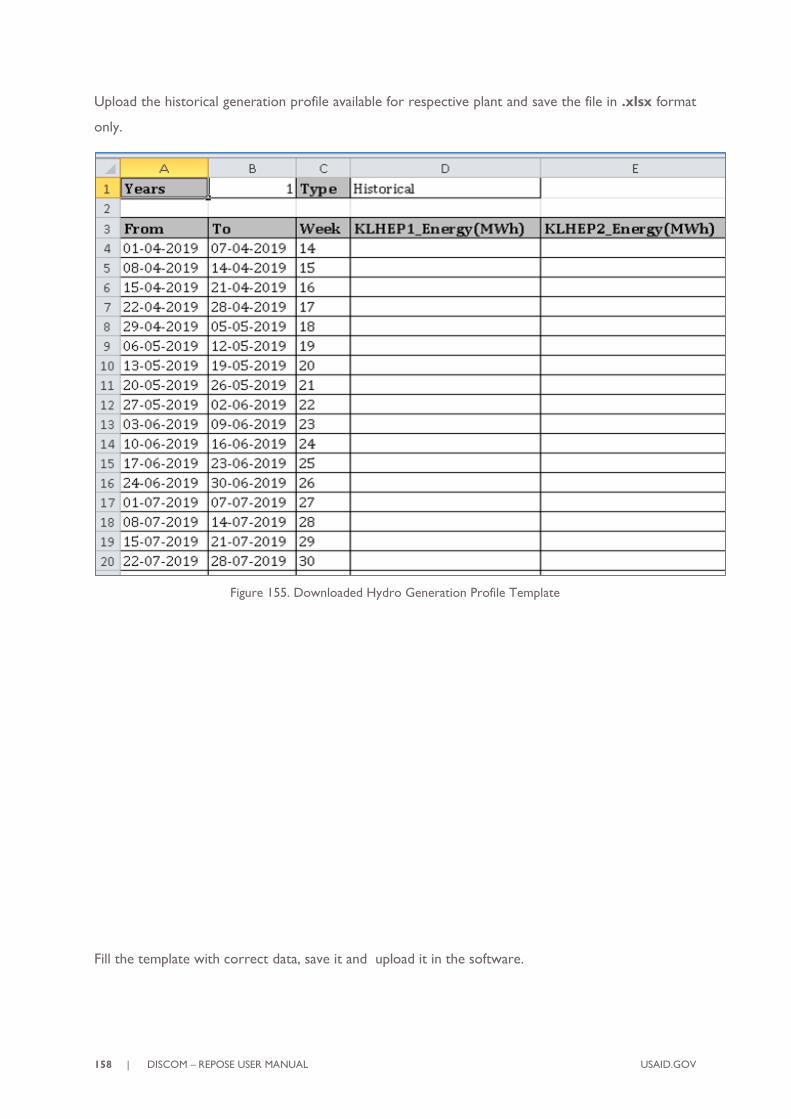
158 | DISCOM – REPOSE USER MANUAL USAID.GOV
Upload the historical generation profile available for respective plant and save the file in .xlsx format
only.
Figure 155. Downloaded Hydro Generation Profile Template
Fill the template with correct data, save it and upload it in the software.

159 | DISCOM – REPOSE USER MANUAL USAID.GOV
Figure 156. Filled in Hydro Plant Template
5. Click on Select Files To Upload icon, select the saved template.
6. Once you select the template, File Name will be displayed along with File Size.
7. Click on Import button to upload the profile into the software.
Figure 157. Steps to Import Hydro Generation Profile

160 | DISCOM – REPOSE USER MANUAL USAID.GOV
8. Once file is imported successfully, the Generation Profile Summary – Annual Energy (MU)
will display on the page.
9. Click on Export button to download and view the uploaded or existing historical
genertaion profile for selected plant.
Figure 158. Imported Hydro Generation Profile
Repeat above steps to import historical generation profile for other Hydro plants.
TP – Thermal plants are the plants which generate electricity from Coal, Diesel, Nuclear, Gas, LPG
etc.
This section helps you to add available Thermal Plants in State required for carrying out Integrated
Resource Mapping – IRM studies.
STEPS TO ADD THERMAL PLANTS:
1. Click on Generation tab. The Generation tab appears.
2. Click on Plant tab. The Plant tab appears as shown in Figure 159.
3. Click on Thermal Plant tab.
4. Click on Add Thermal Plant icon for configuring new Thermal Plant into the software.

161 | DISCOM – REPOSE USER MANUAL USAID.GOV
Figure 159. Steps to Add Thermal Plant
Once you click on Add Thermal Plant, a blank record appears for adding plant information
as shown in Figure 160.
5. Fill the correct Plant Information available for respective State/Region. Plant information like;
• Enter plant name in Name field.
• Enter suitable plant code in Code field.
• Select Fuel Type from the drop-down i.e. Coal, Diesel, Nuclear, Gas or LPG.
• Select Type for which category the Thermal plant belongs to from the drop-down i.e. State,
IPP or CGS.
• You can set Emission toggle Off/On based on availability.
• Select Crew Constraint from drop-down if available.
6. Fill the correct Unit Information available for respective added plant. Unit information to be
entered like;
• Unit name in Unit Name field.
• Unit code in Unit Code field.

162 | DISCOM – REPOSE USER MANUAL USAID.GOV
• Select Fuel Type from drop-down.
• Initial Generation of the unit in MW.
• Minimum Generation and Maximum Generation of the unit in MW.
• Auxiliary Consumption and Annual Unavailability (Forced Outage Rate) in
percentage (%).
• Select suitable Fuel Contract Library configured in “FUEL CONTRACT” section from
the drop-down for respective unit if available.
• Select suitable Emission Library configured in “EMISSION CHARACTERISTICS” section
from the drop-down for respective unit if available.
• Select suitable Generation Cost Library configured in “COST CHARACTERISTICS”
section from the drop-down for respective unit.
• Reserve Allocation in % and Reserve Cost in INR/MWh details.
• Ramp Up Rate and Ramp Down Rate in MW/Min.
• Minimum Up time and Minimum Down Time in Hours (Hrs).
• Hot Start Up Cost, Warm Start Up Cost, Cold Start Up Cost in INR.
• Start Ups/Week details.
• Fuel Consumption details of unit in Tons/MW.
• Time to Warm Start and Time to Cold Start in Hours (Hrs).
• Choose Date Of Commissioning and Date Of Retirement of the unit.
• Unit can be made as must run unit or not if required by setting Off/On toggle icon.
• Unit can be made in-service or out-of-service if required by setting Out Of Service/In
Service toggle icon.
• Unit’s Ownership status can be chosen as State Owned/Contract using
Ownership Status toggle.
[Note: When Ownership is set as contract the fields like generation cost library, emission
library, must run status, fuel status, fuel contract library, fuel consumption, time to warm

163 | DISCOM – REPOSE USER MANUAL USAID.GOV
start, time to cold start, hot startup cost, warm startup cost, cold startup cost and
startups/week will be disabled as they do not participate for contracted thermal units.]
• Set Fuel Status toggle to Off/On based on data availability.
• If there is any maintenance for the unit, dates of maintenance can be scheduled in
Maintenance Schedule option.
• By clicking on Add Unit icon we can add multiple units in for one thermal plant.
Note: Fields marked with * are mandatory to fill.
7. Thermal plant can be made in-service or out-of-service if required by setting Out Of Service/In
Service toggle icon.
8. Click on Copy From icon to copy plant information from previously added Thermal plant if
data is same.
Figure 160. Blank Record for Adding Thermal Plant

164 | DISCOM – REPOSE USER MANUAL USAID.GOV
9. Figure 161 shows the sample Thermal plant data entered for LAKWA_TPS THERMAL plant
of Assam state.
Figure 161. Sample Thermal Plant Data
10. After entering the plant information, click on Add button. The “Are you sure?” confirmation pop-
up appears.
Click on OK. The “Inserted successfully” message appears.
Click on CANCEL to discard the task.

165 | DISCOM – REPOSE USER MANUAL USAID.GOV
11. Configured Thermal plant list will appear on left of the page as shown in Figure 162.
12. You can select the configured plant, and can make changes if required.
Click on Update button to save the changes made.
13. Click on Delete icon to remove the entire plant or particular unit record. The “Are you sure?”
confirmation pop-up appears.
Click on OK. The “Deleted successfully” message appears.
Click on CANCEL to discard the task.
Figure 162. Updated Thermal Plant
Repeat above steps to add and update new Thermal plants into the software.

166 | DISCOM – REPOSE USER MANUAL USAID.GOV
14. Once all the Thermal plants are added and configured the final Thermal plant - TP page will appear
as shown in Figure 163. List of all the Thermal plants will appear on left of the applicication page.
Figure 163. List of Configured Thermal Plants
Once all available hydro power plants are configured into the software for IRM studies, we need
reference generation profile for the plant energy dispatch.
You may get the generation profile for hydro plants from SLDC data of respective state.
You can consider previous year’s generation/dispatch pattern as reference generation profile.
Weekly hydro generation profile is required for IRM – Studies in DISCOM – REPOSE software.
Once you gather generation profiles for all hydro plants, we need to configure them into the
software.
This section helps us to configure/upload hydro generation profile.
STEPS TO CREATE HYDRO GENERATION PORTFOLIO:

167 | DISCOM – REPOSE USER MANUAL USAID.GOV
1. Click on Generation tab. The Generation tab appears as shown in Figure 164
2. By default, Library tab will be selected.
3. Click on Hydro Generation Portfolio tab.
4. Click on Add Hydro Portfolio icon to add new hydro generation portfolio.
Figure 164. Adding Hydro Generation Portfolio
Once you click on Add Hydro Portfolio icon, you will see the blank record appeared on page
as shown in Figure 165.
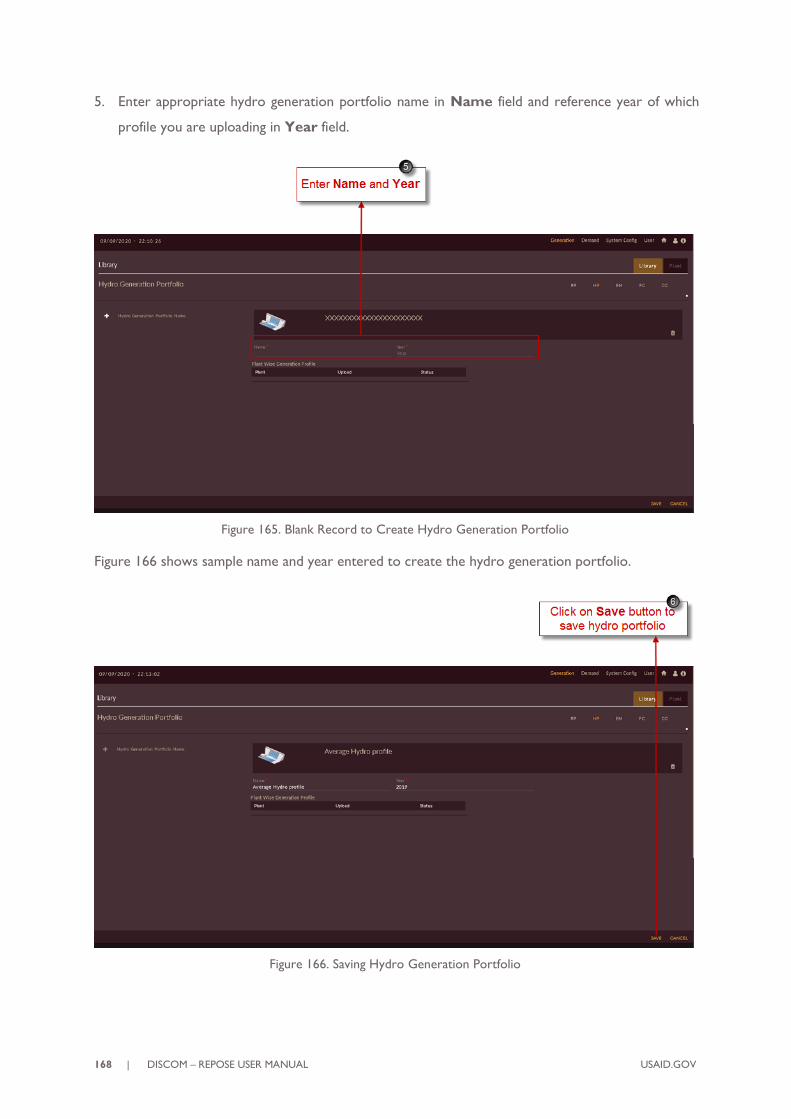
168 | DISCOM – REPOSE USER MANUAL USAID.GOV
5. Enter appropriate hydro generation portfolio name in Name field and reference year of which
profile you are uploading in Year field.
Figure 165. Blank Record to Create Hydro Generation Portfolio
Figure 166 shows sample name and year entered to create the hydro generation portfolio.
Figure 166. Saving Hydro Generation Portfolio

169 | DISCOM – REPOSE USER MANUAL USAID.GOV
6. Click on the SAVE button. The “Are you sure?” confirmation pop-up appears.
Click on OK. The “Inserted successfully” message appears.
Click on CANCEL to discard the task.
STEPS TO UPLOAD HYDRO GENERATION PROFILE:
Successfully added/configured hydro generation portfolio reflects on left of the page as shown in Figure
167.
7. Select configured hydro portfolio.
8. Hydro plants added in HYDRO PLANT section appears as list showing Pending
indication as hydro generation profile is not uploaded.
9. To upload hydro generation profile, click on Upload Plant Wise Generation Profile icon
for which plant you need to upload. Here KLHEP plant is shown.
Figure 167. Configured Hydro Generation Portfolio
Once you click on Upload Plant Wise Generation Profile icon for selected Hydro plant page
will appear as shown in Figure 168.

170 | DISCOM – REPOSE USER MANUAL USAID.GOV
10. Click on Download Template icon.
11. Template gets downloaded in .xlsx format amnd appears in taskbar of your browser.
Figure 168. Downloading Hydro Generation Profile Template
Template will be downloaded for weekly in .xlsx format with selected plant name unit wise (here
KLHEP Hydro) as shown in Figure 169.
Upload the generation profile available for respective plant and save the file in .xlsx format only.

171 | DISCOM – REPOSE USER MANUAL USAID.GOV
Figure 169. Downloaded Hydro Generation Profile Template
After file is saved,with actual data you have to upload it in software.
12. Click on Select Files To Upload icon, select the saved template.
13. Once you select the template, File Name will be displayed along with File Size.
14. Click on Import button to upload the completed profile into the software.
Note: The same filled in template can be exported for future reference as shown inFigure 172.
Exported Hydro Generation Profile.

172 | DISCOM – REPOSE USER MANUAL USAID.GOV
Figure 170. Steps to Import Hydro Generation Profile
15. Once the hydro generation file is imported successfully, the unit wise Generation Profile
Summary – Annual Energy (MU) will display on the page.
16. Click on Export button to download and view the uploaded or existing genertaion profile
for selected plant.
Figure 171. Imported Hydro Generation Profile

173 | DISCOM – REPOSE USER MANUAL USAID.GOV
Once you click on Export button the imported hydro generation profile will get downloaded
in .xlsx format and will appear as shown in Figure 172.
Figure 172. Exported Hydro Generation Profile
17. Once profile is imported succesfully, Pending indication will get
changed to Uploaded indication as shown in Figure 173.
Figure 173. Uploaded Profile Indication

174 | DISCOM – REPOSE USER MANUAL USAID.GOV
Repeat above steps to add hydro generation profile for remaining hydro plants.
Once hydro generation profiles are imported to all Hydro plants, page will appear as shown in Figure
174.
Figure 174. Successfully Created Hydro Generation Portfolio
Once all available RE power plants are configured into the software for IRM studies, we need
reference generation profile for the plant energy dispatch.
You may get the generation profile for RE plants from SLDC data of respective state.
You can consider previous year’s generation/dispatch pattern as reference generation profile.
Hourly RE generation profile is required for IRM – Studies in DISCOM – REPOSE software.
Once you gather generation profiles for all RE plants, we need to configure them into the software.
This section helps us to configure/upload RE generation profile.
STEPS TO CREATE RE GENERATION PORTFOLIO:
1. Click on Generation tab. The Generation tab appears as shown in Figure 175.
2. By default, Library tab will be selected.
3. Click on RE Generation Portfolio tab.
4. Click on Add RE Gen icon to add new RE generation portfolio.

175 | DISCOM – REPOSE USER MANUAL USAID.GOV
Figure 175. Steps to add RE Generation Portfolio
Once you click on Add RE Gen icon, you will see the blank record appeared on page as shown
in Figure 176.
5. Enter appropriate RE generation portfolio name in Name field and reference year of which profile
you are uploading in Year field.

176 | DISCOM – REPOSE USER MANUAL USAID.GOV
Figure 176. Blank Record to Create RE Generation Portfolio
Figure 177 shows sample name and year entered to create the RE generation portfolio.
Figure 177. Saving RE Generation Portfolio

177 | DISCOM – REPOSE USER MANUAL USAID.GOV
6. Click on the SAVE button. The “Are you sure?” confirmation pop-up appears.
Click on OK. The “Inserted successfully” message appears.
Click on CANCEL to discard the task.
STEPS TO UPLOAD RE GENERATION PROFILE:
Successfully added/configured RE generation portfolio reflects on left of the page as shown in Figure
178.
7. Select configured RE portfolio.
8. RE plants added in RE PLANT section appears as list showing Pending
indication as RE generation profile is not uploaded.
9. To upload RE generation profile, click on Upload Plant Wise Generation Profile icon for
which plant you need to upload. Here NVVN_SOLAR plant is shown.
Figure 178. Configured RE Generation Portfolio
Once you click on Upload Plant Wise Generation Profile icon for selected RE plant page will
appear as shown in Figure 179.
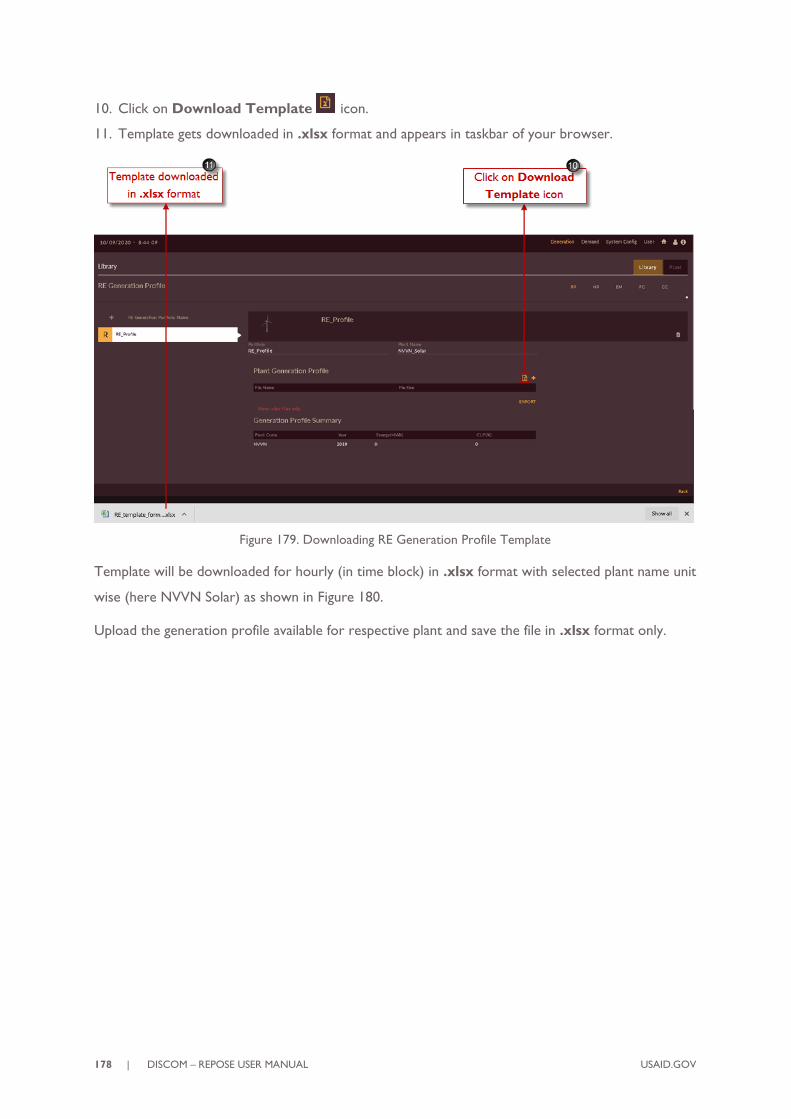
178 | DISCOM – REPOSE USER MANUAL USAID.GOV
10. Click on Download Template icon.
11. Template gets downloaded in .xlsx format and appears in taskbar of your browser.
Figure 179. Downloading RE Generation Profile Template
Template will be downloaded for hourly (in time block) in .xlsx format with selected plant name unit
wise (here NVVN Solar) as shown in Figure 180.
Upload the generation profile available for respective plant and save the file in .xlsx format only.

179 | DISCOM – REPOSE USER MANUAL USAID.GOV
Figure 180. Downloaded RE Generation Profile Template
After file is saved with actual data, you have to upload it in software.
12. Click on Select Files To Upload icon, select the saved template.
13. Once you select the template, File Name will be displayed along with File Size.
14. Click on Import button to upload the profile into the software.

180 | DISCOM – REPOSE USER MANUAL USAID.GOV
Figure 181. Steps to import RE Generation Profile
15. Once file is imported successfully, Generation Profile Summary – Annual Energy (MU) will
display on the page.
16. Click on Export button to download and view the uploaded or existing genertaion profile
for selected plant.
Figure 182. Imported RE Generation Profile

181 | DISCOM – REPOSE USER MANUAL USAID.GOV
Once you click on Export button the imported RE generation profile will get downloaded in
.xlsx format and will appear as shown in Figure 183.
Figure 183. Exported RE Generation Profile

182 | DISCOM – REPOSE USER MANUAL USAID.GOV
17. Once profile is imported succesfully, Pending indication will get
changed to Uploaded indication as shown in Figure 184.
Figure 184. Uploaded Profile Indication
Repeat above steps to add RE generation profile for remaining RE plants.
Once RE generation profiles are imported to all RE plants, page will appear as shown in Figure 185.
Figure 185. Successfully Created RE Generation Portfolio
2.2.3 Building Scenarios for Integrated Resource Mapping Studies
Once you feed all the inputs to the software now it’s time to perform the Integrated Resource
Mapping Studies.

183 | DISCOM – REPOSE USER MANUAL USAID.GOV
For performing studies of integrated resource mapping in DISCOM – REPOSE software you have to
create study scenarios.
For performing IRM - Integrated Resource Mapping or Generation planning studies you have to give
demand data as input.
Since we have created Business As usual (BAU) scenario for Demand forecast studies we have
demand data as output from that BAU scenario we can use as input for IRM studies.
This section gives you the steps to access and create IRM scenario.
Follow these steps to add a scenario.
1. Login to the software. The Dashboard/ Home page appears.
Alternatively, click on Home icon to access the execution page. The page will appear as shown
in Figure 186.
(The scenarios which we created i.e. Business As usual (BAU) and Scenario with Drivers in
BUILDING SCENARIOS FOR DEMAND FORECAST STUDIES section appears in the
scenario list).
2. Click on settings option provided on IRM block to add the scenario creation page.
Figure 186. DISCOM – REPOSE Home Page
Once you click settings icon blank record will appear on the page as shown in Figure 187.

184 | DISCOM – REPOSE USER MANUAL USAID.GOV
Figure 187. Blank Record to Create Scenario for IRM Studies
3. By default Annual IRM option will be selected.
4. Give appropriate scenario name in Scenario Name field, here we have named as
‘IRM_Basecase’.
5. Add study period for Annual IRM studies by choosing Study Period From and Study Period
TO from the calender drop-down.
Figure 188. Creating Annual IRM Study Period

185 | DISCOM – REPOSE USER MANUAL USAID.GOV
6. Click on the SAVE button to save the Annual IRM scenario settings.
The “Are you sure?” confirmation message appears.
Click on the OK icon to save the scenario.
The “Saved Successfully” message appears.
7. Click on Weekly IRM tab to add hourly study details.
You will see the page as shown in Figure 189.
8. Select required week from the drop-down for which you need to carry out studies. You can select
one or multiple weeks. If you set Consider Peak Demand toggle to Yes option
software will choose the week which has peak demand in whole study year.
Figure 189. Creating Weekly IRM Study Period
9. Click on the SAVE button to save the Weekly IRM scenario settings.

186 | DISCOM – REPOSE USER MANUAL USAID.GOV
The “Are you sure?” confirmation message appears.
Click on the OK icon to save the scenario.
The “Saved Successfully” message appears.
10. The scenario appears in the scenario list as shown in Figure 190.
Figure 190. IRM Scenario in Scenario List Page
The scenario page and the scenario will be having following features;
• icon to sort the records.
• View Result icon to view the results.
• Edit Scenario icon to edit the scenario.
• Delete icon to remove the scenario from the list.

187 | DISCOM – REPOSE USER MANUAL USAID.GOV
Once scenario is created and it appears on the page it will not be having any data, you have to configure
all the data which you have given as input.
This section gives explains how to edit the scenario.
We have to edit or configure four different data for the scenario, they are;
• Demand Data
• Hydro Plant Data
• Thermal Plant Data
• RE Plant Data
Follow these steps to edit a scenario.
STEPS TO EDIT/CONFIGURE DEMAND DATA INTO IRM_BASECASE:
1. In the scenario list shown in Figure 191 click on the Edit scenario icon for
IRM_Basecase scenario.
Figure 191. Editing IRM Scenario
Once Scenario is created you need add the required data for studies from raw data section by selecting
required data’s from Manage Resource Mapping Data drop-down list.
Once you click Edit scenario icon page will appear as shown in Figure 192.
2. Click on Manage Resource Mapping Data icon in IRM Base case scenario.
3. Select Demand Data from drop-down list as shown in Figure 192.

188 | DISCOM – REPOSE USER MANUAL USAID.GOV
Figure 192. Manage Demand Data
Once you click on Demand Data link. The scenario specific Demand Configuration data page
appears as shown in Figure 193.
In demand configuration you have to enter the following data;
➢ Demand data source.
• Option 1: Consider demand forecasted in current scenario.
• Option 2: Consider demand forecasted in pre-executed scenario.
• Option 3: Import demand data.
➢ Uncertainty in %.
➢ Demand data scaling.
➢ Unmet requirements like penalty on unmet demand.
➢ System reserve requirements like penalty on unmet reserve.
4. If you have configured both DFC and IRM in same scenario, choose first option under Demand
Data Source.

189 | DISCOM – REPOSE USER MANUAL USAID.GOV
Figure 193. Blank Record for Demand Data
5. Since we have created separate scenarios for DFC and IRM we will choose second option under
Demand Data Source.
Drop-down appears for previously executed cases, you can choose from which case you need to
consider the demand data.
[Note: To get scenario list in drop-down you have to download Load Profiles for the selected
year in DFC scenarios i.e. Business As usual (BAU) and Scenario with Drivers.
See note given in STEPS TO DOWNLOAD BAU-DFC RESULTS: section under
DOWNLOAD/EXPORT/VIEW BAU SCENARIO RESULTS section.]
6. Fill other demand details like Uncertainty, Unmet requirements, system reserve requirements, etc.

190 | DISCOM – REPOSE USER MANUAL USAID.GOV
Figure 194. Configured Demand Data
7. Click on the SAVE icon to save the Demand data settings.
The “Are you sure?” confirmation message appears.
Click on the OK icon to save the scenario.
The “Saved Successfully” message appears.
8. You can view your demand data just by clicking Export Demand And Reserve Data
icon.
9. Demand data will be downloaded in .xlsx format and will appear in task bar of your browser.
Figure 195 shows demand data exported from Business As Usual (BAU) scenario.

191 | DISCOM – REPOSE USER MANUAL USAID.GOV
Figure 195. Exported Demand and Reserve Data
10. In case you don’t have any DFC scenario and you only have raw demand data you can import it
mannually by choosing third option i.e. Import demand data under Demand Data Source.
11. Click on Download Template icon.
12. Template gets downloaded in .xlsx format amnd appears in taskbar of your browser.
Figure 196. Downloading Demand Data Template

192 | DISCOM – REPOSE USER MANUAL USAID.GOV
Template for importing demand data will be downloaded for hourly (in time block) in .xlsx format for
selected study period with scenario name as shown in Figure 197.
Upload the demand data available for scenario and save the file in .xlsx format only.
Figure 197. Downloaded Demand Data Template
After file is saved with actual data, you have to import it into the software.
13. Click on Select Files To Upload icon, select the saved template.
14. Once you select the template, File Name will be displayed along with File Size.
15. Click on Import button to upload the demand data into the software.

193 | DISCOM – REPOSE USER MANUAL USAID.GOV
Figure 198. Imported Demand Data
Click on the SAVE button to save the Demand data settings.
The “Are you sure?” confirmation message appears.
Click on the OK icon to save the scenario.
The “Saved Successfully” message appears.
STEPS TO EDIT/CONFIGURE HYDRO PLANT DATA INTO IRM_BASECASE:
1. Click on Manage Demand Forecast Data icon in IRM Base case scenario.
2. Select Hydro Plant Data from the drop-down list as shown in Figure 198.

194 | DISCOM – REPOSE USER MANUAL USAID.GOV
Figure 199. Manage Hydro Plant Data
Once you click Hydro Plant Data, you are navigated to the Hydro Plant Configuration page of
IRM Basecase senario as shown in Figure 200.
3. Click on Upload Generation Portfolio icon to configure hydro generation profiles.
Figure 200. Uploading Hydro Generation Portfolio to Hydro Plants
Once you click on Upload Generation Portfolio software will appear as shown in Figure 201.

195 | DISCOM – REPOSE USER MANUAL USAID.GOV
4. You have to select Hydro Generation Portfolio from drop-down list. The hydro generation
portfolio configured in HYDRO GENERATION PORTFOLIO section will appear in drop-down
list.
Figure 201. Selecting Hydro Generation Portfolio
5. Click on the SAVE button. The “Are you sure?” confirmation pop-up appears.
Click on OK. The “Inserted successfully” message appears.
Click on CANCEL to discard the task.
Once hydro generation portfolio is successfully inserted into the IRM Base case graph will get
updated as shown in Figure 202.

196 | DISCOM – REPOSE USER MANUAL USAID.GOV
Figure 202. Successfully Configured Hydro Generation Portfolio
Once hydro generation portfolio is successfully inserted into the IRM Base case, we have to check
whether generation profile is updated into each hydro plant. For doing so;
6. Click on Edit icon of respective plant for which you want to see or edit the data. Here KLHEP
Hydro plant is selected in Figure 203.
Figure 203. Edit/View Configured Hydro Generation Portfolio for Plant
Once you click on Edit icon of respective plant, page will appear as shown in Figure 204.

197 | DISCOM – REPOSE USER MANUAL USAID.GOV
7. Table is displayed containing hydro generation profile imported for respective unit. Here KLHEP1
unit is shown.
8. Weekly graphs of respective units will be displayed below table according to generation profile.
You can also edit the generation profile data by just double clicking the row and click on Refresh
icon to update the graph.
Figure 204. Updated Hydro Generation Profile of Hydro Plant
9. Click on UPDATE button to save the changes.
The “Are you sure?” confirmation message appears.
Click on OK to accept the changes made. The “Updated successfully” message appears.

198 | DISCOM – REPOSE USER MANUAL USAID.GOV
Once hydro generation portfolio is updated successfully we have to configure each hydro plant
into the IRM Base case scenario.
10. Click on Configuration icon of respective hydro plant to configure it into IRM Basecase
scenario. Here KLHEP Hydro plant is selected in Figure 205.
Figure 205. Configuring Hydro Plants for IRM scenario
Once you click on Configuration icon of respective plant, unit information of selected plant
page will appear as shown in Figure 206.

199 | DISCOM – REPOSE USER MANUAL USAID.GOV
11. You can edit the unit information here if required, the fields like;
• Minimum and Maximum generation of unit in MW.
• Ramp up and Ramp down rate in MW/min.
• Annual Unavailability (Forced outage rate) in percentage (%).
• You can change generation cost library.
• Percentage (%) reserve allocation.
12. You can make hydro units Out of service or In- service for scenario specific by setting Out Of
Service/In Service toggle icon and can set Maintenance Schedule for
selected unit if required.
Figure 206. Saving Configured Hydro Plant
13. Click on the SAVE button to save and configure Hydro plant data settings.
The “Are you sure?” confirmation message appears.
Click on the OK icon to save the scenario. The “Saved Successfully” message appears.

200 | DISCOM – REPOSE USER MANUAL USAID.GOV
14. Figure 207 shows configured hydro plant into the IRM Base case scenario. Blue tick indication
appears for the plant which is configured or partcipating into the scenario for IRM studies.
Figure 207. Successfully Configured Hydro Plant
Repeat above steps for configuring other hydro plants into the IRM Base case scenario for IRM studies.
You can see the ownership status of each unit by clicking on Details icon.
Once all the Hydro plants are configured into the IRM Base case scenario the final Hydro Plant
Configuration page will appear as shown in Figure 208.

201 | DISCOM – REPOSE USER MANUAL USAID.GOV
Figure 208. List of Successfully Configured Hydro Plants
STEPS TO EDIT/CONFIGURE THERMAL PLANT DATA INTO IRM_BASECASE:
1. Click on Manage Demand Forecast Data icon in IRM Base case scenario.
2. Select Thermal Plant Data from the drop-down list as shown in Figure 209.
Figure 209. Manage Thermal Plant Data
Once you click Thermal Plant Data, software will take user to Thermal Plant Configuration
page of IRM Basecase senario as shown in Figure 210.

202 | DISCOM – REPOSE USER MANUAL USAID.GOV
3. Click on Config icon of respective thermal plant to configure it into IRM Basecase scenario.
Here LAKWA_TPS Thermal plant is selected in Figure 210.
Figure 210. Configuring Thermal Plants for IRM Scenario
Once you click on Config icon of respective plant, unit information of selected plant page will
appear as shown in Figure 211.
4. You can edit the unit information here if required, the fields like;
• Minimum and Maximum generation of unit in MW.
• Ramp up and Ramp down rate in MW/min.
• Annual Unavailability (Forced outage rate) in percentage (%).
• You can change generation cost library and fuel contract library.
• Percentage (%) reserve allocation.
5. You can make thermal units Out of service or In- service for scenario specific by setting Out Of
Service/In Service toggle icon, can make Fuel status Off/On by
setting toggle at suitable position and can set Maintenance Schedule for selected unit if required.

203 | DISCOM – REPOSE USER MANUAL USAID.GOV
Figure 211. Saving Configured Thermal Plant
6. Click on the SAVE button to save and configure Thermal plant data settings.
The “Are you sure?” confirmation message appears.
Click on the OK icon to save the scenario. The “Saved Successfully” message appears.
7. Figure 212 shows configured thermal plant into the IRM Base case scenario. Blue tick indication
appears for the plant which is configured or partcipating into the scenario for IRM studies.

204 | DISCOM – REPOSE USER MANUAL USAID.GOV
Figure 212. Successfully Configured Thermal Plant
Repeat above steps for configuring other thermal plants into the IRM Base case scenario for IRM
studies.
You can see the ownership status of each unit by clicking on Details icon.
Once all the Thermal plants are configured into the IRM Base case scenario the final Thermal Plant
Configuration page will appear as shown in Figure 213.

205 | DISCOM – REPOSE USER MANUAL USAID.GOV
Figure 213. List of Successfully Configured Thermal Plants
STEPS TO EDIT/CONFIGURE RE PLANT DATA INTO IRM_BASECASE:
1. Click on Manage Demand Forecast Data icon in IRM Base case scenario.
2. Select RE Plant Data from the drop-down list as shown in Figure 214.
Figure 214. Manage RE Plant Data
Once you click RE Plant Data, software will take user to RE Plant Configuration page of IRM
Basecase senario as shown in Figure 215.
3. Click on Upload RE Portfolio icon to configure RE generation profiles.

206 | DISCOM – REPOSE USER MANUAL USAID.GOV
Figure 215. Uploading RE Generation Portfolio to RE Plants
Once you click on Upload RE Portfolio icon software will appear as shown in Figure 216.
4. You have to select RE Generation Portfolio from drop-down list. The RE generation portfolio
configured in RE GENERATION PORTFOLIO section will appear in drop-down list.
Figure 216. Selecting RE Generation Portfolio

207 | DISCOM – REPOSE USER MANUAL USAID.GOV
5. Click on the SAVE button. The “Are you sure?” confirmation pop-up appears.
Click on OK. The “Inserted successfully” message appears.
Click on CANCEL to discard the task.
Once RE generation portfolio is successfully inserted into the IRM Base case graph will get updated
as shown in Figure 217.
Figure 217. Successful Configuration of RE Generation Portfolio
Once RE generation portfolio is successfully inserted into the IRM Base case, we have to check
whether generation profile is updated into each RE plant. For doing so;
6. Click on Edit icon of respective plant for which you want to see or edit the data. Here NVVN
Solar plant is selected in Figure 218.

208 | DISCOM – REPOSE USER MANUAL USAID.GOV
Figure 218. Edit/View Configured RE Generation Portfolio for Plant
Once you click on Edit icon of respective plant, the generation profile page appears as shown
in Figure 219.
7. Table is displayed containing RE generation profile imported for respective plant. Here NVVN Solar
plant is shown.
8. Hourly graph of respective plant will be displayed below table according to generation profile.
You can also edit the generation profile data by just double clicking the row and click on Refresh
icon to update the graph.

209 | DISCOM – REPOSE USER MANUAL USAID.GOV
Figure 219. Updated RE Generation Profile of RE Plant
9. Click on UPDATE button to save the changes.
The “Are you sure?” confirmation message appears.
Click on OK to accept the changes made. The “Updated successfully” message appears.
Once RE generation portfolio is updated successfully we have to configure each RE plant into the
IRM Base case scenario.
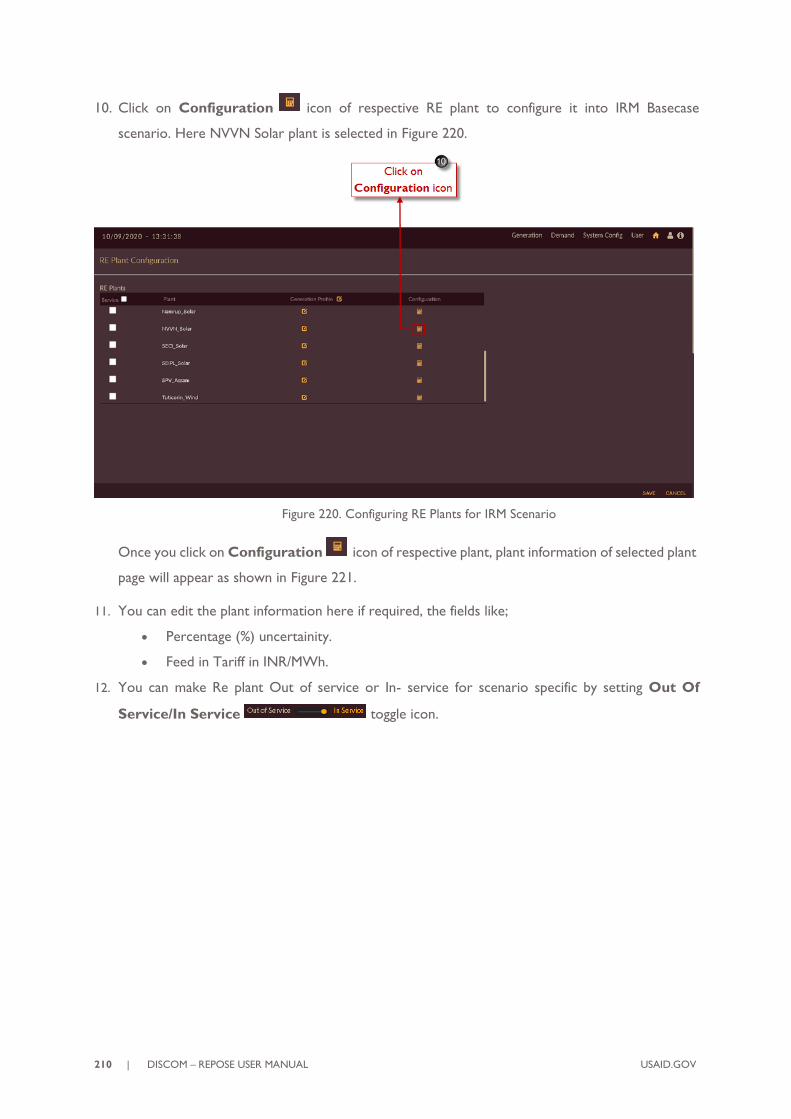
210 | DISCOM – REPOSE USER MANUAL USAID.GOV
10. Click on Configuration icon of respective RE plant to configure it into IRM Basecase
scenario. Here NVVN Solar plant is selected in Figure 220.
Figure 220. Configuring RE Plants for IRM Scenario
Once you click on Configuration icon of respective plant, plant information of selected plant
page will appear as shown in Figure 221.
11. You can edit the plant information here if required, the fields like;
• Percentage (%) uncertainity.
• Feed in Tariff in INR/MWh.
12. You can make Re plant Out of service or In- service for scenario specific by setting Out Of
Service/In Service toggle icon.

211 | DISCOM – REPOSE USER MANUAL USAID.GOV
Figure 221. Saving Configured RE Plant
13. Click on the SAVE button to save and configure RE plant data settings.
The “Are you sure?” confirmation message appears.
Click on the OK icon to save the scenario. The “Saved Successfully” message appears.
14. Figure 222 shows configured RE plant into the IRM Base case scenario. Blue tick indication
appears for the plant which is configured or partcipating into the scenario for IRM studies.

212 | DISCOM – REPOSE USER MANUAL USAID.GOV
Figure 222. Successful Configuration of RE Plant
Repeat above steps for configuring other RE plants into the IRM Base case scenario for IRM studies.
Once all the RE plants are configured into the IRM Base case scenario the final RE Plant Configuration
page will appear as shown in Figure 223.
Figure 223. List of Successful Configured RE Plants
15. After managing all resource data like Demand Data, Hydro Plant Data, Thermal Plant data and RE
Plant Data into the IRM Base case scenario, you will see the page as shown in Figure 224.

213 | DISCOM – REPOSE USER MANUAL USAID.GOV
Figure 224. Finalized IRM Scenario
This section gives you the steps to execute the scenario created.
1. Go to scenario list page as shown in Figure 225 and click on Edit Scenario icon for the
scenario which you need to execute. Here we are executing IRM Base case scenario.
Figure 225. Select IRM Scenario to Execute

214 | DISCOM – REPOSE USER MANUAL USAID.GOV
2. Select the method i.e, IRM function by clicking the red tick mark of respective
method.
3. Click on the Execute icon on the left-side shown in Figure 226.
4. Orange line appears on the top of the software page indicating that scenario is getting executed.
Figure 226. Execution of IRM
The “Executed Successfully” message appears.
The software page will navigate to results page as shown in Figure 227.

215 | DISCOM – REPOSE USER MANUAL USAID.GOV
Figure 227. Result Page
This section gives the steps to view, export and download IRM Scenario Execution Results.
STEPS TO VIEW & EXPORT IRM RESULTS:
Login to the software. The Dashboard/Home page appears. The Scenario List appears on the right
of the home page.
1. Click on the View Result icon on the scenario that you wish to view. In this example, we
see the results of the scenario 93, IRM Base case.
Figure 228. View IRM Scenario

216 | DISCOM – REPOSE USER MANUAL USAID.GOV
Once you click View Result icon, the result page of selected scenario, IRM Base case will open
as shown in Figure 229.
In result page by-default DFC icon will be selected.
2. Click on IRM tab, to view IRM results.
Figure 229 Result Page of IRM Scenario
Once you click IRM icon, in the result page by-default results will appear in the form of graphical
representation and slider will be on graphical option as shown in Figure 230.

217 | DISCOM – REPOSE USER MANUAL USAID.GOV
Figure 230. Results in Graphical Form
3. You can also view the graphical results in tabular form just by setting Graph or Table
data slider to Tabular option. The same data appears as table as shown in Figure
231.

218 | DISCOM – REPOSE USER MANUAL USAID.GOV
Figure 231. Results in Tabular Form
STEPS TO DOWNLOAD IRM RESULTS:
This section gives you the steps to download results.
Repeat steps from 1 to 3 from STEPS TO VIEW & EXPORT IRM RESULTS:.
4. Click on the Download RO PDF REPORT icon to download the PDF report file to see
detailed IRM results along with input data. A screenshot of the PDF report IRM Base case is shown
in Figure 232.

219 | DISCOM – REPOSE USER MANUAL USAID.GOV
Figure 232. Resource Mapping Report IRM Base Case PDF Report
5. Click on Download Text Reports icon to download CSV files to view detailed IRM results
along with input data.
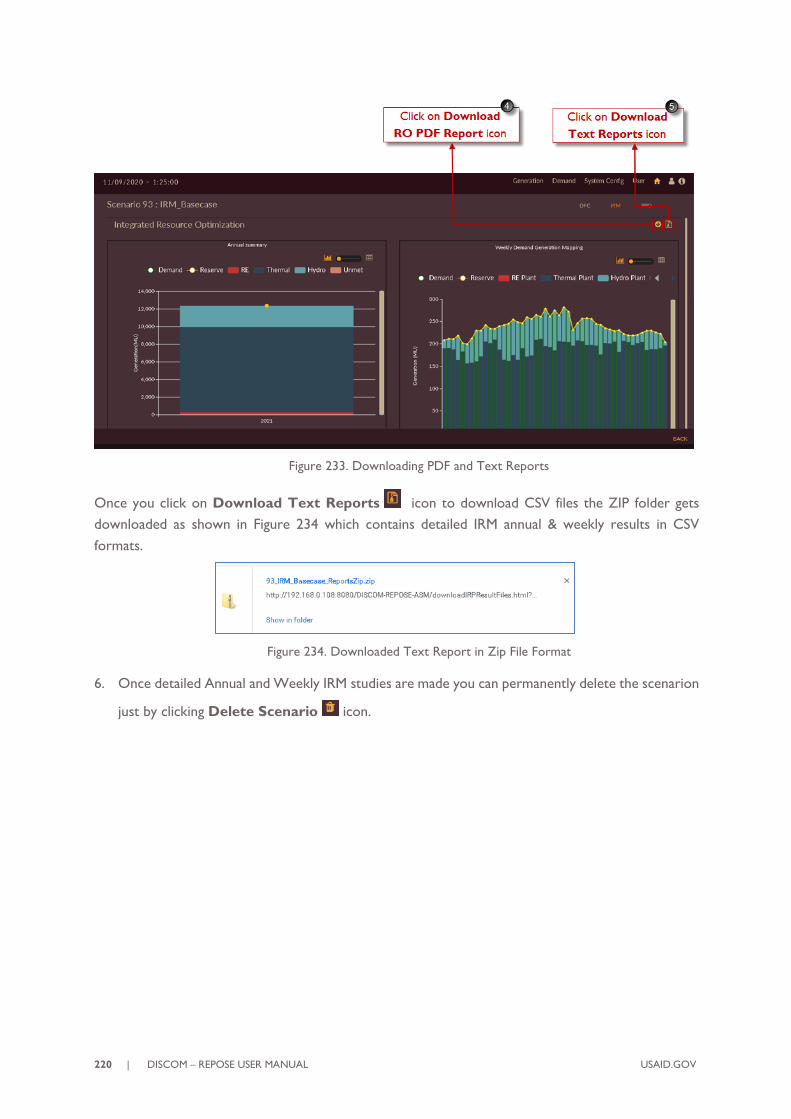
220 | DISCOM – REPOSE USER MANUAL USAID.GOV
Figure 233. Downloading PDF and Text Reports
Once you click on Download Text Reports icon to download CSV files the ZIP folder gets
downloaded as shown in Figure 234 which contains detailed IRM annual & weekly results in CSV
formats.
Figure 234. Downloaded Text Report in Zip File Format
6. Once detailed Annual and Weekly IRM studies are made you can permanently delete the scenarion
just by clicking Delete Scenario icon.

221 | DISCOM – REPOSE USER MANUAL USAID.GOV
Figure 235. Delete IRM Scenario
Once you click on Delete Scenario icon to remove the scenario. The “Are you sure?”
confirmation pop-up appears.
Click on OK. The “Deleted successfully” message appears. Click on CANCEL to discard the task.

222 | DISCOM – REPOSE USER MANUAL USAID.GOV
2.3 MODULE 3: POWER PROCUREMENT OPTIMIZATION
2.3.1 Introduction
Power Procurement Optimization is the third component in DISCOM-REPOSE software using which
we can perform the optimization studies.
In IRM studies we perform the planning studies without considering the procurement data like,
contracts, exchange, RPO targets etc. In PPO module all procurement data like contracts, exchange,
RPO targets, storages are considered for studies.
Once you login to the software, you will see the page as shown in Figure 236.
Figure 236. DISCOM – REPOSE Home page
Let us see what input parameters are required, how to model the database and how to obtain the
results in next sections.
2.3.2 Input Parameters
For performing integrated resource mapping, we have to collect the following data which will be
considered as input for the studies.
Inputs to be considered are the following:
• Contract data
➢ Short term exchange
➢ Medium term/Long term procurement
• Library
➢ Generation profiles for contracted RE plants
• Storage data
• RPO targets data

223 | DISCOM – REPOSE USER MANUAL USAID.GOV
Figure 237. Procurement Page
The sequence to be followed to feed input data for PPO studies is given as follows
1. Configure the ST Exchange and MT/LT Procurement data under Contract tab.
2. Configure the generation profiles for RE contract plants under Library tab.
3. Configure Storage details data under Storage tab.
4. Add RPO targets under System Config tab.
This section helps you to configure shot term exchange data. Follow below steps to add ST Exchange
data,
1. Click on Procurement tab. The Procurement tab appears as shown in Figure 238.
2. Click on Contract tab.
3. By-default Exchange option will be selected.

224 | DISCOM – REPOSE USER MANUAL USAID.GOV
Figure 238. Blank record to add ST exchange data
4. Set the toggle to History Period and Populate the history
period for number of years data available.
5. Enter Short term Energy Exchange (MU) and Exchange Rate (INR/KWh) data in the table
as shown in Figure 239.
Figure 239. Uploading Historical Exchange Data

225 | DISCOM – REPOSE USER MANUAL USAID.GOV
6. Click on SAVE button to save historical ST Exchange data.
The “Are you sure?” confirmation pop-up appears.
Click on OK. The “Saved Successfully” message appears. Click on CANCEL to discard the task.
7. Set the toggle to Future Period and Populate the number of
years as per the study period.
8. Enter Short term Energy Exchange (%) as per your requirement for PPO studies as shown in
Figure 240.
9. Click on Predict button to predict future Exchange Rate (INR/KWh).
[Note: The values predicted in the exchange rates are a trend-based projection of historical cost
data configured in the application. These values can be modified/replaced partially or in full with
real time data, if available.]

226 | DISCOM – REPOSE USER MANUAL USAID.GOV
Figure 240. Uploading Future Exchange Data
10. Click on SAVE button to save future ST Exchange data.
The “Are you sure?” confirmation pop-up appears.
Click on OK. The “Saved Successfully” message appears. Click on CANCEL to discard the task.
This section helps you to configure medium/long term procurement data. Follow below steps to add
MT/LT Procurement data,
1. Click on Procurement tab. The Procurement tab appears.
2. Click on Contract tab. The Contract tab appears.
3. Click on sub Procurement tab.
4. Click on Contract Name icon to add contract plant into the application.

227 | DISCOM – REPOSE USER MANUAL USAID.GOV
Once you click on Contract Name icon, you will see the blank record appeared on page as
shown in Figure 241.
5. Enter the information’s like;
• Contract Information
➢ Enter contract name in Name field
➢ Enter code in Code field
• Associated Plant/Unit Selection
➢ Select the plant type like Hydro/Thermal/RE from the Plant Type drop-down
➢ Select the contract plant name from Plant Name drop-down and unit name form
Unit Name drop-down.
[Note: Only the plants which has ownership status as contract will be displayed in
the drop-down]
• Periodic Contract Details
➢ Select contract period i.e From Date and To Date from the calender drop-down.
[Note: If the study period is less than or equal to five years, toggle will be automatically set to MT
Contract .If the study period is greater than ten years, toggle will be
automatically set to LT Contract . ]
➢ Enter Capacity Share (MW) and EnergyShare (MWh) of a contract.
➢ Enter cost details of contract plant like Fixed Cost (INR/MW) and Variable
Cost (INR/MWh).

228 | DISCOM – REPOSE USER MANUAL USAID.GOV
Figure 241. Blank Record to add Contract plant
6. Click on SAVE button to save contract plant.
The “Are you sure?” confirmation pop-up appears.
Click on OK. The “Saved Successfully” message appears. Click on CANCEL to discard the task.
7. List of successfully added contract plants will appear on left side of the screen as shown in Figure
242.
8. You can view the contract information of selected contract and you can also edit the details if
required.

229 | DISCOM – REPOSE USER MANUAL USAID.GOV
Figure 242. Added Contract Plant
9. Click on UPDATE button to save the changes.
Based on study period edited following message appears.
OR
Click on OK
The “Are you sure?” confirmation message appears.
Click on OK to accept the changes made. The “Updated successfully” message appears.
Repeat above steps to add and update new Contract plants into the software.
10. Once all the Contract plants are added and configured the final Contract > Procurement page will
appear as shown in Figure 243. List of all the Procurement/Contract plants will appear on left of
the applicication page.

230 | DISCOM – REPOSE USER MANUAL USAID.GOV
Figure 243. List of Configured Contract Plants
Once all available RE contracts are configured into the software for PPO studies, we need reference
generation profile for the plant energy dispatch.
You may get the generation profile for RE plants/contracts from SLDC data of respective state.
You can consider previous year’s generation/dispatch pattern as reference generation profile.
Hourly RE generation profile is required for PPO – Studies in DISCOM – REPOSE software.
Once you gather generation profiles for all RE contracts, we need to configure them into the
software.
This section helps us to configure/upload RE contract generation profile.
STEPS TO CREATE RE CONTRACT PORTFOLIO:
1. Click on Procurement tab. The Procurement tab appears as shown in Figure 244.
2. Click on Library tab.
3. Click on Add RE Contract Portfolio icon to add new RE Contract Generation Portfolio.
Once you click on Add RE Contract Portfolio icon, you will see the blank record appeared on
page as shown in Figure 244.

231 | DISCOM – REPOSE USER MANUAL USAID.GOV
4. Enter appropriate RE contract generation portfolio name in Name field and reference year of
which profile you are uploading in Year field.
Figure 244. Steps to add RE Contract Portfolio
5. Figure 245 shows sample name and year entered to create the RE contract generation portfolio.
Figure 245. Saving RE Contract Generation Portfolio

232 | DISCOM – REPOSE USER MANUAL USAID.GOV
6. Click on the SAVE button. The “Are you sure?” confirmation pop-up appears.
Click on OK. The “Inserted successfully” message appears.
Click on CANCEL to discard the task.
STEPS TO UPLOAD RE CONTRACT GENERATION PROFILE:
Successfully added/configured RE contract generation portfolio reflects on left of the page as shown in
Figure 246.
7. Select configured RE portfolio.
8. RE contracts added in MT/LT PROCUREMENT section appears as list showing Pending
indication as RE contract generation profile is not uploaded.
9. To upload RE contract generation profile, click on Upload icon for which RE contract plant
you need to upload. Here RE 2 contract is shown.
Figure 246. Configured RE Contract Generation Portfolio
Once you click on Upload icon for selected RE contract, page will appear as shown in Figure 247.

233 | DISCOM – REPOSE USER MANUAL USAID.GOV
10. Click on Download Template icon.
11. Template gets downloaded in .xlsx format and appears in taskbar of your browser.
Figure 247. Downloading RE Contract Generation Profile Template
Template will be downloaded for hourly (in time block) in .xlsx format with selected RE contract
name (here RE 2) as shown in Figure 248.
Upload the generation profile available for respective RE contract and save the file in .xlsx format
only.

234 | DISCOM – REPOSE USER MANUAL USAID.GOV
Figure 248. Downloaded RE Contract Generation Profile Template
After file is saved with actual data, you have to upload it in software.
12. Click on Select Files To Upload icon, select the saved template.
13. Once you select the template, File Name will be displayed along with File Size.
14. Click on Import button to upload the profile into the software.

235 | DISCOM – REPOSE USER MANUAL USAID.GOV
Figure 249. Steps to import RE Contract Generation Profile
15. Once file is imported successfully, Generation Profile Summary – Energy (MWh) will display
on the page.
16. Click on Export button to download and view the uploaded or existing genertaion profile
for selected plant.
Figure 250. Imported RE Generation Profile

236 | DISCOM – REPOSE USER MANUAL USAID.GOV
Once you click on Export button the imported RE contract generation profile will get
downloaded in .xlsx format and will appear as shown in Figure 251.
Figure 251. Exported RE Contract Generation Profile
17. Once profile is imported succesfully, Pending indication will get
changed to Uploaded indication as shown in Figure 252.
Figure 252. Uploaded Profile Indication
Repeat above steps to add RE contract generation profile for remaining RE contracts.

237 | DISCOM – REPOSE USER MANUAL USAID.GOV
Once RE contract generation profiles are imported to all RE contracts, page will appear as shown in
Figure 253.
Figure 253. Successfully Created RE Generation Portfolio
This section helps you to configure storage plant data. Follow below steps to add Storage data,
1. Click on Procurement tab. The Procurement tab appears.
2. By-default Storage tab will be selected.
3. Click on Add Storage icon to add storage plant into the application.

238 | DISCOM – REPOSE USER MANUAL USAID.GOV
Figure 254. Steps to Add Storage Plant
Once you click on Add Storage icon, you will see the blank record appeared on page as shown
in Figure 255.
4. Enter the Storage Information details like;
• Appropriate name in Name field
• Appropriate code in Code field
• Maximum Generation (MW) and Energy Availability Per Day (MWh)
• Storage Efficiency (%)
• Ramp Up and Ramp Down Rate in MW/Min
• Date of Commissioning and Retirement of storage plant
5. Select correct Ownership Type of storage plant i.e IPP/Grid Dependent using
toggle.
6. Fill the Cost Details like Fixed Cost (INR/MW) and Variable Cost (INR/MWh) along with
From and To Dates.
7. If you have selected ownership type as IPP for storage plant, you need to enter the houlry
Generation Profile in MWh.

239 | DISCOM – REPOSE USER MANUAL USAID.GOV
Figure 255. Blank Record for Adding Storage Plant
Figure 256 shows the sample storage data added.
Figure 256. Saving Sample Storage Plant
8. Click on the SAVE button to add storage plant into the software.
The “Are you sure?” confirmation pop-up appears.

240 | DISCOM – REPOSE USER MANUAL USAID.GOV
Click on OK. The “Saved successfully” message appears.
Click on CANCEL to discard the task.
Repeat above steps to add multiple storage plants into the application.
The list of successfully added storage plants will appear on left of the screen as shown in Figure 257.
Figure 257. List of Configured Storage Plants
2.3.3 Additional Parameters
The additional parameters include the system configuration information such as seasons and
Transmission & Distribution Losses which we have seen in module 1. Apart from those parameters
we have RPO – Renewable Purchase Obligation to be added for PPO studies as this parameter is
observed to have higher impact on the power procurement optimization studies. The RPO module is
provided under SYSTEM CONFIG tab.
Renewable Purchase Obligation (RPO) mandates that all electricity distribution licensees should
purchase or produce a minimum specified quantity of their requirements from Renewable Energy

241 | DISCOM – REPOSE USER MANUAL USAID.GOV
Sources. This is as per the Indian Electricity Act, 2003. The State Electricity Regulatory Commissions
fix the minimum RPO for the State.
STEPS TO CONFIGURE RENEWABLE PURCHASE OBLIGATION (RPO) INTO THE
SOFTWARE:
1. Login to the software and access System Config tab. The System Config tab appears.
2. Click on the RPO tab. The RPO tab appears.
After you click on RPO tab the software page looks like as shown in Figure 258.
3. Enter year wise RPO targets in % for Solar, Wind, Biomass, Small Hydro and Other Renewables in
the table.
Figure 258. Steps to Add RPO Targets Data
4. Click on the SAVE button to add RPO targets into the software.
The “Are you sure?” confirmation pop-up appears.
Click on OK. The “Saved successfully” message appears.
Click on CANCEL to discard the task.

242 | DISCOM – REPOSE USER MANUAL USAID.GOV
5. Once RPO targets are saved corresponding graph appears on the screen as shown in Figure 259.
Figure 259. Saving RPO Target Data
2.3.4 Building Scenarios for Power Procurement Optimization Studies
Once you feed all the inputs to the software now it’s time to perform the Power Procurement
Optimization Studies.
For performing studies of power procurement optimization in DISCOM – REPOSE software you have
to create study scenarios.
For performing PPO – Power Procurement Optimization studies you have to give demand data as
input.
Since we have created Business As usual (BAU) scenario for Demand forecast studies we have
demand data as output from that BAU scenario we can use as input for PPO studies.
This section gives you the steps to access and create PPO scenario.
Follow these steps to add a scenario.
1. Login to the software. The Dashboard/ Home page appears.
Alternatively, click on Home icon to access the execution page. The page will appear as shown
in Figure 260.
(The scenarios which we created i.e. Business As usual (BAU) and Scenario with Drivers in
BUILDING SCENARIOS FOR DEMAND FORECAST STUDIES section and IRM Base
case BUILDING SCENARIOS FOR INTEGRATED RESOURCE MAPPING STUDIES
section appears in the scenario list).
2. Click on settings option provided on PPO block to add the scenario creation page.

243 | DISCOM – REPOSE USER MANUAL USAID.GOV
Figure 260. DISCOM – REPOSE Home Page
Once you click settings icon blank record will appear on the page as shown in Figure 261.
Figure 261. Blank Record to Create Scenario for PPO Studies
3. By default PPO option will be selected.
4. Give appropriate scenario name in Scenario Name field, here we have named as
‘PPO_Basecase’.
5. Select required Optimization Criteria, study period for PPO studies by choosing Period From
and Period To from the calender drop-down and other options required for PPO studies.

244 | DISCOM – REPOSE USER MANUAL USAID.GOV
Figure 262. Creating PPO Study Period
6. Click on the SAVE button to save the PPO scenario settings.
The “Are you sure?” confirmation message appears.
Click on the OK icon to save the scenario.
The “Saved Successfully” message appears.
7. The scenario appears in the scenario list as shown in Figure 263.

245 | DISCOM – REPOSE USER MANUAL USAID.GOV
Figure 263. PPO Scenario in Scenario List Page
The scenario page and the scenario will be having following features;
• icon to sort the records.
• View Result icon to view the results.
• Edit Scenario icon to edit the scenario.
• Delete icon to remove the scenario from the list.
Once scenario is created and it appears on the page it will not be having any data, you have to configure
all the data which you have given as input.
This section gives explains how to edit and configure the scenario.
Follow these steps to edit a scenario.
1. In the scenario list shown in Figure 264 click on the Edit scenario icon for
PPO_Basecase scenario.

246 | DISCOM – REPOSE USER MANUAL USAID.GOV
Figure 264. Editing PPO Scenario
Once Scenario is created you need add the required data for studies from raw data section by selecting
required data’s from Manage Power Procurement Data drop-down list.
Once you click Edit scenario icon page will appear as shown in Figure 265.
2. Click on Manage Power Procurement Data icon in PPO Base case scenario.
3. Once you click Manage Power Procurement Data icon, list of data to be configured will
appear as list. If we see Figure 265 there are eight different data to be configured to the scenario,
they are;
• Demand Data
• Hydro Plant Data
• Thermal Plant Data
• RE Plant Data
• Procurement
• Exchange
• RPO Targets
• Energy Storage

247 | DISCOM – REPOSE USER MANUAL USAID.GOV
Figure 265. Managing Power Procurement Data
STEPS TO EDIT/CONFIGURE DEMAND DATA INTO PPO_BASECASE:
Editing/Configuring demand data into PPO_Basecase scenario is similar as we configured demand
data to IRM_Basecase.
So, you can follow the same steps as shown in STEPS TO EDIT/CONFIGURE DEMAND
DATA INTO IRM_BASECASE: for configuring demand data into PPO_Basecase.
STEPS TO EDIT/CONFIGURE HYDRO PLANT DATA INTO PPO_BASECASE:
Editing/Configuring hydro plant data into PPO_Basecase scenario is similar as we configured hydro
plant data to IRM_Basecase.
So, you can follow the same steps as shown in STEPS TO EDIT/CONFIGURE HYDRO
PLANT DATA INTO IRM_BASECASE: for configuring demand data into PPO_Basecase.
STEPS TO EDIT/CONFIGURE THERMAL PLANT DATA INTO PPO_BASECASE:
Editing/Configuring thermal plant data into PPO_Basecase scenario is similar as we configured
thermal plant data to IRM_Basecase.
So, you can follow the same steps as shown in STEPS TO EDIT/CONFIGURE THERMAL
PLANT DATA INTO IRM_BASECASE: for configuring demand data into PPO_Basecase.
STEPS TO EDIT/CONFIGURE RE PLANT DATA INTO PPO_BASECASE:
Editing/Configuring RE plant data into PPO_Basecase scenario is similar as we configured RE plant
data to IRM_Basecase.

248 | DISCOM – REPOSE USER MANUAL USAID.GOV
So, you can follow the same steps as shown in STEPS TO EDIT/CONFIGURE RE PLANT
DATA INTO IRM_BASECASE: for configuring demand data into PPO_Basecase.
Once you successfully configure demand, hydro, thermal and RE data to the scenario the scenario
screen will appear as shown in Figure 266.
Figure 266. Demand, Hydro, Thermal, RE Data configured to PPO Scenario
STEPS TO EDIT/CONFIGURE PROCUREMENT DATA INTO PPO_BASECASE:
1. Click on Manage Power Procurement Data icon in PPO Base case scenario.
2. Select Procurement from the drop-down list as shown in Figure 267.
Figure 267. Manage Procurement Data

249 | DISCOM – REPOSE USER MANUAL USAID.GOV
Once you click Procurement, you are navigated to the Procurement page of PPO Basecase
senario as shown in Figure 268.
3. Click on Upload mtlt Portfolio icon to configure RE contract generation profiles.
Figure 268. Uploading mtlt Portfolio for RE Contracts
Once you click on Upload mtlt Portfolio software will appear as shown in Figure 269.
4. You have to select RE Contract Portfolio from drop-down list. The RE contract generation
portfolio configured in RE GENERATION PORTFOLIO FOR RE CONTRACTS section will appear
in drop-down list.

250 | DISCOM – REPOSE USER MANUAL USAID.GOV
Figure 269. Selecting RE Contract Generation Portfolio
5. Click on the SAVE button. The “Are you sure?” confirmation pop-up appears.
Click on OK. The “Inserted successfully” message appears.
Click on CANCEL to discard the task.
Once RE contract generation portfolio is successfully inserted into the PPO Base case graph will
get updated as shown in Figure 270.

251 | DISCOM – REPOSE USER MANUAL USAID.GOV
Figure 270. Successfully Configured RE Contract Generation Portfolio
Once Re contract generation portfolio is successfully inserted into the PPO Base case, we have to
check whether generation profile is updated into each RE contract plant. For doing so;
6. Click on Edit icon of respective RE contract plant for which you want to see or edit the data.
Here RE 1 contract plant is selected in Figure 271.
Figure 271. Edit/View Configured RE Contract Generation Portfolio
Once you click on Edit icon of respective RE contract plant, page will appear as shown in
Figure 272.

252 | DISCOM – REPOSE USER MANUAL USAID.GOV
7. Table is displayed containing RE contract generation profile imported for respective RE contract.
Here RE 1 contract is shown.
8. Hourly graphs of respective contracts will be displayed below table according to generation profile.
You can also edit the generation profile data by just double clicking the row and click on Refresh
icon to update the graph.
Figure 272. Updated RE Contract Generation Portfolio of RE Contract
9. Click on UPDATE button to save the changes.
The “Are you sure?” confirmation message appears.
Click on OK to accept the changes made. The “Updated successfully” message appears.

253 | DISCOM – REPOSE USER MANUAL USAID.GOV
Once RE contract generation portfolio is updated successfully we have to configure each contract
unit into the PPO Base case scenario.
10. Click on Configuration icon of respective contract unit/plant to configure it into PPO
Basecase scenario. Here Hydro 1 contract unit is selected in Figure 273.
Figure 273. Configuring Contracts for PPO Scenario
Once you click on Configuration icon of respective contract, periodic contract details of
selected contract page will appear as shown in Figure 274.

254 | DISCOM – REPOSE USER MANUAL USAID.GOV
11. You can edit the periodic contract details here if required, the fields like;
• Contract period (From Date and To date).
• Capacity Share in MW.
• Energy Share in MWh.
• Cost details like Fixed Cost (INR/MW) and Variabke Cost (INR/MWh).
Figure 274. Saving Configured Contracts
12. Click on the SAVE button to save and configure contract unit data settings.
The “Are you sure?” confirmation message appears.
Click on the OK icon to save the scenario. The “Saved Successfully” message appears.

255 | DISCOM – REPOSE USER MANUAL USAID.GOV
13. Figure 275 shows configured Contract unit into the PPO Base case scenario. Blue tick indication
appears for the contract unit which is configured or partcipating into the scenario for PPO
studies.
Figure 275. Successfully Configured Contract
Repeat above steps for configuring other contracts into the PPO Base case scenario for PPO studies.
Once all the Contracts are configured into the PPO Base case scenario the final Procurement
Configuration page will appear as shown in Figure 276.
Figure 276. List of Successfully Configured Contracts

256 | DISCOM – REPOSE USER MANUAL USAID.GOV
STEPS TO EDIT/CONFIGURE EXCHANGE DATA INTO PPO_BASECASE:
1. Click on Manage Power Procurement Data icon in PPO Base case scenario.
2. Select Exchange from the drop-down list as shown in Figure 277.
Figure 277. Manage Exchange Data
3. By-default History Period will be selected, i.e historical short term exchange data will be displayed
as shown in Figure 278.

257 | DISCOM – REPOSE USER MANUAL USAID.GOV
Figure 278. Configuring Historical Exchange Data
4. Click on the SAVE button to save and configure historical exchange data into the PPO
scenario.
The “Are you sure?” confirmation message appears.
Click on the OK icon to save the scenario. The “Saved Successfully” message appears.
5. Set the toggle to Future Period to save future short term exchange data to the scenario as shown
in Figure 279.

258 | DISCOM – REPOSE USER MANUAL USAID.GOV
Figure 279. Configuring Future Exchange Data
6. Click on the SAVE button to save and configure future exchange data into the PPO
scenario.
The “Are you sure?” confirmation message appears.
Click on the OK icon to save the scenario. The “Saved Successfully” message appears.
STEPS TO EDIT/CONFIGURE RPO TARGETS DATA INTO PPO_BASECASE:
1. Click on Manage Power Procurement Data icon in PPO Base case scenario.
2. Select RPO Targets from the drop-down list as shown in Figure 280.

259 | DISCOM – REPOSE USER MANUAL USAID.GOV
Figure 280. Manage RPO Targets Data
3. The RPO target configured in STEPS TO CONFIGURE RENEWABLE PURCHASE
OBLIGATION (RPO) INTO THE SOFTWARE: section will appear for selected study year.
You can also edit the data if required.
Figure 281. Configuring/Saving RPO Targets
4. Click on the SAVE button to save and configure RPO targets data into the PPO scenario.
The “Are you sure?” confirmation message appears.

260 | DISCOM – REPOSE USER MANUAL USAID.GOV
Click on the OK icon to save the scenario. The “Saved Successfully” message appears.
STEPS TO EDIT/CONFIGURE ENERGY STORAGE DATA INTO PPO_BASECASE:
1. Click on Manage Power Procurement Data icon in PPO Base case scenario.
2. Select Energy Storage from the drop-down list as shown in Figure 282.
Figure 282. Manage Energy Storage Data
3. Click on Configuration icon of respective storage plant to configure it into PPO Basecase
scenario. Here Pumped Storage Independent plant is selected in Figure 283.

261 | DISCOM – REPOSE USER MANUAL USAID.GOV
Figure 283. Configuring Storage Plant for PPO Scenario
Once you click on Configuration icon of respective storage plant, storage information of
selected storage plant will appear as shown in Figure 284.
4. You can edit the storage plant details if required, the fields like;
• Storage Information details like;
➢ Maximum Generation in MW
➢ Energy availability per day in MWh
➢ Storage efficiency in %
➢ Ramp Up and Ramp Down rates in MW/Min.
• Cost Details like;
➢ From Date and To Date
➢ Fixed Cost in INR/MW and Variable Cost in INR/MWh.
• Hourly Generation Profile details.
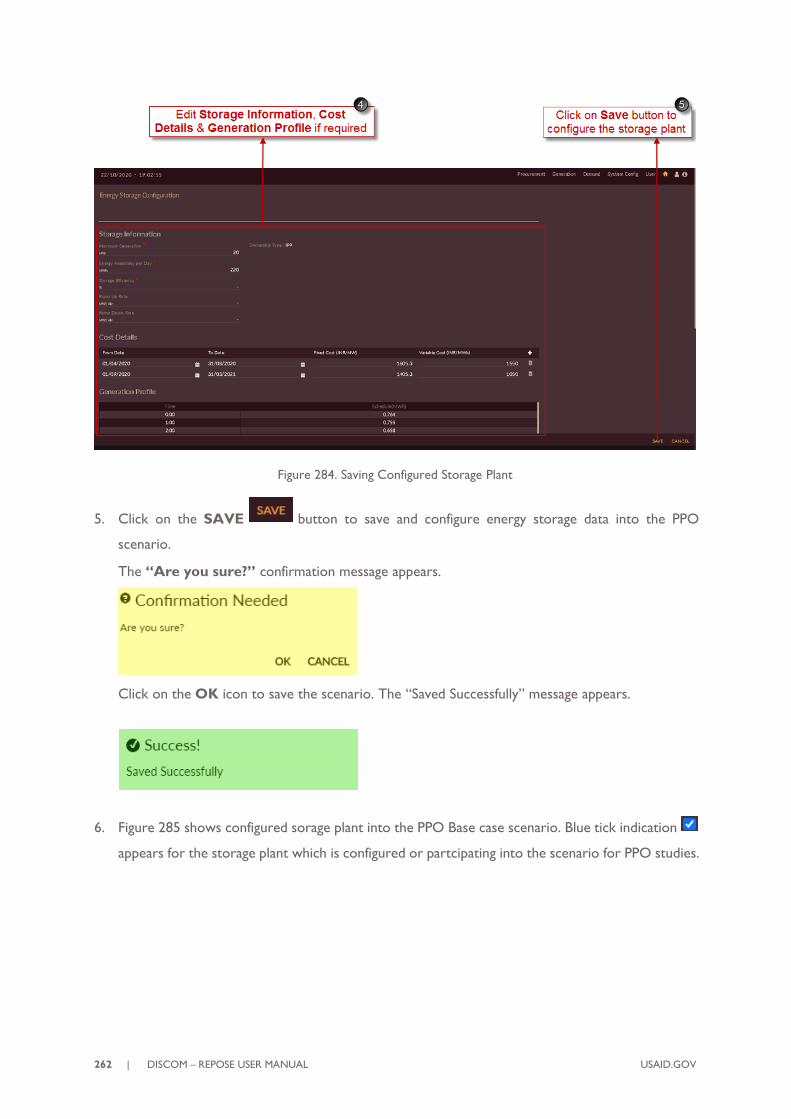
262 | DISCOM – REPOSE USER MANUAL USAID.GOV
Figure 284. Saving Configured Storage Plant
5. Click on the SAVE button to save and configure energy storage data into the PPO
scenario.
The “Are you sure?” confirmation message appears.
Click on the OK icon to save the scenario. The “Saved Successfully” message appears.
6. Figure 285 shows configured sorage plant into the PPO Base case scenario. Blue tick indication
appears for the storage plant which is configured or partcipating into the scenario for PPO studies.

263 | DISCOM – REPOSE USER MANUAL USAID.GOV
Figure 285. Successfully Configured Storage Plant
Repeat above steps for configuring other enrgy storage plants into the PPO Base case scenario for
PPO studies.
Once all the Storage plants are configured into the PPO Base case scenario the final Energy Storage
Configuration page will appear as shown in Figure 286.
Figure 286. List of Successfully Configured Storage Plant

264 | DISCOM – REPOSE USER MANUAL USAID.GOV
7. After managing all power procurement data like Demand Data, Hydro Plant Data, Thermal Plant
Data, RE Plant Data, Procurement Data, Exchange Data, RPO Targets Data and Energy Storage
Data into the PPO Base case scenario, you will see the page as shown in Figure 287.
Figure 287. Finalized PPO Scenario
This section gives you the steps to execute the scenario created.
1. Go to scenario list page as shown in Figure 288 and click on Edit Scenario icon for the
scenario which you need to execute. Here we are executing PPO Base case scenario.

265 | DISCOM – REPOSE USER MANUAL USAID.GOV
Figure 288. Select PPO Scenario to Execute
2. Select the method i.e, PPO function by clicking the red tick mark of respective
method.
3. Click on the Execute icon on the left-side shown in Figure 289.
4. Orange line appears on the top of the software page indicating that scenario is getting executed.

266 | DISCOM – REPOSE USER MANUAL USAID.GOV
Figure 289. Execution of PPO
The “Executed Successfully” message appears.
The software page will navigate to results page as shown in Figure 290.
Figure 290. Result Page

267 | DISCOM – REPOSE USER MANUAL USAID.GOV
This section gives the steps to view, export and download PPO Scenario Execution Results.
STEPS TO VIEW & EXPORT PPO RESULTS:
Login to the software. The Dashboard/Home page appears. The Scenario List appears on the right
of the home page.
1. Click on the View Result icon on the scenario that you wish to view. In this example, we
see the results of the scenario 122, PPO Base case.
Figure 291. View PPO Scenario
Once you click View Result icon, the result page of selected scenario, PPO Base case will open
as shown in Figure 292.
In result page by-default DFC icon will be selected.
2. Click on PPO tab, to view PPO results.

268 | DISCOM – REPOSE USER MANUAL USAID.GOV
Figure 292. Result Page of PPO Scenario
Once you click PPO icon, in the result page by-default results will appear in the form of graphical
representation and slider will be on graphical option as shown in Error!
Reference source not found..
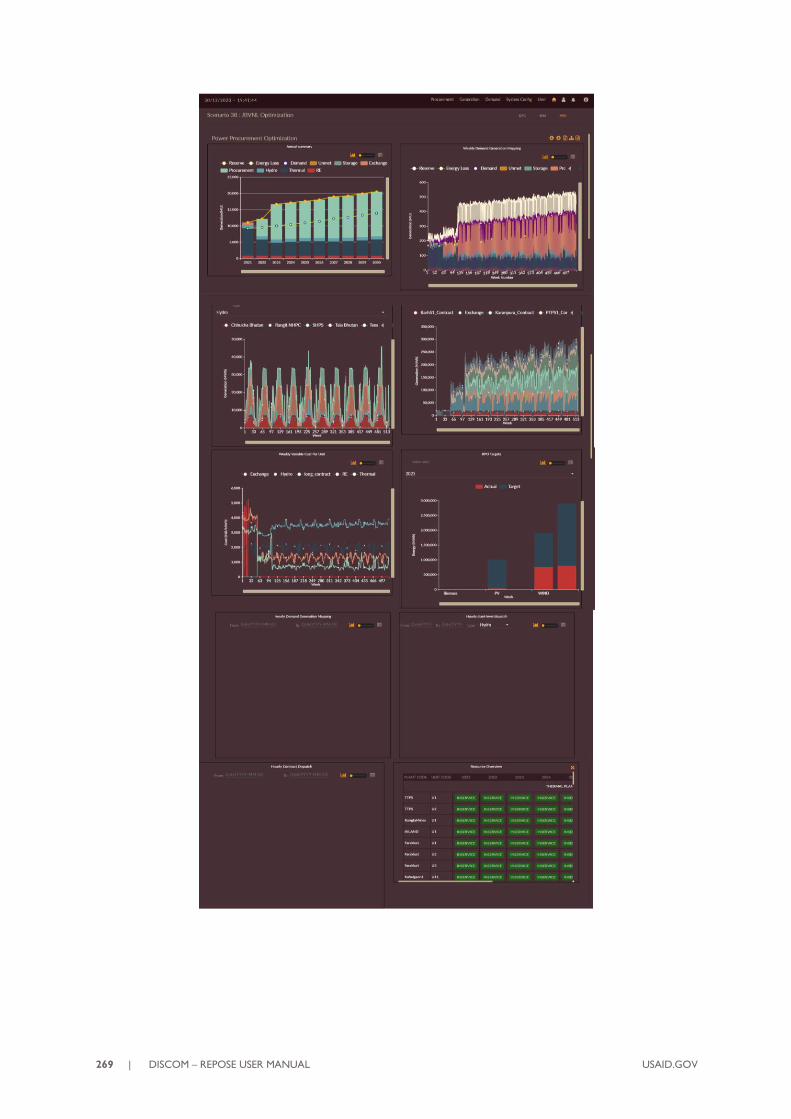
269 | DISCOM – REPOSE USER MANUAL USAID.GOV

270 | DISCOM – REPOSE USER MANUAL USAID.GOV
Figure 293. Results in Graphical Form

271 | DISCOM – REPOSE USER MANUAL USAID.GOV
3. You can also view the graphical results in tabular form just by setting Graph or Table
data slider to Tabular option. The same data appears as table as shown in
Figure 294.
Figure 294. Results in Tabular Form

272 | DISCOM – REPOSE USER MANUAL USAID.GOV
STEPS TO DOWNLOAD PPO RESULTS:
This section gives you the steps to download results.
Repeat steps from 1 to 3 from STEPS TO VIEW & EXPORT IRM RESULTS:.
4. Click on the Download PPO PDF REPORT icon to download the PDF report file to see
detailed PPO results along with input data. A screenshot of the PDF report PPO Base case is
shown in Figure 295.
Figure 295. Power Procurement Report PPO Base Case PDF Report
5. Click on Download Text Reports icon to download CSV files to view detailed PPO results
along with input data.

273 | DISCOM – REPOSE USER MANUAL USAID.GOV
Figure 296. Downloading PDF and Text Reports
Once you click on Download Text Reports icon to download CSV files the ZIP folder gets
downloaded as shown in Figure 297 which contains detailed PPO results in CSV formats.
Figure 297. Downloaded Text Report in Zip File Format
6. Once detailed PPO studies are made you can permanently delete the scenario just by clicking
Delete Scenario icon.

274 | DISCOM – REPOSE USER MANUAL USAID.GOV
Figure 298. Delete PPO Scenario
This section gives the steps to view, export and download PPO Scenario Consolidated Reports.
1. Click on the PPO button in the scenario results page.
2. Click on the Consolidated Reports icon.

275 | DISCOM – REPOSE USER MANUAL USAID.GOV
Figure 299. PPO Consolidated Reports
3. Click on the Graph Type drop-down to select the option for which you wish to view
the graph.
4. Click on the Plot button to render the respective graph as shown in

276 | DISCOM – REPOSE USER MANUAL USAID.GOV
Figure 300. Plotting the Graphs for Generation Dispatch Cost Summary
5. Click on the back icon to go back to the previous screen.
6. Select the Contract Type.
7. Click on the Plant Type and select the plant.
8. Click on the Unit name.
9. Click on the Generation Dispatch cost year drop-down and select the year for which
the graph is to be generated.
10. The graph gets plotted for the selected year as shown in Figure 301. Generation
Dispatch Cost Graph - RE Plant

277 | DISCOM – REPOSE USER MANUAL USAID.GOV
Figure 301. Generation Dispatch Cost Graph - RE Plant
11. Click on the Contract type as State Owned or Contract.
12. Select the Plant Type as Thermal Plant.
13. Select the Plant name.
14. Select the Unit name.
15. The graph gets plotted below as shown in

278 | DISCOM – REPOSE USER MANUAL USAID.GOV
Figure 302. Generation Dispatch Cost Graph - Thermal
Figure 303. Average Cost Summary for Study Period Selected

279 | DISCOM – REPOSE USER MANUAL USAID.GOV
This section gives you the steps to download the recommendation reports.
1. Access the PPO Results tab and click on the Recommendations Reports icon.
Figure 304. Recommendations Report Option in PPO Results Page
2. The Recommendations Report page appears. Select the Optimization Type from the
drop-down menu and click on Generate button.
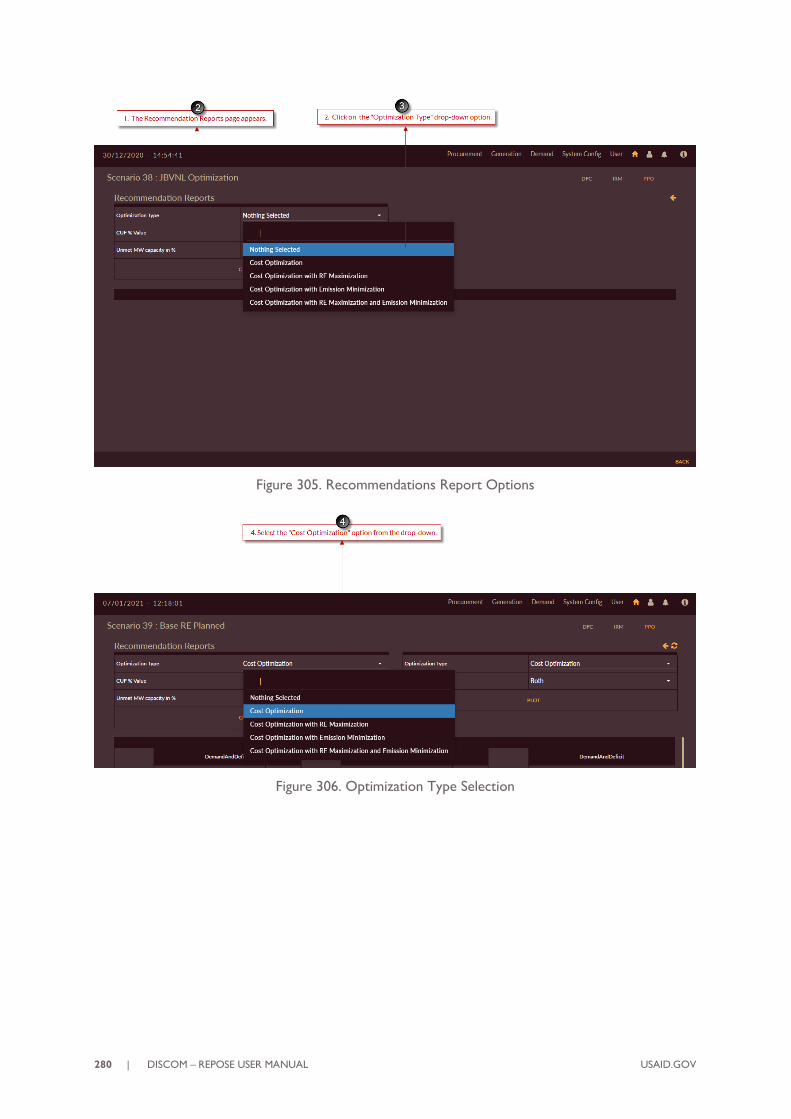
280 | DISCOM – REPOSE USER MANUAL USAID.GOV
Figure 305. Recommendations Report Options
Figure 306. Optimization Type Selection

281 | DISCOM – REPOSE USER MANUAL USAID.GOV
Figure 307. Generate Optimization Tables

282 | DISCOM – REPOSE USER MANUAL USAID.GOV
Figure 308. Select the Optimization Graphs
Figure 309. Demand Trend - Demand, Unmet Demand, Peak Demand, Peak Unmet
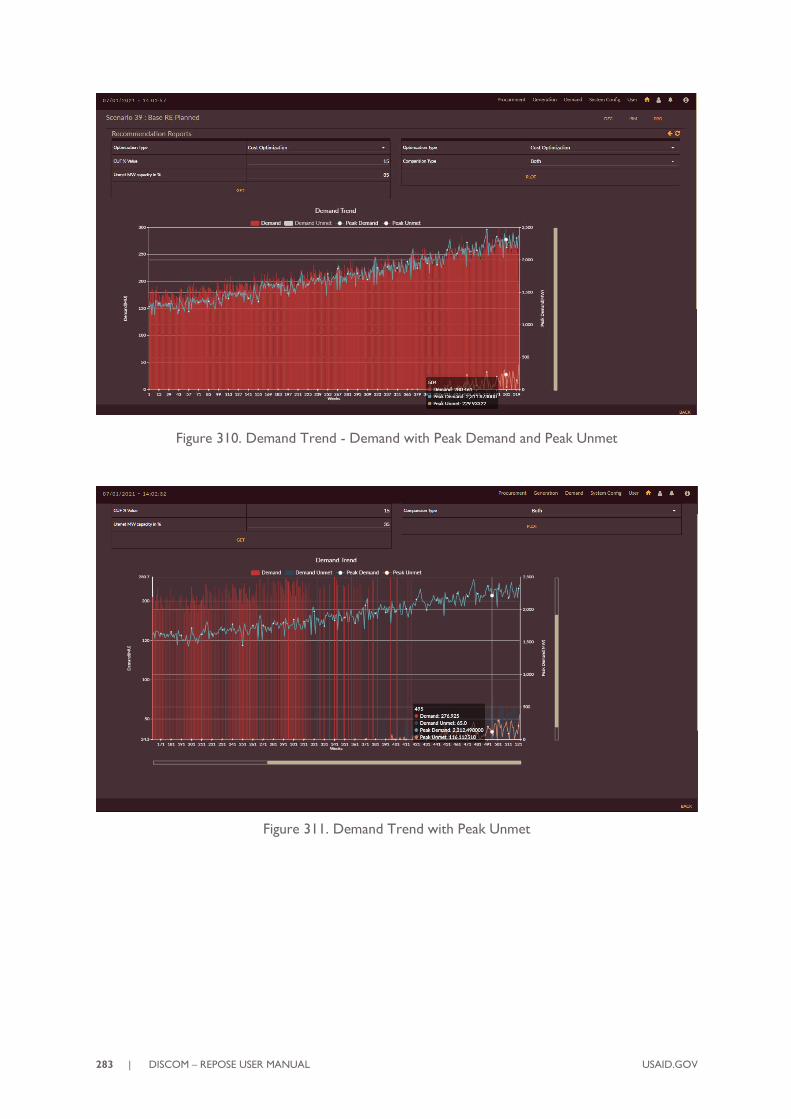
283 | DISCOM – REPOSE USER MANUAL USAID.GOV
Figure 310. Demand Trend - Demand with Peak Demand and Peak Unmet
Figure 311. Demand Trend with Peak Unmet

284 | DISCOM – REPOSE USER MANUAL USAID.GOV
Figure 312. Demand
Figure 313. Demand Unmet

285 | DISCOM – REPOSE USER MANUAL USAID.GOV
2.4 FREQUENTLY ASKED QUESTIONS
2.4.1 Demand Forecast
1. WHAT ARE THE VARIABLES PRE-CONFIGURED IN THE SOFTWARE?
The following variables are pre-configured:
Demand Data
Historical Energy Sales Data: The historical energy sales data is given as input to the application
to forecast the future energy sales of the DISCOM. This variable acts as the dependent variable that
participates in forecasting the future sales. Based on the forecasted energy sales for each category,
the total DISCOM demand can be evaluated.
Weather Variations
TEMPERATURE: Temperature has the utmost influence on electrical demand among all weather-
related factors. The parameters which have the impact on energy sales are also called as independent
variables. When the temperature is cold or hot, there will be a large number of heating or cooling
loads put into operation, which will result in a substantial change in power consumption needs in the
residential and commercial sectors. Therefore, temperature, scaled at monthly horizon is an
important factor in the medium-term load forecasting.
RAINFALL: The impact of wet years versus draught years on the demand, and further, the impact of
years witnessing heavier/lower rainfall than usual can be estimated by including Rainfall (in mm) in the
year/season/month as one of the independent variables. The impact of rainfall on energy sales can
have either positive or negative depending on the geographical location of the DISCOM.
HUMIDITY: The yearly averages for humidity levels (in percentage) also play a key role in
correlating the impact of weather variation on demand. However, this parameter has limited role on
medium-term and long-term demand projections.
WATER TABLE: It is the ground water level measured in mgbl i.e., Meters Below Ground Level.
The vast majority of groundwater supply sources require considerable energy for pumping. As the
level of underground water recedes, the power required to draw the water through water-pumps
and bore-wells increases, which will result in a substantial change in power consumption needs in the
agriculture sector. Hence the water table is included as one of the independent variables to find the
impact on DISCOM energy sales.
Demographic Variables
TOTAL POPULATION: Considering the rise in the growth of per capita consumption in a
developing country, an increase in population will increase the demand seen by the utility. Domestic
category energy sales mainly depend on the increase in population. Hence, population is included as
an independent variable while calibrating the impact on DISCOM’s energy sales.
Econometric Variables
GROSS DOMESTIC PRODUCT: The energy demand in a given area will increase at a rate
that depends upon the population and economic growth of the people living in the area. This
is reflected in the market value of final goods, measured by GDP. GDP of different sector gives an
insight on the possible demand from the corresponding consumer categories. In addition, literature
findings also emphasize the need for considering the Price of Electricity (Rs/kWh) as an important
variable in addition to GDP to be able to effectively forecast the per capita consumption of electricity.
PER CAPITA INCOME: It is calculated based on the GDP value and the population forecasted. The
per capita income represents the average income of an individual and this exhibits a positive

286 | DISCOM – REPOSE USER MANUAL USAID.GOV
relationship with the consumption of electricity. As the income of an individual increases the
consumption of electricity also increases, as the individual will opt for more electrical and electronic
gadgets.
PRICE DEFLATOR: It is the deflation in the prices of the general commodities used in day-to-day life
of the general public. This variable explains the effect of prices in the demand equation. This parameter
has been calculated based on the ratio of GDP at current prices and GDP at constant prices.
GDP Manufacturing: The manufacturing sector is the largest consumer of industrial electricity. It
runs power intensive processes that use a large amount of electricity. A rise in manufacturing increases
the demand for electricity, especially for industrial use. Manufacturing is a key data point because it has
a weight of more than three-fourths in the total demand experienced by the DISCOMs.
GDP Agriculture: Agriculture is described as the backbone for most of the developing countries
like India. Agriculture uses energy directly as fuel or electricity to operate machinery and equipment,
for lighting on the farm or mostly to pump water and indirectly in manufacturing fertilizers and
chemicals produced to support farming
TAX HOLIDAY: A tax holiday is also implemented for businesses to encourage economic activity
and foster growth. Used in the hopes of increasing the gross domestic product (GDP) in developing
countries, tax holidays are a way in which governments attract foreign investors or foreign companies
that establish base in the host country. Tax holidays are often put in place in particular industries to
promote growth, develop, or diversify domestic industries. For specific categories like commercial,
industrial, etc., several incentives are provided, which would impact the production and in-turn, the
consumption by the category. For instance, the StartUp India Campaign by the Government of India
allows startups to enjoy a three-year TAX HOLIDAY in a block of seven years. This encourages the
startups to maximize their services/productions for the said period without having tax implications.
Which of the variables are suitable for each of the categories?
Typically, the suitability of variables is evaluated through data research. However, an indicative table
is given in Table 8.
Table 8: Indicative Category – Variable Mapping List
SL. NO. CATEGORY VARAIBLES
1 Domestic
i. Population
ii. Per Capita Income
iii. GSDP
2 Commercial
i. GSDP
ii. Per Capita Income
iii. Price Deflator
3 Public lighting & water works i. Population
4 Bulk Supply i. GSDP
5 Industrial i. GSDP Manufacturing
ii. Price Deflator
6 General Purpose i. Per Capita Income
7 Agriculture/Irrigation i. GDP Agriculture
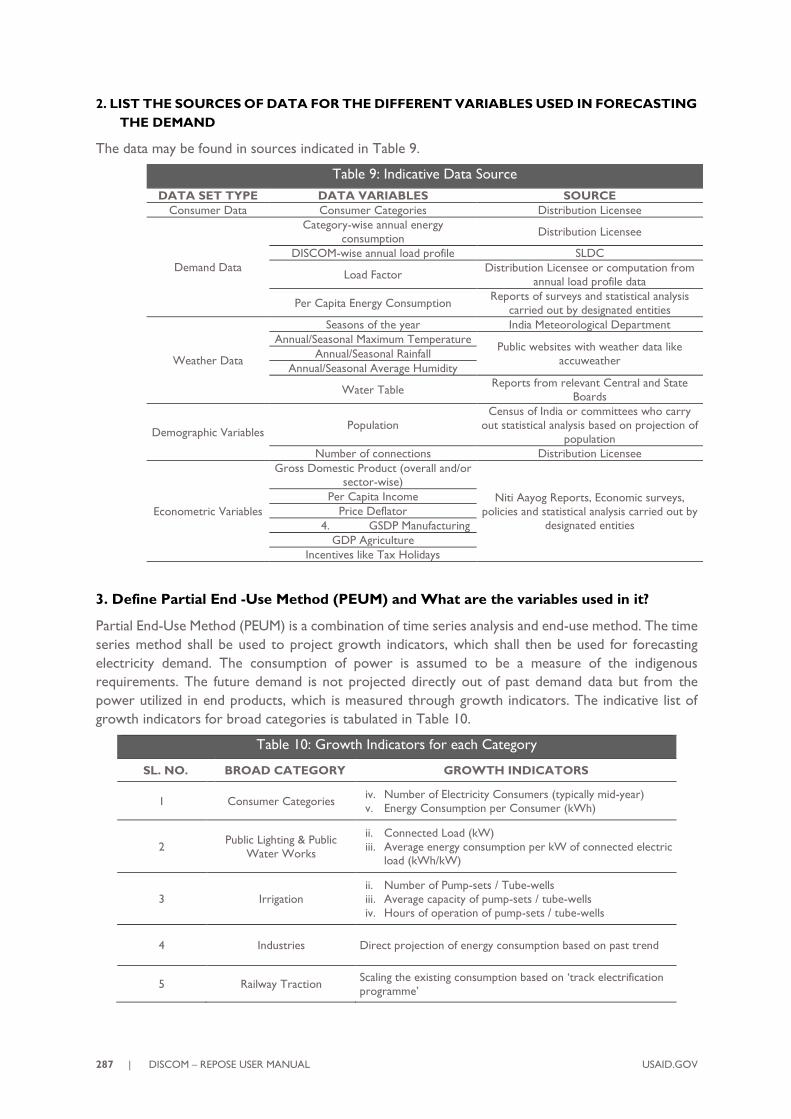
287 | DISCOM – REPOSE USER MANUAL USAID.GOV
2. LIST THE SOURCES OF DATA FOR THE DIFFERENT VARIABLES USED IN FORECASTING
THE DEMAND
The data may be found in sources indicated in Table 9.
Table 9: Indicative Data Source
DATA SET TYPE DATA VARIABLES SOURCE
Consumer Data Consumer Categories Distribution Licensee
Demand Data
Category-wise annual energy
consumption Distribution Licensee
DISCOM-wise annual load profile SLDC
Load Factor Distribution Licensee or computation from
annual load profile data
Per Capita Energy Consumption Reports of surveys and statistical analysis
carried out by designated entities
Weather Data
Seasons of the year India Meteorological Department
Annual/Seasonal Maximum Temperature Public websites with weather data like
accuweather Annual/Seasonal Rainfall
Annual/Seasonal Average Humidity
Water Table Reports from relevant Central and State
Boards
Demographic Variables Population
Census of India or committees who carry
out statistical analysis based on projection of
population
Number of connections Distribution Licensee
Econometric Variables
Gross Domestic Product (overall and/or sector-wise)
Niti Aayog Reports, Economic surveys,
policies and statistical analysis carried out by
designated entities
Per Capita Income
Price Deflator
4. GSDP Manufacturing
GDP Agriculture
Incentives like Tax Holidays
3. Define Partial End -Use Method (PEUM) and What are the variables used in it?
Partial End-Use Method (PEUM) is a combination of time series analysis and end-use method. The time
series method shall be used to project growth indicators, which shall then be used for forecasting
electricity demand. The consumption of power is assumed to be a measure of the indigenous
requirements. The future demand is not projected directly out of past demand data but from the
power utilized in end products, which is measured through growth indicators. The indicative list of
growth indicators for broad categories is tabulated in Table 10.
Table 10: Growth Indicators for each Category
SL. NO. BROAD CATEGORY GROWTH INDICATORS
1 Consumer Categories iv. Number of Electricity Consumers (typically mid-year)
v. Energy Consumption per Consumer (kWh)
2 Public Lighting & Public
Water Works
ii. Connected Load (kW)
iii. Average energy consumption per kW of connected electric load (kWh/kW)
3 Irrigation
ii. Number of Pump-sets / Tube-wells
iii. Average capacity of pump-sets / tube-wells
iv. Hours of operation of pump-sets / tube-wells
4 Industries Direct projection of energy consumption based on past trend
5 Railway Traction Scaling the existing consumption based on ‘track electrification
programme’

288 | DISCOM – REPOSE USER MANUAL USAID.GOV
Table 10: Growth Indicators for each Category
6 Bulk Supply
Based on data of specific consumers (research establishments,
institutions, hospitals, power projects, etc.) made available from
various sources or by trend analysis.
2.4.2 Power Purchase Optimization
1. What are CONTRACTS?
The Power purchase agreements between a utility and power producer are termed as contracts.
The energy procured from the seller by the Utility over different period of times is mutually agreed
and fixed.
2. What are the different types of contracts that a utility can have?
A utility may have either a short-term contract termed as “Exchange” which can be purchased to
meet hourly demand predicted by the utility or a medium-term or long-term contract called
“Procurement” that shall be used by the utility to meet the demand.
3. Can the contracts with constraints be modeled in discom-repose?
Yes. The OPERATING LIMITS of each individual unit participating in the power procurement
contract will be honored while modeling in such a way that for the committed contracts, the total
hourly production across contracts from each unit will have a lower bound that is set to minimum
generation and an upper bound set to maximum generation
4. Can I see the total energy procured via a contract annually?
Yes. It will be a user-defined value. The respective utility can fix this value while honoring the
contract in the software.
5. Does the contract come with fixed cost?
No. A contract has both fixed and variable cost for the time period the contract is active. It can be
easily configured under Procurement Module in the software.
6. How is the Open access contract treated in the software?
The Open Access contracts made directly by consumers have been accommodated in the Demand
Forecasting Module as a driver. The short-term and long-term Open Access directly contracted by
the Utilities will be configured in this PPO module.

289 | DISCOM – REPOSE USER MANUAL USAID.GOV
2.5 TROUBLESHOOTING
2.5.1 Hardware Issues
Q: Facing application performance issue
A: Server memory may be less. Ensure the following minimum requirements are met:
• RAM – 8 GB
• Hard Disk – 250 GB
• Network/Wi-Fi interface should be minimum 1 Gbps.
• Windows Pro or Windows Server Edition
2.5.2 Software Issues
Q. Discom-Repose is not getting invoked as expected?
A: The proper invocation of the Discom-Repose requires the successful installation and working of
the following software products. Check if the following software dependencies are fixed.
1. Microsoft Visual C++ Redistributable 64 bit: Check whether Microsoft Visual C++
Redistributable 64 bit is installed successfully or not.
Follow these steps to check if Microsoft Visual C++ Redistributable is installed on your
machine:
1. Go to Start>Control Panel >Programs and Features
2. Search for Microsoft Visual C++ Redistributable software.
3. If you see the software listed in the programs, then it indicates that the software is
installed on your machine.
4. If the software is not listed then download 2015 version and install or seek the support
of the DISCOM-REPOSE administrator to install.
https://www.microsoft.com/en-in/download/details.aspx?id=48145
2. Python Packages: The Python packages with the following versions essential for running
Discom-Repose may not be installed or may not be properly installed. If installed ensure if
the correct version of packages are installed on your machine. The packages with the version
are listed below:
• Tensorflow2.0
• Keras 2.3.0
• Matplotlib 3.3.2
• Datetime 4.3
• Pandas 1.1.2
• Numpy 1.19.2
• psycopg2 2.7
• statsmodels 0.12.0
• sklearn 0.23
• mlxtend 0.17.3
• ortools 7.8.7959

290 | DISCOM – REPOSE USER MANUAL USAID.GOV
Follow these steps to ensure if the packages are installed on your machine. Note: You have to
install all these packages using the PIP command. Check the installation guide for more detailed
steps.
1. Go to Start>Run>Command>Enter.
2. In the command prompt type “pip show “package name”.
Ex- pip show pandas
3. “powerlfc” Application: Check if “powerlfc” application is installed and ensure if it is
activated.
Follow the steps to find the path of the installed files.
1. Navigate to folder > Service > application.properties
2. There we can find the powerlfc path.
Q. Getting “This site can’t be reached” error message in browser when tried to open application
with valid URL?
A: Either the Tomcat server may be down or the ports using which the application connects is
blocked or not configured properly in the client property file while installing the application.
1. Tomcat Server Down: The Apache Tomcat 8 server may be down. Check if server is
up and running, if not make the server active and running. If you still face difficulties
please contact Discom-Repose administrator.
2. PORTS are not configured: In the client property file, the ports should be
configured in the right manner for the software to function efficiently.
Follow the steps to verify if the ports are configured correctly.
1. Navigate to folder > Service > application.properties
2. Navigate to folder - C:\Program Files\Apache Software Foundation\Tomcat
8.0\webapps\DISCOM-REPOSE\WEB-INF\classes\properties\database.proerties
3. Navigate to folder - C:\Program Files\Apache Software Foundation\Tomcat
8.0\webapps\DISCOM-REPOSE\WEB-INF\classes\client\client.proerties
4. If all these steps fail, contact the Discom-Repose administrator for further help.
Note: The location in which you may find the folder may be different from the illustration.
3. PORT is blocked: Sometimes the PORT may be blocked for unknown reasons. In
such cases, contact the Discom Repose Administrator.
2.5.3 Installing DISCOM-REPOSE Software WAR Files
Q. Users complain that after the deployment of the new build, they still find the old build.
A: Check the steps below:
1. Check if the latest build is present on the server with build details. Locate the build details
file by navigating to the folder:
Start>Mycomputer>C:\Program Files\Apache Software Foundation\Tomcat
8.0\webapps\DISCOM-REPOSE\Build-details.txt
2. Navigate to Tomcat 8 folder and check the “catalina.out” in the logs directory of Tomcat 8.
Check if the “*. WAR” filename is deployed or not.

291 | DISCOM – REPOSE USER MANUAL USAID.GOV
3. If both are checked and the issue still persists, then stop the Tomcat service and clear the
content of the temp directory under the work/Catalina/localhost using the
Reference command:
Follow these commands to stop and resume the service.
1. To stop the service – ctrl+c
2. To start the service – Navigate to folder C:\Program Files\Apache Software
Foundation\Tomcat 8.0\bin
3. Right click on Tomcat8x and run as administrator.
2.5.4 Login Issues
Q. I am unable to Login to DISCOM-REPOSE application.
A: Check for any of the following reasons.
1. User ID is not created – contact DISCOM-REPOSE administrator to create a valid id.
2. Password entered may be wrong –The passwords are case sensitive. Check if Caps
Lock is on. If you have forgotten the correct password, use Forgot Password option or
contact DISCOM-REPOSE administrator to reset your password and re-login with the new
password.
3. Role is not assigned – At least one role must be assigned to each of the software user.
Contact DISCOM-REPOSE administrator to check if a role is assigned and get a role
assigned for the user.
4. Schema details may be wrong – The right schema should be configured for successful
login of the users. Hence verify if the right schema is configured in the “database.properties”
file. Follow the steps to locate the file.
1. File path - Navigate to folder - C:\Program Files\Apache Software Foundation\Tomcat
8.0\webapps\DISCOM-REPOSE\WEB-INF\classes\properties\database.proerties
Q. I am unable to access DISCOM-REPOSE URL.
A: Check for the following possibilities to resolve the issue.
1. Check the URL: URL is case sensitive. Check if you have entered the URL properly.
For correct URL, contact DISCOM-REPOSE administrator.
2. Connectivity Issue: Check the connectivity of the system. Internet/intranet connection
should be working to be able to access the URL.
3. Server Availability Issue – DISCOM-REPOSE server may be down, contact DISCOM-
REPOSE administrator to check the server availability.
2.5.5 Management & Administration
Q. How do I activate my account?
A: In order to be able to access DISCOM-REPOSE, you should have valid login credentials. Contact
PRDC or the utility administrator.
What is the email address to be used for the same?
Q. I am unable to modify data (Variable/Category etc.).
A. Modifying any data in DISCOM-REPOSE requires the user to have MODIFY permission for the
respective module. For the permission, contact DISCOM-REPOSE administrator.

292 | DISCOM – REPOSE USER MANUAL USAID.GOV
Q. I am unable to view all the tabs.
A: The tabs and the buttons that can be seen by a user depend on the permissions assigned to the
user. If you are not seeing few of the tabs mean that you don’t have the permission to view those
tabs. Contact DISCOM-REPOSE administrator.
2.5.6 Module 1: Demand Forecasting
Q. I am unable to create Input Parameters.
A: Do the following to rectify the issue.
1. Creating any data in DISCOM-REPOSE requires the user to have CREATE permission for
the respective module. Check if your account has the permission to create the input
parameters. To get the permission, contact DISCOM-REPOSE administrator.
2. Ensure appropriate mapping of parameters are done in the application: The order of
creation of parameters is the following: variables→ categories→ licensees.
A Licensee is mapped to categories of consumers whereas each of the categories is in-turn mapped
with independent and dependent variables. Ensure that for any parameter that you select for creating
a scenario, appropriate categories and variables are configured and mapped.
Q. I am unable to configure variable data in decimals.
A: The value of the “Variable” may be set to “Count”. Reset the value to “Decimal”.
Q. I am unable to fetch data of bigger size.
A. Verify weather “set maxHttpHeaderSize” is set to 65536 under connector tag or not in
server.xml file. If not please update and save then restart the server or contact DISCOM-REPOSE
administrator.
Follow the steps to make changes.
1. Navigate to “C:\Program Files\Apache Software Foundation\Tomcat 8.0\conf\server.xml”
2. Stop the server using – ctlr+c
3. Server Start - Navigate to folder C:\Program Files\Apache Software Foundation\Tomcat
8.0\bin
4. Right click on Tomcat8x and run as administrator.
EDIT SCENARIO
Q. I am unable to edit variables data in License Projection page.
A. 1. Historical data cannot be edited.
2. State variables data cannot be modified in license projection data page.
Q. I am unable to see any variables in PEUM page.
A. Any variable created is ideally mapped to a category. In this case, maybe no variables are
mapped to the categories under the PEUM tab.
EXECUTE SCENARIO
Q. I am unable to Execute Demand Forecasting Scenario.

293 | DISCOM – REPOSE USER MANUAL USAID.GOV
1. Base/Raw data may not be configured and saved properly in configuration pages, (Ex:
Variable historical and future data, Drivers data, Driver data, T&D losses data etc.)
2. After creating a scenario, License and State projection data may not be configured and saved.
As License and State projection data are the mandatory data for demand forecasting scenario
execution.
3. Java spring boot Service may be down, contact DISCOM-REPOSE administrator.
4. Generally, a folder for saving the execution files is created and this folder path should be
configured in database.properties and client.properties file to ensure all the files are stored in
this location.
The files are located in the following path:
1. Database.proerties File path - C:\Program Files\Apache Software Foundation\Tomcat
8.0\webapps\DISCOM-REPOSE\WEB-INF\classes\properties\database.proerties
2. Client.proerties File Path - C:\Program Files\Apache Software Foundation\Tomcat
8.0\webapps\DISCOM-REPOSE\WEB-INF\classes\client\client.proerties
3. Navigate to both these files and check if the folder name provided for storing the
execution files is mentioned appropriately.
5. Python files may not be saved and files path is not mentioned in application.properties file.
To resolve this, do the following:
Navigate to folder > Service > application.properties
DOWNLOAD/EXPORT/VIEW SCENARIO RESULTS
Q. I am unable to download PDF document.
A. Try the following steps to download the document.
1. May be the pop-up blocker is enabled in the browser which is blocking the download.
Enable the pop-up and retry.
2. The required image files are not added in directory or directory path may be wrong.
Create a folder and update its path in property files or contact DISCOM-REPOSE
administrator.
3. Probability analysis may not be executed properly. Even though it is not mandatory for
PDF report, due to some junk file it causes issue. Please execute Probability analysis
again and save data.
2.5.7 Module 2: Integrated Resource Mapping
Q. I am unable to create input parameters?
A. Try all the steps given below to resolve.
1. Creating any data in DISCOM-REPOSE requires the user to have CREATE permission
for the respective module. For the permission, contact DISCOM-REPOSE administrator.
2. Dependencies are maintained in configuration of Input parameters. In order to create a
PLANT all required libraries need to configure.
3. In order to create portfolio, all plants need to be created.

294 | DISCOM – REPOSE USER MANUAL USAID.GOV
EDIT SCENARIO
Q. I am unable to view demand forecasted in pre-executed scenario.
A. Load profile data need to download from pre executed scenario for years configured in IRM
scenario.
EXECUTE SCENARIO
Q. I am unable to Execute IRM Scenario.
A. Try the steps given to resolve.
1. Base/Raw data may not be configured and saved properly in configuration pages
(Ex: Hydro profile data, RE profile data & Demand data etc.)
2. After creating a scenario, Hydro, Thermal, RE & Demand data may not be configured
and saved.
3. Java spring boot Service may be down, contact DISCOM-REPOSE administrator.
4. Folder need to be created in directory for execution files storing and folder path need to
be configured in database.properties and client.propertiesfile.
1. Database.proerties File path - C:\Program Files\Apache Software Foundation\Tomcat
8.0\webapps\DISCOM-REPOSE\WEB-INF\classes\properties\database.proerties
2. Client.proerties File Path - C:\Program Files\Apache Software Foundation\Tomcat
8.0\webapps\DISCOM-REPOSE\WEB-INF\classes\client\client.proerties
5. Engine path is not mentioned in application.property file.
6. Navigate to folder > Service > application.properties
DOWNLOAD/EXPORT/VIEW SCENARIO RESULTS
Q. I am unable to view graphs/data in result screen even after successful execution?
1. May be py.db property file is not configured with valid database and schema details.
Navigate to folder > IRM_Engine > pydb.properties
2. May be output parser is missing from the directory, contact DISCOM-REPOSE
administrator.
Output parser file path
Navigate to folder > IRM_Engine > ro_output_parser
Q. I am unable to download PDF/text document?
1. May be browser is blocking the pop up, please enable the pop up.
2. Required image files are not added in directory or directory path may be wrong. Create a
folder and update its path in property files or contact DISCOM-REPOSE administrator.
1. File path - database.proerties File path - C:\Program Files\Apache Software
Foundation\Tomcat 8.0\webapps\DISCOM-REPOSE\WEB-
INF\classes\properties\database.proerties
3. Execution should be successful.
Q. I am unable to download and export load profile templates?

295 | DISCOM – REPOSE USER MANUAL USAID.GOV
The size of the memory configured for Apache tomcat server cache/pool memory may be less.
Reconfigure the memory with required memory size and save the settings. Or else contact the
Discom Repose administrator.

296 | DISCOM – REPOSE USER MANUAL USAID.GOV
B. HARDWARE REQUIREMENTS
1. HARDWARE REQUIREMENTS
This section includes the system requirements table that lists out all the system requirements.
Table 11 DISCOM-REPOSE System Requirements Information
SI.NO ITEMS APPLICATION SERVER DATABASE SERVER
1 RAM 16GB 32 GB RAM
2 CORE QUAD-CORE QUAD-CORE
3 OS WINDOWS SERVER 2008 WINDOWS SERVER 2012 R2
standard/2016/2019
4 DATABASE ----------------- POSTGRESQL V.10
2. UNBOXING SOFTWARE – INSTALLATION & DEPLOYMENT
2.1.1 Software Requirements
The software requirements of DISCOM-REPOSE are discussed in this section. These are
mandatory and should be installed prior to the installation of DISOM – REPOSE software
for its successful installation and usage.
1. Download the Java SE Runtime Environment 8 (exe) for Windows operating system using
the following link.
https://www.oracle.com/technetwork/java/javase/downloads/jre8-downloads-
2133155.html
Note: Accept the license agreement term and remember to choose a compatible
version 32/64 bit for your machine.
2. Check for downloaded file and double-click on the .exe file to initiate the installation.
Figure 314. Download JAVA JDK
3. The Wizard to guide the Installation process appears. Click on Install to continue.
Note: If you wish to continue the installation with the default folder, continue from

297 | DISCOM – REPOSE USER MANUAL USAID.GOV
Step 4The Java Setup - Progress page appears.
Figure 315. Java Installation Begins
Follow these steps to Change the Destination Folder.
If you wish to change the destination folder, follow the steps below.
a. To change the destination folder, click on Change destination folder check-box.
b. Click on Install button. The Change destination folder page appears.
Figure 316. Change Location to Install Java in a Different Folder
c. The Browse For Folder pop-up appears. Click on button to
change the folder.
Note: If an alternative folder exists, you could select that folder and click OK button.
Otherwise, select the drive and click on Make New Folder button and create a folder.

298 | DISCOM – REPOSE USER MANUAL USAID.GOV
Figure 317. Browse For Folder
Figure 318. Make New Folder

299 | DISCOM – REPOSE USER MANUAL USAID.GOV
d. Click on OK. The Java Setup Destination Folder reflects the alternative folder.
Figure 319. Java Installation Folder Changed
e. Click on Next button.
4. The Java Setup - Progress page appears.
Figure 320. Installing Java Page
5. The Java Setup - Complete page appears with a success message You have
successfully installed Java.

300 | DISCOM – REPOSE USER MANUAL USAID.GOV
Figure 321. Java Installation Successful Page
This section gives you the steps to install TOMCAT V 8.0.x (64 bits).
1. Download the TOMCAT V 8.0.26 (exe) for Windows operating system using the
following link.
https://archive.apache.org/dist/tomcat/tomcat-8/v8.0.26/bin/apache-tomcat-8.0.26.exe
2. Check the downloads for the file and double-click on the exe file. The Apache Tomcat
Setup page appears.
Figure 322. Apache Tomcat Setup
3. Click on Next button. The License Agreement page appears.

301 | DISCOM – REPOSE USER MANUAL USAID.GOV
Figure 323. License Agreement
4. Click on I Agree button.
Figure 324. Choose Components Page
5. Select the necessary components by checking the check-boxes or leave it with the default
as per your requirements and click on Next button.

302 | DISCOM – REPOSE USER MANUAL USAID.GOV
Figure 325. Configuration Settings
6. Click on Next button. The Java Virtual Machine Path Selection page appears.
Figure 326. Java Virtual Machine Page
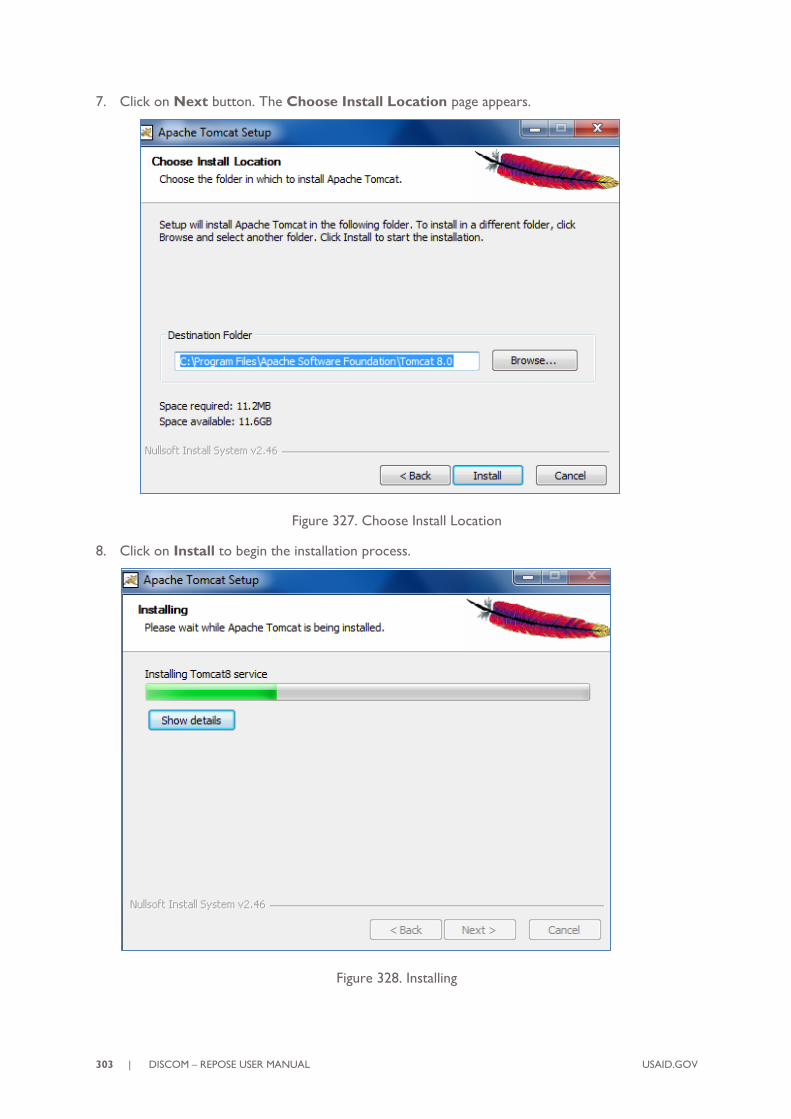
303 | DISCOM – REPOSE USER MANUAL USAID.GOV
7. Click on Next button. The Choose Install Location page appears.
Figure 327. Choose Install Location
8. Click on Install to begin the installation process.
Figure 328. Installing

304 | DISCOM – REPOSE USER MANUAL USAID.GOV
Note: You can change the destination folder using the Browse button to select another
location.
Figure 329. Setup Completed Page
9. The Completing Setup page appears. Click on Finish button to complete the task.

305 | DISCOM – REPOSE USER MANUAL USAID.GOV
This INSTALLING PYTHON V3.7.3 section gives the steps to install Python V 3.7.3 for
Windows 7 and above versions.
Check the Windows processor version if its 32 or 64 bits before installing python. Choose
the right version of Python based on the bit-system on your machine. Ideally, the 3.7.3
VERSION (62 BIT) IS INSTALLED IN THIS SCENARIO.
Follow the steps to install Python.
1. Go to www.python.org.
Figure 330. Python Website
2. Click on Downloads tab.
Figure 331. Download Tab
3. Click on the Python 3.7.3 button under Download for Windows.

306 | DISCOM – REPOSE USER MANUAL USAID.GOV
Figure 332. Downloading python-3.7.2.exe
4. Open the location where the file has downloaded.
Figure 333. Location of the Downloaded File
5. Double-click on the folder. The Open File-Security Warning Dialog appears.
Figure 334. Run Dialog

307 | DISCOM – REPOSE USER MANUAL USAID.GOV
6. Click on Run. The Install Python 3.7.3 (64-bit) dialog appears.
Figure 335. Python Setup Dialog-A
7. Select Customize installation option.
Figure 336. Python Setup Dialog-B

308 | DISCOM – REPOSE USER MANUAL USAID.GOV
8. Click on Next button. The Python Setup-Advanced Options dialog appears.
Prerequisite
Before selecting the customized location, ensure you create a folder “Python” in a
location of your choice. In this illustration, the Python folder is created in the following
location.
C:\Python
Figure 337. Create a Python Folder in C Drive
Figure 338. Advanced Options- Customize Install Location

309 | DISCOM – REPOSE USER MANUAL USAID.GOV
9. Click on Browse button to select the Python folder in the following path: C:\Python
Figure 339. Select Python Folder
10. Click on Install button. The Setup Progress dialog appears.
Figure 340. Setup Progress
11. Upon completion of installation the Setup Successful dialog appears.

310 | DISCOM – REPOSE USER MANUAL USAID.GOV
Figure 341. Setup Successful
12. Post installation the Python 3.7 (32-bit) application option appears in the Windows
start menu.
Figure 342. Python in the Windows - Start Menu
13. Go to My computer> Right-click > Properties>Advanced System Settings.

311 | DISCOM – REPOSE USER MANUAL USAID.GOV
Figure 343. Windows Advanced Settings
14. The Advanced tab appears.
15. Click on the Environment Variables button. The Environment Variables dialog
appears.
16. Click on New button. Enter the New User variable. Copy the path in which the Python
directory is created as shown in the figure below. Click on OK.
Figure 344. Python Folder
17. Click on New button. Enter the New User variable. Copy the path in which the Python
Scripts directory is created as shown in the figure below. Click on OK.

312 | DISCOM – REPOSE USER MANUAL USAID.GOV
Figure 345. New User Variable
18. In the system variables section, select the Path option and click on Edit button.
Figure 346. Edit Environment Variables
19. The Edit System Variable dialog appears.
Set the following environment variables as shown below.
1. Copy and paste the path of the Python folder and the Python Scripts folder
separated by a semicolon as shown below and append it with the existing path.

313 | DISCOM – REPOSE USER MANUAL USAID.GOV
Figure 347. Edit System Variable Dialog
2. Click on OK button. Thus, the environment variables are set successfully.

314 | DISCOM – REPOSE USER MANUAL USAID.GOV
1. Go to Windows> Start > Command Prompt (cmd). At the prompt, type python.
The information about python installed appears. This ensures if installation of python is
successful or not.
Figure 348. Python - Installation check
2. Install the image package using the following command.
C:\Users\divyakala.r\pip install image
3. The image package gets installed as shown in the figure below.
Figure 349. Image Package Installation
C:\Users\divyakala.r\pip install numpy

315 | DISCOM – REPOSE USER MANUAL USAID.GOV
4. Install the numpy package using the following command.
5. The numpy package gets installed as shown in the figure below.
Figure 350. Numpy Package Installation
6. Install the MATPLOTLIB package using the following command.
C:\Users\divyakala.r\pip install matplotlib
7. The MATPLOTLIB gets installed as shown in the figure below.
Figure 351. Matplotlib Package Installation
8. Install the PANDAS package using the following command.
C:\Users\divyakala.r\pip install pandas
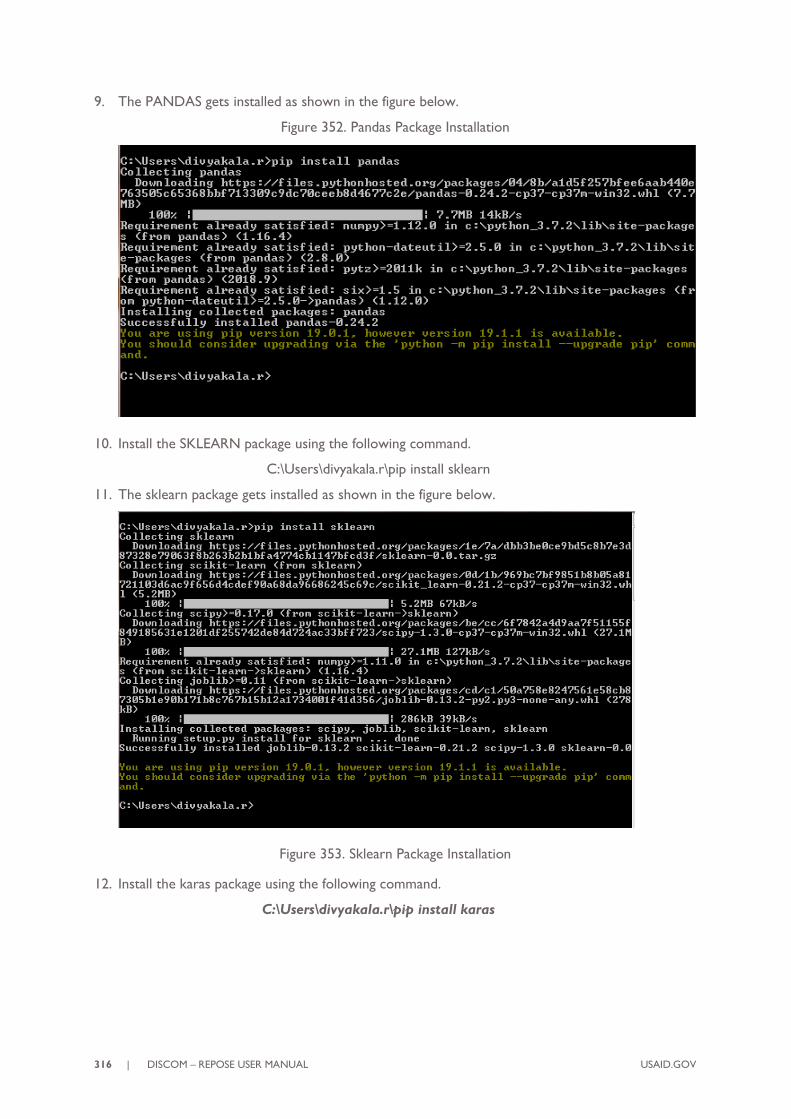
316 | DISCOM – REPOSE USER MANUAL USAID.GOV
9. The PANDAS gets installed as shown in the figure below.
Figure 352. Pandas Package Installation
10. Install the SKLEARN package using the following command.
C:\Users\divyakala.r\pip install sklearn
11. The sklearn package gets installed as shown in the figure below.
Figure 353. Sklearn Package Installation
12. Install the karas package using the following command.
C:\Users\divyakala.r\pip install karas

317 | DISCOM – REPOSE USER MANUAL USAID.GOV
13. The karas package gets installed as shown in the figure below.
Figure 354. Karas Package Installation
14. Install the statsmodels package using the following command.
C:\Users\divyakala.r\pip install statsmodels
15. The statsmodels package gets installed as shown in the figure below.
Figure 355. Statsmodels Package Installation
16. Install the mlxtend package using the following command.
C:\Users\divyakala.r\pip install mlxtend
17. The mlxtend package gets installed as shown in the figure below.

318 | DISCOM – REPOSE USER MANUAL USAID.GOV
Figure 356. Mlxtend Package Installation
18. Install the TensorFlow package using the following command.
C:\Users\divyakala.r\pip install TensorFlow

319 | DISCOM – REPOSE USER MANUAL USAID.GOV
19. The TensorFlow package gets installed as shown in the figure.
Figure 357. TensorFlow Package Installation
20. Install the ORTOOLS package using the following command.
C:\Users\divyakala.r\pip install ortools
21. The “OR Tools” package gets installed on the machine.
Figure 358. OR Tools Package Installation

320 | DISCOM – REPOSE USER MANUAL USAID.GOV
22. Install the ORTOOLS package using the following command.
C:\Users\divyakala.r\pip install xlsxwriter
23. The “xlsxwriter” package gets installed.
Figure 359. "xlsxwriter" Package Installation
24. Thus all the essential python packages are installed successfully.
Note: To check if all the packages are installed properly, run this command and verify the
list of packages installed.
1. Run → cmd → pip list

321 | DISCOM – REPOSE USER MANUAL USAID.GOV
Figure 360. Lists all Libraries
Alternatively, run the following command
Import <package name>
Figure 361. Check List of Libraries

322 | DISCOM – REPOSE USER MANUAL USAID.GOV
The steps to be followed for installing POSTGRESQL V.10 SERVER are provided in this
section.
Ensure operating system Windows 32/64 bit is installed on the server.
Follow the steps to install PostgreSQL Server.
1. Download the PostgreSQL Server version 10.5-2 and above for Windows 32/64 bit.
https://www.enterprisedb.com/thank-you-downloading-
postgresql?anid=1256623 (32 bit)
https://www.enterprisedb.com/thank-you-downloading-
postgresql?anid=1256624 (64 bit)
2. Login into the Windows server check PostgreSQL setup file is available.
3. Double click on the PostgreSQL 10.6-1 setup file. Following screen will appear to install
Microsoft Visual C++ 2013 Redistributable.
Figure 362. PostgreSQL Server Setup Progress Page
4. The first page of the Setup wizard appears. Click on Next button on this screen.

323 | DISCOM – REPOSE USER MANUAL USAID.GOV
Figure 363. Setup –PostgreSQL Page
5. The “Installation Directory” page appears. Enter a different directory location or
accept the default, and then click Next button.
Figure 364. Installation Directory Page
6. The Select Components page appears.

324 | DISCOM – REPOSE USER MANUAL USAID.GOV
Figure 365. Select Components Page
7. Uncheck the Stack Builder option and click on Next button.
Figure 366. Remove Stack Builder Page
8. The Data Directory page will appear. Enter a different directory or accept the default,
and then click Next button.

325 | DISCOM – REPOSE USER MANUAL USAID.GOV
Figure 367. Data Directory Page
9. The Password page appears. Enter the password and press Next button.
Figure 368. Password Page
10. The Port setup page appears. Enter the port or accept the default port (5432) and click
Next button.

326 | DISCOM – REPOSE USER MANUAL USAID.GOV
Figure 369. Setup the Port Page
11. The Advanced Options page appears. Select the required locale or accept the defaults
and click on Next button on this page.
Figure 370. Advanced Options Page
12. The Pre Installation Summary page appears. Click on Next button.

327 | DISCOM – REPOSE USER MANUAL USAID.GOV
Figure 371. Pre Installation Summary Page
13. The Ready to Install page appears. Click on Next button to continue.
Figure 372. Ready to Install Page

328 | DISCOM – REPOSE USER MANUAL USAID.GOV
14. The Installing page appears showing the progress of installation.
Figure 373. Installation in Progress Page
15. After installation is completed, “Completing the PostgreSQL Setup Wizard” page
appears. Uncheck the Stack Builder check box and click on Finish button. Installation
gets completed successfully.
Figure 374. Installation Completed

329 | DISCOM – REPOSE USER MANUAL USAID.GOV
This section gives you the steps to create the database for DISCOM -REPOSE application.
Ensure PostgreSQL Server V.10 is installed.
1. Click All Programs → PostgreSQL 10 → pgAdmin 4.
Figure 375. PostgreSQL Server V.10
2. Double-click on PostgreSQL 10. The Connect to Server pop-up to enter password
(given while installing) appears. Enter the Password.
Figure 376. Connect to Server with a Password
3. Follow these steps to create the Tablespace.
1. Right-click Tablespace (2) → Create → Tablespace…
Figure 377. Create Tablespace

330 | DISCOM – REPOSE USER MANUAL USAID.GOV
2. The Create – Tablespace window appears. Enter Tablespace name in General
tab.
Figure 378. Create Tablespace – General Tab Details
3. In the Definition tab enter location of the tablespace in the file system. Click on
the Save button to complete the creation.
Figure 379. Tablespace Creation- Definition Tab Details
This section gives the steps to create database.
1. In pgAdmin 4, double-click PostgreSQL 10. Enter password and then right-click on
Databases and click on create then on Database…
Figure 380. Create Database

331 | DISCOM – REPOSE USER MANUAL USAID.GOV
2. The Create – Database page appears. Enter Database name in General tab.
Figure 381. Create Database - General Tab Details
3. In Definition tab enter Encoding, Template, Tablespace, Collation, Character
Type, and Connection Limit. Click Save button to create the Database.
Figure 382. Create Database - Definition Tab Details
4. Now click on the newly created database. Database successfully created.
5. The new Database page appears.

332 | DISCOM – REPOSE USER MANUAL USAID.GOV
Figure 383. DISOM-REPOSE Database
This section gives the steps to create a new user.
Ensure that user is able to connect by PostgreSQL admin users “postgres”.
Follow the steps to create a user.
1. Right click on Login/Group Roles (6), then select Create, now select Login/Group
Role…
Figure 384. Create - Login/ Group Role
2. The Create – Login/Group Role… pop-up appears. In General tab enter Name.
Click on Save button.

333 | DISCOM – REPOSE USER MANUAL USAID.GOV
Figure 385. Create User - General Tab Details
3. Click on the Definition tab. Enter the password details for the user. Click on Save
button.
Figure 386. Create User - Definition Tab Password Details
4. In the Privileges tab select yes for Can Login? and click Save button. The user is
created.

334 | DISCOM – REPOSE USER MANUAL USAID.GOV
Figure 387. Create User - Privileges Tab Details
This section gives the steps to create a Schema.
Ensure that user is able to connect by PostgreSQL admin users “postgres”.
Follow these steps to create a Schema.
1. Right click on Schemas (1) , then select Create, now select Schema…
Figure 388. Create Schema
2. The Create - Schema pop-up appears. Enter the Name and select the owner of the
schema (mipso01). Click on Save button.

335 | DISCOM – REPOSE USER MANUAL USAID.GOV
Figure 389. Create Schema - General Tab Details
3. Thus the Tablespace, Database, User, and Schema get created.

336 | DISCOM – REPOSE USER MANUAL USAID.GOV
Figure 390. PostgreSQL Installation Completed
This section gives the steps to take back-up of the database and steps to perform a
restoration.
STEPS TO TAKE A BACKUP
This section gives you steps to take backup of the database.
The user should have access and rights to schedule the task on Windows system for regular
backup using script.
1. Create task for the provided script “AutoBackupForPostgreSQL.vbs”

337 | DISCOM – REPOSE USER MANUAL USAID.GOV
pg_dump.exe –h localhost –p 5432 –U postgres –F c -b --section=pre-data --
section=data --section=post-data -n <Schema Name> -d <Database Name > -f
<File Name>
Or user can run the following from the command prompt.
Note: Change the <Schema Name>, <Database Name> and <File Name> as per the
requirement.
STEPS TO RESTORE BACKUP
Execute the following command from the command prompt
Note: Change the <File Name> as per the requirement.
2.1.1 Installing DISCOM-REPOSE Software
This section gives you steps to install the mandatory software products, libraries, war files
and running environment settings that are essential for smooth installation, deployment and
running of the DISCOM REPOSE software.
This section guides you with steps to deploy the DISCOM-REPOSE WAR files on the client
machine.
Follow these steps to install the war files.
1. Copy DISCOM-REPOSE.war file to the following Tomcat directory. (image to be
replaced)
<Tomcat installed directory>\Tomcat 8.0\webapps\
Figure 391. Tomcast Installation Directory
2. Navigate to the “bin” folder under “Tomcat 8.0” and double-click “Tomcat8.exe”.
pg_restore.exe -h localhost -p 5432 -U postgres -vF c -j 2 -f <File Name>
DR_WAR

338 | DISCOM – REPOSE USER MANUAL USAID.GOV
Figure 392. Tomcat Folder
3. The command prompt appears to deploy the war file.
Figure 393. Command Prompt to Deploy
4. Once the war is deployed, the command prompt window closes. Navigate to
“webapps” folder and ensure if DISCOM-REPOSE folder is created. (Image to be
replaced)

339 | DISCOM – REPOSE USER MANUAL USAID.GOV
Figure 394. DISCOM Folder
5. Configure the database details by navigating to the following folder under “webapps”
MiPSO >> WEB-INF >> “classes” file >>”database.properties”.
Figure 395. Configure the Database Properties File
6. Edit the values highlighted in red according to the DB details and save the file.
Figure 396. Edit the Property Values according to DB details

340 | DISCOM – REPOSE USER MANUAL USAID.GOV
Note: Create a folder in any drive other than C drive on your machine to save the
reports. Note the filepath.
7. Edit the report variable with the filepath of the reports folder as shown below.
Figure 397. Configuring Reports Folder
8. Edit the following values highlighted in red according to the details to execute the
studies.
Figure 398. Study Execution Results Location Configuration
9. Update the following parameters required.
10. Once the property files are configured, navigate to “bin” folder in Tomcat directory
and start the service by executing the “Tomcat8w.exe”.
Figure 399. Start Tomcat File
Follow these steps to remove war files.
1. Go to Tomcat folder (if tomcat is not installed, refer section 3.2). Navigate to the
tomcat directory:
<Tomcat installed directory>\Tomcat X.X\bin
2. Once navigated, run “Tomcat8w.exe”.
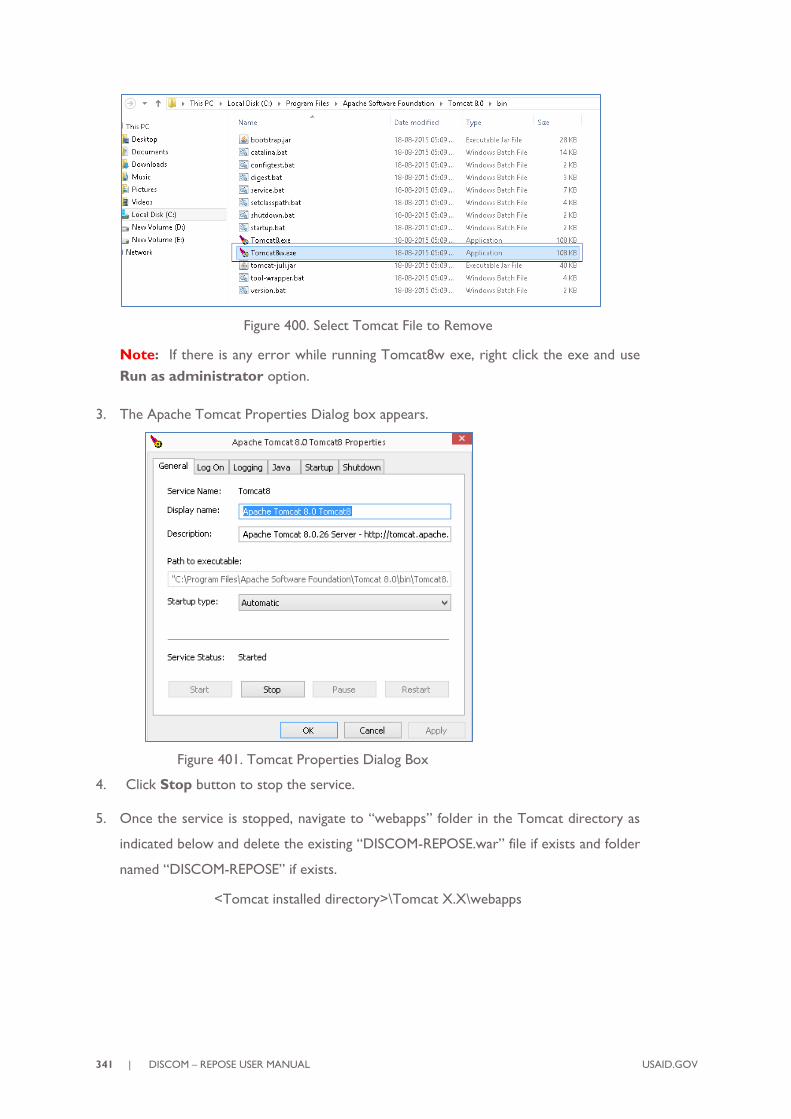
341 | DISCOM – REPOSE USER MANUAL USAID.GOV
Figure 400. Select Tomcat File to Remove
Note: If there is any error while running Tomcat8w exe, right click the exe and use
Run as administrator option.
3. The Apache Tomcat Properties Dialog box appears.
Figure 401. Tomcat Properties Dialog Box
4. Click Stop button to stop the service.
5. Once the service is stopped, navigate to “webapps” folder in the Tomcat directory as
indicated below and delete the existing “DISCOM-REPOSE.war” file if exists and folder
named “DISCOM-REPOSE” if exists.
<Tomcat installed directory>\Tomcat X.X\webapps

342 | DISCOM – REPOSE USER MANUAL USAID.GOV
Figure 402. War File to be Removed
Note:
1. Ignore this step if this is the first time installation.
2. After the removal of the old files, the new war can be installed following the steps
described in section 2.1.1.1 SETTING UP WAR FILES AND PROPERTIES

343 | DISCOM – REPOSE USER MANUAL USAID.GOV