Annual report and accounts 2010 - Aviva plc
364
Aviva plc Annual Report and Accounts 2010 Putting you in the picture
-
Upload
khangminh22 -
Category
Documents
-
view
0 -
download
0
Transcript of Annual report and accounts 2010 - Aviva plc

Aviva plcAnnual Report and Accounts 2010
Putting you in the picture

Front cover imagery: Extraordinary portraits of some of the extraordinary customers and employees who are celebrated in our You Are The Big Picture campaign. Our business isn’t about policies. It’s about people.
www.youarethebigpicture.com
Read here… 17 Performance review
75 Corporate responsibility
93 Governance
137 Shareholder information
167 Financial statements IFRS
315 Financial statements MCEV
353 Other information
…or go online
Corporate responsibility report onlineIn our online Corporate responsibility report you can fi nd out more about our commitment to acting as a responsible member of the international business community.
You can view our Corporate responsibility report here
www.aviva.com/cr2010
2010 Annual report and accountsYou can fi nd more detailed information regarding Aviva’s performance during 2010 from our online Annual report and accounts. Providing our reports electronically online allows us to reduce the paper we print and distribute.
Visit Aviva
www.aviva.com/reports

01
Andrew MossGroup chief executive
• North America • Asia Pacific
• UK • Europe
£47.1bnWorldwide sales
2010
Sales
UK 35 Europe 46North America 14Asia Pacific 5
%
••••••
£2.55bnIFRS GroupOperating
profit
IFRS Group Operating profit %
UK 42 Europe 43 North America 11 Asia Pacifi c 1 Aviva Investors 3••
••••••
Aviva at a glance
Aviva plc Annual Report and Accounts 2010 Overview
“In good and bad times people need to feel secure. As a leading insurance company, we’re here to help create prosperity and peace of mind for our customers.”
What we do
Aviva is the world’s sixth-largest insurance group. Our premium income and investment sales were £47.1 billion in 2010. We provide more than 53 million customers with insurance, savings and investment products. We are the UK’s largest insurer and one of Europe’s leading providers of life and general insurance. We combine strong life and general insurance and asset management businesses under a single strong brand, focused on providing customers with prosperity and peace of mind. This combination provides us with reliable revenues from diverse sources and helps us to fund and grow our business more efficiently.
Aviva worldwide
Our key statistics
UK and Europe – the world’s largest life and pensions markets UK
42% of Group operating profits 12 major centres in the UK
Europe
43% of Group operating profits Belgium*, Czech Republic, France,
Hungary, Ireland, Italy, Lithuania, Netherlands*, Poland, Romania, Russia, Slovakia, Spain, Turkey (Delta Lloyd operations*)
North America 11% of Group operating profits Canada, United States
Asia Pacific
1% of Group operating profits China, Hong Kong, India, Indonesia,
Malaysia, Singapore, South Korea, Sri Lanka
Aviva Investors
3% of Group operating profits
53.4m customers
45,000 Employees
300 years of heritage
£260bn Aviva Investors funds under management (as at 31 December 2010)
25.5p 2010 full year dividend
26.1% Growth in operating profit (as at 31 December 2010)
£2.55bn IFRS Group operating profit
14.8% IFRS return on equity (as at 31 December 2010)

Aviva plc Annual Report and Accounts 2010
We believe in people not policies
02
Our approach We help protect almost every aspect of peoples’ lives; their homes, cars, families, health and their financial futures. For over 300 years, we’ve helped people protect what they have today and to plan, invest and save for their futures. It’s our ability to understand and meet our customers’ needs that has led more than 53 million people, and one in three UK households to put their trust in us. We’re there for our customers, we’re flexible and we’re committed to acting in their best interests. We know that when they do business with Aviva, they want it to be simple and that, if something does go wrong, we’ll fix it. Everyone in our business understands the difference they can make to peoples’ lives, particularly in times of need.
Our commitments Our customers For us, insurance is about people, not policies. That means responding to our customers with thought, care and understanding. We want people to choose us and stay with Aviva throughout their lives because they know we’ll be there for them – and they like dealing with us.
Listen to customer Jack Dobson discuss his experience Watch video here
youarethebigpicture.com
Our people We’re determined to stand apart from other financial services companies. We’ll only achieve this if our people are proud to work for Aviva, so we listen to them, respect them and recognise the personal contribution they make to our business.
Listen to Gael Roux discuss his experience Watch video here
youarethebigpicture.com
Our business Our business helps our customers to manage the risks of everyday life and protects them long into the future. We must be there for them throughout their lives and beyond, so it’s crucial we are a sustainable and profitable business, for the mutual benefit of our customers and our shareholders.
Society We want to encourage more people to secure their financial futures. We’re committed to working with our customers, Governments, regulators, charity partners and business partners to find solutions that increase the financial well- being of both individuals and society.
Listen to Kali’s story from the Street to School project Watch video here
youarethebigpicture.com

www.youarethebigpicture.com
Aviva at a glance
03
Aviva plc Annual Report and Accounts 2010
We believe in people not policies continued
“You did a super job for us. We’ll never forget you, ever.” On a Saturday afternoon, Sylvia Cooper was rushed into hospital for a life-saving operation. First thing on Monday morning her husband Allen phoned Aviva. He was a little apprehensive because he had not been able to clear the operation costs beforehand. Aviva advisor Hayley Gerrard told him not to worry. She took it upon herself to make sure that all the expenses were cleared and called Allen daily to check on Sylvia’s progress.
“I said to my son before I called, I just hope I don’t get a jobsworth,“ Allen recalls. “But I didn’t. I got Hayley – an angel.” At Aviva, we know insurance is not about policies. It’s about recognising the people behind them. That’s why our ‘You are the Big Picture’ campaign, through giant portraits and online stories, celebrated the people who are most important to us – our customers and our employees.

UK
Mark HodgesChief executive, Aviva UK
Europe
Igal MayerChief executive,
IFRS operating profit £m
0
500
1,500
1,000
2,000
10
1,41
1
06
1,77
7
07
1,12
6
08
1,3
77
09
1,16
5
IFRS operating profit £m
0
400
1,200
800
1,600
10
1,43
4
06
1,05
0
07
1,19
7
08
1,1
41
09
1,19
6
Aviva Europe
Aviva plc Annual Report and Accounts 2010
Aviva worldwide
04
Aviva is the leading insurance brand and customer franchise in the UK. Our combination of life, health and general insurance, together with motoring services from RAC, is unique in its scale and breadth in the UK market. We are the UK’s largest insurer with 19 million customers, and one in three households has a relationship with us. Customers can choose to buy our products through intermediaries, our corporate partners or from Aviva direct and we have become the partner of choice for many of the UK’s biggest organisations. We are ranked as one of the UK’s top ten most valuable brands. In 2010 we delivered a very strong result, with momentum building in profit and sales and improved customer service. We also made good progress in bringing our life and general insurance businesses closer together and were successful in significantly extending our distribution reach. We remain focused on improving efficiency and service across our UK operations as we grow, which will bring benefits to customers and shareholders.
Highlights In 2010 we delivered total IFRS operating
profit growth of 21% to £1,411 million We achieved record operating profits in
our life business up 26% to £850 million with sales up 19% to £11,846 million
Our UK general insurance profits increased 8% to £579 million with sales increasing each quarter during 2010
We were voted the UK’s top life, general and health insurer by insurance intermediaries, and customer service improved across our businesses
Aviva provides 18 million customers across Europe with life, general and health insurance products, through our multi-channel distribution network. We are creating one market-leading, pan-European business to capitalise on the opportunities in the world’s largest life and pensions market. By bringing together our European markets to form one business, we are able to operate more efficiently, and take full advantage of our scale and market-leading position. As we have rationalised our product suite and established new pan-European centres of excellence, we have adopted best practice across the region, enhancing Aviva’s customer-focus and multi-channel distribution. Aviva is a clear leader in bancassurance in Europe, with 55 relationships across the region. In 2010 we identified an annual pension savings gap of €2.4 trillion1 in Europe, demonstrating the size and potential of the European pensions market and the significant opportunity that exists for Aviva.
1 Includes the 27 countries of the European Union and the countries of Russia and Turkey
Highlights We achieved a strong performance across all major markets in 2010 with 20% growth in IFRS operating profit to £1,434 million
We are a clear leader in bancassurance, driving sales growth of 9% during 2010
Our Quantum Leap transformation plan, a simplified product set and management focus on cost discipline have enabled run costs to be maintained level with 2009
Customers
18 million Delta Lloyd: 4.4 million
Customers
19 million

North America
Richard HoskinsChief executive, Aviva North America
Asia Pacifi c
Simon MachellChief executive, Aviva Asia Pacifi c
Aviva at a glance
IFRS operating profit £m
0
100
300
200
400
10
376
06
161
07
229
08
14
9
09
213
IFRS operating profit £m
-30
-20
20
30
-10
0
10
40
1006
-5
07
-14
08
-21
09
Excludes the Australian business sold on 1 October 2009
3132
Aviva plc Annual Report and Accounts 2010
Aviva worldwide continued
05
The North America region is home to two of the world’s largest and richest economies. We are focusing on building our position and competitiveness in these markets to actively capitalise on Aviva’s financial strength and leverage our strong high quality relationships with our distribution partners. Aviva North America has four million customers and operates through two businesses - our life and annuity insurance business in the United States and general insurance business in Canada. This gives us access to a population with attractive demographics and a growing desire for products that offer peace of mind. We continue to grow our share of the Group’s operating earnings, through active management of our spread and insurance underwriting businesses together with disciplined cost management. We have a clear focus on delivering compelling propositions supported by enhanced service to our customers and also strengthening and expanding our successful distribution relationships throughout the region.
Highlights In 2010 we delivered strong results
growing our total regional IFRS operating profit by 77% to £376 million
Total sales in the year grew to £6.7 billion Our life and annuity business IFRS profits
in the US more than doubled In Canada, our general insurance
operating profit increased 54% to £222 million
We operate across Asia Pacific through joint ventures and wholly-owned operations and provide more than 8 million customers with life, general and health insurance products. The opportunity for Aviva to create franchise value through organic growth in Asia is significant. Robust economic growth, markets with favourable demographics and low life and pension penetration offer attractive long-term prospects in the region. China and India have large populations and relatively high economic growth and are capable of generating a significant proportion of our future new business in Asia. We are focusing on capitalising on these opportunities and continuing to improve our performance. We have taken action to reshape our product portfolio towards higher-margin products. Our multi-distribution platform is being reinforced by strengthening relationships with our bank partners. With the strengthening of our multi-channel distribution capability and product portfolio management we are well positioned to benefit from the region’s long-term growth potential.
Highlights Our IFRS operating profit for 2010 was
£31 million2 Total sales for the year increased 25% to
£1,911 million2 (excluding Aviva Investors Australia sales)
We are the partner of choice for more than 50 prestigious banks across the region including DBS (South East Asia’s largest bank), Woori (Korea’s largest bank), CIMB (Malaysia’s second-largest bank), IndusInd Bank and Punjab Sind Bank in India, as well as over ten banks in China
2 Excludes the Australian life business that was sold on 1 October 2009
Customers
4 million
Customers
8 million

Aviva Investors
Alain DromerChief executive, Aviva Investors
IFRS operating profit £m
0
40
120
80
160
10
100
06
112
07
147
08
11
4
09
115
Aviva plc Annual Report and Accounts 2010
Aviva worldwide continued
06
Aviva Investors is the integrated asset management business of the Aviva Group, managing funds for Aviva and a growing range of third party clients. Our strategy for growth is focused on leveraging our Aviva parentage and insurance heritage to further increase third-party assets under management. We enjoy a close and mutually beneficial relationship with Aviva, supported by the financial strength and global brand presence of the Group and, in return, delivering investment know-how, strong and sustainable returns and support financial risk management initiatives. We have made considerable progress in developing the infrastructure necessary to meet our objectives and are seeing the benefits of this through improved sales performance. Our focus in 2011 will be on accelerating growth in third-party sales to deliver improved profitability.
Highlights Focus on our customers enabled us to
deliver improvements in our internal and external client service rankings in 2010
Our investment performance is ahead of target with 73% of funds where a benchmark is specified, beating their benchmark over one and three years (equally weighted)
We achieved strong growth in net funded external sales (excluding liquidity funds), up from an outflow of £236 million in 2009 to inflows of £2,364 million (at 31 December 2010)
Our role in the community As a leader in the insurance industry we have an important role to play in partnership with governments to address the challenge of long-term savings and pensions, and more broadly with climate change.
Our global ‘Street to School’ programme helps our charity partners across the world make a real difference to children who are alone and at risk on the streets
Last year our staff volunteered over 57,250 hours of their time
In 2010 we invested £11.4 million in community and charity projects
We are carbon neutral worldwide focusing firstly on reduction and then using offsetting schemes – just one step in our programme to reduce our impact on the environment
We are working hard to ensure we have an effective gender and diversity mix at all levels within the organisation
We are working with the United Nations on its sustainable stock exchange initiative, established to encourage stock listing organisations to require inclusion of sustainability-related information in annual reporting
www.aviva.com/corporate-responsibility/street-to-school/
Assets under management
£260 billion

07
Performance reviewCorporate responsibilityGovernanceShareholder informationFinancial statements IFRSFinancial statements MCEVOther information
Other inform
ationFinancial statem
ents MCEV
Financial statements IFRS
Shareholder information
Governance
Corporate responsibilityPerform
ance reviewAviva plc Annual Report and Accounts 2010
07
What’s inside Page
Chairman’s statement 08 Group chief executive’s review 10 Our strategy 14 Financial highlights 16
Performance review Key performance indicators 18 Regional performance 20
Information on the company 27 Organisational structure 40 Selected consolidated financial data 42 Financial and operating performance 43 Analysis of investments 57 Property 64 Contractual obligations 65 Risk management 66 Capital management 70
Corporate responsibility Highlights 76
Governance Board of directors 94 Executive management 96 Directors’ report 97 Corporate governance report 100 Nomination committee report 109 Audit committee report 110 Risk committee report 112 Corporate responsibility committee report 114 Directors’ remuneration report 115
Shareholder information Company address and Share capital 138 Related party disclosures 140 Dividend data 141 Guarantees, securitised assets and off-balance sheet arrangements
141
Liquidity and capital resources 142 Audit committee financial expert 147
Code of ethics and Regulation 147
Risks relating to our business 153
Financial statements IFRS Page
Independent auditor’s report 168 Accounting policies 170 Consolidated income statement 183 Pro forma reconciliation of Group operating profit to profit before tax
184
Consolidated statement of comprehensive income
186
Consolidated statement of changes in equity 187 Consolidated statement of financial position 189 Consolidated statement of cash flows 190 Notes to the consolidated financial statements 191 Financial statements of the Company 306
Financial statements MCEV Condensed consolidated income statement 316 Condensed statement of comprehensive income 317 Condensed statement of changes in equity 317 Condensed consolidated statement of financial position
318
Reconciliation of shareholders’ equity on an IFRS and MCEV basis
319
Reconciliation of IFRS total equity to MCEV net worth for life and related businesses
319
Group MCEV analysis of earnings 320 Notes to the MCEV financial statements 321 Statement of directors’ responsibilities in respect of the Market Consistent Embedded Value (MCEV) basis
351
Independent auditor’s report 352
Other information Glossary 354 Shareholder services 359

Lord Sharman of Redlynch OBE
Chairman
Chairman’s statement
08
Aviva plc Annual Report and Accounts 2010
Delivering more than just peace of mind
Operationally Aviva is doing extremely well; the executive team and our people across the Group have done a remarkable job in supporting our customers and delivering profits of £2.55 billion for the year. I thought 2010 would not be an easy year for the financial markets and in some respects it was not. We have had to cope with volatility in the marketplace and increasing regulation. In spite of this, we have made very good progress over the last twelve months. The longer-term economic prospects are looking brighter and our single strong brand enhances Aviva’s resilience.
Corporate responsibility Aviva has continued to lead the way in helping to shape better futures for people around the world. For example, we have driven the debate about creating a cultural change in how people think about saving by convening the Future Prosperity Panel in conjunction with the Economist Intelligence Unit. We have also worked hard to promote our corporate responsibility principles across the business and they have become part of everyday life at Aviva. This year we have continued to support Save the Children and Child Rights and You, through our inspiring Street to School initiative. We are carbon neutral worldwide and have been so since 2006 and have a corporate sustainability programme which is industry-leading. You can read more about these and our other commitments in our Corporate Responsibility report on page 75.
Dividend for 2010 I am happy to report that the final dividend for 2010 will be 16 pence, bringing the total dividend to 25.50 pence, an increase of 6% over 2009. We continue to retain the dividend at a sustainable level for business growth.

09
Aviva plc Annual Report and Accounts 2010
Chairman’s statement continued
Changes to the Board In January 2011, we announced that Andrea Moneta, chief executive of Aviva Europe, Middle East and Africa, would be leaving the Group. We welcomed Igal Mayer, formerly chief executive of Aviva North America, as the new CEO, Aviva Europe, who has been appointed to the Board.
Leadership and effectiveness of the Board I am pleased to confirm that the Board is compliant with the principles of the new UK Corporate Governance Code relating to the leadership and effectiveness of the Board. These principles are closely aligned to the corresponding principles of the Combined Code on Corporate Governance (Combined Code) which are still applicable for the financial year ending 31 December 2010. In applying these principles, the Board has ensured that there is a clear distinction between the leadership of the Board and the executive leadership of the Company by the Group chief executive officer. The Board has also adopted detailed terms of reference for the Board and its committees, as well as a rigorous and transparent procedure for the appointment of new directors. The continued effectiveness of the Board is assessed annually through a formal evaluation process. For further details of how we have applied the principles of the Combined Code, please see our Corporate Governance Report on pages 100 to 108.
Looking forward to 2011 Predicting the future of the financial markets is never easy and the likelihood is that the situation will remain uncertain, perhaps for another 18 months. However, against this backdrop, we are in good shape and have a clear way forward. On behalf of the Board and the executive, I would like to publicly thank all of our people for the great job they continue to do every day in delivering our brand promise to recognise our customers and help provide them with prosperity and peace of mind. Lord Sharman of Redlynch OBE Chairman

Andrew MossGroup chief executive
10
Aviva plc Annual Report and Accounts 2010 Group chief executive’s review
This has been a successful year for Aviva. Despite the tough economic environment in 2010, we have grown the business and the benefits of Aviva’s transformation over recent years have started to come through. We have seen strong growth during the year: IFRS operating profits were up 26% to £2.55 billion and total sales were up 4% to £47.1 billion. We are selling more and improving profitability: we delivered a life new business internal rate of return (IRR) of 12.5% and a general insurance combined operating ratio (COR) of 96.8%. We have also beaten our target for capital generation, increasing net operational capital by 70% to £1.7 billion.
A successful year for Aviva
This is the result of a great deal of hard work across the group – focusing on our customers, growing the business and driving cost and capital efficiency. We are in good shape to continue building on last year’s strong performance. We have a clear strategy to concentrate on the markets where we have strength and scale and to make the most of running our life and general insurance businesses under a single strong brand.
We have created a strong platform for profitable growth... With the global economy in the grip of a financial crisis, we have created a strong platform for profitable growth, taking decisive management actions to improve our productivity and efficiency. The steps we have taken as part of our ‘One Aviva, twice the value’ strategy have helped us achieve this. We have simplified and streamlined the Group, moving from a federation of independent businesses to a successful, global business operating under a single, strong brand. This has strengthened the business and enabled us to serve our customers better.
...and the benefits are clearly evident in the numbers As expected, the economic situation remained difficult in 2010. The fact that we turned in such a strong financial performance under these circumstances underlines the strength of our business. We are seeing evidence of improved performance right across our business. We had another strong year in life insurance. General insurance is returning to growth from a low point in the cycle. Our asset management business, Aviva Investors, delivered significant growth in funded external sales.
Our customers are at the heart of our success... Aviva’s resilience and improving performance are underpinned by the scale of our customer base, now over 53 million strong. Against an uncertain economic backdrop, customers are looking to save more for their financial security. Investment performance and customer demand for our products increased total funds under management by £23 billion to £402 billion in the year. Through our determination to focus on meeting customers’ needs effectively and efficiently, we are attracting new customers and giving existing customers greater reason to stay with Aviva.
53.4m customers
£47.1bn worldwide sales
£2.55bn operating profit

Group chief executive’s review continued
11
Aviva plc Annual Report and Accounts 2010
...as we continued to grow the business profitably... During the year we maintained our emphasis on growing the business profitably. We ensured that we allocated our capital to areas where we could earn optimal returns and continued to bear down on costs. We reduced our cost base by £149 million, a reduction of 3%, and over the last three years we have taken more than £750 million of costs out of the business. With this combination of keeping down costs and pursuing profitable growth, Aviva’s life business is now significantly more profitable than it was three years ago and the momentum is continuing. In general insurance, absolute cost savings combined with rising sales and disciplined underwriting have driven a significant improvement in profitability. These improvements helped to drive IFRS operating profit up by 26% to £2,550 million and earnings per share increased by 33% to 50 pence. In addition, the consultation on the planned closure of Aviva’s final salary staff pension scheme was completed during the year. Moving all UK staff to a defined contribution scheme from 1 April 2011 has benefited Aviva’s net asset value by £286 million and will reduce funding costs by £50 million a year.
... due to strong performances across our businesses We delivered a strong life insurance performance in 2010. Long-term savings sales increased by 4% to £37,360 million. Through our focus on profitable new business growth and disciplined allocation of capital the Group’s Internal rate of return (IRR) increased to 12.5% (from 10.0% in 2009) with a payback of 8 years (14 years in 2009). In the UK our life business is clearly winning in an attractive market and we were voted the UK’s top insurer by independent financial advisers. Not only did we grow long-term saving sales by 19% and increase our market share for the third consecutive quarter but we also delivered excellent profitability with a 15% IRR and significantly increased margins to 3.4% (FY 2009: 2.8%). In Europe we are well positioned in the world’s largest life and pensions market. We achieved a 13% IRR in Aviva Europe – ahead of the Group’s short term financial target – on life and pensions sales up 3% on a local currency basis. In North America we significantly increased profitability with an IRR of 14% and a four-year payback as a result of disciplined pricing management and our focus on more capital-efficient life products.
In Asia Pacific we have made great strides in the growth of our franchise. Life and pensions sales were up 48%5 and IRRs improved significantly from 6%5 to 11% through active management of the product mix and capital discipline. Our general insurance performance is a very important highlight of 2010. Over the last couple of years, we took tough decisions to move away from unprofitable business, particularly in the UK. This means that, from a sound footing, we are now growing in a market which shows some signs of improvement and total general insurance and health net written premiums increased by 6% to £9,699 million. Our offering is proving very successful. In the UK general insurance business, net written premiums were 5% higher at £4,046 million in 2010 and we delivered four consecutive quarters of sales growth. In Aviva Europe the COR was 103%, and although some of this was due to poor weather this is an area for further improvement in 2011. In Canada – our second-largest general insurance business – our decision to exit unprofitable business contributed to a 54% increase in operating profit to £222 million on slightly lower sales, down 3% to £1,958 million on a constant currency basis. Across the general insurance business we achieved a COR of 96.8%, better than our 2011 target of 97%. The strength of our bancassurance performance was particularly pleasing. Our combination of life and general insurance and our excellent products and services in both areas make us an attractive business partner and during 2010 we announced new arrangements with Santander and Royal Bank of Scotland. We have over 100 bank partnerships and long-term savings sales in this area grew by 10% in the year. Aviva Investors, our global asset management business, grew assets under management by 4% to £260 billion. IFRS operating profits were down from £115 million in 2009 to £100 million in 2010 as we continued to invest in the business. Despite the unpredictable nature of the financial markets, investment performance was ahead of target for Aviva Investors with 73% of its funds beating benchmark. The business has also made good progress in the development of a global infrastructure which will help to reinforce the focus on delivering strong growth in third-party business. Net funded external sales rose from £236 million outflows in 2009 to £2,364 million inflows in 2010. Overall, our results in life, general insurance and asset management have been largely unaffected by foreign exchange movements.
5. Excluding Australian life business sold on 1 October 2009

Group chief executive’s review continued
12
Aviva plc Annual Report and Accounts 2010
Cash and capital is a clear differentiator... We took time in 2010 to highlight to analysts and shareholders the strength of our cash and capital generation. Indeed, we generate substantially more capital than any other insurer in the UK. Given the strength of our business across life and general insurance, and with over 30 million customers on long-term contracts, a key characteristic of Aviva is the strength of our cash flows and our capital position. 2010 saw a £3 billion increase in expected future cash flows from our in-force life book to £36 billion. Last year we forecast net operating capital for the year of £1.5 billion. We have beaten that guidance, delivering £1.7 billion net operating capital in 2010 – an increase of 70% on 2009.
... and our balance sheet is stronger… We also provided further clarity on the strength and quality of our balance sheet which underpins our resilient profits and powerful capital generation. During the year our IFRS net asset value per share increased to 454 pence (31 December 2010) from 374 pence (31 December 2009), largely through the strength of our earnings and by reducing the pension deficit to zero (31 December 2010) from £1.7 billion (31 December 2009), but also partly through improving financial markets. The strength of Aviva’s balance sheet rests on our effective management of credit and insurance risk and our disciplined asset liability management. We have high-quality, well managed and diverse fixed income portfolios, and our asset manager Aviva Investors has helped to deliver a consistently strong performance across these assets over a number of years. In line with the prudent management of our balance sheet in the current economic environment and our strong capital generation, we plan to reduce Aviva’s hybrid debt by at least £700 million over the next three years.
In January 2011 we provided the market with further embedded value disclosure. This gave additional clarity to the value of Aviva’s future cash flows and allows greater comparability with other UK insurers. On a European Embedded Value equivalent basis Aviva’s net asset value per share is 621 pence at 31 December 2010. Our IFRS shareholder equity now exceeds the level before the global financial crisis, having increased during the year by £2.5 billion to £13.0 billion and our financial strength was recognised by the positive rating action by credit rating agencies S&P and Fitch at the start of 2011.
...supporting a healthy and growing dividend It is the strength of our capital generation and our balance sheet which support a healthy and growing dividend. For 2010, we intend to pay a dividend of 25.5 pence, an increase of 6% over 2009.
We have refreshed our strategy In November 2010, we set out the results of our strategic review. There is no doubt we are in a strong position because of the actions we have taken across the business. Equally, the world is a very different place to when we laid out our strategy in 2007. We are in a new economic environment as customers prefer to pay down debt and save more and constraints on capital require greater investment discipline, strategic focus and strong balance sheets. Given this changed environment in 2010 we took a step back and had a hard look at our strategic direction. There were three clear conclusions, as I outline here and set out in more detail in the following pages: 1. Increasing our geographic focus on 12 markets where we have strength and scale, particularly in the UK and Europe where our market-leading positions mean that we are well placed to make the most of the significant demographic opportunity in the region.
Strong platform for profitable growth Moved from 40 brands to a single, strong brand – Aviva Grown the scale of our customer base, now over 53 million strong and continuing to attract
new customers Reshaped the portfolio to reallocate capital to higher return markets – such as the partial IPO
of Delta Lloyd and the sale of our sub-scale Australian life business Brought our businesses closer together – combined life and general insurance in the UK and
implemented the transformation of our European business Delivered our £500 million cost savings target a year early – £750 million costs taken out of
the business over the last 3 years Reduced our headcount by approximately 19% since 2007 Completed the reattribution of the inherited estate benefiting policyholders and shareholders Negotiated the closure of the final salary section of the UK staff pension schemes to future accruals

Group chief executive’s review continued
13
Aviva plc Annual Report and Accounts 2010
2. Benefiting from the combination of life and general insurance. Our life and general insurance operations are excellent businesses in their own right, with strong market positions, good growth prospects and attractive returns. In addition to their inherent strengths, there are significant advantages to running both under one strong brand. For example, Aviva benefits from diversification of risk that allows us to hold 30-40% less capital to write new general insurance business than on a standalone basis. 3. Building on our core strengths in marketing and distribution expertise, technical excellence, operational effectiveness and financial discipline. We already perform well in these areas, but by focusing our efforts and resources we aim to excel at each of them, and enhance Aviva’s position as a leading insurer.
Delivering on short-term financial commitments In addition to our longer-term strategy, we have set out a number of near-term, demanding financial targets. We aim to deliver:
At least £1.5 billion operational capital generation in 2011;
Life IRR of a least 12% with payback of 10 years or less;
2011 general insurance COR of 97% or better; and
£200 million of cost savings and £200 million of efficiency gains by the end of 2012.
In 2010 we demonstrated our ability to meet these targets as we generated £1.7 billion net operational capital; delivered a life new business IRR of 12.5% and a general insurance COR of 96.8%.
Strength from our people and our customers We are reaping the benefits of the commitment and hard work of our people over the past few years and I am grateful to all of the Aviva team.
The real source of our success, of which I am always conscious, is the difference that our people can make to our customers’ lives. This is what motivates us and makes Aviva an exciting place to work.
Building a strong and sustainable business. Our business helps our customers to manage the risks of everyday life and to secure their financial futures. We must be there for them throughout their lives and beyond, so it is crucial we are a sustainable and profitable business, for the mutual benefit of our shareholders and our customers. Our sustainability and financial strength are underpinned by effective risk management, which allows us to predict future changes, move more quickly and take better decisions for our customers, giving them prosperity and peace of mind.
Confident outlook We are in good shape with a clear way forward and strong momentum in our businesses. In our life business, we are confident that with our brand strength, leading market positions and great product offerings, we are in a strong position to benefit from our customers’ increasing propensity to save in these uncertain times. In our general insurance business, because of the actions we have taken and the improving market conditions, I believe the prospects are better than at any time in the last five years. We have come a long way in the last few years and I am confident that, although the economic environment may well be tough in 2011, we have a strong platform from which to deliver the continued success of Aviva.
Andrew Moss Group chief executive
Safeguarding our financial future With economies recovering at different speeds and a greater pressure on finances for both business and individuals, we are playing our part in finding new ways of thinking about how we should safeguard our financial futures.
We continue to monitor consumer attitudes to savings around the world. We now have seven years of rich data from which to create insight (www.aviva.com/customers/consumer-attitudes-survey).
In August 2010 we launched ‘Mind the Gap’, a report which explores the difference, across 27 European countries, between the pension provision people will need in retirement and the pension amount they can currently expect to receive. It provides calls to action to address the pensions gap and incentivise higher levels of saving (www.aviva.com/europe-pensions-gap).
In October 2010, we convened the Future Prosperity Panel, bringing together leading international ‘thinkers’ from outside financial services to debate fresh approaches to ensuring financial prosperity. It uses insights from public policy, business and behavioural economics to look for new solutions to help people save (www.aviva.com/media/future-prosperity-panel).

14
Our strategy
1
India
China
US
Canada
Turkey
Russia
UK
France
SpainItaly
PolandIreland
£1.5bn of net operational capital generation in 2011
£200m of cost savings and £200m of cost effi ciency gains by the end of 2012
97% COR or better in general insurance by 2011
12% Life IRR with payback of ten years or less
Aviva plc Annual Report and Accounts 2010
Clear way forward
Strong platform for profitable growth We have simplified and streamlined the Group, moving from a federation of independent businesses trading across 40 different brands to a successful business operating under a single strong brand. We have reduced costs significantly, strengthened the balance sheet and improved profitability.
A clear focused strategy However, there is no doubt that the world has changed significantly. Against a backdrop of changes to the economic, business and regulatory environments, we stepped back in the first half of 2010 and assessed our strategic direction. As a result, in this new economic environment we are now looking ahead to the next phase of Aviva’s growth – there are new challenges and exciting opportunities.
Financial targets for 2011 Our strategy gives us a clear way forward, but we are also focused on delivering strong performance in the near-term, so we have set out a number of clear financial deliverables:
Increasing geographic focus We will prioritise our investment in 12 markets where we have strength and scale.
UK and Europe: our key focus
UK and Europe represents the largest life and pensions market in the world, offering the greatest absolute growth over the next five years
We will focus on risk and savings products in UK, France, Spain, Italy, Poland, Ireland, Turkey and Russia
North America: focus on growing profits organically
We will focus on growing profits in Canada and the US
In Canada we will focus on being a great underwriting company
In the US we will diversify the business mix by growing our life protection business to achieve a top ten position while continuing to build our core annuity business
Asia Pacific: focus on growing franchise value
In Asia Pacific we will pursue franchise growth through organic investment
We will focus on the high priority markets of China and India

15
Our strategy continued
3 2
Aviva plc Annual Report and Accounts 2010
Benefiting from the combination of life and general insurance Our life and general insurance operations are excellent businesses in their own right, but in addition to their inherent strengths there are significant advantages to running these businesses under one brand and in one group. Aviva Investors, our global asset manager, is dedicated to building and providing focused investment solutions for clients and continues to target growth in third-party assets to drive franchise value.
Building on our core strengths We will succeed by building on four core strengths. We already perform well in these areas, but by focusing our efforts and resources, we aim to excel at each of them, and enhance Aviva’s position as a leading insurer and asset manager.
Capital The combination of our businesses provides capital benefits by diversifying risks
Aviva can hold 30-40% less capital to write new general insurance business than the general insurance business would need to hold on a standalone basis. It is anticipated that this benefit will be reinforced under Solvency II
Cash flows The diversity of our business drives more resilient cash
flows and earnings than single line insurers through the cycle
Half of Aviva’s net cash flow is generated from general insurance businesses
Cost and efficiency We gain clear scale benefits and cost synergies from
having life, general insurance and asset management in one group, including the operational benefits of shared back-office functions, IT and finance resources
We can benefit from the opportunity to transfer key skills and capabilities across the Group
Customer and distribution The power of Aviva’s brand differentiates our life, general
insurance and asset management businesses This combination makes Aviva an attractive business
partner and has allowed us to develop global leadership in bancassurance
We create cross-selling opportunities, with our single, trusted brand which is able to meet our customers’ complete insurance, pension and investment needs
Marketing and distribution expertise Leveraging our multi-channel distribution network will
provide access to millions of potential new customers We will further develop our sales effectiveness to deliver a broad range of products and services to new and existing customers
We will build on our expertise as one of the leading partners to banks in order to develop new bancassurance relationships
We will exploit the strength of our brand, which is one of Aviva’s greatest assets
Technical excellence First class technical skills will enable us to offer our customers excellent products at competitive prices
We will continue to develop our disciplined approach to underwriting and pricing
We will further develop our approach to understanding and taking measured risks, protected by optimised reinsurance
Operational effectiveness Our focus on meeting customer needs will enhance
loyalty, improve retention and enable us to sell more products
Continually seeking opportunities to streamline our processes will drive efficiency and improve customer service
We will continue to invest in our market-leading claims management expertise
Financial discipline We will allocate capital rigorously to the opportunities
that provide the best risk-adjusted returns Managing our portfolio selectively will enable us to
invest and deepen our presence in our priority markets We will balance sales growth with profitability of
new business We will manage investment risk and gearing effectively

Financial highlights
16
Aviva plc Annual Report and Accounts 2010
* From continuing operations including share of associates’ premiums ** Before tax attributable to shareholders *** On a MCEV basis from 2007. Prior years presented on an EEV basis
60,000
0
10,000
20,000
40,000
30,000
50,000
Worldwide sales* £m
06
42,9
67
07
50,2
74
08
51,3
77
0945
,068
10
47,0
59
More details on our results can be found in the Performance review section
l 17 – 74
4,000
0
500
1,500
1,000
3,000
3,500
MCEV operating profit*** £m
2,500
2,000
06
3,25
1
07
3,06
5
08
3,36
7
09
3,59
2
10
3,76
0
2009 MCEV operating profit has been restated – see Financial Statements MCEV
3,000
0
500
1,000
1,500
2,500
06 07 08 09 10
IFRS operating profit before tax** £m
2,000
2.50
2.00
1.00
1.50
Div
iden
d co
ver
(tim
es)
IFRS Dividend cover
2,60
9
2,21
6
2,29
7
2,02
2
2,55
0
100
60
80
40
20
(60)
(40)
(20)
0
IFRS total return after tax EPS
09
1,31
5
08
(885
)
10
1,89
2
071,
498
06
2,38
9
2,500
(1,500)
(1,000)
(500)
500
0
1,500
2,000
1,000
Earn
ings
per
sha
re (p
ence
)
IFRS total return after tax £m
40
0
10
20
30
Full year dividend Pence
06
30.0
0
07
33.0
0
08
33.0
0
09
24.0
0
10
25.
50
14
0
2
4
8
06 07 08 09 10
Equity shareholders’ funds £m
6
28
16
12 24
10 20
12
0
8
4
Retu
rn o
n eq
uity
%
IFRS Return on equity
11,3
76
13,2
42
11,3
79
10,5
56
12,9
94
£47.1bnWorldwide sales
2010
Sales
UK 35 Europe 46North America 14Asia Pacific 5
%
•••• £2.55bn
IFRS GroupOperating
profit
IFRS Group Operating profit %
UK 42 Europe 43 North America 11 Asia Pacifi c 1 Aviva Investors 3•
••••

Performance reviewCorporate responsibilityGovernanceShareholder informationFinancial statements IFRSFinancial statements MCEVOther information
Performance review
Aviva plc Annual Report and Accounts 2010
17
Performance review
In this section Page
Key performance indicators 18
Regional performance 20
Information on the company 27
Organisational structure 40
Selected consolidated financial data 42
Financial and operating performance 43
Analysis of investments 57
Property 64
Contractual obligations 65
Risk management 66
Capital management 70
Basis of preparation 73
Accounting basis of preparation 74

18
Aviva plc Annual Report and Accounts 2010 Key performance indicators
The key measures used by the Board and executive management team to assess performance at a Group level are set out below.
* On an MCEV basis from 2007. Prior years presented on an EEV basis
Earnings per share Our IFRS earnings per share for 2010 was 50.4 pence (2009: 37.8 pence). This reflects strong growth in UK, Europe and the US.
Relevancy
100
(60)
(40)
(20)
20
0
60
80
40
06
88.0
07
48.9
08
37.8
09
(36.
8)
10
50.4
Earnings per share Pence
Focusing on earnings per share allows us to align our strategic priorities with what our shareholders receive.
Total IFRS return takes into account everything affecting shareholder value, not just operating profits.
Proposed ordinary dividend per share and dividend cover Our Board has recommended a final dividend of 16.00 pence per share (2009: 15.00 pence). This brings the total dividend for the year to 25.50 pence and gives a dividend cover of 2.1 times (2009: 1.8 times) based on IFRS operating earnings after tax.
Our intention is to pay a dividend on a basis judged prudent using dividend cover of 1.5–2.0 times, while retaining capital to fund future growth.
35.0
0
5.0
10.0
15.0
25.0
30.0
06 07 08 09 10
Proposed ordinary dividend per shareand dividend cover Pence
20.0
3.50
3.00
2.50
2.00
0
1.00
0.50
1.50
30.0
0
33.0
0
33.0
0
24.0
0
Dividend Cover
25.5
0
Div
iden
d co
ver
(tim
es)
Group adjusted operating profit before tax IFRS operating profit increased by 26% to £2,550 million (2009: £2,022 million). MCEV operating profit increased by 5% to £3,760 million (2009: £3,592 million). These results reflect the improvement in our operating performance in the year, fuelled by the sales growth we observed on our UK, European and American markets.
We aim to achieve steady sustainable growth in our operating profit, both on an IFRS and market consistent embedded value (MCEV) basis. In seeking to achieve this growth, we continue to adopt strict financial management disciplines underpinned by strong corporate governance.
Group operating profit £mIFRS MCEV*
06
3,25
1
07
3,06
5
08
3,36
7
09
3,59
2
10
3,76
0
2,60
9
2,21
6
2,29
7
2,02
2
4,000
0
500
2,000
2,500
1,000
1,500
3,000
3,500
2,55
0
2009 MCEV operating profit has been restated – see Financial Statements MCEV
Worldwide sales Total worldwide sales increased by 4% in 2010 to £47,059 million (2009: £45,068 million). Long-term and savings sales increased by 4% to £37,360 million (2009: £35,875 million). General insurance and health sales of £9,699 million (2009: £9,193 million) were up by 6%.
While our focus is on capital efficiency and profit rather than volumes, sales remain an important indicator. Worldwide sales comprise the PVNBP of long-term savings new business sales and net written premiums from the general insurance and health businesses.
60,000
0
10,000
20,000
40,000
30,000
50,000
06
42,9
67
07
50,2
74
08
51,3
77
09
45,0
68
10
47,0
59
Worldwide sales £m

19
Performance reviewCorporate responsibilityGovernanceShareholder informationFinancial statements IFRSFinancial statements MCEVOther information
Performance review
Aviva plc Annual Report and Accounts 2010
Key performance indicators continued
Operational capital generation Our focus on operational capital generation enabled us to generate £1.7 billion of capital in 2010, up from £1.0 billion in 2009, as we continue to benefit from our combination of life and general insurance businesses. This excludes the impact of the Delta Lloyd longevity assumption changes of £0.2 billion.
Relevancy
09 10
2.0
0
1.0
0.5
1.5
Operational capital generation £bn
1.0
1.7
Operating capital generation is the operating movement in our free capital in the year.
Return on equity shareholders’ funds Return on Equity shareholders’ funds on an IFRS basis increased to 14.8% (2009: 10.9%) benefiting from the growth in operating profits.
Return on equity shareholders’ funds is calculated as after-tax operating return, before adjusting items, on opening equity shareholders’ funds, including life profits on an IFRS basis.
20.0
0
12.0
8.0
4.0
16.0
Return on equity shareholders’ funds %
06
19.7
08
12.7
09
10.9
1007
12.2
14.8
Employee engagement and leadership Key performance indicators relating to our employees’ views on Aviva are based on questions in our annual global ‘Employee Promise’ survey. We report and set targets in line with global financial service (GFS) benchmark norms and monitor our internal performance by using our historical data to assess annual progress.
Employee engagement represents the degree to which people believe Aviva is a great place to work and are contributing to help meet our collective goals and ambitions.
The survey results are used each year to determine and implement actions with the aim of achieving continuous improvement. The survey measures employees’ perceptions of leadership, engagement and more, verifying alignment with our strategic direction and immediate business plans.
Our aim is to improve both measures over time and meet or exceed a global financial services benchmark.
GFS normPerformance
Engagement Leadership
Target: 73 Target: 71
Employee engagement and leadership %
100
0102030
5060
40
90
7080
Customer advocacy The 2010 Net Promoter Score® survey showed results broadly consistent with 2009. We maintained the proportion of businesses operating in the upper quartile (relative to local competition) despite an element of uncertainty in some of Aviva’s markets. Our geographic diversity means we are well positioned and optimistic about the long-term prospects for growth.
Customer advocacy gives us, in a single, simple measure, an accurate predictor of customer retention and cross-sell opportunity.
Performance v market average – Net Promoter Score©
% met or exceeded benchmark% below benchmark% in upper quartile
1009
100
0
20
60
40
80
.

20
Aviva plc Annual Report and Accounts 2010 Aviva UK
Winning in the UK Aviva is the leading insurance brand and customer franchise in the UK. Our combination of life, health and general insurance, together with motoring services from RAC, is unique in its scale and breadth in the UK market. We are the UK’s largest insurer with 19 million customers, and one in three households has a relationship with us. Customers can choose to buy our products through intermediaries, our corporate partners or from Aviva direct and we have become the partner of choice for many of the UK’s biggest organisations. We are ranked as one of the UK’s top ten most valuable brands.
Strategy We want to become the most recommended company in our market – by our customers, distributors and our people. To do this we aim to excel in each of the markets in which we operate, while creating additional value by operating our life and general insurance businesses together. We aim to maintain our market leadership by:
Offering a broad range of market-leading products across long-term savings, health, general insurance and motoring services
Growing our unparalleled distribution network, maximising the potential of our strong brand and being the partner of choice for intermediaries, banks and other corporate partners
Maintaining a clear focus on the customer; simplifying our processes and improving our service and retention, while increasing the number of policies each customer holds
Managing a controlled expansion of our risk appetite into attractive growth markets where we are underweight, such as corporate risks and specialty lines
Ensuring strong financial discipline, including excellence in underwriting, claims management, asset liability management and an ongoing focus on costs.
Market environment In 2010 economic uncertainty continued, with its consequent impact on consumer confidence, discretionary spending and investment performance. However the long-term savings market returned to growth, following two consecutive years of contraction. We gained market share in annuities and core protection as customers turned to strong brands they can trust, like Aviva. The general insurance market remained highly competitive. The most notable trend in 2010 was a rise in personal motor premiums across the industry in response to the recent increases in bodily injury claims costs and frequencies. Elsewhere, the competitive environment has constrained increases in homeowner and commercial lines.
An excellent year with momentum building in profit, sales and service across our UK business In 2010 we delivered strong and profitable growth across our UK business. IFRS profit increased 21% to £1,411million; clearly demonstrating the significant value generated from our unique combination of life and general insurance businesses. We significantly increased our distribution strength during the year by expanding our corporate partnerships across our UK businesses while at the same time being voted the UK’s top insurer by insurance intermediaries across life, general insurance and health.
Our continued disciplined focus on operational capital generation across our UK businesses resulted in a 85% increase to £973 million
Our life business is winning in an attractive marketplace We delivered a record result in our UK life business with IFRS operating profits up 26% to £850 million as we drove increased earnings from our new and in-force business. We have created competitive advantage from our strong and diversified new business franchise, leading brand and multi-distribution. Total long-term savings were up 19% to £11,846 million and life and pensions sales increased 16% to £10,298 million. The UK market is growing again and we grew our market share for the third consecutive quarter (Q3 2010 11%; Q3 2009 9.7%) with a strong performance in annuities and core life protection. We increased margins significantly to 3.4% (2009: 2.8%) through our disciplined approach to business mix, costs and capital. Our IRR was 15% with a reduced payback period of 7 years. We are well placed for the Retail Distribution Review (RDR) in 2013 with our diverse distribution and broad product range.
Significant opportunity for future earnings growth as general insurance performance accelerates Our general insurance and health business delivered a strong performance with IFRS operating profit increasing 8% to £579 million and our general insurance combined operating ratio improving from 99% to 96%, demonstrating the quality of our portfolio and our continuing focus on cost control. Our enhanced pricing and risk selection techniques enable us to more accurately recognise individual risks with the most competitive premium, which in turn has been reflected in our improved claims experience. Our approach to reserving and prior year releases has remained consistent to previous years. Our general insurance business has delivered four consecutive quarters of sales growth with net written premiums 5% higher at £4,046 million. Our direct business is growing fast with over one million customers holding direct motor policies with Aviva, 200,000 more than at the start of 2010. Direct pricing has been rolled out to 2,300 brokers making a significant contribution to our growth and RAC Panel sales have more than doubled. We continue to exploit our market leading SME franchise in commercial lines and SME net written premiums increased 7%. We have made good progress in building our corporate risks and specialty lines business through the controlled expansion of our risk appetite and the recruitment of specialist expertise. We are attracting high-quality risks with £50 million of new gross premiums and a COR of 81%. Our disciplined approach to risk selection, claims excellence and our geographical spread helped mitigate some of the effects of the adverse winter weather experienced in late November and December. We have received over 23,000 weather related property claims for homes and businesses at a cost of £60 million above our long-term average weather assumptions. Weather in the rest of the year was better than expected, despite the January freeze, taking the overall impact to £40 million above long-term average for the whole of 2010.
Benefiting from the trust, confidence and visibility of being the UK’s leading insurance brand and customer franchise We have 19 million customers in the UK, meaning that one in three households has an Aviva relationship and we continue to invest in developing our brand and customer franchise. We have embedded strong customer focus in everything we do by making it part of our reward package for every member of staff. In 2010 service improved across our business on all measures and we launched a number of innovative new services that allow customers to benefit from our expertise through their mobile devices.

21
Performance reviewCorporate responsibilityGovernanceShareholder informationFinancial statements IFRSFinancial statements MCEVOther information
Performance review
Aviva plc Annual Report and Accounts 2010
Aviva UK continued
The Aviva brand is strong; customer recognition and consideration levels improved in 2010 with spontaneous awareness at 54% at the year end. We have also adopted a single approach to TV advertising using Paul Whitehouse which has both contributed to growing customer interest and sales. Our unrivalled product range means Aviva can meet customer needs throughout their lives and our customer research highlights the significant opportunity we have to increase value and deliver a wider service to our UK customers. The number of customers who hold multiple Aviva products is growing and we are focussing on further developing this
Becoming the partner of choice Our strategic partnerships with leading banks and other leading organisations delivered strong financial results in 2010 with an IRR of 15% and a COR of 96%. We are now the leading UK bancassurer based on both new business volume and breadth of offer. We strengthened this market-leading distribution with some significant wins in 2010 and will build further on these in 2011. In our exclusive relationship with Santander we are adding life protection products to our existing general insurance distribution agreement. Our long-term successful strategic partnership with RBS was renewed in 2010 on the basis of a new exclusive distribution agreement for the sale of life, protection and pensions products. In general insurance we also secured or renewed ten partnership arrangements with bank and building society partners in 2010.
Driving value across our UK business for customers and shareholders In 2010 total costs including brand and restructuring have fallen by £200 million to £1.7 billion. Costs continue to be an area of focus and we remain on track to deliver £200 million of cost and efficiency gains by the end of 2012. Following consultation with our staff, we are closing our UK final salary pension schemes to future accrual from 1 April 2011. This will reduce the pension fund deficit benefiting Aviva’s net asset value by £286 million and reducing future funding costs by approximately £50 million per year. We continue to simplify our business and improve our service to customers. Our new online services mean that 95% of new online general insurance customers receive their documents electronically.
Outlook: A growing business with a unique opportunity Aviva is growing profitably in the UK and we expect this momentum to continue in 2011 as we benefit from our strong brand, broad product range and diverse distribution. The long-term savings market continues to show resilience and is growing. While we remain cautious about the economy overall, we expect to continue to grow as we extend our competitive advantage and retain a disciplined approach. The growth dynamics in the UK market remain compelling with new research from Aviva finding that the UK has the largest pensions gap per person in Europe at £318 billion overall; in addition 61% of families have no life insurance protection. As a trusted brand Aviva is well placed to respond. The general insurance market remains competitive. Through disciplined deployment of our capital we will extend our risk appetite and business mix to drive superior returns. At the heart of this will be continued excellence in our risk selection and underwriting. We will drive additional and unique benefit from operating our life and general insurance businesses together and have clear plans to expand distribution, develop our customer agenda and further improve cost management.
10 11,846
09 9,963
08 13,343
07 14,548
06 13,812
Long-term and savings sales £m
101,085
09787
08883
07822
74406
850
672
751
723
629
IFRS MCEV*
* On an MCEV basis from 2007. Prior years presented on an EEV basis.
Long-term and savings operating profit £m
Aviva Premiership Rugby sponsorship Aviva has become the new title sponsor of English rugby union’s top-flight league. Under the four-year £20 million deal, the world-leading rugby union competition became Aviva Premiership Rugby from September 2010. When combined with our sponsorship of UK Athletics it provides year-round visibility of the Aviva brand. The Aviva Premiership includes more than 135 games each season, watched by 1.7 million people at the grounds and many more on Sky, ITV and ESPN. The deal also allows Aviva to extend its grassroots programme designed to encourage young people to get involved in sport. The 12 rugby clubs in the Aviva Premiership are committing 15,000 man hours to work with 36,000 pupils at 600 primary schools in England, as well as providing them with equipment and teacher training.
10 4,539
09 4,298
08 5,413
07 5,897
06 6,000
General insurance and health net written premiums £m
0
06 07 08 09 10
104
1,200
960
720
480
240 92
88
96
100
108
Combined Operating Ratio (COR)
%
General insurance and health IFRS operating profit £m

22
Aviva plc Annual Report and Accounts 2010
Europe
Capitalising on our leading position in Europe Aviva has a strong presence in France, Ireland, Italy, Poland and Spain and continues to grow in Russia and Turkey. We also have a strategic investment in Delta Lloyd in the Netherlands. With $1.7 trillion growth in life and pensions assets expected between 2009 and 20141, Europe (including the UK) has huge long-term potential for the Group.
Strategy Our strategy is to invest and deepen our presence in Europe, with a clear focus on managing for value. Our Quantum Leap transformation programme is implementing a truly pan-European operating model across our markets. It underpins our operational achievements in the past year and continues to progress well. We will take advantage of demographic opportunities by leveraging our scale, strong market positions and local expertise:
Offering a range of life, pensions, general and health insurance and asset management products, providing the diversity and competitive strength that a combination of life and general insurance provides.
Capitalising on our multi-distribution network, where our single brand will support our retail network and continue to grow our market-leading bancassurance franchise.
Developing core strengths in product simplification and innovation, shared operational excellence, general insurance claims management, governance and risk management while remaining customer focused.
Delta Lloyd is independent of our other operations. Following a successful IPO in 2009, Aviva retained a 58.3% interest. In 2010 we chose not to exercise a scrip dividend option and this resulted in a dilution of the shareholding to 57.6%. We retain 54.0% of the voting rights.
Market environment Throughout 2010 many markets within Europe have faced a turbulent economy, including a suppressed housing market, political change and a shift in the regulatory environment. As a result, new regulations have been introduced which have created challenges for us as an insurer. These include pension legislation changes pending in Poland and new taxes introduced in France and Italy. There has been volatility in the financial markets with sovereign and corporate debt concerns particularly for Ireland, Spain and Italy. This has had a corresponding impact on consumer sentiment in all markets, with customers preferring savings products that have an element of guarantee. We have chosen to manage our product propositions to balance this need while ensuring an appropriate focus on capital management and shareholder returns. However, the economic environment also provides opportunities for us, not least the mergers of the Spanish savings banks, the €2.4 trillion2 gap in pensions savings and changing customer sentiment. We will utilise our expertise across the region and leverage the capabilities provided by our transformation to deliver returns to shareholders and market-leading products to policyholders.
1 Oliver Wyman 2 Includes the 27 countries of the European Union and the countries of Russia and Turkey
Aviva Europe performance Increased profit in a challenging market Aviva Europe increased IFRS operating profits by 13% to £898 million (2009: £797 million) underpinned by disciplined capital management and driven by a pan-European distribution model through our retail and bancassurance channels.
Life and pensions operating profit higher Life and pensions sales were maintained at £13,537 million (2009: £13,523 million), a 3% increase on a local currency basis. A number of initiatives have been enacted in 2010 including a reduction in the guaranteed interest rate in Italy and the redesign of unit-linked products in France, Ireland and Poland. This has helped to deliver a strong performance in operating profits with a 17% increase to £893 million (2009: £761 million). Furthermore it has helped to achieve a margin of 3.7% and an IRR of 13% with a payback period of 7 years, in line with the group’s short term financial targets.
Positive general insurance sales General insurance and health net written premiums increased 4% to £1,953 million (2009: £1,883 million). This is supported by management action in Poland, where we have expanded the product offering sold through independent agents, strong growth in Italian personal motor and creditor business, and strong health sales in both Ireland and France. General insurance and health profits are 17% lower at £109 million (2009: £132 million) as a result of lower long term investment returns of £147 million (2009: £175 million). Adverse weather and a significantly lower level of reserve margin release than prior year has led to a COR of 103% (2009:103%).
Customer-focussed, multi-channel distribution We operate a pan-European distribution model through our retail and bancassurance channels. We benefit from offering both life and general insurance in France, Ireland, Italy, Poland and Turkey and will assess opportunities to leverage our skills across the region. We are a leader in bancassurance and continuously evaluate potential new relationships. This year we established a new general insurance bancassurance agreement with Ulster Bank in Ireland bringing our total number of bancassurance relationships to 55. Sales through the bancassurance channel increased by 9% to £8,040 million (2009: £7,353 million).
Delivering attractive propositions to our customers We have leveraged best practice in pricing and underwriting principles across Europe in both life and general insurance. This enables us to bring attractive propositions to our customers while ensuring we generate appropriate returns for shareholders:
CPPI Fund, a unit-linked product with an element of guarantee, has launched successfully in Poland, Ireland and France.
In Turkey, we have launched a retirement savings product in anticipation of new pensions legislation. This has the potential to be a significant new market.
‘My Aviva Customer Bundling’ was launched as a pilot in Ireland to maximise cross-selling of general, life and health products for our most profitable customers.
In Spain and Ireland we have offered customers additional peace of mind through innovative product enhancements providing market-leading breast cancer cover.
Transformation delivers operational excellence We’ve made good progress in developing our shared service capabilities to embed single and consistent ways of doing business. This combined with a management focus on cost discipline has

23
Performance reviewCorporate responsibilityGovernanceShareholder informationFinancial statements IFRSFinancial statements MCEVOther information
Performance review
Aviva plc Annual Report and Accounts 2010
Europe continued
enabled Aviva Europe to maintain like for like costs at the same level as 2009. This is a great achievement that negates the impact of inflation. In addition to the pan-European product initiative above, another example of how we share expertise across the region is our approach to brand and marketing initiatives. This enables high media exposure via cost-efficient campaigns. Poland and Ireland rebranded in 2010; this was supported by the opening in Dublin of the Aviva Stadium and an extensive branding campaign in Poland. The ‘Faces’ advertising campaign, launched across France and Italy, clearly demonstrates the efficiencies gained from a single brand and extends the reach of Aviva’s global ‘You are the Big Picture’ campaign.
Europe presents a significant opportunity Europe has significant long-term potential for Aviva with a $1.7 trillion growth in life and pensions assets expected between 2009 and 2014. The strategic attractiveness of the region was underscored by research we conducted in 2010 into Europe’s pensions gap. For further detail see case study below.
Outlook There is evidence that economies in Europe are recovering at different rates as well as continuing uncertainty around legislative changes. However our geographic diversity means that we remain well positioned. As we look ahead, while there may be an element of uncertainty in some of our markets, the need for people to save and protect what they have allied with our clear strategic direction mean that we are optimistic about the long-term prospects for growth. We expect consumer sentiment to continue to favour guaranteed savings products and the general insurance market to remain competitive. Our focus in 2011 will be on positively contributing towards group’s targets through margin growth and generating operational capital. We will continue executing our strategy: driving operational excellence, maximising the value from our combination of life and general insurance and competitive distribution network, and deepening our presence in growth markets.
10 18,680
09 18,704
08 17,716
07 17,256
06 14,525
Delta LloydEurope
Long-term and savings sales £m
1,223
1,038
881
777
648
2,096
2,344
1,647
1,503
1,171
10
09
08
07
06
Delta LloydEurope
* On an MCEV basis from 2007. Prior years presented on an EEV basis.
2009 MCEV operating profit has been restated – see Financial Statements MCEV
IFRS
IFRS
IFRS
IFRS
IFRS
MCEV*
MCEV*
MCEV*
MCEV*
MCEV*
Long-term and savings operating profit £m
Aviva Europe: Bridging the pensions gap In 2010 Aviva Europe completed an assessment of the pensions gap across Europe for those retiring between 2011 and 2051. The ‘Mind the Gap’ pensions study shows the difference between:
The pension provision needed for an adequate standard of living; and
The pension amount they can currently expect to receive. This pioneering research shows that European citizens need to find an additional €2.4 trillion3 in savings every year to fully close the gap. Using our depth and breadth of life experience in the region, we are working in close partnership with governments, local regulators and the European Commission to generate tangible solutions to increase pension savings, such as our proposal for a European Quality Standard for pensions and the issue of annual pensions statements to all citizens. While this raises significant challenges across Europe, it also demonstrates the size and potential of the European pensions market and the significant opportunity that exists for Aviva. For further detail visit: www.aviva.com/europe-pensions-gap
10 3,130
09 3,046
08 4,090
07 3,232
06 3,287
General insurance and health net written premiums £mDelta LloydEurope
10 255
09 275
08 397
07 442
06 417
General insurance and health IFRS operating profit £mDelta LloydEurope
Delta Lloyd performance Delta Lloyd is one of the top five financial services providers in the Netherlands, with a growing operation in Belgium. We continue to operate in a very saturated market, where cost reduction and economies of scale are becoming increasingly important. The focus for 2010 was on growth through cost discipline, strong capital and risk management, customer focus and leading market positions, Delta Lloyd increased IFRS operating profits by 34% to £536 million (2009: £399 million) driven by higher expected investment returns, higher fund management performance fees and improved expense margins. Life operating profit increased by 19% to £330 million (2009: £277 million). The life result was impacted by a change in longevity assumptions leading to an increase in the longevity provision as at year-end 2010 and a one-off negative impact of £483 million on the IFRS result before tax. General insurance COR improved to 95% (2009: 97%) with expense savings and reserve margin releases offsetting a higher claims ratio. Fund management operating profits are 268% ahead of prior year at £103 million (2009: £28 million). Delta Lloyd implemented a simplification plan during 2010 which aims to reduce the management cost base by 8% to €850 million by 2012.
3 Includes the 27 countries of the European Union and the countries of Russia and Turkey

24
Aviva plc Annual Report and Accounts 2010 North America
Improving our position and profitability in a key region The North America region is home to two of the world’s largest and richest economies. Aviva North America consists of two businesses: our life insurance and annuity business in the United States and our general insurance business in Canada – both serve their respective home markets with support from our regional headquarters in Chicago.
Strategy Our strategic priorities for the region are focused on driving profitable growth through improving our position and competitiveness in North America:
focusing on our customers with compelling value propositions, enhanced service and personalised customer experience
improving the profitability and capital generation of the North American region, which is a net capital contributor to the Group
selectively expanding and growing our core life insurance and annuity distribution and product capabilities
operating as a great underwriting company in our general insurance business
building on our strong high-quality relationships with our distribution partners.
Market environment There are increasing signs of economic recovery and, despite the recession, North America’s economies remain among the world’s largest and its population among the world’s wealthiest. The US life insurance and annuity market and the Canadian property and casualty insurance market are very competitive and highly fragmented with a large number of insurers.
Strong profits and progress against strategic priorities across the region In 2010, the North American businesses saw strong financial performance as a result of our focus and discipline. We increased our total regional IFRS operating profit by 77% to £376 million, benefiting from strong pricing and underwriting management, cost discipline and an improved economic environment.
Healthy profit growth in US life and annuity business In the US, our disciplined pricing management led IFRS operating profits from our life and annuity business to more than double, with life new business profitability also improving significantly to a 14% IRR (2009: 7%). Our US protection sales as measured on a PVNBP basis rose 15% to £999 million and are the largest across Aviva. Annuity sales grew moderately as we focused on profitable growth and capital efficiency. We continue to focus on diversifying our business mix, specifically targeting the growth of life sales in existing and new channels.
Strong general insurance performance in Canada In Canada, operating profit rose 54% to £222 million reflecting improved underwriting performance combined with benign weather in the early part of 2010. Following our decision last year to exit unprofitable business we saw a moderate decline in premiums on a local currency basis and we concentrated efforts on growing profits from our book.
We made further progress enhancing our sophisticated underwriting capabilities and dealt successfully with new regulation in the Ontario auto market, further strengthening our position in that sector. We have taken difficult but necessary actions to improve our cost base and operational performance, including targeted cost reductions announced in November 2010 that form part of the overall £60 million of cost savings and efficiencies to be achieved across the North American Region by the end of 2012.
Outlook Regional economic growth is recovering and the outlook is for moderate growth overall. In this context, our disciplined underwriting and operational effectiveness in our general insurance business – combined with a continued focus on profitable growth underpinned by compelling value propositions to our customers in our life business – positions the North America region well to further grow our contribution to Aviva’s overall profits.
‘Building insurance around YOU’ Aviva USA approaches the life insurance and annuities marketplace in a very innovative way: by building insurance around the concept that every individual matters. Recent market shifts have made many customers wary of financial services in general which is why we wanted to make it clear that we put our customers at the centre of everything we do. Today’s consumers want to be understood and have recognition of the specific and unique reasons for considering and making decisions about financial products. We approach the market with products that are tailor-made for an individual’s stage in life. Launched in 2010, ‘Building insurance around YOU’ is the outcome of our commitment to customers, articulating our focus on getting to know them, fully understanding their priorities, and delivering life and annuity products to meet their changing needs.
10 6,686
09 6,345
09 7,316
07 5,058
06 2,284
Long-term savingsGeneral insurance
Total sales £m
10 491
09 394
08 334
07 274
18006
376
213
149
229
161
IFRSMCEV*
* On an MCEV basis from 2007. Prior years presented on an EEV basis.
Operating profit £m

Performance reviewCorporate responsibilityGovernanceShareholder informationFinancial statements IFRSFinancial statements MCEVOther information
Performance review
Aviva plc Annual Report and Accounts 2010 Asia Pacific
25
Committed to building franchise value through organic growth Aviva Asia Pacific operates in nine countries across the region through both joint ventures and wholly owned operations. China and India, both with large populations and relatively high economic growth, are ‘must-win’ markets and are expected to generate a significant proportion of our future new business. We will continue to pursue franchise value growth through organic investment and improved margins, focusing on these key markets.
Strategy Our strategy is to grow our franchise value through:
Securing strong organic growth in our chosen markets, in particular China and India.
Evolving our product portfolio to improve margin and profit. Strengthening our multi-channel distribution capability. Strengthening our talent pool.
Market environment The economic forecast from Asia Development Bank4 predicts GDP growth for emerging markets in Asia (excluding Japan) of 8.2% in 2010 and 7.3% in 2011. While competition is increasing both as a result of international competitors focusing on Asia and domestic leaders leveraging strong brands, we believe that the opportunity for Aviva to create franchise value through organic growth in Asia is unprecedented.
Franchise value growth through organic investment We continue to progress against our strategic priorities, pursuing franchise growth though organic investment and improved margins. While we operate in nine countries, we have further sharpened our focus on markets where we have strength and scale such as China, India and Singapore where we expect to generate a significant proportion of our new business growth.
Sales increase significantly as Asian franchise grows5
Total sales were £1,911 million in 2010. This represents an increase of 25% on 2009, with margin on a Present Value of New Business Premium (PVNBP) basis increasing from 0.9% to 3.2%. Life and pensions sales increased by 48%, reflecting the growth and development of Aviva’s franchise in Asia. We delivered a strong performance in our priority markets of China and India where sales increased by 28% and 22% respectively. Outside China & India, life and pension sales increased from £665 million to £1,085 million. This reflects the region’s strong economic recovery as well as our renewed strategic focus on delivering strong new business margins. Markets such as Singapore recorded a rise in life and pensions sales to £345 million from £155 million and Korea is now our second largest market after China in terms of sales volumes, growing by 41%. IFRS operating profit of £31 million was lower than prior year, which included favourable reserve releases in Singapore and Aviva’s Australian life business (sold 1 October 2009). Excluding these one-off factors and the one-off impact from the change in China’s GAAP accounting basis this year, underlying adjusted operating profit increased by £40 million reflecting our increased
4 Asian Development Bank outlook 2010 update, 28 September 2010 5 Excludes the Australian life business sold on 1 October 2009
scale and focused cost management. We have also focused on capital efficiency. Our internal rate of return (IRR) has improved significantly from 6% to 11% through increasing benefits of scale coupled with careful portfolio management and capital discipline.
Strengthening our multi-channel distribution capability Our improved performance in 2010 can be largely attributed to strengthened relationships with our bank partners. This has encouraged an evolving product portfolio focused on higher-margin products in areas such as protection and saving. We have continued to build our multi-distribution platform and now have over 50 bank partnerships, with sales from our bancassurance operations increasing by 76% since 2009.
Outlook The fundamentals of the Asian markets remain attractive with the region’s economies reverting to pre-crisis levels. The longer-term outlook for our business in Asia remains positive and high growth rates are expected in the medium term, owing to the current low penetration rates of insurance products in many markets, high GDP growth, a growing middle class and ageing populations. By strengthening our multi-channel distribution capability as well as managing our product portfolio for margin and profit, we will be well positioned to continue delivering strong growth in both volumes and margins.
Aviva Advisors The financial needs of our customers are evolving rapidly in Asia. To address this, in Singapore and Hong Kong, we are transforming the traditional agency model with the launch of a truly innovative channel – Aviva Advisors. This ‘owned’ channel, unique in the market, is led by professional advisors who are equipped with innovative and differentiated life insurance products, services and state of the-art tools to meet their clients’ needs. It bridges the gap between the traditional agency and independent financial advisors.
10 2,178
09 1,717
08 1,852
07 1,883
06 1,459
Total sales £m
Sales include Aviva Investors Australia, and excludes the Australian business sold on 1 October 2009
1069
0986
0869
07101
9206
31
77
36
37
50
IFRS MCEV*
* On an MCEV basis from 2007. Prior years presented on an EEV basis.
Operating profit £m

26
Aviva plc Annual Report and Accounts 2010
Aviva Investors
Strong progress in the development of our global infrastructure Aviva Investors is the globally integrated asset management business of the Aviva Group. We manage funds for Aviva and a growing range of third-party clients. We enjoy a close and mutually beneficial relationship with Aviva, supported by the financial strength and global brand presence of the Group, and in return, delivering investment know-how, strong and sustainable returns and supporting financial risk management initiatives.
Strategy Aviva Investors’ strategy is to leverage our Aviva parentage and insurance heritage to grow third-party sales, maintain and, where possible, increase the assets we manage on behalf of Aviva, and through these actions materially increase our contribution to Group profitability. Our nine key strategic imperatives are:
Focusing on external sales and revenues. Establishing the right product and solution offering –
including development of our fixed income proposition. Enhancing investment performance. Driving innovation by developing and implementing a new
way of working. Expanding our global footprint and centres of excellence. Developing strong client service for a scaleable business. Integrating globally to provide a scaleable platform. Creating a robust risk-managed operating platform. Driving capability development by attracting, developing,
motivating and retaining the talent that the business needs to meet its strategic aims.
Market environment Investors continued to take a more cautious view on investment opportunities in 2010. Pension funds in particular, the biggest source of global assets following the financial crisis, have increased attention to risk management. Aviva Investors has worked to adapt its products to meet this growing demand. We also see opportunities arising from increased regulation in developed markets, as this creates barriers for new entrants and opportunities for some existing firms.
Growth in external sales We made strong progress in the development of our global business development infrastructure during 2010 and saw encouraging signs that our business model is supporting our primary objective of delivering strong growth in external fund sales. Net funded external sales (excluding liquidity funds) rose from an outflow of £236 million in 2009 to inflows of £2,364 million in 2010, gross external sales were £8,320 million offset by higher than expected redemptions of £5,956 million. Net liquidity fund sales were an outflow of £745 million (2009: inflows of £2,593 million). During 2010, we re-oriented our business towards more durable, higher margin funds, which resulted in an increased average fee rate on gross external sales, excluding liquidity funds. Assets under management of £260 billion (at 31 December 2010) were up 4% on 2009’s figure of £250 billion, with assets managed for external clients increasing 13% to £51 billion (2009: £45 billion).
Strong investment performance and further improvements in client service At the end of 2010, 73% of institutional funds where a benchmark is specified, performed above benchmark over the one year and three year horizon (equally weighted). For portfolios measured against a relevant peer group, 70% performed above median over one and three years at the end of December 2010, with 33% in the top quartile over one year and 42% in the top quartile over the three year period. Our focus on client-centricity enabled us to deliver further improvements in client service rankings for Aviva UK, UK institutional and for UK/European financial institutions in 2010 according to independent surveys undertaken by Investit. Rankings in UK pensions, measured by Greenwich Associates, slipped slightly in comparison with 2009 from 1st quartile to 2nd, but we remain in a strong position competitively.
Continuing investment in the business leads to a fall in operating profit Operating profit fell from £115 million in 2009 to £100 million in 2010 as a result of higher than expected redemptions and ongoing investment in the business which is starting to bear fruit as we see an increase in higher margin external assets. The £100 million profit in 2010 comprises £97 million (2009: £115 million) in respect of fund management operations and £3 million (2009: nil) from our pooled pensions business, which is reported within the long-term business segment.
Strengthening our mutually beneficial position within Aviva Our growth is focused on leveraging our Aviva parentage and insurance heritage to increase external assets under management. Our Guaranteed Managed Solutions (GMS) product in the US for example, brought in over £500 million of mandates in the last four months of the year. GMS was developed in partnership with Aviva USA and is an important product for both companies.
Outlook We have made considerable progress developing the infrastructure necessary to meet our objectives and are seeing the benefits of this through improved sales performance. In 2011 we will continue to focus on our core investment strategies to deliver added-value investment solutions to clients in our established markets of the UK, Europe and the US, as well as actively pursuing market share in potential high-growth markets in the Asia Pacific region.
1030
0940
0841
0764
5706
Aviva investors operating profit £m
100
115
114
147
112
IFRS MCEV*
* On an MCEV basis from 2007. Prior years presented on an EEV basis.
10 260
09 250
08 236
Funds under management £bn
07 235

Performance reviewCorporate responsibilityGovernanceShareholder informationFinancial statements IFRSFinancial statements MCEVOther information
Performance review
Aviva plc Annual Report and Accounts 2010
Information on the company
27
History and development of Aviva General We are a public limited company incorporated under the laws of England and Wales. We are one of the world’s leading global insurance groups. We are the sixth largest insurance group in the world, based on gross written premiums for the 2009 year. We are one of the top five providers of long-term insurance and savings products in the UK, Ireland, the Netherlands, Poland and Spain and one of the top ten providers of long-term insurance and savings products in France and Italy for 2009. More detail is provided within the operating segment review later in this section. Our main activities are the provision of products and services in relation to long-term insurance and savings, general insurance and fund management.
Our history The Group was formed by the merger of CGU plc and Norwich Union plc on 30 May 2000. CGU plc was renamed CGNU plc on completion of the merger, and subsequently renamed Aviva plc on 1 July 2002. CGU plc and Norwich Union plc were both major UK-based insurers operating in the long-term insurance business and general insurance markets. Both companies had long corporate histories. CGU plc was formed in 1998 from the merger of Commercial Union plc and General Accident plc. Hand in Hand, which was incorporated in 1696, was acquired by Commercial Union in 1905, which itself was incorporated in 1861. General Accident plc was incorporated in 1865. Norwich Union plc was founded as a mutual society in 1797 and operated as such until 1997, when it demutualised and became an English public limited company. Between 2000 and 2002 we actively withdrew from lines of business and markets that did not offer the potential for market-leading positions or superior returns, or did not otherwise meet our strategic objectives, principally through the disposal of property and casualty businesses in the UK London Market, the US, Australia, New Zealand and certain European countries. Since 2002, we have grown in part through carefully selected acquisitions, in particular the acquisitions of RAC in 2005 and AmerUs in 2006. During 2009, we disposed of our long-term and savings and wealth management in Australia and through an IPO we sold approximately 42% of our Dutch business, Delta Lloyd. In January 2010 we integrated our life, general insurance and health businesses in the UK under one CEO. We also announced the acquisition of River Road Asset Management, a US equity manager, to support the expansion of Aviva Investors business. Further details of recent acquisitions and disposals can be found in the section ‘Financial statements IFRS – Note 3 – Subsidiaries’.
Business overview Our aims and strategy We have simplified and streamlined the Group, moving from a federation of independent businesses to a successful global business. However there is no doubt the world has changed significantly in the last few years. This is particularly true for Aviva’s customers, who are responding to the uncertain economic climate and lower disposable incomes by paying down debt and saving more, to ensure a more secure financial future for themselves and their families. For insurance companies, such as Aviva, the capital constraints of today demand investment discipline, greater strategic focus and strong balance sheets. In addition, the
regulatory environment has moved towards greater regulatory scrutiny and the advent of Solvency II. We assessed our strategic direction against the backdrop of these changes and came away with three principal conclusions:
Increasing geographic focus We will focus on markets where we have strength and scale. In determining our focus we will judge markets on their potential to generate both $100 million of IFRS operating profits and a 12% return on capital employed, or $1 billion of franchise value for younger businesses. This focus will allow us to capitalise on our leading market positions in the UK and Europe, the world’s largest life and pensions market.
Benefiting from the combination of life and general insurance Our life and general insurance operations are excellent businesses in their own right, but in addition to their inherent strengths there are significant advantages of running these businesses under one brand and in one group, supported by Aviva investors.
Building on our core strengths To be the best in both life and general insurance, we will focus on our four core strengths of marketing and distribution, financial discipline, technical excellence and operational effectiveness, benefiting from a powerful brand and growing customer franchise.
Our business Overview Our principal activity is the provision of financial products and services, focused on the following lines of business: long-term insurance and savings business, general insurance and health and fund management. Our business is managed on a geographic basis through a regional management structure based on four regions: UK, Europe, North America and Asia Pacific. The four regions function as six operating segments as both the UK and Europe regions are split into two operating segments. Due to the size of the UK region it is split into the UK Life and UK General Insurance segments, which undertake long-term insurance and savings business and general insurance respectively. In Europe, Delta Lloyd is managed separately from the other European businesses; therefore the region is split into Aviva Europe and Delta Lloyd operating segments. Aviva Investors, our fund management business and sixth operating segment, operates across all four regions providing fund management services to third-party investors and to our long-term insurance business and general insurance operations. For information on the main categories of products sold in each of these geographic segments over the last three years, see ‘Financial and operating performance – Regional performance’. Our geographic operating segments offer the following lines of business to a greater or lesser extent:
Long-term insurance and savings business Long-term insurance and savings business accounted for over 75% of our total business based on sales for the year ended 31 December 2010. We reported total long-term insurance and savings new business sales of £33.4 billion and investment sales of £4.0 billion for the year ended 31 December 2010. Our focus remains on growing our business profitably and improving our operational efficiency so that we can fully benefit as our major markets return to economic growth.
Market position In the UK we have a market share of 11% based on annual premium equivalent (APE) according to the Association of British Insurers (ABI) quarter three 2010 data. APE is a recognised sales

28
Aviva plc Annual Report and Accounts 2010 Information on the company continued
measure in the UK and is the total of new annual premiums plus 10% of single premiums. Long-term insurance and savings products in the UK represented 25% of our worldwide sales for the year ended 31 December 2010. Long-term insurance products from our European businesses (excluding the UK) represented 40% of total Group worldwide sales for the year ended 31 December 2010. In North America our life and annuity business is a leading provider of both fixed indexed life and fixed indexed annuity products, according to reports in 2010 from LIMRA and AnnuitySpecs. In the Asia Pacific region we operate in nine countries with businesses at different stages of development.
Brands and products In the UK we operated under the Norwich Union brand until June 2009, when Norwich Union became Aviva. Following the rebrand of Hibernian Aviva in Ireland to Aviva in January 2010 and Aviva Commercial Union in Poland to Aviva in June 2010, we operate under the brand name Aviva throughout Europe and the rest of the world. The exception to this is in the Netherlands, where we operate under the Delta Lloyd brand. Our long-term insurance and savings businesses offer a broad range of life insurance and asset accumulation products. Our products are split into the following categories:
Pensions – a means of providing income in retirement for an individual and possibly his or her dependants. Our pension products include personal and group pensions, stakeholder pensions and income drawdown.
Annuities – a type of policy that pays out regular amounts of benefit, either immediately and for the remainder of a person’s lifetime, or deferred to commence from a future date. Immediate annuities may be purchased for an individual and his or her dependants or on a bulk purchase basis for groups of people. Deferred annuities are asset accumulation contracts, which may be used to provide benefits in retirement, and may be guaranteed, unit-linked or index-linked.
Protection – an insurance contract that protects the policyholder or his or her dependants against financial loss on death or ill-health. Our product ranges include term assurance, mortgage life insurance, flexible whole life and critical illness cover.
Bonds and savings – accumulation products with single or regular premiums and unit-linked or guaranteed investment returns. Our product ranges include single premium investment bonds, regular premium savings plans, mortgage endowment products and funding agreements.
Other, which includes equity release and structured settlements.
Investment sales comprise of retail sales of mutual fund type products such as unit trusts, individual savings accounts (ISAs) and Open Ended Investment Companies (OEICs).
Some of our insurance and investment contracts contain a discretionary participating feature, which is a contractual right to receive additional benefits as a supplement to guaranteed benefits. These are referred to as participating contacts.
General insurance and health General insurance and health insurance together accounted for 21% of our total sales for the year ended 31 December 2010. In the year ended 31 December 2010, we reported general and health insurance net written premiums of £9.7 billion.
Market position We are one of the leading general insurers in the UK and Ireland based on gross written premiums for the year ended 31 December 2009 and we are one of the top five general insurers in Canada and the Netherlands, as based on gross written premiums for the year ended 31 December 2009. The Group has other European general insurance operations in France, Italy, Poland and Turkey, and in Asia Pacific we sell general insurance and health products in Malaysia, Singapore, Indonesia and Sri Lanka. In the year ended 31 December 2010, 47% of our total general insurance and health business was written in the UK.
Brands and products Our general insurance business currently operates under different brand names, with Aviva and the RAC in the UK and Delta Lloyd in the Netherlands. Our other general insurance operations in Europe, Canada and Asia Pacific operate under the Aviva brand. During 2010, businesses in Ireland and Poland completed their transition to the Aviva brand as part of a global branding exercise. RAC in the UK and Delta Lloyd in the Netherlands will remain unchanged. Our general insurance business concentrates on personal lines and commercial lines insurance through the provision of motor, household, travel, creditor, commercial liability and commercial property coverage. Our health insurance business concentrates on private health insurance, income protection and personal accident insurance, as well as a range of corporate healthcare products.
Distribution We have various distribution agreements with bancassurance partners and joint ventures across many markets in which we operate. The agreements contain similar terms and depending on our line of business in that market offer long-term insurance products, general insurance and health products, asset management services or a combination thereof. The agreements have a defined contract term, frequently with the option to extend. In return for offering our products to their customers, the bank or joint venture partners receive a commission as a percentage of sales and in some cases achieve extra commission if agreed target levels of sales are met. Certain agreements have a profit sharing element based on a predetermined percentage. The success of the agreement is regularly monitored against certain performance indicators which are those typically used by the management of the business. In some cases, if the agreed targets are not met, the terms of the contract can be renegotiated, typically with respect to the level of commission or profit sharing percentage. Under joint venture agreements, the costs of running the venture are often split between the partners.
Fund management The fund management businesses manage the funds of Aviva’s general insurance and long-term insurance and savings operations and provide investment management for institutional pension funds, as well as developing and selling retail investment products. Our main brand for fund management is Aviva Investors. The main fund management operations are in the UK, France, the Netherlands, Ireland, the US and Australia. All sales of retail fund management products are included in our long-term insurance and savings business sales.
Market position Aviva Investors is ranked 32nd globally by assets under management, according to Cerulli Associates’ December 2009 ranking of asset managers by assets under management. Aviva Investors operates under a single brand in 15 countries across our regions of the UK, Europe, North America and Asia Pacific.

29
Performance reviewCorporate responsibilityGovernanceShareholder informationFinancial statements IFRSFinancial statements MCEVOther information
Performance review
Aviva plc Annual Report and Accounts 2010
Information on the company continued
The other fund management businesses of Aviva comprise our collective investment business with the Royal Bank of Scotland Group in the UK, Delta Lloyd in the Netherlands and our Navigator wrap administration business in Hong Kong and Singapore. Total worldwide funds managed by Aviva Investors at 31 December 2010 was £260 billion, the substantial majority of which currently relates to Aviva’s insurance and savings operations.
Brands and products Our business in the UK manages investments including equities, fixed income, property, hedge fund and socially responsible investments (SRIs) on behalf of institutional, pension fund and retail clients. Up until 31 December 2010, we also sold retail ISAs, unit trusts, OEICs and structured products under the Aviva Investors and the Royal Bank of Scotland Group (RBSG) brands.
Operating segments Each operating segment has a member of our executive management team who is responsible for it and who is accountable to the group chief executive for the operating performance of their segment. The full membership of our executive management team is set out on page 96. This structure for our operating segments is intended to ensure the Group’s ability to take advantage of market opportunities, improve speed of response, eliminate duplication of effort, and encourage the sharing of best practice in the interests of our customers and shareholders, while providing local knowledge.
United Kingdom Aviva Business overview and strategy As a leading UK insurer, our UK business operates through two major brands, Aviva and RAC. Our aim is to provide prosperity and peace of mind to the 19 million customers, or one in three UK households, who hold either long-term insurance, general insurance, healthcare or motoring services products with us. Aviva is a leading insurance brand and customer franchise in the UK. We have significant customer reach with customers able to purchase our products direct, through intermediaries, and through significant partnerships with the top UK banks and other institutions such as the Post Office. We employ 21,000 people and operate from a number of locations throughout the UK, including York, Norwich, Perth, Glasgow, Eastleigh, Bristol and Sheffield. We also have outsourcing relationships with a number of partners including Swiss Re, Scottish Friendly and International Financial Data Services (IFDS) in the UK, and WNS in India and Sri Lanka. The UK life and general insurance businesses were drawn together under common leadership at the start of 2010, creating significant opportunities for shareholders and customers. We identify brand, financial strength and a commitment to service, as our key strengths. Our core strategy is to leverage our range of market-leading products, our extensive distribution network and our customer base to outperform the UK market. We believe that our rigorous use of capital, further improvement in customer retention, reduction in new business acquisition costs and increase in productivity through the simplification of processes, services and costs will drive greater value for shareholders. In 2010, Aviva’s UK markets have continued to be affected by the challenging economic conditions experienced by the UK as a whole, including the slowdown in the housing market.
United Kingdom Aviva Life Business overview and strategy Our UK life insurance business is a leading long-term insurance and savings provider in the UK with a market share of 11% based on third quarter 2010 ABI returns. Our key strengths include a
balanced distribution and broad product mix, a strong brand, and underwriting and risk management expertise. This breadth of distribution and product range aims to makes us more resilient to changes associated with the implementation of the Retail Distribution Review. We seek to outperform the UK Life market while delivering enhanced margins and an increase in Internal Rate of Return (IRR).
Market and competition The UK long-term insurance market is highly competitive. According to research undertaken by Aviva, in conjunction with Deloitte, there is a potential annual pensions gap of some £317 billion, the difference between what an individual saves today, and what they need to save in order to pay for a comfortable standard of living in retirement. Research by Swiss Re also identifies a potential protection gap of £2.4 trillion, which is the difference between the life insurance and financial protection cover an individual has and the amount they need to meet their needs. We believe these shortfalls offer significant opportunities for long-term insurance companies within this market. The UK long-term insurance market is highly competitive. We consider our main competitors to be Prudential, Legal & General, AEGON, Standard Life and Lloyds Banking Group. The principal competitive factors for our life insurance business in the UK are:
Financial strength and ratings; Brand strength and customer advocacy; Focus on customer and quality of service; Range of product lines and quality of products on offer; Strength of distribution channels; Pricing; and Investment management performance.
Products We provide an extensive product range in the UK that covers pensions, annuities, protection, bonds and savings and equity release products, as well as investment products. We hold strong positions in each of our key markets of savings, protection, and annuity products based on APE in 2010 according to ABI returns. We write both non-profit and with-profit business. Non-profit business means that shareholders retain 100% of the distributed profits. With-profit business means that policyholders are entitled to at least 90% of the distributed profits, with shareholders receiving the balance. The with-profit products share profits and losses of the with-profit fund with its investors. This is achieved through a system of bonuses. In deciding the regular bonuses Aviva aims to smooth the return of the policyholder’s plan. As bonuses are added to the plan, valuable guarantees build up. These guarantees are unique to with-profits investments. At the close of the plan the investor receives a terminal bonus based on the performance of the fund. We provide a number of traditional life insurance products including level-term, decreasing-term and guaranteed whole life insurance, guaranteed lifelong protection plans and critical illness cover products. Our savings and investment products include ISAs, investment bonds, funds, base rate trackers, capital protected plan and with-profits products. The pensions and retirement products we offer include stakeholder, personal pensions, equity release, annuities, income drawdown and with-profits products. Our annuity offerings include immediate life, enhanced and with-profit pension annuities.
Distribution We have a multi-distribution strategy. We are a leading provider in the intermediary market with the majority of our sales through

30
Aviva plc Annual Report and Accounts 2010 Information on the company continued
independent financial advisers (IFAs). This is particularly the case for our savings and investment products as customers seek advice due to the complex nature of the products, the regulation surrounding them and the need for these products to meet the individual circumstances of the customer. We are a leading insurance partner for the biggest UK banks and building societies. We recently agreed the renewal of our successful strategic partnership with Royal Bank of Scotland Group with a new, exclusive seven year distribution agreement for the sale of life, protection and pensions products from 1 January 2011. We will also be launching life protection products through the extension of our existing general insurance distribution agreement with Santander from June this year. We have strong existing relationships with a number of banks and building societies, distribution deals with the Co-operative Insurance Society and the Post Office, and growing corporate and direct channels.
United Kingdom Aviva General Insurance Business overview and strategy Aviva is a leading general insurer in the UK, with a market share in 2009 of over 10% according to Datamonitor. We focus on personal and commercial insurance and are also a leading provider of motoring services through the RAC, as voted by the JD Power survey since 2006. Our key strengths include underwriting excellence and product and distribution leadership. We aim to maintain a market-leading position while focusing on insurance fundamentals to maximise returns through the insurance cycle. We seek to provide excellent customer service, maintain disciplined underwriting and pricing and control the impact of claims inflation.
Market and competition The UK is the third largest insurance market in the world according to the ABI based on data for 2009. In 2009, the top four companies had approximately 36% (2008: 39%) of the general insurance market share, based on Datamonitor figures for gross written premiums. Insurance profits in the UK general insurance market are cyclical in nature, with different segments of the market at different stages in the cycle. In personal motor we have seen significant premium rate increases in 2010 in response to recent increases in claims costs and frequencies, most notably for bodily injury claims. Homeowner rates have seen little movement reflecting a competitive environment and the depressed housing market. Conditions in commercial lines have also remained competitive with rating increases proving difficult to achieve. We are growing our capability in Corporate Risks and Specialty Lines business, building on our core underwriting and pricing strengths to win in these markets. In recent years, the growing proportion of commercial brokers seeking to trade with us online has led us to invest more heavily in our e-commerce propositions, ensuring we remain competitive and alert to evolving customer needs in this important distribution channel. We consider our main competitors to be RBS, RSA, AXA, Zurich, Lloyds Banking Group, Allianz and The Admiral Group. The principal competitive factors for our general insurance business in the UK are:
Range and quality of products; Access to distribution; Pricing and underwriting discipline; Brand association; Customer satisfaction; Claims handling; and Cost management.
Products We provide a range of general insurance products focused on personal and commercial customers. We held top three positions in all our major classes of business for 2009, according to Datamonitor, based on gross written premiums. Our general insurance business mix is approximately 60% personal lines and 40% commercial lines. Our general insurance products include personal motor, home, travel, payment protection, commercial motor, commercial property and commercial liability insurance. We also offer a range of breakdown products through the RAC. Our personal motor insurance product range includes cars, motorcycles and vans. For businesses we offer cover for fleets and commercial vehicles. Our home insurance products include building and contents insurance and home emergency cover. Our commercial products focus on insurance for small to medium enterprises and, from 2010, the larger UK corporate risk market. Looking forward we are aiming for controlled expansion in both the corporate risks and specialty lines.
Distribution We have a multi-distribution strategy. Our personal products are sold directly to customers over the phone and through our website www.aviva.co.uk, via brokers and through over 100 corporate partnerships. Our RAC insurance offerings are also available through price comparison sites. For commercial insurance, we focus on broker distribution and believe that independent brokers remain the best source of the advice required by business customers. As part of our strategy to increase our appetite in the Corporate Risks Sector (CRS), we now have a bespoke trading floor in the City of London, providing direct access to our CRS specialists.
Europe Regional overview and strategy Europe (excluding the UK) offers a huge opportunity for Aviva, with $1.7 trillion growth in life and pensions assets expected between 2009 and 2014, according to Oliver Wyman. We have a major presence in the five markets of France, Ireland, Italy, Poland and Spain, which between them represent nearly 80% of our new business premiums. We are also focused on increasing our presence in the growing markets of Russia and Turkey and continue to manage our strategic investment in Delta Lloyd in the Netherlands. Through our leading bancassurance franchise and established retail networks, we offer a range of life, pensions, general and health insurance and asset management propositions, providing the diversity and competitive strength that only a composite insurance model can offer. We are already a top six provider in our five largest markets for life products5 and have a strategy to grow our general insurance presence.
Aviva Europe Our Quantum Leap transformation plan is focused on delivering benefits in the markets of France, Ireland, Italy, Poland, Spain, Russia and Turkey. Across these we operate a composite model, selling life and pensions products, general insurance products and providing asset management propositions. In Russia and Spain we currently have a purely life distribution model. This pan-European composite distribution model enables us to exploit our existing relationships and networks in order to develop higher margin customer targeted products, to improve our
5 Based on regulatory data from FFSA,, IIF, ANIA, KNF, ICEA

31
Performance reviewCorporate responsibilityGovernanceShareholder informationFinancial statements IFRSFinancial statements MCEVOther information
Performance review
Aviva plc Annual Report and Accounts 2010
Information on the company continued
product mix by increasing sales of protection and unit-linked products and to expand our general insurance distribution. Our strategy is focused on developing five core capabilities, which are:
Customer-focused multi-channel distribution; Product simplification and innovation; Shared operational excellence; General insurance claims management; and Governance and risk management.
We have a strong bancassurance model that serves customers throughout Europe via 55 banking agreements. We have strong partnerships including Credit du Nord in France, six of the savings banks in Spain, Allied Irish Bank in Ireland and relationships with five banks in Italy, including UniCredit Group. We also have a significant retail franchise, with a presence in all of our markets, operating through more than 8,000 direct and tied agents across 30 networks and with an independent sales force of 6,000 consultants. This is supported by our move to a single retail operating model, where shared tools and the creation of centres of excellence are enabling us to maximise our sales capability. We are also building a shared platform that will provide us with the ability to meet the demands of each prospective partner’s requirements in a rapid and efficient way, creating value for both Aviva and our partners, all whilst driving down the cost per policy. This strategy is enabling us to increase our sales force productivity, improve customer retention, develop and price innovative and customer-centric product propositions and create economies of scale through pan-European cost management.
Market and competition The region is split between mature Western European markets with high wealth and insurance penetration and the developing markets of Central and Eastern Europe. Competitive intensity and market consolidation varies across the region depending on the size and stage of development of each market. Across the region consolidation is low; based on total insurance premiums from the CEA the top five insurers hold less than 35% of the market. Our competitors comprise a mixture of large pan-European insurers, such as Allianz and AXA, and local insurers, such as Powszechy Zaxlad Ubezpieczan (PZU) in Poland and CNP Assurances (CNP) in France. The largest insurers across the region are Allianz, Generali and AXA. Market data from SwissRe SIGMA shows that as at 31 December 2009, Aviva has a 5.5% share of the life markets in which we operated (including the UK and non-participatory investment contracts, excluding business written outside of Europe, non-primary insurance and inaccessible markets, for example compulsory healthcare), which makes us the fourth largest insurer in Europe. We have several strengths that we believe give us a competitive advantage in Europe, which include:
our strong bancassurance franchise; our diversified insurance model; our firm establishment in the markets in which we have
chosen to compete; and our pan-European transformation plan.
All of these strengths support our efficient, effective, composite insurance model and allow us to pursue growth potential in the underpenetrated markets of Russia and Turkey.
France Business overview and strategy Aviva France is one of the top ten insurance businesses in France, being sixth in life insurance and eighth in general insurance as
measured by gross written premiums, according to L’Argus de l’Assurance, as at 31 December 2008. Our life business has a 4.5% market share according to the Fédération Française des Sociétés d’Assurances (FFSA) as at 31 December 2010, based on gross written premiums. Our general insurance business has a 1.9% share of the market as based on 2010 premium income, according to the FFSA, measured by gross written premiums. Our health business has a 2.3% share of the market based on 2008 premium income, also according to the FFSA, measured by gross written premiums. We offer a range of long-term insurance and savings products, primarily for individuals, which focus on the unit-linked market. We have a longstanding relationship with the Association Française d’Epargne et de Retraite (AFER), which is the largest retirement savings association in France with 730,000 members as at 31 December 2010. We have a strong partnership with Crédit Du Nord, operating through 931 bank branches as at 22 September 2010. Aviva France operates through two main companies: Aviva Vie and Antarius. In our general insurance business we predominantly sell personal and small commercial lines insurance products through an agent network and our direct insurer, Eurofil. Our strategy for Aviva France is to continue the diversification and growth of our business and to maintain a high level of profitability. We seek to accomplish these goals through our distribution expertise, innovation of products and services, greater communication and brand visibility.
Market We believe that the long-term insurance and savings market in France has longer-term growth potential due to the ageing population and the growing need for private pensions. We also believe that the current volatility in the financial markets has affected customer confidence in purchasing risk bearing products although we believe that over a longer period, multi-funds policies and unit-linked funds are the best insurance vehicles for performance. In the context of the ageing population and economic crisis, we believe our customers are expressing the need to be reassured and protected financially. We believe that there are real needs for protection in the form of long-term care and safeguarding wealth. The increase in health spending and the public authorities’ difficulties in financing the system are leading to a gradual transfer of health spending to private insurers. The general insurance market in France is mature and characterised by fierce competition. For several years, price competition was high as they aimed to gain market share, particularly in the personal lines market. Price competition has, however, reached its limits as the market currently faces increased claims frequency and a higher average claims cost. In the last few years, the industry has also faced major climatic events (storms Quentin, Klaus and Xynthia as well as floods) which have impacted general insurers’ results.
Products Aviva France provides a wide range of insurance solutions: life and long-term savings, general insurance and asset management through Aviva Investors France. The main products sold through our life channel are long-term savings, pensions and regular premium products and a broad range of protection products. We are the main distributor of the AFER product which is a leading savings product, benefiting from high customer confidence, a strong reputation and strong financial performance. In particular we believe we have developed a reputation for excellence in unit-linked products with on average 50% of our unit-linked funds being first quartile performers in 2009, according to Aviva Investors France.

32
Aviva plc Annual Report and Accounts 2010 Information on the company continued
Aviva France holds a majority stake in Union Financière de France (UFF) which we believe has gained a reputation for expertise in managing, selecting and distributing mutual funds and sourcing tax optimisation products. In the general insurance market, our product range includes household, motor, health, legal protection products and also a broad range of insurance products for farms, craftsmen, tradesmen and small to medium sized entities and specific products for building firms and motor fleets.
Distribution Aviva France has developed a multi-distribution model combining retail, direct and bancassurance networks through owned distribution channels, independent networks and partnerships. Our retail networks sell through 870 tied agents, a direct sales force composed of 338 advisors and 662 UFF consultants and more than 1,000 active brokers in the life, health and construction markets. Direct distribution is sold through Eurofil for personal general insurance, Aviva Direct for health and protection and Epargne Actuelle for the AFER product. Eurofil is the second largest direct general insurer and Aviva Direct is the second largest insurer of funeral expense plans in France by number of policies according to the FFSA as at 31 December 2009. We also operate in the bancassurance market through our partnership with Crédit du Nord, a subsidiary of Société Générale selling life, savings, protection and general insurance products. This partnership gives Aviva access to 1.8 million customers, as at 31 December 2010. We also have several partnerships with car manufacturers including Volvo, Ford, Mazda, Mercedes Benz and GM.
Ireland Business overview and strategy Aviva Ireland had a 16% share of the Irish long-term insurance and savings market in 2009 based on gross written premiums according to the Irish Insurance Federation (IIF), and is the fourth largest life and pension provider in Ireland. Our general insurance business is the largest in Ireland, with a market share of 16% in 2009 according to the IIF. Aviva has a 13% market share making it the third largest health insurer in Ireland based on research conducted by REDC Research and Marketing (REDC) on behalf of the Irish Health Insurance Authority (HIA). Aviva Ireland has over one million customers across its general insurance, life & pensions, asset management (which is managed by Aviva Investors) and health insurance businesses. Our strategy is focused on delivering sustainable, profitable growth, maximising capital generation and leveraging our product portfolio.
Market The life insurance market in Ireland is largely consolidated with approximately 78% of the market share being held by the top four providers, including Aviva, according to a report by IFF based on 2009 gross written premiums. We believe that customers have moved away from traditional life products in Ireland because of volatility in the stock markets and a slowdown in the housing market in the last three years. We believe that the general insurance market in Ireland remains extremely competitive in both personal and commercial lines, with large weather related losses in 2010 across the market in January, November and December. Motor is the largest class of business representing 43% of the general insurance market followed by property which accounts for 30% of the market at 31 December 2009, according to the IIF.
Products Our long-term insurance and savings business offers a comprehensive range of protection, bonds and savings and pension products. The protection products include single, dual and joint life insurance, mortgage protection, specified illness and guaranteed whole life cover products. The pension range covers retirement and investment products including government promoted personal retirement savings account (PRSA) schemes. Our general insurance and health businesses provide a wide range of products including property, motor, travel, farm and business insurance. Our motor business is more focused on personal lines, while our property business is primarily commercial lines. Our health insurance business provides a range of plans in both the personal and company plan sector with access to hospitals, treatment and scan centres.
Distribution Aviva Ireland has a wide range of distribution channels, including intermediary channels such as brokers, bancassurance partners, corporate partners and direct channels including call centres, internet and a nationwide branch network. Our long-term insurance and savings products are distributed through our broker network, our bancassurance partnership with Allied Irish Bank plc (AIB) and our branch network. Our general insurance business is sold through all of our distribution channels, with an increasing proportion offered by direct and corporate partners. We also provide branded products for a number of financial institutions, namely AIB, Ulster Bank and Postbank. Traditionally the majority of our health business was sold via our direct channels; however there has been a significant increase in the business sold through the intermediary channel in 2010.
Italy Business overview and strategy Aviva Italy is the country’s sixth-largest life insurer, with a market share of 5% based on 2009 premiums according to Associazione Nazionale fra le Imprese Assicuratrici (ANIA). We are the 13th largest general insurance company in Italy with a market share of 1%, and over 2.3 million customers, according to ANIA. Our strategy is to continue to work with our partners on new products, suited to the current markets, to develop our bancassurance relationships and to expand our customer reach, through customer penetration and expanding our distribution reach.
Market In the Italian life market, large groups dominate the market, with the top four providers writing 50% of the life premium income in 2009 according to ANIA. After the decline in the market in 2008, the insurance industry in Italy reported a strong growth in volumes in 2009 with gross written premiums up by 28% to €118 billion according to ANIA. The life segment grew by 49% driven by the strong demand by customers for with-profit products. The general insurance segment declined 2% due to a reduction in the motor segment. In the Italian market, we believe that many customers prefer investment products from well-established long-term insurance companies as long-term savings vehicles. We also think that consumers prefer developing a personal relationship with the bank distributing products through one-to-one contact. Internet and telephone channels are not widely used in Italy. Over the last few years, the Italian government has introduced legislation to break the exclusive relationship between general insurance companies and their ‘tied’ agents and therefore has widened the availability of general insurance products from

33
Performance reviewCorporate responsibilityGovernanceShareholder informationFinancial statements IFRSFinancial statements MCEVOther information
Performance review
Aviva plc Annual Report and Accounts 2010
Information on the company continued
different insurers. This has opened up the general insurance marketplace to increased competition from different channels.
Products Our long-term insurance and savings business offers a wide range of products covering protection, bonds and savings and pensions. The largest segment is single and regular premium savings and investment products. These include unit-linked policies linked to a range of investment funds as well as profit-sharing policies where there is a minimum annual return credited to the policy and the potential for an additional bonus. Also, we provide index-linked products where there is typically some protection of capital at the end of the policy term and a pay-out linked to the performance of an index or basket of shares. A growing area of the market is credit protection insurance, where protection on death and disability is provided for mortgages and credit loans. Individual and group pension plans are also available and this part of the market is expected to grow in the long-term given the ageing population and government reforms to reduce the cost of state retirement provision. Our general insurance business in Italy mainly provides motor and home insurance products to individuals, as well as small commercial risk insurance, including marine insurance, to businesses. For reporting purposes the Italian general insurance business is shown within ‘Other Europe’ in the general insurance segment.
Distribution Our products are distributed principally through bancassurance partnerships with UniCredit Group, Banco Popolare Italiana Group (BPI), Banca Popolari Unite (BPU) and Unione di Banche Italiana (UBI). These partnerships give us access to more than 6,300 branches. In addition, we also have 650 insurance agents and access to approximately 5,100 sales advisers, as at 31 December 2010. We distribute general insurance products primarily through agents and brokers, with a growing proportion of bancassurance sales.
Poland (including Lithuania) Business overview and strategy Our Polish life operation is the fourth largest overall life insurer in Poland (including JV Life), with a market share of 6% based on total premium income as at 30 September 2010 according to the Polish Financial Supervision Authority (KNF). Aviva Poland completed its rebrand to Aviva in June 2010. It has more than 900,000 individual and group customers and manages over £3.1 billion of customers’ assets, providing both long-term insurance and savings products. Our businesses have approximately 2,600 direct sales force members with 60 sales branches across the countries as at 31 December 2010. Aviva Poland has been one of the leaders of the second-pillar pension fund market since its launch in 1999. Second pillar pension funds are privately managed with first pillar being the pay-as-you-go state pensions and third pillar being voluntary contributions. We have seen two tranches of significant legislative changes to the pensions market in the last two years. In 2010 a change was made to pensions’ legislation which limited pension funds’ potential income through a reduction of contract fees and a cap on total asset management revenues. From 1 April 2011, a further change has been announced whereby contributions received by mandatory pension funds will be reduced from 7.3% of gross salary to 2.3%. This has had the effect that our pensions business in Poland has a market share of around 24% down from 25% last year and 2.8 million customers. Our product strategy for pensions is to
retain our status as one of the market leaders in terms of assets and customers. In the short term we have overhauled our compensation and bonus structure for our sales force with the aim of linking compensation directly with the value generated by the sale. Our general insurance business in Poland commenced in 1997 and continues to develop. For reporting purposes the general insurance business is shown within ‘Other Europe’ in the general insurance segment.
Market The Polish market for protection products has seen significant growth since 1999, although penetration rates remain relatively low according to our analysis of KNF statistics. In 1999, Poland launched a comprehensive reform of its state pension system and created privately managed funds. This enabled private companies to offer pension products and made it obligatory for all employees under 30 years of age to join one of the competing pension funds. As described above, from 2010 the Polish government started to implement restrictions on the fees that pension fund management companies can charge, and it is expected that the government will start to take higher proportions of pension payments in 2011. The general insurance market is continuing to grow, although at a slower rate than the long-term insurance and savings market. Growth is mainly driven by household and travel personal lines and an increase in rates in commercial lines.
Products Our life business in Poland provides a broad range of protection, annuities and bonds and savings products. For individuals it offers unit-linked life policies, annuities, single premium savings and health insurance. For institutions it offers group life insurance and employee pension programmes, which are both unit-linked products. Our pension business offers a standard product for all customers as part of the privately managed second pillar pensions market. We offer general insurance products to both institutions and individuals in Poland. For institutions we offer selected commercial lines risks such as fire and loss-of-profit insurance, technical insurance, insurance against loss of property during transportation, civil liability insurance and commercial health insurance. For individuals we offer home, accident and travel insurance, which are primarily sold by tied agents, as well as motor insurance, which is sold primarily through our direct operation.
Distribution The direct sales force is the main distribution channel for most of the Polish group and is made up of 2,400 tied insurance agents whose work is co-ordinated by a network of our sales branches run by over 250 sales managers. We are developing our bancassurance distribution channel. Our biggest relationship is a joint venture with Bank Zachodni WBK (a subsidiary of AIB) that sells both life and general insurance products through the bank’s network of over 600 branches. We also co-operate with independent insurance agencies and brokers. We believe that these insurance brokers play a key role in selling commercial lines general insurance. Our mutual funds are also sold in brokerage houses and our individual products are supported by call centre and website sales. We also have a direct platform (internet and call centre) for distribution of motor insurance.

34
Aviva plc Annual Report and Accounts 2010 Information on the company continued
Spain Business overview and strategy Aviva Spain is the country’s fifth-largest long-term insurer by gross written premiums with a market share of 7% in the third quarter of 2010 according to Investigación Cooperativa entre Entidades Aseguradoras y Fondos de Pensiones (ICEA). Aviva Spain sells long-term insurance and savings, health and accident insurance in Spain through a bancassurance network based on joint ventures with six banks (Bancaja, Caja España, Caixa Galicia, Unicaja, Caja Granada and Cajamurcia) and through Aviva Vida y Pensiones, the wholly owned Aviva branded long-term insurance company. Our strategy in Spain is to further develop our bancassurance relationships and attract new partners when the opportunities arise. We also intend to develop our general insurance offerings through our existing partnerships. Overall, we will continue to be customer-focused, react quickly to market trends and maximise the sales of our core products, such as pensions and savings.
Market We believe Spain’s savings banks, ‘the cajas’, continue to be under pressure and a number may have to pursue mergers to secure their positions. Any opportunities arising from this will be considered by Aviva on their individual merits. In relation to distribution agreements with bancassurance partners, Aviva is also protected financially within our contracts with the cajas should a merger result in the insurance services of the newly merged company being awarded to the insurer of the other party involved. The top positions in the long-term insurance market are dominated by bank-owned or bank-insurer joint ventures, with the overall bancassurance channel accounting for more than 65% of gross written premiums in the third quarter of 2010 in the Spanish life insurance market according to ICEA. Customers in Spain are accustomed to receiving advice through traditional banking channels, and we leverage our cajas’ distribution channels to capitalise on this characteristic. We believe that customers have a high level of financial understanding and require comprehensive advice on products and services.
Products We offer a wide range of bonds and savings, and protection products. Investment products include both unit linked and traditional plans, where profit sharing is regularly used to increase the policy return. Our traditional plans include savings schemes and income products. Pension savings products have valuable tax advantages each year for such contributions within permitted limits and we offer a flexible range of individual and group plans with alternative investment choices. We also offer protection products, covering both mortgages and credit loans typically providing cover for the family in the event of death or disability.
Distribution Through bancassurance partnerships we have established subsidiaries to distribute our products with each of the banks as set out below:
Aseval – in conjunction with Bancaja since 2000 Unicorp Vida – in conjunction with Unicaja since 2001 CxG – in conjunction with Caixa Galicia since 2001 Caja España Vida – in conjunction with Caja España
since 2001 Caja Granada Vida – in conjunction with Caja de Granada
since 2002 Cajamurcia Vida – in conjunction with Cajamurcia
since 2007
Aviva Vida y Pensiones distributes our products through professional intermediaries (financial advisers, agents and brokers) and a direct sales force, supported by a branch office network and call centres. The strength of our distribution relationships has enabled us to maintain our position as the second largest provider of protection products in the market, according to the ICEA at 30 September 2010.
Russia Business overview and strategy Aviva Russia is ranked fifth in the life insurance market with a 7.8% market share according to the data published by the market regulator, Finance and the Federal Service for Insurance Supervision (FSSN) and first in the non-captive Pillar III pension market with 17.5% market share, as at 30 September 2010. We began trading in early 2006, with a strategy that we continue to pursue, to position the business to take advantage of the growth expected to occur as the Russian life insurance industry develops. Compared with the same period last year, in the third quarter of 2010 Aviva’s gross written premiums grew by 142%, which is four times faster than the market, according to FSSN and the insurance market regulator. Aviva Russia is made up of a life company and two non-state pension funds. Aviva Russia has a Net Promoter Score of 86 in 2010, a score that has been consistently high (2009: 85).
Market The life insurance market in Russia has grown rapidly from a low base over the last five-year period. Life insurance penetration in Russia is much lower than in other BRIC countries (Brazil, Russia, India and China are all countries that are deemed to be at a similar stage of newly advanced economic development) and we believe demonstrates strong potential for further growth.
Products In Russia, we sell a range of products including individual accident insurance largely through bank partners, group protection and non-state pension products.
Distribution At the end of 2010 Aviva Russia had 966,000 customers. Aviva Russia has 19 distribution agreements with banks, operating in 63 out of 83 Russian regions. Approximately 50% of new business sold is Group protection and corporate pensions.
Turkey Business overview and strategy AvivaSA, our long-term insurance and savings business in Turkey, is the second largest pension provider in the market in terms of assets under management (‘AuM’), with a market share of 21% as of 24 December 2010 as reported by the Turkish Pensions Monitoring Centre. Our largest competitor in this market, Anadolu, ranks first with a market share of 22%. We are also the fourth largest life insurer in Turkey with a market share of 7% as of 30 November 2010, as reported by the Association of Insurance and Reinsurance Companies of Turkey. AvivaSA has a bancassurance agreement with Akbank T.A.S. (Akbank), Turkey’s second largest privately-owned bank based in terms of total assets according to The Banks Association of Turkey. Aviva Sigorta, our general insurance business in Turkey, is the 12th largest general insurer in Turkey with a market share of 3% as of September 2010 according to the Insurance Union of Turkey. Aviva Sigorta has over 750,000 customers and a sales force of over 750 independent agents and brokers. Our strategy in Turkey is to pursue the high growth potential that we believe this market offers.

35
Performance reviewCorporate responsibilityGovernanceShareholder informationFinancial statements IFRSFinancial statements MCEVOther information
Performance review
Aviva plc Annual Report and Accounts 2010
Information on the company continued
Market We believe that Turkey, with its large population and strong economic growth, is a highly attractive market in the medium term. The pensions market, for example, is growing very fast, increasing 31% in the year to 31 October 2010 according to the TSRBS. The general insurance market is slightly more tempered, growing 5% in the year to 30 September 2010, according to the TSRBS.
Products AvivaSA’s life and savings products include unit-linked pensions, supplemented by protection insurance and other savings products, which are aimed at medium to high-net-worth customers and the leading national and multinational corporations in Turkey. Aviva Sigorta sells a diverse range of products including personal motor, household, commercial property, SME, personal accident, marine and travel insurance.
Distribution In Turkey, we operate through a multi-channel distribution framework consisting of bancassurance, direct sales force, corporate sales, agencies and brokers.
Other Europe Business overview and strategy Aviva’s other European businesses are in the Czech Republic, Hungary, Slovakia and Romania. In the Czech Republic we are the 13th largest life insurer, with a 1.4% market share as at 31 December 2010 according to the Czech Insurance Association. We have more than 50,000 customers and 115 staff as at 31 December 2010. In Hungary, we are the seventh largest life insurance business, measured by gross written premiums as at 30 September 2010. Aviva Romania is the fifth largest voluntary pensions provider as at 31 December 2010 as measured by fund value according to the Private Pension Regulator (CSSPP) and the seventh largest life insurance provider as at 30 September 2010 according to data gathered by Signal Iduna in Romania. We are currently continuing to manage these markets for profitable growth.
Market Across these new European markets there are countries at different stages of development. Hungary and the Czech Republic are the most developed markets although they still have a gap as compared to Western European markets.
Products Czech Republic sells flexible unit-linked insurance products and group life insurance schemes for corporate clients. Hungary sells flexible unit-linked and traditional life products and sells unit-linked savings products through Brokernet Slovakia. Romania provides traditional life insurance products and started to offer pension products to customers following government reforms introducing compulsory pensions in 2008.
Distribution In the Czech Republic, our sales force is made up of over 380 agents operating across 14 regional offices, with 17 independent distributors. In Hungary, in addition to the direct sales force we also sell through brokerage partners. In Romania, we distribute through a direct sales force branch network of approximately 500 agents and have bancassurance partners, which include local units of Piraeus Bank, Emporiki and Credit Europe Bank.
Delta Lloyd Delta Lloyd is one of the top five financial services providers in the Netherlands, with a growing operation in Belgium. Delta Lloyd
has been listed on the NYSE Euronext Amsterdam since 3 November 2009. At the time of listing we retained 58.3% of the ordinary share capital and 54.0% of the voting rights in Delta Lloyd. The IPO raised £1 billion of gross disposal proceeds and since then the strategic management of our investment in Delta Lloyd has been managed independently from other operations. During 2010 Delta Lloyd offered scrip dividends in exchange for cash dividends. We did not exercise this option which resulted in the dilution of our shareholding by 0.7% to 57.6% at 31 December 2010.
Business overview and strategy Delta Lloyd operates in the life insurance and pensions, general insurance, fund management and selected banking markets in the Netherlands and Belgium. The group employs approximately 5,800 permanent staff as of 31 December 2010. The German life insurance operations are no longer considered core business by management and we ceased writing new business in Germany in the third quarter of 2010. We identified ‘Delivering sustainable value for shareholders through long-term focus’ as being core to our strategy. To realise this strategy the following initiatives have been implemented:
Simplify organisational structure in 2010, with the aim of reducing costs by 2012 compared with the 2010 cost level.
Economies of scale through volumes. We will position ourselves through our brands Delta Lloyd, OHRA and ABN Amro Verzekeringen and develop standardised, flexible ‘white-label’ products.
Asset accumulation for the longer term via long term pension and investment contracts.
Enhance knowledge of the customer and respond to changing customer needs.
Prudent risk management by using hedging strategies to protect against interest rate and equity risk.
Take a disciplined approach to consolidation. We believe we are well placed for expected future consolidation within our target markets. Delta Lloyd will only consider pursuing mergers and acquisitions if strategic opportunities arise and will create shareholder value.
Raise capital through the issue of senior unsecured debt. In October 2010, a European Mid-Term Note (EMTN) programme of maximum £2.1 billion (€2.5 billion) was established to increase Delta Lloyd’s financial flexibility. Under this programme £491 million (€575 million) worth of debt was issued in 2010 which will be used for working capital purposes.
Market Delta Lloyd continues to operate in a competitive saturated market. We believe that the Dutch insurance market is mature and cost reduction and economies of scale are becoming increasingly important. Customers are increasingly demanding that suppliers provide value-for-money high-performing products with transparent charges. The Dutch savings market is extremely competitive with banks now able to offer retirement products on the same terms as insurers. In the life segment the focus is on profitable growth, for example in the group pension market, and retaining customers through the tax favourable bank savings product. In the general insurance market there continues to be competition on premium rates, particularly in the motor sector, and increasing claims frequencies linked with the economic downturn and weather related events. Managing the claims ratio and cost savings are the top priority in this highly competitive market.

36
Aviva plc Annual Report and Accounts 2010 Information on the company continued
The credit crisis has resulted in a number of Delta Lloyd’s competitors seeking state or shareholder support. We expect this situation to result in further industry reorganisation and consolidation in the coming years. In 2010, the Dutch Actuaries’ Association commented that current longevity models have underestimated the longevity improvement trend in the last two decades. A new set of mortality tables has been issued by the ‘Actuarieel Genootschap’ (AG), CBS and the Insurers Association (Verbond van Verzekeraars). The whole Dutch market will be impacted by the assumption changes arising from these new tables.
Products The long-term insurance and savings business of Delta Lloyd offers a range of protection, bonds and savings and pensions services, including group pension schemes, annuities, unit-linked bonds, savings products and protection insurance. Our general insurance business offers a well diversified product portfolio including personal, motor, travel and home insurance and small to medium-sized commercial policies. We also sell retail investment fund and mortgage products in the Netherlands and retail banking products in Belgium.
Distribution Delta Lloyd distributes long-term insurance and savings and general insurance products under three brands: Delta Lloyd, OHRA and through a joint venture with ABN AMRO. In the Netherlands the Delta Lloyd brand works exclusively with independent insurance intermediaries, while OHRA focuses on direct channels such as telephone, internet and mail. The third brand comprises a joint venture with ABN AMRO, reaching customers through the extensive distribution networks of ABN AMRO bank. The joint venture remains the exclusive insurance partner for the current and future Dutch banking operations of ABN AMRO, including Fortis branches which were integrated in 2010. We believe the Fortis integration will improve the distribution opportunities in bancassurance. Individual investment products are sold through private banks including ABN Amro, ING and Rabobank.
North America Regional overview and strategy Aviva North America consists of two businesses: our life insurance and annuity business in the US and our general insurance business in Canada. Our strategic priorities for the region are focused on driving profitable growth through improving our position and competitiveness in North America through:
focusing on our customers with compelling value propositions, enhanced service and personalised customer experience;
improving the profitability and capital generation of the North American Region, which is a net capital contributor to the Group;
selectively expanding and growing our core life insurance and annuity distribution, products and capabilities;
leveraging the sophisticated underwriting capabilities in our general insurance business; and
building on our strong high quality relationships with our distribution partners.
Market and competition The North American region is home to two of the world’s largest and richest economies. Aviva has two businesses that currently serve their respective home markets and are led by our regional headquarters in Chicago.
The US long-term insurance and annuity market and the Canadian property and casualty insurance market are highly fragmented markets with a large number of insurers. Competitors for the products in which we specialise include global insurers such as Allianz, Royal & Sun Alliance, ING and AEGON. Local market competitors also feature in various product segments. We consider our competitive advantages in the North America region to be:
Product innovation combined with a clear customer focus; Quality of distribution partnerships; Sophisticated pricing and underwriting capabilities; Financial strength and performance; and Investment management.
USA Business overview and strategy Aviva USA is a leading provider of both fixed indexed life insurance and fixed indexed annuities according to sales reports released in 2010 by the industry’s Life Insurance and Market Research Association (LIMRA) and Indexed Sales and Market Reports from AnnuitySpecs.com. Over the last several years, Aviva USA has achieved significant growth and market penetration in the US market. Aviva USA’s strategy is to accelerate our growth of life insurance and protection business and to expand our access to savings and income markets. Today, Aviva USA has approximately one million customers and employs more than 1,500 people across the country from its headquarters in West Des Moines, Iowa, and offices in Topeka, Kansas, and Melville, N.Y. Underlying our strategy is a focus on developing compelling customer value propositions including enhanced product offerings, personalised service and deeper relationships with key distribution partners. We believe that US consumers want to be understood and recognised for the distinct financial needs they face. In 2010 Aviva USA introduced Building insurance around YOU, a strategic focus on the customer with products designed for their individual stage of life. By understanding our customers’ priorities, we believe we can best deliver life and annuity products to meet their changing needs.
Market According to the World Bank, the US is the world’s largest national economy, based on 2009 GDP. It is also the largest insurance market according to an August 2010 Swiss Reinsurance report on total premiums. This is especially true for retirement savings products as more than 78 million members of the baby boom generation move into retirement in the US. At the same time, the US economy – and its financial sector in particular – continues to feel the impact of the severe contraction due to the financial crisis of the past two years. There are increasing signs of economic recovery and, despite the recession, North America’s economies remain among the world’s largest and its population among the world’s wealthiest. Retirement savings represent 34% of household assets in the US, according to a report by Investment Company Institute, and, despite the uncertainty affecting the financial markets, people continue to save and buy insurance from brands they trust. In Aviva USA, we believe we are well positioned to respond to customer needs, having savings and investment products with downside guarantees as a major component of our product portfolio. The indexed annuity and indexed life markets in which Aviva USA operates are dominated by a small number of insurers. According to third quarter 2010 data compiled by LIMRA, the top five indexed annuity providers hold 61% of the indexed annuities market, while for indexed life insurance, the top five providers account for 68% of the market. This product segment has seen

37
Performance reviewCorporate responsibilityGovernanceShareholder informationFinancial statements IFRSFinancial statements MCEVOther information
Performance review
Aviva plc Annual Report and Accounts 2010
Information on the company continued
record sales growth in 2010, and continues to expand with new carriers introducing new product options, particularly in the life insurance side of the business.
Products Aviva’s broad product portfolio offers flexible solutions to multiple customer needs. We offer traditional universal life (UL) and indexed UL products which are designed to accumulate cash values that can later be used, if needed, by our customers. In the protection market, the product offerings include term insurance and secondary guarantee UL insurance designed to offer lower cost death benefit protection with little to no cash accumulation potential. In addition, Aviva offers a wide array of riders to customise the coverage to meet each customer’s unique needs. Amongst the riders is the innovative ‘Wellness for Life’ that offers cost of insurance discounts to insureds that meet certain wellness criteria. The rider benefits include a menu of wellness information services provided through an exclusive relationship with Mayo Clinic Health Services. In the savings market, Aviva’s fixed annuity portfolio offers customers tax-advantaged savings opportunities and protection against the risk of outliving one’s assets. We are receiving greater demand for the guaranteed lifetime withdrawal benefit which gives customers an opportunity to accumulate premiums at an attractive guaranteed interest rate for the purposes of taking withdrawals over his or her lifetime. In 2010, Aviva USA entered the managed account guaranteed investment contract (GIC) market with a product offering that leverages the investment management capabilities of both our life insurance business and those of Aviva Investors North America. In the past, Aviva has also issued funding agreements in the institutional market.
Distribution Aviva USA uses a multi-channel distribution strategy to bring its products to market. We leverage these relationships to promote and sell our fixed indexed annuities and life insurance products. Our network covers all 50 states and includes 30,000 annuity and life insurance producers, including career marketing organisations, personal producing general agents, independent marketing organisations and brokerage general agents.
Canada Business overview and strategy Aviva Canada has an 8% share of the Canadian general insurance market, with a top five position in all major provinces according to 2009 industry data provided by MSA Research Inc. We believe that we are well placed in Canada for steady organic growth and that our success is underpinned by strong broker relationships, underwriting excellence and a balanced portfolio of commercial and personal lines. We will continue to develop and leverage our sophisticated pricing and underwriting capabilities. We will also continue to address increasing customer demand for choice and simplicity through our broker-distribution model. In commercial lines, we aim to continue to profitably grow our business by leveraging techniques developed in personal lines in the small and medium enterprise sector.
Market As the seventh-largest in the world, according to Swiss Re’s Sigma World Insurance Report, Canada’s general insurance market is established and stable. The four largest provinces generate around 90% of total premiums with Ontario, the largest, representing 47% on its own, according to 2009 industry data provided by MSA Research Inc. In recent years the most significant growth rates have been seen in western Canada, where economic development has resulted in significant population increases and a changing demographic profile.
With over 200 insurance companies, the Canadian general insurance industry is highly fragmented with many small players and no dominant consumer brand. Steady consolidation has resulted in the top five companies sharing 35% of the market with the top two companies, Intact Insurance and Aviva, controlling 19%. The rest of the industry consists largely of smaller, provincially based or niche companies. While the direct and affinity channels are gradually increasing market share, the traditional broker channel accounts for over 70% of distribution according to Axco’s Insurance Market Report for Canada. Competition for growth has moved to investment in brokers, direct to consumer marketing, and technology.
Products We provide a number of general insurance products through our Canadian companies including:
Property, home and automobile insurance, including recreational vehicles and mobile homes insurance;
Niche personal insurance products including holiday and park model trailers, horses, hobby farms, sailboats, power boats and antique classic and custom cars; and
Small and medium-size enterprise commercial insurance, including motor, property, liability, boiler and machinery, and surety.
Distribution We operate in Canada through a distribution network primarily focused on approximately 1,700 independent retail brokers who distribute our core personal and commercial lines. In addition, we work closely with both independent and wholly owned specialty brokers to distribute group insurance and specialty personal lines, such as insurance for antique cars.
Asia Pacific Regional overview and strategy Aviva Asia Pacific operates in nine countries across the region through both joint ventures and wholly-owned operations. China and India, our key strategic markets, have large populations, relatively high economic growth and are expected to generate a significant portion of the insurance growth in Asia in the future. Most of our businesses in our other countries (Singapore, Hong Kong, South Korea, Malaysia, Sri Lanka, Taiwan and Indonesia) are bancassurance led with strong joint venture partners. Aviva Asia Pacific aims to create franchise value through organic growth. Our goal remains to increase new business sales and increase margins by strengthening our multi-channel distribution platform. In November 2010 we announced our intention to exit Taiwan as we do not believe we can achieve our desired financial returns in this market.
Market and competition The Asia Pacific insurance market includes both mature markets such as Singapore, Hong Kong and South Korea and emerging markets such as China and India. China and India are ‘must-win’ markets given their demographics and are expected to generate a very significant portion of the insurance new business in the future. These markets accounted for around 33% of the Asia Pacific segment’s long-term and pension sales in 2010. Markets in South East Asia (Singapore, Hong Kong and Malaysia) remain attractive given their high margins and double-digit growth. These markets represented 36% of the segment’s long-term and pension sales in 2010. South Korea is a large market where we have a successful growing business, accounting for 25% of the segment’s long-term and pension sales in 2010. Other small markets accounted for 6% of the segment’s long-term and pension sales in 2010.

38
Aviva plc Annual Report and Accounts 2010 Information on the company continued
In long-term insurance and savings, we believe that the outlook is positive, with high growth rates expected in the medium-term owing to currently low penetration rates of insurance products in many markets, high GDP growth, generally high savings rates and the growing need for old age provision. We believe that fundamentals of the Asia Pacific region are highly attractive and competition from both local and international players is increasing as a result. Local companies are our main competitors in most markets. We believe that the following factors position us well to compete effectively in the region and provide a solid platform for creating franchise value:
Balanced portfolio of fast-growing and high-margin markets; Strong position and/or partner in most major markets; Multi-channel distribution, with particular strength in
bancassurance; A clear strategy with a sharp focus on franchise value
creation and organic growth; and Global group (brand, expertise, capital).
Asia Business overview and strategy Aviva has operations in nine markets in Asia, with businesses at different stages of development. In China, through our joint venture with COFCO Limited (COFCO), we are ranked second in terms of annualised premium equivalent (APE) among 28 foreign insurers according to China Insurance Regulatory Commission as at 30 September 2010. We have a presence in 11 provinces at 31 December 2010, with a total of 44 city branches. We aim to achieve a top ten position by 2014, whilst improving profitability/margins. We will do so by strengthening our multi-distribution competencies and continue to be cost efficient, whilst developing talent and improving customer experience. In India, we operate in partnership with the Dabur Group through an associate, Aviva Life Insurance Company India Limited. We currently rank 11th among the private life insurance companies in India based on APE as at 30 November 2010, according to the Insurance Regulatory and Development Authority (IRDA). We aim to be amongst India’s top 10 insurers by evolving our product portfolio towards traditional products, increasing productivity of our current bancassurance operations, establishing new bank relationships and continuing to upgrade our agency network into a high-performance channel. In South Korea we own a 47% stake in Woori Aviva Life Insurance Co., Ltd. through a partnership formed with Woori Finance Holdings Company Ltd. Woori Bank is the second-largest commercial bank in South Korea by market capitalisation. Our business is young and growing; by the end of 2010 we have increased our market share to 2.2% since our entry in April 2008, and we aim to become a top ten player in the medium-term. In Singapore, we rank fifth in the life long-term insurance market by APE as at 30 September 2010 according to the Life Insurance Association. We are one of the leading bancassurance players in the market. We aim to be a top five player in the life and health market, whilst continuing to improve margins, building on the sales momentum in DBS in 2010 (306% above 2009) and through the launch of our financial advisory channel Aviva Advisors. In Hong Kong we are ranked 19th in the long-term insurance market by APE as at 30 September 2010 according to the Office of the Commissioner of Insurance. Our strategy is to build scale in this high-margin market by expanding our distribution channels. In Malaysia we own a 49% stake in two of CIMB Group’s subsidiaries, Commerce Life Assurance Berhad and Commerce Takaful Berhad who have entered into bancassurance agreements
with another CIMB Group subsidiary, CIMB Bank. We are ranked 14th with a market share of 1.8% at 30 September 2010. We aim to become a top five life and takaful company in Malaysia. In 2010, Aviva entered Indonesia through a joint-venture with Asuransi Wahana-Tata. Our business is a top five provider of group health and pension products and we aim to grow the life insurance business. In Sri Lanka, we own a 51% stake in Aviva NDB. We were ranked the third largest life insurer and fifth largest general insurer in the country, based on gross written premiums in 2009 according to the Insurance Board of Sri Lanka. We aim to become a market leader in the life business . In Taiwan, we have a 49% stake in First-Aviva Insurance Company, a joint venture with First Financial Holdings Company (FFHC). After three years of operation, we have recently announced our decision to exit this market as we do not believe we can achieve our desired financial returns.
Market We believe that the fundamentals of the Asian markets are attractive. Asia’s economies are reverting to pre-crisis levels. The economic forecast from Asian Development Bank predicts GDP growth for emerging markets in Asia of 8.2% in 2010 and 7.3% in 2011. (Asian Development outlook 2010 update, 28 September 2010). Asian economic growth is expected to continue to outpace the West, most notably in China and India. In our view, we expect Asia to be the fastest growing region for life insurance globally over the next decade. We also believe that we are well-positioned to continue delivering strong growth in both volumes and margins in our Asia Pacific business. Recent IPOs and M&A transactions have evidenced favourable valuations. While competition is increasing as a result of many international competitors focusing on Asia for growth and domestic leaders leveraging strong brands, we believe that our opportunity to create franchise value through organic growth in Asia is unprecedented.
Products Our Asian businesses generally offer a range of protection, bonds and savings and pension products including universal life, participating life, unit-linked single and regular premium life insurance, other savings and pensions products and a range of accident and health insurance products. We believe that Aviva has established itself as a strong player in the health and protection market as well as in the child education segment. In April 2010 Aviva launched an innovative direct insurance business in Singapore by offering car, home and travel insurance online.
Distribution We operate a multi-distribution strategy in Asia, with particular strength in bancassurance. We aim to continue to harness the benefits of multi-distribution in all of our markets as we expect the regionally dominant agency sales force model to decline as Asian markets mature. Aviva Singapore has a multi-channel distribution strategy building on a core bancassurance relationship with DBS Bank and an expanding network of IFAs. We have launched Aviva Advisors in 2010, an innovative owned channel led by high performing advisors. We also launched the first online motor sales platform in the market in 2010. In Hong Kong, we distribute the majority of our products through bancassurance and IFAs. In China, India, Malaysia and South Korea bancassurance is the main distribution channel. However, as we continue building our multi-distribution platform across the region, other channels are increasing in importance, diversifying our sources of revenue.

39
Performance reviewCorporate responsibilityGovernanceShareholder informationFinancial statements IFRSFinancial statements MCEVOther information
Performance review
Aviva plc Annual Report and Accounts 2010
Information on the company continued
Aviva Investors Business overview and strategy Aviva Investors was set up in 2008 to combine major fund management components of the Aviva Group into a single global fund management business. We have £260 billion in assets under management as at 31 December 2010 and offer a broad range of expert investment skills and experience around the world. We manage internal funds for our long-term insurance and savings, and general insurance operations as well as a range of external retail and institutional funds. We provide these services across most of our geographic operating segments, with services in 15 countries around the world, including the UK, the US, Canada, France, Poland and Australia. Aviva Investors provides investment management services to a broad range of client types. Our largest client group are the long-term insurance and savings, and general insurance businesses of Aviva plc. For these clients we provide bespoke asset management services, across a broad spectrum of asset classes. We work extremely closely with these clients to develop tailored solutions to their policyholder needs. Our distribution model to external clients is a business-to-business model, and this is consistent across all regions. We provide both bespoke segregated solutions for larger clients or offer access to a variety of fund ranges. Our target clients for the larger segregated solutions tend to be large pension schemes and financial institutions such as insurance companies and banks. Our strategy is to rapidly grow our external business through offering client-centric solutions and products to our customers across an expanding global footprint. This will be achieved in conjunction with the establishment of a globally integrated organisation, supported by a high-performance culture and global core processes.
Market and competition Following the creation of Aviva Investors, we consider our competitor peer group to include large-scale global asset managers such as those owned by Blackrock, AXA and Allianz. In addition, we continue to look at UK-based providers who have significant overseas operations, including both insurance-owned companies such as Standard Life Investments and the combined asset management businesses of Prudential plc (primarily M&G), as well as independent, listed managers like Schroders and Aberdeen Asset Management. Where appropriate, we also look at other managers with a strong presence in the UK institutional and retail markets such as F&C Asset Management, Henderson Global Investors, Jupiter Asset Management and Threadneedle. These managers also have non-UK operations, particularly in Europe. Key identified competitive factors for Aviva Investors include:
Investment performance; Brand; Our Aviva Group parentage; Client service; Scale; Global product breadth and distribution reach; A range of capabilities to provide tailored solutions
for clients; Risk management expertise; and Capability in socially responsible investing and
corporate governance.
Products Our product range is broad and covers most asset classes. In Europe we have a range of SICAVs (domiciled in France, Luxembourg and Poland). These funds cover all key asset classes and normally have different share classes depending on the size and type of investor. Our normal distribution model for these funds focuses on wholesale distributors, asset allocators and smaller institutional investors. In the UK, we supply products to the UK retail and wholesale markets. These funds are mostly ‘owned’ by Aviva UK Life with Aviva Investors as asset manager, although we have a small number of funds registered in the Aviva Investors name. These funds are promoted to investors via IFAs, fund platforms, supermarkets and discretionary asset managers. In addition, we have a range of pooled pension funds which are aimed at the smaller pension fund market. These funds are normally defined benefit schemes and tend to be advised by investment consultants. We manufacture hedge funds in the UK, US and Poland. These funds are generally registered offshore and are primarily sold to the hedge funds industry, although we do also promote single strategy funds to institutional clients, family offices and wealth managers. The asset classes include fixed interest, multi-asset, convertibles and equities. We also have an expanding range of specialist property funds. These funds are targeted at specialist real estate buyers and large institutions (mostly pension funds and local authorities), and provide real estate solutions to a wide range of risk appetites, ranging from secure income generating funds to highly leveraged growth funds. These funds address the UK, European and Asian markets. In Australia, we have a range of unit trusts that are primarily marketed to retail clients. The funds we manufacture are primarily equity related funds with an Australian and Asian focus. We also have four Dublin domiciled money market funds addressing the sterling and euro money market segments. These funds are sold by a specialist sales team based in London and target corporate treasury functions.
Asset classes Aviva Investors offers a wide range of investment across all asset classes and in all significant financial centres worldwide. Where we do not directly manage assets, we believe we have the skills and experience to select the right third-party asset managers to complement our own products. Our investment capabilities, products and services comprise:
Alternatives – We offer a range of alternative investment products from private equity fund of funds to hedge funds.
Equities – locally based teams focused on generating above market performance.
Fixed Income – Our Fixed Income teams cover a comprehensive product set: UK government securities, liquidity products, corporate bonds, European and global sovereigns, index-linked bonds, emerging markets (hard and local currency debt) and high-yield instruments.
Global Investment Solutions – our Global Investment Solutions team constructs client solutions across markets.
Real Estate – We offer funds specific to property assets in the UK, Europe and Asia, in addition to a global fund, client-specific segregated funds and a multi-manager service.

40
Aviva plc Annual Report and Accounts 2010
Organisational structure
Organisational structure The following chart shows, in simplified form, the organisational structure of the Group as at 31 December 2010. Aviva plc, is the holding company of the Group.
Subsidiaries The principal subsidiaries of the Company are listed below by country of incorporation. All are wholly-owned, directly or indirectly, and transact insurance or reinsurance business, fund management or services in connection therewith, unless otherwise stated. * Incorporated in England and Wales ** Incorporated in People’s Republic of China.
Aviva plc has a 50% interest in the joint venture *** Incorporated in Scotland **** Includes other UK general insurance subsidiaries
and certain investment management businesses
United Kingdom Aviva Annuity UK Limited Aviva Central Services UK Limited Aviva Consumer Products UK Limited Aviva Employment Services Limited Aviva Equity Release UK Limited Aviva Health UK Limited Aviva Insurance Limited Aviva Insurance Services UK Limited Aviva Insurance UK Limited Aviva International Insurance Limited Aviva Investors Global Services Limited Aviva Investors Pensions Limited Aviva Investors UK Fund Services Limited Aviva Investors UK Funds Limited Aviva Life & Pensions UK Limited Aviva Life Services UK Limited Aviva Risk Management Solutions UK Limited Aviva UKGI Investments Limited CGU Underwriting Limited Gresham Insurance Company Limited Hamilton Insurance Company Limited London and Edinburgh Insurance Company Limited National Westminster Life Assurance Limited RAC Financial Services Limited RAC Insurance Limited RAC Motoring Services RAC plc Royal Scottish Assurance plc
Australia Aviva Investors Australia Limited
Barbados Victoria Reinsurance Company Ltd Belgium Delta Lloyd Life N.V.
Bermuda Aviva Re Limited
Canada Aviva Canada Inc. and its principal operating subsidiaries: Aviva Insurance Company of Canada Elite Insurance Company Pilot Insurance Company Scottish & York Insurance Co. Limited S&Y Insurance Company Traders General Insurance Company
Czech Republic Aviva zivotni pojist’ovna, a.s.
France Aviva Participations SA and its principal subsidiaries: Antarius S.A. (50.0%) Aviva Assurances SA Aviva France SA Aviva Investors France SA Aviva Vie S.A. Aviva Epargne Retraite Eurofil SA Union Financière de France Banque (Banking) (74.3%)
Hong Kong Aviva Life Insurance Company Limited Aviva Portfolio Investment Services Limited
Hungary Aviva Életbiztosító Zártkörûen Mûködõ Részvénytársaság
Aviva – COFCO LifeInsurance CompanyLimited**
Aviva Life Holdings UK Limited*
Aviva InvestorsHoldings Limited*
Aviva Central Services UK Limited*
UK LifeSubsidiaries
InvestmentManagementSubsidiaries
Aviva EmploymentServices Limited*
Aviva Insurance UK Limited*
UK General Insurance Subsidiaries
Aviva InsuranceLimited***
Aviva InternationalHoldings Limited*
Overseas and othersubsidiaries****
General Accident plc***
Aviva InternationalInsurance Limited*
Aviva plc*
Aviva Group Holdings Limited*

41
Performance reviewCorporate responsibilityGovernanceShareholder informationFinancial statements IFRSFinancial statements MCEVOther information
Performance review
Aviva plc Annual Report and Accounts 2010
Organisational structure continued
Ireland Aviva Europe SE and its principal subsidiaries: Aviva Insurance Europe SE Aviva Life and Pensions Europe SE Aviva Investment Management Services Europe SE Aviva Investment Management Europe SE Aviva Health Group Ireland Limited (70.0%) Aviva Life & Pensions Ireland Limited (75.0%) Aviva Investors Ireland Limited
Italy Aviva Italia Holding S.p.A and its principal subsidiaries: Aviva Assicurazioni S.p.A (50.0%) Aviva Assicurazioni Vita S.p.A (50.0%) Aviva Italia S.p.A Aviva Life S.p.A (50.0%) Aviva Previdenza S.p.A (55.0%) Aviva Vita S.p.A (25.5%) Eurovita Assicurazioni S.p.A (40.5%)
Lithuania
Netherlands Delta Lloyd N.V. (54.0%) and its principal subsidiaries: Delta Lloyd ABN AMRO Verzekeringen Holding BV (51.0%) Delta Lloyd Asset Management N.V. Delta Lloyd Groep Particuliare Schadeverzekeringen N.V. Delta Lloyd Bankengroep N.V. (Banking) Delta Lloyd Levensverzekering N.V. Delta Lloyd Schadeverzekering N.V. OHRA Levensverzekeringen N.V.
Poland Aviva Powszechne Towarzystwo Emerytalne Aviva BZ WBK S.A. (90.0%) Aviva Towarzystwo Ubezpieczen Na Zycie SA (90.0%) Aviva Towarzystwo Ubezpieczen Ogolnych SA (90.0%)
Romania Aviva Asigurari de Viata SA
Russia Closed Joint Stock Insurance Company Aviva (Zao)
Singapore Aviva Limited Navigator Investment Services Limited
Spain Aseguradora Valenciana SA, de Seguros y Reaseguros (Aseval) (50.0%) Aviva Vida y Pensiones, S.A. de seguros y reaseguros (Sociedad Unipersonal) Caja Espana Vida, Compania de Seguros y Reaseguros (50.0%) Caja Murcia Vida y Pensiones, de Seguros y Reaseguros S.A. (50.0%) Caja Granada Vida, de Seguros y Reaseguros, S.A. (25.0%) CxG Aviva Corporación Caixa Galicia de Seguros y Reaseguros, S.A. (50.0%) Unicorp Vida, Compania de Seguros y Reaseguros (50.0%)
Sri Lanka Aviva NDB Insurance PLC (51.0%)
Turkey Aviva Sigorta A.S. (98.6%)
United States Aviva USA Corporation and its principal subsidiary: Aviva Life and Annuity Company Aviva Investors North America, Inc.
Associates and joint ventures The Group has interests in the following operations that are classified as associates or joint ventures. Further details of those operations that were most significant in 2010 are set out in notes 18 and 19 to the financial statements.
United Kingdom The Group has interests in several property limited partnerships. Further details are provided in note 18 to the financial statements.
China Aviva-COFCO Life Insurance Co. Limited (50.0%)
India Aviva Life Insurance Company India Limited (26.0%)
Malaysia CIMB Aviva Assurance Berhad (49.0%) CIMB Aviva Takaful Berhad (49.0%)
South Korea Woori Aviva Life Insurance Co., Ltd (47.31%)
Turkey AvivaSA Emeklilik ve Hayat A.S (49.8%)

42
Aviva plc Annual Report and Accounts 2010 Selected consolidated financial data
Selected consolidated financial data The following table sets forth our selected consolidated financial data for the periods indicated. This data is derived from our consolidated financial statements prepared in accordance with IFRS as issued by the IASB. The selected consolidated financial data for the five years ended 31 December 2010 has been derived from, and should be read in conjunction with, our audited consolidated financial statements and the related notes in these financial statements.
Income statement data
Amounts in accordance with IFRS 2010
£m 2009
£m 2008
£m 2007
£m 2006
£m
Income Gross written premiums 36,274 34,690 36,206 30,991 28,735 Premiums ceded to reinsurers (1,863) (2,576) (1,841) (1,658) (1,501)
Premiums written net of reinsurance 34,411 32,114 34,365 29,333 27,234 Net change in provision for unearned premiums (75) 559 277 (21) 93
Net earned premiums 34,336 32,673 34,642 29,312 27,327 Fee and commission income 1,782 1,789 1,885 1,760 1,870 Net investment income/(expense) 21,993 25,155 (16,043) 9,689 15,908 Share of profit/(loss) after tax of joint ventures and associates 131 (504) (1,128) (304) 485 Profit on the disposal of subsidiaries and associates 159 153 7 49 222
58,401 59,266 19,363 40,506 45,812
Expenses Claims and benefits paid, net of recoveries from reinsurers (29,152) (27,549) (29,353) (27,121) (23,444) Change in insurance liabilities, net of reinsurance (7,177) (5,682) 3,885 (3,508) (2,594) Change in investment contract provisions (8,741) (11,185) 10,629 (2,018) (6,002) Change in unallocated divisible surplus 329 (1,547) 4,482 2,922 (558) Fee and commission expense (5,867) (4,396) (4,411) (4,244) (5,461) Other expenses (3,537) (5,366) (5,416) (3,473) (3,557) Finance costs (1,422) (1,519) (1,547) (1,217) (856)
(55,567) (57,244) (21,731) (38,659) (42,472)
Profit/(loss) before tax 2,834 2,022 (2,368) 1,847 3,340 Tax attributable to policyholders’ returns (394) (217) 1,068 (15) (346)
Profit/(loss) before tax attributable to shareholders’ profits 2,440 1,805 (1,300) 1,832 2,994
Tax attributable to shareholders’ profits (548) (490) 415 (334) (594)
Profit/(loss) for the financial year 1,892 1,315 (885) 1,498 2,400
Per share Per share Per share Per share Per share
Profit/(loss) per share attributable to equity shareholders: Basic 50.4p 37.8p (36.8)p 48.9p 88.0p Diluted 49.6p 37.5p (36.8)p 48.5p 87.0p
Per share Per share Per share Per share Per share
Dividends paid per share 25.5p 24.0p 33.0p 33.0p 30.0p
Millions Millions Millions Millions Millions
Number of shares in issue at 31 December 2,820 2,767 2,658 2,622 2,566 Weighted average number of shares in issue for the year 2,784 2,705 2,643 2,588 2,469
Statement of financial position data
Amounts in accordance with IFRS 2010
£m 2009
£m 2008
£m 2007
£m 2006
£m
Total assets 370,107 354,391 354,562 321,326 294,851
Gross insurance liabilities 177,700 171,092 174,850 152,839 144,230 Gross liabilities for investment contracts 117,787 110,015 107,559 98,244 88,358 Unallocated divisible surplus 3,428 3,866 2,325 6,785 9,465 Core structural borrowings 6,066 5,489 5,525 4,311 4,195 Other liabilities 47,401 48,843 49,730 43,120 34,539
Total liabilities 352,382 339,305 339,989 305,299 280,787
Total shareholders’ equity 17,725 15,086 14,573 16,027 14,064
2009 comparative figures for net investment income/(expense) and finance costs have been reclassified to conform with the treatment adopted in 2010. Please refer to ‘Financial Statements IFRS Note 2(a) – Presentation changes’ – for more detail.

Performance reviewCorporate responsibilityGovernanceShareholder informationFinancial statements IFRSFinancial statements MCEVOther information
Performance review
Financial and operating performance
43
Aviva plc Annual Report and Accounts 2010
Financial and operating performance We are the sixth-largest insurance group in the world, based on gross written premiums for the 2009 fiscal year. We are one of the top five providers of life and pensions products in the UK, Ireland, Netherlands (through our Delta Lloyd subsidiary), Poland and Spain and one of the top ten providers of life and pensions products in France and Italy, as based on total sales for 2009. Our main activities are the provision of products and services in relation to long-term insurance and savings, fund management and general insurance.
Factors affecting results of operations Our financial results are affected, to some degree, by a number of external factors, including demographic trends, general economic and market conditions, government policy and legislation and exchange rate fluctuations. See ‘Performance review – Risk management’ for more information on risks associated with these and other factors. In addition, our financial results are affected by corporate actions taken by the Group, including acquisitions, disposals and other actions aimed at achieving our stated strategy. We believe that all of these factors will continue to affect our results in the future.
Demographic trends Our results are affected by the demographic make-up of the countries in which we operate. The types of products that we sell reflect the needs of our customers. For example, in regions and countries with a high proportion of older people, a larger proportion of our sales will reflect their needs for pre-and post-retirement planning. Our sales levels will also be impacted by our ability to help provide useful information to such policyholders on retirement planning and to offer products that are competitive and respond to such policyholders’ needs. In our long-term insurance and savings business we make assumptions about key non-economic factors, such as the mortality rate that we expect to be experienced by our policyholders. In countries where the life expectancy is growing, this will need to be reflected in our pricing models as lower mortality rates will increase profitability of life insurance products but will reduce the returns on annuity products. We review our assumptions against our own experience and industry expectations. During 2008 and 2009 our results were not impacted by any major changes in mortality assumptions. In 2010, a new set of Dutch mortality tables has been issued by the ‘Actuarieel Genootschap’ (AG), CBS and the Insurers Association (Verbond van Verzekeraars). Following this, we made an exceptional strengthening of longevity assumptions in the Netherlands, which reduced IFRS profit by approximately £483 million before tax and non-controlling interests.
Economic conditions Our results are affected by the levels of economic activity in our geographic markets and, consequently, by economic cycles in those markets. High levels of general economic activity typically result in high levels of demand for, and therefore sales of, our products and services. Economic activity in turn is affected by government monetary and fiscal policy as well as by global trading conditions and external shocks such as terrorist activity, war and oil price movements. During 2009 and 2010, we saw improved economic activity across our regions and although customers continued to prefer cash deposits, we saw movement towards investment products resulting in increased investment sales, primarily across Europe and Asia.
Capital and credit market conditions An important part of our business involves investing client money and policyholders’ and shareholders’ funds across a wide range of financial investments, including equities, fixed income securities and properties. Our results are sensitive to volatility in the market value of these investments, either directly, because we bear some or all of the investment risk or indirectly, because we earn management fees for investments managed on behalf of policyholders. Investment market conditions also affect the demand for a substantial portion of our life insurance products. In general, rising equity price levels have a positive effect on the demand for equity-linked products, such as unit trusts and unit-linked life insurance products and conversely a negative effect on the demand for products offering fixed or guaranteed minimum rates of return. Declining equity price levels tend to have the opposite effects. During 2010, the capital and credit markets showed substantial recoveries from the end of 2009 as market sentiment improved. The amount of investment variance improved to £791 million in 2010 (2009: £75 million adverse), including £1,010 million related to Delta Lloyd. Of the £1,010 million, approximately £800 million is due to differing movements in asset and liability yield curves while the remainder primarily relates to gains on interest rate derivatives. Liabilities in Delta Lloyd are discounted using a yield curve based on a fully collateralised AAA bond portfolio. The discount rate increased in 2010 as an impact of around 80bps in credit spreads on collateralised bonds was only partially offset by lower risk-free yields. As a result, whilst lower interest rates increased the market value of assets, this has not been offset by a corresponding movement in liabilities. This was partly offset by negative economic variances of £154 million in Aviva Europe, primarily from the impact of increased bond yields and credit spreads on assets in Ireland, Italy and Spain.
With-profits business We write products through our with-profits funds mainly in our UK operating segment, with smaller funds in Ireland and Singapore. These funds enable policyholders to participate in a large pool of diverse investments, therefore reducing their exposure to individual securities or asset classes. The investment pool is managed by us with returns to with-profits policyholders paid through bonuses which are added to the value of their policy. In order to provide an element of stability in the returns to policyholders, bonuses are designed to reduce policyholders’ exposure to the volatility of investment returns over time and to provide an equitable share of surplus earned, depending on the investment and operating performance of the fund. Shareholders also have a participating interest in the with-profit funds and any declared bonuses. Generally, policyholder and shareholder participation in with-profit funds in the UK is split 90:10. The level of bonuses declared to policyholders is influenced by the actual returns on investments and our expectation of future rates of return. While bonuses can never be negative, a predicted sustained fall in equity markets could lead to a reduction in annual and terminal bonus rates, and so reduce both policyholder returns and shareholders’ profit under IFRS. Over the early part of this decade, the combination of a decline in equity markets and the general outlook for lower interest rates led to reductions in annual bonus rates, and the corresponding shareholders’ share of profits. The subsequent recovery in equity markets over 2003–2007 led to a partial reversal of this trend. During 2008 and 2009 the worsening economic conditions impacted on UK bonus levels but the annual effect of this for both policyholders and shareholders was offset by the benefit from the one-off special bonus mentioned below. Improving investment returns over 2010 have increased bonus rates although the impact of smoothing inherent within bonus calculations means that this is not universal.

Financial and operating performance continued
44
Aviva plc Annual Report and Accounts 2010
Shareholders’ profits arising on with-profits business under IFRS depend on the total bonuses declared to policyholders on an annual basis. A special bonus distribution was announced for policyholders of two of our UK with-profits funds, with the final payment made in 2010. This special bonus reflects the financial strength of those funds, and provided an uplift to IFRS profits in 2008, 2009 and 2010. The uplift in 2010 is approximately £58 million, net of tax.
General insurance and health underwriting cycle Our general insurance and health business is comprised of our property and casualty insurance and health insurance operations. In 2010, general insurance accounted for 28% of Group net written premiums from continuing operations. Demand for general insurance is usually price-sensitive because of the limited degree of product differentiation inherent in the industry. As a result, the price of insuring property and casualty risks is subject to a cycle (called an underwriting cycle). In periods when the price of risk is high, the high profitability of selling insurance attracts new entrants and hence new capital into the market. Increased competition however drives prices down. Eventually the business becomes uneconomic and some industry players, suffering from losses, exit the market while others fail, resulting in lower capital invested within the market. Decreased competition leads to increasing prices, thereby repeating the cycle. Although our various general insurance markets are not always at the same stage of the underwriting cycle, price competition has been increasing within the UK and the rest of the world across most of our general insurance business lines in recent years. We are now seeing evidence of increased rating discipline in the UK resulting from volatile investment markets. We expect the underwriting cycle to continue in the future but to be less pronounced than in the past because of structural changes to the industry over the past decade. Capital markets are imposing financial discipline by being increasingly more demanding about performance from insurance companies before extending new capital. Such discipline, together with the increased concentration of competitors within the market, recent natural disasters and the adoption of more scientific pricing methods is expected to make the underwriting cycle less pronounced in the future.
Natural and man-made disasters Our general insurance and health business results are affected by the amount of claims we need to pay out which, in turn, can be subject to significant volatility depending on many factors, including natural and man-made disasters. Natural disasters arise from adverse weather, earthquakes and other such natural phenomena. Man-made disasters include accidents and intentional events, such as acts of terrorism. These events are difficult to predict with a high degree of accuracy, although they generally occur infrequently at a material level. Our exposure to large disasters has been somewhat reduced through the recent strategic refocusing of our general insurance business mainly towards personal lines business and small- to medium-sized commercial risks. Our costs in connection with natural and man-made disasters are also significantly mitigated by reinsurance arrangements with external parties such that our maximum exposure is limited to no more than approximately £300 million for a one in ten year event or £550 million for a one in one hundred year event. See ‘Financial Statements IFRS – Note 57 – Risk Management’ and ‘Financial Statements IFRS – Note 42 – Reinsurance Assets’ for further information on our reinsurance programme. In 2008, Ireland and Canada incurred some weather-related losses and in 2009 the UK, Ireland and France were all impacted.
In 2010 the UK was impacted by severe freezes in January, November and December.
Government policy and legislation Changes in government policy and legislation applicable to our business in any of the markets in which we operate, particularly in the UK, may affect our results of operations. These include changes to the tax treatment of financial products and services, government pension arrangements and policies, the regulation of selling practices and the regulation of solvency standards. Such changes may affect our existing and future business by, for example, causing customers to cancel existing policies, requiring us to change our range of products and services, forcing us to redesign our technology, requiring us to retrain our staff or increase our tax liability. As a global business, we are exposed to various local political, regulatory and economic conditions, business risks and challenges which may affect the demand for our products and services, the value of our investments portfolio and the credit quality of local counterparties. Our regulated business is subject to extensive regulatory supervision both in the UK and internationally. For details please refer to the section ‘Shareholder information – Regulation’.
Exchange rate fluctuations We publish our consolidated financial statements in pounds sterling. Due to our substantial non-UK operations, a significant portion of our operating earnings and net assets are denominated in currencies other than sterling, most notably the euro and the US dollar. As a consequence, our results are exposed to translation risk arising from fluctuations in the values of these currencies against sterling. Total foreign currency movements during 2010 resulted in a gain recognised in the income statement of £34 million, a decrease from a £154 million gain in 2009. We generally do not hedge foreign currency revenues, as we prefer to retain revenue locally in each business to support business growth, to meet local and regulatory market requirements and to maintain sufficient assets in local currency to match local currency liabilities. Movements in exchange rates may affect the value of consolidated shareholders’ equity, which is expressed in sterling. Exchange differences taken to other comprehensive income arise on the translation of the net investment in foreign subsidiaries, associates and joint ventures. This aspect of foreign exchange risk is monitored centrally against limits that we have set to control the extent to which capital deployment and capital requirements are not aligned. We use currency borrowings and derivatives when necessary to keep currency exposures within these predetermined limits, and to hedge specific foreign exchange risks when appropriate; for example, in any acquisition or disposal activity. During 2010, sterling had strengthened in value against the euro, but marginally weakened against the dollar, resulting in a foreign currency loss in other comprehensive income of £78 million (2009: £951 million loss). The impact of these fluctuations is limited to a significant degree, however, by the fact that revenues, expenses, assets and liabilities within our non-UK operations are generally denominated in the same currencies.
Acquisitions and disposals Over the last three years we have engaged in a series of acquisitions and disposals, some of which have had a material impact on our results. These transactions reflect our strategic objectives of maximising value for our shareholders by building top five positions in key markets, withdrawing from lines of business or markets that do not offer the potential for market-leading positions and taking advantage of particular opportunities as they arise.

45
Performance reviewCorporate responsibilityGovernanceShareholder informationFinancial statements IFRSFinancial statements MCEVOther information
Performance review
Aviva plc Annual Report and Accounts 2010
Financial and operating performance continued
Activity in 2010 On 17 February 2010, we sold our 35% holding in Sogessur SA to that company’s main shareholder for a consideration of £35 million, realising a profit on disposal of £24 million. On 24 February 2010, we acquired 100% of River Road Asset Management, a US equity manager, to support the expansion of Aviva Investors’ third-party institutional asset management business. The total consideration was estimated as £83 million (US$128 million). On 31 December 2010 the Group entered into transactions with RBS Group plc (RBSG) and agreed that, with effect from 31 December 2010, the Group would take ownership of the back book of RBS Life in exchange for RBSG taking 100% ownership of RBS Collective. Separately, a new distribution agreement was signed between our UK Life business and RBSG, with the new structure providing more flexibility in our long-term business operations.
Activity in 2009 On 1 October 2009, we completed the sale of our Australian life and pension business and wealth management platform to the National Australia Bank for A$902 million (£443 million). The sale supports Aviva’s strategy of focusing on the key growth markets in Asia where leading positions can be achieved. On 3 November 2009, we completed the Initial Public Offering (IPO) of approximately 42% of Delta Lloyd N.V. raising €1.1 billion (£1 billion). The IPO enabled Aviva to monetise part of its holding in Delta Lloyd, giving Aviva greater financial flexibility, including the option to explore balance sheet restructuring and further growth opportunities. It will also enhance the value and liquidity of Aviva’s retained stake in Delta Lloyd. Delta Lloyd, at the start of the year, sold its health business for £235 million to OWM CZ Groep Zorgverkeraar UA (CZ). The sale to CZ removed the underwriting risk and administration out of Delta Lloyd whilst continuing to sell health products and also market general insurance and income protection products to CZ’s customers. Continuing with the Group’s strategy to exit non-core operations, we disposed of the British School of Motoring Limited for a consideration of £4 million.
Activity in 2008 During 2008, we acquired subsidiaries in Ireland, Italy and Belgium. In Belgium we acquired Swiss Life Belgium, further strengthening our position in the Belgium life insurance market. The acquisition of UBI Vita in Italy provides us with a new bancassurance distribution channel and the acquisition of Vivas Group Limited in Ireland has enabled us to enter the Irish health insurance market. Total consideration for these acquisitions, including costs, was £189 million. As part of our strategy to exit non-core operations, we disposed of HPI Limited and RAC Autowindscreens Limited in the UK and our life operations in Luxembourg. In addition, we disposed of our offshore administration operations. These offshore operations will continue to provide administration services to our UK, Irish and Canadian businesses under a master services agreement with the new owners. Consideration for these disposals was £126 million, realising a net profit on disposal of £7 million.
Reattribution of inherited estate The ‘inherited estate’ refers to the assets of the long-term with-profit funds less the realistic reserves for non-profit policies, less asset shares aggregated across the with-profit policies and any additional amounts expected at the valuation date to be paid to in-force policyholders in the future in respect of smoothing costs and guarantees.
The reattribution of our inherited estate completed on 1 October 2009 following the High Court’s approval of the offer in September and final approval by the Aviva plc and Aviva UK Life boards. From a shareholder perspective the reattribution is expected to enhance the cash flow profile of Aviva’s UK life business and will bring significant financial benefits. In return for the £471 million paid to policyholders at the time of the deal, shareholders are expected to gain access to around £650 million of additional capital over five years, to fund new, non-profit business.
Basis of earnings by line of business Our earnings originate from three main lines of business: our long-term insurance and savings business, which includes a range of life insurance and savings products; fund management, which manages funds on behalf of our long-term insurance and general insurance businesses, external institutions, pension funds and retail clients; and general insurance and health, which focuses on personal and commercial lines. These lines of business are present in our various operating segments to a greater or lesser extent. In the UK, we have major long-term insurance and savings businesses and general insurance businesses; in Europe we have long-term insurance and savings businesses in all countries in which we operate, large general insurance businesses in Ireland and the Netherlands, through our Delta Lloyd subsidiary, and smaller general insurance operations in several other countries; in North America we have a large long-term insurance and savings business in the US and a major general insurance business in Canada; in Asia Pacific we predominantly have long-term insurance and savings businesses. Our fund management businesses operate across all our four regions.
Long-term insurance and savings business For most of our life insurance businesses, such as those in the UK, France and the Netherlands, operating earnings are generated principally from our in-force books of business. Our in-force books consist of business written in prior years and on which we continue to generate profits for shareholders. Nevertheless new business written in these markets, with the exception of our UK with-profits business which is discussed below, has a significant direct effect on our operating earnings. Under IFRS, certain costs incurred in acquiring new business must be expensed thereby typically giving rise to a loss in the period of acquisition, though the degree of this effect will depend on the pricing structure of product offerings. In markets where we are experiencing strong growth, such as we have experienced in Spain, Italy, the US and Asia in recent years, current year sales have a more significant effect on current year operating earnings.
UK with-profits business With-profits products are designed to pay policyholders smoother investment returns through a combination of annual bonuses and terminal bonuses. Shareholders’ profit emerges from this business in direct proportion to policyholder bonuses, as shareholders receive up to one-ninth of the value of each year’s bonus declaration to policyholders. Accordingly, the smoothing inherent in the bonus declarations provides for relatively stable annual shareholders’ profit from this business. The most significant factors that influence the determination of bonus rates are the return on the investments of the with-profits funds and expectations about future investment returns. Actual and expected investment returns are affected by, among other factors, the mix of investments supporting the with-profits fund, which in turn is influenced by the extent of the inherited estate within the with-profits fund. The annual excess of premiums and investment return over operating expenses, benefit provisions and claims payments within

Financial and operating performance continued
46
Aviva plc Annual Report and Accounts 2010
our with-profits funds that is not distributed as bonuses and related shareholders’ profit, is transferred from the income statement to the unallocated divisible surplus. Conversely, if a shortfall arises one year, for example because of insufficient investment return, a transfer out of the unallocated divisible surplus finances bonus declarations and related shareholders’ profit. The unallocated divisible surplus therefore consists of future (as yet undetermined) policyholder benefits, associated shareholders’ profit and the orphan estate. The orphan estate serves as working capital for our with-profits funds. It affords the with-profits fund a degree of freedom to invest a substantial portion of the funds’ assets in investments yielding higher returns than might otherwise be obtainable without being constrained by the need to absorb the cash-flow strain of writing large volumes of new business and the need to demonstrate solvency.
Other long-term insurance and savings business Non-profit business falls mainly into two categories: investment type business and risk cover business. Investment type business, which accounts for most of our non-profit business, includes predominantly unit-linked life and pensions business, where the risk of investing policy assets is borne entirely by the policyholder. In addition investment type business also includes life and pensions business where the risk of investing policy assets is typically shared between policyholders and shareholders, subject to a minimum rate of investment return guaranteed to policyholders. Operating earnings arise from unit-linked business when fees charged to policyholders based on the value of the policy assets exceed costs of acquiring new business and administration costs. In respect of remaining investment type business, investment return generated from policy assets has an effect on operating earnings though this is often non-proportional. Finally in respect of all investment type business, shareholders bear the risk of investing shareholder capital in support of these operations. Risk cover business includes term assurance, or term life insurance business. The risk of investing policy assets in this business is borne entirely by the shareholders. Operating earnings arise when premiums, and investment return earned on assets supporting insurance liabilities and shareholder capital, exceed claims costs, costs of acquiring new business and administration costs.
General insurance and health business Operating earnings within our general insurance and health business arise when premiums, and investment return earned on assets supporting insurance liabilities and shareholder capital, exceed claims costs, costs of acquiring new business and administration costs.
Fund management Fund management operating earnings consist of fees earned for managing policyholder funds and external retail and institutional funds on behalf of clients, net of operating expenses. Arrangements for the management of proprietary funds are conducted on an arm’s length basis between our fund management and insurance businesses. Such arrangements exist mainly in the UK, France, the Netherlands, Ireland, Australia, US and Canada. Proprietary insurance funds in other countries are externally managed.
Other business Other business includes our operations other than insurance and fund management. These incorporate mainly our roadside recovery operation in the UK, and our banking and retail mortgage operations in the Netherlands and Belgium.
Financial highlights The following analysis is based on our consolidated financial statements and should be read in conjunction with those statements. In order to fully explain the performance of our business, we discuss and analyse the results of our business in terms of certain financial measures which are based on IFRS ‘non-GAAP measures’ which we use for internal monitoring and for executive remuneration purposes. We review these in addition to GAAP measures such as profit before and after tax.
Non-GAAP measures Sales The total sales of the Group consist of long-term insurance and savings new business sales and general insurance and health net written premiums. We classify our long-term insurance and savings new business sales into the following categories:
Long-term insurance and savings new business sales Sales of the long-term insurance and savings business consist of: Covered business or life, pensions and savings products:
Insurance and participating investment business – This includes traditional life insurance, annuity business and
with-profits business – There is an element of insurance risk borne by the group
therefore, under IFRS, these are reported within net written premiums.
Non-participating investment business – This includes unit-linked business and pensions business – The amounts received for this business are treated as
deposits under IFRS and an investment management fee is earned on the funds deposited
– For new business reporting in the UK, companies continue to report non-participating investment business within their ‘covered business’ sales, in line with the historic treatment under UK GAAP.
Non-covered business or investment sales:
These include retail sales of mutual fund type products such as unit trusts and OEICs.
There is no insurance risk borne by the Group therefore under IFRS, these are treated as deposits and investment management fee income is earned on the funds deposited.
These have never been treated as ‘covered business’ for long-term insurance and savings reporting so we show these separately as investment sales.
Sales is a non-GAAP financial measure and key performance indicator that we report to our key decision makers in the businesses in order to assess the value of new business from our customers and compare performance across the markets in which we operate. We consider sales to be a critical indicator of new business, and is the basis on which we provide analysis of our results to our shareholders and analysts. The non-GAAP measure of sales is also used internally in the determination of bonus awards as an executive performance measure. For our general insurance and health business we report sales based on IFRS net written premiums. For long-term insurance and savings new business, we define sales as the sum of the present value of new business premiums (PVNBP) of life, pension and savings products and investment sales. PVNBP is equal to total single premium sales received in the year plus the discounted value of annual premiums expected to be received over the terms of newly incepted contracts and is calculated as at the date of sale. We adjust annual premiums to reflect the expected stream of business coming from this new business over future years. In the view of management this

47
Performance reviewCorporate responsibilityGovernanceShareholder informationFinancial statements IFRSFinancial statements MCEVOther information
Performance review
Aviva plc Annual Report and Accounts 2010
Financial and operating performance continued
performance measure better recognises the relative economic value of regular premium contracts compared to single premium contracts. PVNBP is a European insurance industry standard measure of new business. For our long-term insurance and savings business, we believe that sales is an important measure of underlying performance and a better measure for new business than IFRS net written premiums. We consider the use of sales over IFRS net written premiums provides:
Consistent treatment of long-term insurance and investment contracts: IFRS net written premiums do not include deposits received on non-participating investment contracts. Long-term insurance contracts and participating investment contracts also contain a deposit component, which are included in IFRS net written premiums, in addition to an insurance risk component. Therefore, to appropriately assess the revenue generated on a consistent basis between types of contracts, we evaluate the present value of new business sales of long-term insurance and investment products on the basis of total premiums and deposits collected, including sales of mutual fund type products such as unit trusts and OEICs.
Better reflection of the relative economic value of regular premium contracts compared to single premium contracts: Sales recognise the economic value of all expected contractual cash flows for regular premium contracts in the year of inception, whereas IFRS net written premiums only recognise premiums received in the year.
Better reflection of current management actions in the year: IFRS net written premiums include premiums on regular premium contracts, which incepted in prior years, and therefore reflect the actions of management in prior years.
In comparison to IFRS net written premiums, sales do not include premiums received from contracts in-force at the beginning of the year, even though these are a source of IFRS revenue, as these have already been recognised as sales in the year of inception of the contract. In addition, unlike IFRS net written premiums, sales do not reflect the effect on premiums of any increase or decrease in persistency of regular premium contracts compared to what was assumed at the inception of the contract. PVNBP is not a substitute for net written premiums as determined in accordance with IFRS. Our definition of sales may differ from similar measures used by other companies, and may change over time.
General insurance and health sales General insurance and health sales are defined as IFRS net written premiums, being those premiums written during the year net of amounts reinsured with third parties, as set out in the segmental analysis of results in ‘Financial Statements IFRS – Note 4 – Segmental information’. For sales reporting, we use the GAAP measure for general insurance and health business. The table below presents our consolidated sales for the years ended 31 December 2010, 2009 and 2008, as well as the reconciliation of sales to net written premiums in IFRS.
2010
£m 2009
£m 2008
£m
Long-term insurance and savings new business sales 37,360 35,875 40,240
General insurance and health sales 9,699 9,193 11,137
Total sales 47,059 45,068 51,377 Less: Effect of capitalisation factor on regular
premium long-term business (7,797) (8,612) (9,893) Share of long-term new business sales from
JVs and associates (1,446) (1,277) (1,062) Annualisation impact of regular premium
long-term business (538) (529) (613) Deposits taken on non-participating
investment contracts and equity release contracts (3,803) (3,481) (8,134)
Retail sales of mutual fund type products (investment sales) (4,002) (3,872) (3,995)
Add: IFRS gross written premiums from existing long-term business 5,963 6,547 7,730
Less: long-term insurance and savings business premiums ceded to reinsurers (1,025) (1,730) (1,045)
Total IFRS net written premiums 34,411 32,114 34,365
Analysed as: Long-term insurance
and savings net written premiums 24,712 22,921 23,228 General insurance and health net
written premiums 9,699 9,193 11,137
34,411 32,114 34,365
Effect of capitalisation factor on regular premium
long-term business: PVNBP is derived from the single and regular premiums of the products sold during the financial period and is expressed at the point of sale. The PVNBP calculation is equal to total single premium sales received in the year plus the discounted value of regular premiums expected to be received over the term of the new contracts. The discounted value of regular premiums is calculated using the market consistent embedded value methodology proposed by the CFO Forum Principles. The discounted value reflects the expected income streams over the life of the contract, adjusted for expected levels of persistency, discounted back to present value. The discounted value can also be expressed as annualised regular premiums multiplied by a weighted average capitalisation factor (WACF). The WACF varies over time depending on the mix of new products sold, the average outstanding term of the new contracts and the projection assumptions.
Share of long-term new business sales from joint ventures and associates: Total long-term new business sales include our share of sales from joint ventures and associates. Under IFRS reporting, premiums from these sales are excluded from our consolidated accounts, with only our share of profits or losses from such businesses being brought into the income statement separately.
Annualisation impact of regular premium long-term business: As noted above, the calculation of PVNBP includes annualised regular premiums. The impact of this annualisation is removed in order to reconcile the non-GAAP new business sales to IFRS premiums and will vary depending on the volume of regular premium sales during the year.
Deposits taken on non-participating investment contracts and equity release contracts: Under IFRS, non-participating investment contracts are recognised on the statement of financial position by recording the cash received as a deposit and an associated liability and are not recorded as premiums received in the income statement. Only the margin earned is recognised in the income statement.

Financial and operating performance continued
48
Aviva plc Annual Report and Accounts 2010
Retail sales of mutual fund type products (investment sales): Investment sales included in the total sales number represent the cash inflows received from customers to invest in mutual fund type products such as unit trusts and OEICs. We earn fees on the investment and management of these funds which are recorded separately in the IFRS income statement as ’fees and commissions received’ and are not included in statutory premiums.
IFRS gross written premiums from existing long-term business: The non-GAAP measure of long-term and savings sales focuses on new business written in the year under review while the IFRS income statement includes premiums received from all business, both new and existing.
Adjusted operating profit We report to our chief operating decision makers in the businesses the results of our operating segments using a financial performance measure we refer to herein as ‘adjusted operating profit’. We define our segment adjusted operating profit as profit before income taxes and non-controlling interests in earnings, excluding the following items: investment return variances and economic assumption changes on long-term and non-long-term business, impairment of goodwill, amortisation and impairment of other intangibles (excluding the acquired value of in-force business), profit or loss on the disposal of subsidiaries and associates, integration and restructuring costs and exceptional items. While these excluded items are significant components in understanding and assessing our consolidated financial performance, we believe that the presentation of adjusted operating profit enhances the understanding and comparability of the underlying performance of our segments by highlighting net income attributable to ongoing segment operations. Adjusted operating profit for long-term insurance and savings business is based on expected investment returns on financial investments backing shareholder and policyholder funds over the period, with consistent allowance for the corresponding expected movements in liabilities. The expected rate of return is determined using consistent assumptions between operations, having regard to local economic and market forecasts of investment return and asset classification. Where assets are classified as fair value through profit and loss, expected return is based on the same assumptions used under embedded value principles for fixed income securities, equities and properties. Where fixed interest securities are classified as available for sale, such as in the US, the expected return comprises interest or dividend payments and amortisation of the premium or discount at purchase. Adjusted operating profit includes the effect of variances in experience for non-economic items, such as mortality, persistency and expenses, and the effect of changes in non-economic assumptions. Changes due to economic items, such as market value movement and interest rate changes, which give rise to variances between actual and expected investment returns, and the impact of changes in economic assumptions on liabilities, are disclosed as non-operating items.
Adjusted operating profit for non-long-term insurance business is based on expected investment returns on financial investments backing shareholder funds over the period. Expected investment returns are calculated for equities and properties by multiplying the opening market value of the investments, adjusted for sales and purchases during the year, by the longer-term rate of return. This rate of return is the same as that applied for the long-term business expected returns. The longer-term return for other investments is the actual income receivable for the period. Changes due to market value movement and interest rate changes, which give rise to variances between actual and expected investment returns, are disclosed as non-operating items. The impact of changes in the discount rate applied to claims provisions is also treated outside adjusted operating profit. Adjusted operating profit is not a substitute for profit before income taxes and non-controlling interests in earnings or net income as determined in accordance with IFRS. Our definition of adjusted operating profit may differ from similar measures used by other companies, and may change over time. The table below presents our consolidated adjusted operating profit for 31 December 2010, 2009 and 2008, as well as the reconciliation of adjusted operating profit to profit before tax attributable to shareholders’ profits under IFRS.
2010 £m
2009 £m
2008 £m
United Kingdom 1,411 1,165 1,377 Europe 1,434 1,196 1,141 North America 376 213 149 Asia Pacific 31 77 36 Aviva Investors 97 115 114 Other (799) (744) (520)
Adjusted operating profit 2,550 2,022 2,297
Add back adjusting items: Investment return variances and economic
assumption changes on long-term insurance business 791 (75) (1,631)
Short-term fluctuation in return on investments on non-long-term business (243) 95 (819)
Economic assumption changes on general insurance and health business (61) 57 (94)
Impairment of goodwill (24) (62) (66) Amortisation and impairment of intangibles (216) (144) (117) Profit on the disposal of subsidiaries
and associates 159 153 7 Integration and restructuring costs (243) (286) (326) Exceptional items (273) 45 (551)
Profit/(loss) before tax attributable to shareholders’ profits 2,440 1,805 (1,300)
Consolidated results of operations The table below presents our consolidated sales for the years ended 31 December 2010, 2009 and 2008.
2010 £m
2009 £m
2008 £m
United Kingdom 16,385 14,261 18,756 Europe 21,810 21,750 21,806 North America 6,686 6,345 7,316 Asia Pacific 2,178 2,712 3,499
Total sales 47,059 45,068 51,377

49
Performance reviewCorporate responsibilityGovernanceShareholder informationFinancial statements IFRSFinancial statements MCEVOther information
Performance review
Aviva plc Annual Report and Accounts 2010
Financial and operating performance continued
The table below presents our consolidated income statement under IFRS for the years ended 31 December 2010, 2009 and 2008.
2010
£m 2009
£m 2008
£m
Income Gross written premiums 36,274 34,690 36,206 Premiums ceded to reinsurers (1,863) (2,576) (1,841)
Premiums written net of reinsurance 34,411 32,114 34,365 Net change in provision for unearned premiums (75) 559 277
Net earned premiums 34,336 32,673 34,642 Fee and commission income 1,782 1,789 1,885 Net investment income/(expense) 21,993 25,155 (16,043) Share of profit / (loss) of joint ventures and
associates 131 (504) (1,128)
Profit on the disposal of subsidiaries and associates 159 153 7
58,401 59,266 19,363
Expenses Claims and benefits paid, net of recoveries
from reinsurers (29,152) (27,549) (29,353) Change in insurance liabilities, net of
reinsurance (7,177) (5,682) 3,885
Change in investment contract provisions (8,741) (11,185) 10,629 Change in unallocated divisible surplus 329 (1,547) 4,482 Fee and commission expense (5,867) (4,396) (4,411) Other expenses (3,537) (5,366) (5,416) Finance costs (1,422) (1,519) (1,547)
(55,567) (57,244) (21,731)
Profit/(loss) before tax 2,834 2,022 (2,368) Tax attributable to policyholders’ returns (394) (217) 1,068
Profit/(loss) before tax attributable to shareholders’ profits 2,440 1,805 (1,300)
Sales Year ended 31 December 2010 Sales in 2010 were £47,059 million, an increase of £1,991 million, or 4% from £45,068 million in 2009. Sales in the UK increased for both long-term insurance and savings (19% increase on 2009) and general insurance and health (6% increase on 2009). Europe sales were flat at £21,810 million (2009: £21,750 million) with lower sales in Poland, Spain and Delta Lloyd offsetting growth in Italy and other Europe. North America long-term insurance and savings sales increased by 4%, or £183 million, and general insurance sales increased by 9%, or £158 million. Sales in Asia Pacific were down on the prior year by £534 million, or 20%, with the impact of the sale of the Australian life business in 2009 more than offsetting growth in other Asian markets.
Year ended 31 December 2009 Sales in 2009 were £45,068 million, a decrease of £6,309 million, or 12%, from £51,377 million in 2008. All regions reported a decrease in sales in 2009. Long-term insurance and savings and general insurance and health sales decreased by 24% in the UK with Europe reporting an increase of 6% in long-term insurance and savings sales offset by a 26% decrease in general insurance and health sales mainly attributable to the sale of the Delta Lloyd health business on 1 January 2009. North America long-term insurance and savings sales decreased by £1,170 million, offset by a 12% increase in general insurance sales in Canada. Asia Pacific reported a decrease in sales of 22% mainly attributable to the sale of the Australian business on 1 October 2009.
Income Year ended 31 December 2010 Net written premiums in 2010 were £34,411 million, an increase of £2,297 million, or 7%, from £32,114 million in 2009. All regions reported increases on 2009 levels. General and health
insurance increased by 6% on 2009, and life insurance and savings increased by 8%, fuelled by strong annuity sales in the UK. Europe reported a £585 million increase in net written premiums over 2009, whilst North America and Asia showed increases in net written premiums of 4% and 27% respectively.
Year ended 31 December 2009 Net written premiums in 2009 were £32,114 million, a decrease of £2,251 million, or 7%, from £34,365 million in 2008. Long-term insurance and savings and general insurance and health both reported decreases in net written premiums primarily in the UK with a 36% decrease in long-term insurance and savings and 22% decrease in general insurance and health net written premiums in the UK. Europe reported a 12% increase in net written premiums with both North America and Asia Pacific reporting a decrease in net written premiums of 2% and 11% respectively.
Net investment income Year ended 31 December 2010 Net investment income for the year was £21,993 million, a decrease of £3,162 million (2009: £25,155 million). Investment returns were generally lower than in 2009, with lower unrealised gains on investments in 2010 and improved fair value adjustments on investment properties.
Year ended 31 December 2009 Net investment income for the year was £25,155 million, an increase of £41,198 million (2008: £16,043 million loss). During 2009, investment markets across the regions in which we operated improved significantly from the falls in property and equity markets that were experienced in 2008.
Other income Year ended 31 December 2010 Other income (which consists of fee and commission income, share of profit/(loss) after tax of joint ventures and associates, and profit on disposal of subsidiaries and associates) increased by £634 million to £2,072 million in 2010 (2009: £1,438 million). The increase was primarily due to improved financial performance by joint ventures and associates, with the share of profit in the year being £131 million against a loss in 2009 of £504 million.
Year ended 31 December 2009 Other income (which consists of fee and commission income, share of (loss)/profit after tax of joint ventures and associates, and profit/(loss) on disposal of subsidiaries and associates) increased by £674 million to £1,438 million in 2009 (2008: £764 million). Profit/(loss) on disposal of subsidiaries and associates includes the sale of our Dutch health business and our Australian long-term insurance and savings business resulting in a profit of £153 million. The loss after tax of joint ventures and associates was £504 million, an increase on 2008 of £624 million from increasing property values from our property partnerships.
Expenses Year ended 31 December 2010 Claims and benefits paid net of reinsurance in 2010 were £29,152 million, an increase of £1,603 million over 2009 (2009: £27,549 million) reflecting the overall growth of the portfolio and surrender values. This includes a marginal decrease in claims payments to general insurance and health policyholders. Changes in insurance liabilities in 2010 were a charge of £7,177 million, an increase of £1,495 million on the prior year (2009: £5,682 million charge). This is primarily due to changes in economic and non-economic assumptions. The change in investment contract provision of £8,741 million charge (2009: £11,185 million charge) is a result of improved

Financial and operating performance continued
50
Aviva plc Annual Report and Accounts 2010
investment markets across our regions resulting in increases in our contract liabilities. The change in unallocated divisible surplus (UDS) of £329 million credit (2009: £1,547 million charge) reflects rising government bond yields in Italy, Spain and Ireland in the fourth quarter of 2010. Fee and commission expense, other expenses and finance costs of £10,826 million decreased by £455 million from £11,281 million in 2009. Increased fee and commission expenses were offset by lower other expenses, impairment charges and finance costs: see ‘Financial Statements – Note 6 – Details of expenses’.
Year ended 31 December 2009 Claims and benefits paid in 2009 were £27,549 million, a decrease of £1,804 million (2008: £29,353 million). The decrease in claims and benefits paid are a result of a fall in surrenders during the year and our Dutch healthcare business being sold as of 1 January 2009. Changes in insurance liabilities in 2009 were a charge of £5,682 million, an increase of £9,567 million (2008: £3,885 million credit). The unfavourable movement is a result of new business provision and the impact of the euro against sterling. The change in investment contract provisions of £11,185 million charge (2008: £10,629 million credit) is a result of improved investment markets across our regions resulting in increases in our contract liabilities and the impact of the euro against sterling. Unallocated divisible surplus charge of £1,547 million (2008: £4,482 million credit) reflects the narrowing of investment spread on participating assets and related liabilities. In 2008, a negative balance in Spain created a charge of £203 million of which £159 million was reversed in 2009. Fee and commission expense, other expenses and finance costs of £11,281 million decreased by £93 million or 1% from £11,374 million in 2008. Lower staff costs and impairment charges were offset by higher exceptional costs following the reattribution of the inherited estate in the UK – see ‘Financial Statements – Note 6 – Details of expenses’.
Profit/(loss) before tax attributable to shareholders’ profits Year ended 31 December 2010 Profit before tax attributable to shareholders in 2010 was £2,440 million against a profit of £1,805 million in 2009. The increase is primarily due to the increase in premiums and decrease in expenses, which more than offsets the drop in net investment income.
Year ended 31 December 2009 Profit before tax attributable to shareholders in 2009 was £1,805 million against a loss of £1,300 million in 2008. The increase is primarily due to favourable investment performance in 2009 which more than offset the decrease in premiums and increase in expenses as discussed above.
Adjusting items Year ended 31 December 2010 The long-term insurance and savings business investment variances and economic assumption changes was a gain of £791 million (2009: £75 million charge). The favourable change is mainly driven by differing movements in asset and liability yield curves. The short-term fluctuations and economic assumption changes on the non-life business were a £304 million charge (2009: £152 million credit). This is due to unfavourable market movements in a number of our regions.
Impairment of goodwill was £24 million in 2010 (2009: £62 million). The current year charge primarily relates to an impairment recognised in an Italian associate and £9 million against Taiwan. Amortisation of intangibles increased by £72 million to £216 million in 2010 (2009: £144 million) due to a £66 million higher amortisation charge recognised in UK Life relating to an accelerated amortisation period for certain assets. Profit on disposal of subsidiaries and associates was £159 million (2009: £153 million). The profit comprises principally of a £128 million profit in relation to the transaction with RBSG, as described in note 3 to the IFRS financial statements. Integration and restructuring costs for 2010 were £243 million (2009: £286 million). 2010 costs include expenditure on restructuring programmes across the Group of £123 million; costs in relation to the European ‘Quantum Leap’ transformation programme of £40 million; and costs associated with preparing the businesses for Solvency II implementation amounted to £59 million. Exceptional items in 2010 were £273 million adverse (2009: £45 million favourable). This included exceptional strengthening of longevity assumptions of approximately £483 million for Delta Lloyd following the introduction of new mortality tables in 2010, partially offset by a net gain on the closure of the UK pension schemes of £286 million.
Year ended 31 December 2009 The long-term insurance and savings business investment variances and economic assumption changes on long-term insurance business was a charge of £75 million (2008: £1,631 million charge). The favourable change is driven by positive market movements across our regions and the inclusion in 2008 of a £550 million provision for credit defaults in the UK. The short-term fluctuations and economic assumption changes on the non-life business were a £152 million credit (2008: £913 million charge). Favourable market movements across our regions were the primary driver for the change in the current year result. Impairment of goodwill was £62 million in 2009 (2008: £66 million) driven by impairments in our UK life business and on an Italian associate. Amortisation of intangibles increased by £27 million to £144 million in 2009 (2008: £117 million) on higher levels of bancassurance and other distribution agreements held within the Group. Profit on disposal of subsidiaries and associates were £153 million. The profit comprises £31 million from the sale of our Dutch health insurance business and £122 million from the sale of our Australian life and pensions business. Integration and restructuring costs for 2009 were £286 million (2008: £326 million). This includes £210 million for the cost savings initiatives in the UK life and general insurance businesses and Europe, which have delivered £170 million annualised cost savings in the year. Exceptional items for 2009 amounted to £45 million favourable (2008: £551 million adverse). This includes an exceptional gain resulting from the reattribution of the inherited estate offset by strengthening of reserves in respect of several specific discontinued commercial liability risks written in Canada a significant number of years ago and the migration of all remaining local brands, except Delta Lloyd and RAC, to the single global Aviva brand, which has been implemented over the two-year period 2008 to 2009.

51
Performance reviewCorporate responsibilityGovernanceShareholder informationFinancial statements IFRSFinancial statements MCEVOther information
Performance review
Aviva plc Annual Report and Accounts 2010
Financial and operating performance continued
Adjusted operating profit Year ended 31 December 2010 Adjusted operating profit increased by £528 million, or 26%, to £2,550 million (2009: £2,022 million) for the reasons set out above.
Year ended 31 December 2009 Adjusted operating profit decreased by £275 million, or 12%, to £2,022 million (2008: £2,297 million) for the reasons set forth above.
Regional performance United Kingdom Our operations in the UK consist of long-term insurance and savings business, which provides products such as bonds and savings, pensions, protection, annuities, equity release and investment products, including both with-profits and non-profit business, and our general insurance and health business, which provides a range of general and health insurance products focused on personal and business customers, such as household, motor and liability insurance, together with a range of breakdown products from the RAC.
Long-term and savings business The table below presents sales, net written premiums, adjusted operating profit and profit/(loss) before tax attributable to shareholders’ profits under IFRS from our UK long-term business for the years ended 31 December 2010, 2009 and 2008.
2010 £m
2009 £m
2008 £m
Protection 944 965 1,126 Pensions 4,062 3,752 4,753 Annuities 3,170 1,897 2,433 Bonds 1,686 2,024 3,296 Equity release 436 276 250 Investment sales 1,548 1,049 1,485
Sales 11,846 9,963 13,343 Net written premiums 5,469 4,389 7,107 Adjusted operating profit 853 658 733 Profit/(loss) before tax attributable to
shareholders’ profits 784
611
(149)
Year ended 31 December 2010 On a PVNBP basis, sales in our UK long-term insurance and savings business increased by £1,883 million, or 19%, to £11,846 million (2009: £9,963 million). Protection sales have stayed broadly level as a 14% increase in core protection products offset a reduction in other areas. Pension sales increased by 8% supported by a strong performance in group personal pensions. Annuities increased by 67% supported by higher sales of bulk purchase annuities and a 34% increase in the sale of individual annuities. Bonds decreased 17% as we continued to manage for value rather than volume. Investment sales increased by 48% due to growth in managed and structured fund sales and as consumers reinvested in property as an asset class. Equity release showed an increase of 58%. Net written premiums in our UK long-term insurance and savings business were £5,469 million, an increase of £1,080 million, or 25%, from £4,389 million in 2009. The increase is primarily due to higher bulk purchase annuity sales. Adjusted operating profit in our UK long-term insurance and savings business increased by 30% to £853 million (2009: £658 million) reflecting the full year benefit of the Reattributed Inherited Estate External Support Account (RIEESA), increased annuity profitability and improved market conditions resulting in higher annual management charge (AMC) income. This was
partly offset by a reduction in with-profits shareholder transfers driven by reduced bonus rates and a lower, final special distribution. Profit before tax was £784 million for 2010 (2009: £611 million) which includes a £128 million one-off benefit from the restructuring of our joint venture with the Royal Bank of Scotland.
Year ended 31 December 2009 Sales in our UK long-term insurance and savings business decreased by £3,380 million, or 25%, to £9,963 million (2008: £13,343 million). Protection sales have decreased by 14% as a result of regulatory changes affecting creditor sales volumes. Pension sales decreased by 21% due to the reduced number of large schemes written in the year. Annuities decreased by 22% due to lower bulk purchase annuity volumes, bonds decreased 39% and investment sales decreased by 29%. Equity release showed an increase of 10%. Net written premiums in our UK long-term insurance and savings business were £4,389 million, a decrease of £2,718 million, or 38%, from £7,107 million in 2008. The decrease is primarily due to lower bulk purchase annuity and bond sales. Adjusted operating profit in our UK long-term insurance and savings business decreased by 10% to £658 million (2008: £733 million) reflecting lower asset values on bonuses declared in our with-profits funds and on the level of the with-profit special distribution bonus. The non-profit result increased to £495 million (2008: £462 million) including the benefit of the reattribution but was partly offset by lower annual management charges. Profit before tax was £611 million for 2009 (2008: £149 million loss). The loss for 2008 included an additional £550 million provision for credit defaults over and above the long-term provisions, which has been retained in 2009, and £97 million for the cost of transferring the investment wrap platform to a third-party supplier, which were one off events in that year.
General insurance and health The table below presents sales, net written premiums, adjusted operating profit and profit/(loss) before tax attributable to shareholders’ profits under IFRS from our UK general insurance and health business for the years ended 31 December 2010, 2009 and 2008.
2010 £m
2009 £m
2008 £m
Sales/net written premiums 4,539 4,298 5,413 Adjusted operating profit 579 535 656 Profit/(loss) before tax attributable to
shareholders’ profits 457
434
(391)
Year end 31 December 2010 UK general insurance and health net written premiums were £4,539 million, an increase of £241 million, or 6%, on 2009 (2009: £4,298 million). The increase reflects a combination of factors including excellent retention, substantial growth in our direct channel, rolling out our direct prices to brokers, good levels of commercial new business and the launch of our corporate risks offering. Adjusted operating profit in 2009 was £579 million, an increase of £44 million, or 8% (2009: £535 million). The increase in adjusted operating profit results from an improvement in current year profitability which has more than offset an adverse impact from weather-related claims of £40 million compared to long-term average (2009: neutral), a £29 million reduction in investment return to £388 million (2009: £417 million) and lower savings on prior year claims development of £87 million (2009: £105 million).

Financial and operating performance continued
52
Aviva plc Annual Report and Accounts 2010
Profit before tax was £457 million, an increase of £23 million from a profit of £434 million in 2009. The increase in operating profit and lower levels of restructuring costs were broadly offset by adverse movements in economic assumption changes and an increase in pension deficit funding in the year.
Year ended 31 December 2009 UK general insurance and health net written premiums were £4,298 million, a decrease of £1,115 million, or 21%, on 2008 (2008: 5,413 million). The decrease reflects a combination of the actions taken to exit unprofitable business and difficult market conditions, most notably in creditor due to lower levels of lending, and commercial due to more business failures, fewer start-ups and reduced levels of exposure. Adjusted operating profit in 2009 was £535 million, a decrease of £121 million, or 18% (2008: £656 million). The decrease in adjusted operating profit is a result of a decline in long-term investment returns, an increase in creditor claims resulting from the recession and a reduction in savings on prior year claims development to £105 million (2008: £285 million). Profit before tax was £434 million, an increase of £825 million from a loss of £391 million in 2008. The increase predominately reflects the impact of investment variances of £397 million and an exceptional charge in 2008 of £279 million relating to the discounted cost of strengthening our latent claims.
Europe Aviva Europe has substantial long-term insurance and savings businesses in France, Ireland, Italy, Poland and Spain. We also have a growing presence in Russia and Turkey. We have large general insurance businesses in France, Ireland and Italy as well as smaller operations in Poland and Turkey. Our Europe fund management operations are managed by Aviva Investors. Delta Lloyd operations include long-term insurance and savings, general insurance and fund management. The table below presents sales and net written premiums from our operations in Europe for the years ended 31 December 2010, 2009 and 2008, including amounts relating to investment sales from Aviva Investors.
2010 £m
2009 £m
2008 £m
Sales Long-term insurance and savings business France 4,918 4,891 3,880 Ireland 938 1,072 1,299 Italy 4,456 3,607 2,331 Poland (including Lithuania) 751 1,161 1,906 Spain 2,084 2,454 2,489 Other Europe 1,740 1,190 1,410
Aviva Europe 14,887 14,375 13,315 Delta Lloyd 3,793 4,329 4,401
Total long-term insurance and savings business 18,680 18,704 17,716
General insurance and health France 968 952 882 Ireland 459 474 513 Other Europe 526 457 417
Aviva Europe 1,953 1,883 1,812 Delta Lloyd 1,177 1,163 2,278
Total general insurance and health 3,130 3,046 4,090
Sales 21,810 21,750 21,806
Aviva Europe 13,041 12,455 9,183 Delta Lloyd 4,340 4,341 5,883
Net written premiums 17,381 16,796 15,066
The table below presents adjusted operating profit and profit before tax attributable to shareholders’ profits under IFRS from our operations in Europe for the years ended 31 December 2010, 2009 and 2008.
2010 £m
2009 £m
2008 £m
Adjusted operating profit Long-term insurance
and savings business
France 319 272 275 Ireland 122 50 61 Italy 119 128 48 Poland (including Lithuania) 157 152 162 Spain 179 160 155 Other Europe (3) (1) (16)
Aviva Europe 893 761 685 Delta Lloyd 330 277 196
Total long-term insurance and savings business 1,223 1,038 881
General insurance and health France 76 97 107 Ireland 51 57 68 Other Europe (18) (22) 45
Aviva Europe 109 132 220 Delta Lloyd 146 143 177
Total general insurance and health 255 275 397
Fund management 103 31 14 Non-insurance (147) (148) (151) Total adjusted operating profit 1,434 1,196 1,141
Profit before tax attributable to shareholders’ profits
1,503
941
48
Year ended 31 December 2010 Europe sales in 2010 were £21,810 million, marginally increased on the prior year (2009: £21,750 million) primarily due to increased sales in Italy and Other Europe more than offsetting lower sales levels in Delta Lloyd, Poland and Spain. Total adjusted operating profit increased to £1,434 million (2009: £1,196 million). Adjusted operating profit for long-term insurance and savings business in 2010 increased by £185 million to £1,223 million (2009: £1,038 million) with all regions showing an increase in profitability apart from Italy, where increased premiums were offset by increased new business strain. General insurance and health adjusted operating profit decreased by £20 million to £255 million (2009: £275 million) due to lower longer-term investment returns partially offset by expense savings. Europe’s profit before tax attributable to shareholders’ profits was £1,503 million in 2010, an increase of £562 million from 2009. The improved result was driven by growth in profits on existing life business in France and Spain, and stable results in other markets. Ireland also benefited from £95 million reserve releases in the year, including £55 million following the adoption of realistic reserving in 2010. Delta Lloyd operating profits increased by £137 million primarily due to higher expected investment returns and expense margins.
Aviva Europe Aviva Europe long-term insurance and savings sales were £512 million higher than prior year at £14,887 million (2009: £14,375 million), despite the continuing challenging economic environment. Sales through our bancassurance channel have increased 9% to £8,040 million (2009: £7,353 million), primarily as a result of strong sales in Italy. Retail sales have decreased 11% to £5,497 million (2009: £6,170 million). Nearly 60% of the decline in sales is from Poland as a result of significant pension legislation changes.

53
Performance reviewCorporate responsibilityGovernanceShareholder informationFinancial statements IFRSFinancial statements MCEVOther information
Performance review
Aviva plc Annual Report and Accounts 2010
Financial and operating performance continued
General insurance and health sales increased 4% to £1,953 million (2009: £1,883 million). We saw growth in all our general insurance and health markets except in Ireland. In Ireland health insurance sales grew 19%, however general insurance sales declined as the market continues to be challenging. Net written premiums in long-term insurance and savings business were £13,041 million, an increase of £586 million, or 5% (2009: £12,455 million) driven by sales of our profit sharing single premium products in Italy. Aviva Europe’s long-term insurance and savings business adjusted operating profit was £893 million, an increase of £132 million, or 17%, from £761 million in 2009, reflecting increased profits from existing business in France, Italy and Spain offset by increased new business strain in Italy. The current year result includes £55 million from release of reserves for protection business following the adoption of realistic reserving in 2010. Aviva Europe’s adjusted operating profit of our general insurance and health businesses was £109 million in 2010, a decrease of £23 million, or 17%, over £132 million in 2009, primarily due to lower longer-term investment returns as a result of lower interest rate yields.
Delta Lloyd Delta Lloyd reported long-term and savings sales of £3,793 million, a decrease of £536 million, or 12%, on 2009 (2009: £4,329 million). Life and pension sales decreased by 13% to £3,178 million with investment sales reported at £615 million, a decrease of 7% on 2009. Excluding Germany, life and pension sales were 3% lower on a local currency basis. General insurance and health sales at £1,177 million are in line with prior year (2009: £1,163 million) and 5% higher on a local currency basis. This includes amounts from accelerating the reporting of brokered business onto an actual basis; excluding these amounts net written premiums were stable year on year. Delta Lloyd reported net written premiums of £4,340 million in line with 2009 (2009: £4,341 million) primarily due to lower group pension contracts and the closure of the German operation to new business being offset by an increase in annuity product sales. Adjusted operating profit was £536 million, an increase of £137 million on £399 million in 2009. Improved profits in the fund management segment resulted from a substantial one-off performance fee received in late 2010 while life operating profit benefited from increased technical margins and a reduction in administration costs.
Year ended 31 December 2009 Europe sales in 2009 were in line with the prior year at £21,750 million (2008: £21,806 million). A 6% increase in long-term insurance and savings sales to £18,704 million (2008: £17,716 million) offset a 26% decrease in general insurance and health net written premiums to £3,046 million (2008: £4,090 million). Net written premiums in 2009 increased by £1,730 million or 12% to £16,796 million (2008: £15,066 million). Adjusted operating profit in 2009 was £1,196 million, an increase of 5%, or £55 million, from £1,141 million. Europe’s profit before tax attributable to shareholders’ profits was £941 million in 2009, an increase of £893 million from £48 million in 2008. The increase is mainly attributable to favourable investment returns.
Aviva Europe Aviva Europe reported an increase in long-term insurance and savings sales of £1,060 million, or 8%, to £14,375 million (2008: £13,315 million) largely due to the strengthening of the euro against sterling. Life and pension sales contributed £668 million to the increase in long-term insurance and savings sales with £392 million from investment sales. Both France and Italy reported increases in life and pension sales of 26% and 55%, respectively, with all other markets reporting a decrease in sales. Poland sales were 41% down reflecting the impact of pension legislation changes and special promotions in 2008. General insurance and health sales increased by 4% to £1,883 million (2008: £1,812 million) primarily due to increased sales in France and other European markets, offset by an 8% fall in sales in Ireland. Net written premiums in long-term insurance and savings businesses were £10,572 million, an increase of £3,201 million, or 43% (2008: £7,371 million) driven by France and Italy. Sales in France have increased through AFER and Italy reported an increase in sales of profit sharing single premium products. Aviva Europe’s long-term insurance and savings business adjusted operating profit was £761 million, an increase of £76 million, or 11%, from £685 million in 2008, reflecting increased profits from existing business in France and Italy due to favourable experience in claims, lapses and surrenders. Aviva Europe’s adjusted operating profit of our general insurance and health businesses was £132 million in 2009, a decrease of £88 million, or 40%, over £220 million in 2008, primarily due to extreme weather in Ireland and France during the year.
Delta Lloyd Delta Lloyd reported long-term and savings sales of £4,329 million, a decrease of £72 million, or 2%, on 2008 (2008: £4,401 million). Life and pension sales decreased by 11% to £3,665 million with investment sales reported at £664 million, an increase of 118% on 2008. General insurance and health sales were £1,163 million (2008: £2,278 million), a decrease of £1,115 million, or 49%, as a result of the sale of their health business on 1 January 2009. Adjusting for the impact of the sale, Delta Lloyd general insurance sales were 13% higher on 2008 (2008: £1,028 million) benefiting from the strengthening of the euro and the inclusion of a full year’s contribution from Swiss Life Belgium. Delta Lloyd reported net written premiums of £4,341 million, a decrease of £1,542 million, or 26%, on 2008 (2008: £5,883 million) primarily due to lower group pension contracts and the sale of the health business. Adjusted operating profit was £399 million, an increase of £89 million on £310 million in 2008. Improved profits in the long-term and savings business resulted from lower new business strain, driven by a decrease in corporate pension sales, expense savings, and strengthening of the euro.

Financial and operating performance continued
54
Aviva plc Annual Report and Accounts 2010
North America Aviva North America includes the long-term insurance and savings business in the US, which provides life insurance and annuity products, and the general insurance business in Canada. The table below presents sales, net written premiums, adjusted operating profit and IFRS profit/(loss) before tax attributable to shareholders for the years ended 31 December 2010, 2009 and 2008.
2010 £m
2009 £m
2008 £m
Protection 999 871 623 Annuities 3,729 3,674 4,244 Other long-term business — — 848 General insurance 1,958 1,800 1,601
Sales 6,686 6,345 7,316
Net written premiums 6,443 6,176 6,268 Adjusted operating profit Long-term insurance business 174 85 16 General insurance 222 144 145 Non-insurance (20) (16) (12)
376 213 149
Profit/(loss) before tax attributable to shareholders’ profits
309
244
(338)
Year ended 31 December 2010 Sales in Aviva North America were £6,686 million, an increase of £341 million, or 5% (2009: £6,345 million). Annuity sales in 2010 grew to £3,729 million, slightly above last year’s levels (2009: £3,674 million) reflecting focus on our key distribution partners while balancing productivity, profitability and capital efficiency. Compared to the prior year, our protection sales have increased by 15% to £999 million (2009: £871 million) and account for 21% (2009: 19%) of our total new business sales in the US reflecting our continued focus on business diversification. The US business is now the leading provider of life insurance protection products in the Aviva Group, following the second consecutive year of double digit internally generated growth in this segment. General insurance sales in Canada increased by £158 million, or 9%, to £1,958 million (2009: £1,800 million), benefitting from the impact of foreign exchange, which more than offset a 3% decline on a local currency basis reflecting our actions to eliminate poorly performing personal lines business. Aviva North America’s net written premiums increased by £267 million, or 4%, to £6,443 million (2009: £6,176 million). The increase is a result of higher protection product sales in the US and foreign exchange driven increases in Canada as noted above. Adjusted operating profit was £376 million, an increase of £163 million, or 77% (2009: £213 million). Long-term insurance and savings adjusted operating profit increased 105% to £174 million (2009: £85 million) driven by strong spread management, expense discipline and an improved economic environment. General insurance adjusted operating profit improved 54% in 2010 to £222 million (2009: £144 million) due to improved risk selection, product pricing and cost savings combined with benign weather in the early part of 2010. Aviva North America’s profit before tax attributable to shareholders’ profits was £309 million, a 27% increase (2009: £244 million). The increase is mainly as a result of improved operating results that more than offset short term investment variances in both our life and general insurance businesses.
Year ended 31 December 2009 Sales in Aviva North America were £6,345 million, a decrease of £971 million, or 13%, (2008: £7,316 million). The decrease is driven by a reduction in annuity sales resulting from management action to focus on capital efficiency and the decision not to participate in funding agreement business in 2009. Protection product sales increased by 40% on actions to create innovative products and expand product distribution. General insurance sales in Canada increased by £199 million, or 12%, to £1,800 million (2008: £1,601 million), with growth driven by increased sales in homeowner while personal auto premiums were maintained at a similar level to 2008. Aviva North America’s net written premiums decreased by £92 million, or 1%, to £6,176 million (2008: £6,268 million). The decrease is a result of lower long-term insurance and savings sales in the US offset by improved sales in Canada as stated above. Adjusted operating profit was £213 million, an increase of £64 million, or 43%, on 2008 (2008: £149 million). Long-term insurance and savings adjusted operating profit increased to £85 million (2008: £16 million) driven by improved investment margin earned on existing equity indexed annuity business. General insurance adjusted operating profit is in line with 2008 at £144 million (2008: £145 million) with the benefits of increased sales volumes, higher long-term investment return, cost savings and foreign exchange movements being offset by the adverse movement in the claims experience. Aviva North America’s profit before tax attributable to shareholders’ profits was £244 million, an increase of £582 million (2008: £338 million loss). The increase is mainly as a result of favourable investment performance during the year.
Asia Pacific Aviva Asia Pacific operates in nine countries across the region through both joint ventures and wholly-owned operations. We have businesses in markets at various stages of development, with established businesses in Singapore and Hong Kong, high potential businesses in India and China and developing businesses in South Korea, Malaysia, Sri Lanka, Taiwan and Indonesia. The table below presents the sales, net written premiums, adjusted operating profit and profit/(loss) before tax attributable to shareholders’ profits under IFRS of Aviva Asia Pacific for the years ended 31 December 2010, 2009 and 2008.
2010 £m
2009 £m
2008 £m
Asia Pacific 2,178 1,717 1,852 Australia long-term insurance and savings business — 995 1,647
Sales 2,178 2,712 3,499
Asia Pacific 579 377 425 Australia long-term insurance and savings business — 78 86 Net written premiums 579 455 511 Adjusted operating profit Asia Pacific long-term insurance and savings
business 71 52 2 Australia long-term insurance and savings business — 40 44 General insurance and health (6) 6 — Fund management and non-insurance (34) (21) (10)
Adjusted operating profit 31 77 36
Profit/(loss) before tax attributable to shareholders’ profits – Asia Pacific 39 101 (108)
Profit/(loss) before tax attributable to shareholders’ profits – Australia — 45 40
Profit/(loss) before tax attributable to shareholders’ profits 39
146
(68)

55
Performance reviewCorporate responsibilityGovernanceShareholder informationFinancial statements IFRSFinancial statements MCEVOther information
Performance review
Aviva plc Annual Report and Accounts 2010
Financial and operating performance continued
Year ended 31 December 2010 Total Asia sales excluding Australia increased by £461 million, or 27%, to £2,178 million (2009: £1,717 million6) underpinned by improving economic conditions and reflecting our business expansion in Asia and the success of our bancassurance partnerships. Life and pensions sales (in PVNBP terms) increased by 48%, with more than half of our sales coming from bancassurance channels. Investment sales through Navigator (our wrap administration platform) declined although total funds under administration grew by 23% over the year. Net written premiums increased by £202 million to £579 million (2009: £377 million6). This strong growth reflects the new online (direct) general insurance platform in Singapore and our entry into the Indonesia health market as well as growth in existing markets. This more than offsets the drop in net written premiums due to the disposal of the Australian business. Excluding one-off impacts on adjusted operating profit (2010: £27 million from a change in China GAAP basis; 2009: £68 million release of reserves in Singapore) and excluding the contribution from Australia, the underlying adjusted operating profit increased by £40 million reflecting scale and focused cost management. Profit before tax of £39 million is lower than the prior year (2009: £146 million) due to the profit arising in 2009 on the sale of the Australian business and the contribution from substantial investment market movements in 2009.
Year ended 31 December 2009 Sales in Asia Pacific decreased by £787 million, or 22%, to £2,712 million (2008: £3,499 million). In Australia, sales decreased by 40%, impacted by the sale of the Australian business on 1 October 2009. Sales in Asia decreased 7% as a result of the uncertain economic environment, leading to investor caution across Singapore, Hong Kong, India and our other Asian markets, together with the impact of the strategic decision to scale back the sale of capital intensive products in several Asian markets. Net written premiums decreased to £455 million, a decrease of £56 million, or 11%, on 2008 (2008: £511 million). The decrease was mainly due to the impact of the uncertain economic environment in the region as highlighted above and the disposal of the Australian business. Increase in adjusted operating profit of £41 million to £77 million (2008: £36 million) was mainly due to the benefit from a one-off release of reserves of £68 million following an actuarial review of assumptions in Singapore, partly offset by the impact of the Australian disposal. Profit before tax of £146 million (2008: £68 million loss) reflects the favourable movements in the market across the Asia Pacific region.
6 Excludes the contribution from the Australian life business sold on 1 October 2009
Aviva Investors Aviva Investors, our fund management business, operates across all four regions providing fund management services to third-party investors and supporting our long-term insurance and savings and general insurance operations. The table below presents the adjusted operating profit, profit before tax attributable to shareholders’ profits under IFRS and funds under management of Aviva Investors for the years ended 31 December 2010, 2009 and 2008.
2010 £m
2009 £m
2008 £m
Adjusted operating profit 97 115 114 Profit before tax attributable to
shareholders’ profits 61
91
72 Funds under management 259,787 249,630 236,178
Year ended 31 December 2010 Aviva Investors’ adjusted operating profit in 2010 was £97 million, a decrease of £18 million from 2009. The reduction in operating profit was as a result of higher than expected redemptions and ongoing investment in the business which is starting to bear fruit as we see an increase in higher margin external assets. During 2010, we re-oriented our business towards more durable, higher margin funds, which resulted in an increased average fee rate on gross external sales, excluding liquidity funds. Profit before tax attributable to shareholders was £61 million, a decrease of £30 million, or 33%, on 2009 (2009: £91 million). Amortisation expenses were higher than 2009, the acquisition of River Road Asset Management resulting in an intangible asset, and restructuring costs were higher than 2009 reflecting the phasing of our business transformation programme. Aviva Investors’ funds under management were £260 billion, an increase of £10 billion, or 4%, on 2009. The increase is a result of capital appreciation and the inclusion of River Road within the 2010 figures, partially offset by the impact of sterling’s appreciation against the euro.
Year ended 31 December 2009 Aviva Investors’ adjusted operating profit in 2009 was £115 million, in line with 2008. Higher performance fees were earned in 2009, offset by lower average market levels through the year. Profit before tax attributable to shareholders’ profits was £91 million, an increase of £19 million, or 25%, on 2008 (2008: £72 million). Profit in 2009 benefited from lower integration and restructuring costs on the set-up of Aviva Investors. Aviva Investor’s funds under management were £250 billion, an increase of £14 billion, or 6%, on 2008. The increase is a result of investment performance and product sales together with capital appreciation in some fixed income markets, offset by the impact of sterling’s appreciation against the euro and US dollar.

Financial and operating performance continued
56
Aviva plc Annual Report and Accounts 2010
Corporate centre and group debt costs and other interest
2010 £m
2009 £m
2008 £m
Corporate centre (143) (108) (141) Group debt costs and other interest (656) (636) (379)
Year ended 31 December 2010 Corporate centre costs were £143 million, an increase of £35 million, or 32%, on £108 million in 2009. The increase principally reflects a higher project spend of £26 million in the year, and higher central costs of £7 million arising from enhanced capacity to meet greater financial and regulatory reporting requirements. Group debt and other interest costs were £656 million, an increase of £20 million or 3% on 2009. The increase principally relates to higher lending arrangement costs (2010: £246 million; 2009: £227 million) driven by changes in internal loan balances throughout the year. Group debt costs and other interest includes the net pension charge of £87 million (2009: £74 million). This represents the difference between the expected return on pension scheme assets and the unwind of the discount on pension scheme liabilities. Year ended 31 December 2009 Corporate centre costs were £108 million, a decrease of £33 million, or 23%, on £141 million in 2008. The decrease reflects lower central spend. Staff incentive costs were in line with 2008 and projects spending decreased by £23 million reflecting lower costs following the completion of the brand migration, financial controls and MCEV projects initiated in 2008. The Group debt costs and other interest increased to £636 million, an increase of £257 million on 2008 of £379 million. External interest costs increased to £335 million (2008: £286 million) reflecting higher interest on subordinated debt, due to hybrid debt being issued in 2008 and 2009, which was offset by lower commercial paper interest as proceeds from the issue were used to repay some commercial paper. Internal lending arrangement costs increased to £227 million (2008: £197 million) driven by changes to our internal loan balances. The net pension charge of £74 million (2008: £104 million income) represents the difference between the expected return on pension scheme assets and the interest charged on pension scheme liabilities. The increase is primarily due to lower rates of return on asset values offset by higher discount rates on liabilities.

57
Performance reviewCorporate responsibilityGovernanceShareholder informationFinancial statements IFRSFinancial statements MCEVOther information
Performance review
Aviva plc Annual Report and Accounts 2010
Analysis of investments
Analysis of investments We invest our policyholders’ funds and our own funds in order to generate a return for both policyholders and shareholders. The financial strength of our Group and both our current and future operating results and financial performance are, therefore, in part dependent on the quality and performance of our investment portfolios in our UK, continental European, North America and Asia Pacific operations. For additional information on our financial investments, please see ‘Financial statements IFRS – Note 25 – Financial investments’. For a quantitative analysis of funds under management by Aviva and third-party fund managers, see ‘Financial statements IFRS – Note 59 – Assets under management’.
Investment strategy Our investment portfolio supports a range of businesses operating in a number of geographical locations. Our aim is to match the investments held to support a line of business to the nature of the underlying liabilities, while at the same time considering local regulatory requirements, the level of risk inherent within different investments, and the desire to generate superior investment returns, where compatible with this stated strategy and risk appetite.
Long-term insurance and savings business As stated above, we aim to optimise investment returns while ensuring that sufficient assets are held to meet future liabilities and regulatory requirements. As different types of life insurance business vary in their cash flows and in the expectations placed upon them by policyholders, we need to hold different types of investment to meet these different cash flows and expectations. The UK with-profits business is comprised largely of long-term contracts with some guaranteed payments. We are therefore able to invest a significant proportion of the funds supporting this business in equities and real estate. This is because the long-term nature of these contracts allows us to take advantage of the long-term growth potential within these classes of assets, while the level of guaranteed payments is managed to mitigate the level of risk that we bear in relation to the volatility of these classes of assets. Annuities and non-participating contracts, on the other hand, have a high level of guaranteed future payments. We endeavour to match the investments held against these types of business to future cash flows. We therefore have a policy of generally holding fixed income securities and mortgage loans with appropriate maturity dates. With unit-linked business, the primary objective is to maximise investment returns, subject to following an investment policy consistent with the representations that we have made to our unit-linked product policyholders.
General insurance and health business The general insurance and health business is comprised of shorter-term liabilities than the long-term insurance business. Furthermore, all the risk attaching to the investments is borne by our shareholders. As a result, the investment portfolio held to cover general insurance liabilities contains a higher proportion of fixed-income securities than the portfolio held to cover life insurance liabilities.
Property partnerships As part of their investment strategy, the UK and certain European policyholder funds have invested in a number of property limited partnerships (PLPs), either directly or via property unit trusts (PUTs), through a mix of capital and loans. The nature of our involvement in property partnerships is set out in the second and third paragraphs of the Investment vehicles section of ‘Financial Statements IFRS – Accounting policies – (C) Consolidation principles’. Property partnerships are accounted for as subsidiaries, joint ventures or financial investments depending on our participation and the terms of each partnership agreement. For each property partnership accounted for as a subsidiary, joint venture or financial investment, we are exposed to falls in the value of the underlying properties which are reflected as unrealised gains/losses on investment properties, our share of joint venture results and unrealised gains/losses on financial investments, respectively. However, the majority of these are in policyholder funds (rather than shareholder funds) so such losses are offset by changes in the amounts due to policyholders or unitholders, or in the Unallocated Divisible Surplus (UDS).

58
Analysis of investments continued Aviva plc Annual Report and Accounts 2010
Analysis of investments We distinguish between policyholder, participating fund and shareholder investments, which are terms used to reflect the differing exposure to investment gains and losses. Policyholder assets are connected to our unit-linked business, where the policyholder bears the investment risk on the assets in the unit-linked funds. Our exposure to loss on policyholder assets is limited to the extent that income arising from asset management charges is based on the value of assets in the funds. Participating fund assets related to some of our insurance and investment contracts which contain a discretionary participating feature, which is a contractual right to receive additional benefits as a supplement to guaranteed benefits. Our exposure to investment losses on participating funds is generally limited to our participation in the fund. Shareholder assets are other assets held within our long-term businesses that are not backing unit-linked liabilities or participating funds. Investments held at 31 December 2010 and 31 December 2009 are analysed below:
2010
Policyholder assets
£m
Participating fund assets
£m
Shareholder assets
£m
Total assets
analysed £m
Less assets of
operations classified
as held for sale
£m
Balance sheet total
£m
Investment property 4,015 7,062 1,987 13,064 — 13,064 Loans 35 8,314 34,725 43,074 — 43,074 Financial investments Debt securities 16,150 85,414 65,918 167,482 — 167,482 Equity securities 31,441 12,308 5,327 49,076 — 49,076 Other investments 26,814 6,608 3,308 36,730 — 36,730
Total 78,455 119,706 111,265 309,426 — 309,426
Total % 25.4% 38.6% 36.0% 100.0% 100.0%
2009 74,620 114,873 102,718 292,211 (31) 292,180 2009 % 25.5% 39.3% 35.2% 100.0% — As the table indicates, approximately 36% of total investments can be directly attributed to shareholders. The apportionment of our shareholder assets is predominantly weighted towards debt securities and loans. In comparison, policyholder and participating funds contain a greater proportion of equities and other investments (e.g., unit trusts), reflecting the underlying investment mandates. Financial investment balances included in the remainder of this disclosure include financial investments of operations classified as held for sale. During 2010, the Group undertook a review of investment classifications, the allocation of assets between shareholder, participating and policyholder funds, and credit rating classifications, with the following effect on 2009 previously reported amounts:
In our Spanish business debt securities of £2,362 million and equity securities of £10 million previously recognised as participating fund assets have been reclassified as shareholder assets.
In our UK Life business investments and other assets backing indexed linked policies previously recognised as policyholder assets have been reclassified as shareholder assets. Reclassified assets total £1,890 million, split £1,214 million debt securities, £551 million loans, £97 million other investments and £28 million reinsurance assets.
In our business in France, equity and debt securities held indirectly through majority owned consolidated mutual funds previously presented as unit trusts and other investment vehicles within other investments, are now presented as equity and debt securities. The effect is to increase equity and debt securities by £2,085 million and £1,247 million and decrease unit trusts and other investment vehicles within other investments by £3,332 million.
In our businesses in the UK the credit ratings of certain non-rated private placements and other bonds totalling £1,917 million have previously been classified according to their internal credit ratings. These are now classified as non-rated. The net effect of the adjustments above is to increase shareholder investment at 31 December 2009 by £4,262 million and decrease policyholder and participating fund investments by £1,890 million and £2,372 million respectively.
Where relevant, 2009 comparative amounts in the table above and those that follow in this section have been adjusted accordingly. None of the adjustments above affects balances reported in the IFRS primary statements.

59
Performance reviewCorporate responsibilityGovernanceShareholder informationFinancial statements IFRSFinancial statements MCEVOther information
Performance review
Aviva plc Annual Report and Accounts 2010
Analysis of investments continued
Measurement basis We carry investments on our statement of financial position at either fair value or amortised cost. As shown in the table below, at 31 December 2010, 93% of the group’s total investments were carried at fair value on the statement of financial position.
2010 2009
Fair value £m
Amortised cost £m
Total
£m
Fair value
£m
Amortised cost £m
Total
£m
Investment property 13,064 — 13,064 12,430 — 12,430 Loans 21,028 22,046 43,074 20,890 20,189 41,079 Financial investments Debt securities 167,482 — 167,482 161,757 — 161,757 Equity securities 49,076 — 49,076 45,427 — 45,427 Other investments 36,730 — 36,730 31,518 — 31,518 Total 287,380 22,046 309,426 272,022 20,189 292,211
Total % 92.9% 7.1% 100.0% 93.1% 6.9% 100.0%
For more information about financial investments analysed according to their accounting classification and valuation approach, as well as the cost, unrealised gains and losses, impairments, fair value and other information concerning financial investments, see the ‘Financial Statements IFRS – Note 25 – Financial investments’.
Debt securities We grade debt securities according to current external credit ratings issued at the balance sheet date. The credit rating used for each individual security is the second highest of the available ratings from Standard & Poor’s, Moody’s and Fitch. If a credit rating is available from only one of these three rating agencies then this rating is used. If an individual security has not been given a credit rating by any of these three rating agencies, the security is classified as ‘non-rated’. For the tables below we have used the standard Standard & Poor’s rating classifications. Investment grade debt securities are classified within the range of AAA (extremely strong) to BBB (good) ratings, with AAA being the highest possible rating. Debt securities which fall outside this range are classified as speculative grade. Where we use a rating provided by Moody’s or Fitch, we have expressed it as the Standard & Poor’s equivalent rating. For example, we consider Standard & Poor’s rating of AA (very strong) to be equivalent to Moody’s rating of AA (excellent) and Fitch’s rating of AA (very strong). Despite the market downgrade activity during 2009 and 2010, debt securities with a credit rating of A or above at 31 December 2010 still represented 77% of total holdings (2009: 80%). Approximately 41% of total debt security holdings are in government bonds and 33% of total debt security holdings were in corporate bonds with a credit rating of A or above, as of 31 December 2010. ‘Wrapped credit’ is credit exposure that has been insured with monoline insurers to achieve a better credit rating. The monoline insurers suffered further downgrades during 2009 and 2010 and this is reflected in the analysis that follows. The exposure is diversified across several monolines and the underlying bonds are diversified across many different counterparties. In general, we are a long-term holder of this debt, although we continue to review our holdings with reference to the underlying quality and prospects. The majority of the residential mortgage-backed securities (RMBS) are US investments and over 85% of this exposure is backed by the US government-sponsored entities (GSEs) Fannie Mae and Freddie Mac. Under the conservatorship arrangements with the US government implemented in September 2008, these securities have an implicit guarantee, although they are not expressly backed by the full faith and credit of the US government. The majority of the remaining US RMBS are backed by fixed-rate loans that originated in 2005 or before. At 31 December 2010, we had no exposure to sub-prime debt securities (2009: £2 million), and our exposure to collaterised debt obligations (CDO) and collaterised loan obligations (CLO) was limited to £332 million (2009: £241 million). Investments in structured assets (excluding agency RMBS that are backed by GSEs) were £6.0 billion, representing less than 4% of total debt securities. During 2010, the proportion of our shareholder debt securities that are investment grade declined slightly to 88% (2009: 90%). This movement was primarily due to the increase in private placements to back UK annuity liabilities. The remaining 12.0% of shareholder debt securities that do not have an external rating of BBB or higher can be split as follows:
3.4% are debt securities that are rated as below investment grade 3.0% are US private placements which are not rated by the major ratings agencies, but are rated an average equivalent of A-
by the Securities Valuation Office of the National Association of Insurance Commissioners (NAIC), a US national regulatory agency
5.6% are not rated by the major rating agencies or the NAIC. Of the securities not rated by an external agency or NAIC most are allocated an internal rating using a methodology largely consistent with that adopted by an external ratings agency, and are considered to be of investment grade credit quality; these include £1.8 billion (2.7% of total shareholder debt securities) of private placements and other corporate bonds held in our UK Life business which have been internally rated as investment grade.

60
Analysis of investments continued Aviva plc Annual Report and Accounts 2010
Debt securities analysed by credit rating and sector Total debt securities analysed by credit rating and product type are set out in the table below. Government and corporate debt securities are further analysed by type of issuer.
Debt securities – Total
Ratings
2010 AAA
£m AA £m
A £m
BBB £m
Less than BBB £m
Non-rated £m
Total £m
Government UK government 17,447 — — — — — 17,447 UK local authorities 1 10 — — — 5 16 Non-UK government 27,695 15,747 4,428 1,433 632 585 50,520
45,143 15,757 4,428 1,433 632 590 67,983
Corporate Public Utilities 76 639 4,797 2,455 80 320 8,367 Convertibles and bonds with warrants 5 46 101 329 42 60 583 Other corporate bonds 10,373 12,340 26,687 20,657 2,897 6,163 79,117
10,454 13,025 31,585 23,441 3,019 6,543 88,067
Certificates of deposits — 572 925 1,170 — 26 2,693
Structured RMBS non-agency sub-prime — — — — — — — RMBS non-agency ALT A 19 9 11 8 131 — 178 RMBS non-agency prime 758 21 44 67 30 — 920 RMBS agency 1,762 — — — — — 1,762
2,539 30 55 75 161 — 2,860
CMBS1 1,434 281 369 119 181 20 2,404 ABS2 1,113 256 365 129 63 181 2,107 CDO (including CLO) 97 57 22 17 86 53 332 ABCP3 — 15 — — — — 15 ABFRN4 — — — — — — —
2,644 609 756 265 330 254 4,858
Wrapped credit — 288 92 157 55 49 641 Other 27 4 116 — 1 232 380
Total 60,807 30,285 37,957 26,541 4,198 7,694 167,482
Total % 36.3% 18.1% 22.7% 15.8% 2.5% 4.6% 100.0%
2009 62,489 28,045 38,747 20,777 3,936 7,763 161,757 2009 % 38.6% 17.3% 24.0% 12.8% 2.5% 4.8% 100.0% 1 CMBS – Commercial Mortgage Backed Security 2 ABS – Asset Backed Security 3 ABCP – Asset backed commercial paper 4 ABFRN – Asset backed floating rate notes

61
Performance reviewCorporate responsibilityGovernanceShareholder informationFinancial statements IFRSFinancial statements MCEVOther information
Performance review
Aviva plc Annual Report and Accounts 2010
Analysis of investments continued
Debt securities, for which policyholders carry the exposure to investment losses, analysed by credit rating and product type are set out in the table below. Government and corporate debt securities are further analysed by type of issuer.
Debt securities – policyholder assets
Ratings
2010 AAA
£m AA £m
A £m
BBB £m
Less than BBB £m
Non-rated £m
Total £m
Government UK government 3,497 — — — — — 3,497 UK local authorities 1 — — — — — 1 Non-UK government 1,951 534 777 162 80 11 3,515
5,449 534 777 162 80 11 7,013
Corporate Public Utilities 1 37 170 67 3 2 280 Convertibles and bonds with warrants — — — 2 — 3 5 Other corporate bonds 363 981 2,603 3,138 283 226 7,594
364 1,018 2,773 3,207 286 231 7,879
Certificates of deposits — 362 603 144 -— 2 1,111
Structured RMBS non-agency sub-prime — — — — — — — RMBS non-agency ALT A — — — — — — — RMBS non-agency prime 24 2 3 — — — 29 RMBS agency — — — — — — —
24 2 3 — — — 29
CMBS 7 2 — — — — 9 ABS 18 6 47 3 — 9 83 CDO (including CLO) — — — — — — — ABCP — — — — — — — ABFRN — — — — — — —
25 8 47 3 — 9 92
Wrapped credit — 16 1 2 4 2 25 Other — — 1 — — — 1
Total 5,862 1,940 4,205 3,518 370 255 16,150
Total % 36.3% 12.0% 26.0% 21.8% 2.3% 1.6% 100.0%
2009 7,864 2,161 4,277 944 48 1,089 16,383 2009 % 48.0% 13.2% 26.1% 5.8% 0.3% 6.6% 100.0%

62
Analysis of investments continued Aviva plc Annual Report and Accounts 2010
Debt securities, for which participating funds carry the exposure to investment losses, analysed by credit rating and product type are set out in the table below. Government and corporate debt securities are further analysed by type of issuer.
Debt securities – participating fund assets
Ratings
2010 AAA
£m AA £m
A £m
BBB £m
Less than BBB £m
Non-rated £m
Total £m
Government UK government 11,842 — — — — — 11,842 UK local authorities — — — — — — — Non-UK government 15,357 11,586 2,011 675 350 — 29,979
27,199 11,586 2,011 675 350 — 41,821
Corporate Public Utilities 4 280 1,868 767 1 41 2,961 Convertibles and bonds with warrants — 46 11 266 20 19 362 Other corporate bonds 7,128 6,564 13,237 8,339 1,163 1,697 38,128
7,132 6,890 15,116 9,372 1,184 1,757 41,451
Certificates of deposits — 132 208 816 — — 1,156
Structured RMBS non-agency sub-prime — — — — — — — RMBS non-agency ALT A — — — 3 2 — 5 RMBS non-agency prime 163 — 5 — — — 168 RMBS agency 134 — — — — — 134
297 — 5 3 2 — 307
CMBS 128 50 6 16 9 1 210 ABS 88 32 113 53 37 1 324 CDO (including CLO) — — — — — — — ABCP — — — — — — — ABFRN — — — — — — —
216 82 119 69 46 2 534
Wrapped credit — 74 17 35 4 6 136 Other — — 9 — — — 9
Total 34,844 18,764 17,485 10,970 1,586 1,765 85,414
Total % 40.8% 22.0% 20.5% 12.8% 1.9% 2.0% 100.0%
2009 35,262 17,486 18,921 9,376 2,125 2,178 85,348 2009 % 41.3% 20.5% 22.2% 11.0% 2.5% 2.5% 100.0%

63
Performance reviewCorporate responsibilityGovernanceShareholder informationFinancial statements IFRSFinancial statements MCEVOther information
Performance review
Aviva plc Annual Report and Accounts 2010
Analysis of investments continued
Debt securities, for which shareholders carry the exposure to investment losses, analysed by credit rating and product type are set out in the table below. Government and corporate debt securities are further analysed by type of issuer.
Debt securities – shareholder assets
Ratings
2010 AAA
£m AA £m
A £m
BBB £m
Less than BBB £m
Non-rated £m
Total £m
Government UK government 2,108 — — — — — 2,108 UK local authorities — 10 — — — 5 15 Non-UK government 10,387 3,627 1,640 596 202 574 17,026 12,495 3,637 1,640 596 202 579 19,149
Corporate Public Utilities 71 322 2,759 1,621 76 277 5,126 Convertibles and bonds with warrants 5 — 90 61 22 38 216 Other corporate bonds 2,882 4,795 10,847 9,180 1,451 4,240 33,395 2,958 5,117 13,696 10,862 1,549 4,555 38,737
Certificates of deposits — 78 114 210 — 24 426
Structured RMBS non-agency sub-prime — — — — — — — RMBS non-agency ALT A 19 9 11 5 129 — 173 RMBS non-agency prime 571 19 36 67 30 — 723 RMBS agency 1,628 — — — — — 1,628 2,218 28 47 72 159 — 2,524 CMBS 1,299 229 363 103 172 19 2,185 ABS 1,007 218 205 73 26 171 1,700 CDO (including CLO) 97 57 22 17 86 53 332 ABCP — 15 — — — — 15 ABFRN — — — — — — —
2,403 519 590 193 284 243 4,232
Wrapped credit — 198 74 120 47 41 480 Other 27 4 106 — 1 232 370 Total 20,101 9,581 16,267 12,053 2,242 5,674 65,918
Total % 30.5% 14.5% 24.7% 18.3% 3.4% 8.6% 100.0%
2009 19,363 8,399 15,549 10,456 1,762 4,497 60,026 2009 % 32.3% 14.0% 25.9% 17.4% 2.9% 7.5% 100.0% In respect of the wrapped credit investments, the table below shows the credit rating of the securities as they are officially rated, and an estimate of their rating without the guarantee. As rating agencies do not provide credit ratings for individual wrapped credit securities without consideration of the insurance guarantee, the credit ratings disclosed in the table below are based on internal best estimates.
Total assets
Rating with insurance guarantee Rating without
insurance guarantee
Fair value £m
% of total Fair value
£m
% of total
Wrapped Credit AAA — — — — AA 288 44.8% 37 5.7% A 92 14.3% 100 15.6% BBB 157 24.5% 215 33.6% Less than BBB 55 8.5% 59 9.2% Non-rated 49 7.9% 47 7.3% Not available without insurance guarantee — — 183 28.6%
641 100.0% 641 100.0%
RMBS Agency
AAA 1,762 100.0% 1,762 100.0%

64
Property Aviva plc Annual Report and Accounts 2010
Equity securities The table below analyses our investments in equity securities by sector.
2010 Policyholder
£m Participating
£m Shareholder
£m Total
£m
Public Utilities 2,690 1,395 23 4,108 Banks, trusts and insurance companies 4,331 1,854 1,436 7,621 Industrial miscellaneous and all other 24,402 9,019 3,279 36,700 Non-redeemable preferred shares 19 40 588 647
Total 31,442 12,308 5,326 49,076
Total % 64.1% 25.0% 10.9% 100.0%
2009 28,638 11,678 5,111 45,427 2009 % 63.0% 25.7% 11.3% 100.0%
At 31 December 2010, shareholder investment in equity securities amounted to £5.3 billion, of which 79% related to our business in the Netherlands, 7% our Italian business and 14% other businesses. The Italian equity holdings are held both directly by our Italian subsidiaries and by Group holding companies. Of our £7.6 billion exposure to equity investments in banks, trusts and insurance companies, £1.4 billion relates to shareholder investments, which includes £803 million equities held by our business in the Netherlands and a £408 million strategic holding in UniCredit and other Italian financial institutions (£244 million net of minority interest). The remaining shareholder exposure to equity securities, other than banks, trusts and insurance companies, arises principally in our Netherlands business, amounting to approximately 88% of the total exposure of £3.9 billion.
Other investments The table below analyses other investments by type.
2010 Policyholder
£m Participating
£m Shareholder
£m Total
£m
Unit trusts and other investment vehicles 26,040 5,743 737 32,520 Derivative financial instruments 187 131 1,956 2,274 Deposits and credit institutions 28 38 492 558 Minority holdings in property management undertakings 11 593 60 664 Other 548 103 63 714
Total 26,814 6,608 3,308 36,730
Total % 73.0% 18.0% 9.0% 100.0%
2009 24,865 3,968 2,685 31,518 2009 % 78.9% 12.6% 8.5% 100.0%
Property Our global headquarters are located in St. Helen’s, 1 Undershaft, London, England. We also have the following regional headquarters:
UK – UK Life: York, England; UK – UK General Insurance: Norwich, England; Europe – Dublin, Ireland; North America – Chicago, Illinois, USA; Asia Pacific – Singapore; and Aviva Investors – London, England.
In addition to the above, our regions have major offices in the following locations:
North America: Des Moines, Iowa, USA and Scarborough, Ontario, Canada Europe: Paris, France; Amsterdam, the Netherlands; Dublin, Ireland; Madrid, Spain; Warsaw, Poland; Brussels, Belgium; and
Milan, Italy We own or lease space in 26 countries around the world. As of 31 December 2010, we owned and occupied land and buildings for our own use with a total book value of £440 million (2009: £416 million). We believe that these facilities are adequate for our present needs in all material respects. We also hold other properties, both directly and indirectly, for investment purposes, valued at £11,241 million at 31 December 2010 (2009: £10,757 million).

65
Performance reviewCorporate responsibilityGovernanceShareholder informationFinancial statements IFRSFinancial statements MCEVOther information
Performance review
Aviva plc Annual Report and Accounts 2010
Contractual Obligations
Contractual obligations Contractual obligations with specified payment dates at 31 December 2010 included the following:
Less than one
year £m
Between one and
three years
£m
Between three
and five years
£m
After five
years £m
Total £m
Insurance and investment contracts Long-term business — Insurance contracts – non-linked1 11,871 22,734 23,199 151,843 209,647 — Investment contracts – non-linked2 63,197 — — — 63,197 — Linked business2 82,769 — — — 82,769 General insurance3 7,231 4,410 2,108 4,288 18,037
165,068 27,144 25,307 156,131 373,650 Other contractual obligations4 Borrowings 2,947 1,567 2,272 27,773 34,559 Operating lease obligations 136 233 190 737 1,296 Capital commitments 118 46 23 36 223 Payables and other financial liabilities5 19,194 772 115 914 20,995 Net asset value attributable to unitholders 9,032 — — — 9,032
Total 196,495 29,762 27,907 185,591 439,755
Reconciliation to the statement of financial position £m
Total contractual obligations above 439,755 Effect of discounting contractual cash flows for insurance contracts (78,163) Contractual undiscounted interest payments6 (19,653) Difference between carrying value of borrowings and undiscounted cash flows of principle 43 Contractual cash flows under operating leases and capital commitments (1,519) Difference between derivative liabilities contractual cash flows and carrying value (703) Liabilities of operations classified as held for sale — Non-contractual / short-term obligations — Unallocated divisible surplus7 3,428 — Provisions8 2,943 — Current and deferred tax liabilities 2,072 — Other liabilities 4,179
Total liabilities per statement of financial position 352,382 1. Amounts shown in respect of long-term insurance contracts represent estimated undiscounted cash flows for the Group’s life assurance contracts. In determining the projected payments, account has been taken of the contract features, in
particular that the amount and timing of the contractual payments reflect either surrender, death or contract maturity. In addition, the undiscounted amounts shown include the expected payments based on assumed future investment returns on assets backing insurance and investment contract liabilities. The projected cash flows exclude the unallocated surplus of with-profits funds (see below).
2. All linked contracts and almost all non-linked investment contracts may be surrendered or transferred on demand. For such contracts the earliest contractual maturity is therefore at the current statement of financial position date, for a surrender amount approximately equal to the current statement of financial position liability. Although we expect surrenders, transfers and maturities to occur over many years, the total liability for non-linked investment contracts is shown in the Less than 1 year column above.
3. Amounts shown in respect of general insurance contracts are based on undiscounted estimates of future claim payments, including for those classes of business for which discounted provisions are held, see ‘Financial Statements IFRS – Note 39 – Insurance liabilities’. The timing of cash flows reflects a best estimate of when claims will be settled.
4. The Group has no material finance leases for property and equipment. 5. Includes obligations under repurchase agreements amounting to £853 million and obligations for repayment of collateral received under stock lending arrangements and derivative transactions amounting to £4,825 million. 6. When subordinated debt is undated or loan notes perpetual, the interest payments have not been included beyond 15 years. Annual interest payments for these borrowings are £84 million. Contractual undiscounted interest payments are
calculated using fixed interest rates or prevailing market floating rates as applicable. 7. The unallocated surplus represents the excess of assets over liabilities, including policyholder ‘asset share’ liabilities, which reflect the amount payable under the realistic Peak 2 reporting regime of the FSA. Although accounted for as a liability, as
permitted by IFRS 4, there is currently no expected payment date for the unallocated surplus. 8. Provisions include pension obligations, which have been excluded from the contractual obligations table above, due to the uncertainty of the amount and timing of future cash flows. The Group operates both funded defined benefit and funded
defined contribution pension schemes around the world, full details of which are provided in ‘Financial Statements IFRS – Note 48 – Pension obligations’. We have a contractual obligation to fund these schemes. However, the amount and timing of the Group’s cash contributions to these schemes is uncertain and will be affected by factors such as future investment returns and demographic changes. Our cash funding of defined contribution schemes is based on percentages of salary. Our cash contribution to defined benefit schemes is agreed in advance with scheme trustees. In 2010 a long-term funding agreement was agreed with the scheme trustees which is expected to eliminate the funding deficit over time. However, these contributions are revisited annually in light of changes in expectations of investment returns and other assumptions. The discounted scheme liabilities have an average duration of 18 years in the UK schemes and between 12 and 19 years in the non-UK schemes.

66
Risk management Aviva plc Annual Report and Accounts 2010
Risk management As a global insurance group, risk management is at the heart of what we do and is the source of value creation as well as a vital form of control. It is an integral part of maintaining financial stability for our customers, shareholders and other stakeholders. The Group’s risk strategy is to invest its available capital to optimise the balance between return and risk whilst maintaining an appropriate level of economic (i.e. risk-based) capital and regulatory capital. Consequently, our risk management goals are to:
Embed rigorous risk management throughout the business, based on setting clear risk appetites and staying within these;
Ensure that capital is allocated where it will make the highest returns on a risk-weighted basis; and
Meet the expectations of our customers, investors and regulators that we will maintain capital surpluses to ensure we can meet our liabilities even if a number of extreme risks materialise.
In 2010, in support of these goals, the Group continued its work to enhance its risk management capabilities by developing a comprehensive Risk Plan. The Risk Plan sets out a phased programme for designing, implementing and embedding enhancements to the existing risk management framework (RMF) across the Group. Key components of the RMF and some of the enhancements made in 2010 are described below.
Risk appetite Risk appetite is an expression of the level of risk we are willing and able to accept in pursuit of our strategic objectives and thus provides the context for our risk and capital management. The following appetite statements, which were reviewed and approved by the Board in June 2010, demonstrate a key focus on balance sheet strength and protection of the franchise value. They supplement existing risk appetite statements relating to the regulatory solvency position.
Economic capital: the Aviva Board requires that the Group has sufficient capital to remain able to meet its liabilities in extreme adverse scenarios, on an ongoing basis, calibrated consistently with the Group’s strategic target of maintaining a credit rating in the AA range.
Liquidity: the Aviva Board requires that the Group maintains significant liquid resources to meet both planned cash outflows and cover unexpected cash requirements under stress conditions. In addition the Group maintains substantial unutilised committed credit facilities to cover extreme adverse scenarios.
Franchise value: Aviva recognises that its long-term sustainability depends upon the protection of our franchise and our relationship with customers. As such, Aviva will not accept risks that materially impair the reputation of the Group and requires that customers are always treated with integrity.
The Group’s position against the quantitative risk appetite statements is monitored and reported to the Board on a monthly basis. The 2010 business planning process included explicit consideration of the reviewed Group level risk appetite statements and economic capital risk appetites were cascaded to individual business units at the end of 2010. More granular risk appetites or tolerances are set out in our risk management policies, which are implemented across the Group.
Risk and capital management Risk and capital management are strongly interlinked. We set our business strategy and plans, guided by our overarching strategy, risk appetite and goal of improving risk-weighted returns. We actively manage our risk profile through a wide range of techniques including product design, pricing, underwriting, asset allocation, investment management, duration matching, hedging, reinsurance, acquisitions and disposals, management of the capital structure and of committed credit facilities. The development and evaluation of our business plans and our various capital and risk management actions are supported by risk modelling, which has been a key area of further enhancement throughout 2010.
Risk modelling For the purposes of risk identification and measurement, risks are usually grouped by risk type: market, credit, liquidity, general insurance, life insurance and operational risk. Risks falling within these types may affect a number of key metrics including those relating to balance sheet strength, liquidity and profit. They may also affect the performance of the products that we deliver to our customers and the service to our customers and distributors, which can be categorised as risks to our brand and reputation. To evaluate the impact of these risks, we carry out a range of stress (where one risk factor, such as equity returns, is assumed to vary) and scenario (where combinations of risk factors are assumed to vary) tests to evaluate their impact on the business and the management actions available to respond to the conditions envisaged. These stress and scenario tests are sometimes prescribed by supervisory authorities, but are supplemented by scenarios drawn from historical periods of adverse conditions, from risk models and from management discussions. In addition, ‘reverse stress tests’ are now generated where the intention is to identify the extreme scenarios which would test the business model to the point of failure. These are used to facilitate discussions on whether business plans should be modified. More details on our capital modelling, including our internal risk-based, economic capital model, can be found in the capital management section on page 70. Risk modelling is an area of focus for continued enhancement and development.
Risk management responsibilities, policies and procedures Aviva operates a ‘three lines of defence’ model. Primary responsibility for the application of the RMF lies with business management (the first line of defence). Support for and challenge on the risk management activities (including the identification, measurement, monitoring, management and reporting of risk) are performed by a specialist, independent risk function (the second line of defence) acting as the ‘critical friend’ to the first line of defence. The design of the RMF is also primarily the responsibility of the second line of defence. Independent and objective assurance on the robustness of the RMF and the appropriateness and effectiveness of internal control is provided by Group internal audit (the third line of defence). To promote a consistent and rigorous approach to risk management across all the businesses and locations in which we operate, we have a set of formal risk management policies. These risk policies set out risk management and control standards for the Group’s worldwide operations. As our business responds to changing market conditions and customer needs, we regularly monitor the appropriateness of our risk policies to ensure that they remain up-to-date.
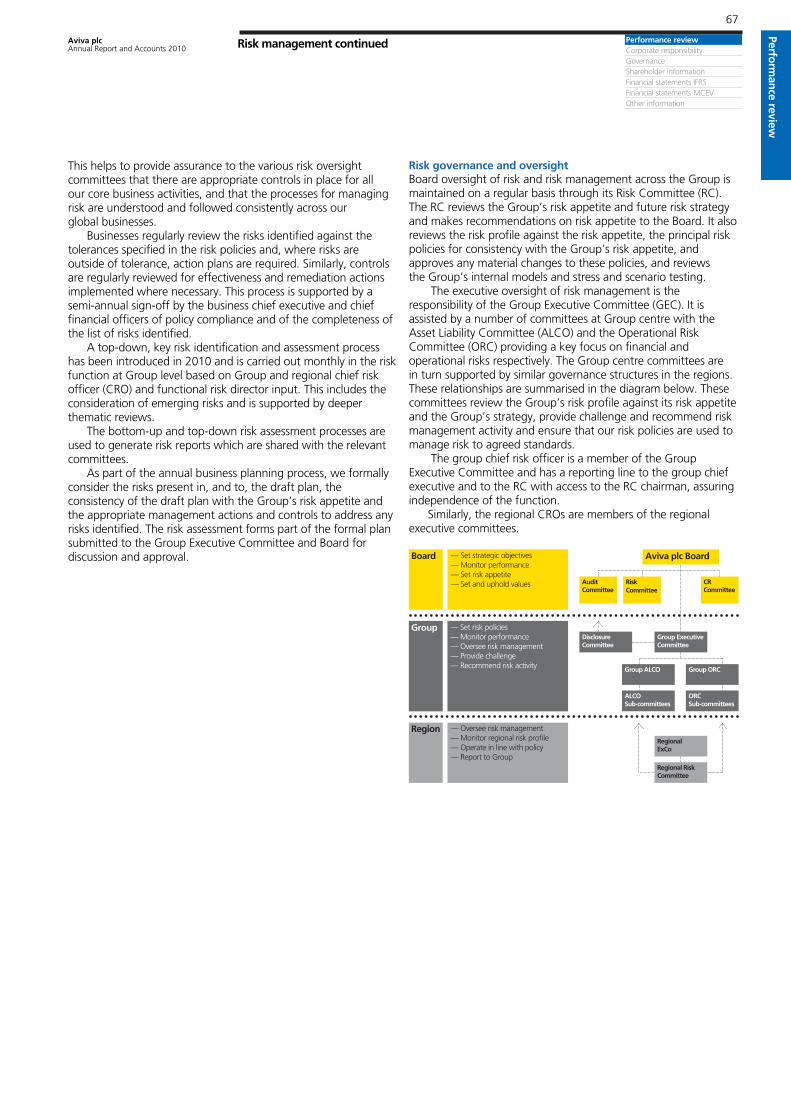
67
Performance reviewCorporate responsibilityGovernanceShareholder informationFinancial statements IFRSFinancial statements MCEVOther information
Performance review
Aviva plc Annual Report and Accounts 2010
Risk management continued
This helps to provide assurance to the various risk oversight committees that there are appropriate controls in place for all our core business activities, and that the processes for managing risk are understood and followed consistently across our global businesses. Businesses regularly review the risks identified against the tolerances specified in the risk policies and, where risks are outside of tolerance, action plans are required. Similarly, controls are regularly reviewed for effectiveness and remediation actions implemented where necessary. This process is supported by a semi-annual sign-off by the business chief executive and chief financial officers of policy compliance and of the completeness of the list of risks identified. A top-down, key risk identification and assessment process has been introduced in 2010 and is carried out monthly in the risk function at Group level based on Group and regional chief risk officer (CRO) and functional risk director input. This includes the consideration of emerging risks and is supported by deeper thematic reviews. The bottom-up and top-down risk assessment processes are used to generate risk reports which are shared with the relevant committees. As part of the annual business planning process, we formally consider the risks present in, and to, the draft plan, the consistency of the draft plan with the Group’s risk appetite and the appropriate management actions and controls to address any risks identified. The risk assessment forms part of the formal plan submitted to the Group Executive Committee and Board for discussion and approval.
Risk governance and oversight Board oversight of risk and risk management across the Group is maintained on a regular basis through its Risk Committee (RC). The RC reviews the Group’s risk appetite and future risk strategy and makes recommendations on risk appetite to the Board. It also reviews the risk profile against the risk appetite, the principal risk policies for consistency with the Group’s risk appetite, and approves any material changes to these policies, and reviews the Group’s internal models and stress and scenario testing. The executive oversight of risk management is the responsibility of the Group Executive Committee (GEC). It is assisted by a number of committees at Group centre with the Asset Liability Committee (ALCO) and the Operational Risk Committee (ORC) providing a key focus on financial and operational risks respectively. The Group centre committees are in turn supported by similar governance structures in the regions. These relationships are summarised in the diagram below. These committees review the Group’s risk profile against its risk appetite and the Group’s strategy, provide challenge and recommend risk management activity and ensure that our risk policies are used to manage risk to agreed standards. The group chief risk officer is a member of the Group Executive Committee and has a reporting line to the group chief executive and to the RC with access to the RC chairman, assuring independence of the function. Similarly, the regional CROs are members of the regional executive committees.
— Set strategic objectives— Monitor performance— Set risk appetite— Set and uphold values
Board
Group
Region
CR Committee
ORCSub-committees
Group ORC
ALCO Sub-committees
Group ALCO
Group ExecutiveCommittee
AuditCommittee
Risk Committee
RegionalExCo
Regional Risk Committee
Aviva plc Board
DisclosureCommittee
— Oversee risk management— Monitor regional risk profile— Operate in line with policy— Report to Group
— Set risk policies— Monitor performance— Oversee risk management— Provide challenge— Recommend risk activity

68
Risk factors This table sets out the definitions of each key risk type; the key risk drivers for each risk category; sensitivities to economic and operating experience on the Group’s performance and a summary of the related risk mitigation processes within the risk management framework.
Aviva plc Annual Report and Accounts 2010
Risk type Key drivers
Market Risk of adverse financial impact due to changes in fair values or future cash flows of financial instruments from fluctuations in interest rates, equity prices and foreign currency exchange rates
Fluctuation in the value of, or income from, our investments including loans, debt, equity securities, mortgages and holdings of investment properties
Impact of market conditions on the sales of investments, pensions and other savings products and our fund management business
Products sold by the Group that carry investment return and surrender value guarantees Movements in the value of assets and liabilities, cash flows or dividends received from
subsidiaries as a result of movements in currency exchange rates Fluctuation in the value of assets held by the staff pension schemes Movements in yield curves or market implied volatilities that affect the values placed on
assets and liabilities are not perfectly matched
Credit Risk of financial loss as a result of the default or failure of third parties to meet their payment obligations or as a result of changes in fair value resulting from movements in the credit standing of the third party or in credit spreads
Exposures to debt investments, structured asset investments, and counterparties in our derivatives, mortgage loans and reinsurance placements
Default and spread risks are considered, as both impact the value and risks of assets Concentrations of exposures to individual credits/counterparties or sectors/geographies
Liquidity Risk of not maintaining sufficient financial resources to meet our business obligations as they fall due
Insufficient capital generated from the receipt of premiums, fees and investment income, along with planned asset sales and maturities to pay claims, expenses, interest costs and dividends
Instances where additional cash requirements arise in excess of that available within operating businesses
Mismatches in the timing of cash flows relating to assets, liabilities and off balance sheet instruments
General insurance The inherent uncertainty as to the occurrence, amount and timing of insurance liabilities. This includes fluctuations in the timing, frequency and severity of claims and settlements.
Claims incurred from catastrophic events, such as flooding and windstorm Financial impact of worsening claims ratios and inadequate reserves Claims inflation
Life insurance The inherent uncertainty as to the occurrence, amount and timing of insurance liabilities. This includes exposure to mortality and morbidity insurance and exposure to worse than anticipated operating experience on factors such as persistency levels and management and administrative expenses
Adverse longevity experience (the risk that people will live longer than we have assumed) Adverse mortality experience (the death of a policy holder) and morbidity (ill health) Expense experience compared with assumptions at the start of the insurance policy Poorly designed or inadequately priced products Persistency risk arising from customers lapsing their policies earlier, or in some
circumstances later, than has been assumed Adverse take-up rates of options embedded in insurance contracts
Operational The risks of direct or indirect loss resulting from inadequate or failed internal processes, or from people and systems, or from external events, including changes in the legislative or regulatory environment.
Failure of key processes and controls resulting in misselling, fraud, or losses requiring customer compensation
Failure of information technology and communications systems that affects the delivery of services to our customers
Failure or underperformance of providers of outsourced services including administration and distribution
Adverse changes in the external environment including the competitive landscape, customer behaviour, distributor regulatory changes, merger and acquisition opportunities and emerging trends
Adverse changes in regulatory or legislative environment
Brand and reputation Our dependence on the strength of our brands, the brands of our partners, and our reputation with customers, distributors and regulators in the sale of our products and services
Media speculation, negative publicity, adverse market and customer perception Products or services recommended by us not performing as expected
For further details refer to the ‘Financial statements IFRS – Note 57 – Risk management’.

69
Performance reviewCorporate responsibilityGovernanceShareholder informationFinancial statements IFRSFinancial statements MCEVOther information
Performance review
Aviva plc Annual Report and Accounts 2010
Risk management continued
Sensitivities1 Risk mitigation
A 1% increase in interest rates would decrease total shareholder funds by £1.4 billion net of tax on an IFRS basis and by £0.8 billion net of tax on an MCEV basis
A 10% decrease in equity prices would decrease total shareholders’ funds by £0.6 billion net of tax on an IFRS basis and by £1.0 billion net of tax on an MCEV basis. These sensitivities are shown net of equity hedges.
We expect that a 40% fall in equity prices (at 31 December 2010) would reduce IGD by £0.6 billion.
Regular reviews by the Asset Liability Committee relative to risk appetite Active management of exposure through changes in asset mix and hedging
against unfavourable market movements Regular monitoring of impact from changes in market risks (interest rates,
equity prices, property values) through value at risk analysis, stress tests and scenario analysis
Use of currency borrowings and derivatives to manage currency exposures within centrally set limits
Investment strategy and long-term objectives agreed with scheme trustees Duration matching
A 50 bps increase in credit spreads would have no net impact on IFRS shareholder funds but would decrease embedded value by £1.4 billion on a net of tax MCEV basis.
Adherence to credit policy and limits frameworks by all businesses Regular monitoring and reviews by the Credit Approvals Committee of
exposures and management against limits Maintaining a diversified portfolio and reviewing concentrations of exposure
by types, sector, geography and credit ratings Utilisation of risk reduction techniques such as hedging and collateral
posting requirements
Sensitivity information is not provided for this risk type Asset liability matching methodology develops optimal asset portfolio maturity structures in our businesses to ensure cash flows are sufficient to meet liabilities
Regular monitoring through liquidity stress and scenario testing and against liquidity risk appetite
Sale of assets from investment portfolios, issuing commercial paper Maintain committed borrowing facilities (£2.1 billion) from highly rated
banks Regular reviews by the Assets Committee and the Asset Liability Committee
Our total potential loss from our most concentrated catastrophe exposure zone (Northern European) is approximately £300 million for a one in ten year annual loss scenario, compared to approximately £550 million for a one in hundred year annual loss scenario
A 5% increase in gross loss ratios for our general insurance and health business reduces shareholders funds by £310 million, net of reinsurance on a pre-tax basis
Regular reviews by the General Insurance Committee Use of reinsurance to help reduce the financial impact of a catastrophe and
manage earnings volatility Extensive use of data, financial models and analysis to improve pricing and
risk selection Underwriting and claims management disciplines Digital mapping to better manage property flood risk
Mortality/ morbidity – a 5% worsening in assurance mortality/morbidity experience would reduce shareholder funds by £55 million before tax on an IFRS basis and decrease embedded value by £220 million net of tax on an MCEV basis.
Longevity – should our assumptions in respect of annuitant mortality worsen by 5% then shareholder funds would reduce by £355 million before tax on an IFRS basis and decrease embedded value by £420 million net of tax on an MCEV basis.
Regular reviews by the Life Insurance Committee Monitoring longevity statistics compared with emerging industry trends and
use of reinsurance solutions Use of reinsurance solutions to mitigate mortality and morbidity risks Guidelines to support businesses through complete cycle of product design,
development and pricing Regular monitoring of expense assumptions and the use of outsource
providers governed by strict outsourcing policy Guidelines on persistency management and regular monitoring and
investigation of persistency levels
Sensitivity information is not provided for this risk type
Regular reviews by Operational Risk Committee Capture and investigation of operational risk loss events data Strong policy and control framework compliance which is subject to regular
review and certification Strategic review and planning process combined with performance
management process Challenging developments that could be damaging to our business and the
industry as a whole
Sensitivity information is not provided for this risk type Regular reviews by the Corporate Reputation Committee Building our brand prominence and regularly monitoring brand metrics Delivering a truly exceptional experience to our customers and treating
customers fairly in line with the FSA principles Monitoring metrics including customer advocacy, retention and complaints
1 IFRS sensitivities are shown gross of minority interest.

70
Capital management Aviva plc Annual Report and Accounts 2010
Capital management Capital management objectives The primary objective of capital management is to optimise the balance between return and risk, whilst maintaining economic and regulatory capital in accordance with risk appetite. Aviva’s capital and risk management objectives are closely interlinked, and support the dividend policy and earnings per share growth, whilst also recognising the critical importance of protecting policyholder and other stakeholder interests. Overall capital risk appetite, which is reviewed and approved by the Aviva Board, is set and managed with reference to the requirements of a range of different stakeholders including shareholders, policyholders, regulators and rating agencies. Risk appetite is expressed in relation to a number of key capital and risk measures, and includes an economic capital risk appetite of holding sufficient capital resources to enable the Group to meet its liabilities in extreme adverse scenarios, on an ongoing basis, calibrated consistently with the Group’s strategic target of maintaining credit ratings in the AA range. In managing capital we seek to:
maintain sufficient, but not excessive, financial strength in accordance with risk appetite to support new business growth and satisfy the requirements of our regulators and other stakeholders giving both our customers and shareholders assurance of our financial strength;
optimise our overall debt to equity structure to enhance our returns to shareholders, subject to our capital risk appetite and balancing the requirements of the range of stakeholders;
retain financial flexibility by maintaining strong liquidity, including significant unutilised committed credit facilities and access to a range of capital markets;
allocate capital rigorously across the Group, to drive value adding growth through optimising risk and return; and
declare dividends on a basis judged prudent, while retaining capital to support future business growth, using dividend cover on an IFRS operating earnings after tax basis in the 1.5 to 2.0 times range as a guide.
In line with these objectives, the capital generated and invested by the Group’s businesses is a key management focus. Operating capital generation, which measures net capital generated after taking into account capital invested in new business (before the impact of non-operating items) is a core regulatory capital based management performance metric used across the Group. This is embedded in the Group business planning process and other primary internal performance and management information processes. Capital is measured and managed on a number of different bases. These are discussed further in the following sections.
Accounting basis: Capital employed by segment and financing of capital The table below shows how our capital, on an MCEV basis, is deployed by segment and how that capital is funded.
2010 £m
Restated 2009
£m
Long-term savings 21,793 20,792 General insurance and health 5,613 4,562 Fund management 465 269 Other business 178 (246) Corporate1 (1,521) (1,327)
Total capital employed 26,528 24,050
Financed by: Equity shareholders’ funds 15,295 13,092 Minority interest 3,977 4,279 Direct capital instruments 990 990 Preference shares 200 200 Subordinated debt 4,572 4,637 External debt 1,494 852
Total capital employed 26,528 24,050
1 ‘Corporate’ includes centrally held tangible net assets, the element of the staff pension scheme deficit or surplus allocated centrally and also reflects internal lending arrangements. These internal lending arrangements, which net out on consolidation, arise in relation to the following:
— Aviva International Insurance Limited (AII) acts as both a UK general insurer and as the primary holding company for our foreign subsidiaries. Internal capital management mechanisms in place allocate a portion of the total capital of the company to the UK general insurance operations, giving rise to notional lending between the general insurance and holding company activities. These mechanisms also allow for some of the assets of the general insurance business to be made available for use across the Group.
— Certain subsidiaries, subject to continuing to satisfy stand-alone capital and liquidity requirements, loan funds to corporate and holding entities. These loans satisfy arms length criteria and all interest payments are made when due.
Total capital employed is financed by a combination of equity shareholders’ funds, preference capital, subordinated debt and borrowings. At 31 December 2010 we had £26.5 billion (31 December 2009: £24.1 billion) of total capital employed in our trading operations, measured on an MCEV basis. Financial leverage, the ratio of external senior and subordinated debt to MCEV capital and reserves, was 31.5% (31 December 2009: 31.6%). Fixed charge cover, which measures the extent to which external interest costs, including subordinated debt interest and preference dividends, are covered by MCEV operating profit was 9.4 times (31 December 2009: 8.7 times).
Regulatory capital – overview Individual regulated subsidiaries measure and report solvency based on applicable local regulations, including in the UK the regulations established by the Financial Services Authority (FSA). These measures are also consolidated under the European Insurance Groups Directive (IGD) to calculate regulatory capital adequacy at an aggregate group level, where we have a regulatory obligation to have a positive position at all times. This measure represents the excess of the aggregate value of regulatory capital employed in our business over the aggregate minimum solvency requirements imposed by local regulators, excluding the surplus held in the UK and Ireland with-profit life funds. The minimum solvency requirement for our European businesses is based on the Solvency 1 Directive. In broad terms, for EU operations, this is set at 4% and 1% of non-linked and unit-linked life reserves respectively and for our general insurance portfolio of business is the higher of 18% of gross premiums or 26% of gross claims, in both cases adjusted to reflect the level of reinsurance recoveries. For our major non-European businesses (the US, and Canada) a risk charge on assets and liabilities approach is used.

71
Performance reviewCorporate responsibilityGovernanceShareholder informationFinancial statements IFRSFinancial statements MCEVOther information
Performance review
Aviva plc Annual Report and Accounts 2010
Capital management continued
Regulatory capital – group European Insurance Groups Directive
UK Life funds
£bn
Other business
£bn 2010 £bn
2009 £bn
Insurance Groups Directive (IGD) capital resources 6.0 10.3 16.3 15.7
Less: capital resource requirement (CRR) (6.0) (6.5) (12.5) (11.2)
Insurance Groups Directive (IGD) excess solvency — 3.8 3.8 4.5
Cover of EU minimum (calculated excluding UK Life funds) 1.6 times
1.7 times
The EU Insurance Groups Directive (IGD) regulatory capital solvency surplus has decreased by £0.7 billion since 31 December 2009 to £3.8 billion. The key movements over the period are set out in the following table:
£bn
IGD solvency surplus at 31 December 2009 4.5 Operating profits net of other income and expenses 1.0 Dividends net of scrip (0.5) Market movements including foreign exchange (0.2) Pension scheme funding (0.3) Increase in Capital Resource Requirement (0.3) Acquisitions (River Road and other small transactions) (0.2) Other (0.2)
Estimated IGD solvency surplus at 31 December 2010 3.8
Regulatory capital – Long-term businesses For our non-participating worldwide life assurance businesses, our capital requirements, expressed as a percentage of the EU minimum, are set for each business unit as the higher of:
The level of capital at which the local regulator is empowered to take action.
The capital requirement of the business unit under the group’s economic capital requirements; and,
The target capital level of the business unit. The required capital across our life businesses varies between 100% and 325% of EU minimum or equivalent. The weighted average level of required capital for our non-participating life business, expressed as a percentage of the EU minimum (or equivalent) solvency margin has decreased to 129% (31 December 2009: 130%). These levels of required capital are used in the calculation of the group’s embedded value to evaluate the cost of locked in capital. At 31 December 2010 the aggregate regulatory requirements based on the EU minimum test amounted to £6.8 billion (31 December 2009: £6.1 billion). At this date, the actual net worth held in our long-term business was £10.0 billion (31 December 2009: £9.8 billion) which represents 147% (31 December 2009: 159%) of these minimum requirements.
Regulatory capital – UK Life with-profit funds The available capital of the with-profit funds is represented by the realistic inherited estate. The estate represents the assets of the long-term with-profit funds less the realistic liabilities for non-profit policies within the funds, less asset shares aggregated across the with-profit policies and any additional amounts expected at the valuation date to be paid to in-force policyholders in the future in respect of smoothing costs, guarantees and promises. Realistic balance sheet information is shown below for the three main UK with-profit funds: Old With-Profit Sub-Fund (OWPSF), New With-Profit Sub-Fund (NWPSF) and With-Profit Sub-Fund (WPSF). These realistic liabilities have been included within the long-term business provision and the liability for
insurance and investment contracts on the consolidated IFRS balance sheet at 31 December 2010 and 31 December 2009.
Estimated realistic
assets £bn
Estimate realistic
liabilities1 £bn
Estimated realistic
inherited estate2
£bn
Support arrange-
ment3 £bn
Estimated risk
capital Margin5
£bn
Estimated excess
£bn
2009 Estimated
excess £bn
NWPSF 20.8 (20.8) — 1.2 (0.4) 0.8 0.6 OWPSF 3.1 (2.8) 0.3 — (0.1) 0.2 0.1 WPSF4 20.4 (18.6) 1.8 — (0.4) 1.4 1.4
Aggregate 44.3 (42.2) 2.1 1.2 (0.9) 2.4 2.1
1 These realistic liabilities include the shareholders’ share of future bonuses of £0.7 billion (31 December 2009: £0.6 billion). Realistic liabilities adjusted to eliminate the shareholders’ share of future bonuses are £41.5 billion (31 December 2009: £42.1 billion). These realistic liabilities make provision for guarantees, options and promises on a market consistent stochastic basis. The value of the provision included within realistic liabilities is £1.9 billion, £0.3 billion and £3.1 billion for NWPSF, OWPSF and WPSF respectively (31 December 2009: £2.2 billion, £0.3 billion and £3.1 billion).
2 Estimated realistic inherited estate at 31 December 2009 was £nil billion, £0.2 billion and £1.6 billion for NWPSF, OWPSF and WPSF respectively.
3 This represents the reattributed estate of £1.2 billion at 31 December 2010 (31 December 2009: £1.1 billion) held within the non-profit fund with WPSF included within other UK life operations.
4 The WPSF fund includes the Provident Mutual (PM) fund which has realistic assets and liabilities of £1.7 billion, and therefore does not impact the realistic inherited estate.
5 The risk capital margin (RCM) is 3.7 times covered by the inherited estate and support arrangement (31 December 2009: 3.6 times).
Investment mix The aggregate investment mix of the assets in the three main with-profit funds at 31 December 2010 was:
2010 %
2009 %
Equity 26% 21% Property 16% 12% Fixed interest 57% 59% Other 1% 8%
The equity backing ratios, including property, supporting with-profit asset shares are 69% in OWPSF and NWPSF, and 68% in WPSF.
Economic capital We use a risk-based capital model to assess economic capital requirements and to aid in risk and capital management across the Group. The model is based on a framework for identifying the risks to which business units, and the Group as a whole, are exposed. A mixture of scenario based approaches and stochastic models are used to capture market risk, credit risk, insurance risk and operational risk. Scenarios are specified centrally to provide consistency across businesses and to achieve a minimum standard. Where appropriate, businesses also supplement these with additional risk models and stressed scenarios specific to their own risk profile. When aggregating capital requirements at business unit and Group level, we allow for diversification benefits between risks and between businesses, with restrictions to allow for non-fungibility of capital when appropriate. This means that the aggregate capital requirement is less than the sum of capital required to cover all of the individual risks. This model is used to support our Individual Capital Assessments (ICA) which are reported to the FSA for all our UK regulated insurance businesses. The FSA uses the results of our ICA process when setting target levels of capital for our UK regulated insurance businesses. In line with FSA requirements, the ICA estimates the capital required to mitigate the risk of insolvency to a 99.5% confidence level over a one year time horizon (equivalent to events occurring in 1 out of 200 years) against financial and non-financial tests. The financial modelling techniques employed in economic capital enhance our practice of risk and capital management. They enable understanding of the impact of the interaction of different risks allowing us to direct risk management activities appropriately. These same techniques are employed to enhance product pricing and capital allocation processes. Unlike more

72
Aviva plc Annual Report and Accounts 2010
Capital management continued
traditional regulatory capital measures, economic capital also recognises the value of longer-term profits emerging from in-force and new business, allowing for consideration of longer-term value emergence as well as shorter-term net worth volatility in our risk and capital management processes. We continue to develop our economic capital modelling capability for all our businesses as part of our development programme to increase the focus on economic capital management and meeting the emerging requirements of the Solvency II framework and external agencies.
Solvency II The development of Solvency II continues in 2011. The European Commission is focused on concluding the development of the Level 2 implementing measures that will establish the technical requirements governing the practical application of Solvency II. The European Commission has published a draft directive (‘Omnibus II’) proposing some changes, including as expected a change to the date for implementation of Solvency II from 31 October 2012 to 31 December 2012. Aviva continues to actively participate in the development of the requirements through the key European industry working groups and engaging with the FSA and HM Treasury to influence the on-going negotiations in Brussels. The European Commission is now giving further consideration to the wording of the implementing measures and is expected to finalise these during 2011.
Rating agency Credit ratings are an important indicator of financial strength and support access to debt markets as well as providing assurance to business partners and policyholders over our ability to service contractual obligations. In recognition of this we have solicited relationships with a number of rating agencies. The agencies generally assign ratings based on an assessment of a range of financial factors (e.g. capital strength, gearing, liquidity and fixed charge cover ratios) and non-financial factors (e.g. strategy, competitive position, and quality of management). Certain rating agencies have proprietary capital models which they use to assess available capital resources against capital requirements as a component in their overall criteria for assigning ratings. Managing our capital and liquidity position in accordance with our target rating levels is a core consideration in all material capital management and capital allocation decisions. The Group’s overall financial strength is reflected in our credit ratings. The Group’s rating from Standard and Poors is AA- (‘very strong’) with a Stable outlook; Aa3 (‘excellent’) with a Stable outlook from Moody’s; and A (‘excellent’) with a Positive outlook from A M Best. These ratings continue to reflect our strong competitive position, positive strategic management, strong and diversified underlying earnings profile and strong liquidity position.
Financial flexibility The Group’s borrowings are comprised primarily of long dated hybrid instruments with maturities spread over many years, minimising refinancing risk. In addition to central liquid asset holdings of £1.5 billion, the group also has access to unutilised committed credit facilities of £2.1 billion provided by a range of leading international banks.
Capital generation and utilisation The active management of the generation and utilisation of capital is a primary Group focus, with the balancing of new business investment and shareholder distribution with operational capital generation a key financial priority. The 2010 result of £1.7 billion represents a £0.7 billion increase on 2009 and reinforces our confidence in the capital generation position of the Group. This excludes the negative impact of the Delta Lloyd longevity assumption change of £0.2 billion which is included in the MCEV existing business free surplus generation. Profits from the life business remain strong, generating £2.1 billion of capital1 (31 December 2009: £1.9 billion), with a further £0.6 billion (31 December 2009: £0.6 billion) generated by the general insurance, fund management and non-insurance businesses. Capital invested in new business has reduced significantly to £1.0 billion (31 December 2009: £1.5 billion), benefiting in particular from management actions to improve capital efficiency in the US business, the utilisation of the RIEESA to finance new business in UK Life and reduced required capital on general insurance business.
2010
£m 2009
£m
Operational capital generation: Life in-force profits1 2.1 1.9 General insurance, fund management and non-insurance profits 0.6 0.6
Operational capital generated before investment in new business 2.7 2.5
Capital invested in new business (1.0) (1.5)
Operational capital generated after investment in new business 1.7 1.0
Operational capital generation comprises the following components: — Operating Free surplus emergence, including release of required capital, for the life in-force business (net of tax and
minorities); — IFRS operating profits for the general insurance and non-life businesses (net of tax and minorities); — Capital invested in new business. For the life business this is the impact of initial and required capital on free surplus.
For general insurance businesses this reflects the movement in required capital, which we have assumed to equal two times the regulatory minimum. Where appropriate, the movement in capital requirements excludes the impact of foreign exchange movements.
1 Life in-force profits exclude the negative impact of the Delta Lloyd longevity assumption change of £0.2 billion which is included in the MCEV analysis of free surplus generated.
As well as financing new business investment, operational capital generated is used to finance corporate costs, service the Group’s debt capital and to finance shareholder dividend distributions. After taking these items into account the net operational capital generated after financing remains at a £0.6 billion surplus, a strong improvement on the 2009 position.
2010 £m
2009 £m
Operational capital generated after investment in new business 1.7 1.0
Interest, corporate and other costs (0.6) (0.5) External dividend net of scrip (0.5) (0.6)
Net operational capital generation after financing 0.6 (0.1)

73
Performance reviewCorporate responsibilityGovernanceShareholder informationFinancial statements IFRSFinancial statements MCEVOther information
Performance review
Aviva plc Annual Report and Accounts 2010
Basis of preparation
Basis of preparation This review complies with the recommendations of the European Union (EU) Modernisation Directive, the Companies Act 2006 (Contents of Directors’ Report: Business Review) and is in line with current best practice. It is addressed to, and written for, the members of Aviva plc with the aim of providing a fair review of our business development, performance and position at the current time. In producing this review, we aim to present a view that is balanced and comprehensive and that is consistent with the size and complexity of our business. The review is written in the context of the risks and uncertainties facing our business. We anticipate that the format and content of the review will evolve over time, along with developments in our business and the external environment.
Key performance indicators The Companies Act requires that a fair review of the business contains financial and, where applicable, non-financial key performance indicators (KPIs). We consider that our financial KPIs are those that communicate to the members the financial performance and strength of the Group as a whole. These KPIs comprise:
Earnings per share (International Financial Reporting Standards basis);
Proposed ordinary dividend per share and dividend cover; Operating profit (Market Consistent Embedded Value basis); Operating profit (IFRS basis); Worldwide sales; Operational capital generation; and Return on equity shareholders’ funds.
Management also use a variety of other performance indicators (OPIs) in both running and assessing the performance of individual business segments and units, rather than the Group as a whole. OPIs include measures such as new business margins, combined operating ratio and underwriting profit. In addition to reporting on our financial performance, it is important that as a forward-thinking company we are aware of our wider responsibilities and report on the non-financial aspects of our performance. We consider that our employees and customers are fundamental to the success of our business; as such, they form the basis for our non-financial measures, and include:
Leadership and employee engagement; and Customer advocacy.
Accounting basis of preparation In addition to presenting our results and financial position on an International Financial Reporting Standards basis, we also use Market Consistent Embedded Value (MCEV) as an alternative performance measure. Details of the accounting basis of preparation are set out on the following page.
Forward-looking statements This business review contains ‘forward-looking statements’ about:
Our future plans; Our current goals; and Our expectations of our future financial condition,
performance and results. By their nature, all forward-looking statements involve risk and uncertainty because they relate to future events that are beyond our control. For example, certain insurance risk disclosures are dependent on our choices about assumptions and models, which by their nature are estimates. As such, actual future gains and losses could differ materially from those that we have estimated. Other factors that could cause actual results to differ materially from those estimated by the forward-looking statements include, but are not limited to:
Global economic business conditions; Monetary and interest rate policies; Foreign currency exchange rates; Equity and property prices; The impact of competition, inflation and deflation; Changes to regulations, taxes and legislation; The timing and impact of acquisitions and business
combinations in relevant industries; Natural and other disasters; Changes to consumer saving and spending habits; and Our success in managing the above factors.
Consequently, our actual future financial condition, performance and results could differ materially from the plans, goals and expectations set out in our forward-looking statements. We undertake no obligation to update the forward-looking statements contained in this review or any other forward-looking statements we make.

74
Aviva plc Annual Report and Accounts 2010
Accounting basis of preparation
Accounting basis of preparation International Financial Reporting Standards (IFRS) Our consolidated financial statements are prepared under IFRS, using standards issued by the International Accounting Standards Board (IASB) and endorsed by the EU. In addition to fulfilling this legal obligation, the Group has also complied with IFRS as issued by the IASB and applicable at 31 December 2010. The financial data contained in the report and accounts has been prepared using the Group’s accounting policies set out on pages 170 to 182. Where applicable, the financial statements have also been prepared in accordance with the Statement of Recommended Practice (SORP) on accounting for insurance business issued by the Association of British Insurers (ABI), the most recent version of which was issued in December 2005 and amended in December 2006.
Market Consistent Embedded Value (MCEV) basis of reporting We present the results and financial position of our life and related businesses on an MCEV basis, in addition to the IFRS basis. MCEV methodology represents an alternative basis of reporting the value of the Group’s life and related businesses and the drivers of performance. This basis values cashflow from assets consistently with market prices and is consistent with the way pricing is assessed and the business is managed. The MCEV methodology adopted is in accordance with the MCEV Principles published by the CFO Forum in October 2009. Under this methodology, the total profit recognised over the full lifetime of an insurance policy is the same as under the IFRS basis of reporting. However, the MCEV basis gives a market-consistent indication of the profitability of business on inception. Additionally, shareholders’ funds on an MCEV basis incorporate internally-generated additional value of in-force business (AVIF), which is excluded for IFRS reporting. These financial statements include supplementary information on MCEV reporting in the ‘Alternative method of reporting long-term business’ section.
Longer-term investment return The long-term nature of most of our operations means that short-term realised and unrealised gains and losses are shown as an adjustment to operating profit. We focus instead on operating profit incorporating a longer-term investment return (LTIR). Our rates of return that we use for equity and property in our LTIR methodology are aligned with the rates that we use under MCEV principles. For fixed interest securities, we include the amortisation of premiums or discounts arising on purchase, thereby producing an LTIR that is equivalent to the gross redemption yield.
Critical accounting policies and estimates The preparation of financial statements requires the group to select accounting policies and make estimates and assumptions that affect items reported in the consolidated income statement, consolidated statement of financial position, other primary statements and notes to the financial statements. These are set out on pages 170 to 182.
Critical accounting policies The major areas of judgement on policy application are considered to be over whether Group entities should be consolidated (set out in policy D), on product classification (set out in policy F) and in the classification of financial investments (set out in policy S).
Use of estimates All estimates are based on management’s knowledge of current facts and circumstances, assumptions based on that knowledge and their predictions of future events and actions. Actual results can always differ from those estimates, possibly significantly. The table below sets out those items that we consider particularly susceptible to changes in estimates and assumptions, and the relevant accounting policy.
Item Accounting
policy Insurance and participating investment contract liabilities F & K Goodwill, AVIF and other intangible assets N Fair values of financial investments S Impairment of financial investments S Fair value of derivative financial instruments T Deferred acquisition costs and other assets W Provisions and contingent liabilities Z Pension obligations AA Deferred income taxes AB
Future accounting developments We continue to take an active role in the development of new accounting standards, via industry forums and working parties, and reviewing and providing comment on proposals from the IASB. Phase II of the IASB’s project on insurance contracts continues to be the most significant area of development for us, and we continue actively to engage in the debate. We fully support the timely development of a global standard for insurance accounting that reflects the economics of our business, and are working directly and through the CFO Forum of leading European insurers, to achieve this. While this standard is still under development, we will continue to focus on embedded value as the best measure of value for our long-term business. We continue to monitor other major IASB projects, including financial instruments, revenue recognition, leasing, pensions accounting and fair value measurement.

Performance reviewCorporate responsibilityGovernanceShareholder informationFinancial statements IFRSFinancial statements MCEVOther information
Corporate responsibilityAviva plc Annual Report and Accounts 2010
75
Corporate responsibility
In this section Page
Highlights 76 Strategy and risk 76 Governance 76 Trust and integrity 77 Attracting and retaining talent 78 Developing communities 80 Climate change and environment 80 Financial capability 82 External benchmarking and recognition 83 Affiliations and engagements 83 Key indicators 84 Accounting for Sustainability 86 Independent assurance statement 91

76
Aviva plc Annual Report and Accounts 2010 Corporate responsibility
At Aviva, corporate responsibility (CR) means embracing our responsibilities and developing opportunities to be a strong sustainable business. We want what we do every day to have a positive impact on the societies in which we operate. In this report we highlight how we are addressing the issues that are material for our business. These issues include responding to the need to improve trust in the financial services sector; attracting and retaining talent; developing communities; influencing the climate change agenda and promoting financial capability. The report that follows contains a summary of the progress and performance of our CR programme in 2010 aligned to these material issues. A more detailed review is available online at www.aviva.com/corporate-responsibility/reports
Highlights from 2010 include: Being the first company to put our CR report in the Annual
Report to an advisory vote of shareholders at the AGM Increasing perception of CR internally leading to an
increasing sense of pride in what Aviva stands for – 74% of employees responding to our employee survey think that our commitment to CR is genuine, a rise of 8% from 2009
Developing commercial insurance products to support development of a low carbon economy
Increasing community investment by 43% and increasing recognition of our global community programme Street to School, helping over 128,000 children
Focusing on a balanced leadership to ensure an effective gender mix throughout all levels in the organisation.
Strategy and risk Our CR strategy is an integral part of the way Aviva does business internally and externally. Our CR strategy was revised during the year. Starting with our belief that ‘by acting responsibly for the long term in how we do business we will meet our ambition to provide prosperity and peace of mind to our customers’ we took on feedback from a range of stakeholders to ensure our CR strategy was correctly aligned to the most significant challenges and opportunities we face. For example, one of our priorities is to improve consumer trust. The risk is that consumers lose faith in financial services. We know we need to conduct ourselves in line with the highest ethical standards as set out in our business ethics code and satisfy the customers’ expectations to ensure their loyalty. It is important that we recognise these issues and manage the associated risks. By working to turn these issues into opportunities for our business we help to shape the wider debate and action in our societies. We have developed a robust CR programme over the past ten years although we do acknowledge that we have differing levels of CR maturity within our markets. We are working hard to develop our capability globally. Our KPI section lists some areas where we are outperforming our targets and leading the agenda. In other areas we have a way to go to meet our ambitions. In all areas we are committed to continuous improvement. As an illustration, we are committed to reducing our impact on the environment and have long-term targets to focus performance. However, we note that while our absolute carbon emissions have reduced by 4% our actual emissions have risen by 22% due to growth in the business and the extended scope of reporting boundaries to include subsidiary companies. We want our growth to be sustainable so we will be working hard to reverse this trend.
Our achievements within our global community programme Street to School have helped us achieve a 43% rise in the amount of investment in our communities, but the amount of volunteering hours has reduced by 28%. This is because we no longer use brokers to find volunteering opportunities and volunteering opportunities with children require special training. We are exploring options to make it easier for our employees to make use of their three days volunteering leave to address this. We know this helps grow employee pride but there is more to be done on wider employee engagement which dropped by 1% in 2010. All teams across the Group are creating action plans to help us deliver on our employee promise of ‘At Aviva I am recognised for who I am, and my contribution matters’. We are proud of our extensive approach to diversity and inclusion. We have three female non-executive directors and good standing in benchmarks and indices. However, we have seen a slight drop in the percentage of women in senior management to 21% (2009: 22%). This is something we are intent on addressing. Throughout the report that follows we outline our performance and progress in 2010 and we are keen to continue our dialogue with our stakeholders to further develop our CR strategy, CR capability and positive contribution to the world we all share.
Governance Aviva is proud to have a well-established governance structure providing strong leadership and direction. Our Corporate Responsibility Committee is chaired by non-executive director Carole Piwnica, and comprises our chairman, group CEO and two other non-executive directors, Scott Wheway and Euleen Goh. The committee reviews strategy and policy and receives regional and functional reports four times a year. In 2010 it received a report from all regional offices and the IT, audit, procurement, SRI and customer teams. As standing items it had business ethics and the Street to School programme to discuss. The Corporate Responsibility Committee’s report can be found on page 114. Our CR Advisory Group supports and advises on the management and implementation of the global CR programme. Membership of the advisory group is being extended during 2011 to include external stakeholders representative of our strategic priorities. The internal members comprise Group CR specialists, regional CR leads and HR directors who work together to adopt and refine CR strategies, assess progress, identify actions that need to be taken and embed our programmes in different parts of the business. In addition, the Aviva Board receives both annual and ad hoc updates on CR strategy, activities and progress. Our CR programme is regularly on the agenda at executive management committees and regional performance against Group KPIs is reviewed quarterly. A percentage of our senior executive remuneration is dependent on performance against our CR key performance indicators.
Stakeholder communications By being open and transparent about what we do and how we run our business we believe we will be seen to have a high degree of integrity and therefore continue to build trust in Aviva for all of our stakeholders. Key to this is the way that we report our CR commitments and performance. We prepare stand-alone detailed annual reports for the Carbon Disclosure Project, UN Global Compact, ClimateWise and Principles of Responsible Investment. As well as

77
Performance reviewCorporate responsibilityGovernanceShareholder informationFinancial statements IFRSFinancial statements MCEVOther information
Corporate responsibilityAviva plc Annual Report and Accounts 2010 Corporate responsibility continued
providing a narrative CR report we prepare an Accounting for Sustainability statement using the Connected Reporting Framework to demonstrate the costs associated with our energy, natural resource use and waste management. We also use this statement to demonstrate the financial impacts of our community investment and customer advocacy commitments. The Accounting for Sustainability statement is provided on page 86. We are also committed to providing full disclosure to investors on our CR programme and as such respond to EIRIS, SAM, Sustainalytics and Vigeo for inclusion in the FTSE4Good, Dow Jones Sustainability Indices, Ethibel and ECPI indices. Some of our senior managers are involved in the promotion of transparent reporting: Tim Harris, deputy chief financial officer, is working with the International Accounting Standards Board to drive forward a globally consistent high-quality standard of reporting (International Financial Reporting Standards (IFRS)) and Steve Waygood, head of sustainability research at Aviva Investors, is part of the team progressing the International Integrated Reporting Committee which aims to present a more rounded view of responsible reporting. The work Aviva Investors has been developing over the past two years on the Sustainable Stock Exchange initiative continued to gather prominence during 2010. Building on this, looking towards 2011 and the 2012 Rio Earth Summit, Aviva has taken a position to highlight the need for long-termism in investment decision making. Open dialogue with our stakeholders also helps us to define priorities and shape our approach. We have increased our engagement with governmental stakeholders this year in order to respond to consultations relating specifically to changes proposed to corporate governance and reporting. We are keen to actively engage in dialogue with government, sharing our insight as both the owner and investor of capital, giving a useful double perspective to aid their public policy development. Specifically we have responded to:
UK Department for Business (BIS) ‘Future of Narrative Reporting’
BIS call for evidence – ‘A long-term focus for corporate Britain’
EU Commission Green paper on ‘Corporate governance in financial institutions’
EU Commission Questionnaire on Disclosure of Non-Financial Information by Companies
In addition to these consultations we have engaged with MPs on the Street to School programme with our UK partner Railway Children to raise awareness of children at risk on our streets in the UK. The Opinion Leader Research carried out independently each year suggests that our strategy for engagement is well received. The research shows that Aviva is seen as the most trusted insurer amongst UK MPs, this has been the case for three years.
Trust and integrity Building and maintaining trust in Aviva by our customers, our suppliers, shareholders and employees, is of prime importance within a sector that has been impacted by the economic crisis. We are doing this through a commitment to transparent disclosure of information via the aforementioned initiatives, particularly the Carbon Disclosure Project and Accounting for Sustainability. We build long-term partnerships with charities and communities to provide both a sustainable source of finance and to deliver on outcomes over a significant period of time.
All employees are required to sign our business ethics code annually. Each instance of financial crime is recorded and investigated independently and the highest controls are put in place to protect our customers’ data. By regularly researching the opinions and behaviours of our customers, through our Consumer Attitudes to Savings research for example, we are able to deliver products and services that are designed to provide prosperity and peace of mind to our customers.
Business ethics We aspire to the highest standards of conduct and set out our principles in our business ethics code. This stipulates fairness, honesty and transparency in all we do. Employees in all countries in which we operate are required to uphold the laws of the host country. Everyone at Aviva has a part to play in upholding our standards and we raise awareness of these responsibilities through our induction programmes and sign-off of acceptance of the code by all staff. Our code has been revised for 2011 to incorporate the increasing legislative requirements of the UK Bribery Act 2010 and US Foreign Corrupt Practices Act. We will also be increasing the level of awareness of the new legislation throughout the organisation to improve understanding and compliance. In addition to our business ethics code, Aviva has adopted a code of ethics for senior management as required by section 406 of the Sarbanes-Oxley Act 2002 and the rules issued by the Securities and Exchange Commission. This code can be found on Aviva’s website, www.aviva.com/investor-relations/corporate-governance/code-of-ethics
Financial crime Our financial crime policy reinforces our zero-tolerance approach and ensures that risks relating to fraud, money laundering, market abuse and bribery and corruption are adequately controlled. We provide mandatory computer-based training as part of our procedures for combating market abuse and insider trading, money laundering and fraud. In 2010 we enhanced understanding of bribery and corruption throughout the business, including at Board and senior manager level. Throughout 2011 we will be running training events with our 450 senior managers to raise awareness of bribery and corruption and reinforcing the importance of making ethical decisions. We encourage our employees to raise any concerns they might have through ‘Right Call’ – an Aviva-wide malpractice reporting service. This enables all employees to report any suspicions or concerns in a confidential manner for independent investigation. During 2010, 48 incidents were recorded across the Group. All cases were referred for independent investigation with 39 reaching conclusion and nine cases currently remaining under investigation.
Understanding our customers We continued to work to understand perceptions and needs in our markets and once again conducted our wide-ranging survey on Consumer Attitudes to Saving, using the results to inform ongoing product and service developments across the Group. The Net Promoter Score®1 (NPS) is our leading, Group-wide measure of customer advocacy, comprising a globally consistent relationship and benchmarking survey which is conducted annually. The focus for the business is to ensure we are acting on
1 Net Promoter, NPS, and Net Promoter Score are trademarks of Satmetrix Systems, Inc., Bain & Company, and Fred Reichheld.

78
Aviva plc Annual Report and Accounts 2010 Corporate responsibility continued
the feedback from our customers as well as including NPS performance targets as part of our executive directors’ annual remuneration.
Products and services Our product portfolio is designed to allow customers to make informed choices about their insurance and financial needs which provide socio-economic and environmental benefits:
Our affordable microfinance and insurance products for low-income earners have reached around three million rural lives in India to date, in many cases offering financial protection for as little as US$2 a year.
Car insurance customers in some of our general insurance markets are rewarded by lower premiums if they opt to drive vehicles with low CO2 emissions.
As part of our response to climate change we launched insurance products in February 2011 that support commercial development of low-carbon products including wind farms and biomass energy conversion plants.
We have continued this year to run the Aviva Customer Cup competition first launched in 2009. The Customer Cup challenges employees from around the Group to increase customer satisfaction and loyalty by improving our product offering and service delivery. Projects from more than 200 teams are evaluated by judges in three tournament stages with ten teams making it through to the grand final in June 2011. We are pleased that the Customer Cup has been recognised externally by the Financial World Innovation Awards 2010 for ‘Innovation in Staff Participation’. Our ‘You are the Big Picture’ campaign reflected the progress we have made in the transition towards a customer-focused organisation. The campaign featured our customers, employees, business partners and communities bringing to life our brand promise of individual recognition. Employees and customers relived their stories of the part Aviva played at a time of crisis to deliver peace of mind.
Attracting and retaining talent As a global financial services organisation we recognise our role in finding and building new skills for the workforce, developing a workplace that employees want to join and develop their career with. Delivering on our strategic plans and commitments requires strong leadership and the energy, dedication and belief of all our employees. Over the past three years we have built a strong global HR function to lead our cultural transformation. We have a clear purpose – to bring to life our employee promise to deliver exceptional business performance. We have approached this by implementing strategies designed to:
encourage talented people to join Aviva and stay match the right people to the right roles and take action
where there are gaps enable people to be the best they can be build pride in Aviva.
We will do this by focusing globally on:
developing leaders capable of winning for Aviva in our chosen markets
embedding a culture of recognition, personal responsibility, risk awareness and performance
building engagement and commitment by living the employee promise
strengthening our CR performance by engaging employees and influencing our communities and stakeholders
making it easier to work by simplifying and de-cluttering HR tools and processes
building strong global HR and CR functions. Locally, the use of global tools and ‘One Aviva’ processes supports the delivery of our business strategies.
Simplifying our key people processes and tools Talking Talent is designed to match the right people to the right roles and equip individuals to take personal responsibility for their development. Over the last four years, this has been firmly established as a ‘signature process’ at Aviva and, since the end of 2010, has been deployed in all regions. The support material for Talking Talent has been simplified and translated into 11 languages so that staff at all levels can now use the same process worldwide. The outputs of Talking Talent are the cornerstone of our key people-related decisions – from rewarding great work to recruiting expertise from outside while ensuring we achieve a healthy mix of promotions from within. We have eliminated almost all of the bureaucracy previously associated with performance management. The focus is now on frequent, open, honest and informal conversations between individuals and their line manager throughout the year – with a much simpler and clearer annual mechanism for recording these formally. We are focusing on simplifying HR processes and procedures to reduce the administration burden and complexity apparent due to legacy. As part of this we are harmonising terms and conditions in employment contracts within the UK to apply consistent employment conditions to all UK employees. We are in the process of introducing a new HR management system, Workday, to consolidate all HR databases globally and have created New Beginnings, a central repository of information to help new employees at Aviva.
Creating a culture of performance, responsibility and recognition Since their launch in 2008, the Aviva senior leadership summits in each region have become our primary means of engaging the top 500 leaders in our purpose, vision and strategy. This year, we used these gatherings to launch the concept of Living Leadership – which defines leadership simply as ‘the act of making a difference’. This model has three levels. Leading Myself clarifies our expectations of every Aviva employee – in terms of personal responsibility, accountability and contribution. It has provided a refreshed focus on ethics and risk as well as the foundations of both our employee and brand promise. Leading People reinforces our belief that excellence in line management is essential to turn the talents of individual employees into sustained superior business performance. Leading Organisations provides a focus on strategic leadership with the aim of beating the competition. Over the course of 2011, we will use Living Leadership to drive employee engagement and a recommitment to the Aviva values.
Our employee promise We want every employee to be able to say ‘At Aviva I am recognised for who I am and my contribution matters’. Our employee promise, launched in 2009, helps us to create an employment brand that differentiates Aviva as an employer of choice. We use ‘Aviva Day’, an annual celebration in June, to mark achievements across the Group. In 2010, a key part of this event was to raise awareness for our global community programme Street to School. This included participation in a variety of fundraising activities where employees raised in excess of £100,000. Employees were able to post information about their Aviva Day activities on Aviva World, our global intranet, in

79
Performance reviewCorporate responsibilityGovernanceShareholder informationFinancial statements IFRSFinancial statements MCEVOther information
Corporate responsibilityAviva plc Annual Report and Accounts 2010 Corporate responsibility continued
11 different countries and nine different languages. The fact that there was a high level of engagement and input in this activity gained Aviva an International Visual Communications Association (IVCA) Gold Award for experiential digital events. A key part of our employee promise is to recognise the contribution of our employees. Our ‘You are the Big Picture’ brand campaign, recognises employees by celebrating their dedication to our customers. This campaign was shared online both internally and to an external audience. Indeed, our annual employee promise survey tells us that individual recognition is now our most important engagement priority.
Listening to our employees One of the ways that we listen to our employees is through our Employee Promise survey. In 2010, this achieved an 80% response rate, our highest response rate to date (2009: 76%). The survey measures our employees’ engagement levels, our leadership capabilities, delivery of Aviva’s strategy and tells us how we are doing in other areas that are important to our employees. As well as telling us what our key strengths are it gives detailed analysis of where we need to improve. One example of a key strength is our commitment to CR, 74% of employees think that this is genuine (2009: 66%). Our employees’ perception of our reputation for the quality of our products and services is also a growing strength. We need to improve the perception amongst our employees that we value diverse perspectives in the workplace. The survey results not only inform action planning for the following year but are also linked to senior management remuneration. We make sure that each manager with five direct reports or more receives their own local survey results, helping them to have honest conversations on the successes and challenges the survey results present and most importantly to decide on actions to take locally as a team. As with last year, each completed survey triggers a £1 donation to our global Street to School charity partner Save the Children. This year we raised £37,000 (2009: £37,000). We also focus on talking and listening to our employees when working on more challenging changes which we have to address as a business. This year, in the UK, we announced that in order to provide a sustainable pension scheme, changes would need to be made to the current arrangements. Following a three-month consultation with employees, the trade union Unite, and pension trustees we announced that the final salary scheme would close in April 2011. The 7,600 employees impacted by the changes have been fully consulted throughout the process. We ran 344 workshops across 34 locations, attended by 5,038 employees. All impacted employees were also kept informed of progress by post to their home addresses.
Strengthening our leadership capability Over the last two years we have introduced new management and leadership programmes to nurture talent and create proactive dialogue with leaders and their teams. In the UK business we have implemented a programme to develop frontline managers, focused specifically on the Asia top 60 and introduced a Europe-wide learning and development curriculum. We have also improved the way that we provide information to senior leaders who are new to Aviva, to introduce them to our culture, values and management processes. Some 40 incoming
senior leaders took part in a specially developed induction process this year and received take-away information packs.
Diversity, equality and human rights Being respectful of each other’s differing backgrounds, cultures, needs and views is key to our delivery of the employee promise – ‘I am recognised for who I am and my contribution matters’. Our Diversity and Inclusion policy and practices are aligned with the United Nations Universal Declaration of Human Rights and the International Labour Organisation’s core labour standards. Last year, our Employee Promise survey results showed that our commitment to valuing diversity in our organisation could be improved. In response to this we have run a series of online discussions and employee forums to gain an insight into what is understood by diversity and how employees would like us to improve the perception and management of diversity issues. Based on this we have started to focus on instilling balanced leadership to create an effective gender mix at all levels in the organisation. We are recognised for being one of the few FTSE 100 companies for having three female non-executive directors, one of whom, Carole Piwnica, chairs our Corporate Responsibility Committee. Within our senior management group however, representation of female colleagues has declined slightly to 21% (2009: 22%) making our commitment to achieving balanced leadership all the more important. Whilst we have been making some improvement in terms of the internal promotion of our senior managers, we are committed to monitoring gender throughout this process to ensure a balance exists. Following a series of workshops with our senior management group we have implemented an action plan with a staged approach which comprises:
embedding balanced leadership in our talent management programme
senior leaders role modelling personal behaviours that support balanced leadership. One example is the group executive committee reciprocal mentoring scheme which will be launched in 2011
raising awareness and building engagement around balanced leadership principles
hardwiring balanced leadership into HR practices and processes
embedding balanced leadership into our regional HR strategies.
Our employee network group Aviva Pride successfully launched Friends of Aviva Pride in York this year with guest speaker Welsh rugby player, Gareth Thomas to encourage all colleagues to support a working environment that is open and inclusive. In North America our Aviva Pride and diversity networks have been formed this year as part of the programme launched by the Diversity and Inclusion advisory council set up by Aviva North America in 2009. We further improved our position in Stonewall’s Workplace Equality Index, achieving 42nd position (2009: 54th), which puts us in the top ten private sector companies. We continue to be the only insurer in the top 100. We have also received another Star Performing Network award recognising the activities of our employee network group as an example of best practice, with special acknowledgement for our work supporting local community projects.

80
Aviva plc Annual Report and Accounts 2010 Corporate responsibility continued
Developing communities To be a sustainable business, we believe we have a role to play in the development of our communities. Moving beyond passive giving we strive to listen carefully, collaborate and together create a genuine and lasting impact. Using our strengths and working around our strategic focus on education, life trauma and financial literacy we have collaborated right across private, public and third sectors to help develop the wellbeing of our communities - to which our current and future investors, customers, talent and supply chain belong. We are actively contributing to the Millennium Development Goals and our history of engagement with the UN Global Compact (UNGC) led to an invitation to become one of the 54 UNGC LEAD companies. LEAD companies are committed to being at the leading edge of addressing environmental, social, and governance issues, and broadening and deepening partnerships with the entire United Nations system. Globally, we contributed over £11.4 million in 2010, a 43% increase on 2009 (2009: £8 million) and we have improved our measurement approach to record our inputs and outputs more accurately in order to demonstrate the benefit of this investment for our employees, our communities and our brand. Engaging our employees is vital. We delivered over 57,250 hours of volunteering in 2010. We measure the development gained by volunteers and the impact on their perception of Aviva and 80% of volunteers reported positive benefits2. This is reflected in a 4% uplift in employees who think we do a good job of contributing to our communities and an 8% increase in employees who believe Aviva’s commitment to CR is genuine. Aviva has a clear track record of working with field experts in community development across the third and public sector. We recognise the importance of our partnerships with organisations such as UK Athletics, Save the Children, Consortium for Street Children and Oxfam to enable us to develop and share best practice programmes and to work effectively in areas of community advocacy. We also recognise the mutual benefit of our community development activity; our employees feel engaged and proud, our communities benefit and our brand reputation is enhanced.
Street to School Our flagship global community development programme Street to School, a five-year commitment to help 500,000 children fulfil their potential, shows our approach in action. 2010 saw a significant increase in the volume and profile of our partnership work to help children off the streets and into education. In collaboration with leading charities and experts, and supported by our employees, partners and customers we have positively impacted 128,000 children through preventative education, outreach, healthcare, safe housing and education projects. Street to School partnerships and programmes are up and running in 17 of our markets and we have begun to use Street to School for cause-related marketing. Here are just a few examples of what we have achieved:
In India our ‘Great Wall of Education’, supported by politicians and sports stars, collected a staggering 950,000 educational books for underprivileged children this year. With an average campaign reach of 48% of the population in Kolkata, Chennai, Delhi and Mumbai and a combined media value of over £875,000, we achieved significant exposure for our brand. This also attracted several awards including the CMO Asia Award for Excellence in ‘Social
2 ‘Volunteering: the business case’, Corporate Citizenship 2010, http://www.corporate-citizenship.com/archive/volunteering-the-most-cost-effective-way-to-train-and-develop-your-staff
Marketing’ and the ‘Corporate Social Responsibility Award’ at the Asia Insurance Industry Awards 2010 for demonstrating how CR can be closely and successfully tied with business strategy.
In the UK, over 7,000 children have been positively impacted. 2.4 million customers have been reached by our Street to School messages and the full media reach is estimated at £14 million. Over £500,000 has been raised for our UK partner Railway Children and we’ve contacted 650 MPs.
In China our ‘Twinkling Stars’ project works with the issues of children left behind due to economic migration. This year we have built ten Care Houses, worked in 20 poor rural elementary schools and reached 24,000 children. In addition to significant publicity this helped Aviva Cofco win the award for ‘China’s Best Corporate Citizen’.
We used our global brand campaign ‘You are the Big Picture’ to raise awareness of street children, to engage the public including attracting 57,000 fans on Facebook and to raise £170,000 for Street to School.
In total over 61 million people had the chance to hear about Street to School in 2010.
Community projects We commit at least 50% of our community development budget to Street to School. Our approach to benefiting our people, community and brand is also found in the following examples:
Our ongoing partnership with Oxfam 365 helps to equip Oxfam with the resources and materials to respond to emergencies as soon as they happen, such as those in Haiti and Pakistan
‘Paying for It’ (www.payingforit.org.uk) launched by Aviva in 2007, continued to take economic citizenship teaching into schools up and down the UK using trained Aviva volunteers and now with 3,300 teachers using our resources
Our Grassroots Athletics and Rugby programmes reach out to tens of thousands of children every year to help them develop a healthy and active lifestyle
In Canada, the Aviva Community Fund gives members of the public the opportunity to turn great ideas into action to benefit their local communities. This innovative use of social media encouraged two million members of the community to vote on their preferred project.
We have streamlined our portfolio of projects to ensure alignment with our strategy but being conscious of the need to recognise that all our people have issues close to their hearts we continue to offer all staff three days paid volunteering leave and fundraising matching programmes.
Climate change and environment Tackling climate change and protecting the environment are key priorities for Aviva that we believe require action today, not tomorrow. Our strategy to deliver action focuses firstly on control of our own environmental impacts to reduce greenhouse gas emissions from energy, waste and travel. We continue to compensate for our operational emissions worldwide by purchasing carbon credits from the voluntary carbon market. We apply our understanding to work within our sphere of influence externally to encourage sustainable practices with our customers, suppliers, governments and the companies in which we invest.

81
Performance reviewCorporate responsibilityGovernanceShareholder informationFinancial statements IFRSFinancial statements MCEVOther information
Corporate responsibilityAviva plc Annual Report and Accounts 2010 Corporate responsibility continued
Our focused attention on driving down energy use has been rewarded this year with a reduction in gross emissions by 4% (2009: 13%). Last year we announced our long-term target of a reduction of 30% CO2 emissions by 2020. Taking the 2010 figures into account we have achieved an 10% reduction since our baseline of 2006. Our annual target reduction is set at 5% to help us achieve the longer-term target. We also set global annual targets in other key areas, summarised below:
2010 Targets
Performance – accounting
for divestments
Reduce CO2 emissions by 5%* 4% Reduce water use by 4% 8% Reduce waste by 4% (2)% Increase percentage of recycled waste by 2% (until 80% recycled
rate is achieved) 75%
* We also offset 105% of our remaining emissions by investing in sustainable projects such as renewable energy generation and small-scale run-of-river hydro electricity systems.
All performance data is calculated on a like-for-like basis taking into account new acquisitions and divestments in 2010.
Part of our approach to achieve these targets is to share best practice across the regions of value creating initiatives. Some examples of this over the past year have been the sharing of information on advances in low-energy IT solutions such as 1E Nightwatchman between the UK, Europe and Asia Pacific. We have also shared progress and implementation notes on the use of ‘low-water’ and ‘no-water’ urinals and centralised recycling. The impact that we have on the environment is not restricted to our own operations but extends to areas of our supply chain and properties that we hold within our investment funds. Sustainable supply chain work during 2010 has focused on the environmental benefits we can deliver throughout the claims fulfilment process. We have made savings in waste production through the ‘repair over replace’ schemes in both motor and home repairs. We have worked with our IT suppliers to minimise the polystyrene placed in packaging and have an agreement in place with Dell for them to take back and recycle polystyrene packaging. In February 2011 we are launching the first commercial insurance products to support the drive to a low-carbon economy. These products will cover wind turbines and solar power manufacturers, biomass and waste to energy production.
The role of insurers in climate change The insurance industry has a fundamental part to play in society’s responses to climate change. As a major insurer Aviva has first-hand understanding of the impact of extreme weather events on our customers. On their behalf, we are committed to help mitigate the threat of climate change and support everyone in society to adapt to changes caused by man-made emissions already in the atmosphere. Our industry can also draw on its knowledge of historical weather data to identify patterns of change, applying our understanding of risk to map future temperature scenarios and determine likely impacts. Finally, we can offer the financial tools to help manage the burden of climate change, for example the pooling and transfer of risk. Our Accounting for Sustainability statement on page 86 explains our progress against these areas. We believe that climate change must be tackled now. As extreme weather events become more frequent and more severe, they become more challenging to insure. It is in everyone’s
interest that insurance remains affordable and available so that people affected by severe weather events can recover quickly from unavoidable impacts.
Leadership and participation We work in collaboration with leading organisations to provide a collective business and sector-specific response to the climate change agenda. This year we have participated in:
The Cancun Communiqué; Open letters from the Aldersgate Group on mandatory
reporting of climate related data; and 2010 Global Investor Statement on Climate Change.
Since 2006, when we were a founder member of the ClimateWise Principles, we have been a part of the management committee and continue to report each year against these industry-wide principles. This year we hosted the ClimateWise review, where Aviva Investors UK CEO Paul Abberley spoke along with UK government ministers Chris Huhne and William Hague. Our senior managers have continued to support high-level initiatives to tackle climate change. Our chairman, Lord Sharman, a long-time advocate for addressing climate change issues, wrote an article in Environmental Finance calling for mandatory reporting of carbon emissions. Andrew Moss, Group CEO, highlighted the importance of translating sustainable development principles into business operations in the media leading up to the Davos summit in January 2011. Andrew attended the UN Global Compact LEAD launch in Davos, membership of which recognises Aviva as a leader in addressing environmental, social, and governance issues. John Ainley, Group HR director spoke on the subject of employee engagement to drive climate behavioural change to the UK CBI in April 2010. While in Singapore our director of HR change, Anuradha Purbey, spoke at the 1st Climate Change Conference, supported by ClimateWise. Our Corporate Responsibility Committee has taken the steps to become paperless, saving an estimated 8.8kg of paper per annum and energy associated with printing. We firmly believe that engaging our employees to raise awareness and address environmental impacts is an essential part of delivering our environmental strategy. 71% of our employees agree that we make business choices that support the environment which include measures such as our recycling initiatives, providing alternatives to business travel and energy reduction techniques. We are looking to further strengthen our communications to our employees and customers through our sponsorship of ClimateWeek during March 2011. At the London launch of the Carbon Disclosure Project in 2009 Lord Sharman called for more focus on carbon mitigation. We are working with the Carbon Disclosure Project to develop a project to collate carbon mitigation responses. We consider our supply chain to be part of our sphere of influence not only to address the carbon intensity of our supply chain but to encourage our suppliers to be more responsible and sustainable. Aviva is a large procurer, with a £5.3 billion spend and 27,000 suppliers. During 2010 we have started to investigate the nature of embedded carbon within our supply chain, both through conversations with suppliers and through examining the appropriate methodology for this task. We have also begun to introduce legally binding clauses within procurement contracts. During 2011 we will be continuing this work and developing a ‘code of behaviour’ for suppliers outlining a mutual moral commitment on which to conduct the supplier relationship.

82
Aviva plc Annual Report and Accounts 2010 Corporate responsibility continued
Financial capability We believe it’s vital to help build financial capability as the capacity for consumers to save and make provision is the single most important ingredient for future prosperity. We work across a number of fronts, especially to help lower-income groups: increasing awareness of personal responsibility, improving financial education and ensuring access to products and services in our markets. We’re also working with government and policy makers to help create the right environment to close pensions and savings gaps. A lack of trust in financial institutions, made worse by the banking crisis, has further undermined customers’ trust and ability to save and make provisions. Aviva is determined to address this, and in particular, issues around the significant level of under-provision for retirement.
Empowering our customers We want to help our customers secure their financial futures by designing products and services to meet their needs. Individuals, too, have a responsibility to plan, decide and act. Across Aviva, communicating with our customers openly and effectively is fundamental to the business. We continue to develop all the channels available to us to reach our customers, and provide good, clear information, whether written or spoken, to help people with financial decisions. To illustrate this in the UK our customer portal now has 15,000 registered users who use the site to find up-to-date valuations and use a range of online help tools including a pension tracker and a retirement calculator. It remains a fact, however, that there is substantial under-provision for retirement. In Europe, for example, where we have carried out a significant amount of research to understand the pensions’ requirements, we estimate that some individuals will need to increase their savings by an average of €12,000 per annum to fully close their own personal pension gap. Our Consumer Attitudes to Saving research, which has now covered over 100,000 people, analyses what consumers are thinking and feeling about financial matters, revealing common concerns about retirement. However, these worries are not being translated into personal action. The issues are complex but we are looking at new ways to better engage consumers to take greater personal responsibility. This is why we have convened experts in behavioural change and psychology to join our Future Prosperity Panel, with the aim of publishing new thinking on the issues in 2011.
Community initiatives Through our community development programme we have defined financial capability as one of our key strategic areas. We are therefore supporting financial education, in young people and adults, by funding education programmes and by offering the time and expertise of our colleagues. In the UK our Paying for It and Learn and Thrive programmes educate young people to be financially literate while our Chance to be Chancellor competition gives 14 – 19 year-olds the opportunity to have their say on the economy, to develop their own Budget and identify their priorities for public spending. While in Sri Lanka, our community projects include helping small businesses to improve their financial capability and providing internships to university students to develop a greater awareness of a financial services workplace.
Working with government stakeholders Aviva is committed to working with regulators, government and across our sector to build greater financial capability. As part of this, we believe that individuals need to take greater responsibility for their own retirement provision. The biggest influence on an individual’s ability to maintain their standard of living is how much they save during their working lives relative to their retirement expectations. To encourage individuals to plan their financial futures, it is important to understand current attitudes and concerns and we are sharing findings from our seven-year study into consumer attitudes to savings in our markets. Findings from our consumer attitudes survey have been shared with HM Treasury in the UK particularly around retirement concerns. We also presented our ‘Mind the Gap’ pensions research and recommendations to the European Commission (EC). In Europe, for people retiring in the next 40 years an additional €2.4 trillion will be required each year to fill the pensions gap3. Aviva has called on the EC to create a European Quality Standard for Pensions to restore consumer confidence in pensions savings vehicles and to establish and monitor a European Pensions Savings Target. It is hoped that through this national governments will be encouraged to rebalance their pensions systems with greater funded schemes.
Sustainable stock markets The most significant project on voting and engagement issues is our involvement in the Sustainable Stock Exchanges initiative. This is focused on enabling all investors to vote directly on the sustainability disclosure of listed companies, rather than using a surrogate such as the annual report and accounts. In 2008 Aviva Investors CEO Alain Dromer called on all the listing authorities of the global stock markets to consider whether their corporate governance codes should be updated to include a provision promoting CR reporting. Specifically, we proposed that all stock market listing authorities establish a listing requirement that companies:
consider how responsible and sustainable their business model is; and
present a forward-looking sustainability strategy at their annual general meeting (AGM) for shareholder approval.
Overall, the main purpose of our proposed corporate responsibility reporting requirement, and the associated AGM vote, is to try to create the right kind of discussions within the boardrooms of listed companies around the world, and then between the company and its shareholders. Since 2008, the Sustainable Stock Exchange initiative has continued to gather momentum. In 2009 and 2010 we co-hosted events with the UN-backed Principles for Responsible Investment Initiative (PRI), UN Global Compact and the United Nations Conference on Trade and Development (UNCTAD), to examine the various ways in which stock exchanges promote sustainable business practices. We believe this initiative has significant potential to make capital markets work better and be more sustainable.
3 Source: Mind the Gap – quantifying Europe’s pensions gap: Aviva & Deloitte, Sept 2010

83
Performance reviewCorporate responsibilityGovernanceShareholder informationFinancial statements IFRSFinancial statements MCEVOther information
Corporate responsibilityAviva plc Annual Report and Accounts 2010 Corporate responsibility continued
External benchmarking and recognition Our achievements in 2010 were recognised by our inclusion in some of the world’s leading external benchmarks:
Dow Jones Europe and World Sustainability Indexes; SAM Sustainability Yearbook; FTSE4GOOD Index Series; FTSE KLD Europe, Asia Pacific and Global Sustainability
indexes (excluding the US Index); ECPI Ethical Index Euro and Ethical Index Global; Ethibel Excellence and Pioneer Indexes; Gold status in Business in the Community’s (BITC) Corporate
Responsibility Index (2009); and Stonewall Workplace Equality Index – ranked 42nd in the
top 100 employers in the UK.
Affiliations and engagements We work closely with leading organisations to share good practice, identify emerging issues and improve our performance. Here are just a few of the organisations we collaborated with in 2010:
CBI Climate Change Board; Carbon Disclosure Project; HRH Prince of Wales Accounting for Sustainability; ClimateWise; UNEP Finance Initiative; UN Global Compact and represented on UN Principles for
Responsible Investment and Caring for Climate working groups;
Consortium for Street Children; UN Women Empowerment Principles; Business in the Community; and ORC Global Diversity Forum.

Corporate responsibility continued
84
Aviva plc Annual Report and Accounts 2010
Key indicators CR Indicator 2007 2008 2009 2010 2010 target
Business ethics % of employees signing of receipt, understanding and acceptance of our Business Ethics Code
— —
96%
100% of employees
% of annual sign-off — — 90%
32%
100% of employees
Customers % of businesses that are in or above the upper quartile relative to the local market average
— 50% 50%
50%
Maintain or improve past performance
% of employees who rate us favourably on customer index — — 67% 69% Meet/exceed GFS benchmark (2010: 75%)
Environment % of remaining CO2 emissions offset annually 100% 100% 100%
100%
Offset remaining emissions CO2 at group level
CO2 emissions (tonnes) – gross* — 177,077 154,726 148,251
Reduce CO2 emissions by 5%
CO2 emissions (tonnes) – absolute* 127,002 122,791 104,351 127,685
CO2 emissions (tonnes) – relative* n/a n/a 128,976 127,685
Water consumption (m³) – absolute 851,070 843,750 751,750 690,369 Reduce water use by 4%
Waste generated (tonnes) – absolute 18,877 19,311 11,812* 12,042 Reduce waste generated by 4%
Proportion of recycled waste 88% 84% 79% 75% 80% or above
% of employees who feel that Aviva makes business choices that support the environment
— — 62% 71% Meet/exceed GFS benchmark (2010: 60%)
People % of women in senior management 22% 22% 22%
21%
Increase percentage of women in senior management group
% of employees who feel that Aviva is committed to attracting, developing and keeping a diverse workforce
— — 52% 62% Meet/exceed GFS benchmark (2010: 64%)
% of employees who feel that they are treated with respect, regardless of their position
— — 67% 69% New KPI
% of employees who feel we have created an environment where people with diverse backgrounds can succeed
— — — 73% Meet/exceed GFS benchmark (2010: 80%)
% of employees who rate us favourably on leadership index — — 64% 63% Meet/exceed GFS benchmark (2010: 71%)
% of employees who rate us favourably on engagement index — — 64% 63% Meet/exceed GFS benchmark (2010: 73%)
Suppliers Number of business unit suppliers, with material spend, signing Aviva’s Supplier Code of Conduct
— 233 adjusted
from 983
438
1,486
1,000
Number of detailed CR assessments of Aviva’s major suppliers — 30 in theUK
138globally
216 200 globally
Number of business units that have implemented and embedded use of ‘Supplier Hospitality register’ and ‘Register of Interests’
— 5 11 15 18
Community Amount of community investment £6.8m £9.6m £8.0m
£11.4m
Total community investment at/above previous year
% of employees participating in volunteering
— — 16% 17% Increase the % of employee participation in volunteering
Number of employee hours spent volunteering — 67,700 79,900 57,250 Increase the % of employee participation in volunteering
% of investment in Aviva ‘Street to School’ — — — 52% 50% of cash donations
% of employees who feel that Aviva does a good job of contributing to the communities in which we live and work
— — 62% 66% Meet/exceed GFS benchmark (2010: 62%)
*Notes on KPIs Gross emissions – Data according to Defra guidelines i.e. UK electricity rated as grid average but renewable recognised in other countries. Includes Solus for 2010 Absolute emissions – Data excluding the Defra guidelines rating UK renewable electricity as grid average. Includes Solus emissions for 2010 Relative emission – Restated 2009 emissions taking account of acquisitions and divestments that have occurred over the year and increased scope of reporting in 2010. Waste – 2009 waste has been restated based on availability of more accurate data.

85
Performance reviewCorporate responsibilityGovernanceShareholder informationFinancial statements IFRSFinancial statements MCEVOther information
Corporate responsibilityAviva plc Annual Report and Accounts 2010
Corporate responsibility continued
Met/exceeded 2010 target Missed 2010 target Change over year 2011 target Notes
n/a
100% of employees
Business ethics: This data excludes Delta Lloyd employees. While we aim for 100% of employees to sign the code on induction to the Company it is inevitable that some new businesses will take some time to implement this requirement. We are currently revising our business ethics code. From 2011 the code will require annual sign-off. Some businesses have this process in place already and we have reported this percentage here.
n/a
100% of employees
0
Maintain or improve past performance
Customers: Using NPS methodology we calculate the performance of businesses relative to their local market.
2% Meet/exceed GFS benchmark We have increased our performance on last year but are still below the external GFS benchmark for this KPI.
0%
Offset remaining CO2 emissions at group level
Environment: We want to show clearly that we have reduced our emissions as a result of energy management and behavioural change and not merely due to divestments. However, we also do not wish new businesses that we include in our reporting scope to detract from the progress we have made in our existing businesses. This data covers all employees as well as joint venture employees. Our reporting continues to evolve and improve to capture all areas of environmental data in all businesses.
(4)% Reduce CO2 emissions by 5% 22%
(1)% (8)% Reduce water use by 4%
2% Reduce waste generated by 4%
6% 80% or above
10% Meet/exceed GFS benchmark
(1)%
Increase percentage of women in senior management group
People: Data for women in senior management excludes Delta Lloyd. Whilst we have improved in most of these KPIs against our own performance, our targets are external benchmarks which we working towards achieving. 10% Meet/exceed GFS benchmark
2% Meet/exceed GFS benchmark
n/a Improve past performance (no
GFS benchmark)
(1)% Meet/exceed GFS benchmark (1)% Meet/exceed GFS benchmark +1048
KPI to be revised in 2011
Suppliers: We have increased the amount of suppliers signing the code of conduct, however, we have found that some suppliers are reluctant to sign a code as it is not a legal document. Therefore, we are implementing a code of behaviour alongside minimum contractual clauses for new contracts from Q2 2011, to address some of this issue. This data does not include European claims data. These KPIs will be revised in 2011 in light of our changing processes.
+78
KPI to be revised in 2011
-3
KPI to be revised in 2011
43%
Total community investment at/above previous year
Community: These KPIs exclude Delta Lloyd. The amount of volunteering hours has dropped significantly as we no longer pay a broker to find volunteering opportunities for us. We are exploring implementing an internal volunteering opportunities system throughout 2011.
1% Increase the % of employee participation in volunteering
(28)% Increase the % of employee participation in volunteering
New KPI 50%
4%
Meet/exceed GFS benchmark

Corporate responsibility continued
86
Aviva plc Annual Report and Accounts 2010
Accounting for Sustainability We also report our performance using Accounting for Sustainability’s connected reporting framework, which integrates financial and non-financial data to provide a comprehensive picture of our impacts. We were one of the first companies to help develop the framework and have used this approach for environmental reporting in our Annual Report and Accounts since 2007. We continue to explore ways to extend this framework and have included customer and community indicators since 2009.
We have reported the following indicators for 2010:
Developing communities; Greenhouse gas emissions; Waste; Resource usage; and Customer advocacy.
Developing communities Direct company impacts Our global investment in charitable and community development projects in 2010 was £11.4 million (2009: £8.0 million). This includes cash, time and in-kind donations as well as management costs calculated using the London Benchmarking Group (LBG) model4. We also helped leverage an additional £1.5 million of investment where our activity attracted further contributions from our wide network of stakeholders including employees.
000
hour
s
80
50
55
65
70
60
75
Community investment £m
07 0908 10
12
0
2
6
8
4
10
Community investment Employee volunteering hours
Our performance, strategy and targets Our global community development (CD) strategy, focusing on financial literacy, education and life trauma, aligns to our corporate vision and channels financial support and the expertise of our employees into projects where we can see positive societal impacts. Our total investment was £3.4 million higher than in 2009. Three key factors contributed to this; significant investment in our first Global CD and cause related marketing initiative Street to School which donated funds and used our marketing reach to raise awareness of the issue; improvement in the scope and accuracy of the way we record CD data according to LBG guidelines and the increasing engagement of our people in CD activity with 29% now involved in payroll giving. We delivered over 57,250 hours of volunteering in 2010. This is a drop back in volume due to the removal of paid intermediaries to broker opportunities and the limited volunteering options when working with vulnerable children. We are addressing this by providing more volunteering choice for employees in 2011. Overall we have a significant 4% uplift
4 See www.lbg-online.net for more information
in employees believing we act responsibly in our communities and 8% uplift (2009: 66%, 2010: 74%) in those believing our commitment to CR is genuine. Our flagship Street to School initiative to get young people off the streets and into education and training has started to deliver tangible benefits in engaging our people, impacting the lives of vulnerable young people and in creating the right brand associations for Aviva. Our clear focus on this programme, with at least 50% of CD activity happening in this sphere gives us the opportunity to make a deep and lasting difference. The Street to School programme is in operation in 17 markets and we have developed a rigorous measurement framework together with our partners to allow us to govern and demonstrate the activity, its inputs and outputs. From this we know that we have helped over 128,000 people in our programmes. We have seen a number of cause related marketing pilots comes to fruition and we will continue to push ahead with further cause related marketing around Street to School in 2011.
Indirect impacts We have taken the opportunity to partner with the Consortium for Street Children (CSC) to aid our ability to play our part in national and international advocacy activity as we know that legislative, policy and service delivery improvements will make the biggest difference to the most children. We have recently announced that we have seconded a senior Aviva Group director to the role of CEO of the CSC for the next 2 years. We are actively exploring and leveraging networks of interested parties, and their various capabilities, across public, third and private sectors as we seek means of non-competitive collaboration to achieve the recognition and realisation of street child rights, help deliver the Millennium Development Goals and increase the wellbeing of all in our global communities.
Greenhouse gas emissions Direct Company impacts Cash flow performance Through Aviva’s worldwide business operations in 2010, 127,685 tonnes of carbon dioxide (CO2) or equivalent were emitted into the atmosphere. To compensate for these emissions we purchased carbon offsets to 105% from the voluntary carbon market at a total cost in the region of £462,500. This is the fourth year in which we have addressed the issue in this way, complementing our internal carbon reduction programme of employing energy-efficient technologies and sourcing renewable electricity where the zero carbon nature of the electricity is recognised as a benefit to the Company.

87
Performance reviewCorporate responsibilityGovernanceShareholder informationFinancial statements IFRSFinancial statements MCEVOther information
Corporate responsibilityAviva plc Annual Report and Accounts 2010 Corporate responsibility continued
The cost of offsetting the 2010 emissions has, for the first time, been recharged to the areas of business that have created the emissions on a ‘polluter pays’ principle. This is as a result of UK HMRC’s reversal of the VAT applicable to offsets from the voluntary market. This will provide a stronger internal financial driver to reduce emissions within the business. Due to the size and nature of the business operations, Aviva UK will fund the majority of the offsetting process at 54%. In July 2010, the main UK electricity contract for zero emission electricity ended. As the UK government advised in 2008 that the benefit of the related zero emissions are not granted to the purchasing company, we sought the best value grid average electricity contract, taking into account the Climate Change Levy and will, going forwards, purchase carbon offsets to account for the emissions from this. As part of the LEED accreditation process for Aviva US’s new head office, and as renewable electricity was not able to be sourced, Aviva committed to purchasing 4.4 gigawatt hours of Renewable Energy Certificates to compensate for 70% of electricity emissions over the first two years of their building occupancy. With the modification of the UK Carbon Reduction Commitment Energy Efficiency Scheme in which Aviva is included, the climate change levy and the cost of purchasing carbon offsets, we have calculated an internal cost of carbon as set out in the table below:
Aviva’s CO2 emissions 000 tonnesCO2 tonnes CO2 offset CO2 tonnes per employee
06
125,
400
07
127,
002
125,
400
127,
002
08
122,
791
122,
791
09
104,
351
104,
351
10
127,
685
127,
685
140
0
60
80
20
40
100
120
2.8
0
1.2
1.6
0.4
0.8
2.0
2.4
Aviva plc – operational carbon footprint covering 100% of employees GHG Emissions data from 1 Jan 2010 to 31 Dec 2010
Tonnes CO2e 2010 2009 Baseline
year 2006
Scope 1 63,784 42,224 52,847 Scope 2* 68,628 81,994 90,591 Scope 3 15,839 30,508 21,952 Gross CO2 emissions* 148,251 154,726 165,390 Absolute CO2 footprint 127,685 104,351 125,400 Carbon offsetting (133,049) (109,568) (132,000) Total net emissions (6,336) (5,217) (6,600)
* Data according to Defra guidelines i.e. UK electricity rated as grid average but renewable recognised in other countries
Scope 1 – operational emissions from owned sources e.g. gas, vehicle fleet as part of product/service. Scope 2 – operational emission from non-owned sources e.g. electricity. Scope 3 – business activity emissions from non-owned sources – e.g. business travel
Performance, strategy and targets Aviva’s gross carbon emissions have reduced again this year by 4%; a reduction for the third year running. Our absolute carbon footprint has increased as a result of us purchasing grid average electricity in the UK from July 2010. The amount of renewable/zero emission electricity on a worldwide basis has reduced accordingly from 63% in 2009 to 39% in 2010. Our green IT programme focuses on reducing IT related emissions as it is estimated 40% of our electricity consumption is IT-related. We are currently looking at ways that we can more
accurately benchmark this impact and so further identify reduction measures we can employ. The other aspect is our work to decarbonise our communications through the use of telepresence, webex and MS Office Communicator. In 2010 we held 1,151 meetings (2009: 1,030) via telepresence, accommodating a total of 10,853 attendees over a total of 5,505 meeting hours (2009: 4,927). 43% of those meetings had at least one Executive Committee member attending. Similarly 9,000 meetings (2009: 5,450) were held over webex providing training, and hosting collaborative meetings. This equates to 30,627 hours (2009: 24,000) an increase of 28%. With the migration to the One Aviva model in Europe, and Dublin as the regional head office, there has been an inevitable increase in air travel within the Europe region. Air kilometres have increased from 5,116,951km in 2009 to 14,307,089km in 2010. In order to address this increase, Aviva Europe has installed new telepresence systems in Paris, Madrid, Warsaw, Dublin and Milan; along with a further four high-definition video conferencing suites in Paris, Warsaw, Turkey and Russia. The investment in these suites along with the roll out of MS Office Communicator should provide a realistic future way of working. We have recently appointed a new travel agency to provide travel services for the following Aviva business: UK, US, Ireland, Canada, France, Spain, Poland and Dubai. This new service will include management information on air kilometres and CO2 emissions to provide a further improvement in the consistency and quality of reporting. Our focus for energy efficiency has been electricity consumption in 2010 and will be again in 2011. 1E Nightwatchman, software which switches off networked laptops, PCs and monitors remotely, was trialled at one location in the UK and demonstrated a 6.5% reduction in electricity usage. The cost benefit analysis of this shows a projected payback period of one year five months, a saving in electricity costs of £427,000 and 2,800 tonnes of carbon per annum. This has therefore been rolled out across the UK and will be implemented in Europe and the Asia Pacific region in 2011. For one of our larger UK offices we have trialled Powerperfector voltage optimisers which have reduced electricity consumption by 8% per annum for that site, saving £692,000 and 324 tonnes CO2. Our Group annual CO2 reduction target still stands at 5% with a long term reduction of 30% by 2020 compared to our 2006 baseline. We have achieved an 10% reduction to date.
Products/suppliers/investors The demand by customers for green products is still low, the cost of the insurance product being paramount. In the UK we have therefore turned our attention to reducing the environmental impact of our claims supply chain. We continue to roll out the ‘repair over replacement’ process working with our suppliers and our own accident repair centres. We commissioned a report to ascertain the benefits of this revision in the process and through a focus on reducing waste, sustainability became the route to the following benefits:
ongoing cost reduction; the supplier reducing their operational carbon footprint
and energy bills by 34%; wasted parts were reduced by 42%; increased customer satisfaction (quicker to repair than
waiting for replacement parts); and secured 30 jobs whilst increasing the skill set of the
workers.

Corporate responsibility continued
88
Aviva plc Annual Report and Accounts 2010
The fuel consumption of the RAC fleet has reduced further from 9.1 million litres to 7.4 million litres, a reduction of 19%. This is still due in part to the economic downturn and customers not using their cars as much, the use of more accurate satellite navigation systems in the vehicles and more technical staff in the call centres to talk customers through simple repairs. This means they can continue their journey sooner and breakdown assistance mileage is reduced. We are also making use of our local knowledge of reliable garages to reduce towing mileage and achieve a comprehensive repair quickly. These changes in our processes, together with speed limiters and minimising our carrying load, have all reduced the carbon intensity of our roadside breakdown service whilst still providing the highest level of customer satisfaction.
Indirect impacts We are conscious of the potential impacts that climate change has on our business. We have been a part of ClimateWise, the insurance sector collaborate forum on climate change, on workstreams around sustainable claims management and on investigating the linkages of climate change and morbidity rates. Both these workstreams will continue into 2011. We have also invested in pioneering technology to measure surface water flooding using a unique flood model that can estimate the damage freak downpours can inflict on homes and businesses in the UK. The research and modelling was identified following the rain storms events in the summer of 2007. Working in partnership with hydrologists JBA Consulting, the map has been developed using laser technology that recognises undulations in the ground as small as15cms. The map has then been “flooded” with a simulation of a 200-year rain storm event and a digital model created to show where the water falls and pools. Previously the map focused on coastal and river flooding risk together with historical claims data. The additional data means the model now addresses the ever-growing threat that freak downpours can have on our towns and cities. It is for insurance purposes only and will enable the underwriter to more accurately assess each customer's individual circumstances. We consider the financial risk climate change poses for Aviva and accordingly build this into our levels of capital reserves and risk management processes. We have completed a carbon footprinting exercise for the properties we own through our Property Fund managed by Aviva Investors in 2008. Aviva Investors’ European Renewable Energy Fund is targeting gross investment of approximately €1 billion and is currently open for investment.
Industry benchmark information Carbon Disclosure Project Score 70 out
of 100 in FTSE Global 500 and FTSE350; and BREEAM5 minimum ranking ’Good‘ for new build and
refurbishment.
5 Building research establishment environmental assessment methodology
Waste Direct company impacts Hazardous and non-hazardous waste Total disposal cost for hazardous and non-hazardous waste in the UK was £596,000 (2009: £748,000), which includes UK landfill tax.
Conservation investment Total capital expenditure for storage and recycling in the UK was zero (2009: £zero).
Aviva’s waste 000 tonnesTotal waste (tonnes) Recycled (tonnes) Total waste per employee (kgs)
06
12,6
22
19,7
19
0716
,672
18,8
77
08
16,2
22
19,3
11
09
9,33
1
11,8
12
10
9,49
0
12,0
42
25
0
5
10
15
20
450
0
90
180
270
360
kg/e
mpl
oyee
Performance, strategy and targets 2010 saw a slight increase in our overall operational waste of 2%. Aviva US has implemented a state of the art recycling process along with a solar powered waste compactor for the general waste which they are currently unable to recycle. The UK business continues with its plans to reach its zero-to-landfill target by 2015 with an increase in its recycling rate to 88.9% as a proportion of total operational waste. We have worked with our IT supplier to remove the polystyrene packaging in which the equipment is delivered, increasing our IT waste recycling rate to 98%. Aviva’s Group head office was awarded the prestigious Chairman's Cup in the City of London’s Clean City Awards in January 2011. This is the first time that any company has won the cup twice. It signifies our achievements in waste reduction over the past year and recognises our commitment and leadership in waste management.
Indirect impacts Products/suppliers/investors In an effort to reduce the amount of waste generated through our claims fulfilment processes, we have sought to apply the ‘repair over replace’ principle to domestic property claims following water damage. Previously this consisted of ‘stripping out’ render and plaster on walls and ceilings. We target minimisation of strip out of the property affected by water damage through the introduction of a Repair Order to Aid Drying (ROTAD) whereby the suppliers are required to complete a documented request on a property prior to drying. This monitoring process has significantly reduced the instance of strip outs.
Industry benchmark information 200kg of waste per employee per year; and recycling rate of 60–70% (BRE Office toolkit).
Targets annual 4% reduction in total waste; annual recycling rate greater than 80%; and long-term target – zero to landfill for UK operations by
2015 and worldwide by 2020.

89
Performance reviewCorporate responsibilityGovernanceShareholder informationFinancial statements IFRSFinancial statements MCEVOther information
Corporate responsibilityAviva plc Annual Report and Accounts 2010 Corporate responsibility continued
Resource usage Direct Company impacts Water The operating cost of water usage was £1.6 million in 2010 (2009: £1.3 million).
Energy intensity Total cost of buildings-related energy in 2010 was £17.7 million (2009: £17.7 million). The equivalent cost per m2 is £12.
Paper usage We currently do not track the cost of paper on a global basis.
Environmental incidents During 2010 there were no environmental incidents as a result of our operations (2009: none).
860
660
700
740
820
Aviva’s water consumption 000 m3
780
20
12
8
16
0
4
m3 /
empl
oyee
Water consumption m3 Water consumption m3 per employee
06
736,
455
07
851,
070
08
843,
750
09
751,
750
10
690,
369
Performance, strategy and targets Water consumption reduced by 8% in 2010, exceeding our target of 4%. The UK business, having successfully trialled ‘no-water’ urinals in one location has now rolled the process out to all other suitable locations. In locations where ‘low-water’ urinals had not already been installed there was a 38% reduction in water consumption, or 20 million litres across the UK property portfolio, and a saving of £40,000 per annum. In respect of paper the UK business has replaced 432 large photocopiers with 200 smaller multifunctional devices. 10% of all printers were also removed, meeting the target of 1,500 printers by the end of 2010. Aviva US has now received LEED Gold Certification for the new 33,444m2 head office in Des Moines from the US Green Buildings Council. It is one of only five buildings of its size or larger in the US to achieve this designation. The building, accommodating 1,300 employees, is constructed from locally sourced material and includes rainwater run-off and collection, food waste composting, natural lighting, motion sensors and auto-dimming in offices and conference rooms.
Indirect impacts Products/suppliers/investors Aviva UK has also signed up to the Royal Mail’s Responsible Mailing programme for direct marketing mail. This ensures that the paper used in the marketing is FSC accredited and that a recycling message is included on each piece of material. By 2010 year end 3.9 million items of direct mail had been delivered through this programme. Royal Mail also reduces its handling costs as part of this initiative providing a saving of £11, 000. The UK business is also using phone text messaging, following a Met Office severe weather warning for storm or extreme weather temperatures, to inform customers of the precautions they should take to safeguard their property and
cars. Texts to 500,000 customers went out to warn them of the perils of the arctic conditions in December. Aviva’s new global brand campaign ‘You are the Big Picture’ required that the building wraps could be recycled in line with the recycling infrastructure available. Some were turned into biofuel whilst others were made into traffic cones and plastic kerbs. The energy used to illuminate the buildings and image projectors was calculated and CO2 emissions were offset; a total of 113 tonnes. The marketing and IT team in Singapore worked together to build a system to launch our general insurance products in 2010. The products are sold through an online system (the first in Singapore). When customers purchased their policy, they are given the option to ‘Go Green’ and if they chose this option the policy is sent to them electronically, reducing the need for printing. Since the launch of this product, 93% of customers have requested this option out of a total of 9,992 policies sold. Each policy is approximately 24 pages saving 1.2 tonnes of paper.
Industry benchmark information Water: 7.7m3 per employee per year (National Water
Demand Management Centre); and Office paper: good practice 4,000-5,000 sheets per
employee per annum (Gartner Research).
Customer advocacy Direct Company impacts At Aviva, the Net Promoter Score® is our key customer metric. This measure is widely regarded as a predictor of future growth, with strong correlations to retention, repeat purchase and referrals, suggesting that using this metric to build advocacy will have a positive impact on business performance. This KPI is derived from the annual Relationship NPS survey conducted across all markets and comparing the local Aviva results with the local competition. Engaged employees deliver better customer experiences which drive greater shareholder value. By deepening our understanding of the relationship between our NPS results and actual customer behaviour we will prove that building advocacy by consistently delivering a customer experience aligned to our brand promise will see our customers stay longer, buy more, recommend us to others and cost less to serve; which all have an impact on our overall ability to generate capital.
Non-financial indicator Businesses’ performance vs local benchmark
Performance v market average – Net Promoter Score©
% met or exceeded benchmark% below benchmark % in upper quartile
1009
100
0
20
60
40
80

Corporate responsibility continued
90
Aviva plc Annual Report and Accounts 2010
Our performance, strategy and targets The 2010 Relationship NPS survey showed results broadly consistent with 2009. We maintained the proportion of businesses operating in the upper quartile (relative to local competition) despite a generally improving market environment. Across our regions:
In North America, we have seen strong improvements in the US business.
In Asia, China and Korea have outperformed when compared to the local market benchmark. There were also strong improvements in the Indian business.
In Europe, the majority of markets continue to outperform when compared to the local market benchmark.
The UK results are largely consistent with 2009. The RAC maintains its market leadership position while others remain behind the market benchmarks.
Our long-term target is for all markets to be in the upper quartile relative to their local competition and so building customer advocacy is one of the primary objectives for the business as a whole. Using NPS as the discipline to listen to our customers and improve the experience we deliver to them will allow us to improve this metric and in turn our financial performance. We have developed a framework around Net Promoter that outlines the attributes of world-class customer focus and each market is making progress against this. For example:
Our UK General Insurance business has implemented a state-of-the-art Transactional NPS system which enables the business to survey customers that have recently had contact, on a daily basis. This system allows the business to not only track how it is delivering to customers more frequently but also re-contact unhappy customers immediately to try and fix the problem.
The US business saw significantly improved scores this year through single-minded focus on the main driver of detraction in 2009. By testing a number of initiatives designed to build a stronger relationship with their customers they were able to identify the ones that would make the biggest difference.
Indirect impacts Building Aviva around our customers requires that we work as One Aviva – all employees have a role to play in delivering a consistent experience to our customers – and this will be a key focus for 2011. Listening to our customers is the first step in being able to deliver our brand promise. One of the major mechanisms we have to do this is our annual NPS survey discussed above; another is our global Consumer Attitudes to Savings survey, which covers a nationally representative sample of consumers in key markets. The results of this study have been used with policy makers across our markets as well as being used to drive product and proposition development for our customers. Equally important in ensuring that we are delivering the customer promise is that we act on what our customers have told us. One way we can do this is through structured action planning programmes as a result of surveying customers, as we do with our Relationship NPS results. Another way is to harness the engagement of our employee base through our open innovation competition, the Customer Cup. This is a programme designed to enable all employees to find innovative solutions that will deliver prosperity and peace of mind to our customers. We are also actively exploring challenging topics facing our customers globally and their implications for future prosperity as well as our industry:
Aviva Europe’s ‘Mind the Gap’ report explored the adequacy of future pension provision by systematically quantifying Europe’s annual ‘pensions gap’. Among other things, the report called on the European Commission to create a European Quality Standard for Pensions to restore consumer confidence in pensions savings vehicles, and to establish and monitor a European Pensions Savings Target so that national governments are encouraged to rebalance their pensions systems with greater funded schemes.
We also set up the Future Prosperity Panel in 2010, a group of independent international thinkers, to develop fresh thinking on the whole area of saving and how this can build prosperity globally.
We do receive customer complaints and these are dealt with by our customer complaints management system. Further details of our customer related risks are found within our Customer Policy at www.aviva.com/corporate-responsibility/our-cr-policy/#customer

91
Performance reviewCorporate responsibilityGovernanceShareholder informationFinancial statements IFRSFinancial statements MCEVOther information
Corporate responsibilityAviva plc Annual Report and Accounts 2010 Corporate responsibility continued
Independent assurance statement The Aviva corporate responsibility content on pages 76-90 (the CR Report) has been prepared by the management of Aviva, who are responsible for the collection and presentation of information reported. Our responsibility, in accordance with management’s instructions, is to provide a limited assurance engagement on the CR Report content and on selected environmental and community investment data presented in the CR Report. We do not accept or assume any responsibility for any other purpose or to any other person or organisation. Any reliance any such third party may place on the CR Report is entirely at its own risk.
What we did to form our conclusions Our assurance engagement has been planned and performed in accordance with ISAE3000 and to meet the requirements of a Type 2 assurance engagement as defined by AA1000AS (2008) . The AA1000AS (2008) assurance principles of Inclusivity, Materiality and Responsiveness have been used as criteria against which to evaluate the CR Report. To form our conclusions on the CR Report we undertook the steps outlined below: 1. Interviewed a selection of executives and senior managers
at Aviva’s Group headquarters in London and selected Aviva businesses to understand the current status of corporate responsibility activities, and progress made during the reporting period
2. Reviewed Aviva’s approach to stakeholder engagement through interviews with a selection of employees at Aviva businesses in the UK, India, USA and Group headquarters and reviewed selected associated documentation
3. Reviewed a selection of external media reports and selected corporate level documents relating to corporate responsibility aspects of Aviva’s performance to test the coverage of topics within the CR Report
4. Reviewed Aviva’s processes for determining material issues to be included in the CR Report
5. Reviewed the collation and aggregation of selected environmental and community investment performance data at Aviva businesses in the UK, India, USA and Group
6. Reviewed information or explanations about selected data, statements and assertions regarding Aviva’s corporate responsibility performance
Level of assurance Our evidence gathering procedures were designed to obtain a limited level of assurance (as set out in ISAE3000) on which to base our conclusions. The extent of evidence gathering procedures performed is less than that of a reasonable assurance engagement (such as a financial audit) and therefore a lower level of assurance is provided.
Limitations of our review Our review of data processes included the following data sets: environmental and community investment. We did not review environmental or community investment performance data for years prior to 2010.
1 International Federation of the Accountants’ International Standard for Assurance Engagements Other Than Audits
or Reviews of Historical Financial Information (ISAE3000).
Our conclusions On the basis of our review we provide the following conclusions on the CR Report in relation to each of the AA1000AS (2008) assurance principles, overall plausibility and the completeness and accuracy of environmental and community investment performance data. Our conclusions should be read in conjunction with the above section on ‘What we did to form our conclusions’.
Inclusivity Has Aviva been engaging with stakeholders across the business to further develop its approach to corporate responsibility?
We are not aware of any key stakeholder groups that have been excluded from dialogue.
We are not aware of any matters that would lead us to conclude that Aviva has not applied the inclusivity principle in developing its approach to corporate responsibility.
Materiality Has Aviva provided a balanced representation of material issues concerning its corporate responsibility performance?
With the exception of the subject areas listed below, we are not aware of any material aspects of Aviva’s corporate responsibility performance which have been excluded from the CR Report.
We consider that Aviva could have covered the following subject areas in more depth in the CR Report: – The role of Aviva Investors in voting on corporate
responsibility disclosures and driving greater transparency in reporting.
– The corporate responsibility challenges of growing Aviva businesses in developing countries.
Nothing has come to our attention that causes us to believe that Aviva management has not applied its processes for determining material issues to be included in the CR Report.
Responsiveness Has Aviva responded to stakeholder concerns?
We are not aware of any matters that would lead us to conclude that Aviva has not applied the responsiveness principle in considering the matters to be reported.
Performance information How plausible are the statements and claims within the CR Report?
We are not aware of any inconsistencies in the assertions made with regards to performance and achievement.
How complete and accurate is the environmental and community investment data in the CR Report?
With the exception of the limitations identified in the CR Report, we are not aware of any material reporting units that have been excluded from Group data.
Nothing has come to our attention that causes us to believe that the data relating to the above topics has not been collated properly from Group-wide systems.
We are not aware of any errors that would materially affect the data as presented in the CR Report.
1 AA1000AS (2008) – A second edition of the AA1000 assurance standard from the Institute of Social and Ethical Accountability.

Corporate responsibility continued
92
Aviva plc Annual Report and Accounts 2010
Observations on particular aspects of our engagement Our observations and areas for improvement will be raised in a report to Aviva management. Selected observations are provided below. These observations do not affect our conclusions on the CR Report set out above.
Aviva has introduced a data collection tool, Credit360, as a means of standardising the environmental and community data collation process. Aviva should consider improving the guidance for the collation and reporting of environmental performance data to enhance consistency across the Group.
The CR Report includes examples of corporate responsibility performance in key markets. In future Reports it will be important to use these examples to show a balanced picture of performance, including challenges faced in relation to corporate responsibility across all markets.
Our independence As auditors to Aviva p.l.c., Ernst & Young are required to comply with the independence requirements set out in the Auditing Practices Board’s (APB) Ethical Standards for Auditors. Ernst & Young’s independence policies apply to the firm, partners and professional staff. These policies prohibit any financial interests in our clients that would or might be seen to impair independence. Each year, partners and staff are required to confirm their compliance with the firm’s policies.
Our assurance team Our assurance team has been drawn from our global Climate Change and Sustainability Services Practice, which undertakes engagements similar to this with a number of significant UK and international businesses. The work has been led and reviewed by a Lead Sustainability Assurance Practitioner. Ernst & Young LLP London 2 March 2011

Performance reviewCorporate responsibilityGovernanceShareholder informationFinancial statements IFRSFinancial statements MCEVOther information
Governance
Aviva plc Annual Report and Accounts 2010
93
Governance
In this section Page
Board of directors 94
Executive management 96
Directors’ report 97
Corporate governance report 100
Nomination committee report 109
Audit committee report 110
Risk committee report 112
Corporate responsibility committee report 114
Directors’ remuneration report 115

94
Aviva plc Annual Report and Accounts 2010 Board of directors
1. Lord Sharman of Redlynch OBE Chairman (Age 68) Appointed to the Board in January 2005 and became chairman in January 2006. Currently an independent non-executive director of BG Group plc (oil and gas) and Reed Elsevier plc (publishing). Former chairman of Aegis Group plc (media services) and KPMG International (auditors). Former deputy chairman of Group 4 Securicor plc (and former chairman of Securicor plc) (security services), former member of the supervisory board of ABN AMRO Holding N.V. (banking) and a former independent non-executive director of Young & Co.’s Brewery plc (hospitality) and AEA Technology plc (commercial/technology). Chairman of the Board and Nomination Committee and member of the Corporate Responsibility Committee.
2. Andrew Moss Group chief executive (Age 53) Appointed to the Board in May 2004. Joined as group finance director and became group chief executive in July 2007. Previously director of finance, risk management and operations at Lloyd’s of London (insurance) and formerly held a number of senior management positions at HSBC plc (banking). Member of the Corporate Responsibility and Nomination committees and member of the supervisory board of Delta Lloyd N.V.
1 2 3
10
7
13
11
8
12
9
4 6 5

95
Performance reviewCorporate responsibilityGovernanceShareholder informationFinancial statements IFRSFinancial statements MCEVOther information
Governance
Aviva plc Annual Report and Accounts 2010 Board of directors continued
3. Patrick Regan Chief financial officer (Age 45) Appointed to the Board in February 2010 as chief financial officer. Previously group chief financial officer and group chief operating officer at Willis Group Holdings Limited (insurance broking). Formerly group financial controller of RSA Insurance Group plc (insurance) and finance and claims director, UK general insurance of AXA Insurance (insurance). He also held a number of senior management positions at GE Capital (financial services) and specialised in corporate finance and investigations at Grant Thornton (professional services). Member of the supervisory board of Delta Lloyd N.V.
4. Mark Hodges Executive director (Age 45) Appointed to the Board in June 2008. Joined Norwich Union in January 1991 and held a number of senior roles within the finance function before becoming finance director of Norwich Union Insurance in 1998, managing director of Norwich Union General Insurance in 2005 and chief executive of Norwich Union Life, the Group’s long-term savings business in the UK, in 2006. Appointed chief executive of Aviva UK, comprising Aviva UK Life (formerly Norwich Union Life), and Aviva UK General Insurance (formerly Norwich Union Insurance), the Group’s insurance and motoring services business in the UK, in January 2010.
5. Igal Mayer Executive director (Age 49) Appointed to the Board in January 2011. Joined the Group in May 1989 as assistant vice-president/controller of Canadian General Insurance Group. Formerly chief executive of Aviva North America, chief executive of Aviva UK General Insurance and chief executive officer, chief financial officer and executive vice-president of Aviva Canada. Previously finance director of Norwich Union Insurance and managing director, London Markets, for CGU Insurance in London.
6. Mary Francis CBE Independent non-executive director (Age 62) Appointed to the Board in October 2005. Currently senior independent director of Centrica plc (utilities) and a non-executive director of Cable & Wireless Communications plc (telecoms). A senior adviser to Chatham House and chair of governors, James Allen’s Girls’ School. Formerly a senior civil servant, director general of the Association of British Insurers and a non-executive director of the Bank of England, Alliance & Leicester plc (banking), St Modwen Properties plc (property development) and the Almeida Theatre Company Limited. Chairman of the Risk Committee and a member of the Audit, Nomination and Remuneration committees.
7. Richard Karl Goeltz Senior independent non-executive director (Age 68) Appointed to the Board in May 2004. Currently a non-executive director of the Warnaco Group, Inc. (clothing), the New Germany Fund (investment trust), the Central Europe and Russia Fund (investment trust), the European Equity Fund (investment trust) and a member of the Council and Court of Governors of The London School of Economics and Political Science. Former vice-chairman and chief financial officer of American Express Company (financial services) and director and chief financial officer of NatWest Group plc (banking). Former non-executive director of Delta Air Lines, Inc. (transport) and Federal Home Loan Mortgage Corporation (Freddie Mac) (financial services) and a former member of the Accounting Standards Board (UK). Member of the Audit and Nomination committees.
8. Euleen Goh Independent non-executive director (Age 55) Appointed to the Board in January 2009. Currently non-executive director of DBS Group Holdings Ltd, DBS Bank Limited (banking), Singapore Airlines Limited (aviation), Singapore Exchange Limited and the Singapore Chinese Girls’ School. Chairman of the Accounting Standards Council of Singapore and the Singapore International Foundation. Former chief executive officer of Standard Chartered Bank in Singapore (banking). Member of the Audit and Corporate Responsibility committees.
9. Michael Hawker AM Independent non-executive director (Age 51) Appointed to the Board in January 2010. Currently a non-executive director of Macquarie Bank Limited, Macquarie Group Limited (banking) and Australian Rugby Union, Chairman of the George Institute and a member of the Advisory Council at General Enterprise Management Services International Limited (GEMS), the Hong Kong-based private equity firm. Formerly chief executive and managing director of Insurance Australia Group Limited (insurance). Member of the Risk Committee.
10. Carole Piwnica Independent non-executive director (Age 53) Appointed to the Board in May 2003. A member of the New York and Paris Bars. Currently managing director of Naxos UK (private equity), a non-executive director of Amyris Biotechnologies, Inc. (renewable products), Sanofi-aventis (healthcare products) and Eutelsat Communications (satellite operator). Formerly a non-executive director of Dairy Crest Group plc (dairy products), Toepfer International GmbH (trading) and a member of the biotech advisory board of Monsanto (biotechnology). Former chairman of Amylum Group (agricultural/ industrial) and non-
executive director and vice-chairman of Tate & Lyle plc (agricultural/industrial) and a non-executive director of S A Spadel N.V. (food and beverages). Chairman of the Corporate Responsibility Committee and member of the Remuneration Committee.
11. Leslie Van de Walle Independent non-executive director (Age 54) Appointed to the Board in May 2009. Currently chairman of SIG plc (construction products), non-executive director of DCC plc (business support) and La Seda de Barcelona, S.A. (plastic packaging). Formerly chief executive officer of Rexam plc (packaging), executive vice-president of retail for oil products and head of oil products, a division of Shell Europe, Royal Dutch Shell plc and non-executive director of Aegis Group plc (media services). Formerly held a number of senior management positions with Cadbury Schweppes plc (consumer goods) and United Biscuits Limited (consumer goods). Member of the Remuneration and Risk committees.
12. Russell Walls Independent non-executive director (Age 67) Appointed to the Board in May 2004. Currently non-executive director of Signet Jewelers Limited (retail), treasurer and trustee of The British Red Cross and a member of the Finance Commission of the International Federation of the Red Cross. Former group finance director of BAA plc (transport), Wellcome plc (pharmaceuticals) and Coats Viyella plc (textiles). Former senior independent non-executive director of Stagecoach Group plc (transport) and Hilton Group plc (leisure) and a former non-executive director of Delphic Diagnostics Limited (medical), and the Mersey Docks and Harbour Company (transport). Chairman of the Audit Committee and a member of the Nomination and Risk committees.
13. Scott Wheway Independent non-executive director (Age 44) Appointed to the Board in December 2007. Currently a strategic advisor to Best Buy Co., Inc. (retail services). Formerly chief executive officer of Best Buy Europe Distributions Limited (retail services). Former director of The Boots Company plc (now known as The Boots Company Limited) (pharmacy) and managing director of Boots the Chemist at Alliance Boots plc. Formerly held a number of senior executive positions at Tesco plc (retail services). Chairman of the Remuneration Committee and member of the Corporate Responsibility Committee.

96
Aviva plc Annual Report and Accounts 2010 Executive management
Andrew Moss Group chief executive (Age 53) See page 94
Patrick Regan Chief financial officer (Age 45) See page 95
Mark Hodges Chief executive, Aviva UK (Age 45) See page 95
Igal Mayer Chief executive, Aviva Europe (Age 49) See page 95
John Ainley Group human resources director (Age 54) Joined the Group in 1999. Formerly held senior HR positions with WH Smith plc, ICL plc and General Electric plc. Previously Group HR Director for Norwich Union plc and HR Director for Norwich Union Insurance and Norwich Union Life. Holds a Law degree and is a Companion of the Chartered Institute of Personnel Development.
Alain Dromer Chief executive, Aviva Investors (Age 56) Joined the Group in September 2007. Formerly global head of group investment businesses at HSBC, senior executive vice-president and head of asset management and insurance at Credit Commercial de France and director of capital markets at La Compagnie Financiére Edmond de Rothschild. Formerly at the French Treasury in the Ministry of Finance and the French Institute for Statistics and Economic Studies. Educated at l’École Polytechnique, Paris and l’École Nationale de la Statistique l’Administration Économique, Paris.
Richard Hoskins Chief executive, Aviva North America (Age 46) Joined the Group in 2009. Formerly executive vice-president and chief financial officer of Aviva North America. Previously executive vice-president and chief financial officer for Old Mutual US and acting group finance director and deputy group finance director for Old Mutual plc, London. Formerly head of National Australia Insurance Services, a subsidiary of National Australia Bank’s UK operations and chief financial officer of their European wealth management business. Previously held several senior management roles in Sydney at Lend Lease Corporation, Qantas Airways Limited and Deloitte and Touche. Holds a Bachelor of Arts degree in Business Studies from Sheffield University and is a Member of the Institute of Chartered Accountants of England and Wales.
Simon Machell Chief executive, Aviva Asia Pacific (Age 47) Joined the Group in 1994. Formerly chief executive of Norwich Union Insurance and managing director of RAC plc. Previously held positions with Ernst & Young LLP and Legal & General Group plc. Holds a BA Honours in Economics from the University of Durham and is a Fellow of the Institute of Chartered Accountants of England and Wales.
Amanda Mackenzie Chief marketing and communications officer (Age 47) Joined the Group in 2008. Currently a non-executive director of Mothercare plc. Formerly commercial and marketing director for British Gas plc and has 25 years of experience in the marketing and advertising profession. Holds a Bachelor of Science degree in Psychology from the University of London and is a graduate of the INSEAD advanced management programme. She is a Fellow of the Royal Society of Arts and the Marketing Society and is a governor of the National Youth Orchestra. She is also a member of the Lord Davies inquiry into women on boards and the Cabinet Office review of the Central Information Office.
Robin Spencer Chief risk officer (Age 41) Joined the Group in 1995. Formerly chief executive officer of Aviva Canada, chief financial officer of Aviva Canada and held various senior management positions in the finance function of Norwich Union and was finance director for London & Edinburgh Insurance Company Limited. Previously spent five years with Procter & Gamble Limited. Holds an MA in Economics from Aberdeen University and is a chartered management accountant. Former chairman of Canada’s Property and Casualty Insurance Compensation Corporation.

97
Performance reviewCorporate responsibilityGovernanceShareholder informationFinancial statements IFRSFinancial statements MCEVOther information
Governance
Aviva plc Annual Report and Accounts 2010 Directors’ report
The directors submit their Annual Report and Accounts for Aviva plc, together with the consolidated financial statements of the Aviva Group of companies, for the year ended 31 December 2010. The Companies Act 2006 requires the directors to present a ‘business review’ in this Directors’ Report. The requirement is for the Company to set out in this report, a fair review of the business of the Group during the financial year ended 31 December 2010, including an analysis of the position of the Group at the end of the financial year and the trends and factors likely to affect the future development, performance and position of the business. The contents of this Directors’ Report, together with the Performance review on pages 17 to 74, the Corporate Responsibility Report on pages 75 to 92, Shareholder information on pages 137 to 166 (which includes the risks relating to our business), the Corporate Governance Report on pages 100 to 108, and the Directors’ Remuneration Report on pages 115 to 136 constitute the business review and are therefore incorporated into this Directors’ Report by reference. Details of material acquisitions and disposals made by the Group during the year are contained in note 3 to the consolidated financial statements IFRS.
Results The Group results for the year are shown in the consolidated income statement on page 183.
Dividends The directors are recommending a final dividend of 16.00 pence per ordinary share (2009: 15.00 pence), which, together with the interim dividend of 9.50 pence per ordinary share paid on 17 November 2010 (2009: 9.00 pence), produces a total dividend for the year of 25.5 pence per ordinary share (2009: 24.00 pence). The total cost of ordinary dividends paid in 2010, was £681 million (2009: £775 million). Subject to shareholder approval at the 2011 Annual General Meeting, the final dividend for 2010 will be paid on 17 May 2011 to all holders of ordinary shares on the Register of Members at the close of business on 25 March 2011 (and approximately five business days later for holders of American Depositary Receipts).
Share capital and control The issued ordinary share capital of the Company was increased by 53,537,268 ordinary shares during the year. 722,968 shares were allotted under the Group’s employee share and incentive plans and 52,814,300 shares were allotted under the Aviva Scrip Dividend Scheme for the May 2010 and November 2010 dividends. At 31 December 2010 the issued ordinary share capital totalled 2,820,148,642 shares of 25 pence each and the issued preference share capital totalled 200 million shares of £1 each. Accordingly, the issued ordinary share capital constituted 78% of the Company’s total issued share capital and the issued preference share capital constituted 22% of the Company’s total issued share capital at 31 December 2010. All the Company’s shares in issue are fully paid up and the ordinary and preference shares have a premium and standard listing respectively on the London Stock Exchange. The Company is listed on the New York Stock Exchange (NYSE) in the form of American Depositary Shares, referenced to ordinary shares, under a depositary agreement with Citibank. Details of the Company’s share capital and shares under option at 31 December 2010 and shares issued during the year are given in notes 29 to 32 to the consolidated financial statements.
The rights and obligations attaching to the Company’s ordinary shares and preference shares, as well as the powers of the Company’s directors, are set out in the Company’s articles of association, copies of which can be obtained from Companies House and the Company’s website, www.aviva.com/investor-relations/corporate-governance/articles-of-association/, or by writing to the group company secretary. With the exception of restrictions on transfer of ordinary shares under the Company’s employee share incentive plans while the shares are subject to the rules of the plan, there are no restrictions on the voting rights attaching to the Company’s ordinary shares or the transfer of securities in the Company. Where, under an employee share incentive plan operated by the Company, participants are the beneficial owners of shares, but not the registered owners, the voting rights are normally exercised at the discretion of the participants. No person holds securities in the Company carrying special rights with regard to control of the Company. The Company is not aware of any agreements between holders of securities that may result in restrictions in the transfer of securities or voting rights. Unless expressly specified to the contrary in the articles of association of the Company, the Company’s articles of association may only be amended by special resolution of the Company’s shareholders in general meeting. There are a number of agreements that take effect, alter or terminate upon a change of control of the Company, such as commercial contracts and joint venture agreements. None is considered to be significant in terms of their potential impact on the business of the Group as a whole. All of the Company’s employee share incentive plans contain provisions relating to a change of control. Outstanding awards and options would normally vest and become exercisable on a change of control, subject to the satisfaction of any performance conditions and pro rata reduction as may be applicable under the rules of the employee share incentive plans. At the 2011 Annual General Meeting, shareholders will be asked to renew the directors’ authority to allot shares. Details are contained in the Notice of AGM.
Authority to purchase own shares At the Company’s Annual General Meeting held on 28 April 2010, shareholders renewed the Company’s authorities to make market purchases of up to 276 million ordinary shares, up to 100 million 83/4% preference shares and up to 100 million 83/8% preference shares. These authorities were not used during the year or up to the date of this report. At the 2011 Annual General Meeting, shareholders will be asked to renew these authorities for another year and will once again propose a maximum aggregate number of ordinary shares which the Company can purchase of less than 10% of the issued ordinary share capital. Details are contained in the Notice of AGM. The Company held no treasury shares during the year or up to the date of this report.
Substantial shareholdings As at 2 March 2011, in accordance with the provisions of the Disclosure and Transparency Rules of the Financial Services Authority, the Company had received the following notifications relating to the holding percentage of the total voting rights attaching to the issued ordinary share capital of the Company; BlackRock, Inc. held 5.09%, Legal & General Group plc held 3.98% and AXA S.A. held 3.86%.

98
Aviva plc Annual Report and Accounts 2010 Directors’ report continued
Directors The following persons served as directors of the Company during the year and up to the date of this report: Mary Francis Richard Karl Goeltz Euleen Goh Michael Hawker Mark Hodges Igal Mayer (appointed 19 January 2011) Andrea Moneta (resigned 19 January 2011) Andrew Moss Carole Piwnica Patrick Regan Philip Scott (retired 26 January 2010) Lord Sharman of Redlynch Leslie Van de Walle Russell Walls Scott Wheway The biographical details of the persons currently serving as directors appear on pages 94 and 95. The new UK Corporate Governance Code (the Code) provides that all directors of FTSE 350 companies should be subject to annual re-election by shareholders. The Company is within this category of listed companies and has adopted this provision early. Therefore, at the 2011 Annual General Meeting, all directors of the Company will offer themselves for election/re-election in compliance with this provision of the Code.
Directors’ interests and indemnity arrangements At no time during the year did any director hold a material interest in any contract of significance with the Company or any of its subsidiary undertakings other than an indemnity provision between each director and the Company and service contracts between each executive director and a Group company. There is no arrangement or understanding with any shareholder, customer, supplier, or any other external party, to appoint a director or a member of the Executive Committee. The Company has purchased and maintained throughout the year, directors’ and officers’ liability insurance in respect of itself and its directors. The directors also have the benefit of the indemnity provision contained in the Company’s articles of association. The Company has executed deeds of indemnity for the benefit of each director of the Company, and each person who was a director of the Company during the year, in respect of liabilities that may attach to them in their capacity as directors of the Company or of associated companies. These indemnities were granted at different times according to the law in place at the time and where relevant are qualifying third-party indemnity provisions as defined by section 234 of the Companies Act 2006. These indemnities were in force throughout the year and are currently in force. Details of directors’ remuneration, service contracts and interests in the shares of the Company are set out in the Directors’ Remuneration Report.
Financial instruments Aviva Group companies use financial instruments to manage certain types of risks including those relating to credit, foreign currency exchange, cash flow, liquidity, interest rates, and equity and property prices. Details of the objectives and management of these instruments are contained in the Shareholder information section on pages 153 to 166 and an indication of the exposure of the Group companies to such risks is contained in note 57 to the consolidated financial statements.
Health and safety The health and safety of the Group’s employees is a priority and is reviewed at regular intervals. Each business within the Group has an appointed health and safety representative, whose role is to bring to the attention of senior management any areas of concern that should be addressed within the health and safety programme. Information on health and safety matters is communicated to staff through the normal communication channels. Under the Group’s Health and Safety Policy the Group chief executive is accountable for health and safety.
Developing communities As a sustainable business, the Group is committed to playing its part in the development of the communities where it operates and it strives to listen carefully, collaborate and together create a genuine and lasting impact on the issues affecting those communities. This includes the broader Millennium Development Goals set by the United Nations to focus governments, businesses and civil society on major global concerns. Using the Group’s strengths and working around the strategic focus on education, life trauma and financial literacy, a contribution of over £11.4 million was made in 2010, a 42.5% increase on 2009. The Group delivered over 80,000 hours of volunteering and working in partnership with field experts across the public and third sector. There is also recognition of the mutual benefit of the Group’s community development activity as employees feel engaged and proud, communities where the Group operates feel the impact and the Group’s brand reputation is enhanced. The Group’s flagship global community development programme, Street to School, is a five-year commitment which aims to help 500,000 children fulfil their potential, and which showed the adopted approach in action. By the end of 2010, the Group had already helped 128,000 children through prevention work, community outreach, healthcare, safe housing and a significant focus on education and training projects. The Group’s community development activity also included: Grassroots Athletics and Rugby activity, financial literacy work in schools and adult education and the ongoing partnership with Oxfam 365 which helped them respond immediately to emergencies such as the earthquake in Haiti and flooding in Pakistan.
Political donations At the 2010 Annual General Meeting, shareholders passed a resolution, on a precautionary basis, to authorise the Company to make political donations and/or incur political expenditure (as such terms are defined in sections 362 to 379 of the Companies Act 2006), in each case in amounts not exceeding £100,000 in aggregate. The definitions used in the Companies Act 2006 are broad in nature and this authority was sought to ensure that any activities undertaken throughout the Group’s businesses which could otherwise be construed to fall within these provisions could be undertaken without inadvertently infringing them. During the year, the Company’s American subsidiary, Aviva USA, through its employee-funded Political Action Committee, made contributions to four different industry bodies and the re-election committee of a state governor, which could all be construed to fall within the political donations provisions. The total sum of the donations was $12,500 and the donations were used to support candidates for nomination and/or election to public office. It is not the policy of the Company to make donations to EU political organisations or to incur other political expenditure.

99
Performance reviewCorporate responsibilityGovernanceShareholder informationFinancial statements IFRSFinancial statements MCEVOther information
Governance
Aviva plc Annual Report and Accounts 2010
Directors’ report continued
As the authority granted at the 2010 Annual General Meeting will expire on 4 May 2011, renewal of this authority will be sought at this year’s Annual General Meeting. Further details are available in the Notice of AGM.
Group employees The Group’s statement on its employees is set out in the Corporate Responsibility Report. In summary, the Group’s commitment to communication and dialogue with employees continues. The existence of a Group-wide intranet enables engagement and communication with employees throughout the Group on a single platform. It also helps management to share information, ideas and opportunities much faster across the entire business and to achieve a common awareness on the part of all employees of the financial and economic factors affecting the performance of the Company. A strong emphasis is placed on the provision of news and information through a range of media. Employees have opportunities to voice their opinions and ask questions through intranet sites, question and answer sessions with the group chief executive, via telephone conferencing, opinion surveys and the Group’s Employee Promise Survey which is open to all employees. Face-to-face briefings and team meetings are actively encouraged and are held in all business units across the Group. The Group’s businesses in the UK have established employee consultative forums and a European Consultative Forum convenes annually to discuss matters impacting the business across Europe. The Group ensures that involvement of employees in its performance is encouraged by allowing eligible employees to participate in the Group’s all employee share ownership plans. On 2 June 2010, in commemoration of the first year of the Company becoming ‘One Aviva’, employees participated in and contributed to various activities to raise funds for charity.
Employee practice The Group respects all fundamental human rights and is guided in the conduct of its business by the provisions of the United Nations Universal Declaration of Human Rights and the International Labour Organization core labour standards. Aviva also supports the United Nations Global Compact Principles. Aviva Group companies are committed to providing equal opportunities to all employees, irrespective of their gender, sexual orientation, marital status, race, nationality, ethnic origin, disability, age, religion or union membership status. Aviva is an inclusive employer and values diversity in its employees. These commitments extend to recruitment and selection, training, career development, flexible working arrangements, promotion and performance appraisal. In the event of employees becoming disabled, every effort is made to ensure that their employment with the Group continues and to provide specialised training where this is appropriate.
Corporate responsibility The Group has a well-established corporate responsibility programme and continues to use its position to influence other companies to engage in sustainable business practices and to be open and transparent in the information they publicly report. At the 2010 Annual General Meeting, the Company, for the first time, put its Corporate Responsibility Report included in the annual report and accounts, to an advisory vote of shareholders as a means of obtaining feedback on the report and the Company’s performance in this area. This resolution is now put to the Annual General Meeting annually. The report is set out on pages 75 to 92 and details of the resolution are set out in the Notice of AGM.
Creditor payment policy and practice It is the Group’s policy to pay creditors when they fall due for payment. Terms of payment are agreed with suppliers when negotiating each transaction and the policy is to abide by those terms, provided that the suppliers also comply with all relevant terms and conditions. In respect of Group activities in the UK, the amounts due to trade creditors at 31 December 2010 represented 20.8 days of average daily purchases through the year (2009: 23 days).
Corporate Governance Statement In compliance with the Disclosure and Transparency Rules (the DTRs), the disclosures required by DTR 7.2.2 to 7.2.7 can be found in the Corporate Governance Report on pages 100 to 108 which is incorporated into this Directors’ Report by reference.
Reappointment of the auditor and disclosure of information to the auditor In accordance with section 489 of the Companies Act 2006, a resolution is to be proposed at the 2011 Annual General Meeting to reappoint Ernst & Young LLP as auditor of the Company. A resolution will also be proposed authorising the directors to determine the auditor’s remuneration. The Audit Committee reviews the appointment of the auditor, the auditor’s effectiveness, independence and relationship with the Group, including the level of audit and non-audit fees paid. Further details on the work of the auditor and the Audit Committee are set out in the Audit Committee Report. The directors in office at the date of this Directors’ Report confirm that, so far as they are each aware, there is no relevant audit information of which Ernst & Young LLP are unaware and each director has taken all steps that ought to have been taken as a director to be aware of any relevant audit information and to establish that Ernst & Young LLP are aware of that information.
Annual General Meeting The 2011 Annual General Meeting of the Company will be held on Wednesday 4 May 2011 at the Barbican Centre, Silk Street, London EC2Y 8DS at 11am. The Notice of AGM convening the meeting describes the business to be conducted thereat. By order of the Board Andrew Moss Group chief executive 2 March 2011 Registered Office: St. Helen’s, 1 Undershaft, London EC3P 3DQ Registered in England No. 2468686

100
Aviva plc Annual Report and Accounts 2010 Corporate governance report
The UK Corporate Governance Code The UK Corporate Governance Code (the Code) is the new edition of the Combined Code on Corporate Governance (the Combined Code) and was issued by the Financial Reporting Council in May 2010. The Code is applicable to financial years beginning on or after 29 June 2010 and has been applied by the Company since the start of the current financial year on 1 January 2011. The Board have, however, opted for an early adoption of some of the new provisions of the Code where it deems this to be appropriate, including the annual re-election of directors. The first time the Company will report on the Code will be in 2012, in respect of the 2011 financial year. This report is therefore based on compliance with the Combined Code which was applicable for the 2010 financial year and sets out details of how the Company has applied its principles and complied with its provisions. The Combined Code sets out standards of good practice in the form of principles and provisions on how companies should be directed and controlled to follow good governance practice. The Financial Services Authority (FSA) requires companies listed in the UK to disclose, in relation to section 1 of the Combined Code, how they have applied its principles and whether they have complied with its provisions throughout the accounting period. Where the provisions have not been complied with, companies must provide an explanation for this. It is the Board’s view that the Company has been fully compliant throughout the accounting period with the provisions set down in section 1 of the Combined Code. Further information on the Code and Combined Code can be found on the Financial Reporting Council’s website, www.frc.org.uk
The Board The directors are responsible to shareholders for ensuring that the Company is appropriately managed and that it achieves its objectives. It meets regularly to determine the Company’s strategic direction, to review the Company’s operating and financial performance, to set the Company’s risk appetite and to provide oversight that the Company is adequately resourced and effectively controlled. The specific duties of the Board are clearly set out in its terms of reference that address a wide range of corporate governance issues and list those items that are specifically reserved for decision by the Board. Matters requiring Board approval include:
Group strategy, business plans and performance monitoring; Financial reporting and controls, capital structure and
dividend policy; Group risk appetite and framework, and risk management
policies; Corporate governance; Others (shareholder documentation, Board and committee
succession planning, constitution of Board committees, Board effectiveness review, committee reports and key business policies).
Allocation of Board agenda time %
• Group strategy, business plans and performance monitoring 51• Financial reporting and controls, capital structure and dividend policy 21• Group risk management policies, risk appetite and framework 8• Corporate governance 9• Others (shareholder documentation, ! Board and committee succession planning, constitution of Board committees, Board effectiveness review,committee reports and key business policies) 11 The full terms of reference for the Board are available from the group company secretary. Matters that are not specifically reserved for the Board and its committees under its terms of reference, or for shareholders in general meeting, are delegated to the group chief executive. The Board’s terms of reference also set out those matters that must be reported to the Board, such as significant litigation or material regulatory breaches, and cover how matters requiring consideration by the Board that arise between scheduled meetings should be dealt with. The Board and its committees operate in line with work plans agreed prior to the start of each year. At Board and committee meetings, directors receive regular reports on the Group’s financial position, risk management, regulatory compliance, key business operations and other material issues. Directors are fully briefed in advance of Board and committee meetings on all matters to be discussed. The group company secretary is responsible for following Board procedures and advising the Board, through the chairman, on governance matters. All directors have access to her advice and services. The Board has adopted a procedure whereby directors may, in the performance of their duties, seek independent professional advice at the Company’s expense if considered appropriate. During the year the members of the Remuneration Committee sought independent advice from Hewitt New Bridge Street Consultants on issues surrounding senior executive remuneration. The Audit Committee and the Risk Committee also sought independent advice from Keith Nicholson, a former partner at KPMG LLP.
The directors The Board currently comprises the chairman, eight independent non-executive directors and four executive directors. Each non-executive director serves for a fixed term not exceeding three years that may be renewed by mutual agreement. Subject to the Board being satisfied with a director’s performance, independence and commitment, there is no specified limit regarding the number of terms a director may serve. Each director is required to be elected by shareholders at the Annual General Meeting following his/her appointment by the Board and there will now be annual re-election of all directors as stated in the Board terms of reference.

101
Performance reviewCorporate responsibilityGovernanceShareholder informationFinancial statements IFRSFinancial statements MCEVOther information
Governance
Aviva plc Annual Report and Accounts 2010
Corporate governance report continued
Balance of executive and non-executive directors
• Chairman 1• Executive directors 4• Non-executive directors 8
Gender split of directors
• Male 10• Female 3
Length of tenure of non-executive directors
• 0 – 3 years 3• 3 – 6 years 2• 6 – 9 years 4• +9 years 0
Geographical mix
• UK 7• Continental Europe 3• US 1• Other 2
The Board’s policy is to appoint and retain non-executive directors, who can apply their wider knowledge and experiences to their understanding of the Aviva Group, and to review and refresh regularly the skills and experience the Board requires through a programme of rotational retirement. Several non-executive directors, including the Company chairman, are due to retire in 2012 and 2013, after serving on the Board for up to nine years, in line with the Combined Code. The Nomination Committee continued succession planning for the Board during the year to ensure that an appropriate balance of skills and experience is maintained and that there is progressive refreshing of the Board. As part of the process for the appointment of new directors, the Nomination Committee, on behalf of the Board,
considers the diversity of the Board, including gender. The diverse nationalities which currently make up the Board ensure an international perspective, which is invaluable for the Group as a global business. In addition to the strengths of experience, diversity and an international perspective, the Board also complies with the requirements of the Combined Code on the independence of directors. The aim is that the Board as a whole should have an appropriate balance of skills, experience, independence and knowledge to enable each director and the Board as a whole to discharge their duties and responsibilities effectively. Each director must be able to devote sufficient time to the role in order to discharge his or her responsibilities effectively and on average spend at least 44 days a year on company business, with the chairmen of the Audit and Risk committees spending substantially more. The process for appointing new directors is conducted by the Nomination Committee whose report, including a description of its duties, is set out on page 109. The Combined Code requires that at least half the Board, excluding the chairman, should comprise independent non-executive directors as determined by the Board. The Nomination Committee performs an annual review of directors’ interests in which all potential or perceived conflicts, including time commitments, length of service and other issues relevant to their independence, are considered. Where a director has served on the Board for up to nine years, the Board, through the Nomination Committee, will assess whether such a director remains independent in character and judgement. The Board will disclose reasons why it believes that the director remains independent if the assessment reached that conclusion, notwithstanding that the director has been on the Board for more than nine years. It is the Board’s view that an independent non-executive director also needs to be able to present an objective, rigorous and constructive challenge to management, drawing on his/her wider experiences to question assumptions and viewpoints and where necessary defend their beliefs. The independent non-executive directors should also assist management in the development of the Company’s strategy. To be effective, an independent director needs to acquire a sound understanding of the industry and the Company so as to be able to evaluate properly the information provided. Having considered the matter carefully, the Board is of the opinion that all of the current non-executive directors are independent and free from any relationship or circumstances that could affect, or appear to affect, their independent judgement. Accordingly, over half of the Board members, excluding the chairman, are independent non-executive directors. All of the directors have been subject to a formal performance evaluation and took part in a peer evaluation review during 2010. In particular, directors who have served on the Board for more than six years were subject to particularly rigorous review and there was consideration of the need for progressive refreshing of the Board. As at the date of this report, there are four non-executive directors who have served on the Board for more than six years. More details about the directors standing for election and re-election at this year’s Annual General Meeting are set out in the Notice of AGM and their biographical details are set out on pages 94 and 95. Below is a summary of some of the skills and experience they possess which they bring to the Board.

102
Aviva plc Annual Report and Accounts 2010 Corporate governance report continued
Summary of directors’ skills and experience Mary Francis CBE Mrs Francis has a distinguished record with extensive experience of business at an international level. Her experience in government affairs and in the financial services industry is an invaluable asset to the Company. Richard Karl Goeltz Mr Goeltz has a strong financial background with over 30 years experience of international business and leadership in major global corporations. In addition, he has excellent experience of audit and governance committees.
Euleen Goh Ms Goh has extensive experience and knowledge both from an executive and non-executive standpoint. She has a strong understanding of risk and product issues in financial services and has brought a new insight to the Company’s operations in Asia.
Michael Hawker AM Mr Hawker has a wealth of industry knowledge with over 24 years of experience in the banking and insurance industry in both executive and non-executive roles in Europe, Asia and Australia. He also has valuable experience of risk committees.
Mark Hodges Mr Hodges has made a significant contribution to the Board’s discussions and brings both operational and strategic expertise as well as significant experience and knowledge about the Group’s business in the UK.
Igal Mayer Mr Mayer has implemented significant changes to the Company’s North American business, resulting in a strong performance from the region in 2010. He brings to the Board an international perspective and a detailed knowledge of the Group in particular and the insurance industry in general.
Andrew Moss Mr Moss has extensive experience and knowledge of the financial services industry. He has successfully led the Group since 2007, transforming it into a successful global business operating under a single brand. Mr Moss’s strong leadership skills and clear strategic vision make him a valuable contributor to Board discussions.
Carole Piwnica Mrs Piwnica has extensive business and commercial experience together with significant knowledge of the regulatory environment in the European Union and has made a significant contribution to the discussions of the Board.
Patrick Regan Mr Regan has a deep understanding of, and extensive experience in, various executive functions within the insurance industry. With his significant financial experience and global perspective, he has greatly contributed to the deliberations of the Board.
Lord Sharman of Redlynch OBE Lord Sharman has wide ranging international experience in the financial services industry and a wealth of non-executive experience which includes numerous non-executive directorships and the chairmanship of various listed companies. He has an excellent track record of working with and leading diverse international businesses and has applied these skills to his chairmanship of the Company’s Board.
Leslie Van de Walle Mr Van de Walle has brought to the Board extensive marketing and brand knowledge together with a wealth of experience in growing and developing businesses. With his multi-sector experience and strong analytical ability, he has contributed significantly to the deliberations of the Board.
Russell Walls Mr Walls has a strong financial background and a wealth of international business experience in addition to valuable experience of audit committees. With his financial acumen and thorough, common sense approach, he has contributed significantly to the discussions of the Board.
Scott Wheway Mr Wheway has a wealth of business experience in the retail sector and has been a champion of excellent customer service. He has provided key insights into the Company’s strategy of putting the customer at the heart of business.
The chairman and group chief executive The respective roles of the chairman and group chief executive are set out in the Board’s terms of reference. The chairman’s priority is the leadership of the Board and ensuring its effectiveness and the group chief executive’s priority is the management of the Company. The chairman’s commitment to the Company is two to three days per week and his main interests outside the Company are set out in his biographical details on page 94.
Senior independent director Under the Combined Code the Board appoints one of the non-executive directors to act as senior independent director. The role of the senior independent director is to provide a sounding board for the Chairman and to serve as an intermediary for the other directors where necessary. His main responsibility is to be available to shareholders should they have concerns that they have been unable to resolve through normal channels, or when such channels would be inappropriate. During the year, and led by the senior independent director, the non-executive directors have twice met without the chairman present. The senior independent director is also responsible for leading the Board’s discussion on the chairman’s performance and the appointment of a new chairman, when appropriate. Richard Goeltz has served as the senior independent director since January 2009.
Board effectiveness The effectiveness of the Board is vital to the success of the Group and the Company undertakes a rigorous evaluation each year in order to assess how well the Board, its committees, the directors and the chairman are performing. The aim is to improve the effectiveness of the Board and its committees and the Group’s performance. The process is led by the chairman and supported by the group company secretary. Once again this year the review was carried out by Boardroom Review, an independent consultancy, and was based on the progress the Board had made on the actions identified in previous effectiveness reviews. Boardroom Review prepared a report based on interviews with the directors and the overall results of the evaluation were presented to, and discussed by, the Board in January 2011. The performance of the chairman was also included in the above process and took into account the views of both the executive and non-executive directors. The chairman’s evaluation was managed by the senior independent director who provided feedback to the chairman. As part of the chairman’s evaluation the non-executive directors met separately under the chairmanship of the senior independent director.

103
Performance reviewCorporate responsibilityGovernanceShareholder informationFinancial statements IFRSFinancial statements MCEVOther information
Governance
Aviva plc Annual Report and Accounts 2010
Corporate governance report continued
The Board evaluation process assessed the executive directors in their capacities as directors of the Company. They were evaluated in respect of their executive duties through a separate process whereby the chairman and the non-executive directors assessed the group chief executive and the group chief executive assessed the other executive directors. Following this comprehensive review, the directors have concluded that the Board and its committees operate effectively and agreed that the actions in respect of certain processes identified for improvement in previous reviews had been implemented. The Board also agreed to increase focus on the external environment and peer group analysis. Additionally, the chairman has concluded that each director contributes effectively and demonstrates full commitment to his/her duties.
Training and development The Board believes strongly in the development of all its employees and directors and it is a requirement of each director’s appointment that they commit to continue their development. The form that this development takes is subject to individual director’s requirements and the quality and relevance of the training available. During the year, directors attended a number of internal and external courses including training on Solvency II for the Board and on IFRS Phase II for members of the Audit Committee. There was a joint training session for members of the Risk and Audit committees on the global corporate structure and the Risk Committee members also attended training on economic capital and stress testing. Training sessions have also been built into the Board’s and committees’ work plans for 2011. The Board made visits to the Group’s businesses located in the UK, Spain, Turkey, Italy and Poland during the year to gain a closer understanding of their operations. The Board has a comprehensive induction programme consisting of several separate sessions which take place over a number of months at times convenient for the director. The sessions include presentations from key members of senior management, visits to the Group’s main operating businesses, and meetings with the external auditor and one of the Company’s corporate brokers. Further or follow-up meetings are arranged where a director requires a deeper understanding on a particular issue.
Directors’ attendance The Company requires directors to attend all meetings of the Board and the committees on which they serve and to devote sufficient time to the Company in order to perform their duties. The attendance of the directors at the Board meetings held in 2010 is shown in the table below and the attendance at committee meetings is shown in the committee reports.
Board attendance 2010 Number of meetings held* 10 Mary Francis 10 Richard Karl Goeltz 10 Euleen Goh 10 Michael Hawker 10 Mark Hodges 10 Andrea Moneta** 10 Andrew Moss 10 Carole Piwnica 9 Patrick Regan*** 9 Lord Sharman 10 Leslie Van de Walle 9 Russell Walls 9 Scott Wheway 10
* There were eight scheduled Board meetings during 2010 and two additional meetings called at short notice. ** Resigned on 19 January 2011. ***Appointed to the Board on 22 February 2010.
During 2010, the chairman and the non-executive directors met in the absence of the executive directors and the non-executive directors met in the absence of the chairman, including one meeting chaired by the senior independent director in order to appraise the chairman’s performance.
Board committees The Board has established the following standing committees to oversee and debate important issues of policy and oversight outside the main Board meetings:
Audit Committee; Corporate Responsibility Committee; Nomination Committee; Remuneration Committee; and Risk Committee.
Throughout the year the chairman of each committee provided the Board with a summary of the key issues considered at the meetings of the committees and the minutes of the meetings were circulated to the Board. The committees operate within defined terms of reference which are available on the Company’s website, www.aviva.com/investor-relations/corporate-governance/terms-of-reference/, or from the group company secretary upon request. Board committees are authorised to engage the services of external advisers as they deem necessary in the furtherance of their duties at the Company’s expense. Reports of the committee chairmen are set out on pages 109 to 136.
Aviva plc governance structure
AuditCommittee
Group Operational RiskCommittee
Group AssetLiability Committee
RiskCommittee
Aviva plc Board
CorporateResponsibilityCommittee
NominationCommittee
RemunerationCommittee
Group ExecutiveCommittee
DisclosureCommittee

104
Aviva plc Annual Report and Accounts 2010 Corporate governance report continued
Conflicts of interest In line with the Companies Act 2006, the Company’s articles of association allow the Board to authorise potential conflicts of interest that may arise and to impose such limits or conditions as it thinks fit. The decision to authorise a conflict of interest can only be made by non-conflicted directors (those who have no interest in the matter being considered) and in making such a decision the directors must act in a way they consider in good faith will be most likely to promote the Company’s success. The Board has established a procedure whereby actual and potential conflicts of interest are regularly reviewed and for the appropriate authorisation to be sought prior to the appointment of any new director or if a new conflict arises. During 2010 this procedure operated effectively.
Internal control statement The Board has overall responsibility for maintaining the Group’s system of internal control and for reviewing its effectiveness. To discharge this responsibility, the Board has established frameworks for internal governance and risk management. The Group’s system of internal control plays a key role in the management of risks that may impact the fulfilment of its objectives. Internal control facilitates effective and efficient operations, the development of robust and reliable internal reporting and compliance with laws and regulations. This system is designed to manage, rather than eliminate, the risk of failure to achieve business objectives and can only provide reasonable and not absolute assurance against material misstatement or losses. The system is regularly reviewed and complies with the revised guidance for directors on the Combined Code, October 2005 (the Turnbull Guidance) published by the Financial Reporting Council. The Audit Committee, working closely with the Risk Committee, on behalf of the Board, last reviewed the effectiveness of the system of internal control in February 2011, covering all material controls, including financial, operational and compliance controls and risk management systems. The necessary actions have been or are being taken to remedy any significant failings and weaknesses identified from these reviews. The Board confirms that there is an ongoing process for identifying, measuring, managing, monitoring and reporting the significant risks faced by the Group, which has been in place for the year under review and up to the date of approval of the Annual Report and Accounts. The principal features of the system of internal control and methods by which the Board satisfies itself that this system operates effectively are set out below.
Control environment The Group operates a ‘three lines of defence’ model. Primary responsibility for the application of the risk management framework – risk identification, measurement, management, monitoring and reporting – lies with business management (the first line of defence). Management is therefore responsible for implementing and monitoring the operation of the system of internal control and for providing assurance to the Group Executive Committee, the Audit Committee and the Risk Committee, as relevant, that it has done so. Support for and challenge of the completeness and accuracy of risk assessment, risk reporting and adequacy of mitigation plans are performed by the specialist risk function (the second line of defence) acting as the ‘critical friend’ to the first line of defence. The design of the risk management framework is also primarily the responsibility of the second line of defence. The risk function operates globally with teams in all major regions and business units.
Independent and objective assurance on the robustness of the risk management framework and the appropriateness and effectiveness of internal control is provided by the Internal Audit (the third line of defence) to the Audit and Risk committees, regional and business unit audit committees, Board members and the Group Executive Committee.
Governance and oversight committee structure The Board delegates oversight in relation to risk management and internal control to the following committees:
Risk Committee; and Audit Committee
The Risk Committee assists the Board in providing leadership, direction and oversight of risk and risk management across the Group. Oversight of the design, completeness and effectiveness of the risk management framework relative to the Group’s activities is performed on behalf of the Board by the Risk Committee. This includes the oversight of the quality of the risk function and the effectiveness of risk reporting. The committee’s oversight covers all aspects of risk including market, credit, liquidity, general insurance, life insurance, operational, reputational and regulatory risks. The Audit Committee, working closely with the Risk Committee, is responsible for assisting the Board in discharging its responsibilities for the integrity of the Company’s financial statements and the effectiveness of the system of internal control and for monitoring the effectiveness, performance and objectivity of the internal and external auditors. These committees receive reporting on risk management and internal control procedures and consider where relevant whether appropriate actions have been undertaken as well as monitoring the completion of any Group level actions to a satisfactory conclusion. These committees have clearly defined terms of reference and full reports for these committees are set out on pages 110 to 113. The parts of the governance framework relating to the operational management of the Group’s businesses include limits on the authority delegated by the Board in respect of matters which are necessary for the effective day-to-day running and management of the business. The group chief executive has been delegated operational responsibilities and powers by the Board, and in turn delegates authority to members of the Group Executive Committee including the chief executive officer of each region who report to him for the management of that region. In addition each of those regional chief executives has established delegations and a regional executive committee comprising the region’s most senior executives.
Control activities The Group has a set of formal risk management policies that facilitate a consistent approach to the management of all the risks across all the businesses and locations in which the Group operates. These risk policies define our appetite for different, granular risk types and set out risk management and control standards for the Group’s worldwide operations. The risk policies also set out the roles and responsibilities of businesses, regions, risk policy owners and the risk oversight committees. As our business responds to changing market conditions and customer needs, we regularly monitor the appropriateness of our risk policies to ensure they remain up to date. This helps to provide assurance to the various risk oversight committees that there are appropriate controls in place for all our core business activities, and that the processes for managing risk are understood and followed consistently across our global businesses.

105
Performance reviewCorporate responsibilityGovernanceShareholder informationFinancial statements IFRSFinancial statements MCEVOther information
Governance
Aviva plc Annual Report and Accounts 2010
Corporate governance report continued
Businesses regularly review the risks identified against the tolerances specified in the risk policies, and where risks are outside of tolerance, action plans are required. Similarly, controls are regularly reviewed for effectiveness and remediation actions implemented where necessary. The Audit Committee receives regular reports from management to assist with its review and assessment of the effectiveness of internal control including financial reporting. A governance certification process is conducted throughout the Group in support of this review. The necessary actions have been or are being taken to remedy significant failings and weaknesses identified from these reviews. The chief executive and chief financial officer of each region have certified compliance with the Group’s governance, internal control and risk management requirements, supported by consideration of evidence from all three lines of defence. They have certified that all the key inherent risks within the business have been identified and assessed and that the business operates in a manner which conforms to the minimum standards outlined in Group risk policies as well as the business ethics code. The chief executives and chief financial officers in the regions have also confirmed that there is a governance structure that is appropriate to oversee risk management activities and that the business has complied with the terms of its delegated authority (cascaded by the Group) and has operated a delegated authority structure that is appropriate to oversee its activities. Any key risks not previously identified, control weaknesses or non-compliance with the Group policy framework or local delegation of authority must be highlighted as part of this process. The chief risk officers of each region have also certified their responsibility for providing effective challenge and independent oversight of the business management of all risks and of the system of internal control. The chief risk officers have certified in each region that they have reviewed, and where appropriate, challenged the completeness, appropriateness and adequacy of risk assessments (irrespective of risk appetite), risk reporting and the adequacy of risk mitigation plans, including proactively advising senior management of emerging risk issues. They have also certified that they have monitored the implementation of, and compliance with, the risk policies and standards, providing challenge and escalating all material breaches of limits, appetite or policy to the appropriate forum as necessary. The Group risk function has reviewed any matters identified by regions in their certification and also assessed the risk and control issues that arose and were reported during the year by the three lines of defence.
Internal controls over financial reporting A Group Reporting Manual including International Financial Reporting Standards (IFRS) and Market Consistent Embedded Value (MCEV) requirements has been defined and rolled out across the Group. A Financial Reporting Control Framework (FRCF) is in place across the Group. FRCF relates to the preparation of reliable financial reporting and preparation of local and consolidated financial statements in accordance with IFRS and MCEV. FRCF also ensures compliance with the requirements of the Sarbanes-Oxley Act 2002. The FRCF process follows a risk-based approach, with management identification, assessment (documentation and testing), remediation as required, reporting and certification over key financial reporting-related controls. Management quality assurance procedures over the application of the FRCF process and FRCF controls are undertaken regularly. The results of the FRCF process are signed off by business unit and regional chief
executives and chief financial officers and at a Group level by the group chief executive and chief financial officer. The Disclosure Committee, which has the role of overseeing the design and effectiveness of the Group’s disclosure controls, for both financial and non-financial information, evaluates the Group’s disclosure controls and reviews and endorses the Group’s key periodic external reports including the consolidated financial statements. This committee is chaired by the chief financial officer and reports to the Audit Committee and the Group Executive Committee. A Group Technical Committee, reporting to the Disclosure Committee is in place, which presides over significant technical matters, reviewing technical decisions including key judgements, issues and application of assumptions.
Risk management A Risk Management Framework (RMF), designed to identify, measure, manage, monitor and report significant risks to the achievement of business objectives is in place and embedded throughout the Group. The risk management policy set described above (under control activities) is a key element of the RMF. The Board has overall responsibility for determining the nature and extent of the significant risks it is willing to take in achieving its strategic objectives. The Group’s risk appetite statements were reviewed and approved by the Board in June 2010, with a key focus on balance sheet strength, liquidity and the protection of the franchise value. A company’s objectives, its internal organisation and the environment in which it operates are continually evolving and, as a result, the risks it faces are continually changing. Management in conjunction with the risk function regularly monitors the risk profile of business units, regions and the Group. On a quarterly basis, risk reports, setting out the risk profiles, risk exposures outside risk appetite and action plans are reported by the risk function. A consolidated Group-wide risk profile is considered by the Group Executive Committee and the Risk Committee. Regional executive committees and management receive and similarly consider local risk reporting. Where significant risks outside risk appetite are identified, an escalation process is followed. Such significant risks are reported by the chief risk officer to the Group Executive Committee, the Risk Committee and Audit Committee, along with any proposed mitigating actions. The risk management process has been in place for the year under review and up to the date of approval of the Annual Report and Accounts. Further details on procedures for the management of risk and the systems of internal control operated by the Group are given in the section on risk management set out on pages 65 to 68.
Internal audit Internal Audit provides independent assurance to management on the effectiveness of the internal control systems and, the adequacy of these systems to manage business risk and to safeguard the Group’s assets and resources. Internal Audit also provides objective independent assurance on risk and control to both the Audit Committee and the Risk Committee. Throughout 2010, Internal Audit, through the chief audit officer, provided quarterly reporting on issues arising and the status of action items to the Audit Committee and Risk Committee. Similar reporting is undertaken on a regional and business unit basis to local executive management and local audit committees. The effectiveness of Internal Audit is reviewed annually by the Audit Committee.

106
Aviva plc Annual Report and Accounts 2010 Corporate governance report continued
Share capital and control The information required to be provided by the directors pursuant to section 992 of the Companies Act 2006 can be found on page 97 of the Directors’ Report.
Communication with shareholders The Company places considerable importance on communication with shareholders and engages with them on a wide range of issues. The Group has an ongoing programme of dialogue and meetings between the executive directors and institutional investors, fund managers and analysts. At these meetings a wide range of relevant issues including strategy, performance, management and governance are discussed within the constraints of information already made public. The Company’s investor relations department is dedicated to facilitating communication with institutional investors. The directors consider it important to understand the views of shareholders and, in particular, any issues which concern them. The Board receives reports on matters that have been raised with management at the regular meetings held with the Company’s major investors. During the year, the chairman and the senior independent director held a meeting with the major institutional investors and attended investor meetings with management. In addition, the senior independent director is available to meet with major investors to discuss any areas of concern that cannot be resolved through normal channels of investor communication, and arrangements can be made to meet with the senior independent director through the group company secretary. Similarly, arrangements can be made for major investors to meet with newly appointed directors. In addition, the Board consults with shareholders in connection with specific issues where it considers appropriate. This year the Board, through the Remuneration Committee chairman, has consulted with institutional investors on the introduction of new share plans which will be put to shareholders at this year’s Annual General Meeting. The Board is equally interested in the concerns of private shareholders and, on its behalf, the group company secretary oversees communication with this group of investors. The Company has a dedicated email address to which questions can be sent, in addition to the facility on the Company’s website, which are both highlighted in the shareholder information section of the Notice of AGM. These can be used by shareholders to put relevant questions, related to the business of the meeting, to the directors. These are considered to be particularly helpful for those shareholders who are unable to attend the Annual General Meeting. Written responses are provided through a leaflet containing answers to the most frequently asked questions, which is also placed on the Company’s website, www.aviva.com/agm and available at the 2011 Annual General Meeting. All material information reported to the regulatory news service is simultaneously published on the Company’s website, affording all shareholders full access to material Company announcements. The Company has taken full advantage of the provisions within the Companies Act 2006 allowing communications to be made electronically to shareholders where they have not requested hard copy documentation. As a result, the Company’s website has become the primary method of communication for the majority of its shareholders. Details of the information available for shareholders on the website can be found in the Shareholder Services section on page 360 and the Shareholder Services section of the website at www.aviva.com/shareholderservices.
The Company’s Annual General Meeting provides a valuable opportunity for the Board to communicate with private shareholders. At the meeting, the Company complies with the Combined Code as it relates to voting, the separation of resolutions and the attendance of Board committee chairmen. Whenever possible, all directors attend the Annual General Meeting and shareholders are invited to ask questions related to the business of the meeting during the meeting and have an opportunity to meet with the directors following the conclusion of the meeting. In line with the Combined Code, details of proxy voting by shareholders, including votes withheld, are made available on request and are placed on the Company’s website following the meeting. The Company’s Annual Report and Accounts together with the Company’s Half-year Report, interim management statements, reports on Form 20F (for filing with the United States Securities and Exchange Commission) (SEC) and other public announcements, are designed to present a balanced and understandable view of the Group’s activities and prospects and are available on the Company’s website, ww.aviva.com/investor-relations/results-and-reports. The Chairman’s statement, group chief executive’s review and Performance review provide an assessment of the Group’s affairs and they will be supported by a presentation to be made at the Annual General Meeting, which can also be viewed by webcast on the Company’s website at www.aviva.com/agm after the meeting.
Aviva Investors Aviva Investors, the Group’s core asset management company, considers good governance to play an important role in protecting and enhancing shareholder value. In keeping with the Group’s values, Aviva Investors looks to act as a responsible investor, monitors the governance of the companies in which it invests and seeks to maintain an effective dialogue and engagement with companies on matters which may affect shareholder interests and the future performance of those companies. Aviva Investors applies and complies with the UK Stewardship Code maintained by the Financial Reporting Council and has published detailed Stewardship and Corporate Governance and Voting Policies as part of its investment strategy, which underpin its approach to engaging and voting at company general meetings. These policies encompass social, environmental and ethical issues and are applied pragmatically after careful consideration of all relevant information. In addition, Aviva Investors makes detailed voting reports available to clients, as well as providing some summary reporting on its website, www.avivainvestors.com
New York Stock Exchange listing requirements The Company was admitted to the New York Stock Exchange (NYSE) on 20 October 2009 and its ordinary shares are traded as American Depositary Shares. As a foreign company listed on the NYSE, the Company is required to comply with the NYSE corporate governance rules to the extent that these rules apply to foreign private issuers such as Aviva plc. As a foreign private issuer, the Company is therefore required to comply with NYSE Rule 303A.11 by making a disclosure of the differences between the Company’s corporate governance practices and the NYSE corporate governance rules applicable to US companies listed on the NYSE. These differences are summarised below:

107
Performance reviewCorporate responsibilityGovernanceShareholder informationFinancial statements IFRSFinancial statements MCEVOther information
Governance
Aviva plc Annual Report and Accounts 2010
Corporate governance report continued
Independence criteria for directors Under the NYSE listing rules applicable to US companies, independent directors must form the majority of the board of directors. The Combined Code requires that at least half the Board, excluding the Chairman, should comprise independent non-executive directors, as determined by the Board. The NYSE listing rules for US companies also state that a director cannot qualify as independent unless the Board affirmatively determines that the director has no material relationship with the company, and the NYSE rules prescribe a list of specific factors and tests that US companies must use for determining independence. The Combined Code sets out its own criteria that may be relevant to the independence determination, but permits the Board to conclude affirmative independence notwithstanding the existence of relationships or circumstances which may appear relevant to its determination, so long as it states its reasons.
Non-executive director meetings Pursuant to the NYSE listing standards, the non-management directors of each listed company must meet at regularly scheduled executive sessions without management and, if that group includes directors who are not independent, listed companies should at least once a year schedule an executive session including only independent directors. Under the Combined Code, the Chairman should hold meetings with the non-executive directors without the executive directors present.
Committees Under the NYSE standards, US companies are required to have a nominating/corporate governance committee. In addition to identifying individuals qualified to become Board members, this committee must develop and recommend to the Board a set of corporate governance principles. The Company’s Nomination Committee’s terms of reference do not require the committee to develop and recommend corporate governance principles for the Company.
Code of business conduct and ethics The NYSE listing standards require US companies to adopt and disclose a code of business conduct and ethics for directors, officers and employees, and promptly disclose any waivers of the code for directors or executive officers. While the Company does not strictly follow this NYSE standard applicable to US companies, it is committed to ensuring that its business is conducted in all respects according to rigorous ethical, professional and legal standards. The Company has adopted a Business Ethics Code to which all employees are bound and a Code of Ethics for senior management, to comply with the Sarbanes-Oxley Act 2002.
Shareholder approval of equity-compensation plans Under the NYSE listing standards, shareholders must be given the opportunity to vote on all equity-compensation plans and ‘material revisions’ to those plans. Under the Combined Code, shareholder approval is also necessary for certain equity-compensation plans and ‘significant changes’ thereto, subject to certain exceptions. The Combined Code does not provide a detailed definition or explanation of what are considered to be ‘significant changes’, in contrast to the detailed definition of ‘material revisions’ provided by the NYSE.
Directors’ responsibilities The directors are required to prepare financial statements for each accounting period that comply with the relevant provisions of the Companies Act 2006 and International Financial Reporting Standards (IFRS) as adopted by the European Union (EU), and which present fairly the financial position, financial performance and cash flows of the Company and the Group at the end of the accounting period. A fair presentation of the financial statements in accordance with IFRS requires the directors to:
select suitable accounting policies and verify that they are applied consistently in preparing the accounts, on a going concern basis unless it is inappropriate to presume that the Company and the Group will continue in business;
present information, including accounting policies, in a manner that is relevant, reliable, comparable and understandable;
provide additional disclosures when compliance with the specific requirements in IFRS is insufficient to enable users to understand the impact of particular transactions, other events and conditions on the Company and the Group’s financial position and financial performance; and
state that the Company and the Group have complied with applicable IFRS, subject to any material departures disclosed and explained in the financial statements.
The directors are responsible for maintaining proper accounting records, which are intended to disclose with reasonable accuracy, at any time, the financial position of the Company and the Group. They are also ultimately responsible for the systems of internal control maintained by the Group for safeguarding the assets of the Company and the Group and for the prevention and detection of fraud and other irregularities. Further details of the systems of internal controls maintained by the Group are more fully described on pages 104 and 105.

108
Aviva plc Annual Report and Accounts 2010 Corporate governance report continued
Directors’ responsibility statement pursuant to Disclosure and Transparency Rule 4.1.12 Each of the directors listed on pages 94 and 95 confirms that, to the best of their knowledge: (a) the Group and Company financial statements in this report,
which have been prepared in accordance with IFRS as adopted by the EU, International Financial Reporting Interpretations Committee’s interpretation and those parts of the Companies Act 2006 applicable to companies reporting under IFRS, give a true and fair view of the assets, liabilities, financial position and results of the Company and of the Group taken as a whole; and
(b) the Directors’ Report includes a fair review of the development and performance of the business and the position of the Company and the Group taken as a whole, together with a description of the principal risks and uncertainties that they face.
By order of the Board Andrew Moss Pat Regan Group chief executive Chief financial officer 2 March 2011
Going concern The Group’s business activities, together with the factors likely to affect its future development, performance and position are set out in the Overview on pages 8 to 16 and the Performance review on pages 18 to 74. The Performance review includes sections on Group Performance (pages 20 to 26), Capital management (pages 70 to 72) and Risk management (pages 66 to 69). In addition, the financial pages include notes on the Group’s borrowings (note 49); its contingent liabilities and other risk factors (note 52); its capital structure and position (notes 55 and 56); management of its risks including market, credit and liquidity risk (note 57); and derivative financial instruments (note 58). The Group has considerable financial resources together with a diversified business model, with a spread of business and geographical reach. As a consequence, the directors believe that the Group is well placed to manage its business risks successfully. After making enquiries, the directors have a reasonable expectation that the Company and the Group as a whole have adequate resources to continue in operational existence for the foreseeable future. For this reason, they continue to adopt the going concern basis in preparing the financial statements.

109
Performance reviewCorporate responsibilityGovernanceShareholder informationFinancial statements IFRSFinancial statements MCEVOther information
Governance
Aviva plc Annual Report and Accounts 2010 Nomination committee report
This report provides details of the role of the Nomination Committee and the work it has undertaken during the year. The purpose of the committee is to assist the Board by keeping the composition of the Board under review and conducting a rigorous and transparent process when recommending or renewing appointments of directors to the Board. It also advises the Board on issues of directors’ conflicts of interest and independence. The full terms of reference for the committee can be found on the Company’s website, www.aviva.com/investor-relations/corporate-governance/ terms-of-reference, and are also available from the group company secretary. The following directors served on the committee during the year:
Period
Member From To
Lord Sharman (Chairman) 25 January 2006 To date Mary Francis Richard Karl Goeltz
2 December 2009 29 July 2008
To date To date
Andrew Moss* 12 July 2007 To date Russell Walls 23 January 2007 To date
* The Nomination Committee notes that the Combined Code does not preclude the group chief executive from membership of the committee and the committee believes that his input is essential and invaluable in its discussions and therefore important that this is obtained through his membership of the committee. Any concern about this will be allayed by the predominant membership of independent non-executive directors on the committee.
Attendance Number of meetings held 2 Lord Sharman (Chairman) 2 Mary Francis 2 Richard Karl Goeltz 2 Andrew Moss 2 Russell Walls 2
The committee met on two occasions in 2010 and the members’ attendance record is set out above. The group company secretary acts as the secretary to the committee. The committee keeps under review the balance of skills on the Board and the knowledge, experience, length of service and performance of the directors. It also reviews their external interests with a view to identifying any actual, perceived or potential conflicts of interests, including the time available to commit to their duties to the Company. The committee monitors the independence of each non-executive director and makes recommendations concerning such to the Board. The results of these reviews are important when the Board considers succession planning and the re-election of directors. Members of the committee take no part in any discussions concerning their own circumstances. The chart below shows how the committee allocated its time during 2010.
• Succession planning 35• Conflicts of interest 25• Independence 20• Others (including corporate governance matters) 20
Nomination Committee – Allocation of agenda time %
Committee activities during 2010 During the year, the committee initiated a review of the succession plans for appointments to the Board to ensure that an appropriate balance of skills and experience is maintained and that there is progressive refreshing of the Board. Several non-executive directors, including the Company chairman are due to retire in 2012 and 2013 on the basis of their completion of nine years of service in line with the Combined Code guidance. An external search agency has been retained to identify potential candidates for future appointments and the committee has prepared a job specification, including an assessment of the time commitment expected from candidates. The search will be conducted and any appointments will be made, on merit, against the criteria identified by the committee having regard to the benefits of diversity on the Board, including gender. The senior independent director will chair the committee when it is dealing with the appointment of a successor to the chairmanship of the Company. In line with the Combined Code requirement, the Board undertook a review of the effectiveness of all its committees during the year, including the Nomination Committee. This report was reviewed and approved by the Board on 2 March 2011. Lord Sharman of Redlynch Chairman, Nomination Committee

Audit committee report
110
Aviva plc Annual Report and Accounts 2010
This report provides details of the role of the Audit Committee and the work it has undertaken during the year. The purpose of the committee is to assist the Board in discharging its responsibilities for the integrity of the Group and Company’s financial statements, the assessment of the effectiveness of the systems of internal control and monitoring the effectiveness and objectivity of the internal and external auditors. The full terms of reference for the committee can be found on the Company’s website, www.aviva.com/investor-relations/corporate-governance/terms-of-reference, and are also available from the group company secretary. The following independent non-executive directors, served on the committee during the year:
Period
Member From To
Russell Walls (Chairman) 1 July 2004 To date Mary Francis 1 January 2007 To date Richard Karl Goeltz 1 July 2004 To date Euleen Goh 1 January 2009 To date
Attendance Number of meetings held* 11 Russell Walls (Chairman) 11 Mary Francis 10 Richard Karl Goeltz 11 Euleen Goh 10
* There were nine scheduled Audit Committee meetings during 2010 and two additional meetings called at short notice.
The committee met on 11 occasions in 2010 and the members’ attendance record is set out above. In addition, the committee held separate meetings with members of senior management and the external auditors to discuss issues relevant to the committee and for the purpose of training. The group company secretary acts as the secretary to the committee. Russell Walls, a Fellow Chartered Certified Accountant, is a former group finance director of BAA plc, Wellcome plc and Coats Viyella plc. Richard Goeltz is a former chief financial officer of American Express Company and NatWest Group plc and a former member of the Accounting Standards Board. Euleen Goh, a Chartered Accountant and member of the Chartered Institute of Taxation, is a former financial controller of Pontiac Land and chief executive of Standard Chartered Bank, Singapore. The Board is satisfied that these directors have recent and relevant financial experience for the purpose of the Combined Code and are financial experts for the purposes of section 407 of the Sarbanes-Oxley Act 2002. The group chief executive, chief financial officer, chief audit officer, chief accounting officer, chief risk officer and the external auditor normally attend, by invitation, all meetings of the committee. Other members of senior management are also invited to attend as appropriate to present reports. In performing its duties, the committee has access to the services of the chief audit officer, the group company secretary and external professional advisers. Keith Nicholson, a former partner at KPMG LLP, acts as an external adviser to the committee.
Committee activities during 2010 The committee follows an agreed annual work plan. It reviews, with members of management and the internal and external auditors, the Company’s financial announcements including the Annual Report and Accounts to shareholders and associated documentation. It places particular emphasis on their fair presentation and the reasonableness of the judgemental factors and appropriateness of significant accounting policies used in their preparation. At each meeting, the committee receives a report from the chief audit officer concerning the Company’s systems of internal control, including any significant new issues
and actions taken on previously reported issues. The committee also reviews, approves and monitors the annual work plan for the Group’s internal audit function and approves the annual plan for the external audit. Twice each year, the committee receives reports on the adequacy of the Group’s life assurance and general insurance reserves. The committee reports to the Board regarding the effectiveness of the Group’s overall systems of internal control including the risk management systems in relation to the financial reporting process. The committee works closely with the Risk Committee, which assists the committee in its review of the Company’s systems of internal control and risk management. The committee receives reports from the external auditor and, at all scheduled meetings, holds discussions with both the chief audit officer and external auditors in the absence of management. The chairman of the committee reports to the subsequent meeting of the Board on the committee’s work and the Board receives a copy of the minutes of each meeting of the committee. The chart below shows how the committee allocated its time during 2010.
Audit Committee – Allocation of agenda time %
• Financial reporting 35• Internal audit and controls 21• External audit and external! auditor’s report 9• External auditor engagement
and policy 9• Financial reporting control
framework and financial reportingdevelopments 18
• Others (including tax, treasury! and dividends) 8 During the year, the committee held several joint meetings with the Risk Committee and one with the members of the business unit audit committee in Spain. This meeting allowed the committee to gain a deeper understanding of the relevant local issues and assess the effectiveness of the systems of internal control and the effectiveness and objectivity of the internal and external auditors in that business. Each of the Group’s other major business units has an audit committee that provides an oversight role for its business. The chief audit officer reviews the papers and minutes from these committees and brings all significant matters to the committee’s attention. The chief audit officer also attends regional and business unit audit committee meetings on a regular basis and reports back on the effectiveness of these committees to the committee. In addition, during 2010 the members of the committee attended several local audit committee meetings, including those in Aviva USA, Aviva UK Life, Aviva UKGI, Aviva Investors, Hong Kong, Singapore, India, and Ireland and the Europe Region Oversight Committee. This programme of attendance at local audit committee meetings will continue during 2011. During the year, a UK Regional Board was formed with a duly constituted UK Audit Committee (UKAC). The chairman (who is a non-executive director), and members of the UKAC (one of whom is also a non-executive director on the UK Regional Board), are appointed by the UK Board with the agreement of the chairman of the committee. Working closely with the UK Risk Committee, the UKAC assists the UK Regional Board in discharging its responsibilities for the integrity of the UK region’s financial statements and the effectiveness of the systems of internal control and risk management and to monitor the effectiveness, performance and objectivity of the internal and

111
Performance reviewCorporate responsibilityGovernanceShareholder informationFinancial statements IFRSFinancial statements MCEVOther information
Governance
Aviva plc Annual Report and Accounts 2010
Audit committee report continued
external auditors. In addition it provides assurance to the committee that the UK region is discharging its responsibilities in accordance with policies laid down by the Group Board.
Internal audit Internal Audit reports to management on the effectiveness of the Company’s systems of internal control, the adequacy of these systems to manage business risk and to safeguard the Group’s assets and resources. Internal Audit is fully centralised and each country/region head has a full reporting line to the chief audit officer (with the exception of Delta Lloyd and some of the Group’s joint ventures). The chief audit officer reports to the group chief executive and to the chairman of the committee. Through the chief audit officer, Internal Audit provides objective assurance on risk appetite and controls to the committee. The plans, the level of resources, the budget of the Internal Audit function and the remuneration of the chief audit officer are reviewed and approved at least annually by the committee. During 2010 the committee worked closely with management on the appointment of a new chief audit officer. The committee also undertakes an annual review of the effectiveness of Internal Audit against guidance criteria provided by the Institute of Chartered Accountants in England and Wales and by the Institute of Internal Auditors (IIA). Every five years the review is performed by an independent party as required by the IIA standards. The last independent review was performed in 2008. During 2010 Internal Audit carried out assurance reviews over inherent risks throughout the Group. Reviews were focused on, but not limited to, areas such as financial risk management, governance and oversight of the Group, the Group compliance framework and major projects including Quantum and Solvency II.
External auditor Ernst & Young LLP (Ernst & Young) was appointed external auditor of the Company in 2001 having previously been the auditor of Norwich Union plc. During the year, the committee performed its annual review of the independence, effectiveness and objectivity of the external auditor, assessing the audit firm, the audit partner and audit teams. The process was conducted by means of a questionnaire, completed Group-wide by members of senior management and members of the Group’s finance community and the committee. The questionnaire sought opinions on the importance of certain criteria and the performance of the external auditor against those criteria. Based on this review, the committee concluded that the audit service of Ernst & Young was fit for purpose and provided a robust overall examination of the Group’s business and the risks involved. Following this review, the committee recommended that a re-tender process should not be undertaken in 2010 but that the relationship and the effectiveness of the auditor be kept under review. Ernst & Young audits all significant subsidiaries of the Group. The Company introduced a revised external auditor policy on 1 January 2008 aimed at safeguarding and supporting the independence and objectivity of the external auditors. The policy is regularly reviewed and if necessary updated to reflect current global best practice on auditor independence, and is in full compliance with all UK, US and International Federation of Accountants (IFAC) rules. The revised external auditor policy aims to be simpler to interpret, providing greater clarity on what services may and may not be provided by the Group’s external auditors. The external auditor policy regulates the appointment of former audit employees to senior finance positions in the Group and sets out the approach to be taken by the Group when using
the non-audit services of the external auditor, including requiring that all services provided by the external auditor are pre-approved by the committee. It distinguishes between those services where an independent view is required and that should be performed by the external auditor (such as statutory and non-statutory audit and assurance work), prohibited services where the independence of the external auditor could be threatened and they must not be used, and other non-audit services where the external auditor may be used. Non-audit services where the external auditor may be used include: non-recurring internal controls and risk management reviews (i.e. excluding outsourcing of internal audit work), advice on financial reporting and regulatory matters, due diligence on acquisitions and disposals, project assurance and advice, tax compliance services, and employee tax services. The committee receives a quarterly report of compliance against the external auditor policy and the policy has worked effectively during 2010. Annually, the committee reviews a formal letter provided by the external auditor confirming its independence and objectivity within the context of applicable regulatory requirements and professional standards. The Group paid £18.6 million to Ernst & Young for audit services in 2010, relating to the statutory audit of the Group and Company financial statements and the audit of Group subsidiaries and associates pursuant to legislation (2009: £17.9 million). The fees for other services, which included MCEV supplementary reporting, advice on accounting and regulatory matters, reporting on internal controls, reporting on the Group’s Individual Capital Assessment, and due diligence work, were £7.0 million (2009: £16.1 million), giving a total fee to Ernst & Young of £25.6 million (2009: £34.0 million). The Group paid £1.7 million to Ernst & Young in relation to other non-audit services. This included two significant engagements, which were both at Delta Lloyd Bank Belgium (DLBB): £0.4 million in relation to a report to DLBB’s management and strategy committee, and £0.4 million in relation to a review of DLBB’s cost base. The Audit Committee satisfied itself that for both engagements, robust controls (including appropriate levels of review and challenge by DLBB management) were in place to ensure that E&Y’s objectivity and independence was safeguarded, and concluded that it was in the interests of the Company to purchase these services from E&Y due to its specific expertise in the Belgian banking market. Further details are provided in note 12 to the consolidated financial statements IFRS. In addition, the Group engaged Ernst & Young to provide assurance on the Group’s Corporate Responsibility Report. In line with the Combined Code requirement, the Board undertook a review of the effectiveness of all its committees during the year, including the Audit Committee. This report was reviewed and approved by the Board on 2 March 2011. Russell Walls Chairman, Audit Committee

Risk committee report
112
Aviva plc Annual Report and Accounts 2010
This report provides details of the role of the Risk Committee and the work it has undertaken during the year. The purpose of the committee is to assist the Board in providing leadership, direction and oversight of the Group’s management of risk. The full terms of reference for the committee can be found on the Company’s website, www.aviva.com/investor-relations/corporate-governance/ terms-of-reference, and are also available from the group company secretary. The following independent non-executive directors served on the committee during the year:
Period
Member From To
Mary Francis (Chairman) 14 January 2006 To date Michael Hawker Leslie Van de Walle
1 January 2010 24 September 2009
To date To date
Russell Walls 14 January 2006 To date
Attendance Number of meetings held 7 Mary Francis (Chairman) 7 Michael Hawker 7 Leslie Van de Walle 7 Russell Walls 7
The committee met on seven occasions in 2010 and the members’ attendance record is set out above. In addition the committee held separate meetings with members of senior management and the external auditor to discuss issues relevant to the committee and for the purposes of induction and training. The group company secretary acts as the secretary to the committee. The group chief executive, chief risk officer, chief financial officer, chief audit officer and the external auditor normally attended, by invitation, all meetings of the committee. Other members of senior management were also invited to attend as appropriate to present reports. It was the committee’s practice at each meeting to meet separately with the chief risk officer, the chief audit officer and the external auditor without any members of management being present. In performing its duties, the committee had access to the services of the chief audit officer, the chief risk officer and the group company secretary and external professional advisers. The chairman of the committee reported to subsequent meetings of the Board on the committee’s work and the Board received a copy of the minutes of each meeting of the committee. The chairman of the committee sits on the Audit and Remuneration committees to ensure that risk considerations are fully reflected in their decisions. External background During 2010 the economic and market environment remained challenging for the Group and the Board and the committee continued to concentrate on financial risk and capital and liquidity management. In particular the development of the Solvency II Directive and the resultant requirements of the new economic capital regime were an important area of focus.
Committee activities during 2010 The committee oversees all aspects of risk management in the Group, including market, credit, liquidity, insurance and operational, and their impact on both financial and non-financial goals. During the year the committee focused on the following areas:
Strengthening risk management across the Group: the committee approved a comprehensive Risk Plan (the Plan) which sets out the further steps needed to deliver leading standards of risk management at all levels of the business. The Plan is based on setting clear statements of risk appetite, especially for economic capital and liquidity, and rigorously managing all risk exposures within these limits. It allocates responsibilities for risk management between the first, second and third lines of defence, with a strong emphasis on the responsibilities of front-line management. The Group’s risk appetite has been thoroughly reviewed by the committee and the Board has approved a Group risk appetite statement which is being cascaded throughout the Group. The chief risk officer has overall responsibility for the Plan and reports regularly to the committee on progress against the Plan.
Preparing for Solvency II: the committee continued to oversee all aspects of the programme to implement the Solvency II Directive by the end of 2012. The Directive requires insurance companies to maintain an adequate surplus of economic capital (i.e. the capital required to ensure that a company’s liabilities can be met after defined risks have materialised). As well as requiring high standards of risk management (delivered by the Risk Plan – see above), the directive entails the development of sophisticated models to calculate economic capital requirements, and stress testing techniques to check and monitor actual levels of economic capital. The committee received regular progress reports on these matters throughout the year. It reviewed and approved the submission of the pre-application qualifying criteria assessment template required by the FSA as part of the Solvency II internal model approval process and reviewed the Quantitative Impact Study 5 results and the likely impact of Solvency II on the Group’s economic capital requirements and businesses.
Risk monitoring: the committee received regular reports on key risk exposures, the drivers of risk in the Group, emerging and potential risks, and actions taken to mitigate any risks that were out of appetite. Working with the Audit Committee, it also monitored the adequacy of the Group control framework. The committee focused particularly on monitoring the Group’s capital and liquidity positions against risk appetite, the results of stress and scenario testing, and the drivers of financial and insurance risks – since these give rise to the majority of the Group’s capital requirements under both the current (IGD and ICA) and the future (Solvency II) regimes. The committee continued its practice of inviting business unit and regional teams, led by their chief executive, to present on how risk is managed in their businesses. During the year, presentations were received from Aviva USA, Delta Lloyd and the UK Region.

113
Performance reviewCorporate responsibilityGovernanceShareholder informationFinancial statements IFRSFinancial statements MCEVOther information
Governance
Aviva plc Annual Report and Accounts 2010
Risk committee report continued
Group risk management policies: the committee approved significant changes to the Group Distribution policy, the Group Brand and Marketing policy and the Group Customer policy and received regular reports on compliance with Group policies.
Operational risks: the committee paid particular attention to business protection and IT security risks, and how business units were embedding the Group IT and Business Protection policies.
Regulatory risks and relationships: the committee received regular reports on compliance issues and regulatory and other public policy initiatives. In particular, it monitored the actions being taken by management in response to the FSA’s Risk Mitigation Programme and management responses to proposed changes in the prudential requirements for financial services companies.
Fraud and financial crime: the committee maintained regular oversight of compliance with controls against financial malpractice including fraud, and of the arrangements for employees to report in confidence any concerns about lack of probity (whistleblowing).
Internal controls: Internal Audit provided the committee with independent and objective assurance over the appropriateness, effectiveness and sustainability of the Company’s system of internal controls. Key control issues reported by Internal Audit to management and to the committee members were monitored on a quarterly basis until the risk exposure had been properly mitigated. The chart below shows how the committee allocated its time during 2010.
Risk Committee – Allocation of agenda time %
• Risk management and risk appetite 32• Group risk report and Group audit report 29• Solvency II and capital position and targets 11• Group internal capital assessment, IGD and economic capital 7• Business protection and IT security 3• Stress testing 3• Others (Group liquidity position, 2009 Report and Accounts, Group policies, Aviva USA update, Aviva Investors update, Delta Lloyd update, UK Risk Committee update) 15
More detail on the management of risk is contained in the Risk management section of the Performance review on pages 65 to 68. During the year the committee held several joint meetings with the Audit Committee and one with the members of the business unit audit committee in Spain. In line with the Combined Code requirement, the Board undertook a review of the effectiveness of all its committees during the year, including the Risk Committee. This report was reviewed and approved by the Board on 2 March 2011. Mary Francis Chairman, Risk Committee

114
Aviva plc Annual Report and Accounts 2010 Corporate responsibility committee report
This report provides details of the role of the Corporate Responsibility Committee and the work it has undertaken during the year. The purpose of the committee is to set guidance and direction for the Group’s corporate responsibility (CR) programme, review the Group’s key CR risks and opportunities and to monitor progress against the Group’s key performance indicators. The committee also reviews the Group’s strategy for CR together with the Group’s overall CR targets. The full terms of reference for the committee can be found on the Company’s website, www.aviva.com/investor-relations/corporate-governance/terms-of-reference, and are also available from the group company secretary. The following directors served on the committee during the year:
Period
Member From To
Carole Piwnica (Chairman) 14 January 2006 To date Euleen Goh Andrew Moss
1 January 2009 12 July 2007
To date To date
Lord Sharman 14 January 2006 To date Scott Wheway 5 December 2007 To date
Attendance Number of meetings held* 5 Carole Piwnica (Chairman) 5 Euleen Goh 4 Andrew Moss 4 Lord Sharman 5 Scott Wheway 4
*There were four scheduled committee meetings during 2010 and one additional meeting called at short notice.
The committee met on five occasions in 2010 and the members’ attendance record is set out above. The group company secretary acts as the secretary to the committee. During the year, the committee reviewed and approved the content and scope of the Company’s 2010 CR Report included in this annual report and accounts. It also continued to monitor the management of the CR risks affecting the Group and again reviewed each region’s performance and progress during the year against the Group’s key performance indicators together with the performance of Group functions such as Procurement and IT, which contribute to the Group’s CR programme activities. Internal Audit reported to the committee on the results of their reviews which were relevant to the CR activities of the Group and will continue to do so. In addition, going forward, external assurance to the committee will be provided by Ernst & Young LLP. The regional CR plans have been incorporated into the overall regional and functional strategies to facilitate the embedding of the CR strategy through formal accountabilities. There was continued focus on strengthening CR performance through employee engagement, by influencing key stakeholders and on embedding balanced leadership throughout the organisation. The committee received updates on the Group’s key CR programme activities such as the Street to School programme, on which there was an increased focus during the year; business ethics, particularly in preparation for the implementation of the UK Bribery Act; stakeholder recognition and the progress of the Group’s carbon offset projects as part of management’s commitment to be carbon neutral on a global basis. More recently, in line with the Board’s commitment to energy efficiency and reduction of waste in natural resources, the committee has supported the move towards paperless meetings. The chart opposite shows how the committee allocated its time during 2010.
The Company put its CR Report included in the 2009 annual report and accounts to an advisory vote of shareholders at the 2010 Annual General Meeting and intends to do this annually as a means of obtaining feedback on the report and the Company’s performance in this area. This year’s CR Report is set out on pages 75 to 92 and further details of the relevant resolution are set out in the Notice of AGM.
Corporate Responsibility Committee – Allocation of agenda time %
• Balanced leadership debate 5• Region review 26• Stakeholder recognition and business ethics 16• Street to School programme 16• Function review 21• Climate change response and carbon offsetting 5• CR reporting and assurance 11
Members of the committee are interviewed as part of the external assurance process for the CR programme and the subsequent management report, including Aviva’s action plan, is reviewed by the committee to assist in the strengthening and future direction of the programme. In line with the Combined Code requirement, the Board undertook a review of the effectiveness of all its committees during the year, including the Corporate Responsibility Committee. This report was reviewed and approved by the Board on 2 March 2011. Carole Piwnica Chairman, Corporate Responsibility Committee

115
Performance reviewCorporate responsibilityGovernanceShareholder informationFinancial statements IFRSFinancial statements MCEVOther information
Governance
Aviva plc Annual Report and Accounts 2010 Directors’ remuneration report
Highlights During 2010, the Company undertook a Strategic Reward Review which was overseen by the Remuneration Committee and
which comprehensively examined all elements of senior executive remuneration. This has allowed the Company to put to the 2011 Annual General Meeting proposals that reflect a thorough review of the Company’s remuneration package taking into account changing market and regulatory practice and the requirement to ensure that the package remains competitive. Details of these proposals are outlined in Section 2 of this report. The highlights of the changes are: – Fully revised remuneration principles; – Revised benchmarking group; – Simplified annual bonus structure; – Competitive Long Term Incentive Plans; and – New share ownership requirements.
The committee approved the executive directors’ (EDs’) request to freeze their basic salaries for 2010, for the second year in a row.
The financial and non-financial targets set for the 2010 annual bonus were met in part during the year. The combination of financial outcomes, along with those targets relating to employees, customers, and personal objectives mean the group chief executive received a 2010 bonus of 74.3% of his maximum opportunity (2009: 74.2%).
On 26 January 2010, Philip Scott retired from the Board. He continued to be employed by the Group until his retirement in July 2010. Further details of his leaving arrangements are disclosed in this report.
On 22 February 2010, Patrick Regan, chief financial officer, joined Aviva and the Board. Therefore, full information on his remuneration appears in this report for the first time.
On 19 January 2011, Andrea Moneta resigned from the Board and left the Company on 28 February 2011. Details of his leaving arrangements are disclosed in this report.
On 19 January 2011, Igal Mayer was appointed as chief executive, Aviva Europe and joined the Board. A summary of his annual remuneration is included in this report.
1. Introduction This report sets out the details of the remuneration policy for the Company’s directors, describes its implementation and discloses the amounts paid in 2010. In addition to meeting statutory requirements, particularly the regulations on directors’ remuneration reports made under the Companies Act 2006, the committee has complied with best practice guidelines, including guidance issued by the Association of British Insurers and the National Association of Pension Funds, in producing this report. Relevant sections of this report have been audited in accordance with the legislation. This report covers the following:
The committee’s objectives, membership and main activities in 2010; A review of Aviva’s remuneration policy and practice; Commentary on the alignment between remuneration, risk and Aviva’s business strategy and objectives; Details of the terms of executive directors’ (EDs) service contracts; Aviva’s share ownership policy with respect to EDs; Aviva’s policy on external board appointments; Aviva’s UK all employee share plans and share incentive plans; Aviva’s position against dilution limits; Remuneration of the non-executive directors (NEDs), and; Tables summarising the 2010 position on:
– Directors’ remuneration – EDs’ pension arrangements – Share incentive plans – Directors’ interests in shares
2. Strategic Reward Review Throughout 2010 the Company conducted a comprehensive review of senior executive remuneration. This was last conducted in 2005. The objectives of the review were:
To ensure remuneration is optimally designed to attract and retain senior executives To ensure remuneration is aligned with, and incentivise the achievement of, our strategic business aims whilst ensuring
appropriate risk taking To benchmark total compensation against suitable comparator groups to ensure remuneration is appropriately positioned
against market To ensure our reward plans comply with regulatory requirements
The review was led by the committee with input from the Human Resources function and senior management. In addition to the internal resources, market benchmarking and external commentary was provided by Hewitt New Bridge Street (HNBS) (primarily to the committee) and PricewaterhouseCoopers (PwC) (primarily to management). During the review, the committee and management agreed a set of Remuneration Principles and Remuneration Framework to be applied throughout the Company. These were then used to help guide the conclusions and remuneration structures which will be rolled out in 2011.

116
Aviva plc Annual Report and Accounts 2010 Directors’ remuneration report continued
Whilst the Financial Services Authority’s (FSA) Remuneration Code does not directly apply to Aviva plc (see section 6), both the committee and management have been very mindful of the external environment that has been the focus of many regulators across the globe. In particular, careful attention has been paid to the overall gearing of total remuneration (which will reduce in 2011) and the impact that risk has on each element of reward. The Strategic Reward Review concluded in December 2010 and the proposals outlined below will be fully implemented in 2011.
Key changes from Strategic Reward Review: to be implemented from 2011 The implementation of the Remuneration Principles above, has led to a range of changes to the remuneration elements across the Company. The critical changes and a summary of how these changes impact the group chief executive and the other EDs is shown below:
Revised benchmarking group: Since the previous reward review in 2005, the relevant benchmarking group for considering total compensation has been the lower quartile to median of the FTSE 30 and the median to upper quartile of the FTSE 50. The committee has decided to benchmark against a more sustainable peer group, ie. the median of a range of companies that are centered on Aviva. Therefore, our total compensation benchmark position from 2011 will be the 25 FTSE companies either side of Aviva’s market capitalisation. The absolute peer group will be reviewed annually based on the most up to date market data available.
Simplified annual bonus structure: In 2010, and in prior years, the financial component of the annual bonus (which comprises 50% of the total annual bonus opportunity) had multiple (typically seven) Key Performance Indicators (KPIs). In order to help drive a reward and performance culture, the number of KPIs will be ideally kept to a maximum of four. These will be disclosed in the Annual Report and Accounts following the relevant year end and will endeavour to reflect all relevant outcomes, behaviors and risk management actions sought by the Board.
Competitive Long Term Incentive Plans: As previously agreed by shareholders at the 2008 AGM, the 2010 One Aviva Twice the Value (OATTV) bonus award was the last award under the plan. Therefore no OATTV award will be made in 2011. The committee has carefully reviewed the total compensation benchmarking data and proposed revised standard long term incentive awards to ensure our packages remain competitive within the relevant market place, as well as representing value for the shareholder.
New share ownership requirements: The share ownership requirement of the group chief executive will be increasing from 175% to 200% of basic salary. In addition, members of the Executive Committee (EC) who are not EDs will also see the introduction of a 50% of basic salary share ownership requirement. In line with common market practice, no time limit will now be set in order for any member of the EC to meet these requirements. Instead 50% and 25% of the EDs’ and EC members’ respective share plan releases will be required to be held until such time as their requirement is met.
Table 1: Strategic Reward Review’s key changes to each element of remuneration for the EDs
Remuneration Element 2010 (included in this report) From 2011
Basic Salary / Total Remuneration benchmarking group
Lower quartile to median of the FTSE 30 and the Median to upper quartile of the FTSE 50
By reference to the median of 25 FTSE companies either side of Aviva’s market capitalisation
Annual Bonus Target 75% of basic salary Maximum 150% basic salary Multiple financial measures Two-thirds deferred into shares for three years
Unchanged target and maximum opportunity Financial measures limited to four, where possible No change to deferral arrangements
One Aviva Twice the Value CEO: Matches 100% of the deferred annual bonus ED: Matches 75% of the deferred annual bonus
Plan expired in 2010, as originally approved by shareholders in 2008
Long Term Incentive CEO: 175% standard award EDs: 150% standard award Performance measures: 50% Total Return MCEV ROCE, 50% Relative TSR 30% vests for threshold performance
CEO: 275% standard award EDs: 225% standard award Performance measures: 50%Operating IFRS ROCE, 50% Relative TSR (IFRS ROCE is considered a more stable balance sheet measure) 20% vests for threshold performance
Share Ownership Requirement CEO: 175% of basic salary EDs: 150% of basic salary To be fulfilled five years from date of appointment
CEO: 200% of basic salary EDs: 150% of basic salary EC: 50% of basic salary EDs must retain 50% of net share plan releases (EC 25%) until requirement is met

117
Performance reviewCorporate responsibilityGovernanceShareholder informationFinancial statements IFRSFinancial statements MCEVOther information
Governance
Aviva plc Annual Report and Accounts 2010
Directors’ remuneration report continued
3. The committee’s objectives The committee is a committee of the Board. Its terms of reference are available from the group general counsel and company Secretary and can be found on the Company’s website at www.aviva.com/terms-of-reference. The committee’s key objectives are to:
Establish a competitive remuneration package to attract, retain and motivate high quality leaders; Promote the achievement of both the Company’s annual plans and its strategic objectives by providing a remuneration
package that contains appropriately motivating targets that are within the Group’s risk appetite; and Align senior executives’ remuneration with the interests of shareholders and other stakeholders, including customers
and employees. The committee’s main responsibilities are to:
Recommend to the Board the Group’s remuneration policy for the EDs and members of senior management, covering basic salary, bonus, long-term incentives, retirement provisions, long-term wealth creation and other benefits;
Strike an appropriate balance between (i) the fixed and variable components and (ii) the cash, equity and equity related components of the total remuneration package;
Ensure the remuneration package is congruent with, and provides the incentives to realise, short and long term goals; Review and determine the terms of employment and remuneration of the individual EDs, including any specific recruitment or
severance terms; Assess and, within the broad policy from time to time approved by the Board, determine the remuneration terms of the
Chairman of the Board; Recommend to the Board the establishment of any employee share plans and exercise all the Board’s powers in relation to the
operation of all share incentive plans, including the granting of awards, the setting and testing of performance conditions (where appropriate), and any discretion on behalf of the Board regarding any material amendments to the plans’ rules not requiring the approval of shareholders;
Select, appoint and determine terms of reference for independent remuneration consultants to advise the committee on remuneration policy and levels of remuneration; and
Work with the Risk Committee to ensure that risk is properly considered in setting the overall remuneration policy for the Group and the remuneration of EDs and members of senior management.
4. Committee membership Table 2 below shows the directors who served as members of the committee during the year, all of whom are independent NEDs, and individuals who attended committee meetings:
Table 2: Members and attendees of the committee during 2010 Member Position Comments
Scott Wheway Chairman of the committee Member since 5 December 2007, chairman since 1 January 2009 Mary Francis Member Member since 25 January 2006 Carole Piwnica Member Member since 25 January 2006 Leslie Van de Walle Member Member since 24 September 2009 Attendee Position Comments
Lord Sharman Chairman of the Company Attended by invitation Andrew Moss Group chief executive Attended by invitation John Ainley Group HR director Attended as an executive responsible for advising on the
remuneration policy Graham Jones Group company secretary Attended as secretary to the committee Kirsty Cooper Deputy group company secretary Attended by invitation Tracey O’Rourke Group reward and HR policy director Attended as an executive responsible for advising on the
remuneration policy Martyn Fisher Group reward director Attended as an executive responsible for advising on the
remuneration policy David Rogers Chief accounting officer Attended to advise on matters relating to the performance measures
and targets for the Group’s share incentive plans Robin Spencer Chief risk officer Attended to advise on the management of risk within the
remuneration framework Representatives of Hewitt New Bridge Street (HNBS)
Attended by invitation as the committee’s independent adviser HNBS is part of AON, who provided insurance broking services to the Company in 2010
Representatives of PricewaterhouseCoopers (PwC)
Attended to advise management on relevant remuneration matters. PwC also provided consultancy services to the Group in 2010
No person was present during any discussion relating to their own remuneration. In addition to the members and attendees listed in Table 2 above, Deloitte LLP advised the committee on the calculation of Total Shareholder Return (TSR) in respect of the Long Term Incentive Plan (LTIP) vesting. Deloitte LLP also provided consultancy services to the Group in 2010. In line with Combined Code requirements, the Board undertook a review of the effectiveness of the committee during the year. Additionally, the committee reviewed its own performance and agreed steps to enhance its effectiveness and addressed the issues identified.

118
Aviva plc Annual Report and Accounts 2010 Directors’ remuneration report continued
5. Committee attendance and activities during 2010 The committee is required by its terms of reference to meet at least three times per year. In 2010, the committee met six times and the number of meetings attended by each committee member is shown in Table 3:
Table 3: Attendance
Number of meetings held 6 Scott Wheway (Chairman) 6 Mary Francis 6 Carole Piwnica 5 Leslie Van de Walle 5
The committee members also participated in five workshops throughout the year. The committee has a standing calendar of agenda items within its remit. In addition to these items, the committee discusses matters relating to the operation of the Group’s remuneration policy and emerging market practices. The chart below summarises the time allocated to various agenda items during 2010 and Table 4 below sets out the matters discussed by the committee:
Remuneration Committee – Allocation of agenda time %
• Strategic reward review 20• EDs’ salaries and bonuses 15• EDs’ objectives and Group targets 15• Share Plan amendments, awardsp and performance conditions 15• Discussions regarding Group
Risk input into compensation arrangements 10
• Other matters 25
Table 4: Matters discussed by the committee during its 2010 meetings Meeting Standing agenda items Other agenda items
January None Final approval of the Group’s stretch target for the 2010 financial year
March A review of EDs’ basic salaries and benefits in kind Assurance of non-financial bonus outcomes for 2009 Consideration and approval of EDs’ bonus awards for 2009
and approval of share awards under the Annual Bonus Plan (ABP)
A review and approval of Long Term Incentive Plan (LTIP) grants to the EDs and approval of the performance conditions for the 2010 grants
A performance test of subsisting LTIP grants A review of dilution limits A review and approval of recommendations on
contributions into the Aviva Capital Accumulation Plan (ACAP)
Approval of the 2009 Directors’ Remuneration Report Approval of the 2010 One Aviva Twice The Value Bonus
Plan (OATTV) grants EDs’ shareholding requirements A review and approval of the chairman’s fees
Approval of the HM Revenue and Customs Approved Options Schedule to the rules of the Aviva Executive Share Option Plan 2005
Approval of the Restricted Share Awards Schedule to the rules the ABP
Approval of the inclusion of clawback provisions in the rules of the ABP and LTIP
Approval of amendments to the committee’s terms of reference
Approval of the rules of the CFO Recruitment Share Awards Plan and the terms of the grants to be made to Patrick Regan
Discussion of the Strategic Reward Review
April None Discussion of the performance conditions for the 2010 OATTV grants
June None Approval of the early testing of performance conditions of the LTIP and OATTV Plan grants held by a good leaver
August A review of dilution limits Approval of an invitation to UK and Irish employees to
participate in the Aviva Savings Related Share Option Scheme or the Aviva Ireland Save As You Earn Scheme (SAYE Schemes)
Approval of the Aviva Investors’ Bonus Funding Discussion regarding Group Risk’s input into
remuneration arrangements Discussion of the Strategic Reward Review and the
approval of bonus weighting targets, benchmarking data and award levels under the LTIP
December Approval of the proposed 2011 financial, employee and customer targets for the operation of the ABP
Comment upon and noting of the EDs’ personal objectives for 2011
A review of the proposed approach to the 2010 Directors’ Remuneration Report
A review of the committee’s 2011 work plan
Further discussion regarding Group Risk’s input into compensation arrangements
Discussion regarding the Strategic Reward Review Approval of new share incentive plans subject to
shareholder approval
The committee members also participated in five workshops throughout the year to discuss the Strategic Reward Review’s progress and to review critical stages of its development.

119
Performance reviewCorporate responsibilityGovernanceShareholder informationFinancial statements IFRSFinancial statements MCEVOther information
Governance
Aviva plc Annual Report and Accounts 2010 Directors’ remuneration report continued
6. FSA Remuneration Code: Aviva Investors The FSA Remuneration Code does not apply to Aviva’s businesses with the exception of Aviva Investors and two small subsidiaries within the UK business. The Company is in full compliance with the Code’s requirements and expects Solvency II and other European-based legislation to further define requirements in this area in the future. Specifically, Aviva Investors’ policy on remuneration takes into account its status as a Tier 4 organisation as defined in the FSA Remuneration Code 2010, and as such is fully compliant with the Code. Aviva Investors’ reward principles and arrangements are designed to accurately and appropriately incentivise and reward employees for achieving stated business goals in a manner that is consistent with our approach to sound and effective risk management. Effective risk management is central to how the company and Aviva Investors perform and the risk profile of each business is also taken into account in compensation decisions. The approach to performance and reward is designed to drive sustainable performance, ensuring that remuneration policies support the business strategy and long term interests of the Company.
7. Future actions and changes The Company does not anticipate any significant changes to the structure of EDs’ compensation packages in 2011, other than those outlined in section 2 and as detailed below:
Changes to UK pension taxation Following announcements by the UK government during 2010, the Company is reviewing its approach to pension provisions for those employees whose pension contributions will exceed the newly reduced annual allowance (and from April 2012, the newly reduced Lifetime Allowance). The Company fully supports, where possible, the continued tax-efficient provision of retirement benefits. In addition, the manner in which contributions to the Aviva Capital Accumulation Plan (ACAP) will be taxed is also changing. In reviewing the ongoing retirement benefit plan changes, no arrangements will be entered into which materially increase the costs to the Company. Any impact of these proposals that is experienced by the EDs will be disclosed in the 2011 Annual Report and Accounts.
8. Alignment with Group strategy and target setting The committee considers alignment between Group strategy and the remuneration of its senior executives, including EDs, to be critical. It believes that senior executives should be highly rewarded (on a market competitive basis) for the delivery of stretching goals but should receive reduced rewards when the business performs poorly. The pay and employment conditions of employees of the Company and the Group were also taken into account when determining directors’ remuneration for the financial year, in addition to the Group Reward policies and framework. To achieve this alignment Aviva’s remuneration package is leveraged, with a suitable percentage of pay ‘at risk’ against the achievement of stretching goals, which is aligned with the Company’s risk profile and employee behaviour. Furthermore two-thirds of any bonus for EDs and EC members and any LTIP grants are delivered in the form of Aviva shares. In 2010, the element of deferred bonus that is matched under the OATTV Plan only vests if very demanding Earnings Per Share (EPS) targets are met. The requirements to defer bonus, participation in the LTIP and the OATTV Plan closely tie the long-term value of executive remuneration to the Company’s share price performance. Senior executives thus have high exposure to the same benefits and drawbacks of share price movement as all shareholders. The belief that senior executives should be shareholders is reinforced through formal guidelines requiring EDs to build up and maintain a significant holding of shares in the Company. Section 2 outlines the critical changes being implemented in 2011, following the Strategic Reward Review. The committee’s considerations shown below relate to reward decisions made in 2010.
The Group’s strategic priorities and targets are set out elsewhere in this report. Those priorities are reflected closely in the remuneration package.
The committee also considers how, given changing economic circumstances, the Group’s priorities, and consequently the targets underpinning its bonus structures, need to change. Financial targets sit alongside targets on customer advocacy and employee engagement that the committee believes are critical to long-term organisational health. The personal objectives of EC members are reviewed by the committee to ensure they adequately reflect the strategic aims of the Group, good governance and best practice.
Basic Salary: Internal and external equity in basic salary positioning is an important contributor to a motivational remuneration package. A range of market data is used to inform decision making taking into account the Company’s benchmarking policy with regard to the relevant FTSE market during 2010 and the new group of 25 FTSE companies either side of Aviva’s position for 2011 and beyond.
Annual Bonus Plan: Bonus structures are effective only if they drive, through the targets, the maintenance of the Company on a sound financial footing and sustained profitable growth. In addition, the targets must not provide an incentive to promote behaviours which could be detrimental to the Company’s long-term interests. Management must justify the targets it recommends. The committee is satisfied that the targets provide appropriate incentives, are sufficiently challenging, are aligned to shareholders’ interests and are within the Group’s risk appetite.
OATTV Plan: This plan was introduced to reward the growth in EPS. The plan, approved by shareholders in 2008, expired after the third annual grant. Therefore, the awards made in 2010 were the last awards under the plan.
LTIP: The LTIP encourages a longer-term management focus on Return on Capital Employed (ROCE) and relative TSR. These metrics measure how the Company is performing in both absolute and relative terms.

120
Aviva plc Annual Report and Accounts 2010 Directors’ remuneration report continued
The committee considers all these elements, plus pension and other benefits, as a whole. It looks to ensure that an appropriate balance is maintained between them so that the need for both short-term success and long-term sustainable growth is recognised. The committee also ensures that the non-financial business measures and individual objectives reflect adequately the Company’s environmental, social and governance responsibilities.
9. Constituent elements of reward as a percentage of total remuneration Tables 5a and 5b below show how the Group’s remuneration policy translates in practice into the group chief executive’s remuneration package for 2010 and 2011. The tables outline the contribution each element makes to overall compensation at both ‘Target’ and ‘Stretch’ levels of performance. More than half of EDs’ total remuneration is performance related. For the remainder of EDs, 44% of total remuneration is paid in cash for on ‘Target’ performance and 32% for ‘Stretch’ performance (excluding ACAP which EDs participate in to varied degrees, see Table 7).
Tables 5a: Breakdown of remuneration for group chief executive in 2010
Total remuneration elements
Target Salary27%
Bonus21%
OATTV14%
LTIP24%
ACAP14%
Stretch Salary15%
Bonus22%
OATTV30%
LTIP26%
ACAP7%
20% 40 60 80 100
Total remuneration elements
Target
Stretch Cash22%
Variable Cash8%
Shares70%
20% 40 60 80 100
Cash41%
VariableCash7%
Shares52%
Tables 5b: Breakdown of remuneration for group chief executive in 2011
Total remuneration elements
Target Salary28%
Bonus21%
LTIP37%
ACAP14%
Stretch Salary17%
Bonus26%
LTIP48%
ACAP9%
20% 40 60 80 100
Total remuneration elements
Target Cash41%
VariableCash7%
Shares52%
Stretch Cash26%
Variable Cash9%
Shares65%
20% 40 60 80 100 Tables 5a and 5b show the breakdown of the group chief executive’s remuneration package into its main constituent elements as well as the proportions of fixed cash, variable cash and shares. For this purpose, fixed cash includes basic salary and the discretionary ACAP payment. Variable cash is the one-third of bonus paid in cash annually. In 2010, the share element includes the two-thirds of the annual bonus deferred into shares, the OATTV Plan match and the LTIP.
2010 ‘Target’ performance means a target ABP outcome (75% of basic salary), a 50% vesting of the LTIP (87.5% of basic salary) and a 1:1 match from the OATTV Plan (50% of basic salary).
2010 ‘Stretch’ performance means a stretch ABP outcome (150% of basic salary), 100% vesting of the LTIP (175% of basic salary) and a 2:1 match from the OATTV Plan (200% of basic salary).
2011 ‘Target’ performance means a target ABP outcome (75% of basic salary) and a 50% vesting of the LTIP (137.5% of basic salary).
2011 ‘Stretch’ performance means a stretch ABP outcome (150% of basic salary) and 100% vesting of the LTIP (275% of basic salary).
The breakdown does not include any share price growth, the dividends payable on the ABP deferred shares and 2011 long-term incentive awards or other benefits (e.g. cash car allowance, value of private medical insurance (PMI) and all employee share ownership plans).

121
Performance reviewCorporate responsibilityGovernanceShareholder informationFinancial statements IFRSFinancial statements MCEVOther information
Governance
Aviva plc Annual Report and Accounts 2010
Directors’ remuneration report continued
10. Remuneration policy in practice for EDs Table 6, below, summarises Aviva’s remuneration policy as it is applied in practice to EDs.
Table 6: Remuneration Policy in practice Policy How delivered
Total remuneration Total remuneration package levels are informed by relevant pay data, in particular for 2010 the lower quartile to median range of the FTSE 30 and the median to upper quartile range of the FTSE 50. These reference points are chosen to reflect Aviva’s market capitalisation and comparability to other large, sophisticated multi-national companies and the positioning that is appropriate to Aviva in those different comparator groups. As outlined above, from 2011, this pay data will be based on the median of 25 FTSE companies, either side of Aviva’s market capitalisation.
Basic salary ABP OATTV Plan (2010 only) LTIP Long-term savings Aviva Staff Pension Scheme (ASPS) Benefits All employee schemes
Basic salary Benchmarked as for total remuneration but with positioning and progression taking account of individual and business performance and the levels of increase provided for the broader UK employee population (basic salaries of the UK staff increased by 2% on average in 2010). The committee takes seriously institutional investors’ concerns on the upward ratchet of basic salaries and is rigorous in its review of market position and salary.
Monthly in cash Reviewed annually in February, with
changes taking effect from 1 April.
ABP The ABP is intended to motivate executives to achieve the annual business plan, based on a series of key financial, employee and customer performance indicators (KPIs), which make up 70% of the bonus opportunity, and personal objectives which make up 30%. 75% of basic salary is payable for ‘on target’ performance and up to 150% for ‘stretch’ performance. Two-thirds of bonus is deferred into shares and the deferred shares vest on the third anniversary of the date of grant, subject to reduced vesting for certain leaver circumstances for deferrals made prior to March 2011. For all deferrals made from March 2011, on resignation during the three-year deferral period, all of the grant is forfeited. Additional shares are awarded at vesting in lieu of the dividends paid on the deferred shares during the deferral period.
Annually, one-third is paid in cash and
two-thirds in deferred shares.
OATTV Plan The OATTV Plan rewards executives for growth in EPS over a three-year period. As previously approved by shareholders, the 2010 award was the final award under this plan. The plan matches 100% of the deferred ABP shares for the group chief executive (75% for other EDs). For the 2010 awards, the vesting of these matched shares is dependent on the achievement of an EPS of 49.2 pence per share and then compounded annual growth targets as follows:
Less than 14.9% growth pa Nil 14.9% growth pa 0.1 for 1 57.5% growth pa 1 for 1
Matching is on a straight-line basis for performance from 14.9% to 57.5% and beyond, up to a maximum award of 2 for 1. No additional shares are awarded for the dividends paid during the three-year performance period on those shares that vest. The methodology for establishing the targets of each OATTV award was not adjusted following the financial crisis of 2008. Therefore, the outcome of each award is likely to be well below anticipated value.
Annually, a proportion of the deferred
element of the ABP is matched in shares. Shares vest based only upon the
achievement of demanding EPS growth targets.
LTIP The LTIP is intended to motivate the achievement of the Company’s longer-term objectives, to aid the retention of key personnel and to align executive interests to those of shareholders. In 2010 the group chief executive was eligible to receive an annual award of shares equal to 175% of basic salary. Other EDs were eligible to receive an annual award of shares equal to 150% of basic salary. From 2011 onwards, the standard awards will be 275% and 225% respectively. The Company operates a phantom scheme in the US for its US-based employees. Levels of awards reflect US market practice. For awards made prior to 2011, no additional shares are awarded for the dividends paid during the three-year performance period on those shares that vest. From 2011 onwards, dividend equivalent awards will be paid, in line with the current market practice.
Annual awards in shares that vest, subject
to ROCE and relative TSR performance conditions being met at the end of a three-year performance period.
Awards that do not vest lapse.
Long-term savings The Aviva Capital Accumulation Plan (ACAP) is a long-term savings vehicle which aids retention whilst recognising a need for flexibility in long-term wealth planning. Company contributions are discretionary and vary year on year, but would not normally exceed 50% of basic salary. Contributions for the EDs are shown in the table on page 135. No ED who participates in the ACAP is currently accruing benefits in the ASPS. A resignation or departure for breach of contract generally results in forfeiture of contribution for the relevant year.
Discretionary payments into a trust where
they are held for a minimum of five years.
ASPS The UK Aviva Staff Pension Scheme (ASPS) provides a competitive post-retirement package. Lump sum death in service benefit of four times basic salary is provided, as is a spouse’s or partner’s pension equal to two-thirds of actual or, on death in service and in certain other circumstances, prospective pension. Post-retirement increases are equivalent to the Retail Price Index up to a maximum of 10%. Retirement benefits can be accessed from age 60.
Deferred cash payable on retirement in the
form of a lump sum /monthly payment.

122
Aviva plc Annual Report and Accounts 2010 Directors’ remuneration report continued
Policy How delivered
Other benefits Other benefits are provided on a market competitive basis.
Cash car allowance PMI
CFO Recruitment Share Awards Plan The CFO Recruitment Share Awards Plan was approved by the committee in 2010 for the granting of one-off share awards to Patrick Regan as part of the recruitment offer made to him. The following awards were granted to Mr Regan under the rules of this plan and are subject to clawback provisions:
Replacement Restricted Share Award (RRSA) with a grant value of £1.65 million to compensate for the loss of unvested Willis Group Holdings Limited restricted shares and share options.
Bonus Replacement Deferred Share Award (BRDSA) with a grant value of £283,333, two-thirds of the compensation for the loss of bonus which would have been paid to Mr Regan by Willis Group Holdings Limited for the 2009 financial year.
One Aviva, Twice the Value Award (OATTV) with a grant value of 75% of the BRDSA.
RRSA will vest in three equal tranches on
the first, second and third anniversaries of Mr Regan’s employment start date, subject to Mr Regan’s performance being considered to be at least ‘Mid Range’, as assessed by the chairman of the Company and the group chief executive, and no dealing restrictions being in place on the vesting date. Otherwise the principal terms of the RRSA are generally the same as those of the ABP, except that on cessation of employment, Mr Regan’s unvested awards will generally lapse unless he leaves by reason of death, ill-health, injury, disability, redundancy or a sale of an employing subsidiary or business.
BRDSA will vest under the same terms as outlined above for the ABP and is therefore not subject to performance conditions.
OATTV will vest under the same terms as outlined above for the OATTV Plan.
Awards granted under the CFO Recruitment Share Awards Plan are not pensionable. Any amendments to the plan which are to the advantage of the participant (other than certain minor amendments) are subject to shareholder approval.
11. Overview of the effect on EDs during 2010 The effect of these policies in 2010 for EDs is set out in Table 7 below. It should be emphasised that the figures shown for both the OATTV Plan and the LTIP grant represent the face value of those awards on the date of grant. The OATTV Plan and LTIP grant would only be realised if very stretching performance conditions were to be met. Details on pension benefits are set out later in this report.
Table 7: Overview of current EDs’ remuneration Andrew Moss, group chief executive Element Amount Commentary**
Basic Salary £925,000 during the year Mr Moss requested not to receive an increase to his basic salary in 2010.
ABP
£1,031,144 (111.5% of basic salary) (£343,715 delivered in cash and £687,429 deferred into shares for three years)
Bonus is a function of the degree of achievement of 2010 targets as follows: Financial 40.8% (maximum 50%) Employee 0.9% (maximum 10%) Customer 5.9% (maximum 10%) Personal 26.7% (maximum 30%)
OATTV Plan £686,196 The face value of 100% of the two-thirds deferred element of 2009 annual bonus.
LTIP – Face Value of grant £1,618,750 The face value of the grant represented 175% of basic salary on 28 February 2010.
ACAP
£462,500
The Trustee of the Plan accepted Aviva’s recommendation and made an award into the plan equivalent to 50% of Mr Moss’ basic salary as at 1 April 2010.
Other Benefits
£19,000 cash car allowance 2% basic salary cash supplement PMI
Mr Moss receives 2% of basic salary as a non-pensionable cash supplement provided in consideration of his surrendering his Unapproved Unfunded Retirement Benefit (UURB) promise at the point when accrual in the ASPS ceased.
** Percentages do not necessarily add up due to rounding

123
Performance reviewCorporate responsibilityGovernanceShareholder informationFinancial statements IFRSFinancial statements MCEVOther information
Governance
Aviva plc Annual Report and Accounts 2010
Directors’ remuneration report continued
Philip Scott, chief financial officer* Element Amount Commentary**
Basic Salary £41,935 during the year. Mr Scott requested not to receive an increase to his annual basic salary of £600,000 in 2010.
ABP £25,755 (60% of pro rata basic salary)
Bonus disclosed is proportional to time served as an ED.
ASPS Membership of the ASPS Mr Scott has a fully accrued pension equivalent to two-thirds of his pensionable salary at retirement. He therefore no longer accrues service-related benefits but does continue to accrue additional benefits as a result of pensionable salary increases.
Other Benefits £1,127 cash car allowance during the year PMI £2,875 in legal fees
Legal fees were paid directly to Mr Scott’s solicitor for advising Mr Scott on his departure terms.
* Philip Scott retired from the Board on 26 January 2010 and the information shown is for the period served as an ED in 2010. ** Percentages do not necessarily add up due to rounding.
Patrick Regan, chief financial officer* Element Amount Commentary**
Basic Salary £511,539 during the year. Mr Regan commenced employment on 22 February 2010 with an annual basic salary of £600,000.
ABP
£668,850 (111.5% of basic salary) (£222,950 delivered in cash and £445,900 deferred into shares for three years)
Bonus is a function of the degree of achievement of 2010 targets as follows: Financial 40.8% (maximum 50%) Employee 0.9% (maximum 10%) Customer 5.9% (maximum 10%) Personal 26.7% (maximum 30%)
LTIP – Face Value of grant £900,000 The face value of the grant represented 150% of Mr Regan’s basic salary on 28 February 2010.
CFO Recruitment Share Awards Plan
RRSA
BRDSA
OATTV
£1,650,000 £283,333 £212,500
RRSA was granted over Restricted Shares and will vest in three equal tranches per year over a three-year period. The grant is compensation for the loss of share awards and share options from previous employer (see section 10 for more details). BRDSA was granted over Restricted Shares and will vest on third anniversary of the date of grant (see section 10 for more details). The face value of 75% of the BRDSA. Vests subject to performance condition outcome of 2010 OATTV award (see section 10 for more details).
Defined Contribution Pension See section 23 for details.
Other Benefits
£13,811 cash car allowance during the year PMI £141,667 compensation for loss of bonus from previous employer
Annual car allowance of £16,200. Mr Regan received £425,000 compensation for loss of bonus from previous employer. This payment was paid one-third in cash (£141,667) with the remaining £283,333 deferred into restricted shares for three years (BRDSA as detailed above).
* Patrick Regan joined the Company and Board on 22 February 2010 ** Percentages do not necessarily add up due to rounding.

124
Aviva plc Annual Report and Accounts 2010 Directors’ remuneration report continued
Mark Hodges, CEO, Aviva UK Element Amount Commentary**
Basic Salary £600,000 during the year. Mr Hodges’ basic salary increased to £600,000 on 1 January 2010 to reflect his increased responsibilities across the UK business.
ABP
£695,490 (115.9%% of basic salary) (£231,830 delivered in cash and £463,660 deferred into shares for three years)
Bonus is a function of the degree of achievement of 2010 targets as follows: Financial 42.6% (maximum 50%) Employee 0.0% (maximum 10%) Customer 8.1% (maximum 10%) Personal 26.7% (maximum 30%)
OATTV Plan £251,264 The face value of 75% of the two-thirds deferred element of 2009 annual bonus.
LTIP – Face Value of grant £900,000 The face value of the grant represented 150% of Mr Hodges’ basic salary on 28 February 2010.
ACAP
£300,000
The Trustee of the Plan accepted Aviva’s recommendation and made an award into the plan equivalent to 50% of Mr Hodges’ basic salary as at 1 April 2010.
Other Benefits £16,200 cash car allowance PMI
**Percentages do not necessarily add up due to rounding.
Andrea Moneta, CEO, Aviva Europe, Middle East and Africa* Element Amount Commentary**
Basic Salary €780,000 during the year (£668,925) Mr Moneta requested not to receive an increase to his basic salary in 2010.
ABP
€500,000 (64.1% of basic salary) delivered in cash
Mr Moneta’s bonus is in line with European 2010 performance.
OATTV Plan €424,330 The face value of 75% of the two-thirds deferred element of 2009 annual bonus.
LTIP – Face Value of grant €1,170,000 The face value of the grant represented 150% of Mr Moneta’s basic salary on 28 February 2010.
ACAP
€202,191
The Trustee of the Plan accepted Aviva’s recommendation and made an award into the plan equivalent to 27% of Mr Moneta’s basic salary as at 1 April 2010.
Other Benefits
€21,500 cash car allowance during the year €400,000 compensation for loss of earnings, options and performance shares from previous employer €112,000 housing allowance per annum for three years €30,000 schooling allowance PMI (Based on average exchange rate for 2010 of €1.16605 : £1.00)
A further €400,000 compensation is payable for loss of earnings, options and performance shares from a previous employer in March 2011. €112,000 annual housing allowance, grossed up for tax purposes.*** €30,000 annual schooling allowance payable up to the end of secondary schooling, grossed up for tax purposes.***
*Andrea Moneta resigned from the Board on 19 January 2011. **Percentages do not necessarily add up due to rounding. ***These exceptional other benefits were provided to replicate pre-existing obligations and are time-limited.
12. Target setting ABP – target setting The financial targets which underpinned the ABP (accounting for 50% of annual bonus) in 2010 were derived from Aviva’s return, growth and capital efficiency/capital generation goals. Employee and customer targets (each accounting for up to 10% of annual bonus) are set taking into account performance to date and aspirations for the future. The employee targets on leadership and engagement are derived from the Group’s employee promise survey in which all business units participate and which over 36,907 staff completed in 2010. This survey is delivered through an independent third party who is able to provide extensive external benchmark data. The Company’s aspiration is to reach the upper quartile positions compared to the relevant global and national norms on leadership and engagement over time. In 2010, all businesses measured customer advocacy using a consistent robust methodology undertaken by an independent global research agency. All business units now have customer advocacy targets in place for 2011. The Company’s aspiration is to reach the upper quartile in the relevant local market benchmark. Internal assurance that the outcomes on employee and customer targets were accurately calculated and reported was provided to the committee by Group Audit.

125
Performance reviewCorporate responsibilityGovernanceShareholder informationFinancial statements IFRSFinancial statements MCEVOther information
Governance
Aviva plc Annual Report and Accounts 2010
Directors’ remuneration report continued
Personal objectives based on delivery of key strategic priorities, personal leadership and operating performance of the relevant portion of the business account for up to 30% of annual bonus. Carbon emissions targets are also included as part of the EDs’ role profile. The Group’s performance against its financial, employee and customer KPIs in 2010, as they affected the bonus of the Group Chief Executive, is shown in Table 8.
Table 8: Group performance in 2010 against its KPIs
Weighting (% of total bonus opportunity)
Key performance indicators On target
(%) Stretch
(%)
Actual payment
(%)
Business measures (70%) Volume – Total long-term savings 2.5 5.0 2.5
Volume – Net written premium 2.5 5.0 2.4
IFRS operating profit 7.5 15.0 15.0
MCEV operating profit 2.5 5.0 5.0
New business margin 2.5 5.0 2.5
Combined Operating Ratio (COR) 2.5 5.0 4.4
Cost savings (expense base) 5.0 10.0 9.0
Customer 5.0 10.0 5.9
Employee 5.0 10.0 0.9
Personal measures (30%) Personal – individual strategic 15.0 30.0 26.7
Total 50.0 100.0 74.3
The committee remains sensitive to the external environment in relation to executive pay, and particularly relating to the payment of bonuses in circumstances where financial targets have not been met and share prices have fallen. However, the combination of financial and non-financial measures is central to the structure of the ABP. The committee wants to ensure a balanced focus on both short-term financial performance and on the objective non-financial measures that are leading indicators of future financial success. This balance is, in the committee’s view, reflective of good practice in incentive design and is consistent with the FSA’s guidance on creating incentive schemes that have a focus on long-term sustainable performance and considerate of the risk environment. Aviva appropriately incentivises and rewards employees for achieving stated business goals in a manner that is consistent with our approach to sound and effective risk management. As described above, the committee took the view that it was important to maintain the integrity of the financial targets for the EDs, and so these were not adjusted during the year. In the same way, the committee believes that it is appropriate to pay bonuses based on pre-agreed rigorous targets when these have been met. To align with the business priorities for 2011, the financial measures at Group level for 2011 are IFRS Operating Profit, Net Operating Capital Generation, Internal Rate of Return and Total Sales (which are not set a stretch target in line with relevant risk considerations).
LTIP – Target Setting The LTIP vests subject to the degree of achievement of two equally weighted performance measures, chosen to reflect shareholders’ long-term interest, in absolute ROCE and relative TSR performance.
ROCE targets ROCE targets determine the vesting of 50% of any LTIP award and are set annually within the context of the Company’s three-year business plan. Vesting depends upon performance over the three-year period against a target return. The Company’s external auditor provides a formal opinion on the ROCE vesting calculation. The 2010 LTIP award ROCE targets are set out in Table 9 below:
Table 9: 2010 LTIP ROCE Targets ROCE over the three-year performance period Percentage of shares in award that vests based on achievement of ROCE targets
Less than 31.5% 0% 31.5% 15% Between 31.5% and 37.5% Pro rata between 15% and 50% on a straight line basis 37.5% and above 50%

126
Aviva plc Annual Report and Accounts 2010 Directors’ remuneration report continued
TSR Targets Relative TSR determines the vesting of the other 50% of any LTIP award. The comparator group for the assessment of relative TSR performance at the time of the 2010 grant comprised Aegon, Allianz, Axa, Fortis, Generali, ING, Legal and General, Lloyds Banking Group, Prudential, Resolution Limited, Royal Bank of Scotland, Royal and Sun Alliance, Standard Life and Zurich. Friends Provident had been delisted by the time the 2010 grant was made and so was not included in the comparator group. Resolution Limited was added to the comparator group for the 2010 grant. TSR vesting operates as set out in Table 10 below:
Table 10: TSR vesting schedule for the 2010 award TSR position over the three-year performance period Percentage of shares in award that vests based on achievement of TSR targets
Below median 0% Median 15% Between median and upper quintile Pro rata between 15% and 50% on a straight line basis Upper quintile and above 50%
The same targets will apply for the 2011 LTIP awards, except ROCE will be measured on an Operating IFRS basis. The comparator group will remain unchanged. The committee has agreed a shortlist of companies that would be considered for inclusion in the comparator group, subject to final review, should any member of the group be delisted. 2011 LTIP and future awards will vest at 20% for threshold performance (down from 30%). Details of subsisting LTIP awards are provided on page 128 and Table 11 below shows the vesting projections (non-audited) of those awards as at 31 December 2010.
Table 11: Projections of vesting of subsisting LTIP awards LTIP award 31 December 2010 vesting projection (% of award)
Aviva LTIP 2010 50% Aviva LTIP 2009 79.6% Aviva LTIP 2008 72.3%
Details of the assumptions used in valuing the LTIP for accounting purposes can be found on page 242 of this report. The vesting assumption made in respect of the 2011 award for accounting purposes is 50%. Since the LTIP has performance conditions attached to it, one potential outcome is that neither performance condition is met and the whole of the LTIP lapses. Table 12 below has been drawn up to assist in understanding the potential value of the LTIP awards made to EDs in 2010 should the performance conditions be met in part or in whole.
Table 12: Potential value of 2010 LTIP awards (rounded to nearest £50) LTIP Andrew Moss Patrick Regan Mark Hodges Andrea Moneta*
£ £ £ £ Face Value of grant 1,618,750 900,000 900,000 1,003,400 Threshold Vesting 485,650 270,000 270,000 301,000 Expected Value 936,950 520,900 520,900 580,800 Maximum Vesting 2,154,550 1,197,900 1,197,900 1,335,500 * Figures shown for Mr Moneta have been converted from euro to pound sterling at the average exchange rate for 2010 of €1.16605:£1.00
Assumptions are as follows:
Threshold vesting assumes TSR and ROCE elements vest at the minimum level, producing a 30% vesting of the total award. No share price growth is assumed;
Expected value, based on the vesting assumption made for accounting purposes, assumes TSR and ROCE elements vest at a combined rate of 50% of the total award. Share price growth of 5% per annum is assumed over the three-year performance period;
Maximum vesting assumes both TSR and ROCE elements vest in full, producing a 100% vesting. Share price growth of 10% per annum is assumed over the three-year performance period.
At the end of the performance period for the 2007 LTIP grant, which vested in 2010, the Company was ranked ninth out of the 16 companies in the TSR comparator group (0% vesting) and ROCE was 39.0% (50% vesting of the whole award). The total vesting was therefore 50%. The 50% of the award which did not vest lapsed. The LTIP vesting history is set out in Table 13 below. Prior to the 2005 award, vesting history is based on an earlier LTIP plan, and the last award made under this plan was in 2004.

127
Performance reviewCorporate responsibilityGovernanceShareholder informationFinancial statements IFRSFinancial statements MCEVOther information
Governance
Aviva plc Annual Report and Accounts 2010
Directors’ remuneration report continued
Table 13: Vesting history of LTIP awards Percentage of award vesting
Year of grant Performance period ROCE TSR Total
2002 January 2002 to December 2004 23.3 23.0 46.3 2003 January 2003 to December 2005 30.0 34.9 64.9 2004 January 2004 to December 2006 30.0 34.9 64.9 2005 January 2005 to December 2007 50.0 0.0 50.0 2006 January 2006 to December 2008 41.3 15.0 56.3 2007 January 2007 to December 2009 50.0 0.0 50.0
Aviva does not historically award additional shares for the dividends that were paid during the three-year performance period on those shares that vest. As outlined earlier in this report, the awards that will vest from the 2011 LTIP grants onwards will attract dividends, which is aligned to current market practice.
2008-2010 LTIP and OATTV Plan: Performance outcome for group chief executive The 2008 Annual Report disclosed the face value of the LTIP and OATTV Plan awards granted to all EDs. The face value of the LTIP and OATTV awards granted to the group chief executive were £1,540,000 and £568,891 respectively. The total actual value of the awards that will vest is £719,689, based on the performance condition outcome and assuming a share price of 393p (which was the closing middle market price of an ordinary share of the Company on 31 December 2010).
Performance graph Table 14 below compares the TSR performance of the Company over the past five years with the TSR of the FTSE 100 Return Index. This index has been chosen because it is a recognised equity market index, of which Aviva is a member. The companies which comprise the current LTIP comparator group for TSR purposes were chosen on the basis of product and geographic match to Aviva and are listed above. The TSR graph for the comparator group has been plotted using the 20 companies (including Aviva) in the comparator group for pre-2005 grants, the 15 companies (including Aviva) in the comparator group for 2005–07 grants, the 16 companies (including Aviva) in the comparator group for the 2008 grant, and the 15 companies (including Aviva) in the comparator group for the 2009 and 2010 grants.
Table 14: Aviva plc five-year TSR performance against the FTSE 100 Index and the median of the comparator group
Aviva FTSE 100 Comparator Group Median
200
150
100
50
0
Dec 10Dec 09Dec 08Dec 07Dec 06
TSR
(reba
sed
to 1
00)

128
Aviva plc Annual Report and Accounts 2010 Directors’ remuneration report continued
13. Share awards Table 15 below sets out the current position of those share-based awards made to EDs under current remuneration arrangements.
Table 15: LTIP, ABP, OATTV Plan and CFO Recruitment Share Awards Plan awards
At 1 January 2010
Number
Awards granted during year
Number
Awards vesting during year
Number
Awards lapsing during year
Number
At 31 December
2010 Number8
Market price at date awards
granted1 Pence
Market price or sale price at date
awards vested Pence
Normal Vesting Date
Andrew Moss Aviva Long Term Incentive Plan
2007 136,540 — 68,2706 68,270 0 778.50 401.60 Mar-10 2008 253,289 — — — 253,289 617.50 Mar-11 2009 632,324 — — — 632,324 245.00 Mar-12 2010 — 419,365 — — 419,365 387.70 Mar-13 Aviva Annual Bonus Plan
2007 64,273 14,2587 78,5316 — 0 778.50 401.60 Mar-10 20089 93,567 — 38,459 — 55,108 617.50 386.87 Mar-11 20099 195,876 — 80,511 — 115,365 245.00 386.87 Mar-12 201010 — 177,770 73,068 — 104,702 387.70 386.87 Mar-13 One Aviva Twice the Value Bonus Plan
2008 93,567 — — — 93,567 598.00 Mar-11 2009 195,876 — — — 195,876 245.00 Mar-12 2010 — 177,770 — — 177,770 387.70 Mar-13 Philip Scott Aviva Long Term Incentive Plan
2007 107,282 — — — 107,282 778.50 Mar-10 2008 140,625 — — — 140,625 617.50 Mar-11 2009 351,562 — — — 351,562 245.00 Mar-12 Aviva Annual Bonus Plan
2007 58,647 — — — 58,647 778.50 Mar-10 2008 70,312 — — — 70,312 617.50 Mar-11 2009 127,054 — — 127,054 245.00 Mar-12 One Aviva Twice the Value Bonus Plan
2008 52,734 — — — 52,734 598.00 Mar-11 2009 95,291 — — — 95,291 245.00 Mar-12 Patrick Regan11 Aviva Long Term Incentive Plan
2010 — 233,160 — — 233,160 387.70 Mar-13 CFO Recruitment Share Awards Plan
2010 (RRSA)12 — 433,959 178,370 — 255,589 394.20 395.70 Feb-11, 12, 1313
2010 (BRDSA)12 — 73,402 30,171 — 43,231 387.70 386.87 Mar-13 2010 (OATTV) — 55,051 — — 55,051 387.70 Mar-13

129
Performance reviewCorporate responsibilityGovernanceShareholder informationFinancial statements IFRSFinancial statements MCEVOther information
Governance
Aviva plc Annual Report and Accounts 2010
Directors’ remuneration report continued
At 1 January 2010
Number
Awards granted during year
Number
Awards vesting during year
Number
Awards lapsing during year
Number
At 31 December
2010 Number8
Market price at date awards
granted1 Pence
Market price or sale price at date
awards vested Pence
Normal Vesting Date
Mark Hodges Aviva Long Term Incentive Plan
2007 56,892 — 28,4466 28,446 0 778.50 401.60 Mar-10 2008 97,450 — — — 97,450 617.50 Mar-11 2009 304,687 — — — 304,687 245.00 Mar-12 2010 — 233,160 — — 233,160 387.70 Mar-13
Aviva Annual Bonus Plan
2007 37,366 8,2897 45,6556 — 0 778.50 401.60 Mar-10 20089 55,785 — 22,930 — 32,855 617.50 386.87 Mar-11 20099 138,561 — 56,952 — 81,609 245.00 386.87 Mar-12 201010 — 86,792 35,674 — 51,118 387.70 386.87 Mar-13
One Aviva Twice the Value Bonus Plan
2008 41,838 — — — 41,838 598.00 Mar-11 2009 103,921 — — — 103,921 245.00 Mar-12 2010 — 65,094 — — 65,094 387.70 Mar-13
Andrea Moneta Aviva Long Term Incentive Plan
2009 249,023 — — — 249,023 245.00 Mar-12 2010 — 265,425 — — 265,425 387.70 Mar-13
Aviva Annual Bonus Plan
2009 159,375 — — — 159,375 245.00 Mar-12 2010 — 128,350 — — 128,350 387.70 Mar-13
One Aviva Twice the Value Bonus Plan
2009 119,531 — — — 119,531 245.00 Mar-12 2010 — 96,263 — — 96,263 387.70 Mar-13
Notes 1. The actual price used to calculate the ABP and LTIP awards is based on a three day average closing middle market price of an ordinary share of the Company. These were in 2007: 769p; 2008: 608p; 2009: 256p; 2010: 386p. The three day
average closing middle market price of an ordinary share of the Company used to grant the 2008 OATTV Plan awards was 617p; in 2009 was 256p; and in 2010 was 386p. The five day average closing middle market price of an ordinary share of the Company used to grant the RRSA in 2010 was 380.22p.
2. The performance period for all awards begins at the commencement of the financial year in which the award is granted. 3. The performance conditions for awards granted and vested during 2010 are explained elsewhere in this report. 4. The monetary value of awards will be calculated by multiplying the relevant number of shares by the closing middle market price of an ordinary share of the Company at the date of vesting. 5. The award date for the awards granted in 2007 which vested in 2010 was 23 March 2007. 6. The awards granted in 2007 that vested in 2010 were released with the net amount being settled in shares and the balance settled in cash and used to pay the resulting tax liability. 7. These figures relate to shares issued in lieu of dividends accrued during the deferral period. 8. The information shown for Philip Scott is as at his retirement from the Board on 26 January 2010. 9. Andrew Moss and Mark Hodges elected for their ABP conditional share awards granted in 2008 and 2009 to be exchanged on 30 March 2010 for equivalent awards in respect of restricted shares. The awards vesting during the year in respect
of these awards were released and sold on 30 March 2010 to cover the tax liability due on the exchange. The remaining restricted shares continue to be subject to the terms of the original awards. 10. Andrew Moss and Mark Hodges elected for their 2010 ABP awards to be granted as restricted shares. The awards vesting during the year in respect of these awards were released and sold on 30 March 2010 to cover the tax liability due at
grant. The remaining restricted shares are subjected to forfeiture conditions until 30 March 2013. 11. Patrick Regan joined the Board on 22 February 2010 and held no share awards on appointment. 12 Patrick Regan elected for his RRSA award and BRDSA award to be granted as restricted shares. The awards vesting during the year in respect of the RRSA and BRDSA were released and sold on 11 March 2010 and 30 March 2010 respectively
to cover the tax liabilities due at grant. The remaining restricted shares are subjected to forfeiture conditions until 30 March 2013, in respect of the BRDSA, and 22 February 2011 (one-third), 22 February 2012 (one-third) and 22 February 2013 (one-third) in respect of the RRSA.
13. The first tranche of the RRSA will vest on the first dealing day when there are no dealing restrictions in place. 14. The aggregate net value of share awards granted to the directors in the period was £9.510 million (2009: £5.256 million). The net value has been calculated by reference to the closing middle market price of an ordinary share of the Company
at the date of grant.

130
Aviva plc Annual Report and Accounts 2010 Directors’ remuneration report continued
14.Share options Details of the EDs who were in office for any part of the financial year, and hold or held options over ordinary shares of the Company, pursuant to the Company’s share based incentive plans, are set out in Table 16 below. Savings-related share options in Table 16 refer to options granted under the HMRC approved Aviva Savings Related Share Option Scheme. Options are normally exercisable during the six-month period following the end of the relevant (three-, five- or seven-year) savings contract. Executive share options (approved) in Table 16 refer to options granted under the HMRC approved schedule to the Aviva Executive Share Option Plan 2005. Options will be exercisable on 30 March 2013 to the extent that the LTIP awards granted in 2010 have vested. Any gain made on exercise of these options will be used to reduce the number of shares vesting under the LTIP. Therefore, the vesting of the options will not increase the overall number of shares received by the EDs from their LTIP awards.
Table 16: EDs’ options over Company shares
At 1 January 2010
Number
Options granted during year
Number
Options exercised
during year Number
Options lapsing
during year Number
At 31 December 2010
Number2 Exercise Price
Pence Exercise Period
Mark Hodges Savings-related options 2007 1,705 — — — 1,705 563.0 December 2010 –
May 2011 Executive share options (approved) 2010 — 7,772 — — 7,772 386.0 March 2013
Andrew Moss Savings-related options 2005 3,279 — — — 3,279 491.0 December 2010 –
May 2011 Executive share options (approved) 2010 — 7,772 — — 7,772 386.0 March 2013 Patrick Regan1
Savings-related options 2010 — 2,903 — — 2,903 310.0 December 2013 – May 2014
Executive share options (approved) 2010 — 7,772 — — 7,772 386.0 March 2013
Philip Scott2 Savings-related options 2008 2,341 — — — 2,341 410.00 December 2011 –
May 2012
Notes 1 Patrick Regan joined the Board on 22 February 2010 and held no share options on appointment. 2. The information shown for Philip Scott is as at his retirement from the Board on 26 January 2010
The closing middle market price of an ordinary share of the Company on 31 December 2010, being the last business day of the year, was 393p, and the closing middle market price of an ordinary share of the Company during the year ranged from 294.2p to 423.5p. During the year, no share options were exercised by directors (2009: nil options exercised). EDs did not pay for the award of any share options and options were not subject to performance conditions (the savings related options being granted under an all-employee share scheme and the executive share options being linked to awards under the LTIP which are subject to performance conditions).
15. EDs’ service contracts Service contracts agreed with each ED incorporate their terms and conditions of employment. The key terms are set out in Table 17 below.
Table 17: EDs’ key terms and conditions of employment Provision Policy
Notice period By the director By the Company
6 months. 12 months, rolling. No notice or payment in lieu to be paid where the Company terminates for cause.
Termination payment Pay in lieu of notice up to a maximum of 12 months’ basic salary. This may be increased by a discretionary redundancy payment (where appropriate) but any such further termination payment is capped at 12 months’ basic salary. Any amount is subject to phased payment and mitigation requirements.
Remuneration and benefits As described in this report the operation of the ABP, the OATTV Plan and LTIP is at the Company’s discretion and, in the case of the long-term savings plans, at the trustees’ discretion.
Expenses Reimbursement of expenses reasonably incurred in accordance with their duties.
Holiday entitlement 30 working days plus public holidays.
Sickness In line with senior management terms, i.e. 100% basic salary for 52 weeks, and 75% thereafter.
Non-compete During employment and for six months after leaving.
Contract dates Director Andrew Moss Mark Hodges Andrea Moneta Patrick Regan
Date current contract commenced 1 January 2007 26 June 2008 28 September 2009* 22 February 2010
*Andrea Moneta resigned from the Board on 19 January 2011

131
Performance reviewCorporate responsibilityGovernanceShareholder informationFinancial statements IFRSFinancial statements MCEVOther information
Governance
Aviva plc Annual Report and Accounts 2010
Directors’ remuneration report continued
16. Share ownership requirements An internal shareholding requirement was introduced in 2005 that the group chief executive and any ED should build, over a five-year period, a shareholding in the Company equivalent to 175% of basic salary and 150% of basic salary respectively and no specific value per share was designated for the calculation. As outlined in section 2, the shareholding requirement in 2011 is increasing to 200% for the Group Chief Executive. In addition, the EDs will be required to retain 50% of the net share releases from the deferred annual bonuses and LTIPs until the shareholding requirements have been reached, which will not have a target date. Shares held in compulsory bonus deferrals and performance shares held in unvested LTIPs are not taken into account in applying this test. Table 18 shows the position at 31 December 2010, based on that day’s closing middle market price of an ordinary share of the Company of 393 pence.
Table 18: EDs’ share ownership requirements
Basic salary Shareholding excluding restricted
shares Value of shareholding Percentage of basic salary Shareholding requirement
Andrew Moss1 £925,000 326,460 £1,282,988 139% 175% Patrick Regan2 £600,000 — — 0% 150% Mark Hodges2 £600,000 183,155 £719,799 120% 150% Andrea Moneta3 €780,000 394 £1,548 0% N/A
Notes 1. Andrew Moss did not meet the internal shareholding requirement target of 150% of salary by April 2010, although he is on target to meet 175% of salary by July 2012 through the vesting of share awards. 2. Patrick Regan and Mark Hodges are on target to meet 150% of salary by their target dates through the vesting of share awards. 3. Andrea Moneta resigned from the Board on 19 January 2011 and therefore no longer has any share ownership requirements.
17. External Board appointments Aviva recognises its EDs can benefit from serving in a personal capacity as a NED of non-Aviva Group companies. It is, at the same time, conscious of the corporate governance recommendations that EDs should take account of the time commitment required by a NED position and ensure any such role does not impact their ability to carry out fully their executive duties. The Company therefore has a policy of normally allowing senior executives to serve as a NED of one external company, subject to approval by the Board, and to retain any board fees. The only ED who held an external NED appointment during 2010 was Philip Scott, who was appointed to the board of Diageo plc on 17 October 2007 and, following the announcement of his intended retirement from the Company, to the board of Royal Bank of Scotland Group plc on 1 November 2009. As a NED of Diageo plc, Mr Scott received fees totalling £10,274 in the period from 1 January 2010 until his retirement from the Aviva plc Board on 26 January 2010. As a NED of Royal Bank of Scotland Group plc, Mr Scott received fees totalling £6,849 in the period from 1 January 2010 until his retirement from the Aviva plc Board on 26 January 2010.
18. All employee share plans EDs are eligible to participate in a number of HMRC approved all employee share plans on the same basis as other eligible employees. These plans include a free share element of the Aviva All Employee Share Ownership Plan (AESOP). Under this element of the plan, eligible employees can receive up to a maximum of £3,000 per annum in shares based upon the profits of the Company’s UK businesses. The shares are free of tax subject to a retention period. Free shares were not awarded in 2010. In addition, the partnership element of the AESOP, which the Company also operates, allows participants to invest up to £125 per month out of their gross salary in the Company’s shares. There is no matching to this investment by the Company. Shares awarded to, or investments made by, EDs through the AESOP are included in Table 24 below. The Aviva Savings Related Share Option Scheme allows eligible employees to acquire options over the Company’s shares at a discount of up to 20% of their market value at the date of grant. In order to exercise these options, participants must have saved through a three-, five- or seven-year HMRC approved savings contract, subject to a maximum savings limit of £250 per month. Details of options granted to EDs under this scheme can be found in Table 16 above.
19. Dilution Awards granted under the Aviva employee shares plans are met by the funding of an employee trust administered by an external trustee that acquires shares in the market. The current practice is that new issue shares will generally only be issued where it is not practicable to use the trust and the funding policy is kept under review by the committee and the Board. Details of the shares currently held in the employee trust are set out in note 30 to the accounts. During 2010 loans totalling £13.9 million were made to RBC Trustees (CI) Limited to ensure sufficient shares were available to meet its ongoing liabilities.

132
Aviva plc Annual Report and Accounts 2010 Directors’ remuneration report continued
20. NEDs The NEDs, including the chairman, have letters of appointment which set out their duties and responsibilities. The key terms of the appointments are set out in Table 19 below.
Table 19: NED key terms of appointment Provision Policy
Period
Prior to the introduction of the UK Corporate Governance Code, NEDs were appointed on a three-year term which could be extended by mutual consent. Commencing at the 2011 AGM, NEDs will be subject to re-election by shareholders at each AGM.
Termination By the director or the Company at their discretion without compensation.
Fees As described below.
Expenses Reimbursement of travel and other expenses reasonably incurred in the performance of their duties.
Time commitment
Each director must be able to devote sufficient time to the role in order to discharge his or her responsibilities effectively and on average spend at least 44 days a year on Company business, with the chairmen of the Audit and Risk committees spending substantially more.
Non-compete During term of directorship and for six months after leaving.
Appointment dates Director Date of last appointment on letter of appointment
Appointment end date on letter of appointment*
Mary Francis 1 October 2008 AGM 2012 Richard Karl Goeltz 28 April 2010 AGM 2011 Euleen Goh 1 January 2009 AGM 2011 Michael Hawker 28 April 2010 AGM 2011 Carole Piwnica 30 May 2009 AGM 2012 Lord Sharman 14 January 2008 AGM 2011 Leslie Van de Walle 28 April 2010 AGM 2011 Russell Walls 28 April 2010 AGM 2011 Scott Wheway 28 April 2010 AGM 2011 * All NEDs will be subject to re-election by shareholders at the 2011 AGM
It is the Company’s policy to set the fees paid to its chairman and NEDs taking account of the median market payments in international companies of similar size and complexity. NEDs receive a basic annual fee in respect of their Board duties. A further fee is paid to NEDs (other than the chairman) in respect of membership and, where appropriate, chairmanship of Board committees. Fees are reviewed annually and are set by the Board to attract individuals with the required range of skills and experience. In determining the level of fees paid to the NEDs the Board receives recommendations from the EDs, who consider the NEDs’ duties and responsibilities, together with the time commitment required in preparing for and attending meetings, and the amounts paid by competitors and similar-sized companies. There were no increases to fees during 2010. However, following a review in December 2010 of Aviva’s fees against market benchmarks and consideration of the expected changes in the workloads and responsibilities of certain committee members in light of regulatory requirements, the following changes in NEDs’ emoluments were made with effect from 1 January 2011:
The fee for Board membership was increased from £63,000 pa to £65,000 pa The fee for the senior independent director (in addition to Board membership fee) was increased from £20,000 pa to
£25,000 pa The fee for chairing the Risk Committee (inclusive of membership fee) was increased from £20,000 pa to £35,000 pa The fee for chairing the Remuneration Committee (inclusive of membership fee) was increased from £20,000 pa to
£30,000 pa The membership fee for the Risk Committee increased from £5,000 pa to £10,000 pa The membership fee for the Nomination Committee and Corporate Responsibility Committee increased from £5,000 pa
to £7,500 pa The Chairman and NEDs do not participate in any incentive or performance plans or pension arrangements and they also do not receive an expense allowance. The Company’s articles of association provide that the total aggregate remuneration paid to the chairman and NEDs will be determined by the Board within the limits set by shareholders. The current aggregate limit of £1.5 million was approved by shareholders at the Company’s 2005 Annual General Meeting. The amount paid in 2010 was £1.2 million. EDs are remunerated under their service contracts and receive no additional fee for serving as directors.

133
Performance reviewCorporate responsibilityGovernanceShareholder informationFinancial statements IFRSFinancial statements MCEVOther information
Governance
Aviva plc Annual Report and Accounts 2010
Directors’ remuneration report continued
NED fees payable from 1 January 2011 are set out in Table 20 below.
Table 20: NEDs’ fees from 1 January 2011
Chairman £495,000
Board membership fee £65,000
Additional fees are paid as follows:
Senior independent director £25,000
Committee chairman – Audit – Corporate Responsibility – Remuneration – Risk
£35,000 (inclusive of committee membership fee) £10,000 (inclusive of committee membership fee) £30,000 (inclusive of committee membership fee) £35,000 (inclusive of committee membership fee)
Committee membership – Audit – Corporate Responsibility – Nomination – Remuneration – Risk
£10,000 £7,500 £7,500 £10,000 £10,000
Directors’ service contracts and letters of appointment are available for inspection at the Company’s registered office during normal hours of business, and at the place of the Company’s Annual General Meeting from 10.45am on Wednesday 4 May 2011 until the close of the meeting.
21. Directors’ remuneration in 2010 Table 21 below sets out the remuneration paid or payable to the directors in respect of the year to 31 December 2010. This section (Directors’ remuneration in 2010) and those sections headed ‘EDs’ pension arrangements’ and ‘Share incentive plans’ along with their associated footnotes have been subject to audit.
Table 21: Directors’ Remuneration in 2010 Basic salary/fees Bonuses1 ACAP Benefits2 Total
2010 £’000
2009 £’000 2010
£’000 2009 £’000 2010
£’000 2009 £’000 2010
£’000 2009 £’000 2010
£’000 2009 £’000
Chairman Lord Sharman 495 495 — — — — 264 — 521 495
Executive directors Andrew Moss 925 925 1,031 1,029 463 463 55 74 2,474 2,491 Philip Scott 42 600 26 578 — — 4 34 72 1,212 Patrick Regan 512 — 669 — — — 18 — 1,199 — Mark Hodges 600 520 695 503 300 260 27 66 1,622 1,349 Andrea Moneta3 669 629 429 756 173 82 143 142 1,414 1,609
Non-executive directors Mary Francis 108 103 — — — — — — 108 103 Richard Karl Goeltz 98 98 — — — — — — 98 98 Euleen Goh 78 78 — — — — — — 78 78 Michael Hawker 68 — — — — — — — 68 — Carole Piwnica 83 83 — — — — — — 83 83 Leslie Van de Walle 78 45 — — — — — — 78 45 Russell Walls 108 108 — — — — — — 108 108 Scott Wheway 88 88 — — — — — — 88 88
Total emoluments of directors 3,952 3,772 2,850 2,866 936 805 273 316 8,011 7,759
Notes 1. Bonuses show the value at the date of award inclusive of the two-thirds of bonus which Aviva requires its EDs to defer into Aviva shares for three years. 2. ‘Benefits’. All the EDs received life assurance benefits during the year that relate to the cost incurred by the Company of insuring the directors’ life and relevant spouses’ benefits which, had the director died during the year, could not have been
wholly paid by the pension scheme and would therefore have been met by the Company had the insurance not been in place. The disclosure also includes the cost of private medical insurance and, where appropriate, accompanied travel, accommodation and car benefits. All the numbers disclosed include the tax charged on the benefits. No directors received an expense allowance during the year.
3. Figures shown for Mr Moneta have been converted from euro to pound sterling at the average exchange rate for 2010 of €1.16605 : £1.00. 4. The Chairman received travel related benefits. 5 NEDs are reimbursed for expenses, and any tax arising on those expenses is settled directly by Aviva. 6 For the purposes of the disclosure required by Schedule 5 to the Companies Act 2006, the total aggregate emoluments of the directors in respect of 2010 was £6.8 million (2009: £6.7 million). 7. No compensation payment for loss of office was made to any director, or former director, during the year. However, as previously stated, legal fees of £2,875 were paid directly to Mr Scott’s solicitor.

134
Aviva plc Annual Report and Accounts 2010 Directors’ remuneration report continued
Fees earned in 2010 by the NEDs are set out in Table 22 below.
Table 22: NEDs’ fees paid in 2010 Committee Chairman/Membership
Board membership
fees
Senior independent
director Remuneration Audit Nomination Corporate
Responsibility Risk Total fees
Lord Sharman, Chairman £495,000 £495,000 Mary Francis £63,000 £10,000 £10,000 £5,000 £20,000 £108,000 Richard Karl Goeltz £63,000 £20,000 £10,000 £5,000 £98,000 Euleen Goh £63,000 £10,000 £5,000 £78,000 Michael Hawker* £63,000 £5,000 £68,000 Carole Piwnica £63,000 £10,000 £10,000 £83,000 Leslie Van de Walle £63,000 £10,000 £5,000 £78,000 Russell Walls £63,000 £35,000 £5,000 £5,000 £108,000 Scott Wheway £63,000 £20,000 £5,000 £88,000 *Michael Hawker joined the Board and the Risk Committee on 1 January 2010.
22. Senior executives’ remuneration The total compensation paid during the year to key management personnel, being those having authority and responsibility for planning, directing and controlling the activities of the Company, including the Company’s EDs and NEDs (as required to be disclosed by International Accounting Standard 24) was £81 million (2009: £61 million) and is set out in note 60 to the Annual Report and Accounts.
23. EDs’ pension arrangements The positions of the EDs with respect to accumulated pension benefits under the defined benefits section of the ASPS is set out in Table 23 below.
Table 23: EDs’ Pension Benefits
Andrew Moss
£’000 Mark Hodges
£’000 Patrick Regan
£’000
Benefit Type Defined benefit
Defined benefit
Defined contribution
Accrued annual pension at 31 December 2009 22.1 84.8 — Accrued annual pension at 31 December 2010 21.8 83.6 — Gross increase in accrued pension over the year (0.3) (1.2) — Increase (decrease) in accrued pension net of inflation over the year — — — Employee contributions during the year — — — Defined contribution employer contributions during the year — — 136.4
Transfer value of accrued pension at 31 December 2009 350.2 1,062.5 — Transfer value of accrued pension at 31 December 2010 365.1 1,091.7 — Change in transfer value during the period less employee contributions 14.9 29.2 — Transfer value of net increase (decrease) in accrued pension less employee contributions — — —
Age at 31 December 2010 (years) 52 45 44
Notes 1. Accrued pensions shown are the amounts that would be paid annually on retirement based on service to the end of the year. 2. Benefits deriving from Additional Voluntary Contributions (AVCs) paid by directors are excluded from the amounts above. 3. The change in transfer value allows for fluctuations in the transfer value due to factors beyond the control of the Company and directors, such as changes in stock market conditions. 4. The transfer values have been calculated in line with the relevant legislation and using actuarial assumptions agreed by the trustee. 5. No former Directors received any increase in retirement benefits in excess of the amount to which they were entitled, on the later of the date when the benefits first became payable, or the 31 March 1997. 6. The transfer value of net increase (decrease) in accrued pension shows the value of the increase (decrease) in accrued pension net of inflation, over the year net of contributions. 7. Philip Scott ceased to accrue benefits in the Aviva Staff Pension Scheme with effect from 30 June 2009. Mr Scott subsequently took early retirement with effect from 1 August 2010. As disclosed in the 2008 and 2009 Annual Report and
Accounts, Mr Scott was entitled to receive a non-discounted pension with effect from January 2012, aged 58. Consequently, his early retirement pension payable from 1 August 2010 amounted to £384,900 p.a. rather than £342,535 p.a. To provide this additional £42,365 p.a. a cost was incurred to the Company of £1,227,539. Mr Scott then surrendered £25,338 p.a. of his pension for a cash sum, reducing his pension payable from 1 August 2010 to £359,562 p.a.
8. Andrea Moneta left the Company’s defined contribution scheme in 2009 and therefore did not accrue any further scheme benefits in 2010.

135
Performance reviewCorporate responsibilityGovernanceShareholder informationFinancial statements IFRSFinancial statements MCEVOther information
Governance
Aviva plc Annual Report and Accounts 2010
Directors’ remuneration report continued
24. Directors’ interests in Aviva shares The interests held by each person who was a director at the end of the financial year and their connected persons in the ordinary shares of the Company are shown in Table 24 below. All the disclosed interests are beneficial. The table also summarises the interests in shares held through the Company’s various share incentive plans. Details of the options and long-term incentive awards are shown below.
Table 24: Directors’ interests in Aviva Shares9 Shares1 ABP2 LTIP3 OATTV Plan4 Options5
1 January
2010 31 December
2010 1 January
2010 31 December
2010 1 January
2010 31 December
2010 1 January
2010 31 December
2010 1 January
2010 31 December
2010
Mary Francis 1,800 4,700 — — — — — — — — Richard Karl Goeltz 2,500 7,500 — — — — — — — — Euleen Goh — — — — — — — — — — Michael Hawker — 5,000 — — — — — — — — Mark Hodges 139,028 348,737 231,712 165,582 459,029 635,297 145,759 210,853 1,705 9,477 Andrea Moneta 394 394 159,375 287,725 249,023 514,448 119,531 215,794 — — Andrew Moss 239,848 601,635 353,716 275,175 1,022,153 1,304,978 289,443 467,213 3,279 11,051 Carole Piwnica 2,500 2,500 — — — — — — — — Patrick Regan6 — 298,820 — 298,8207 — 233,160 — 55,0518 — 10,675 Lord Sharman 33,531 35,654 — — — — — — — — Leslie Van de Walle 2,485 17,485 — — — — — — — — Russell Walls 4,000 4,000 — — — — — — — — Scott Wheway 13,579 13,579 — — — — — — — —
Notes 1. ‘Shares’ are the directors’ beneficial holdings in the ordinary shares of the Company and in respect of the EDs include shares held in trust under the Company’s AESOP being shares purchased by them under the partnership element and shares
granted under the free share element. In respect of Mark Hodges and Andrew Moss, it also includes the remaining restricted shares held in trust from their ABP awards, and for Patrick Regan it includes the remaining restricted shares held in trust from his RRSA and BRDSA awarded under the rules of the CFO Recruitment Share Awards Plan.
2. ABP relates to entitlements to shares arising through the Aviva Annual Bonus Plan. Under these plans some of the earned bonuses are paid in the form of restricted shares or conditional shares and deferred for three years. The transfer of the shares to the director at the end of the period is not subject to the attainment of performance conditions but a proportion of the shares can be forfeited if the executive leaves service before the end of the period. In respect of Mark Hodges and Andrew Moss, these shares are restricted shares. In respect of Patrick Regan, these shares represent the RRSA and BRDSA awarded under the rules of the CFO Recruitment Share Awards Plan and are restricted shares.
3. Awards granted under the LTIP which vest only if the performance conditions are achieved. 4. OATTV Plan awards are granted as a match to the bonus plan awards under the ABP and vest only if the performance conditions are achieved. 5. ‘Options’ are options over shares granted under the SAYE and the Aviva Executive Share Option Plan 2005. 6. Patrick Regan was appointed as a director on 22 February 2010. On this date he held no shares, awards or options. 7 These shares represent the RRSA and BRDSA awarded under the rules of the CFO Recruitment Share Awards Plan and are restricted shares. 8. These shares represent the OATTV awarded under the rules of the CFO Recruitment Share Awards Plan. 9. The interests of connected persons to the directors are included in the directors’ interests above
The following changes to directors’ interests which relate to shares acquired each month under the partnership element of the AESOP during the period 1 January 2011 to 1 March 2011 have been reported to the Company.
Number of shares
Mark Hodges 57

136
Aviva plc Annual Report and Accounts 2010 Directors’ remuneration report continued
25. Former directors Philip Scott Mr Scott retired from the Board on 26 January 2010 and left the employment of the Company on 31 July 2010. As disclosed in the 2009 Annual Report and Accounts, the committee exercised its discretion with regard to Mr Scott’s share awards and, on leaving the Company, the outstanding deferred shares granted to Mr Scott under the ABP were released to him. Mr Scott also retained 100% of the LTIP award, and 86.1% of the OATTV award, granted in 2008, and 66.6% of the LTIP award, and 52.8% of the OATTV award, granted in 2009. The retained LTIP and OATTV awards will vest on their normal vesting date subject to the satisfaction of the performance conditions set at the time of grant. Mr Scott will receive a non-discounted pension with effect from January 2012. Mr Scott received a prorated bonus for the 2010 financial year of £27,755 for his period as an ED. A payment of £2,875 was made for legal fees on his departure terms. Mr Scott did not receive any other compensation payments for loss of office. As also disclosed in the 2009 Annual Report and Accounts, Mr Scott has provided consultancy services to the Group since 1 October 2010. Mr Scott will continue to provide this service for a limited period.
26. Developments in 2011 Andrea Moneta Mr Moneta resigned from the Board on 19 January 2011 and left the Company on 28 February 2011. Any deferred shares earned during his period of employment will be available for release to him on the first dealing day following his departure date. Any long-term incentives granted will vest on their due date and in accordance with the performance condition outcomes. As per Mr Moneta’s contract, a basic salary will be paid for the duration of 12 months which will be phased and mitigated as appropriate, pending any new employment. Other contractual entitlements will be paid up to 28 February 2011.
Igal Mayer On 19 January 2011, Mr Mayer was appointed chief executive, Aviva Europe and joined the Board. Previously Mr Mayer was CEO of the North American region and lives in Canada. Mr Mayer will receive a basic salary of C$1,001,500 with an On Target annual bonus of 75%, maximum 150%. He will be eligible to receive long-term incentive awards at a standard rate of 250% of basic salary, in recognition of his prior grants in North America, where market levels of awards differ from Aviva’s regular practice. Mr Mayer’s family will remain in Canada and suitable accommodation and necessary travel will be provided. Scott Wheway Chairman, Remuneration Committee 2 March 2011

Performance reviewCorporate responsibilityGovernanceShareholder informationFinancial statements IFRSFinancial statements MCEVOther information
Shareholder information
Aviva plc Annual Report and Accounts 2010
137
Shareholder information
In this section Page
Company address 138
Share capital 138
Related party disclosures 140
Dividend data 141
Guarantees, securitised assets and off-balance sheet arrangements
141
Liquidity and capital resources 142
Audit committee financial expert 147
Code of ethics 147
Regulation 147
Risks relating to our business 153

138
Aviva plc Annual Report and Accounts 2010 Shareholder information
Company address The Company’s registered office is St Helens, 1 Undershaft, London, EC3P 3DQ. The Company’s telephone number is +44 (0)20 7283 2000.
Share capital The Company has four share classes:
Ordinary Shares of £0.25 each which constitute our equity security and hold voting rights; Cumulative irredeemable preference shares of £1 each, which entitle holders to attend and vote at general meetings only when
dividends on such shares are in arrears. Cumulative irredeemable preference shareholders may also attend general meetings and vote on particular proposals when such proposals relate to an alteration of the rights attaching to such shares, a reduction of capital (other than through a redemption or repurchase of shares) or a winding up of business;
Sterling New Preference Shares of £1 each, which have such rights and terms (including terms related to the redemption of shares, ranking and entitlement to dividend and capital) as the Board determines; and
Euro New Preference Shares of €1 each, which have such rights and terms (including, terms related to the redemption of such shares, ranking and entitlement to dividend and capital) as the Board determines.
Issued share capital The Company had aggregate issued and outstanding ordinary share capital of £705 million as of 31 December 2010. The following table sets forth information about the issued and outstanding classes of equity as of 31 December 2010. Shares issued and outstanding Shares covered by outstanding option
Share class 2010
Million 2009
Million 2008
Million 2010
Million 2009
Million 2008
Million
Ordinary Shares, nominal value 25p 2,820 2,766 2,657 27 26 26 8.375% Cumulative Irredeemable Preferred Shares, nominal value £1 100 100 100 — — — 8.75% Cumulative Irredeemable Preferred Shares, nominal value £1 100 100 100 — — — Preferred Shares, nominal value £1 — — — — — — Preferred Shares, nominal value €1 — — — — — —
The Companies Act 2006 abolished the requirement for a company to have an authorised share capital and the articles of association adopted by the Company on 28 April 2010 reflect this. Directors will still be limited as to the number of shares they can at any time, allot, as the allotment authority continues to be required under the Act, save in respect of employee share schemes. Ordinary shares in issue in the Company rank pari passu. All the ordinary shares in issue carry the same right to receive all dividends and other distributions declared, made or paid by the Company. The company is not permitted under English law to hold its own ordinary shares. While the company is presently authorised to repurchase up to 276 million ordinary shares, any shares that are repurchase must be cancelled. Details of the company’s dividends, including the paying agents, are set out below under ‘Articles of Association’.
Share options and awards The Company maintains a number of active stock option and share award schemes. Details of these schemes are set out in ‘Financial statements IFRS – Note 30 – Equity compensation plans’.
Share Investment Plan The Company’s UK resident employees of participating companies can buy shares in the Company by making monthly contributions from their gross salary. Contributions can be a minimum of £5 and up to a maximum of £125 per month (or, if less, 10% of gross salary). Contributions are held in a trust by an independent trustee and shares are allocated within 30 days of the employee’s monthly contribution date. Employees can withdraw their shares from the trust at any time on payment of income tax and National Insurance Contributions (NIC). However, after five years shares can be withdrawn from the trust free of income tax and NIC.
Shares to satisfy options and awards Prior to March 2003, it was the practice to satisfy options and awards granted under the Group’s share plans through shares purchased in the market and held by employee share trusts which were established for the purpose of satisfying awards under the various Group share plans and funded by the Company. From March 2003 to July 2008, it was generally the Company’s practice to satisfy the awards granted after March 2003 by the issue of new shares at the time of vesting. However, since July 2008, it has been the Company’s practice to satisfy all awards and options using shares purchased in the market and held by employee trusts except where local regulations make it necessary to issue new shares. At 31 December 2010, 8,415,487 shares were held by the employee share trusts as compared to 17,979,232 at 31 December 2009, in both instances following the share purchases and distributions to individual employees throughout the year. These shares have an aggregate nominal value of £2,103,871.75 and market value £33,072,864 as of 31 December 2010, compared to £4,494,808 and £71,539,364 at 31 December 2009, respectively. Shares held by separate employee share trusts on behalf of specific individuals have not been included in these amounts. Further details are given in ‘Financial statements IFRS – Note 31 – Shares held by employee trusts.’

139
Performance reviewCorporate responsibilityGovernanceShareholder informationFinancial statements IFRSFinancial statements MCEVOther information
Shareholder information
Aviva plc Annual Report and Accounts 2010 Shareholder information continued
History of share capital The following table sets out information about the history of the Company’s ordinary shares over the last three full calendar years.
Number of
shares outstanding
At 1 January 2008 2,621,792,828
Shares issued under the Group’s Employee and Executive Share Option Schemes1 35,908,796 Shares issued in lieu of dividends2 —
At 31 December 2008 2,657,701,624
Shares issued under the Group’s Employee and Executive Share Option Schemes1 951,455 Shares issued in lieu of dividends2 107,958,295
At 31 December 2009 2,766,611,374
Shares issued under the Group’s Employee and Executive Share Option Schemes1 722,968 Shares issued in lieu of dividends2 52,814,300
At 31 December 2010 2,820,148,642 1. For more information on our various option schemes, see ‘Governance’ section. 2. The issue of shares in lieu of cash dividends is considered a bonus issue under the terms of the Companies Act 2006 and the nominal value of the shares is charged to the share premium account.
The Company issued shares pursuant to special resolutions passed on 10 May 2006, increasing the authorised share capital from £1.45 billion and €700 million to £1.95 billion and €700 million by the creation of 500 million new preference shares of £1 each, and allowing the directors, subject to certain conditions, to issue equity securities up to the aggregate nominal value of £150 million. This authority expired at the conclusion of the AGM in 2007. A further ordinary resolution was passed on 26 April 2007 allowing the directors, subject to certain conditions, to allot equity securities up to the aggregate nominal value of £108 million. This authority expired at the conclusion of the AGM in 2008. An ordinary resolution was passed on 1 May 2008 allowing the directors, subject to certain conditions, to issue equity securities up to the aggregate nominal value of £94 million. This authority expired at the conclusion of the AGM in 2009. Ordinary resolutions were passed on 29 April 2009, increasing the authorised share capital from £1.95 billion and €700 million to £2.5 billion and €700 million by the creation of 2.2 billion ordinary shares of 25 pence each, and allowing the directors, subject to certain conditions, to issue equity securities up to the aggregate nominal value of £221 million and up to £443 million in connection with an offer by way of a rights issue. This authority expired at the conclusion of the AGM on 28 April 2010. The Companies Act 2006 abolished the requirement for a company to have an authorised share capital and the articles of association adopted by the Company on 28 April 2010 reflect this. Directors will still be limited as to the number of shares they can at any time, allot as the allotment authority continues to be required in the Act save in respect of employee share schemes. There were no changes to the voting rights of any class of shares during 2008, 2009 or 2010, other than issuances in connection with our various employee option schemes and under the Company’s scrip dividend scheme. The Company did not issue shares for consideration other than cash during 2008, 2009 or 2010. In addition, at the Company’s general meetings in 2008, 2009 and 2010, shareholders authorised the limited dis-application of Section 561 of the Companies Act 2006 to permit the Company to issue new equity securities for cash without applying shareholders’ statutory pre-emptive rights.

140
Aviva plc Annual Report and Accounts 2010
Shareholder information continued
Related party disclosures Related party transactions For more information relating to related party transactions, including more information about the transactions described below, please see ‘Financial Statements IFRS – Note 60 – Related party transactions’.
Subsidiaries Transactions between the Company and its subsidiaries are eliminated on consolidation. However, the Company has transactions and outstanding balances with certain unit trusts, Open Ended Investments Companies, collateralised debt obligations and similar entities which are not consolidated and where a Group company acts as manager. These entities are regarded as related parties for the purposes of International Accounting Standard (IAS) 24. The balances are included in the Group’s statement of financial position at fair value or amortised cost in accordance with their IAS 39 classifications. The transactions are included in the income statement and include amounts paid on issue of shares or units, amounts received on cancellation of shares or units and paid in respect of the periodic charge and administration fee.
Directors and key management The total compensation to those employees classified as key management, being those having authority and responsibility for planning, directing and controlling the activities of the Group, including the executive and non-executive directors is as follows:
2010 £m
2009 £m
2008 £m
Salary and other short-term benefits 48 39 38 Post-employment benefits 8 5 3 Equity compensation plans 21 16 9 Termination benefits 4 1 3 Total 81 61 53 Various directors and key management of Aviva may from time to time purchase insurance, asset management or annuity products, or be granted mortgages marketed by Aviva Group companies in the ordinary course of business on substantially the same terms, including interest rates and security requirements, as those prevailing at the time for comparable transactions with other persons. Apart from the disclosed transactions discussed above and in the ‘Governance’ section of this report, no director had an interest in shares, transactions or arrangements that requires disclosure under applicable rules and regulations.
Other related parties The Group received income from other related parties from transactions made in the normal course of business. Loans to other related parties are made on normal arm’s length commercial terms.
Services provided to other related parties
2010 2009 2008
Income earned in year
£m
Receivable at year
end £m
Income earned in year
£m
Receivable at year
end £m
Income earned in year
£m
Receivable at year
end £m
Associates 47 — 49 3 61 3 Joint ventures 18 375 17 327 20 300 Employee
pension schemes 10 2 9 2 24 6
75 377 75 332 105 309
Income from associates predominantly relates to our investments in the Royal Bank of Scotland (RBS) life and collective investment companies prior to their restructuring described in ‘Financial Statements IFRS – Note 3 – Subsidiaries’. Under management service agreements with these associates, our UK life insurance companies provided administration services, the cost of which was recharged to the RBS companies. In addition, our fund management companies provided fund management services to these associates, for which they charged fees based on the level of funds under management. Movements in loans made to our associates may be found in ‘Financial Statements IFRS – Note 19 – Interests in, and loans to, joint ventures’. Transactions with joint ventures relate to the property management undertakings. At 31 December 2010, there were 16 such joint ventures, the most material of which are listed in note 18(b). Our interest in these joint ventures comprises a mix of equity and loans, together with the provision of administration services and financial management to many of them. Our UK life insurance companies earn interest on loans advanced to these entities and our fund management companies also charge fees to these joint ventures for administration services and for arranging external finance. Our UK fund management companies manage most of the assets held by the Group’s main UK staff pension scheme, for which they charge fees based on the level of funds under management. The main UK scheme and the Dutch scheme hold investments in Group-managed funds and insurance policies with other Group companies, as explained in note 48(e)(iii). The related parties’ receivables are not secured and no guarantees were received in respect thereof. The receivables will be settled in accordance with normal credit terms. Details of guarantees, indemnities and warranties provided on behalf of related parties are given in ‘Financial Statements IFRS – Note 52 – contingent liability and risk factors’.
Loans to joint ventures We make loans to our property management joint ventures to fund property developments which we undertake with our joint venture partners. Movements in these loans may be found in ‘Financial Statements IFRS – Note 18– Interests in, and loans to, joint ventures’. Total loans at 31 December 2010 and at the end of each of the last three financial years are shown in the table below:
2010
£m 2009
£m 2008
£m
Loans to joint ventures 375 327 300
These constitute loans to joint ventures to fund shopping, business or distribution centres or properties in Europe, as well as a film studio development in the UK.

141
Performance reviewCorporate responsibilityGovernanceShareholder informationFinancial statements IFRSFinancial statements MCEVOther information
Shareholder information
Aviva plc Annual Report and Accounts 2010 Shareholder information continued
Dividend data The Company’s dividend policy is to sustain a target dividend cover of between one and a half and two times our IFRS adjusted operating profit after tax before amortisation of goodwill and adjusting items. Under UK company law, we may only pay dividends if the company has ‘distributable profits’ available. ‘Distributable profits’ are accumulated, realised profits not previously distributed or capitalised, less accumulated, unrealised losses not previously written off based on IFRS. Even if distributable profits are available, we pay dividends only if the amount of our net assets is not less than the aggregate of our called-up share capital and undistributable reserves and the payment of the dividend does not reduce the amount of our net assets to less than that aggregate. As a holding company, the Company is dependent upon dividends and interest from our subsidiaries to pay cash dividends. Many of the Company’s subsidiaries are subject to insurance regulations that restrict the amount of dividends that they can pay to us. Historically, the Company has declared an interim and a final dividend for each year (with the final dividend being paid in the year following the year to which it relates). Subject to the restrictions set out above, the payment of interim dividends on ordinary shares is made at the discretion of our Board of directors, while payment of any final dividend requires the approval of the Company’s shareholders at a general meeting. Preference shares are irredeemable and dividends on preference shares are made at the discretion of our Board of directors. The Company pays cash dividends in pounds sterling, although the articles of association permit payment of dividends on ordinary shares in other currencies and in forms other than cash, such as ordinary shares. If dividends on ordinary shares held by the American Depositary Shares (ADS) depositary are paid in pounds sterling, the ADS depositary will convert the pounds that it receives on behalf of the ADS holders into US dollars according to the prevailing market rate on the date that the ADS depositary actually receives the dividends. For the 2007 final dividend and previous final and interim dividends, shareholders on record were provided with the opportunity to elect to receive dividends in the form of newly issued ordinary shares through our scrip dividend scheme. For the 2008 interim dividend the scrip dividend scheme was replaced by a dividend reinvestment plan (DRIP). For those shareholders participating in the DRIP, we paid a cash dividend, which was then used to buy existing shares on the open market. For the 2008 final dividend we withdrew the DRIP and reintroduced the scrip dividend scheme. An interim dividend is generally paid in November of each year. A final dividend is proposed by the Company’s Board of directors after the end of the relevant year and generally paid in May. The following table shows certain information regarding the dividends that we paid on ordinary shares for the periods indicated in pounds sterling and converted into US dollars at the noon buying rate in effect on each payment date.
Year
Interim dividend per share
(pence)
Interim dividend per share
(cents)
Final dividend per share
(pence)
Final dividend per share
(cents)
2005 9.83 16.90 17.44 32.82 2006 10.82 20.49 19.18 37.88 2007 11.90 24.37 21.10 41.31 2008 13.09 19.69 19.91 30.31 2009 9.00 14.75 15.00 23.55 2010 9.50 15.20 16.00 25.80
Guarantees, securitised assets and off-balance sheet arrangements As a normal part of our operating activities, various Group companies have given financial guarantees and options, including interest rate guarantees, in respect of certain long-term assurance and fund management products, as set out in ‘Financial statements IFRS – Note 41 – Financial guarantees and options’. These are accounted for on-balance sheet as either part of the host insurance contract or as financial instruments under IFRS. Information on operating lease commitments can be found in ‘Financial statements IFRS – Note 53 – Commitments’. It is standard business practice for our Group companies to give guarantees, indemnities and warranties in connection with disposals of subsidiaries and associates to third parties. As of 31 December 2010, we believe no material loss will arise in respect of these guarantees, indemnities and warranties. Standard financial warranties include the accuracy and completeness of the statement of financial position at the completion date, details of outstanding litigation, the position on tax filings and any outstanding clearance items. In addition, specific clauses cover such matters as regulatory approvals and licences, the adequacy of actuarial insurance liabilities, reinsurance contracts and the status of employee pension plans. Their exact terms are tailored to each disposal and are set out in the respective sale and purchase agreement. Similarly, the open warranty periods, within which the purchaser could claim, and limits on the maximum amount potentially recoverable will vary for each item covered in each disposal. There are a number of outstanding claims on recent disposals, none of which are material. There are also open claim periods on other recent disposals on which we have neither received, nor expect to receive, any such claims. We believe that there is no material exposure in this respect and therefore we do not have any liabilities in our statement of financial position in respect of claims under guarantees, indemnities and warranties in connection with disposals. We have loans receivable, secured by mortgages, which have then been securitised through non-recourse borrowings by special purpose entities, in our UK Life and Dutch businesses, as set out in ‘Financial statements IFRS – Note 24 – Securitised mortgages and related assets’. These special purpose entities have been consolidated and included in the statement of financial position, as we retain the residual interest in them.

142
Aviva plc Annual Report and Accounts 2010 Shareholder information continued
Limited liability partnerships classified as joint ventures As part of their investment strategy, the UK and certain European long-term business policyholder funds have invested in a number of property limited partnerships (PLP), either directly or via property unit trusts (PUT), through a mix of capital and loans. The PLPs are managed by general partners (GP), in which the long-term business shareholder companies hold equity stakes and which themselves hold nominal stakes in the PLPs. The PUTs are managed by a Group subsidiary. Accounting for the PUTs and PLPs as subsidiaries, joint ventures or other financial investments depends on the shareholdings in the GPs and the terms of each partnership agreement. If a partnership is managed by a contractual arrangement agreement such that no party exerts control, notwithstanding that the Group’s partnership share or economic interest in the PLP (including its indirect stake via the relevant PUT and GP) may be greater than 50%, such PUTs and PLPs have been classified as joint ventures. Of the PLPs accounted for as joint ventures at 31 December 2010, the Group’s economic interest exceeded 50% in respect of one partnership, The Mall Limited Partnership, in which the Group had a 50.5% economic interest. ‘Financial statements IFRS – Note 18 – Interests in, and loans to, joint ventures’ provides a list of PLPs accounted for as joint ventures, as well as summarised information on the revenue, expenses, assets and liabilities of the Group’s interests in its joint ventures in aggregate. In respect of these PLPs, there are no significant contingent liabilities to which we are exposed, nor do we have any significant contingent liabilities in relation to our interests in them. External debt raised by the PLPs is secured on their respective property portfolios, and the lenders are only entitled to obtain payment of both interest and principal to the extent there are sufficient resources in the respective PLPs. The lenders have no recourse whatsoever to the policyholder and shareholders’ funds of any companies in the Aviva Group. At 31 December 2010, we had £nil capital commitments to these PLP joint ventures.
Liquidity and capital resources Treasury function The treasury function of our business is managed by our centralised treasury team, headed by the group treasurer. The group treasurer acts as owner of Group policies for liquidity, derivatives and foreign exchange risk management within the Group risk governance and oversight framework. Changes in policy require the agreement of the chief risk officer. Significant changes in policy require, in addition, the approval of the Assets and Liabilities Committee, the Executive Committee and then the Risk and Regulatory Committee of the Board. These policies are independently implemented and monitored by each of our businesses. Our central treasury team is split into distinct functions: a Group team, which develops our overall treasury strategy and our treasury team at Aviva Investors, which manages and monitors our treasury and cash flow positions for our holding companies. Each business unit is responsible for monitoring its own cash and liquidity positions, as well as its ongoing funding requirements. It is our policy to make the majority of our financing arrangements at the parent company level for our business units, primarily through external borrowings and equity offerings. This enables us to achieve the efficiencies afforded by our collective size. A number of our business units also raise debt on their own behalf.
Our principal objective in managing our liquidity and capital resources is to maximise the return on capital to shareholders, while enabling us to pay the dividends, service our debt and our holding companies’ cash flows. In the context of a financial services company, where our working capital is largely representative of our liquidity, we believe our working capital is sufficient for our present operational requirements. For additional information, see ‘Financial Statements IFRS – Note 57 – Risk management – liquidity risk’.
Extraordinary market conditions Starting in mid-September 2008, the global financial markets experienced unprecedented disruption, adversely affecting the business environment in general, as well as financial services companies in particular. Markets have improved but continue to be fragile. A return to adverse financial market conditions could significantly affect our ability to meet liquidity needs and obtain capital, although management believes that we have liquidity and capital resources to meet business requirements under current market conditions. At 31 December 2010, total consolidated net cash and cash equivalents amounted to £24,698 million, an increase of £447 million over £24,251 million in 2009. Processes for monitoring and managing liquidity risk, including liquidity stress models, have been enhanced to take into account the extraordinary market conditions, including the impact on policyholder and counterparty behaviour, the ability to sell various investment assets and the ability to raise incremental funding from various sources. Management has taken steps to strengthen liquidity in light of its assessment of the impact of market conditions, such as issuing £200 million long-term subordinated debt in March 2009, and will continue to monitor the situation closely.
Management of capital resources We seek to maintain an efficient capital structure using a combination of equity shareholders’ funds, preference capital, subordinated debt and borrowings. This structure is consistent with our risk profile and the regulatory and market requirements of our business. In managing our capital, we seek to:
Match the profile of our assets and liabilities, taking into account the risks inherent in each business;
Maintain financial strength to support new business growth while still satisfying the requirements of policyholders, regulators and rating agencies;
Retain financial flexibility by maintaining strong liquidity, access to a range of capital markets and significant unutilised committed credit lines;
Allocate capital efficiently to support growth and repatriate excess capital where appropriate; and
Manage exposures to movements in exchange rates by aligning the deployment of capital by currency with our capital requirements by currency.
We are subject to a number of regulatory capital tests and employ realistic scenario tests to allocate capital and manage risk. The impact of these regulatory capital tests on our ability to transfer capital around the Group through dividends and capital injections is discussed later in this section under the headings ‘Sources of Liquidity’ and ‘Capital injections’. Overall, the Group and its subsidiaries satisfy all existing requirements and, as reported below, have significant resources and capital strength.

143
Performance reviewCorporate responsibilityGovernanceShareholder informationFinancial statements IFRSFinancial statements MCEVOther information
Shareholder information
Aviva plc Annual Report and Accounts 2010 Shareholder information continued
At 31 December 2010, the Group had £26.5 billion (31 December 2009: £24.0 billion) of total capital employed in our trading operations which is financed by a combination of equity shareholders’ funds, preference capital, direct capital instruments, subordinated debt and internal and external borrowings. In 2010, the total capital employed increased by £2.5 billion. Over the period the Group has generated post tax profits and benefitted from actuarial gains on staff pension schemes. See ‘Financial statements IFRS – Note 55 – Group capital structure’. In addition to external funding sources, we have a number of internal debt arrangements in place. These have allowed the assets supporting technical liabilities to be invested into the pool of central assets for use across the Group. They have also enabled us to deploy cash from some parts of the business to others in order to fund growth. Although intra-Group loans in nature, they are counted as part of the capital base for the purpose of capital management. All internal loans satisfy arm’s length criteria and all interest payments have been made when due. The presentation of internal lending arrangements depicts a net debt position which represents the upstream of internal loans from business operations to corporate and holding entities net of tangible assets held by these entities. The corporate net liabilities represent the element of the pension scheme deficit held centrally.
Management of debt Aviva plc is the principal financing vehicle in our centralised funding strategy. Our senior debt obligations are supported by guarantees from our principal non-life trading subsidiaries. We also manage our external debt in line with rating agency limits applicable for entities with a rating in the AA range. We aim to maintain a balance of fixed and floating rate debt, and manage the maturity of our borrowings and our undrawn committed facilities to avoid bunching of maturities. We aim to maintain access to a range of funding sources, including the banking market, the commercial paper market and the long-term debt capital markets. We issue debt in a variety of currencies, predominantly sterling, euros and US dollars, based on investor demand at the time of issuance and management of the Group’s foreign exchange translation exposures in the statement of financial position. In November 2010, Delta Lloyd issued a €575 million senior bond repayable in 2017 and €160 million of short term commercial paper. In March 2009, we issued subordinated debt in two tranches comprising £200 million and €50 million, both callable in 2014. In May 2008, we issued subordinated debt in two tranches comprising £400 million callable in 2038, and €400 million callable in 2018. We used £600 million sterling equivalent to repay commercial paper denominated in various currencies. In August 2008, we issued a further £200 million, callable in 2038.
In January 2007, we issued $375 million of commercial paper, which was used to repay senior debt in our US business. In the year ended 31 December 2006 we raised £442 million of new borrowings in order to fund the acquisition of AmerUs and repay senior debt in AmerUs. At 31 December 2010, our total external borrowings, including subordinated debt and securitised mortgage loans, amounted to £14.9 billion. Of the total borrowings £6.1 billion are considered to be core borrowings and are included within the Group’s capital employed. The balance of £8.8 billion represents operational debt issued by operating subsidiaries. We also have substantial committed credit facilities available for our use. At 31 December 2010, we had undrawn committed credit facilities expiring within one year of £1.0 billion compared to £0.6 billion of such facilities at 31 December 2009, and £1.1 billion in credit facilities expiring after more than one year compared to £1.5 billion of such facilities at 31 December 2009. Of these facilities, £1 billion was allocated in both 2010 and 2009 to support our commercial paper programme. Further information on the maturity profile, currency and interest rate structure of our borrowings is presented in ‘Financial statements IFRS – Note 49 – Borrowings’. Commercial paper is issued for terms up to six months and is generally reissued at maturity. The earliest repayment date for other debt instruments is an €800 million subordinated debt instrument with a first call date of 14 November 2011 at the option of the company. At this time Aviva will have the option of repaying the debt or accepting a step-up in the coupon and deferring repayment until 2021. The table below provides presents our debt position for the periods indicated:
2010
£m 2009
£m
Core structural borrowings Subordinate debt 4,572 4,638 Debenture loans 851 368 Commercial paper 643 483
6,066 5,489
Operating borrowings Amounts owed to credit institutions 2,550 2,182 Securitised mortgage loans 6,333 7,329
8,883 9,511
Total 14,949 15,000
In both the UK and the Netherlands, we have raised non-recourse funding secured against books of mortgages. This funding has been raised through the use of special purpose entities. The beneficial interest in the books of mortgages has been passed to these special purpose entities. These entities, which are owned by independent trustees, have funded this transfer through the issue of loan notes. The value of the secured assets and the corresponding non-recourse funding was £1,288 million in the UK and £5,045 million in the Netherlands. In both cases, we continue to receive fees from these special purpose entities in respect of loan administration services. In the Netherlands, we also receive payments under the terms of interest rate swaps which we have entered into with the special purpose entities. These special purpose entities have been consolidated as we retain the residual interest in them. The transactions and reasons for consolidation are discussed further within ‘Financial statements IFRS – Note 24 – Securitised mortgages and related assets’.

144
Aviva plc Annual Report and Accounts 2010 Shareholder information continued
In addition to our external funding sources, we have a number of internal debt arrangements in place. These allow the assets supporting technical liabilities to be invested into a pool of central capital for use across the Group. They also enable us to deploy cash from some parts of the business to others in order to fund growth. Although these are intra-Group loans, we count them as part of our capital base for the purpose of capital management. We believe that all internal loans have been negotiated at market rates and are appropriately serviced.
Undrawn borrowings At 31 December 2010, we had £2.1 billion undrawn committed central borrowing facilities available to us, provided by a diverse range of 11 leading banks, all but one of which were rated AA. We have allocated £1.0 billion to support the credit rating of Aviva’s commercial paper programme. Undrawn borrowings are analysed below:
2010
£m 2009
£m
Expiring within one year 975 600 Expiring beyond one year 1,135 1,510
Total 2,110 2,110
Our committed central borrowing facilities have two financial covenants:
Borrowings (excluding non-recourse indebtedness) may not exceed total shareholders’ funds. At 31 December 2010 borrowings were 55% of total shareholders funds.
Total shareholders’ funds to exceed 32% of non-life net written premiums for the previous 12 months. At 31 December 2010 total shareholders funds were 161% of non-life net written premiums.
Total shareholders’ funds are defined as the aggregate of nominal share capital of Aviva and the IFRS retained profits and reserves, plus the value of in-force long-term business, on a consolidated basis.
Sources of liquidity In managing our cash flow position, we have a number of sources of liquidity, including:
dividends from operating subsidiaries; external debt issuance; internal debt and central assets; and funds generated by the sale of businesses.
One of our principal sources of liquidity is dividends from our subsidiaries. The level of dividends is based on two primary factors: the financial performance and the local solvency and capital requirements of our individual business units. The table below shows the dividends received from our principal operating subsidiaries in 2010:
2010 Amounts received
£m
UK life insurance 190 UK general insurance — Aviva Investors 30 France 123 Netherlands 72 Poland 67 Ireland 44 Other Europe 39 Other operations 138
703
Under UK company law, dividends can only be paid if a company has distributable reserves sufficient to cover the dividend. At 31 December 2010, Aviva plc itself had distributable reserves of £3,327 million, sufficient to pay dividends to our shareholders for three years based on historic dividend payments. In UK Life, our largest operating subsidiary, distributable reserves, which could be paid to Aviva plc via its intermediate holding company, are created mainly by the statutory long-term business profit transfer to shareholders that occurs upon the declaration of bonuses to policyholders of with-profit products. While the UK insurance regulatory laws applicable to UK Life and our other UK subsidiaries impose no statutory restrictions on an insurer’s ability to declare a dividend, the FSA’s rules require maintenance of each insurance company’s solvency margin, which might impact their ability to pay dividends to the parent company. Our other life and general insurance, and fund management subsidiaries’ ability to pay dividends and make loans to the parent company is similarly restricted by local corporate or insurance laws and regulations. For example, the ability of our US insurance subsidiaries to provide inter-company loans is subject to state regulations which restrict the making of loans or require explicit regulatory approval. In all jurisdictions, when paying dividends, the relevant subsidiary must take into account its capital position and must set the level of dividend to maintain sufficient capital to meet minimum solvency requirements and any additional target capital expected by local regulators. These minimum solvency requirements, which are consolidated under the European Insurance Group Directive, are discussed later in this section under the heading ‘Regulatory capital position’. Our US subsidiaries are also subject to state laws that limit the dividends payable to the parent company and dividends in excess of these limitations generally require the approval of the state insurance commissioner. We do not believe that the legal and regulatory restrictions constitute a material limitation on the ability of our businesses to meet their obligations or to pay dividends to the parent company, Aviva plc. We have also received funds from the sale of parts of our businesses. For the year ended 31 December 2010 cash proceeds from the disposal of subsidiaries, joint ventures and associates net of cash transferred amounted to £54 million compared to £1,131 million for the year ended 31 December 2009. Principal disposals in 2010 and cash consideration received are disclosed in ‘Financial statements IFRS – Note 3 – Subsidiaries’. We have established two main programmes for the issuance of external debt. For short-term senior debt issuance we have a £2 billion commercial paper programme which allows debt to be issued in a range of currencies. At 31 December 2010 the outstanding debt issued under this programme was £504 million. For longer term debt we have established a Euro Medium Term Note (EMTN) programme. This programme has documentation readily available to allow quick issuance of long-term debt with a variety of terms of conditions. Debt issued under this programme may be senior guaranteed debt or regulatory qualifying debt and may have a fixed or floating interest rate. At 31 December 2010 the outstanding debt issued under this programme was £1,458 million.
Application of funds We use funds to pay dividends to our shareholders, to service our debt and to pay our central Group cash flows. In 2010, total cash paid by the Company as ordinary and preference dividends and coupon payments on direct capital instrument amounted to £575 million, compared to £574 million in 2009.

145
Performance reviewCorporate responsibilityGovernanceShareholder informationFinancial statements IFRSFinancial statements MCEVOther information
Shareholder information
Aviva plc Annual Report and Accounts 2010 Shareholder information continued
In 2010, our total debt costs on central borrowings were £324 million. This compared to £334 million of interest paid on central borrowings in 2009. Total corporate centre expenses in 2010 were £178 million compared to £159 million in 2009. An additional application of our funds is the acquisition of businesses. In 2010, cash paid for the acquisition of subsidiaries, joint ventures and associates net of cash acquired amounted to £7 million, compared to £596 million in 2009. Principal acquisitions in 2010 and cash consideration paid are disclosed in ‘Financial statements IFRS – Note 3 – Subsidiaries’.
Capital injections We make capital injections into our businesses where necessary to ensure that they meet their local solvency requirements and also to support development of their operations. Capital is provided either by equity or, where a local holding company is in place, maybe via loans with the holding company subsequently injecting equity capital in the regulated operating company. Each capital injection is subject to review by our central Group Approvals Committee and needs to meet our required internal rates of return. To the extent capital injections are provided or funded by regulated entities, then we have to consider the impact on regulatory capital of the capital injection. Otherwise our ability to make capital injections into our businesses is not materially limited by applicable legal and regulatory restrictions. Total capital injections into the business units were £333 million and £612 million in 2010 and 2009 respectively.
Consolidated cash flows The cash and cash equivalents consist of cash at banks and in hand, deposits held at call with banks, treasury bills and other short-term highly liquid investments that are readily convertible to known amounts of cash and which are subject to an insignificant risk of change in value. For the purposes of the cash flow statement, cash and cash equivalents also include bank overdrafts, which are included in payables and other financial liabilities on the balance sheet.
Year ended 31 December 2010 Net cash from operating activities Total net cash from operating activities decreased by £878 million to £1,807 million in 2010 (2009: £2,685 million). The decrease is due to lower investment income and higher claims in the long-term business segment.
Net cash used in investing activities Net cash from investing activities increased by £796 million to £364 million (2009: £432 million utilised). The increase is a result of a £930 million reclassification within the statement of cash flows described further in note 2(b). The underlying increase is a result of cash and cash equivalents acquired as part of the RBS Life acquisition described further in note 3(a).
Net cash out flow on financing activities Net cash used in financing activities was £797 million higher at £1,368 million (2009: £571 million). The increase is a result of a £930 million reclassification within the statement of cash flows described further in note 2(b). The underlying decrease of £133 million reflects higher interest payments partially offset by a lower net drawdown of borrowings.
Net cash and cash equivalents At 31 December 2010, total consolidated net cash and cash equivalents amounted to £24,695 million, an increase of £444 million over £24,251 million in 2009.
Year ended 31 December 2009 Net cash from operating activities Total net cash from operating activities decreased by £5,410 million to £2,685 million in 2009 (2008: £8,095 million). The decrease is due to lower pension and annuity sales, predominately in the UK, and lower general insurance and health sales.
Net cash used in investing activities Net cash from investing activities decreased by £37 million to £432 million utilised (2008: £395 million utilised). Principal acquisitions and disposals in 2008 and cash consideration paid and received are disclosed in ‘Financial statements IFRS – Note 3 – Subsidiaries’.
Net cash out flow on financing activities Net cash used in financing activities was £1,566 million lower at £571 million (2008: £2,137 million). The decrease is a result of the proceeds from the IPO of our Dutch business Delta Lloyd, lower interest payments on borrowing and a decrease in ordinary dividends paid.
Net cash and cash equivalents At 31 December 2009, total consolidated net cash and cash equivalents amounted to £24,251 million, an increase of £720 million over £23,531 million in 2008.
Currency Our exposures to movements in exchange rates and the management of these exposures is detailed in ‘Performance review – Financial and operating performance – Exchange rate fluctuations’.
Regulatory capital position Individual regulated subsidiaries measure and report solvency based on applicable local regulations, including in the UK the regulations established by the Financial Services Authority (FSA). These measures are also consolidated under the European Insurance Groups Directive (IGD) to calculate regulatory capital adequacy at an aggregate group level, where we have a regulatory obligation to have a positive position at all times. This measure represents the excess of the aggregate value of regulatory capital employed in our business over the aggregate minimum solvency requirements imposed by local regulators, excluding the surplus held in the UK and Ireland with-profit life funds. The minimum solvency requirement for our European businesses is based on the Solvency 1 Directive. In broad terms, for EU operations, this is set at 4% and 1% of non-linked and unit-linked life reserves respectively and for our general insurance portfolio of business is the higher of 18% of gross premiums or 26% of gross claims, in both cases adjusted to reflect the level of reinsurance recoveries. For our major non-European businesses (the US, and Canada) a risk charge on assets and liabilities approach is used.
European Insurance Groups Directive
UK Life funds
£bn
Other business
£bn 2010 £bn
2009 £bn
Insurance Groups Directive (IGD) capital resources 6.0 10.3 16.3 15.7
Less: capital resource requirement (CRR) (6.0) (6.5) (12.5) (11.2)
Insurance Groups Directive (IGD) excess solvency — 3.8 3.8 4.5
Cover of EU minimum (calculated excluding UK Life funds) 1.6 times 1.7 times

146
Aviva plc Annual Report and Accounts 2010 Shareholder information continued
The EU Insurance Groups Directive (IGD) regulatory capital solvency surplus has decreased by £0.7 billion since 31 December 2010 to £3.8 billion. The key movements over the period are set out in the following table:
£bn
IGD solvency surplus at 31 December 2009 4.5 Operating profits net of income and other expenses 1.0 Dividends net of scrip (0.5) Market movements including foreign exchange (0.2) Pension scheme funding (0.3) Increase in Capital Resource Requirement (0.3) Acquisitions (River Road and other small transactions) (0.2) Other (0.2)
Estimated IGD solvency surplus at 31 December 2010 3.8
Capital commitments Contractual commitments for acquisitions or capital expenditures of investment property, property and equipment and intangible assets, which have not been recognised in our consolidated financial statements, are as follows:
2010
£m 2009
£m 2008
£m
Investment property 63 66 7 Property and equipment 160 255 108 Intangible assets — 4 23
Total 223 325 138
Contractual obligations for future repairs and maintenance on investment properties are £1 million (2009: £1 million, 2008: £1 million). We have capital commitments to our joint ventures of £nil (2008: £nil, 2007: £nil) and to other investment vehicles of £nil million (2008: £33 million, 2008: £48 million). These commitments are expected to be funded through operational cash flow without recourse to core structural borrowings.

147
Performance reviewCorporate responsibilityGovernanceShareholder informationFinancial statements IFRSFinancial statements MCEVOther information
Shareholder information
Aviva plc Annual Report and Accounts 2010 Shareholder information continued
Audit Committee financial expert The Board has determined that Russell Walls, Richard Goeltz and Euleen Goh all qualify as Audit Committee financial experts within the meaning of Item 16A of Form 20-F, and that Russell Walls, Richard Goeltz and Euleen Goh are all independent as defined by the Securities and Exchange Commission rules and the New York Stock Exchange Corporate Governance Standards.
Code of ethics The Company has adopted a code of ethics for its group chief executive, chief financial officer, general auditor and group chief accounting officer as required by the provisions of Section 406 of the Sarbanes-Oxley Act of 2002 and the rules issued by the SEC. There have been no amendments to, or waivers from, the code of ethics relating to any of those officers. The code of ethics was filed on 7 October 2009 as an exhibit to our Form 20-F registration document.
Regulation Compliance In both our insurance and fund management businesses matters may arise as a result of industry-wide issues, inspection visits or other regulatory activity, requiring discussion and resolution with insurance industry regulators. The Aviva Group needs to ensure that procedures are in place to address any regulatory concerns, and that such procedures are properly planned, managed and resourced. Corrective action is undertaken, when necessary, with progress reported to relevant regulatory bodies in a timely manner.
Overview of regulation as it affects our business Our principal insurance and fund management operations are in the United Kingdom (UK), Europe, North America and the Asia Pacific region. We are therefore subject to financial services regulation in these areas, as individually covered below. However, as the Group’s parent company is based in the UK, both European Union (EU) legislation and the rules of the Financial Services Authority (FSA), the UK’s financial services regulator, can impact on Aviva’s business practices worldwide.
The European Union In addition to its UK businesses Aviva is also active in other EU member states through wholly owned subsidiary and joint venture companies. These companies are subject to the laws and regulations of the EU member state in which they are based, but are also affected by higher level EU legislation, which will continue to have a significant influence on the legislative environment, both in the UK and other EU markets. The EU operates by promulgating directives that must be implemented into local national legislation within each EU member country. These directives set the minimum standards for national legislatures to meet, with each legislature able to decide how they should be implemented. National governments may not pass laws which fail to meet the minimum standards set out in a directive, but are generally free to impose legal requirements which go beyond those required. Directives are written at a fairly high level, with more detail being provided at national level through legislation developed in accordance with the local legal system. Even greater detail may be imposed through the rules and regulations of national regulators, and for financial services businesses these rules can be extensive. EU financial services regulation is based on the principle of ‘home country control’, which makes the home country regulator responsible for monitoring compliance with all applicable regulation.
Key directives of particular relevance to the financial services industry, and so to Aviva’s businesses in the European Union include:
Third Life and Non-Life Directives These directives implemented the home country control principle for life and non-life insurance business, in the mid-1990s, and placed the responsibility for such issues as solvency, actuarial reserves, investment of assets, and certain governance issues on the home country regulator. Most companies licensed to conduct insurance business in one member state may rely on its home country regulation to ‘passport’ into all other member states to conduct business without having to be separately licensed in each. The general exception is selling activity which continues to be regulated by the state in which the sale takes place.
Insurance Groups Directive (IGD) The IGD requires member states to introduce the following measures to strengthen supervision of insurance companies which are part of a group:
an adjustment to the solvency calculation in relation to participating interest in other insurance undertakings in order to eliminate ‘double-gearing’ (the use of the same regulatory capital in more than one entity of a group).
an additional parent undertaking solvency margin calculation analogous to the adjusted margin test referred to above, to be applied at the level of the parent undertaking.
the introduction of new solo supervision requirements, including rules as to internal control within the insurance undertaking regarding the production of information relevant to supplementary supervision, the exchange of information within the group and the supervision of intra-group transactions.
further provisions aimed at ensuring co-operation between competent regulatory authorities of member states.
Since 31 December 2006 the group capital resources requirement (the parent undertaking solvency calculation mentioned above) has been a ‘hard’ test (i.e. it constitutes a requirement to maintain the group capital resources, rather than simply to make the calculation) for UK-based companies operating under FSA rules.
Reinsurance Directive Adopted on 16 November 2005, this directive requires that all reinsurance undertakings be authorised in their home member state. To obtain that authorisation, they need to meet strict requirements, but are then free to operate anywhere in the EU through the single market passport process.
Distance Marketing Directive Under the Distance Marketing Directive, EU member states are required to implement a framework of rules and guidance in order to protect consumers by:
setting minimum standards for information that must be provided to consumers before entering into a financial services contract by ‘distance means’.
for certain products and services, giving a cooling-off period in which a consumer may cancel a contract without penalty.
Insurance Mediation Directive This requires EU member states to establish a framework to:
ensure that insurance and reinsurance intermediaries have been registered on the basis of a minimum set of professional and financial requirements.
ensure that registered intermediaries will be able to operate in other member states by availing themselves of the freedom to provide services or by establishing a branch.

148
Aviva plc Annual Report and Accounts 2010 Shareholder information continued
impose on insurance intermediaries requirements to provide specified minimum information to potential customers.
Markets in Financial Instruments Directive (MiFID) MiFID, which superseded the earlier Investment Services Directive, builds on the home country control principle, extending the range of ‘core’ investment services and activities that may be passported from one member state to another, clarifying the allocation of responsibilities between home and host country jurisdictions, and introducing greater harmonisation governing the organisation and conduct of business of investment firms.
Solvency II The agreed Solvency II Level 1 Directive was published in November 2009. Solvency II represents a fundamental change in European regulation and will result in a more sophisticated economic risk-based capital approach. It establishes a solvency system that is better aligned to the true risks of insurers, and aims to enable supervisors to protect policyholder interests as effectively as possible in accordance with common principles across the EU. Since approval, focus has been on the Level 2 implementing measures that determine how the directive will be applied in practice, and expected amendments to the Solvency II Directive (Omnibus II Directive) following the creation of the new European Supervisory Authorities (ESAs) in September 2010. Uncertainty remains around the implementing measures, which are not expected to be finalised before June 2011. One of the new ESAs, the European Insurance and Occupational Pensions Authority (EIOPA), replaced CEIOPS on 1 January 2011. Proposed focused amendments to the Solvency II Directive were published in January 2011, giving power to EIOPA to issue binding guidance/standards, and delay implementation of Solvency II to 1 January 2013. This highlights the need for continued engaged industry participation, and Aviva has been actively participating, through the key European industry working groups who provide the voice of industry, in on-going discussions in Brussels.
Future EU developments In Europe agreement has been reached on the roles and powers of the new ESAs which came into force in January 2011. The new ESAs have powers to make binding rules and drive supervisory consistency and convergence through a single rule book. Their involvement in the colleges of supervisors for cross-border financial institutions, together with broader changes being progressed within Europe relating to financial conglomerates, signals a move towards more focused and intrusive group supervision. The European Parliament has now approved the Alternative Investment Fund Managers Directive, and each EU nation has two years to implement the directive. Once the directive is in force the regime governing the marketing of alternative investments to EU investors will be determined by the location of the fund manager and the fund. Managers established in the EU, and managing a fund established in the EU, will be able to apply for a passport to market that EU fund to ‘professional investors’ across the EU. If the manager, or the fund, is not established in the EU the current private placement regimes will apply, to enable the marketing of the fund within the EU. Two years after implementation a decision will be made regarding the possible extension of the passport regime to non-EU countries.
United Kingdom The Financial Services Authority In the UK, the Financial Services Authority (the ‘FSA) is currently the single regulator for those individuals and firms conducting defined regulated activities in the financial services sector. The FSA has the authority to make rules and issue guidance, taking into account relevant EU directives, in relation to a wide sphere of activity encompassing the governance of the conduct of business by, and the prudential supervision of, individuals and firms authorised by the FSA to conduct such business (‘Authorised Persons’ or ‘Authorised Firms’). Under the Financial Services and Markets Act 2000 (FSMA) no person may carry on, or purport to carry on, a regulated activity by way of business in the UK unless he is an Authorised Person or an exempt person. A firm granted permission by the FSA to carry on regulated activities becomes an Authorised Person for the purposes of FSMA. ‘Regulated activities’ are prescribed in the FSMA (Regulated Activities) Order 2001 and include banking, insurance and investment business, stakeholder pension schemes, insurance mediation and certain mortgage mediation and lending activities. Authorised Firms must at all times meet specified threshold conditions, including possession of adequate resources for the carrying on of its business, and being fit and proper to conduct that business, having regard to all the circumstances. Authorised Firms must also operate in accordance with the FSA’s Principles for Business. These are 11 high level principles for conducting financial services business in the UK, including maintenance of adequate systems and controls, treating customers fairly, and communicating with customers in a manner that is clear, fair and not misleading. The FSA regime is based on the principle that firms should have effective systems and controls, including robust risk management, which are appropriate to the size, complexity and diversity of their business.
The FSA’s regulation of the Group A number of the Group’s UK subsidiaries are directly authorised and regulated by the FSA, including our insurance companies (e.g. the UK Life and UK General Insurance companies), asset managers (Aviva Investors) and intermediaries (UK Healthcare and RAC Motoring Services). Aviva plc, although not directly authorised by the FSA, does itself come within the scope of some regulation, as the ultimate insurance holding company in the Group. As Aviva is a UK-based group, the FSA has the responsibility of acting as lead regulatory (i.e. the cross-sector supervisory co-ordinator) for the Group within the EU.
Approved persons and controllers The FSA places great emphasis on the principle of senior management responsibility. The directors of, and senior managers carrying out FSA defined controlled function roles in, any of the Group’s regulated entities are individually registered with the FSA under the ‘Approved Person’ regime, and can be held directly accountable to the FSA for control failings in those firms. A number of senior managers at Group level have also been registered as Approved Persons for the regulated subsidiaries, even though they are neither directors nor senior managers of these firms. This recognises that these managers exert significant influence over the regulated subsidiaries, because they are responsible for key parts of the Group’s control framework on which the regulated subsidiaries place reliance. The FSA regulates from a legal entity perspective, even though Aviva tends to operate within Regions by Business Unit. However, the FSA also expects that Aviva’s regulated subsidiaries

149
Performance reviewCorporate responsibilityGovernanceShareholder informationFinancial statements IFRSFinancial statements MCEVOther information
Shareholder information
Aviva plc Annual Report and Accounts 2010 Shareholder information continued
operate within an overall framework of Group governance and controls. Its rules expressly provide that any systems and controls which operate on a Group basis will be taken into account in determining the adequacy of a regulated subsidiary’s systems and controls. The robustness of these Group controls is therefore subject to scrutiny and challenge by the FSA. The FSA regulates the acquisition and increase of control over Authorised Firms. Under FSMA, any person proposing to acquire control of, or increase control over certain thresholds of, an Authorised Firm must first obtain the consent of the FSA. The Authorised Firm must also inform the FSA of any such proposed acquisition or increase. In considering whether to grant or withhold its approval of the acquisition or increase of control, the FSA must be satisfied both that the acquirer is a fit and proper person and that the interests of consumers would not be threatened by this acquisition or increase of control. Control over a UK Authorised Firm (A) is acquired if the acquirer:
holds 10% (or 20% if the Authorised Firm is an insurance intermediary) or more of the shares, or voting power, in that firm, or a parent undertaking of the firm; or
is able to exercise significant influence over the management of the firm by virtue of the acquirer’s shares or voting power in that company or a parent undertaking of the firm.
Increases in control require the consent of the FSA when they reach thresholds of 20%, 30% and 50% of the shares or voting power of the firm (or its parent). In order to determine whether a person or a group of persons is a ‘controller’ for the purposes of FSMA, the holdings (shares or voting rights) of the person and any other person ‘acting in concert’, if any, are aggregated.
FSA conduct of business rules The FSA’s Conduct of Business (COB) and Insurance: Conduct of Business (ICOB) Rules apply to every Authorised Firm carrying on relevant regulated activities, and regulate the day to day conduct of business standards to be observed by all Authorised Persons in carrying out regulated activities. The COB and ICOB Rules are principle based, and the scope and range of obligations imposed on an Authorised Firm will vary according to the scope of its business and range of the Authorised Firm’s clients. Generally speaking, however, the obligations imposed on an Authorised Firm by the COB and ICOB Rules will include the need to classify its clients according to their level of sophistication, provide them with information about the Authorised Firm, meet certain standards of product disclosures (including fee and remuneration arrangements), ensure that promotional material which it produces is clear, fair and not misleading, assess suitability when advising on certain products, control the range and scope of advice given, manage conflicts of interest, report appropriately to its clients and provide certain protections in relation to client assets.
Capital and solvency rules for insurers The FSA rules require that a UK insurer (including those within the Group) must hold capital resources equal to at least the Minimum Capital Requirement (the MCR). Insurers with with-profits liabilities of more than £500 million (which is the case with Aviva’s with-profits fund) must hold capital equal to the higher of MCR and the Enhanced Capital Requirement (the ECR). The ECR is intended to provide a more risk responsive and ‘realistic’ measure of a with-profits insurer’s capital requirements, whereas the MCR is broadly equivalent to the previous required minimum margin, and satisfies the minimum EU standards.
Determination of the ECR involves the comparison of two separate measurements of the Authorised Firm’s financial resources requirements, which the FSA refers to as the ‘twin peaks’ approach. The two separate peaks are:
the requirement comprised by the mathematical reserves plus the ‘long term insurance capital requirement’ (the LTICR), together known as the ‘regulatory peak’; and
a calculation of the ‘realistic’ present value of the insurer’s expected future contractual liabilities together with projected ‘fair’ discretionary bonuses to policyholders, plus a risk capital margin, together known as the ‘realistic peak’.
All insurers must also carry out an Individual Capital Assessment (ICA) to calculate the amount of capital needed to back their business. If the FSA decides that the final ICA amount is insufficient, it may draw up its own Individual Capital Guidance (ICG) for the firm, which can be imposed as a requirement on the scope of the Authorised Firm’s permission.
Day-to-day supervision The FSA takes a risk-based approach to its regulatory activity, concentrating its resources on those firms and activities which it assesses pose the greatest potential threats to its four statutory objectives of:
maintaining confidence in the UK financial system contributing to the protection and enhancement of stability
of the UK financial system securing the appropriate degree of protection for consumers reducing the extent to which it is possible for a regulated
business to be used for a purpose connected with financial crime
Given our size, and our share of the UK retail market, a major issue within our business which causes concern for the FSA may have a significant impact on these objectives. The FSA therefore aspires to have a ‘close and continuous’ relationship with us, with day-to-day supervision of Aviva conducted by a dedicated team within its Major Retail Groups Division. In practice, this means that a wide range of Group, Regional and UK Business Unit senior managers have regular scheduled ‘close and continuous’ meetings with the FSA, and other meetings and discussions on specific issues take place as the need occurs. This adds up to weekly or even daily FSA interaction at UK Region, Business Unit and Group level. The FSA also periodically conducts a formal Advanced Risk-Responsive Operating framework (ARROW) review of Aviva, to assess the level of risk that the Group poses to each of the FSA objectives. The last full risk assessment was conducted in 2009 and the next full risk assessment is due to take place in quarter 3, 2011. Areas of potential risk or weakness, where the FSA particularly requires Aviva to focus attention, are formally set out in a Risk Mitigation Plan (RMP), with both risk assessment and RMP issues up-dated on an ongoing basis between each ARROW review. The FSA has highlighted in its 2010 Business Plan that its key focus areas for 2010/2011 would be:
ensuring firms are soundly run, with effective risk management in place, through close scrutiny of corporate governance, financial reporting, remuneration arrangements, recovery and resolution plans, and firms’ ability to identify and mitigate risk.
a more proactive and intensive approach to supervision, through implementation of its Core Prudential Programme for Insurers (CPPI).
maintaining pressure on firms to treat customers fairly.

150
Aviva plc Annual Report and Accounts 2010 Shareholder information continued
playing a full role as an international leader in financial regulation.
Solvency II, which remains central to our engagement with the FSA as the industry and the regulator prepare for the application of this new regulatory regime.
Outside of the UK, each Aviva business is regulated by its own national regulator(s). However, overseas operations are also within the remit of the FSA for two main reasons: The structure of the Group means that the great majority of the overseas operations are owned, ultimately, by Aviva International Insurance Ltd (AII), a UK regulated insurance company. In its regulation of AII, the FSA has an interest in the systems and controls by which the Group manages its overseas businesses, to mitigate the risk of financial shocks arising overseas flowing through to the UK. The FSA monitors the strategy and performance of the Group’s international businesses through its programme of regular close and continuous meetings. The FSA aims to play a leading role in the development of both EU and international regulation. It is, in particular, at the vanguard of the movement towards risk-based insurance regulation. In line with this the FSA continues to place increasing weight on the ‘Treating Customers Fairly’ principle.
Intervention and enforcement The FSA has extensive powers to investigate and intervene in the affairs of Authorised Firms and is obliged under FSMA to monitor compliance with the requirements imposed by, and to enforce the provisions of, FSMA, related secondary legislation and the rules made thereunder. The FSA’s enforcement powers, which may be exercised against both Authorised Firms and Approved Persons, include public censure, imposition of unlimited fines and, in serious cases, the variation or revocation of permission to carry on regulated activities or of an Approved Person’s status. The FSA may also vary or revoke an Authorised Firm’s permissions to protect the interests of consumers or potential consumers, if the Authorised Firm has not engaged in regulated activity for 12 months, or if it is failing to meet the threshold conditions for authorisation. The FSA has further powers to obtain injunctions against Authorised Persons and to impose or seek restitution orders where consumers have suffered loss. In addition to applying sanctions for market abuse, the FSA has the power to prosecute criminal offences arising under FSMA and insider dealing under Part V of the Criminal Justice Act 1993, and breaches of money laundering regulations. The FSA’s stated policy is to pursue criminal prosecution in all appropriate cases.
The Financial Services Compensation Scheme (FSCS) The FSCS is intended to compensate individuals and small businesses for claims against an Authorised Firm where the Authorised Firm is unable or unlikely to be able to meet those claims (generally, when it is insolvent or has gone out of business). Under a new funding system that started on 1 April 2008, for the purposes of funding FSCS compensation costs, the FSCS levy is split into five broad classes:
Deposits Long-term insurance and pensions General insurance Investments Home finance
With the exception of the deposits class, each broad class is divided into two sub-classes based on provider/intermediation activities. Each of the ‘sub-classes’ is made up of firms which are
providers or intermediaries and engage in similar styles of business with similar types of customer. The sub-classes are based on the activities a firm undertakes (and are aligned to their FSA permissions). A firm could be allocated to one or more sub-classes according to the activities that it undertakes. In the event of a failure of a market participant, the Authorised Firms in the Group could be required to make contributions to compensate investors. It should be noted that such contributions are not restricted to failures in the sub-classes to which a particular firm belongs, as there is the potential for cross-subsidy between sub-classes to be required.
Restrictions on business FSA rules restrict an insurance company from carrying on any commercial business other than insurance business and activities directly arising from that business. Therefore, the FSA authorised insurance companies in the Group are bound by this restriction.
Long-term assets and liabilities Where a UK insurer carries on life insurance business, its long-term business assets and liabilities – i.e. those assets and liabilities relating to life and health insurance policies – must be segregated from the assets and liabilities attributable to non-life insurance business or to shareholders. Separate accounting and other records must be maintained and a separate fund established to hold all receipts of long-term business. The extent to which long-term fund assets may be used for purposes other than long-term business is restricted by the FSA rules. Only the ‘established surplus’, which is the excess of assets over liabilities in the long-term fund as determined by actuarial investigation, may be transferred so as to be available for other purposes. Restrictions also apply to the payment of dividends by the insurance company, as described below. FSA rules also require insurers to maintain sufficient assets in the separate long-term insurance fund to cover the actuarially determined value of the insurance liabilities.
Distribution of profits and with-profits business For UK authorised life insurers carrying on with-profits business, the FSA’s rules require that once an allocation of surplus in a with-profits fund has been made to policyholders, no transfer of assets representing any part of a subsequent surplus can be made, to shareholders or otherwise, unless either the ‘relevant minimum’ (as defined in the FSA Handbook) of the surplus has been allocated to policyholders or a statutory notification procedure has been followed. Calculation of the relevant minimum is based on the percentage of the relevant surplus previously allocated to eligible policyholders.
Reporting requirements FSA rules require insurance companies to file their audited annual accounts, statements of financial position and life insurers’ annual reports from the actuary performing the actuarial function with the regulator. There is also a requirement to report the annual solvency position of the insurance company’s ultimate parent. The FSA uses the annual return to monitor the solvency (i.e. the ability to meet current and future obligations such as claims payments to policyholders) of the insurance company. For general insurance business, the return is also used to assess retrospectively the adequacy of the company’s claims provisions. The directors of an insurance company are required to sign a certificate, which includes a statement as to whether the company has maintained the required minimum margin of solvency throughout the year. The directors must also certify that the company has completed its return to the FSA properly in accordance with the FSA’s instructions, and that the directors are satisfied that the company

151
Performance reviewCorporate responsibilityGovernanceShareholder informationFinancial statements IFRSFinancial statements MCEVOther information
Shareholder information
Aviva plc Annual Report and Accounts 2010 Shareholder information continued
has complied in all material respects with the requirements set out in the FSA rules.
UK winding up rules The general insolvency laws and regulations applicable to UK companies are modified in certain respects in relation to UK insurance companies, where direct insurance claims will have priority over the claims of other unsecured creditors (with the exception of preferred creditors), including reinsurance creditors, on a winding up by the court or a creditors’ voluntary winding up of the insurance company. Furthermore, instead of making a winding-up order when an insurance company has been proved unable to pay its debts, a UK court may reduce the amount of one or more of the insurance company’s contracts on terms and subject to conditions (if any) which the court considers fit. Where an insurance company is in financial difficulties but not in liquidation, the Financial Services Compensation Scheme may take measures to secure the transfer of all or part of the business to another insurance company. FSMA provides further protection to policyholders of insurance companies effecting or carrying out contracts of long-term insurance. Unless the court orders otherwise, a liquidator and/or administrator must carry on the insurer’s business so far as it consists of carrying out the insurer’s contracts of long-term insurance with a view to it being transferred as a going concern to a person who may lawfully carry out those contracts. In carrying on the business, the liquidator/administrator may agree to the variation of any contracts of insurance in existence when the winding-up order is made, but must not effect any new contracts of insurance.
United States We write life and annuity business in the United States through Aviva USA, a wholly owned subsidiary formed by the merger of Aviva Life Insurance Company of America with AmerUS which it acquired in July 2006. Aviva USA is domiciled in Iowa and licensed to conduct business in all 50 states. In New York it operates a wholly owned subsidiary, Aviva Life Insurance Company of New York. The US insurance industry is regulated primarily on a state- by-state basis therefore individual states have authority to pass statutes, adopt regulation or issue directives to regulate insurance activities within their jurisdiction. Consequently, life insurance companies are subject to regulation both in the state in which they are domiciled as well as in each of the individual states in which they operate. State regulation can vary in detail from state to state. All have laws and regulations covering the financial aspects of the insurance business including standards of solvency, reserves reinsurance and capital adequacy. In addition, most states have specific regulation governing licensing and the conduct of selling agents as well as the approval of products and associated product forms and literature.
Federal initiatives While the National Association of Insurance Commissioners (NAIC) has no statutory powers, its members are the insurance commissioners in each state and it acts as a forum to develop and propose model laws and regulations. Each state then decides whether to adopt the NAIC model laws or regulations and each state may make changes to the adoption process. However, the models are generally widely adopted. An example is the ‘Suitability in Annuity Transactions Model Act’ which has been widely adopted by states for a broad range of transactions. NAIC has a commitment to modernising the state-based system of insurance regulation and is pushing forward an action plan aimed at achieving consistency of approach between states
on a number of issues including consumer protection, licensing, solvency and changes in insurance company control. The American Council of Life Insurers (ACLI) has, in the past, proposed an optional federal charter (OFC) under which life insurers could choose to be federally regulated instead of state regulated. However, the OFC has not been widely supported or adopted. In 2010 Congress passed a law adopting significant federal regulatory reforms for the financial services industry in the US. The new law will impose stricter prudential standards on systemically significant financial companies, higher risk financial activities and introduce new mechanisms for resolving failures of significant financial companies. The law requires additional stress testing and reporting on a regular basis. In addition, a Federal Insurance Office (FIO) has been established within the Treasury Department to monitor the insurance industry, co-ordinate federal policy and, along with the US Trade Representative, enter into international agreements on prudential insurance matters. While the FIO will have no direct regulatory authority over the business of insurance such international agreements could pre-empt inconsistent state insurance laws. The FIO will also be required to conduct a study of how to improve and modernise insurance regulation and report to Congress within one year. The new law does not currently have any immediate and significant impact on the Company and the FIO is still in the process of being organised. However, we continue to monitor the FIO and related rulemaking developments. Additionally, there is active discussion within the NAIC of moving to a principles-based valuation system for the setting of reserves and capital for life insurance companies. This could change our statutory reserve and capital requirements significantly and it is not possible to estimate the impact on our financial condition and results of operation at this time.
Risk-based capital The NAIC has developed risk-based capital standards for life insurance companies as well as a model act for state legislatures to enact. The model act requires that life insurance companies report on a formula-based, risk-based capital standard that they calculate by applying factors to various asset, premium and reserve items. The formula takes into account the risk characteristics of a company, including asset risk, insurance risk, interest rate risk and business risk. The NAIC designed the formula as an early-warning tool to identify potentially inadequately capitalised companies for the purposes of initiating regulatory action. The model act imposes broad confidentiality requirements on those engaged in the insurance business (including insurers, agents, brokers and others) and on state insurance departments as to the use and publication of risk-based capital data. Any state adopting the model act gives the state insurance commissioner explicit regulatory authority to require various actions by, or take various actions against, insurance companies whose adjusted capital does not meet minimum risk-based capital standards. The Iowa Insurance Commissioner takes into account the NAIC’s risk-based capital standards to determine adequate compliance with Iowa insurance law. Effective 31 December 2005, the NAIC implemented new requirements, referred to as C-3 Phase II, for calculating risk-based capital in connection with variable annuity products with death and living benefit guarantees. These changes did not have a material effect on our US operations, and at 31 December 2010, the Company’s total adjusted capital under the NAIC’s definition substantially exceeded Iowa standards.

152
Aviva plc Annual Report and Accounts 2010 Shareholder information continued
Canada We write property and casualty business in Canada via a number of wholly owned companies. Insurance business in Canada is regulated federally by the Office of the Superintendent of Financial Institutions (OSFI) with the focus very much on prudential supervision, i.e. capital adequacy, solvency, etc. OSFI derives its powers from the federal Insurance Companies Act (Canada) which governs the structure and operation of federally incorporated insurance companies. The capital adequacy of insurance companies is monitored under the Minimum Capital Test (MCT) – a risk-based framework allowing for capital to be assessed on the basis of an individual company’s risk profile taking account of the investments held and insurance business being written. Companies have their own internal MCT target as well as being expected to maintain capital in excess of 150% of the OSFI minimum requirement. There are also ten individual provincial regulators each regulating predominantly conduct of business issues such as policy terms and conditions, pricing and underwriting of companies they have licensed to write business in the province.
Asia Pacific We operate within the Asia Pacific region through a network of subsidiary companies either wholly owned or established as a joint venture with a local partner. Our business in the region is predominately long-term and savings business, with small general insurance and health operations. There are wholly owned businesses in Singapore and Hong Kong. Aviva operates in China, India, Malaysia, Sri Lanka, Taiwan, Korea, Indonesia and Vietnam which, depending on the nature and extent of the control we are able to exert, are either accounted for as subsidiaries, joint ventures or associates. The Asia Pacific region is made up of a number of widely differing and independent markets. The markets tend to be at different stages in their development but each has its own regulatory structures and Aviva complies with the local regulation in each of the countries in which it operates. Industry regulation across the region typically focuses on financial stability, i.e. minimum capital and the basis for calculating solvency, reserves and policyholder liability. In many of the markets across the region regulators have the power to revoke operating licences, regulate shareholder structures and the participation in and the payment of dividends. Markets within the region are moving quickly to modernise insurance regulation with an increasing focus on governance and conduct of business.
Intellectual property Our primary brands in the UK (Aviva, RAC) are registered trade marks in the UK and elsewhere. Aviva owns approximately 300 registered or pending marks in the UK, including Community trade marks having effect in the entire EU. Aviva has an active programme of review of marks and watching for infringements. There are no material infringements in the UK known to us as at the date of this report, either by the Group or third parties.

153
Performance reviewCorporate responsibilityGovernanceShareholder informationFinancial statements IFRSFinancial statements MCEVOther information
Shareholder information
Aviva plc Annual Report and Accounts 2010 Shareholder information continued
Risks relating to our business You should carefully review the following risk factors together with other information contained in this Annual Report before making an investment decision in our ordinary shares or ADSs. Our business, financial position, results of our operations and cash flow could be materially affected by any of these risks, the trading price of our ordinary shares or ADSs could decline due to any of these risks and investors may lose part or all of their investment.
Difficult conditions in the global capital markets and the economy generally may materially adversely affect our business and results of operations and we do not expect these conditions to improve in the near future. Our results of operations are materially affected by conditions in the global capital markets and the economy generally, in the UK, Europe, the US and elsewhere around the world. The world-wide economic environment remains uncertain. Even though some indicators are beginning to show positive trend there is a risk that the pace of recovery is not sustained, or in a worse case reverses. The path to sustained economic growth remains fragile and uneven and we continue to see levels of market volatility in global capital markets, in both debt and equity. Governments and their central banks are attempting to manage a difficult economic situation. Withdrawal of fiscal stimulus may simply push the world’s economies back into recession, while continued stimulus may lead to unsustainable asset price inflation and higher long-term inflation. The ongoing economic and sovereign concerns still pose several threats that may lead to higher volatility going forward. We cannot predict the level of growth in the global economy, but as with most businesses, we believe a period of weak market growth would have an adverse effect on our business and results of operations. In addition, the fixed-income markets have experienced a period of volatility which has negatively impacted market liquidity conditions. Financial markets remain vigilant to concerns about rising government deficits and debt levels across the globe together with the problems facing the current account deficit (CAD) countries which are also in the Eurozone. Fiscal policy tightening of CAD countries could prolong their recessions. Domestic and international equity markets have also experienced volatility and uncertainty. The type of events and continuing market volatility may have an adverse effect on us, in part because we have a large investment portfolio and are also dependent upon customer behaviour. Our sales are likely to decline in such circumstances and our profit margins could erode. Even in the absence of a market downturn, we are exposed to substantial risk of loss due to market volatility. Although the financial situation has significantly improved since the middle of 2009, markets remain fragile. ‘Financial statements IFRS – Note 5 – Details of income’ and ‘– Note 25 – Financial investments’ include analyses of unrealised and realised investment losses. Factors such as consumer spending, business investment, government spending, the volatility and strength of both debt and equity markets, and inflation all affect the business and economic environment and ultimately, the amount and profitability of our business. In an economic downturn characterised by higher unemployment, lower household income, lower corporate earnings, lower business investment and lower consumer spending, the demand for our financial and insurance products could be adversely affected. In addition, we may experience an elevated incidence of claims or surrenders of policies that could affect the current and future profitability of
our business. Although our sales figures have been reasonably consistent with prior years, a prolonged economic crisis could result in lower sales figures in the future. Our policyholders may choose to defer paying insurance premiums or stop paying insurance premiums altogether. These adverse changes in the economy could affect earnings negatively and could have a material adverse effect on our business, results of operations and financial condition.
Changes in interest rates may cause policyholders to surrender their contracts, reduce the value of our investment portfolio and impact our asset and liability matching, which could adversely affect our results of operation and financial condition. Our exposure to interest rate risk relates primarily to the market price and cash flow variability associated with changes in interest rates. Certain of our life insurance businesses may be exposed to disintermediation risk. Disintermediation risk refers to the risk that our policyholders may surrender their contracts in a rising interest rate environment or for liquidity reasons, requiring us to liquidate assets in an unrealised loss position. Due to the long-term nature of the liabilities associated with certain of our life insurance businesses, and guaranteed benefits on certain long-term insurance and fund management products, sustained declines in long-term interest rates may subject us to reinvestment risks and increased hedging costs. In other situations, declines in interest rates may result in increasing the duration of certain life insurance liabilities, creating asset liability duration mismatches. Our investment portfolio also contains interest rate sensitive instruments, such as fixed income securities, which may be adversely affected by changes in interest rates from governmental monetary policies, domestic and international economic and political conditions and other factors beyond our control. A rise in interest rates would increase the net unrealised loss position of our investment portfolio, offset by our ability to earn higher rates of return on funds reinvested. Conversely, a decline in interest rates would decrease the net unrealised loss position of our investment portfolio, offset by lower rates of return on funds reinvested. Our mitigation efforts with respect to interest rate risk are primarily focused on maintaining an investment portfolio with diversified maturities that has a weighted average duration approximately equal to the duration of our estimated liability cash flow profile. However, it may not be possible to hold assets which will provide cash flows to exactly match those relating to policyholder liabilities, in particular in jurisdictions with undeveloped bond markets and in certain markets where regulated surrender value or maturity values are set with reference to the interest rate environment prevailing at the time of policy issue. This is due to the duration and uncertainty of the liability cash flows and the lack of sufficient assets of suitable duration. This results in a residual asset/liability mismatch risk which can be managed but not eliminated. In addition, our estimate of the liability cash flow profile may be inaccurate and we may be forced to liquidate investments prior to maturity at a loss in order to cover the liability. See ‘Financial statements IFRS – Note 57 – Risk management’.

154
Aviva plc Annual Report and Accounts 2010 Shareholder information continued
We are exposed to possible widening in credit spreads which could increase the net unrealised loss portion of the investment portfolio and adversely affect our results of operations. Our exposure to credit spreads primarily relates to market price and cash flow variability associated with changes in credit spreads in our investment portfolio which is largely held to maturity. Market volatility can make it difficult to value certain of our securities if trading becomes less frequent. Accordingly, valuations of investments may include assumptions or estimates that may have significant period to period changes due to market conditions, which could have a material adverse effect on our consolidated results of operations or financial condition.
Falls in property prices could have an adverse impact on our investment portfolio and impact our results of operations and shareholders’ equity. We are subject to property price risk due to holdings of investment properties in a variety of locations worldwide. We are also subject to liquidity, valuation and counterparty risks in relation to property investments. These investments may be adversely affected by weakness in real estate markets in the UK, US and much of the rest of the world and increased mortgage delinquencies. We are also subject to property risk indirectly in our investments in residential mortgage-backed securities (RMBS) and commercial mortgage-backed securities (CMBS). There is the risk that the underlying collateral within our investments in mortgage-backed securities may default on principal and interest payments causing an adverse change in cash flows paid to our investments. In many cases, the markets for these property investments and instruments have become highly illiquid, and issues relating to counterparty credit ratings and other factors have exacerbated pricing and valuation uncertainties.
Fluctuations in the fixed income and equity markets could affect the levels of regulatory capital that we must hold for regulatory solvency purposes and for pension obligations, which could materially impact our results of operations and shareholders’ equity. The value of our investment assets fluctuates, which can impact the capital levels supporting our business. We are required to hold an excess amount of our capital over a minimum solvency amount. Our IGD solvency surplus decreased from £4.5 billion as of 31 December 2009 to £3.8 billion as of 31 December 2010. Of this movement, £0.3 billion relates to additional funding contributions to the Aviva pension scheme. An inability to meet regulatory capital requirements in the future would be likely to lead to intervention by the Financial Services Authority (FSA), which could require the Group to restore regulatory capital to acceptable levels. See ‘Liquidity and capital resources’ section in the report. We are also exposed to interest rate and equity risk based upon the discount rate and expected long-term rate of return assumptions associated with our pension and other post-retirement benefit obligations. Sustained declines in long-term interest rates or equity returns would have a negative effect on the funded status of these plans. See ‘Financial statements IFRS – Note 48 – Pension obligations’.
Governmental initiatives intended to alleviate the current financial crisis that have been adopted may not be effective and, in any event, are expected to be accompanied by other initiatives, including new capital requirements or other regulations, that could materially affect our results of operations, financial condition and liquidity in ways that we cannot predict. In a number of countries in which we operate legislation has been passed in an attempt to stabilise the financial markets, including
bank stabilisation programmes by the government and Bank of England in the UK. These programmes, as well as accompanying actions, such as monetary or fiscal actions, of comparable authorities in the US, UK, Eurozone and other countries, may not achieve their intended objectives and may have unintended consequences. These proposals or actions may have other consequences, including material effects on interest rates and foreign exchange rates, which could materially affect our investments, results of operations and liquidity in ways that we cannot predict. The failure to effectively implement, or to withdraw as appropriate, proposals or actions could also increase constraints on the liquidity available in the banking system and financial markets and increase pressure on stock prices, any of which could materially and adversely affect our results of operations, financial condition and liquidity. In the event of future material deterioration in business conditions, we may need to raise additional capital or consider other transactions to manage our capital position or liquidity. In addition, we are subject to extensive laws and regulations that are administered and enforced by a number of different governmental authorities and non-governmental self-regulatory agencies, including the FSA and other regulators. In light of financial conditions, some of these authorities are or may in the future consider enhanced or new regulatory requirements intended to prevent future crises or otherwise assure the stability of institutions under their supervision. These authorities may also seek to exercise their supervisory or enforcement authority in new or more robust ways. All of these possibilities, if they occurred, could affect the way we conduct our business and manage our capital, and may require us to satisfy increased capital requirements, any of which in turn could materially affect our results of operations, financial condition and liquidity.
Defaults in our bond, residential and commercial mortgage and structured credit portfolios may have an adverse impact on our profitability and shareholders’ equity. We have a significant exposure to credit risk through our investments in corporate bonds, residential and commercial mortgages and structured credit assets, as well as second order exposures through counterparty risks in our derivatives contracts and reinsurance placements. The risks in these assets and exposures may be borne by Aviva plc and our shareholders or by the policyholders whose policies the assets back, or a mixture of the two, where we hold some residual risk. We held a total of £370 billion of assets on our statement of financial position at 31 December 2010, of which £148 billion are assets where Aviva plc and our shareholders bear the risk. Such assets included as of 31 December 2010:
£57,886 million invested in bonds, of which £19,149 million are issued by government-related entities, and the remaining are from corporate bonds;
£30,109 million invested in mortgages, of which £12,943 million are commercial mortgages, £8,850 million are residential mortgages (including equity release) and the remaining are securitised mortgages, for which the majority of the risk have been sold to third parties, and Aviva plc and our shareholders only retain exposure to approximately £1,300 million;
£4,616 million invested in policy loans, loans and advances to banks and other loans;
£7,606 million invested in structured credit assets, of which £1,628 million is US Agency backed RMBS, £896 million is non-Agency RMBS, £2,185 million is CMBS and the remaining are CDOs, other ABS and wrapped credit assets;
£9,061 million invested in other Financial Assets including equities and other investments;

155
Performance reviewCorporate responsibilityGovernanceShareholder informationFinancial statements IFRSFinancial statements MCEVOther information
Shareholder information
Aviva plc Annual Report and Accounts 2010 Shareholder information continued
£8,489 million of cash and cash equivalents; and £5,150 million of Reinsurance Assets.
The remaining £24,959 million is comprised of various other shareholder assets such as goodwill and value of in-force business, intangible assets, property and equipment, tax assets (current and deferred), receivables and other financial assets, prepayment and accrued income, and deferred acquisition costs. These assets in normal economic conditions reasonably match our long-term insurance liabilities and benefit both policyholders and shareholders. Adverse changes to market conditions, however, could provoke an increase in credit defaults with a negative effect on shareholders’ equity and reduced investment returns. Falls in investment returns could impair our operational capability, including our ability to write significant volumes of new business. For additional information about our investments, see ‘Performance review – Analysis of investments’.
A decline in equity markets or an increase in volatility in equity markets may adversely affect sales of our investment products, our fund management business, our profitability and the market value of our assets invested for our defined benefit pension scheme. Significant downturns and volatility in equity markets could have a material adverse effect on our financial condition and results of operations in several ways. Downturns in equity markets will depress equity prices and have a negative impact on our capital position in that unrealised losses in our net investment portfolio will increase, and our defined benefit pension scheme deficit will increase as the market value of scheme assets invested in equities decreases. Downturns and volatility in equity markets can have a material adverse effect on the revenues and returns from our unit-linked, participating and fund management business. Because our unit-linked and fund management business depends on fees related primarily to the value of assets under management, a decline in the equity markets could reduce our revenues by reducing the value of the investment assets we manage. Likewise, because investment risk in our participating business is shared with policyholders a decline in the equity markets could reduce our revenues by reducing the funds investment return. Profits could also be reduced as a result of current investors withdrawing funds or reducing their rates of ongoing investment with our fund management companies or as a result of our fund management companies failing to attract funds from new investors. We provide certain guarantees within some of our products that protect policyholders against significant downturns in the equity markets. For example, we offer certain long-term insurance products with guaranteed features. In volatile or declining equity market conditions, we may need to increase liabilities for future policy benefits and policyholder account balances, negatively affecting net income. Additional provisions for guarantees were decreased by £90 million in 2010 in relation to minimum death benefits for unit-linked contracts in France and guaranteed minimum returns at maturity for unit-linked and segregated fund business in the Netherlands. For a discussion of guarantees we have given for our insurance and investment products, please see ‘Financial statements IFRS – Note 41 – Financial guarantees and options’. In our US business in particular, market downturns and volatility may discourage purchases of accumulation products, such as equity-indexed annuities and equity-indexed life insurance that have returns linked to the performance of the equity markets and may cause some of our existing customers to withdraw cash values or reduce investments in those products. A sustained
weakness in the markets will decrease revenues and earnings in these types of products. Interest rate volatility may adversely affect our profitability. Some of our products, principally traditional whole life insurance, term life insurance, universal life insurance and annuities, including fixed and equity indexed annuities, expose us to the risk that changes in interest rates will reduce our ‘spread’, or the difference between the amounts that we are required to pay under the contracts and the rate of return we are able to earn on investments intended to support obligations under the contracts. Our spread is a key component of our net income. As interest rates decrease or remain at low levels, we may be forced to reinvest proceeds from investments that have matured or have been prepaid or sold at lower yields, reducing our investment margin. Moreover, borrowers may prepay or redeem the fixed-income securities, commercial mortgages and mortgage-backed securities in our investment portfolio with greater frequency in order to borrow at lower market rates, which exacerbates this risk. Lowering interest crediting rates can help offset decreases in investment margins on some products. However, our ability to lower these rates could be limited by competition or contractually guaranteed minimum rates and may not match the timing or magnitude of changes in asset yields. As a result, our spread could decrease or potentially become negative. Our expectation for future spreads is an important component in the amortisation of policy acquisition costs and significantly lower spreads may cause us to accelerate amortisation, thereby reducing net income in the affected reporting period. In addition, during periods of declining interest rates, life insurance and annuity products may be relatively more attractive to consumers, resulting in increased premium payments on products with flexible premium features, and a higher percentage of insurance policies remaining in force from year to year, during a period when our new investments carry lower returns. Accordingly, during periods of declining interest rates, our profitability may suffer as the result of a decrease in the spread between interest rates charged to policyholders and returns on our investment portfolio. Increases in market interest rates could also negatively affect our profitability. In periods of rapidly increasing interest rates, we may not be able to replace, in a timely manner, our investments intended to support contracts with higher yielding assets needed to fund the higher crediting rates necessary to keep interest sensitive products competitive. We, therefore, may have to accept a lower spread and, thus, lower profitability or face a decline in sales and greater loss of existing contracts and related assets. In addition, in periods of increasing interest rates, surrenders of life insurance policies and fixed annuity contracts may increase as policyholders choose to forego insurance protection and seek higher investment returns. Obtaining cash to satisfy these obligations may require us to liquidate fixed maturity investments at a time when market prices for those assets are depressed because of increases in interest rates. This may result in realised investment losses. Regardless of whether we realise an investment loss, these cash payments would result in a decrease in total invested assets, and may decrease our net income. Premature withdrawals may also cause us to accelerate amortisation of policy acquisition costs, which would also reduce our net income.
Fluctuations in currency exchange rates may adversely affect our operating results and financial position. We operate internationally and are thus exposed to foreign currency exchange risk arising from fluctuations in exchange rates of various currencies. As of December 2010, over half of our premium income arises in currencies other than sterling, and our

156
Aviva plc Annual Report and Accounts 2010 Shareholder information continued
net assets are denominated in a variety of currencies, of which the largest are the euro, sterling and US dollar. In managing our foreign currency exposures, we do not hedge revenues as these are substantially retained locally to support the growth of the business and meet local regulatory and market requirements. Nevertheless, the effect of exchange rate fluctuations on local operating results could lead to significant fluctuations in our consolidated financial statements upon translation of the results into sterling. Although we take certain actions to address this risk, foreign currency exchange rate fluctuation could materially adversely affect our reported results due to unhedged positions or the failure of hedges to effectively offset the impact of the foreign currency exchange rate fluctuation. Our foreign exchange policy requires that each of our subsidiaries maintain sufficient assets in their local currencies to meet local currency liabilities. However, such movements may impact the value of our consolidated shareholders’ equity, which is expressed in sterling. For a discussion of the impact of changes in foreign exchange rates on our results of operations, see ‘Financial statements IFRS – Note 57 – Risk management’.
Market fluctuations may cause the value of options and guarantees embedded in some of our life insurance products to exceed the value of the assets backing their reserves and as a consequence, negatively affect the profitability of the business. Guarantees within certain of our products that protect policyholders against significant downturns in equity markets may decrease our earnings, increase the volatility of our results if hedging or risk management strategies prove ineffective, result in higher hedging costs and expose us to increased financial risk. As a normal part of their operating activities, various Group companies have given guarantees, including interest rate guarantees, in respect of certain long-term insurance, unit-linked and fund management products. At the present time, guarantees and options are in force in the UK, continental Europe, the US and Asia. In providing these guarantees and options, our capital position is sensitive to fluctuations in financial variables including interest rates, credit spreads, real estate prices and equity prices. Interest rate guaranteed returns, such as those available on guaranteed annuity options (GAOs), are sensitive to interest rates falling below the guaranteed level. Other guarantees, such as maturity value guarantees and guarantees in relation to minimum rates of return, are sensitive to fluctuations in the investment return below the level assumed when the guarantee was made. Periods of significant and sustained downturns in equity markets, increased equity volatility or reduced interest rates could result in an increase in the valuation of the future policy benefit or policyholder account balance liabilities associated with such products, resulting in a reduction to net income. We use reinsurance in combination with derivative instruments to mitigate the liability exposure and the volatility of net income associated with these liabilities, and while we believe that these and other actions have mitigated the risks related to these benefits, we remain liable for the guaranteed benefits in the event that reinsurers or derivative counterparties are unable or unwilling to pay. We are also subject to the risk that the cost of hedging these guaranteed minimum benefits increases, resulting in a reduction to net income. In addition, we are subject to the risk that hedging and other management procedures prove ineffective or that unanticipated policyholder behaviour or mortality, combined with adverse market events, produces economic losses beyond the scope of the risk management techniques employed. These, individually or collectively, may have a material adverse effect on net income, financial condition or liquidity.
Some of our investments are relatively illiquid and are in asset classes that have been experiencing significant market valuation fluctuations. We hold certain investments that may lack liquidity, such as privately placed fixed-maturity securities, and unlisted equities, as the inputs used for their valuation are not directly observable in the market. These asset classes represented approximately 4.5% of the total assets held at fair value as of 31 December 2010. Even some of our very high-quality assets have been more illiquid as a result of the recent challenging market conditions. If we require significant amounts of cash on short notice in excess of normal cash requirements or are required to post or return collateral in connection with our investment portfolio or derivatives transactions, we may have difficulty selling these investments in a timely manner, be forced to sell them for less than we otherwise would have been able to realise, or both. The reported value of our relatively illiquid types of investments, our investments in the asset classes described in the paragraph above and, at times, our high-quality, generally liquid asset classes, do not necessarily reflect the lowest current market price for the asset. If we were forced to sell certain of our assets in the current market, there can be no assurance that we will be able to sell them for the prices at which we have recorded them and we may be forced to sell them at significantly lower prices.
Adverse capital and credit market conditions may significantly affect our ability to meet liquidity needs, access to capital and cost of capital. The capital and credit markets have been experiencing volatility and disruption. In some cases, the markets have exerted downward pressure on availability of liquidity and credit capacity for certain issuers. We need liquidity to pay our operating expenses, interest on our debt and dividends on our capital stock, and replace certain maturing liabilities. Without sufficient liquidity, we will be forced to curtail our operations, and our business will suffer. The principal sources of our liquidity are insurance premiums, annuity considerations, deposit funds, cash flow from our investment portfolio and assets, consisting mainly of cash or assets that are readily convertible into cash. Sources of liquidity in normal markets also include a variety of short- and long-term instruments, including repurchase agreements, commercial paper, medium- and long-term debt, junior subordinated debt securities, capital securities and stockholders’ equity. In the event current resources do not satisfy our needs, we may have to seek additional financing. The availability of additional financing will depend on a variety of factors such as market conditions, the general availability of credit, the volume of trading activities, the overall availability of credit to the financial services industry, our credit ratings and credit capacity, as well as the possibility that customers or lenders could develop a negative perception of our long- or short-term financial prospects if we incur large investment losses or if the level of our business activity decreased due to a market downturn. Similarly, our access to funds may be impaired if regulatory authorities or rating agencies take negative actions against us. Our internal sources of liquidity may prove to be insufficient, and in such case, we may not be able to successfully obtain additional financing on favourable terms, or at all. Disruptions, uncertainty or volatility in the capital and credit markets may also limit our access to capital required to operate our business, most significantly our insurance operations. Such market conditions may limit our ability to replace, in a timely manner, maturing liabilities; satisfy statutory capital requirements; generate fee income and market-related revenue to meet liquidity needs; and access the capital necessary to grow our business. As such, we may be forced to delay raising capital, issue shorter-term

157
Performance reviewCorporate responsibilityGovernanceShareholder informationFinancial statements IFRSFinancial statements MCEVOther information
Shareholder information
Aviva plc Annual Report and Accounts 2010 Shareholder information continued
securities than we prefer, or bear an unattractive cost of capital which could decrease our profitability and significantly reduce our financial flexibility. Our results of operations, financial condition, cash flows and statutory capital position could be materially adversely affected by disruptions in the financial markets.
The impairment of other financial institutions, service providers and business partners could adversely affect us. We have exposure to many different industries and counterparties, and routinely execute transactions with counterparties in the financial services industry, including brokers and dealers, commercial banks, investment banks, hedge funds and other investment funds, other insurance groups and other institutions. Many of these transactions expose us to credit risk in the event of default of our counterparty. In addition, with respect to secured transactions, our credit risk may be exacerbated when the collateral held by us cannot be realised upon or is liquidated at prices not sufficient to recover the full amount of the loan or derivative exposure due to it. We also have exposure to these financial institutions in the form of unsecured debt instruments, derivative transactions and equity investments. There can be no assurance that any such losses or impairments to the carrying value of these assets would not materially and adversely affect our business and results of operations. In addition, we use derivative instruments to hedge various risks, including certain guaranteed minimum benefits contained in many of our equity indexed annuity and life products. We enter into a variety of derivative instruments, including options, forwards, interest rate and currency swaps with a number of counterparties. Our obligations under our equity indexed annuity and life products are not changed by our hedging activities and we are liable for our obligations even if our derivative counterparties do not pay us. This is a more pronounced risk to us in view of the recent stresses suffered by financial institutions. Defaults by such counterparties could have a material adverse effect on our financial condition and results of operations. We are also susceptible to risks associated with the potential financial instability of the service providers and business partners (such as our bancassurance partners in certain international locations) on which we rely or partially rely to provide services and grow our business.
We operate in several markets through arrangements with third parties. These arrangements involve certain risks that we do not face with our subsidiaries. Our ability to exercise management control over our partnership operations, our joint ventures and our investment in them depends on the terms of the legal agreements. In particular it depends on the allocation of control among, and continued co-operation between, the participants. We may also face financial or other exposure in the event that any of our partners fail to meet their obligations under the agreement or encounter financial difficulty. For example, a significant proportion of our product distribution, such as bancassurance, is carried out through arrangements with third parties not controlled by us and is dependent upon continuation of these relationships. A temporary or permanent disruption to these distribution arrangements could affect our financial condition. Some of these arrangements require our third-party partners to participate in and provide capital to our joint venture, associate and subsidiary undertakings. Our partners may change their strategic priorities or encounter financial difficulties preventing them from providing the necessary capital to promote future growth. In addition, we outsource certain customer service, technology and legacy policy administration functions to third
parties and may do so increasingly in the future. If we do not effectively develop and implement our outsourcing strategy, third-party providers do not perform as anticipated or we experience technological or other problems with a transition, we may not realise productivity improvements or cost efficiencies and may experience operational difficulties, increased costs and a loss of business. In addition, our ability to receive services from third-party providers outside of the UK (or the jurisdictions in which our subsidiaries operate) might be impacted by cultural differences, political instability, unanticipated regulatory requirements or policies inside or outside of the UK. As a result, our ability to conduct our business might be adversely affected.
Inability of our reinsurers to meet their obligations, or the unavailability of adequate reinsurance coverage, may have an adverse impact on our profitability and shareholders’ equity. We transfer our exposure to certain risks to others through reinsurance arrangements. Under such arrangements, other insurers assume a portion of the losses and expenses associated with reported and unreported losses in exchange for a premium. The availability, amount and cost of reinsurance depend on general market conditions and may vary significantly. Any decrease in the amount of our reinsurance will increase our risk of loss. When we obtain reinsurance, we still remain primarily liable for the reinsured risks without regard to whether the reinsurer will meet its reinsurance obligations to us. Therefore, the inability or unwillingness of our reinsurers to meet their financial obligations or disputes on, and defects in reinsurance contract wording or processes, could materially affect our operations. Although we conduct periodic reviews of the financial statements and reputations of our reinsurers, our reinsurers may become financially unsound by the time they are called upon to pay amounts due, which may not occur for many years. As a result of financial market conditions and other macro-economic challenges recently affecting the global economy, our reinsurers may experience increased regulatory scrutiny, serious cash flow problems and other financial difficulties. In addition, reinsurance may prove inadequate to protect against losses. Due to the nature of the reinsurance market and the restricted range of reinsurers that have acceptable ratings, we are exposed to concentrations of risk with individual reinsurers. If a catastrophic event or the inability to meet financial obligations caused these reinsurers to default, our business profitability and shareholders’ equity could be significantly affected. Furthermore, market conditions beyond our control determine the availability and cost of the reinsurance protection we purchase. Accordingly, we may be forced to incur additional expenses for reinsurance or may not be able to obtain sufficient reinsurance on acceptable terms, which could adversely affect our ability to write future business. For the 2010 underwriting year the Group participated in a share of a reinsurer’s US property catastrophe reinsurance portfolio. Because this exposure does not correlate with the Group’s other general insurance exposure this provided a strategic opportunity to diversify the general insurance portfolio with a risk that had a high expected profit margin but also a high potential for loss. The modelled loss from a one in ten year annual loss scenario was £55 million compared to approximately £160 million when measured on a one in a hundred year annual loss scenario. As a result of better than normal experience the arrangement delivered above average underwriting returns in 2010. Notwithstanding the good return in 2010 we have renewed the arrangement in 2011 on a reduced scale reflecting expected market conditions. The total expected loss from a one in ten year

158
Aviva plc Annual Report and Accounts 2010 Shareholder information continued
annual loss scenario is £40 million compared to approximately £100 million when measured on a one in a hundred year annual loss scenario.
We are rated by several rating agencies, and a decline in any of these ratings could affect our standing among brokers and customers and cause our sales and earnings to decrease. Claims-paying ability and financial strength ratings are factors in establishing the competitive position of insurers. A rating downgrade (or the perceived potential for such a downgrade) of Aviva plc or any of our rated insurance subsidiaries may, among other things, materially increase the number of policy surrenders and withdrawals by policyholders of cash values from their policies. The outcome of such activities may be cash payments requiring the sale of invested assets, including illiquid assets, at a price that may result in realised investment losses. These cash payments to policyholders would result in a decrease in total invested assets and a decrease in net income. Among other things, early withdrawals may also cause us to accelerate amortisation of policy acquisition costs, reducing net income. A rating downgrade may also impact sales volumes, particularly in the US where there is more focus on ratings when evaluating similar products. The ratings provided by AM Best are widely considered to be most important for distribution in the US, and a downgrade could lead to a significant loss of sales.
Financial strength ratings The insurance financial strength ratings of Aviva’s core operating subsidiaries are AA- (‘Very Strong’) with a stable outlook (Standard & Poor’s), Aa3 (‘Excellent’) with a stable outlook (Moody’s), and A (‘Excellent’) with a positive outlook (AM Best). These ratings represent the second highest of nine ratings categories for the Standard & Poor’s rating and the lowest within the category based on modifiers (i.e. AA+, AA and AA- are ‘Very Strong’); the second highest of nine ratings categories for the Moody’s rating and the lowest within the category based on modifiers (i.e. Aa1, Aa2 and Aa3 are ‘Excellent’); the second highest of nine rating categories for the AM Best rating and the highest within the category based on modifiers (i.e. A and A- are ‘Excellent’). The foregoing ratings reflect each rating agency’s opinion of the financial strength, operating performance and the ability to meet obligations for Aviva plc and Aviva’s core operating subsidiaries. These ratings are not evaluations relating to our common stock or the protection of our shareholders. Rating organisations assign ratings based upon several factors. While most of the factors relate to the rated company, some of the factors relate to general economic conditions and circumstances outside the rated company’s control. In view of the difficulties experienced recently by many financial institutions, including our competitors in the insurance industry, we believe it is possible that the rating agencies, including Standard & Poor’s, Moody’s and AM Best, will heighten the level of scrutiny that they apply to such institutions, will increase the frequency and scope of their credit reviews, will request additional information from the companies that they rate and may adjust upward the capital and other requirements employed in their models for maintenance of certain ratings levels. We cannot predict what actions rating agencies may take, or what actions we or others may take in response to the actions of rating agencies, which could adversely affect our business. As with other companies in the insurance industry, our ratings could be downgraded at any time and without any notice by any rating agency. A downgrade may adversely affect relationships with broker-dealers, banks, agents, wholesalers and other distributors of our products and services, which may negatively impact new sales and adversely affect our ability to compete and thereby have a material adverse effect on
our business, results of operations and financial condition. In addition, the interest rates we pay on our borrowings are affected by our debt credit ratings.
Our businesses are conducted in highly competitive environments and our continued profitability depends on management’s ability to respond to these pressures. There are many factors which affect our ability to sell our products, including price and yields offered, financial strength and ratings, range of product lines and product quality, brand strength and name recognition, investment management performance and historical bonus levels. In some of our markets, the Group faces competitors that are larger, have greater financial resources or a greater market share, offer a broader range of products or have higher bonus rates or claims-paying ratios. Further, heightened competition for talented and skilled employees with local experience, particularly in the emerging, high-growth markets, may limit our potential to grow our business as quickly as planned. Our principal competitors in the life market include many of the major financial services businesses including, in particular, Axa, Allianz, Generali, Prudential and Standard Life. Our principal competitors in the general insurance market include Royal Bank of Scotland Insurance, RSA, Zurich, Axa and Allianz. We also face competitors who specialise in many of the niche markets in which we operate, for example bulk annuities in the UK. We believe that competition will intensify across all regions in response to consumer demand, technological advances, the impact of consolidation, regulatory actions and other factors. Our ability to generate an appropriate return depends significantly upon our capacity to anticipate and respond appropriately to these competitive pressures.
We are dependent on the strength of our brands, the brands of our partners and our reputation with customers and agents in the sale of our products and services. Our success and results are, to a certain extent, dependent on the strength of our brands and reputation. As part of our ongoing ‘One Aviva, Twice the Value’ strategy, we have been working to create a global Aviva brand, as well as rebrand businesses in the UK, Ireland and Poland under the Aviva name. While we as a Group are well recognised, we are vulnerable to adverse market and customer perception. We operate in an industry where integrity, customer trust and confidence are paramount. We are exposed to the risk that litigation, employee misconduct, operational failures, the outcome of regulatory investigations, press speculation and negative publicity, disclosure of confidential client information, inadequate services, amongst others, whether or not founded, could impact our brands or reputation. Any of our brands or our reputation could also be affected if products or services recommended by us (or any of our intermediaries) do not perform as expected (whether or not the expectations are founded) or in line with the customers’ expectations for the product range.
The use of inaccurate assumptions in pricing and reserving for insurance business may have an adverse effect on our business profitability. The management of the life insurance business within the Group requires the life insurance companies to make a number of assumptions in relation to the business written, including with regard to the mortality and morbidity rates of our customers, the development of interest rates, persistency rates (the rates at which customers terminate existing policies prior to their maturity dates) and future levels of expenses. These assumptions may turn out to be incorrect.

159
Performance reviewCorporate responsibilityGovernanceShareholder informationFinancial statements IFRSFinancial statements MCEVOther information
Shareholder information
Aviva plc Annual Report and Accounts 2010 Shareholder information continued
When establishing their liabilities, our life insurance companies allow for changes in the assumptions made, monitor their experience against the actuarial assumptions used and assess the information gathered to refine their long-term assumptions, together with taking actual claims experience into account. However, it is not possible to determine precisely the amounts in total that will ultimately be necessary to pay liabilities under the policies written by the business. Amounts may vary from estimates, particularly in light of the long-term nature of the life insurance business. Changes in assumptions may also lead to changes in the level of capital required to be maintained. If the assumptions underlying our reserving methodology were to prove incorrect, we may need to increase the amount of our reserves, which could have a material adverse impact on the Group’s value, the results of our operation and/or financial condition and our ability to manage our businesses in an efficient manner. Examples of our reserving assumptions, which could prove to be incorrect, would include: actual claims experience being less favourable than the underlying assumptions; a higher than anticipated rate of future claims; or actual levels of future persistency being significantly lower than previously assumed. Additionally, our management of the general insurance business requires the general insurance companies to make a number of assumptions in relation to the business written. These assumptions include the costs of writing the business and settling claims, and the frequency and severity of claims. The assumptions may turn out to be incorrect. In relation to certain key risks such as weather catastrophes (e.g. a UK flood or Northern European windstorm), if actual claims experience is less favourable than the underlying assumptions, this would have an adverse impact on our profit. Additionally, man-made disasters including accidents and intentional events are difficult to predict with a high degree of accuracy. These would also have an adverse impact on our profit due to higher than expected claims. Furthermore, outstanding claims provisions for the general insurance business are based on the best-estimate ultimate cost of all claims incurred but not settled at a given date, both reported and incurred but not reported (IBNR), together with the direct costs incurred in settling each claim (e.g. legal fees). Any provisions for re-opened claims are also included. A range of methods, including stochastic projections, may be used to determine these provisions. Underlying these methods are a number of explicit or implicit assumptions relating to the expected settlement amount and settlement pattern of claims. If the assumptions underlying the reserving basis were to prove incorrect or actual claims experience were to be less favourable than the underlying assumptions, we might have to increase the amount of the general insurance provisions. If claims exceed insurance reserves financial results could be significantly affected.
We have a significant exposure to annuity business and a significant life insurance risk is associated with longevity. Longevity statistics are monitored in detail, compared with emerging industry trends, and the results are used to inform both the reserving and pricing of annuities. Inevitably there remains uncertainty about the development of future longevity that cannot be mitigated. Our principal longevity risks emanate from markets with a long history of collecting population longevity data, and we study those statistics in detail. We also believe the size of our business means that we have statistically relevant data to make an assessment of the longevity characteristics of our own portfolio. In addition to evaluating current experience the key factor is our assessment of the future rate of improvement in
longevity. For this, we analyse trends and study the wide range of papers written on this subject, in reaching our conclusions. A strengthening in the longevity assumption used to calculate our long-term business liabilities would result in an increase in these reserves and reduce significantly our shareholders’ equity. As disclosed in ‘Financial statements IFRS – Note 57 – Risk management’, the impact on profit before tax of a 5% change in annuitant mortality at 31 December 2010 for long-term business would be £355 million loss.
We may face losses if there are significant deviations from our assumptions regarding the persistency of our insurance policies and annuity contracts. A significant proportion of our profitability arises from our in-force portfolio of business. The prices and expected future profitability of our insurance and deferred annuity products are based in part upon expected patterns of premiums, expenses and benefits, using a number of assumptions, including those related to persistency, which is the probability that a policy or contract will remain in force from one period to the next. The effect of persistency on profitability varies for different products. For most of our life insurance and deferred annuity products, actual persistency that is lower than our persistency assumptions could have an adverse impact on profitability. Customers are often able to surrender their contracts early, which will generally reduce the future flow of profits. In addition some contracts have a variety of options which the customer is able to choose to exercise. In setting reserves, assumptions have been made about the proportion of customers exercising options. If more customers choose to exercise options at times when they are most valuable, then our net income will be adversely affected. Significant deviations in experience from pricing expectations regarding persistency could have an adverse effect on the profitability of our products.
The cyclical nature of the insurance industry may cause fluctuations in our results. Historically, the insurance industry has been cyclical and operating results of insurers have fluctuated significantly because of volatile and sometimes unpredictable developments, many of which are beyond the direct control of any insurer. Although we have a geographically diverse group of businesses providing a diverse range of products, we expect to experience the effects of this cyclical nature, including changes in sales and premium levels, which could have a material adverse effect on our results of operations. The unpredictability and competitive nature of the general insurance business historically has contributed to significant quarter-to-quarter and year-to-year fluctuations in underwriting results and net earnings in the general insurance industry.
As a global business, we are exposed to various local political, regulatory and economic conditions, business risks and challenges which may affect the demand for our products and services, the value of our investment portfolios and the credit quality of local counterparties. We offer our products and services in Europe (including the UK), North America and the Asia Pacific region, through wholly owned and majority-owned subsidiaries, joint ventures, companies in which we hold non-controlling equity stakes, agents and independent contractors. Our international operations expose us to different local political, regulatory, business and financial risks and challenges which may affect the demand for our products and services, the value of our investment portfolio, the required levels of capital and surplus, and the credit quality of local counterparties. These risks include, for example, political, social or economic instability in countries in which we operate,

160
Aviva plc Annual Report and Accounts 2010 Shareholder information continued
discriminatory regulation, credit risks of our local borrowers and counterparties, lack of local business experience in certain markets, risks associated with exposure to insurance industry insolvencies through policyholder guarantee funds or similar mechanisms set up in foreign markets and, in certain cases, risks associated with the potential incompatibility with foreign partners, especially in countries in which we are conducting business through entities we do not control. Some of our international insurance operations are, and are likely to continue to be, in emerging markets where these risks are heightened. Our overall success as a global business depends, in part, upon our ability to succeed in different economic, social and political conditions. Finally, our results of operations and financial condition may be materially affected from time to time by the general economic conditions such as the levels of employment, consumer lending, prevailing interest rates, or inflation, in the countries in which we operate.
If our business does not perform well or if actual experience versus estimates used in valuing and amortising Deferred Acquisition Costs (DAC) and Acquired value of in-force business (AVIF) vary significantly, we may be required to accelerate the amortisation and/or impair the DAC and AVIF which could adversely affect our results of operations or financial condition. We incur significant costs in connection with acquiring new and renewal business. Those costs that vary with and are, in particular, related to the production of new and renewal business in respect of certain UK non-profit insurance business and certain US insurance business are deferred and referred to as DAC. The recovery of DAC is dependent upon the future profitability of the related business. The amount of future profit or margin is dependent principally on investment returns in excess of the amounts credited to policyholders, mortality, morbidity, persistency, interest crediting rates and expenses to administer the business. Of these factors, we anticipate that investment margins are most likely to impact the rate of amortisation of such costs. The aforementioned factors enter into management’s estimates of gross profits or margins, which generally are used to amortise such costs. If the estimates of gross profits or margins were overstated, then the amortisation of such costs would be accelerated in the period the actual experience is known and would result in a charge to income. Significant or sustained equity market declines could result in an acceleration of amortisation of the DAC related to UK unit-linked business, resulting in a charge to income. Such adjustments could have a material adverse effect on our results of operations or financial condition. AVIF, arising primarily in our US business, reflects the estimated fair value of certain in-force contracts in a life insurance company acquired either directly or through the purchase of a subsidiary and represents the portion of the purchase price that is allocated to the value of the right to receive future cash flows from the insurance and investment contracts in-force at the acquisition date. AVIF is based on actuarially determined projections. Actual experience may vary from the projections. Revisions to estimates result in changes to the amounts expensed in the reporting period in which the revisions are made and could result in an impairment and a charge to income. Also, as AVIF is amortised similarly to DAC, an acceleration of the amortisation of AVIF would occur if the estimates of gross profits or margins were overstated. Accordingly, the amortisation of such costs would be accelerated in the period in which the actual experience is known and would result in a charge to net income. Such adjustments could have a material adverse effect on our results of operations or financial condition.
If our business does not perform well, we may be required to recognise an impairment of our goodwill, intangibles with indefinite useful lives or intangibles with finite lives, which could adversely affect our results of operations or financial condition. Goodwill represents the excess of the amounts we paid to acquire subsidiaries and other businesses over the fair value of their net assets at the date of acquisition. We test goodwill and intangible assets with indefinite useful lives at least annually for impairment or when circumstances or events indicate there may be uncertainty over this value. We test intangibles with finite lives when circumstances or events indicate there may be uncertainty over this value. For impairment testing, goodwill and intangibles have been allocated to cash-generating units by geographical reporting unit and business segment. The fair value of the reporting unit is impacted by the performance of the business. Goodwill and indefinite life intangibles are written down for impairment where the recoverable amount is insufficient to support its carrying value. Such write downs could have a material adverse effect on our results of operations or financial position.
Our valuation of Available For Sale (AFS) Securities and Fair Value (FV) Securities may include methodologies, estimations and assumptions which, by their nature, require judgement. The use of reasonable alternative methodologies, estimations and assumptions could result in changes to investment valuations that may materially adversely affect our results of operations or financial condition. We value our AFS and FV securities using designated methodologies, estimation and assumptions. These securities, which are reported at fair value on the consolidated statement of financial position, represent the majority of our total cash and invested assets. We have categorised the measurement basis for assets carried at fair value into a ‘fair value hierarchy’ in accordance with the valuation inputs and consistent with IFRS7 Financial Instruments: Disclosures. The fair value hierarchy gives the highest priority to quoted prices in active markets for identical assets or liabilities (Level 1); the middle priority to fair values other than quoted prices based on observable market information (Level 2); and the lowest priority to unobservable inputs that reflect the assumptions that we consider market participants would normally use (Level 3). The majority of our financial assets are valued based on quoted market information or observable market data. At 31 December 2010, 4.3% of total financial investments, loans and investment properties at fair value were classified as Level 3, amounting to £12,349 million. Where estimates were used for inputs to Level 3 fair values, these were based on a combination of independent third-party evidence and internally developed models, calibrated to market observable data where possible. An asset or liability’s classification within the fair value hierarchy is based on the lowest level of significant input to its valuation. See ‘IFRS critical accounting policies – Investments’. During periods of market disruption including periods of significantly rising or high interest rates, rapidly widening credit spreads or illiquidity, it may be difficult to value certain of our securities, such as mortgage-backed securities, if trading becomes less frequent and/or market data becomes less observable. There may be certain asset classes that were in active markets with significant observable data that become illiquid due to the current financial environment. In such cases, more securities may fall to Level 3 and thus require more subjectivity and management judgement. As such, valuations may include inputs and assumptions that are less observable or require greater estimation as well as valuation methods which are more sophisticated or require greater estimation thereby resulting in values which may

161
Performance reviewCorporate responsibilityGovernanceShareholder informationFinancial statements IFRSFinancial statements MCEVOther information
Shareholder information
Aviva plc Annual Report and Accounts 2010 Shareholder information continued
be less than the value at which the investments may be ultimately sold. Further, rapidly changing and unprecedented credit and equity market conditions could materially impact the valuation of securities as reported within our consolidated financial statements and the period-to-period changes in value could vary significantly. Decreases in value may have a material adverse effect on our results of operations or financial condition.
The determination of the amount of allowances and impairments taken on our investments is highly subjective and could materially impact our results of operations or financial position. The determination of the amount of allowances and impairments vary by investment type and is based upon our periodic evaluation and assessment of known and inherent risks associated with the respective asset class. Such evaluations and assessments are revised as conditions change and new information becomes available. Furthermore, additional impairments may need to be taken or allowances provided for in the future. Management updates its evaluations regularly and reflects changes in allowances and impairments in operations as such evaluations are revised. If the carrying value of an investment is greater than the recoverable amount, the carrying value is reduced through a charge to the income statement in the period of impairment. There can be no assurance that our management has accurately assessed the level of impairments taken and allowances reflected in our financial statements.
In the event that the assumptions and calculations underlying the endowments business were materially wrong, a significant change in the provisions required could have a material adverse effect on our business, results of operations and/or financial condition. In December 1999, the FSA announced the findings of its review of mortgage endowments and expressed concern as to whether, given decreases in expected future investment returns, such policies could be expected to cover the full repayment of mortgages. In August 2004, we confirmed our intention to introduce time barring on mortgage endowment complaints, under FSA rules. We now include details of our endowment policyholders’ time bar position within the annual re-projection mailings. Customers will be given at least 12 months’ individual notice before a time bar becomes applicable – double the six months’ notice required by the FSA. Until such time as all claims under such policies are either time-barred or determined, the provisions held by companies in the Group are based on a combination of experience and modelling and are, therefore, only estimates of the expected final outcome. Our aggregate exposure to potential endowment mis-selling claims is linked to the performance of the underlying investments. While our principal exposure to mis-selling claims is in the UK, we sell endowment products in other countries in which we operate, and are therefore also exposed to potential mis-selling claims in these countries.
We are involved in various legal proceedings and regulatory investigations and examinations and may be involved in more in the future, any one or a combination of which could have a material adverse effect on our financial condition and results of operations. We have been named as defendants in lawsuits (both class actions and individual lawsuits). We have been subject to regulatory investigations or examinations in the various jurisdictions where we do business. These actions arise in various contexts including in connection with our activities as an insurer,
securities issuer, employer, investment adviser, investor and taxpayer. Certain of these lawsuits and investigations seek significant or unspecified amounts of damages (including punitive damages), and certain of the regulatory authorities involved in these proceedings have substantial powers over the conduct and operations of our business. Due to the nature of certain of these lawsuits and investigations, we cannot make an estimate of loss or predict with any certainty the potential impact of these suits or investigations on our business, financial condition or results of operations. In the course of conducting insurance business, various companies within the Group receive general insurance liability claims, and become involved in actual or threatened related litigation arising therefrom, including claims in respect of pollution and other environmental hazards. Amongst these are claims in respect of asbestos production and handling in various jurisdictions, including the UK, Ireland, the Netherlands and Canada. Given the significant delays that are experienced in the notification of these claims, the potential number of incidents which they cover and the uncertainties associated with establishing liability and the availability of reinsurance, the ultimate cost cannot be determined with certainty. Additionally, it is possible that a regulator in one of our major markets may conduct a review of products previously sold, either as part of an industry-wide review or specific to Aviva. The result of this review may be to compensate customers for losses they have incurred as a result of the products they were sold.
All of our businesses are subject to operational risks, including the risk of direct or indirect loss resulting from inadequate or failed internal and external processes, systems and human error or from external events. Our business is dependent on processing a large number of complex transactions across numerous and diverse products. Furthermore, the long-term nature of the majority of our business means that accurate records have to be maintained for significant periods. We also outsource several operations, including certain servicing and IT functions and are therefore at least partially reliant upon the operational processing performance of our outsourcing partners. Our systems and processes on which we are dependent to serve our customers are designed to ensure that the operational risks associated with our activities are appropriately identified and addressed; however, they may nonetheless fail due to IT malfunctions, human error, business interruptions, non-performance by third parties or other external events. This could disrupt business operations resulting in material reputational damage and the loss of customers, and have a consequent material adverse effect on our results. Although we have taken appropriate steps to upgrade systems and processes to reduce these operational risks, we cannot anticipate the specifics or timing of all possible operational and systems failures which may adversely impact our business. Additional detail of the types of operational risks associated with financial reporting is provided below in ‘Compliance with the Sarbanes-Oxley Act entails significant expenditure and managerial attention, and non-compliance with the Sarbanes-Oxley Act may adversely affect us.’
Our risk management policies and procedures may leave us exposed to unidentified or unanticipated risk, which could negatively affect our business. Management of risk requires, among other things, policies and procedures to record properly and verify a large number of transactions and events. We have devoted significant resources to develop our risk management policies and procedures and expect

162
Aviva plc Annual Report and Accounts 2010 Shareholder information continued
to continue to do so in the future. Nonetheless, our policies and procedures may not be comprehensive. Many of our methods for managing risk and exposures are based upon the use of observed historical market behaviour or statistics based on historical models. As a result, these methods may not fully predict future exposures, which can be significantly greater than our historical measures indicate, particularly in unusual markets and environments. Other risk management methods depend upon the evaluation of information regarding markets, clients, catastrophe occurrence or other matters that is publicly available or otherwise accessible to us. This information may not always be accurate, complete, up to date or properly evaluated.
The failure to attract or retain the necessary personnel could have a material adverse effect on our results and/or financial condition. As a global financial services organisation with a decentralised management structure, we rely, to a considerable extent, on the quality of local management in the regions and countries in which we operate. The success of our operations is dependent, among other things, on our ability to attract and retain highly qualified professional people. Competition for such key people in most countries in which we operate is intense. Our ability to attract and retain key people, and in particular directors, experienced investment managers, fund managers and underwriters, is dependent on a number of factors, including prevailing market conditions and compensation packages offered by companies competing for the same talent.
Catastrophic events, which are often unpredictable by nature, could result in material losses and abruptly and significantly interrupt our business activities. Our business is exposed to volatile natural and man-made disasters such as pandemics, hurricanes, windstorms, earthquakes, terrorism, riots, fires and explosions. Over the past several years, changing weather patterns and climatic conditions have added to the unpredictability and frequency of natural disasters in certain parts of the world and created additional uncertainty as to future trends and exposure. Our life insurance operations, in particular, are exposed to the risk of catastrophic mortality, such as a pandemic or other event that causes a large number of deaths. Significant influenza pandemics have occurred three times in the last century, but neither the likelihood and timing, nor the severity of a future pandemic can be predicted. The effectiveness of external parties, including governmental and non-governmental organisations, in combating the spread and severity of such a pandemic could have a material impact on the losses experienced by us. These events could cause a material adverse effect on our results of operations in any period and, depending on their severity, could also materially and adversely affect our financial condition. The extent of losses from a catastrophe is a function of both the total amount of insured exposure in the area affected by the event and the severity of the event. Most catastrophes are restricted to small geographic areas; however, pandemics, hurricanes, earthquakes and man-made catastrophes may produce significant damage in larger areas, especially those that are heavily populated. Claims resulting from natural or man-made catastrophic events could cause substantial volatility in our financial results for any fiscal quarter or year and could materially reduce our profitability or harm our financial condition. Also, catastrophic events could harm the financial condition of our reinsurers and thereby increase the probability of default on reinsurance recoveries. Our ability to write new business could also be affected. Furthermore, pandemics, natural disasters, terrorism and fires could disrupt our operations and result in
significant loss of property, key personnel and information about our clients and us. If our business continuity plans have not included effective contingencies for such events they could adversely affect our business, results of operations, corporate reputation and financial condition for a substantial period of time.
Our regulated business is subject to extensive regulatory supervision both in the UK and internationally. Our insurance subsidiaries worldwide are subject to detailed and comprehensive government regulation in each of the jurisdictions in which they conduct business. Regulatory agencies have broad administrative power over many aspects of the insurance business, which may include premium rates, marketing and selling practices, advertising, licensing agents, policy forms, capital adequacy and permitted investments. Government regulators are concerned primarily with the protection of policyholders rather than our shareholders or creditors. Insurance laws, regulations and policies currently affecting us and our subsidiaries may change at any time in ways having an adverse effect on our business. Furthermore, we cannot predict the timing or form of future regulatory initiatives. In the UK, our business is subject to regulation by the FSA, which has broad powers under the Financial Services and Markets Act (FSMA), including the authority to grant, vary the terms of, or cancel a regulated firm’s authorisation, to investigate marketing and sales practices and to require the maintenance of adequate financial resources. The FSA has the power to take a range of investigative, disciplinary or enforcement actions, including public censure, restitution, fines or sanctions and to award compensation. The FSA may make enquiries of the companies which it regulates regarding compliance with regulations governing the operation of business and like all UK regulated financial service companies, we face the risk that the FSA could find that we have failed to comply with applicable regulations or have not undertaken corrective action as required. Issues and disputes may arise from time to time from the way in which the insurance industry or fund management industry has sold or administered an insurance policy or other product or in the way in which they have treated policyholders or customers, either individually or collectively. In the UK, any such issues or disputes are typically resolved by the Financial Ombudsman Service (FOS) in the UK, or by litigation for individual policyholders. The FSA may intervene directly, however, where larger groups or matters of public policy are concerned. There have been several industry-wide issues in recent years in which the FSA has intervened directly, including the sale of personal pensions, the sale of mortgage-related endowments and investments in split capital investment trusts. We have successfully completed the reattribution of the ‘inherited estate’ in the UK. The inherited estate refers to the assets of the long-term with-profit funds less the realistic reserves for non-profit policies, less asset shares aggregated across the with-profit policies and any additional amounts expected at the valuation date to be paid to in-force policyholders in the future in respect of smoothing costs and guarantees. Following the reattribution, shareholders are exposed to more risk and potential reward. This additional exposure is subject to the same risk management processes that we generally apply. Outside of the UK, our business is regulated by local regulators that often have similar powers to the FSA and could therefore have a similar negative impact on perceptions of us or have a material adverse effect on our business, our results and/or financial condition and divert management’s attention from the day-to-day management of the business. Furthermore, various jurisdictions in which we operate, including the UK, have created investor compensation schemes

163
Performance reviewCorporate responsibilityGovernanceShareholder informationFinancial statements IFRSFinancial statements MCEVOther information
Shareholder information
Aviva plc Annual Report and Accounts 2010 Shareholder information continued
that require mandatory contributions from market participants in some instances in the event of a failure of another market participant. As a major participant in the majority of our chosen markets, circumstances could arise where we, along with other companies, may be required to make such contributions. Additionally there is a risk to us and other insurers that we may be obliged to meet compensation costs arising from bank failures. The financial crisis has exposed a number of weaknesses in the current regulatory framework. Whilst these weaknesses are predominantly in the banking sector, the insurance and investment management industries potentially face a number of regulatory initiatives aimed at addressing lessons learnt from the crisis. We could be impacted by global initiatives (led by the G20), European initiatives and national initiatives in the markets within which we operate. The Solvency II Directive (‘Solvency II’), an insurance industry regulation agreed by the European Parliament in 2009, will require European domiciled insurers to move to more risk-based capital requirements. However, the more detailed implementing measures still need to be agreed and there is a risk that this could lead to a significant increase in the capital required to support our annuity and other business. There is evidence of heightened supervisory action throughout the world to assess and protect the financial position of regulated insurance companies. For example, the FSA has asked all life insurers in the UK to apply further stress tests to their solvency positions from 2008 to ensure they hold sufficient capital. Other European Regulators in certain countries in which we operate have adopted new rules – or indicated that they may adopt new rules in the future – relating to distributable reserves and retention of profits, which could affect the dividends our subsidiaries may pay to us. A determination that we have failed to comply with applicable regulation could have a negative impact on our reported results or on our relations with current and potential customers. Regulatory action against a member of the Group could result in adverse publicity for, or negative perceptions regarding, the Group, or could have a material adverse effect on our business, our results of operations and/or financial condition and divert management’s attention from the day-to-day management of the business.
Inconsistent application of directives by regulators in different European Union (EU) member states may place our business at a competitive disadvantage to other European financial services groups. Insurance regulation in the UK is largely based on the requirements of EU directives. Inconsistent application of directives by regulators in different EU member states may place our business at a competitive disadvantage to other European financial services groups. In addition, changes in the local regulatory regimes of designated territories could affect the calculation of our solvency position.
Our businesses are subject to regulatory risk, including adverse changes in the laws, regulations, policies and interpretations in the markets in which we operate. We will not always be able to predict accurately the impact of future legislation or regulation or changes in the interpretation or operation of existing legislation or regulation on our business, results of operations and/or financial condition. Changes in government policy, legislation or regulatory interpretation applying to companies in the financial services and insurance industries in any of the markets in which we operate, which may be applied retrospectively, may adversely affect our product
range, distribution channels, capital requirements and, consequently, results and financing requirements. Such changes could include, for example, alterations to the regulatory framework for pension arrangements and policies or the regulation of selling practices and solvency requirements (including the implementation of the EU solvency framework for insurers, ‘Solvency II’). We may face increased compliance costs due to the need to set up additional compliance controls or the direct cost of such compliance because of changes to financial services legislation or regulation. We face significant compliance challenges because our regulatory environment is evolving rapidly and supervisory authorities around the world are assuming an increasingly active and aggressive role in interpreting and enforcing regulations in the jurisdictions in which we operate, for example in the UK, the extent of the regulator’s interpretation of the principle of ‘treating customers fairly’.
Regulatory changes or errors may affect the calculation of unit prices or deduction of charges for our unit-linked products which may require Aviva to compensate customers retrospectively. A significant proportion of our product sales are unit-linked contracts, where product benefits are linked to the prices of underlying unit funds. Whilst comprehensive controls are in place, there is a risk of error in the calculation of the prices of these funds, which may be due to human error in data entry, IT-related issues or other causes. Additionally, it is possible that policy charges which are deducted from these contracts are taken incorrectly, or the methodology is subsequently challenged by policyholders or regulators and changed retrospectively. Any of these can give rise to compensation payments to customers. Controls are in place to mitigate these risks, but errors could give rise to future liabilities. Payments due to errors or compensation may negatively impact our profits.
From time to time changes in the interpretation of existing tax laws, amendments to existing tax rates or the introduction of new tax legislation may adversely impact our business, results of operations and financial condition. We operate in numerous tax jurisdictions around the world. Tax risk is the risk associated with changes in tax law or in the interpretation of tax law. It also includes the risk of changes in tax rates and the risk of failure to comply with procedures required by tax authorities. Failure to manage tax risks could lead to an additional tax charge. It could also lead to a financial penalty for failure to comply with required tax procedures or other aspects of tax law. If, as a result of a particular tax risk materialising, the tax costs associated with particular transactions are greater than anticipated, it could affect the profitability of those transactions. There are also specific rules governing the taxation of policyholders. We will be unable accurately to predict the impact of future changes in tax law on the taxation of life insurance and pension policies in the hands of policyholders. Amendments to existing legislation (particularly if there is the withdrawal of any tax relief or an increase in tax rates) or the introduction of new rules may affect the future long-term business and the decisions of policyholders. The impact of such changes upon us might depend on the mix of business in force at the time of such change and could have a material adverse effect on our business, results of operations and/or financial condition. The design of life insurance products by our life insurance companies takes into account a number of factors, including risks, benefits, charges, expenses, investment returns (including bonuses) and taxation. The design of long-term insurance products is based on the tax legislation in force at that time. Changes in tax legislation or in the interpretation of tax legislation

164
Aviva plc Annual Report and Accounts 2010 Shareholder information continued
may therefore, when applied to such products, have a material adverse effect on the financial condition of the relevant long-term business fund of the company in which the business was written.
The governance arrangements in place with Delta Lloyd N.V. could impact on how we can direct the day-to-day management of the internal operations of this subsidiary. Delta Lloyd N.V. is one of the Group’s majority-owned subsidiaries consolidated in the Aviva plc IFRS financial statements. Delta Lloyd N.V. is subject to the provisions of Dutch corporate law and particularly the Dutch ‘full large company’ regime. Under this regime, Delta Lloyd has a two-tier Board structure consisting of an Executive Board and a Supervisory Board. The Executive Board is the executive body and is responsible for day-to-day management of Delta Lloyd and for its strategy, policy and operations. The Supervisory Board advises and supervises Delta Lloyd’s Executive Board and is the body having the right to appoint and dismiss that Board. The Supervisory Board’s approval is required for certain important decisions of the Executive Board. For governance purposes, our interests are represented through our two members of the Supervisory Board, which has a duty to a wide variety of stakeholders, including its shareholders. The members of the Supervisory Board are appointed by the General meeting based on nominations by the Supervisory Board directors, taking into account recommendations of the shareholders and the Works Council. These arrangements could impact on how we can influence the day-to-day management of Delta Lloyd’s internal operations.
Compliance with the Sarbanes-Oxley Act entails significant expenditure and managerial attention, and non-compliance with the Sarbanes-Oxley Act may adversely affect us. The US Sarbanes-Oxley Act of 2002 and related regulations subsequently implemented by the SEC and the NYSE require changes to some of our accounting and corporate governance practices, including the requirement to provide our first management report as required by Section 404 of the Sarbanes-Oxley Act on our internal control over financial reporting for the year ending 31 December 2010 and for future years. In the event that we are unable to maintain compliance with Section 404 and other provisions of the Sarbanes-Oxley Act and related rules, such non-compliance may adversely affect us. As a UK listed company, we have been operating a control framework that involves regular self-assessments of internal controls to ensure we meet existing compliance requirements applicable to us under the Combined Code on Corporate Governance and the Turnbull Guidance on Internal Control. This control framework was based on the criteria established in ‘Internal Control – Integrated Framework’ issued by the Committee of Sponsoring Organizations of the Treadway Commission (COSO). Results of these assessments are reported twice a year to our Audit Committee and our external auditors. Given our continued commitment to improve our internal control over financial reporting, and following our listing on a US stock exchange, we have continued our implementation of an enhanced control framework, referred to as the Financial Reporting Control Framework (FRCF), which meets the requirements of Section 404 of the Sarbanes-Oxley Act. We expect that compliance with these rules and regulations will continue to require significant management attention and there will be substantial costs associated with this. Our internal controls over financial reporting will also have to be updated to reflect any changes to our business such as internal restructuring, corporate development, significant IT projects or other developments in future years.
There are inherent funding risks associated with our participations in defined benefit staff pension schemes. We operate both defined benefit and defined contribution staff pension schemes. There are inherent funding risks associated with the defined benefit schemes. Events could result in a material reduction in the funding position of such schemes and, in some cases, a deficit between the pension scheme’s assets and liabilities could increase. The factors that affect the scheme’s position include: poor investment performance of pension fund investments; greater life expectancy than assumed; adverse changes in interest rates; and other events occurring which make past service benefits more expensive than predicted in the actuarial assumptions by reference to which funding requirements have been assessed. In the short term, the funding position is inherently volatile due to movements in the market value of assets. Where a funding deficit or surplus arises the position will be discussed with the scheme trustees to agree appropriate actions. This may include a funding plan being agreed to make good the deficit over a period of years but could also include a range of other actions such as changes to member contribution rates, changes in future benefit accruals or closure of schemes to new members. Any surplus or deficit in the defined benefit pension scheme will affect our shareholders’ equity.
We are reliant on IT systems and there are risks that our current and legacy systems cannot be made to adapt to growth in the business or new styles of doing business. Key IT initiatives may not deliver what is required either on time or within budget or provide the performance levels required to support the current and future needs of the business. Significant resources are devoted to maintaining and developing our IT systems to keep pace with developments within the insurance and fund management industries. Failure to do so could result in the inability to gather information for pricing, underwriting and reserving, and to attract and retain customers. We could also incur higher administrative costs both from the processing of business and potentially remediation of disputes.
Our acquisitions may divert management attention and other resources and involve risks of undisclosed liabilities and integration issues. In recent years we have completed a number of acquisitions around the world. We may make further acquisitions in the future. Growth by acquisition involves risks that could adversely affect our operating results, including the substantial amount of management time that may be diverted from operations to pursue and complete acquisitions. Our acquisitions could also result in the incurrence of additional indebtedness, costs, contingent liabilities, and impairment and amortisation expenses related to goodwill and other intangible assets, all of which could materially adversely affect our businesses, financial condition and results of operations. Future acquisitions may have a dilutive effect on the ownership and voting percentages of existing shareholders. We may also finance future acquisitions with debt issuances or by entering into credit facilities, each of which could adversely affect our businesses, financial condition and results of operations. The businesses we have recently acquired include long-term insurance and savings, general insurance and health and fund management. There could be unforeseen liabilities that arise out of the businesses we have acquired and may acquire in the future which may not be covered by, or exceed the amounts of any indemnities provided to us by the sellers.

165
Performance reviewCorporate responsibilityGovernanceShareholder informationFinancial statements IFRSFinancial statements MCEVOther information
Shareholder information
Aviva plc Annual Report and Accounts 2010 Shareholder information continued
Risks related to ownership of the ADSs and Ordinary Shares As a holding company, we are dependent on our operating subsidiaries to cover operating expenses and dividend payments. Our insurance and fund management operations are generally conducted through direct and indirect subsidiaries. As a holding company, Aviva plc’s principal sources of funding are dividends from subsidiaries, shareholder-backed funds and any amounts that may be raised through the issuance of debt and commercial paper. Certain subsidiaries have regulatory restrictions that may limit the payment of dividends, which in some circumstances could limit our ability to pay dividends to shareholders. In the current economic environment, such restrictions could become more stringent.
The trading price of our ADSs and dividends paid on our ADSs may be materially adversely affected by fluctuations in the exchange rate for converting sterling into US dollars. An ADS is a negotiable US security, representing ownership in one share. An ADR is denominated in US dollars and represents ownership of any number of ADSs. ADRs are publicly traded shares in a non-US corporation, quoted and traded in US dollars in the US securities market. Any dividends are paid to investors in US dollars. ADRs were specifically designed to facilitate the purchase, holding and sale of non-US securities by US investors. The term ADR is often used to mean both the certificates and the securities themselves. Fluctuations in the exchange rate for converting pound sterling into US dollars may affect the value of our ADSs. Specifically, as the relative value of the pound sterling against the US dollar declines, each of the following values will also decline:
the US dollar equivalent of the pound sterling trading price of our ordinary shares on the London Stock Exchange which may consequently cause the trading price of our ADSs in the US to also decline;
the US dollar equivalent of the proceeds that a holder of our ADSs would receive upon the sale in the UK of any our ordinary shares withdrawn from the depositary; and
the US dollar equivalent of cash dividends paid in pound sterling on our ordinary shares represented by our ADSs.
The holders of our ADSs may not be able to exercise their voting rights due to delays in notification to and by the depositary. The depositary for our ADSs may not receive voting materials for our ordinary shares represented by our ADSs in time to ensure that holders of our ADSs can instruct the depositary to vote their shares. In addition, the depositary’s liability to holders of our ADSs for failing to carry out voting instructions or for the manner of carrying out voting instructions is limited by the Deposit Agreement governing our ADR facility. As a result, holders of our ADSs may not be able to exercise their right to vote and may have limited recourse against the depositary or us, if their shares are not voted according to their request.
Holders of our ADSs will have limited recourse if we or the depositary fail to meet our respective obligations under the Deposit Agreement. The Deposit Agreement expressly limits our obligations and liability and those of the depositary. Neither we nor the depositary will be liable if either of us:
are prevented from or delayed in performing any obligation by circumstances beyond our/their control;
exercise or fail to exercise discretion under the Deposit Agreement; or
take any action based upon the advice of, or information from, legal counsel, accountants, any person presenting ordinary shares for deposit, any holder or owner of an Aviva Plc ADR or any other person believed by us or the depositary in good faith to be competent to give such advice or information.
In addition, the depositary has the obligation to participate in any action, suit or other proceeding with respect to our ADSs which may involve it in expense or liability only if it is indemnified. These provisions of the Deposit Agreement will limit the ability of holders of our ADSs to obtain recourse if we or the depositary fails to meet their obligations under the Deposit Agreement or if they wish to involve us or the depositary in a legal proceeding.
The holders of our ADSs in the US may not be able to participate in offerings of rights, warrants or similar securities to holders of our ordinary shares on the same terms and conditions as holders of our ordinary shares. In the event that we offer rights, warrants or similar securities to the holders of our ordinary shares or distribute dividends payable, in whole or in part, in securities, the Deposit Agreement provides that the depositary (after consultation with us) shall have discretion as to the procedure to be followed in making such rights or other securities available to ADR holders including disposing of such rights or other securities and distributing the net proceeds in US dollars to ADR holders. Given the significant number of our ADR holders in the US, we generally would be required to register with the SEC any public offering of rights, warrants or other securities made to our ADR holders unless an exemption from the registration requirements of the US securities laws is available. Registering such an offering with the SEC can be a lengthy process which may be inconsistent with the timetable for a global capital raising operation. Consequently, we have in the past elected and may in the future elect not to make such an offer in the US, including to our ADR holders in the US, and rather only conduct such an offering in an ‘offshore’ transaction in accordance with ‘Regulation S’ under the US Securities Act of 1933, as amended. Therefore, there can be no assurance that our ADR holders will be able to participate in such an offering in the same manner as our ordinary shareholders.
Our ADS and ordinary share price could be volatile and could drop unexpectedly and holders may not be able to sell their ADRs or ordinary shares at or above the price they paid. The price at which our ADSs and ordinary shares will trade may be affected by a large number of factors, some of which will be specific to us and our operations and some of which will be related to the insurance industry and equity markets generally. As a result of these factors, holders may not be able to resell their ADSs or ordinary shares at or above the price which they paid for them. In particular, the following factors, in addition to other risk factors described in this section, may have a significant impact on the market price of our ADSs or ordinary shares:
investor perception of our Company, including actual or anticipated variations in our revenues, earnings or other operating results;
announcement of intended acquisitions, disposals or financings or speculations of such acquisitions, disposals or financings;
changes in our dividend policy, which could result from changes in our cash flow and capital position;
sales of blocks of our shares by significant shareholders; hedging activities on our shares;

166
Aviva plc Annual Report and Accounts 2010 Shareholder information continued
a downgrade of our credit or financial strength ratings, including placement on credit watch, or rumours of such downgrades;
actual or potential litigation involving us or the insurance or fund management industries generally;
changes in financial estimates and recommendations by securities research analysts;
fluctuations in foreign exchange rates and interest rates; the performance of other companies in the financial
services’ sector; regulatory developments in the principal markets in which
we operate; international or local political, economic and market
conditions; and unforeseen events such as natural disaster or terrorist
attacks and other developments stemming from such events and the uncertainty related to these developments.
As a ‘foreign private issuer’ in the US we are exempt from certain rules under the US securities laws and are permitted to file less information with the SEC than US companies. As a ‘foreign private issuer’, we are exempt from certain rules under the US Securities Exchange Act of 1934, as amended (the ‘Exchange Act’), that impose certain disclosure obligations and procedural requirements for proxy solicitations under Section 14 of the Exchange Act. In addition, our officers, directors and principal shareholders are exempt from the reporting and ‘short-swing’ profit recovery provisions of Section 16 of the Exchange Act and the rules under the Exchange Act with respect to their purchases and sales of our ordinary shares and ADRs. Moreover, we are not required to file periodic reports and financial statements with the SEC as frequently or as promptly as US companies whose securities are registered under the Exchange Act. In addition, we are not required to comply with Regulation FD, which restricts the selective disclosure of material information. Although we must comply with UK listing rules on insider reporting of share ownership and on protection of inside information, there may be less publicly available information concerning us than there is for US public companies.
Judgements of US courts may not be enforceable against us. Judgements of US courts, including those predicated on the civil liability provisions of the Federal securities laws of the US, may not be enforceable in courts in the United Kingdom. As a result, our shareholders who obtain a judgement against us in the US may not be able to require us to pay the amount of the judgement.
Limitations on Enforceability of Civil Liabilities under US Federal Securities Laws. We are an English company. Any experts working on our behalf are likely to be residents of the United Kingdom and not the United States. In addition, most of our officers and directors are residents of the United Kingdom and not the United States. It may be difficult or impossible to serve legal process on persons located outside the United States and to force them to appear in a US court. It may also be difficult or impossible to enforce a judgement of a US court against persons outside the United States, or to enforce a judgement of a foreign court against such persons in the United States. We believe that there may be doubt as to the enforceability against persons in the United Kingdom, whether in original actions or in actions for the enforcement of judgements of US courts, of civil liabilities predicated solely upon the laws of the United States, including its federal securities laws. Individual shareholders of an English company (including US persons) have the right under English law to bring lawsuits on behalf of the company in which they are a shareholder, and on their own behalf against the company, in certain limited circumstances. English law does not permit class action lawsuits by shareholders, except in limited circumstances.

Performance reviewCorporate responsibilityGovernanceShareholder informationFinancial statements IFRSFinancial statements MCEVOther information
Financial statements IFRS167
Aviva plc Annual Report and Accounts 2010
Financial statements IFRS
In this section Page
Independent auditor’s report 168 Accounting policies 170 Consolidated financial statements 183 Consolidated income statement 183 Pro forma reconciliation of Group operating profit to profit before tax
184
Consolidated statement of comprehensive income
186
Consolidated statement of changes in equity 187 Consolidated statement of financial position 189 Consolidated statement of cash flows 190
Notes to the consolidated financial statements
1 Exchange rates 191 2 Presentation changes 191 3 Subsidiaries 192 4 Segmental information 195 5 Details of income 202 6 Details of expenses 203 7 Finance costs 205 8 Long-term business economic volatility 206 9 Longer-term investment return and economic assumption changes for non-long-term business
207
10 Employee information 208 11 Directors 209 12 Auditors’ remuneration 210 13 Tax 211 14 Earnings per share 212 15 Dividends and appropriations 215 16 Goodwill 215 17 Acquired value of in-force business (AVIF) and intangible assets
219
18 Interests in, and loans to, joint ventures 220 19 Interests in, and loans to, associates 223 20 Property and equipment 225 21 Investment property 226 22 Fair value methodology 227 23 Loans 231
Page
24 Securitised mortgages and related assets 232 25 Financial investments 234 26 Receivables 237 27 Deferred acquisition costs and other assets 237 28 Assets held to cover linked liabilities 239 29 Ordinary share capital 239 30 Equity compensation plans 240 31 Shares held by employee trusts 243 32 Preference share capital 243 33 Direct capital instruments 244 34 Merger reserve 244 35 Other reserves 245 36 Retained earnings 246 37 Non-controlling interests 246 38 Contract liabilities and associated reinsurance
247
39 Insurance liabilities 248 40 Liability for investment contracts 258 41 Financial guarantees and options 260 42 Reinsurance assets 263 43 Effect of changes in assumptions and estimates during the year
264
44 Unallocated divisible surplus 265 45 Special bonus and reattribution of the inherited estate
265
46 Tax assets and liabilities 266 47 Provisions 267 48 Pension obligations 268 49 Borrowings 276 50 Payables and other financial liabilities 280 51 Other liabilities 280 52 Contingent liabilities and other risk factors 281 53 Commitments 282 54 Statement of cash flows 283 55 Group capital structure 284 56 Capital statement 285 57 Risk management 288 58 Derivative financial instruments 302 59 Assets under management 304 60 Related party transactions 305 Financial statements of the Company 306

Independent auditor’s report to the shareholders of Aviva plc
168
Aviva plc Annual Report and Accounts 2010
We have audited the Group and Parent Company financial statements (the ‘financial statements’) of Aviva plc for the year ended 31 December 2010 which comprise the Accounting Policies, the Consolidated and Parent Company Income Statements, the Pro Forma Reconciliation of Group Operating Profit to Profit before Tax, the Consolidated and Parent Company Statements of Comprehensive Income, the Consolidated and Parent Company Statements of Changes in Equity, the Consolidated and Parent Company Statements of Financial Position, the Consolidated and Parent Company Cash Flow Statements, and the related notes 1 to 60 and A to H. The financial reporting framework that has been applied in their preparation is applicable law and International Financial Reporting Standards (IFRSs) as adopted by the European Union. This report is made solely to the Company’s members, as a body, in accordance with Chapter 3 of Part 16 to the Companies Act 2006. Our audit work has been undertaken so that we might state to the Company’s members those matters we are required to state to them in an auditor’s report and for no other purpose. To the fullest extent permitted by law, we do not accept or assume responsibility to anyone other than the Company and the Company’s members as a body, for our audit work, for this report, or for the opinions we have formed.
Respective responsibilities of directors and auditors As explained more fully in the Directors’ Responsibilities Statement set out on pages 107-108, the directors are responsible for the preparation of the financial statements and for being satisfied that they give a true and fair view. Our responsibility is to audit and express an opinion on the financial statements in accordance with applicable law and International Standards on Auditing (UK and Ireland). Those standards require us to comply with the Auditing Practices Board’s (APB’s) Ethical Standards for Auditors.
Scope of the audit of the financial statements An audit involves obtaining evidence about the amounts and disclosures in the financial statements sufficient to give reasonable assurance that the financial statements are free from material misstatement, whether caused by fraud or error. This includes an assessment of: whether the accounting policies are appropriate to the Group’s and the Parent company’s circumstances and have been consistently applied and adequately disclosed; the reasonableness of significant accounting estimates made by the directors; and the overall presentation of the financial statements.
Opinion on financial statements In our opinion:
the financial statements give a true and fair view of the state of the Group’s and of the Parent company’s affairs as at 31 December 2010 and of the Group’s and the Parent company’s profit for the year then ended;
the financial statements have been properly prepared in accordance with IFRSs as adopted by the European Union; and the financial statements have been prepared in accordance with the requirements of the Companies Act 2006 and, as regards
the Group financial statements, Article 4 of the IAS Regulation.
Separate Opinion in relation to IFRSs As explained in the Accounting Policies to the Group financial statements, the Group, in addition to complying with its legal obligation to apply IFRSs as adopted by the European Union, has also applied IFRSs as issued by the International Accounting Standards Board (IASB). In our opinion, the Group financial statements comply with IFRSs as issued by the IASB.
Opinion on other matters prescribed by the Companies Act 2006 In our opinion:
the part of the Directors’ Remuneration Report to be audited has been properly prepared in accordance with the Companies Act 2006;
the information given in the Directors’ Report for the financial year for which the financial statements are prepared is consistent with the financial statements; and
the information given in the Corporate Governance Statement, set out on pages 104 and 105, with respect to internal control and risk management systems in relation to financial reporting processes and about share capital structures is consistent with the financial statements.

Performance reviewCorporate responsibilityGovernanceShareholder informationFinancial statements IFRSFinancial statements MCEVOther information
Financial statements IFRS
Independent auditor’s report to the shareholders of Aviva plc continued
169
Aviva plc Annual Report and Accounts 2010
Matters on which we are required to report by exception We have nothing to report in respect of the following: Under the Companies Act 2006 we are required to report to you if, in our opinion:
adequate accounting records have not been kept by the Parent company, or returns adequate for our audit have not been received from branches not visited by us; or
the Parent company financial statements and the part of the Directors’ Remuneration Report to be audited are not in agreement with the accounting records and returns; or
certain disclosures of directors’ remuneration specified by law are not made; or we have not received all the information and explanations we require for our audit; or a Corporate Governance Statement has not been prepared by the Company.
Under the Listing Rules we are required to review:
the Directors’ statement, set out on page 108, in relation to going concern; and the part of the Corporate Governance Statement relating to the Company’s compliance with the nine provisions of the June
2008 Combined Code specified for our review; and certain elements of the report to shareholders by the Board on Directors’ remuneration.
James W Dean (Senior statutory auditor) for and on behalf of Ernst & Young LLP, Statutory Auditor London 2 March 2011 1. The maintenance and integrity of Aviva plc’s website is the responsibility of the directors; the work carried out by the auditors does not involve consideration of these matters and, accordingly, the auditors accept no responsibility for any changes
that may have occurred to the financial statements since they were initially presented on the website. 2. Legislation in the United Kingdom governing the preparation and dissemination of financial statements may differ from legislation in other jurisdictions.

Accounting policies 170
Aviva plc Annual Report and Accounts 2010
Aviva plc (the ‘Company’), a public limited company incorporated and domiciled in the United Kingdom (UK), together with its subsidiaries (collectively, the ‘Group’ or ‘Aviva’) transacts life assurance and long-term savings business, fund management and most classes of general insurance and health business through its subsidiaries, associates and branches in the UK, Ireland, continental Europe, United States (US), Canada, Asia, Australia and other countries throughout the world. The Group is managed on a regional basis, reflecting the management structure whereby a member of the Executive Management team is accountable to the group chief executive for the operating segment for which he is responsible. Further details of the reportable segments are given in note 4. The principal accounting policies adopted in the preparation of these financial statements are set out below.
(A) Basis of presentation Since 2005, all European Union listed companies have been required to prepare consolidated financial statements using International Financial Reporting Standards (IFRS) issued by the International Accounting Standards Board (IASB) and endorsed by the European Union (EU). The date of transition to IFRS was 1 January 2004. In addition to fulfilling their legal obligation to comply with IFRS as adopted by the European Union, the Group and Company have also complied with IFRS as issued by the International Accounting Standards Board and applicable at 31 December 2010. In 2008, the IASB issued revised versions of IFRS 3, Business Combinations, and IAS 27, Consolidated and Separate Financial Statements. The former introduced a number of changes in accounting for such transactions that impact the amount of goodwill recognised, the reported results in the period an acquisition occurs and future reported results. The latter now requires a change in the ownership interest of a subsidiary (without loss of control) to be accounted for as an equity transaction, rather than giving rise to goodwill or a gain or loss. Consequential amendments were made to IAS 7, Statement of Cash Flows, IAS 12, Income Taxes, IAS 21, The Effects of Changes in Foreign Exchange Rates, IAS 28, Investments in Associates, and IAS 31, Interests in Joint Ventures. During 2008 and 2009, the IASB also issued amendments to IFRS 1, First Time Adoption of IFRS, IFRS 2, Share-Based Payment, IAS 39, Financial Instruments: Recognition and Measurement and the results of its annual improvements project. IFRIC interpretation 17, Distributions of Non-cash Assets to Owners, issued in 2008, has also been endorsed by the EU. These are all applicable for the first time in the current accounting period and are now reflected in the Group’s financial reporting, with no material impact other than on presentation as described in note 2(b). Further amendments to IFRS 1, IAS 24, Related Party Disclosures, and IAS 32, Financial Instruments – Presentation, and the results of its next annual improvements project have been issued and endorsed by the EU, while other amendments to IFRS 1, IFRS 7, Financial Instruments – Disclosures, and IAS 12 have been issued but have not yet been so endorsed. These are applicable prospectively for accounting periods commencing 1 February 2010 or later, and are therefore not applicable for the current accounting period. On adoption, they will not have any material impact on the Group’s financial reporting. In 2009, the IASB issued IFRS 9, Financial Instruments – Classification and Measurement, followed by additional requirements on accounting for financial liabilities in 2010. These are the first two parts of a replacement standard for IAS 39. They are applicable prospectively for accounting periods commencing 1 January 2013 or later, and are therefore not applicable for the current accounting period. IFRS 9 has not yet been endorsed by the EU but, on adoption, will require us to review the classification of certain financial instruments while allowing us to retain fair value measurement as we deem necessary. We have not yet completed our assessment of its impact. IFRIC interpretation 19, Extinguishing Financial Liabilities with Equity Instruments, and an amendment to interpretation 14, IAS 19 – The Limit on a Defined Benefit Asset, Minimum Funding Requirements and their Interaction, were issued during 2008 and 2009 and have been endorsed by the EU. These are applicable prospectively for accounting periods commencing 1 July 2010 or later, and are therefore not applicable for the current accounting period. On adoption, they will not have any impact on our financial reporting. In accordance with IFRS 4, Insurance Contracts, the Group has applied existing accounting practices for insurance and participating investment contracts, modified as appropriate to comply with the IFRS framework and applicable standards. Further details are given in policy F below. Items included in the financial statements of each of the Group’s entities are measured in the currency of the primary economic environment in which that entity operates (the functional currency). The consolidated financial statements are stated in sterling, which is the Company’s functional and presentation currency. Unless otherwise noted, the amounts shown in these financial statements are in millions of pounds sterling (£m). As supplementary information, consolidated financial information is also presented in euros. The separate financial statements of the Company are on pages 306 to 314.
(B) Operating profit The long-term nature of much of the Group’s operations means that, for management’s decision-making and internal performance management, short-term realised and unrealised investment gains and losses are treated as non-operating items. The Group focuses instead on an operating profit measure (also referred to as adjusted operating profit) that incorporates an expected return on investments supporting its long-term and non-long-term businesses. Operating profit for long-term business is based on expected investment returns on financial investments backing shareholder and policyholder funds over the reporting period, with allowance for the corresponding expected movements in liabilities. Variances between actual and expected investment returns, and the impact of changes in economic assumptions on liabilities, are disclosed separately outside operating profit. For non-long-term business, the total investment income, including realised and unrealised gains, is analysed between that calculated using a longer-term return and short-term fluctuations from that level. Further details of this analysis and the assumptions used are given in notes 8 and 9.
(C) Critical accounting policies and the use of estimates The preparation of financial statements requires the Group to select accounting policies and make estimates and assumptions that affect items reported in the consolidated income statement, consolidated statement of financial position, other primary statements and notes to the consolidated financial statements.

Performance reviewCorporate responsibilityGovernanceShareholder informationFinancial statements IFRSFinancial statements MCEVOther information
Financial statements IFRS
Accounting policies continued
171
Aviva plc Annual Report and Accounts 2010
Critical accounting policies The major areas of judgement on policy application are considered to be over whether Group entities should be consolidated (set out in policy D), on product classification (set out in policy F) and in the classification of financial investments (set out in policy S).
Use of estimates All estimates are based on management’s knowledge of current facts and circumstances, assumptions based on that knowledge and their predictions of future events and actions. Actual results may differ from those estimates, possibly significantly. The table below sets out those items we consider particularly susceptible to changes in estimates and assumptions, and the relevant accounting policy.
Item Accounting
policy Insurance and participating investment contract liabilities F&K Goodwill, AVIF and intangible assets N Fair values of financial investments S Impairment of financial investments S Fair value of derivative financial instruments T Deferred acquisition costs and other assets W Provisions and contingent liabilities Z Pension obligations AA Deferred income taxes AB
(D) Consolidation principles Subsidiaries Subsidiaries are those entities (including special purpose entities) in which the Group, directly or indirectly, has power to exercise control over financial and operating policies in order to gain economic benefits. Subsidiaries are consolidated from the date on which effective control is transferred to the Group and are excluded from consolidation from the date the Group no longer has effective control. All inter-company transactions, balances and unrealised surpluses and deficits on transactions between Group companies have been eliminated. From 1 January 2004, the date of first time adoption of IFRS, the Group is required to use the acquisition method of accounting to account for the acquisition of subsidiaries. Under this method, the cost of an acquisition is measured as the fair value of assets given up, shares issued or liabilities undertaken at the date of acquisition, plus costs directly attributable to the acquisition. The excess of the cost of acquisition over the fair value of the net assets of the subsidiary acquired is recorded as goodwill (see policy N below). Any surplus of the acquirer’s interest in the subsidiary’s net assets over the cost of acquisition is credited to the income statement. For business combinations for which the acquisition date is on or after 1 January 2010, the Group is required to use the acquisition method of accounting. Under this method, the cost of an acquisition is measured as the aggregate of the consideration transferred, measured at acquisition date fair value, and the amount of any non-controlling interest in the acquiree. For each business combination, the Group has the option to measure the non-controlling interest in the acquiree either at fair value or at the proportionate share of the acquiree’s identifiable net assets. The excess of the consideration transferred over the fair value of the net assets of the subsidiary acquired is recorded as goodwill. Acquisition-related costs incurred are expensed as incurred. Transactions that do not result in a loss of control are treated as equity transactions with non-controlling interests.’
Merger accounting and the merger reserve Prior to 1 January 2004, certain significant business combinations were accounted for using the ‘pooling of interests method’ (or merger accounting), which treats the merged groups as if they had been combined throughout the current and comparative accounting periods. Merger accounting principles for these combinations gave rise to a merger reserve in the consolidated statement of financial position, being the difference between the nominal value of new shares issued by the Parent Company for the acquisition of the shares of the subsidiary and the subsidiary’s own share capital and share premium account. These transactions have not been restated, as permitted by the IFRS 1 transitional arrangements. The merger reserve is also used where more than 90% of the shares in a subsidiary are acquired and the consideration includes the issue of new shares by the Company, thereby attracting merger relief under the Companies Act 1985 and, from 1 October 2009, the Companies Act 2006.
Investment vehicles In several countries, the Group has invested in a number of specialised investment vehicles such as Open-ended Investment Companies (OEICs) and unit trusts. These invest mainly in equities, bonds, cash and cash equivalents, and properties, and distribute most of their income. The Group’s percentage ownership in these vehicles can fluctuate from day to day according to the Group’s and third-party participation in them. Where Group companies are deemed to control such vehicles, with control determined based on an analysis of the guidance in IAS 27 and SIC 12, they are consolidated, with the interests of parties other than Aviva being classified as liabilities. These appear as ‘Net asset value attributable to unitholders’ in the consolidated statement of financial position. Where the Group does not control such vehicles, and these investments are held by its insurance or investment funds, they do not meet the definition of associates (see below) and are, instead, carried at fair value through profit and loss within financial investments in the consolidated statement of financial position, in accordance with IAS 39, Financial Instruments: Recognition and Measurement. As part of their investment strategy, the UK and certain European long-term business policyholder funds have invested in a number of property limited partnerships (PLPs), either directly or via property unit trusts (PUTs), through a mix of capital and loans. The PLPs are managed by general partners (GPs), in which the long-term business shareholder companies hold equity stakes and which themselves hold nominal stakes in the PLPs. The PUTs are managed by a Group subsidiary.

Accounting policies continued
172
Aviva plc Annual Report and Accounts 2010
Accounting for the PUTs and PLPs as subsidiaries, joint ventures or other financial investments depends on the shareholdings in the GPs and the terms of each partnership agreement. Where the Group exerts control over a PLP, it has been treated as a subsidiary and its results, assets and liabilities have been consolidated. Where the partnership is managed by a contractual agreement such that no party exerts control, notwithstanding that the Group’s partnership share in the PLP (including its indirect stake via the relevant PUT and GP) may be greater than 50%, such PUTs and PLPs have been classified as joint ventures. Where the Group holds minority stakes in PLPs, with no disproportionate influence, the relevant investments are carried at fair value through profit and loss within financial investments.
Associates and joint ventures Associates are entities over which the Group has significant influence, but which it does not control. Generally, it is presumed that the Group has significant influence if it has between 20% and 50% of voting rights. Joint ventures are entities whereby the Group and other parties undertake an economic activity which is subject to joint control arising from a contractual agreement. In a number of these, the Group’s share of the underlying assets and liabilities may be greater than 50% but the terms of the relevant agreements make it clear that control is not exercised. Such jointly controlled entities are referred to as joint ventures in these financial statements. Gains on transactions between the Group and its associates and joint ventures are eliminated to the extent of the Group’s interest in the associates and joint ventures. Losses are also eliminated, unless the transaction provides evidence of an impairment of the asset transferred between entities. Investments in associates and joint ventures are accounted for using the equity method of accounting. Under this method, the cost of the investment in a given associate or joint venture, together with the Group’s share of that entity’s post-acquisition changes to shareholders’ funds, is included as an asset in the consolidated statement of financial position. As explained in policy N, the cost includes goodwill identified on acquisition. The Group’s share of their post-acquisition profits or losses is recognised in the income statement and its share of post-acquisition movements in reserves is recognised in reserves. Equity accounting is discontinued when the Group no longer has significant influence or joint control over the investment. If the Group’s share of losses in an associate or joint venture equals or exceeds its interest in the undertaking, the Group does not recognise further losses unless it has incurred obligations or made payments on behalf of the entity.
The Company’s investments In the Company statement of financial position, subsidiaries and joint ventures are stated at their fair values, estimated using applicable valuation models underpinned by the Company’s market capitalisation. These investments are classified as available for sale (AFS) financial assets, with changes in their fair value being recognised in other comprehensive income and recorded in a separate investment valuation reserve within equity.
(E) Foreign currency translation Income statements and cash flows of foreign entities are translated into the Group’s presentation currency at average exchange rates for the year while their statements of financial position are translated at the year-end exchange rates. Exchange differences arising from the translation of the net investment in foreign subsidiaries, associates and joint ventures, and of borrowings and other currency instruments designated as hedges of such investments, are recognised in other comprehensive income and taken to the currency translation reserve within equity. On disposal of a foreign entity, such exchange differences are transferred out of this reserve and are recognised in the income statement as part of the gain or loss on sale. The cumulative translation differences were deemed to be zero at the transition date to IFRS. Foreign currency transactions are accounted for at the exchange rates prevailing at the date of the transactions. Gains and losses resulting from the settlement of such transactions, and from the translation of monetary assets and liabilities denominated in foreign currencies, are recognised in the income statement. Translation differences on debt securities and other monetary financial assets measured at fair value and designated as held at fair value through profit or loss (FV) (see policy S) are included in foreign exchange gains and losses in the income statement. For monetary financial assets designated as AFS, translation differences are calculated as if they were carried at amortised cost and so are recognised in the income statement, whilst foreign exchange differences arising from fair value gains and losses are recognised in other comprehensive income and included in the investment valuation reserve within equity. Translation differences on non-monetary items, such as equities which are designated as FV, are reported as part of the fair value gain or loss, whereas such differences on AFS equities are included in the investment valuation reserve.
(F) Product classification Insurance contracts are defined as those containing significant insurance risk if, and only if, an insured event could cause an insurer to make significant additional payments in any scenario, excluding scenarios that lack commercial substance, at the inception of the contract. Such contracts remain insurance contracts until all rights and obligations are extinguished or expire. Contracts can be reclassified as insurance contracts after inception if insurance risk becomes significant. Any contracts not considered to be insurance contracts under IFRS are classified as investment contracts. Some insurance and investment contracts contain a discretionary participating feature, which is a contractual right to receive additional benefits as a supplement to guaranteed benefits. These are referred to as participating contracts. As noted in policy A above, insurance contracts and participating investment contracts in general continue to be measured and accounted for under existing accounting practices at the later of the date of transition to IFRS or the date of the acquisition of the entity, in accordance with IFRS 4. Accounting for insurance contracts in UK companies is determined in accordance with the Statement of Recommended Practice issued by the Association of British Insurers, the most recent version of which was issued in December 2005 and amended in December 2006. In certain businesses, the accounting policies or accounting estimates have been changed, as permitted by IFRS 4 and IAS 8 respectively, to remeasure designated insurance liabilities to reflect current market interest rates and changes to regulatory capital requirements. When accounting policies or accounting estimates have been changed, and adjustments

Performance reviewCorporate responsibilityGovernanceShareholder informationFinancial statements IFRSFinancial statements MCEVOther information
Financial statements IFRS
Accounting policies continued
173
Aviva plc Annual Report and Accounts 2010
to the measurement basis have occurred, the financial statements of that year will have disclosed the impacts accordingly. One such example is our adoption of Financial Reporting Standard 27, Life Assurance, (FRS 27) which was issued by the UK’s Accounting Standards Board (ASB) in December 2004. Aviva, along with other major insurance companies and the ABI, signed a Memorandum of Understanding with the ASB, under which we voluntarily agreed to adopt in full the standard from 2005 in the Group’s IFRS financial statements. FRS 27 adds to the requirements of IFRS but does not vary them in any way. The additional requirements of FRS 27 are detailed in policy K below and in note 56.
(G) Premiums earned Premiums on long-term insurance contracts and participating investment contracts are recognised as income when receivable, except for investment-linked premiums which are accounted for when the corresponding liabilities are recognised. For single premium business, this is the date from which the policy is effective. For regular premium contracts, receivables are recognised at the date when payments are due. Premiums are shown before deduction of commission and before any sales-based taxes or duties. Where policies lapse due to non-receipt of premiums, then all the related premium income accrued but not received from the date they are deemed to have lapsed is offset against premiums. General insurance and health premiums written reflect business incepted during the year, and exclude any sales-based taxes or duties. Unearned premiums are those proportions of the premiums written in a year that relate to periods of risk after the statement of financial position date. Unearned premiums are calculated on either a daily or monthly pro rata basis. Premiums collected by intermediaries, but not yet received, are assessed based on estimates from underwriting or past experience, and are included in premiums written. Deposits collected under investment contracts without a discretionary participating feature (non-participating contracts) are not accounted for through the income statement, except for the fee income (covered in policy H) and the investment income attributable to those contracts, but are accounted for directly through the statement of financial position as an adjustment to the investment contract liability.
(H) Other investment contract fee revenue Investment contract policyholders are charged fees for policy administration, investment management, surrenders or other contract services. The fees may be for fixed amounts or vary with the amounts being managed, and will generally be charged as an adjustment to the policyholder’s balance. The fees are recognised as revenue in the period in which they are collected unless they relate to services to be provided in future periods, in which case they are deferred and recognised as the service is provided. Initiation and other ‘front-end’ fees (fees that are assessed against the policyholder balance as consideration for origination of the contract) are charged on some non-participating investment and investment fund management contracts. Where the investment contract is recorded at amortised cost, these fees are deferred and recognised over the expected term of the policy by an adjustment to the effective yield. Where the investment contract is measured at fair value, the front-end fees that relate to the provision of investment management services are deferred and recognised as the services are provided.
(I) Other fee and commission income Other fee and commission income consists primarily of fund management fees, income from the RAC’s non-insurance activities, distribution fees from mutual funds, commissions on reinsurance ceded, commission revenue from the sale of mutual fund shares and transfer agent fees for shareholder record keeping. Reinsurance commissions receivable are deferred in the same way as acquisition costs, as described in policy W. All other fee and commission income is recognised as the services are provided.
(J) Net investment income Investment income consists of dividends, interest and rents receivable for the year, movements in amortised cost on debt securities, realised gains and losses, and unrealised gains and losses on FV investments (as defined in policy S). Dividends on equity securities are recorded as revenue on the ex-dividend date. Interest income is recognised as it accrues, taking into account the effective yield on the investment. It includes the interest rate differential on forward foreign exchange contracts. Rental income is recognised on an accruals basis. A gain or loss on a financial investment is only realised on disposal or transfer, and is the difference between the proceeds received, net of transaction costs, and its original cost or amortised cost as appropriate. Unrealised gains and losses, arising on investments which have not been derecognised as a result of disposal or transfer, represent the difference between the carrying value at the year end and the carrying value at the previous year end or purchase value during the year, less the reversal of previously recognised unrealised gains and losses in respect of disposals made during the year. Realised gains or losses on investment property represent the difference between the net disposal proceeds and the carrying amount of the property.
(K) Insurance and participating investment contract liabilities Claims Long-term business claims reflect the cost of all claims arising during the year, including claims handling costs, as well as policyholder bonuses accrued in anticipation of bonus declarations. General insurance and health claims incurred include all losses occurring during the year, whether reported or not, related handling costs, a reduction for the value of salvage and other recoveries, and any adjustments to claims outstanding from previous years. Claims handling costs include internal and external costs incurred in connection with the negotiation and settlement of claims. Internal costs include all direct expenses of the claims department and any part of the general administrative costs directly attributable to the claims function.

Accounting policies continued
174
Aviva plc Annual Report and Accounts 2010
Long-term business provisions Under current IFRS requirements, insurance and participating investment contract liabilities are measured using accounting policies consistent with those adopted previously under existing accounting practices, with the exception of liabilities remeasured to reflect current market interest rates and those relating to UK with-profit and non-profit contracts, to be consistent with the value of the backing assets. For liabilities relating to UK with-profit contracts, the Group has adopted FRS 27, Life Assurance, as described in policy F above, in addition to the requirements of IFRS. In the United States, shadow adjustments are made to the liabilities or related deferred acquisition costs and are recognised directly in other comprehensive income. This means that the measurement of these items is adjusted for unrealised gains or losses on the backing assets such as AFS financial investments (see policy S), that are recognised directly in other comprehensive income, in the same way as if those gains or losses had been realised. The long-term business provisions are calculated separately for each life operation, based either on local regulatory requirements or existing local GAAP at the later of the date of transition to IFRS or the date of the acquisition of the entity, and actuarial principles consistent with those applied in the UK. Each calculation represents a determination within a range of possible outcomes, where the assumptions used in the calculations depend on the circumstances prevailing in each life operation. The principal assumptions are disclosed in note 39(b). For liabilities of the UK with-profit funds, FRS 27 requires liabilities to be calculated as the realistic basis liabilities as set out by the UK’s Financial Services Authority, adjusted to remove the shareholders’ share of future bonuses. For UK non-profit insurance contracts, the Group applies the realistic regulatory basis as set out in the FSA Policy Statement 06/14, Prudential Changes for Insurers, where applicable.
Present value of future profits (PVFP) on non-participating business written in a with-profit fund For UK with-profit life funds falling within the scope of the FSA realistic capital regime, and hence FRS 27, an amount may be recognised for the present value of future profits on non-participating business written in a with-profit fund where the determination of the realistic value of liabilities in that with-profit fund takes account, directly or indirectly, of this value. This amount is recognised as a reduction in the liability rather than as an asset in the statement of financial position, and is then apportioned between the amounts that have been taken into account in the measurement of liabilities and other amounts which are shown as an adjustment to the unallocated divisible surplus.
Unallocated divisible surplus In certain participating long-term insurance and investment business, the nature of the policy benefits is such that the division between shareholder reserves and policyholder liabilities is uncertain. Amounts whose allocation to either policyholders or shareholders has not been determined by the end of the financial year are held within liabilities as an unallocated divisible surplus. If the aggregate carrying value of liabilities for a particular participating business fund is in excess of the aggregate carrying value of its assets, then the difference is held as a negative unallocated divisible surplus balance, subject to recoverability from margins in that fund’s participating business. Any excess of this difference over the recoverable amount is charged to net income in the reporting period.
Embedded derivatives Embedded derivatives that meet the definition of an insurance contract or correspond to options to surrender insurance contracts for a set amount (or based on a fixed amount and an interest rate) are not separately measured. All other embedded derivatives are separated and measured at fair value, if they are not considered as closely related to the host insurance contract or do not meet the definition of an insurance contract. Fair value reflects own credit risk to the extent the embedded derivative is not fully collateralised.
Liability adequacy At each reporting date, an assessment is made of whether the recognised long-term business provisions are adequate, using current estimates of future cash flows. If that assessment shows that the carrying amount of the liabilities (less related assets) is insufficient in light of the estimated future cash flows, the deficiency is recognised in the income statement by setting up an additional provision in the statement of financial position.
General insurance and health provisions (i) Outstanding claims provisions General insurance and health outstanding claims provisions are based on the estimated ultimate cost of all claims incurred but not settled at the statement of financial position date, whether reported or not, together with related claims handling costs. Significant delays are experienced in the notification and settlement of certain types of general insurance claims, particularly in respect of liability business, including environmental and pollution exposures, the ultimate cost of which cannot be known with certainty at the statement of financial position date. Any estimate represents a determination within a range of possible outcomes. Further details of estimation techniques are given in note 39(c). Provisions for latent claims are discounted, using rates based on the relevant swap curve, in the relevant currency at the reporting date, having regard to the expected settlement dates of the claims. The discount rate is set at the start of the accounting period with any change in rates between the start and end of the accounting period being reflected below operating profit as an economic assumption change. The range of discount rates used is described in note 39(c). Outstanding claims provisions are valued net of an allowance for expected future recoveries. Recoveries include non-insurance assets that have been acquired by exercising rights to salvage and subrogation under the terms of insurance contracts.

Performance reviewCorporate responsibilityGovernanceShareholder informationFinancial statements IFRSFinancial statements MCEVOther information
Financial statements IFRS
Accounting policies continued
175
Aviva plc Annual Report and Accounts 2010
(ii) Provision for unearned premiums The proportion of written premiums, gross of commission payable to intermediaries, attributable to subsequent periods is deferred as a provision for unearned premiums. The change in this provision is taken to the income statement as recognition of revenue over the period of risk.
(iii) Liability adequacy At each reporting date, the Group reviews its unexpired risks and carries out a liability adequacy test for any overall excess of expected claims and deferred acquisition costs over unearned premiums, using the current estimates of future cash flows under its contracts after taking account of the investment return expected to arise on assets relating to the relevant general business provisions. If these estimates show that the carrying amount of its insurance liabilities (less related deferred acquisition costs) is insufficient in light of the estimated future cash flows, the deficiency is recognised in the income statement by setting up a provision in the statement of financial position.
Other assessments and levies The Group is subject to various periodic insurance-related assessments or guarantee fund levies. Related provisions are established where there is a present obligation (legal or constructive) as a result of a past event. Such amounts are not included in insurance liabilities but are included under ‘Provisions’ in the statement of financial position.
(L) Non-participating investment contract liabilities Claims For non-participating investment contracts with an account balance, claims reflect the excess of amounts paid over the account balance released.
Contract liabilities Deposits collected under non-participating investment contracts are not accounted for through the income statement, except for the investment income attributable to those contracts, but are accounted for directly through the statement of financial position as an adjustment to the investment contract liability. The majority of the Group’s contracts classified as non-participating investment contracts are unit-linked contracts and are measured at fair value. Certain liabilities for non-linked non-participating contracts are measured at amortised cost. The fair value liability is determined in accordance with IAS 39, using a valuation technique to provide a reliable estimate of the amount for which the liability could be settled between knowledgeable willing parties in an arm’s length transaction. For unit-linked contracts, the fair value liability is equal to the current unit fund value, plus additional non-unit reserves if required based on a discounted cash flow analysis. For non-linked contracts, the fair value liability is based on a discounted cash flow analysis, with allowance for risk calibrated to match the market price for risk. Amortised cost is calculated as the fair value of consideration received at the date of initial recognition, less the net effect of payments such as transaction costs and front-end fees, plus or minus the cumulative amortisation (using the effective interest rate method) of any difference between that initial amount and the maturity value, and less any write-down for surrender payments. The effective interest rate is the one that equates the discounted cash payments to the initial amount. At each reporting date, the amortised cost liability is determined as the value of future best estimate cash flows discounted at the effective interest rate.
(M) Reinsurance The Group assumes and cedes reinsurance in the normal course of business, with retention limits varying by line of business. Premiums on reinsurance assumed are recognised as revenue in the same manner as they would be if the reinsurance were considered direct business, taking into account the product classification of the reinsured business. The cost of reinsurance related to long-duration contracts is accounted for over the life of the underlying reinsured policies, using assumptions consistent with those used to account for these policies. Where general insurance liabilities are discounted, any corresponding reinsurance assets are also discounted using consistent assumptions. Gains or losses on buying retroactive reinsurance are recognised in the income statement immediately at the date of purchase and are not amortised. Premiums ceded and claims reimbursed are presented on a gross basis in the consolidated income statement and statement of financial position as appropriate. Reinsurance assets primarily include balances due from both insurance and reinsurance companies for ceded insurance liabilities. Amounts recoverable from reinsurers are estimated in a manner consistent with the outstanding claims provisions or settled claims associated with the reinsured policies and in accordance with the relevant reinsurance contract. Reinsurance contracts that principally transfer financial risk are accounted for directly through the statement of financial position and are not included in reinsurance assets or liabilities. A deposit asset or liability is recognised, based on the consideration paid or received less any explicitly identified premiums or fees to be retained by the reinsured. If a reinsurance asset is impaired, the Group reduces the carrying amount accordingly and recognises that impairment loss in the income statement. A reinsurance asset is impaired if there is objective evidence, as a result of an event that occurred after initial recognition of the reinsurance asset, that the Group may not receive all amounts due to it under the terms of the contract, and the event has a reliably measurable impact on the amounts that the Group will receive from the reinsurer.

Accounting policies continued
176
Aviva plc Annual Report and Accounts 2010
(N) Goodwill, AVIF and intangible assets Goodwill Goodwill represents the excess of the cost of an acquisition over the fair value of the Group’s share of the net assets of the acquired subsidiary, associate or joint venture at the date of acquisition. Goodwill on acquisitions prior to 1 January 2004 (the date of transition to IFRS) is carried at its book value (original cost less cumulative amortisation) on that date, less any impairment subsequently incurred. Goodwill arising before 1 January 1998 was eliminated against reserves and has not been reinstated. Goodwill arising on the Group’s investments in subsidiaries since that date is shown as a separate asset, whilst that on associates and joint ventures is included within the carrying value of those investments.
Acquired value of in-force business (AVIF) The present value of future profits on a portfolio of long-term insurance and investment contracts, acquired either directly or through the purchase of a subsidiary, is recognised as an asset. If the AVIF results from the acquisition of an investment in a joint venture or an associate, it is held within the carrying amount of that investment. In all cases, the AVIF is amortised over the useful lifetime of the related contracts in the portfolio on a systematic basis. The rate of amortisation is chosen by considering the profile of the additional value of in-force business acquired and the expected depletion in its value. The value of the acquired in-force long-term business is reviewed annually for any impairment in value and any reductions are charged as expenses in the income statement.
Intangible assets Intangibles consist primarily of brands, certain of which have been assessed as having indefinite useful lives, and contractual relationships such as access to distribution networks and customer lists. The economic lives of the latter are determined by considering relevant factors such as usage of the asset, typical product life cycles, potential obsolescence, maintenance costs, the stability of the industry, competitive position and the period of control over the assets. These intangibles are amortised over their useful lives, which range from five to 30 years, using the straight-line method. The amortisation charge for the year is included in the income statement under ‘Other operating expenses’. For intangibles with finite lives, a provision for impairment will be charged where evidence of such impairment is observed. Intangibles with indefinite lives are subject to regular impairment testing, as described below.
Impairment testing For impairment testing, goodwill and intangibles with indefinite useful lives have been allocated to cash-generating units. The carrying amount of goodwill and intangible assets with indefinite useful lives is reviewed at least annually or when circumstances or events indicate there may be uncertainty over this value. Goodwill and indefinite life intangibles are written down for impairment where the recoverable amount is insufficient to support its carrying value. Further details on goodwill allocation and impairment testing are given in note 16.
(O) Property and equipment Owner-occupied properties are carried at their revalued amounts, which are supported by market evidence, and movements are recognised in other comprehensive income and taken to a separate reserve within equity. When such properties are sold, the accumulated revaluation surpluses are transferred from this reserve to retained earnings. These properties are depreciated down to their estimated residual values over their useful lives. All other items classed as property and equipment within the statement of financial position are carried at historical cost less accumulated depreciation. Investment properties under construction are included within property and equipment until completion, and are stated at cost less any provision for impairment in their values. Depreciation is calculated on the straight-line method to write-down the cost of other assets to their residual values over their estimated useful lives as follows:
Land No depreciation Properties under construction No depreciation Owner-occupied properties, and related mechanical and electrical equipment 25 years Motor vehicles Three years, or lease term if longer Computer equipment Three to five years Other assets Three to five years
The assets’ residual values, useful lives and method of depreciation are reviewed regularly, and at least at each financial year end, and adjusted if appropriate. Where the carrying amount of an asset is greater than its estimated recoverable amount, it is written down immediately to its recoverable amount. Gains and losses on disposal of property and equipment are determined by reference to their carrying amount. Borrowing costs directly attributable to the acquisition and construction of property and equipment are capitalised. All repairs and maintenance costs are charged to the income statement during the financial period in which they are incurred. The cost of major renovations is included in the carrying amount of the asset when it is probable that future economic benefits in excess of the most recently assessed standard of performance of the existing asset will flow to the Group and the renovation replaces an identifiable part of the asset. Major renovations are depreciated over the remaining useful life of the related asset.

Performance reviewCorporate responsibilityGovernanceShareholder informationFinancial statements IFRSFinancial statements MCEVOther information
Financial statements IFRS
Accounting policies continued
177
Aviva plc Annual Report and Accounts 2010
(P) Investment property Investment property is held for long-term rental yields and is not occupied by the Group. Completed investment property is stated at its fair value, which is supported by market evidence, as assessed by qualified external valuers or by local qualified staff of the Group in overseas operations. Changes in fair values are recorded in the income statement in net investment income.
(Q) Impairment of non-financial assets Property and equipment and other non-financial assets are reviewed for impairment losses whenever events or changes in circumstances indicate that the carrying amount may not be recoverable. An impairment loss is recognised for the amount by which the carrying amount of the asset exceeds its recoverable amount, which is the higher of an asset’s net selling price and value in use. For the purposes of assessing impairment, assets are grouped at the lowest level for which there are separately identifiable cash flows.
(R) Derecognition and offset of financial assets and financial liabilities A financial asset (or, where applicable, a part of a financial asset or part of a group of similar financial assets) is derecognised where:
The rights to receive cash flows from the asset have expired. The Group retains the right to receive cash flows from the asset, but has assumed an obligation to pay them in full without
material delay to a third party under a ‘pass-through’ arrangement. The Group has transferred its rights to receive cash flows from the asset and has either transferred substantially all the risks
and rewards of the asset, or has neither transferred nor retained substantially all the risks and rewards of the asset, but has transferred control of the asset.
A financial liability is derecognised when the obligation under the liability is discharged or cancelled or expires. Financial assets and liabilities are offset and the net amount reported in the statement of financial position when there is a legally enforceable right to set off the recognised amounts and there is an intention to settle on a net basis, or realise the asset and settle the liability simultaneously.
(S) Financial investments The Group classifies its investments as either financial assets at fair value through profit or loss (FV) or financial assets available for sale (AFS). The classification depends on the purpose for which the investments were acquired, and is determined by local management at initial recognition. The FV category has two subcategories – those that meet the definition as being held for trading and those the Group chooses to designate as FV (referred to in this accounting policy as ‘other than trading’). In general, the FV category is used as, in most cases, the Group’s investment or risk management strategy is to manage its financial investments on a fair value basis. Debt securities and equity securities, which the Group buys with the intention to resell in the short term, are classified as trading, as are non-hedge derivatives (see policy T below). All other securities in the FV category are classified as other than trading. The AFS category is used where the relevant long-term business liability (including shareholders’ funds) is passively managed, as well as in certain fund management and non-insurance operations. Purchases and sales of investments are recognised on the trade date, which is the date that the Group commits to purchase or sell the assets, at their fair values. Debt securities are initially recorded at their fair value, which is taken to be amortised cost, with amortisation credited or charged to the income statement. Investments classified as trading, other than trading and AFS are subsequently carried at fair value. Changes in the fair value of trading and other than trading investments are included in the income statement in the period in which they arise. Changes in the fair value of securities classified as AFS are recognised in other comprehensive income and recorded in a separate investment valuation reserve within equity. Investments carried at fair value are measured using a fair value hierarchy, described in note 22, with values based on quoted bid prices or amounts derived from cash flow models. Fair values for unlisted equity securities are estimated using applicable price/earnings or price/cash flow ratios refined to reflect the specific circumstances of the issuer. When securities classified as AFS are sold or impaired, the accumulated fair value adjustments are transferred out of the investment valuation reserve to the income statement with a corresponding movement through other comprehensive income. Financial guarantees are recognised initially at their fair value and are subsequently amortised over the duration of the contract. A liability is recognised for amounts payable under the guarantee if it is more likely than not that the guarantee will be called upon.
Impairment The Group reviews the carrying value of its loans and receivables and AFS investments on a regular basis. If the carrying value of a loan, receivable or AFS investment is greater than the recoverable amount, the carrying value is reduced through a charge to the income statement in the period of impairment. The following policies are used to determine the level of any impairment, some of which involve considerable judgement: AFS debt securities: An AFS debt security is impaired if there is objective evidence that a loss event has occurred which has impaired the expected cash flows, i.e. where all amounts due according to the contractual terms of the security are not considered collectible. An impairment charge, measured as the difference between the security’s fair value and amortised cost, is recognised when the issuer is known to be either in default or in financial difficulty. Determining when an issuer is in financial difficulty requires the use of judgement, and we consider a number of factors including industry risk factors, financial condition, liquidity position and near-term prospects of the issuer, credit rating declines and a breach of contract. A decline in fair value below amortised cost due to changes in risk-free interest rates does not necessarily represent objective evidence of a loss event.

Accounting policies continued
178
Aviva plc Annual Report and Accounts 2010
AFS equity securities: An AFS equity security is considered impaired if there is objective evidence that the cost may not be recovered. In addition to qualitative impairment criteria, such evidence includes a significant or prolonged decline in fair value below cost. Unless there is evidence to the contrary, an equity security is considered impaired if the decline in fair value relative to cost has been either at least 20% for a continuous six-month period or more than 40% at the end of the reporting period. Evidence to the contrary may include a significant rise in value of the equity security, for example as a result of a merger announced after the period end. We also review our largest equity holdings for evidence of impairment, as well as individual equity holdings in industry sectors known to be in difficulty. Where there is objective evidence that impairment exists, the security is written down regardless of the size of the unrealised loss. For both debt and equity AFS securities identified as being impaired, the cumulative unrealised net loss previously recognised within the investment valuation reserve is transferred to realised losses for the year with a corresponding movement through other comprehensive income. Any subsequent increase in fair value of these impaired securities is recognised in other comprehensive income and recorded in the investment valuation reserve, unless this increase can be objectively related to an event occurring after the impairment loss was recognised in the income statement. In such an event, the reversal of the impairment loss is recognised as a gain in the income statement. Mortgages and securitised loans: Impairment is measured based on the present value of expected future cash flows discounted at the effective rate of interest of the loan, subject to the fair value of the underlying collateral. When a loan is considered to be impaired, the income statement is charged with the difference between the carrying value and the estimated recoverable amount. Interest income on impaired loans is recognised based on the estimated recoverable amount. Reversals of impairments on any of these assets are only recognised where the decrease in the impairment can be objectively related to an event occurring after the write-down (such as an improvement in the debtor’s credit rating), and are not recognised in respect of equity instruments.
(T) Derivative financial instruments and hedging Derivative financial instruments include foreign exchange contracts, interest rate futures, currency and interest rate swaps, currency and interest rate options (both written and purchased) and other financial instruments that derive their value mainly from underlying interest rates, foreign exchange rates, commodity values or equity instruments. All derivatives are initially recognised in the statement of financial position at their fair value, which usually represents their cost. They are subsequently remeasured at their fair value, with the method of recognising movements in this value depending on whether they are designated as hedging instruments and, if so, the nature of the item being hedged. Fair values are obtained from quoted market prices or, if these are not available, by using valuation techniques such as discounted cash flow models or option pricing models. All derivatives are carried as assets when the fair values are positive and as liabilities when the fair values are negative. Premiums paid for derivatives are recorded as an asset on the statement of financial position at the date of purchase, representing their fair value at that date. Derivative contracts may be traded on an exchange or over-the-counter (OTC). Exchange-traded derivatives are standardised and include certain futures and option contracts. OTC derivative contracts are individually negotiated between contracting parties and include forwards, swaps, caps and floors. Derivatives are subject to various risks including market, liquidity and credit risk, similar to those related to the underlying financial instruments. The notional or contractual amounts associated with derivative financial instruments are not recorded as assets or liabilities on the statement of financial position as they do not represent the fair value of these transactions. These amounts are disclosed in note 58.
Interest rate and currency swaps Interest rate swaps are contractual agreements between two parties to exchange periodic payments in the same currency, each of which is computed on a different interest rate basis, on a specified notional amount. Most interest rate swaps involve the net exchange of payments calculated as the difference between the fixed and floating rate interest payments. Currency swaps, in their simplest form, are contractual agreements that involve the exchange of both periodic and final amounts in two different currencies. Both types of swap contracts may include the net exchange of principal. Exposure to gain or loss on these contracts will increase or decrease over their respective lives as a function of maturity dates, interest and foreign exchange rates, and the timing of payments.
Interest rate futures, forwards and options contracts Interest rate futures are exchange-traded instruments and represent commitments to purchase or sell a designated security or money market instrument at a specified future date and price. Interest rate forward agreements are OTC contracts in which two parties agree on an interest rate and other terms that will become a reference point in determining, in concert with an agreed notional principal amount, a net payment to be made by one party to the other, depending what rate in fact prevails at a future point in time. Interest rate options, which consist primarily of caps and floors, are interest rate protection instruments that involve the potential obligation of the seller to pay the buyer an interest rate differential in exchange for a premium paid by the buyer. This differential represents the difference between current rate and an agreed rate applied to a notional amount. Exposure to gain or loss on all interest rate contracts will increase or decrease over their respective lives as interest rates fluctuate.
Foreign exchange contracts Foreign exchange contracts, which include spot, forward and futures contracts, represent agreements to exchange the currency of one country for the currency of another country at an agreed price and settlement date. Foreign exchange option contracts are similar to interest rate option contracts, except that they are based on currencies, rather than interest rates. Exposure to gain or loss on these contracts will increase or decrease over their respective lives as currency exchange and interest rates fluctuate.

Performance reviewCorporate responsibilityGovernanceShareholder informationFinancial statements IFRSFinancial statements MCEVOther information
Financial statements IFRS
Accounting policies continued
179
Aviva plc Annual Report and Accounts 2010
Derivative instruments for hedging On the date a derivative contract is entered into, the Group designates certain derivatives as either: (i) a hedge of the fair value of a recognised asset or liability (fair value hedge) (ii) a hedge of a future cash flow attributable to a recognised asset or liability, a highly probable forecast transaction or a firm
commitment (cash flow hedge); or (iii) a hedge of a net investment in a foreign operation (net investment hedge) Hedge accounting is used for derivatives designated in this way, provided certain criteria are met. At the inception of the transaction, the Group documents the relationship between the hedging instrument and the hedged item, as well as the risk management objective and the strategy for undertaking the hedge transaction. The Group also documents its assessment of whether the hedge is expected to be, and has been, highly effective in offsetting the risk in the hedged item, both at inception and on an ongoing basis. Changes in the fair value of derivatives that are designated and qualify as net investment or cash flow hedges, and that prove to be highly effective in relation to the hedged risk, are recognised in other comprehensive income and a separate reserve within equity. Gains and losses accumulated in this reserve are included in the income statement on disposal of the relevant investment or occurrence of the cash flow as appropriate. Changes in the fair value of derivatives that are designated and qualify as fair value hedges against assets carried at amortised cost are adjusted against the carrying value of the hedged asset to the extent those changes relate to the hedged risk. This adjustment is then amortised to the income statement over the anticipated remaining life of the hedged instrument. Where the hedge is against the value of AFS securities, changes in its value are recognised in the income statement, partially or wholly offset by a transfer from the investment valuation reserve for the change in value of the hedged item. The Group discontinues hedge accounting if the hedging instrument expires, is sold, terminated or exercised, the hedge no longer meets the criteria for hedge accounting or the Group revokes the designation. For a variety of reasons, certain derivative transactions, while providing effective economic hedges under the Group’s risk management positions, do not qualify for hedge accounting under the specific IFRS rules and are therefore treated as derivatives held for trading. Their fair value gains and losses are recognised immediately in other trading income.
(U) Loans Loans with fixed maturities, including policyholder loans, mortgage loans on investment property, securitised mortgages and collateral loans, are recognised when cash is advanced to borrowers. The majority of these loans are carried at their unpaid principal balances and adjusted for amortisation of premium or discount, non-refundable loan fees and related direct costs. These amounts are deferred and amortised over the life of the loan as an adjustment to loan yield using the effective interest rate method. Loans with indefinite future lives are carried at unpaid principal balances or cost. For certain mortgage loans, the Group has taken advantage of the revised fair value option under IAS 39 to present the mortgages, associated borrowings and derivative financial instruments at fair value, since they are managed as a portfolio on a fair value basis. This presentation provides more relevant information and eliminates any accounting mismatch that would otherwise arise from using different measurement bases for these three items. The fair values of mortgages classified as FV are estimated using discounted cash flow forecasts, based on a risk-adjusted discount rate which reflects the risks associated with these products, calibrated using the margins available on new lending or with reference to the rates offered by competitors. They are revalued at each period end, with movements in their fair values being taken to the income statement. At each reporting date, we review loans carried at amortised cost for objective evidence that they are impaired and uncollectable, either at the level of an individual security or collectively within a group of loans with similar credit risk characteristics. To the extent that a loan is uncollectable, it is written down as impaired to its recoverable amount, measured as the present value of expected future cash flows discounted at the original effective interest rate of the loan, including any collateral receivable. Subsequent recoveries in excess of the loan’s written-down carrying value are credited to the income statement.
(V) Collateral The Group receives and pledges collateral in the form of cash or non-cash assets in respect of stock lending transactions, as well as certain derivative contracts and loans, in order to reduce the credit risk of these transactions. Collateral is also pledged as security for bank letters of credit. The amount and type of collateral required depends on an assessment of the credit risk of the counterparty. Collateral received in the form of cash, which is not legally segregated from the Group, is recognised as an asset in the statement of financial position with a corresponding liability for the repayment in financial liabilities (note 50). However, where the Group has a currently enforceable legal right of set-off, the collateral liability and associated derivative balances are shown net, in line with market practice. Non-cash collateral received is not recognised in the statement of financial position unless the Group either sells or repledges these assets in the absence of default, at which point the obligation to return this collateral is recognised as a liability. Collateral pledged in the form of cash, which is legally segregated from the Group, is derecognised from the statement of financial position with a corresponding receivable for its return. Non-cash collateral pledged is not derecognised from the statement of financial position unless the Group defaults on its obligations under the relevant agreement, and therefore continues to be recognised in the statement of financial position within the appropriate asset classification.
(W) Deferred acquisition costs and other assets The costs directly attributable to the acquisition of new business for insurance and participating investment contracts (excluding those written in the UK) are deferred to the extent that they are expected to be recoverable out of future margins in revenues on these contracts. For participating contracts written in the UK, acquisition costs are generally not deferred as the liability for these contracts is calculated in accordance with the FSA’s realistic capital regime and FRS 27. For non-participating investment and investment fund management contracts, incremental acquisition costs and sales enhancements that are directly attributable to securing an investment management service are also deferred.

Accounting policies continued
180
Aviva plc Annual Report and Accounts 2010
Where such business is reinsured, an appropriate proportion of the deferred acquisition costs is attributed to the reinsurer, and is treated as a separate liability. Long-term business deferred acquisition costs are amortised systematically over a period no longer than that in which they are expected to be recoverable out of these future margins. Deferrable acquisition costs for non-participating investment and investment fund management contracts are amortised over the period in which the service is provided. General insurance and health deferred acquisition costs are amortised over the period in which the related revenues are earned. The reinsurers’ share of deferred acquisition costs is amortised in the same manner as the underlying asset. Deferred acquisition costs are reviewed by category of business at the end of each reporting period and are written-off where they are no longer considered to be recoverable. Other assets include vehicles which are subject to repurchase agreements and inventories of vehicle parts. The former are carried at the lower of their agreed repurchase price or net realisable value, whilst the latter are carried at the lower of cost and net realisable value, where cost is arrived at on the weighted average cost formula or ‘first in first out’ (FIFO) basis. Provision is made against inventories which are obsolete or surplus to requirements.
(X) Statement of cash flows Cash and cash equivalents Cash and cash equivalents consist of cash at banks and in hand, deposits held at call with banks, treasury bills and other short-term highly liquid investments that are readily convertible to known amounts of cash and which are subject to an insignificant risk of change in value. Such investments are those with less than three months’ maturity from the date of acquisition, or which are redeemable on demand with only an insignificant change in their fair values. For the purposes of the statement of cash flows, cash and cash equivalents also include bank overdrafts, which are included in payables and other financial liabilities on the statement of financial position.
Operating cash flows Purchases and sales of investment property, loans and financial investments are included within operating cash flows as the purchases are funded from cash flows associated with the origination of insurance and investment contracts, net of payments of related benefits and claims.
(Y) Leases Leases, where a significant portion of the risks and rewards of ownership is retained by the lessor, are classified as operating leases. Assets held for use in such leases are included in property and equipment, and are depreciated to their residual values over their estimated useful lives. Rentals from such leases are credited to the income statement on a straight-line basis over the period of the relevant leases. Payments made as lessee under operating leases (net of any incentives received from the lessor) are charged to the income statement on a straight-line basis over the period of the relevant leases.
(Z) Provisions and contingent liabilities Provisions are recognised when the Group has a present legal or constructive obligation as a result of past events, it is more probable than not that an outflow of resources embodying economic benefits will be required to settle the obligation, and a reliable estimate of the amount of the obligation can be made. Where the Group expects a provision to be reimbursed, for example under an insurance contract, the reimbursement is recognised as a separate asset but only when the reimbursement is virtually certain. The Group recognises a provision for onerous contracts when the expected benefits to be derived from a contract are less than the unavoidable costs of meeting the obligations under the contract. Contingent liabilities are disclosed if there is a possible future obligation as a result of a past event, or if there is a present obligation as a result of a past event but either a payment is not probable or the amount cannot be reasonably estimated.
(AA) Employee benefits Annual leave and long service leave Employee entitlements to annual leave and long service leave are recognised when they accrue to employees. A provision is made for the estimated liability for annual leave and long service leave as a result of services rendered by employees up to the statement of financial position date.
Pension obligations The Group operates a large number of pension schemes around the world, whose members receive benefits on either a defined benefit basis (generally related to a member’s final salary and length of service) or a defined contribution basis (generally related to the amount invested, investment return and annuity rates), the assets of which are generally held in separate trustee-administered funds. The pension plans are generally funded by payments from employees and the relevant Group companies. For defined benefit plans, the pension costs are assessed using the projected unit credit method. Under this method, the cost of providing pensions is charged to the income statement so as to spread the regular cost over the service lives of employees. The pension obligation is measured as the present value of the estimated future cash outflows, using a discount rate based on market yields for high-quality corporate bonds that are denominated in the currency in which the benefits will be paid and that have terms to maturity approximating to the terms of the related pension liability. The resulting pension scheme surplus or deficit appears as an asset or liability in the consolidated statement of financial position. Costs charged to the income statement comprise the current service cost (the increase in pension obligation resulting from employees’ service in the current period, together with the schemes’ administration expenses), past service cost (resulting from changes to benefits with respect to previous years’ service), and gains or losses on curtailment (when the employer materially reduces the number of employees covered by the scheme) or on settlements (when a scheme’s obligations are transferred outside the Group).

Performance reviewCorporate responsibilityGovernanceShareholder informationFinancial statements IFRSFinancial statements MCEVOther information
Financial statements IFRS
Accounting policies continued
181
Aviva plc Annual Report and Accounts 2010
In addition, the difference between the expected return on scheme assets, less investment expenses, and the interest cost of unwinding the discount on the scheme liabilities (to reflect the benefits being one period closer to being paid out) is credited to investment income. All actuarial gains and losses, being the difference between the actual and expected returns on scheme assets, changes in assumptions underlying the liability calculations and experience gains or losses on the assumptions made at the beginning of the period, are recognised immediately in other comprehensive income. For defined contribution plans, the Group pays contributions to publicly or privately administered pension plans. Once the contributions have been paid, the Group, as employer, has no further payment obligations. The Group’s contributions are charged to the income statement in the year to which they relate and are included in staff costs.
Other post-employment obligations Some Group companies provide post-employment healthcare or other benefits to their retirees. The entitlement to these benefits is usually based on the employee remaining in service up to retirement age and the completion of a minimum service period. Unlike the pension schemes, no assets are set aside in separate funds to provide for the future liability but none of these schemes is material to the Group. The costs of the Canadian scheme are included within those for the defined benefit pension schemes in that country. For such schemes in other countries, provisions are calculated in line with local regulations, with movements being charged to the income statement within staff costs.
Equity compensation plans The Group offers share award and option plans over the Company’s ordinary shares for certain employees, including a Save As You Earn plan (SAYE plan), details of which are given in the Directors’ Remuneration Report and in note 30. The Group accounts for options and awards under equity compensation plans, which were granted after 7 November 2002, until such time as they are fully vested, using the fair value based method of accounting (the ‘fair value method’). Under this method, the cost of providing equity compensation plans is based on the fair value of the share awards or option plans at date of grant, which is recognised in the income statement over the expected vesting period of the related employees and credited to the equity compensation reserve, part of shareholders’ funds. Shares purchased by employee share trusts to fund these awards are shown as a deduction from shareholders’ funds at their original cost. When the options are exercised and new shares are issued, the proceeds received, net of any transaction costs, are credited to share capital (par value) and the balance to share premium. Where the shares are already held by employee trusts, the net proceeds are credited against the cost of these shares, with the difference between cost and proceeds being taken to retained earnings. In both cases, the relevant amount in the equity compensation reserve is then credited to retained earnings.
(AB) Income taxes The current tax expense is based on the taxable profits for the year, after any adjustments in respect of prior years. Tax, including tax relief for losses if applicable, is allocated over profits before taxation and amounts charged or credited to components of other comprehensive income and equity as appropriate. Provision is made for deferred tax liabilities, or credit taken for deferred tax assets, using the liability method, on all material temporary differences between the tax bases of assets and liabilities and their carrying amounts in the consolidated financial statements. The principal temporary differences arise from depreciation of property and equipment, revaluation of certain financial assets and liabilities including derivative contracts, provisions for pensions and other post-retirement benefits and tax losses carried forward; and, in relation to acquisitions, on the difference between the fair values of the net assets acquired and their tax base. The rates enacted or substantively enacted at the statement of financial position date are used to determine the deferred tax. Deferred tax assets are recognised to the extent that it is probable that future taxable profit will be available against which the temporary differences can be utilised. In countries where there is a history of tax losses, deferred tax assets are only recognised in excess of deferred tax liabilities if there is convincing evidence that future profits will be available. Deferred tax is provided on temporary differences arising from investments in subsidiaries, associates and joint ventures, except where the timing of the reversal of the temporary difference can be controlled and it is probable that the difference will not reverse in the foreseeable future. Deferred taxes are not provided in respect of temporary differences arising from the initial recognition of goodwill, or from goodwill for which amortisation is not deductible for tax purposes, or from the initial recognition of an asset or liability in a transaction which is not a business combination and affects neither accounting profit nor taxable profit or loss at the time of the transaction. Current and deferred tax relating to items recognised in other comprehensive income and directly in equity are similarly recognised in other comprehensive income and directly in equity respectively. Deferred tax related to fair value re-measurement of available for sale investments, owner-occupied properties and other amounts charged or credited directly to other comprehensive income is recognised in the statement of financial position as a deferred tax asset or liability. Current tax on interest paid on Direct Capital instruments is credited directly in equity. In addition to paying tax on shareholders’ profits, the Group’s life businesses in the UK, Ireland and Singapore (and Australia prior to its disposal in 2009) pay tax on policyholders’ investment returns (‘policyholder tax’) on certain products at policyholder tax rates. Policyholder tax is accounted for as an income tax and is included in the total tax expense. The Group has decided to show separately the amounts of policyholder tax to provide a more meaningful measure of the tax the Group pays on its profits. In the pro forma reconciliations, operating profit has been calculated after charging policyholder tax.

Accounting policies continued
182
Aviva plc Annual Report and Accounts 2010
(AC) Borrowings Borrowings are recognised initially at their issue proceeds less transaction costs incurred. Subsequently, most borrowings are stated at amortised cost, and any difference between net proceeds and the redemption value is recognised in the income statement over the period of the borrowings using the effective interest rate method. All borrowing costs are expensed as they are incurred except where they are directly attributable to the acquisition or construction of property and equipment as described in policy O above. Where loan notes have been issued in connection with certain securitised mortgage loans, the Group has taken advantage of the revised fair value option under IAS 39 to present the mortgages, associated liabilities and derivative financial instruments at fair value, since they are managed as a portfolio on a fair value basis. This presentation provides more relevant information and eliminates any accounting mismatch which would otherwise arise from using different measurement bases for these three items.
(AD) Share capital and treasury shares Equity instruments An equity instrument is a contract that evidences a residual interest in the assets of an entity after deducting all its liabilities. Accordingly, a financial instrument is treated as equity if: (i) there is no contractual obligation to deliver cash or other financial assets or to exchange financial assets or liabilities on terms that
may be unfavourable; and (ii) the instrument is a non-derivative that contains no contractual obligation to deliver a variable number of shares or is a derivative
that will be settled only by the Group exchanging a fixed amount of cash or other assets for a fixed number of the Group’s own equity instruments.
Share issue costs Incremental external costs directly attributable to the issue of new shares are shown in equity as a deduction, net of tax, from the proceeds of the issue and disclosed where material.
Dividends Interim dividends on ordinary shares are recognised in equity in the period in which they are paid. Final dividends on these shares are recognised when they have been approved by shareholders. Dividends on preference shares are recognised in the period in which they are declared and appropriately approved.
Treasury shares Where the Company or its subsidiaries purchase the Company’s share capital or obtain rights to purchase its share capital, the consideration paid (including any attributable transaction costs net of income taxes) is shown as a deduction from total shareholders’ equity. Gains and losses on sales of own shares are charged or credited to the treasury share account in equity.
(AE) Fiduciary activities Assets and income arising from fiduciary activities, together with related undertakings to return such assets to customers, are excluded from these financial statements where the Group has no contractual rights in the assets and acts in a fiduciary capacity such as nominee, trustee or agent.
(AF) Earnings per share Basic earnings per share is calculated by dividing net income available to ordinary shareholders by the weighted average number of ordinary shares in issue during the year, excluding the weighted average number of ordinary shares purchased by the Group and held as Treasury shares. Earnings per share has also been calculated on the operating profit before impairment of goodwill and other adjusting items, after tax, attributable to ordinary shareholders, as the directors believe this figure provides a better indication of operating performance. Details are given in note 14. For the diluted earnings per share, the weighted average number of ordinary shares in issue is adjusted to assume conversion of all dilutive potential ordinary shares, such as convertible debt and share options granted to employees. Potential or contingent share issuances are treated as dilutive when their conversion to shares would decrease net earnings per share.
(AG) Operations held for sale Assets and liabilities held for disposal as part of operations which are held for sale are shown separately in the consolidated statement of financial position. The relevant assets are recorded at the lower of their carrying amount and their fair value, less the estimated selling costs.

Performance reviewCorporate responsibilityGovernanceShareholder informationFinancial statements IFRSFinancial statements MCEVOther information
Financial statements IFRS
Consolidated financial statements 183
Aviva plc Annual Report and Accounts 2010
The accounting policies (identified alphabetically) on pages 170 to 182 and notes (identified numerically) on pages 191 to 305 are an integral part of these financial statements.
Consolidated income statement For the year ended 31 December 2010
2010 €m Note
2010 £m
2009 £m
Income 5 42,675 Gross written premiums 36,274 34,690 (2,191) Premiums ceded to reinsurers (1,863) (2,576)
40,484 Premiums written net of reinsurance 34,411 32,114 (89) Net change in provision for unearned premiums (75) 559
40,395 Net earned premiums G 34,336 32,673 2,096 Fee and commission income H & I 1,782 1,789
25,874 Net investment income j 21,993 25,155 155 Share of profit/(loss) after tax of joint ventures and associates 131 (504) 187 Profit on the disposal and re-measurement of subsidiaries and associates 3b 159 153
68,707 58,401 59,266
Expenses 6 (34,296) Claims and benefits paid, net of recoveries from reinsurers (29,152) (27,549)
(8,444) Change in insurance liabilities, net of reinsurance (7,177) (5,682) (10,284) Change in investment contract provisions (8,741) (11,185)
387 Change in unallocated divisible surplus 329 (1,547) (6,902) Fee and commission expense (5,867) (4,396) (4,161) Other expenses (3,537) (5,366) (1,673) Finance costs 7 (1,422) (1,519)
(65,373) (55,567) (57,244)
3,334 Profit before tax 2,834 2,022
(463) Tax attributable to policyholders’ returns 13 (394) (217)
2,871 Profit before tax attributable to shareholders’ profits 2,440 1,805
(1,108) Tax expense AB & 13 (942) (707) 463 Less: tax attributable to policyholders’ returns 13 394 217
(645) Tax attributable to shareholders’ profits (548) (490)
2,226 Profit for the year 1,892 1,315
Attributable to: 1,721 Equity shareholders of Aviva plc 1,463 1,085
505 Non-controlling interests 37b 429 230
2,226 1,892 1,315
Earnings per share AF & 14 59.3c Basic (pence per share) 50.4p 37.8p 58.3c Diluted (pence per share) 49.6p 37.5p

Consolidated financial statements continued
184
Aviva plc Annual Report and Accounts 2010
The accounting policies (identified alphabetically) on pages 170 to 182 and notes (identified numerically) on pages 191 to 305 are an integral part of these financial statements.
Pro forma reconciliation of Group operating profit to profit before tax For the year ended 31 December 2010
2010 €m Note
2010 £m
2009 £m
Operating profit before tax attributable to shareholders’ profits 2,727 Long-term business 2,318 1,887 1,236 General insurance and health 1,050 960
237 Fund management 201 133 Other
(260) Other operations and regional costs (220) (214) (168) Corporate centre (143) (108) (772) Group debt costs and other interest (656) (636)
3,000 IFRS operating profit before adjusting items and tax attributable to shareholders’ profits 2,550 2,022
Adjusted for the following: 931 Investment return variances and economic assumption changes on long-term business 8 791 (75)
(286) Short-term fluctuation in return on investments on non-long-term business 9a (243) 95 (72) Economic assumption changes on general insurance and health business 9a (61) 57 (28) Impairment of goodwill and other amounts expensed 16 (24) (62)
(254) Amortisation and impairment of intangibles (see below) (216) (144) 187 Profit on the disposal and re-measurement of subsidiaries and associates 3b 159 153
(286) Integration and restructuring costs 6 (243) (286) (321) Exceptional items 6 (273) 45
2,871 Profit before tax attributable to shareholders’ profits 2,440 1,805 Tax attributable to shareholders’ profits
(735) Operating profit 14a(i) (625) (547) 90 Other activities 14a(i) 77 57
(645) (548) (490)
2,226 Profit for the year 1,892 1,315
2010
€m Note 2010
£m 2009
£m
Amortisation and impairment of intangibles arise in: (236) Subsidiaries 17 (201) (139)
(6) Joint ventures 18 (5) (4) (12) Associates 19 (10) (1)
(254) (216) (144)

Performance reviewCorporate responsibilityGovernanceShareholder informationFinancial statements IFRSFinancial statements MCEVOther information
Financial statements IFRS
Consolidated financial statements continued
185
Aviva plc Annual Report and Accounts 2010
The accounting policies (identified alphabetically) on pages 170 to 182 and notes (identified numerically) on pages 191 to 305 are an integral part of these financial statements.
Pro forma reconciliation of Group operating profit to profit before tax continued Operating profit can be further analysed into the following segments:
Year ended 31 December 2010 Long-term
business £m
General insurance
and health £m
Fund manage-
ment £m
Other operations
£m Total
£m
UK 850 579 3 (21) 1,411 Aviva Europe 893 109 — (104) 898 Delta Lloyd 330 146 103 (43) 536 North America 174 222 — (20) 376 Asia Pacific 71 (6) (2) (32) 31 Aviva Investors — — 97 — 97
2,318 1,050 201 (220) 3,349
Corporate centre (143) Group debt costs and other interest (656)
2,550
Year ended 31 December 2009 Long-term
business £m
General insurance
and health £m
Fund manage-
ment £m
Other operations
£m Total
£m
UK 672 535 (14) (28) 1,165 Aviva Europe 761 132 3 (99) 797 Delta Lloyd 277 143 28 (49) 399 North America 85 144 — (16) 213 Asia Pacific 92 6 1 (22) 77 Aviva Investors — — 115 — 115
1,887 960 133 (214) 2,766
Corporate centre (108) Group debt costs and other interest (636)
2,022

Consolidated financial statements continued
186
Aviva plc Annual Report and Accounts 2010
The accounting policies (identified alphabetically) on pages 170 to 182 and notes (identified numerically) on pages 191 to 305 are an integral part of these financial statements.
Consolidated statement of comprehensive income For the year ended 31 December 2010
2010 €m Note
2010 £m
2009 £m
2,226 Profit for the year 1,892 1,315 Other comprehensive income Investments classified as available for sale
815 Fair value gains 693 1,011 (188) Fair value gains transferred to profit on disposals (160) (310)
211 Impairment losses on assets previously revalued through other comprehensive income now taken to the income statement 179 482
Owner-occupier properties (54) Fair value losses (46) (25) (31) Share of other comprehensive income of joint ventures and associates (26) 122
1,175 Actuarial gains/(losses) on pension schemes 48e(iv) 999 (1,140) (21) Actuarial losses on pension schemes transferred to unallocated divisible surplus and other movements 48c(i) (18) 24 (92) Foreign exchange rate movements 35 & 37b (78) (951)
(131) Aggregate tax effect – shareholder tax 13b (112) (196)
1,684 Other comprehensive income, net of tax 1,431 (983)
3,910 Total comprehensive income for the year 3,323 332 Attributable to:
3,471 Equity shareholders of Aviva plc 2,950 240 439 Non-controlling interests 37b 373 92
3,910 3,323 332

Performance reviewCorporate responsibilityGovernanceShareholder informationFinancial statements IFRSFinancial statements MCEVOther information
Financial statements IFRS
Consolidated financial statements continued
187
Aviva plc Annual Report and Accounts 2010
The accounting policies (identified alphabetically) on pages 170 to 182 and notes (identified numerically) on pages 191 to 305 are an integral part of these financial statements.
Consolidated statement of changes in equity For the year ended 31 December 2010
Ordinary share
capital £m
Preference share
capital £m
Share premium
£m
Merger reserve
£m
Shares held by
employee trusts
£m
Currency translation
reserve £m
Owner-occupied
properties reserve
£m
Investment valuation
reserve £m
Hedging instruments
reserve £m
Equity compensation
reserve £m
Retained earnings
£m
Equity attributable
to shareholders of Aviva plc
£m
Direct capital
instrument £m
Non-controlling
interests £m
Total equity
£m
Balance at 1 January 692 200 1,207 3,271 (68) 2,224 104 163 (771) 109 3,425 10,556 990 3,540 15,086 Profit for the year — — — — — — — — — — 1,463 1,463 — 429 1,892 Other comprehensive income — — — — — (38) (21) 411 78 — 1,057 1,487 — (56) 1,431 Total comprehensive
income for the year — — — — — (38) (21) 411 78 — 2,520 2,950 — 373 3,323 Dividends and appropriations — — — — — — — — — — (757) (757) — — (757) Shares issued in lieu
of dividends 13 — (13) — — — — — — — 209 209 — — 209 Capital contributions from
non-controlling interests — — — — — — — — — — — — — 42 42 Dilution of shareholding in
Delta Lloyd — — — — — (3) — (1) — — (4) (8) — 8 — Non-controlling interests’ share
of dividends declared in the year — — — — — — — — — — — — — (187) (187)
Non-controlling interests in acquired/(disposed) subsidiaries — — — — — — — — — — — — — 3 3
Changes in non-controlling interests in existing subsidiaries — — — — — — — — — — — — — (38) (38)
Shares acquired by employee trusts — — — — (14) — — — — — — (14) — — (14)
Shares distributed by employee trusts — — — — 50 — — — — — (50) — — — —
Reserves credit for equity compensation plans — — — — — — — — — 41 — 41 — — 41
Shares issued under equity compensation plans — — — — — — — — — (51) 51 — — — —
Aggregate tax effect – shareholder tax (note 13(c)) — — — — — — — — — — 17 17 — — 17
Balance at 31 December 705 200 1,194 3,271 (32) 2,183 83 573 (693) 99 5,411 12,994 990 3,741 17,725

Consolidated financial statements continued
188
Aviva plc Annual Report and Accounts 2010
The accounting policies (identified alphabetically) on pages 170 to 182 and notes (identified numerically) on pages 191 to 305 are an integral part of these financial statements.
Consolidated statement of changes in equity continued For the year ended 31 December 2009
Ordinary share
capital £m
Preference share
capital £m
Share premium
£m
Merger reserve
£m
Shares held by
employee trusts
£m
Currency translation
reserve £m
Owner-occupied
properties reserve
£m
Investment valuation
reserve £m
Hedging instruments
reserve £m
Equity compensation
reserve £m
Retained earnings
£m
Equity attributable
to shareholders of Aviva plc
£m
Direct capital
instrument £m
Non-controlling
interests £m
Total equity
£m
At 1 January 2009 664 200 1,234 3,271 (33) 3,685 157 (711) (1,103) 113 3,902 11,379 990 2,204 14,573 Profit for the year — — — — — — — — — — 1,085 1,085 — 230 1,315 Other comprehensive income — — — — — (1,110) (26) 1,030 332 — (1,071) (845) — (138) (983) Total comprehensive income
for the year — — — — — (1,110) (26) 1,030 332 — 14 240 — 92 332 Owner-occupied
properties – Fair value losses transferred to
retained earnings on disposals — — — — — — (1) — — — 1 — — — —
Dividends and appropriations — — — — — — — — — — (853) (853) — — (853)
Issues of share capital 1 — — — — — — — — — — 1 — — 1 Shares issued in lieu
of dividends 27 — (27) — — — — — — — 299 299 — — 299 Capital contributions from non-
controlling interests — — — — — — — — — — — — — 6 6 Transfers to non-controlling
interests following Delta Lloyd IPO — — — — — (351) (26) (156) — — 3 (530) — 1,460 930
Minority share of dividends declared in the year — — — — — — — — — — — — — (109) (109)
Non-controlling interests in acquired/(disposed) subsidiaries — — — — — — — — — — — — — (2) (2)
Changes in non-controlling interests in existing subsidiaries — — — — — — — — — — — — — (111) (111)
Shares acquired by employee trusts — — — — (53) — — — — — — (53) — — (53)
Shares distributed by employee trusts — — — — 18 — — — — — (18) — — — —
Reserves credit for equity compensation plans — — — — — — — — — 56 — 56 — — 56
Shares issued under equity compensation plans — — — — — — — — — (60) 60 — — — —
Aggregate tax effect – shareholder tax (note 13(c)) — — — — — — — — — — 17 17 — — 17
Balance at 31 December 692 200 1,207 3,271 (68) 2,224 104 163 (771) 109 3,425 10,556 990 3,540 15,086

Performance reviewCorporate responsibilityGovernanceShareholder informationFinancial statements IFRSFinancial statements MCEVOther information
Financial statements IFRS
Consolidated financial statements continued
189
Aviva plc Annual Report and Accounts 2010
The accounting policies (identified alphabetically) on pages 170 to 182 and notes (identified numerically) on pages 191 to 305 are an integral part of these financial statements.
Consolidated statement of financial position As at 31 December 2010
2010 €m Note
2010 £m
2009 £m
Assets 3,943 Goodwill N & 16 3,391 3,381 3,263 Acquired value of in-force business and intangible assets N & 17 2,806 2,860 2,319 Interests in, and loans to, joint ventures D & 18 1,994 1,701
748 Interests in, and loans to, associates D & 19 643 1,281 872 Property and equipment O & 20 750 753
15,191 Investment property P & 21 13,064 12,422 50,086 Loans U & 23 43,074 41,079
294,521 Financial investments R, S & 25 253,288 238,679 8,237 Reinsurance assets M & 42 7,084 7,572
335 Deferred tax assets AB &46b 288 218 230 Current tax assets 46a 198 359
9,645 Receivables 26 8,295 9,632 7,060 Deferred acquisition costs and other assets W & 27 6,072 5,621 4,292 Prepayments and accrued income 27d 3,691 3,604
29,599 Cash and cash equivalents X & 54d 25,455 25,176 16 Assets of operations classified as held for sale AG & 3c 14 53
430,357 Total assets 370,107 354,391
Equity Capital AD
820 Ordinary share capital 29 705 692 233 Preference share capital 32 200 200
1,053 905 892 Capital reserves
1,388 Share premium 29b 1,194 1,207 3,803 Merger reserve D & 34 3,271 3,271 5,191 4,465 4,478
(37) Shares held by employee trusts 31 (32) (68) 2,610 Other reserves 35 2,245 1,829 6,292 Retained earnings 36 5,411 3,425
15,109 Equity attributable to shareholders of Aviva plc 12,994 10,556 1,151 Direct capital instrument 33 990 990 4,350 Non-controlling interests 37 3,741 3,540
20,610 Total equity 17,725 15,086
Liabilities 206,628 Gross insurance liabilities K & 39 177,700 171,092 136,962 Gross liabilities for investment contracts L & 40 117,787 110,015
3,986 Unallocated divisible surplus K & 44 3,428 3,866 10,502 Net asset value attributable to unitholders D 9,032 9,894
3,422 Provisions Z, AA & 47 2,943 3,980 2,044 Deferred tax liabilities AB & 46b 1,758 1,038
365 Current tax liabilities 46a 314 192 17,383 Borrowings AC & 49 14,949 15,000 23,595 Payables and other financial liabilities R & 50 20,292 20,542
4,860 Other liabilities 51 4,179 3,653 — Liabilities of operations classified as held for sale AG & 3c — 33
409,747 Total liabilities 352,382 339,305
430,357 Total equity and liabilities 370,107 354,391
Approved by the Board on 2 March 2011. Patrick Regan Chief financial officer

Consolidated financial statements continued
190
Aviva plc Annual Report and Accounts 2010
The accounting policies (identified alphabetically) on pages 170 to 182 and notes (identified numerically) on pages 191 to 305 are an integral part of these financial statements.
Consolidated statement of cash flows For the year ended 31 December 2010 The cash flows presented in this statement cover all the Group’s activities and include flows from both policyholder and shareholder activities. All cash and cash equivalents are available for use by the Group.
Note 2010
£m 2009
£m
Cash flows from operating activities 54a Cash generated from operations 2,213 3,286 Tax paid (406) (601)
Net cash from operating activities 1,807 2,685
Cash flows from investing activities Acquisitions of subsidiaries, joint ventures and associates, net of cash acquired 54b 477 (596) Disposals of subsidiaries, joint ventures and associates, net of cash transferred 54c 251 201 Disposal of non-controlling interest in subsidiary 15 — New loans to joint ventures and associates (64) (145) Repayment of loans to joint ventures and associates 5 99 Net new loans to joint ventures and associates 18a & 19a (59) (46) Purchases of property and equipment 20 (225) (149) Proceeds on sale of property and equipment 61 188 Purchases of intangible assets 17 (156) (30)
Net cash from investing activities 364 (432)
Cash flows from financing activities Proceeds from issue of ordinary shares, net of transaction costs — 1 Treasury shares purchased for employee trusts (14) (53) New borrowings drawn down, net expenses 3,647 4,260 Repayment of borrowings (2,887) (3,853) Net drawdown of borrowings 49e 760 407 Interest paid on borrowings (1,421) (1,199) Preference dividends paid (17) (17) Ordinary dividends paid (472) (476) Coupon payments on direct capital instruments (59) (61) Capital contributions from non-controlling interests 42 6 Dividends paid to non-controlling interests of subsidiaries (187) (109) Partial disposal of subsidiary 2b & 54c — 930
Net cash from financing activities (1,368) (571)
Net increase in cash and cash equivalents 803 1,682 Cash and cash equivalents at 1 January 24,251 23,531 Effect of exchange rate changes on cash and cash equivalents (359) (962)
Cash and cash equivalents at 31 December 54d 24,695 24,251

Performance reviewCorporate responsibilityGovernanceShareholder informationFinancial statements IFRSFinancial statements MCEVOther information
Financial statements IFRS
Notes to the consolidated financial statements
191
Aviva plc Annual Report and Accounts 2010
1 – Exchange rates The Group’s principal overseas operations during the year were located within the Eurozone and the United States. The results and cash flows of these operations have been translated into sterling at an average rate for the year of €1 = £0.85 (2009: €1 = £0.88) and £1 = US$1.55 (2009: £1= US$1.57). Assets and liabilities have been translated at the year-end rate of €1 = £0.86 (2009: €1 = £0.88) and £1 = US$1.57 (2009: £1= US$1.61). Total foreign currency movements during 2010 resulted in a gain recognised in the income statement of £34 million (2009: £154 million gain).
2 – Presentation changes (a) Pension scheme net finance costs In financial years prior to and including 2008, the net finance income on the Group’s defined benefit pension schemes, representing the surplus of expected income on scheme assets over the unwind of the discount on their liabilities, was classified as investment income in the consolidated income statement. Since adoption of IFRS in 2004, this figure had always been in a net finance income position but movements in scheme deficits and interest rates resulted in a net finance charge in 2009. For consistency with prior years, this net charge was included within investment income in the Group’s 2009 financial statements. In 2010, there is again a net finance charge which we believe should more appropriately be included within finance costs in the consolidated income statement. For consistency and comparability, we have therefore reclassified the 2009 comparative (£183 million) from net investment income to finance costs.
(b) Reclassification within the statement of cash flows As described in accounting policy A, the Group has adopted the revised versions of IFRS 3, Business Combinations, and IAS 27, Consolidated and Separate Financial Statements, and consequential amendments to several other accounting standards, in its financial reporting for the current accounting period. One such amendment to IAS 7, Statement of Cash Flows, requires cash flows arising from changes in ownership interests in a subsidiary, which do not result in a loss of control, to be classified as cash flows from financing activities, in the same way as other transactions with equity holders. The Group’s partial disposal of Delta Lloyd through its Initial Public Offering in 2009 gave rise to net cash proceeds of £930 million, which was disclosed as arising from investing activities in our consolidated statement of cash flows last year. As a result of the amendment to IAS 7 described above, we have reclassified that amount from investing activities to financing activities in the 2009 comparatives to this year’s statement. This resulted in a change in net cash from investing activities from £498 million inflow to £432 million outflow, and from financing activities from £1,501 million outflow to £571 million outflow.

Notes to the consolidated financial statements continued
192
Aviva plc Annual Report and Accounts 2010
3 – Subsidiaries This note provides details of the acquisitions and disposals of subsidiaries that the Group has made during the year, together with details of businesses held for sale at the year end. The principal Group subsidiaries are listed on pages 40 to 41.
(a) Acquisitions (i) River Road Asset Management On 24 February 2010, the Group acquired 100% of River Road Asset Management (River Road), a US equity manager, to support the expansion of Aviva Investors’ third-party institutional asset management business. The total consideration was estimated as £83 million (US$128 million), of which £37 million (US$57 million) was paid in cash on completion. The balance comprises undiscounted contingent consideration. The contingent consideration arrangement requires the Group to pay additional amounts, based on a multiple of the earnings (1.0792 times) during the next five years, up to a maximum of £70 million (US$108 million). The potential undiscounted amount of all future payments that the Group could be required to make under the contingent consideration arrangement is between £26 million (US$41 million) and £53 million (US$82 million). A fair value liability of £24 million, using a discount rate of 17%, has been recognised for potential consideration that is payable in 2014, 2015 and 2016. The acquisition has given rise to goodwill of £29 million, calculated as follows:
£m
Purchase cost: Cash paid 37 Contingent consideration arrangement (fair value) 24
Total consideration 61
The estimated book and fair values of the assets and liabilities at the acquisition date were:
Book value
£m
Fair value and
accounting policy
adjustments £m
Fair value £m
Assets Intangible assets — 31 31 Receivables and other assets 3 — 3
Total assets 3 31 34
Liabilities Payables and other liabilities (2) — (2)
Total liabilities (2) — (2)
Total identifiable net assets 1 31 32
Goodwill arising on acquisition 29
The fair value adjustment for intangible assets relates to customer relationships acquired. Goodwill of £29 million arising from this acquisition consists largely of the expected benefits from new business and new product introductions. The results of River Road have been included in the consolidated financial statements of the Group with effect from 24 February 2010, and have contributed £10 million revenues and £4 million loss to the consolidated profit before tax. Had it been consolidated from 1 January 2010, River Road would have contributed £12 million revenues and £5 million loss to the consolidated profit before tax.
(ii) RBS Life Investments Limited During the year, the Group reviewed its relationship with RBS Group plc (RBSG) which comprised interests in two associates, RBS Life Investments Limited (RBS Life) and RBSG Collective Investments Limited (RBS Collective), and a distribution arrangement for the products of these companies. The parties agreed that, with effect from 31 December 2010, the Group would take ownership of the back book of RBS Life in exchange for RBSG taking 100% ownership of RBS Collective through a share-for-share exchange. Separately, a new distribution agreement would be signed between our UK Life business and RBSG, with the new structure providing more flexibility in our long-term business operations. On 31 December 2010, the Group acquired 50.01% of the shares of RBS Life from RBSG. Combined with our existing 49.99% interest, the Group now owns all the ordinary shares of that entity, and has full control. It is being consolidated as a subsidiary from that date. As consideration for the acquisition, the Group transferred its 49.99% shareholding in RBS Collective to RBSG, together with cash of £3 million for 2010 performance variance. In addition, the existing distribution agreement ceased. Because of the nature of the transaction, the Group’s pre-existing interests in RBS Life and RBS Collective were re-measured to fair value as at the transaction date.

Performance reviewCorporate responsibilityGovernanceShareholder informationFinancial statements IFRSFinancial statements MCEVOther information
Financial statements IFRS
Notes to the consolidated financial statements continued
193
Aviva plc Annual Report and Accounts 2010
3 – Subsidiaries continued This transaction has given rise to a profit of £128 million, arising from the difference between the values of both interests prior to the exchange and their carrying values, calculated as follows: £m
Deemed consideration for existing 49.99% interests (equal to fair value of 100% of RBS Life) 727 Carrying value of RBS Collective and RBS Life prior to transaction (586) Cash consideration (3) Attributable costs (10)
Total profit on disposal and remeasurement arising from transaction (see (b) below) 128
The disposal of the Group’s interest in RBS Collective and the acquisition of a controlling stake in RBS Life are linked transactions and are therefore taken together in determining the profit arising from the restructuring, as we believe this most appropriately reflects the commercial substance of the arrangement. The fair value of RBS Life was estimated using MCEV principles and with regard to current market conditions. The estimated book and fair values of the assets and liabilities of RBS Life at the acquisition date were:
Book value
£m
Fair value and accounting
policy adjustments
£m Fair value
£m
Assets Acquired value of in-force business — 203 203 Financial investments 2,565 — 2,565 Other investments 161 — 161 Reinsurance assets 304 — 304 Receivables 58 — 58 Prepayments and accrued income 12 — 12 Cash and cash equivalents 767 — 767 Other assets 80 — 80
Total assets 3,947 203 4,150
Liabilities Insurance liabilities (1,349) — (1,349) Liabilities for investment contracts (1,905) — (1,905) Payables and other financial liabilities (60) — (60) Other liabilities (109) — (109) Total liabilities (3,423) — (3,423)
Total net assets 524 203 727
No goodwill arises from this transaction. There is no potential deferred tax on the acquired value of in-force business. As the acquisition occurred on 31 December 2010, no revenue or profit or loss has been recognised in the consolidated income statement since the acquisition date. If the acquisition had occurred on 1 January 2010, RBS Life would have contributed £188 million revenues and £56 million profit to the consolidated profit before tax.
(iii) Other goodwill arising Goodwill arising on all acquisitions, as shown in note 16(a), was £29 million, which arises on the River Road acquisition described above. There has also been a £4 million reduction in goodwill for changes in contingent consideration payable on previous acquisitions.
(iv) Unaudited pro forma combined revenues and profit Shown below are unaudited pro forma figures for combined revenues and profit as though the acquisition date for all business combinations effected during the year had been 1 January 2010, after giving effect to purchase accounting adjustments and the elimination of intercompany transactions. This pro forma financial information is not necessarily indicative of the combined results that would have been attained had the acquisitions taken place at 1 January 2010, nor is it necessarily indicative of future results.
Unaudited
2010 £m
Revenues (net earned premiums and fee income) 36,308
Profit before tax attributable to shareholders 2,455

Notes to the consolidated financial statements continued
194
Aviva plc Annual Report and Accounts 2010
3 – Subsidiaries continued (b) Disposal and remeasurement of subsidiaries, joint ventures and associates The profit on the disposal and remeasurement of subsidiaries, joint ventures and associates comprises:
2010 £m
2009 £m
United Kingdom RBS Life and RBS Collective (see (a)(ii) above) 128 — Non-core operations (see below) 4 — France (including £24 million described in note 19a) 26 — Netherlands (4) 31 Australia — 122 Other small operations 5 —
Profit on disposal and remeasurement before tax 159 153
Tax on profit on disposal and remeasurement — —
Profit on disposal and remeasurement after tax 159 153
UK non-core operations On 30 June 2010, the Group sold its wholly owned subsidiaries, RAC France SA and RAC Service Europe SA, to their executive management for a consideration of £17 million. These companies had total assets of £48 million (comprising investments of £25 million, receivables of £20 million and other assets of £3 million) and total liabilities of £36 million (insurance liabilities of £23 million and other liabilities of £13 million), giving net assets of £12 million and a profit on disposal after transaction costs of £4 million. The Group’s French subsidiary, Aviva Assurances SA, has acquired 17.5% of the shares in both companies and the profit is stated after eliminating the effect of this purchase.
(c) Assets and liabilities of operations classified as held for sale The assets and liabilities of operations classified as held for sale as at 31 December 2010 relate to a joint venture in Taiwan and are as follows:
2010
£m 2009
£m
Interest in associate 14 6 Investments and property and equipment — 26 Receivables and other financial assets — 20 Prepayments and accrued income — 1 Total assets 14 53
Gross insurance liabilities and liabilities for investment contracts — (20) Other liabilities — (13) Total liabilities — (33)
Net assets 14 20
The operations held for sale at 31 December 2009 comprised the UK non-core operations and an associate in Australia, both of which were sold in 2010.

Performance reviewCorporate responsibilityGovernanceShareholder informationFinancial statements IFRSFinancial statements MCEVOther information
Financial statements IFRS
Notes to the consolidated financial statements continued
195
Aviva plc Annual Report and Accounts 2010
4 – Segmental information The Group’s results can be segmented, either by activity or by geography. Our primary reporting format is on regional reporting lines, with supplementary information being given by business activity. This note provides segmental information on the consolidated income statement and statement of financial position.
(a) Operating segments The Group has determined its operating segments along regional lines. These reflect the management structure whereby a member of the executive management team is accountable to the group chief executive for the operating segment for which he is responsible. The activities of each operating segment are described below:
United Kingdom The United Kingdom comprises two operating segments – UK Life and UK General Insurance (UK GI). The principal activities of UK Life are life insurance, long-term health and accident insurance, savings, pensions and annuity business, whilst UK GI provides insurance cover to individuals and businesses, for risks associated mainly with motor vehicles, property and liability, such as employers’ liability and professional indemnity liability, and medical expenses. UK GI also includes the RAC motor recovery business, the Group reinsurance result and the results of run-off agency business.
Aviva Europe Activities reported in the Aviva Europe operating segment exclude operations in the UK and include those in Russia and Turkey. Principal activities are long-term business in France, Ireland, Italy, Poland and Spain, and general insurance in France, Ireland and Italy.
Delta Lloyd The activities of Delta Lloyd comprise long-term business operations in the Netherlands, Belgium and Germany and general insurance, fund management and banking operations in the Netherlands.
North America Our activities in North America principally comprise our long-term business operations in the US and general insurance business operation in Canada.
Asia Pacific Our activities in Asia Pacific principally comprise our long-term business operations in China, India, Singapore, Hong Kong, Sri Lanka, Taiwan, Malaysia, South Korea and Indonesia. 2009 comparatives also include Australia (prior to its sale on 1 October 2009).
Aviva Investors Aviva Investors operates in most of the regions in which the Group operates, in particular the UK, France, the US and Canada and other international businesses, managing policyholders’ and shareholders’ invested funds, providing investment management services for institutional pension fund mandates and managing a range of retail investment products, including investment funds, unit trusts, OEICs and ISAs. Fund management activities of Delta Lloyd are included in the separate operating segment above.
Other Group activities Investment return on centrally held assets and head office expenses, such as Group treasury and finance functions, together with certain taxes and financing costs arising on central borrowings are included in ‘Other Group activities’. Similarly, central core structural borrowings and certain tax balances are included in ‘Other Group activities’ in the segmental statement of financial position. Also included here are consolidation and elimination adjustments.
Measurement basis The accounting policies of the segments are the same as those for the Group as a whole. Any transactions between the business segments are on normal commercial terms and market conditions. The Group evaluates performance of operating segments on the basis of: (i) profit or loss from operations before tax attributable to shareholders (ii) profit or loss from operations before tax attributable to shareholders, adjusted for non-operating items outside the segment
management’s control, including investment market performance and fiscal policy changes

Notes to the consolidated financial statements continued
196
Aviva plc Annual Report and Accounts 2010
4 – Segmental information continued (i) Segmental income statement for the year ended 31 December 2010
United Kingdom Europe
Life £m
GI# £m
Aviva Europe
£m Delta Lloyd
£m
North America
£m Asia Pacific
£m
Aviva Investors
£m
Other Group
activities £m
Total £m
Gross written premiums 6,572 4,405 13,507 4,469 6,680 641 — — 36,274 Premiums ceded to reinsurers (673) (333) (452) (124) (221) (60) — — (1,863) Internal reinsurance revenue — 37 (14) (5) (16) (2) — — —
Net written premiums 5,899 4,109 13,041 4,340 6,443 579 — — 34,411 Net change in provision for unearned premiums (12) (16) (68) (2) 29 (6) — — (75)
Net earned premiums 5,887 4,093 12,973 4,338 6,472 573 — — 34,336 Fee and commission income 302 248 512 332 41 6 341 — 1,782
6,189 4,341 13,485 4,670 6,513 579 341 — 36,118 Net investment income 10,945 424 3,961 3,244 2,223 211 171 814 21,993 Inter-segment revenue — — — — — — 214 — 214 Share of profit/(loss) of joint ventures and associates 128 — (14) (10) — 33 3 (9) 131 Profit/(loss) on the disposal of subsidiaries and associates 128 5 26 (4) 1 — — 3 159
Segmental income* 17,390 4,770 17,458 7,900 8,737 823 729 808 58,615
Claims and benefits paid, net of recoveries from reinsurers (8,144) (2,829) (9,413) (4,234) (4,069) (463) — — (29,152) Change in insurance liabilities, net of reinsurance (2,923) 237 (687) (569) (3,020) (215) — — (7,177) Change in investment contract provisions (3,300) — (5,034) (48) (129) — (230) — (8,741) Change in unallocated divisible surplus (166) — 478 (33) — 50 — — 329 Amortisation of acquired value of in-force business — — (43) (12) (115) (4) — — (174) Depreciation and other amortisation expense (71) (42) (54) (37) (82) (5) (10) — (301) Other operating expenses (1,300) (1,636) (2,060) (1,226) (834) (140) (425) (1,101) (8,722) Impairment losses** — (3) — (123) (81) — — — (207) Inter-segment expenses (125) (2) (16) — (71) — — — (214) Finance costs (193) (38) (18) (723) (27) — (3) (420) (1,422)
Segmental expenses (16,222) (4,313) (16,847) (7,005) (8,428) (777) (668) (1,521) (55,781)
Profit/(loss) before tax 1,168 457 611 895 309 46 61 (713) 2,834 Tax attributable to policyholders’ returns (384) — (3) — — (7) — — (394)
Profit/(loss) before tax attributable to shareholders 784 457 608 895 309 39 61 (713) 2,440
Adjusted for non-operating items: Reclassification of corporate costs and unallocated interest 99 148 7 12 5 — 12 (283) — Investment return variances and economic assumption changes on long-term business 87 — 154 (1,010) (10) (12) — — (791) Short-term fluctuation in return on investments backing non-long-term business — (31) 47 44 (44) — — 227 243 Economic assumption changes on general insurance and health business — 60 1 — — — — — 61 Impairment of goodwill 4 — 9 1 — 1 — 9 24 Amortisation and impairment of intangibles 68 7 37 23 75 1 5 — 216 (Profit)/loss on the disposal of subsidiaries and associates (128) (5) (26) 4 (1) — — (3) (159) Integration and restructuring costs 41 35 61 18 32 2 30 24 243 Exceptional items (99) (157) — 549 10 — (11) (19) 273
Operating profit/(loss) before tax attributable to shareholders 856 514 898 536 376 31 97 (758) 2,550 * Total reported income, excluding inter-segment revenue, is split United Kingdom £22,160 million, France £8,748 million, Netherlands £7,782 million, USA £6,497 million and Rest of the World £13,214 million. Income is attributed on the basis of
geographical origin which does not materially differ from revenue by geographical destination, as most risks are located in the countries where the contracts were written. ** Impairment losses, and reversal of such losses, recognised directly in other comprehensive income were £179 million and £nil million respectively. # United Kingdom General Insurance includes the Group Reinsurance business, agency run-off business and the non-insurance business for the RAC.

Performance reviewCorporate responsibilityGovernanceShareholder informationFinancial statements IFRSFinancial statements MCEVOther information
Financial statements IFRS
Notes to the consolidated financial statements continued
197
Aviva plc Annual Report and Accounts 2010
4 – Segmental information continued (ii) Segmental income statement for the year ended 31 December 2009
United Kingdom Europe
Life £m
GI# £m
Aviva Europe
£m
Delta Lloyd
£m
North America
£m Asia Pacific
£m
Aviva Investors
£m
Other Group
activities £m
Total £m
Gross written premiums 6,086 4,239 12,936 4,482 6,413 534 — — 34,690 Premiums ceded to reinsurers (1,311) (355) (468) (134) (231) (77) — — (2,576) Internal reinsurance revenue — 28 (13) (7) (6) (2) — — —
Net written premiums 4,775 3,912 12,455 4,341 6,176 455 — — 32,114 Net change in provision for unearned premiums 2 607 (16) 6 (35) (5) — — 559
Net earned premiums 4,777 4,519 12,439 4,347 6,141 450 — — 32,673 Fee and commission income 261 272 558 226 55 121 296 — 1,789 5,038 4,791 12,997 4,573 6,196 571 296 — 34,462 Net investment income 8,199 568 10,196 3,245 2,249 586 157 (45) 25,155 Inter-segment revenue — — — — — — 202 — 202 Share of loss of joint ventures and associates (416) — (36) (41) — (11) — — (504) Profit on the disposal of subsidiaries and associates — — — 31 — 122 — — 153
Segmental income* 12,821 5,359 23,157 7,808 8,445 1,268 655 (45) 59,468
Claims and benefits paid,net of recoveries from reinsurers (7,313) (3,409) (8,871) (3,567) (4,110) (279) — — (27,549) Change in insurance liabilities, net of reinsurance 663 531 (2,321) (1,448) (2,895) (212) — — (5,682) Change in investment contract provisions (4,008) — (6,451) (239) (128) (148) (211) — (11,185) Change in unallocated divisible surplus 872 — (2,280) (68) — (71) — — (1,547) Amortisation of acquired value of in-force business (46) — (47) (3) (149) (4) — — (249) Depreciation and other amortisation expense (45) (72) (60) (35) (77) (6) (5) — (300) Other operating expenses (1,804) (1,893) (2,107) (1,248) (653) (246) (348) (306) (8,605) Impairment losses** — (42) (17) (445) (104) — — — (608) Inter-segment expenses (119) (6) (15) — (60) (1) — (1) (202) Finance costs (254) (34) (25) (745) (25) — — (436) (1,519)
Segmental expenses (12,054) (4,925) (22,194) (7,798) (8,201) (967) (564) (743) (57,446)
Profit/(loss) before tax 767 434 963 10 244 301 91 (788) 2,022 Tax attributable to policyholders’ returns (156) — (32) — — (29) — — (217)
Profit/(loss) before tax attributable to shareholders 611 434 931 10 244 272 91 (788) 1,805
Adjusted for non-operating items: Reclassification of corporate costs and unallocated interest 1 (10) 13 29 10 — 1 (44) — Investment return variances and economic assumption changes on long-term business
83
—
(194)
348
(87)
(75)
—
—
75
Short-term fluctuation in return on investments backing non-long-term business
—
(62)
(92)
23
(79)
—
—
115
(95)
Economic assumption changes on general insurance and health business
—
(55)
2
—
(4)
—
—
—
(57)
Impairment of goodwill 35 — 26 1 — — — — 62 Amortisation and impairment of intangibles 3 18 31 19 69 2 2 — 144 Profit on the disposal of subsidiaries and associates — — — (31) — (122) — — (153) Integration and restructuring costs 89 114 64 — — — 21 (2) 286 Exceptional items (163) 42 16 — 60 — — — (45)
Operating profit/(loss) before tax attributable to shareholders 659 481 797 399 213 77 115 (719) 2,022 * Total reported income, excluding inter-segment revenue, is split United Kingdom £18,256 million, France £12,890 million, Netherlands £7,808 million, USA £6,350 million and Rest of the World £13,962 million. Income is attributed on the basis
of geographical origin which does not materially differ from revenue by geographical destination, as most risks are located in the countries where the contracts were written. ** Impairment losses, and reversal of such losses, recognised directly in other comprehensive income were £482 million and £nil respectively. # United Kingdom General Insurance includes the Group Reinsurance business, agency run-off business and the non-insurance business for the RAC.

Notes to the consolidated financial statements continued
198
Aviva plc Annual Report and Accounts 2010
4 – Segmental information continued (iii) Segmental statement of financial position as at 31 December 2010
United Kingdom Europe
Life £m
GI £m
Aviva Europe
£m Delta Lloyd
£m
North America
£m Asia Pacific
£m
Aviva Investors
£m
Other Group
activities £m
Total £m
Goodwill 29 1,208 927 307 838 54 28 — 3,391 Acquired value of in-force business and intangible assets 277 241 1,072 58 1,102 16 40 — 2,806 Interests in, and loans to, joint ventures and associates 1,603 — 315 323 1 381 14 — 2,637 Property and equipment 152 90 99 236 149 7 17 — 750 Investment property 8,121 37 1,382 2,043 6 — 1,060 415 13,064 Loans 19,781 502 977 19,120 2,529 40 — 125 43,074 Financial investments 83,099 2,525 95,940 33,627 31,829 2,639 1,062 2,567 253,288 Deferred acquisition costs 1,445 628 632 188 2,518 5 — — 5,416 Other assets 14,409 3,724 17,748 3,361 2,939 446 1,164 1,890 45,681
Total assets 128,916 8,955 119,092 59,263 41,911 3,588 3,385 4,997 370,107
Insurance liabilities Long-term business and outstanding claims provisions 66,261 5,136 37,165 30,240 31,218 2,482 — — 172,502 Unearned premiums 185 2,171 1,023 336 1,098 42 — — 4,855 Other insurance liabilities — 69 111 61 100 2 — — 343 Liability for investment contracts 44,350 — 65,020 3,220 2,929 — 2,268 — 117,787 Unallocated divisible surplus 2,010 — 1,243 138 — 37 — — 3,428 Net asset value attributable to unitholders 991 — 4,231 678 — — — 3,132 9,032 External borrowings 2,796 — 127 6,574 178 — — 5,274 14,949 Other liabilities, including inter-segment liabilities 7,316 (1,823) 3,760 13,706 2,541 193 901 2,892 29,486
Total liabilities 123,909 5,553 112,680 54,953 38,064 2,756 3,169 11,298 352,382
Total equity 17,725
Total equity and liabilities 370,107
Capital expenditure (excluding business combinations) 379 11 20 88 68 6 12 — 584
External borrowings by holding companies within the Group which are not allocated to operating companies are included in ‘Other Group activities’.
(iv) Segmental statement of financial position as at 31 December 2009
United Kingdom Europe
Life £m
GI £m
Aviva Europe
£m
Delta Lloyd
£m
North America
£m Asia Pacific
£m
Aviva Investors
£m
Other Group
activities £m
Restated Total
£m
Goodwill 31 1,208 959 319 812 50 2 — 3,381 Acquired value of in-force business and intangible assets 17 249 1,190 71 1,302 19 12 — 2,860 Interests in, and loans to, joint ventures and associates 1,957 — 348 379 2 277 15 4 2,982 Property and equipment 112 127 105 282 111 5 10 1 753 Investment property 7,369 89 1,342 2,183 6 — 698 735 12,422 Loans 18,348 600 992 18,797 2,177 35 5 125 41,079 Financial investments 73,788 2,477 95,086 32,009 27,371 2,169 1,095 4,684 238,679 Deferred acquisition costs 1,313 717 732 198 2,348 8 — — 5,316 Other assets 14,942 3,847 19,169 4,364 3,030 379 654 534 46,919
Total assets 117,877 9,314 119,923 58,602 37,159 2,942 2,491 6,083 354,391
Insurance liabilities Long-term business and outstanding claims provisions 62,043 5,410 38,422 30,818 27,201 2,062 — — 165,956 Unearned premiums 173 2,240 956 347 1,040 25 — — 4,781 Other insurance liabilities — 79 116 63 98 (1) — — 355 Liability for investment contracts 39,322 — 62,477 3,335 2,911 — 1,970 — 110,015 Unallocated divisible surplus 1,849 — 1,787 150 — 80 — — 3,866 Net asset value attributable to unitholders 875 — 5,257 721 — — — 3,041 9,894 External borrowings 2,518 10 141 6,830 183 — — 5,318 15,000 Other liabilities, including inter-segment liabilities 6,668 (585) 4,282 12,529 2,450 140 320 3,634 29,438
Total liabilities 113,448 7,154 113,438 54,793 33,883 2,306 2,290 11,993 339,305
Total equity 15,086
Total equity and liabilities 354,391
Capital expenditure (excluding business combinations) 38 23 40 24 65 3 4 — 197

Performance reviewCorporate responsibilityGovernanceShareholder informationFinancial statements IFRSFinancial statements MCEVOther information
Financial statements IFRS
Notes to the consolidated financial statements continued
199
Aviva plc Annual Report and Accounts 2010
4 – Segmental information continued (b) Further analysis by products and services The Group’s results can be further analysed by products and services which comprise long-term business, general insurance and health, fund management and other activities.
Long-term business Our long-term business comprises life insurance, long-term health and accident insurance, savings, pensions and annuity business written by our life insurance subsidiaries, including managed pension fund business and our share of the other life and related business written in our associates and joint ventures, as well as lifetime mortgage business written in the UK.
General insurance and health Our general insurance and health business provides insurance cover to individuals and to small and medium-sized businesses, for risks associated mainly with motor vehicles, property and liability, such as employers’ liability and professional indemnity liability, and medical expenses.
Fund management Our fund management business invests policyholders’ and shareholders’ funds, provides investment management services for institutional pension fund mandates and manages a range of retail investment products, including investment funds, unit trusts, OEICs and ISAs. Clients include Aviva Group businesses and third-party financial institutions, pension funds, public sector organisations, investment professionals and private investors.
Other Other includes the RAC non-insurance operations, our banking businesses, service companies, head office expenses, such as Group treasury and finance functions, and certain financing costs and taxes not allocated to business segments.
(i) Segmental income statement – products and services for the year ended 31 December 2010
Long-term business
£m
General insurance
and health**
£m
Fund management
£m Other
£m Total
£m
Gross written premiums* 25,805 10,469 — — 36,274 Premiums ceded to reinsurers (1,093) (770) — — (1,863)
Net written premiums 24,712 9,699 — — 34,411 Net change in provision for unearned premiums — (75) — — (75)
Net earned premiums 24,712 9,624 — — 34,336 Fee and commission income 644 115 561 462 1,782
25,356 9,739 561 462 36,118 Net investment income 19,673 633 16 1,671 21,993 Inter-segment revenue — — 231 — 231 Share of profit/(loss) of joint ventures and associates 172 — (5) (36) 131 Profit on the disposal of subsidiaries and associates 130 1 — 28 159
Segmental income 45,331 10,373 803 2,125 58,632
Claims and benefits paid, net of recoveries from reinsurers (22,366) (6,786) — — (29,152) Change in insurance liabilities, net of reinsurance (7,611) 434 — — (7,177) Change in investment contract provisions (8,741) — — — (8,741) Change in unallocated divisible surplus 329 — — — 329 Amortisation of acquired value of in-force business (174) — — — (174) Depreciation and other amortisation expense (189) (35) (13) (64) (301) Other operating expenses (3,084) (3,182) (583) (1,873) (8,722) Impairment losses (164) (3) — (40) (207) Inter-segment expenses (221) (8) — (2) (231) Finance costs (262) (64) (43) (1,053) (1,422)
Segmental expenses (42,483) (9,644) (639) (3,032) (55,798)
Profit/(loss) before tax 2,848 729 164 (907) 2,834 Tax attributable to policyholder returns (394) — — — (394)
Profit/(loss) before tax attributable to shareholders 2,454 729 164 (907) 2,440 Adjusted for non-operating items (136) 321 37 (112) 110
Operating profit/(loss) before tax attributable to shareholders’ profits 2,318 1,050 201 (1,019) 2,550 * Gross written premiums includes inward reinsurance premiums assumed from other companies amounting to £255 million, of which £113 million relates to property and liability insurance and £142 million relates to long-term business. ** General insurance and health business segment includes gross written premiums of £942 million relating to health business. The remaining business relates to property and liability insurance.

Notes to the consolidated financial statements continued
200
Aviva plc Annual Report and Accounts 2010
4 – Segmental information continued (ii) Segmental income statement – products and services for the year ended 31 December 2009
Long-term business
£m
General insurance
and health**
£m
Fund management
£m Other
£m Total
£m
Gross written premiums* 24,722 9,968 — — 34,690 Premiums ceded to reinsurers (1,801) (775) — — (2,576)
Net written premiums 22,921 9,193 — — 32,114 Net change in provision for unearned premiums — 559 — — 559
Net earned premiums 22,921 9,752 — — 32,673 Fee and commission income 703 131 548 407 1,789
23,624 9,883 548 407 34,462 Net investment (expense)/income 23,148 1,310 10 687 25,155 Inter-segment revenue — — 189 — 189 Share of loss of joint ventures and associates (449) 2 (16) (41) (504) Profit on the disposal of subsidiaries and associates (4) — — 157 153
Segmental income 46,319 11,195 731 1,210 59,455
Claims and benefits paid, net of recoveries from reinsurers (20,442) (7,107) — — (27,549) Change in insurance liabilities, net of reinsurance (6,229) 547 — — (5,682) Change in investment contract provisions (11,185) — — — (11,185) Change in unallocated divisible surplus (1,547) — — — (1,547) Amortisation of acquired value of in-force business (249) — — — (249) Depreciation and other amortisation expense (147) (53) (7) (93) (300) Other operating expenses (3,192) (3,465) (554) (1,394) (8,605) Impairment losses (429) (85) — (94) (608) Inter-segment expenses (178) (11) — — (189) Finance costs (300) (62) (62) (1,095) (1,519)
Segmental expenses (43,898) (10,236) (623) (2,676) (57,433)
Profit/(loss) before tax 2,421 959 108 (1,466) 2,022 Tax attributable to policyholder returns (217) — — — (217)
Profit/(loss) before tax attributable to shareholders 2,204 959 108 (1,466) 1,805 Adjusted for non-operating items (317) 1 25 508 217
Operating profit/(loss) before tax attributable to shareholders’ profits 1,887 960 133 (958) 2,022 * Gross written premiums includes inward reinsurance premiums assumed from other companies amounting to £207 million, of which £51 million relates to property and liability insurance and £156 million relates to long-term business. ** General insurance and health business segment includes gross written premiums of £841 million relating to health business. The remaining business relates to property and liability insurance.
(iii) Segmental statement of financial position – products and services as at 31 December 2010
Long- term
business £m
General insurance
and health £m
Fund management
£m Other
£m Total
£m
Goodwill 1,615 459 28 1,289 3,391 Acquired value of in-force business and intangible assets 2,328 356 59 63 2,806 Interests in, and loans to, joint ventures and associates 2,630 6 — 1 2,637 Property and equipment 472 47 18 213 750 Investment property 12,490 146 — 428 13,064 Loans 28,596 664 — 13,814 43,074 Financial investments 237,659 11,481 82 4,066 253,288 Deferred acquisition costs 4,261 1,141 14 — 5,416 Other assets 34,678 7,517 1,627 1,859 45,681
Total assets 324,729 21,817 1,828 21,733 370,107
Gross insurance liabilities 160,579 17,121 — — 177,700 Gross liabilities for investment contracts 117,787 — — — 117,787 Unallocated divisible surplus 3,428 — — — 3,428 Net asset value attributable to unit holders 5,892 8 — 3,132 9,032 Borrowings 3,653 86 139 11,071 14,949 Other liabilities, including inter-segment liabilities 14,334 (1,129) 1,361 14,920 29,486
Total liabilities 305,673 16,086 1,500 29,123 352,382
Total equity 17,725
Total equity and liabilities 370,107

Performance reviewCorporate responsibilityGovernanceShareholder informationFinancial statements IFRSFinancial statements MCEVOther information
Financial statements IFRS
Notes to the consolidated financial statements continued
201
Aviva plc Annual Report and Accounts 2010
4 – Segmental information continued (iv) Segmental statement of financial position – products and services as at 31 December 2009
Long- term
business £m
General insurance
and health £m
Fund management
£m Other
£m
Restated Total
£m
Goodwill 1,616 462 2 1,301 3,381 Acquired value of in-force business and intangible assets 2,396 382 12 70 2,860 Interests in, and loans to, joint ventures and associates 2,851 5 44 82 2,982 Property and equipment 397 48 12 296 753 Investment property 11,138 191 — 1,093 12,422 Loans 26,915 769 5 13,390 41,079 Financial investments 220,660 11,548 65 6,406 238,679 Deferred acquisition costs 4,069 1,227 20 — 5,316 Other assets 38,469 7,014 523 913 46,919
Total assets 308,511 21,646 683 23,551 354,391
Gross insurance liabilities 153,628 17,464 — — 171,092 Gross liabilities for investment contracts 110,015 — — — 110,015 Unallocated divisible surplus 3,866 — — — 3,866 Net asset value attributable to unitholders 6,841 13 — 3,040 9,894 Borrowings 3,780 89 — 11,131 15,000 Other liabilities, including inter-segment liabilities 13,064 (606) 414 16,566 29,438
Total liabilities 291,194 16,960 414 30,737 339,305
Total equity 15,086
Total equity and liabilities 354,391

Notes to the consolidated financial statements continued
202
Aviva plc Annual Report and Accounts 2010
5 – Details of income This note gives further detail on the items appearing in the first section of the consolidated income statement.
2010
£m 2009
£m
Gross written premiums (note 4a & 4b) Long-term: Insurance contracts 18,315 16,692 Participating investment contracts 7,490 8,030 General insurance and health 10,469 9,968
36,274 34,690 Less: premiums ceded to reinsurers (note 4a & 4b) (1,863) (2,576) Gross change in provision for unearned premiums (note 39e) (45) 645 Reinsurers’ share of change in provision for unearned premiums (note 42c(iii)) (30) (86) Net change in provision for unearned premiums (75) 559
Net earned premiums 34,336 32,673
Fee and commission income Fee income from investment contract business 441 456 Fund management fee income 567 536 Other fee income 498 473 Reinsurance commissions receivable 127 180 Other commission income 147 138 Net change in deferred revenue 2 6
1,782 1,789
Total revenue 36,118 34,462
Net investment income Interest and similar income From financial instruments designated as trading and other than trading 6,914 7,258 From AFS investments and financial instruments at amortised cost 2,215 2,150 9,129 9,408 Dividend income 1,616 1,753 Other income from investments designated as trading Realised gains on disposals 292 693 Unrealised gains and losses (policy J) Gains/(losses) arising in the year 689 (1,184) (Gains)/losses recognised in prior periods and now realised (292) (693) 397 (1,877) 689 (1,184) Other income from investments designated as other than trading Realised gains/(losses) on disposals 1,633 (2,561) Unrealised gains and losses (see policy J) Gains arising in the year 9,192 14,481 (Gains)/losses recognised previously and now realised (1,633) 2,561 7,559 17,042 9,192 14,481 Realised gains and losses on AFS investments Gains recognised previously as unrealised in equity (see policy S and note 35) 160 310 Other gains/(losses) arising in the year — — 160 310 Net income from investment properties Rent 921 908 Expenses relating to these properties (51) (47) Realised gains on disposal 45 339 Fair value gains/(losses) on investment properties (note 21) 421 (1,084) 1,336 116 Realised gains on loans 12 24 Foreign exchange gains and losses on investments other than trading (54) 238 Other investment (expenses)/income (87) 9
Net investment income 21,993 25,155
Share of profit/(loss) after tax of joint ventures (note 18a) 149 (409) Share of loss after tax of associates (note 19a) (18) (95) Share of profit/(loss) after tax of joint ventures and associates 131 (504) Profit on disposal of subsidiaries and associates (note 3b) 159 153
Total income 58,401 59,266

Performance reviewCorporate responsibilityGovernanceShareholder informationFinancial statements IFRSFinancial statements MCEVOther information
Financial statements IFRS
Notes to the consolidated financial statements continued
203
Aviva plc Annual Report and Accounts 2010
6 – Details of expenses This note gives further detail on the items appearing in the second section of the consolidated income statement.
2010
£m 2009
£m
Claims and benefits paid Claims and benefits paid to policyholders on long-term business Insurance contracts 17,761 16,973 Participating investment contracts 5,338 4,264 Non-participating investment contracts 39 67 Claims and benefits paid to policyholders on general insurance and health business 7,194 7,444
30,332 28,748 Less: Claim recoveries from reinsurers Insurance contracts (1,030) (1,083) Participating investment contracts (150) (116)
Claims and benefits paid, net of recoveries from reinsurers 29,152 27,549
Change in insurance liabilities Change in insurance liabilities 6,270 5,755 Change in reinsurance asset for insurance provisions 907 (73)
Change in insurance liabilities, net of reinsurance 7,177 5,682
Change in investment contract provisions Investment income allocated to investment contracts 3,907 5,136 Other changes in provisions Participating investment contracts (note 40) 4,825 5,764 Non-participating investment contracts 2 (5,425) Change in reinsurance asset for investment contract provisions 7 5,710
Change in investment contract provisions 8,741 11,185
Change in unallocated divisible surplus (note 44) (329) 1,547
Fee and commission expense Acquisition costs Commission expenses for insurance and participating investment contracts 3,010 2,953 Change in deferred acquisition costs for insurance and participating investment contracts (573) (536) Deferrable costs for non-participating investment contracts 141 112 Other acquisition costs 1,276 1,137 Change in deferred acquisition costs for non-participating investment contracts (29) (31) Investment income attributable to unitholders 1,586 331 Reinsurance commissions and other fee and commission expense 456 430
5,867 4,396
Other expenses Other operating expenses Staff costs (note 10) 1,677 1,845 Central costs and sharesave schemes 144 108 Depreciation (note 20) 77 115 Impairment losses on property and equipment (note 20) 3 2 Impairment of goodwill on subsidiaries and other amounts expensed (note 16a) 3 30 Amortisation of acquired value of in-force business on insurance contracts (note 17) 174 249 Amortisation of intangible assets (note 17) 197 142 Impairment of acquired value of in-force business (note 17) — 13 Impairment of intangible assets (note 17) 21 12 Integration and restructuring costs (see below) 243 286 Exceptional items (see below) (220) 776 Other expenses 1,102 1,113
3,421 4,691
Impairments Net impairment on loans 22 53 Net impairment on financial investments 179 538 Net impairment on receivables and other financial assets 1 2 Net impairment on non-financial assets 2 (1)
204 592
Other net foreign exchange (gains)/losses (88) 83 Finance costs (note 7) 1,422 1,519
Total expenses 55,567 57,244
Certain prior year disclosures in note 6 have been amended to conform to current year presentation

Notes to the consolidated financial statements continued
204
Aviva plc Annual Report and Accounts 2010
6 – Details of expenses continued Integration and restructuring costs Integration and restructuring costs were £243 million (2009: £286 million). This includes expenditure relating to restructuring exercises across the group of £123 million, including UK restructuring costs of £53 million, £18 million in Delta Lloyd, £20 million in North America and £30 million in Aviva Investors. Expenditure relating to the Quantum Leap project in Europe amounted to £40 million and costs associated with preparing the businesses for Solvency II implementation amounted to £59 million. Costs incurred in 2009 mainly related to expenditure on cost saving programmes in the UK and Europe.
Exceptional items Exceptional items totalled £273 million net expense (2009: £45 million net income) in the year. For the year ended 31 December 2010, this comprised:
£549 million recognised in Delta Lloyd which comprises of the cost of adopting new mortality tables of £483 million, German business closure, unit-linked insurance compensation scheme costs and compensation costs in defined contribution pension schemes of £66 million
£286 million benefit from the closure of the final salary section of the UK staff pension scheme to future accruals. £10 million expense for the strengthening of reserves is in respect of several specific discontinued commercial liability risks
written in Canada a significant number of years ago. For the year ended 31 December 2009, this comprised:
A net exceptional profit before tax of £207 million as a result of the reattribution of the inherited estate (see note 45), of which £674 million was included in ‘other expenses’ and £881 million credit was included in changes in ‘unallocated divisible surplus’;
A £60 million expense for the strengthening of reserves in respect of several specific discontinued commercial liability risks written in Canada a significant number of years ago, which was included in ‘change in insurance liabilities’; and
A £102 million expense for the migration of all remaining local brands, except Delta Lloyd and RAC, to the single global Aviva brand, which was implemented over the two-year period 2008 to 2009. This cost was included in ‘other expenses’.
The table below sets out the lines of the income statement in which the exceptional items have been included:
2010
£m 2009
£m
Change in unallocated divisible surplus (note 44) — 881 Change in insurance liabilities, net of reinsurance (note 39) (493) (60) Other expenses (as in the table above) 220 (776)
(273) 45

Performance reviewCorporate responsibilityGovernanceShareholder informationFinancial statements IFRSFinancial statements MCEVOther information
Financial statements IFRS
Notes to the consolidated financial statements continued
205
Aviva plc Annual Report and Accounts 2010
7 – Finance costs This note analyses the interest costs on our borrowings (which are described in note 49) and similar charges. Finance costs comprise:
2010
£m 2009
£m
Interest expense on core structural borrowings Subordinated debt 290 293 Debenture loans 32 29 Commercial paper 1 13
323 335
Interest expense on operational borrowings Amounts owed to credit institutions 123 113 Securitised mortgage loan notes At amortised cost 67 77 At fair value 140 185 207 262
330 375
Interest on banking customer deposits 394 390 Interest on reinsurance deposits 8 12 Interest on collateral received 20 47 Net finance charge on pension schemes (notes 2a & 48e(iv)) 195 183 Other similar charges 152 177
769 809
Total finance costs 1,422 1,519

Notes to the consolidated financial statements continued
206
Aviva plc Annual Report and Accounts 2010
8 – Long-term business economic volatility The long-term nature of much of the Group’s operations means that, for management’s decision-making and internal performance management, the effects of short-term economic volatility are treated as non-operating items. The Group focuses instead on an operating profit measure that incorporates an expected return on investments supporting its long-term business. This note explains the methodology behind this.
(a) Definitions Operating profit for long-term business is based on expected investment returns on financial investments backing shareholder and policyholder funds over the reporting period, with consistent allowance for the corresponding expected movements in liabilities. Operating profit includes the effect of variance in experience for non-economic items, such as mortality, persistency and expenses, and the effect of changes in non-economic assumptions, where not treated as exceptional. In 2010, the strengthening of annuitant longevity assumptions in the Netherlands is treated as an exceptional item outside operating profit. Changes due to economic items, such as market value movements and interest rate changes, which give rise to variances between actual and expected investment returns, and the impact of changes in economic assumptions on liabilities, are disclosed separately outside operating profit.
(b) Economic volatility The investment variances and economic assumption changes excluded from the long-term business operating profit are as follows:
Long-term business
2010
£m 2009
£m
Investment variances and economic assumption changes 791 (75)
Investment variances of £791 million include £1,010 million relating to Delta Lloyd. Of this, around £800 million is due to differing movements in asset and liability yield curves while the remainder primarily relates to gains on interest rate derivatives. Liabilities in Delta Lloyd are discounted using a yield curve based on a fully collateralised AAA bond portfolio. The discount rate increased in 2010 as an increase of around 80bps in credit spreads on collateralised bonds was only partly offset by lower risk-free yields. As a result, whilst lower interest rates increased the market value of assets, this has not been offset by a corresponding movement in liabilities. The AAA collateralised bond spread movement in the year reflected the perceived risk regarding the curve’s components which include bonds issued by Spanish savings banks and a range of other European organisations. If spreads were to reduce, this would increase the insurance liabilities which may not be offset by a corresponding increase in asset values. This was partly offset by negative economic variances of £154 million in Aviva Europe, primarily from the impact of increased bond yields and credit spreads on assets in Ireland, Italy and Spain. The additional provisions for credit defaults on corporate bonds and commercial mortgages in the UK that were established in 2008 remain at consistent levels.
(c) Methodology The expected investment returns and corresponding expected movements in long-term business liabilities are calculated separately for each principal long-term business unit. The expected return on investments for both policyholders’ and shareholders’ funds is based on opening economic assumptions applied to the expected funds under management over the reporting period. Expected investment return assumptions are derived actively, based on market yields on risk-free fixed interest assets at the end of each financial year. The same margins are applied on a consistent basis across the Group to gross risk-free yields, to obtain investment return assumptions for equities and properties. Expected funds under management are equal to the opening value of funds under management, adjusted for sales and purchases during the period arising from expected operating experience. The actual investment return is affected by differences between the actual and expected funds under management and changes in asset mix, as well as movements in interest rates. To the extent that these differences arise from the operating experience of the long-term business, or management decisions to change asset mix, the effect is included in the operating profit. The residual difference between actual and expected investment return is included in investment variances, outside operating profit but included in profit before tax. The movement in liabilities included in operating profit reflects both the change in liabilities due to the expected return on investments and the impact of experience variances and assumption changes for non-economic items. The effect of differences between actual and expected economic experience on liabilities, and changes to economic assumptions used to value liabilities, are taken outside operating profit. For many types of long-term business, including unit-linked and with-profits funds, movements in asset values are offset by corresponding changes in liabilities, limiting the net impact on profit. For other long-term business the profit impact of economic volatility depends on the degree of matching of assets and liabilities, and exposure to financial options and guarantees.
(d) Assumptions The expected rate of investment return is determined using consistent assumptions between operations, having regard to local economic and market forecasts of investment return and asset classification under IFRS. The principal assumptions underlying the calculation of the expected investment return for equities and properties are:
Equities Properties
2010
% 2009
% 2010
% 2009
%
United Kingdom 7.8 7.0 6.3 5.5 Eurozone 7.2 7.3 5.7 5.8

Performance reviewCorporate responsibilityGovernanceShareholder informationFinancial statements IFRSFinancial statements MCEVOther information
Financial statements IFRS
Notes to the consolidated financial statements continued
207
Aviva plc Annual Report and Accounts 2010
8 – Long-term business economic volatility continued The expected return on equities and properties has been calculated by reference to the 10-year swap rate in the relevant currency plus an appropriate risk margin. These are the same assumptions as are used under MCEV principles to calculate the longer-term investment return for the Group’s long-term business. For fixed interest securities classified as fair value through profit or loss, the expected investment returns are based on average prospective yields for the actual assets held. Where such securities are classified as available for sale, such as in the United States, the expected investment return comprises the expected interest or dividend payments and amortisation of the premium or discount at purchase.
9 – Longer-term investment return and economic assumption changes for non-long-term business For non-long-term business, the total investment income, including realised and unrealised gains, is split between a calculated longer-term return and short-term fluctuations from this. This note gives details of the longer-term return calculation and the relevant assumptions, as well as the economic assumption changes on our general insurance and health business. (a) The short-term fluctuations in investment return and economic assumption changes attributable to the non-long-term business result and reported outside operating profit were as follows:
Non-long-term business
2010
£m 2009
£m
Short-term fluctuation in investment return (see (b) below) (243) 95 Economic assumption changes (see (g) below) (61) 57
(304) 152
(b) The longer-term investment return and short-term fluctuation are as follows:
Non-long-term business
2010
£m 2009
£m
Net investment income 719 1,373 Internal charges included under other headings 55 (193)
774 1,180
Analysed between: Longer-term investment return, reported within operating profit 1,017 1,085 Short-term fluctuation in investment return, reported outside operating profit General insurance and health (158) 218 Other operations (85) (123) (243) 95
774 1,180
(c) The longer-term investment return is calculated separately for each principal non-long-term business unit. In respect of equities and properties, the return is calculated by multiplying the opening market value of the investments, adjusted for sales and purchases during the year, by the longer-term rate of investment return. The longer-term rate of investment return is determined using consistent assumptions between operations, having regard to local economic and market forecasts of investment return. The allocated longer-term return for other investments is the actual income receivable for the year. Actual income and longer-term investment return both contain the amortisation of the discounts/premium arising on the acquisition of fixed income securities. For other operations, the longer-term return reflects interest income earned in the Netherlands bank and retail mortgage divisions. (d) The total assets supporting the general insurance and health business, which contribute towards the longer-term return, are:
2010
£m 2009
£m
Debt securities 11,404 11,649 Equity securities 918 1,239 Properties 146 200 Cash and cash equivalents 1,787 2,078 Other 4,021 3,490
Assets supporting general insurance and health business 18,276 18,656
Assets supporting other non-long-term business 1,689 2,598
Total assets supporting non-long-term business 19,965 21,254

Notes to the consolidated financial statements continued
208
Aviva plc Annual Report and Accounts 2010
9 – Longer-term investment return and economic assumption changes for non-long-term business continued The principal assumptions underlying the calculation of the longer-term investment return are:
Longer-term rates of return Equities
Longer-term rates of return Properties
2010
% 2009
% 2010
% 2009
%
United Kingdom 7.8 7.0 6.3 5.5 France 7.2 7.3 5.7 5.8 Ireland 7.2 7.3 5.7 5.8 Netherlands 7.2 7.3 5.7 5.8 Canada 7.5 6.1 6.0 4.6
The Group has applied the same economic assumptions for equities and properties as are used under MCEV principles to calculate the longer-term investment return for its non-long-term business in 2009 and 2010. (e) The table below compares the actual return on investments attributable to the non-long-term business, after deducting investment management expenses and charges, with the aggregate longer-term return over a five-year period.
2006- 2010
£m
2005- 2009
£m
Actual return attributable to shareholders 4,758 5,547 Longer-term return credited to operating results (5,760) (5,789)
Excess of longer-term returns over actual returns (1,002) (242)
(f) The table below shows the sensitivity of the Group’s non-long-term business operating profit before tax to changes in the longer-term rates of return:
Movement in investment return for By Change in 2010
£m 2009
£m
Equities 1% higher/lower Group operating profit before tax 12 11 Properties 1% higher/lower Group operating profit before tax 2 3
(g) The economic assumption changes mainly arise from movements in the rate used to discount latent claims. As explained in accounting policy K, provisions for latent claims are discounted, using rates based on the relevant swap curve, in the relevant currency at the reporting date, having regard to the duration of the expected settlement of the claims. The discount rate is set at the start of the accounting period, with any change in rates between the start and end of the accounting period being reflected below operating profit as an economic assumption change. The range of discount rates used is disclosed in note 39(c).
10 – Employee information This note shows where our staff are employed throughout the world and analyses the total staff costs. The note excludes staff employed by our joint ventures or associates.
(a) Employee numbers The number of persons employed by the Group was:
At 31
December Average for
the year
2010
Number 2009
Number 2010
Number 2009
Number
United Kingdom operations 20,762 21,663 21,166 24,068 Aviva Europe 9,797 9,741 9,506 9,755 Delta Lloyd 5,722 6,297 6,009 6,486 North America 5,212 5,247 5,296 5,498 Asia Pacific 1,738 1,599 1,593 1,595 Aviva Investors 1,386 1,311 1,267 1,313 Corporate centre 525 469 504 467
45,142 46,327 45,341 49,182

Performance reviewCorporate responsibilityGovernanceShareholder informationFinancial statements IFRSFinancial statements MCEVOther information
Financial statements IFRS
Notes to the consolidated financial statements continued
209
Aviva plc Annual Report and Accounts 2010
10 – Employee information continued (b) Staff costs Total staff costs were:
2010
£m 2009
£m
Wages and salaries 1,864 1,860 Social security costs 260 272 Post-retirement obligations Defined benefit schemes (note 48d) (175) 187 Defined contribution schemes (note 48d) 70 73 Profit sharing and incentive plans 147 135 Equity compensation plans (note 30d) 50 56 Termination benefits 23 76
2,239 2,659
The credit for the defined benefit pension schemes arises from the £286 million gain on the closure of the UK schemes to future accrual, described in note 48(c). These costs are charged within:
2010
£m 2009
£m
Acquisition costs 620 491 Claims handling expenses 234 270 Central costs and sharesave schemes (6) 53 Other operating expenses 1,677 1,845 Exceptional items (286) —
2,239 2,659
11 – Directors Information concerning individual directors’ emoluments, interests and transactions is given in the Directors’ Remuneration Report on pages 115 to 136 in the ‘Corporate governance’ section of this report. For the purposes of the disclosure required by Schedule 5 to the Companies Act 2006, the total aggregate emoluments of the directors in respect of 2010 was £6.8 million (2009: £6.7 million). Employer contributions to pensions for executive directors for qualifying periods were £136,400 (2009: £123,000). This is only for one ED as the others in the qualifying periods were not receiving any pension contributions by Aviva. The aggregate net value of share awards granted to the directors in the period was £9.510 million (2009: £5.256 million). The net value has been calculated by reference to the market price at the date of grant. During the year, no share options were exercised by directors (2009: nil).

Notes to the consolidated financial statements continued
210
Aviva plc Annual Report and Accounts 2010
12 – Auditors’ remuneration This note shows the total remuneration payable by the Group to our auditors. The total remuneration payable by the Group, excluding VAT and any overseas equivalent thereof, to its principal auditors, Ernst & Young LLP, and its associates is shown below.
2010
Audit fees
£m
Audit-related
fees £m
Tax
services £m
Other
services £m
Total fees
£m
Fees payable to Ernst & Young LLP for the statutory audit of the Aviva Group and Company financial statements 1.8 — — — 1.8 Fees payable to Ernst & Young LLP and its associates for other services to Group companies: Audit of Group subsidiaries pursuant to legislation 13.7 — — — 13.7 Additional fees related to the prior year audit of Group subsidiaries pursuant to legislation 0.6 — — — 0.6 Other services pursuant to legislation 2.5 — — — 2.5 Audit of Group pension scheme — 0.1 — — 0.1 Supplementary reporting — 1.8 — — 1.8 Tax services — — 0.1 — 0.1 All other fees:
Services relating to corporate finance transactions — — — 0.5 0.5 Other supplementary services — 3.4 — 1.1 4.5
18.6 5.3 0.1 1.6 25.6
2009
Audit fees £m
Audit-related fees
£m
Tax services
£m
Other services
£m
Total fees £m
Fees payable to Ernst & Young LLP for the statutory audit of the Aviva Group and Company financial statements 1.5 — — — 1.5 Fees payable to Ernst & Young LLP and its associates for other services to Group companies: Audit of Group subsidiaries pursuant to legislation 11.9 — — — 11.9 Additional fees related to the prior year audit of Group subsidiaries pursuant to legislation 1.5 — — — 1.5 Other services pursuant to legislation 3.0 — — — 3.0 Audit of Group pension scheme — 0.1 — — 0.1 Supplementary reporting — 2.1 — — 2.1 Tax services — — 0.1 — 0.1 All other fees:
Services relating to corporate finance transactions — 1.2 — 1.8 3.0 Other supplementary services — 7.9 — 2.9 10.8
17.9 11.3 0.1 4.7 34.0
For the first time in 2010, Audit fees includes the fees payable for attestation under Section 404 of the US Sarbanes-Oxley Act 2002. In 2009, the fees for assurance services provided in connection with the IFRS component of the Group’s Financial Reporting Control Framework were included in Other supplementary services. Fees payable for the audit of the Group’s subsidiaries pursuant to legislation include fees for the statutory audit of the subsidiaries, both inside and outside the UK, and for the work performed by Ernst & Young LLP in respect of the subsidiaries for the purpose of the consolidated financial statements of the Group. Other services pursuant to legislation comprise services in relation to statutory and regulatory filings. These include audit services for the audit of FSA returns in the UK and review of interim financial information under the Listing Rules of the UK Listing Authority. Fees for Supplementary reporting are in respect of the audit of the Group’s MCEV reporting. Although embedded value is a primary management reporting basis and our disclosures require a full audit, the relevant fees are not classified as being for statutory audit. The 2010 fees for Other supplementary services include £0.7 million (2009: £5.7 million) for assurance services in connection with the Group’s Financial Reporting Control Framework; £1.1 million (2009: £1.2 million) for examination of the Group’s Individual Capital Assessment (ICA); and £2.7 million (2009: £3.9 million) for other services, which includes £0.8 million relating to two engagements at Delta Lloyd Bank Belgium. The 2009 figures for other services included fees for work undertaken on the listing on the New York Stock Exchange and the reattribution of the inherited estate in the UK. The 2009 figure for services relating to corporate finance transactions reflected work undertaken on the partial IPO of Delta Lloyd on Euronext Amsterdam.

Performance reviewCorporate responsibilityGovernanceShareholder informationFinancial statements IFRSFinancial statements MCEVOther information
Financial statements IFRS
Notes to the consolidated financial statements continued
211
Aviva plc Annual Report and Accounts 2010
13 – Tax This note analyses the tax charge for the year and explains the factors that affect it.
(a) Tax charged/(credited) to the income statement (i) The total tax charge comprises:
2010
£m 2009
£m
Current tax For this year 590 617 Prior year adjustments (46) (164)
Total current tax 544 453
Deferred tax Origination and reversal of temporary differences 505 231 Changes in tax rates or tax laws (40) 2 Write-(back)/down of deferred tax assets (67) 21
Total deferred tax 398 254
Total tax charged to income statement (note 13d) 942 707
(ii) The Group, as a proxy for policyholders in the UK, Ireland, Singapore and Australia (prior to its disposal in 2009), is required to record taxes on investment income and gains each year. Accordingly, the tax benefit or expense attributable to UK, Irish, Singapore and Australian life insurance policyholder returns is included in the tax charge. The tax charge attributable to policyholders’ returns included in the charge above is £394 million (2009: £217 million). (iii) The tax charge can be analysed as follows:
2010
£m 2009
£m
UK tax 447 225 Overseas tax 495 482
942 707
(iv) Unrecognised tax losses and temporary differences of previous years were used to reduce current tax expense and deferred tax expense by £34 million and £88 million respectively (2009: £59 million and £10 million respectively). (v) Deferred tax charged to the income statement represents movements on the following items:
2010
£m 2009
£m
Long-term business technical provisions and other insurance items 235 (876) Deferred acquisition costs 199 261 Unrealised gains on investments 97 963 Pensions and other post-retirement obligations 50 (72) Unused losses and tax credits 117 (182) Subsidiaries, associates and joint ventures 2 12 Intangibles and additional value of in-force long-term business (114) (21) Provisions and other temporary differences (188) 169
Total deferred tax charged to income statement 398 254

Notes to the consolidated financial statements continued
212
Aviva plc Annual Report and Accounts 2010
13 – Tax continued (b) Tax charged/(credited) to other comprehensive income (i) The total tax charge comprises:
2010
£m 2009
£m
Current tax In respect of pensions and other post-retirement obligations (29) — In respect of foreign exchange movements (5) — (34) —
Deferred tax In respect of pensions and other post-retirement obligations (23) (45) In respect of fair value losses on owner-occupied properties (10) — In respect of unrealised gains on investments 179 241 146 196
Total tax charged to other comprehensive income 112 196
(ii) The tax charge attributable to policyholders’ returns included above is £nil (2009: £nil).
(c) Tax credited to equity Tax credited directly to equity in the year amounted to £17 million (2009: £17 million), and is wholly in respect of coupon payments on direct capital instruments.
(d) Tax reconciliation The tax on the Group’s profit before tax differs from the theoretical amount that would arise using the tax rate of the home country of the Company as follows:
2010
£m 2009
£m
Profit before tax 2,834 2,022
Tax calculated at standard UK corporation tax rate of 28% (2009: 28%) 794 566 Different basis of tax – policyholders 272 82 Adjustment to tax charge in respect of prior years (28) (113) Non-assessable income (93) (105) Non-taxable profit on sale of subsidiaries and associates (44) (44) Disallowable expenses 142 279 Different local basis of tax on overseas profits 95 50 Reduction in future local statutory tax rates (26) — Movement in deferred tax not recognised (156) (15) Other (14) 7
Total tax charged to income statement (note 13a) 942 707
A gradual reduction in the UK corporation tax rate from 28% to 24% over four years was announced in the Emergency Budget of 22 June 2010. The Finance (No. 2) Act 2010 enacted the first of the 1% rate reductions with effect from April 2011, the effect of which is shown in the table above. Subsequent reductions will be dealt with by future legislation. The benefit to the Group’s net assets from the further 3% reduction in the rate is estimated as approximately £90 million in total and will be recognised as the legislation is substantively enacted.
14 – Earnings per share This note shows how we calculate earnings per share, based both on the present shares in issue (the basic earnings per share) and the potential future shares in issue, including conversion of share options granted to employees (the diluted earnings per share). We have also shown the same calculations based on our operating profit as we believe this gives a better indication of operating performance.
(a) Basic earnings per share (i) The profit attributable to ordinary shareholders is:
2010
Operating profit
£m
Adjusting items
£m Total
£m
Profit before tax attributable to shareholders’ profits 2,550 (110) 2,440 Tax attributable to shareholders’ profits (625) 77 (548)
Profit for the year 1,925 (33) 1,892 Amount attributable to non-controlling interests (332) (97) (429) Cumulative preference dividends for the year (17) — (17) Coupon payments in respect of direct capital instruments (DCI) (net of tax) (42) — (42)
Profit attributable to ordinary shareholders 1,534 (130) 1,404

Performance reviewCorporate responsibilityGovernanceShareholder informationFinancial statements IFRSFinancial statements MCEVOther information
Financial statements IFRS
Notes to the consolidated financial statements continued
213
Aviva plc Annual Report and Accounts 2010
14 – Earnings per share continued
2009
Operating profit
£m
Adjusting items
£m Total
£m
Profit before tax attributable to shareholders’ profits 2,022 (217) 1,805 Tax attributable to shareholders’ profits (547) 57 (490)
Profit for the year 1,475 (160) 1,315 Amount attributable to non-controlling interests (193) (37) (230) Cumulative preference dividends for the year (17) — (17) Coupon payments in respect of direct capital instruments (DCI) (net of tax) (44) — (44)
Profit attributable to ordinary shareholders 1,221 (197) 1,024
(ii) Basic earnings per share is calculated as follows:
2010
Before tax
£m
Net of tax, non-
controlling interests,
preference dividends
and DCI £m
Per share p
Operating profit attributable to ordinary shareholders 2,550 1,534 55.1 Non-operating items: Investment return variances and economic assumption changes on long-term business (note 8) 791 243 8.7 Short-term fluctuation in return on investments backing non-long-term business (note 9a) (243) (167) (6.0) Economic assumption changes on general insurance and health business (note 9a) (61) (44) (1.6) Impairment of goodwill (note 16a) (24) (24) (0.9) Amortisation and net impairment of intangibles (note 17) (216) (128) (4.6) Profit on the disposal of subsidiaries and associates (note 3b) 159 161 5.8 Integration and restructuring costs and exceptional items (note 6) (516) (171) (6.1) Profit attributable to ordinary shareholders 2,440 1,404 50.4
2009
Before tax
£m
Net of tax, non-
controlling interests,
preference dividends and DCI
£m Per share
p
Operating profit attributable to ordinary shareholders 2,022 1,221 45.1 Non-operating items: Investment return variances and economic assumption changes on long-term business (note 8) (75) (120) (4.4) Short-term fluctuation in return on investments backing non-long-term business (note 9a) 95 158 5.8 Economic assumption changes on general insurance and health business 57 41 1.5 Impairment of goodwill and other amounts expensed (note 16a) (62) (62) (2.3) Amortisation and net impairment of intangibles (note 17) (144) (38) (1.4) Profit on the disposal of subsidiaries and associates (note 3b) 153 153 5.7 Integration and restructuring costs and exceptional items (note 6) (241) (329) (12.2)
Profit attributable to ordinary shareholders 1,805 1,024 37.8
(iii) The calculation of basic earnings per share uses a weighted average of 2,784 million (2009: 2,705 million) ordinary shares in issue, after deducting shares owned by the employee share trusts. The actual number of shares in issue at 31 December 2010 was 2,820 million (2009: 2,767 million) and 2,812 million (2009: 2,749 million) excluding shares owned by the employee share trusts.

Notes to the consolidated financial statements continued
214
Aviva plc Annual Report and Accounts 2010
14 – Earnings per share continued (b) Diluted earnings per share (i) Diluted earnings per share is calculated as follows:
2010
Total
£m
Weighted average
number of shares
m Per share
p
Profit attributable to ordinary shareholders 1,404 2,784 50.4 Dilutive effect of share awards and options — 47 (0.8)
Diluted earnings per share 1,404 2,831 49.6
2009
Total
£m
Weighted average
number of shares
m Per share
p
Profit attributable to ordinary shareholders 1,024 2,705 37.8 Dilutive effect of share awards and options — 25 (0.3)
Diluted earnings per share 1,024 2,730 37.5
(ii) Diluted earnings per share on operating profit attributable to ordinary shareholders is calculated as follows:
2010
Total
£m
Weighted average
number of shares
m Per share
p
Operating profit attributable to ordinary shareholders 1,534 2,784 55.1 Dilutive effect of share awards and options — 47 (0.9)
Diluted earnings per share 1,534 2,831 54.2
2009
Total
£m
Weighted average
number of shares
m Per share
p
Operating profit attributable to ordinary shareholders 1,221 2,705 45.1 Dilutive effect of share awards and options — 25 (0.3)
Diluted earnings per share 1,221 2,730 44.8

Performance reviewCorporate responsibilityGovernanceShareholder informationFinancial statements IFRSFinancial statements MCEVOther information
Financial statements IFRS
Notes to the consolidated financial statements continued
215
Aviva plc Annual Report and Accounts 2010
15 – Dividends and appropriations This note analyses the total dividends and other appropriations we have paid during the year. The table below does not include the final dividend proposed after the year end because it is not accrued in these financial statements. The impact of shares issued in lieu of dividends is shown separately in note 36.
2010
£m 2009
£m
Ordinary dividends declared and charged to equity in the year Final 2009 – 15.00 pence per share, paid on 17 May 2010 415 — Final 2008 – 19.91 pence per share, paid on 15 May 2009 — 527 Interim 2010 – 9.50 pence per share, paid on 17 November 2010 266 — Interim 2009 – 9.00 pence per share, paid on 17 November 2009 — 248
681 775 Preference dividends declared and charged to equity in the year 17 17 Coupon payments on direct capital instruments 59 61
757 853
Subsequent to 31 December 2010, the directors proposed a final dividend for 2010 of 16.0 pence per ordinary share (2009: 15.0 pence), amounting to £451 million (2009: £415 million) in total. Subject to approval by shareholders at the AGM, the dividend will be paid on 17 May 2011 and will be accounted for as an appropriation of retained earnings in the year ending 31 December 2011. Interest on the direct capital instruments issued in November 2004 is treated as an appropriation of retained profits and, accordingly, it is accounted for when paid. Tax relief is obtained at a rate of 28.0% (2009: 28.0%).
16 – Goodwill This note analyses the changes to the carrying amount of goodwill during the year, and details the results of our impairment testing on both goodwill and intangible assets with indefinite lives.
(a) Carrying amount
2010
£m 2009
£m
Gross amount At 1 January 3,667 3,898 Acquisitions (note 3a) 29 5 Fair value adjustments and movements in contingent consideration (4) 48 Disposals (4) (9) Amounts expensed in the year — (30) Foreign exchange rate movements (17) (245)
At 31 December 3,671 3,667
Accumulated impairment At 1 January (286) (315) Other impairment losses charged to expenses (3) — Write back of impairment related to disposals — 3 Foreign exchange rate movements 9 26
At 31 December (280) (286)
Carrying amount at 1 January 3,381 3,583
Carrying amount at 31 December 3,391 3,381
Goodwill impairment charges of £3 million have been recognised as expenses. Together with impairment charges of £9 million recognised in respect of goodwill within interests in joint ventures (note 18) and £12 million recognised in respect of goodwill within interests in associates (note 19), the total goodwill write down for the year is £24 million. Movements in contingent consideration relate to contingent consideration paid or received in respect of acquisitions of subsidiaries prior to 1 January 2010. Goodwill arising on acquisitions completed before 1 January 1998 was charged directly to reserves. Goodwill arising on the Group’s acquisition of joint ventures and associates is included within the carrying value of those investments (see notes 18 and 19).

Notes to the consolidated financial statements continued
216
Aviva plc Annual Report and Accounts 2010
16 – Goodwill continued (b) Goodwill allocation and impairment testing A summary of the goodwill and intangibles with indefinite useful lives allocated to cash-generating units is presented below.
Carrying amount of
goodwill
Carrying amount of intangibles
with indefinite useful lives (detailed in note 17) Total
2010
£m 2009
£m 2010
£m 2009
£m 2010
£m 2009
£m
United Kingdom Long-term business (see (i) below) 29 31 — — 29 31 General insurance, RAC and health (see (ii) below) 1,208 1,208 201 201 1,409 1,409 Europe France (long-term business) (see (iii) below) — — 53 55 53 55 Ireland Long-term business (see (iv) below) 118 122 — — 118 122 General insurance and health (see (v) below) 119 121 — — 119 121 Italy Long-term business (see (vi) below) 65 65 — — 65 65 General insurance and health (see (vii) below) 56 58 — — 56 58 Delta Lloyd (see (viii) below) 307 319 — — 307 319 Spain (long-term business) (see (ix) below) 556 580 — — 556 580 Other 12 15 — — 12 15 North America United States (long-term business) (see (x) below) 795 770 — — 795 770 United States (fund management) 28 — — — 28 — Canada 44 42 — — 44 42 Asia Pacific Various 54 50 — — 54 50
3,391 3,381 254 256 3,645 3,637
As explained in accounting policy N, the carrying amount of goodwill and intangible assets with indefinite useful lives is reviewed at least annually or when circumstances or events indicate there may be uncertainty over this value. The tests led to impairment of goodwill of £3 million in 2010 (2009: £nil). Goodwill and intangibles with indefinite useful lives have been tested for impairment in these businesses as follows:
United Kingdom (i) Long-term business The UK long-term business goodwill balance is split across two cash-generating units, with no individual balance exceeding £20 million. As part of the annual review of goodwill, management have considered the recoverability of the goodwill balance associated with the UK Creditor Life business. As a result of a change in the nature of products sold by that business, management have concluded that the goodwill is no longer fully recoverable and an impairment of £2 million has been recognised as an expense during the year.
(ii) General insurance, RAC and health The recoverable amount of the UK General Insurance, RAC and health business exceeds the carrying value of the cash-generating unit including goodwill. The recoverable amount of the UK general insurance, RAC and health unit has been determined based on a value in use calculation. The calculation uses cash flow projections based on business plans approved by management covering a three-year period. Cash flows beyond that three-year period have been extrapolated using a steady 2.5% growth rate and a risk-adjusted discount rate of 9.3%. This growth rate is set with regards to past experience and historical statistics of UK premium growth published by the Association of British Insurers. Key assumptions used for the calculation were:
Budgeted operating profit represents the operating profit in the business plans, approved by management, and as such reflects the best estimate of future profits based on both historical experience and expected growth rates for the relevant UK industry sectors;
Some of the assumptions that underline the budgeted operating profit include market share, customer numbers, premium rate and fee income changes, claims inflation and commission rates; and
Growth rates represent the rates used to extrapolate future cash flows beyond the business plan period and have been based upon latest information available regarding future and past growth rates, including external sources of data such as ABI Annual Market Statistics.
Europe Long-term business The recoverable amount of long-term business cash-generating units in the Europe region has been determined based on a value in use calculation. The first step of the test was to compare the carrying value of each cash-generating unit, including goodwill, to the Market Consistent Embedded Value (MCEV) of that cash-generating unit. If the MCEV is less than the carrying value of a cash generating unit the present value of profits from expected new business for that cash-generating unit is considered. If the value of profits from expected new business for a cash-generating unit is expected to grow beyond the period of the initial plan, this growth rate is set with regard to past experience in each market and market expectations of future growth in each country.

Performance reviewCorporate responsibilityGovernanceShareholder informationFinancial statements IFRSFinancial statements MCEVOther information
Financial statements IFRS
Notes to the consolidated financial statements continued
217
Aviva plc Annual Report and Accounts 2010
16 – Goodwill continued For European long-term business cash-generating units a key assumption used for the calculation was the embedded value which represents the shareholder interest in the life business and is calculated in accordance with the Market Consistent Embedded Value (MCEV) principles. The embedded value is the total of the net worth and the value of the in-force life business.
General insurance, health and other The recoverable amount of general insurance, health and other non-life cash-generating units in the Europe region has been determined based on a value in use calculation. Value in use is calculated for each cash-generating unit using a discounted cash flow projection based on business plans and growth assumptions approved by management for each cash-generating unit and discounted at a risk discount rate appropriate for each cash-generating unit. If the cash flows are expected to grow beyond the period of the initial plan, this growth rate is set with regard to past experience in each market and market expectations of future growth in each country.
(iii) France (long-term business) The recoverable amount of the indefinite life intangible asset has been assessed as part of the recoverable amount of the French long-term business cash-generating unit. The MCEV of the French long-term business was significantly greater than its carrying value, including indefinite life intangible assets.
(iv) Ireland (long-term business) The recoverable amount of the Irish long-term business exceeds the carrying value of the cash-generating unit including goodwill. This calculation is an actuarially determined appraisal value and is based on the embedded value of the business together with the present value of expected profits from future new business. Key assumptions (in addition to MCEV principles) used for the calculation were:
New business contribution represents the present value of projected future profits generated from business written in a period. This is initially based on the most recent three-year business plans approved by management;
Growth rate represents the rate used to extrapolate new business contributions beyond the business plan period, and is based on management’s estimate of no future growth in annual cash flows;
Discount rate of 5% represents the rate used to discount expected profits from future new business. The discount rate is a combination of a risk-free rate and a risk margin to make prudent allowance for the risk that experience in future years for new business may differ from that assumed. The MCEV principles applied to project future cash flows include allowance for many of the risks associated with these cash flows, and therefore these risks are not also reflected in the discount rate applied to calculate a present value of future cash flows.
(v) Ireland (general insurance and health) The recoverable amount of the Irish general insurance and health business exceeds the carrying value of the cash-generating unit including goodwill. Key assumptions used for the calculation were:
Budgeted operating profit for an initial three-year period which represents the operating profit in the business plans, approved by management and reflecting the best estimate of future profits based on both historical experience and expected growth rates for the Irish economy. The assumptions that underline the budgeted operating profit include market share, premium rate changes, claims inflation and commission rates;
Future cash flows are extrapolated beyond the three-year business plan period assuming nil growth for general insurance business and a 7% growth rate for the health business; and
A risk-adjusted discount rate of 10.8%.
(vi) Italy (long-term business) The recoverable amount of the Italian long-term business exceeds the carrying value of the cash-generating unit including goodwill. This calculation is an actuarially determined appraisal value and is based on the embedded value of the business together with the present value of expected profits from future new business. Key assumptions (in addition to MCEV principles) used for the calculation were:
New business contribution represents the present value of projected future profits generated from business written in a period. This is initially based on the most recent three-year business plans approved by management;
Growth rate represents the rate used to extrapolate new business contributions beyond the business plan period, and is based on management’s estimate of future growth of 3%; and
Discount rate of 6.5% represents the rate used to discount expected profits from future new business. The discount rate is a combination of a risk-free rate and a risk margin to make prudent allowance for the risk that experience in future years for new business may differ from that assumed. The MCEV principles applied to project future cash flows include allowance for many of the risks associated with these cash flows, and therefore these risks are not also reflected in the discount rate applied to calculate a present value of future cash flows.
(vii) Italy (non-life) The recoverable amount exceeds the carrying value of the cash-generating unit including goodwill. Key assumptions used for the calculation were:
Budgeted operating profit for an initial three-year period represents the operating profit in the most recent business plans, approved by management and as such reflects the best estimate of future profits based on both historical experience and expected growth rates for the Italian economy;
Growth rate of 3% represents the rate used to extrapolate future cash flows beyond the business plan period; and A risk-adjusted discount rate of 10.8%.

Notes to the consolidated financial statements continued
218
Aviva plc Annual Report and Accounts 2010
16 – Goodwill continued (viii) Delta Lloyd (long-term, general insurance, health and fund management) The recoverable amount of Delta Lloyd exceeds the carrying value of the cash-generating unit including goodwill. The recoverable amount of the Delta Lloyd life and general insurance and health cash-generating units has been determined on the basis of a value in use calculation. This calculation is an appraisal value and is based on the discounted expected future cash flows from the operations over their expected useful life. Expected cash flows for future periods have been obtained from the plan figures for a three-to-five-year period, depending on the management plan period of the unit. Expected cash flows for later periods have been extrapolated, taking into account the growth rate. Key assumptions used for the calculation were:
Expected cash flows for future periods have been obtained from the plan figures for a three-to-five-year period; For the year following the end of the management plan period cash flows are extrapolated at a growth rate of nil to 3.7%
depending on the particular circumstances of each unit; and Risk-adjusted discount rate of 9.9% to 10.7%, depending on management’s assessment of the specific risks of each unit,
represents the rate used to discount expected profits from future new business.
(ix) Spain (long-term business) The recoverable amount of the Spanish long-term business exceeds the carrying value of the cash-generating unit including goodwill. This calculation is an actuarially determined appraisal value and is based on the embedded value of the business together with the present value of expected profits from future new business. Key assumptions (in addition to MCEV principles) used for the calculation were:
New business contribution represents the present value of projected future profits generated from business written in a period. This is initially based on the most recent three-year business plans approved by management;
Growth rate represents the rate used to extrapolate new business contributions beyond the business plan period, and is based on management’s conservative estimate of future growth of 3%; and
Risk-adjusted discount rate of 5.6% represents the rate used to discount expected profits from future new business. The discount rate is a combination of a risk-free rate and a risk margin to make prudent allowance for the risk that experience in future years for new business may differ from that assumed. The MCEV principles applied to project future cash flows include allowance for many of the risks associated with these cash flows, and therefore these risks are not also reflected in the discount rate applied to reach a present value.
In addition to estimating the recoverable value of the Spain cash-generating unit, management have considered the terms of the contractual arrangements with bancassurance partners. Management have concluded that, under a range of reasonably possible scenarios, the contractual terms support the recoverability of the carrying value of the cash-generating unit.
(x) United States (long-term business) The recoverable amount of the United States long-term business exceeds the carrying value of the cash-generating unit including goodwill. The recoverable amount of the United States long-term cash-generating unit has been determined based on a value in use calculation. This calculation is an actuarially determined appraisal value and is based on an embedded value of the business (the total of the net worth of the life business and the value of the in-force business) together with the present value of expected profits from future new business. Key assumptions used for the calculation were:
Embedded value represents the shareholder interest in the life business and is based on projected cash flows of the business including expected investment returns;
Risk-adjusted discount rate of 8% is used to calculate the embedded value; New business contribution represents the present value of projected future profits generated from business written in a period.
This is initially based on the most recent three-year business plans approved by management; Growth rate represents the rate used to extrapolate new business contributions beyond the business plan period, and is based
on management’s estimate of future growth of 5% for life and annuity business, which is set with regard to past experience in these markets; and
Risk-adjusted discount rate of 10% represents the rate used to discount expected profits from future new business. The discount rate includes an additional margin to make prudent allowance for the risk that experience in future years for new business may differ from that assumed.
Cash flow projections To comply with paragraph 33(c) of IAS 36, cash flow projections for the period beyond the three-year plan period are extrapolated from the position in the final year of the three-year plan period. In all cases, we have assumed a positive or nil steady growth rate for subsequent years, not an increasing growth rate. The steady growth rate selected for each cash-generating unit reflects long-term expectations for the markets in which each cash-generating unit participates. Impairment tests for all cash-generating units have been performed using assumptions which management believe are reasonable. Given the magnitude of the excess of recoverable value over carrying amount in each case, management believe that it is not reasonably possible that there would be a change in the key assumptions such that the carrying amount would exceed the recoverable value.

Performance reviewCorporate responsibilityGovernanceShareholder informationFinancial statements IFRSFinancial statements MCEVOther information
Financial statements IFRS
Notes to the consolidated financial statements continued
219
Aviva plc Annual Report and Accounts 2010
17 – Acquired value of in-force business (AVIF) and intangible assets This note shows the movements in cost and amortisation of the in-force business and intangible assets acquired when we have purchased subsidiaries.
AVIF on insurance
contracts* £m
AVIF on investment
contracts** £m
Other intangible
assets with finite useful lives
(c) £m
Intangible assets with
indefinite useful
lives (a) £m
Total £m
Gross amount At 1 January 2009 3,524 216 1,224 827 5,791 Additions 17 — 30 — 47 Acquisition of subsidiaries (20) — 3 — (17) Disposals — — (33) (20) (53) Movement in shadow adjustment (484) — — — (484) Transfers — — 431 (431) — Transfers from property and equipment (note 20) — — 23 — 23 Foreign exchange rate movements (329) (17) (71) (50) (467)
At 31 December 2009 2,708 199 1,607 326 4,840 Additions — — 156 — 156 Acquisition of subsidiaries (note (b)) 88 115 31 — 234 Disposals — — (27) — (27) Liquidations (note (e)) (25) — — — (25) Movement in shadow adjustment (80) — — — (80) Transfers from property and equipment (note 20) — — 88 — 88 Foreign exchange rate movements 33 (6) (13) (3) 11
At 31 December 2010 2,724 308 1,842 323 5,197
Accumulated amortisation At 1 January 2009 (1,062) (92) (344) — (1,498) Amortisation for the year (249) (15) (127) — (391) Disposals — — 21 — 21 Transfers from property and equipment (note 20) — — (3) — (3) Foreign exchange rate movements 105 7 24 — 136
At 31 December 2009 (1,206) (100) (429) — (1,735) Amortisation for the year (174) (17) (180) — (371) Disposals — — 6 — 6 Liquidations (note (e)) 25 — — — 25 Transfers from property and equipment (note 20) — — (57) — (57) Foreign exchange rate movements (7) 4 (3) — (6)
At 31 December 2010 (1,362) (113) (663) — (2,138)
Accumulated impairment At 1 January 2009 (96) — (55) (95) (246) Disposals — — — 20 20 Impairment losses charged to expenses (13) — (12) — (25) Foreign exchange rate movements 1 — — 5 6
At 31 December 2009 (108) — (67) (70) (245) Disposals — — 12 — 12 Impairment losses charged to expenses (note (d)) — — (21) — (21) Foreign exchange rate movements — — — 1 1
At 31 December 2010 (108) — (76) (69) (253)
Carrying amount At 1 January 2009 2,366 124 825 732 4,047 At 31 December 2009 1,394 99 1,111 256 2,860
At 31 December 2010 1,254 195 1,103 254 2,806 * On insurance and participating investment contracts. ** On non-participating investment contracts.
(a) Intangible assets with indefinite useful lives comprise the RAC brand, and the value of the Union Financière de France Banque
distribution channel, where the existing lives of the assets and their competitive position in, and the stability of, their respective markets support this classification. Impairment testing of these intangibles is covered in note 16(b).
(b) The acquisitions of AVIF relating to insurance contracts and investment contracts arise from the acquisition of the RBS Life assurance business (see note 3(a)). The other acquired intangible asset of £31 million arises from the acquisition of the River Road US asset management business and represents the value of existing customer relationships (see note 3(a)).
(c) Other intangible assets with finite useful lives consist primarily of the value of bancassurance and other distribution agreements. (d) Impairment losses arise from a management review of the recoverability of intangible computer software assets. As a result,
impairment charges were recognised in North America (£9 million), Aviva Europe (£7 million) and Delta Lloyd (£5 million). (e) During 2010, the Group’s subsidiary London & Edinburgh Life Assurance Limited was dissolved. As a result, the fully amortised
AVIF balance relating to this entity has been derecognised.

Notes to the consolidated financial statements continued
220
Aviva plc Annual Report and Accounts 2010
18 – Interests in, and loans to, joint ventures In several business units, Group companies and other parties jointly control certain entities. This note analyses these interests and describes the principal joint ventures in which we are involved.
(a) Carrying amount (i) The movements in the carrying amount comprised:
Goodwill and
intangibles £m
Equity interests
£m Loans
£m Total
£m
At 1 January 2009 223 1,217 297 1,737
Share of results before tax — (398) — (398) Share of tax — (4) — (4) Share of results after tax — (402) — (402) Amortisation and impairment of goodwill and intangibles1 (7) — — (7) Share of loss after tax (7) (402) — (409) Acquisitions and additions — 415 145 560 Disposals and reduction in Group interests — (59) — (59) Fair value losses taken to other comprehensive income — 8 — 8 Loans repaid — — (99) (99) Foreign exchange rate movements (14) (7) (16) (37) At 31 December 2009 202 1,172 327 1,701
Share of results before tax — 180 — 180 Share of tax — (15) — (15) Share of results after tax — 165 — 165 Impairment of goodwill (9) — — (9) Amortisation of intangibles1 (7) — — (7) Share of profit/loss after tax (16) 165 — 149 Acquisitions and additions — 225 64 289 Disposals and reduction in Group interests — (130) — (130) Fair value gains taken to other comprehensive income — 1 — 1 Loans repaid — — (5) (5) Foreign exchange rate movements 1 13 (11) 3
At 31 December 2010 187 1,446 375 2,008
Less: Amounts classified as held for sale — (14) — (14)
187 1,432 375 1,994 1. Comprises amortisation of AVIF on insurance contracts of £2 million (2009: £3 million) and other intangibles of £5 million (2009: £4 million).
During the year the Group’s Taiwan joint venture, First-Aviva Life Insurance Co., Ltd., was classified as held for sale following the decision of management to seek to dispose of the business. The disposal is expected to be completed within 12 months. On classification as held for sale, the business was re-measured at fair value less costs to sell, and an impairment of £9 million was recognised within the income statement as a component of share of profit after tax of joint ventures and associates. Acquisitions, additions, disposals and reductions in Group interests relate to property management undertakings. The Group’s principal interests in property management joint ventures are listed below. (ii) The balances at 31 December comprised:
2010
Goodwill and
intangibles £m
Equity interests
£m Loans
£m Total
£m
Property management undertakings — 1,195 375 1,570 Long-term business undertakings 187 246 — 433 General insurance undertakings — 5 — 5
Total 187 1,446 375 2,008
2009
Goodwill and
intangibles £m
Equity interests
£m Loans
£m Total
£m
Property management undertakings — 1,021 327 1,348 Long-term business undertakings 202 146 — 348 General insurance undertakings — 5 — 5
Total 202 1,172 327 1,701
The loans are not secured and no guarantees were received in respect thereof. They are interest-bearing and are repayable on termination of the relevant partnership.

Performance reviewCorporate responsibilityGovernanceShareholder informationFinancial statements IFRSFinancial statements MCEVOther information
Financial statements IFRS
Notes to the consolidated financial statements continued
221
Aviva plc Annual Report and Accounts 2010
18 – Interests in, and loans to, joint ventures continued (b) Property management undertakings The principal joint ventures are as follows: Company GP proportion held PLP proportion held
Airport Property Partnership 50.0% 50.0% Ashtenne Industrial Fund Limited Partnership 67.7% 37.4% The Mall Limited Partnership 50.0% 50.5% Queensgate Limited Partnership 50.0% 50.0% Quercus Healthcare Property Partnership Limited 50.0% 29.3% The Southgate Limited Partnership 50.0% 50.0% 20 Gracechurch Street Limited Partnership 50.0% 50.0%
All the above entities perform property ownership and management activities, and are incorporated and operate in the United Kingdom. All these investments are held by subsidiary entities.
(c) Long-term business undertakings The principal joint ventures are as follows:
Company Class of share Proportion held
Country of incorporation and
operation
Aviva-COFCO Life Insurance Co. Limited Ordinary shares of RMB1 each 50.0% China AvivaSA Emeklilik ve Hayat A.S. Ordinary shares of YTL1 each 49.8% Turkey CIMB Aviva Assurance Berhad Ordinary shares of RM1 each 49.0% Malaysia CIMB Aviva Takaful Berhad Ordinary shares of RM1 each 49.0% Malaysia First-Aviva Life Insurance Co., Ltd. Ordinary shares of NT$10 each 49.0% Taiwan Woori Aviva Life insurance Co. Ltd Ordinary shares of KRW 5000 each 47.3% Korea
All investments in the above companies are unlisted and are held by subsidiaries except for the shares in Aviva-COFCO Life Insurance Co. Limited, which are held by the Company. The Group’s share of net assets of that company is £115 million (2009: £55 million) and have a fair value of £115 million (2009: £72 million).
(d) Impairment testing All interests in joint ventures have been tested for impairment but the only material items are detailed below.
(i) CIMB Aviva Assurance Berhad and CIMB Aviva Takaful Berhad The Group’s investments in CIMB Aviva Assurance Berhad and CIMB Aviva Takaful Berhad have been tested for impairment by comparing their carrying values (which include goodwill which arose on their acquisition) with their recoverable amounts. The recoverable amounts for both the investments have been determined based on value in use calculations. This calculation is an actuarially determined appraisal value and is based on the embedded value of the business together with the present value of expected profits from future new business. The recoverable amounts exceed the carrying values of both the investments. Key assumptions used for the calculation were:
Cash flow projections based on: (i) the policy portfolio expected at the valuation date; and (ii) the future sales based on plans approved by management covering the subsequent three-year period. The cash flows from the
existing policy portfolio are calculated using best estimate assumptions, which have been supported by experience investigations where available and prudent estimates typical for the market where experience investigations are not available;
The embedded value for existing business was derived using risk free rates; The value in use was derived as the sum of embedded value of existing business and the new business contribution in each
future year discounted using a risk adjusted discount rate of 13.8%; and New sales beyond the three-year period have been extrapolated using a growth rate of 10%.
CIMB Aviva Assurance Berhad and CIMB Aviva Takaful Berhad are developing businesses and the recoverability of value is reliant on future projected growth being achieved. These projections are inherently uncertain and dependent on local economic conditions.

Notes to the consolidated financial statements continued
222
Aviva plc Annual Report and Accounts 2010
18 – Interests in, and loans to, joint ventures continued (ii) AvivaSA Emeklilik ve Hayat A.S. The Group’s investment in AvivaSA Emeklilik ve Hayat A.S. has been tested for impairment by comparing its carrying value (which includes goodwill which arose on its acquisition) with its recoverable amount. The recoverable amount has been determined based on a value in use calculation. This calculation is an actuarially determined appraisal value and is based on the embedded value of the business together with the present value of expected profits from future new business. The recoverable amount exceeds the carrying value of the cash-generating unit including goodwill. Key assumptions used for the calculation were:
Embedded value represents the shareholder interest in the life business and is calculated in accordance with the Market Consistent Embedded Value (MCEV) principles. The embedded value is the total of the net worth of the life business and the value of the in-force business.
New business contribution represents the present value of projected future distributable profits generated from business written in a period. This is initially based on the most recent three-year business plans approved by management.
Growth rate represents the rate used to extrapolate new business contributions beyond the business plan period, and is based on management’s estimate of future growth of 3%.
Risk adjusted discount rate of 16.5% represents the rate used to discount expected profits from future new business. The discount rate reflects a risk margin to make prudent allowance for the risk that experience in future years for new business may differ from that assumed.
(iii) Woori Aviva Life insurance Co. Ltd The Group’s investment in Woori Aviva Life Insurance Co. Ltd has been tested for impairment by comparing its carrying value (which includes goodwill which arose on its acquisition) with its recoverable amount. The recoverable amount has been determined based on a value in use calculation. This calculation is an actuarially determined appraisal value and is based on the embedded value of the business together with the present value of expected profits from future new business. The recoverable amount exceeds the carrying values of the investments. Key assumptions used for the calculation were:
Cash flow projections based on: (i) the policy portfolio reported at the valuation date; and
(ii) the future sales based on plans approved by management covering the subsequent three-year period. The cash flows from the existing policy portfolio are calculated using best estimate assumptions, which have been supported by experience investigations where available and prudent estimates typical for the market where experience investigations are not available;
The embedded value for existing business was derived using risk free rates; The value in use was derived as the sum of embedded value of existing business and the new business contribution in each
future year discounted using a risk adjusted discount rate of 14.6%; and New sales beyond the three-year period have been extrapolated using a growth rate of 8%.
Woori Aviva Life Insurance Co. Ltd is a developing business and the recoverability of value is reliant on future projected growth being achieved. These projections are inherently uncertain and dependent on local economic conditions.
(e) Additional information Summarised aggregate financial information on the Group’s interests in its joint ventures is as follows:
2010
£m 2009
£m
Income, including unrealised gains/(losses) on investments 910 (105) Expenses (730) (293)
Share of results before tax 180 (398)
Long-term assets 1,914 2,885 Current assets 2,359 645
Share of total assets 4,273 3,530
Long-term liabilities (1,466) (1,982) Current liabilities (1,361) (376)
Share of total liabilities (2,827) (2,358)
Share of net assets 1,446 1,172
The joint ventures have no significant contingent liabilities to which the Group is exposed, nor has the Group any significant contingent liabilities in relation to its interests in them.

Performance reviewCorporate responsibilityGovernanceShareholder informationFinancial statements IFRSFinancial statements MCEVOther information
Financial statements IFRS
Notes to the consolidated financial statements continued
223
Aviva plc Annual Report and Accounts 2010
19 – Interests in, and loans to, associates This note analyses our interests in entities which we do not control but where we have significant influence.
(a) Carrying amount
Goodwill and
intangibles £m
Equity interests
£m Loans
£m Total
£m
At 1 January 2009 454 789 3 1,246
Share of results before tax — (53) — (53) Share of tax — (1) — (1)
Share of results after tax — (54) — (54) Impairment of goodwill and intangibles1 (32) — — (32) Amortisation of acquired value of in-force business (9) — — (9)
Share of loss after tax (41) (54) — (95) Acquisitions and additions — 175 — 175 Disposals (26) (7) — (33) Fair value gains taken to other comprehensive income — 114 — 114 Dividends received — (22) — (22) Reclassification from investment in subsidiaries — (68) — (68) Foreign exchange rate movements (2) (34) — (36)
Movements in carrying amount (69) 104 — 35
At 31 December 2009 385 893 3 1,281
Share of results before tax — 16 — 16 Share of tax — (4) — (4) Share of results after tax — 12 — 12 Impairment of goodwill and intangibles1 (22) — — (22) Amortisation of acquired value of in-force business (8) — — (8) Share of profit/loss after tax (30) 12 — (18) Acquisitions and additions 32 91 — 123 Disposals (305) (317) (2) (624) Fair value losses taken to other comprehensive income — (27) — (27) Dividends received — (63) — (63) Reclassification to financial investments — (9) — (9) Foreign exchange rate movements (2) (17) (1) (20) Movements in carrying amount (305) (330) (3) (638)
At 31 December 2010 80 563 — 643 1. Includes impairment of £10 million in other intangibles (2009: £1 million).
Additions relate to the Group’s Netherlands and India associates. On 17 February 2010, the Group sold its 35% holding in Sogessur SA to that company’s main shareholder, Société Générale, for a consideration of £35 million, realising a profit on disposal of £24 million. On 31 December 2010, the Group sold its 49.99% holding in RBSG Collective Investments Limited to that company’s main shareholder, RBS Group plc. In addition the Group acquired RBS Group plc’s shareholding in RBS Life Investments Limited, resulting in the Group gaining control of that entity and it therefore ceasing to be an associate (see note 3(a)). Other disposals relate to the Group’s Netherlands associates.
(b) Principal associates The principal associates included above are:
Company Type of business Class of share Proportion held
Country of incorporation and
operation
Aviva Life Insurance Company India Limited Insurance Ordinary shares of RS1 each 26.0% India Banca Network Investimenti SpA Product distribution Ordinary shares of €1 each 49.99% Italy Cyrte Fund I CV Investment fund Partnership share 22.31% Netherlands Cyrte Fund II BV Investment fund Ordinary shares of €1 each 10.48% Netherlands Cyrte Fund III CV Investment fund Partnership share 28.82% Netherlands
All investments in principal associates are unlisted and are held by subsidiaries.

Notes to the consolidated financial statements continued
224
Aviva plc Annual Report and Accounts 2010
19 – Interests in, and loans to, associates continued Although the Group’s holding in one of the three Cyrte funds is less than 20%, it has significant influence through ownership of the fund manager, Cyrte Investments BV, a subsidiary of which acts as general partner to the funds, and through membership of its investment committee. The Group’s Dutch subsidiary owns 30.6% of the shares, and depositary receipts for shares, in Van Lanschot NV, a financial services company in the Netherlands. The Group is not able to appoint management representation on the board of this company and is therefore unable to exert significant influence over its affairs. Accordingly, this investment is treated as a financial investment rather than as an associate.
(c) Additional information Summarised aggregate financial information on the Group’s interests in its associates is as follows:
2010
£m 2009
£m
Share of revenues 163 216
Share of results before tax 16 (53)
Share of assets 803 3,013 Share of liabilities (240) (2,120)
Share of net assets 563 893
The associates have no significant contingent liabilities to which the Group is exposed, nor has the Group any significant contingent liabilities in relation to its interest in them.
(d) Impairment testing All interests in associates have been tested for impairment but the only material items are detailed below.
(i) Aviva Life Insurance Company India Limited The Group’s investment in Aviva Life Insurance Company India Limited has been tested for impairment by comparing its carrying value (which includes goodwill which arose on their acquisition) with its recoverable amount. The recoverable amount has been determined based on a value in use calculation. This calculation is an actuarially determined appraisal value and is based on the embedded value of the business together with the present value of expected profits from future new business. The recoverable amount exceeds the carrying value of the investment. Key assumptions used for the calculation were:
Cash flow projections based on (i) the policy portfolio existing at the valuation date; and (ii) the future sales based on plans approved by management covering the subsequent three-year period. The cash flows from the
existing policy portfolio are calculated using best estimate assumptions, which have been supported by experience investigations where available and prudent estimates typical for the market where experience investigations are not available;
The embedded values for existing business was derived using risk free rates; The value in use was derived as the sum of embedded value of existing business and the new business contribution in each
future year discounted using a risk adjusted discount rate of 17.3%; and New sales beyond the three-year period have been extrapolated using a growth rate of 14% for seven years and 10%
thereafter. Aviva Life Insurance Company India Limited is a developing business and the recoverability of value is reliant on future projected growth being achieved. In addition local regulatory changes have resulted in changes to the types of product that can be sold. The growth projections are inherently uncertain and dependent on local economic and regulatory conditions.
(ii) Banca Network Investimenti SpA A review of strategy by the owners of Banca Network Investimenti SpA has significantly changed the future business plans and nature of the activities of this associate. As a result of this change in the prospects of the associate, management no longer believe that its carrying value is fully recoverable. This has generated an impairment of £20 million. Other impairments arise from UK long-term business intermediary associates.

Performance reviewCorporate responsibilityGovernanceShareholder informationFinancial statements IFRSFinancial statements MCEVOther information
Financial statements IFRS
Notes to the consolidated financial statements continued
225
Aviva plc Annual Report and Accounts 2010
20 – Property and equipment This note analyses our tangible fixed assets, which are primarily properties occupied by Group companies and computer equipment.
Properties under
construction £m
Owner- occupied
properties £m
Motor vehicles
£m
Computer equipment
£m Other assets
£m Total
£m
Cost or valuation At 1 January 2009 61 573 14 876 605 2,129 Additions 62 11 — 40 36 149 Disposals (7) (49) (2) (82) (196) (336) Transfers to investment property (note 21) (16) (47) — — — (63) Transfers to intangibles (note 17) — — — (23) — (23) Fair value losses (see below) — (33) — — — (33) Foreign exchange rate movements (6) (35) (2) (14) (18) (75)
At 31 December 2009 94 420 10 797 427 1,748 Additions 122 19 1 25 58 225 Disposals (5) (35) (2) (27) (52) (121) Transfers (to)/from investment property (note 21) (1) 2 — — — 1 Transfers to Intangibles (note 17) — — — (69) (19) (88) Transfers (87) 87 — — — — Fair value gains/(losses) — (42) — — — (42) Foreign exchange rate movements 3 (11) — (3) (5) (16)
At 31 December 2010 126 440 9 723 409 1,707
Depreciation and impairment At 1 January 2009 — (5) (8) (675) (375) (1,063) Charge for the year — (1) (1) (76) (37) (115) Disposals — 2 1 60 92 155 Transfers to intangibles (note 17) — — — 3 — 3 Transfers — — — (1) — (1) Impairment losses charged to restructuring costs — — — (1) (1) (2) Foreign exchange rate movements — — 1 13 15 29
At 31 December 2009 — (4) (7) (677) (306) (994) Charge for the year — — (1) (47) (29) (77) Disposals — 4 — 22 22 48 Transfers to intangibles (note 17) — — — 57 — 57 Impairment losses charged to restructuring costs — — — — (3) (3) Foreign exchange rate movements — — 1 5 6 12
At 31 December 2010 — — (7) (640) (310) (957)
Carrying amount At 31 December 2009 94 416 3 120 121 754 Less: Amounts classified as held for sale: — — — — (1) (1)
94 416 3 120 120 753
At 31 December 2010 126 440 2 83 99 750
Fair value losses of £46 million (2009: £26 million) have been charged to other comprehensive income, with the net reversal of losses previously charged to the income statement now being credited there. Owner-occupied properties are stated at their revalued amounts, as assessed by qualified external valuers or by local qualified staff of the Group in overseas operations, all with recent relevant experience. These values are assessed in accordance with the relevant parts of the current RICS Appraisal and Valuation Standards in the UK, and with current local valuation practices in other countries. This assessment, on the basis of Existing Use Value and in accordance with UK Practice Statement 1.3, is the estimated amount for which a property should exchange on the date of valuation between a willing buyer and a willing seller in an arm’s-length transaction, after proper marketing wherein the parties had acted knowledgeably, prudently and without compulsion, assuming that the buyer is granted vacant possession of all parts of the property required by the business and disregarding potential alternative uses. The valuation assessment adopts market-based evidence and is in line with guidance from the International Valuation Standards Committee and the requirements of IAS 16, Property, Plant and Equipment. If owner-occupied properties were stated on a historical cost basis, the carrying amount would be £347 million (2009:£328 million). The Group has no material finance leases for property and equipment.

Notes to the consolidated financial statements continued
226
Aviva plc Annual Report and Accounts 2010
21 – Investment property This note gives details of the properties we hold for long-term rental yields or capital appreciation.
Freehold
£m Leasehold
£m Total
£m
Carrying value At 1 January 2009 12,501 1,925 14,426 Additions 319 49 368 Capitalised expenditure on existing properties 64 9 73 Fair value losses (917) (167) (1,084) Disposals (785) (143) (928) Transfers from property and equipment (note 20) 28 35 63 Foreign exchange rate movements (453) (35) (488)
At 31 December 2009 10,757 1,673 12,430 Less: Amounts classified as held for sale — (8) (8)
10,757 1,665 12,422
At 1 January 2010 10,757 1,673 12,430 Additions 800 278 1,078 Capitalised expenditure on existing properties 35 13 48 Fair value gains 336 85 421 Disposals (610) (215) (825) Transfers (to)/from property and equipment (note 20) (2) 1 (1) Foreign exchange rate movements (75) (12) (87)
At 31 December 2010 11,241 1,823 13,064
Investment properties are stated at their market values as assessed by qualified external valuers or by local qualified staff of the Group in overseas operations, all with recent relevant experience. Values are calculated using a discounted cash flow approach and are based on current rental income plus anticipated uplifts at the next rent review, assuming no future growth in rental income. This uplift and the discount rate are derived from rates implied by recent market transactions on similar properties. The fair value of investment properties leased to third parties under operating leases at 31 December 2010 was £12,924 million (2009: £11,750 million). Future contractual aggregate minimum lease rentals receivable under the non-cancellable portion of these leases are given in note 53(b)(i).

Performance reviewCorporate responsibilityGovernanceShareholder informationFinancial statements IFRSFinancial statements MCEVOther information
Financial statements IFRS
Notes to the consolidated financial statements continued
227
Aviva plc Annual Report and Accounts 2010
22 – Fair value methodology This note explains the methodology for valuing our financial assets and liabilities carried at fair value, and provides an analysis of these according to a ‘fair value hierarchy’, determined by the market observability of valuation inputs.
(a) Basis for determining fair value hierarchy of financial instruments For financial assets and liabilities carried at fair value, we have categorised the measurement basis into a ‘fair value hierarchy’ as follows:
Quoted market prices in active markets – (‘Level 1’) Inputs to Level 1 fair values are quoted prices (unadjusted) in active markets for identical assets and liabilities. An active market is one in which transactions for the asset or liability occur with sufficient frequency and volume to provide pricing information on an ongoing basis. Examples are listed equities in active markets, listed debt securities in active markets and quoted unit trusts in active markets.
Modelled with significant observable market inputs – (‘Level 2’) Inputs to Level 2 fair values are inputs other than quoted prices included within Level 1 that are observable for the asset or liability, either directly or indirectly. If the asset or liability has a specified (contractual) term, a Level 2 input must be observable for substantially the full term of the instrument. Level 2 inputs include the following:
Quoted prices for similar (i.e. not identical) assets and liabilities in active markets. Quoted prices for identical or similar assets and liabilities in markets that are not active, the prices are not current, or price
quotations vary substantially either over time or among market makers, or in which little information is released publicly. Inputs other than quoted prices that are observable for the asset or liability (for example, interest rates and yield curves
observable at commonly quoted intervals, volatilities, prepayment spreads, loss severities, credit risks, and default rates). Inputs that are derived principally from, or corroborated by, observable market data by correlation or other means (market-
corroborated inputs). Examples of these are securities measured using discounted cash flow models based on market observable swap yields, and listed debt or equity securities in a market that is inactive. Valuations, whether sourced from internal models or third parties incorporate credit risk by adjusting the spread above the yield curve for government treasury securities for the appropriate amount of credit risk for each issuer, based on observed market transactions. To the extent observed market spreads are either not used in valuing a security, or do not fully reflect liquidity risk, our valuation methodology, whether sourced from internal models or third parties, reflects a liquidity premium. Where we use broker quotes and no information as to the observability of inputs is provided by the broker, we generally validate the price quoted by the broker by using internal models with observable inputs. When the price obtained from the broker and internal model are similar, we look to the inputs used in our internal model to understand the observability of the inputs used by the broker. In circumstances where internal models are not used to validate broker prices, and the observability of inputs used by brokers is unavailable, the investment is classified as Level 3. Broker quotes are usually non-binding.
Modelled with significant unobservable market inputs – (‘Level 3’) Inputs to Level 3 fair values are unobservable inputs for the asset or liability. Unobservable inputs may have been used to measure fair value to the extent that observable inputs are not available, thereby allowing for situations in which there is little, if any, market activity for the asset or liability at the measurement date (or market information for the inputs to any valuation models). As such, unobservable inputs reflect the assumptions the business unit considers that market participants would use in pricing the asset or liability. Examples are certain private equity investments and private placements. The majority of the Group’s financial assets and certain financial liabilities are valued based on quoted market information or observable market data. A small percentage (4.5%) of total financial assets recorded at fair value are based on estimates and recorded as Level 3 investments. Where estimates are used, these are based on a combination of independent third-party evidence and internally developed models, calibrated to market observable data where possible. Third-party valuations using significant unobservable inputs validated against Level 2 internally modelled valuations are classified as Level 3, where there is a significant difference between the third-party price and the internally modelled value. Where the difference is insignificant, the instrument would be classified as Level 2.

Notes to the consolidated financial statements continued
228
Aviva plc Annual Report and Accounts 2010
22 – Fair value methodology continued (b) Fair value hierarchy analysis An analysis of financial assets and liabilities according to fair value hierarchy is given below:
2010
Fair value hierarchy
Level 1
£m Level 2
£m Level 3
£m
Sub-total fair value
£m
Amortised cost £m
Less: Assets of
operations classified as
held for sale £m
Statement of financial
position Total
£m
Financial investments and loans (notes 25 and 23) Loans — 21,028 — 21,028 22,046 — 43,074 Fixed maturity securities 116,577 42,196 8,709 167,482 — — 167,482 Equity securities 43,455 4,649 972 49,076 — — 49,076 Other investments (including derivatives) 29,982 4,080 2,668 36,730 — — 36,730
Total 190,014 71,953 12,349 274,316 22,046 — 296,362
Financial liabilities Non-participating investments contracts (note 40) 44,795 1,131 199 46,125 2,180 — 48,305 Borrowings (note 49) 2,305 2,385 — 4,690 10,259 — 14,949 Derivative liabilities (note 50) 147 2,226 9 2,382 — — 2,382
Total 47,247 5,742 208 53,197 12,439 — 65,636
Discussion on the valuation techniques applied to value financial liabilities carried at fair value is included in the relevant footnote disclosure for the financial liability. For the year to 31 December 2010, transfers of financial assets from fair value hierarchy Level 1 to Level 2 amounted to £517 million (2009: £886 million), and from Level 2 to Level 1 amounted to £289 million (2009: £2,181 million). The transfers arose as a result of changes in the level of activity in the markets from which prices are sourced, as well as changes in the pricing sources used in France to value certain financial investments. The latter has not given rise to a change in pricing methodology. For the year to 31 December 2010, there were no transfers of financial liabilities between fair value hierarchy levels except for the transfer of £2,305 million securitised borrowings in our business in the Netherlands, which have moved from Level 2 to Level 1 as a result of increased market activity.
2009
Fair value hierarchy
Level 1
£m Level 2
£m Level 3
£m
Sub-total fair value
£m
Amortised cost £m
Less: Assets of
operations classified as
held for sale £m
Statement of financial position
Total £m
Financial investments and loans (notes 23 and 25) Loans — 20,890 — 20,890 20,189 — 41,079 Fixed maturity securities 116,026 36,592 9,139 161,757 — — 161,757 Equity securities 38,809 5,775 843 45,427 — — 45,427 Other investments (including derivatives) 26,240 3,950 1,328 31,518 — (23) 31,495
Total 181,075 67,207 11,310 259,592 20,189 (23) 279,758
Financial liabilities Non-participating investments contracts (note 40) 39,924 1,203 162 41,289 2,167 — 43,456 Borrowings (note 49) — 5,108 — 5,108 9,892 — 15,000 Derivative liabilities (note 50) 117 1,968 14 2,099 — — 2,099
Total 40,041 8,279 176 48,496 12,059 — 60,555
Following a review of the Group’s investment classifications, comparative amounts in the table above for debt and equity securities and other investments have been amended from amounts previously reported, reflecting the fact that equity and debt securities held indirectly through majority owned consolidated mutual funds in France managed by third parties, which in 2009 were presented as unit trusts and other investment vehicles within other investments, are now presented as debt and equity securities. The effect is to increase equity and debt securities by £2,085 million and £1,247 million respectively and decrease unit trusts and other investment vehicles within other investments by £3,332 million. Except for £50 million equity securities considered Level 3, which were previously treated as Level 1 when classified as other investments, there is no effect on the fair value hierarchy as a result of the change in presentation.

Performance reviewCorporate responsibilityGovernanceShareholder informationFinancial statements IFRSFinancial statements MCEVOther information
Financial statements IFRS
Notes to the consolidated financial statements continued
229
Aviva plc Annual Report and Accounts 2010
22 – Fair value methodology continued (c) Further information on Level 3 financial instruments (i) The tables below show movements in the Level 3 financial assets and liabilities measured at fair value.
2010
Fixed maturity
securities £m
Equity securities
£m
Other invest-ments
£m
Financial investments
Total £m
Financial liabilities
Total £m
Total funds Balance at 1 January 9,139 844 1,327 11,310 176 Total net gains or losses recognised in the income statement 64 6 177 247 — Total net gains or losses recognised in other comprehensive income 73 50 — 123 — Purchases 1,279 11 1,031 2,321 — Issuances — — — — 31 Disposals (636) (75) (140) (851) (5) Transfers into Level 3 300 165 289 754 — Transfers out of Level 3 (1,296) (3) (2) (1,301) — Foreign exchange rate movements (214) (26) (14) (254) 6
Balance at 31 December 8,709 972 2,668 12,349 208
2009
Fixed maturity
securities £m
Equity securities
£m
Other invest-ments
£m
Financial investments
Total £m
Financial liabilities
Total £m
Total funds Balance at 1 January 1,850 981 64 2,895 182 Total net gains or losses recognised in the income statement 2 (55) 1 (52) 1 Total net gains or losses recognised in other comprehensive income 107 1 (4) 104 — Purchases 820 117 104 1,041 — Issuances — — — — 12 Disposals (247) (133) (5) (385) — Settlements — (73) — (73) — Transfers into Level 3 7,659 134 1,186 8,979 — Transfers out of Level 3 (923) (54) (19) (996) — Foreign exchange rate movements (129) (74) — (203) (19)
Balance at 31 December 9,139 844 1,327 11,310 176
The Group assesses the fair value hierarchy of its financial investments biannually at 30 June and 31 December. Transfers between fair value hierarchy levels are deemed to have occurred at the assessment date. Transfers into and out of Level 3 arose for the following reasons:
Changes in the market observability of valuation inputs. Changes in the market observability of inputs used to validate valuations. Significant differences between third-party prices used for valuations and validation prices either sourced from third parties or
internal models. The principal transfers out of Level 3 in 2010, are:
The transfer of £0.65 billion Italian structured bonds, which were classified as Level 3 in 2009 because of significant differences between the third-party counterparty price used to value the bonds and the internal model valuation using observable market inputs, which was used to validate the counterparty price. Except for £55 million of structured bonds, which remain in Level 3, the third-party and internal-modelled valuations have not shown any significant differences on a monthly basis since January 2010. Consequently the bonds have been transferred to Level 2.
The transfer of £0.31 billion debt securities in our UK business, for which either new valuation models have been developed or there has been sufficient market activity in observable inputs to justify a Level 2 classification.
The transfers into Level 3 in 2010 are spread across our businesses in the UK, Italy, US, the Netherlands and France and across a number of asset classes, with no single business or asset class predominating. There are a variety of reasons for these transfers including insufficient market activity in valuation inputs, greater transparency of valuation inputs from third-party pricing sources and open investment funds becoming closed. Of the £247 million net gains (2009: £52 million net losses) recognised in the income statement during the year, £252 million gain (2009: £2 million gain) relates to net investment income and £5 million loss (2009: £54 million loss) relating to impairments is included in other expenses.

Notes to the consolidated financial statements continued
230
Aviva plc Annual Report and Accounts 2010
22 – Fair value methodology continued (ii) The principal investments classified as Level 3, and the valuation techniques applied to them, are:
Structured bond-type products held by our businesses in France and Italy amounting to £6.49 billion and £0.06 billion respectively, for which there is no active market. These bonds are valued either using third-party counterparty or broker quotes. These bonds are validated against internal or third-party models. Most of these bonds have been classified as Level 3 because either (i) the third-party models included a significant unobservable liquidity adjustment or (ii) differences between the valuation provided by the counterparty and broker quotes and the validation model were sufficiently significant to result in a Level 3 classification. At 31 December 2010, the counterparty and broker quotes used to value these products were less than the modelled valuations.
Notes issued by loan partnerships held by our UK Life business amounting to £1.2 billion, for which there is no active market. These are valued using counterparty quotes, corroborated against the prices of selected similar securities. In 2010, there were insufficient market observable transactions in the selected securities to provide a reliable proxy price to corroborate the counterparty price. In addition, our UK Life business owns part of the residual equity interest in these loan partnerships valued at £0.2 billion according to net asset values, which are not considered market observable, resulting in a Level 3 classification.
Private equity investment funds amounting to £1.4 billion, of which £0.9 billion is held by our UK business. In valuing our interest in these funds, we rely on investment valuation reports received from the fund manager, making adjustments for items such as subsequent draw-downs and distributions between the date of the report and the balance sheet date and the fund manager’s carried interest. In addition, an indexation adjustment is made to reflect changes in appropriate equity market indices between the valuation report date and balance sheet date.
External hedge funds held principally by businesses in the UK, US and France amounting to £1.1 billion. Valuations received from fund managers are based on net asset values. However, insufficient information is provided on the underlying fund assets to support a classification other than Level 3.
Certain direct private equity investments and private placements held by our business in the Netherlands and strategic interests in banking partners held by our Italian business amounting to £0.9 billion. Valuations are based on third-party independent appraisals, or where internally modelled, transactions in similar entities, discounted cash flow techniques and valuation multiples, using public and internal management information.
Other Level 3 investments amount to £1.0 billion and relate to a diverse range of different types of securities held by a number of businesses throughout the Group.
(iii) Where possible, the Group tests the sensitivity of the fair values of Level 3 investments to changes in unobservable inputs to reasonable alternatives. 95% (2009: 91%) of valuations for Level 3 investments are sourced from independent third parties and, where appropriate, validated against internally-modelled valuations, third-party models or broker quotes. Where third-party pricing sources are unwilling to provide a sensitivity analysis for their valuations, the Group undertakes, where feasible, sensitivity analysis on the following basis:
For third-party valuations validated against internally-modelled valuations using significant unobservable inputs, the sensitivity of the internally modelled valuation to changes in unobservable inputs to a reasonable alternative is determined.
For third-party valuations either not validated or validated against a third-party model or broker quote, the third-party valuation in its entirety is considered an unobservable input. Sensitivities are determined by flexing to a reasonable alternative the yield, NAV multiple, IRR or other suitable valuation multiples of the financial instrument implied by the third-party valuation. For example, for a fixed income security the implied yield would be the rate of return which discounts the security’s contractual cash flows to equal the third-party valuation.
On the basis of the methodology outlined above, the Group is able to perform sensitivity analysis for £4.5 billion of the Group’s Level 3 investments. For these Level 3 investments, changing unobservable valuation inputs to a reasonable alternative would result in a change in fair value in the range of £367 million positive impact and £366 million adverse impact. Of the £7.9 billion Level 3 investments for which sensitivity analysis is not provided, £0.1 billion and £7.2 billion relate to investments held in unit-linked and participating funds respectively in Spain and France. For these products investment risk is predominantly borne by policyholders, and therefore shareholder profit before tax is insensitive to reasonable changes in fair value of these investments. Level 3 investments backing non-linked shareholder-backed business, for which no sensitivity analysis is provided, amounts to only £0.6 billion. A 10% change in valuation of these investments would reduce shareholder profit before tax by £64 million. For the year ended 31 December 2009, we reported that changing one or more unobservable inputs to a reasonable alternative would not have had a significant impact on the fair value of financial investments carried at fair value.

Performance reviewCorporate responsibilityGovernanceShareholder informationFinancial statements IFRSFinancial statements MCEVOther information
Financial statements IFRS
Notes to the consolidated financial statements continued
231
Aviva plc Annual Report and Accounts 2010
23 – Loans This note analyses the loans our Group companies have made, the majority of which are mortgage loans.
(a) Carrying amounts The carrying amounts of loans at 31 December 2009 and 2010 were as follows:
2010 2009
At fair value
through profit
or loss other than
trading £m
At amortised
cost £m
Total £m
At fair value
through profit
or loss other than
trading £m
At amortised
cost £m
Total £m
Policy loans 180 1,574 1,754 214 1,655 1,869 Loans to banks — 5,683 5,683 — 5,339 5,339 Securitised mortgage loans (see note 24) UK 1,912 — 1,912 1,840 — 1,840 Netherlands 5,249 1,155 6,404 5,544 1,770 7,314 7,161 1,155 8,316 7,384 1,770 9,154 Non-securitised mortgage loans 13,687 9,750 23,437 13,292 8,012 21,304 Loans and advances to bank customers — 2,023 2,023 — 1,943 1,943 Loans to brokers and other intermediaries — 100 100 — 92 92 Other loans — 1,761 1,761 — 1,378 1,378
Total 21,028 22,046 43,074 20,890 20,189 41,079
Loans to banks include cash collateral received under stock lending arrangements (see note 25(d)). The obligation to repay this collateral is included in payables and other financial liabilities (note 50). Of the above loans, £35,581 million (2009: £33,241 million) is expected to be recovered more than one year after the statement of financial position date.
Loans at fair value Fair values have been calculated by discounting the future cash flows using appropriate current interest rates for each portfolio of mortgages. Further details of the fair value methodology are given in note 22. The change in fair value of these loans during the year, attributable to a change in credit risk, was a loss of £85 million (2009: £338 million gain). The cumulative change attributable to changes in credit risk to 31 December 2010 was a loss of £400 million (2009: £315 million loss).
Loans at amortised cost The fair value of these loans at 31 December 2010 was £21,784 million (2009: £19,786 million).
(b) Analysis of loans carried at amortised cost
2010 2009
Amortised cost £m
Impairment £m
Carrying value
£m
Amortised cost £m
Impairment £m
Carrying value
£m
Policy loans 1,574 — 1,574 1,655 — 1,655 Loans to banks 5,683 — 5,683 5,339 — 5,339 Securitised mortgage loans 1,156 (1) 1,155 1,771 (1) 1,770 Non-securitised mortgage loans 9,846 (96) 9,750 8,115 (103) 8,012 Loans and advances to bank customers 2,064 (41) 2,023 1,986 (43) 1,943 Loans to brokers and other intermediaries 100 — 100 92 — 92 Other loans 1,764 (3) 1,761 1,379 (1) 1,378
Total 22,187 (141) 22,046 20,337 (148) 20,189
The movements in the impairment provisions on these loans for the years ended 31 December 2009 and 2010 were as follows:
2010
£m 2009
£m
At 1 January (148) (122) Increase during the year (28) (58) Write back following sale or reimbursement 17 17 Write back following recovery in value 6 5 Other movements 11 2 Foreign exchange movements 1 8
At 31 December (141) (148)

Notes to the consolidated financial statements continued
232
Aviva plc Annual Report and Accounts 2010
23 – Loans continued (b) Collateral The Group holds collateral in respect of loans where it is considered appropriate, in order to reduce the risk of non-recovery. This collateral generally takes the form of liens or charges over properties and, in the case of policy loans, the underlying policy, for the majority of the loan balances above. In all other situations, the collateral must be in a readily realisable form, such as listed securities, and is held in segregated accounts. Transfer of title for the collateral received always occurs in such cases, although no market risk or benefit is taken. In the event of a default, the Group is able to sell or repledge the collateral. The amount of collateral received with respect to loans which the Group is permitted to sell or repledge in the absence of default was £4,542 million (2009: £3,685 million). No collateral was actually sold or repledged in the absence of default during the year (2009: £nil).
24 – Securitised mortgages and related assets The Group has loans receivable, secured by mortgages, which have then been securitised through non-recourse borrowings, in our UK Life and Dutch businesses. This note gives details of the relevant transactions.
(a) Description of arrangements (i) United Kingdom In a long-term business subsidiary, Aviva Equity Release UK Limited (AER), the beneficial interest in certain portfolios of lifetime mortgages has been transferred to five special purpose securitisation companies (the ERF companies), in return for initial consideration and, at later dates, deferred consideration. The deferred consideration represents receipts accrued within the ERF companies after meeting all their obligations to the note holders, loan providers and other third parties in the priority of payments. The purchases of the mortgages were funded by the issue of fixed and floating rate notes by the ERF companies. All the shares in the ERF companies are held by independent companies, whose shares are held on trust. Although AER does not own, directly or indirectly, any of the share capital of the ERF companies or their parent companies, it retains control of the majority of the residual or ownership risks and rewards related to the assets of the securitisation companies, and they have therefore been treated as subsidiaries in the consolidated financial statements. AER has no right to repurchase the benefit of any of the securitised mortgage loans, other than in certain circumstances where AER is in breach of warranty or loans are substituted in order to effect a further advance. AER has purchased subordinated notes and granted subordinated loans to some of the ERF companies. These have been eliminated on consolidation through offset against the borrowings of the ERF companies in the consolidated statement of financial position.
(ii) Delta Lloyd In three subsidiaries, Delta Lloyd Levensverzekering NV (DLL), Amstelhuys NV (AMS), and Delta Lloyd Bank (Belgium) NV/SA (DLB), the principal benefits of certain portfolios of mortgage loans have been transferred to a number of special purpose securitisation companies, which were funded primarily through the issue of fixed and floating rate notes. All the shares in the securitisation companies are held by independent trustee companies. Although DLL, AMS and DLB do not own, directly or indirectly, any of the share capital of the securitisation companies or their parent companies, they retain control of the majority of the residual or ownership risks and rewards related to the assets of the securitisation companies, and these companies have therefore been treated as subsidiaries in the consolidated financial statements. DLL, AMS and DLB have no right, nor any obligation, to repurchase the benefit of any of the securitised mortgage loans before the optional call date, other than in certain circumstances where they are in breach of warranty. Delta Lloyd companies have purchased notes in the securitisation companies, which have been eliminated on consolidation through offset against the borrowings of the securitisation companies in the consolidated statement of financial position.
(iii) General In all of the above transactions, the Company and its subsidiaries are not obliged to support any losses that may be suffered by the note holders and do not intend to provide such support. Additionally, the notes were issued on the basis that note holders are only entitled to obtain payment, of both principal and interest, to the extent that the available resources of the respective special purpose securitisation companies, including funds due from customers in respect of the securitised loans, are sufficient and that note holders have no recourse whatsoever to other companies in the Aviva Group.

Performance reviewCorporate responsibilityGovernanceShareholder informationFinancial statements IFRSFinancial statements MCEVOther information
Financial statements IFRS
Notes to the consolidated financial statements continued
233
Aviva plc Annual Report and Accounts 2010
24 – Securitised mortgages and related assets continued (b) Carrying values The following table summarises the securitisation arrangements:
2010 2009
Securitised assets
£m
Securitised borrowings
£m
Securitised assets
£m
Securitised borrowings
£m
UK Securitised mortgage loans At fair value (note 23) 1,912 (1,464) 1,840 (1,444) Other securitisation assets/(liabilities) 130 (578) — (396)
2,042 (2,042) 1,840 (1,840)
Delta Lloyd Securitised mortgage loans At fair value (note 23) 5,249 (4,216) 5,544 (4,441) At amortised cost (note 23) 1,155 (1,924) 1,770 (2,656)
6,404 (6,140) 7,314 (7,097) Other securitisation assets/(liabilities) — (264) — (217)
6,404 (6,404) 7,314 (7,314)
Loan notes held by third parties are as follows:
2010 2009
UK £m
Delta Lloyd
£m
UK £m
Delta Lloyd £m
Total loan notes issued, as above 1,464 6,140 1,444 7,097 Less: Loan notes held by Group companies (176) (1,095) — (1,212)
Loan notes held by third parties (note 49c) 1,288 5,045 1,444 5,885
Of the total UK commercial mortgage loans, £215 million (2009: £46 million) relates to primary healthcare and PFI businesses and is secured against General Practitioner premises, other primary health-related premises or schools leased to government bodies. For all such loans, government support is provided through reimbursement of rental payments to the tenants to meet income service and provide for the debt to be reduced substantially over the term of the loan. Although the loan principal is not government-guaranteed, the nature of these businesses and premises provides considerable comfort of an ongoing business model and low risk of default.

Notes to the consolidated financial statements continued
234
Aviva plc Annual Report and Accounts 2010
25 – Financial investments This note analyses our financial investments by type and shows their cost and fair value. These will change from one period to the next as a result of new business written, claims paid and market movements.
(a) Carrying amount Financial investments comprise:
2010 2009
At fair value through
profit or loss At fair value through
profit or loss
Trading
£m
Other than trading
£m
Available for sale £m
Total £m
Trading
£m
Other than trading
£m
Available for sale £m
Total £m
Fixed maturity securities Debt securities UK government — 17,447 — 17,447 — 21,423 — 21,423 UK local authorities — 16 — 16 — 16 — 16 Non-UK government 11 47,843 2,666 50,520 11 45,655 1,810 47,476 Corporate bonds Public utilities — 5,849 2,518 8,367 — 5,997 633 6,630 Other corporate 6 61,988 17,123 79,117 (28) 55,254 15,364 70,590 Convertibles and bonds with warrants attached — 583 — 583 — 586 — 586 Other 14 3,614 4,928 8,556 36 6,870 5,065 11,971
31 137,340 27,235 164,606 19 135,801 22,872 158,692 Certificates of deposit 80 2,590 24 2,694 — 2,802 8 2,810 Redeemable preference shares — 178 4 182 — 255 — 255
111 140,108 27,263 167,482 19 138,858 22,880 161,757
Equity securities Ordinary shares Public utilities — 4,108 — 4,108 — 3,665 15 3,680 Banks, trusts and insurance companies 7 6,708 907 7,622 — 6,458 831 7,289 Industrial miscellaneous and all other 31 34,102 2,566 36,699 8 31,668 2,540 34,216
38 44,918 3,473 48,429 8 41,791 3,386 45,185 Non-redeemable preference shares — 260 387 647 — 125 117 242
38 45,178 3,860 49,076 8 41,916 3,503 45,427
Other investments Unit trusts and other investment vehicles 12 32,202 306 32,520 — 27,064 119 27,183 Derivative financial instruments (note 58b) 2,274 — — 2,274 2,078 — — 2,078 Deposits with credit institutions 73 485 — 558 88 881 — 969 Minority holdings in property management undertakings — 664 — 664 — 667 — 667 Other investments – long-term — 660 52 712 — 617 4 621 Other investments – short-term — 2 — 2 — — — —
2,359 34,013 358 36,730 2,166 29,229 123 31,518
Total financial investments Less assets classified as held for sale Fixed maturity securities — — — — — — — — Equity securities — — — — — — — — Other investments — — — — (23) — — (23) — — — — (23) — — (23)
2,508 219,299 31,481 253,288 2,170 210,003 26,506 238,679
Of the above total, £153,470 million (2009: £174,292 million) is expected to be recovered more than one year after the statement of financial position date. Other debt securities of £8,556 million (2009: £11,971 million) primarily include residential and commercial mortgage-backed securities, as well as other structured credit securities. Following a review of the Group’s investment classifications, comparative amounts for equity securities and other investments have been amended from amounts previously reported, reflecting the fact that equity and debt securities held indirectly through majority owned consolidated mutual funds in France managed by third parties, which in 2009 were presented as unit trusts and other investment vehicles within other investments, are now presented as debt and equity securities. The effect is to increase equity and debt securities by £2,085 million and £1,247 million and decrease unit trusts and other investment vehicles within other investments by £3,332 million.

Performance reviewCorporate responsibilityGovernanceShareholder informationFinancial statements IFRSFinancial statements MCEVOther information
Financial statements IFRS
Notes to the consolidated financial statements continued
235
Aviva plc Annual Report and Accounts 2010
25 – Financial investments continued (b) Cost, unrealised gains and fair value The following is a summary of the cost/amortised cost, gross unrealised gains and losses and fair value of financial investments:
2010
Cost/ amortised
cost £m
Unrealised gains
£m
Unrealised losses and
impairments £m
Fair value £m
Fixed maturity securities 164,266 7,507 (4,291) 167,482 Equity securities 44,878 7,186 (2,988) 49,076 Other investments Unit trusts and specialised investment vehicles 30,455 2,478 (413) 32,520 Derivative financial instruments 1,517 774 (17) 2,274 Deposits with credit institutions 558 — — 558 Minority holdings in property management undertakings 669 121 (126) 664 Other long-term investments 756 18 (62) 712 Other short-term investment 2 — — 2
243,101 18,084 (7,897) 253,288
These are further analysed as follows: At fair value through profit or loss 212,714 15,626 (6,533) 221,807 Available for sale 30,387 2,458 (1,364) 31,481
243,101 18,084 (7,897) 253,288
2009
Cost/ amortised
cost £m
Unrealised gains
£m
Unrealised losses and
impairments £m
Fair value £m
Fixed maturity securities 160,572 5,872 (4,687) 161,757 Equity securities 46,479 4,173 (5,225) 45,427 Other investments Unit trusts and specialised investment vehicles 26,653 784 (254) 27,183 Derivative financial instruments 1,519 896 (337) 2,078 Deposits with credit institutions 969 — — 969 Minority holdings in property management undertakings 635 69 (37) 667 Other long-term investments 729 191 (299) 621
237,556 11,985 (10,839) 238,702
These are further analysed as follows: At fair value through profit or loss 210,635 10,506 (8,945) 212,196 Available for sale 26,921 1,479 (1,894) 26,506
237,556 11,985 (10,839) 238,702
All unrealised gains and losses and impairments on financial investments classified as fair value through profit or loss have been recognised in the income statement. Unrealised gains and losses on financial investments classified as at fair value through profit or loss recognised in the income statement in the year were a net gain of £7,956 million (2009: £15,165 million net gain). Of this, £397 million net gain (2009: £1,877 million net loss) related to financial investments designated as trading and £7,559 million net gain (2009: £17,042 million net gain) related to investments designated as other than trading. The movement in the unrealised gain/loss position reported in the statement of financial position during the year, shown in the table above, includes foreign exchange movements on the translation of unrealised gains and losses on financial investments held by foreign subsidiaries, which are recognised in other comprehensive income, as well as transfers due to the realisation of gains and losses on disposal and the recognition of impairment losses. Total impairments of financial investments classified as available for sale in the income statement in the year, disclosed in note 6, were £179 million (2009: £538 million). The total accumulated impairment provision for financial investments classified as available-for-sale included in the table above within unrealised losses and impairments was £983 million (2009: £1,060 million). Movements in this provision are shown in section (c) below. At 31 December 2010, £1.0 billion of shareholder holdings in debt securities represent exposures to the governments (and local authorities and agencies) of Greece, Ireland, Portugal and Spain.

Notes to the consolidated financial statements continued
236
Aviva plc Annual Report and Accounts 2010
25 – Financial investments continued (c) Impairment of financial investments The movements in impairment provisions on available-for-sale financial investments for the years ended 31 December 2009 and 2010 were as follows:
Fixed maturity
securities £m
Equity securities
£m
Other investments
£m Total
£m
At 1 January 2009 (225) (1,036) — (1,261) Increase for the year charged to the income statement (93) (384) (5) (482) Write back following sale or reimbursement 174 401 — 575 Foreign exchange rate movements 25 85 (2) 108
At 31 December 2009 (119) (934) (7) (1,060) Increase for the year charged to the income statement (79) (100) — (179) Write back following sale or reimbursement 48 175 — 223 Write back following recovery in value 1 1 — 2 Foreign exchange rate movements (2) 33 — 31
At 31 December 2010 (151) (825) (7) (983)
(d) Financial investment arrangements (i) Stock lending arrangements The Group has entered into stock lending arrangements in the UK and overseas in accordance with established market conventions. The majority of the Group’s stock lending transactions occurs in the UK, where investments are lent to EEA-regulated, locally domiciled counterparties and governed by agreements written under English law. It is not the Group’s practice to enter into stock lending or repurchase agreements which result in the derecognition of financial assets from our balance sheet. Financial assets subject to such agreements are sold to be repurchased at a fixed price, usually market price on execution, or loaned for a fee. The Group therefore retains exposure to the market risks of the transferred securities. Because, as transferor, we have retained substantially all the risks and rewards of ownership of the transferred securities, they remain on balance sheet. The Group receives collateral in order to reduce the credit risk of these arrangements. Collateral must be in a readily realisable form, such as listed securities, and is held in segregated accounts. Transfer of title always occurs for collateral received, although no market risk or economic benefit is taken. The level of collateral held is monitored regularly, with further collateral obtained where this is considered necessary to manage the Group’s risk exposure. In certain markets, the Group or the Group’s appointed stock lending managers obtain legal ownership of the collateral received and can re-pledge it as collateral elsewhere or sell outright in the absence of default. The carrying amount of financial assets received in this manner at 31 December 2010 was £15,858 million (2009: £16,909 million). The value of collateral that was actually sold in the absence of default was £nil (2009: £nil). In addition to the above, the Group has received and pledged cash collateral under stock lending arrangements that has been recognised in the statement of financial position with a corresponding obligation or receivable for its return. These latter balances are shown in notes 50 and 26 respectively.
(ii) Stock repurchase arrangements Included within financial investments are £853 million (2009: £664 million) of debt securities and other fixed income securities which have been sold under stock repurchase arrangements. The obligations arising under these arrangements are shown in note 50.
(iii) Other arrangements In carrying on its bulk purchase annuity business, the Group’s UK Life operation is required to place certain investments in trust on behalf of the policyholders. Amounts become payable from the trust funds to the trustees if the Group were to be in breach of its payment obligations in respect of policyholder benefits. At 31 December 2010, £910 million (2009: £703 million) of financial investments were restricted in this way. Certain financial investments are also required to be deposited under local laws in various overseas countries as security for the holders of policies issued in those countries. Other investments are pledged as security collateral for bank letters of credit.

Performance reviewCorporate responsibilityGovernanceShareholder informationFinancial statements IFRSFinancial statements MCEVOther information
Financial statements IFRS
Notes to the consolidated financial statements continued
237
Aviva plc Annual Report and Accounts 2010
26 – Receivables This note analyses our total receivables.
2010
£m 2009
£m
Amounts owed by contract holders 1,965 2,435 Amounts owed by intermediaries 1,414 1,216 Deposits with ceding undertakings 1,459 1,670 Amounts due from reinsurers 500 680 Amounts due from brokers for investment sales 269 232 Amounts receivable for collateral pledged (notes 25d and 58c) 15 15 Reimbursements due from government health insurance 388 141 Corporate owned life insurance 153 146 Dividends receivable 86 76 Finance lease receivables 175 162 Other banking assets 248 273 Other receivables 1,623 2,606
Total 8,295 9,652 Less: Amounts classified as held for sale — (20)
8,295 9,632
Expected to be recovered in less than one year 7,095 8,985 Expected to be recovered in more than one year 1,200 647
8,295 9,632
Concentrations of credit risk with respect to receivables are limited due to the size and spread of the Group’s trading base. No further credit risk provision is therefore required in excess of the normal provision for doubtful receivables.
27 – Deferred acquisition costs and other assets This note shows the products on which we are deferring some of our acquisition costs and details the movements in the balance during the year.
(a) Carrying amount The carrying amount comprises:
2010
£m 2009
£m
Deferred acquisition costs in respect of: Insurance contracts – Long-term business 3,148 2,952 Insurance contracts – General insurance and health business 1,141 1,227 Participating investment contracts – Long-term business 35 85 Non-participating investment contracts – Long-term business 1,078 1,032 Retail fund management business 14 20
Total deferred acquisition costs 5,416 5,316 Surpluses in the staff pension schemes (note 48(e)(vii)) 524 — Other assets 132 305
Total 6,072 5,621
Deferred acquisition costs on long-term business are generally recoverable in more than one year whereas such costs on general insurance and health business are generally recoverable within one year after the statement of financial position date. Surpluses in the staff pension schemes are recoverable more than one year after the statement of financial position date.

Notes to the consolidated financial statements continued
238
Aviva plc Annual Report and Accounts 2010
27 – Deferred acquisition costs and other assets continued (b) Movements in the year The movements in deferred acquisition costs during the year were:
2010
Long-term business
£m
General insurance
and health business
£m
Retail fund manage-
ment business
£m Total
£m
Carrying amount at 1 January 4,069 1,227 20 5,316 Acquisition costs deferred during the year 1,167 2,283 6 3,456 Amortisation (582) (2,369) (12) (2,963) Impact of assumption changes 58 — — 58 Effect of portfolio transfers, acquisitions and disposals 80 — — 80 Foreign exchange rate movements 39 13 — 52 Shadow adjustment (570) — — (570) Other — (13) — (13)
Carrying amount at 31 December 4,261 1,141 14 5,416
2009
Long-term business
£m
General insurance
and health business
£m
Retail fund manage-
ment business
£m Total
£m
Carrying amount at 1 January 4,455 1,489 22 5,966 Acquisition costs deferred during the year 1,123 2,209 8 3,340 Amortisation (468) (2,464) (9) (2,941) Impact of assumption changes 94 — (1) 93 Effect of portfolio transfers, acquisitions and disposals (40) — — (40) Foreign exchange rate movements (338) (7) — (345) Shadow adjustment (757) — — (757)
Carrying amount at 31 December 4,069 1,227 20 5,316
The level of capitalised acquisition costs for new long-term business increased by £44 million in 2010, reflecting higher new business in the United States. The amortisation increased by £114 million in 2010, mainly in the United States where DAC balances, and the amortisation thereof, are increasing, driven by the growing volumes of business. Where amortisation of the DAC balance depends on projected profits, changes to economic conditions may lead to a movement in the DAC balance and a corresponding impact on profit. It is estimated that the movement in DAC balance would reduce profit by £115 million if market yields on fixed income investments were to increase by 1% and increase profit by £125 million if yields were to reduce by 1%. The shadow adjustments relate to deferred acquisition costs on business in the United States backed by investments classified as available for sale. As explained in accounting policy K, unrealised gains and losses on the AFS investments and the shadow adjustments above are both recognised directly in other comprehensive income.
(c) Other assets Other assets include £1 million (2009: £1 million) that is expected to be recovered more than one year after the statement of financial position date.
(d) Prepayments and accrued income Prepayments and accrued income of £3,691 million (2009: £3,604 million), include £172 million (2009: £148 million) that is expected to be recovered more than one year after the statement of financial position date.

Performance reviewCorporate responsibilityGovernanceShareholder informationFinancial statements IFRSFinancial statements MCEVOther information
Financial statements IFRS
Notes to the consolidated financial statements continued
239
Aviva plc Annual Report and Accounts 2010
28 – Assets held to cover linked liabilities Certain unit-linked products have been classified as investment contracts, while some are included within the definition of an insurance contract. The assets backing these unit-linked liabilities are included within the relevant balances in the consolidated statement of financial position, while the liabilities are included within insurance and investment contract provisions. This note analyses the carrying values of assets backing these liabilities. The carrying values of assets backing unit-linked liabilities are as follows:
2010
£m 2009
£m
Loans 35 917 Debt securities 16,150 16,381 Equity securities 31,441 28,638 Other investments 31,846 29,659 Reinsurance assets 1,215 986 Cash and cash equivalents 4,772 4,214
85,459 80,795
As described in note 39(a), £1,890 million of index-linked liabilities, previously included within unit-linked non-participating provisions, have been reclassified as other non-participating provisions as at 31 December 2009. As a result, the carrying values of assets backing unit-linked liabilities at that date have been reduced accordingly.
29 – Ordinary share capital This note gives details of Aviva plc’s ordinary share capital and shows the movements during the year. (a) Details of the Company’s ordinary share capital are as follows:
2010
£m 2009
£m
The allotted, called up and fully paid share capital of the Company at 31 December 2010 was: 2,820,148,642 (2009: 2,766,611,374) ordinary shares of 25 pence each 705 692
(b) During 2010, a total of 53,537,268 ordinary shares of 25 pence each were allotted and issued by the Company as follows:
Number
of shares
Share Capital
£m
Share Premium
£m
At 1 January 2009 2,657,701,624 664 1,234 Shares issued under the Group’s Employee and Executive Share Option Schemes 951,455 1 — Shares issued in lieu of dividends 107,958,295 27 (27)
At 31 December 2009 2,766,611,374 692 1,207 Shares issued under the Group’s Employee and Executive Share Option Schemes 722,968 — — Shares issued in lieu of dividends 52,814,300 13 (13)
At 31 December 2010 2,820,148,642 705 1,194
The Companies Act 2006 abolished the requirement for a company to have an authorised share capital and the articles of association adopted by the Company on 28 April 2010 reflect this. Directors will still be limited as to the number of shares they can at any time allot as the allotment authority continues to be required under the act, save in respect of employee share schemes. Ordinary shares in issue in the Company rank pari passu with any new ordinary shares issued in the Company. All the ordinary shares in issue carry the same right to receive all dividends and other distributions declared, made or paid by the Company. The issue of shares in lieu of cash dividends is considered a bonus issue under the terms of the Companies Act 2006 and the nominal value of the shares is charged to the share premium account.

Notes to the consolidated financial statements continued
240
Aviva plc Annual Report and Accounts 2010
30 – Equity compensation plans This note describes the various equity compensation plans we use, and shows how we value the options and awards of shares in the Company.
(a) Description of the plans The Group maintains a number of active share option and award plans and schemes (the Group’s Share Plans). These are as follows:
(i) Savings-related options These are options granted under the HM Revenue and Customs-approved Save As You Earn (SAYE) share option schemes in the UK and Irish Revenue-approved SAYE share option scheme in Ireland. Options are normally exercisable during the six-month period following either the third, fifth or seventh anniversary of the start of the relevant savings contract.
(ii) Executive share options These are options granted on various dates until 2004, under the Aviva Executive Share Option Plan or predecessor plans, and in 2010, under the Aviva Executive Share Option Plan 2005. Options granted between 2001 and 2004 were subject to the satisfaction of conditions relating to both the Company’s Return on Capital Employed (ROCE) and its relative Total Shareholder Return (TSR). The performance was measured over a three-year performance period and the options are normally exercisable between the third and tenth anniversary of their grant. The options granted in 2010 are described in the Directors’ Remuneration Report.
(iii) Long-term incentive plan awards These awards have been made under the Aviva Long Term Incentive Plan 2005 and are described in section (b) below and in the Directors’ Remuneration Report.
(iv) Annual bonus plan awards These awards have been made under the Aviva Annual Bonus Plan 2005, and are described in section (b) below and in the Directors’ Remuneration Report.
(v) One Aviva, twice the value bonus plan awards These are conditional awards first granted under the Aviva Annual Bonus Plan 2005 in 2008, and are described in section (b) below and in the Directors’ Remuneration Report.
(vi) CFO recruitment share awards plan awards The following awards were granted to Patrick Regan under the CFO Recruitment Share Awards Plan following his recruitment in 2010: the Replacement Restricted Share Award (RRSA), the Bonus Replacement Deferred Share Award (BRDSA) and the One Aviva Twice the Value Award (OATTV). The RRSA was awarded to compensate Mr Regan for the loss of share awards granted by his previous employer and the BRDSA was awarded to compensate Mr Regan for the loss of bonus from his previous employer. The awards are described in section (b) below and in the Directors’ Remuneration Report. No further awards will be made under this plan.
(b) Outstanding options and awards (i) Share options At 31 December 2010, options to subscribe for ordinary shares of 25 pence each in the Company were outstanding as follows: Aviva Savings Related Share Option Scheme
Option price p
Number of shares
Normally exercisable
Option price p
Number of shares
Normally exercisable
406 146,038 2010 563 1,113,993 2010, 2012 or 2014 428 91,945 2011 410 2,599,581 2011, 2013 or 2015 491 523,884 2010 or 2012 316 11,067,836 2012, 2014 or 2016 593 290,792 2011 or 2013 310 6,050,688 2013, 2015 or 2017
Aviva Ireland Savings Related Share Option Scheme (in euros)
Option price c
Number of shares
Normally exercisable
Option price c
Number of shares
Normally exercisable
719 19,535 2010 509 256,558 2011 or 2013 879 22,832 2011 360 1,122,071 2012 or 2014 830 89,009 2010 or 2012 374 345,187 2013 or 2015

Performance reviewCorporate responsibilityGovernanceShareholder informationFinancial statements IFRSFinancial statements MCEVOther information
Financial statements IFRS
Notes to the consolidated financial statements continued
241
Aviva plc Annual Report and Accounts 2010
30 – Equity compensation plans continued
Aviva Executive Share Option Plan Option price
p Number
of shares Normally
exercisable
1,035 291,730 2004 to 2011 516 529,990 2005 to 2012 512 694,984 2006 to 2013 526 470,340 2007 to 2014 386 1,529,647 2013
The following table summarises information about options outstanding at 31 December 2010:
Range of exercise prices
Outstanding options Number
Weighted average remaining
contractual life Years
Weighted average exercise price
p
£3.10 – £5.55 25,448,284 3 347.84 £5.56 – £8.00 1,516,626 1 569.20 £8.01 – £10.35 291.730 1 1,035.00
The comparative figures as at 31 December 2009 were:
Range of exercise prices
Outstanding options
Number
Weighted average remaining
contractual life Years
Weighted average exercise price
p
£3.10 – £5.55 23,163,439 3 362.18 £5.56 – £8.00 2,725,129 1 576.28 £8.01 – £10.35 466,525 1 1,016.57
(ii) Share awards At 31 December 2010, awards issued under the Company’s executive incentive plans over ordinary shares of 25 pence each in the Company were outstanding as follows: Aviva Long Term Incentive Plan 2005 Number of shares Vesting period Number of shares Vesting period
3,669,927 2008 to 2010 7,599,920 2010 to 2012 10,460,578 2009 to 2011
One Aviva, twice the value Bonus Plan Number of shares Vesting period Number of shares Vesting period
929,872 2008 to 2010 2,178,398 2010 to 2012 2,420,778 2009 to 2011
Aviva Annual Bonus Plan 2005 Number of shares Vesting period Number of shares Vesting period
1,775,320 2008 to 2010 5,051,579 2010 to 2012 5,416,844 2009 to 2011
CFO Recruitment Share Awards Plan Award type Number of shares Vesting period
RRSA 255,589 2010, 2011 and 2012 BRDSA 43,231 2010 to 2012 OATTV 55,051 2010 to 2012
The vesting of awards under the Aviva Long Term Incentive Plan 2005, the One Aviva, twice the value Bonus Plan and the OATTV award under the CFO Recruitment Share Awards Plan is subject to the attainment of performance conditions as described in the Directors’ Remuneration Report. Shares which do not vest, lapse.
(iii) Shares to satisfy awards and options Prior to March 2003, it was the practice to satisfy awards and options granted under the Group’s Share Plans through shares purchased in the market and held by employee share trusts which were established for the purpose of satisfying awards under the Group’s Share Plans and funded by the Company. From March 2003 to July 2008, it was generally the Company’s practice to satisfy the awards granted after March 2003 by the issue of new shares at the time of vesting. However, since July 2008, it has been the Company’s practice to satisfy all awards and options using shares purchased in the market and held by employee trusts except where local regulations make it necessary to issue new shares. Further details are given in note 31.

Notes to the consolidated financial statements continued
242
Aviva plc Annual Report and Accounts 2010
30 – Equity compensation plans continued (c) Movements in the year A summary of the status of the option plans as at 31 December 2009 and 2010, and changes during the years ended on those dates, is shown below.
2010 2009
Number of options
Weighted average
exercise price p
Number of options
Weighted average
exercise price p
Outstanding at 1 January 26,355,093 395.90 26,278,223 477.82 Granted during the year 8,020,085 326.52 14,863,272 316.00 Exercised during the year (73,755) 335.12 (146,330) 359.55 Forfeited during the year (1,461,530) 380.82 (1,149,764) 459.77 Cancelled during the year (2,788,423) 362.05 (8,604,422) 433.40 Expired during the year (2,794,830) 516.95 (4,885,886) 513.42
Outstanding at 31 December 27,256,640 367.51 26,355,093 395.90
Exercisable at 31 December 3,319,816 564.95 6,709,247 550.41
(d) Expense charged to the income statement The total expense recognised for the year arising from equity compensation plans was as follows:
2010
£m 2009
£m
Equity-settled expense (note 10b) 50 56 Cash-settled expense — —
50 56
(e) Fair value of options and awards granted after 7 November 2002 The weighted average fair values of options and awards granted during the year, estimated by using the Black-Scholes option pricing model, were £1.32 and £2.39 (2009: £1.78 and £1.94) respectively.
(i) Share options The fair value of the options was estimated on the date of grant, based on the following weighted average assumptions: Weighted average assumption 2010 2009
Share price 402p 480p Exercise price 310p 316p Expected volatility 56% 55% Expected life 5.00 years 5.00 years Expected dividend yield 6.09% 5.06% Risk-free interest rate 1.57% 2.47%
The expected volatility used was based on the historical volatility of the share price over a period equivalent to the expected life of the options prior to its date of grant. The risk-free interest rate was based on the yields available on UK government bonds as at the date of grant. The bonds chosen were those with a similar remaining term to the expected life of the options. 64,903 options granted after 7 November 2002 were exercised during the year (2009: 144,590).
(ii) Share awards The fair value of the awards was estimated on the date of grant, based on the following weighted average assumptions: Weighted average assumption 2010 2009
Share price 386.00p 216.25p Expected volatility* 66% 60% Expected volatility of comparator companies’ share price* 65% 61% Correlation between Aviva and competitors’ share price* 57% 55% Expected life 2.75 years 2.75 years Expected dividend yield 7.70% 8.23% Risk-free interest rate* 1.80% 1.76% * For awards with market-based performance conditions.
The expected volatility used was based on the historical volatility of the share price over a period equivalent to the expected life of the options prior to its date of grant. The risk-free interest rate was based on the yields available on UK government bonds as at the date of grant. The bonds chosen were those with a similar remaining term to the expected life of the options.

Performance reviewCorporate responsibilityGovernanceShareholder informationFinancial statements IFRSFinancial statements MCEVOther information
Financial statements IFRS
Notes to the consolidated financial statements continued
243
Aviva plc Annual Report and Accounts 2010
31 – Shares held by employee trusts We satisfy awards and options granted under the Group’s Share Plans primarily through shares purchased in the market and held by employees share trusts. This note gives details of the shares held in these trusts. Movements in the carrying value of shares held by employee trusts comprise:
2010 2009
Number £m Number £m
Cost debited to shareholders’ funds At 1 January 17,979,232 68 8,635,582 33 Acquired in the year 3,500,000 14 14,000,000 54 Distributed in the year (13,063,745) (50) (4,656,350) (19)
Balance at 31 December 8,415,487 32 17,979,232 68
The shares are owned by an employee share trust with an undertaking to satisfy awards of shares in the Company under the Company’s share plans and schemes. Details of the features of the plans can be found in the Directors’ Remuneration Report. These shares were purchased in the market and are carried at cost less amounts charged to the income statement in prior years. At 31 December 2010, they had an aggregate nominal value of £2,103,871 (2009: £4,494,808) and a market value of £33,072,864 (2009: £71,539,364). The trustees have waived their rights to dividends on the shares held in the trusts.
32 – Preference share capital This note gives details of Aviva plc’s preference share capital. The preference share capital of the Company at 31 December 2010 was:
2010
£m 2009
£m
Issued and paid up 100,000,000 83/8% cumulative irredeemable preference shares of £1 each 100 100 100,000,000 83/4% cumulative irredeemable preference shares of £1 each 100 100
200 200
The Companies Act 2006 abolished the requirement for a company to have an authorised share capital and the articles of association adopted by the Company on 28 April 2010 reflect this. Directors will still be limited as to the number of shares they can at any time allot because the allotment authority continues to be required under the act. Under the Company’s articles of association, the Company may issue and allot Sterling New Preference Shares and Euro New Preference Shares, which, if issued and allotted, would rank, as to payment of a dividend and capital, ahead of the Company’s ordinary share capital but behind the cumulative irredeemable preference shares currently in issue. The issued preference shares are non-voting except where their dividends are in arrears, on a winding up or where their rights are altered. On a winding up, they carry a preferential right of return of capital ahead of the ordinary shares. The Company does not have a contractual obligation to deliver cash or other financial assets to the preference shareholders and therefore the directors may make dividend payments at their discretion.

Notes to the consolidated financial statements continued
244
Aviva plc Annual Report and Accounts 2010
33 – Direct capital instruments This note gives details of the direct capital instruments issued in November 2004.
Notional amount 2010
£m 2009
£m
5.9021% £500 million direct capital instrument 500 500 4.7291% €700 million direct capital instrument 490 490
990 990
The euro and sterling direct capital instruments (the DCIs) were issued on 25 November 2004 and qualify as Innovative Tier 1 capital, as defined by the Financial Services Authority in GENPRU Annex 1 ‘Capital Resources’. They have no fixed redemption date but the Company may, at its sole option, redeem all (but not part) of the euro and sterling DCIs at their principal amounts on 28 November 2014 and 27 July 2020 respectively, at which dates the interest rates change to variable rates, or on any respective coupon payment date thereafter. In addition, under certain circumstances defined in the terms and conditions of the issue, the Company may at its sole option:
substitute at any time not less than all of the DCIs for, or vary the terms of the DCIs so that they become, Qualifying Tier 1 Securities or Qualifying Upper Tier 2 Securities;
substitute not less than all of the DCIs for fully paid non-cumulative preference shares in the Company. These preference shares could only be redeemed on 28 November 2014 in the case of the euro DCIs and on 27 July 2020 in the case of the sterling DCIs, or in each case on any dividend payment date thereafter. The Company has the right to choose whether or not to pay any dividend on the new shares, and any such dividend payment will be non-cumulative.
The Company has the option to defer coupon payments on the DCIs on any relevant payment date. Deferred coupons shall be satisfied only in the following circumstances, all of which occur at the sole option of the Company:
Redemption; or Substitution by, or variation so they become, alternative Qualifying Tier 1 Securities or Qualifying Upper Tier 2 Securities; or Substitution by preference shares.
No interest will accrue on any deferred coupon. Deferred coupons will be satisfied by the issue and sale of ordinary shares in the Company at their prevailing market value, to a sum as near as practicable to (and at least equal to) the relevant deferred coupons. In the event of any coupon deferral, the Company will not declare or pay any dividend on its ordinary or preference share capital.
34 – Merger reserve This note analyses the movements in the merger reserve during the year. Movements in the year comprised:
2010
£m 2009
£m
Balance at 1 January 3,271 3,271 Movement in the year — —
Balance at 31 December 3,271 3,271
Prior to 1 January 2004, certain significant business combinations were accounted for using the ‘pooling of interests method’ (or merger accounting), which treats the merged groups as if they had been combined throughout the current and comparative accounting periods. Merger accounting principles for these combinations gave rise to a merger reserve in the consolidated statement of financial position, being the difference between the nominal value of new shares issued by the Parent Company for the acquisition of the shares of the subsidiary and the subsidiary’s own share capital and share premium account. The merger reserve is also used where more than 90% of the shares in a subsidiary are acquired and the consideration includes the issue of new shares by the Company, thereby attracting merger relief under the Companies Act 1985 and, from 1 October 2009, the Companies Act 2006. The balance on the reserve has arisen through the mergers of Commercial Union, General Accident and Norwich Union companies, forming Aviva plc in 2000, together with the acquisition of RAC plc in 2005.

Performance reviewCorporate responsibilityGovernanceShareholder informationFinancial statements IFRSFinancial statements MCEVOther information
Financial statements IFRS
Notes to the consolidated financial statements continued
245
Aviva plc Annual Report and Accounts 2010
35 – Other reserves This note gives details of the various reserves forming part of the Group’s consolidated equity, and shows the movements during the year. Movements in the year comprised:
Currency translation
reserve (see accounting
policy E) £m
Owner occupied
properties reserve (see accounting
policy O) £m
Investment valuation
reserve (see accounting
policy S) £m
Hedging instruments reserve (see accounting
policy T) £m
Equity compensa- tion reserve
(see accounting policy AA)
£m Total
£m
Balance at 1 January 2009 3,685 157 (711) (1,103) 113 2,141 Arising in the year: Fair value gains/(losses) — (26) 977 — — 951 Fair value gains transferred to profit on disposals — — (310) — — (310) Transfer to profit on disposal of subsidiary (96) — — — — (96) Fair value gains transferred to retained earnings on disposals (note 36) — (1) — — — (1) Share of fair value changes in joint ventures and associates taken to other comprehensive income (notes 18a & 19a) — — 122 — — 122 Impairment losses on assets previously revalued directly through other comprehensive income now taken to income statement — — 482 — — 482 Reserves credit for equity compensation plans — — — — 56 56 Shares issued under equity compensation plans (note 36) — — — — (60) (60) Transfer to minority interests following Delta Lloyd IPO (351) (26) (156) — — (533) Foreign exchange rate movements (1,014) — — 332 — (682) Aggregate tax effect – shareholders’ tax — — (241) — — (241)
Balance at 31 December 2009 2,224 104 163 (771) 109 1,829 Arising in the year: Fair value gains/(losses) — (25) 579 — — 554 Fair value gains transferred to profit on disposals — — (123) — — (123) Transfer to profit on disposal of subsidiary (note 3b) (2) — — — — (2) Share of fair value changes in joint ventures and associates taken to other comprehensive income (notes 18a & 19a) — — (15) — — (15) Impairment losses on assets previously revalued directly through other comprehensive income now taken to income statement — — 136 — — 136 Reserves credit for equity compensation plans — — — — 41 41 Shares issued under equity compensation plans (note 36) — — — — (51) (51) Transfers to Minority Interests following DL IPO (3) — (1) (4) Foreign exchange rate movements (41) — — 78 — 37 Aggregate tax effect – shareholders’ tax 5 4 (166) — — (157)
Balance at 31 December 2010 2,183 83 573 (693) 99 2,245
The above reserves are shown net of non-controlling interests.

Notes to the consolidated financial statements continued
246
Aviva plc Annual Report and Accounts 2010
36 – Retained earnings This note analyses the movements in the consolidated retained earnings during the year.
2010
£m 2009
£m
Balance at 1 January 3,425 3,902 Profit for the year attributable to equity shareholders 1,463 1,085 Actuarial gains/(losses) on pension schemes (note 48e(iv)) 1,033 (1,140) Actuarial losses on pension schemes transferred to unallocated divisible surplus (note 44) (18) 24 Dividends and appropriations (note 15) (757) (853) Shares issued in lieu of dividends 209 299 Shares issued under equity compensation plans (note 35) 51 60 Shares distributed by employee trusts (note 31) (50) (18) Fair value gains realised from reserves (note 35) — 1 Transfer to minority interests following Delta Lloyd IPO (4) 3 Aggregate tax effect 59 62
Balance at 31 December 5,411 3,425
The shares issued in lieu of dividends are in respect of the transfer to retained earnings from the ordinary dividend account, arising from the treatment of these shares explained in note 29(b). The Group’s regulated subsidiaries are required to hold sufficient capital to meet acceptable solvency levels based on applicable local regulations. Their ability to transfer retained earnings to the UK parent companies is therefore restricted to the extent these earnings form part of local regulatory capital.
37 – Non-controlling interests This note gives details of the Group’s minority interests and shows the movements during the year.
(a) Non-controlling interests at 31 December comprised:
2010
£m 2009
£m
Equity shares in subsidiaries 2,055 2,098 Share of earnings 1,057 795 Share of other reserves 377 395 3,489 3,288 Preference shares in General Accident plc 250 250 Preference shares in other subsidiaries 2 2
3,741 3,540
(b) Movements in the year comprised:
2010
£m 2009
£m
Balance at 1 January 3,540 2,204 Profit for the year attributable to non-controlling interests 429 230 Minority share of movements in other reserves 57 35 Foreign exchange rate movements (113) (173) Total comprehensive income attributable to non-controlling interests 373 92 Capital contributions from non-controlling interests 42 6 Increase in non-controlling interests following Delta Lloyd IPO 8 1,460 Minority share of dividends declared in the year (187) (109) Non-controlling interest in acquired subsidiaries 3 (2) Changes in non-controlling interest in existing subsidiaries (38) 11 Reclassification to financial liabilities (see below) — (122)
Balance at 31 December 3,741 3,540
At the start of 2009, the minority shareholders in two subsidiaries in France and Italy held options requiring the Group to purchase their shares. During that year, both sets of minority shareholders indicated that they intended to exercise these options in 2010. We therefore reclassified their interests as at 31 December 2009 to financial liabilities in the consolidated statement of financial position. These transactions were completed during 2010 with the exercise of both sets of options.

Performance reviewCorporate responsibilityGovernanceShareholder informationFinancial statements IFRSFinancial statements MCEVOther information
Financial statements IFRS
Notes to the consolidated financial statements continued
247
Aviva plc Annual Report and Accounts 2010
38 – Contract liabilities and associated reinsurance The following notes explain how we calculate our liabilities to our policyholders for insurance and investment products we have sold to them. Notes 39 and 40 cover these liabilities, and note 41 details the financial guarantees and options given for some of these products. Note 42 details the reinsurance recoverables on these liabilities while note 43 shows the effects of the assumptions we have changed during the year. The following is a summary of the contract provisions and related reinsurance assets as at 31 December.
2010 2009
Gross
provisions £m
Reinsurance assets
£m
Net £m
Gross provisions
£m
Reinsurance assets
£m
Net £m
Long-term business Insurance contracts (160,946) 3,650 (157,296) (154,058) 4,299 (149,759) Participating investment contracts (69,482) 2 (69,480) (66,559) — (66,559) Non-participating investment contracts (48,305) 1,463 (46,842) (43,456) 1,258 (42,198)
(278,733) 5,115 (273,618) (264,073) 5,557 (258,516) Outstanding claims provisions Long-term business (1,078) 104 (974) (921) 40 (881) General insurance and health (9,528) 1,113 (8,415) (9,977) 1,194 (8,783) (10,606) 1,217 (9,389) (10,898) 1,234 (9,664) Provisions for claims incurred but not reported (2,735) 445 (2,290) (2,719) 449 (2,270)
(292,074) 6,777 (285,297) (277,690) 7,240 (270,450) Provision for unearned premiums (4,855) 307 (4,548) (4,781) 332 (4,449) Provision arising from liability adequacy tests (2) — (2) (7) — (7) Other technical provisions (1) — (1) — — —
Totals (296,932) 7,084 (289,848) (282,478) 7,572 (274,906) Less: Amounts classified as held for sale — — — 20 — 20
(296,932) 7,084 (289,848) (282,458) 7,572 (274,886)

Notes to the consolidated financial statements continued
248
Aviva plc Annual Report and Accounts 2010
39 – Insurance liabilities This note analyses our insurance contract liabilities by type of product and describes how we calculate these liabilities and what assumptions we have used.
(a) Carrying amount Insurance liabilities at 31 December comprise:
2010 2009
Long-term
business £m
General insurance
and health £m
Total £m
Long-term
business £m
General insurance
and health £m
Total £m
Long-term business provisions Participating 64,043 — 64,043 64,702 — 64,702 Unit-linked non-participating 21,450 — 21,450 21,268 — 21,268 Other non-participating 75,453 — 75,453 68,088 — 68,088
160,946 — 160,946 154,058 — 154,058
Outstanding claims provisions 1,078 9,528 10,606 921 9,977 10,898 Provision for claims incurred but not reported — 2,735 2,735 — 2,719 2,719
1,078 12,263 13,341 921 12,696 13,617
Provision for unearned premiums — 4,855 4,855 — 4,781 4,781 Provision arising from liability adequacy tests — 2 2 — 7 7 Other technical provisions — 1 1 — — —
Total 162,024 17,121 179,145 154,979 17,484 172,463 Less: Obligations to staff pension schemes transferred to provisions (note 47a) (1,445) — (1,445) (1,351) — (1,351) Amounts classified as held for sale — — — — (20) (20)
160,579 17,121 177,700 153,628 17,464 171,092
During 2010, the Group conducted a review of its classification of linked liabilities, following refinement of our policy which now defines unit-linked liabilities as those where all risks attached to the assets held to back those liabilities are borne by the policyholders. The review resulted in a reclassification of £1,890 million of insurance liabilities previously included as unit-linked non-participating liabilities as at 31 December 2009 to other non-participating liabilities. As a result of this reclassification, assets held to cover linked liabilities have also decreased by £1,890 million (see note 28).
(b) Long-term business liabilities (i) Business description The Group underwrites long-term business in a number of countries as follows:
In the UK mainly in: – New With-Profits sub-fund (NWPSF) of Aviva Life & Pensions UK (UKLAP), where the with-profit policyholders are entitled to at
least 90% of the distributed profits, the shareholders receiving the balance. Any surplus or deficit emerging in NWPSF that is not distributed as bonus will be transferred from this sub-fund to the Reattributed Inherited Estate External Support Account (RIEESA) (see below).
– Old With-Profits sub-fund (OWPSF), With-Profits sub-fund (WPSF) and Provident Mutual sub-fund (PMSF) of UKLAP, where the with-profit policyholders are entitled to at least 90% of the distributed profits, the shareholders receiving the balance.
– ‘Non-profit’ funds of Aviva Annuity UK and UKLAP, where shareholders are entitled to 100% of the distributed profits. Shareholder profits on unitised with-profit business written by WPSF and on stakeholder unitised with-profit business are derived from management fees and policy charges, and emerge in the non-profit funds.
– The RIEESA of UKLAP, which is a non-profit fund where shareholders are entitled to 100% of the distributed profits, but these cannot be distributed until the ‘lock-in’ criteria set by the Reattribution Scheme have been met. RIEESA will be used to write non-profit business and also to provide capital support to NWPSF.
In France, where the majority of policyholders’ benefits are determined by investment performance, subject to certain guarantees, and shareholders’ profits are derived largely from management fees. In addition, a substantial number of policies participate in investment returns, with the balance being attributable to shareholders.
In the Netherlands, the balance of profits, after providing appropriate returns for policyholders and after tax, accrues for the benefit of the shareholders. The bases for determining returns for policyholders are complex, but are consistent with methods and criteria followed generally in the Netherlands. In addition, a substantial number of policies provide benefits that are determined by investment performance, subject to certain guarantees, and shareholders’ profits are derived largely from management fees.

Performance reviewCorporate responsibilityGovernanceShareholder informationFinancial statements IFRSFinancial statements MCEVOther information
Financial statements IFRS
Notes to the consolidated financial statements continued
249
Aviva plc Annual Report and Accounts 2010
39 – Insurance liabilities continued In the United States, there are two main types of business – protection products and accumulation products. Protection
products include interest-sensitive whole life, term life, universal life and indexed life insurance policies. The accumulation product segment includes traditional fixed and indexed deferred annuities for individuals and funding agreements for business customers. In addition, there are two closed blocks of participating contracts arising from demutualisations of subsidiary companies. All products are classified as insurance contracts except for the funding agreements and term certain immediate annuities, which are classified as non-participating investment contracts.
In other overseas operations. (ii) Group practice The long-term business provision is calculated separately for each of the Group’s life operations. The provisions for overseas subsidiaries have generally been included on the basis of local regulatory requirements, modified where necessary to reflect the requirements of the Companies Act. Material judgement is required in calculating the provisions and is exercised particularly through the choice of assumptions where discretion is permitted. In turn, the assumptions used depend on the circumstances prevailing in each of the life operations. Provisions are most sensitive to assumptions regarding discount rates and mortality/morbidity rates. Bonuses paid during the year are reflected in claims paid, whereas those allocated as part of the bonus declaration are included in the movements in the long-term business provision.
(iii) Methodology and assumptions There are two main methods of actuarial valuation of liabilities arising under long-term insurance contracts – the net premium method and the gross premium method – both of which involve the discounting of projected premiums and claims. Under the net premium method, the premium taken into account in calculating the provision is determined actuarially, based on the valuation assumptions regarding discount rates, mortality and disability. The difference between this premium and the actual premium payable provides a margin for expenses. This method does not allow for voluntary early termination of the contract by the policyholder, and so no assumption is required for persistency. Explicit provision is made for vested bonuses (including those vesting following the most recent fund valuation), but no such provision is made for future regular or terminal bonuses. However, this method makes implicit allowance for future regular or terminal bonuses already earned, by margins in the valuation discount rate used. The gross premium method uses the amount of contractual premiums payable and includes explicit assumptions for interest and discount rates, mortality and morbidity, persistency and future expenses. These assumptions can vary by contract type and reflect current and expected future experience. Explicit provision is made for vested bonuses and explicit allowance is also made for future regular bonuses, but not terminal bonuses.
(a) UK With-profit business The valuation of with-profit business uses the methodology developed for the Realistic Balance Sheet, adjusted to remove the shareholders’ share of future bonuses. The key elements of the Realistic Balance Sheet methodology are the with-profit benefit reserve (WPBR) and the present value of the expected cost of any payments in excess of the WPBR (referred to as the cost of future policy-related liabilities). The realistic liability for any contract is equal to the sum of the WPBR and the cost of future policy-related liabilities. The WPBR for an individual contract is generally calculated on a retrospective basis, and represents the accumulation of the premiums paid on the contract, allowing for investment return, taxation, expenses and any other charges levied on the contract. For a small proportion of business, a prospective valuation approach is used, including allowance for anticipated future regular and final bonuses. The items included in the cost of future policy-related liabilities include:
Maturity Guarantees; Guaranteed Annuity Options; GMP underpin on Section 32 transfers; and Expected payments under Mortgage Endowment Promise.
In the Provident Mutual and With-Profits sub-funds in UKLAP, this is offset by the expected cost of charges to WPBR to be made in respect of guarantees. The cost of future policy-related liabilities is determined using a market-consistent approach and, in the main, this is based on a stochastic model calibrated to market conditions at the end of the reporting period. Non-market-related assumptions (for example, persistency, mortality and expenses) are based on experience, adjusted to take into account future trends. The principal assumptions underlying the cost of future policy-related liabilities are as follows:
Future investment return A ‘risk-free’ rate equal to the spot yield on UK government securities, plus a margin of 0.1% is used. The rates vary, according to the outstanding term of the policy, with a typical rate as at 31 December 2010 being 3.78% (2009: 4.35%) for a policy with ten years outstanding.

Notes to the consolidated financial statements continued
250
Aviva plc Annual Report and Accounts 2010
39 – Insurance liabilities continued Volatility of investment return Volatility assumptions are set with reference to implied volatility data on traded market instruments, where available, or on a best estimate basis where not. These are term-dependent, with specimen values for ten-year terms as follows:
Volatility
2010 2009
Equity returns 26.1% 26.6% Property returns 15.0% 15.0% Fixed interest yields 13.2% 14.4%
The table above shows the volatility of fixed interest yields, set with reference to 20 year at-the-money swaption volatilities.
Future regular bonuses Annual bonus assumptions for 2011 have been set consistently with the year-end 2010 declaration. Future annual bonus rates reflect the principles and practices of the fund. In particular, the level is set with regard to the projected margin for final bonus and the change from one year to the next is limited to a level consistent with past practice.
Mortality Mortality assumptions are set with regard to recent Company experience and general industry trends. The mortality tables used in the valuation are summarised below:
Mortality table used
2010 2009
Assurances, pure endowments and deferred annuities before vesting Nil or Axx00 adjusted Nil or Axx00 adjusted Pensions business after vesting and pensions annuities in payment PCMA00/PCFA00 adjusted plus
allowance for future mortality improvement
PCMA00/PCFA00 adjusted plus allowance for future mortality
improvement
Non-profit business Conventional non-profit contracts, including those written in the with-profit funds, are valued using gross premium methods which discount projected future cash flows. The cash flows are calculated using the amount of contractual premiums payable, together with explicit assumptions for investment returns, inflation, discount rates, mortality, morbidity, persistency and future expenses. These assumptions vary by contract type and reflect current and expected future experience. For unit-linked and some unitised with-profit business, the provisions are valued by adding a prospective non-unit reserve to the bid value of units. The prospective non-unit reserve is calculated by projecting the future non-unit cash flows on the assumption that future premiums cease, unless it is more onerous to assume that they continue. Where appropriate, allowance for persistency is based on actual experience. Valuation discount rate assumptions are set with regard to yields on the supporting assets and the general level of long-term interest rates as measured by gilt yields. An explicit allowance for risk is included by restricting the yields for equities and properties with reference to a margin over long-term interest rates or by making an explicit deduction from the yields on corporate bonds, mortgages and deposits, based on historical default experience of each asset class. A further margin for risk is then deducted for all asset classes. The provisions held in respect of guaranteed annuity options are a prudent assessment of the additional liability incurred under the option on a basis and method consistent with that used to value basic policy liabilities, and includes a prudent assessment of the proportion of policyholders who will choose to exercise the option. Valuation discount rates for business in the non-profit funds are as follows:
Valuation discount rates
2010 2009
Assurances Life conventional non-profit 2.8% to 3.5% 3.0% to 3.8% Pensions conventional non-profit 3.5% to 3.7% 3.8% to 4.0% Deferred annuities Non-profit – in deferment 3.9% 4.2% Non-profit – in payment 3.5% to 3.7% 3.8% to 4.0% Annuities in payment Conventional annuity 3.9% to 5.4% 4.2% to 5.7% Non-unit reserves Life 3.1% 3.3% Pensions 3.8% 4.1%

Performance reviewCorporate responsibilityGovernanceShareholder informationFinancial statements IFRSFinancial statements MCEVOther information
Financial statements IFRS
Notes to the consolidated financial statements continued
251
Aviva plc Annual Report and Accounts 2010
39 – Insurance liabilities continued Mortality assumptions are set with regard to recent Company experience and general industry trends. The mortality tables used in the valuation are summarised below:
Mortality tables used
2010 2009
Assurances Non-profit AM00/AF00 or TM00/TF00
adjusted for smoker status and age/sex specific factors
AM00/AF00 or TM00/TF00 adjusted for smoker status and age/sex
specific factors Pure endowments and deferred annuities before vesting AM00/AF00 adjusted AM00/AF00 adjusted Pensions business after vesting PCMA00/PCFA00 adjusted plus
allowance for future mortality improvement
PCMA00/PCFA00 adjusted plus allowance for future mortality
improvement Annuities in payment General annuity business IML00/IFL00 adjusted plus
allowance for future mortality improvement
IML00/IFL00 adjusted plus allowance for future mortality
improvement
(b) France The majority of reserves arise from a single premium savings product and is based on the accumulated fund value, adjusted to maintain consistency with the value of the assets backing the policyholder liabilities. The net premium method is used for prospective valuations, in accordance with local regulation, where the valuation assumptions depend on the date of issue of the contract. The valuation discount rate also depends on the original duration of the contract and mortality rates are based on industry tables.
Valuation discount rates Mortality tables used
2010 and 2009 2010 and 2009
Life assurances 0% to 4.5%
TD73-77, TD88-90, TH00-02, TGF05/TGH05;
H_AVDBS, F_AVDBS, H_SSDBS and F_SSDBS (in 2010)
Annuities 0% to 4.5% TPRV (prospective table)
(c) Netherlands On transition to IFRS, the valuation of most long-term insurance and participating investment contracts was changed from existing methods that used historic assumptions to an active basis using current market interest rates. A liability adequacy test is performed in line with IFRS requirements. Where liabilities are based on current market interest rates and assets are valued at market value, the margin in the liability adequacy test is determined by comparison of the liabilities with the present value of best estimate cash flows. The yield curve is constructed from yields on collateralised AAA bonds. Annuitant mortality assumptions were revised in 2010.
Valuation discount rates Mortality tables used
2010 and 2009 2010 and 2009
Life assurances Market risk-free yield curves, based on iBoxx index for collateralised
AAA bonds
GBM 61-65, GBM/V 76-80, GBM 80-85, GBM/V 85-90
and GBM/V 90-95 Annuities in deferment and in payment Market risk-free yield curves, based
on iBoxx index for collateralised AAA bonds
GBM/V 76-80, GBM/V 85-90, GBM/V 95-00, Coll 1993/2003
and DIL 98, plus further allowance for future mortality improvement;
CBS2010 (in 2010)
(d) United States For the major part of our US business, insurance liabilities are measured in accordance with US GAAP as at the date of acquisition. The liability for future policy benefits for traditional life insurance is computed using the net level method, based on guaranteed interest and mortality rates as used in calculating cash surrender values. Reserve interest assumptions ranged from 2.00% to 7.50% in 2010 (2009: 2.00% to 7.50%). The weighted average interest rate for all traditional life policy reserves in 2010 was 4.50% (2009: 4.47%).

Notes to the consolidated financial statements continued
252
Aviva plc Annual Report and Accounts 2010
39 – Insurance liabilities continued Future policy benefit reserves for universal life insurance, deferred annuity products and funding agreements are computed under a retrospective deposit method and represent policy account balances before applicable surrender charges. For the indexed products, the liability held is calculated based on the option budget method and is equal to the host contract and the calculated value of the derivative. The value of the derivative is based on the present value of the difference between the projected fund value and the underlying fund guarantee. The range of interest crediting rates for deferred annuity products, the largest component of the US business, excluding sales inducement payouts, was 1.00% to 5.20% in 2010 (2009: 2.00% to 6.00%). An additional liability is established for universal life contracts with death or other insurance benefit features, which is determined using an equally weighted range of scenarios with respect to investment returns, policyholder lapses, benefit election rates, premium payout patterns and mortality. The additional liability represents the present value of future expected benefits based on current product assumptions. The indexed life and annuity products guarantee the return of principal to the customer, and credit interest based on certain indices. A portion of the premium from each customer is invested in fixed income securities and is intended to cover the minimum guaranteed value. A further portion of the premium is used to purchase derivatives to hedge the growth in interest credited to the customer as a direct result of increases in the related indices. Both the derivatives and the options embedded in the policy are valued at their fair value. Deferred income reserves are established for fees charged for insurance benefit features which are assessed in a manner that is expected to result in higher profits in earlier years, followed by lower profits or losses in subsequent years. The excess charges are deferred and amortised using the same assumptions and factors used to amortise deferred acquisition costs. Shadow adjustments may be made to deferred acquisition costs, acquired value of in-force business, deferred income reserves and contract liabilities. The shadow adjustments are recognised directly in other comprehensive income so that unrealised gains or losses on investments that are recognised directly in other comprehensive income affect the measurement of the liability, or related assets, in the same way as realised gains or losses.
(e) Other countries In all other countries, local generally accepted interest rates and published standard mortality tables are used for different categories of business as appropriate. The tables are based on relevant experience and show mortality rates, by age, for specific groupings of people.
(iv) Movements The following movements have occurred in the long-term business provisions during the year:
2010
£m 2009
£m
Carrying amount at 1 January 154,058 156,188 Provisions in respect of new business 12,502 11,105 Expected change in existing business provisions (9,259) (7,625) Variance between actual and expected experience 1,858 2,154 Impact of other operating assumption changes (520) (121) Impact of economic assumption changes 1,959 (404) Exceptional strengthening of longevity assumptions (see below) 483 — Other movements (197) 1,112 Change in liability recognised as an expense 6,826 6,221 Effect of portfolio transfers, acquisitions and disposals 1,117 (67) Foreign exchange rate movements (1,055) (8,284)
Carrying amount at 31 December 160,946 154,058
The variance between actual and expected experience of £1.9 billion in 2010 was primarily driven by favourable movements in investment markets, which had a direct or indirect impact on liability values. Equity markets increased, government bond yields fell in major markets and credit spreads on corporate bonds were broadly unchanged. For many types of long-term business, including unit-linked and participating funds, movements in asset values are offset by corresponding changes in liabilities, limiting the net impact on profit. Minor variances arise from differences between actual and expected experience for persistency, mortality and other demographic factors. The impact of assumption changes in the above analysis shows the resulting movement in the carrying value of insurance liabilities. A strengthening of longevity assumptions was made in the Netherlands, following the publication of new mortality tables, which is separately identified as an exceptional item. The reduction in liabilities from other operating assumption changes mainly relates to assurance mortality assumptions in the UK and Ireland, with a corresponding reduction made to reassurance assets. The £2.0 billion impact of economic assumption changes reflects reductions in valuation interest rates. For participating business, a movement in liabilities is generally offset by a corresponding adjustment to the unallocated divisible surplus and does not impact on profit. Where assumption changes do impact on profit, these are included in the effect of changes in assumptions and estimates during the year shown in note 43, together with the impact of movements in related non-financial assets.

Performance reviewCorporate responsibilityGovernanceShareholder informationFinancial statements IFRSFinancial statements MCEVOther information
Financial statements IFRS
Notes to the consolidated financial statements continued
253
Aviva plc Annual Report and Accounts 2010
39 – Insurance liabilities continued (c) General insurance and health liabilities (i) Provisions for outstanding claims Delays occur in the notification and settlement of claims and a substantial measure of experience and judgement is involved in assessing outstanding liabilities, the ultimate cost of which cannot be known with certainty at the statement of financial position date. The reserves for general insurance and health business are based on information currently available. However, it is inherent in the nature of the business written that the ultimate liabilities may vary as a result of subsequent developments. Provisions for outstanding claims are established to cover the outstanding expected ultimate liability for losses and loss adjustment expenses (LAE) in respect of all claims that have already occurred. The provisions established cover reported claims and associated LAE, as well as claims incurred but not yet reported and associated LAE. We only establish loss reserves for losses that have already occurred. We therefore do not establish catastrophe equalisation reserves that defer a share of income in respect of certain lines of business from years in which a catastrophe does not occur to future periods in which catastrophes may occur. When calculating reserves, we take into account estimated future recoveries from salvage and subrogation, and a separate asset is recorded for expected future recoveries from reinsurers after considering their collectability. The table below shows the split of total general insurance and health outstanding claim provisions and IBNR provisions, gross of reinsurance, by major line of business.
As at 31 December 2010 As at 31 December 2009
Outstanding claim
provisions £m
IBNR
provisions £m
Total claim provisions
£m
Outstanding claim
provisions £m
IBNR
provisions £m
Total claim provisions
£m
Motor 4,419 924 5,343 4,411 753 5,164 Property 1,669 188 1,857 1,697 196 1,893 Liability 2,388 1,303 3,691 2,707 1,379 4,086 Creditor 77 24 101 170 17 187 Other 975 296 1,271 992 374 1,366
9,528 2,735 12,263 9,977 2,719 12,696
(ii) Discounting Outstanding claims provisions are based on undiscounted estimates of future claim payments, except for the following classes of business for which discounted provisions are held:
Rate Mean term of
liabilities
Class 2010 2009 2010 2009
Netherlands Permanent health and injury 3.75% 3.48% 7 years 8 years Reinsured London Market business 3.30% 4.00% 12 years 10 years Latent claims 0.88% to
4.18% 0.82% to
4.84% 7 to 15
years 8 to 15 years Structured settlements 3.20% 3.30% 35 years 35 years
The gross outstanding claims provision before discounting was £13,179 million (2009: £13,576 million). The period of time which will elapse before the liabilities are settled has been estimated by modelling the settlement patterns of the underlying claims. The discount rate that has been applied to latent claims reserves is based on the relevant swap curve in the relevant currency having regard to the expected settlement dates of the claims. The range of discount rates used depends on the duration of the claims and is given in the table above. The duration of the claims span over 35 years, with the average duration being between 7 and 15 years depending on the geographical region. Any change in discount rates between the start and the end of the accounting period is reflected below operating profit as an economic assumption change. During 2010, we have continued to experience an increase in the number of bodily injury claims settled by periodic payment orders (PPOs) or structured settlements, especially in the UK, which are reserved for on a discounted basis.
(iii) Assumptions Outstanding claims provisions are estimated based on known facts at the date of estimation. Case estimates are generally set by skilled claims technicians, applying their experience and knowledge to the circumstances of individual claims. They take into account all available information and correspondence regarding the circumstances of the claim, such as medical reports, investigations and inspections. Claims technicians set case estimates according to documented claims department policies and specialise in setting estimates for certain lines of business or types of claim. Claims above certain limits are referred to senior claims handlers for authorisation.

Notes to the consolidated financial statements continued
254
Aviva plc Annual Report and Accounts 2010
39 – Insurance liabilities continued No adjustments are made to the claims technicians’ case estimates included in booked claim provisions, except for rare occasions when the estimated ultimate cost of a large or unusual claim may be adjusted, subject to internal reserve committee approval, to allow for uncertainty regarding, for example, the outcome of a court case. The ultimate cost of outstanding claims is then estimated by using a range of standard actuarial claims projection techniques, such as the Chain Ladder and Bornhuetter-Ferguson methods. The main assumption underlying these techniques is that a company’s past claims development experience can be used to project future claims development and hence ultimate claims costs. As such, these methods extrapolate the development of paid and incurred losses, average costs per claim and claim numbers based on the observed development of earlier years and expected loss ratios. Historical claims development is mainly analysed by accident period, although underwriting or notification period is also used where this is considered appropriate. Claim development is separately analysed for each geographic area, as well as by each line of business. Certain lines of business are also further analysed by claim type or type of coverage. In addition, large claims are usually separately addressed, either by being reserved at the face value of loss adjuster estimates or separately projected in order to reflect their future development. The assumptions used in most non-life actuarial projection techniques, including future rates of claims inflation or loss ratio assumptions, are implicit in the historical claims development data on which the projections are based. Additional qualitative judgement is used to assess the extent to which past trends may not apply in the future, for example, to reflect one-off occurrences, changes in external or market factors such as public attitudes to claiming, economic conditions, levels of claims inflation, judicial decisions and legislation, as well as internal factors such as portfolio mix, policy conditions and claims handling procedures in order to arrive at a point estimate for the ultimate cost of claims that represents the likely outcome, from a range of possible outcomes, taking account of all the uncertainties involved. The range of possible outcomes does not, however, result in the quantification of a reserve range. However, the following explicit assumptions are made which could materially impact the level of booked net reserves:
UK mesothelioma claims The level of uncertainty associated with latent claims is considerable due to the relatively small number of claims and the long-tail nature of the liabilities. UK mesothelioma claims account for a large proportion of the Group’s latent claims. The key assumptions underlying the estimation of these claims include claim numbers, the base average cost per claim, future inflation in the average cost of claims, legal fees and the life expectancy of potential sufferers. The best estimate of the liabilities reflects the latest available market information and studies. Many different scenarios can be derived by flexing these key assumptions and applying different combinations of the different assumptions. An upper and lower scenario can be derived by making reasonably likely changes to these assumptions, resulting in an estimate £195 million greater than the best estimate, or £85 million lower than the best estimate. These scenarios do not, however, constitute an upper or lower bound on these liabilities.
Interest rates used to discount latent claim liabilities The discount rates used in determining our latent claim liabilities are based on the relevant swap curve in the relevant currency at the reporting date, having regard to the duration of the expected settlement of latent claims. The range of discount rates used is shown in section (ii) above and depends on the duration of the claim and the reporting date. At 31 December 2010, it is estimated that a 1% fall in the discount rates used would increase net claim reserves by approximately £70 million, excluding the offsetting effect on asset values as assets are not hypothecated across classes of business. The impact of a 1% fall in interest rates across all assets and liabilities of our general insurance and health businesses is shown in note 57(i).
Allowance for risk and uncertainty The uncertainties involved in estimating loss reserves are allowed for in the reserving process and by the estimation of explicit reserve uncertainty distributions. The reserve estimation basis for non-life claims adopted by the Group at 31 December 2010 requires all non-life businesses to calculate booked claim provisions as the best estimate of the cost of future claim payments, plus an explicit allowance for risk and uncertainty. The allowance for risk and uncertainty is calculated by each business unit in accordance with the requirements of the Group non-life reserving policy, taking into account the risks and uncertainties specific to each line of business and type of claim in that territory. The requirements of the Group non-life reserving policy also seek to ensure that the allowance for risk and uncertainty is set consistently across both business units and reporting periods. Changes to claims development patterns can materially impact the results of actuarial projection techniques. However, allowance for the inherent uncertainty in the assumptions underlying reserving projections is automatically allowed for in the explicit allowance for risk and uncertainty included when setting booked reserves. Lump sum payments in settlement of bodily injury claims decided by the UK courts are calculated in accordance with the Ogden Tables. The Ogden Tables contain a discount rate that is set by the Lord Chancellor and that is applied when calculating the present value of loss of earnings for claims settlement purposes. The Ogden discount rate is currently under review by the Lord Chancellor. The outcome of this review is expected to be announced in 2011 but it is still not clear whether or by how much the rate will change. A reduction in the Ogden discount rates will increase lump sum payments to UK bodily injury claimants.

Performance reviewCorporate responsibilityGovernanceShareholder informationFinancial statements IFRSFinancial statements MCEVOther information
Financial statements IFRS
Notes to the consolidated financial statements continued
255
Aviva plc Annual Report and Accounts 2010
39 – Insurance liabilities continued (iv) Movements The following changes have occurred in the general insurance and health claims provisions during the year:
2010
£m 2009
£m
Carrying amount at 1 January 12,696 14,360 Impact of changes in assumptions 26 (106) Claim losses and expenses incurred in the current year 6,908 7,328 Decrease in estimated claim losses and expenses incurred in prior years (358) (541) Exceptional strengthening of general insurance latent claims provisions 10 60
Incurred claims losses and expenses 6,586 6,741 Less: Payments made on claims incurred in the current year (3,641) (3,922) Payments made on claims incurred in prior years (3,803) (3,814) Recoveries on claim payments 271 298
Claims payments made in the year, net of recoveries (7,173) (7,438) Unwind of discounting 64 41 Other movements in the claims provisions (18) —
Change in claims reserve recognised as an expense (541) (656) Effect of portfolio transfers, acquisitions and disposals 4 (649) Foreign exchange rate movements 102 (359) Other movements 2 — Carrying amount at 31 December 12,263 12,696
The exceptional strengthening of reserves is in respect of several specific discontinued commercial liability risks written in Canada a significant number of years ago. The effect of changes in the main assumptions is given in note 43 and the economic assumption changes are explained in note 9.
(d) Loss development tables (i) Description of tables The tables that follow present the development of claim payments and the estimated ultimate cost of claims for the accident years 2001 to 2010. The upper half of the tables shows the cumulative amounts paid during successive years related to each accident year. For example, with respect to the accident year 2002, by the end of 2010 £5,814 million had actually been paid in settlement of claims. In addition, as reflected in the lower section of the table, the original estimated ultimate cost of claims of £6,250 million was re-estimated to be £6,035 million at 31 December 2010. The original estimates will be increased or decreased, as more information becomes known about the individual claims and overall claim frequency and severity. The Group aims to maintain strong reserves in respect of its general insurance and health business in order to protect against adverse future claims experience and development. As claims develop and the ultimate cost of claims become more certain, the absence of adverse claims experience will result in a release of reserves from earlier accident years, as shown in the loss development tables and movements table (c)(iv) above. However, in order to maintain overall reserve adequacy, the Group establishes strong reserves in respect of the current accident year (2010) where the development of claims is less mature and there is much greater uncertainty attaching to the ultimate cost of claims. Releases from prior accident year reserves are also due to an improvement in the estimated cost of claims. Key elements of the release from prior accident year general insurance and health net provisions during 2009 were:
£230 million from the UK, including group reinsurance business, mainly due to an improved view of group reinsurance liabilities, and favourable development on personal and commercial motor claims, and commercial property and commercial liability large claims.
£237 million from Europe mainly due to favourable development of personal motor and commercial property, especially in respect of large claims.
£79 million from Canada mainly due to favourable experience on motor and personal property. Key elements of the release from prior accident year general insurance and health net provisions during 2010 were:
£101 million from the UK, including group reinsurance business, mainly due to an improved view of group reinsurance liabilities, and favourable development on personal property claims, and commercial property and commercial liability large claims.
£167 million from Europe mainly due to favourable development of personal and commercial property. £44 million from Canada mainly due to favourable experience on motor and commercial liability.

Notes to the consolidated financial statements continued
256
Aviva plc Annual Report and Accounts 2010
39 – Insurance liabilities continued (ii) Gross figures Before the effect of reinsurance, the loss development table is:
Accident year All prior
years £m
2001
£m 2002
£m 2003
£m 2004
£m 2005
£m 2006
£m 2007
£m 2008
£m 2009
£m 2010
£m Total
£m
Gross cumulative claim payments
At end of accident year (3,029) (2,952) (2,819) (2,971) (3,345) (3,653) (4,393) (4,915) (3,780) (3,502) One year later (4,766) (4,486) (4,190) (4,561) (5,011) (5,525) (6,676) (7,350) (5,464) Two years later (5,303) (4,921) (4,613) (4,981) (5,449) (5,971) (7,191) (7,828) Three years later (5,701) (5,233) (4,972) (5,263) (5,784) (6,272) (7,513) Four years later (5,966) (5,466) (5,258) (5,448) (6,001) (6,531) Five years later (6,121) (5,618) (5,409) (5,617) (6,156) Six years later (6,223) (5,715) (5,527) (5,725) Seven years later (6,294) (5,767) (5,594) Eight years later (6,350) (5,814) Nine years later (6,389) Estimate of gross ultimate claims
At end of accident year 6,590 6,250 6,385 6,891 7,106 7,533 8,530 9,508 7,364 6,911 One year later 6,770 6,372 6,172 6,557 6,938 7,318 8,468 9,322 7,297 Two years later 6,775 6,287 6,124 6,371 6,813 7,243 8,430 9,277 Three years later 6,798 6,257 6,036 6,178 6,679 7,130 8,438 Four years later 6,754 6,205 5,932 6,008 6,603 7,149 Five years later 6,679 6,122 5,853 6,003 6,605 Six years later 6,630 6,056 5,813 5,953 Seven years later 6,576 6,044 5,792 Eight years later 6,600 6,035 Nine years later 6,577 Estimate of gross ultimate claims
6,577
6,035
5,792
5,953
6,605
7,149
8,438
9,277
7,297
6,911
Cumulative payments (6,389) (5,814) (5,594) (5,725) (6,156) (6,531) (7,513) (7,828) (5,464) (3,502)
3,040 188 221 198 228 449 618 925 1,449 1,833 3,409 12,558 Effect of discounting (747) (6) (11) (29) (7) (28) (27) (9) (11) (24) (17) (916)
Present value 2,293 182 210 169 221 421 591 916 1,438 1,809 3,392 11,642 Cumulative effect of foreign exchange movements — 29 31 47 52 85 122 111 (16) 17 — 478 Effect of acquisitions — 7 8 50 10 18 15 27 8 — — 143
Present value recognised in the statement of financial position 2,293 218 249 266 283 524 728 1,054 1,430 1,826 3,392 12,263

Performance reviewCorporate responsibilityGovernanceShareholder informationFinancial statements IFRSFinancial statements MCEVOther information
Financial statements IFRS
Notes to the consolidated financial statements continued
257
Aviva plc Annual Report and Accounts 2010
39 – Insurance liabilities continued (iii) Net of reinsurance After the effect of reinsurance, the loss development table is:
In the loss development tables shown above, the cumulative claim payments and estimates of cumulative claims for each accident year are translated into sterling at the exchange rates that applied at the end of that accident year. The impact of using varying exchange rates is shown at the bottom of each table. Disposals are dealt with by treating all outstanding and IBNR claims of the disposed entity as ‘paid’ at the date of disposal. The loss development tables above include information on asbestos and environmental pollution claims provisions from business written before 2001. The undiscounted claim provisions, net of reinsurance, in respect of this business at 31 December 2010 were £939 million (2009: £968 million). The movement in the year reflects exceptional strengthening of provisions by £10 million (2009: £60 million) in respect of several specific discontinued commercial liability risks written in Canada a significant number of years ago, other strengthening of £66 million (2009: £62 million release), claim payments, reinsurance recoveries and foreign exchange rate movements.
(e) Provision for unearned premiums Movements The following changes have occurred in the provision for unearned premiums (UPR) during the year:
2010
£m 2009
£m
Carrying amount at 1 January 4,781 5,493 Premiums written during the year 10,469 9,968 Less: Premiums earned during the year (10,424) (10,613)
Change in UPR recognised as income 45 (645) Gross portfolio transfers and acquisitions (14) — Foreign exchange rate movements 43 (67)
Carrying amount at 31 December 4,855 4,781
Accident year All prior
years £m
2001
£m 2002
£m 2003
£m 2004
£m 2005
£m 2006
£m 2007
£m 2008
£m 2009
£m 2010
£m Total
£m
Net cumulative claim payments At end of accident year (2,970) (2,913) (2,819) (2,870) (3,281) (3,612) (4,317) (4,808) (3,650) (3,386) One year later (4,624) (4,369) (4,158) (4,378) (4,925) (5,442) (6,542) (7,165) (5,286) Two years later (5,088) (4,779) (4,565) (4,712) (5,344) (5,881) (7,052) (7,638) Three years later (5,436) (5,064) (4,924) (4,986) (5,671) (6,181) (7,356) Four years later (5,648) (5,297) (5,180) (5,163) (5,892) (6,434) Five years later (5,763) (5,424) (5,325) (5,327) (6,039) Six years later (5,841) (5,508) (5,442) (5,430) Seven years later (5,896) (5,552) (5,502) Eight years later (5,954) (5,598) Nine years later (5,979) Estimate of net ultimate claims At end of accident year 6,186 6,037 6,218 6,602 6,982 7,430 8,363 9,262 7,115 6,650 One year later 6,333 6,038 6,093 6,266 6,818 7,197 8,302 9,104 7,067 Two years later 6,321 5,997 6,037 6,082 6,688 7,104 8,244 9,028 Three years later 6,329 5,973 5,942 5,882 6,544 6,996 8,249 Four years later 6,286 5,912 5,851 5,709 6,476 6,980 Five years later 6,219 5,855 5,772 5,699 6,448 Six years later 6,173 5,786 5,683 5,639 Seven years later 6,109 5,754 5,663 Eight years later 6,130 5,742 Nine years later 6,090 Estimate of net ultimate claims 6,090 5,742 5,663 5,639 6,448 6,980 8,249 9,028 7,067 6,650 Cumulative payments (5,979) (5,598) (5,502) (5,430) (6,039) (6,434) (7,356) (7,638) (5,286) (3,386)
1,750 111 144 161 209 409 546 893 1,390 1,781 3,264 10,658 Effect of discounting (414) (3) (5) (8) (3) (3) (5) (9) (11) (24) (16) (501)
Present value 1,336 108 139 153 206 406 541 884 1,379 1,757 3,248 10,157 Cumulative effect of foreign exchange movements — 15 27 42 48 80 116 106 (14) 17 — 437 Effect of acquisitions — 6 7 36 8 13 13 20 8 — — 111
Present value recognised in the statement of financial position 1,336 129 173 231 262 499 670 1,010 1,373 1,774 3,248 10,705

Notes to the consolidated financial statements continued
258
Aviva plc Annual Report and Accounts 2010
40 – Liability for investment contracts This note analyses our investment contract liabilities by type of product and describes how we calculate these liabilities and what assumptions we have used.
(a) Carrying amount The liability for investment contracts at 31 December comprised:
2010
£m 2009
£m
Long-term business Participating contracts 69,482 66,559 Non-participating contracts at fair value 46,124 41,289 Non-participating contracts at amortised cost 2,181 2,167 48,305 43,456
Total 117,787 110,015
(b) Long-term business investment liabilities Investment contracts are those that do not transfer significant insurance risk from the contract holder to the issuer, and are therefore treated as financial instruments under IFRS. Many investment contracts contain a discretionary participation feature in which the contract holder has a contractual right to receive additional benefits as a supplement to guaranteed benefits. These are referred to as participating contracts and are measured according to the methodology and Group practice for long-term business liabilities as described in note 39. They are not measured at fair value as there is currently no agreed definition of fair valuation for discretionary participation features under IFRS. In the absence of such a definition, it is not possible to provide a range of estimates within which a fair value is likely to fall. The IASB has deferred consideration of participating contracts to Phase II of its insurance contracts project. For participating business, the discretionary participation feature is recognised separately from the guaranteed element and is classified as a liability, referred to as unallocated distributable surplus. Guarantees on long-term investment products are discussed in note 41. Investment contracts that do not contain a discretionary participation feature are referred to as non-participating contracts and the liability is measured at either fair value or amortised cost. Of the non-participating investment contracts measured at fair value, £44,631 million are unit linked in structure and the fair value liability is equal to the unit reserve plus additional non-unit reserves if required on a fair value basis. These contracts are classified as ‘Level 1’ in the fair value hierarchy, as the unit reserve is calculated as the publicly quoted unit price multiplied by the number units in issue, and any non-unit reserve is insignificant. For unit-linked business, a deferred acquisition cost asset and deferred income reserve liability are recognised in respect of transaction costs and front-end fees respectively, that relate to the provision of investment management services, and which are amortised on a systematic basis over the contract term. The amount of the related deferred acquisition cost asset is shown in note 27 and the deferred income liability is shown in note 51. In the United States, funding agreements consist of one to ten year fixed rate contracts. These contracts may not be cancelled by the holders unless there is a default under the agreement, but may, subject to a call premium, be terminated by Aviva at any time. Aviva issued no new funding agreements in 2010. The weighted average interest rates for fixed-rate and floating-rate funding agreements as at 31 December 2010 were 4.758% and 0.434% respectively. Funding agreements issued before 2008 are measured at fair value equal to the present value of contractual cash flows and, for business issued since 2008, are measured at amortised cost. Most funding agreements are fully collateralised and therefore their fair values are not adjusted for own credit risk. Funding agreements carried at fair value total £1.0 billion and are classified as ‘Level 2’ in the fair value hierarchy. There is a small volume of annuity certain business for which the liability is measured at amortised cost using the effective interest method. The fair value of contract liabilities measured at amortised cost is not materially different from the amortised cost liability.

Performance reviewCorporate responsibilityGovernanceShareholder informationFinancial statements IFRSFinancial statements MCEVOther information
Financial statements IFRS
Notes to the consolidated financial statements continued
259
Aviva plc Annual Report and Accounts 2010
40 – Liability for investment contracts continued (c) Movements in the year The following movements have occurred in the year:
(i) Participating investment contracts
2010
£m 2009
£m
Carrying amount at 1 January 66,559 65,278 Provisions in respect of new business 6,169 5,973 Expected change in existing business provisions (2,400) (1,256) Variance between actual and expected experience 845 2,469 Impact of operating assumption changes 36 (49) Impact of economic assumption changes 240 (57) Other movements (65) (1,316) Change in liability recognised as an expense 4,825 5,764 Effect of portfolio transfers, acquisitions and disposals — (246) Foreign exchange rate movements (1,918) (4,256) Other movements 16 19
Carrying amount at 31 December 69,482 66,559
The variance between actual and expected experience of £0.8 billion was primarily driven by favourable movements in investment markets in 2010, which had a direct or indirect impact on liability values. Equity markets increased, government bond yields fell in major markets and credit spreads on corporate bonds were broadly unchanged. For many types of long-term business, including unit-linked and participating funds, movements in asset values are offset by corresponding changes in liabilities, limiting the net impact on profit. Minor variances arise from differences between actual and expected experience for persistency, mortality and other demographic factors. The impact of assumption changes in the above analysis shows the resulting movement in the carrying value of participating investment contract liabilities. The £0.8 billion variance between actual and expected experience is not a change in assumptions. For participating business, a movement in liabilities is generally offset by a corresponding adjustment to the unallocated divisible surplus and does not impact on profit. Where assumption changes do impact on profit, these are included in the effect of changes in assumptions and estimates during the year shown in note 43, together with the impact of movements in related non-financial assets.
(ii) Non-participating investment contracts
2010
£m 2009
£m
Carrying amount at 1 January 43,456 42,281 Provisions in respect of new business 4,096 3,045 Expected change in existing business provisions (2,145) (1,847) Variance between actual and expected experience 1,276 2,495 Impact of operating assumption changes 20 107 Impact of economic assumption changes 3 4 Other movements 53 370 Change in liability 3,303 4,174 Effect of portfolio transfers, acquisitions and disposals 1,903 (1,596) Foreign exchange rate movements (357) (1,403)
Carrying amount at 31 December 48,305 43,456
The variance between actual and expected experience of £1.3 billion was primarily driven by favourable movements in investment markets in 2010, which had a direct or indirect impact on liability values. Equity markets increased, government bond yields fell in major markets and credit spreads on corporate bonds were broadly unchanged. For unit-linked investment contracts, movements in asset values are offset by corresponding changes in liabilities, limiting the net impact on profit. Minor variances arise from differences between actual and expected experience for persistency, mortality and other demographic factors. The impact of assumption changes in the above analysis shows the resulting movement in the carrying value of non-participating investment contract liabilities. The £1.3 billion variance between actual and expected experience is not a change in assumptions. The impact of assumption changes on profit are included in the effect of changes in assumptions and estimates during the year shown in note 43, which combines participating and non-participating investment contracts together with the impact of movements in related non-financial assets.

Notes to the consolidated financial statements continued
260
Aviva plc Annual Report and Accounts 2010
41 – Financial guarantees and options This note details the financial guarantees and options we have given for some of our insurance and investment products. As a normal part of their operating activities, various Group companies have given guarantees and options, including investment return guarantees, in respect of certain long-term insurance and fund management products. Further information on assumptions is given in notes 39 and 40.
(a) UK Life with-profit business In the UK, life insurers are required to comply with the FSA’s realistic reporting regime for their with-profit funds for the calculation of FSA liabilities. Under the FSA’s rules, provision for guarantees and options within realistic liabilities must be measured at fair value, using market-consistent stochastic models. A stochastic approach includes measuring the time value of guarantees and options, which represents the additional cost arising from uncertainty surrounding future economic conditions. The material guarantees and options to which this provision relates are:
(i) Maturity value guarantees Substantially all of the conventional with-profit business and a significant proportion of unitised with-profit business have minimum maturity values reflecting the sums assured plus declared annual bonus. In addition, the guarantee fund has offered maturity value guarantees on certain unit-linked products. For some unitised with-profit life contracts the amount paid after the fifth policy anniversary is guaranteed to be at least as high as the premium paid increased in line with the rise in RPI/CPI.
(ii) No market valuation reduction (MVR) guarantees For unitised business, there are a number of circumstances where a ‘no MVR’ guarantee is applied, for example on certain policy anniversaries, guaranteeing that no market value reduction will be applied to reflect the difference between the accumulated value of units and the market value of the underlying assets.
(iii) Guaranteed annuity options The Group’s UK with-profit funds have written individual and group pension contracts which contain guaranteed annuity rate options (GAOs), where the policyholder has the option to take the benefits from a policy in the form of an annuity based on guaranteed conversion rates. The Group also has exposure to GAOs and similar options on deferred annuities. Realistic liabilities for GAOs in the UK with-profit funds were £823 million at 31 December 2010 (2009: £760 million). With the exception of the New With-Profits Sub Fund (NWPSF), movements in the realistic liabilities in the with-profit funds are offset by a corresponding movement in the unallocated divisible surplus, with no net impact on IFRS profit. Realistic liabilities for GAOs in the NWPSF were £131 million at 31 December 2010 (2009: £109 million).
(iv) Guaranteed minimum pension The Group’s UK with-profit funds also have certain policies that contain a guaranteed minimum level of pensions as part of the condition of the original transfer from state benefits to the policy. In addition, the with-profit fund companies have made promises to certain policyholders in relation to their with-profit mortgage endowments. Top-up payments will be made on these policies at maturity to meet the mortgage value up to a maximum of the 31 December 1999 illustrated shortfall. For UKLAP WP policyholders, these payments are subject to certain conditions.
(b) UK Life non-profit business The Group’s UK non-profit funds are evaluated by reference to statutory reserving rules, including changes introduced in 2006 under FSA Policy Statement 06/14 Prudential Changes for Insurers.
(i) Guaranteed annuity options Similar options to those written in the with-profit fund have been written in relation to non-profit products. Provision for these guarantees does not materially differ from a provision based on a market-consistent stochastic model, and amounts to £31 million at 31 December 2010 (2009: £28 million).
(ii) Guaranteed unit price on certain products Certain unit-linked pension products linked to long-term life insurance funds provide policyholders with guaranteed benefits at retirement or death. No additional provision is made for this guarantee as the investment management strategy for these funds is designed to ensure that the guarantee can be met from the fund, mitigating the impact of large falls in investment values and interest rates.
(c) Overseas life businesses In addition to guarantees written in the Group’s UK life businesses, our overseas businesses have also written contracts containing guarantees and options. Details of the significant guarantees and options provided by overseas life businesses are set out below.
(i) France Guaranteed surrender value and guaranteed minimum bonuses Aviva France has written a number of contracts with such guarantees. The guaranteed surrender value is the accumulated value of the contract including accrued bonuses. Bonuses are based on accounting income from amortised bond portfolios, where the duration of bond portfolios is set in relation to the expected duration of the policies, plus income and releases from realised gains on equity-type investments. Policy reserves are equal to guaranteed surrender values. Local statutory accounting envisages the establishment of a reserve, ‘Provision pour Aléas Financiers’ (PAF), when accounting income is less than 125% of guaranteed minimum credited returns. No PAF was established at the end of 2010.

Performance reviewCorporate responsibilityGovernanceShareholder informationFinancial statements IFRSFinancial statements MCEVOther information
Financial statements IFRS
Notes to the consolidated financial statements continued
261
Aviva plc Annual Report and Accounts 2010
41 – Financial guarantees and options continued The most significant of these contracts is the AFER Eurofund which has total liabilities of £34 billion at 31 December 2010 (2009: £33 billion). Up to 2010, the guaranteed bonus on this contract equalled 75% of the average of the last two years’ declared bonus rates. Starting from year end 2010, Aviva France and the AFER association will agree the guaranteed bonus on this contract at every year end for the following year. This bonus was 3.55% for 2010 (2009: 3.67%) compared with an accounting income from the fund of 4.01% (2009: 4.62%). Non-AFER contracts with guaranteed surrender values had liabilities of £13 billion at 31 December 2010 (2009: £12 billion) and all guaranteed annual bonus rates are between 0% and 4.5%.
Guaranteed death and maturity benefits In France, the Group has also sold unit-linked policies where the death and/or maturity benefit is guaranteed to be at least equal to the premiums paid. The reserve held in the Group’s consolidated statement of financial position at the end of 2010 for this guarantee is £85 million (2009: £97 million). The reserve is calculated on a prudent basis and is in excess of the economic liability. At the end of 2010, total sums at risk for these contracts were £242 million (2009: £372 million) out of total unit-linked funds of £14 billion (2009: £14 billion). The average age of policyholders was approximately 54. It is estimated that this liability would increase by £93 million (2009: £71 million) if yields were to decrease by 1% per annum and by £22 million (2009: £25 million) if equity markets were to decline by 10% from year end 2010 levels. These figures do not reflect our ability to review the tariff for this option.
(ii) Delta Lloyd Guaranteed minimum return at maturity In the Netherlands, it is market practice to guarantee a minimum return at maturity on traditional savings and pension contracts. Guarantees on older lines of business are 4% per annum, while for business written since 1 September 1999, the guarantee is 3% per annum. On Group pensions business, it is often possible to recapture guarantee costs through adjustments to surrender values or to premium rates. On transition to IFRS, Delta Lloyd changed the reserving basis for most traditional contracts to reflect current market interest rates, for consistency with the reporting of assets at market value. The cost of meeting interest rate guarantees is allowed for directly in the liabilities. Although most traditional contracts are valued at market interest rate, the split by level of guarantee shown below is according to the original underlying guarantee. The total liabilities for traditional business at 31 December 2010 are £13 billion (2009: £13 billion) analysed as follows:
Liabilities 3% guarantee
2010 £m
2009 £m
Individual 2,216 2,206 Group pensions 869 780
Total 3,085 2,986
Liabilities 4% guarantee 2010
£m 2009
£m
Individual 3,447 3,690 Group pensions 6,274 6,329
Total 9,721 10,019
Delta Lloyd has certain unit-linked contracts which provide a guaranteed minimum return at maturity from 4% pa to 2% pa. Provisions consist of unit values plus an additional reserve for the guarantee. The additional provision for the guarantee was £88 million (2009: £148 million). An additional provision of £15 million (2009: £33 million) in respect of investment return guarantees on group segregated fund business is held. It is estimated that the provision would increase by £106 million (2009: £180 million) if yields were to reduce by 1% pa and by £37 million (2009: £42 million) if equity markets were to decline by 10% from year end 2010 levels.
(iii) Ireland Guaranteed annuity options Products with similar GAOs to those offered in the UK have been issued in Ireland. The current net of reinsurance provision for such options is £236 million (2009: £214 million). This has been calculated on a deterministic basis, making conservative assumptions for the factors which influence the cost of the guarantee, principally annuitant mortality option take-up and long-term interest rates. These GAOs are ‘in the money’ at current interest rates but the exposure to interest rates under these contracts has been hedged through the use of reinsurance, using derivatives (swaptions). The swaptions effectively guarantee that an interest rate of 5% will be available at the vesting date of these benefits so there is reduced exposure to a further decrease in interest rates.

Notes to the consolidated financial statements continued
262
Aviva plc Annual Report and Accounts 2010
41 – Financial guarantees and options continued ‘No MVR’ guarantees Certain unitised with-profit policies containing ‘no MVR’ guarantees, similar to those in the UK, have been sold in Ireland. These guarantees are currently ‘in-the-money’ by £13 million (2009: £10 million). This has been calculated on a deterministic basis as the excess of the current policy surrender value over the discounted value (excluding terminal bonus) of the guarantees. The value of these guarantees is usually sensitive to the performance of investments held in the with-profit fund. Amounts payable under these guarantees are determined by the bonuses declared on these policies. There is no sensitivity to either interest rates or equity markets since there is no longer any exposure to equity in these funds and a matching strategy has been implemented for bonds.
Return of premium guarantee Until 2005, Aviva Life and Pensions Ireland wrote two tranches of linked bonds with a return of premium guarantee, or a price floor guarantee, after five or six years. The first tranche has now expired. The provision for the second tranche over and above unit and sterling reserves, at the end of 2010 is £9 million (2009: £11 million). It is estimated that the provision would increase by £3 million (2009: £4 million) if equity markets were to decline by 10% from the year end 2010 levels. However, the provision increase would be broadly off-set by an increase in the value of the hedging assets that were set up on sale of these policies. We would not expect any significant impact on this provision as a result of interest rate movements. It is estimated that the provision would increase by £0.5 million (2009: £2 million) if property values were to decline by 10% from year end 2010 levels. This would be offset by an increase in the value of the hedging assets by £0.5 million (2009: £0.4 million), the difference reflecting the fact that only the second tranche was hedged for property exposure.
(iv) Spain and Italy Guaranteed investment returns and guaranteed surrender values The Group has also written contracts containing guaranteed investment returns and guaranteed surrender values in both Spain and Italy. Traditional profit-sharing products receive an appropriate share of the investment return, assessed on a book value basis, subject to a guaranteed minimum annual return of up to 6% in Spain and 4% in Italy on existing business, while on new business the maximum guaranteed rate is lower. Liabilities are generally taken as the face value of the contract plus, if required, an explicit provision for guarantees calculated in accordance with local regulations. At 31 December 2010, total liabilities for the Spanish business were £4 billion (2009: £3 billion) with a further reserve of £12 million (2009: £11 million) for guarantees. Total liabilities for the Italian business were £11 billion (2009: £9 billion), with a further provision of £46 million (2009: £69 million) for guarantees. Liabilities are most sensitive to changes in the level of interest rates. It is estimated that provisions for guarantees would need to increase by £43 million (2009: £46 million) in Spain and £7 million (2009: £21 million) in Italy if interest rates fell by 1% from end 2010 values. Under this sensitivity test, the guarantee provision in Spain is calculated conservatively, assuming a long-term market interest rate of 1.6% and no lapses or premium discontinuances.
(v) United States Indexed and total return strategy products In the United States, the Group writes indexed life and deferred annuity products. These products guarantee the return of principal to the policyholder and credit interest based on certain indices, primarily the Standard & Poor’s 500 Composite Stock Price Index. A portion of each premium is used to purchase derivatives to hedge the growth in interest credited to the policyholder. The derivatives held by the Group and the options embedded in the policy are both carried at fair value. The US Treasury swap curve plus a risk adjustment of 1.47% (2009: 1.87%) for indexed life and 1.48% (2009: 1.65%) for indexed deferred annuities is used as the discount rate to calculate the fair value of the embedded options. The risk adjustment calculation is based on market spreads on senior long-term unsecured Aviva plc debt with a reduction to reflect policyholder priority over other creditors in case of default. The amount of change in the fair value of these embedded options resulting from the risk adjustment in 2010 is an increase of £216 million (2009: £313 million), and is principally attributable to market factors rather than instrument specific credit risk. At 31 December 2010, the total liabilities for indexed products were £20 billion (2009: £17 billion), including liabilities for the embedded option of £2.5 billion (2009: £1.7 billion). If interest rates were to increase by 1%, the provision for embedded options would decrease by £151 million (2009: £59 million) and, if interest rates were to decrease by 1%, the provision would increase by £167 million (2009: £86 million). The Group has certain products that credit interest based on a total return strategy, whereby policyholders are allowed to allocate their premium payments to different asset classes within the general account. The Group guarantees a minimum return of premium plus approximately 3% interest over the term of the contracts. The linked general account assets are fixed maturity securities, and both the securities and the contract liabilities are carried at fair value. At 31 December 2010, the liabilities for total return strategy products were £1.0 billion (2009: £1.2 billion). The Group offers an optional lifetime guaranteed income benefit focused on the retirement income segment of the deferred annuity marketplace to help customers manage income during both the accumulation stage and the distribution stage of their financial life. At 31 December 2010, a total of £8.9 billion (2009: £4.9 billion) in indexed deferred annuities have elected this benefit, taking steps to guarantee retirement income.

Performance reviewCorporate responsibilityGovernanceShareholder informationFinancial statements IFRSFinancial statements MCEVOther information
Financial statements IFRS
Notes to the consolidated financial statements continued
263
Aviva plc Annual Report and Accounts 2010
41 – Financial guarantees and options continued (d) Sensitivity In providing these guarantees and options, the Group’s capital position is sensitive to fluctuations in financial variables including foreign currency exchange rates, interest rates, real estate prices and equity prices. Interest rate guaranteed returns, such as those available on guaranteed annuity options (GAOs), are sensitive to interest rates falling below the guaranteed level. Other guarantees, such as maturity value guarantees and guarantees in relation to minimum rates of return, are sensitive to fluctuations in the investment return below the level assumed when the guarantee was made.
42 – Reinsurance assets This note details the reinsurance recoverables on our insurance and investment contract liabilities.
(a) Carrying amounts The reinsurance assets at 31 December comprised:
2010
£m 2009
£m
Long-term business Insurance contracts 3,650 4,299 Participating investment contracts 2 — Non-participating investment contracts 1,463 1,258 Outstanding claims provisions 104 40
5,219 5,597
General insurance and health Outstanding claims provisions 1,113 1,194 Provisions for claims incurred but not reported 445 449
1,558 1,643 Provision for unearned premiums 307 332
1,865 1,975
Total 7,084 7,572
Of the above total, £4,675 million (2009: £4,493 million) is expected to be recovered more than one year after the statement of financial position date.
(b) Assumptions The assumptions, including discount rates, used for reinsurance contracts follow those used for insurance contracts. Reinsurance assets are valued net of an allowance for their recoverability.
(c) Movements The following movements have occurred in the reinsurance asset during the year:
(i) In respect of long-term business provisions
2010
£m 2009
£m
Carrying amount at 1 January 5,557 5,565 Asset in respect of new business 358 412 Expected change in existing business asset (208) (57) Variance between actual and expected experience 81 (35) Impact of other operating assumption changes (443) (189) Impact of economic assumption changes (25) (250) Other movements (318) 486
Change in asset (555) 367 Effect of portfolio transfers, acquisitions and disposals 174 (41) Foreign exchange rate movements (61) (334) Carrying amount at 31 December 5,115 5,557
The impact of assumption changes in the above analysis shows the resulting movement in the carrying value of reinsurance assets. The reduction in the reinsurance asset from assumption changes mainly relates to assurance mortality assumptions in the UK and Ireland, with a corresponding reduction made to gross insurance contract liabilities. For participating businesses, a movement in reinsurance assets is generally offset by a corresponding adjustment to the unallocated divisible surplus and does not impact on profit. Where assumption changes do impact profit, these are included in the effect of changes in assumptions and estimates during the year shown in note 43, together with the impact of movements in related liabilities and other non-financial assets.

Notes to the consolidated financial statements continued
264
Aviva plc Annual Report and Accounts 2010
42 – Reinsurance assets continued (ii) In respect of general insurance and health outstanding claims provisions and IBNR
2010
£m 2009
£m
Carrying amount at 1 January 1,643 1,766 Impact of changes in assumptions 17 (72) Reinsurers’ share of claim losses and expenses Incurred in current year 265 255 Incurred in prior years (46) 7 Reinsurers’ share of incurred claim losses and expenses 219 262 Less: Reinsurance recoveries received on claims Incurred in current year (125) (138) Incurred in prior years (282) (202) Reinsurance recoveries received in the year (407) (340) Unwind of discounting 23 22
Change in reinsurance asset recognised as income (148) (128) Effect of portfolio transfers, acquisitions and disposals 34 57 Foreign exchange rate movements 28 (50) Other movements 1 (2)
Carrying amount at 31 December 1,558 1,643
(iii) Reinsurers’ share of the provision for unearned premiums (UPR)
2010
£m 2009
£m
Carrying amount at 1 January 332 418 Premiums ceded to reinsurers in the year 770 775 Less: Reinsurers’ share of premiums earned during the year (800) (861) Change in reinsurance asset recognised as income (30) (86) Reinsurers’ share of portfolio transfers and acquisitions 4 5 Foreign exchange rate movements (2) (5) Other movements 3 —
Carrying amount at 31 December 307 332
43 – Effect of changes in assumptions and estimates during the year Certain estimates and assumptions used in determining our liabilities for insurance and investment contract business were changed from 2009 to 2010, affecting the profit recognised for the year with an equivalent effect on liabilities. This note analyses the effect of the changes. This disclosure only allows for the impact on liabilities and related assets, such as reinsurance, deferred acquisition costs and AVIF, and does not allow for offsetting movements in the value of backing financial assets.
Effect on profit 2010
£m
Effect on profit 2009
£m
Assumptions Long-term insurance business Interest rates (796) (363) Expenses (1) 69 Persistency rates 2 — Mortality for assurance contracts 71 11 Mortality for annuity contracts (637) 6 Tax and other assumptions 167 (49) Investment contracts Interest rates 1 20 Expenses 1 40 Persistency rates (21) — Tax and other assumptions (3) (89) General insurance and health business Change in loss ratio assumptions (4) (2) Change in discount rate assumptions (61) 57 Change in expense ratio and other assumptions 38 (21)
Total (1,243) (321)
The impact of interest rates for long-term business relates primarily to the UK driven by the reduction in interest rates. This had the effect of increasing liabilities and hence a negative impact on profit. The overall impact on profit also depends on movements in the value of assets backing the liabilities, which is not included in this disclosure. The impact of mortality for annuity contracts relates to the exceptional strengthening in the Netherlands, following the publication of new mortality tables, and to smaller changes in the UK. Other assumptions relate mainly to the move to realistic reserving in Ireland, which reduced insurance liabilities, and changes in the UK.

Performance reviewCorporate responsibilityGovernanceShareholder informationFinancial statements IFRSFinancial statements MCEVOther information
Financial statements IFRS
Notes to the consolidated financial statements continued
265
Aviva plc Annual Report and Accounts 2010
44 – Unallocated divisible surplus An unallocated divisible surplus (UDS) is established where the nature of policy benefits is such that the division between shareholder reserves and policyholder liabilities is uncertain. This note shows the movements in this surplus during the year. The following movements have occurred in the year:
2010
£m 2009
£m
Carrying amount at 1 January 3,866 2,325 Change in participating contract assets (444) (1,314) Change in participating contract liabilities 169 3,836 Effect of special bonus to with-profit policyholders (see note 45a) (58) (69) Effect of reattribution of inherited estate (see note 45b) — (881) Other movements 4 (25) Change in liability recognised as an expense (329) 1,547 Effect of portfolio transfers, acquisitions and disposals (3) (4) Movement in respect of change in pension scheme deficit (note 48c(i)) 18 (24) Foreign exchange rate movements (61) 43 Other movements (63) (21)
Carrying amount at 31 December 3,428 3,866
In Italy and Spain, the UDS balances were £435 million negative in total at 31 December 2010 (2009: Italy £92 million negative) because of an accounting mismatch between participating assets carried at market value and participating liabilities measured using local practice. The negative balance is considered to be recoverable from margins in the existing participating business liabilities.
45 – Special bonus and reattribution of the inherited estate This note describes the special distribution and reattribution of the inherited estate in our UK Life business.
(a) Special bonus declared by UK Life business On 5 February 2008, the Group’s UK long-term business operation, Norwich Union Life, announced a one-off, special bonus worth an estimated £2.3 billion, benefiting around 1.1 million with-profit policyholders in its CGNU Life and CULAC with-profit funds. The bonus has been used to enhance policy values by around 10% in total, in three instalments, with the qualifying dates being 1 January 2008, 1 January 2009 and 1 January 2010. In accordance with the way the funds are managed, the bonus distribution has been split on a 90/10 basis between policyholders and shareholders. £2,127 million was set aside for policyholders on 1 January 2008 and has been allocated over the three years. Similarly, shareholders were expected to receive £236 million over the three-year period. As explained in accounting policies F and K, the Group’s insurance and participating investment contract liabilities are measured in accordance with IFRS 4, Insurance Contracts, and FRS 27, Life Assurance. The latter requires liabilities for with-profit funds falling within the scope of the UK’s Financial Services Authority’s capital regime to be determined in accordance with this regime, adjusted to remove the shareholders’ share of future bonuses. This required us to recognise planned discretionary bonuses within policyholder liabilities at 31 December 2007, even if there was no constructive obligation at the time. As a result of the announcement made above, a transfer of £2,127 million was made in 2007 from the UDS in order to increase insurance liabilities by £1,728 million and participating investment contract liabilities by £399 million. Of the original £236 million due to shareholders, £58 million has been transferred from the UDS in 2010 (2009: £69 million).
(b) Impact of the reattribution of the inherited estate On 1 October 2009, a reorganisation of the with-profit funds of CGNU Life Assurance Limited (CGNU) and Commercial Union Life Assurance Company Limited (CULAC) was approved by the Board and became effective. The reorganisation was achieved through a reattribution to shareholders of the inherited estates of these funds. As part of the reorganisation the two funds were merged and transferred to Aviva Life & Pensions UK Limited (UKLAP). Within UKLAP, two new with-profit sub-funds were created. Policies of non-electing policyholders were transferred to the Old With-Profit Sub-Fund (OWPSF). The inherited estate has not been reattributed and remains in the OWPSF. Where policyholders elected to accept the reattribution, their policies were transferred to the New With-Profit Sub-Fund (NWPSF). The inherited estate, totalling £1,105 million at 1 October 2009, was reattributed to a separate long-term fund called the Non-Profit Sub-Fund 1(NPSF1), in which 100% of the surplus is attributable to shareholders. On the effective date of 1 October 2009, the unallocated divisible surplus of NWPSF was released as it has been allocated to shareholders. The reorganisation scheme has imposed certain restrictions around release of the assets allocated to shareholders as a result of this transaction, to ensure that sufficient protection for with-profit policyholder benefits is maintained. The initial impact of the reorganisation on profit before tax in 2009 was £202 million, of which a loss of £5 million was recognised in operating profit, reflecting the value derived from the reorganisation. The remaining £207 million was recognised outside operating profit, offsetting the shareholder tax attributable to the transaction. The ongoing impact of the reattribution is that profit recognised in the NWPSF, which prior to the reattribution would have been transferred to the unallocated distributable surplus, is now recognised in profit attributable to shareholders.

Notes to the consolidated financial statements continued
266
Aviva plc Annual Report and Accounts 2010
46 – Tax assets and liabilities This note analyses the tax assets and liabilities that appear in the statement of financial position, and explains the movements in these balances in the year.
(a) Current tax Current tax assets recoverable and liabilities payable in more than one year are £76 million and £246 million (2009: £254 million and £49 million). The taxation of foreign profits and worldwide debt cap rules were enacted in the Finance Act 2009. Under the foreign profits rules, a dividend exemption was introduced which largely exempts dividends received on or after 1 July 2009 from UK corporation tax. The Group has applied this legislation in arriving at its UK tax results for 2009 and 2010. The worldwide debt cap rules do not apply to Aviva plc in the period ended 31 December 2010 because the Group is a qualifying financial services group in the period.
(b) Deferred tax (i) The balances at 31 December comprise:
2010
£m 2009
£m
Deferred tax assets 288 218 Deferred tax liabilities (1,758) (1,038)
Net deferred tax liability (1,470) (820)
(ii) The net deferred tax liability arises on the following items:
2010
£m 2009
£m
Long-term business technical provisions and other insurance items 1,051 1,290 Deferred acquisition costs (678) (662) Unrealised gains on investments (1,465) (915) Pensions and other post-retirement obligations 91 100 Unused losses and tax credits 713 824 Subsidiaries, associates and joint ventures (9) (7) Intangibles and additional value of in-force long-term business (656) (766) Provisions and other temporary differences (517) (684)
Net deferred tax liability (1,470) (820)
(iii) The movement in the net deferred tax liability was as follows:
2010
£m 2009
£m
Net liability at 1 January (820) (421) Acquisition and disposal of subsidiaries (44) (22) Amounts charged to profit (note 13a) (398) (254) Amounts charged to other comprehensive income (note 13b) (146) (196) Exchange differences 7 37 Other movements (69) 36
Net liability at 31 December (1,470) (820)
Deferred tax assets are recognised to the extent that it is probable that future taxable profits will be available against which the temporary differences can be utilised. In countries where there is a history of tax losses, deferred tax assets are only recognised in excess of deferred tax liabilities if there is convincing evidence that future profits will be available. Where this is the case, the directors have relied on business plans supporting future profits. The Group has unrecognised tax losses and other temporary differences of £2,150million (2009: £2,975 million) to carry forward against future taxable income of the necessary category in the companies concerned. Of these, trading losses of £185 million will expire within the next 15 years. The remaining losses have no expiry date. In addition, the Group has unrecognised capital losses of £384 million (2009: £462 million). Of these, £35 million will expire within the next 15 years. The remaining capital losses have no expiry date. Deferred tax liabilities have not been established for temporary differences in respect of unremitted overseas retained earnings of £140 million (2009: £144 million) associated with investments in subsidiaries and interests in joint ventures and associates because the Group can control the timing of the reversal of these differences and it is probable that they will not reverse in the foreseeable future. The temporary differences represent the unremitted earnings of those overseas subsidiaries in respect of which a tax liability may still arise on remittance of those earnings to the UK, principally as a result of overseas withholding taxes on dividends.

Performance reviewCorporate responsibilityGovernanceShareholder informationFinancial statements IFRSFinancial statements MCEVOther information
Financial statements IFRS
Notes to the consolidated financial statements continued
267
Aviva plc Annual Report and Accounts 2010
47 – Provisions This note details the non-insurance provisions that the Group holds, and shows the movements in these during the year.
(a) Carrying amounts
2010
£m 2009
£m
Deficits in the main staff pension schemes (note 48e(vii)) 527 1,707 Other obligations to main staff pension schemes – insurance policies issued by Group companies (note 48e(vii)) 1,445 1,351
Total IAS 19 obligations to main staff pension schemes 1,972 3,058 Deficits in other staff pension schemes 129 125
Total IAS 19 obligations to staff pension schemes 2,101 3,183 Restructuring provisions 152 198 Other provisions 690 599
Total 2,943 3,980
Other provisions comprise many small provisions throughout the Group for obligations such as costs of compensation, litigation, staff entitlements and reorganisation. Of the total, £2,245 million (2009: £3,375 million) is expected to be settled more than one year after the statement of financial position date.
(b) Movements on restructuring and other provisions
2010
Restructuring provisions
£m
Other provisions
£m Total
£m
At 1 January 198 599 797 Additional provisions 129 281 410 Unused amounts reversed (6) (74) (80) Change in the discounted amount arising from passage of time — 6 6
Charge to income statement 123 213 336 Utilised during the year (160) (119) (279) Acquisition of subsidiaries — 2 2 Foreign exchange rate movements (9) (5) (14)
At 31 December 152 690 842
2009
Restructuring provisions
£m
Other provisions
£m Total
£m
At 1 January 253 591 844 Additional provisions 348 336 684 Unused amounts reversed (13) (23) (36) Change in the discounted amount arising from passage of time (7) (23) (30)
Charge to income statement 328 290 618 Utilised during the year (370) (239) (609) Acquisition of subsidiaries — (32) (32) Foreign exchange rate movements (13) (11) (24)
At 31 December 198 599 797

Notes to the consolidated financial statements continued
268
Aviva plc Annual Report and Accounts 2010
48 – Pension obligations This note describes the Group’s pension arrangements for its employees and explains how our obligations to these schemes are calculated.
(a) Introduction The Group operates a large number of defined benefit and defined contribution pension schemes around the world. The only material defined benefit schemes are in the UK, the Netherlands, Canada and Ireland and, of these, the main UK scheme is by far the largest. This note gives full IAS 19 disclosures for these schemes whilst the smaller ones, while still measured under IAS 19, are included as one total within Provisions (see note 47). Similarly, while the charges to the income statement for the main schemes are shown in section (e)(iv) below, the total charges for all pension schemes are disclosed in section (d) below. The assets of the main UK, Irish and Canadian schemes are held in separate trustee-administered funds to meet long-term pension liabilities to past and present employees. In the Netherlands, the main scheme is held in a separate foundation which invests in the life funds of the Group. In all schemes, the appointment of trustees of the funds is determined by their trust documentation, and they are required to act in the best interests of the schemes’ beneficiaries. The long-term investment objectives of the trustees and the employers are to limit the risk of the assets failing to meet the liabilities of the schemes over the long term, and to maximise returns consistent with an acceptable level of risk so as to control the long-term costs of these schemes. A full actuarial valuation of each of the defined benefit schemes is carried out at least every three years for the benefit of scheme trustees and members. Actuarial reports have been submitted for each scheme within this period, using appropriate methods for the respective countries on local funding bases.
(b) Membership The number of scheme members at 31 December 2010 was as follows:
United Kingdom Netherlands
2010 Number
2009 Number 2010
Number 2009
Number
Active members 7,261 8,164 4,453 4,637 Deferred members 52,833 53,221 6,090 6,155 Pensioners 29,754 28,878 3,152 3,119
Total members 89,848 90,263 13,695 13,911
Canada Ireland
2010 Number
2009 Number
2010 Number
2009 Number
Active members 732 816 1,082 1,143 Deferred members 578 558 933 877 Pensioners 1,288 1,291 683 684
Total members 2,598 2,665 2,698 2,704
(c) UK schemes In the UK, the Group operates two main pension schemes, the Aviva Staff Pension Scheme (ASPS) and the smaller RAC (2003) Pension Scheme. New entrants join the defined contribution section of the ASPS, as the defined benefit section is closed. This scheme is operated by a trustee company, with 11 trustee directors, comprising representatives of the employers, staff, pensioners and an independent trustee (referred to below as the trustees). On 20 October 2010, following formal consultation, the Group confirmed its decision to close the final salary sections of both UK schemes with effect from 1 April 2011, with entry into the defined contribution sections being offered to the staff members affected. The consequential reduction in the liabilities of both schemes, arising from projecting forward salaries using estimates of inflation rather than salary inflation, is £320 million. Additional contributions to affected members’ defined contribution accounts and implementation costs have resulted in an overall gain on closure of £286 million, which is considered a profit arising in 2010. Closure of the schemes removes the volatility associated with adding future accrual for active members and will also lead to lower service costs and their expected cash funding from 2011 onwards.

Performance reviewCorporate responsibilityGovernanceShareholder informationFinancial statements IFRSFinancial statements MCEVOther information
Financial statements IFRS
Notes to the consolidated financial statements continued
269
Aviva plc Annual Report and Accounts 2010
48 – Pension obligations continued (i) Defined benefit section of the ASPS The Company works closely with the trustees who are required to consult it on the funding of the scheme and its investment strategy. Following each actuarial valuation, the Company and the trustees agree the level of contributions needed and funding levels are then monitored on an annual basis. At 31 March 2009, the date of the last actuarial valuation, this section of the scheme had an excess of obligations over available assets, on a funding basis, which uses more prudent assumptions than are required for reporting under IAS 19, of £3.0 billion. As a result of that valuation, the Company and the trustees have agreed a long-term funding plan where contributions, together with anticipated growth in scheme investments, are expected to eliminate the funding deficit over time. Under this agreement, deficit funding payments of £378 million were made in 2010, and are expected to be £136 million in 2011. Partly as a result of the higher funding payments and the impact on scheme liabilities of the scheme closures described above, the funding deficit is estimated to have fallen to £1.3 billion at 31 December 2010. The employing companies’ contributions to the defined benefit section of the ASPS throughout 2010 were 48% of employees’ pensionable salaries, together with the cost of redundancies during the year and the additional deficit funding described above, together totalling £501 million. Until 31 March 2011, the employers’ contribution rate for 2011 has been maintained as 48% of pensionable salaries, with expected service funding contributions for that period falling to £25 million. Active members of this section of the ASPS contributed between 5% and 7.5% of their pensionable salaries during 2010. In 2006, the Group’s UK life business carried out an investigation into the allocation of costs in respect of funding the ASPS, to identify the deficit that arose in respect of accruals prior to the introduction of the current management services agreements (MSAs) and to propose a split between individual product companies based on an allocation of the deficit into pre- and post-MSA amounts. The results of this review were agreed by the relevant company boards and accepted by the UK regulator. Consequently, with effect from 1 January 2006, the Company’s UK with-profit product companies have been liable for a share of the additional payments for deficit funding referred to above up to a total of £130 million. This has resulted in movements between the unallocated divisible surplus (UDS) and retained earnings via the statement of comprehensive income of (£18) million in 2010 (2009: £24 million) to reflect changes in the amount recoverable from the with-profit product companies.
(ii) Defined contribution (money purchase) section of the ASPS The trustees have responsibility for selecting a range of suitable funds in which the members can choose to invest and for monitoring the performance of the available investment funds. Members are responsible for reviewing the level of contributions they pay and the choice of investment fund to ensure these are appropriate to their attitude to risk and their retirement plans. Members of this section contribute at least 1% of their pensionable salaries and, depending on the percentage chosen, the Company contributes up to a maximum 14%, together with the cost of the death-in-service benefits. These contribution rates are unchanged for 2011.
(d) Credit/charges to the income statement The total pension (credit)/costs of all the Group’s defined benefit and defined contribution schemes were:
2010
£m 2009
£m
UK defined benefit schemes (227) 84 Overseas defined benefit schemes 52 103
Total defined benefit schemes (note 10b) (175) 187 UK defined contribution schemes 53 53 Overseas defined contribution schemes 17 20
Total defined contribution schemes (note 10b) 70 73
Total (credit)/charge for pension schemes (105) 260
The credit for the defined benefit schemes arises from the £286 million gain on the closure of the UK scheme to future accrual, described in section (c) above. There were no significant contributions outstanding or prepaid as at either 31 December 2009 or 2010.
(e) IAS 19 disclosures Disclosures under IAS 19 for the material defined benefit schemes in the UK, the Netherlands, Canada and Ireland are given below. Where schemes provide both defined benefit and defined contribution pensions, the assets and liabilities shown exclude those relating to defined contribution pensions. Total employer contributions for these schemes in 2011, including the ASPS deficit funding, are expected to be £285 million.
(i) Assumptions on scheme liabilities The projected unit credit method The inherent uncertainties affecting the measurement of scheme liabilities require these to be measured on an actuarial basis. This involves discounting the best estimate of future cash flows to be paid out by the scheme using the projected unit credit method. This is an accrued benefits valuation method which calculates the past service liability to members and makes allowance for their projected future earnings. It is based on a number of actuarial assumptions, which vary according to the economic conditions of the countries in which the relevant businesses are situated, and changes in these assumptions can materially affect the measurement of the pension obligations.

Notes to the consolidated financial statements continued
270
Aviva plc Annual Report and Accounts 2010
48 – Pension obligations continued Alternative measurement methods There are alternative methods of measuring liabilities, for example by calculating an accumulated benefit obligation (the present value of benefits for service already rendered but with no allowance for future salary increases) or on a solvency basis, using the cost of securing the benefits at a particular date with an insurance company or one of the growing market of alternative buy-out providers. This could take the form of a buy-out, in which the entire liability will be settled in one payment with all obligations transferred to an insurance company or buy-out provider, or a buy-in, in which annuities or other insurance products are purchased to cover a part or all of the liability. A valuation of the liabilities in either of these cases will almost always result in a higher estimate of the pension deficit than under an ongoing approach, as they assume that the sponsor immediately transfers the majority, if not all, of the risk to another provider who would be seeking to make a profit on the transaction. However, there are only a limited number of organisations that would be able to offer these options for schemes of the size of those in our Group. The full buy-out cost would only be known if quotes were obtained from such organisations but, to illustrate the cost of a buy-out valuation, an estimate for the main UK scheme is that the year-end liabilities of £7.9 billion could be valued some £4.1 billion higher, at £12.0 billion. There is a small buy-out market in Ireland, largely restricted to pensions currently in payment and it is not clear whether current capacity would enable an immediate buy-out of our Irish pension liabilities at present. The Canadian defined benefit plan’s liabilities represent the likely limit on what the Canadian group annuity market could absorb at normal competitive group annuity prices if the entire plan were subject to a buy-out valuation. There is in fact a reasonably high chance that only a portion of the plan’s liabilities could be absorbed in one tranche. IAS 19 requires us to use the projected unit credit method to measure our pension scheme liabilities. Neither of the alternative methods is considered appropriate in presenting fairly the Group’s obligations to the members of its pension schemes on an ongoing basis, so they are not considered further.
Valuations and assumptions The valuations used for accounting under IAS 19 have been based on the most recent full actuarial valuations, updated to take account of that standard’s requirements in order to assess the liabilities of the material schemes at 31 December 2010. Scheme assets are stated at their fair values at 31 December 2010. The main actuarial assumptions used to calculate scheme liabilities under IAS 19 are:
UK Netherlands
2010 2009 2010 2009
Inflation rate 3.5% 3.6% 1.9% 2.1% General salary increases 5.3% 5.4% 2.9%* 3.1%* Pension increases 3.5% 3.6% 1.9** 2.1%/1.9%** Deferred pension increases 3.5% 3.6% 1.9%** 2.1%/1.9%** Discount rate 5.5% 5.7% 5.1% 5.2% Basis of discount rate AA-rated corporate bonds AA-rated corporate bonds * Age-related scale increases plus 2.9% (2009: 3.1%). ** 2.1% until 2011 and expected return less 3% thereafter (2009: 2.1% until 2011 and 1.9% thereafter) .
Canada Ireland
2010 2009 2010 2009
Inflation rate 2.5% 2.5% 2.0% 2.0% General salary increases 3.75% 3.75% 3.5% 3.5% Pension increases 1.25% 1.25% 2.0% 2.0% Deferred pension increases — — 2.0% 2.0% Discount rate 5.0% 5.5% 5.6% 5.5% Basis of discount rate AA-rated corporate bonds AA-rated corporate bonds The discount rate and pension increase rate are the two assumptions that have the largest impact on the value of the liabilities, with the difference between them being known as the net discount rate. For each country, the discount rate is based on current average yields of high-quality debt instruments taking account of the maturities of the defined benefit obligations. A 1% increase in this rate (and therefore the net discount rate) would reduce the liabilities by £1.6 billion and the service cost for the year by £36 million. It would also reduce the interest cost on those liabilities by £2 million.
Mortality assumptions Mortality assumptions are significant in measuring the Group’s obligations under its defined benefit schemes, particularly given the maturity of these obligations in the material schemes. The assumptions used are summarised in the table below and have been selected to reflect the characteristics and experience of the membership of these schemes.

Performance reviewCorporate responsibilityGovernanceShareholder informationFinancial statements IFRSFinancial statements MCEVOther information
Financial statements IFRS
Notes to the consolidated financial statements continued
271
Aviva plc Annual Report and Accounts 2010
48 – Pension obligations continued The mortality tables, average life expectancy and pension duration used at 31 December 2010 for scheme members are as follows:
Life expectancy/(pension
duration) at NRA of a male Life expectancy/(pension
duration) at NRA of a female
Mortality table
Normal
retirement age (NRA)
Currently
aged NRA
20 years younger
than NRA
Currently
aged NRA
20 years younger
than NRA
UK – ASPS Club Vita pooled experience, including an allowance for future improvements 60
89.6 (29.6)
92.8 (32.8)
89.7 (29.7)
91.9 (31.9)
– RAC SAPS series 1, including allowances for future improvement
65
87.6 (22.6)
90.6 (25.6)
89.7 (24.7)
91.7 (26.7)
Netherlands CBS 2010, adjusted for experience and allowance for future improvements 65
85.5 (20.5)
86.9 (21.9)
87.5 (22.5)
88.7 (23.7)
Canada UP1994 projected to 2020, using Projection Scale AA
65
84.4 (19.4)
84.8 (19.8)
86.8 (21.8)
86.8 (21.8)
Ireland 94% PNA00 with allowance for future improvements 61 86.5 (25.5)
89.5 (28.5)
89.3 (28.3)
92.3 (31.3)
The assumptions above are based on commonly used mortality tables and, in the UK, have been changed to those used by both schemes’ trustees in the most recent full actuarial valuations. The new tables make allowance for observed variations in such factors as age, gender, pension amount, salary and postcode-based lifestyle group, and have been adjusted to reflect recent research into mortality experience. However, the extent of future improvements in longevity is subject to considerable uncertainty and judgement is required in setting this assumption. In the UK schemes, which are by far the most material to the Group, the assumptions include an allowance for future mortality improvement, based on the actuarial profession’s long and medium cohort projection tables (for the ASPS and RAC schemes respectively) and incorporating underpins to the rate of future improvement equal to 1.5% pa for males and 1.0% pa for females. The effect of assuming all members were one year younger would increase the above schemes’ liabilities by £240 million and the service cost for the year by £3 million. The discounted scheme liabilities have an average duration of 18 years in the UK schemes and between 12 and 19 years in the overseas schemes. The undiscounted benefits payable from the main UK defined benefit scheme are expected to be as shown in the chart below:
700
0
100
200
300
500
600
2011 2041 21012071
Undiscounted benefit payments £m
400
Current active and deferred member cash flows Pensioner cash flows
(ii) Assumptions on scheme assets The expected rates of return on the schemes’ assets are:
UK Netherlands Canada Ireland
2011 2010 2011 2010 2011 2010 2011 2010
Equities 7.2% 7.8% 6.2% 6.8% 7.0% 7.6% 6.9% 7.2% Bonds 4.4% 4.8% 3.6% 4.3% 3.2% 3.5% 2.7% 4.5% Property 5.7% 6.3% 2.9% 5.2% n/a n/a 5.4% 5.7% Cash 0.6% 0.9% n/a n/a n/a n/a 2.7% 2.9%
The overall rates of return are based on the expected returns within each asset category and on current asset allocations. The expected returns for equities and properties are aligned with the rates used for the longer-term investment return assumptions, other than in the Netherlands, where they have been developed in conjunction with external advisers due to the characteristics of the scheme. The figures for the total expected return on scheme assets in the following section are stated after deducting investment expenses.

Notes to the consolidated financial statements continued
272
Aviva plc Annual Report and Accounts 2010
48 – Pension obligations continued (iii) Investments in Group-managed funds and insurance policies Plan assets include investments in Group-managed funds in the consolidated statement of financial position of £116 million (2009: £101 million) in the UK scheme, and insurance policies with other Group companies of £160 million and £1,445 million (2009: £157 million and £1,351 million) in the UK and Dutch schemes respectively. The Dutch insurance policies are considered non-transferable under the terms of IAS 19 and so have been treated as other obligations to staff pension schemes within provisions (see note 47). The treatment in the relevant parts of the financial statements is as follows: Plan assets – The treatment of these funds and policies in the consolidated statement of financial position is described above. Expected rates of return – Where the relevant insurance policies are in segregated funds with specific asset allocations, their expected rates of return are included in the appropriate line in the table in section (ii) above. Pension expense – To avoid double-counting of investment income on scheme assets and the assets backing the underlying policies, adjustments have been made to the former in the tables in section (iv) below.
(iv) Pension expense As noted above, plan assets in the UK and Dutch schemes include insurance policies with other Group companies. To avoid double-counting of investment income on scheme assets and the assets backing the underlying policies, adjustments have been made to the former as shown in the tables below. The total pension expense for these schemes comprises:
Recognised in the income statement
2010
£m 2009
£m
Current service cost (160) (131) Past service cost (10) (25) Gains on curtailments 347 38 Gains on settlements — 11
Total pension credit/(cost) charged to net operating expenses 177 (107) Expected return on scheme assets 522 466 Less: Income on insurance policy assets accounted for elsewhere (see (iii) above) (65) (58)
457 408 Interest charge on scheme liabilities (652) (591)
Charge to finance costs (notes 2(a) & 7) (195) (183)
Total charge to income (18) (290)
The gains on curtailments principally arise from closure of the UK schemes to future accrual, described in section (c) above.
Recognised in the statement of comprehensive income
2010
£m 2009
£m Expected return on scheme assets (522) (466) Actual return on these assets 1,145 1,009
Actuarial gains on scheme assets 623 543 Less: (gains)/losses on insurance policy assets accounted for elsewhere (see (iii) above) (80) 18
Actuarial gains on admissible assets 543 561 Experience gains arising on scheme liabilities 450 77 Changes in assumptions underlying the present value of the scheme liabilities 6 (1,778)
Actuarial gains/(losses) recognised in other comprehensive income 999 (1,140)
Attributable to equity shareholders of Aviva plc 1,033 (1,140) Attributable to non-controlling interests (34) —
999 (1,140)
The gain arising from changes in assumptions in 2010 reflects the impact of lower discount rates for liabilities across all but the Irish schemes, together with the impact of changes in mortality assumptions in the UK and Dutch schemes, and changes in the revaluation rate for certain benefits in deferment in the UK schemes as a result of recent government legislation. The cumulative amount of actuarial gains and losses on the pension schemes recognised in other comprehensive income since 1 January 2004 (the date of transition to IFRS) is a loss of £1,231 million at 31 December 2010 (2009: cumulative loss of £2,230 million).

Performance reviewCorporate responsibilityGovernanceShareholder informationFinancial statements IFRSFinancial statements MCEVOther information
Financial statements IFRS
Notes to the consolidated financial statements continued
273
Aviva plc Annual Report and Accounts 2010
48 – Pension obligations continued (v) Experience gains and losses The following disclosures of experience gains and losses give a five-year history. Scheme assets exclude insurance policies with Group companies and income on the assets underlying them.
2010
£m 2009
£m 2008
£m 2007
£m 2006
£m
Fair value of scheme assets at the end of the year 9,971 8,754 7,936 8,814 8,137 Present value of scheme liabilities at the end of the year (11,419) (11,812) (9,951) (10,017) (10,196)
Net deficits in the schemes (1,448) (3,058) (2,015) (1,203) (2,059)
Difference between the expected and actual return on scheme assets Amount of gains/(losses) 547 561 (1,893) (138) 251 Percentage of the scheme assets at the end of the year 5.5% 6.4% 23.8% 1.6% 3.1% Experience gains/(losses) on scheme liabilities (excluding changes in assumptions) Amount of gains/(losses) 450 77 105 (80) 63 Percentage of the present value of scheme liabilities 3.9% 0.7% 1.1% 0.8% 0.6%
(vi) Risk management and asset allocation strategy As noted above, the long-term investment objectives of the trustees and the employers are to limit the risk of the assets failing to meet the liabilities of the schemes over the long term, and to maximise returns consistent with an acceptable level of risk so as to control the long-term costs of these schemes. To meet these objectives, each scheme’s assets are invested in a diversified portfolio, consisting primarily of equity and debt securities. These reflect the current long-term asset allocation ranges chosen, having regard to the structure of liabilities within the schemes.
Main UK scheme Both the Group and the trustees regularly review the asset/liability management of the main UK scheme. It is fully understood that, whilst the current asset mix is designed to produce appropriate long-term returns, this introduces a material risk of volatility in the scheme’s surplus or deficit of assets compared with its liabilities. The principal asset risks to which the scheme is exposed are: Equity market risk – the effect of equity market falls on the value of plan assets. Inflation risk – the effect of inflation rising faster than expected on the value of the plan liabilities. Interest rate risk – falling interest rates leading to an increase in liabilities significantly exceeding the increase in the value of assets. There is also an exposure to currency risk where assets are not denominated in the same currency as the liabilities. The majority of this exposure has been removed by the use of hedging instruments. In 2010, there has been a reduction in the proportion of assets invested in equities, thereby mitigating the equity risk above. In addition, the trustees have taken further measures to partially mitigate inflation and interest rate risks.
Other schemes The other schemes are considerably less material but their risks are managed in a similar way to those in the main UK scheme.

Notes to the consolidated financial statements continued
274
Aviva plc Annual Report and Accounts 2010
48 – Pension obligations continued (vii) Recognition in the statement of financial position The assets and liabilities of the schemes, attributable to defined benefit members, including investments in Group insurance policies (see footnote below), at 31 December 2010 were:
UK Netherlands Canada Ireland Total
£m
£m £m
£m 2010 £m
Equities 2,435 244 54 50 2,783 Bonds 5,533 1,061 150 202 6,946 Property 558 81 — 17 656 Other 835 66 12 118 1,031
Total fair value of assets 9,361 1,452 216 387 11,416 Present value of scheme liabilities (9,044) (1,462) (362) (551) (11,419)
Net surplus/(deficits) in the schemes 317 (10) (146) (164) (3)
Surplus included in other assets (note 27) 524 — — — 524 Deficits included in provisions (note 47) (207) (10) (146) (164) (527)
317 (10) (146) (164) (3)
UK Netherlands Canada Ireland Total
£m
£m £m
£m 2009 £m
Equities 2,285 258 78 28 2,649 Bonds 4,619 992 110 231 5,952 Property 403 92 — 18 513 Other 835 16 10 130 991
Total fair value of assets 8,142 1,358 198 407 10,105 Present value of scheme liabilities (9,554) (1,372) (308) (578) (11,812)
Deficits in the schemes included in provisions (note 47) (1,412) (14) (110) (171) (1,707)
Other assets comprise cash at bank, derivative financial instruments, receivables and payables. Plan assets in the table above include investments in Group-managed funds and insurance policies, as described in section (iii) above. Where the investment and insurance policies are in segregated funds with specific asset allocations, they are included in the appropriate line in the table above, otherwise they appear in ‘Other’. The Dutch insurance policies of £1,445 million (2009: £1,351 million) are considered non-transferable under the terms of IAS 19 and so have been treated as other obligations to staff pension schemes within provisions (see note 47). The total IAS 19 obligations and strict IAS 19 assets (i.e. excluding the non-transferable insurance policies) of the schemes give a net deficit of £1,448 million (2009: £3,058 million), as shown in the following tables.
UK Netherlands Canada Ireland Total
£m
£m £m
£m 2010 £m
Equities 2,435 — 54 50 2,539 Bonds 5,533 — 150 202 5,885 Property 558 — — 17 575 Other 835 7 12 118 972
Total fair value of assets 9,361 7 216 387 9,971 Present value of scheme liabilities (9,044) (1,462) (362) (551) (11,419)
Net surplus/(deficits) in the schemes 317 (1,455) (146) (164) (1,448)
Surplus included in other assets (note 27) 524 — — — 524 Deficits included in provisions (note 47) (207) (1,455) (146) (164) (1,972)
317 (1,455) (146) (164) (1,448)
UK Netherlands Canada Ireland Total
£m
£m £m
£m 2009 £m
Equities 2,285 — 78 28 2,391 Bonds 4,619 — 110 231 4,960 Property 403 — — 18 421 Other 835 7 10 130 982
Total fair value of assets 8,142 7 198 407 8,754 Present value of scheme liabilities (9,554) (1,372) (308) (578) (11,812)
Deficits in the schemes included in provisions (note 47) (1,412) (1,365) (110) (171) (3,058)
The present value of unfunded post-retirement benefit obligations included in the totals in both sets of tables above is £130 million (2009: £118 million).

Performance reviewCorporate responsibilityGovernanceShareholder informationFinancial statements IFRSFinancial statements MCEVOther information
Financial statements IFRS
Notes to the consolidated financial statements continued
275
Aviva plc Annual Report and Accounts 2010
48 – Pension obligations continued (viii) Movements in the scheme deficits and surpluses Movements in the pension schemes’ deficits and surpluses comprise:
2010
Scheme assets
£m
Scheme liabilities
£m
Pension scheme deficits
£m
Adjust for Group
insurance policies
£m
IAS 19
pensions deficits
£m
Deficits in the schemes at 1 January 10,105 (11,812) (1,707) (1,351) (3,058) Employer contributions 579 — 579 (34) 545 Employee contributions 15 (15) — (9) (9) Benefits paid (385) 385 — 47 47 Current and past service cost (see (iv) above) — (170) (170) — (170) Gains on curtailments and settlements (see (iv) above) (1) 348 347 — 347 Credit/(charge) to finance costs (see (iv) above) 522 (652) (130) (65) (195) Actuarial gains/(losses) (see (iv) above) 623 456 1,079 (80) 999 Transfers 1 2 3 (1) 2 Exchange rate movements on foreign plans (43) 39 (4) 48 44
Net deficits in the schemes at 31 December 11,416 (11,419) (3) (1,445) (1,448)
2009
Scheme assets
£m
Scheme liabilities
£m
Pension scheme deficits
£m
Adjust for Group
insurance policies
£m
IAS 19
pensions deficits
£m
Deficits in the schemes at 1 January 9,338 (9,951) (613) (1,402) (2,015) Employer contributions 294 — 294 (62) 232 Employee contributions 18 (18) — (8) (8) Benefits paid (392) 392 — 46 46 Current and past service cost (see (iv) above) — (156) (156) — (156) Gains/(losses) on curtailments (see (iv) above) (19) 68 49 — 49 Credit/(charge) to finance costs (see (iv) above) 466 (591) (125) (58) (183) Actuarial gains/(losses) (see (iv) above) 543 (1,701) (1,158) 18 (1,140) Transfers (1) 1 — 2 2 Exchange rate movements on foreign plans (142) 144 2 113 115
Deficits in the schemes at 31 December 10,105 (11,812) (1,707) (1,351) (3,058)
The fall in the pension schemes’ net deficits during 2010 is mainly attributable to additional employer contributions and curtailment gains in the UK schemes, increases in investment values and experience gains on scheme liabilities.

Notes to the consolidated financial statements continued
276
Aviva plc Annual Report and Accounts 2010
49 – Borrowings Our borrowings are either core structural borrowings or operational borrowings. This note shows the carrying values and contractual maturity amounts of each type, and explains their main features and movements during the year.
(a) Analysis of total borrowings Total borrowings comprise:
2010
£m 2009
£m
Core structural borrowings, at amortised cost 6,066 5,489 Operational borrowings, at amortised cost 4,193 4,404 Operational borrowings, at fair value 4,690 5,107 8,883 9,511
Total 14,949 15,000
(b) Core structural borrowings (i) The carrying amounts of these borrowings are:
Upper Tier 2
£m
Lower Tier 2
£m
Senior
£m
2010 Total
£m
Upper Tier 2
£m
Lower Tier 2
£m
Senior
£m
2009 Total
£m
Subordinated debt 6.125% £700 million subordinated notes 2036 — 690 — 690 — 690 — 690 5.750% €800 million subordinated notes 2021 — 685 — 685 — 710 — 710 5.250% €650 million subordinated notes 2023 — 521 — 521 — 539 — 539 5.700% €500 million undated subordinated notes 426 — — 426 441 — — 441 6.125% £800 million undated subordinated notes 791 — — 791 791 — — 791 Floating rate US$300 million subordinated notes 2017 — 192 — 192 — 186 — 186 6.875% £400 million subordinated notes 2058 — 398 — 398 — 395 — 395 6.875% £200 million subordinated notes 2058 — 199 — 199 — 199 — 199 6.875% €500 million subordinated notes 2038 — 427 — 427 — 442 — 442 10.6726% £200 million subordinated notes 2019 — 200 — 200 — 200 — 200 10.464% €50 million subordinated notes 2019 — 43 — 43 — 44 — 44
1,217 3,355 — 4,572 1,232 3,405 — 4,637
Debenture loans 9.5% guaranteed bonds 2016 — — 199 199 — — 199 199 4.25% senior bonds 2017 issued by Delta Lloyd N.V. — — 489 489 — — — — 2.5% subordinated perpetual loan notes — 151 — 151 — 157 — 157 Other loans — — 12 12 — — 13 13
— 151 700 851 — 157 212 369
Commercial paper — — 643 643 — — 483 483
Total 1,217 3,506 1,343 6,066 1,232 3,562 695 5,489
The classifications between Upper Tier 2, Lower Tier 2 and Senior debt shown above are as defined by the Financial Services Authority in GENPRU Annex 1 ‘Capital Resources’. Subordinated debt is stated net of notes held by Group companies of £34 million (2009: £35 million). All the above borrowings are stated at amortised cost.
(ii) The contractual maturity dates of undiscounted cash flows for these borrowings are:
2010 2009
Principal
£m Interest
£m Total
£m Principal
£m Interest
£m Total
£m
Within 1 year 655 512 1,167 483 344 827 1 to 5 years — 1,783 1,783 13 1,455 1,468 5 to 10 years 1,128 2,090 3,218 1,074 1,736 2,810 10 to 15 years 1,243 1,788 3,031 1,289 1,440 2,729 Over 15 years 3,382 6,244 9,626 2,985 2,340 5,325
Total contractual undiscounted cash flows 6,408 12,417 18,825 5,844 7,315 13,159
Borrowings are considered current if the contractual maturity dates are within a year. Where subordinated debt is undated or loan notes are perpetual, the interest payments have not been included beyond 15 years. Annual interest payments for these borrowings are £84 million (2009: £86 million). Contractual undiscounted interest payments are calculated based on underlying fixed interest rates or prevailing market floating rates as applicable. Year-end exchange rates have been used for interest projections on loans in foreign currencies.

Performance reviewCorporate responsibilityGovernanceShareholder informationFinancial statements IFRSFinancial statements MCEVOther information
Financial statements IFRS
Notes to the consolidated financial statements continued
277
Aviva plc Annual Report and Accounts 2010
49 – Borrowings continued (c) Operational borrowings (i) The carrying amounts of these borrowings are:
2010 £m
2009 £m
Amounts owed to credit institutions Bank loans 2,550 2,182
Securitised mortgage loan notes UK lifetime mortgage business 1,288 1,444 Dutch domestic mortgage business 5,045 5,885
6,333 7,329
Total 8,883 9,511
All the above borrowings are stated at amortised cost, except for the loan notes issued in connection with the UK lifetime mortgage business of £1,288 million (2009: £1,444 million) and £3,402 million (2009: £3,664 million) of the loan notes issued in connection with the Dutch domestic mortgage business, which are carried at fair value. There is an active market for some of the Dutch securitised mortgage loan notes, amounting to £2,305 million (2009: £nil), and therefore fair values for these notes are based on market quoted prices, warranting a fair value hierarchy classification of ‘Level 1’. For the remaining loan notes carried at fair value, fair values are modelled on risk-adjusted cash flows for defaults discounted at a risk-free rate plus a market-determined liquidity premium, and are therefore classified as ‘Level 2’ in the fair value hierarchy. These have been designated at fair value through profit and loss in order to present the relevant mortgages, borrowings and derivative financial instruments at fair value, since they are managed as a portfolio on a fair value basis. This presentation provides more relevant information and eliminates any accounting mismatch. The securitised mortgage loan notes are at various fixed, floating and index-linked rates. Further details about these notes are given in note 24.
(ii) The contractual maturity dates of undiscounted cash flows for these borrowings are:
2010 2009
Principal
£m Interest
£m Total
£m Principal
£m Interest
£m Total
£m
Less than 1 year 1,560 220 1,780 324 185 509 1 to 5 years 1,157 899 2,056 769 755 1,524 5 to 10 years 266 1,084 1,350 936 825 1,761 10 to 15 years 317 956 1,273 669 754 1,423 Over 15 years 5,198 4,077 9,275 7,230 2,335 9,565
8,498 7,236 15,734 9,928 4,854 14,782
Contractual undiscounted interest payments are calculated based on underlying fixed interest rates or prevailing market floating rates as applicable. Year-end exchange rates have been used for interest projections on loans in foreign currencies.
(d) Description and features (i) Subordinated debt A description of each of the subordinated notes is set out in the table below:
Notional amount Issue date Redemption date Callable at par at option
of the Company from In the event the Company does not call the notes, the
coupon will reset at each applicable reset date to £700 million 14 Nov 2001 14 Nov 2036 16 Nov 2026 5 year Benchmark Gilt + 2.85% €800 million 14 Nov 2001 14 Nov 2021 14 Nov 2011 3 month Euribor + 2.12% €650 million 29 Sep 2003 02 Oct 2023 02 Oct 2013 3 month Euribor + 2.08% €500 million 29 Sep 2003 Undated 29 Sep 2015 3 month Euribor + 2.35% £800 million 29 Sep 2003 Undated 29 Sep 2022 5 year Benchmark Gilt + 2.40% US$300 million 19 Dec 2006 19 Jun 2017 19 Jun 2012 3 month US LIBOR + 0.84% £400 million 20 May 2008 20 May 2058 20 May 2038 3 month LIBOR + 3.26% £200 million 8 Aug 2008 20 May 2058 20 May 2038 3 month LIBOR + 3.26% €500 million 20 May 2008 22 May 2038 22 May 2018 3 month Euribor + 3.35% £200 million 1 Apr 2009 1 Apr 2019 1 Apr 2014 3 month LIBOR + 8.10% €50 million 30 Apr 2009 30 Apr 2019 30 Apr 2014 3 month Euribor + 8.25%
The subordinated notes were issued by the Company. They rank below its senior obligations and ahead of its preference shares and ordinary share capital. The dated subordinated notes rank ahead of the undated subordinated notes. The fair value of these notes at 31 December 2010 was £4,370 million (2009: £4,372 million), calculated with reference to quoted prices.

Notes to the consolidated financial statements continued
278
Aviva plc Annual Report and Accounts 2010
49 – Borrowings continued (ii) Debenture loans The 9.5% guaranteed bonds were issued by the Company at a discount of £1.1 million. This discount and the issue expenses are being amortised over the full term of the bonds. Although these bonds were issued in sterling, the loans have effectively been converted into euro liabilities through the use of financial instruments in a subsidiary. The 4.25% senior loan notes were issued by Delta Lloyd at a discount of £2 million in November 2010. The bonds mature in November 2017. The 2.5% perpetual subordinated loan notes were issued by Delta Lloyd to finance the acquisition of NUTS OHRA Beheer BV in 1999. As part of the public offering of Delta Lloyd in 2009, their nominal value was increased to €497 million. However, because they are considered to be perpetual, their carrying value is lower at €177 million (2009: €177 million), calculated in 1999 and based on the future cash flows in perpetuity discounted back at a market rate of interest. The rate of interest paid on the notes has been gradually increased to a maximum of 2.76% in 2009. Other loans totalling £12 million (2009: £13 million) comprise borrowings in the United States. All these borrowings are at fixed rates and their fair value at 31 December 2010 was £860 million (2009: £552 million), calculated with reference to quoted prices or discounted future cash flows as appropriate.
(iii) Commercial paper The commercial paper consists of £504 million in the Company (2009: £483 million) and £139 million in Delta Lloyd N.V. (2009: £nil) and is considered core structural funding. All commercial paper is repayable within one year and is issued in a number of different currencies, primarily sterling, euros and US dollars. Its fair value is considered to be the same as its carrying value.
(iv) Bank loans Bank loans comprise:
2010
£m 2009
£m
Non-recourse Loans to property partnerships (see (a) below) 1,098 790 Loans to Irish investment funds (see (b) below) 34 36 UK Life reassurance (see (c) below) 217 114 US 149 150 Other non-recourse loans 193 169
1,691 1,259 Other loans (see (d) below) 859 923
2,550 2,182
(a) As explained in accounting policy D, the UK long-term business policyholder funds have invested in a number of property limited partnerships (PLPs). The PLPs have raised external debt, secured on their respective property portfolios, and the lenders are only entitled to obtain payment of both interest and principal to the extent there are sufficient resources in the respective PLPs. The lenders have no recourse whatsoever to the policyholder or shareholders’ funds of any companies in the Aviva Group. Loans of £1,098 million (2009: £790 million) included in the table relate to those PLPs which have been consolidated as subsidiaries. (b) Certain Irish policyholder investment funds and unit trusts, which have been fully consolidated in accordance with accounting policy D, have raised borrowings with external credit institutions. The borrowings are secured on the funds, with the only recourse on default being the underlying investments in these funds and unit trusts. The lenders have no recourse whatsoever to the shareholders’ funds of any companies in the Aviva Group. These loans run for a period of five years, with interest rates fixed monthly and based on a fixed margin above the euro inter-bank rate. The amount of these loans can be varied without any penalty being charged, subject to a maximum of 50% Loan to Value and a maximum facility of €40 million. (c) The UK long-term business entered into a financial reassurance agreement with Swiss Re in 2008, under which up-front payments are received from Swiss Re in return for 90% of future surplus arising. The loan will be repaid as profits emerge on the business. (d) Other loans include €500 million 10.44% subordinated notes due 2019, of which €400 million of the loan was issued by Delta Lloyd Levensverzekering and €100m by Delta Lloyd Schadeverzekering.

Performance reviewCorporate responsibilityGovernanceShareholder informationFinancial statements IFRSFinancial statements MCEVOther information
Financial statements IFRS
Notes to the consolidated financial statements continued
279
Aviva plc Annual Report and Accounts 2010
49 – Borrowings continued (v) Securitised mortgage loan notes Loan notes have been issued by special purpose securitisation companies in the UK and the Netherlands. Details of these securitisations are given in note 24. For the Dutch securitised mortgage loan notes carried at amortised cost of £1,642 million (2009: £2,221 million), their fair value is £1,628 million (2009: £2,170 million), calculated based on the future cash flows discounted back at the market rate of interest.
(e) Movements during the year Movements in borrowings during the year were:
Core structural
£m Operational
£m
Total 2010
£m
New borrowings drawn down, net of expenses 2,921 726 3,647 Repayment of borrowings (2,274) (613) (2,887) Net cash inflow 647 113 760 Foreign exchange rate movements (77) (801) (878) Borrowings acquired/(loans repaid) for non-cash consideration — (4) (4) Fair value movements — 59 59 Amortisation of discounts and other non-cash items 1 — 1 Other movements 6 5 11
Movements in the year 577 (628) (51) Balance at 1 January 5,489 9,511 15,000
Balance at 31 December 6,066 8,883 14,949
Movements in borrowings during the previous year were:
Core structural
£m Operational
£m
Total 2009
£m
New borrowings drawn down, net of expenses 2,739 1,521 4,260 Repayment of borrowings (2,546) (1,307) (3,853)
Net cash inflow 193 214 407 Foreign exchange rate movements (232) (566) (798) Fair value movements — 187 187 Amortisation of discounts and other non-cash items 3 — 3
Movements in the year (36) (165) (201) Balance at 1 January 5,525 9,676 15,201
Balance at 31 December 5,489 9,511 15,000
All movements in fair value in 2009 and 2010 on securitised mortgage loan notes designated as fair value through profit or loss were attributable to changes in market conditions. These loan notes have external credit ratings which have not changed since the inception of the loans.
(f) Undrawn borrowings The Group and Company have the following undrawn committed central borrowing facilities available to it, of which £750 million (2009: £1,000 million) is used to support the commercial paper programme:
2010
£m 2009
£m
Expiring within one year 975 600 Expiring beyond one year 1,135 1,510
2,110 2,110

Notes to the consolidated financial statements continued
280
Aviva plc Annual Report and Accounts 2010
50 – Payables and other financial liabilities This note analyses our financial liabilities at the end of the year.
2010
£m 2009
£m
Payables arising out of direct insurance 1,426 1,585 Payables arising out of reinsurance operations 571 544 Deposits and advances received from reinsurers 773 928 Bank overdrafts 760 926 Derivative liabilities (note 58) 2,382 2,099 Bank customer accounts 4,780 4,618 Bank deposits received from other banks 1,772 1,933 Amounts due to brokers for investment purchases 498 793 Obligations for repayment of collateral received (notes 25d(i) & 58c) 4,825 3,602 Obligations under stock repurchase arrangements (note 25d(ii)) 853 664 Other financial liabilities 1,652 2,850
20,292 20,542
Expected to be settled within one year 19,155 19,982 Expected to be settled in more than one year 1,137 560
20,292 20,542
Bank overdrafts arise substantially from unpresented cheques and amount to £319 million (2009: £422 million) in long-term business operations and £441 million (2009: £504 million) in general business and other operations. All payables and other financial liabilities are carried at cost, which approximates to fair value, except for derivative liabilities, which are carried at their fair values.
51 – Other liabilities This note analyses our other liabilities at the end of the year.
2010
£m 2009
£m
Deferred income 789 423 Reinsurers’ share of deferred acquisition costs 79 127 Accruals 1,896 1,623 Other liabilities 1,415 1,493
4,179 3,666 Less: Amounts classified as held for sale — (13)
4,179 3,653
Expected to be settled within one year 3,734 3,214 Expected to be settled in more than one year 445 439
4,179 3,653

Performance reviewCorporate responsibilityGovernanceShareholder informationFinancial statements IFRSFinancial statements MCEVOther information
Financial statements IFRS
Notes to the consolidated financial statements continued
281
Aviva plc Annual Report and Accounts 2010
52 – Contingent liabilities and other risk factors This note sets out the main areas of uncertainty over the calculation of our liabilities.
(a) Uncertainty over claims provisions Note 39 gives details of the estimation techniques used by the Group to determine the general business outstanding claims provisions and of the methodology and assumptions used in determining the long-term business provisions. These approaches are designed to allow for the appropriate cost of policy-related liabilities, with a degree of prudence, to give a result within the normal range of outcomes. To the extent that the ultimate cost falls outside this range, for example where experience is worse than that assumed, or future general business claims inflation differs from that expected, there is uncertainty in respect of these liabilities.
(b) Asbestos, pollution and social environmental hazards In the course of conducting insurance business, various companies within the Group receive general insurance liability claims, and become involved in actual or threatened related litigation arising therefrom, including claims in respect of pollution and other environmental hazards. Amongst these are claims in respect of asbestos production and handling in various jurisdictions, including Europe, Canada and Australia. Given the significant delays that are experienced in the notification of these claims, the potential number of incidents which they cover and the uncertainties associated with establishing liability and the availability of reinsurance, the ultimate cost cannot be determined with certainty. However, on the basis of current information having regard to the level of provisions made for general insurance claims, the directors consider that any additional costs arising are not likely to have a material impact on the financial position of the Group.
(c) Guarantees on long-term savings products As a normal part of their operating activities, various Group companies have given guarantees and options, including interest rate guarantees, in respect of certain long-term insurance and fund management products. Note 41 gives details of these guarantees and options. In providing these guarantees and options, the Group’s capital position is sensitive to fluctuations in financial variables including foreign currency exchange rates, interest rates, property values and equity prices. Interest rate guaranteed returns, such as those available on guaranteed annuity options (GAOs), are sensitive to interest rates falling below the guaranteed level. Other guarantees, such as maturity value guarantees and guarantees in relation to minimum rates of return, are sensitive to fluctuations in the investment return below the level assumed when the guarantee was made. The directors continue to believe that the existing provisions for such guarantees and options are sufficient.
(d) Regulatory compliance The Group’s insurance and investment business is subject to local regulation in each of the countries in which it operates. The FSA regulates the Group’s UK business and in addition monitors the financial resources and organisation of the Group as a whole. The FSA has broad powers including the authority to grant, vary the terms of, or cancel a regulated firm’s authorisation; to investigate marketing and sales practices; and to require the maintenance of adequate financial resources. The Group’s regulators outside the UK typically have similar powers but in some cases they operate a system of ‘prior product approval’ and hence place less emphasis than the FSA on regulating sales and marketing practices. The Group’s regulated businesses have compliance resources to respond to regulatory enquiries in a constructive way, and take corrective action when warranted. However, all regulated financial services companies face the risk that their regulator could find that they have failed to comply with applicable regulations or have not undertaken corrective action as required. The impact of any such finding (whether in the UK or overseas) could have a negative impact on the Group’s reported results or on its relations with current and potential customers. Regulatory action against a member of the Group could result in adverse publicity for, or negative perceptions regarding, the Group, or could have a material adverse effect on the business of the Group, its results of operations and/or financial condition and divert management’s attention from the day-to-day management of the business.
(e) European legislative change In 2010, a test case was taken to the European Court of Justice to rule on the current law and practice whereby insurers may take into account a person’s gender in the assessment of risk and consequently the pricing of insurance products, the ruling for which was issued on 1 March 2011. We are currently unable to quantify the impact on our existing insurance provisions.
(f) Payment protection insurance (PPI) mis-selling In September 2009, the FSA launched an investigation into sales practices for payment protection insurance. On 10 August 2010, the FSA announced that mis-selling of PPI policies had been widespread and that consumers who could prove mis-selling would be entitled to financial redress from distributors of the policies. However, in October 2010, on behalf of distributors, the British Bankers Association elected to seek a judicial review of this ruling and no conclusion of this legal process has yet been reached. The directors do not consider that the Group is liable for mis-selling in its role as underwriter and so no provision is currently necessary.
(g) Structured settlements In Canada, annuities have been purchased from licensed Canadian life insurers to provide for fixed and recurring payments to claimants. As a result of these arrangements, the Group is exposed to credit risk to the extent that any of the life insurers fail to fulfil their obligations. The Group’s maximum exposure to credit risk for these arrangements is approximately £683 million as at 31 December 2010 (2009: £984 million) based on estimated replacement cost for the underlying annuities. The 2010 structured settlement exposure valuation used revised shorter life expectancy tables, resulting in a large reduction over the prior year. The credit risk is managed by acquiring annuities from a diverse portfolio of life insurers with proven financial stability. The risk is reduced to the extent of coverage provided by Assuris, the Canadian life insurance industry compensation plan. No information has come to the Group’s attention that would suggest any weakness or failure in the Canadian life insurers from which it has purchased annuities.

Notes to the consolidated financial statements continued
282
Aviva plc Annual Report and Accounts 2010
52 – Contingent liabilities and other risk factors continued (h) Other In the course of conducting insurance and investment business, various Group companies receive liability claims, and become involved in actual or threatened related litigation. In the opinion of the directors, adequate provisions have been established for such claims and no material loss will arise in this respect. The Company and several of its subsidiaries have guaranteed the overdrafts and borrowings of certain other Group companies. At 31 December 2010, the total exposure of the Group and Company is £nil (2009: £nil) and £343 million (2009: £77 million) respectively and, in the opinion of the directors, no material loss will arise in respect of these guarantees and indemnities. In addition, in line with standard business practice, various Group companies have been given guarantees, indemnities and warranties in connection with disposals in recent years of subsidiaries and associates to parties outside the Aviva Group. In the opinion of the directors, no material loss will arise in respect of these guarantees, indemnities and warranties. The Group’s insurance subsidiaries pay contributions to levy schemes in several countries in which we operate. Given the economic environment, there is a heightened risk that the levy contributions will need to be increased to protect policyholders if an insurance company falls into financial difficulties. The directors continue to monitor the situation but are not aware of any need to increase provisions at the statement of financial position date.
53 – Commitments This note gives details of our commitments to capital expenditure and under operating leases.
(a) Capital commitments Contractual commitments for acquisitions or capital expenditures of investment property, property and equipment and intangible assets, which have not been recognised in the financial statements, are as follows:
2010
£m 2009
£m
Investment property 63 66 Property and equipment 160 255 Intangible assets — 4
223 325
Contractual obligations for future repairs and maintenance on investment properties are £1 million (2009: £1 million). The Group has capital commitments to its joint ventures of £nil (2009: £nil) and to other investment vehicles of £nil (2009: £33 million).
(b) Operating lease commitments (i) Future contractual aggregate minimum lease rentals receivable under non-cancellable operating leases are as follows:
2010
£m 2009
£m
Within 1 year 374 551 Later than 1 year and not later than 5 years 1,206 1,505 Later than 5 years 2,270 2,456
3,850 4,512
(ii) Future contractual aggregate minimum lease payments under non-cancellable operating leases are as follows:
2010
£m 2009
£m
Within 1 year 136 145 Later than 1 year and not later than 5 years 423 463 Later than 5 years 737 834
1,296 1,442
Total future minimum sub-lease payments expected to be received under non-cancellable sub-leases 63 83

Performance reviewCorporate responsibilityGovernanceShareholder informationFinancial statements IFRSFinancial statements MCEVOther information
Financial statements IFRS
Notes to the consolidated financial statements continued
283
Aviva plc Annual Report and Accounts 2010
54 – Statement of cash flows This note gives further detail behind the figures in the statement of cash flows. (a) The reconciliation of profit before tax to the net cash inflow from operating activities is:
2010
£m 2009
£m
Profit before tax 2,834 2,022 Adjustments for: Share of (profits)/losses of joint ventures and associates (131) 504 Dividends received from joint ventures and associates 63 22 (Profit)/loss on sale of: Investment property (45) (339) Property and equipment 5 (9) Subsidiaries, joint ventures and associates (159) (153) Investments (2,097) 1,534 (2,296) 1,033 Fair value (gains)/losses on: Investment property (421) 1,084 Investments (8,015) (15,352) Borrowings 67 196 (8,369) (14,072) Depreciation of property and equipment 77 115 Equity compensation plans, equity settled expense 50 56 Impairment and expensing of: Goodwill on subsidiaries 3 30 Financial investments, loans and other assets 202 592 Acquired value of in-force business and intangibles 21 25 Non-financial assets 5 (1) 231 646 Amortisation of: Premium or discount on debt securities 72 303 Premium or discount on loans 26 (19) Premium or discount on borrowings 1 3 Premium or discount on participating investment contracts 17 15 Financial instruments 70 (77) Acquired value of in-force business and intangibles 354 376 540 601 Change in unallocated divisible surplus (329) 1,547 Interest expense on borrowings 1,232 1,327 Net finance charge on pension schemes 195 183 Foreign currency exchange gains (34) (155) Changes in working capital Decrease in reinsurance assets 685 (124) (Increase)/decrease in deferred acquisition costs (602) (567) Increase/(decrease) in insurance liabilities and investment contracts 14,076 15,134 Increase/(decrease) in other assets and liabilities 3,892 2,301 18,051 16,744 Net purchases of operating assets Purchases of investment property (1,126) (441) Proceeds on sale of investment property 870 1,267 Net purchases of financial investments (9,645) (8,113) (9,901) (7,287) Cash generated from operations 2,213 3,286
Purchases and sales of investment property, loans and financial investments are included within operating cash flows as the purchases are funded from cash flows associated with the origination of insurance and investment contracts, net of payments of related benefits and claims. (b) Cash flows in respect of the acquisition of subsidiaries, joint ventures and associates:
2010
£m 2009
£m
Cash consideration for subsidiaries, joint ventures and associates acquired 304 601 Less: Cash and cash equivalents acquired with subsidiaries (781) (5)
Cash flows on acquisitions (477) 596

Notes to the consolidated financial statements continued
284
Aviva plc Annual Report and Accounts 2010
54 – Statement of cash flows continued (c) Cash flows in respect of the disposal of subsidiaries, joint ventures and associates:
2010
£m 2009
£m
Cash proceeds from disposal of subsidiaries, joint ventures and associates 271 808 Net cash and cash equivalents divested with subsidiaries (20) (607) Cash flows on disposals 251 201
The above figures form part of cash flows from investing activities. As described in note 2(b), a further £930 million, being the net cash proceeds from the partial disposal of Delta Lloyd in 2009, is included in cash flows from financing activities for that year. (d) Cash and cash equivalents in the statement of cash flows at 31 December comprised:
2010
£m 2009
£m
Cash at bank and in hand 9,740 10,681 Cash equivalents 15,715 14,495
25,455 25,176 Bank overdrafts (760) (925) 24,695 24,251
55 – Group capital structure The Group maintains an efficient capital structure from a combination of equity shareholders’ funds, preference capital, subordinated debt and borrowings, consistent with our overall risk profile and the regulatory and market requirements of our business. This note shows where this capital is employed.
Accounting basis and capital employed by segment The table below shows how our capital, on an MCEV basis, is deployed by segment and how that capital is funded.
2010
£m
Restated 2009
£m
Long-term savings 21,793 20,792 General insurance and health 5,613 4,562 Fund management 465 269 Other business 178 (246) Corporate1 (1,521) (1,327)
Total capital employed 26,528 24,050
Financed by Equity shareholders’ funds 15,295 13,092 Non-controlling interests 3,977 4,279 Direct capital instrument 990 990 Preference shares 200 200 Subordinated debt 4,572 4,637 External debt 1,494 852
Total capital employed 26,528 24,050 1. ‘Corporate’ includes centrally held tangible net assets, the element of the staff pension scheme deficit or surplus allocated centrally and also reflects internal lending arrangements. These internal lending arrangements, which net out on
consolidation, arise in relation to the following: — Aviva International Insurance Limited (AII) acts as both a UK general insurer and as the primary holding company for our foreign subsidiaries. Internal capital management mechanisms in place allocate a portion of the total capital of the
company to the UK general insurance operations, giving rise to notional lending between the general insurance and holding company activities. These mechanisms also allow for some of the assets of the general insurance business to be made available for use across the Group.
— Certain subsidiaries, subject to continuing to satisfy stand alone capital and liquidity requirements, loan funds to corporate and holding entities. These loans satisfy arm’s length criteria and all interest payments are made when due.
Total capital employed is financed by a combination of equity shareholders’ funds, preference capital, subordinated debt and borrowings. At 31 December 2010 we had £26.5 billion (2009: £24.1 billion) of total capital employed in our trading operations, measured on an MCEV basis. Financial leverage, the ratio of external senior and subordinated debt to MCEV capital and reserves, was 31.5% (2009: 31.6%). Fixed charge cover, which measures the extent to which external interest costs, including subordinated debt interest and preference dividends, are covered by MCEV operating profit was 9.4 times (2009: 8.7 times).

Performance reviewCorporate responsibilityGovernanceShareholder informationFinancial statements IFRSFinancial statements MCEVOther information
Financial statements IFRS
Notes to the consolidated financial statements continued
285
Aviva plc Annual Report and Accounts 2010
56 – Capital statement This statement sets out the financial strength of our Group entities and provides an analysis of the disposition and constraints over the availability of capital to meet risks and regulatory requirements. The capital statement also provides a reconciliation of shareholders’ funds to regulatory capital. The analysis below sets out the Group’s available capital resources.
Available capital resources
Old with-profit sub-
fund £m
New with-profit sub-
fund £m
With- profit sub-
fund3 £m
Total UK life
with-profit funds
£m
Other UK life
operations £m
Total UK life
operations £m
Overseas life
operations £m
Total life operations
£m
Other operations4
£m
2010 Total
£m
2009 Total
£m
Total shareholders’ funds 10 (10) 22 22 4,628 4,650 14,143 18,793 (1,068) 17,725 15,086 Other sources of capital1 — — — — 200 200 189 389 4,572 4,961 5,088 Unallocated divisible surplus 201 — 1,846 2,047 9 2,056 1,372 3,428 — 3,428 3,866 Adjustments onto a regulatory basis: Shareholders’ share of accrued bonus (45) (281) (347) (673) — (673) — (673) — (673) (576) Goodwill and other intangibles5 — — — — (296) (296) (3,729) (4,025) (2,430) (6,455) (6,828) Regulatory valuation and admissibility restrictions2 69 1,587 312 1,968 (1,776) 192 (3,581) (3,389) 984 (2,405) 476
Total available capital resources 235 1,296 1,833 3,364 2,765 6,129 8,394 14,523 2,058 16,581 17,112
Analysis of liabilities: Participating insurance liabilities 2,181 17,133 13,013 32,327 — 32,327 31,716 64,043 — 64,043 64,702 Unit-linked liabilities — — — — 3,947 3,947 17,503 21,450 — 21,450 21,268 Other non-participating life insurance 344 2,558 374 3,276 25,783 29,059 46,027 75,086 — 75,086 67,658
Total insurance liabilities 2,525 19,691 13,387 35,603 29,730 65,333 95,246 160,579 — 160,579 153,628
Participating investment liabilities 659 3,464 6,023 10,146 2,628 12,774 56,708 69,482 — 69,482 66,559 Non-participating investment liabilities (4) (31) — (35) 30,645 30,610 17,695 48,305 — 48,305 43,456
Total investment liabilities 655 3,433 6,023 10,111 33,273 43,384 74,403 117,787 — 117,787 110,015
Total liabilities 3,180 23,124 19,410 45,714 63,003 108,717 169,649 278,366 — 278,366 263,643 1. Other sources of capital include Subordinated debt of £4,572 million issued by Aviva and £389 million of other qualifying capital issued by Dutch, Italian, Spanish and US subsidiary undertakings. 2. Including an adjustment for minorities (except for other sources of capital that are reflected net of minority interest). 3. Includes the Provident Mutual with-profit fund. 4. Other operations include general insurance and fund management business. 5. Goodwill and other intangibles includes goodwill of £258 million in joint ventures and associates.

Notes to the consolidated financial statements continued
286
Aviva plc Annual Report and Accounts 2010
56 – Capital statement continued Analysis of movements in capital of long-term businesses For the year ended 31 December 2010
Old with-
profit sub-fund
£m
New with-profit sub-
fund £m
With-profit sub-fund
£m
Total UK life with-profit
funds £m
Other UK life operations
£m
Total UK life operations
£m
Overseas life operations
£m
Total life operations
£m
Available capital resources at 1 January 199 1,128 1,590 2,917 2,861 5,778 8,967 14,745 Effect of new business (2) (19) 12 (9) 95 86 (733) (647) Expected change in available capital resources 17 216 103 336 305 641 635 1,276 Variance between actual and expected experience (11) (119) 17 (113) — (113) (204) (317) Effect of operating assumption changes 2 35 (46) (9) (87) (96) (322) (418) Effect of economic assumption changes 18 107 162 287 — 287 (314) (27) Effect of changes in management policy — (22) — (22) — (22) 31 9 Effect of changes in regulatory requirements — — — — — — 642 642 Transfers, acquisitions and disposals — — — — 211 211 4 215 Foreign exchange movements — — — — (170) (170) Other movements 12 (30) (5) (23) (620) (643) (142) (785)
Available capital resources at 31 December 235 1,296 1,833 3,364 2,765 6,129 8,394 14,523
Further analysis of the movement in the liabilities of the long-term business can be found in notes 39 and 40. The analysis of movements in capital provides an explanation of the movement in available capital of the Group’s life business for the year. This analysis is intended to give an understanding of the underlying causes of changes in the available capital of the Group’s life business, and provides a distinction between some of the key factors affecting the available capital. The negative shareholders’ funds balance within the UK with-profit funds arises in NWPSF as a result of regulatory valuation and admissibility differences in the reattributed estate which is valued on a realistic regulatory basis compared to the disclosure on an IFRS basis. NWPSF is fully supported by the reattributed estate of £1,218 million (this is known as RIEESA), at 31 December 2010 (31 December 2009: £1,177 million), held within NPSF1 (a non-profit fund within UKLAP included within other UK life operations), in the form of a capital support arrangement. This support arrangement will provide capital to NWPSF to ensure that the value of assets of NWPSF are at least equal to the value of liabilities calculated on a realistic regulatory basis therefore it forms part of the NWPSF available capital resources. For the WPSF/RIEESA, equity market performance has had little impact, as the funds mitigate materially all of the equity risk of the estate/RIEESA through internal hedging. In aggregate, the Group has at its disposal total available capital of £16.6 billion (2009: £17.1 billion), representing the aggregation of the solvency capital of all of our businesses. This capital is available to meet risks and regulatory requirements set by reference to local guidance and EU directives. After effecting the year-end transfers to shareholders, the UK with-profit funds have available capital of £3.4 billion (2009: £2.9 billion) (including amounts held in RIEESA). Subject to certain conditions, the RIEESA capital can be used to write new non-profit business, but the primary purpose of this capital is to provide support for the UK with-profit business. The capital is comfortably in excess of the required capital margin, and therefore the shareholders are not required to provide further support. For the remaining life and general insurance operations, the total available capital amounting to £13.2 billion (2009: £14.2 billion) is significantly higher than the minimum requirements established by regulators and, in principle, the excess is available to shareholders. In practice, management will hold higher levels of capital within each business operation to provide appropriate cover for risk. As the total available capital of £16.6 billion is arrived at on the basis of local regulatory guidance, which evaluates assets and liabilities prudently, it understates the economic capital of the business which is considerably higher. This is a limitation of the Group Capital Statement which, to be more meaningful, needs to evaluate available capital on an economic basis and compare it with the risk capital required for each individual operation, after allowing for the considerable diversification benefits that exist in our Group. Within the Aviva Group there exist intra-group arrangements to provide capital to particular business units. Included in these arrangements is a subordinated loan of £200 million from Aviva Life Holdings UK Limited to Aviva Annuity Limited to provide capital to support the writing of new business.

Performance reviewCorporate responsibilityGovernanceShareholder informationFinancial statements IFRSFinancial statements MCEVOther information
Financial statements IFRS
Notes to the consolidated financial statements continued
287
Aviva plc Annual Report and Accounts 2010
56 – Capital statement continued The available capital of the Group’s with-profit funds is determined in accordance with the ‘Realistic balance sheet’ regime prescribed by the FSA’s regulations, under which liabilities to policyholders include both declared bonuses and the constructive obligation for future bonuses not yet declared. The available capital resources include an estimate of the value of their respective estates, included as part of the unallocated divisible surplus. The estate represents the surplus in the fund that is in excess of any constructive obligation to policyholders. It represents capital resources of the individual with-profit fund to which it relates and is available to meet regulatory and other solvency requirements of the fund and, in certain circumstances, additional liabilities may arise. The liabilities included in the balance sheet for the with-profit funds do not include the amount representing the shareholders’ portion of future bonuses. However, the shareholders’ portion is treated as a deduction from capital that is available to meet regulatory requirements and is therefore shown as a separate adjustment in the capital statement. In accordance with the FSA’s regulatory rules under its realistic capital regime, the Group is required to hold sufficient capital in its UK life with-profit funds to meet the FSA capital requirements, based on the risk capital margin (RCM). The determination of the RCM depends on various actuarial and other assumptions about potential changes in market prices, and the actions management would take in the event of particular adverse changes in market conditions.
31 December 2010 31 December
2009
Estimated realistic
assets £bn
Realistic liabilities*1
£bn
Estimated realistic
inherited Estate2
£bn
Capital support
arrangement3 £bn
Estimated risk capital
margin5 £bn
Estimated excess
available capital
£bn Excess
£bn
NWPSF 20.8 (20.8) — 1.2 (0.4) 0.8 0.6 OWPSF 3.1 (2.8) 0.3 — (0.1) 0.2 0.1 WPSF4 20.4 (18.6) 1.8 — (0.4) 1.4 1.4
Aggregate 44.3 (42.2) 2.1 1.2 (0.9) 2.4 2.1 * These realistic liabilities include the shareholders’ share of future bonuses of £0.7 billion (31 December 2009: £0.6 billion). Realistic liabilities adjusted to eliminate the shareholders’ share of future bonuses are £41.5 billion (31 December 2009:
£42.1 billion). 1. These realistic liabilities make provision for guarantees, options and promises on a market consistent stochastic basis. The value of the provision included within realistic liabilities is £1.9 billion, £0.3 billion and £3.1 billion for NWPSF, OWPSF and
WPSF respectively (31 December 2009: £2.2 billion, £0.3 billion and £3.1 billion for NWPSF, OWPSF and WPSF respectively). 2. Estimated realistic inherited estate at 31 December 2009 was £nil, £0.2 billion and £1.6 billion for NWPSF, OWPSF and WPSF respectively. 3. This represents the reattributed estate of £1.2 billion at 31 December 2010 (31 December 2009: £1.1 billion) held within the non-profit fund with WPSF included within other UK life operations. 4. The WPSF fund includes the Provident Mutual (PM) fund, which has realistic assets and liabilities of £1.7 billion and therefore does not impact the realistic inherited estate. 5. The risk capital margin (RCM) is 3.7 times covered by the inherited estate and support arrangement (31 December 2009: 3.6 times).
Under the FSA regulatory regime, UK life with-profits business is required to hold capital equivalent to the greater of their regulatory requirement based on EU directives (regulatory peak) and the FSA realistic bases (realistic peak) described above. For UK non-participating business, the relevant capital requirement is the minimum solvency requirement determined in accordance with FSA regulations. The available capital reflects the excess of regulatory basis assets over liabilities before deduction of capital resources requirement. For UK general insurance businesses, the relevant capital requirement is the minimum solvency requirement determined in accordance with the FSA requirements. For overseas businesses in the EEA, US, Canada, Australia, Hong Kong and Singapore, the available capital and the minimum requirement are calculated under the locally applicable regulatory regimes. The businesses outside these territories are subject to the FSA rules for the purposes of calculation of available capital and capital resource requirement. For fund management and other businesses, the relevant capital requirement is the minimum solvency requirement determined in accordance with the local regulator’s requirements for the specific class of business. The available capital resources in each regulated entity are generally subject to restrictions as to their availability to meet requirements that may arise elsewhere in the Group. The principal restrictions are:
(i) UK with-profit funds – (NWPSF, OWPSF and WPSF) – any available surplus held in each fund can be used to meet the requirements of the fund itself, be distributed to policyholders and shareholders or in the case of NWPSF and OWPSF, transferred via the capital support arrangement explained above (for OWPSF only to the extent support has been provided in the past). In most cases, with-profit policyholders are entitled to at least 90% of the distributed profits while the shareholders receive the balance. The latter distribution would be subject to a tax charge, which is met by the fund.
(ii) UK non-participating funds – any available surplus held in these is attributable to shareholders. Capital in the non-profit funds may be made available to meet requirements elsewhere in the Group subject to meeting the regulatory requirements of the fund. Any transfer of the surplus may give rise to a tax charge subject to availability of tax relief elsewhere in the Group.
(iii) Overseas life operations – the capital requirements and corresponding regulatory capital held by overseas businesses are calculated using the locally applicable regulatory regime. The available capital resources in all these businesses are subject to local regulatory restrictions which may constrain management’s ability to utilise these in other parts of the Group. Any transfer of available capital may give rise to a tax charge subject to availability of tax relief elsewhere in the Group.
(iv) General insurance operations – the capital requirements and corresponding regulatory capital held by overseas businesses are calculated using the locally applicable regulatory regime. The available capital resources in all these businesses are subject to local regulatory restrictions which may constrain management’s ability to utilise these in other parts of the Group. Any transfer of available capital may give rise to a tax charge, subject to availability of tax relief elsewhere in the Group.

Notes to the consolidated financial statements continued
288
Aviva plc Annual Report and Accounts 2010
57 – Risk management This note sets out the major risks our businesses face and describes the Group’s approach to managing these. It also gives sensitivity analyses around the major economic and non-economic assumptions that can cause volatility in the Group’s earnings and capital requirements.
(a) Risk management framework The risk management framework (RMF) in Aviva is the collection of processes and tools that have been put in place to ensure that the risks to which we are exposed are identified, measured, managed, monitored and reported on a continuous basis. The RMF is designed to facilitate a common approach to, and language regarding, the management of risk across the Group. The key instruments of the RMF include the risk management policies, risk reports, risk models, the governance and oversight infrastructure and the risk appetite framework. Risks are usually grouped by risk type: market, credit, liquidity, general insurance, life insurance and operational risk. Risk falling within these types may affect a number of key metrics including those relating to balance sheet strength, liquidity and profit. They may also affect the performance of the products that we deliver to our customers and the service to our customers and distributors, which can be categorised as risks to our brand and reputation. Additional information on the Group’s risk is included in the risk section of the Performance review. The Group has a set of formal risk policies that facilitate a consistent approach to the management of all our risks across all businesses and locations in which we operate. These risk policies define our appetite for different, granular risk types and set out risk management and control standards for the Group’s worldwide operations. A top-down key risk identification and assessment process is carried out monthly in the risk function at Group level based on group and regional chief risk officer and functional risk director input. This includes the consideration of emerging risks and is supported by deeper thematic reviews. The risk assessment processes are used to generate risk reports which are shared with the relevant risk committees. Risk models are an important tool in our measurement of risk and are used to support the monitoring and reporting of the risk profile and in the evaluation of alternative risk management actions. We carry out a range of stress (where one risk factor, such as equity returns, is assumed to vary) and scenario (where combinations of risk factors are assumed to vary) tests to evaluate their impact on the business and the management actions available to respond to the conditions envisaged. Monthly assessments are made of the economic capital available within the business and the economic capital required to cover the current risk profile of the business and these assessments are included in the regular reporting to the risk committees. Board oversight of risk and risk management across the Group is maintained on a regular basis through its Risk Committee. The Board has overall responsibility for determining risk appetite, which is an expression of the risk it is willing to take. The Group’s position against risk appetite is monitored and reported to the Board on a monthly basis. The risk governance framework allocates responsibility for the oversight of risk management to a number of committees at Group centre, with the Asset Liability Committee (ALCO) and the Operational Risk Committee (ORC) providing a key focus on financial and operational risk. The Group centre committees are in turn supported by similar governance structures in the regions.
(b) Market risk Market risk is the risk of adverse financial impact due to changes in fair values or future cash flows of financial instruments from fluctuations in interest rates, equity prices, property prices and foreign currency exchange rates. Market risk arises in business units due to fluctuations in both the value of liabilities and the value of investments held. At Group level, it also arises in relation to the overall portfolio of international businesses and in the value of investment assets owned directly by the shareholders. The Group has established a policy on market risk which sets out the principles that businesses are expected to adopt in respect of management of the key market risks to which the Group is exposed. The Group monitors adherence to this market risk policy and regularly reviews how business units are managing these risks locally, through the Assets Committee and ultimately the Asset Liability Committee (ALCO). For each of the major components of market risk, described in more detail below, the Group has put in place additional processes and procedures to set out how each risk should be managed and monitored, and the approach to setting an appropriate risk appetite. The management of market risk is undertaken in businesses, regions and at Group level. Businesses manage market risks locally using the Group market risk framework and within local regulatory constraints. Businesses may also be constrained by the requirement to meet policyholders’ reasonable expectations and to minimise or avoid market risk in a number of areas. The ALM function is responsible for managing market risk at Group level, and a number of investment-related risks, in particular those faced by shareholder funds throughout the Group. The Group market risk policy sets out the minimum principles and framework for matching liabilities with appropriate assets, the approaches to be taken when liabilities cannot be matched and the monitoring processes that are required. The Group has criteria for matching assets and liabilities for all classes of business to minimise the impact of mismatches between the value of assets and the liabilities due to market movements. The local regulatory environment for each business will also set the conditions under which assets and liabilities are to be matched. In addition, where the Group’s long-term savings businesses have written insurance and investment products where the majority of investment risks are borne by its policyholders, these risks are managed in line with local regulations and marketing literature, in order to satisfy the policyholders’ risk and reward objectives.

Performance reviewCorporate responsibilityGovernanceShareholder informationFinancial statements IFRSFinancial statements MCEVOther information
Financial statements IFRS
Notes to the consolidated financial statements continued
289
Aviva plc Annual Report and Accounts 2010
57 – Risk management continued The Group writes unit-linked business in a number of its operations. In unit-linked business, the policyholder bears the investment risk on the assets held in the unit-linked funds, as the policy benefits are directly linked to the value of the assets in the fund. The shareholders’ exposure to market risk on this business is limited to the extent that income arising from asset management charges is based on the value of assets in the fund.
Equity price risk The Group is subject to equity price risk due to daily changes in the market values of its equity securities portfolio. The Group’s shareholders are exposed to the following sources of equity risk:
Direct equity shareholdings in shareholder funds and the Group defined benefit pension funds. The indirect impact from changes in the value of equities held in policyholders’ funds from which management charges
or a share of performance are taken; and Its interest in the free estate of long-term with profits funds.
At a business unit level, equity price risk is actively managed in order to mitigate anticipated unfavourable market movements where this lies outside the risk appetite of either the company in respect of shareholder assets or the fund in respect of policyholder assets concerned. In addition investment limits and local asset admissibility regulations require that business units hold diversified portfolios of assets thereby reducing exposure to individual equities. The Group does not have material holdings of unquoted equity securities. Equity risk is also managed using a variety of derivative instruments, including futures and options. Businesses actively model the performance of equities through the use of risk models, in particular to understand the impact of equity performance on guarantees, options and bonus rates. The Assets Committee actively monitors equity assets owned directly by the Group, which may include some material shareholdings in the Group’s strategic business partners. Sensitivity to changes in equity prices is given in section (h) below.
Property price risk The Group is subject to property price risk due to holdings of investment properties in a variety of locations worldwide and through investments in mortgages and mortgage backed securities. Investment in property is managed at regional and business level, and will be subject to local regulations on asset admissibility, liquidity requirements and the expectations of policyholders as well as overall risk appetite. The Assets Committee also monitors property assets owned directly by the Group. As at 31 December 2010, no material derivative contracts had been entered into to mitigate the effects of changes in property prices. Sensitivity to changes in property prices is given in section (h) below.
Interest rate risk Interest rate risk arises primarily from the Group’s investments in long-term debt and fixed income securities, which are exposed to fluctuations in interest rates. The Group manages this risk by adopting close asset liability matching criteria, to minimise the impact of mismatches between the value of assets and liabilities from interest rate movements. A number of policyholder participation features have an influence on the Group’s interest rate risk. The major features include guaranteed surrender values, guaranteed annuity options, and minimum surrender and maturity values. Details of material guarantees and options are given in note 41. In short-term business such as general insurance business, the Group requires a close matching of assets and liabilities to minimise this risk. Interest rate risk is managed by the ALM function and monitored and managed by the Assets Committee, and the Asset Liability Committee. Exposure to interest rate risk is monitored through several measures that include value-at-risk analysis, position limits, risk modelling, asset and liability matching using measures such as duration. The impact of exposure to sustained low interest rates is regularly monitored. Interest rate risk is also managed using a variety of derivative instruments, including futures, options, swaps, caps and floors, in order to provide a degree of hedging against unfavourable market movements in interest rates inherent in the assets backing technical liabilities. The Group has entered into a number of initiatives, including interest rate swap agreements and changes in asset mix, to mitigate the effects of potential adverse interest rate movements, and to enable closer matching of assets and liabilities. Sensitivity to changes in interest rates is given in section (h) below. Further information on borrowings is included in note 49.
Currency risk The Group has minimal exposure to currency risk from financial instruments held by business units in currencies other than their functional currencies, as nearly all such holdings are backing either unit-linked or with-profit contract liabilities or are hedged. For this reason, no sensitivity analysis is given for these holdings. The Group operates internationally and as a result is exposed to foreign currency exchange risk arising from fluctuations in exchange rates of various currencies. Approximately half of the Group’s premium income arises in currencies other than sterling and the Group’s net assets are denominated in a variety of currencies, of which the largest are euro, sterling and US dollars. The Group does not hedge foreign currency revenues as these are substantially retained locally to support the growth of the Group’s business and meet local regulatory and market requirements.

Notes to the consolidated financial statements continued
290
Aviva plc Annual Report and Accounts 2010
57 – Risk management continued The Group’s foreign exchange policy requires that each of our subsidiaries maintains sufficient assets in its local currency to meet local currency liabilities. Therefore, capital held by the Group’s business units should be able to support local business activities regardless of foreign currency movements. However, such movements may impact the value of the Group’s consolidated shareholders’ equity which is expressed in sterling. This aspect of foreign exchange risk is monitored and managed centrally, against pre-determined limits. The Group’s foreign exchange policy is to manage these exposures by aligning the deployment of regulatory capital by currency with the Group’s regulatory capital requirements by currency. Limits are set to control the extent to which the deployment of capital is not aligned fully with the Group’s regulatory capital requirement for each major currency. Currency borrowings and derivatives are used to manage exposures within the limits that have been set. At 31 December 2010, the Group’s total equity deployment by currency was:
Sterling
£m Euro £m
US$ £m
Other £m
Total £m
Capital 31 December 2010 3,301 9,288 2,712 2,424 17,725 Capital 31 December 2009 1,737 8,781 2,605 1,963 15,086
A 10% change in sterling to euro/US$ foreign exchange rates would have had the following impact on total equity.
10% increase
in sterling/ euro rate
£m
10% decrease
in sterling/ euro rate
£m
10% increase
in sterling/ US$ rate
£m
10% decrease
in sterling/ US$ rate
£m
Net assets at 31 December 2010 (899) 833 (271) 271 Net assets at 31 December 2009 (802) 802 (228) 228
The changes arise from retranslation of business unit statements of financial position from their functional currencies into sterling, with above movements being taken through the currency translation reserve. These movements in exchange rates therefore have no impact on profit. Net assets are stated after taking account of the effect of currency hedging activities.
Derivatives risk Derivatives are used by a number of the businesses, within policy guidelines agreed by the Board of directors, as set out in the Group policy on derivatives use. Activity is overseen by the Derivatives Approvals Committee, which monitors implementation of the policy, exposure levels and approves large or complex transactions proposed by businesses. Derivatives are primarily used for efficient investment management, risk hedging purposes or to structure specific retail savings products. Derivative transactions are covered by either cash or corresponding assets and liabilities. Speculative activity is prohibited, unless prior approval has been obtained from the Derivatives Approvals Committee. Over-the-counter derivative contracts are entered into only with approved counterparties and using ISDA documentation and credit support annexes (or equivalent) in accordance with the Group derivatives policy. Adherence to the collateral requirements as set out in the Group derivatives and Group credit policies thereby reduces the risk of credit loss. The Group applies strict requirements to the administration and valuation processes it uses, and has a control framework that is consistent with market and industry practice for the activity that is undertaken.
Correlation risk The Group recognises that lapse behaviour and potential increases in consumer expectations are sensitive to and interdependent with market movements and interest rates. These interdependencies are taken into consideration in the ICA in the aggregation of the financial stress tests with the operational risk assessment and in scenario analysis.
(c) Credit risk Credit risk is the risk of financial loss as a result of the default or failure of third parties to pay on their obligations to Aviva. Our credit risks arise through exposures to debt investments, structured asset investments, derivative counterparties, mortgage lending and reinsurance placement counterparties. We hold these investments for the benefit of both our policyholders and shareholders. The Group manages its credit risk at business unit, regional and Group levels. All business units and regions are required to implement local credit risk management processes (including limits frameworks), operate specific risk management committees, and ensure detailed reporting and monitoring of their exposures against pre-established risk criteria. At Group level, we manage and monitor all exposures across our business units on a consolidated basis, and operate a group limit framework that must be adhered to by all. The risk management framework also includes the market related aspect of credit risk. This is the risk of a fall in the value of fixed interest securities from changes in the perceived worthiness of the issuer and is manifested through changes in the fixed interest securities’ credit spreads. Management of credit risk is effected by five core functions:
The maintenance and adherence of an effective governance structure. This includes clear guidance, scope and frameworks for all aspects of the credit risk function to ensure accountability and clarity. This also includes delegated authority to the Credit Approvals Committee which is authorised to make key decisions within certain risk appetite levels.
The accurate and timely reporting of detailed exposure information, and their aggregation by counterparty, exposure types, sectors, geography and ratings.

Performance reviewCorporate responsibilityGovernanceShareholder informationFinancial statements IFRSFinancial statements MCEVOther information
Financial statements IFRS
Notes to the consolidated financial statements continued
291
Aviva plc Annual Report and Accounts 2010
57 – Risk management continued The implementation of a sophisticated capital charge-based credit limit framework that considers and quantifies the key specific
attributes of each exposure (e.g. seniority, maturity, etc) and provides a counterparty level aggregation methodology covering all exposures to a counterparty. This is then managed against centrally set limits. Upper limits are also set to ensure that any unexpected jump to default risks are kept within appetite. Additional limit and controls are applied for structured assets and reinsurance counterparty exposures. The limits framework also considers more systemic risk factors such as sector and geographic concentrations, and these are continually assessed throughout our global portfolio.
Additional committee and credit risk function oversight is provided on all credit risk related matters. This includes regular consideration and review of our key counterparties, monitoring and addressing key credit themes and news that emerge in the markets. The Credit Approvals Committee provides an effective forum to ensure that all key recommendations are considered, and decisions implemented throughout the Group. The regional and Group credit divisions ensure that qualitative aspects of risk management are considered and evaluated to provide further oversight and balance to the quantitative aspects.
The employment of risk mitigation techniques where and when deemed appropriate. These are utilised where possible to remove residual unwanted risks, as well as bring or keep exposure limits within appetite, and include methods such as collateralisation, purchase of credit protection and diversification strategies.
A detailed breakdown of the Group’s current credit exposure by credit quality is shown below.
Financial exposures by credit ratings Financial assets are graded according to current external credit ratings issued. AAA is the highest possible rating. Investment grade financial assets are classified within the range of AAA to BBB ratings. Financial assets which fall outside this range are classified as speculative grade. The following table provides information regarding the aggregated credit risk exposure, for financial assets with external credit ratings, of the Group. Not rated assets capture assets not rated by external ratings agencies.
Credit rating
At 31 December 2010 AAA AA A BBB Speculative
grade Not rated
Carrying value in the
statement of financial
position £m
Debt securities 36.3% 18.1% 22.7% 15.8% 2.5% 4.6% 167,482 Reinsurance assets 0.2% 58.8% 25.3% 1.5% 0.1% 14.1% 7,084 Other investments 0.2% 1.1% 1.4% 0.4% 0.1% 96.8% 36,730 Loans 3.8% 5.8% 2.2% 0.4% 0.7% 87.1% 43,074
Credit rating
At 31 December 2009 AAA AA A BBB Speculative
grade Not rated
Carrying value in the
statement of financial position
£m
Debt securities 38.6% 17.3% 24.0% 12.8% 2.5% 4.8% 161,757 Reinsurance assets 10.5% 52.1% 26.7% 0.4% 0.2% 10.1% 7,572 Other investments 0.2% 3.4% 2.0% 1.2% — 93.2% 31,518 Loans 6.2% 7.7% 0.9% 0.5% 1.0% 83.7% 41,079
The carrying amount of assets included in the statement of financial position represents the maximum credit exposure. As described in note 25, £1,247 million debt securities held by consolidated French mutual funds, previously included within other investments, have been reclassified as debt securities as at 31 December 2009. In addition, certain non-rated debt securities totalling £1,917 million, which at the 31 December 2009 had been classified according to their internal credit ratings, are now presented as non-rated. Carrying values and percentages at 31 December 2009 have been amended accordingly.
Other investments Other investments include:
£32,520 million of unit trusts and other investment vehicles. The underlying credit ratings of these assets are not reflected in this analysis.
Derivative financial instruments of £2,274 million, representing positions to mitigate the impact of adverse market movements. Other assets of £1,936 million, includes deposits with credit institutions and minority holdings in property management
undertakings. The Group loan portfolio principally comprises:
Policy loans which are generally collateralised by a lien or charge over the underlying policy; Loans and advances to banks which primarily relate to loans of cash collateral received in stock lending transactions.
These loans are fully collateralised by other securities; and Mortgage loans collateralised by property assets.

Notes to the consolidated financial statements continued
292
Aviva plc Annual Report and Accounts 2010
57 – Risk management continued Unit trusts and other investment vehicles The credit quality of the underlying debt securities within these vehicles is managed by the safeguards built into the investment mandates for these funds. We rely on our understanding that the trusts and their asset managers are only approved if they satisfy certain selection criteria (including due diligence in the form of a questionnaire and/or research by dedicated teams). In addition, the asset managers are mandated to make investments in line with the funds’ risk profiles as marketed to prospective customers and policyholders. Accordingly, as part of reviewing the asset quality of unit trusts and other investment vehicles, we monitor the assets within the funds and their performance to ensure they remain in line with the respective investment mandates for these funds. For certain of the unit trusts in our other investments, we apply minimum requirements affecting both the underlying counterparties and the investments issued by those counterparties such as a minimum size for the counterparty’s programme, a limit on the size of the overall exposure to the underlying counterparty and, where appropriate, explicit approval of the counterparty by internal credit risk management teams is required. These criteria are indicators of the asset quality for these investments, as they represent minimum criteria for liquidity and diversification. A proportion of the assets underlying these investments are represented by equities and so credit ratings are not generally applicable. Equity exposures are managed against agreed benchmarks that are set with reference to overall market risk appetite.
Derivatives Derivative transactions must comply with Group guidance on the quality of counterparties used and the extent of collateralisation required. The counterparty must have a minimum credit rating from rating agencies (S&P, Moody’s and Fitch) and the collateral process must meet certain minimum standards as set out by Group guidelines. The largest shareholder notional positions are exchange traded, rather than over the counter (OTC), with the added protection that provides (i.e. the credit risk is mitigated significantly through regular margining and protection offered by the exchange, and is controlled by the Group’s local asset management operations).
Loans The majority of the Group loans portfolio is unrated. However, we use the following metrics to internally monitor our exposure:
Property collateralization; Interest service cost; Diversity of the tenant base; and Existence of government guarantees for some residential mortgages.
Policy loans are loans and advances made to policyholders, and are collateralised by the underlying policies. As such, we believe such collateralisation minimises our risk.
Credit concentration risk The long-term businesses and general insurance businesses are generally not individually exposed to significant concentrations of credit risk due to the regulations, applicable in most markets, limiting investments in individual assets and asset classes supplemented by the Group credit policy and limits framework. In cases where the business is particularly exposed to credit risk (e.g. in respect of defaults on mortgages matching annuity liabilities) this risk is translated into a more conservative discount rate used to value the liabilities, creating a greater capital requirement, and this credit risk is actively managed. The impact of aggregation of credit risk is monitored as described above. With the exception of government bonds the largest aggregated counterparty exposure is approximately 0.9% of the Group’s total shareholder assets.
Reinsurance credit exposures The Group is exposed to concentrations of risk with individual reinsurers, due to the nature of the reinsurance market and the restricted range of reinsurers that have acceptable credit ratings. The Group operates a policy to manage its reinsurance counterparty exposures, by limiting the reinsurers that may be used and applying strict limits to each reinsurer. Reinsurance exposures are aggregated with other exposures to ensure that the overall risk is within appetite. The Credit Approvals Committee has a monitoring role over this risk. The Group’s largest reinsurance counterparty is Swiss Reinsurance Company Ltd (including subsidiaries). At 31 December 2010, the reinsurance asset recoverable, including debtor balances, from Swiss Reinsurance Company Ltd was £1,284 million.
Securities finance The Group has significant securities financing operations within the UK. The risks within this business are mitigated by over- collateralisation which is designed to result in minimal residual risk. The Group operates strict standards around collateral management and controls.

Performance reviewCorporate responsibilityGovernanceShareholder informationFinancial statements IFRSFinancial statements MCEVOther information
Financial statements IFRS
Notes to the consolidated financial statements continued
293
Aviva plc Annual Report and Accounts 2010
57 – Risk management continued Derivative credit exposures The Group is exposed to counterparty credit risk through derivative trades. This risk is mitigated through collateralising almost all trades (the exception being certain FX trades where it has historically been the market norm not to collateralise). The Group operates strict standards around collateral management and controls including the requirement that all ‘Over the Counter’ derivatives are supported by credit support annexes and ISDAs.
Unit-linked business As discussed previously, in unit-linked business the policyholder bears the market risk, including credit risk, on investment assets in the unit funds, and the shareholders’ exposure to credit risk is limited to the extent that their income arises from asset management charges based on the value of assets in the fund. Impairment of financial assets The following table provides information regarding the carrying value of financial assets that have been impaired and the ageing of financial assets that are past due but not impaired.
Financial assets that are past due but not impaired
At 31 December 2010
Neither past due
nor impaired
£m
0–3 months
£m
3–6 months
£m
6 months– 1 year
£m
Greater than
1 year £m
Financial assets that have been
impaired £m
Carrying value in
the statement
of financial position
£m
Debt securities 167,334 — 3 3 28 114 167,482 Reinsurance assets 7,084 — — — — — 7,084 Other investments 36,671 19 6 15 8 11 36,730 Loans 42,045 326 26 11 7 659 43,074 Receivables and other financial assets 7,983 209 36 39 10 18 8,295
Financial assets that are past due but not impaired
At 31 December 2009
Neither past due
nor impaired £m
0–3 months
£m
3–6 months
£m
6 months– 1 year
£m
Greater than
1 year £m
Financial assets that have been
impaired £m
Carrying value in the
statement of financial position
£m
Debt securities 161,647 — — — — 110 161,757 Reinsurance assets 7,572 — — — — — 7,572 Other investments 31,503 — — — — 15 31,518 Loans 40,039 355 35 17 6 627 41,079 Receivables and other financial assets 8,832 649 61 32 71 7 9,652
As described in note 25, £1,247 million debt securities held by consolidated French mutual funds, previously included within other investments, have been reclassified as debt securities as at 31 December 2009. The analysis of financial assets past due at 31 December 2009 has been amended accordingly. Credit terms are set locally within overall credit limits prescribed by the Group Credit Approvals Committee and within the framework of the Group Credit Policy. The credit quality of financial assets is managed at the local business unit level. Where assets have been classed as ‘past due and impaired’, an analysis is made of the risk of default and a decision is made whether to seek collateral from the counterparty. There were no material financial assets that would have been past due or impaired had the terms not been renegotiated.
(d) Liquidity risk At Group level, we maintain a prudent level of liquidity which meets the expectations of the Financial Services Authority (FSA) and the wider investment community. We maintain a buffer of liquid assets, determined by liquidity stress tests, which is designed to cover unforeseen circumstances in any of our businesses. The Group and Company have a strong liquidity position (£1.5 billion of financial assets held at Group) and through the application of a Group Liquidity policy seek to maintain sufficient financial resources to meet its obligations as they fall due. In addition to this strong liquidity position, the Group and Company maintain significant undrawn committed borrowing facilities (£2.1 billion) from a range of highly rated banks to further mitigate this risk.
Asset liability matching The Group market risk policy sets out the minimum principles and framework for matching liabilities with appropriate assets, the approaches to be taken when liabilities cannot be matched and the monitoring processes that are required. The Group has criteria for matching assets and liabilities for all classes of business to minimise the impact of mismatches between the value of assets and the liabilities due to market movements. The local regulatory environment for each business will also set the conditions under which assets and liabilities are to be matched. The Asset Liability matching (ALM) methodology develops optimal asset portfolio maturity structures for our businesses which seek to ensure that the cash flows are sufficient to meet the liabilities as they are expected to arise.

Notes to the consolidated financial statements continued
294
Aviva plc Annual Report and Accounts 2010
57 – Risk management continued Where any decision to adopt a position in respect of policyholder assets and liabilities is not closely matched but is within the business unit’s investment risk appetite, the impact is monitored through our economic capital measurement process. The decision taken must be justified to the local management board and Group management by a full analysis of the impact of the level of mismatch on both risk and return. ALM strategy may be determined at a sub-fund level for a block of closely related liabilities. Alternatively, if ALM strategy is determined at a fund or company level, it will usually be appropriate (for pricing, financial reporting and risk management purposes) to develop a hypothecation of assets to notional sub-funds with different liability characteristics. It is for this reason that Group Risk provides a framework of corporate objectives within which the operating businesses develop specific and appropriate ALM methodologies, to seek to ensure that our businesses have sufficient liquidity to settle claims as they are expected to arise. ALM modelling is based on a projection of both assets and liabilities into the future. A further tenet of our risk management strategy involves investment strategies, which also take into account the accounting, regulatory, capital and tax issues. The ALM strategy also takes into account the reasonable expectations of policyholders, local best practice and meets relevant regulatory requirements. Our investment strategies are designed to seek to ensure that sufficient liquidity exists in extreme business scenarios. For example, our investment strategy must consider a scenario of high lapses accompanied by poor investment markets or a general insurance catastrophe event.
Maturity analyses The following tables show the maturities of our insurance and investment contract liabilities, and of the financial and reinsurance assets to meet them. A maturity analysis of the contractual amounts payable for borrowings and derivatives is given in notes 49 and 58 respectively. Contractual obligations under operating leases and capital commitments are given in note 53.
(i) Analysis of maturity of insurance and investment contract liabilities For non-linked insurance business, the following table shows the gross liability at 31 December 2010 analysed by remaining duration. The total liability is split by remaining duration in proportion to the cash-flows expected to arise during that period, as permitted under IFRS 4, Insurance Contracts. Almost all investment contracts may be surrendered or transferred on demand. For such contracts, the earliest contractual maturity date is therefore the current statement of financial position date, for a surrender amount approximately equal to the current statement of financial position liability. We expect surrenders, transfers and maturities to occur over many years, and the tables reflect the expected cash flows for non-linked investment contracts. However, contractually, the total liability for non-linked investment contracts of £63,197 million (2009: £59,504 million) would be shown in the ‘within 1 year’ column below. Unit-linked contracts are repayable or transferable on demand and are therefore shown in the ‘within 1 year’ column.
At 31 December 2010 Total
£m
On demand
or within 1 year
£m 1–5 years
£m 5–15 years
£m
Over 15 years
£m
Long-term business Insurance contracts – non-linked 132,400 12,025 42,609 50,206 27,560 Investment contracts – non-linked 63,197 3,254 13,970 26,901 19,072 Linked business 82,769 82,769 — — — General insurance and health 17,121 7,222 6,453 2,872 574
Total contract liabilities 295,487 105,270 63,032 79,979 47,206
At 31 December 2009 Total
£m
On demand
or within 1 year
£m 1–5 years
£m 5–15 years
£m
Over 15 years
£m
Long-term business Insurance contracts – non-linked 123,933 10,139 38,549 45,181 30,064 Investment contracts – non-linked 59,504 4,304 12,562 24,119 18,519 Linked business 80,206 80,206 — — — General insurance and health 17,484 7,215 6,936 2,865 468
Total contract liabilities 281,127 101,864 58,047 72,165 49,051

Performance reviewCorporate responsibilityGovernanceShareholder informationFinancial statements IFRSFinancial statements MCEVOther information
Financial statements IFRS
Notes to the consolidated financial statements continued
295
Aviva plc Annual Report and Accounts 2010
57 – Risk management continued (ii) Analysis of maturity of financial assets The following table provides an analysis, by maturity date of the principal, of the carrying value of financial assets which are available to fund the repayment of liabilities as they crystallise.
At 31 December 2010 Total
£m
On demand
or within 1 year
£m 1-5 years
£m
Over 5 years
£m
No fixed term
(perpetual) £m
Debt securities 167,482 20,996 46,182 100,133 171 Equity securities 49,076 — — — 49,076 Other investments 36,730 32,625 1,713 956 1,436 Loans 43,074 7,492 5,339 30,240 3 Cash and cash equivalents 25,455 25,455 — — —
321,817 86,568 53,234 131,329 50,686
At 31 December 2009 Total
£m
On demand
or within 1 year
£m 1-5 years
£m
Over 5 years
£m
No fixed term
(perpetual) £m
Debt securities 161,757 17,309 45,298 98,792 358 Equity securities 45,428 — — — 45,428 Other investments 31,517 29,091 414 493 1,519 Loans 41,079 6,867 4,146 30,066 — Cash and cash equivalents 25,176 25,176 — — —
304,957 78,443 49,858 129,351 47,305
As described in note 25, £1,247 million debt securities and £2,085 million equity securities held by consolidated French mutual funds, previously included within other investments, have been reclassified as debt and equity securities as at 31 December 2009. The maturity analysis at 31 December 2009 has been amended accordingly. The assets above are analysed in accordance with the earliest possible redemption date of the instrument at the initiation of the Group. Where an instrument is transferable back to the issuer on demand, such as most unit trusts or similar types of investment vehicle, it is included in the ‘On demand or within 1 year’ column. Debt securities with no fixed contractual maturity date are generally callable at the option of the issuer at the date the coupon rate is reset under the contractual terms of the instrument. The terms for resetting the coupon are such that we expect the securities to be redeemed at this date, as it would be uneconomic for the issuer not to do so, and for liquidity management purposes we manage these securities on this basis. The first repricing and call date is normally ten years or more after the date of issuance. Most of the Group’s investments in equity securities and fixed maturity securities are market traded and therefore, if required, can be liquidated for cash at short notice.
(e) Insurance risk (i) Life insurance risk Types of risk Life insurance risk in the Group arises through its exposure to mortality and morbidity insurance and exposure to worse than anticipated operating experience on factors such as persistency levels and management and administration expenses.
Risk management framework The Group has developed a life insurance risk policy and guidelines on the practical application of this policy. Individual life insurance risks are managed at a business unit level but are also monitored at Group level. The impact of life insurance risks is monitored by the business units as part of the control cycle of business management. Exposure is monitored through the assessment of liabilities, the asset liability management framework, profit reporting (under both IFRS and MCEV), and the ICA process. Significant insurance risks will be reported through the risk management framework and overseen by the Life Insurance Committee. At Group level the overall exposure to life insurance risk is measured through the ICA and other management reporting. The Life Insurance Committee monitors the application of the risk policy in each business, and receives management information on life insurance risks. The committee considers all areas of life insurance risk, but in particular has a remit to monitor mortality, longevity, morbidity, persistency, product development and pricing, unit pricing and expenses. The committee also considers the reinsurance coverage across the life businesses. It confirms that guidance and procedures are in place for each of the major components of life insurance risk, and that the businesses mitigate against any life insurance risk outside local appetite, within the parameters for the overall Group risk appetite. The committee has also developed guidance for business units on management of a number of areas of life insurance risk to ensure best practice is shared throughout the Group and common standards are adopted.

Notes to the consolidated financial statements continued
296
Aviva plc Annual Report and Accounts 2010
57 – Risk management continued Management of life insurance risks The individual life insurance risks are managed as follows:
Mortality and morbidity risks are mitigated by use of reinsurance. The Group allows business units to select reinsurers, from those approved by the Group, based on local factors, but assesses the overall programme to manage Group-wide risk exposures and monitor the aggregation of risk ceded to individual reinsurers is within appetite for credit risk.
Longevity risk is carefully monitored against the latest external industry data and emerging trends. Whilst individual businesses are responsible for reserving and pricing for annuity business, the Group monitors the exposure to this risk and the capital implications to manage the impact on the Group-wide exposure and the capital funding that businesses may require as a consequence. The Group has used reinsurance solutions to reduce the risks from longevity where possible and desirable and continually monitors and evaluates emerging market solutions to mitigate this risk further.
Persistency risk is managed at a business unit level through frequent monitoring of company experience, benchmarked against local market information. Generally, persistency risk arises from customers lapsing their policies earlier than has been assumed. Where possible the financial impact of lapses is reduced through appropriate product design. Businesses also implement specific initiatives to improve retention of policies which may otherwise lapse. The Group Life Insurance Committee has developed guidelines on persistency management.
Product design and pricing risk arises from poorly designed or inadequately priced products and can lead to both financial loss for and reputation damage to the Group. Guidelines have been developed to support the businesses through the complete cycle of the product development process, financial analysis and pricing.
Expense risk is primarily managed by the business units through the assessment of business unit profitability and frequent monitoring of expense levels.
Apart from the ICA, sensitivity testing is widely used to measure the capital required and volatility in earnings due to exposure to life insurance risks, typically through MCEV reporting (examples of which are contained elsewhere in this report). This assessment is taken at both business unit level and at Group level where the impact of aggregation of similar risks can be measured. This enables the Group to determine whether action is required to reduce risk, or whether that risk is within the overall risk appetite.
Concentration risk The Group writes a diverse mix of business in worldwide markets that are all subject to similar risks (mortality, persistency, etc). The Group assesses the relative exposures to and concentrations of each type of risk through the ICA capital requirements and material issues are escalated to and addressed at the Life Insurance Committee. This analysis enables the Group to assess whether accumulations of risk exceed risk appetite. One key concentration of life insurance risk for the Group is improving longevity risk from pensions in payment and deferred annuities in the UK and the Netherlands where the Group has material portfolios. The Group continually monitors this risk and the opportunities for mitigating actions through reinsurance, improved asset liability matching, or innovative solutions that emerge in the market. When looking at concentrations of risk, for example market risk, the risk within Aviva staff pension schemes is also considered. ICA analysis and MCEV sensitivity testing help identify both concentrations of risk types and the benefits of diversification of risk.
Embedded derivatives The Group has exposure to a variety of embedded derivatives in its long-term savings business due to product features offering varying degrees of guaranteed benefits at maturity or on early surrender, along with options to convert their benefits into different products on pre-agreed terms. The extent of the impact of these embedded derivatives differs considerably between business units. Examples of each type of embedded derivative affecting the Group are:
Options: call, put, surrender and maturity options, guaranteed annuity options, options to cease premium payment, options for withdrawals free of market value adjustment, annuity options, and guaranteed insurability options.
Guarantees: embedded floor (guaranteed return), maturity guarantee, guaranteed death benefit, and guaranteed minimum rate of annuity payment.
Other: indexed interest or principal payments, maturity value, loyalty bonus. The impact of these is reflected in ICA and MCEV reporting and managed as part of the asset liability framework.
(ii) General insurance risk Types of risk General insurance risk in the Group arises from:
Fluctuations in the timing, frequency and severity of claims and claim settlements relative to expectations; Unexpected claims arising from a single source; Inaccurate pricing of risks or inappropriate underwriting of risks when underwritten; Inadequate reinsurance protection or other risk transfer techniques; and Inadequate reserves.
The majority of the general insurance business underwritten by the Group is of a short tail nature such as motor, household and commercial property insurances. The Group’s underwriting strategy and appetite is agreed by the Executive Committee and communicated via specific policy statements and guidelines. Like life insurance risk, general insurance risk is managed primarily at business unit level with oversight at a Group level, through the General Insurance Committee.

Performance reviewCorporate responsibilityGovernanceShareholder informationFinancial statements IFRSFinancial statements MCEVOther information
Financial statements IFRS
Notes to the consolidated financial statements continued
297
Aviva plc Annual Report and Accounts 2010
57 – Risk management continued The vast majority of the Group’s general insurance business is managed and priced in the same country as the domicile of the customer.
Management of general insurance risks Significant insurance risks will be reported through the risk management framework. Additionally, the ICA is used to assess the risks that each general insurance business unit, and the Group as a whole, is exposed to, quantifying their impact and calculating appropriate capital requirements. Increasingly risk-based capital models are being used to support the quantification of risk under the ICA framework. All general insurance business units undertake a quarterly review of their insurance risks, the output from which is a key input into the ICA and risk-based capital assessments. The General Insurance Committee monitors and develops the management of insurance risk in the general insurance business units, and assesses the aggregate risk exposure. It is responsible for the development, implementation and review of the Group policies for underwriting, claims, reinsurance and reserving that operate within the risk management framework. Business units have developed mechanisms that identify, quantify and manage accumulated exposures to contain them within the limits of the appetite of the Group. The Group has pioneered various developments, such as the Aviva UK Digital Flood Map to effectively manage exposures arising from specific perils. Where appropriate such projects are employed throughout the business units to promote the adoption of best practice as standard.
General insurance claims reserving Actuarial claims reserving is conducted by local actuaries in the various general insurance business units according to the General Insurance Reserving policy. The General Insurance Committee monitors and maintains the General Insurance Reserving policy, and conducts quarterly reviews of the Group’s general insurance claims provisions, and their adequacy. The reviews include peer reviews of the business unit’s own conclusions as well as independent analysis to confirm the reasonableness of the local reviews. The adequacy of the Group’s general insurance claims provisions is ultimately overseen by the General Insurance Committee. A number of business units also have periodic external reviews by local consultant actuaries (often as part of the local regulatory requirement).
Reinsurance strategy Significant reinsurance purchases are reviewed annually at both business unit and Group level, to verify that the levels of protection being bought reflect any developments in exposure and the risk appetite of the Group. Reinsurance purchases must be in line with the strategy set out in our General Insurance Reinsurance policy. The basis of these purchases is underpinned by extensive financial and capital modelling and actuarial analysis to optimise the cost and capital efficiency benefits from our reinsurance programme. For the larger business units, this involves utilising externally sourced probabilistic models to verify the accumulations and loss probabilities based on the Group’s specific portfolios of business. Where external models are not available, scenarios are developed and tested using the Group’s data to determine potential losses and appropriate levels of reinsurance protection. The reinsurance is placed with providers who meet the Group’s counterparty security requirements, and large reinsurance placements may also require approval from the Asset Liability Committee.
Concentration risk Processes are in place to manage catastrophe risk in individual business units and at a Group level. The Group cedes much of its worldwide catastrophe risk to third-party reinsurers but retains a pooled element for its own account gaining diversification benefit. The total Group potential loss from its most concentrated catastrophe exposure zone (Northern Europe) is approximately £300 million, for a one in ten year annual loss scenario, compared to approximately £550 million when measured on a one in a hundred year annual loss scenario. For the 2010 underwriting year the Group participated in a share of a reinsurer’s US property catastrophe reinsurance portfolio. As this exposure does not correlate with the Group’s other general insurance exposures this provided a strategic opportunity to diversify the general insurance portfolio with a risk that had a high expected profit margin but also a high potential for loss. The modelled loss from a one in ten year annual loss scenario was £55 million compared to approximately £160 million when measured on a one in a hundred year annual loss scenario. As a result of better than normal experience the arrangement delivered above average underwriting returns in 2010. Notwithstanding the good return in 2010, we have renewed the arrangement in 2011 on a reduced scale reflecting expected market conditions. The total expected loss from a one in ten year annual loss scenario is £40 million compared to approximately £100 million when measured on a one in hundred year annual loss scenario.
(f) Operational risk Types of operational risk Operational risk is the risk of loss, arising from inadequate or failed internal processes, or from people and systems, or from external events. Operational risks include business protection, information technology, people, legal and regulatory compliance risks.
Operational risk management We process a large number of complex transactions across numerous and diverse products, and are highly dependent on the proper functioning of information technology and communications systems. We are partially reliant on the operational processing performance of our outsourced partners including certain servicing and IT functions. The long-term nature of our business means that accurate records have to be maintained for significant periods. Significant resources are devoted to maintaining efficient and effective operations within our framework of corporate responsibility, policies and business ethics code.

Notes to the consolidated financial statements continued
298
Aviva plc Annual Report and Accounts 2010
57 – Risk management continued Our businesses are primarily responsible for identifying and managing operational risks in line with minimum standards of control set out in our policies. Each operational risk is assessed by considering the potential impact and the probability of the event occurring. Impact assessments are considered against financial, operational and reputation criteria. Business management teams must be satisfied that all material risks falling outside our risk appetite are being mitigated, monitored and reported to an appropriate level. Any risks with a high potential impact level are monitored centrally on a regular basis. Businesses use key indicator data to help monitor the status of the risk and control environment. They also identify and capture loss events; taking appropriate action to address actual control breakdowns and promote internal learning from these occurrences. The Operational Risk Committee (ORC) oversees the Group’s aggregate operational risk exposure on behalf of the Group Executive Committee. It makes recommendations on the risk appetite that the Group can work within for operational risk, assesses and monitors overall operational risk exposures, identifying any concentrations of operational risk across the Group, and in particular verifies that mitigating action plans are implemented. The ORC operates a number of sub-committees which focus on specific areas of operational risk including customer, brand, business protection, IT, people, legal and regulatory compliance.
(g) Brand and reputation risk We are dependent on the strength of our brands, the brands of our partners and our reputation with customers and agents in the sale of our products and services. Our success and results are, to a certain extent, dependent on the strength of our global Aviva brand and reputation. While we as a group are well recognised, we are vulnerable to adverse market and customer perception. We operate in an industry where integrity, customer trust and confidence are paramount. We are exposed to the risk that litigation, employee misconduct, operational failures, the outcome of regulatory investigations, media speculation and negative publicity, disclosure of confidential client information, inadequate services, amongst others, whether or not founded, could impact our brands or reputation. Any of our brands or our reputation could also be affected if products or services recommended by us (or any of our intermediaries) do not perform as expected (whether or not the expectations are founded) or the customer’s expectations for the product change. One of the FSA’s strategic objectives is to help customers get a fair deal through its ‘treating customers fairly’ principle. Examples of ‘treating customers fairly’ include: products and services targeted to meet customers’ needs and which perform in line with what customers have been led to expect; clear information (and advice where relevant); good service; and making sure there are no unfair barriers that prevent customers from getting access to their money, changing products or making a successful insurance claim. The FSA regularly checks that we are meeting the requirement to treat our customers fairly and we make use of various metrics to assess our own performance, including customer advocacy, retention and complaints. Failure to meet these requirements could also impact our brands or reputation. If we do not manage successfully the perception of our brands and reputation, it could cause existing customers or agents to withdraw from our business and potential customers or agents to be reluctant or elect not to do business with us. This would adversely impact our business and results of operations.
(h) Risk and capital management Sensitivity test analysis The Group uses a number of sensitivity test-based risk management tools to understand the volatility of earnings, the volatility of its capital requirements, and to manage its capital more efficiently. Sensitivities to economic and operating experience are regularly produced on all of the Group’s financial performance measurements to inform the Group’s decision making and planning processes, and as part of the framework for identifying and quantifying the risks to which each of its business units, and the Group as a whole, are exposed. For long-term business in particular, sensitivities of MCEV performance indicators to changes in both economic and non-economic experience are continually used to manage the business and to inform the decision making process. More information on MCEV sensitivities can be found in the presentation of results on an MCEV basis in the supplementary section of this report.
Life insurance and investment contracts The nature of long-term business is such that a number of assumptions are made in compiling these financial statements. Assumptions are made about investment returns, expenses, mortality rates and persistency in connection with the in-force policies for each business unit. Assumptions are best estimates based on historic and expected experience of the business. A number of the key assumptions for the Group’s central scenario are disclosed elsewhere in these statements for both IFRS reporting and reporting under MCEV methodology.
General insurance and health business General insurance and health claim liabilities are estimated by using standard actuarial claims projection techniques. These methods extrapolate the claims development for each accident year based on the observed development of earlier years. In most cases, no explicit assumptions are made as projections are based on assumptions implicit in the historic claims.

Performance reviewCorporate responsibilityGovernanceShareholder informationFinancial statements IFRSFinancial statements MCEVOther information
Financial statements IFRS
Notes to the consolidated financial statements continued
299
Aviva plc Annual Report and Accounts 2010
57 – Risk management continued Sensitivity test results Illustrative results of sensitivity testing for long-term business, general insurance and health business and the fund management and non-insurance business are set out below. For each sensitivity test the impact of a reasonably possible change in a single factor is shown, with other assumptions left unchanged. Sensitivity factor Description of sensitivity factor applied
Interest rate and investment return The impact of a change in market interest rates by a 1% increase or decrease. The test allows consistently for similar changes to investment returns and movements in the market value of backing fixed interest securities.
Equity/property market values The impact of a change in equity/property market values by ± 10%. Expenses The impact of an increase in maintenance expenses by 10%. Assurance mortality/morbidity (life insurance only) The impact of an increase in mortality/morbidity rates for assurance
contracts by 5%. Annuitant mortality (life insurance only) The impact of a reduction in mortality rates for annuity contracts by 5%. Gross loss ratios (non-life insurance only) The impact of an increase in gross loss ratios for general insurance and
health business by 5%.
Long-term business Sensitivities as at 31 December 2010 Impact on profit before tax (£m)
Interest rates +1%
Interest rates -1%
Equity/ property
+10%
Equity/ property
-10% Expenses
+10%
Assurance mortality
+5%
Annuitant mortality
-5%
Insurance participating (55) (235) 65 (125) (45) (10) (45) Insurance non-participating (220) 265 55 (55) (20) (45) (310) Investment participating (15) 15 35 (70) (15) — — Investment non-participating (30) 35 15 (15) (5) — — Assets backing life shareholders’ funds 15 (15) 160 (155) — — —
Total (305) 65 330 (420) (85) (55) (355)
Impact before tax on shareholders’ equity (£m)
Interest rates +1%
Interest rates -1%
Equity/ property
+10%
Equity/ property
-10% Expenses
+10%
Assurance mortality
+5%
Annuitant mortality
-5%
Insurance participating (85) (190) 65 (125) (45) (10) (45) Insurance non-participating (590) 680 240 (240) (20) (45) (310) Investment participating (15) 15 35 (70) (15) — — Investment non-participating (110) 125 15 (15) (5) — — Assets backing life shareholders’ funds (90) 90 280 (275) — — —
Total (890) 720 635 (725) (85) (55) (355)
Sensitivities as at 31 December 2009 Impact on profit before tax (£m)
Interest rates +1%
Interest rates -1%
Equity/ property
+10%
Equity/ property
-10% Expenses
+10%
Assurance mortality
+5%
Annuitant mortality
-5%
Insurance participating (20) (275) 15 (35) (15) (5) (40) Insurance non-participating (190) 270 35 (35) (25) (40) (280) Investment participating (65) (15) 20 (30) (15) — — Investment non-participating (30) 45 20 (20) (5) — — Assets backing life shareholders’ funds (10) 10 135 (140) — — —
Total (315) 35 225 (260) (60) (45) (320) 1. The comparative 2008 economic sensitivities for insurance non-participating business have been restated to reflect modelling enhancements in Delta Lloyd.
Impact before tax on shareholders’ equity (£m)
Interest rates +1%
Interest rates -1%
Equity/ property
+10%
Equity/ property
-10% Expenses
+10%
Assurance mortality
+5%
Annuitant mortality
-5%
Insurance participating (40) (235) 20 (40) (15) (5) (40) Insurance non-participating (380) 535 220 (220) (25) (40) (280) Investment participating (65) (15) 20 (30) (15) — — Investment non-participating (80) 125 20 (20) (5) — — Assets backing life shareholders’ funds (65) 85 215 (215) — — —
Total (630) 495 495 (525) (60) (45) (320)

Notes to the consolidated financial statements continued
300
Aviva plc Annual Report and Accounts 2010
57 – Risk management continued The different impacts of the economic sensitivities on profit and shareholders’ equity arise from classification of certain assets as available for sale in some business units, for which movements in unrealised gains or losses would be taken directly to shareholders’ equity. The sensitivities to economic movements relate mainly to business in the UK, US and the Netherlands. In general a fall in market interest rates has a beneficial impact on non-participating business and shareholders’ funds, due to the increase in market value of fixed interest securities and the relative durations of assets and liabilities; similarly a rise in interest rates has a negative impact. In the US most debt securities are classified as available-for-sale, which limits the overall sensitivity of IFRS profit to interest rate movements. The sensitivity to movements in equity and property market values relates mainly to holdings in the Netherlands, although the impact on IFRS profit is moderated by the classification of equities as available for sale. Changes in sensitivities between 2009 and 2010 reflect movements in market interest rates, portfolio growth, changes to asset mix and the relative durations of assets and liabilities and asset liability management actions. Investment variances of £791 million in 2010 include £1,010 million relating to Delta Lloyd. Of this, around £800 million is due to differing movements in asset and liability yield curves while the remainder primarily relates to gains on interest rate derivatives. Liabilities in Delta Lloyd are discounted using a yield curve based on a fully collateralised AAA bond portfolio. The discount rate increased in 2010 as an increase of around 80bps in credit spreads on collateralised bonds was only partly offset by lower risk-free yields. As a result, whilst lower interest rates increased the market value of assets, this has not been offset by a corresponding movement in liabilities. The AAA collateralised bond spread movement in the year reflected the perceived risk regarding the curve’s components which include bonds issued by Spanish savings banks and a range of other European organisations. If spreads were to reduce, this would increase the insurance liabilities and this increase may not be offset by a corresponding increase in asset values. Changes to the Delta Lloyd curve, which can generate gains or losses, can therefore significantly impact profit before tax and shareholders’ equity and the magnitude of this sensitivity is illustrated by the £800 million profit before tax and increase in shareholders’ equity experiences in 2010. The mortality sensitivities relate primarily to the UK. The impact on the Group’s results from sensitivity to these assumptions can also be found in the MCEV sensitivities included in the alternative method of reporting long-term business profits section.
General insurance and health business Sensitivities as at 31 December 2010 Impact on profit before tax (£m)
Interest rates +1%
Interest rates -1%
Equity/ property
+10%
Equity/ property
-10% Expenses
+10%
Gross loss ratios +5%
Gross of reinsurance (305) 300 95 (100) (135) (325) Net of reinsurance (360) 365 95 (100) (135) (310)
Impact before tax on shareholders’ equity (£m)
Interest rates +1%
Interest rates -1%
Equity/ property
+10%
Equity/ property
-10% Expenses
+10%
Gross loss ratios +5%
Gross of reinsurance (305) 300 95 (100) (35) (325) Net of reinsurance (360) 365 95 (100) (35) (310)
Sensitivities as at 31 December 2009 Impact on profit before tax (£m)
Interest rates +1%
Interest rates -1%
Equity/ property
+10%
Equity/ property
-10% Expenses
+10%
Gross loss ratios +5%
Gross of reinsurance (310) 295 105 (110) (135) (345) Net of reinsurance (365) 365 105 (110) (135) (330)
Impact before tax on shareholders’ equity (£m)
Interest rates +1%
Interest rates -1%
Equity/ property
+10%
Equity/ property
-10% Expenses
+10%
Gross loss ratios +5%
Gross of reinsurance (310) 295 105 (110) (35) (345) Net of reinsurance (365) 365 105 (110) (35) (330)
For general insurance, the impact of the expense sensitivity on profit also includes the increase in ongoing administration expenses, in addition to the increase in the claims handling expense provision.

Performance reviewCorporate responsibilityGovernanceShareholder informationFinancial statements IFRSFinancial statements MCEVOther information
Financial statements IFRS
Notes to the consolidated financial statements continued
301
Aviva plc Annual Report and Accounts 2010
57 – Risk management continued Fund management and non-insurance business Sensitivities as at 31 December 2010 Impact before profit before tax (£m)
Interest rates +1%
Interest rates -1%
Equity/ property
+10%
Equity/ property
-10%
Total 5 (5) 15 35
Impact before tax on shareholders’ equity (£m)
Interest rates +1%
Interest rates -1%
Equity/ property
+10%
Equity/ property
-10%
Total (30) 40 20 30
Sensitivities as at 31 December 2009 Impact before profit before tax (£m)
Interest rates +1%
Interest rates -1%
Equity/ property
+10%
Equity/ property
-10%
Total (20) 25 70 (30)
Impact before tax on shareholders’ equity (£m)
Interest rates +1%
Interest rates -1%
Equity/ property
+10%
Equity/ property
-10%
Total (40) 55 80 (50)
Limitations of sensitivity analysis The above tables demonstrate the effect of a change in a key assumption while other assumptions remain unchanged. In reality, there is a correlation between the assumptions and other factors. It should also be noted that these sensitivities are non-linear, and larger or smaller impacts should not be interpolated or extrapolated from these results. The sensitivity analyses do not take into consideration that the Group’s assets and liabilities are actively managed. Additionally, the financial position of the Group may vary at the time that any actual market movement occurs. For example, the Group’s financial risk management strategy aims to manage the exposure to market fluctuations. As investment markets move past various trigger levels, management actions could include selling investments, changing investment portfolio allocation, adjusting bonuses credited to policyholders, and taking other protective action. A number of the business units use passive assumptions to calculate their long-term business liabilities. Consequently, a change in the underlying assumptions may not have any impact on the liabilities, whereas assets held at market value in the statement of financial position will be affected. In these circumstances, the different measurement bases for liabilities and assets may lead to volatility in shareholder equity. Similarly, for general insurance liabilities, the interest rate sensitivities only affect profit and equity where explicit assumptions are made regarding interest (discount) rates or future inflation. Other limitations in the above sensitivity analyses include the use of hypothetical market movements to demonstrate potential risk that only represent the Group’s view of possible near-term market changes that cannot be predicted with any certainty; and the assumption that all interest rates move in an identical fashion.

Notes to the consolidated financial statements continued
302
Aviva plc Annual Report and Accounts 2010
58 – Derivative financial instruments This note gives details of the various derivative instruments we use to mitigate risk. The Group uses a variety of derivative financial instruments, including both exchange traded and over-the-counter instruments, in line with our overall risk management strategy. The objectives include managing exposure to price, foreign currency and/or interest rate risk on existing assets or liabilities, as well as planned or anticipated investment purchases. In the narrative and tables below, figures are given for both the notional amounts and fair values of these instruments. The notional amounts reflect the aggregate of individual derivative positions on a gross basis and so give an indication of the overall scale of the derivative transaction. They do not reflect current market values of the open positions. The fair values represent the gross carrying values at the year end for each class of derivative contract held (or issued) by the Group. The fair values do not provide an indication of credit risk, as many over-the-counter transactions are contracted and documented under ISDA (International Swaps and Derivatives Association, Inc.) master agreements or their equivalent. Such agreements are designed to provide a legally enforceable set-off in the event of default, which reduces credit exposure. In addition, the Group has collateral agreements in place between the individual Group entities and relevant counterparties.
(a) Hedged derivatives The Group has formally assessed and documented the effectiveness of its hedged derivatives in accordance with IAS 39, Financial Instruments: Recognition and Measurement. To aid discussion and analysis, these derivatives are analysed into cash flow, fair value and net investment hedges, as detailed below.
(i) Cash flow hedges The Group has used forward starting interest rate swap agreements in the United States to hedge the variability in future cash flows associated with the forecasted purchase of fixed-income assets. During 2010, the cash flow hedges were discontinued, resulting in a fair value gain of £nil. The notional value of these interest rate swaps was £3 million at 31 December 2009 and their fair value was £nil.
(ii) Fair value hedges The Group has entered into a number of interest rate swaps in order to hedge fluctuations in the fair value part of its portfolio of mortgage loans and debt securities in the Netherlands and the United States. The notional value of these interest rate swaps was £2,170 million at 31 December 2010 (2009: £3,060 million) and their fair value was £74 million liability (2009: £184 million liability). These hedges were fully effective during the year.
(iii) Net investment hedges To reduce its exposure to foreign currency risk, the Group has entered into the following net investment hedges:
The Group has designated a portion of its euro and US dollar denominated debt as a hedge of the net investment in its European and American subsidiaries. The carrying value of the debt at 31 December 2010 was £2,791 million (2009: £2,806 million) and its fair value at that date was £2,811 million (2009: £2,709 million).
The foreign exchange gain of £53 million (2009: gain of £255 million) on translation of the debt to sterling at the statement of financial position date has been recognised in the hedging instruments reserve in shareholders’ equity. This hedge was fully effective throughout the current and prior years.
The Group’s sterling/euro cross currency swap derivative, which was designated as a hedge of the net investment in its European subsidiaries, matured in November 2010. Therefore, the notional value of the derivative at 31 December 2010 was £nil (2009: £500 million) and its fair value at that date was £nil (2009: £120 million liability). The fair value gain on maturity was £22 million. This hedge was fully effective up to its maturity.

Performance reviewCorporate responsibilityGovernanceShareholder informationFinancial statements IFRSFinancial statements MCEVOther information
Financial statements IFRS
Notes to the consolidated financial statements continued
303
Aviva plc Annual Report and Accounts 2010
58 – Derivative financial instruments continued (b) Non-hedge derivatives Non-hedge derivatives either do not qualify for hedge accounting under IAS 39 or the option to hedge account has not been taken.
(i) The Group’s non-hedge derivative activity at 31 December 2010 was as follows:
2010 2009
Contract/ notional amount
£m
Fair value asset
£m
Fair value liability
£m
Contract/ notional amount
£m
Fair value asset
£m
Fair value liability
£m
Foreign exchange contracts OTC Forwards 12,211 69 (102) 6,091 17 (53) Interest and currency swaps 830 164 (125) 1,408 41 (53) Options 2,000 16 (26)
Total 15,041 249 (253) 7,499 58 (106)
Interest rate contracts OTC Forwards 1,868 1 — 1,043 5 — Swaps 31,391 522 (1,155) 26,718 297 (839) Options 8,883 271 (71) 10,637 432 (4) Exchange traded Futures 4,748 12 (111) 5,542 404 (38) Options 471 17 — 1,066 28 —
Total 47,361 823 (1,337) 45,006 1,166 (881)
Equity/Index contracts OTC Forwards — — — 863 71 — Swaps 2,008 31 (147) — — — Options 3,849 813 (32) 14,571 663 (243) Exchange traded Futures 4,734 247 (386) 7,417 63 (534) Options 2,284 31 (87) 2,688 19 (2)
Total 12,875 1,122 (652) 25,539 816 (779)
Other 1,668 80 (66) 1,155 37 (29)
Totals at 31 December 76,945 2,274 (2,308) 79,199 2,077 (1,795)
Fair value assets are recognised as ‘Derivative financial instruments’ in note 25(a), whilst fair value liabilities are recognised as ‘other financial liabilities’ in note 50. The Group’s derivative risk management policies are outlined in note 57(b).
(ii) The contractual undiscounted cash flows in relation to non-hedge derivative liabilities have the following maturities:
2010
£m 2009
£m
Within one year 1,037 1,238 Between one and two years 320 155 Between two and three years 320 66 Between three and four years 274 74 Between four and five years 263 51 After five years 2,923 657
5,137 2,241
(c) Collateral Certain derivative contracts, primarily interest rate and currency swaps, involve the receipt or pledging of collateral. The amounts of collateral receivable or repayable are included in notes 26 and 50 respectively.

Notes to the consolidated financial statements continued
304
Aviva plc Annual Report and Accounts 2010
59 – Assets under management In addition to the assets included in the consolidated statement of financial position, the Group manages many funds for third parties. This note details the total funds under management. The total Group assets under management are:
2010
£m 2009
£m
Total IFRS assets included in the consolidated statement of financial position 370,107 354,391 Less: Third-party funds included within consolidated IFRS assets (9,999) (9,980)
360,108 344,411 Third-party funds under management 75,491 70,388
435,599 414,799 Non-managed assets (33,348) (35,388)
Funds under management 402,251 379,411
Managed by: Aviva Investors 259,787 249,630 Other Aviva and external managers 142,464 129,781
402,251 379,411

Performance reviewCorporate responsibilityGovernanceShareholder informationFinancial statements IFRSFinancial statements MCEVOther information
Financial statements IFRS
Notes to the consolidated financial statements continued
305
Aviva plc Annual Report and Accounts 2010
60 – Related party transactions This note gives details of the transactions between Group companies and related parties which comprise our joint ventures, associates and staff pension schemes. The Group receives income from related parties from transactions made in the normal course of business. Loans to related parties are made on normal arm’s-length commercial terms.
Services provided to related parties
2010 2009
Income earned in year
£m
Receivable at year end
£m
Income earned in year
£m
Receivable at year end
£m
Associates 47 — 49 3 Joint ventures 18 375 17 327 Employee pension schemes 10 2 9 2
75 377 75 332
Income from associates predominantly relates to our investments in the Royal Bank of Scotland (RBS) life and collective investment companies prior to their restructuring described in note 3(a)). Under management service agreements with these associates, our UK life insurance companies provided administration services, the cost of which was recharged to the RBS companies. In addition, our fund management companies provided fund management services to these associates, for which they charged fees based on the level of funds under management. Movements in loans made to our associates may be found in note 19. Transactions with joint ventures relate to the property management undertakings. At 31 December 2010, there were 16 such joint ventures, the most material of which are listed in note 18(b). Our interest in these joint ventures comprises a mix of equity and loans, together with the provision of administration services and financial management to many of them. Our UK life insurance companies earn interest on loans advanced to these entities to fund property developments, including shopping, business and distribution centres, and properties in Europe, as well as a film studio development in the UK, movements in which may be found in note 18(a). Our fund management companies also charge fees to these joint ventures for administration services and for arranging external finance. Our UK fund management companies manage most of the assets held by the Group’s main UK staff pension scheme, for which they charge fees based on the level of funds under management. The main UK scheme and the Dutch scheme hold investments in Group-managed funds and insurance policies with other Group companies, as explained in note 48(e)(iii). The related parties’ receivables are not secured and no guarantees were received in respect thereof. The receivables will be settled in accordance with normal credit terms. Details of guarantees, indemnities and warranties provided on behalf of related parties are given in note 52(h).
Services provided by related parties There were no services provided by related parties in 2009 or 2010.
Key management compensation The total compensation to those employees classified as key management, being those having authority and responsibility for planning, directing and controlling the activities of the Group, including the executive and non-executive directors is as follows:
2010
£m 2009
£m
Salary and other short-term benefits 48 39 Post-employment benefits 8 5 Equity compensation plans 21 16 Termination benefits 4 1
Total 81 61
Information concerning individual directors’ emoluments, interests and transactions is given in the Directors’ Remuneration Report.

Financial statements of the Company 306
Aviva plc Annual Report and Accounts 2010
Where applicable, the accounting policies of the Company are the same as those of the Group on pages 170 to 182. The notes identified alphabetically on pages 310 to 314 are an integral part of these separate financial statements. Where the same items appear in the Group financial statements, reference is made to the notes (identified alphabetically) on pages 191 to 305.
Income statement For the year ended 31 December 2010
Note 2010
£m 2009
£m
Income Dividends received from subsidiaries 1,110 1,340 Interest receivable from Group companies 150 156 Net investment (expense)/income (14) 50
1,246 1,546
Expenses Operating expenses B (176) (194) Interest payable to Group companies H (458) (603) Interest payable on borrowings (340) (336)
(974) (1,133)
Profit before tax 272 413 Tax credit C 228 158
Profit after tax 500 571
Statement of comprehensive income For the year ended 31 December 2010
Note 2010
£m
2009
£m
Profit for the year 500 571 Other comprehensive income Fair value gains on investments in subsidiaries and joint ventures A 408 883 Actuarial gains/ (losses) on pension provision 1 (3)
Other comprehensive income, net of tax 409 880
Total comprehensive income for the year 909 1,451

Performance reviewCorporate responsibilityGovernanceShareholder informationFinancial statements IFRSFinancial statements MCEVOther information
Financial statements IFRS
Financial statements of the Company continued
307
Aviva plc Annual Report and Accounts 2010
Where applicable, the accounting policies of the Company are the same as those of the Group on pages 170 to 182. The notes identified alphabetically on pages 310 to 314 are an integral part of these separate financial statements. Where the same items appear in the Group financial statements, reference is made to the notes (identified alphabetically) on pages 191 to 305.
Statement of changes in equity For the year ended 31 December 2010
Note
Ordinary share
capital £m
Preference share
capital £m
Share premium
£m
Merger reserve
£m
Investment valuation
reserve £m
Equity compensation
reserve £m
Retained earnings
£m Equity
£m
Direct capital
instrument £m
Total equity
£m
Balance at 1 January 692 200 1,207 735 6,653 109 3,360 12,956 990 13,946 Profit for the year — — — — — — 500 500 — 500 Other comprehensive income — — — — 408 — 1 409 — 409 Total comprehensive income for the year — — — — 408 — 501 909 — 909 Dividends and appropriations 15 — — — — — — (757) (757) — (757) Shares issued in lieu of dividends 29 & 36 13 — (13) — — — 209 209 — 209 Employee trust shares distributed in the year 31 — — — — — — (50) (50) — (50) Reserves credit for equity compensation plans — — — — — 41 — 41 — 41 Shares issued under equity compensation plans — — — — — (51) 51 — — — Aggregate tax effect — — — — — — 17 17 — 17
Balance at 31 December 705 200 1,194 735 7,061 99 3,331 13,325 990 14,315
Statement of changes in equity For the year ended 31 December 2009
Note
Ordinary share capital
£m
Preference share capital
£m
Share premium
£m
Merger reserve
£m
Investment valuation
reserve £m
Equity compensation
reserve £m
Retained earnings
£m Equity
£m
Direct capital
instrument £m
Total equity
£m
Balance at 1 January 664 200 1,234 735 5,770 113 3,287 12,003 990 12,993 Profit for the year — — — — — — 571 571 — 571 Other comprehensive income — — — — 883 — (3) 880 — 880 Total comprehensive income for the year — — — — 883 — 568 1,451 — 1,451 Dividends and appropriations 15 — — — — — — (853) (853) — (853) Issues of share capital 29 1 — — — — — — 1 — 1 Shares issued in lieu of dividends 29 & 36 27 — (27) — — — 299 299 — 299 Employee trust shares distributed in the year 31 — — — — — — (18) (18) — (18) Reserves credit for equity compensation plans — — — — — 56 — 56 — 56 Shares issued under equity compensation plans — — — — — (60) 60 — — — Aggregate tax effect — — — — — — 17 17 — 17
Balance at 31 December 692 200 1,207 735 6,653 109 3,360 12,956 990 13,946

Financial statements of the Company continued
308
Aviva plc Annual Report and Accounts 2010
Where applicable, the accounting policies of the Company are the same as those of the Group on pages 170 to 182. The notes identified alphabetically on pages 310 to 314 are an integral part of these separate financial statements. Where the same items appear in the Group financial statements, reference is made to the notes (identified alphabetically) on pages 191 to 305.
Statement of financial position At 31 December 2010
Note 2010
£m 2009
£m
Assets Non-current assets Investments in subsidiaries A 17,623 17,236 Investment in joint venture 18c 115 72 Loans owed by subsidiaries H 2,411 3,161 Current tax assets 388 526
20,537 20,995 Current assets Loans owed by subsidiaries H 691 — Other amounts owed by subsidiaries H 2,334 2,546 Other assets 74 110 Cash and cash equivalents 1 4
Total assets 23,637 23,655
Equity Ordinary share capital 29 705 692 Preference share capital 32 200 200 Called up capital 905 892 Share premium account 29b 1,194 1,207 Merger reserve D 735 735 Investment valuation reserve D 7,061 6,653 Equity compensation reserve D 99 109 Retained earnings D 3,331 3,360 Direct capital instrument 33 990 990
Total equity 14,315 13,946
Liabilities Non-current liabilities Borrowings E 4,805 4,871 Loans owed to subsidiaries H 2,867 3,598 Provisions 46 47
7,718 8,516 Current liabilities Borrowings E 504 483 Loans owed to subsidiaries H 514 155 Other amounts owed to subsidiaries H 465 442 Other creditors 121 113
Total liabilities 9,322 9,709
Total equity and liabilities 23,637 23,655
Approved by the Board on 2 March 2011.
Patrick Regan Chief financial officer

Performance reviewCorporate responsibilityGovernanceShareholder informationFinancial statements IFRSFinancial statements MCEVOther information
Financial statements IFRS
Financial statements of the Company continued
309
Aviva plc Annual Report and Accounts 2010
Where applicable, the accounting policies of the Company are the same as those of the Group on pages 170 to 182. The notes identified alphabetically on pages 310 to 314 are an integral part of these separate financial statements. Where the same items appear in the Group financial statements, reference is made to the notes (identified alphabetically) on pages 191 to 305.
Statement of cash flows For the year ended 31 December 2010 All the Company’s operating and investing cash requirements are met by subsidiary companies and settled through intercompany loan accounts. As the direct method of presentation has been adopted for these activities, no further disclosure is required. In respect of financing activities, the following items pass through the Company’s own bank accounts.
2010
£m 2009
£m
Cash flows from financing activities Funding provided by subsidiaries 509 477 New borrowings drawdown, net of expenses 2,251 2,490 Repayment of borrowings (2,272) (2,541) Net drawdown of borrowings (21) (51) Preference dividends paid (17) (17) Ordinary dividends paid (472) (476) Interest paid on borrowings (2) (7)
Net cash from financing activities (3) (74)
Net decrease in cash and cash equivalents (3) (74)
Cash and cash equivalents at 1 January 4 78
Cash and cash equivalents at 31 December 1 4

Notes to the Company’s financial statements
310
Aviva plc Annual Report and Accounts 2010
A – Investments in subsidiaries (i) Movements in the Company’s investments in its subsidiaries are as follows:
2010
£m 2009
£m
Fair value as at 1 January 17,236 16,353 Movement in fair value 387 883
At 31 December 17,623 17,236
Fair values are estimated using applicable valuation models underpinned by the Company’s market capitalisation, and are classified as Level 2 in the fair value hierarchy described in note 22 to the Group consolidated financial statements. (ii) At 31 December 2010, the Company has two wholly owned subsidiaries, both incorporated in Great Britain. These are General Accident plc and Aviva Group Holdings Limited. Aviva Group Holdings Limited is an intermediate holding company, whilst General Accident plc no longer carries out this function. The principal subsidiaries of the Aviva Group at 31 December 2010 are listed on pages 40 and 41.
B – Operating expenses (i) Operating expenses Operating expenses comprise:
2010
£m 2009
£m
Staff costs and other employee related expenditure (see below) 159 130 Other operating costs 42 20 Net foreign exchange (gains)/losses (25) 44
Total 176 194
(ii) Staff costs Total staff costs were:
2010
£m 2009
£m
Wages and salaries 109 85 Social security costs 10 9 Post-retirement obligations Defined benefit schemes (see (iii) below) 8 6 Defined contribution schemes 5 6 Profit sharing and incentive plans 10 9 Equity compensation plans (see (iv) below) 15 12 Termination benefits 2 3
Total 159 130
(iii) Pension costs The Company is one of a number of UK companies being charged for its employees participating in the Aviva Staff Pension Scheme, and its contributions are affected by the financial position of the scheme. There is no contractual agreement or policy for charging the net defined benefit cost for this scheme across the participating Group entities but, instead, this cost is recognised in the financial statements of the main UK employing company. The Company therefore recognises a pension expense equal to its contributions payable in the year for its staff, together with the service cost of any unfunded benefits, within staff costs above. Full disclosure on the Group’s pension schemes is given in the Group consolidated financial statements, note 48. (iv) Equity compensation plans All transactions in the Group’s equity compensation plans involve options and awards for ordinary shares of the Company. Full disclosure of these plans is given in the Group consolidated financial statements, note 30. The cost of such options and awards is borne by all participating businesses and, where relevant, the Company bears an appropriate charge. As the majority of the charge to the Company relates to directors’ options and awards, for which full disclosure is made in the Directors’ Remuneration Report, no further disclosure is given here on the grounds of immateriality.

Performance reviewCorporate responsibilityGovernanceShareholder informationFinancial statements IFRSFinancial statements MCEVOther information
Financial statements IFRS
Notes to the Company’s financial statements continued
311
Aviva plc Annual Report and Accounts 2010
C – Tax (i) Tax credited to the income statement
2010
£m 2009
£m
Current tax: For this year 229 151 Prior year adjustments (1) 7
Total tax credited to income statement 228 158
(ii) Tax charged to other comprehensive income No tax was charged or credited to other comprehensive income in 2009 or 2010.
(iii) Tax credited to equity Tax credited to equity comprises £17 million (2009: £17 million) in respect of coupon payments on the direct capital instruments.
(iv) Tax reconciliation The tax on the Company’s profit before tax differs from the theoretical amount that would arise using the tax rate of the home country of the Company as follows:
2010
£m 2009
£m
Profit before tax 272 413
Tax calculated at standard UK corporation tax rate of 28% (2009: 28%) (76) (116) Adjustment to tax charge in respect of prior years (1) 7 Non-assessable dividends 311 375 Disallowable expenses (5) (3) Unpaid group relief — (102) Other (1) (3)
Total tax credited to income statement 228 158
A gradual reduction in the UK corporation tax rate from 28% to 24% over four years was announced in the Emergency Budget of 22 June 2010. The Finance (No. 2) Act 2010 enacted the first of the 1% rate reductions with effect from April 2011. Subsequent reductions will be dealt with by future legislation. There is no impact on the Company’s net assets from the reduction in the rate as the Company has no deferred tax assets or liabilities.
(v) Deferred tax There was no deferred tax recognised in the Company at 31 December 2010 (2009: £nil). The Company has unrecognised other temporary differences of £45 million (2009: £nil).

Notes to the Company’s financial statements continued
312
Aviva plc Annual Report and Accounts 2010
D – Reserves
Merger reserve
£m
Investment valuation
reserve £m
Equity compensation
reserve £m
Retained earnings
£m
Balance at 1 January 2009 735 5,770 113 3,287 Arising in the year: Profit for the year — — — 571 Fair value gains on investments in subsidiaries and joint ventures — 883 — — Actuarial losses on pension provisions — — — (3) Dividends and appropriations — — — (853) Reserves credit for equity compensation plans — — 56 — Shares issued in lieu of dividends — — — 299 Trust shares distributed in the year — — — (18) Issue of share capital under equity compensation scheme — — (60) 60 Aggregate tax effect — — — 17
Balance at 31 December 2009 735 6,653 109 3,360 Arising in the year: Profit for the year — — — 500 Fair value gains on investments in subsidiaries and joint ventures — 408 — — Actuarial gains on pension provisions — — — 1 Dividends and appropriations — — — (757) Reserves credit for equity compensation plans — — 41 — Shares issued in lieu of dividends — — — 209 Trust shares distributed in the year — — — (50) Issue of share capital under equity compensation scheme — — (51) 51 Aggregate tax effect — — — 17
Balance at 31 December 2010 735 7,061 99 3,331
Tax of £17 million (2009: £17 million) is deductible in respect of coupon payments of £61 million (2009: £61 million) on the direct capital instruments.
E – Borrowings The Company’s borrowings comprise:
2010
£m 2009
£m
Subordinated debt 4,606 4,672 9.5% guaranteed bonds 2016 199 199 Commercial paper 504 483
Total 5,309 5,354
Maturity analysis of contractual undiscounted cash flows:
2010 2009
Principal
£m Interest
£m Total
£m Principal
£m Interest
£m Total
£m
Within 1 year 504 306 810 483 328 811 1 to 5 years — 1,214 1,214 — 1,235 1,235 5 to 10 years 634 1,402 2,036 1,074 1,540 2,614 10 to 15 years 1,243 1,062 2,305 1,288 1,349 2,637 Over 15 years 2,956 2,171 5,127 2,544 1,092 3,636
Total contractual undiscounted cash flows 5,337 6,155 11,492 5,389 5,544 10,933
Where subordinated debt is undated, the interest payments have not been included beyond 15 years. Annual interest payments for these borrowings are £73 million (2009: £74 million). The fair value of the subordinated debt at 31 December 2010 was £4,370 million (2009: £4,372 million). The fair value of the 9.5% guaranteed bonds 2016 at 31 December 2010 was £248 million (2009: £238 million). The fair value of the commercial paper is considered to be the same as its carrying value. Further details of these borrowings and undrawn committed facilities can be found in the Group consolidated financial statements, note 49.

Performance reviewCorporate responsibilityGovernanceShareholder informationFinancial statements IFRSFinancial statements MCEVOther information
Financial statements IFRS
Notes to the Company’s financial statements continued
313
Aviva plc Annual Report and Accounts 2010
F – Contingent liabilities Details of the Company’s contingent liabilities are given in the Group consolidated financial statements, note 52(h).
G – Risk management Risk management in the context of the Group is considered in the Group consolidated financial statements, note 57. The business of the Company is managing its investments in subsidiary and joint venture operations. Its risks are considered to be the same as those in the operations themselves and full details of the risk management policies are given in the Group consolidated financial statements, note 57. Such investments are held by the Company at fair value in accordance with accounting policy D. The fair values of the subsidiaries and joint venture are estimated using applicable valuation models, underpinned by the Company’s market capitalisation. This uses a three-month rolling average of the Company’s share price. Given that the key input into the valuation model is based on an observable current share price, and therefore sensitive to movements in that price, the valuation process is not sensitive to non-observable market assumptions. Management believes the resulting estimated fair values recorded in the balance sheet and any changes in fair values recorded in the income statement are reasonable, and are the most appropriate values at the balance sheet date. Financial assets, other than investments in subsidiaries and the joint venture, largely consist of amounts due from subsidiaries. As at the balance sheet date, these receivable amounts were neither past due nor impaired. Financial liabilities owed by the Company as at the balance sheet date are largely in respect of borrowings (details of which are provided in note E and the Group consolidated financial statements, note 49) and loans owed to subsidiaries. Loans owed to subsidiaries were within agreed credit terms as at the balance sheet date.
Interest rate risk Loans to and from subsidiaries are at either fixed or floating rates of interest, with the latter being exposed to fluctuations in these rates. The choice of rates is designed to match the characteristics of financial investments (which are also exposed to interest rate fluctuations) held in both the Company and the relevant subsidiary, to mitigate as far as possible each company’s net exposure. The majority of the Company’s external borrowings are at fixed rates of interest and are therefore not exposed to changes in these rates. However, for those borrowings that are at floating rates, the Company is affected by changes in these rates. Further details of the Company’s borrowings are provided in note E and the Group consolidated financial statements, note 49.
Currency risk The Company’s direct subsidiaries are all incorporated and operating in the UK, and therefore are not exposed to currency risk. However, these subsidiaries are themselves exposed to foreign currency risk arising from fluctuations in exchange rates during the course of providing insurance and asset management services around the world. The exposure of the subsidiaries to currency risk is considered from a Group perspective in the Group consolidated financial statements, note 57. The Company faces exposure to foreign currency risk through some of its borrowings which are denominated in euros and US dollars. However, most of these borrowings have been on-lent to a subsidiary which holds financial investments in these currencies, generating the net investment hedge described in the Group consolidated financial statements, note 58(a)(iii).
H – Related party transactions The Company receives dividend and interest income from subsidiaries and pays interest and fee expense to those subsidiaries in the normal course of business. These activities are reflected in the table below. Loans to and from subsidiaries are made on normal arm’s-length commercial terms. The maturity analysis of the related party loans is as follows:
Loans owed by subsidiaries
Maturity analysis 2010
£m 2009
£m
Within 1 year 691 — 1 to 5 years 1,769 2,050 Over 5 years 642 1,111
Total 3,102 3,161
Loans owed to subsidiaries
2010 2009
Maturity analysis of contractual undiscounted cash flows Principal
£m Interest
£m Total
£m Principal
£m Interest
£m Total
£m
Within 1 year 514 424 938 155 143 298 1 to 5 years 1,125 362 1,487 1,840 431 2,271 Over 5 years 1,742 180 1,922 1,758 217 1,975
Total 3,381 966 4,347 3,753 791 4,544
Other related party balances comprise dividends and interest receivable and payable, as well as inter-company balances for fees and other transactions in the normal course of business.

Notes to the Company’s financial statements continued
314
Aviva plc Annual Report and Accounts 2010
H – Related party transactions continued Dividends, loans, interest Services provided to related parties
2010 2009
Income earned in
year £m
Receivable at year end
£m
Income earned in
year £m
Receivable at year end
£m
Subsidiaries 1,260 5,436 1,496 5,707
The related parties’ receivables are not secured and no guarantees were received in respect thereof. The receivables will be settled in accordance with normal credit terms. Details of guarantees, indemnities and warranties given by the Company on behalf of related parties are given in note 52(h).
Services provided by related parties
2010 2009
Expense incurred in
year £m
Payable at year
end £m
Expense incurred in
year £m
Payable at year
end £m
Subsidiaries 458 3,846 603 4,195
The related parties’ payables are not secured and no guarantees were received in respect thereof. The payables will be settled in accordance with normal credit terms. The directors and key management of the Company are considered to be the same as for the Group. Information on both the Company and Group key management compensation can be found in note 60.

Performance reviewCorporate responsibilityGovernanceShareholder informationFinancial statements IFRSFinancial statements MCEVOther information
Financial statements M
CEV315
Aviva plc Annual Report and Accounts 2010
MCEV Financial statements
In this section Page
Condensed consolidated income statement 316
Condensed consolidated statement of comprehensive income
317
Condensed consolidated statement of changes in equity
317
Condensed consolidated statement of financial position
318
Reconciliation of shareholders’ equity on IFRS and MCEV bases
319
Reconciliation of IFRS total equity to MCEV net worth
319
Group MCEV analysis of earnings 320
E1 – Basis of preparation 321
E2 – Geographical analysis of MCEV operating earnings
325
E3 – Geographical analysis of fund management operating earnings
331
E4 – Analysis of other operations and regional costs
331
E5 – Exceptional items and integration and restructuring costs
331
E6 – Segmentation of condensed consolidated statement of financial position
332
E7 – Analysis of life and pension earnings 333
E8 – Life MCEV operating earnings 334
Page
E9 – Present value of life new business premiums
335
E10 – Geographical analysis of value of new business
336
E11 – Post tax internal rate of return and payback period on life and pensions new business
337
E12 – Free surplus emergence 338
E13 – Maturity profile of business 338
E14 – Segmental analysis of life and related business embedded value
339
E15 – Risk allowance within present value of in-force (VIF)
340
E16 – Implied discount rates (IDR) 341
E17 – Summary of non-controlling interest in life and related businesses’ MCEV results
342
E18 – Principal assumptions 342
E19 – Sensitivity analysis 347
Statement of directors’ responsibilities in respect of the Market Consistent Embedded Value (MCEV) basis
351
Independent auditor’s report to the directors of Aviva plc on the consolidated Market Consistent Embedded Value (MCEV) financial statements
352

MCEV financial statements 316
Aviva plc Annual Report and Accounts 2010
Condensed consolidated income statement – MCEV basis For the year ended 31 December 2010
2010 €m
2010 £m
Restated 2009
£m
Operating profit before tax attributable to shareholders’ profits 1,276 United Kingdom 1,085 787 2,466 Europe 2,096 2,344
340 North America 289 266 128 Asia Pacific 109 101
4,210 Long-term business 3,579 3,498 1,235 General insurance and health 1,050 960
147 Fund management1 125 51 (229) Other operations and regional costs2 (195) (173)
5,363 Regional operating profit 4,559 4,336 (168) Corporate centre (143) (108) (772) Group debt costs and other interest (656) (636)
4,423 Operating profit before tax attributable to shareholders’ profits 3,760 3,592 Adjusted for the following:
(120) Economic variances on long-term business (103) 365 (286) Short-term fluctuation in return on investments on non-long-term business (243) 95
(72) Economic assumption changes on general insurance and health business (61) 57 (28) Impairment of goodwill (24) (62)
(220) Amortisation and impairment of intangibles (187) (135) 187 Profit on the disposal of subsidiaries and associates 159 72
(367) Integration and restructuring costs (312) (286) (504) Exceptional items (428) (248)
3,013 Profit before tax 2,561 3,450 (1,321) Tax on operating profit (1,123) (952)
362 Tax on other activities 308 224 (959) (815) (728)
2,054 Profit for the year 1,746 2,722 All profit is from continuing operations. 1. Excludes the proportion of the results of Aviva Investors fund management businesses and other fund management operations within the Group that arises from the provision of fund management services to our life businesses.
These results are included within the life MCEV operating earnings consistent with the MCEV methodology. 2. Excludes the proportion of the results of subsidiaries providing services to the Life business. These results are included within the life MCEV operating earnings consistent with the MCEV methodology.
Earnings per share – MCEV basis
2010 Earnings per share 2010 Restated
2009
Operating earnings per share on an MCEV basis after tax, attributable to ordinary shareholders of Aviva plc
90.9c Basic (pence per share) 77.3p 83.0p 89.4c Diluted (pence per share) 76.0p 82.2p
Earnings after tax on an MCEV basis, attributable to ordinary shareholders of Aviva plc
69.6c Basic (pence per share) 59.2p 95.8p 67.6c Diluted (pence per share) 58.2p 94.9p
Total MCEV operating profit before shareholder tax was £3,760 million (2009: £3,592 million), an increase of 5%. Within this total the long-term business operating profit before shareholder tax was £3,579 million (2009: £3,498 million), an increase of 2%. For 2010, the expected profit has been adjusted to reflect an even emergence of risk, calculated by using the Implied Discount Rates to ‘unwind’ the opening balances. The basis for setting the underlying normalised investment returns has not been changed. This change has no impact on total profit.

Performance reviewCorporate responsibilityGovernanceShareholder informationFinancial statements IFRSFinancial statements MCEVOther information
Financial statements M
CEV
MCEV financial statements continued Aviva plc Annual Report and Accounts 2010
317
Condensed consolidated statement of comprehensive income – MCEV basis For the year ended 31 December 2010
2010 €m
2010 £m
Restated 2009
£m
2,054 Profit for the year 1,746 2,722 Other comprehensive income
(28) Fair value losses on AFS securities, owner-occupied properties and hedging instruments (24) (86) (18) Fair value gains transferred to profit (15) (30)
1,175 Actuarial losses on pension schemes 999 (1,140) (21) Actuarial gains on pension schemes transferred to unallocated divisible surplus and other movements (18) 24
31 Impairment losses 26 89 (224) Foreign exchange rate movements (190) (1,018)
72 Aggregate tax effect – shareholder tax 61 48
987 Other comprehensive income, net of tax 839 (2,113)
3,041 Total comprehensive income for the year 2,585 609
Attributable to: 3,193 Equity shareholders of Aviva plc 2,714 777 (152) Non-controlling interests (129) (168)
3,041 2,585 609
Condensed consolidated statement of changes in equity – MCEV basis For the year ended 31 December 2010
2010 €m
2010 £m
2009 £m
21,581 Balance at 1 January 18,561 17,771 3,006 Total comprehensive (expense)/income for the year 2,585 609 (880) Dividends and appropriations (757) (853)
— Issues of share capital — 1 243 Shares issued in lieu of dividends 209 299
49 Capital contributions from minority shareholders 42 6 — Net increase to total equity following Delta Lloyd IPO — 930
(217) Minority share of dividends declared in the year (187) (109) 3 Non-controlling interest in (disposed)/acquired subsidiaries 3 (2)
(44) Changes in non-controlling interest in existing subsidiaries (38) (111) (16) Shares acquired by employee trusts (14) (53) 48 Reserves credit for equity compensation plans 41 56 20 Aggregate tax effect – shareholder tax 17 17
23,793 Total equity 20,462 18,561 (4,624) Non-controlling interests (3,977) (4,279)
19,169 Balance at 31 December 16,485 14,282

MCEV financial statements continued
318
Aviva plc Annual Report and Accounts 2010
Condensed consolidated statement of financial position – MCEV basis As at 31 December 2010
2010 €m
2010 £m
Restated 2009
£m
Assets 3,943 Goodwill 3,391 3,381 3,263 Acquired value of in-force business and intangible assets 2,806 2,860 3,182 Additional value of in-force long-term business1 2,737 3,475 2,319 Interests in, and loans to, joint ventures 1,994 1,701
748 Interests in, and loans to, associates 643 1,281 872 Property and equipment 750 753
15,191 Investment property 13,064 12,422 50,086 Loans 43,074 41,079
294,521 Financial investments 253,288 238,679 8,237 Reinsurance assets 7,084 7,572
335 Deferred tax assets 288 218 230 Current tax assets 198 359
9,645 Receivables 8,295 9,632 7,060 Deferred acquisition costs and other assets 6,072 5,621 4,292 Prepayments and accrued income 3,691 3,604
29,599 Cash and cash equivalents 25,455 25,176 16 Assets of operations classified as held for sale 14 53
433,539 Total assets 372,844 357,866
Equity 820 Ordinary share capital 705 692
5,191 Capital reserves 4,465 4,478 2,405 Other reserves 2,069 2,042
(37) Shares held by employee trusts (32) (68) 6,292 Retained earnings 5,411 3,425 3,113 Additional retained earnings on an MCEV basis1 2,677 2,523
17,784 Equity attributable to ordinary shareholders of Aviva plc 15,295 13,092 1,384 Preference share capital and direct capital instruments 1,190 1,190 4,624 Non-controlling interests1 3,977 4,279
23,792 Total equity 20,462 18,561
Liabilities 206,628 Gross insurance liabilities 177,700 171,092 136,962 Gross liabilities for investment contracts 117,787 110,015
3,986 Unallocated divisible surplus 3,428 3,866 10,502 Net asset value attributable to unitholders 9,032 9,894
3,422 Provisions 2,943 3,980 2,044 Deferred tax liabilities 1,758 1,038
365 Current tax liabilities 314 192 17,383 Borrowings 14,949 15,000 23,595 Payables and other financial liabilities 20,292 20,542
4,860 Other liabilities 4,179 3,653 — Liabilities of operations classified as held for sale — 33
409,747 Total liabilities 352,382 339,305
433,539 Total equity and liabilities 372,844 357,866 The summarised consolidated statement of financial position presented above is unaltered from the corresponding IFRS summarised consolidated statement of financial position with the exception of the following: 1. Adding the excess of the Life MCEV, including non-controlling interests, over the corresponding Life IFRS net assets represented as the additional value of in-force long-term business; corresponding item within equity represented by the
additional retained profit on an MCEV basis; and, corresponding adjustments to non-controlling interests.

Performance reviewCorporate responsibilityGovernanceShareholder informationFinancial statements IFRSFinancial statements MCEVOther information
Financial statements M
CEV
MCEV financial statements continued Aviva plc Annual Report and Accounts 2010
319
Reconciliation of shareholders’ equity on IFRS and MCEV bases For the year ended 31 December 2010 2010 £m
IFRS £m
Adjustment £m
MCEV £m
Ordinary share capital 705 — 705 Capital reserves 4,465 — 4,465 Other reserves 2,245 (176) 2,069 Shares held by employee trusts (32) — (32) Retained earnings 5,411 — 5,411 Additional retained earnings on an MCEV basis — 2,677 2,677
Equity attributable to ordinary shareholders of Aviva plc 12,794 2,501 15,295 Preference share capital 200 — 200 Direct capital instruments 990 — 990 Non-controlling interests 3,741 236 3,977
Total equity 17,725 2,737 20,462
2009 £m
IFRS £m
Adjustment £m
Restated MCEV
£m
Ordinary share capital 692 — 692 Capital reserves 4,478 — 4,478 Other reserves 1,829 213 2,042 Shares held by employee trusts (68) — (68) Retained earnings 3,425 — 3,425 Additional retained earnings on an MCEV basis — 2,523 2,523
Equity attributable to ordinary shareholders of Aviva plc 10,356 2,736 13,092 Preference share capital 200 — 200 Direct capital instruments 990 — 990 Non-controlling interests 3,540 739 4,279
Total equity 15,086 3,475 18,561
Reconciliation of IFRS total equity to MCEV net worth For the year ended 31 December 2010
2010
£m
Restated 2009
£m
Net assets on a statutory IFRS net basis 17,725 15,086 Adjusting for general business and other net assets on a statutory IFRS net basis 1,331 2,231
Life and related businesses net assets on a statutory IFRS net basis 19,056 17,317 Goodwill and other intangibles (2,356) (2,606) Acquired value of in-force business (1,447) (1,493) Adjustment for share of joint ventures and associates (120) (377) Adjustment for assets to regulatory value net of tax (890) (19) Adjustment for DAC and DIR net of tax (2,839) (2,653) Adjustment for differences in technical provisions 1,303 1,414 Other accounting and tax differences (467) 630
MCEV net worth 12,240 12,213 MCEV value of in-force1 7,024 6,325
MCEV2 19,264 18,538 1. Comprises PVFP of £10,180 million (31 December 2009: £9,417 million), FC of £(882) million (31 December 2009: £(820) million), CNHR of £(1,070) million (31 December 2009: £(788) million), and TVOG of £(1,204) million
(31 December 2009: £(1,484) million). 2. Comprises embedded value of £16,131 million (31 December 2009: £15,058 million) and non-controlling interest in long-term business assets of £3,133 million (31 December 2009: £3,480million).
The reduced adjustment for share of joint ventures and associates follows the purchase of the remaining shares in RBS Life. The adjustment for assets to regulatory value relates mainly to the US, where the larger negative adjustment in 2010 reflects the increased market value of bonds under IFRS. The DAC and DIR adjustment relates mainly to the UK and US, where DAC balances held for IFRS increased. The difference in technical provisions relates mainly to Delta Lloyd and the US, reflecting differences between the IFRS and local solvency reserving bases.

MCEV financial statements continued
320
Aviva plc Annual Report and Accounts 2010
Group MCEV analysis of earnings
2010 £m
Covered business1
£m A
Non-covered but related
to life business2
£m B
Total life business3
£m A+B
Non-covered relating to
non-life £m
C
Total non-covered business
£m B+C
Total £m
A+B+C
Opening group MCEV 15,058 2,055 17,113 (2,831) (776) 14,282 Opening adjustments — — — — — —
Adjusted opening group MCEV 15,058 2,055 17,113 (2,831) (776) 14,282
Operating MCEV earnings 2,199 — 2,199 12 12 2,211 Non-operating MCEV earnings (361) (63) (424) (79) (142) (503)
Total MCEV earnings 1,838 (63) 1,775 (67) (130) 1,708
Other movements in IFRS net equity — 525 525 536 1,061 1,061 Capital and dividend flows (1,020) — (1,020) 509 509 (511) Foreign exchange variances (170) 2 (168) 113 115 (55) Acquired/divested businesses 425 (180) 245 (245) (425) —
Closing group MCEV 16,131 2,339 18,470 (1,985) 354 16,485
Preference share capital and direct capital instruments (1,190)
Equity attributable to ordinary shareholders of Aviva plc on an MCEV basis 15,295 1. Covered business represents the business that the MCEV calculations cover, as detailed in the Basis of preparation note. The embedded value is presented net of non-controlling interests and tax. 2. Non-covered but related to life business represents the adjustments to the MCEV, including goodwill, to calculate the long-term business net assets on an MCEV basis. An analysis of net assets on an MCEV basis gross of non-controlling interests
is provided in E6. 3. Net assets for the total life businesses on an MCEV basis presented net of non-controlling interests.
Restated 2009 £m
Covered business1
£m A
Non-covered but related
to life business2
£m B
Total life business3
£m A+B
Non-covered relating to
non-life £m
C
Total non-covered business
£m B+C
Total £m
A+B+C
Opening group MCEV 14,522 2,639 17,161 (2,499) 140 14,662 Opening adjustments — — — — — —
Adjusted opening group MCEV 14,522 2,639 17,161 (2,499) 140 14,662
Operating MCEV earnings 2,247 — 2,247 15 15 2,262 Non-operating MCEV earnings 942 (99) 843 (496) (595) 347
Total MCEV earnings 3,189 (99) 3,090 (481) (580) 2,609
Other movements in IFRS net equity — (266) (266) (839) (1,105) (1,105) Capital and dividend flows (250) — (250) (283) (283) (533) Foreign exchange variances (762) (218) (980) 224 6 (756) Acquired/divested businesses (1,641) (1) (1,642) 1,047 1,046 (595)
Closing group MCEV 15,058 2,055 17,113 (2,831) (776) 14,282
Preference share capital and direct capital instruments (1,190)
Equity attributable to ordinary shareholders of Aviva plc on an MCEV basis 13,092

Performance reviewCorporate responsibilityGovernanceShareholder informationFinancial statements IFRSFinancial statements MCEVOther information
Financial statements M
CEV
MCEV financial statements continued Aviva plc Annual Report and Accounts 2010
321
E1 – Basis of preparation The condensed consolidated income statement and condensed consolidated statement of financial position on pages 316 to 318 present the Group’s results and financial position for the life and related businesses on the Market Consistent Embedded Value (MCEV) basis and for its non-life businesses on the International Financial Reporting Standards (IFRS) basis. The MCEV methodology adopted is in accordance with the MCEV Principles published by the CFO Forum in October 2009. The directors consider that the MCEV methodology gives useful insight into the drivers of financial performance of the Group’s life and related businesses. This basis values future cash flows from assets consistently with market prices, including more explicit allowance for the impact of uncertainty in future investment returns and other risks. Embedded value is also consistent with the way pricing is assessed and the business is managed. The results for 2010 and 2009 have been audited by our auditors, Ernst & Young. Their report in respect of 2010 can be found on page 352 in the Report and Accounts.
Covered business The MCEV calculations cover the following lines of business: life insurance, long-term health and accident insurance, savings, pensions and annuity business written by our life insurance subsidiaries, including managed pension fund business and our share of the other life and related business written in our associated undertakings and joint ventures, as well as the equity release business written in the UK. Covered business includes the Group’s share of our joint ventures including our arrangement with The Royal Bank of Scotland Group (RBSG) and our associated undertakings in India, China, Turkey, Malaysia, Taiwan and South Korea. In addition, the results of group companies providing significant administration, fund management and other services and of group holding companies have been included to the extent that they relate to covered business. Together these businesses are referred to as ‘Life and related businesses’.
New business premiums New business premiums include:
premiums arising from the sale of new contracts during the period; non-contractual additional premiums; and expected renewals on new contracts and expected future contractual alterations to new contracts.
The Group’s definition of new business under MCEV includes contracts that meet the definition of ‘non-participating investment’ contracts under IFRS. For products sold to individuals, premiums are considered to represent new business where a new contract has been signed, or where underwriting has been performed. Renewal premiums include contractual renewals, non-contractual variations that are reasonably predictable and recurrent single premiums that are pre-defined and reasonably predictable. For Group products, new business includes new contracts and increases to aggregate premiums under existing contracts. Renewal premiums are based on the level of premium received during the reporting period and allow for premiums expected to be received beyond the expiry of any guaranteed premium rates.
Life and pensions operating earnings For life and pensions operating earnings, Aviva uses normalised investment returns. The use of asset risk premia reflects management’s long-term expectations of asset returns in excess of the swap yield from investing in different asset classes. The normalised investment return on equities and property has been calculated by reference to the ten year swap rate in the relevant currency plus an appropriate risk premium. The expected return on bonds has been calculated by reference to the swap rate consistent with the duration of the backing assets in the relevant currency plus an appropriate risk margin (equivalent to the gross redemption yield less an allowance for defaults). From 2010, Aviva has changed the approach to calculating expected returns within operating profit. The expected existing business contribution (in excess of reference rate) is now calculated using the implied discount rates (IDR), which itself is based on the normalised investment returns. The revised methodology applies the IDR to the Value of In Force (VIF) and Required Capital (RC) components of the MCEV and adds to this the total expected return for Free Surplus (FS) to derive the total expected return, in a manner consistent with that previously used under European Embedded Value reporting. This total is presented as the expected existing business contribution (reference rate), expected existing business contribution (in excess of reference rate) and expected return on shareholders’ net worth (grossed up for tax for pre-tax presentation), with only the excess contribution being impacted by the change. The change to expected returns has no impact on total return or on the closing balance sheet.

MCEV financial statements continued
322
Aviva plc Annual Report and Accounts 2010
E1 – Basis of preparation continued MCEV methodology Overview Under the MCEV methodology, profit is recognised as it is earned over the life of products defined within covered business. The total profit recognised over the lifetime of a policy is the same as under the IFRS basis of reporting, but the timing of recognition is different.
Calculation of the embedded value The shareholders’ interest in the life and related businesses is represented by the embedded value. The embedded value is the total of the net worth of the life and related businesses and the value of in-force covered business. Calculations are performed separately for each business and are based on the cash flows of that business, after allowing for both external and intra-group reinsurance. Where one life business has an interest in another, the net worth of that business excludes the interest in the dependent company. The embedded value is calculated on an after-tax basis applying current legislation and practice together with future known changes. Where gross results are presented, these have been calculated by grossing up post-tax results at the full rate of corporation tax for each country based on opening period tax rates, apart from the US, where a nil tax rate was used for the 2009 post-tax results, and consequently for ‘grossing up’.
Net worth The net worth is the market value of the shareholders’ funds and the shareholders’ interest in the surplus held in the non-profit component of the long-term business funds, determined on a statutory solvency basis and adjusted to add back any non-admissible assets, and consists of the required capital and free surplus. Required capital is the market value of assets attributed to the covered business over and above that required to back liabilities for covered business, for which distribution to shareholders is restricted. Required capital is reported net of implicit items permitted on a local regulatory basis to cover minimum solvency margins which are assessed at a local entity level. The level of required capital for each business unit is set equal to the higher of:
The level of capital at which the local regulator is empowered to take action; The capital requirement of the business unit under the Group’s economic capital requirements; and The target capital level of the business unit.
This methodology reflects the level of capital considered by the directors to be appropriate to manage the business, and includes any additional shareholder funds not available for distribution, such as the reattributed inherited estate in the UK. The same definition of required capital is used for both existing and new business. The free surplus is the market value of any assets allocated to, but not required to support, the in-force covered business at the valuation date. The level of required capital across the business units expressed as a percentage of the EU minimum solvency margin (or equivalent) can be found in E18.
Value of in-force covered business (VIF) The value of in-force covered business consists of the following components:
present value of future profits; time value of financial options and guarantees; frictional costs of required capital; and cost of residual non-hedgeable risks.
Present value of future profits (PVFP) This is the present value of the distributable profits to shareholders arising from the in-force covered business projected on a best estimate basis. Distributable profits generally arise when they are released following actuarial valuations. These valuations are carried out in accordance with any local statutory requirements designed to ensure and demonstrate solvency in long-term business funds. Future distributable profits will depend on experience in a number of areas such as investment return, discontinuance rates, mortality, administration costs, as well as management and policyholder actions. Releases to shareholders arising in future years from the in-force covered business and associated required capital can be projected using assumptions of future experience. Future profits are projected using best estimate non-economic assumptions and market consistent economic assumptions. In principle, each cash flow is discounted at a rate that appropriately reflects the riskiness of that cash flow, so higher risk cash flows are discounted at higher rates. In practice, the PVFP is calculated using the ‘certainty equivalent’ approach, under which the reference rate is used for both the investment return and the discount rate. This approach ensures that asset cash flows are valued consistently with the market prices of assets without options and guarantees. Further information on the risk-free rates is given in note E18. The PVFP includes the capitalised value of profits and losses arising from subsidiary companies providing administration, investment management and other services to the extent that they relate to covered business. This is referred to as the ‘look through’ into service company expenses. In addition, expenses arising in holding companies that relate directly to acquiring or maintaining covered business have been allowed for. Where external companies provide services to the life and related businesses, their charges have been allowed for in the underlying projected cost base.

Performance reviewCorporate responsibilityGovernanceShareholder informationFinancial statements IFRSFinancial statements MCEVOther information
Financial statements M
CEV
MCEV financial statements continued Aviva plc Annual Report and Accounts 2010
323
E1 – Basis of preparation continued US capital solutions Credit has been taken within the 2010 US embedded value, and value of new business, for the anticipated reduction in capital requirements based on management’s intention to enact transactions which allow recognition of additional assets that can be held against certain reserves, reducing shareholder capital requirements. Similar transactions, which are effectively based upon a parental guarantee that sufficient capital resources would be available if required, have been enacted for business written between 2006 and 2009. Previously credit has been taken for equivalent capital solution transactions only after they have been formally enacted.
Time value of financial options and guarantees (TVOG) The PVFP calculation is based on a single (base) economic scenario; however, a single scenario cannot appropriately allow for the effect of certain product features. If an option or guarantee affects shareholder cash flows in the base scenario, the impact is included in the PVFP and is referred to as the intrinsic value of the option guarantee; however, future investment returns are uncertain and the actual impact on shareholder profits may be higher or lower. The value of in-force business needs to be adjusted for the impact of the range of potential future outcomes. Stochastic modelling techniques can be used to assess the impact of potential future outcomes, and the difference between the intrinsic value and the total stochastic value is referred to as the time value of the option or guarantee. Stochastic modelling typically involves projecting the future cash flows of the business under thousands of economic scenarios that are representative of the possible future outcomes for market variables such as interest rates and equity returns. Under a market consistent approach, the economic scenarios generated reflect the market’s tendency towards risk aversion. Allowance is made, where appropriate, for the effect of management and/or policyholder actions in different economic conditions on future assumptions such as asset mix, bonus rates and surrender rates. Stochastic models are calibrated to market yield curves and volatility levels at the valuation date. Tests are performed to confirm that the scenarios used produce results that replicate the market price of traded instruments. Where evidence exists that persistency rates are linked to economic scenarios, dynamic lapse assumptions are set that vary depending on the individual scenarios. This cost is included in the TVOG. Dynamic lapses are modelled for parts of the UK, US and French businesses. Asymmetries in non-economic assumptions that are linked to economic scenarios, but that have insufficient evidence for credible dynamic assumptions, are allowed for within mean best estimate assumptions.
Frictional costs of required capital The additional costs to a shareholder of holding the assets backing required capital within an insurance company rather than directly in the market are called frictional costs. They are explicitly deducted from the PVFP. The additional costs allowed for are the taxation costs and any additional investment expenses on the assets backing the required capital. The level of required capital has been set out above in the net worth section. Frictional costs are calculated by projecting forwards the future levels of required capital. Tax on investment return and investment expenses are payable on the assets backing required capital, up until the point that they are released to shareholders.
Cost of residual non-hedgeable risks (CNHR) The cost of residual non-hedgeable risks (CNHR) covers risks not already allowed for in the time value of options and guarantees or the PVFP. The allowance includes the impact of both non-hedgeable financial and non-financial risks. The most significant risk not included in the PVFP or TVOG is operational risk. Asymmetric risks allowed for in the TVOG or PVFP are described earlier in the basis of preparation. No allowance has been made within the cost of non-hedgeable risk for symmetrical risks as these are diversifiable by investors.
Participating business Future regular bonuses on participating business are projected in a manner consistent with current bonus rates and expected future market-consistent returns on assets deemed to back the policies. For with-profit funds in the UK and Ireland, for the purpose of recognising the value of the estate, it is assumed that terminal bonuses are increased to exhaust all of the assets in the fund over the future lifetime of the in-force with-profit policies. However, under stochastic modelling there may be some extreme economic scenarios when the total assets in the Group’s with-profit funds are not sufficient to pay all policyholder claims. The average additional shareholder cost arising from this shortfall has been included in the TVOG. For profit-sharing business in continental Europe, where policy benefits and shareholder value depend on the timing of realising gains, the apportionment of unrealised gains between policyholders and shareholders reflect contractual requirements as well as existing practice. Under certain economic scenarios where additional shareholder injections are required to meet policyholder payments, the average additional cost has been included in the TVOG.

MCEV financial statements continued
324
Aviva plc Annual Report and Accounts 2010
E1 – Basis of preparation continued The embedded value of the US spread-based products anticipates the application of management discretion allowed for contractually within the policies, subject to contractual guarantees. This includes the ability to change the crediting rates and indexed strategies available within the policy. Consideration is taken of the economic environment assumed in future projections and returns in excess of the reference rate are not assumed. Anticipated market and policyholder reaction to management action has been considered. The anticipated management action is consistent with current decision rules and has been approved and signed off by management and legal counsel.
Consolidation adjustments The effect of transactions between Group life companies such as loans and reinsurance arrangements have been included in the results split by territory in a consistent manner. No elimination is required on consolidation. As the MCEV methodology incorporates the impact of profits and losses arising from subsidiary companies providing administration, investment management and other services to the Group’s life companies, the equivalent profits and losses have been removed from the relevant segment (non-insurance or fund management) and are instead included within the results of life and related businesses. In addition, the underlying basis of calculation for these profits has changed from the IFRS basis to the MCEV basis. The capitalised value of the future profits and losses from such service companies are included in the embedded value and value of new business calculations for the relevant business, but the net assets (representing historical profits and other amounts) remain under non-insurance or fund management. In order to reconcile the profits arising in the financial period within each segment with the assets on the opening and closing statement of financial positions, a transfer of IFRS profits from life and related business to the appropriate segment is deemed to occur. An equivalent approach has been adopted for expenses within our holding companies. The assessments of goodwill, intangibles and pension schemes relating to life insurance business utilise the IFRS measurement basis.
Exchange rates The Group’s principal overseas operations during the period were located within the Eurozone and the United States. The results and cash flows of these operations have been translated at the average rates for that period and the assets and liabilities have been translated at the period end rates. Please refer to note 1 on page 191 of the IFRS financial statements.
Restatement During 2010, the Group’s Dutch subsidiary, Delta Lloyd, reviewed its approach to the scope of business using adjusted swap rates (also known as a ‘liquidity premium’). Delta Lloyd’s approach has been aligned with the Quantitative Impact Study (QIS) 5 methodology set out as part of Solvency II developments. The swap rate adjustment is applied in full to immediate annuity type contracts (as previously). In addition, 75% of the liquidity premium is applied to participating contracts and 50% to all other life covered business. This change aligns local Delta Lloyd and Group Aviva reporting for MCEV and Solvency II internal model calculations. This change increases the closing 2010 embedded value by £20 million net of non-controlling interests. Results for 2009 have been restated on a consistent basis leading to an increase in the opening 2009 embedded value of £310 million; an increase in 2009 new business value of £35 million; an increase in 2009 expected return of £34 million and an increase in closing 2009 embedded value of £57 million, all net of non-controlling interests.

Performance reviewCorporate responsibilityGovernanceShareholder informationFinancial statements IFRSFinancial statements MCEVOther information
Financial statements M
CEV
MCEV financial statements continued Aviva plc Annual Report and Accounts 2010
325
E2 – Geographical analysis of MCEV operating earnings
2010
Europe
United Kingdom
£m
Aviva Europe
£m
Delta Lloyd
£m
North America
£m
Asia Pacific
£m Total
£m
Value of new business 354 504 (92) (194) 52 624 Earnings from existing business: – expected returns at the reference rate 169 244 49 20 20 502 – expected returns in excess of the reference rate 425 357 181 401 25 1,389 – expected returns 594 601 230 421 45 1,891 – experience variances (20) 147 (16) (7) (28) 76 – operating assumption changes (18) 338 (320) (146) 13 (133) Expected return on shareholders’ net worth 179 152 124 82 12 549 Other operating variances (4) 271 157 133 15 572
Operating earnings before tax 1,085 2,013 83 289 109 3,579
Restated 2009
Europe
United Kingdom
£m
Aviva Europe
£m
Delta Lloyd
£m
North America
£m
Asia Pacific
£m Total
£m
Value of new business 247 521 (48) 16 29 765 Earnings from existing business: – expected returns at the reference rate 113 326 43 55 26 563 – expected returns in excess of the reference rate 402 428 324 249 16 1,419 – expected returns 515 754 367 304 42 1,982 – experience variances (29) 43 (3) (87) (23) (99) – operating assumption changes (67) (8) 171 (38) (14) 44 Expected return on shareholders’ net worth 138 180 88 89 17 512 Other operating variances (17) 214 65 (18) 50 294
Operating earnings before tax 787 1,704 640 266 101 3,498
United Kingdom MCEV operating earnings were 38% higher at £1,085 million (2009: £787 million) mainly due to increases in the value of new business and expected returns. Value of new business grew 43% to £354 million (2009: £247 million), due to our focus on value maximisation through active management of our new business mix, robust cost control and pricing discipline. Total expected return increased to £773 million (2009: £653 million), reflecting the additional expected return following the reattribution of the inherited estate partly offset by the adoption of implied discount rates as the basis for determining the expected return. Experience variances of £20 million adverse (2009: £29 million adverse) reflect favourable mortality experience offsetting adverse persistency experience in current economic conditions. Assumption changes were £18 million adverse (2009: £67 million adverse) reflecting a net increase in expense allowances, following the closure of our offshore subsidiary to new business.
Europe In Europe, operating profit decreased to £2,096 million (2009: £2,344 million). Growth in Aviva Europe operating return reflects assumption changes and more favourable operating experience partly offset by lower expected returns. The reduction in Delta Lloyd operating profit mainly reflects adverse assumption changes. 2009 benefited from favourable assumption changes.

MCEV financial statements continued
326
Aviva plc Annual Report and Accounts 2010
E2 – Geographical analysis of MCEV operating earnings continued Aviva Europe MCEV operating earnings increased 18% to £2,013 million (2009: £1,704 million), as positive operating assumption changes, favourable experience variances and modelling improvements more than offset lower expected returns. Value of new business was 3% lower at £504 million (2009: £521 million). After allowing for movements in currency, this is in line with prior year. This reflects increased contributions from profit-sharing products in France and Italy. These contributions have been offset by the impact of reduced sales in Ireland, Spain and Poland. Total expected return was 19% lower at £753 million (2009: £934 million) reflecting lower assumed rates of return and the adoption of implied discount rates as the basis for determining the expected return. Experience variances were favourable at £147 million (2009: £43 million). The 2010 result reflects positive experience on mortality, as well as the release of short-term lapse provisions and the benefit from policyholders switching to unit linked funds in France. This has been offset by the impact of adverse lapse experience in Spain and Ireland. Assumption changes on existing business were favourable at £338 million (2009: £8 million adverse). This arises from the positive impact of a detailed review of our expense assumptions, as well as the positive impact of mortality changes in France. This is offset by further strengthening of lapse assumptions in Spain and Ireland. Other operating variances were positive at £271 million (2009: £214 million). These largely arose in France and relate to modelling refinements of £164 million as well as £107 million from actions taken to reduce the level of policyholder guarantees on profit-sharing products in France.
Delta Lloyd MCEV operating earnings decreased to £83 million (2009: £640 million) mainly due to adverse operating assumption changes compared to positive assumption changes in 2009. Value of new business was negative at £(92) million (2009: £(48) million) reflecting the continuing impacts of adverse economic assumptions. Total expected return was lower at £354 million (2009: £455 million) due to the adoption of implied discount rates as the basis for determining the expected return. Operating experience and assumption changes on existing business amounted to £336 million adverse (2009: £168 million favourable) as the impact of adopting an industry-standard longevity table was partly offset by favourable expense assumption changes related to planned expense savings following restructuring activities. Other operating variances of £157 million (2009: £65 million) related to various modelling changes, mainly in Delta Lloyd Belgium and Delta Lloyd Life.
North America MCEV operating earnings increased to £289 million (2009: £266 million) as higher earnings from existing business were partly offset by lower value of new business. The improvement in in-force earnings was driven by management actions coupled with disciplined spread management, higher expected returns and modelling refinements. Value of new business of negative £(194) million (2009: £16 million positive) reflected adverse economic movements, particularly in the second half of the year as risk free rates decreased. The impact of economic movements has more than offset the benefits of pricing and product management actions. Total expected return increased to £503 million (2009: £393 million) reflecting the adoption of implied discount rates as the basis for determining expected return and the grossing up for tax in 2010 as a result of the reassessment of the tax paying position. Operating experience and assumption changes on existing business were £153 million adverse (2009: £125 million adverse). Included within this are positive benefits of disciplined spread management offset by adverse operating assumption changes relating to immediate annuitant mortality strengthening and increased expense loadings. Other operating variances were £133 million favourable (2009: £18 million adverse) reflecting management actions and modelling refinements.

Performance reviewCorporate responsibilityGovernanceShareholder informationFinancial statements IFRSFinancial statements MCEVOther information
Financial statements M
CEV
MCEV financial statements continued Aviva plc Annual Report and Accounts 2010
327
E2 – Geographical analysis of MCEV operating earnings continued Asia Pacific MCEV operating earnings were 8% higher at £109 million (2009: £101 million, £45 million excluding the contribution from Australia) as higher value of new business was partly offset by lower other operating variances. Value of new business was 79% higher at £52 million (2009: £29 million, £11 million excluding the contribution from Australia), reflecting improved scale efficiencies, product mix and volumes. Total expected return was £57 million (2009: £59 million, £37 million excluding the contribution from Australia), benefiting from the adoption of implied discount rates as the basis for determining the expected return. Operating experience variances, other operating variances and assumption changes on existing business were nil (2009: £13 million), as favourable mortality and assumptions changes were offset by experience variances. Gross of tax and non-controlling interests 2010
UK £m
France £m
Ireland £m
Italy £m
Poland £m
Spain £m
Other Europe
£m
Aviva Europe
£m
Delta Lloyd
£m Europe
£m
North America
£m
Asia Pacific
£m Total
£m
Value of new business 354 175 1 142 40 128 18 504 (92) 412 (194) 52 624 Earnings from existing business
– expected existing business contribution (reference rate) 169 98 12 13 74 34 13 244 49 293 20 20 502 – expected existing business contribution (in excess of reference rate) 425 183 30 34 25 76 9 357 181 538 401 25 1,389 Experience variances – maintenance expense1 12 (25) 6 (11) 5 (1) 5 (21) (21) (42) (16) (2) (48) – project and other related expenses1 (8) (5) (2) — — (2) (5) (14) (4) (18) (18) (3) (47) – mortality/morbidity2 23 27 3 (4) 13 2 3 44 13 57 (7) 9 82 – lapses3 (29) 27 (10) 18 (1) (11) (11) 12 5 17 (3) (27) (42) – other4 (18) 93 (4) 12 14 3 8 126 (9) 117 37 (5) 131
(20) 117 (7) 15 31 (9) — 147 (16) 131 (7) (28) 76
Operating assumption changes: – maintenance expense5 83 31 (3) (11) 140 132 — 289 220 509 (88) 8 512 – project and other related expenses5 (92) — — — — — — — (6) (6) — — (98) – mortality/morbidity6 2 57 7 1 7 (2) — 70 (470) (400) (64) 17 (445) – lapses7 (3) (12) (17) 39 13 (49) (7) (33) (52) (85) 6 (12) (94) – other (8) 4 — (2) 8 — 2 12 (12) — — — (8)
(18) 80 (13) 27 168 81 (5) 338 (320) 18 (146) 13 (133)
Expected return on shareholders’ net worth 179 47 20 50 9 18 8 152 124 276 82 12 549 Other operating variances8 (4) 271 (6) (15) 30 (9) — 271 157 428 133 15 572
Earnings before tax and non-controlling interests 1,085 971 37 266 377 319 43 2,013 83 2,096 289 109 3,579 1 Adverse expense experience occurred across a number of businesses. 2 Mortality experience continues to be better than the assumption set across a number of our businesses, most notably in France and the UK Annuity business. 3 Persistency experience remains volatile across most of our businesses, in part reflecting the wider economic circumstances. In France, persistency experience reflects a release of the short-term provision. 4 Other experience includes, in France, the benefit from policyholders switching to unit-linked funds, and, in the USA favourable spread experience. 5 Favourable maintenance expense assumptions reflect the benefit of the shared service centre in Spain, together with the release of margins in Spain, related to bancassurance joint venture governance costs, and Poland. In the UK, the expense
assumptions include a reallocation of provisions in the service company, better reflecting the expected future allocation of costs. In the USA, the adverse impact reflects a revised allocation of costs between ongoing and one-off. In Delta Lloyd, favourable expense assumptions relate to planned expense saving following restructuring activities.
6 Delta Lloyd have updated mortality assumptions to reflect recently published tables, which include a significantly increased allowance for mortality improvements. In France and the USA, mortality assumptions have been updated reflecting experience.
7 Persistency assumptions have been updated in a number of businesses. 8 Other operating variances for France relate to modelling changes, particularly relating to the time value of options and guarantees, and the benefit of reducing minimum guarantee rates. In Delta Lloyd, modelling changes include impacts related
to commercial mortgages partly offset by changes to group pensions business. In the US, other operating variances related to the benefit of an AXXX capital solution together with modelling refinements on our asset portfolio.

MCEV financial statements continued
328
Aviva plc Annual Report and Accounts 2010
E2 – Geographical analysis of MCEV operating earnings continued Restated Gross of tax and non-controlling interests 2009
UK £m
France £m
Ireland £m
Italy £m
Poland £m
Spain £m
Other Europe
£m
Aviva Europe
£m
Delta Lloyd
£m Europe
£m
North America
£m Asia £m
Australia £m
Asia Pacific
£m Total
£m
Value of new business 247 169 12 124 55 151 10 521 (48) 473 16 11 18 29 765 Earnings from existing business
– expected existing business contribution (reference rate) 113 161 22 15 67 39 22 326 43 369 55 11 15 26 563 – expected existing business contribution (in excess of reference rate) 402 282 18 5 4 119 — 428 324 752 249 15 1 16 1,419 Experience variances – maintenance expense1 37 — 6 (2) 14 (10) 5 13 (3) 10 — 6 (1) 5 52 – project and other related expenses1
(34)
(1)
(7) — — (7) (7) (22) (42) (64) (35) — — — (133)
– mortality/morbidity2 6 50 8 2 12 (6) 8 74 (22) 52 5 5 8 13 76 – lapses3 (30) 53 (23) (46) 17 (52) (17) (68) 13 (55) (17) (38) — (38) (140) – other4 (8) (80) 1 116 7 1 1 46 51 97 (40) — (3) (3) 46
(29) 22 (15) 70 50 (74) (10) 43 (3) 40 (87) (27) 4 (23) (99)
Operating assumption changes: – maintenance expense5 1 (22) 5 (31) 54 (94) 10 (78) 275 197 (9) (10) 8 (2) 187 – project and other related expenses — — — — — (13) — (13) — (13) — — — — (13) – mortality/morbidity6 5 64 7 12 58 (9) (1) 131 (4) 127 (20) (1) 5 4 116 – lapses7 (51) (22) (9) (37) 83 (69) (7) (61) (40) (101) (105) (9) 4 (5) (262) – other8 (22) 3 12 1 (1) — (2) 13 (60) (47) 96 (6) (5) (11) 16
(67) 23 15 (55) 194 (185) — (8) 171 163 (38) (26) 12 (14) 44
Expected return on shareholders’ net worth 138 66 16 57 8 26 7 180 88 268 89 11 6 17 512 Other operating variances9 (17) 62 (4) — 121 37 (2) 214 65 279 (18) 50 — 50 294
Earnings before tax and non-controlling interests 787 785 64 216 499 113 27 1,704 640 2,344 266 45 56 101 3,498 1 Maintenance expense experience in the UK relates to profits from existing business administration. Project and other related expenses in the UK reflect project costs associated with strategic initiatives, including developments designed to offer a
wider range of products to customers, and the simplification of systems and processes. Project and other related expenses in Delta Lloyd relate to integration costs in Belgium. 2 Mortality experience continues to be better than the assumptions set across a number of our businesses. 3 Persistency experience has been volatile across most of our businesses, in part reflecting wider economic volatility. In France, positive persistency experience including the release of a short-term provision, in line with positive underlying experience.
In Poland, lapse experience continued to be better than the long-term assumptions for both Life and Pension products. 4 Other experience is favourable overall. Both France and Italy include one-off adjustments reflecting final commission payments from prior years. The favourable impact in Italy reflects to one-off profit sharing on a reinsurance treaty. The
favourable impact in Delta Lloyd relates to the revised investment and bonus strategy in Germany following the decision to close this operation to new business. The adverse impact in the USA relates to the cost of enhancing policyholder crediting rates.
5 Favourable expense assumption changes reflect the impact of cost reductions in Delta Lloyd and Poland, together with the impact of revisions to expense allocations in Delta Lloyd. The adverse impact in Spain relates to the capitalisation of certain governance costs in respect of bancassurance joint ventures.
6 Favourable mortality assumption changes in France and Poland reflecting recent experience. The adverse impact in Delta Lloyd reflects the net impact of using updated mortality tables in the Netherlands, Germany and Belgium, following the issuance of revised advice from the respective actuarial associations.
7 Persistency assumptions have been strengthened across most of our businesses, in light of experience. In Poland, persistency assumptions have been weakened following sustained favourable experience. 8 Other assumption changes in the US primarily relate to the timing of management action in setting policyholder credited rates. In Delta Lloyd, the change represents tax effects resulting from a reallocation of assets. 9 Other operating variances in France, Poland and Asia have arisen as a result of more accurate modelling. In Delta Lloyd, these relate to revisions to investment and bonus strategies and expenses in Delta Lloyd Germany following the decision to
close this operation to new business. In Spain, these reflect the impact of re-pricing actions on risk products.

Performance reviewCorporate responsibilityGovernanceShareholder informationFinancial statements IFRSFinancial statements MCEVOther information
Financial statements M
CEV
MCEV financial statements continued Aviva plc Annual Report and Accounts 2010
329
E2 – Geographical analysis of MCEV operating earnings continued Net of tax and non-controlling interests 2010
UK £m
France £m
Ireland £m
Italy £m
Poland £m
Spain £m
Other Europe
£m
Aviva Europe
£m
Delta Lloyd
£m Europe
£m
North America
£m
Asia Pacific
£m Total
£m
Value of new business 254 100 1 42 29 43 15 230 (41) 189 (126) 41 358 Earnings from existing business
– expected existing business contribution (reference rate) 122 61 8 4 53 13 11 150 19 169 13 14 318 – expected existing business contribution (in excess of reference rate) 306 115 19 11 18 27 7 197 68 265 261 20 852 Experience variances – maintenance expense1 8 (16) 5 (6) 3 (3) 4 (13) (9) (22) (10) (1) (25) – project and other related expenses1 (6) (3) (1) — — (2) (4) (10) (1) (11) (12) (3) (32) – mortality/morbidity2 17 15 2 (2) 10 — 2 27 3 30 (5) 7 49 – lapses3 (21) 19 (7) 6 — (6) (9) 3 — 3 (2) (22) (42) – other4 (12) 62 (3) 3 10 2 6 80 (3) 77 24 (4) 85
(14) 77 (4) 1 23 (9) (1) 87 (10) 77 (5) (23) 35
Operating assumption changes:
– maintenance expense5 57 21 (2) (8) 97 83 — 191 89 280 (57) 8 288 – project and other related expenses (65) — — — — — — — (3) (3) — — (68) – mortality/morbidity6 1 38 5 1 4 — — 48 (198) (150) (42) 13 (178) – lapses7 (2) (8) (12) 10 10 (17) (6) (23) (21) (44) 4 (9) (51) – other (6) 3 — — 6 — 1 10 (5) 5 — — (1)
(15) 54 (9) 3 117 66 (5) 226 (138) 88 (95) 12 (10)
Expected return on shareholders’ net worth 129 27 14 17 6 7 6 77 50 127 53 9 318 Other operating variances8 (4) 162 (4) (2) 20 (4) — 172 64 236 87 9 328
Earnings after tax and non-controlling interests 778 596 25 76 266 143 33 1,139 12 1,151 188 82 2,199 1 Adverse expense experience occurred across a number of businesses. 2 Mortality experience continues to be better than the assumption set across a number of our businesses, most notably in France and the UK Annuity business. 3 Persistency experience remains volatile across most of our businesses, in part reflecting the wider economic circumstances. In France, persistency experience reflects a release of the short-term provision. 4 Other experience includes, in France, the benefit from policyholders switching to unit linked funds, and, in the USA favourable spread experience. 5 Favourable maintenance expense assumptions reflect the benefit of the shared service centre in Spain, together with the release of margins in Spain, related to bancassurance joint venture governance costs, and Poland. In the UK, the expense
assumptions include a reallocation of provisions in the service company, better reflecting the expected future allocation of costs. In the USA, the adverse impact reflects a revised allocation of costs between ongoing and one-off. In Delta Lloyd, favourable expense assumptions relate to planned expense saving following restructuring activities.
6 Delta Lloyd have updated mortality assumptions to reflect recently published tables, which include a significantly increased allowance for mortality improvements. In France and the USA, mortality assumptions have been updated reflecting experience.
7 Persistency assumptions have been updated in a number of businesses. 8 Other operating variances for France relate to modelling changes, particularly relating to the time value of options and guarantees, and the benefit of reducing minimum guarantee rates. In Delta Lloyd, modelling changes include impacts related
to commercial mortgages partly offset by changes to group pensions business. In the US, other operating variances related to the benefit of an AXXX capital solution together with modelling refinements on our asset portfolio.

MCEV financial statements continued
330
Aviva plc Annual Report and Accounts 2010
E2 – Geographical analysis of MCEV operating earnings continued Restated Net of tax and non-controlling interests 2009
UK £m
France
£m
Ireland
£m
Italy £m
Poland
£m
Spain
£m
Other Europe
£m
Aviva Europe
£m
Delta Lloyd
£m
Europe
£m
North America
£m
Asia £m
Australia
£m
Asia Pacific
£m
Total
£m
Value of new business 177 94 8 38 39 51 8 238 (43) 195 16 9 13 22 410 Earnings from existing business
– expected existing business contribution (reference rate)
81
100
15
5
47
15
17
199
29
228
55
6
11
17
381
– expected existing business contribution (in excess of reference rate)
289
170
12
2
3
44
—
231
205
436
249
12
—
12
986 Experience variances – maintenance expense1 27 — 4 (1) 10 (8) 4 9 4 13 — 5 — 5 45 – project and other related expenses1
(26)
—
(5)
—
—
(3)
(6)
(14)
(21)
(35)
(35)
—
—
—
(96)
– mortality/morbidity2 4 30 5 1 9 (3) 6 48 (17) 31 5 3 5 8 48 – lapses3 (22) 36 (16) (15) 12 (20) (14) (17) 5 (12) (17) (31) — (31) (82) – other4 (4) (49) 1 37 5 1 1 (4) 35 31 (40) (1) (2) (3) (16)
(21) 17 (11) 22 36 (33) (9) 22 6 28 (87) (24) 3 (21) (101)
Operating assumption changes:
– maintenance expense5 — (14) 3 (10) 38 (69) 7 (45) 197 152 (9) (9) 6 (3) 140 – project and other related expenses
—
—
—
—
—
(5)
—
(5)
—
(5)
—
—
—
—
(5)
– mortality/morbidity6 4 42 4 4 42 (3) 1 90 1 91 (20) — 3 3 78 – lapses7 (36) (13) (6) (12) 58 (24) (5) (2) (25) (27) (105) (6) 3 (3) (171) – other8 (16) 2 8 1 (1) — (3) 7 (48) (41) 96 (5) (3) (8) 31
(48) 17 9 (17) 137 (101) — 45 125 170 (38) (20) 9 (11) 73
Expected return on shareholders’ net worth
100
38
11
18
6
10
6
89
57
146
89
7
4
11
346
Other operating variances9 (11) 34 (3) — 83 12 1 127 14 141 (18) 40 — 40 152
Earnings after tax and non-controlling interests
567
470
41
68
351
(2)
23
951
393
1,344
266
30
40
70
2,247
1 Maintenance expense experience in the UK relates to profits from existing business administration. Project and other related expenses in the UK reflect project costs associated with strategic initiatives, including developments designed to offer a wider range of products to customers, and the simplification of systems and processes. Project and other related expenses in Delta Lloyd relate to integration costs in Belgium.
2 Mortality experience continues to be better than the assumptions set across a number of our businesses. 3 Persistency experience has been volatile across most of our businesses, in part reflecting wider economic volatility. In France, positive persistency experience including the release of a short-term provision, in line with positive underlying experience.
In Poland, lapse experience continued to be better than the long-term assumptions for both Life and Pension products. 4 Other experience is favourable overall. Both France and Italy include one-off adjustments reflecting final commission payments from prior years. The favourable impact in Italy reflects one-off profit sharing on a reinsurance treaty. The favourable
impact in Delta Lloyd relates to the revised investment and bonus strategy in Germany following the decision to close this operation to new business. The adverse impact in the USA relates to the cost of enhancing policyholder crediting rates. 5 Favourable expense assumption changes reflect the impact of cost reductions in Delta Lloyd and Poland, together with the impact of revisions to expense allocations in Delta Lloyd. The adverse impact in Spain relates the capitalisation of certain
governance costs in respect of bancassurance joint ventures. 6 Favourable mortality assumption changes in France and Poland reflect recent experience. The adverse impact in Delta Lloyd reflects the net impact of using updated mortality tables in the Netherlands, Germany and Belgium, following the
issuance of revised advice from the respective actuarial associations. 7 Persistency assumptions have been strengthened across most of our businesses, in light of experience. In Poland, persistency assumptions have been weakened following sustained favourable experience. 8 Other assumption changes in the US primarily relate to the timing of management action in setting policyholder credited rates. In Delta Lloyd, the change represents tax effects resulting from a reallocation of assets. 9 Other operating variances in France, Poland and Asia have arisen as a result of more accurate modelling. In Delta Lloyd, these relate to revisions to investment and bonus strategies and expenses in Delta Lloyd Germany following the decision to
close this operation to new business. In Spain, these reflect the impact of re-pricing actions on risk products.

Performance reviewCorporate responsibilityGovernanceShareholder informationFinancial statements IFRSFinancial statements MCEVOther information
Financial statements M
CEV
MCEV financial statements continued Aviva plc Annual Report and Accounts 2010
331
E3 – Geographical analysis of fund management operating earnings The summarised consolidated income statement – MCEV basis includes earnings from the Group’s fund management operations as analysed below. This excludes the proportion of the results of Aviva Investors fund management businesses and other fund management operations within the Group that arise from the provision of fund management services to our Life businesses. These results are included within the Life MCEV operating earnings.
2010
£m 2009
£m
United Kingdom 28 42 Europe 10 6 North America (8) (7) Asia Pacific — (1)
Aviva Investors 30 40
United Kingdom 3 (14) Aviva Europe1 — 3 Delta Lloyd 94 21
Europe 94 24 Asia Pacific2 (2) 1
Total 125 51 1 Aviva Europe included the result from the fund management in Poland in 2009. This business was transferred across to Aviva Investors from 1 January 2010. 2 The Australian Life business was sold on 1 October 2009, included within the 2009 operating earnings is £7 million.
E4 – Analysis of other operations and regional costs Where subsidiaries provide services to our life business, that proportion has been excluded. These results are included within the Life MCEV operating return.
2010 2009
Regional costs
£m
Other operations
£m
Total
£m
Regional costs
£m
Other operations
£m
Total
£m
United Kingdom — (21) (21) — (28) (28) Aviva Europe (55) (43) (98) (36) (41) (77) Delta Lloyd — (24) (24) — (30) (30) Europe (55) (67) (122) (36) (71) (107) North America (26) 6 (20) (19) 3 (16) Asia Pacific (32) — (32) (20) (2) (22)
Total (113) (82) (195) (75) (98) (173)
E5 – Exceptional items and integration and restructuring costs Exceptional Items of £(428) million (2009: £(248) million) were mainly due to a change in the cost of capital charge for the Cost of Non-Hedgeable Risk, from 2.5% to 3.3% pa with total impact £(365) million, the impact of reducing state contributions to Pillar II Pension funds in Poland, following the announcement to change legislation on 1 April 2011 of £(280) million, and the recognition by Delta Lloyd of £(59) million costs in relation to unit-linked insurance compensation scheme and compensation costs in defined contribution pension schemes, partly offset by a £286 million benefit from the closure of the final salary section of the UK staff pension scheme to future accruals. Exceptional costs for full year 2009 totalled £(248) million. This included £175 million in respect of the reattribution of the inherited estate in the UK, £(261) million in respect of the change in legislation in Poland restricting charges against pension funds, £(102) million brand migration costs and £(60) million in respect of latent claims reserves in Canada. Integration and restructuring costs incurred in the year amounted to £312 million (2009: £286 million). This includes expenditure relating to the Quantum Leap project in Europe of £40 million, costs associated with preparing the businesses for Solvency II implementation of £114 million and other restructuring exercises across the Group of £123 million. Costs incurred in 2009 related to expenditure on cost savings programmes in the UK life and general insurance businesses and in Europe.

MCEV financial statements continued
332
Aviva plc Annual Report and Accounts 2010
E6 – Segmentation of condensed consolidated statement of financial position
2010 Restated
2009
Life and related
businesses £m
General business and
other £m
Group £m
Life and related
businesses £m
General business and
other £m
Group £m
Total assets before acquired value of in-force long-term business 323,476 45,378 368,854 307,117 45,880 352,997 Acquired additional value of in-force long-term business 1,253 — 1,253 1,394 — 1,394
Total assets included in the IFRS statement of financial position 324,729 45,378 370,107 308,511 45,880 354,391
Liabilities of the long-term business (305,673) — (305,673) (291,194) — (291,194) Liabilities of the general insurance and other businesses — (46,709) (46,709) — (48,111) (48,111)
Net assets on a statutory IFRS basis 19,056 (1,331) 17,725 17,317 (2,231) 15,086 Additional value of in-force long-term business1 2,737 — 2,737 3,475 — 3,475
Net assets on an MCEV basis2 21,793 (1,331) 20,462 20,792 (2,231) 18,561
Equity capital, capital reserves, shares held by employee trusts and other reserves 7,207 7,144 IFRS basis retained earnings 5,411 3,425 Additional MCEV basis retained earnings 2,677 2,523
Equity attributable to ordinary shareholders of Aviva plc on an MCEV basis 15,295 13,092 Preference share capital and direct capital instruments 1,190 1,190 Non-controlling interests 3,977 4,279
MCEV basis total equity 20,462 18,561
1 The analysis between the Group’s and non-controlling interests’ share of the additional value of in-force long-term business is as follows:
2010
£m
Restated 2009
£m
Movement in year
£m
Group’s share included in shareholders’ funds 2,677 2,523 154 Non-controlling interests’ share 236 739 (503) Movements in AFS securities (176) 213 (389)
Additional value of in-force long-term business 2,737 3,475 (738)
2 Analysis of net assets on an MCEV basis is made up as follows:
2010
£m
Restated 2009
£m
Embedded value 16,131 15,058 Non-controlling interests 3,133 3,480
19,264 18,538 Goodwill and intangible assets allocated to long-term business3 2,356 2,606 Notional allocation of IAS19 pension fund surplus/(deficit) to long-term business4 173 (352)
Long-term business net assets on an MCEV basis 21,793 20,792 3 Goodwill and intangible assets includes amounts related to associated undertakings and joint ventures. 4 The value of the Aviva Staff Pension Scheme surplus has been notionally allocated between segments, based on current funding and the Life proportion has been included within the long-term business net assets on an MCEV basis. The pension
fund surplus notionally allocated to long-term business is net of the agreed funding borne by the UK with-profit funds.

Performance reviewCorporate responsibilityGovernanceShareholder informationFinancial statements IFRSFinancial statements MCEVOther information
Financial statements M
CEV
MCEV financial statements continued Aviva plc Annual Report and Accounts 2010
333
E7 – Analysis of life and pension earnings The following table provides an analysis of the movement in embedded value for covered business. The analysis is shown separately for free surplus, required capital and the value of in-force covered business, and includes amounts transferred between these categories. All figures are shown net of tax and non-controlling interests. Net of tax and non-controlling interests 2010
Free surplus
£m
Required capital1
£m VIF £m
Total MCEV
£m
Opening group MCEV 2,204 7,546 5,308 15,058 New business value (1,250) 901 707 358 Expected existing business contribution (reference rate) — — 318 318 Expected existing business contribution (in excess of reference rate) — — 852 852 Transfers from VIF and required capital to the free surplus 1,811 (587) (1,224) — Experience variances 107 76 (148) 35 Assumption changes (147) (21) 158 (10) Expected return on shareholders’ net worth 126 192 — 318 Other operating variances 47 7 274 328
Operating MCEV earnings 694 568 937 2,199 Economic variances (175) 103 228 156 Other non-operating variances2 (59) — (458) (517)
Total MCEV earnings 460 671 707 1,838 Capital and dividend flows3 (1,020) — — (1,020) Foreign exchange variance (26) (65) (79) (170) Acquired/divested business 23 190 212 425
Closing MCEV 1,641 8,342 6,148 16,131 1 Required capital is shown net of implicit items permitted by local regulators to cover minimum solvency margins. 2 Other non-operating variances are described under Exceptional items on page 331 . 3 Included within capital and dividend flows is the transfer to Life and related businesses from other segments consisting of service company profits and losses during the reported period that have emerged from the value of in-force. Since the ‘look
through’ into service companies includes only future profits and losses, these amounts must be eliminated from the closing embedded value.
Acquisitions during the year consist of an increase in the Group’s interest in RBS Life Investments Limited, and the purchase of the interests of minority shareholders in two subsidiaries in France and Italy. Restated Net of tax and non-controlling interests 2009
Free surplus
£m
Required capital1
£m VIF £m
Total MCEV
£m
Opening MCEV 1,348 8,148 5,026 14,522 New business value (1,571) 983 998 410 Expected existing business contribution (reference rate) — — 381 381 Expected existing business contribution (in excess of reference rate) — — 986 986 Transfers from VIF and required capital to the free surplus 1,869 (738) (1,131) — Experience variances (198) 135 (38) (101) Assumption changes 48 6 19 73 Expected return on shareholders’ net worth 164 182 — 346 Other operating variances 10 (141) 283 152
Operating MCEV earnings 322 427 1,498 2,247 Economic variances 1,317 (324) (315) 678 Other non-operating variances (238) 909 (407) 264
Total MCEV earnings/(loss) 1,401 1,012 776 3,189 Capital and dividend flows2 (250) — — (250) Foreign exchange variances 6 (556) (183) (733) Acquired/divested business (301) (1,058) (311) (1,670)
Closing MCEV 2,204 7,546 5,308 15,058 1 Required capital is shown net of implicit items permitted by local regulators to cover minimum solvency margins. 2 Included within capital and dividend flows is the transfer to Life and related businesses from other segments consisting of service company profits and losses during the reported period that have emerged from the value of in-force. Since the ‘look
through’ into service companies includes only future profits and losses, these amounts must be eliminated from the closing embedded value.

MCEV financial statements continued
334
Aviva plc Annual Report and Accounts 2010
E8 – Life MCEV operating earnings In this table the life and pensions MCEV earnings have been broken down into constituent parts. The life and pensions MCEV operating earnings comprise: the value of new business written during the year; the earnings from existing business including other operating variances; and the expected investment return on the shareholders’ net worth. These components are calculated using economic assumptions as at the start of the year (in-force business) or start of the quarter (new business) and operating (demographic and expenses) assumptions as at the end of the year.
Gross of tax and non-controlling interests
2010 £m
Restated 2009
£m
Value of new business 624 765 Earnings from existing business – expected returns at the reference rate 502 563 – expected returns in excess of the reference rate 1,389 1,419 – expected returns 1,891 1,982 – experience variances 76 (99) – operating assumption changes (133) 44 Other operating variance 572 294 Expected return on shareholders’ net worth 549 512
Life and Pensions operating earnings before tax 3,579 3,498 Economic variances (103) 365 Other non-operating variances (811) 364
Life and Pensions earnings before tax 2,665 4,227 Tax on operating earnings (1,057) (903) Tax on other activities 202 (44)
Life and Pensions earnings after tax 1,810 3,280
There were no separate development costs reported in these years. Other non-operating variances are described under Exceptional items on page 331. The table above presents a summarised breakdown of the life and pensions MCEV earnings on a gross of non-controlling interests basis and gross of tax with tax shown separately. The Group favours the gross presentation for consistency with the IFRS results. The table below compares the key items on the different bases as the subsequent analysis is provided predominantly on a net of tax and non-controlling interests basis as preferred by the CFO Forum Principles.
Key indicators
2010
Restated
2009
Net of non-
controlling interests and tax
£m
Gross of non-
controlling interests and tax
£m
Net of non-
controlling interests and tax
£m
Gross of non-
controlling interests and tax
£m
Value of new business 358 624 410 765 Life and pensions operating return 2,199 3,579 2,247 3,498 Life and pensions earnings 1,838 2,665 3,189 4,227

Performance reviewCorporate responsibilityGovernanceShareholder informationFinancial statements IFRSFinancial statements MCEVOther information
Financial statements M
CEV
MCEV financial statements continued Aviva plc Annual Report and Accounts 2010
335
E9 – Present value of life new business premiums The tables below set out the present value of new business premiums (PVNBP) written by the life and related businesses, the value of new business and the resulting margin, firstly gross and then net of tax and non-controlling interests. The PVNBP calculation is equal to total single premium sales received in the period plus the discounted value of regular premiums expected to be received over the term of the new contracts, and is expressed at the point of sale. The premium volumes and projection assumptions used to calculate the present value of regular premiums for each product are the same as those used to calculate the value of new business, so the components of the new business margin are on a consistent basis. The Weighted Average Capitalisation Factor (WACF) is the multiple of the annualised regular premium which gives the present value at point of sale of the regular premiums.
Gross of non-controlling interests 2010
Regular premiums
£m WACF
Present value of regular
premiums £m
Single premiums
£m
Present value of
new business
premiums £m
United Kingdom 579 5.2 2,997 7,301 10,298 France 89 6.3 565 4,353 4,918 Ireland 65 4.0 263 675 938 Italy 50 5.4 270 4,186 4,456 Poland 51 9.2 468 135 603 Spain 109 5.9 648 1,436 2,084 Other Europe 89 4.6 412 126 538 Aviva Europe 453 5.8 2,626 10,911 13,537 Delta Lloyd 172 9.3 1,591 1,587 3,178 Europe 625 6.7 4,217 12,498 16,715 North America 97 10.2 993 3,735 4,728 Asia Pacific 240 4.7 1,132 485 1,617
Total life and pensions 1,541 6.1 9,339 24,019 33,358
Gross of non-controlling interests 2009
Regular premiums
£m WACF
Present value of regular
premiums £m
Single
premiums £m
Present value of
new business
premiums £m
United Kingdom 531 5.3 2,803 6,111 8,914 France 92 6.6 608 4,283 4,891 Ireland 78 4.3 337 735 1,072 Italy 111 5.3 592 3,015 3,607 Poland 71 13.1 927 152 1,079 Spain 128 6.1 782 1,672 2,454 Other Europe 82 4.5 365 55 420 Aviva Europe 562 6.4 3,611 9,912 13,523 Delta Lloyd 207 9.3 1,935 1,730 3,665 Europe 769 7.2 5,546 11,642 17,188 North America 90 9.6 861 3,684 4,545 Asia 185 4.5 828 267 1,095 Australia 49 4.0 196 65 261 Asia Pacific 234 4.4 1,024 332 1,356
Total life and pensions 1,624 6.3 10,234 21,769 32,003
In Poland, the WACF has significantly fallen, reflecting the lower proportion of new pension business written following legislative changes making this business less attractive. This business had a high WACF, reflecting the long duration of the business combined with premiums increasing each year.

MCEV financial statements continued
336
Aviva plc Annual Report and Accounts 2010
E10 – Geographical analysis of value of new business The value generated by new business written during the period is the present value of the projected stream of after-tax distributable profit from that business, including expected profit between point of sale and the valuation date. The value of new business has been calculated using economic assumptions at the point of sale which has been implemented with the assumptions being taken as those appropriate to the start of each quarter. For contracts that are re-priced more frequently, weekly or monthly economic assumptions have been used. The operating assumptions are consistent with those used to determine the embedded value. The value of new business is shown after the effect of the frictional costs of holding required capital, and after the effect of the costs of residual non-hedgeable risks on the same basis as for the in-force covered business.
Present value of new
business premiums
Value of new business
New business margin
Life and pensions (gross of tax and non-controlling interest)
2010 £m
2009 £m
2010
£m
Restated 2009
£m
2010
%
Restated 2009
%
United Kingdom 10,298 8,914 354 247 3.4% 2.8% France 4,918 4,891 175 169 3.6% 3.5% Ireland 938 1,072 1 12 0.1% 1.1% Italy 4,456 3,607 142 124 3.2% 3.4% Poland 603 1,079 40 55 6.6% 5.1% Spain 2,084 2,454 128 151 6.1% 6.2% Other Europe 538 420 18 10 3.3% 2.4% Aviva Europe 13,537 13,523 504 521 3.7% 3.9% Delta Lloyd 3,178 3,665 (92) (48) (2.9)% (1.3)% Europe 16,715 17,188 412 473 2.5% 2.8% North America1 4,728 4,545 (194) 16 (4.1)% 0.4% Asia Pacific 1,617 1,356 52 29 3.2% 2.1%
Total life and pensions 33,358 32,003 624 765 1.9% 2.4%
Present value of new
business premiums
Value of new business
New business margin
Life and pensions (net of tax and non-controlling interest)
2010 £m
2009 £m
2010 £m
Restated 2009
£m 2010
%
Restated 2009
%
United Kingdom 10,298 8,914 254 177 2.5% 2.0% France 4,340 4,111 100 94 2.3% 2.3% Ireland 704 804 1 8 0.1% 1.0% Italy 1,965 1,614 42 38 2.1% 2.4% Poland 531 933 29 39 5.5% 4.2% Spain 1,136 1,326 43 51 3.8% 3.8% Other Europe 538 420 15 8 2.8% 1.9% Aviva Europe 9,214 9,208 230 238 2.5% 2.6% Delta Lloyd 1,721 3,235 (41) (43) (2.4)% (1.3)% Europe 10,935 12,443 189 195 1.7% 1.6% North America 4,728 4,545 (126) 16 (2.7)% 0.4% Asia Pacific 1,598 1,348 41 22 2.6% 1.6%
Total life and pensions 27,559 27,250 358 410 1.3% 1.5% 1 Value of new business of £(194) million reflects adverse economic movements, particularly in the second half of 2010, as risk free rates decreased.

Performance reviewCorporate responsibilityGovernanceShareholder informationFinancial statements IFRSFinancial statements MCEVOther information
Financial statements M
CEV
MCEV financial statements continued Aviva plc Annual Report and Accounts 2010
337
E11 – Post-tax internal rate of return and payback period on life and pensions new business The new business written requires up-front capital investment, due to high set-up costs and capital requirements. The internal rate of return (IRR) is a measure of the shareholder return expected on this capital investment. It is equivalent to the discount rate at which the present value of the post-tax cash flows expected to be earned over the lifetime of the business written, including allowance for the time value of options and guarantees, is equal to the total invested capital to support the writing of the business. The capital included in the calculation of the IRR is the initial capital required to pay acquisition costs and set up statutory reserves in excess of premiums received (initial capital), plus required capital at the same level as for the calculation of the value of new business. The payback period shows how quickly shareholders can expect the total capital to be repaid. The payback period has been calculated based on undiscounted cash flows and allows for the initial and required capital. The projected investment returns in both the IRR and payback period calculations assume that equities, properties and bonds earn a return in excess of risk-free consistent with the long-term rate of return assumed in operating earnings. The IRR on life and pensions new business for the Group was 12.5% (2009: 10.0%).
Gross of non-controlling interests 31 December 2010
Internal rate of return
%
Initial capital
£m
Required capital
£m
Total invested
capital £m
Payback
period years
United Kingdom 15% 98 198 296 7 France 9% 34 202 236 9 Ireland 5% 34 17 51 11 Italy 11% 32 183 215 6 Poland 25% 16 9 25 4 Spain 22% 25 80 105 4 Other Europe 14% 41 16 57 6 Aviva Europe 13% 182 507 689 7 Delta Lloyd 6% 106 112 218 16 Europe 11% 288 619 907 9 North America 14% 65 366 431 4 Asia Pacific 11% 62 34 96 13
Total 12.5% 513 1,217 1,730 8
Gross of non-controlling interests 31 December 2009
Internal rate of return
%
Initial capital
£m
Required capital
£m
Total invested
capital £m
Payback
period years
United Kingdom 14% 109 133 242 8 France 9% 53 169 222 9 Ireland 6% 56 23 79 10 Italy 10% 27 156 183 7 Poland 22% 20 9 29 5 Spain 26% 25 72 97 3 Other Europe 12% 43 7 50 8 Aviva Europe 13% 224 436 660 7 Delta Lloyd 6% 116 140 256 33 Europe 11% 340 576 916 15 North America 7% 162 376 538 14 Asia 6% 58 25 83 25 Australia 11% 2 34 36 8 Asia Pacific 8% 60 59 119 20
Total 10.0% 671 1,144 1,815 14

MCEV financial statements continued
338
Aviva plc Annual Report and Accounts 2010
E12 – Free surplus emergence
Existing
business New
business Total
business
Net of tax and non-controlling interests 2010
Transfer from VIF to net worth
£m
Return on net worth
£m
Impact of experience
variances and
assumption changes on
net worth £m
Release of required
capital to free
surplus £m
Total existing business
surplus generation
£m
Impact on net worth
£m
Reduction in free
surplus from
required capital
£m
Total new business
surplus generation
£m
Total free surplus
generation £m
United Kingdom 345 129 208 (183) 499 (43) (95) (138) 361 Aviva Europe 478 77 147 126 828 (150) (342) (492) 336 Delta Lloyd 139 50 (225) 83 47 (58) (55) (113) (66) Europe 617 127 (78) 209 875 (208) (397) (605) 270 North America 210 53 (56) 292 499 (41) (375) (416) 83 Asia Pacific 52 9 (5) 15 71 (57) (34) (91) (20)
Total 1,224 318 69 333 1,944 (349) (901) (1,250) 694
Existing
business New
business Total
business
Net of tax and non-controlling interests 2009
Transfer from VIF to net worth
£m
Return on net worth
£m
Impact of experience
variances and
assumption changes on
net worth £m
Release of required
capital to free surplus
£m
Total existing
business surplus
generation £m
Impact on net worth
£m
Reduction in free surplus
from required
capital £m
Total new business surplus
generation £m
Total free surplus
generation £m
United Kingdom 220 99 62 (70) 311 (53) (130) (183) 128 Aviva Europe 495 89 27 112 723 (177) (281) (458) 265 Delta Lloyd 175 57 (124) 55 163 (111) (124) (235) (72) Europe 670 146 (97) 167 886 (288) (405) (693) 193 North America 159 90 (100) 457 606 (192) (390) (582) 24 Asia Pacific 82 11 (5) 2 90 (55) (58) (113) (23)
Total 1,131 346 (140) 556 1,893 (588) (983) (1,571) 322
E13 – Maturity profile of business (a) Total in-force business To show the profile of the VIF emergence, the value of VIF in the statements of financial position has been split into five-year tranches depending on the date when the profit is expected to emerge.
2010 £m 0–5 6–10 11–15 16–20 20+
Total gross of non-
controlling interest
Total net of non-
controlling interest
United Kingdom 153 766 538 287 553 2,297 2,297 Aviva Europe 1,649 980 575 342 375 3,921 3,288 Delta Lloyd 517 109 56 (176) (76) 430 196 Europe 2,166 1,089 631 166 299 4,351 3,484 North America 56 (47) 12 12 9 42 42 Asia Pacific 187 94 35 15 3 334 325
Total 2,562 1,902 1,216 480 864 7,024 6,148
Restated 2009 £m 0–5 6–10 11–15 16–20 20+
Total gross of non-
controlling interest
Total net of non-
controlling interest
United Kingdom 289 629 490 288 369 2,065 2,065 Aviva Europe 1,613 1,149 656 350 342 4,110 3,271 Delta Lloyd 54 149 177 151 (234) 297 125 Europe 1,667 1,298 833 501 108 4,407 3,396 North America (238) (251) 28 13 54 (394) (394) Asia Pacific 102 72 29 18 26 247 241
Total 1,820 1,748 1,380 820 557 6,325 5,308

Performance reviewCorporate responsibilityGovernanceShareholder informationFinancial statements IFRSFinancial statements MCEVOther information
Financial statements M
CEV
MCEV financial statements continued Aviva plc Annual Report and Accounts 2010
339
E13 – Maturity profile of business continued (b) New business To show the profile of the VIF emergence, the value of new business has been split into five-year tranches depending on the date when the profit is expected to emerge.
2010 £m 0–5 6–10 11–15 16–20 20+
Total gross of non-
controlling interest
Total net of non-
controlling interest
United Kingdom 78 42 22 13 143 298 298 Aviva Europe 257 119 70 31 40 517 378 Delta Lloyd (6) 21 21 12 (10) 38 18 Europe 251 140 91 43 30 555 396 North America (26) (85) 10 22 (6) (85) (85) Asia Pacific 59 22 11 5 3 100 98
Total 362 119 134 83 170 868 707
Restated 2009 £m 0–5 6–10 11–15 16–20 20+
Total gross of non-
controlling interest
Total net of non-
controlling interest
United Kingdom 107 30 34 19 40 230 230 Aviva Europe 286 126 80 37 43 572 414 Delta Lloyd (38) 89 97 75 (138) 85 70 Europe 248 215 177 112 (95) 657 484 North America 20 6 64 52 66 208 208 Asia Pacific 46 14 8 4 5 77 76
Total 421 265 283 187 16 1,172 998
E14 – Segmental analysis of life and related business embedded value Net of non-controlling interests 2010
Free surplus £m
Required capital1
£m VIF £m
Total MCEV
£m
United Kingdom 1,139 2,934 2,297 6,370 France2 (243) 1,737 1,446 2,940 Ireland 47 336 444 827 Italy 202 313 82 597 Poland 129 114 876 1,119 Spain 81 266 207 554 Other Europe 43 45 233 321 Aviva Europe 259 2,811 3,288 6,358 Delta Lloyd 356 944 196 1,496 Europe 615 3,755 3,484 7,854 North America2,3 (248) 1,437 42 1,231 Asia Pacific 135 216 325 676
Total 1,641 8,342 6,148 16,131 1 Required capital is shown net of implicit items permitted by local regulators to cover minimum solvency margins. 2 France and Aviva USA have a positive surplus on a statutory basis. 3 Aviva USA’s holding company debt amounting to £765 million at 31 December 2010 has been included within non-covered business.
Restated Net of non-controlling interests 2009
Free surplus £m
Required capital1
£m VIF £m
Total MCEV
£m
United Kingdom2 1,270 2,568 2,065 5,903 France3 (71) 1,592 1,252 2,773 Ireland 175 226 487 888 Italy 263 268 129 660 Poland 60 131 950 1,141 Spain 135 212 265 612 Other Europe 38 33 188 259 Aviva Europe 600 2,462 3,271 6,333 Delta Lloyd 368 1,095 125 1,588 Europe 968 3,557 3,396 7,921 North America3,4 (152) 1,240 (394) 694 Asia 118 181 241 540 Australia — — — — Asia Pacific 118 181 241 540
Total 2,204 7,546 5,308 15,058 1 Required capital is shown net of implicit items permitted by local regulators to cover minimum solvency margins. 2 The large increase in required capital in the UK reflects the additional capital locked in following the reattribution of the inherited estate. 3 France and Aviva USA have a positive surplus on a statutory basis. 4 Aviva USA’s holding company debt amounting to £810 million at 31 December 2009 has been included within non-covered business.

MCEV financial statements continued
340
Aviva plc Annual Report and Accounts 2010
E15 – Risk allowance within present value of in-force (VIF) Within the VIF in the tables, there are additional allowances for risks not included within the basic present value of future profits calculation.
Net of non-controlling interests 2010
PVFP £m
Frictional costs
£m
Non-hedgeable
risks £m
Time value of financial
options and guarantees
£m VIF £m
United Kingdom 2,938 (291) (322) (28) 2,297 France 2,051 (123) (170) (312) 1,446 Ireland 476 (9) (23) — 444 Italy 156 (19) (11) (44) 82 Poland 1,013 (14) (118) (5) 876 Spain 281 (18) (41) (15) 207 Other Europe 247 (3) (9) (2) 233 Aviva Europe 4,224 (186) (372) (378) 3,288 Delta Lloyd 580 (107) (85) (192) 196 Europe 4,804 (293) (457) (570) 3,484 North America 607 (133) (69) (363) 42 Asia Pacific 441 (26) (58) (32) 325
Total 8,790 (743) (906) (993) 6,148
The Time Value of Options and Guarantees has reduced by £248 million to £993 million, reflecting favourable impacts from model refinements in France and US and the impact of renegotiating the guarantees on AFER in France. The allowance for Non-hedgeable risks has increased by £(260) million, reflecting the change to the charge from 2.5% to 3.3%.
Restated Net of non-controlling interests 2009
PVFP £m
Frictional costs
£m
Non-hedgeable
risks £m
Time value of financial
options and guarantees
£m VIF £m
United Kingdom 2,572 (285) (197) (25) 2,065 France 2,048 (144) (155) (497) 1,252 Ireland 517 (9) (21) — 487 Italy 189 (22) (11) (27) 129 Poland 1,050 (17) (74) (9) 950 Spain 326 (16) (28) (17) 265 Other Europe 198 (3) (5) (2) 188 Aviva Europe 4,328 (211) (294) (552) 3,271 Delta Lloyd 544 (129) (80) (210) 125 Europe 4,872 (340) (374) (762) 3,396 North America 80 (9) (45) (420) (394) Asia 324 (19) (30) (34) 241 Australia — — — — — Asia Pacific 324 (19) (30) (34) 241
Total 7,848 (653) (646) (1,241) 5,308

Performance reviewCorporate responsibilityGovernanceShareholder informationFinancial statements IFRSFinancial statements MCEVOther information
Financial statements M
CEV
MCEV financial statements continued Aviva plc Annual Report and Accounts 2010
341
E16 – Implied discount rates (IDR) In the valuation of a block of business, the implied discount rate is the rate of discount such that a traditional embedded value calculation for the covered business equates to the MCEV. The cash flows projected are the expected future cash flows including expected investment cash flows from equities, bonds and properties earning a risk premium in excess of risk free, statutory reserves and required capital. The risk premiums used are consistent with those used in the expected existing business contribution within operating earnings. As the risk premiums are positive, a discount rate higher than risk-free is required to give a value equal to the market-consistent embedded value. Average derived risk discount rates are shown below for the embedded value.
2010
%
Restated1
2009 %
United Kingdom 8.4% 10.4% France 6.7% 7.2% Ireland 4.4% 5.1% Italy 7.3% 5.3% Poland 7.3% 7.1% Spain 9.6% 8.4% Other Europe 8.0% 8.9% Aviva Europe 6.9% 6.9% Delta Lloyd 14.8% 10.5% Europe 8.7% 8.1% North America2 24.5% 35.6% Asia Pacific3 5.9% 7.2%
Total 9.9% 10.1% 1 The IDRs have been restated following more detailed review resulting from the change in expected return methodology, which reflected a more appropriate allowance for the impact of the release of required capital and other refinements. 2 The US full-year 2009 IDR has been revised to reflect the expected future tax paying position of the business. This reduces the IDR from 41.2% to 35.6%. The revised IDR gives the correct expected return allowing for the impact of tax on future
cash flows within the IDR calculation and the impact of the tax assumption change on the closing full-year 2009 balance sheet. 3 Asia Pacific excludes Australian life and pensions business sold in October 2009.

MCEV financial statements continued
342
Aviva plc Annual Report and Accounts 2010
E17 – Summary of non-controlling interest in life and related businesses’ MCEV results
2010 France
£m Ireland
£m Italy £m
Poland £m
Spain £m
Aviva Europe
£m
Delta Lloyd
£m Europe
£m
Asia Pacific
£m Total
£m
Share-holders’ interest
£m Group
£m
Value of new business after tax 15 (1) 54 4 47 119 (26) 93 — 93 358 451 Life MCEV operating earnings after tax 41 6 104 40 81 272 49 321 3 324 2,199 2,523 Life MCEV (loss)/earnings after tax 47 (11) (26) 2 (29) (17) (17) (34) 6 (28) 1,838 1,810 Closing covered businesses’ embedded value 250 268 630 153 489 1,790 1,324 3,114 19 3,133 16,131 19,264
Restated 2009
France £m
Ireland £m
Italy £m
Poland £m
Spain £m
Aviva Europe
£m
Delta Lloyd
£m Europe
£m
Asia Pacific
£m Total
£m
Share-holders’ interest
£m Group
£m
Value of new business after tax 16 2 47 5 56 126 9 135 — 135 410 545 Life MCEV operating earnings after tax 45 14 79 53 81 272 76 348 1 349 2,247 2,596 Life MCEV (loss)/earnings after tax 51 1 64 17 57 190 (98) 92 — 92 3,189 3,281 Closing covered businesses’ embedded value 320 290 762 162 586 2,120 1,346 3,466 14 3,480 15,058 18,538
There are no non-controlling interests in the United Kingdom or North America.
E18 – Principal assumptions (a) Economic assumptions – Deterministic calculations Economic assumptions are derived actively, based on market yields on risk-free fixed interest assets at the end of each reporting period. In setting the risk-free rate we have, wherever possible, used the mid-price swap yield curve for an AA-rated bank. The curve is extrapolated if necessary to get rates suitable to the liabilities. For markets in which there is no reliable swap yield curve the relevant government bond yields are used. For certain business, swap rates are adjusted for a ‘liquidity premium’ in deriving the risk-free rates, and these adjustments are shown below the reference rate table. Required capital is shown as a multiple of the EU statutory minimum solvency margin or equivalent. The principal economic assumptions used are as follows:
Reference rate (spot, swap rates) and expense inflation
United Kingdom
2010 2009 2008
Reference rate 1 year 1.0% 1.2% 2.8% 5 years 2.7% 3.5% 3.2% 10 years 3.7% 4.3% 3.5% 15 years 4.1% 4.6% 3.8% 20 years 4.2% 4.6% 3.8% Expense inflation 3.3% 3.3% 2.4%
Delta Lloyd
2010 2009 2008
Reference rate 1 year 1.3% 1.3% 2.5% 5 years 2.6% 2.9% 3.3% 10 years 3.4% 3.7% 3.8% 15 years 3.8% 4.1% 4.0% 20 years 3.8% 4.2% 3.9% Expense inflation 2.0% 2.4% 2.5%
Eurozone
(excluding Delta Lloyd)
2010 2009 2008
Reference rate 1 year 1.3% 1.3% 2.5% 5 years 2.5% 2.8% 3.3% 10 years 3.4% 3.7% 3.8% 15 years 3.8% 4.1% 3.9% 20 years 3.8% 4.2% 3.9% Expense inflation 2.1% 2.5% 2.1%

Performance reviewCorporate responsibilityGovernanceShareholder informationFinancial statements IFRSFinancial statements MCEVOther information
Financial statements M
CEV
MCEV financial statements continued Aviva plc Annual Report and Accounts 2010
343
E18 – Principal assumptions continued
Poland
2010 2009 2008
Reference rate 1 year 4.4% 4.5% 4.4% 5 years 5.5% 5.8% 4.3% 10 years 5.7% 5.8% 4.2% 15 years 5.4% 5.7% 4.1% 20 years 5.1% 5.5% 4.0% Expense inflation 3.0% 3.0% 2.9%
United States
2010 2009 2008
Reference rate 1 year 0.4% 0.7% 1.3% 5 years 2.2% 3.1% 2.2% 10 years 3.5% 4.2% 2.6% 15 years 4.0% 4.6% 2.9% 20 years 4.2% 4.8% 2.9% Expense inflation 3.0% 3.0% 3.0%
For service companies, expense inflation relates to the underlying expenses rather than the fees charged to the life company. The following adjustments are made to the swap rate for immediate annuity type contracts and for all contracts for Aviva USA and for Delta Lloyd. The risk-free rate is taken as the swap yield curve for the currency of the liability, adjusted by: New business Embedded value
4Q 2010 3Q 2010 Q2 2010 Q1 2010 Restated 4Q 2009
Restated 3Q 2009
Restated 1H 2009 2010
Restated 2009
UK1 1.09%/ 0.72%
0.87%/ 0.69%
0.75%/ 0.70%
0.80%/ 0.75%
0.90%/ 0.45%
1.10%/ 0.95%
1.50% 1.09% 1.00%
France n/a n/a n/a n/a n/a n/a n/a 0.36% 0.30% Spain 0.15% 0.12% 0.20% 0.15% 0.30% 0.75% 1.00% 0.36% 0.30% Delta Lloyd 0.38% 0.39% 0.34% 0.43% 0.61% 1.03% 1.83% 0.36% 0.43% US immediate annuities 0.76% 0.85% 0.65% 0.65% 1.05% 1.50% 3.00% 0.66% 0.65% US deferred annuities and all other contracts 0.64% 0.70% 0.55% 0.55% 0.90% 1.25% 2.50% 0.56% 0.55% 1 The rate provided is for immediate annuities/bulk purchase annuities.
For Delta Lloyd, the adjustment shown is applied to immediate annuity type contracts. For participating contracts, 75% of this value is used and for all other contracts, 50% of this value is used. This methodology is consistent with QIS 5 Solvency II requirements. For 2010, the approach to estimating the market level of liquidity premium in corporate bond assets has been simplified to use the formula structure proposed by CFO/CRO Forum working party. The formula is: UK/Europe: 50% of (iBoxx Corporate bond spread – 40bp) USA: 60% of (iBoxx Corporate bond spread – 40bp) Adjustments are made where liabilities are not fully backed by assets earning a liquidity premium and for contracts that are exposed to some lapse risk. The revised approach increases the EV by £0.3 billion due to the release of prudent margins in the previous direct Credit Default Swap-based approach. There has been no change to the types of contracts to which a liquidity premium is applied, apart from in Delta Lloyd, which has been restated for the move to the QIS 5 approach.
Risk premium – used for operating profit, Implied Discount Rates (IDR), Internal Rates of Return (IRR) and payback period For life and pensions operating earnings, Aviva uses normalised investment returns. The normalised investment returns are expressed as a swap rate based on the typical duration of the assets held plus an asset risk premium. More detail is given in note E1 – Basis of preparation. The use of asset risk premia only impacts operating earnings as expected returns reflect management’s long-term expectations of asset returns in excess of the reference rate from investing in different asset classes. This assumption does not impact the embedded value or value of new business as asset risk premia are not recognised until earned. The asset risk premia set out in the table below are added to the ten year swap rate to calculate expected returns.

MCEV financial statements continued
344
Aviva plc Annual Report and Accounts 2010
E18 – Principal assumptions continued
All territories
2010 2009 2008
Equity risk premium 3.5% 3.5% 3.5% Property risk premium 2.0% 2.0% 2.0%
Future returns on corporate fixed interest investments are calculated from prospective yields less an adjustment for credit risk.
Required capital and tax
Tax rates7 Required capital
(% EU minimum or equivalent)
2010 2009 2008 2010 2009
United Kingdom1 27.0% 28.0% 28.0% 100%/110%/200% 100%/110%/200% France 34.4% 34.4% 34.4% 107.5% 110% Ireland2 12.5% 12.5% 12.5% 175%/250% 150% Italy3 32.4% 32.4% 32.4% 111%/165% 115%/184% Poland 19.0% 19.0% 19.0% 125.5% 150% Spain4 30.0% 30.0% 30.0% 130% - 134%/175% 110%/125% Delta Lloyd5 25.0% 25.5% 25.5% 120% 139% United States6 35.0% 0.0% 0.0% 325% 325% 1 The required capital in the United Kingdom under MCEV is 100% for unit-linked and other non-participating business and 110% for annuity business with 200% for BPA business. In addition, the reattribution of the inherited estate has led to
additional capital being locked in to support the with-profit business, and this has been included within required capital. 2 Required capital in Ireland under MCEV is 175% for bancassurance and 250% for retail business. 3 Required capital in Italy under MCEV is 165% of the EU minimum for Eurovita and 111% for bancassurance and 130% for retail business. 4 Required capital in Spain is 175% of the EU minimum for Aviva Vida y Pensiones and 130% – 134% for bancassurance companies. 5 This capital level is the aggregate capital required for Delta Lloyd. 6 Following a more detailed review of the implied tax position of Aviva US, 2010 results have been calculated including the impact of full corporation tax applying to the cash flows and consequently the 2010 results are ‘grossed up’ at the
corporation tax rate in line with other businesses. 7 Current tax legislation and rates have been assumed to continue unaltered except where changes in future tax rates have been announced.
A gradual reduction in the UK corporation tax rate from 28% to 24% over 4 years was announced in the Emergency Budget of 22 June 2010. The Finance (No. 2) Act 2010 enacted the first of the 1% rate reductions with effect from April 2011, with subsequent reductions to be dealt with by future legislation. The benefit to the Group‘s MCEV net assets arising from the 3% reduction of the rate from 27% to 24% is estimated as £160 million in total.
Other economic assumptions Required capital relating to with-profit business is generally assumed to be covered by the surplus within the with-profit funds and no effect has been attributed to shareholders. Where the fund is insufficient, and additional shareholder support is required, this is included within required capital, including the RIEESA in the UK. Bonus rates on participating business have been set at levels consistent with the economic assumptions. The distribution of profit between policyholders and shareholders within the with-profit funds assumes that the shareholder interest in conventional with-profit business in the United Kingdom and Ireland continues at the current rate of one-ninth of the cost of bonus.
(b) Economic assumptions – Stochastic calculations The calculation of time value of options and guarantees allows for expected management and policyholder actions in response to varying future investment conditions. The management actions modelled include changes to asset mix, bonus rates and rates of interest and other guarantees granted to policyholders. Modelled policyholder actions are described under ‘Other assumptions’.

Performance reviewCorporate responsibilityGovernanceShareholder informationFinancial statements IFRSFinancial statements MCEVOther information
Financial statements M
CEV
MCEV financial statements continued Aviva plc Annual Report and Accounts 2010
345
E18 – Principal assumptions continued Model – United Kingdom, Europe (excluding Delta Lloyd) and Asia Pacific Swap rates are generated by a model, the LIBOR Market Model (LMM), that projects a full swap curve at monthly intervals. Forward rates are assumed to have a log-normal distribution which guarantees non-negative interest rates. The model is calibrated to at-the-money swaptions of a variety of terms and tenors. Swaption volatilities are taken from SuperDerivatives. Tests have been performed to ensure that sufficient scenarios have been used that the result converges to the stochastic value of the business being valued. The total annual return on equities is calculated as the return on one-year swaps plus an excess return. This excess return is generally modelled using a log-normal model where volatility varies by time horizon. This allows the model to capture the term structure of implied volatilities. The model is calibrated to at-the-money options of a variety of terms. For the UK, a two-dimensional model is used to capture the term structure of implied volatilities and the projected in the money position. Option volatilities are taken from Markit. The model also generates property total returns and real yield curves, although these are not significant asset classes for Aviva outside the UK. In the absence of liquid market data, the volatilities of these asset classes are based on historic data. Assumptions for correlations between asset classes have been set based on historic data.
Model – North America Swap rates are generated by a model, the LIBOR Market Model Plus (LMM+), which projects a full swap curve at monthly intervals. Previously the LMM model was used to generate scenarios. Forward rates are assumed to have a distribution that lies between the log-normal and normal distributions. Although this no longer guarantees non-negative interest rates, it maintains interest rates within a more plausible range than the standard Libor Market Model, and gives a better fit to certain swaption volatility surfaces. The model is calibrated to volatilities for swaptions for ten year swaps for a range of option terms and strike rates. Swaption volatilities are taken from SuperDerivatives. Tests have been performed to ensure that sufficient scenarios have been used that the result converges to the stochastic value of the business being valued. The total annual return on equities is calculated as the return on one-year swaps plus an excess return. This excess return is modelled using a log-normal model where volatility varies by time horizon. This allows the model to capture the term structure of implied volatilities. The model is calibrated to at-the-money options of a variety of terms. Option volatilities are taken from Markit. Assumptions for correlations between asset classes have been set based on historic data.
Model – Delta Lloyd The interest rate model used is a short rate G2++ model. The model is calibrated to the QIS5 yield curve and the swaption implied volatilities. Swaption implied volatilities are taken from Bloomberg. The equity model is a Heston model. Assumptions for correlations between asset classes have been set based on historic data.
Asset classes The significant asset classes for UK participating business are equities, property and long-term fixed rate bonds. The most significant assumptions are the distribution of future long-term interest rates (nominal and real) and swaption implied volatilities For many businesses, including US, France and Delta Lloyd, the most important assets are fixed rate bonds of various durations.
Summary statistics Swaption implied volatilities The implied volatility is that determined by Black-Scholes formula to reproduce the market price of the option. The following table sets out the model swaption implied volatilities.
2010 Swap length 2009 Swap length
Option length 10 years 15 years 20 years 25 years 10 years 15 years 20 years 25 years
UK sterling 10 years 15.3% 14.8% 14.3% 13.6% n/a n/a 14.1% n/a 15 years 14.1% 13.6% 13.1% 12.3% n/a n/a 14.6% n/a 20 years 13.1% 12.5% 12.0% 11.2% n/a n/a 14.4% n/a 25 years 12.3% 11.7% 11.2% 10.4% n/a n/a 14.0% n/a Euro 10 years 21.2% 20.9% 20.6% 20.3% 17.9% 17.8% 17.7% 17.6% 15 years 20.7% 20.1% 19.5% 18.8% 18.0% 17.6% 17.3% 16.9% 20 years 19.2% 18.5% 17.8% 16.9% 17.1% 16.7% 16.3% 15.7% 25 years 17.8% 16.9% 16.1% 15.2% 16.2% 15.6% 15.0% 14.4% Delta Lloyd 10 years 17.8% 18.1% 18.8% 19.8% 14.5% 15.3% 17.3% 18.6% 15 years 20.5% 21.0% 21.4% 21.7% 15.2% 15.8% 17.8% 18.9% 20 years 25.2% 25.3% 24.3% 23.4% 15.8% 16.7% 18.1% 18.5% 25 years 28.5% 26.4% 24.0% 22.5% 16.8% 17.5% 18.2% 18.3% US dollar 10 years 24.0% 23.6% 22.9% 22.2% 20.0% 18.9% 18.0% 17.3% 15 years 23.9% 23.1% 22.2% 21.1% 17.5% 16.4% 15.6% 15.0% 20 years 23.0% 21.9% 20.6% 19.4% 15.5% 14.5% 13.8% 13.2% 25 years 21.7% 20.4% 19.1% 17.8% 13.7% 12.9% 12.2% 11.6%
For businesses where stochastic scenarios are calibrated before the year end, the closing embedded value has been adjusted for the subsequent decrease in market volatilities up to the year end.

MCEV financial statements continued
346
Aviva plc Annual Report and Accounts 2010
E18 – Principal assumptions continued Equity implied volatilities The implied volatility is that determined by the Black-Scholes formula to reproduce the market price of the option. The following table set out the model equity implied volatilities.
2010 2009
Option length UK France Italy Ireland Delta Lloyd Spain US UK France Italy Ireland
Delta Lloyd Spain US
5 years 24.5% 29.0% 27.5% 27.7% 27.2% 32.4% 28.8% 25.3% 29.2% 26.9% 27.7% 27.5% 27.0% 26.9% 10 years 25.5% 28.4% 27.0% 27.6% 27.0% 31.2% 29.1% 26.6% 29.0% 26.5% 27.3% 29.1% 25.7% 27.8% 15 years 26.4% 29.1% 26.1% 28.4% 26.3% 30.2% 29.7% 27.3% 30.0% 26.4% 28.1% 30.5% 26.5% 29.1%
Property implied volatilities Best estimate levels of volatility have been used in the absence of meaningful option prices from which implied levels of volatility can be derived. For the UK and Delta Lloyd, model property implied volatility is 15% for 31 December 2010 (31 December 2009: 15%).
Demographic assumptions Assumed future mortality, morbidity and lapse rates have been derived from an analysis of Aviva’s recent operating experience with a view to giving a best estimate of future experience. We have anticipated future changes in experience where that is appropriate, e.g. we have allowed for improvements in future policyholder longevity. We have set the assumptions based on a best estimate of shareholder outcomes. In particular, where the policyholder behaviour varies with economic experience, we have set assumptions which are dynamic, i.e. vary depending on the economic assumptions. For example, surrender and option take up rate assumptions that vary according to the investment scenario under consideration have been used in the calculation of the time value of options and guarantees, based on our assessment of likely policyholder behaviour in different investment scenarios. Additionally, where demographic experience is not driven by economic scenarios but is asymmetric on a stand-alone basis, the best estimate assumption considers the weighted-average expected experience, not simply the median or most likely outcome.
Expense assumptions Management expenses and operating expenses of holding companies attributed to life and related businesses have been included in the MCEV calculations and split between expenses relating to the acquisition of new business, the maintenance of business in-force and project expenses. Future expense assumptions include an allowance for maintenance expenses and a proportion of recurring project expenses. Certain expenses of an exceptional nature, when they occur, are identified separately and are generally charged as incurred. No future productivity gains have been anticipated. Where subsidiary companies provide administration, investment management or other services to our life businesses, the value of profits or losses arising from these services have been included in the embedded value and value of new business.
Non-hedgeable risk For the opening balance sheet and operating profit, a charge of 2.5% has been applied to the Group-diversified capital required on a 1-in-200 one-year basis over the remaining lifetime of in-force business. For the closing balance sheet, a charge of 3.3% has been applied. The charge is set so as to give an aggregate allowance that is in excess of the expected operational risk costs arising from the in-force covered business over its remaining lifetime. The capital levels used are projected to be sufficient to cover non-hedgeable risks at the 99.5% confidence level one year after the valuation date. The capital is equal to the capital from the ICA results for those risks considered. The capital has been projected as running off over the remaining life of the in-force portfolio in line with the drivers of the capital requirement. In addition to the operational risk allowance, financial non-hedgeable risks and other product level asymmetries have been allowed for. These allowances are not material as significant financial non-hedgeable risks and product level asymmetries are either modelled explicitly and included in the TVOG or are included in the PVFP through the use of appropriate best estimate assumptions.

Performance reviewCorporate responsibilityGovernanceShareholder informationFinancial statements IFRSFinancial statements MCEVOther information
Financial statements M
CEV
MCEV financial statements continued Aviva plc Annual Report and Accounts 2010
347
E18 – Principal assumptions continued (c) Other assumptions Valuation of debt Borrowings in the MCEV consolidated statement of financial position are valued on an IFRS basis, consistent with the primary financial statements. At 31 December 2010 the market value of the Group’s external debt, subordinated debt, preference shares including General Accident plc preference shares of £250 million (classified as non-controlling interests) and direct capital instrument was £7,279 million (31 December 2009: £6,634 million).
2010
£m 2009
£m
Borrowings per summarised consolidated statement of financial position – MCEV basis 14,949 15,000 Add: amount included within held for sale — — Less: Securitised mortgage funding (6,332) (7,329)
Borrowings excluding non-recourse funding – MCEV basis 8,617 7,671 Less: Operational financing by businesses (2,551) (2,182)
External debt and subordinated debt – MCEV basis 6,066 5,489 Add: Preference shares (including General Accident plc) and direct capital instrument 1,440 1,440
External debt, subordinated debt, preference shares and direct capital instrument – MCEV basis 7,506 6,929 Effect of marking these instruments to market (227) (295)
Market value of external debt, subordinated debt, preference shares and direct capital instrument 7,279 6,634
Other It has been assumed that there will be no changes to the methods and bases used to calculate the statutory technical provisions and current surrender values, except where driven by varying future investment conditions under stochastic economic scenarios.
E19 – Sensitivity analysis (a) Economic assumptions The following tables show the sensitivity of the embedded value and the value of new business to:
10 basis point increase in the liquidity premium adjustment, where applicable; one and two percentage point increase and decrease in the risk-free rate, including all consequential changes (including
assumed investment returns for all asset classes, market values of fixed interest assets, risk discount rates); 10% increase and decrease in market values of equity and property assets; 25% increase in equity and swaption volatilities; 50 basis point increase and decrease in credit spreads with no change to liquidity premium; and decrease in the level of required capital to 100% EU minimum (or equivalent).
In each sensitivity calculation, all other assumptions remain unchanged except where they are directly affected by the revised economic conditions. For example, future bonus rates are automatically adjusted to reflect sensitivity changes to future investment returns. Some of the sensitivity scenarios may have consequential effects on valuation bases, where the basis for certain blocks of business is actively updated to reflect current economic circumstances. Consequential valuation impacts on the sensitivities are allowed for where an active valuation basis is used. Where businesses have a target asset mix, the portfolio is re-balanced after a significant market movement otherwise no re-balancing is assumed. For new business, the sensitivities reflect the impact of a change immediately after inception of the policy. In general, the magnitude of the sensitivities will reflect the size of the embedded values, though this will vary as the sensitivities have different impacts on the different components of the embedded value. In addition, other factors can have a material impact, such as the nature of the options and guarantees, as well as the types of investments held. The credit spread sensitivities assume that the change relates to credit risk and not liquidity risk; in practice, credit spread movements may be partially offset due to changes in liquidity risk. Sensitivities will also vary according to the current economic assumptions, mainly due to the impact of changes to both the intrinsic cost and time value of options and guarantees. Options and guarantees are the main reason for the asymmetry of the sensitivities where the guarantee impacts to different extents under the different scenarios. This can be seen in the sensitivity of a 1%–2% movement in the interest rate for Delta Lloyd and US, where there is a significant amount of business with investment return guarantees.

MCEV financial statements continued
348
Aviva plc Annual Report and Accounts 2010
E19 – Sensitivity analysis continued Embedded value
Interest rates
2010 Embedded value (net of tax and non-controlling interest)
As reported on page
339 £m
10bp increase in
adjustment to risk-free
rates £m
1% increase
£m
1% decrease
£m
2% increase
£m
2% decrease
£m
United Kingdom 6,370 150 (205) 185 (435) 385 France 2,940 5 (60) (15) (140) (245) Ireland 827 — (30) 40 (55) 60 Italy 597 — (20) 35 (40) 80 Poland 1,119 — (60) 65 (110) 135 Spain 554 10 (15) 15 (35) 30 Other Europe 321 — (5) 15 (15) 25 Aviva Europe 6,358 15 (190) 155 (395) 85 Delta Lloyd 1,496 65 350 (480) 580 (1,235) Europe 7,854 80 160 (325) 185 (1,150) North America 1,231 170 (180) 65 (460) 60 Asia Pacific 676 — 35 (75) 45 (230)
Total 16,131 400 (190) (150) (665) (935)
Equity/property
Market values
2010 Embedded value (net of tax and non-controlling interest)
As reported on page
339 £m
10% increase
£m
10% decrease
£m
Volatility 25%
increase £m
United Kingdom 6,370 275 (325) (215) France 2,940 150 (165) (125) Ireland 827 20 (20) — Italy 597 — — — Poland 1,119 10 (10) — Spain 554 10 (10) (10) Other Europe 321 5 — — Aviva Europe 6,358 195 (205) (135) Delta Lloyd 1,496 255 (260) (35) Europe 7,854 450 (465) (170) North America 1,231 25 (20) — Asia Pacific 676 20 (20) (5)
Total 16,131 770 (830) (390)
Corporate bond
credit spread
2010 Embedded value (net of tax and non-controlling interest)
As reported on page
339 £m
Swaption implied
volatilities 25%
increase £m
50bps increase
£m
50bps decrease
£m
EU minimum capital or
equivalent £m
United Kingdom 6,370 (15) (700) 765 15 France 2,940 (85) (125) 160 10 Ireland 827 — — — 5 Italy 597 — — — 5 Poland 1,119 — — — 5 Spain 554 (5) (60) 55 5 Other Europe 321 — — — — Aviva Europe 6,358 (90) (185) 215 30 Delta Lloyd 1,496 10 (75) 85 10 Europe 7,854 (80) (260) 300 40 North America 1,231 (160) (920) 825 90 Asia Pacific 676 (5) (15) 15 30 Total 16,131 (260) (1,895) 1,905 175

Performance reviewCorporate responsibilityGovernanceShareholder informationFinancial statements IFRSFinancial statements MCEVOther information
Financial statements M
CEV
MCEV financial statements continued Aviva plc Annual Report and Accounts 2010
349
E19 – Sensitivity analysis continued New business
Interest rates
2010 Value of new business (net of tax and non-controlling interest)
As reported on page
329 £m
10bp increase in
adjustment to risk-free
rates £m
1% increase
£m
1% decrease
£m
2% increase
£m
2% decrease
£m
United Kingdom 254 25 (22) 28 (39) 65 France 100 — (6) 6 (15) 6 Ireland 1 — 1 (1) 2 (2) Italy 42 — (3) 2 (6) 1 Poland 29 — (2) 2 (4) 5 Spain 43 1 (2) 2 (4) 1 Other Europe 15 — (1) 1 (2) 3 Aviva Europe 230 1 (13) 12 (29) 14 Delta Lloyd (41) 1 11 (12) 17 (31) Europe 189 2 (2) — (12) (17) North America (126) 15 (10) 4 (40) (16) Asia Pacific 41 — 13 (20) 22 (61)
Total 358 42 (21) 12 (69) (29)
Equity/property
Market values
2010 Value of new business (net of tax and non-controlling interest)
As reported on page
329 £m
10% increase
£m
10% decrease
£m
Volatility 25%
increase £m
United Kingdom 254 — — — France 100 6 (7) (3) Ireland 1 — — — Italy 42 1 (1) — Poland 29 — — — Spain 43 — — — Other Europe 15 — — — Aviva Europe 230 7 (8) (3) Delta Lloyd (41) 6 (6) — Europe 189 13 (14) (3) North America (126) — — — Asia Pacific 41 — — —
Total 358 13 (14) (3)
Corporate bond
credit spread
2010 Value of new business (net of tax and non-controlling interest)
As reported on page
329 £m
Swaption implied
volatilities 25%
increase £m
50bps increase
£m
50bps decrease
£m
EU minimum capital or
equivalent £m
United Kingdom 254 — (58) 61 2 France 100 (6) (1) 3 3 Ireland 1 — — — — Italy 42 — — — 1 Poland 29 — — — — Spain 43 — (7) 6 1 Other Europe 15 — — — — Aviva Europe 230 (6) (8) 9 5 Delta Lloyd (41) — (1) 1 1 Europe 189 (6) (9) 10 6 North America (126) (17) (76) 67 15 Asia Pacific 41 — — — 5
Total 358 (23) (143) 138 28
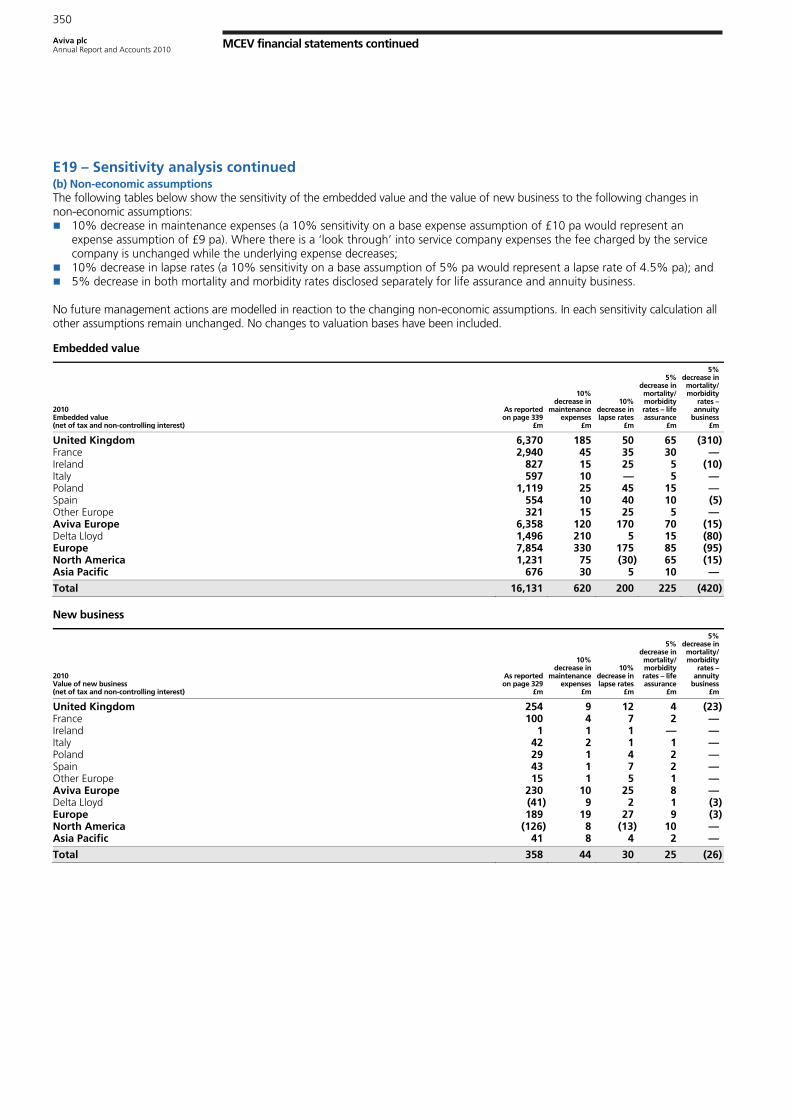
MCEV financial statements continued
350
Aviva plc Annual Report and Accounts 2010
E19 – Sensitivity analysis continued (b) Non-economic assumptions The following tables below show the sensitivity of the embedded value and the value of new business to the following changes in non-economic assumptions:
10% decrease in maintenance expenses (a 10% sensitivity on a base expense assumption of £10 pa would represent an expense assumption of £9 pa). Where there is a ‘look through’ into service company expenses the fee charged by the service company is unchanged while the underlying expense decreases;
10% decrease in lapse rates (a 10% sensitivity on a base assumption of 5% pa would represent a lapse rate of 4.5% pa); and 5% decrease in both mortality and morbidity rates disclosed separately for life assurance and annuity business.
No future management actions are modelled in reaction to the changing non-economic assumptions. In each sensitivity calculation all other assumptions remain unchanged. No changes to valuation bases have been included.
Embedded value
2010 Embedded value (net of tax and non-controlling interest)
As reported on page 339
£m
10% decrease in
maintenance expenses
£m
10% decrease in lapse rates
£m
5% decrease in mortality/ morbidity rates – life assurance
£m
5% decrease in mortality/ morbidity
rates –annuity
business £m
United Kingdom 6,370 185 50 65 (310) France 2,940 45 35 30 — Ireland 827 15 25 5 (10) Italy 597 10 — 5 — Poland 1,119 25 45 15 — Spain 554 10 40 10 (5) Other Europe 321 15 25 5 — Aviva Europe 6,358 120 170 70 (15) Delta Lloyd 1,496 210 5 15 (80) Europe 7,854 330 175 85 (95) North America 1,231 75 (30) 65 (15) Asia Pacific 676 30 5 10 —
Total 16,131 620 200 225 (420)
New business
2010 Value of new business (net of tax and non-controlling interest)
As reported on page 329
£m
10% decrease in
maintenance expenses
£m
10% decrease in lapse rates
£m
5% decrease in mortality/ morbidity rates – life assurance
£m
5% decrease in mortality/ morbidity
rates –annuity
business £m
United Kingdom 254 9 12 4 (23) France 100 4 7 2 — Ireland 1 1 1 — — Italy 42 2 1 1 — Poland 29 1 4 2 — Spain 43 1 7 2 — Other Europe 15 1 5 1 — Aviva Europe 230 10 25 8 — Delta Lloyd (41) 9 2 1 (3) Europe 189 19 27 9 (3) North America (126) 8 (13) 10 — Asia Pacific 41 8 4 2 —
Total 358 44 30 25 (26)

Performance reviewCorporate responsibilityGovernanceShareholder informationFinancial statements IFRSFinancial statements MCEVOther information
Financial statements M
CEV
MCEV financial statements continued Aviva plc Annual Report and Accounts 2010
351
Statement of directors’ responsibilities in respect of the Market Consistent Embedded Value (MCEV) basis When compliance with the European Insurance CFO Forum Market Consistent Embedded Value Principles (MCEV Principles), published in October 2009, is stated, those principles require the directors to prepare supplementary information in accordance with the methodology contained in the MCEV Principles and to disclose and explain any non-compliance with the guidance included in the MCEV Principles. In preparing this supplementary information, the directors have done so in accordance with these MCEV Principles and have also fully complied with all the guidance included therein. Specifically, the directors have:
determined assumptions on a realistic basis, having regard to past, current and expected future experience and to relevant external data, and then applied them consistently;
made estimates that are reasonable and consistent; and, provided additional disclosures when compliance with the specific requirements of the MCEV Principles is insufficient to enable
users to understand the impact of particular transactions, other events and conditions and the Group’s financial position and financial performance.
By order of the Board Patrick Regan Chief financial officer 2 March 2011

MCEV financial statements continued
352
Aviva plc Annual Report and Accounts 2010
Independent auditor’s report to the directors of Aviva plc on the consolidated Market Consistent Embedded Value (MCEV) financial statements We have audited the consolidated MCEV financial statements of Aviva plc for the year ended 31 December 2010 which comprise the Condensed Consolidated Income Statement – MCEV basis, the Condensed Consolidated Statement of Comprehensive Income – MCEV basis, the Condensed Consolidated Statement of Changes in Equity – MCEV basis, the Condensed Consolidated Statement of Financial Position – MCEV basis, the Reconciliation of Shareholders’ Equity on IFRS and MCEV bases, the Reconciliation of IFRS Total Equity to MCEV Net Worth, the Group MCEV Analysis of Earnings and the related notes E1 to E19. The financial reporting framework that has been applied in the consolidated MCEV financial statements is the Market Consistent Embedded Value Principles issued in June 2008 by the CFO Forum as amended in October 2009 (the MCEV Principles) and the basis of preparation set out on pages 321 to 324. We have reported separately on the statutory Group financial statements of Aviva plc for the year ended 31 December 2010. The information contained in the consolidated MCEV financial statements should be read in conjunction with the financial statements prepared on an IFRS basis. This report is made solely to the Company in accordance with our engagement letter dated 4 August 2010. Our audit work has been undertaken so that we might state to the Company those matters we are required to state to them in an auditors’ report and for no other purpose. To the fullest extent permitted by law, we do not accept or assume responsibility to anyone other than the Company for our audit work, for this report, or for the opinions we have formed.
Respective responsibilities of directors and auditors As explained more fully in the Statement of directors’ responsibilities on page 351, the directors are responsible for preparing the consolidated MCEV financial statements in accordance with the MCEV Principles. Our responsibility, as independent auditor, is to audit and express an opinion on the consolidated MCEV financial statements, in accordance with the terms of our engagement letter dated 4 August 2010 and having regard to International Standards on Auditing (UK and Ireland). Those standards require us to comply with the Auditing Practices Board’s Ethical Standards for Auditors.
Scope of the audit of the consolidated MCEV financial statements An audit involves obtaining evidence about the amounts and disclosures in the consolidated MCEV financial statements sufficient to give reasonable assurance that the consolidated MCEV financial statements are free from material misstatement, whether caused by fraud or error. This includes an assessment of: whether the accounting policies are appropriate to the Group’s circumstances and have been consistently applied and adequately disclosed; the reasonableness of significant accounting estimates made by the directors; and the overall presentation of the consolidated MCEV financial statements.
Opinion In our opinion the consolidated MCEV financial statements for the year ended 31 December 2010 have been properly prepared, in all material respects, in accordance with the MCEV Principles and the basis of preparation set out on pages 321 to 324. Ernst & Young LLP London 2 March 2011 1 The maintenance and integrity of Aviva plc’s website is the responsibility of the directors; the work carried out by the auditors does not involve consideration of these matters and, accordingly, the auditors accept no responsibility for any changes
that may have occurred to the financial statements since they were initially presented on the website. 2 Legislation in the United Kingdom governing the preparation and dissemination of financial statements may differ from legislation in other jurisdictions.

Performance reviewCorporate responsibilityGovernanceShareholder informationFinancial statements IFRSFinancial statements MCEVOther information
Other inform
ationAviva plc Annual Report and Accounts 2010
353
Other information
In this section Page
Glossary 354
Shareholder services 359

354
Aviva plc Annual Report and Accounts 2010
Glossary
Product definitions Annuities A type of policy that pays out regular amounts of benefit, either immediately and for the remainder of a person’s lifetime, or deferred to commence from a future date. Immediate annuities may be purchased for an individual and his or/her dependants or on a bulk purchase basis for groups of people. Deferred annuities are accumulation contracts, which may be used to provide benefits in retirement, and may be guaranteed, unit-linked or index-linked.
Bonds and savings These are accumulation products with single or regular premiums and unit-linked or guaranteed investment returns. Our product ranges include single premium investment bonds, regular premium savings plans and mortgage endowment products.
Critical illness cover Critical illness cover pays out a lump sum if the insured person is diagnosed with a serious illness that meets the plan definition. The cover is often provided in conjunction with other benefits under a protection contract.
Deferred annuities An annuity (or pension) due to be paid from a future date or when the policyholder reaches a specified age. A deferred annuity may be funded by a policyholder by payment of a series of regular contributions or by a capital sum (the latter often provided from a pension fund).
Group pensions A pension plan that covers a group of people, which is typically purchased by a company and offered to their employees.
Guaranteed annuities A policy that pays out a fixed regular amount of benefit for a defined period.
Income drawdown The policyholder can transfer money from any pension fund to an income drawdown plan from which they receive an income. The remainder of the pension fund continues to be invested, giving it the potential for growth.
Index linked annuities An index linked annuity is a type of deferred annuity whose credited interest is linked to an equity index. It guarantees a minimum interest rate and protects against a loss of principal.
Investment sales Comprise retail sales of mutual fund-type products such as unit trusts, individual savings accounts (ISAs) and open ended investment companies (OEICs).
ISAs Individual savings accounts – Tax-efficient plans for investing in stocks and shares, cash deposits or life insurance investment funds, subject to certain limits. Introduced in the UK in 1999.
Monolines Financial companies specialising in a single line of products such as credit cards, mortgages or home equity loans.
Mortgage endowment An insurance contract combining savings and protection elements which is designed to repay the principal of a loan or mortgage.
Mortgage life insurance A protection contract designed to pay off the outstanding amount of a mortgage or loan in the event of death of the insured.
Non profits Long-term savings and insurance products sold in the UK other than “With profits” (see definition below) products.
OEIC Open ended investment company is a collective investment fund structured as a limited company in which investors can buy and sell shares.
Pensions A means of providing income in retirement for an individual and possibly his/her dependants. Our pensions products include personal and group pensions, stakeholder pensions and income drawdown.
Personal pensions A pension plan tailored to the individual policyholder, which includes the options to stop, start or change their payments.
Protection An insurance contract that protects the policyholder or his/her dependants against financial loss on death or ill-health. Our product ranges include term assurance, mortgage life insurance, flexible whole life and critical illness cover.
Regular premium A series of payments are made by the policyholder, typically monthly or annually, for part of or all of the duration of the contract.
SICAVs Société d’investissement à capital variable (variable capital investment company). This is an open-ended investment fund, structured as a legally independent joint stock company, whose units are issued in the form of shares.

355
Performance reviewCorporate responsibilityGovernanceShareholder informationFinancial statements IFRSFinancial statements MCEVOther information
Other inform
ation
Aviva plc Annual Report and Accounts 2010
Glossary continued
Product definitions cont. Single premium A single lump sum is paid by the policyholder at commencement of the contract.
Stakeholder pensions Low cost and flexible pension plans available in the UK, governed by specific regulations.
Superannuation Superannuation is a pension product sold in Australia where employers pay a proportion of an employee’s salaries and wages into a fund, which can be accessed when the employee retires.
Takaful Insurance products that observe the rules and regulations of Islamic law.
Term assurance A simple form of life insurance, offering cover over a fixed number of years during which a lump sum will be paid out if the life insured dies.
Unit trusts A form of open ended collective investment constituted under a trust deed, in which investors can buy and sell units.
Unit-linked annuities A unit-linked annuity is a type of deferred annuity which is invested in units of investment funds, whose value depends directly on the market value of assets in those funds.
Whole life Whole life insurance is a protection policy that remains in force for the insured’s whole life. Traditional whole life contracts have fixed premium payments that typically cannot be missed without lapsing the policy. Flexible whole life contracts allow the policyholder to vary the premium and/or amount of life cover, within certain limits.
With-profits A type of long-term savings and insurance product sold in the UK under with profits policies premiums are paid into a separate fund. Policyholders receive a return on their policies through bonuses, which “smooth” the investment return from the assets which premiums are invested in. Bonuses are declared on an annual and terminal basis. Shareholders have a participating interest in the with-profit funds and any declared bonuses. Generally, policyholder and shareholder participation in with-profit funds in the UK is split 90:10.
Wrap investments An account in which a broker or fund manager executes investment decisions on behalf of a client in exchange for a single quarterly or annual fee, usually based on the total assets in the account rather than the number of transactions.
General terms Available for sale (AFS) Securities that have been acquired neither for short-term sale nor to be held to maturity. These are shown at fair value on the statement of financial position and changes in value are taken straight to equity instead of the income statement.
Association of British Insurers (ABI) Association of British Insurers – A major trade association for UK insurance companies, established in July 1985.
Acquired value of in force (AVIF) An estimate of future profits that will emerge over the remaining term of all existing life and pensions policies for which premiums are being paid or have been paid at the statement of financial position date.
Bancassurance An arrangement whereby banks and building societies sell insurance and investment products to their customers on behalf of other financial providers.
Combined Code on Corporate Governance The Combined Code on Corporate Governance sets out guidance in the form of principles and provisions on how companies should be directed and controlled to follow good governance practice. The Financial Services Authority (FSA) requires companies listed in the UK to disclose, in relation to the Combined Code, how they have applied its principles and whether they have complied with its provisions throughout the accounting year. Where the provisions have not been complied with, companies must provide an explanation for this.
Deferred acquisition costs (DAC) The cost directly attributable to the acquisition of new business for insurance and participating investment contracts (excluding those written in the UK) are deferred to the extent that they are expected to be recoverable out of future margins in revenue on these contracts.
Fair value The price that a reasonable buyer would be willing to pay and a reasonable seller would be willing to accept for a product on the open market.
FSA The UK’s Financial Services Authority – Main regulatory body appointed by the government to oversee the financial services industry in the UK. Since December 2001 it has been the single statutory regulator responsible for the savings, insurance and investment business.

356
Aviva plc Annual Report and Accounts 2010
Glossary continued
General terms cont. Funds under management Represents all assets actively managed or administered by or on behalf of the Group including those funds managed by third parties.
Funds under management by Aviva Represents all assets actively managed or administered by the fund management operations of the Group.
General insurance Also known as non-life or property and casualty insurance. Casualty insurance primarily covers losses arising from accidents that cause injury to other people or damage the property of others. Property insurance covers loss or damage through fire, theft, flood, storms and other specified risks.
Gross written premiums The total earnings or revenue generated by sales of insurance products, before any reinsurance is taken into account. Not all premiums written will necessarily be treated as income in the current financial year, because some of them could relate to insurance cover for a subsequent period.
‘Hard’ insurance market A term used to describe the state of the general insurance market. A “hard” insurance market is characterised by high levels of underwriting profits and the ability of insurers to charge high premium rates. Hard insurance markets generally occur when capital is scarce and are the opposite of “soft” insurance markets.
Independent Financial Advisers (IFAs) A person or organisation authorised to give advice on financial matters and to sell the products of all financial service providers. In the UK they are legally obliged to offer the product that best suits their clients’ needs. Outside the UK IFAs may be referred to by other names.
IFRS International Financial Reporting Standards. These are accounting regulations designed to ensure comparable statement of financial position preparation and disclosure, and are the standards that all publicly listed companies in the European Union are required to use.
IFRS operating profit From continuing operations on an IFRS basis, stated before tax attributable to shareholders’ profits, impairment of goodwill and exceptional items. This is also refered to as adjusted operating profit.
Inherited estate In the UK, the assets of the long-term with-profit funds less the realistic reserves for non-profit policies, less asset shares aggregated across the with-profit policies and any additional amounts expected at the valuation date to be paid to in-force policyholders in the future in respect of smoothing costs and guarantees. Long-term and savings business Collective term for life insurance, pensions, savings, investments and related business.
Market Consistent Embedded Value Aviva’s Market Consistent Embedded Value (MCEV) methodology which is in accordance with the MCEV Principles published by the CFO Forum in June 2008 as amended in October 2009.
Net written premiums Total gross written premiums for the given period, minus premiums paid over or ‘ceded’ to reinsurers.
Present value of new business (PVNBP) Present value of new regular premiums plus 100% of single premiums, calculated using assumptions consistent with those used to determine the value of new business under Market Consistent Embedded Value (MCEV) principles published by the CFO Forum of major European listed and non-listed insurance companies.
‘Soft’ insurance market A term used to describe the state of the general insurance market. A “soft” insurance market is characterised by low levels of profitability and market competition driving premium rates lower. Soft insurance markets generally occur when there is excess capital and are the opposite of “hard” insurance markets.
Turnbull Guidance on Internal Control The Turnbull Guidance sets out best practice on internal controls for UK listed companies, and provides additional guidance in applying certain sections of the Combined Code.

357
Performance reviewCorporate responsibilityGovernanceShareholder informationFinancial statements IFRSFinancial statements MCEVOther information
Other inform
ation
Aviva plc Annual Report and Accounts 2010
Glossary continued
Market Consistent Embedded Value (MCEV) terms Asymmetric risk Risks that will cause shareholder profits to vary where the variation above and below the average are not equal in distribution.
CFO Forum The CFO Forum (www.cfoforum.nl) is a high-level group formed by the chief financial officers of major European listed and non-listed insurance companies. Its aim is to discuss issues relating to proposed new accounting regulations for their businesses and how they can create greater transparency for investors. The forum was created in 2002, the Market Consistent Embedded Value Principles were launched in June 2008. The principles are a further development of the European Embedded Value Principles first launched in May 2004. Cost of non-hedgeable risks This is the cost of undertaking those risks for which a deep and liquid market in which to hedge that risk does not exist. This can include both financial risks and non-financial risks such as mortality, persistency and expense.
Covered business The contracts to which the MCEV methodology has been applied.
EU solvency The excess of assets over liabilities and the worldwide minimum solvency margins, excluding goodwill and the additional value of in-force long-term business, and excluding the surplus held in the Group’s life funds. The Group solvency calculation is determined according to the UK Financial Services Authority application of EU Insurance Groups Directive rules.
Financial options and guarantees Features of the covered business conferring potentially valuable guarantees underlying, or options to change, the level or nature of policyholder benefits and exercisable at the discretion of the policyholder, whose potential value is impacted by the behaviour of financial variables.
Free surplus The amount of any capital and surplus allocated to, but not required to support, the in-force covered business.
Frictional costs The additional taxation and investment costs incurred by shareholders through investing the Required Capital in the Company rather than directly.
Funds under management Represents all assets actively managed or administered by or on behalf of the Group including those funds managed by third parties.
Group MCEV A measure of the total consolidated value of the Group with covered life business included on an MCEV basis and non-covered business (including pension schemes and goodwill) included on an IFRS basis. Gross risk-free yields Gross of tax yields on risk-free fixed interest investments, generally swap rates under MCEV. Implicit items Amounts allowed by local regulators to be deducted from capital amounts when determining the EU required minimum margin.
Inherited estate The assets of the long-term with-profit funds less the realistic reserves for non-profit policies, less asset shares aggregated across the with-profit policies and any additional amounts expected at the valuation date to be paid to in-force policyholders in the future in respect of smoothing costs and guarantees.
Life business Subsidiaries selling life and pensions contracts that are classified as covered business under MCEV.
Life MCEV The MCEV balance sheet value of covered business as at the reporting date. Excludes non-covered business including pension schemes and goodwill.
Life MCEV operating earnings Operating earnings on the MCEV basis relating to the lines of business included in the embedded value calculations. From continuing operations and is stated before tax, impairment of goodwill and exceptional items.
Life MCEV earnings Total earnings on the MCEV basis relating to the lines of business included in the embedded value calculations. From continuing operations.
Look-through basis Inclusion of the capitalised value of profits and losses arising from subsidiary companies providing administration, investment management and other services to the extent that they relate to covered business.
Long-term savings Includes life and pension sales calculated under MCEV and retail investment sales.

358
Aviva plc Annual Report and Accounts 2010
Glossary continued
Market Consistent Embedded Value (MCEV) terms cont. Market consistent A measurement approach where economic assumptions are such that projected asset cash flows are valued consistently with current market prices for traded assets.
Net asset value per ordinary share Net asset value divided by the number of ordinary shares in issue. Net asset value is based on equity shareholders’ funds.
Net worth The market value of the shareholders’ funds and the shareholders’ interest in the surplus held in the non-profit component of the long-term business funds, determined on a statutory solvency basis and adjusted to add back any non-admissible assets, and consists of the required capital and free surplus. New business margin New business margins are calculated as the value of new business divided by the present value of new business premiums (PVNBP), and expressed as a percentage.
Present value of new business premiums (PVNBP) Present value of new regular premiums plus 100% of single premiums, calculated using assumptions consistent with those used to determine the value of new business.
Required capital The amount of assets, over and above the value placed on liabilities in respect of covered business, whose distribution to shareholders is restricted.
Risk-free rate (reference rate in CFO Forum terminology) In stable markets, including the period from 31 December 2006 to 30 June 2007, the risk-free rate is taken as the swap curve yield. In current markets, including the period from 1 July 2007, the risk-free rate is taken as swaps except for all contracts that contain features similar to immediate annuities and are backed by appropriate assets, including paid up group deferred annuities and all other contracts in the Netherlands, and deferred annuities and all other contracts in the US. The adjusted risk-free rate is taken as swaps plus the additional return available for products and where backing asset portfolios can be held to maturity.
Service companies Companies providing administration or fund management services to the covered business.
Solvency cover The excess of the regulatory value of total assets over total liabilities, divided by the regulatory value of the required minimum solvency margin.
Spread business Contracts where a significant source of shareholder profits is the taking of credit spread risk that is not passed on to policyholders. The most significant spread business in Aviva are immediate annuities and US deferred annuities and life business. Statutory basis The valuation basis and approach used for reporting financial statements to local regulators. Stochastic techniques Techniques that incorporate the potential future variability in assumptions.
Symmetric risks Risks that will cause shareholder profits to vary where the variation above and below the average are equal and opposite. Financial theory says that investors do not require compensation for non-market risks that are symmetrical as the risks can be diversified away by investors.
Time value and intrinsic value A financial option or guarantee has two elements of value, the time value and intrinsic value. The intrinsic value is the discounted value of the option or guarantee at expiry, assuming that future economic conditions follow best estimate assumptions. The time value is the additional value arising from uncertainty about future economic conditions.
Value of new business Is calculated using economic assumptions set at the start of each quarter and the same operating assumptions as those used to determine the embedded values at the end of the reporting period and is stated after the effect of any frictional costs. Unless otherwise stated, it is also quoted net of tax and minority interests.

359
Performance reviewCorporate responsibilityGovernanceShareholder informationFinancial statements IFRSFinancial statements MCEVOther information
Other inform
ation
Aviva plc Annual Report and Accounts 2010
Shareholder services
Shareholder profile The categories of shareholders and the range and size of shareholding as at 31 December 2010 are set out below: Analysis of shareholders Number of shareholders % Number of shares %
Individual 584,732 97.11 257,030,913 9.11 Banks and nominee companies 13,810 2.29 2,508,890,999 88.97 Pension fund managers and insurance companies 84 0.01 106,844 0.00 Other corporate bodies 3,542 0.59 54,119,886 1.92
Total 602,168 100 2,820,148,642 100 Range of shareholdings Number of shareholders % Number of shares %
1–1,000 548,877 91.66 151,469,464 5.37 1,001–5,000 47,710 7.52 89,477,091 3.17 5,001–10,000 2,933 0.41 20,374,662 0.72 10,001–250,000 1,997 0.30 90,938,140 3.23 250,001–500,000 188 0.03 68,921,413 2.45 500,001 and above 462 0.08 2,390,194,136 84.75 American Depositary Receipts (ADRs) 1 0.00 8,773,736+ 0.31
Total 602,168 100 2,820,148,642 100 +The number of registered ordinary shares represented by ADRs. Please note that each Aviva ADR represents two (2) ordinary Aviva shares.
2011 financial calendar
Annual General Meeting 4 May 2011Announcement of first quarter Interim Management Statement 17 May 2011Announcement of unaudited half-year results 4 August 2011 Announcement of third quarter Interim Management Statement 3 November 2011
Annual General Meeting The 2011 Aviva Annual General Meeting will be held at The Barbican Centre, Silk Street, London EC2Y 8DS, on Wednesday, 4 May 2011 at 11.00am. Details of all the resolutions to be considered at the meeting are given in the Notice of AGM, which is available on the Company’s website at www.aviva.com/agm. The voting results for the 2011 AGM, including proxy votes and votes withheld, will be accessible on the website at www.aviva.com/agm shortly after the meeting.
Dividends Dividends on Aviva ordinary shares are normally paid in May and November; please see the table below for dividend dates in respect of the financial year ended 31 December 2010. Dividends paid on Aviva preference shares are normally paid in March, June, September and December; please visit www.aviva.com/preferenceshares for the latest dividend payment dates. Holders of ordinary and preference shares receive any dividends payable in sterling and holders of ADRs will receive any dividends payable in US dollars.
Ordinary shares – 2010 final dividend dates
Ex-dividend date 23 March 2011 Record date 25 March 2011 Scrip dividend price setting period Scrip dividend price announcement date Last date for receipt of Scrip elections
23, 24, 25, 28, 29 March 2011 30 March 2011
15 April 2011 Dividend payment date* 17 May 2011 * Please note that the ADR local payment date will be approximately five business days after the proposed dividend
date for ordinary shares.
Ordinary shareholders – Have your dividends paid directly into your bank account Visit www.aviva.com/dividends for further details or contact Equiniti to obtain a form. If your holding is less than 1,500 shares, you can set up a mandate instruction over the telephone.
How to ask a question If you are unable to attend the meeting but would like to ask the Board of directors a question regarding the business of the meeting, please do so via our website at www.aviva.com/agm or send an email to [email protected]. Answers to the most frequently asked questions will be published on our website shortly after the meeting.

360
Aviva plc Annual Report and Accounts 2010
Shareholder services continued
Online Shareholder Services Centre – www.aviva.com/shareholderservices The online shareholder services centre has been designed to meet the specific needs of holders of Aviva ordinary shares, preference shares and ADRs, and includes features to allow you to manage your holding in Aviva easily and efficiently. Within the online centre you will be able to find current and historic ordinary share and ADR prices, share dealing information, news, updates and, when available, presentations from Aviva’s senior management. You will also be able to download an electronic copy of recent Company reports. There is also a range of frequently asked questions on holding ordinary shares, preference shares and ADRs in Aviva, which include practical and helpful information, including useful contact details.
Be on your guard – beware of fraudsters Shareholders are advised to be very wary of any unsolicited telephone calls or correspondence offering to buy shares at a discount, offering free financial advice or offers of free company reports. If you receive any unsolicited advice:
Make sure you get the correct name of the person and organization;
Check that they are properly authorised by the Financial Services Authority (FSA) before getting involved by visiting www.fsa.gov.uk/register/;
Report the matter to the FSA by calling 0845 606 1234 or visit www.fsa.gov.uk/pages/consumerinformation; and
If the calls persist, hang up. More detailed information on this can be found on the Consumer Financial Education Body website www.moneymadeclear.org.uk.
Contact details Ordinary and preference shares Aviva’s registrar is Equiniti. Any queries regarding Aviva shares can be directed to Equiniti by post, telephone or email. Please quote Aviva plc, together with the name and address in which the shares are held and the shareholder reference number, which you will find on your latest dividend stationery. Equiniti Aspect House Spencer Road Lancing West Sussex BN99 6DA
Email: [email protected] Telephone: 0871 384 2953* + 44 (0) 121 415 7046 (for callers outside of the UK)
Computershare Investor Services PLC will be replacing Equiniti as the Company’s registrar later this year. Further details, including full contact details, will be made available on www.aviva.com/shareholderservices nearer the time and incorporated into all future shareholders’ communications following the transition.
ADRs Aviva has a sponsored ADR facility administered by Citibank, NA. Any queries regarding Aviva ADRs can be directed to Citibank by post, telephone or email. Citibank Shareholder Services PO Box 43077 Providence, Rhode Island USA 02940-5000
Email: [email protected] Telephone: (00 1) 877 248 4237 (free phone for callers within the US) (00 1) 781 575 4555 (for callers outside the US non-free phone) Fax enquiries: (00 1) 201 324 3284
For further information about Aviva’s ADR programme, please go to www.citi.com/dr.
Form 20-F Aviva is a foreign private issuer in the United States of America and is subject to certain reporting requirements of the Securities Exchange Commission (SEC). Aviva files its Form 20-F with the SEC, copies of which can be found at www.aviva.com/reports.
Internet sites Aviva owns various internet sites, most of which interlink with each other: Aviva Group www.aviva.com UK long-term savings and general insurance www.aviva.co.uk Asset management www.avivainvestors.com Aviva worldwide internet sites www.aviva.com/websites
Other useful links for shareholders: Aviva shareholder services centre www.aviva.com/shareholderservices ADR holders www.aviva.com/adr Aviva preference shareholders www.aviva.com/preferenceshares Dividend information for ordinary shares www.aviva.com/dividends Annual General Meeting information www.aviva.com/agm Electronic voting for Annual General Meeting† www.aviva.com/agm Aviva share price www.aviva.com/shareprice Register for electronic communications www.aviva.com/ecomms * Calls to 0871 numbers are charged at 8 pence per minute from a BT landline. Charges from other telephone providers
may vary. Lines are open from 8.30am to 5.30pm, Monday to Friday. † This service will only be available until 11am on Thursday, 28 April 2011.
Aviva share price You can access the current share price of Aviva ordinary shares and ADRs at www.aviva.com/shareprice. If you would like to find out the price of Aviva preference shares, please visit the London Stock Exchange website at www.londonstockexchange.com.

Designed by sasdesign.co.uk
This document is printed on Revive Pure White Uncoated, which is a recycled grade containing 100% post consumer waste and manufactured at a mill accredited with ISO14001 environmental management standard. The pulp used in this product is bleached using an Elemental Chlorine Free process (ECF). This document was printed by Butler Tanner and Dennis who are FSC, and ISO14001 accredited.
ARA2010 03.11

Aviva plcSt Helen’s, 1 UndershaftLondon EC3P 3DQ +44 (0)20 7283 2000www.aviva.com
Registered in EnglandNumber 2468686