Rathbone Brothers Plc Report and accounts 2020
228
Facing the future responsibly Rathbone Brothers Plc Report and accounts 2020
-
Upload
khangminh22 -
Category
Documents
-
view
3 -
download
0
Transcript of Rathbone Brothers Plc Report and accounts 2020

Rathbone Brothers Plc Report and accounts 2020
Facing the future responsibly
Rathbone Brothers Plc Report and accounts 2020

Strategic report Business overview 1Our purpose 2Chairman’s statement 4Rathbones at a glance 6Our business model 8Stakeholder engagement (s172) 10Chief executive’s review 14Our investment case 17Our market and opportunities 18Our strategy 20Our strategy in action 22Key performance indicators (KPIs) 30Financial performance 33Segmental review 37Financial position 42Liquidity and cash flow 45Risk management and control 46Responsible business report 52
GovernanceCorporate governance report 76Group risk committee report 92Audit committee report 95Nomination committee report 100Remuneration committee report 103Directors’ report 127Statement of directors’ responsibilities in respect of the report and accounts
130
Financial statements Independent auditor’s report to the members of Rathbone Brothers Plc
132
Consolidated financial statements 142Notes to the consolidated financial statements
146
Company financial statements 203Notes to the company financial statements
206
Further informationFive-year record 223Corporate information 223Our offices 224
Rathbones provides individual investment and wealth management services for private clients, charities, trustees and professional partners. We have been trusted for generations to manage and preserve our clients’ wealth. Our tradition of investing and acting responsibly has been with us from the beginning and continues to drive us forward. Our ambition is to be recognised as the UK’s most responsible wealth manager.
Contents
About Rathbones
2020 financial highlights
For a full five-year record, please see page 223
* This measure is considered an alternative performance measure (APM). Please refer to pages 35-36 for more detail on APMs1. A reconciliation between underlying profit before tax and profit before tax is shown on page 352. Underlying profit after tax as a percentage of underlying quarterly average equity at each quarter end
Profit before tax
£43.8m(2019: £39.7m)
Underlying earnings per share* 1
133.3p(2019: 132.8p)
Underlying profit before tax* 1
£92.5m(2019: £88.7m)
Dividends paid and proposed per share
72.0p(2019: 70.0p)
Basic earnings per share
49.6p(2019: 50.3p)
Underlying return on capital employed (ROCE)*2
13.6%(2019: 14.2%)
Return on capital employed (ROCE)
5.3%(2019: 5.7%)

A responsible business
At Rathbones, we have a clear understanding of who we are as a business, supported by a strong ambition for our future. Our purpose represents our commitment as a business to all of our stakeholders and wider society, while our ambition provides our long-term goal for the future. Underpinning both of these is our strategy.
Our purpose is to think, act and invest responsiblyWe deliver on our purpose through our corporate values:
Responsible and entrepreneurialin creating value
Courageous and resilientin leading change
Collaborative and empatheticin dealing with people
Professional and high-performingin all our actions
Our ambition is to be recognised as the UK’s most responsible wealth managerWe are committed to growing and preserving wealth for our clients. Read more on page 17
Institutional-quality investmentswhole of market
Multi-generationalfor clients of today and tomorrow
Relationship-ledtailored and flexible
Partnershipworking together to deliver the best client outcomes
Enriching the client and adviser proposition and experience
Supporting and delivering growth
Inspiring our people
Operating more efficiently
Our purpose and ambition are achieved through a clear strategyRead more about our strategy on pages 22-29
rathbones.com 1

We are committed to investing for everyone’s tomorrow.Our commitment to lead in responsible wealth management stems from our purpose in society, founded on the values passed down from generation to generation. Thinking, acting and investing responsibly guides our actions and drives us to pursue our strategy with consistency and resilience, year after year. It also keeps us on course as we adapt and respond to the unprecedented crisis that the world is facing.
We have a fiduciary responsibility to our clients: investing for their long-term goals. This focus on the long-term enables us to create value for our clients whilst also making a positive contribution to society. And today, it is more than ever at the heart of our commitment to invest for everyone’s tomorrow. We believe that our actions add up to what we stand for. As an example of our commitment to the future, we have built a responsible business framework, which will enable us to deliver on our initiatives, including responsible investment agenda, diversity and inclusion, community investment and reducing our environmental impact.
Our purpose
2 Rathbone Brothers Plc Report and accounts 2020
Strategic report |

In 2020, we have taken a number of steps to ensure that, as a business, we are ready to face the future responsibly:
p.22
p.52
p.70
In year two of our strategy, we have continued to enhance our client proposition with significant advancement of our digital proposition.
We have developed a new responsible business framework, which will provide the blueprint for driving long-term, sustainable value for our broader stakeholders.
We have undertaken a robust review of our approach to climate-related financial risks and are proactively reporting against the Task Force on Climate-related Financial Disclosures (TCFD) framework.
p.59We have continued to focus on addressing our gender and ethnicity balance and embedding diversity and inclusion into our day-to-day working practices.
rathbones.com 3

Chairman’s statement
Chairman’s statement
A review of 20202020 was an extraordinary year. Initial optimism in financial markets was curtailed by the rapid advance of the COVID-19 pandemic and resulting lockdowns, which had a devastating impact on societies and economies worldwide. Financial markets crashed initially but then rallied following massive interventions by central banks and governments resulting in US markets hitting new highs with technology stocks driving the advance.
The response from Rathbones was speedy and effective. We established a crisis committee in early March which oversaw a seamless transition to remote working for the vast majority of our people and we provided ongoing support to them through high levels of engagement and a number of wellbeing initiatives. We also increased communication with our clients to ensure an enhanced service, including both support and advice. We were able to take advantage of our first-class strategic asset allocation and research capabilities to provide our investment managers with the best strategies and ideas for a hugely volatile market. As a result, our investment performance was strong across the group, which serves to reinforce the benefits of active investment management in turbulent times.
Our strong investment performance helped ensure that, notwithstanding the significant market volatility during the year, our funds under management and administration grew by 8.5% to £54.7 billion.
Profit before tax totalled £43.8 million (2019: £39.7 million) reflecting anticipated costs associated with the acquisition of Speirs & Jeffrey. Basic earnings per share decreased to 49.6p from 50.3p in 2019.
Underlying profit before tax totalled £92.5 million (2019: £88.7m), resulting in an underlying operating margin of 25.3% (2019: 25.5%). Underlying earnings per share in the period totalled 133.3p (2019: 132.8p).
In line with our generally progressive dividend policy and reflecting confidence in the outlook for the business and its strong capital position, the board is pleased to recommend a final dividend of 47p per share. This brings the total dividend for the year to 72p per share, 2.9% ahead of 2019.
Our purpose and cultureAs I mentioned in my statement last year, we completed a firm-wide exercise in 2019 to encapsulate the purpose of Rathbones. We concluded that our purpose is to think, act and invest responsibly. This has been embraced by our employees.
Rathbones has a distinctive client-centric, collaborative and entrepreneurial culture which represents a key strength. A strong culture is fundamental to our success over the long term and our board reporting includes increasingly sophisticated management information on this.
Environmental, social and governance (ESG)ESG continued to grow in importance as the global effects of the pandemic and climate change have become obvious, with a consequent impact on social inequalities. The pandemic has also accelerated interest among our clients in responsible investing. We have long been at the forefront in this area through Rathbone Greenbank Investments, which has been creating bespoke ethical,
It has been a huge pleasure and privilege to work with such high-calibre colleagues at Rathbones over the last 10 years, and I am tremendously proud of what the business has achieved during that time. There is strong momentum building in the business and I have the utmost confidence that we are well placed to go from strength to strength.
Mark NichollsChairman
4 Rathbone Brothers Plc Report and accounts 2020
Strategic report |

sustainable and impact portfolios for clients for over 20 years. We are now making good progress towards fully integrating ESG into our investment process across the group and are developing market-leading propositions through the specialist funds offered by Rathbone Unit Trust Management. Our ambition is to be recognised as the UK’s most responsible wealth manager.
We believe it is in our clients’ best interests to ensure that the companies in which we invest on their behalf adopt best practice in promoting a constructive ESG agenda. Our highly regarded stewardship team proactively engages with companies to discuss ESG issues.
Finally, the board is strongly committed to corporate governance and firmly believes that a robust governance framework is vital to the long-term success of the firm and the achievement of its strategy. We recognise that strong corporate governance is not just about complying with the UK Corporate Governance code – it is also about our firm’s culture, our behaviours and how we service our clients. Our corporate governance report can be found on pages 76-91.
StrategyAs we invest to grow the business organically by deepening our investment expertise, improving our client service and proposition, driving productivity and efficiency, and inspiring our people, we are doing so responsibly by ensuring that all strategic decisions are taken in the best interests of all our stakeholders. Our section 172 statement can be found on page 10.
The pandemic has not altered our strategy, rather it has helped to accelerate our plans in many areas. During the year we made good progress on digital infrastructure initiatives and the automation of client administration processes. In addition, we strengthened our specialist capabilities by growing our charities team and completing the acquisition of the Barclays Wealth Court of Protection business. Progressing our digital transformation agenda will be a key strategic focus in 2021.
Engaging with our people and shareholdersRathbones is fundamentally a people business. Our key priority during 2020 was to support the mental health and wellbeing of our people to ensure that they remained engaged. Our annual employee engagement survey had an overall engagement score of 91%, compared to 86% in 2019.
Last year, as our response to the workforce engagement initiative, Sarah Gentleman and Colin Clark were nominated to be responsible for gathering feedback from employees and they have continued their efforts this year with enthusiasm, meeting with a broad spectrum of employees and reporting back to the board on all aspects of their discussions.
Rathbones is an equal opportunities employer and it is our policy to ensure that all job applicants and employees are treated fairly and on merit. We continue to focus on addressing our gender and ethnicity balance, improving our insight and awareness in relation to diversity and inclusion, and reflecting this in our working practices.
Maintaining a transparent and constructive dialogue with our shareholders is a very important mechanism for providing useful feedback to the board. This year I have enjoyed discussions with shareholders on our strategy, dividend policy and governance
initiatives. The chair of our remuneration committee also undertook an extensive shareholder engagement programme to discuss the proposals for our new executive remuneration scheme which will be brought to shareholders for approval at our 2021 Annual General Meeting (AGM).
The board and successionAs I mentioned in my statement last year, I have served as a non-executive director for over 10 years and as chairman since May 2011. My tenure therefore exceeds the requirements outlined in the UK Corporate Governance Code. The board initiated a process during 2020 for the appointment of my successor. The search was successful, and Clive Bannister will succeed me as chairman at the conclusion of the 2021 AGM on 6 May, subject to shareholder and regulatory approval. Clive has had an extensive career in financial services and will bring a wealth of strategic, commercial and financial experience to the board.
Jim Pettigrew has also indicated that he will step down at the 2021 AGM. Jim has made a huge contribution to the board, both as non-executive director and senior independent director, and I am particularly grateful for his wise advice. As part of the board’s succession plans, I am pleased that Colin Clark has been appointed to succeed Jim as senior independent director, subject to regulatory approval.
In addition, as part of our review of board effectiveness and succession planning, we constantly monitor the breadth and depth of knowledge, industry experience and diversity within the board and assess what new skills are necessary to continue constructive challenge and guidance to the executive team. As a result, we have initiated a process to appoint an additional non-executive director in 2021.
Looking backRathbones has enjoyed a remarkably successful year, delivering a resilient financial performance and making good strategic progress in what has been a highly uncertain environment.
On behalf of the board I would like to thank the management team and staff for their dedication and support during the year. I would also like to thank our clients and shareholders for their ongoing commitment to Rathbones.
It has been a pleasure and privilege to work with such high-calibre colleagues at Rathbones over the last 10 years, and I am tremendously proud of what the business has achieved during that time.
Looking aheadThe outlook for 2021 is uncertain and we can expect continuing volatility. Although the ebbs and flows in the struggle to contain the pandemic are likely to be the dominant factor throughout the year, the global geopolitical landscape remains as uncertain as ever and the real implications of Brexit have yet to emerge. That said, Rathbones is well-positioned with a strong balance sheet and the right strategy in place. There is strong momentum building in the business and I have the utmost confidence that we are well-placed to go from strength to strength.
Mark NichollsChairman
3 March 2021rathbones.com 5

At a glance
Rathbone Global Opportunities Fund £3,202m
Rathbone Multi-asset PortfoliosRathbone Ethical Bond Fund £2,088m
£1,714mRathbone Income Fund £811m
Rathbone High Quality Bond Fund £283mRathbone Active Income and Growth Fund £227mRathbone Strategic Bond Fund £204mRathbone Core Investment Fund for Charities £129mRathbone Global Sustainability Fund £44mRathbone UK Opportunities Fund £49m
O�shore funds2 £578m
Other funds £492m
Total Funds
£9,820m
Investment Management client account type by value
Private clients 34.3%
CharitiesISA 19.1%
13.9%Pensions 11.9%Trusts 10.4%Other 10.4%
Size of Investment
Management relationship
value
0-£250k 6.7%
£500k-£750k£250k-£500k 11.1%
9.5%£750k-£1.5m 17.8%£1.5m-£5.0m 25.6%£5.0m-£10.0m 9.7%£10m+ 19.6%
Rathbones at a glance
Where we operate Key highlights
1. Includes Vision Independent Financial Planning2. Our Luxembourg-based feeder funds were converted to directly invested funds in preparation for the potential loss of Undertakings for the Collective Investment in Transferable
Securities (UCITS) status post Brexit
1,588employees
£54.7bnmanaged by us for our clients
FTSE 250company listed on the London Stock Exchange
15UK locations1 and Jersey
6 Rathbone Brothers Plc Report and accounts 2020
Strategic report |

What we do
1. All complementary services are reported as part of our Investment Management segment
Our purpose, which is to think, act and invest responsibly, is delivered through our corporate values – responsible and entrepreneurial in creating value, collaborative and empathetic in dealing with people, courageous and resilient in leading change, professional and high-performing in all our actions.
Investment managementThrough Rathbone Investment Management, we provide investment management solutions to a range of private clients, charities, trustees and professional partners. Clients of this service can expect a tailored investment strategy that meets individual objectives backed by an investment process that aims to provide risk-adjusted returns to meet clients’ needs today and in the future.
Within Investment Management, we have several specialist capabilities including:
Charities and not-for-profit organisationsWe manage £6.5 billion of non-profit funds and are the fourth-largest charity investment manager in the UK. The team is diverse, in both its expertise and experience, and aims to deliver suitably tailored investment portfolios to meet the specific needs of clients and trustees.
Rathbone Greenbank InvestmentsAs one of the pioneers in the field of ethically focused investments, we manage over £1.9 billion in ethical and socially responsible investment portfolios. The team is highly proactive, engaging directly with companies and government to improve business practices.
Personal injury and court of protectionOur specialist team works closely with deputies, trustees and families, seeking to provide a consistent and rigorous investment process sympathetic to individual circumstances.
Rathbone Investment Management InternationalBased in Jersey, we cater for the investment needs of individuals and families, charities and professional advisers who are looking for offshore investment management.
FundsRathbone Unit Trust Management is a UK active fund manager with £9.8 billion under management, providing a range of specialist and multi-asset funds that are designed to meet core investment needs in the retail client market. These funds are distributed primarily through financial advisers in the UK.
Our funds can also be accessed by international clients through our Rathbone Luxembourg Funds SICAV (Société d’Investissement à Capital Variable) which allows access to a similar range of actively managed funds.
Complementary services1
Rathbone Financial PlanningOur in-house financial planning team provides whole-of-market advice to clients. The planners work closely with investment managers to help clients create a bespoke financial plan. We have long-standing experience and can act on a one-off basis or as part of an ongoing service.
Unitised Portfolio ServiceUsing Rathbone Multi-Asset Portfolio funds, we offer clients with investible assets of £25,000 or more our model-based discretionary investment management service. This is designed for clients who do not require a fully bespoke investment solution, but still want access to an investment manager to ensure investment needs are selected and monitored to suit their individual circumstances.
Managed Portfolio ServiceA simple and straightforward execution-only investment service which gives clients with £15,000 or more the ability to access high-quality investments. The service is delivered via an adviser at a price that reflects the competitive nature of our sector, but to a standard that clients have come to expect from Rathbones.
Rathbone Select PortfolioAn attractive and cost-effective investment solution for clients with £15,000 or more to invest for at least three years. Providing access to the Rathbone Multi-Asset Portfolio funds on a self-select basis, this service is designed for clients who are comfortable choosing an investment strategy to meet their investment objectives and risk profile.
Banking and loan servicesWe offer loans to our existing clients secured against their investment portfolios and, in some cases, other assets. As a licensed deposit taker, we are also able to offer our clients a range of banking services including currency and payment services, and fixed interest term deposits.
We also provide services through these entities:
Rathbone Trust CompanyProvides UK trust and specialist legal, estate and tax advice to larger clients.
Vision Independent Financial PlanningAn independent IFA network providing financial advisory solutions to UK private clients. Acquired in 2015, it has grown from £845 million of assets on its discretionary fund management panel and 81 advisers to £2.2 billion and 131 independent financial advisers.
rathbones.com 7

Our business model
Our business model
What we do…
What makes us different…
How we do it…
We are a leading provider of individual investment and wealth management services for private clients, charities, trustees and professional partners. Our ambition is to be recognised as the UK’s most responsible wealth manager.
We have two main areas of operation as well as several complementary services:
Rathbone Investment Management — offers personal discretionary investment management solutions
Rathbone Unit Trust Management — provides single-strategy and multi-asset fund products
Complementary services including: — Financial planning — Unitised Portfolio Service — Managed Portfolio Service — Rathbone Select Portfolio — Banking and loan services — UK trust, legal, estate and tax advice — Vision Independent Financial Plannings
A sound investment case — Relevant investment solutions — Deep expertise — Owned infrastructure — Trusted relationships
Scale and expertise — An established and trusted brand with local presence — Individual relationships with clients and advisers — Our client digital portal, MyRathbones, and our mobile app will complement our face-to-face service
Independent ownership — Listed on the London Stock Exchange and a constituent of the FTSE 250
— High standards of corporate governance
Individual relationships with clients and advisers
Supported by in-house operations
Working flexibly with clients and advisers
An informed investment process
Read more about our investment case on page 17
Link to relevant investment solutions
Link to deep expertise
Link to owned infrastructure
Link to trusted relationships
8
Strategic report |
Rathbone Brothers Plc Report and accounts 2020

To create long-term value…
— We have dedicated in-house custody and settlement services
— Our operations team is highly experienced — We outsource selected services, where this is cost-effective, to reliable and carefully chosen partners
— Clients have the option to join Rathbones either directly or through their own financial intermediary
— Our dedicated intermediary sales team provide Rathbone Group services and products to UK and International financial advisers, including from full bespoke discretionary services to fund based solutions
— Direct client and adviser referrals remain the most important source of organic growth
— Our Vision Independent Financial Planning business operates independently but maintains a close relationship with Rathbone Investment Management
— Rathbone Financial Planning provides whole-of-market advice to clients, working closely with investment managers to create bespoke financial plans
— We have a bespoke approach to portfolio construction supported by a central research team
— Our firm-wide processes allow us to pool intellectual capital and provide strategic asset allocation methodologies
— We operate a range of specialist mandates, including specialist investment teams who provide services to charities, ethical investors and Court of Protection clients
— Our internal quality assurance and performance measurement capabilities provide a sound control framework
— Our service is delivered directly through investment managers who make portfolio decisions
— Our aim is to build lasting and trusted relationships — We access investments across the whole market, with no bias towards in-house funds, but have a suite of fund solutions through Rathbone Unit Trust Management for clients who do not require a fully bespoke investment service
— Our Jersey office can cater for offshore investment needs
— Our upgraded client digital portal, MyRathbones, will complement our face-to-face service
For investors — Leading operating margin compared to industry peers
— Successful acquisition capability of people and firms that fit our culture
Dividends per share in 2020
72p
For clients — Active management of portfolios through changing market conditions
— A valued and quality service that builds trust
— Specialist mandate capabilities — High-quality adviser services
Number of clients
61,000
For employees — Empowered to make individual investment decisions
— Performance-based remuneration — Investment in training, support and development
— Share ownership — Low staff turnover
Employee survey engagement score
91%
rathbones.com 9

Stakeholder engagement
Stakeholder engagement
Measuring our engagement
Client Experience (CX) survey 2020:
Section 172 statementOur board promotes the success of the firm for the benefit of our members as well as a broad range of stakeholders that we recognise are material to the long-term future of our business.
In doing so our board has regard (amongst other matters) to the:
— likely consequences of any decisions in the long term
— interests of our people — need to foster the company’s business relationships with suppliers, customers and other key stakeholders
— impact of the company’s operations on communities and the environment
— desirability of the company maintaining a reputation for high standards of business conduct
— need to act fairly as between members of the company.
We have detailed in the adjacent table how the board have ensured effective engagement with our key stakeholders during the year.
RathbonesBenchmark*
8.98.4
Overallsatisfaction
Overall satisfaction with �rm (0-10)
RathbonesBenchmark*
8.88.2
Teamsatisfaction
Overall satisfaction with wider team (0-10)
RathbonesBenchmark*
99%96%
Clientcentricity
Belief that �rm operates in the client’s best interests
ClientsLink to enriching the client and adviser proposition and experience strategic priority
Why they are important to our businessClients are the central focus of our business. The firm’s ongoing success is built upon an ability to understand clients’ needs and respond with bespoke solutions. This allows us to anticipate how these needs will evolve and to provide portfolios and services that meet their financial goals and build their future prosperity.
How the firm engagedWe engaged with our clients through a variety of channels including:
— regular meetings were held with investment managers and financial planners — implemented video technology to enable virtual engagement with clients — virtual conferences held for private clients, intermediaries and IFAs — external client surveys — regular CEO letter issued to clients to update them on the firm and the impact of COVID-19.
How the firm responded — Implemented even tighter monitoring of portfolio investment performance and processes to ensure it is executed within client risk appetites
— financial awareness courses for all generations held in person and virtually — development of new products and services to meet current and future client needs — assessed how the firm can improve client-service-based on net promoter scores from client surveys.
* Aon UK CX Syndicated Benchmark 2020
10 Rathbone Brothers Plc Report and accounts 2020
Strategic report |

2020 employee engagement survey:2019 2020
Employee response rate 77% 82%Overall engagement 86% 91%Communications between different locations and teams are effective 36% 60%There are right opportunities to learn and grow at work 67% 73%
Pulse survey: how our people are feeling during the pandemic
Why they are important to our businessThe board recognises that the firm’s culture and corporate values underpin the effective delivery of its strategy. Our people are central to the ongoing success of the firm and we are proud of our reputation as an employer of choice. Our people strategy aims to develop an agile workforce as we continue to attract, retain, develop and motivate the right people for our current and future business needs.
How the firm engagedWe engaged with our people through the following activities:
— annual employee opinion survey (further information can be found on page 90)
— regular check-in surveys to assess wellbeing of our people during COVID-19
— ongoing and regular virtual management briefings
— webcast, internal magazine and management blogs — virtual presentations by the executive team to discuss performance and the firm’s progress on the strategic plan
— workforce engagement sessions held with the NEDs.
How the firm responded — equipped our people to work from home during COVID-19, including the introduction of technology enabling employees to communicate virtually
— commitment to improve employee diversity — development of hybrid working approach — supporting employee wellbeing — formalised Rathbones mentoring programme — provided training and guidance to line managers on how to manage remote teams
— invested in virtual training and developing our employees.
Measuring our engagement
AprilJuneNovember
90%93%N/A*
I am able to work e�ectivelyduring this period
AprilJuneNovember
98%98%97%
I feel well communicatedwith by Rathbones’ (Exec)leadership during this period
AprilJuneNovember
95%93%92%
I am satis�ed with the e�ort my manager makes to keep in touch with me during this period
PeopleLink to inspiring our people strategic priority
* Not collated in November following the successful roll-out of IT kit.
rathbones.com 11

Stakeholder engagement continued
Number of investor meetings held in 2020:
822019: 90
Number of new investors in 2020*:
872019: 67
* Number of new investors includes both retail shareholders and institutional investors
Measuring our engagement
CDP score
B2019: B-
Measuring our engagement
Direct engagement with investee companies
2262019: 70
Total amount donated
£467,0002019: £360,000
ShareholdersLink to supporting and delivering growth strategic priority
Why they are important to our businessWe rely on the support and engagement of our shareholders to deliver our strategic objectives and grow the business. Our shareholder base supports the long-term approach we take in the management of our business.
How the firm engagedWe engaged with our shareholders through the following activities:
— executives held regular meetings with our investors throughout the year
— chairman undertook an annual engagement with investors on governance issues and dividend policy
— chairman of the remuneration committee engaged with investors on the review of the remuneration policy
— in light of COVID-19, the firm had its first hybrid model AGM via a webinar and ensured effective shareholder engagement
— we commissioned an independent investor perception study and the results were presented to the board.
How the firm responded — provided regular updates on company performance during COVID-19
— dividends were maintained and paid for the year — an update on the firm’s strategic plan was provided during the year
— took on-board investor feedback for the firm’s Remuneration Policy.
Society and communitiesLink to enriching the client and adviser proposition and experience, and inspiring our people strategic priorities
Why they are important to our businessWe recognise the responsibility we have to wider society and other key stakeholders. We believe that demanding high levels of corporate responsibility is the right thing to do.
How the firm engagedWe engaged with society and the communities in which we operate through the following activities:
— we encouraged high standards of governance as an investment manager. We frequently engaged with companies on environmental, societal, and corporate governance concerns and have been a signatory to the Principles for Responsible Investment (PRI) for over 10 years
— we are proud to support the communities in which we operate and have a long history of contributing through the Rathbone Brothers Foundation, corporate donations and employee volunteering. In 2020 we gave over £467,000 (2019: £360,000)
— we have reduced our total carbon emissions over the last three years, which has been recognised by our improved CDP (formerly Carbon Disclosure Project) rating.
How the firm responded — approved an updated responsible investment policy — reviewed employee volunteering days to allow colleagues to support their local communities, especially during COVID-19
— approved the firm’s donation to Mental Health UK and the Trussell Trust
— agreed to publish our first disclosure in line with the Task Force on Climate-related Financial Disclosures recommendations.
12 Rathbone Brothers Plc Report and accounts 2020
Strategic report |

Suppliers paid within 30 days
90%2019: 92%
Measuring our engagement
Response to regulators
All responses to regulators have been made in line with the agreed deadline
% of payments to suppliers made in agreed timeframe
63%2019: 65%
Our partners and regulatorsLink to operating more efficiently strategic priority
Why they are important to our businessWe seek to build positive relationships with our regulators. Regulators provide key oversight of how we run our business. Our clients’ best interests are served by our working constructively with regulators.
We recognise the importance of our various partners in delivering services to clients and ensure we have shared values.
How the firm engagedWe engaged with regulators and our partners through the following activities:
— we held regular meetings with our regulators during the year and continue to have a proactive and transparent relationship with them
— we ensured our payment terms with all suppliers were fair and in compliance with payment practices
— we assessed our key supplier for conformance to the Modern Slavery Act and conducted a risk assessment of our supply chain. Our modern slavery statement is reviewed and updated by the board annually
— we maintained ongoing relations with our key suppliers and partners during the year with regular board updates.
How the firm responded — worked in close collaboration with the firm’s regulators and respond on a timely basis
— had a constructive relationship with HMRC to help ensure alignment with the relevant regulatory frameworks
— initiated engagement with our supply chain on modern slavery
— we regularly interacted with the industry bodies and associations we are affiliated with to ensure we were engaged with issues impacting our industry.
Further links to:Clients:
Our business model 8-9Rathbones at a glance 6Chief executive’s review 14-16Our investment case 17Our market and opportunities 18-19Our strategy 20-23KPIs 30-32Risk management and control 46-51
People: Our business model 8-9Our strategy 20-21Inspiring our people 26-27Responsible business report 59-63Culture 88-89Workforce engagement 90-91
Shareholders: Our business model 8-9Chairman’s statement 4-5Chief executive’s review 14-16Our investment case 17Supporting and delivering growth 24-25KPIs 30-32Our market and opportunities 18-19Our strategy 20-21Financial performance 33-45
Society and communities: Our business model 8-9Operating more efficiently 28-29Responsible business report 64-66Our environmental impact 67-69Climate-related disclosures 70-74
Our partners and regulators: Operating more efficiently 28-29Risk management and control 46-51Responsible business report 64Climate-related disclosures 70-74
rathbones.com 13

Chief executive’s review
IntroductionExternal events are always part of what defines the success of any wealth management business, and 2020 saw more than its fair share. In responding to the combined impacts of market volatility, COVID-19 and Brexit, alongside some significant economic and political change, our focus throughout has been on delivering a high-quality client service, keeping our employees safe, and actively managing our operating margin. We have also taken many positive strides in delivering strategic change and further detail can be found on pages 20 to 29.
Continued growth in funds under management and administration (FUMA)Market volatility was reflected in most indices in 2020. The FTSE 100 Index ended the year at 6461, down 14.3% from the start of the year, while the MSCI PIMFA Private Investor Balanced Index was flat year-on-year. Our continuing growth and strong investment performance more than offset lower market levels, resulting in total FUMA of £54.7 billion at the end of the year (2019: £50.4 billion). Total net inflows across the group were £2.1 billion (2019: £0.6 billion), representing a growth rate of 4.2% (2019: 1.3%).
Investment Management FUMA grew by 4.4% to £44.9 billion (2019: £43.0 billion). Gross organic inflows in Investment Management were £3.3 billion, consistent with the prior year, and a steady performance considering the prominence of face-to-face sales in our business model.
Outflows in Investment Management totalled £3.3 billion in 2020 (2019: £3.9 billion), reflecting better retention, but somewhat offset by continuing client demand for liquidity and the impact of planned repricing. Outflows from closed accounts as a percentage of opening FUMA reduced from 4.7% in 2019 to 3.0% in 2020. Approximately 18% of outflows during 2020 related to lower-margin or short-term cash mandate business compared to 15% in 2019.
Our funds business had a very successful year with funds under management (FUM) reaching £9.8 billion at 31 December 2020 (2019: £7.4 billion). Net inflows totalled £1,498 million (2019: £943 million), representing 20.1% of opening FUM (2019: 16.7%). Rathbones was ranked in ninth position for overall net retail unit trust sales in the UK in both 2020 and 2019 (source: Pridham Report), maintaining its top 10 position for seven consecutive quarters. Our funds business comprises core single-strategy funds and multi-asset funds that provide a comprehensive suite of wealth solutions for financial advisers and their clients. Our multi-asset funds also underpin our offering for clients with smaller values to invest. Single-strategy funds grew 28.6% to £8.1 billion in 2020 (2019: £6.3 billion) while our multi-asset funds grew by 54.5% to £1.7 billion (2019: £1.1 billion).
Rathbone funds received several accolades during the year. These included being named best investment fund provider at the Investment Life & Pensions Moneyfacts awards; our Ethical Bond Fund was awarded Best Sustainable & ESG Bond Fund in the Investment Week Sustainable and ESG Investment Awards; our Strategic Growth Fund received the City of London Wealth Management award for Best Fund 2020, and our Global Sustainability Fund won the Best ESG Investment Fund – Wealth Manager at the ESG Investing Awards 2021.
Rathbones has had a successful year, despite the many challenges, which is testament to our brand strength, the quality of our client relationships, our people and the robustness and agility of our business model.
Paul StocktonChief Executive
Chief executive’s review
14 Rathbone Brothers Plc Report and accounts 2020
Strategic report |

A resilient financial performanceOperating income across the group totalled £366.1 million in 2020, 5.2% ahead of the prior year (2019: £348.1 million). Fee income growth reflected market movements as well as planned post acquisition repricing of ex Speirs & Jeffrey clients. Strong commission income was driven by market volatility, particularly during the first half of the year. This was partly offset by a reduction in net interest income as a result of Bank of England base rate reductions made in March 2020. Fees from advisory and other services were £21.1 million in 2020, up 3.4% on the prior year (2019: £20.4 million) despite lower market levels.
Underlying profit before tax of £92.5 million at 31 December 2020 was 4.3% ahead of the £88.7 million reported a year ago despite Financial Services Compensation Scheme (FSCS) levies increasing to £6.3 million (2019: £4.5 million). The full year cost for 2021 is currently expected to be in line with 2020. We continue to lobby alongside industry groups to find a more equitable way of managing this cost, which now represents 6.8% of underlying profit before tax (2019: 5.1%). Cost synergies relating to Speirs & Jeffrey amounted to £5.0 million in 2020, ahead of our target of £4.5 million. Our underlying operating margin was consistent with the prior year at 25.3% (2019: 25.5%). Underlying profit after tax was £71.6 million (2019: £71.1 million), which results in an underlying earnings per share of 133.3p (2019: 132.8p).
Profit before tax of £43.8 million (2019: £39.7 million) reflects a number of expected items, primarily in relation to the acquisition of Speirs & Jeffrey (S&J). S&J acquisition costs totalled £34.3 million (2019: £30.8 million) comprising of £32.3 million in relation to the first tranche of deferred consideration payments to the former shareholders of the business (treated as remuneration, given their continuing employment), and integration costs of £2.0 million. Basic earnings per share totalled 49.6p (2019: 50.3p).
Enhancing our investment proposition and servicesOne of the positives of remote working has been that it has provided more opportunity for digital client engagement. This has not only been through more screen-based contact with clients, but also by us taking advantage of the chance to distribute market commentaries and other marketing materials to a much wider client and adviser audience. Consistent historical investment in our research capability has translated into improved quality of output and enhanced coverage of overseas stocks. Investment performance was strong in the year with the Global Investment Performance Standards (GIPS) accredited performance as an average return of all risk levels combined, outperforming both the PIMFA and ARC indices over one, three and five years. Performance in our funds business across both single-strategy and multi-asset funds was also strong.
The quality of our core discretionary service continues to be recognised by our clients. In a recent Aon UK client experience survey, Rathbones was ranked number one for overall client satisfaction, including a number one ranking in 10 of the 14 survey KPIs, and achieved a net promoter score of 60% compared to a benchmark score of 38%. Rathbones was also named Private Client Asset Manager of the Year at the 2020 Citywealth Magic Circle Awards. Our scores as measured by Defaqto in the 2020 discretionary fund management (DFM) satisfaction study (based
on feedback from adviser firms) showed strong improvements, but also recognised the need to improve our digital client lifecycle capability.
To that end, we launched our new web portal, known as ‘MyRathbones’ in December to a small number of clients. The portal provides clients with more holistic communication and online access options and will be rolled out fully towards the end of the first quarter of 2021, adding a version for advisers and a mobile app. ‘MyRathbones’ is the digital doorway into Rathbones, complementing the investment manager – client relationship and providing clients with a straightforward, flexible and safe experience for everyday tasks. We are adopting an agile approach for future enhancements with many planned for the remainder of 2021.
Rathbone Select Portfolio (RSP) was launched in the fourth quarter of 2020. RSP is a cost-effective execution-only investment management solution in circumstances where a bespoke discretionary service may not be appropriate. Clients can choose an appropriate risk-rated investment strategy, with each strategy delivered through a single Rathbone Multi-Asset Portfolio fund. RSP adds to our range of solutions for smaller value portfolios and will improve investment manager capacity as it is rolled out more widely in 2021.
During June 2020, we added two new funds to our Rathbone Multi-Asset Portfolio range, the Rathbone Multi-Asset Defensive Growth Portfolio and the Rathbone Multi-Asset Dynamic Growth Portfolio, providing advisers with cost-effective access to target return profiles across the risk spectrum.
Investing for growth and productivityOur strategy includes a multi-pronged approach to delivering growth by adding investment manager capacity, investing in business development and specialist markets, driving sales to the adviser market and growing our financial planning capability.
In 2020 we welcomed 23 new investment professionals to Rathbones from a number of competitor firms (2019: 18), and all have settled in well. We are targeting a similar level of recruitment during 2021 to support growth, alongside an ongoing graduate recruitment and training programme. In 2020 we realigned remuneration for investment teams to have a much clearer line of sight to organic growth, recognising that other elements of awards encourage high service standards and client retention. We have also restructured how our Investment Management business is organised at a senior level with the creation of two dedicated managing director roles focussing firstly on growth and client service delivery, and secondly the development of our investment process and responsible business agenda.
Our intermediated distribution team, which oversees the provision of a new, integrated ‘adviser as adviser’ proposition to IFA firms, has been successful in building new relationships, onboarding a total of 58 new adviser firms during the year and bringing the total to 82 since launch in July 2019. At 31 December 2020 the amount of FUMA linked to an adviser was £9.9 billion (31 December 2019: £9.2 billion).
Another part of our growth strategy is serving specialised markets. We successfully completed the acquisition of a specialist team and £440 million of client assets in the Court
rathbones.com 15

of Protection sector from Barclays Wealth, increasing our assets to around £1.0 billion and making Rathbones the leading discretionary investment management firm in this area. Charity FUMA at 31 December 2020 reached £6.5 billion (2019: £6.1 billion) including the addition of several substantial mandates in the first half of 2020. Rathbones was named as Charity Investment Manager of the Year at the Citywealth Magic Circle Awards (Gold award) in November.
Our specialist ethical, sustainable and impact research team Rathbone Greenbank Investments (Greenbank) had £1.9 billion of funds under management at 31 December 2020 (2019: £1.6 billion) while our award-winning Ethical Bond Fund continues to deliver strong investment performance, growing by 40% to reach £2.1 billion at 31 December 2020 (2019: £1.5 billion). We have begun to leverage the expertise and experience of Greenbank more widely into our overall investment process, setting investment selection criteria, demonstrating active stewardship and building training and awareness.
Rathbone Funds plans to launch Rathbone Greenbank Multi-Asset Portfolios (RGMAPs) towards the end of the first quarter of 2021. The RGMAPS funds will be a range of four new risk-rated, risk-targeted, sustainable investment funds managed by Rathbones’ acclaimed multi-asset team and supported by Greenbank. This proposition will underpin Rathbones’ continued leadership in the fast-growing private client responsible investment market and presents an opportunity to add wider choice to our Rathbone Select Portfolio proposition.
Building our advice offeringFinancial advice is an increasingly important part of our wealth proposition and we access the advice market in three ways: firstly, by providing discretionary fund management services to approximately 12,000 IFAs and their clients; secondly, an independent IFA network, Vision Independent Financial Planning (Vision) and; thirdly, via our in-house planning capability, Rathbone Financial Planning (RFP), that works alongside our investment teams. Through the combination of Vision and RFP we provide clients with access to 167 financial planners and paraplanners (2019: 165) working with investment teams across the country and advising on £3.6 billion of client funds (2019: £3.2 billion).
Speirs & JeffreyThe acquisition of Speirs & Jeffrey has added considerable skills and capabilities to Rathbones as well as creating a leading market presence in Scotland. Clients have welcomed access to the full array of our services and deeper research capability. The majority of clients were transferred to our discretionary fee-only tariff on 1 October 2020 which substantially completed the alignment with the wider Rathbones group.
Deferred consideration to the vendors of Speirs & Jeffrey, as well as related incentivisation awards to other staff, is dependent on operational and financial targets being met by 31 December 2020 and 31 December 2021. The amount of qualifying funds under management for the year ended 31 December 2020 was £5.1 billion, exceeding the earn-out threshold of £4.5 billion. Under the terms of the sale and purchase agreement, this will result in the crystallisation of the first tranche of deferred consideration,
payable in March 2021. This amount will be satisfied through the issuance of 881,737 new shares and using 421,722 existing owned shares.
Based on our current estimate, we expect that the P&L charge for the second tranche of deferred consideration and related incentivisation awards for the year ending 31 December 2021 will amount to £9 million. This will continue to depend on market conditions during 2021 as well as the further client conversion to qualifying funds under management.
At the time of the acquisition in 2018, we outlined the following financial targets for 2021: expected underlying EPS accretion from the acquisition of at least 8%, and an underlying return on investment of approximately 13%. Despite more challenging markets, as at 31 December 2020 we are on track to exceed both targets.
Inspiring our peopleOur priority during the year was to ensure the safety and wellbeing of our people. During 2020 we have focused on employee engagement, offering multiple forums for our staff to interact together and share any concerns they have.
Worldwide events during 2020 highlighted the critical importance of addressing social imbalances. Our policy is to ensure that all employees and prospective employees are provided with equal opportunities. In 2020 we changed HR practices and offered some welcomed events and forums where diversity and inclusion issues could be explored. Further detail on our people-related initiatives can be found in our responsible business report on pages 52-74.
Risk managementThe COVID-19 pandemic increased our risk exposure in several areas, most notably our staff, our operations and the ability to service our clients. We have been agile in the management and mitigation of these risks.
We continued to focus on the management of potential cyber threats, cognisant of the increased frequency of cyber-attacks on our industry. We continue to invest in this area.
While a degree of uncertainty remains around a deal on financial services between the UK and the EU, there has not been a significant impact on our business model to date. More detail can be found in our risk management report on pages 46-51.
OutlookRathbones has had a successful year, despite the many challenges, which is testament to our brand strength, the quality of our client relationships, our people and the robustness and agility of our business model. Whilst we expect investment markets to remain volatile, our balance sheet is robust with a strong capital position. Our near-term focus is to continue executing our growth strategy to build our market share, through ongoing investment in the business with strict cost discipline, to emerge stronger after the challenges of the pandemic begin to subside.
Paul StocktonChief Executive
3 March 2021
Chief executive’s review continued
16 Rathbone Brothers Plc Report and accounts 2020
Strategic report |

These allow us to deliver consistent returns to shareholders
— A generally progressive dividend policy — An underlying return on capital employed of 13.6% (2019: 14.2%)
— A commitment to high standards of corporate governance, stewardship and transparency
Relevant investment solutions
Range of investment, financial planning and advisory solutionsSuitable for private clients, charities, trustees and professional partners
Strong ESG capabilitySupported by an experienced team, proactive on ethical and sustainability issues
Growing funds businessProviding a wide range of funds catering to differing investment needs
Deep expertise
Quality peopleProviding a diverse range of experience and skills
Deep investment skillsSupported by a highly experienced in-house research team
Owned infrastructure
Leading brandEstablished over decades of providing quality service
Acquisition experienceProven by several successful integrations of full entities and individual teams
Trusted relationships
An extensive client networkCreating connections lasting generations
Our investment case
Dividend per share
72p
70
66
61
57
72
2018 20192016 2017 2020
Relevant investment
solutionsexperti
se
Deep
Tru
sted
rela
tio
nships
infrastructure
Ow
ned
rathbones.com 17

Our market and opportunities
Our market and opportunities
The UK wealth management industry continues to evolve and grow, with sector assets reaching an estimated £1.6 trillion by the end of 2019. The case for independent wealth managers providing advice and reassurance through a range of independent solutions continues to be compelling. Capitalising on the market opportunity to work flexibly with clients and advisers requires continuous investment in technology, product proposition and professional talent. Scale and efficiencies will be important in this environment and Rathbones is well positioned.
Rathbones’ target market is large and continues to grow Industry trends
Total size of UK wealth management
c. £1.6tn
35%23%25%15%
2%
Financial advisers and networksIndependent wealth managersPrivate banks and global wealth managersDirect-to-consumer and robo adviceHigh-street banks
13.7%of the independent wealth management market
3.2%of the UK wealth management market
Rathbones accounts for approximately:
Client needs and expectations are changing
Technology is advancing rapidly
Inter-generational wealth transfer is set to accelerate
Industry consolidation is set to continue
Sources: FCA, Platforum, PIMFA, PAM Directory, Oliver Wyman estimates
18 Rathbone Brothers Plc Report and accounts 2020
Strategic report |

What this means for the industry How Rathbones will respond
Clients will remain focused on value for money, demanding transparency and digital service propositions. Social and environmental issues will be more important than ever before. An ageing UK population with increased life expectancy, and a greater responsibility to manage their own pension assets following the ‘pension freedoms’ legislation and declining state support, increases the need to save for retirement and finance lifestyles over a longer period of time.
Clients are becoming more and more accustomed to using technology to communicate and manage their financial affairs, particularly following the COVID-19 pandemic.
Keeping pace with this change is fundamental to remaining competitive and sustaining a quality service.
It is estimated that in the UK more than £300 billion will be transferred from baby boomers to younger generations over the next 10 years, and inheritors may have different investment and service expectations than donors.
The market is highly fragmented with several different business models. Many businesses that lack scale are unable to keep up with the pace and cost of regulatory and technological change. This will continue to drive consolidation within the industry.
— Ensure a quality service and strong client outcomes with competitive and clear fee-based pricing
— Provide a suite of managed propositions to the adviser market
— Growing the financial planning capability — Provide a wide range of services that caters to differing investment requirements, including broadening our existing ESG proposition
— Enhance the digital client experience and provide seamless multi-channel communication to clients
— Upgrade client relationship management tools and risk management processes
— Invest in systems that will reduce time spent on administrative tasks
— Enhance the use of data to reduce costs, improve productivity and enable continual reinvestment
— Engage with clients on inter-generational wealth planning to ensure that wealth passes to the next generation in a tax-efficient manner
— Build relationships with the next generation of clients using relevant technology to facilitate future retention of investment portfolios
— Ensure that our service and product proposition, particularly our ESG proposition, remains relevant for the clients of tomorrow
— Support business development activity to improve organic growth with direct clients, intermediaries and advisers
— Continue to look for inorganic growth opportunities that fit our culture but maintain strict acquisition criteria
— Continue to selectively recruit individuals and teams to the business
rathbones.com 19

Our strategy
We launched our medium-term strategy for the business in October 2019, to support our purpose of thinking, acting and investing responsibly.
Our strategy, as well as our strategic priorities and the impact that COVID-19 has had on our progress, is set out here. The pandemic has neither altered our strategy nor had a materially negative impact on it. In many cases, it has accelerated our plans. We believe we are emerging stronger from the pandemic.
Enhancing valued servicesEnhancing the experience for private clients and providing a dedicated service for financial advisers.
Deepening investment skillsFostering our investment expertise, broadening capability and coverage, and investing responsibly.
Penetrating specialist marketsFocusing on specialisms, building on existing capabilities and leveraging Rathbone Greenbank Investments.
Driving organic growthManaging client-facing capacity, structuring distribution, driving growth through financial planning and building our funds business.
Our culture and corporate valuesBecoming a more diverse and inclusive organisation, continuing to listen to our people and improving our commitments to them.
Driving productivityProviding a quality client experience and making us easy to do business with.
Enriching the client and adviser proposition and experience
Supporting and delivering growth
Inspiring our people
Operating more efficiently
Our strategy
Our strategic priorities How we plan to achieve these
Read more on page 22
Read more on page 25
Read more on page 26
Read more on page 29
20 Rathbone Brothers Plc Report and accounts 2020
Strategic report |

KPI
KPI
KPI
KPI
Risk
Risk
Risk
Risk
— Total funds under management and administration
— Investment Management net organic growth rates
— Underlying operating margin — Underlying earnings per share — Return on capital employed
— Percentage of shares held by current employees
— Staff turnover — Variable staff costs as a % of underlying profit before tax and before variable staff costs
— Underlying operating margin — Return on capital employed — Common Equity Tier 1 ratio — Headcount
— Number of investment managers and Investment Management clients
— Staff turnover
— Suitability and advice — Business model — Regulatory — Change
— People — Change
— Information security and cyber — People — Change
— Suitability and advice — Business model — Regulatory — People
Read more on our KPIs and risks on pages 30-32 and 46-51
We are developing content and tailoring the delivery of our services for both the direct-to-client and direct-to-financial-adviser markets to ensure we serve all client segments appropriately. We continue to develop our investment culture and are investing to broaden our capability and coverage to drive positive client outcomes. Our investment process is supported by our focus on environmental, social and governance issues.
— Increased communication and support to clients to provide reassurance through COVID-related market volatility
— Initial delay in virtual recruitment and onboarding of investment managers
— An enhanced focus on our ESG proposition with heightened public awareness of social and environmental issues
— Prioritising the safety and wellbeing of our people working remotely
— Flexible working to become a permanent feature of our future employee proposition
— Renewed focus on building a more diverse and inclusive organisation
— Virtual training and development initiatives
— Virtual engagement with clients and advisers will continue alongside face-to-face interaction, providing a boost in productivity
— Adapting IT infrastructure for remote working
— Acceleration in the streamlining of client onboarding and administration
— Limited impact on growing in specialist markets as our charities business continued to grow and the Barclays Wealth Court of Protection assets were successfully migrated
— Business development and RFP teams continue to support the growth of the wider business
— Funds business continues to grow exponentially
Leveraging the use of technology to streamline processes and manage change is a significant opportunity, and embedding a productivity culture is an important part of our future success. Productivity will support growth, boost employee morale and create the time and resources to invest in future growth initiatives. We will also embrace digital to work alongside our face-to-face service, offering a broader set of communication options for clients and advisers.
We are a people business so it is imperative that our strategy sets a culture that drives performance and builds long, rewarding careers for our colleagues. Against a common set of corporate values and a commitment to diversity and inclusion, we plan to leverage the talent in our business as we develop more career paths, build leadership skills and manage succession.
We are investing to improve our organic growth rate. To do this, we are building up skills and resources to access specialist markets including charities, Rathbone Greenbank Investments and Court of Protection. We are also freeing up capacity in our investment teams, adding structure to our business development activity and supporting the ongoing growth of our Rathbone Funds and Rathbone Financial Planning businesses.
COVID-19 impact Link to KPIs and risks
rathbones.com 21

Our strategy is to enrich our client and adviser proposition and experience, harnessing greater use of technology to sit alongside our face-to-face contact. The COVID-19 pandemic not only vindicated the merits of this approach, but it also accelerated our plans, providing a strong foundation for further use of digital tools and process improvement.
Client communication and digitalEngagement and communication through digital channels increased significantly during the year and both clients and advisers have adapted well to this approach. We increased the frequency of market updates, investment thought leadership articles and other educational materials, often accompanied by relevant digital materials. We also made use of virtual marketing and networking events to help raise our profile amongst potential new clients. This approach has been successful and particularly well received by both clients and advisers. Feedback from clients on our level of engagement and quality of service during the year has been positive. In a recent Aon UK client experience survey, Rathbones was ranked number 1 for overall client satisfaction.
Investment skillsA core part of our strategy to deepen our investment skills involves recruiting additional investment managers to support our growth ambitions. Despite some initial delays in our plans as a result of the pandemic, we have made good progress in the recruitment of investment professionals during the year, with 23 individuals joining us in 2020. We are targeting a similar level of recruitment during 2021.
ESG propositionWe already have long-established ESG credentials, and we continue to invest in this area to support the growing demand for ESG investment propositions; for example, we are working to embed a common approach to ESG investing that complements the specialist offerings delivered by Rathbone Greenbank Investments and our funds business. The launch of the Rathbone Greenbank Multi-Asset Portfolio funds in 2021 will give us a strong position in the responsible investment market, which has significant growth potential.
Rathbones Select Portfolio serviceDuring the third quarter of 2020 we piloted a new investment proposition for existing clients known as Rathbones Select Portfolio (RSP). RSP is an execution-only solution for clients where a bespoke discretionary service may not be appropriate. RSP allows clients to self-select from six investment strategies, with each strategy delivered through a single Rathbone Multi-Asset Portfolio fund. We initiated a soft launch of our RSP solution to prospective clients during the fourth quarter and will begin actively marketing the solution during 2021.
Our strategy in action
Enriching the client and adviser proposition and experience
22
Strategic report |

MyRathbonesIn 2020 we focused on projects that improve the client experience and client reporting, enhance and automate our investment risk monitoring and improve our digital capability, including the quality and integration of data across different systems.
The upgrade to our client and adviser web portal, known as MyRathbones, is progressing well. This is the first stage of a programme of digital enhancements to our client proposition and is designed to augment our existing services. MyRathbones will provide clients with multi-channel communication options and online access to their investment portfolios, from a range of devices, and will be protected by industry-standard online security. MyRathbones was piloted with a select group of clients and staff during December, with a full roll-out planned for the first quarter of 2021, including a version for advisers as well as a mobile app. We will continue to develop the platform during 2021 by adding additional features and enhancing its capabilities, based on client and adviser feedback.
23

Strong growth momentum in Rathbone Funds and Rathbone Greenbank InvestmentsRathbone Funds delivered an outstanding performance in 2020, with substantial new business growth and strong investment performance helping funds under management reach a record high of £9.8 billion at 31 December 2020. Rathbone Funds has an attractive and market-leading proposition, providing a comprehensive suite of solutions for financial advisers and their clients with access to both single-strategy and multi-asset funds. During June 2020, we added two new funds to our Rathbone Multi-Asset Portfolio (RMAP) range: the Rathbone Multi-Asset Defensive Growth Portfolio and the Rathbone Multi-Asset Dynamic Growth Portfolio, which complement the existing range of multi-asset portfolio funds.
Rathbone Greenbank Investments (Greenbank) was an early adopter of ESG investing and has been creating bespoke ethical, sustainable and impact portfolios for clients for over 20 years. Fundamental to Greenbank’s approach is the belief that those companies providing positive solutions for a changing world, while also demonstrating strong social and environmental management and good corporate governance, are likely to be sound long-term investments.
Rathbone Funds has announced its intention to launch the Rathbone Greenbank Multi-Asset Portfolios (RGMAPs). These will be a range of four new risk-rated, risk-targeted, sustainable investment funds which will be managed by Rathbones’ acclaimed multi-asset team and supported by Greenbank.
Our strategy in action continued
24
Strategic report |

Supporting and delivering growthThis year, we have built up skills and resources to grow in our specialist markets such as charities, court of protection and specialist ethical, sustainable and impact investing. We also continue to invest in our business development capability that creates and supports new business opportunities across the wider business. Our in-house financial planning capability, known as Rathbone Financial Planning, alongside our independent financial planning network, Vision, are important to our growth ambitions and we will continue to broaden our advice capabilities.
Embedding a growth cultureOur dedicated business development team plays an important role in supporting new business growth initiatives across the organisation, fostering closer collaboration in delivering service to clients and promoting a strong growth culture. During the year the team rolled out a growth initiative known as ‘Blueprint for growth’ which trained investment managers to set achievable growth targets and build trusted relationships by offering the benefits of the totality of our services for clients. Nearly 300 investment professionals completed the training during the year. A follow-up to the ‘Blueprint for growth’ initiative was ‘Roadshow for growth’, which involved a number of virtual sessions held across the business to discuss growth techniques and ideas. In addition, during 2020 we have realigned the way in which our investment teams are remunerated with a much clearer link to organic growth.
Growing our advice capabilityOur strategy continues to place considerable importance on the financial advice market, as the demand and need for advice in the UK continues to increase. Rathbone Financial Planning (RFP) continues to support existing relationships between investment managers and their clients and to forge new client relationships via external partners, delivering advice on a one-off or ongoing basis to clients with more complex needs. RFP advisers complement and support our discretionary investment services to meet client needs where appropriate. We also operate an independent IFA network known as Vision Independent Financial Planning. The combination of Vision and RFP represents a strong advice proposition for clients, providing them with access to 167 financial planners and paraplanners advising on over £3.6 billion of client funds.
Specialist marketsRathbones is the fourth largest charity manager in the UK and we have ambitions to improve our ranking further. We formed a new charities team in Scotland during the year who were successful in securing large mandate wins under difficult circumstances. In April, following the acquisition of the Barclays Wealth Court of Protection and Personal Injury business, we successfully migrated all related client assets and welcomed 10 new colleagues to the firm. Following the acquisition, Rathbones is now the leading discretionary investment management firm in the Court of Protection and Personal Injury sector with total assets under management of approximately £1 billion. This sector has significant growth potential.
Integrated approach to IFA relationshipsWe have developed an integrated proposition for building IFA relationships that distinguishes between an ‘adviser as adviser’ and ‘adviser as introducer’ relationship. ‘Adviser as introducer’ is a more traditional model with the Rathbones investment manager determining an appropriate investment strategy for a client introduced by an adviser. With the ‘adviser as adviser’ approach the adviser determines the investment mandate best suited to meet the client’s objectives while our role is to understand the mandate and select the most suitable assets to achieve this. This new integrated approach has proven to be very successful with a total of 58 new adviser firms onboarded during the year, with 82 firms onboarded since the launch in July 2019.
25

Our strategy in action continued
Rathbones is a people business and our talented workforce is critical to delivering our strategy and ensuring that we are successful over the longer term. Many people have faced a tremendously challenging year in 2020. Our key priority was to ensure the safety and wellbeing of our employees, as well as supporting their ability to work remotely so that they remained engaged, productive and able to continue delivering excellent service to clients.
Wellbeing of our peopleAddressing the mental and physical wellbeing of our people has been a key priority throughout the year, recognising that many employees were faced with numerous challenges and additional pressures while working from home. Our existing wellbeing programmes were reviewed, and additional features and flexibility were added to help address these new challenges. A number of mental health webinars have also taken place during the year. We prioritised investment in IT solutions and infrastructure, such as desks, chairs and screens, to facilitate home working. In the absence of face-to-face social events, regular virtual events for all employees were also held to boost social wellbeing. Virtual exercise classes also took place regularly to help improve physical wellbeing.
Engaging and supporting our peopleThroughout 2020 the level of engagement with our people increased significantly as they took on the challenge of rapidly adapting to a new way of working. Regular pulse surveys, employee townhalls and a continuation of the board’s workforce engagement programme provided a forum for employees to share any concerns, and allowed the business to address those concerns and provide appropriate support. In addition, the board and executive management team shared frequent video updates on the progress of our strategy to help maintain morale.
Investing in our peopleRathbones is committed to developing a pipeline of high-calibre talent to ensure an appropriate balance of skills within the organisation and to aid succession planning. During the year we continued to actively prioritise the development of our people, first by understanding what skills were needed throughout the business, and then by building and delivering high-quality learning and development programmes, many of which were online. For senior employees, a suite of management and leadership courses remained available. Our mentoring and apprenticeship programme continued to run successfully, and 2020 was the third year of our graduate development programme.
Inspiring our people
26
Strategic report |

Diversity and inclusionRathbones is an equal opportunities employer and it is our policy to ensure that all job applicants and employees are treated fairly and on merit, and that we provide opportunities to build a successful career, regardless of age, ethnicity, gender, religion, disability or sexual orientation. Events across the globe during 2020 have highlighted the importance of addressing imbalances. To date we have performed equal pay audits, improved our parental leave policies, held employee focus groups and made external commitments, for example, we are signatories to the Women in Finance Charter, committing to achieve 25% female senior management representation by 2023.
During the year we launched the Rathbones diversity and inclusion (D&I) taskforce, while the Rathbones Included network continues to consider the challenges we face and suggest ways in which to address these challenges. During the year we focused on the following areas:
— addressing our gender and race & ethnicity imbalance
— improving our D&I insight — building D&I into our working practices — improving D&I awareness.
Further details of our people and D&I initiatives can be found in our responsible business report on pages 59-63.
27

Efficiency gains from remote workingExamples include:
— client onboarding documents converted to editable PDFs with a new email encryption system
— compliant client attestation replacing wet signatures and electronic identity verification for AML procedures
— enhanced client data security — local printing hubs established for client mailings ensuring quality and data security
— an exceptions approval home printing process for data security
— deployment of c. 1,400 laptops, wireless keyboards/mouse and headsets and c. 900 chairs and desks
— deployment of MS Teams, Office 365 and a new paperless expense management system
— virtual training to line managers on how to manage remote teams
— an enhanced IT helpdesk solution.
Our strategy in action continued
28
Strategic report |

Operating more efficientlyThe acceleration in the use of technology by clients and staff alike during the year has been considerable and we will continue to leverage this opportunity to enable remote-working colleagues to remain connected with each other and with clients. This will complement our traditional face-to-face client model, providing a greater range of communication options for clients. The pandemic has also presented opportunities to accelerate our plans to streamline client administration and other internal processes, providing a future boost to productivity and morale and creating the time and resources to invest in growth initiatives.
Technology-driven efficiencies in client administrationOur continued investment in technology, and the acceleration of this investment following the outbreak of the pandemic, has enabled efficiencies and enhancements to client on-boarding and lifestyle processes that have improved the client experience and supported greater productivity. Examples of processes that have become paperless and which have been embedded across the business include account opening and amendments, anti-money-laundering verifications, asset and cash transfers and payments and a new wet signature policy. These enhancements were done whilst carefully managing operational risk.
Employee productivityRathbone employees have a very strong client-centric culture, and this continues to be a key competitive advantage. Enabling efficiencies for employees not only improves morale but also provides a boost to productivity, which is an enabler of future growth. Employees have been provided with additional IT equipment and support as well as office furniture to support an ergonomic home-working environment, which will help to enable flexible working going forward. During the year we upgraded elements of our client relationship management system, rolled out Microsoft Teams across the business and adopted a cloud-first approach. Training for line managers to help manage their remote teams effectively, including measures to help boost productivity, was also provided.
Investing in our technology infrastructureGood progress has been made in implementing the future design of the technology function, creating a streamlined structure, reducing layers, improving decision making and supporting service excellence. This has seen an increase in overall technology resources, a clearer delineation between ‘run’ and ‘change’ and a new centralised data management capability, enabling delivery of the technology strategy. In support of a cloud-first infrastructure approach, further improvements have been seen in our core technology infrastructure ensuring greater stability, enabling remote-working and the strategic change agenda. This has included a strategic partnership with Amazon Web Services (AWS) for cloud capability and several process improvements, helping reduce overall technology incidents.
29

Key performance indicators
Key performance indicators
The group considers the following financial and non-financial measures as key performance indicators (KPIs) of its overall performance. Following a review of the KPIs, this year we have made some changes to ensure they remain relevant. ‘Capital expenditure excluding property’ has been removed as it is no longer relevant for the business following our office move in 2017. ‘Average full-time-equivalent employees’ has also been removed as it is no longer deemed a relevant indicator of performance. ‘Number of participants with SIP partnership shares’ has been replaced with ‘Percentage of shares held by current employees’ as this is felt to be a more relevant measure. Finally, ‘Common Equity Tier 1 ratio’ has been added as an indicator of financial resilience.
Each KPI is linked to at least one of our four strategic pillars and is used to measure both the progress and success of our strategy implementation.
DefinitionTotal funds under management and administration at the end of the year.
RelevanceThe amount of funds that we manage directly impacts the level of income we receive.
DefinitionThe number of clients who use our services.
RelevanceIn an industry where scale is important, the size of our client base helps to determine market share.
DefinitionThe value of annual net inflows from Investment Management as a percentage of opening funds under management and administration.
RelevanceMeasures the ability of the firm to grow business in the absence of acquisitions.
Total funds under management and administration
Number of Investment Management clients
Investment Management net organic growth rates
61,000
60,0
00
60,0
00
61,0
00
2018 2019 2020
£54.7bn
50.4
44.1
54.7
2018 2019 2020
0.1%
(1.5
)
3.4
0.1
2018 2019 2020
Link to our strategy: Enhancing the client and adviser proposition and experience
30 Rathbone Brothers Plc Report and accounts 2020
Strategic report |

DefinitionUnderlying profit after tax divided by the weighted average number of ordinary shares.
RelevanceAn important measure of performance as it shows profitability, reflecting the effects of any new share issuance.
DefinitionUnderlying profit before tax as a percentage of underlying operating income.
RelevanceThis measure enables the group’s operational and segmental performance to be understood, accurately reflecting key drivers of long-term profitability.
DefinitionUnderlying profit after tax as a percentage of the underlying quarterly average total of equity.
RelevanceA useful measure of financial efficiency as it indicates profitability after factoring in the amount of capital employed by the business.
DefinitionPerformance-related variable staff costs divided by underlying profit before tax and before performance-related variable staff costs.
RelevanceShows the extent to which profits are shared between employees and shareholders.1. This measure is considered an APM. Please refer to pages 35-36
for more detail on APMs
Underlying earnings per share1Underlying operating margin1
Underlying return on capital employed1Performance-related variable staff costs as a % of underlying profit before tax and before performance-related variable staff costs1
25.3%
25.5
29.4
25.3
2018 2019 2020
43.7%
42.3
36.8
43.7
2018 2019 2020
133.3p
132.
8
142.
5
133.
3
2018 2019 2020
13.6%
14.2
16.9
13.6
2018 2019 2020
Supporting and delivering growth Inspiring our people Operating more efficiently
rathbones.com 31

DefinitionNumber of permanent employees who have left during the year, excluding retirements and redundancies, as a percentage of opening headcount.
RelevanceA measure of staff retention, which can be a reflection of the work environment and commitment to the organisation.
DefinitionTotal annual dividend per share (interim and final).
RelevanceDividends represent an important part of the returns to shareholders.
DefinitionCommon Equity Tier 1 capital as a proportion of total risk exposure amount.
RelevanceAs a bank, we must maintain certain levels of capital. A higher ratio is an indicator of financial resilience.
Refer to page 42 for further detail
DefinitionThe percentage of outstanding shares held by current employees of the firm.
RelevanceA direct link for employees to the future financial success of the company as shareholders.1. Includes some unvested employee share plans
Staff turnoverDividend per share
Common Equity Tier 1 ratioPercentage of shares held by current employees1
72.0p
70
66
72
2018 2019 2020
10.1%
8.3
7.8
10.1
2018 2019 2020
5.1%
7.1
6.0
5.1
2018 2019 2020
23.5%
22.0
20.6
23.5
2018 2019 2020
Key performance indicators continued
32 Rathbone Brothers Plc Report and accounts 2020
Strategic report |

Financial performance
rathbones.com 33
The group’s performance for the year was resilient, with growth and investment delivered, despite challenging market conditions for all.
Overview of financial performance The group’s financial performance for the year to 31 December 2020 remained strong during a turbulent year for financial markets.
Underlying profit before tax was £92.5 million (2019: £88.7 million) reflecting growth in total revenue, despite market conditions, and the continuation of investment in the strategic plans announced in October 2019. The underlying operating margin, which is calculated as the ratio of underlying profit before tax to underlying operating income, was 25.3% (2019: 25.5%).
Statutory profit before tax of £43.8 million in 2020 increased 10% from £39.7 million in 2019. This included planned costs of £32.3 million relating to the acquisition of Speirs & Jeffrey; which was higher than previous guidance following a very successful exercise to bring clients on our standard discretionary terms of business.
The board primarily considers underlying measures of income, expenditure and earnings when assessing the performance of the group. These are considered to be a better reflection of true business performance than reviewing results on a statutory basis only. These measures are also widely used by research analysts covering the group. A full reconciliation between underlying results and the closest IFRS equivalent is provided on page 35.
Table 1. Group’s overall performance
2020 £m
(unless stated)
2019£m
(unless stated)
Operating income (and underlying operating income1) 366.1 348.1
Underlying operating expenses1 (273.6) (259.4)Underlying profit before tax1 92.5 88.7 Underlying operating margin1 25.3% 25.5% Profit before tax 43.8 39.7 Effective tax rate 39.0% 32.2% Taxation (17.1) (12.8)Profit after tax 26.7 26.9 Underlying earnings per share1 133.3p 132.8p Earnings per share 49.6p 50.3p Dividend per share2 72.0p 70.0p Return on capital employed (ROCE) 5.3% 5.7% Underlying return on capital employed1 13.6% 14.2% 1. A reconciliation between the underlying measure and its closest IFRS equivalent is
shown in table 2 2. The total interim and final dividend proposed for the financial year
Jennifer MathiasGroup Finance Director
rathbones.com 33

Financial performance continued
34 Rathbone Brothers Plc Report and accounts 2020
COVID-19 pandemic The uncertainty caused by the emergence of the COVID-19 pandemic during the early part of the year had a profound impact on financial markets and broader business conditions. The rapid falls in the value of Western financial markets from mid-February through to late March reduced the value of funds under management and administration (FUMA) and investment management fees. Following a small recovery at the end of March, markets then remained at these lower valuations for much of the year until the announcement of successful vaccine trials in November, at which point they recovered further, with the FTSE 100 Index ending the year c. 14% down on the start of the year.
Early in the pandemic, central banks cut interest rates further to provide additional support to the economy. The Bank of England reduced its base rate to 0.1%, which put further downward pressure on banking margins.
Like many financial services businesses, the group successfully transitioned almost its entire workforce to remote working arrangements during March and early April. This was enabled by leveraging our existing technology but was supported through the year by the group-wide roll out of portable IT solutions for all staff. Surplus existing technology is being reconditioned and donated to charities supporting disadvantaged children where possible.
The rapid adoption of technology-based solutions for communication and remote working across much of the developed world drove a significant rotation in the value of companies, in favour of technology-based companies and online retailers at the expense of hospitality, travel and traditional consumer-led businesses. This followed the impacts of the mandated restrictions on mobility and consequent falls in consumer income. This significant change in the relative value of entire sectors of investments drove significant transactional activity as investor portfolios were rebalanced.
The group did not need to make use of any of the Government schemes available to support businesses and their employees through the pandemic. Plans for investment were slowed temporarily at the peak of the downturn whilst the business assessed the financial outlook. Consequently, hiring activity has been slower, but not halted, than originally planned during the year.
The impacts of the pandemic on the credit quality of the group’s loan and treasury books was very limited, reflecting the low appetite for credit risk in our investment and lending decisions. Client loans remain well covered by assets held in client portfolios. Treasury exposures are spread across highly rated counterparties, with the largest exposure (£1.8 billion at 31 December 2020) being to the Bank of England.
Underlying operating income No adjustments have been made to operating income as reported under IFRS to calculate underlying operating income for 2020 or 2019.
Operating income increased 5.2% in 2020 to £366.1 million. This reflects a change in the mix of income as a result of the impacts of COVID-19 and, in the fourth quarter, adoption of standard tariffs for our discretionary and advisory services for clients who joined from Speirs & Jeffrey.
Fee income of £274.2 million in 2020 increased 5.4% compared to £260.2 million in 2019. Fees represented 74.9% of underlying operating income in 2020, which was in line with 2019. The resilience of fee income during the year reflects the impact of positive investment performance on the value of FUMA and strong growth in the Funds business.
Net commission income increased 21.9% to £62.3 million in 2020 (2019: £51.1 million). Commission income was high throughout the year as investment managers monitored and responded to changes in the outlook for companies and sectors as the effect of the pandemic developed throughout 2020. The transition of clients to fee-only tariffs in the fourth quarter reduced this impact slightly.
Net interest income decreased 48.8% to £8.4 million, reflecting the cut to the Bank of England’s base rate in March.
Underlying operating expenses Operating expenses increased from £308.4 million to £322.3 million during the year. Operating expenses are adjusted to exclude expenditure falling into the three categories explained on page 35.
Underlying operating expenses increased by 5.5% to £273.6 million. This includes cost savings of some £5 million on travel, subsistence, events and entertainment related expenses as a result of the pandemic restrictions, partially offset by £0.8 million of expenses enabling remote working.
Regulation continued to drive cost growth with additional Financial Services Compensation Scheme levies adding £1.8 million to costs in 2020. Spend on our systems and infrastructure increased by £3.7 million in the year as we advanced our strategic plans to invest in our digital capability.
Planned additions to headcount in 2019 and 2020 and market-led salary increases increased fixed staff costs by 6.0% to £117.5 million. Of this, £1.0 million related to strategic investment in front office hires. This increase also includes synergies of £3.3 million realised following the integration of Speirs & Jeffrey. In total, average headcount increased by 1.7% to 1,535 in 2020 (see note 10). Fixed staff costs also include an additional accrual of £1.2 million for unused staff holiday entitlement as a result of the pandemic restrictions.
Total variable staff costs increased by 16.4% to £77.7 million. Growth in performance-based awards of £6.8 million reflects the high level of sales and profit in the Funds business, as well as the strong performance of our investment management client portfolios. The £4.1 million increase in the cost of other variable staff costs is driven by a number of specific charges in 2020 for share-based employment and other awards.
34 Rathbone Brothers Plc Report and accounts 2020
Strategic report |

rathbones.com 35
Alternative performance measures Table 2. Reconciliation of underlying performance measures to closest equivalent IFRS measures
2020 £m
(unless stated)
2019£m
(unless stated)
Operating income (and underlying operating income) 366.1 348.1
Operating expenses (322.3) (308.4)Charges in relation to client
relationships and goodwill 14.3 15.9 Acquisition-related costs 34.4 33.1 Underlying operating expenses (273.6) (259.4)Profit before tax 43.8 39.7 Underlying profit before tax1 92.5 88.7 Operating margin 12.0% 11.4% Underlying operating margin2 25.3% 25.5% Taxation (17.1) (12.8)Tax on non-underlying expenses (3.8) (4.8)Underlying taxation (20.9) (17.6)Profit after tax 26.7 26.9 Underlying profit after tax3 71.6 71.1 Weighted average number of shares
in issue 53.7m 53.6m Earnings per share 49.6 50.3p Underlying earnings per share4 133.3 132.8p Underlying quarterly average
total equity 520.5 498.9 ROCE 5.3% 5.7% Underlying ROCE5 13.6% 14.2% 1. Underlying operating income less underlying operating expenses 2. Underlying profit before tax as a percentage of underlying operating income 3. Underlying profit before tax less underlying taxation 4. Underlying profit after tax divided by the weighted average number of shares in issue 5. Underlying profit after tax as a percentage of underlying quarterly average total equity
Charges in relation to client relationships and goodwill (note 22) As explained in notes 1.14 and 2.1, client relationship intangible assets are recognised when we acquire a business or hire a team of investment managers. The charges associated with these assets represent the proportion of the cost of securing client contracts that is charged to profit or loss as amortisation each year over the estimated duration of the client relationships. The quantum of the accounting charge will vary depending on the terms of each individual acquisition or team hire and represents a significant non-cash profit and loss item. They have, therefore, been excluded from underlying profit, which represents largely cash-based earnings and more directly relates to the financial reporting period. Research analysts commonly exclude these costs when comparing the performance of firms in the wealth management industry.
Acquisition-related costs (note 9) Acquisition-related costs are significant costs which arise from strategic investments to grow the business rather than its operating performance and are therefore excluded from underlying results.
They primarily represent deferred acquisition consideration and the costs of integrating acquired businesses into the group.
Deferred acquisition costs are generally significant payments that are capital in nature reflecting the transfer of ownership of the business. However, in accordance with IFRS 3, any deferred consideration payments to former shareholders of the acquired business who are required to remain in employment with the group must be treated as remuneration. This distorts the view of operational performance given by the statutory measure of profit.
During 2020, £32.3 million of deferred consideration payments for Speirs & Jeffrey (2019: £26.0 million) were charged to the income statement and are considered separately for executive remuneration purposes (see page 103). A further £2.0 million of integration costs were also incurred in 2020.
Acquisition costs of £0.2 million were incurred in relation to the acquisition of the Personal Injury and Court of Protection business of Barclays Wealth (2019: £0.2 million).
The final payment in respect of the acquisition of Vision Independent Financial Planning and Castle Investment Solutions, which were completed on 31 December 2015, were made to the vendors at the end of 2019. These amounts represent the cost of payments to vendors of the business who remained in employment with the group.
Taxation The corporation tax charge for 2020 was £17.1 million (2019: £12.8 million) (see note 11). The effective tax rate of 39.0% (2019: 32.1%) reflects the disallowable costs of deferred consideration payments for the acquisition of Speirs & Jeffrey. The effective tax rate in 2021 is expected to begin to trend back towards the statutory rate of tax, as the level of the disallowable cost for deferred consideration in 2021 is expected to be much lower (see note 2.3). Thereafter, the group expects it to return to 1-2 percentage points above the statutory rate.
34 Rathbone Brothers Plc Report and accounts 2020
COVID-19 pandemic The uncertainty caused by the emergence of the COVID-19 pandemic during the early part of the year had a profound impact on financial markets and broader business conditions. The rapid falls in the value of Western financial markets from mid-February through to late March reduced the value of funds under management and administration (FUMA) and investment management fees. Following a small recovery at the end of March, markets then remained at these lower valuations for much of the year until the announcement of successful vaccine trials in November, at which point they recovered further, with the FTSE 100 Index ending the year c. 14% down on the start of the year.
Early in the pandemic, central banks cut interest rates further to provide additional support to the economy. The Bank of England reduced its base rate to 0.1%, which put further downward pressure on banking margins.
Like many financial services businesses, the group successfully transitioned almost its entire workforce to remote working arrangements during March and early April. This was enabled by leveraging our existing technology but was supported through the year by the group-wide roll out of portable IT solutions for all staff. Surplus existing technology is being reconditioned and donated to charities supporting disadvantaged children where possible.
The rapid adoption of technology-based solutions for communication and remote working across much of the developed world drove a significant rotation in the value of companies, in favour of technology-based companies and online retailers at the expense of hospitality, travel and traditional consumer-led businesses. This followed the impacts of the mandated restrictions on mobility and consequent falls in consumer income. This significant change in the relative value of entire sectors of investments drove significant transactional activity as investor portfolios were rebalanced.
The group did not need to make use of any of the Government schemes available to support businesses and their employees through the pandemic. Plans for investment were slowed temporarily at the peak of the downturn whilst the business assessed the financial outlook. Consequently, hiring activity has been slower, but not halted, than originally planned during the year.
The impacts of the pandemic on the credit quality of the group’s loan and treasury books was very limited, reflecting the low appetite for credit risk in our investment and lending decisions. Client loans remain well covered by assets held in client portfolios. Treasury exposures are spread across highly rated counterparties, with the largest exposure (£1.8 billion at 31 December 2020) being to the Bank of England.
Underlying operating income No adjustments have been made to operating income as reported under IFRS to calculate underlying operating income for 2020 or 2019.
Operating income increased 5.2% in 2020 to £366.1 million. This reflects a change in the mix of income as a result of the impacts of COVID-19 and, in the fourth quarter, adoption of standard tariffs for our discretionary and advisory services for clients who joined from Speirs & Jeffrey.
Fee income of £274.2 million in 2020 increased 5.4% compared to £260.2 million in 2019. Fees represented 74.9% of underlying operating income in 2020, which was in line with 2019. The resilience of fee income during the year reflects the impact of positive investment performance on the value of FUMA and strong growth in the Funds business.
Net commission income increased 21.9% to £62.3 million in 2020 (2019: £51.1 million). Commission income was high throughout the year as investment managers monitored and responded to changes in the outlook for companies and sectors as the effect of the pandemic developed throughout 2020. The transition of clients to fee-only tariffs in the fourth quarter reduced this impact slightly.
Net interest income decreased 48.8% to £8.4 million, reflecting the cut to the Bank of England’s base rate in March.
Underlying operating expenses Operating expenses increased from £308.4 million to £322.3 million during the year. Operating expenses are adjusted to exclude expenditure falling into the three categories explained on page 35.
Underlying operating expenses increased by 5.5% to £273.6 million. This includes cost savings of some £5 million on travel, subsistence, events and entertainment related expenses as a result of the pandemic restrictions, partially offset by £0.8 million of expenses enabling remote working.
Regulation continued to drive cost growth with additional Financial Services Compensation Scheme levies adding £1.8 million to costs in 2020. Spend on our systems and infrastructure increased by £3.7 million in the year as we advanced our strategic plans to invest in our digital capability.
Planned additions to headcount in 2019 and 2020 and market-led salary increases increased fixed staff costs by 6.0% to £117.5 million. Of this, £1.0 million related to strategic investment in front office hires. This increase also includes synergies of £3.3 million realised following the integration of Speirs & Jeffrey. In total, average headcount increased by 1.7% to 1,535 in 2020 (see note 10). Fixed staff costs also include an additional accrual of £1.2 million for unused staff holiday entitlement as a result of the pandemic restrictions.
Total variable staff costs increased by 16.4% to £77.7 million. Growth in performance-based awards of £6.8 million reflects the high level of sales and profit in the Funds business, as well as the strong performance of our investment management client portfolios. The £4.1 million increase in the cost of other variable staff costs is driven by a number of specific charges in 2020 for share-based employment and other awards.
rathbones.com 35

Financial performance continued
36 Rathbone Brothers Plc Report and accounts 2020
The previously planned reduction of corporation tax to 17% from 19% was reversed by the Government during 2020. Deferred tax balances have therefore been calculated at a rate of 19% (2019: 17%) where timing differences are forecast to unwind in future years. The budget on 3 March 2021 signalled an increase in the rate of corporation tax to 25% in 2023. We will reflect this rate in the deferred tax calculations when the change receives Royal Assent.
Basic earnings per share Basic earnings per share for the year ended 31 December 2020 were 49.6p compared to 50.3p in 2019. This reflects the full impact of non-underlying charges in relation to the acquisition of Speirs & Jeffrey. On an underlying basis, earnings per share were 133.3p in 2020, compared to 132.8p in 2019 (see note 13).
Dividends We operate a generally progressive dividend policy, as set out in the directors’ report on page 127.
In determining the level of any proposed dividend, the board has regard to current and forecast financial performance. Any proposal to pay a dividend is subject to compliance with:
– the Companies Act, which requires that the company must have sufficient distributable reserves to pay the dividend; and
– regulatory capital requirements, which require the group to maintain at least a minimum level of own funds (for further detail, see page 42).
The company’s distributable reserves are primarily dependent on:
– the level of profits earned by the company, including distributions received from trading subsidiaries (some of which are subject to minimum regulatory capital requirements themselves); and
– actuarial changes in the value of the pension schemes that are recognised in the company’s other comprehensive income, net of deferred tax.
At 31 December 2020 the company’s distributable reserves were £93.7 million (2019: £72.0 million). See Note 44 for a reconciliation of net assets to distributable reserves.
In setting the proposed dividend for 2020, the board has considered the group’s performance in 2020 and the strong balance sheet position, balanced with the need to continue our investment programme and the ongoing uncertainty in the economic outlook. As a result, the board is proposing a final dividend for 2020 of 47p; resulting in a full year dividend of 72p (an increase of 2p on 2019).
The proposed full year dividend is covered 0.7 times by basic earnings and 1.9 times by underlying earnings.
Capital expenditure Overall, capital expenditure of £11.7 million in 2020 was consistent with levels spent in 2019. Spend on regulatory driven projects and property improvements reduced by a total of £1.3m, whilst the same amount was re-invested in technology solutions to enable remote working for our employees.
Underlying return on capital employed The board monitors the underlying return on capital employed (ROCE) as a key performance measure, which forms part of the assessment of management’s performance for remuneration purposes as described in the remuneration report on page 106. For monitoring purposes, underlying ROCE is defined as underlying profit after tax expressed as a percentage of quarterly average total equity across the year.
Assessment of underlying return on capital is a key consideration for all investment decisions, particularly in relation to acquired growth.
In 2020, underlying ROCE was 13.6% (2019: 14.2%). Quarterly average total equity increased by £25.6 million in 2020 compared to 2019, reflecting growth in retained earnings.
Outlook The group’s profitability remains closely linked with the performance of global investment markets and UK interest rates.
We continue to work to deliver on our medium-term strategy. As we enter year two of our investment plan, momentum will increase in the investment in our people and digital solutions. These investments will enrich the client experience and support process efficiency; which, over the medium term, will drive the next phase of growth. Consequently, during the next two to three years, we will continue to maintain a mid 20s underlying operating margin.
Acquisition synergies will continue to yield a full year revenue impact in 2021 following the adoption of standard tariffs for clients from Speirs & Jeffery from the last quarter of 2020, along with further cost synergies of approximately £0.4m, adding to the £5m delivered in 2020.
Staff costs in 2021 will reflect salary inflation, including promotions, of approximately 1.5%, in addition to the full impact of hiring activity in 2020 and further joiners planned in 2021 in support of the strategic initiatives.
Announcements from the Financial Services Compensation Scheme in January 2021 signal the group’s share of levies are not expected to reduce and could even increase again in 2021. We await further information.
We will continue to maintain our cost discipline, investing as market conditions allow to support our growth strategy and ensure that our infrastructure supports the business and manages operational risks appropriately.
Other financial impacts Final deferred consideration payments to former shareholders of Speirs & Jeffrey will be calculated at the end of 2021. The amounts payable are conditional on performance against certain operational targets. We currently expect to recognise a non-underlying charge of approximately £9 million in 2021 in relation to these deferred payments.
36 Rathbone Brothers Plc Report and accounts 2020
Strategic report |

36 Rathbone Brothers Plc Report and accounts 2020
The previously planned reduction of corporation tax to 17% from 19% was reversed by the Government during 2020. Deferred tax balances have therefore been calculated at a rate of 19% (2019: 17%) where timing differences are forecast to unwind in future years. The budget on 3 March 2021 signalled an increase in the rate of corporation tax to 25% in 2023. We will reflect this rate in the deferred tax calculations when the change receives Royal Assent.
Basic earnings per share Basic earnings per share for the year ended 31 December 2020 were 49.6p compared to 50.3p in 2019. This reflects the full impact of non-underlying charges in relation to the acquisition of Speirs & Jeffrey. On an underlying basis, earnings per share were 133.3p in 2020, compared to 132.8p in 2019 (see note 13).
Dividends We operate a generally progressive dividend policy, as set out in the directors’ report on page 127.
In determining the level of any proposed dividend, the board has regard to current and forecast financial performance. Any proposal to pay a dividend is subject to compliance with:
– the Companies Act, which requires that the company must have sufficient distributable reserves to pay the dividend; and
– regulatory capital requirements, which require the group to maintain at least a minimum level of own funds (for further detail, see page 42).
The company’s distributable reserves are primarily dependent on:
– the level of profits earned by the company, including distributions received from trading subsidiaries (some of which are subject to minimum regulatory capital requirements themselves); and
– actuarial changes in the value of the pension schemes that are recognised in the company’s other comprehensive income, net of deferred tax.
At 31 December 2020 the company’s distributable reserves were £93.7 million (2019: £72.0 million). See Note 44 for a reconciliation of net assets to distributable reserves.
In setting the proposed dividend for 2020, the board has considered the group’s performance in 2020 and the strong balance sheet position, balanced with the need to continue our investment programme and the ongoing uncertainty in the economic outlook. As a result, the board is proposing a final dividend for 2020 of 47p; resulting in a full year dividend of 72p (an increase of 2p on 2019).
The proposed full year dividend is covered 0.7 times by basic earnings and 1.9 times by underlying earnings.
Capital expenditure Overall, capital expenditure of £11.7 million in 2020 was consistent with levels spent in 2019. Spend on regulatory driven projects and property improvements reduced by a total of £1.3m, whilst the same amount was re-invested in technology solutions to enable remote working for our employees.
Underlying return on capital employed The board monitors the underlying return on capital employed (ROCE) as a key performance measure, which forms part of the assessment of management’s performance for remuneration purposes as described in the remuneration report on page 106. For monitoring purposes, underlying ROCE is defined as underlying profit after tax expressed as a percentage of quarterly average total equity across the year.
Assessment of underlying return on capital is a key consideration for all investment decisions, particularly in relation to acquired growth.
In 2020, underlying ROCE was 13.6% (2019: 14.2%). Quarterly average total equity increased by £25.6 million in 2020 compared to 2019, reflecting growth in retained earnings.
Outlook The group’s profitability remains closely linked with the performance of global investment markets and UK interest rates.
We continue to work to deliver on our medium-term strategy. As we enter year two of our investment plan, momentum will increase in the investment in our people and digital solutions. These investments will enrich the client experience and support process efficiency; which, over the medium term, will drive the next phase of growth. Consequently, during the next two to three years, we will continue to maintain a mid 20s underlying operating margin.
Acquisition synergies will continue to yield a full year revenue impact in 2021 following the adoption of standard tariffs for clients from Speirs & Jeffery from the last quarter of 2020, along with further cost synergies of approximately £0.4m, adding to the £5m delivered in 2020.
Staff costs in 2021 will reflect salary inflation, including promotions, of approximately 1.5%, in addition to the full impact of hiring activity in 2020 and further joiners planned in 2021 in support of the strategic initiatives.
Announcements from the Financial Services Compensation Scheme in January 2021 signal the group’s share of levies are not expected to reduce and could even increase again in 2021. We await further information.
We will continue to maintain our cost discipline, investing as market conditions allow to support our growth strategy and ensure that our infrastructure supports the business and manages operational risks appropriately.
Other financial impacts Final deferred consideration payments to former shareholders of Speirs & Jeffrey will be calculated at the end of 2021. The amounts payable are conditional on performance against certain operational targets. We currently expect to recognise a non-underlying charge of approximately £9 million in 2021 in relation to these deferred payments.
Segmental review
rathbones.com 37
The group is managed through two key operating segments, Investment Management and Funds.
Investment Management The activities of the group are described in detail on pages 7 to 9. The Investment Management segment comprises those activities described under the headings ‘Investment Management’ and ‘Complementary services’ on page 7. The results of the Investment Management segment described below include the trading results of Rathbone Trust Company and Vision Independent Financial Planning.
Investment Management income is largely driven by revenue margins earned from funds under management and administration. Revenue margins are expressed as a basis point return, which depends on a mix of tiered fee rates, commissions charged for transactions undertaken on behalf of clients and the interest margin earned on cash in client portfolios and client loans.
Year-on-year changes in the key performance indicators for Investment Management are shown in table 3.
Table 3. Investment Management – key performance indicators 2020 2019
Funds under management and administration at 31 December1 £44.9bn £43.0bn
Underlying rate of net organic growth in Investment Management funds under management and administration1 0.1% -1.5%
Underlying rate of total net growth in Investment Management funds under management and administration1 1.4% -0.9%
Average net operating basis point return2 72.7 bps 68.2 bps
Number of Investment Management clients (‘000) 61 60
Number of investment managers 304 297 1. See table 4 (percentages calculated on unrounded figures) 2. See table 8
Funds under management and administration Investment Management funds under management and administration increased by 4.4% to £44.9 billion at 31 December 2020, with growth and investment performance offsetting lower market levels at the end of the year.
Despite the impacts of the pandemic, Investment Management has continued to attract new clients both organically and through acquisitions. The level of client losses in 2020 reduced as the impact of investment manager departures in recent years subsided.
During 2020, the total number of investment managers increased to 304 at the end of the year, from 297 at the end of 2019. The total number of clients (or groups of closely related clients) at the end of the year was approximately 61,000 (2019: 60,000).
Table 4. Investment Management – funds under management and administration
2020
£bn 2019
£bn
As at 1 January 43.0 38.5 Inflows 3.9 3.5 – organic1 3.3 3.3 – acquired2 0.6 0.2 Outflows1 (3.3) (3.9)Market adjustment3 1.3 4.9 As at 31 December 44.9 43.0 Net organic new business4 0.0 (0.6)Underlying rate of net organic growth5 0.1% -1.5% Underlying rate of total net growth6 1.4% -0.9% 1. Value at the date of transfer in/(out) 2. Value at date of acquisition 3. Represents the impact of market movements and investment performance 4. Organic inflows less outflows 5. Net organic new business as a percentage of opening funds under management
and administration 6. Net organic new business and acquired inflows as a percentage of opening funds under
management and administration
Gross organic inflows of £3.3 billion remained resilient at 7.7% of opening funds under management and administration. 54% of total gross organic inflows related to existing client relationships. This represents a good performance considering the prominence of face-to-face sales in our business model.
Acquired inflows of £0.6 billion in 2020 reflected the successful acquisition of the Personal Injury and Court of Protection assets from Barclays Wealth and funds introduced by teams who recently joined the group on an earn-out arrangement.
Outflows of funds under management and administration were 7.7% of the opening balance (2019: 10.1%). Of this, approximately 40% related to accounts that were closed with the remainder being drawings from capital to supplement income or for inter-generational transfers. The decrease on 2019 reflects a much-reduced impact of recent investment manager departures on closed accounts.
60
295 60
297 61304
2018 20202019
Chart 1. Investment Management –number of clients and investment managers
Number of investment managersNumber of Investment Management clients (’000)
rathbones.com 37

38 Rathbone Brothers Plc Report and accounts 2020
As a result, total Investment Management new business was £0.6 billion during 2020, representing an increase by 1.4% of opening funds under management and administration (2019: net total reduction of 0.9%).
2020 was another volatile year for equity and bond markets, with the impacts of the emerging pandemic, the US election and the announcement of a Brexit trade deal providing a range of conflicting stimuli to investment markets. Sentiment improved markedly in the fourth quarter, with the announcement of effective vaccines providing some hope for a faster return to stability. Reflecting these factors, the MSCI PIMFA Balanced Index finished the year largely unchanged from its opening level.
The average investment return across all Investment Management client portfolios, after all fees, was +3.4%, which outperformed the PIMFA index by 3.5%. The outperformance was largely driven by US and Worldwide Equities, as the release of positive economic data combined with elevated excess cash levels propelled global indices higher, which attracted significant momentum over time. This meant our conviction in highly cyclical growth names performed particularly strongly with Technology, Sustainability and Smaller Cap holdings leading the way. Overall company performance was also slightly ahead of the Private Client Indices published by ARC.
* Index figures show how funds under management and administration would have changed
between 2016 and 2020 if they had tracked each index
2020 was a strong year for our specialist teams. Charity funds under management and administration continued to grow strongly and reached £6.5 billion at 31 December 2020, up 6.6% from £6.1 billion at the start of the year. The Personal Injury and Court of Protection business ended 2020 with £1.0 billion of funds under management and administration. Rathbone Greenbank Investments grew funds under management and administration nearly 19% to £1.9 billion at 31 December 2020.
As at 31 December 2020, Vision Independent Financial Planning advised on client assets of £2.2 billion, up 1.5% from 2019.
Table 5. Investment Management – service level breakdown
2020
£bn 2019
£bn
Direct 33.7 31.0 Financial adviser linked 9.3 8.7 Total discretionary 43.0 39.7 Non-discretionary investment
management 1.4 2.6 Execution only 2.7 2.4 Gross Investment Management FUMA 47.1 44.7 Discretionary wrapped funds1 (2.2) (1.7)Total Investment Management FUMA 44.9 43.0 1. Holdings of the group’s mutual funds in Investment Management client portfolios and
mutual funds for which the management of the assets is undertaken by Investment Management teams; the corresponding funds under management and administration is reported within Funds
During 2020, clients who joined as part of the acquisition of Speirs & Jeffrey converted some £1.0 billion of funds under administration from non-discretionary to discretionary mandates.
Financial performance Table 6. Investment Management – financial performance
2020
£m 2019
£m
Net investment management fee income1 230.3 224.1
Net commission income 62.3 51.1 Net interest income 8.4 16.4 Fees from advisory services2 and other
income 19.6 19.3 Underlying operating income 320.6 310.9 Underlying operating expenses3 (241.2) (232.5)Underlying profit before tax 79.4 78.4 Underlying operating margin4 24.8% 25.2% 1. Net investment management fee income is stated after deducting fees and commission
expenses paid to introducers 2. Fees from advisory services includes income from trust, tax and financial planning
services (including Vision) 3. See table 9 4. Underlying profit before tax as a percentage of underlying operating income
The effect of the pandemic on investment markets and the wider economy resulted in a change in the mix of revenues in 2020.
Lower average funds under management and administration levels on our principal charging dates during 2020 (see table 7) weighed on net investment management fee income for the first three quarters. Strong investment performance and the repricing of mandates to a fee-only rate card for clients who joined from Speirs & Jeffrey in the fourth quarter offset this; and net investment management fee income increased by 2.8% to £230.3 million in 2020.
£44.9bn
33.8
43.0 44
.9
30.2
38.5
2016 2017 20192018 2020
Chart 2. Investment Management – funds under management and administration �ve year growth (£bn)
FTSE 100*MSCI PIMFA Balanced*
* Index �gures show how funds under management and administration would have changed between 2014 and 2018 if they had tracked each index
Segmental review continued
38 Rathbone Brothers Plc Report and accounts 2020
Strategic report |

38 Rathbone Brothers Plc Report and accounts 2020
As a result, total Investment Management new business was £0.6 billion during 2020, representing an increase by 1.4% of opening funds under management and administration (2019: net total reduction of 0.9%).
2020 was another volatile year for equity and bond markets, with the impacts of the emerging pandemic, the US election and the announcement of a Brexit trade deal providing a range of conflicting stimuli to investment markets. Sentiment improved markedly in the fourth quarter, with the announcement of effective vaccines providing some hope for a faster return to stability. Reflecting these factors, the MSCI PIMFA Balanced Index finished the year largely unchanged from its opening level.
The average investment return across all Investment Management client portfolios, after all fees, was +3.4%, which outperformed the PIMFA index by 3.5%. The outperformance was largely driven by US and Worldwide Equities, as the release of positive economic data combined with elevated excess cash levels propelled global indices higher, which attracted significant momentum over time. This meant our conviction in highly cyclical growth names performed particularly strongly with Technology, Sustainability and Smaller Cap holdings leading the way. Overall company performance was also slightly ahead of the Private Client Indices published by ARC.
* Index figures show how funds under management and administration would have changed
between 2016 and 2020 if they had tracked each index
2020 was a strong year for our specialist teams. Charity funds under management and administration continued to grow strongly and reached £6.5 billion at 31 December 2020, up 6.6% from £6.1 billion at the start of the year. The Personal Injury and Court of Protection business ended 2020 with £1.0 billion of funds under management and administration. Rathbone Greenbank Investments grew funds under management and administration nearly 19% to £1.9 billion at 31 December 2020.
As at 31 December 2020, Vision Independent Financial Planning advised on client assets of £2.2 billion, up 1.5% from 2019.
Table 5. Investment Management – service level breakdown
2020
£bn 2019
£bn
Direct 33.7 31.0 Financial adviser linked 9.3 8.7 Total discretionary 43.0 39.7 Non-discretionary investment
management 1.4 2.6 Execution only 2.7 2.4 Gross Investment Management FUMA 47.1 44.7 Discretionary wrapped funds1 (2.2) (1.7)Total Investment Management FUMA 44.9 43.0 1. Holdings of the group’s mutual funds in Investment Management client portfolios and
mutual funds for which the management of the assets is undertaken by Investment Management teams; the corresponding funds under management and administration is reported within Funds
During 2020, clients who joined as part of the acquisition of Speirs & Jeffrey converted some £1.0 billion of funds under administration from non-discretionary to discretionary mandates.
Financial performance Table 6. Investment Management – financial performance
2020
£m 2019
£m
Net investment management fee income1 230.3 224.1
Net commission income 62.3 51.1 Net interest income 8.4 16.4 Fees from advisory services2 and other
income 19.6 19.3 Underlying operating income 320.6 310.9 Underlying operating expenses3 (241.2) (232.5)Underlying profit before tax 79.4 78.4 Underlying operating margin4 24.8% 25.2% 1. Net investment management fee income is stated after deducting fees and commission
expenses paid to introducers 2. Fees from advisory services includes income from trust, tax and financial planning
services (including Vision) 3. See table 9 4. Underlying profit before tax as a percentage of underlying operating income
The effect of the pandemic on investment markets and the wider economy resulted in a change in the mix of revenues in 2020.
Lower average funds under management and administration levels on our principal charging dates during 2020 (see table 7) weighed on net investment management fee income for the first three quarters. Strong investment performance and the repricing of mandates to a fee-only rate card for clients who joined from Speirs & Jeffrey in the fourth quarter offset this; and net investment management fee income increased by 2.8% to £230.3 million in 2020.
rathbones.com 39
Table 7. Investment Management – average funds under management and administration
2020
£bn 2019
£bn
Valuation dates for billing – 5 April 35.9 41.4 – 30 June 41.3 42.5 – 30 September 41.8 42.2 – 31 December 44.9 43.0 Average 41.0 42.3 Average FTSE 100 level1 5,978 7,4561. Based on the corresponding valuation dates for billing
Net commission income increased 21.9% to £62.3 million in 2020, as the impact of the pandemic on economic prospects in various sectors led to a substantial rotation from value stocks to growth stocks. This drove increased transactional activity as investment managers rebalanced client portfolios to reflect the change in outlook.
The cut in the Bank of England base rate to 0.1% in March 2020 reduced the margin available on our treasury book and net interest income consequently decreased 48.7% to £8.4 million in 2020.
The investment management loan book increased to £158 million at the end of 2020 (2019: £132 million) and contributed £3.4 million to net interest income (2019: £4.0 million). Also included in net interest income is £1.3 million (2019: £1.3 million) of interest payable on the group’s Tier 2 notes, which are callable annually in August, and a charge of £3.4 million in relation to the group’s premises leases (2019: £3.6 million).
Table 8. Investment Management – revenue margin
2020
bps 2019
bps
Basis point return1 from: – fee income 56.2 52.9 – commission 15.2 12.1 – interest 1.3 3.2 Basis point return on funds under
management and administration 72.7 68.2 1. Underlying operating income (see table 6), excluding interest on own reserves, interest
payable on Tier 2 notes issued, interest payable on lease assets, fees from advisory services and other income, divided by the average funds under management and administration on the quarterly billing dates (see table 7). Speirs & Jeffrey funds under management and administration have been included pro rata for the period of ownership in 2018.
As a result of the factors described above, the average net operating basis point return on funds under management and administration has increased by 4.5 bps to 72.7 bps in 2020.
Fees from advisory services and other income increased marginally to £19.6 million, reflecting the impacts of the pandemic on growth in our complementary services.
Underlying operating expenses in Investment Management for 2020 were £241.2 million, an increase of 3.7% compared to 2019. This is highlighted in table 9.
Table 9. Investment Management – underlying operating expenses
2020
£m 2019
£m
Staff costs1 – fixed 83.7 78.6 – variable 56.4 49.7 Total staff costs 140.1 128.3 Other operating expenses 101.1 104.2 Underlying operating expenses 241.2 232.5 Underlying cost/income ratio2 75.2% 74.8% 1. Represents the costs of investment managers and teams directly involved in
client-facing activities 2. Underlying operating expenses as a percentage of underlying operating income
(see table 5)
Fixed staff costs of £83.7 million increased by 6.5% year-on-year. Synergies of £3.3 million following the integration of Speirs & Jeffrey were offset by an 8% growth in headcount and market-driven salary inflation. Incremental accruals of £1.0 million were also recognised for unused holiday entitlement as a result of the pandemic.
Variable staff costs totalled £56.4 million in 2020, an increase of £6.7 million on 2019. This principally reflects a higher charge for growth-based awards following strong investment performance in 2020 as well as the cost of staff withdrawing from the Save As You Earn scheme and awards for new investment management teams.
Other operating expenses of £101.1 million include property, depreciation, settlement, IT, finance and other central support services costs.
Savings in the year of approximately £5 million arose from the impact of the pandemic on entertaining, travel, events and subsistence spend, as well as reduced use of the group’s office space. The total cost for 2020 also includes the impact of £1.7 million of synergies from the Speirs & Jeffrey integration.
The savings were partially offset by additional levies for the Financial Services Compensation Scheme, which increased by £1.6 million in 2020.
rathbones.com 39

40 Rathbone Brothers Plc Report and accounts 2020
Funds Table 10. Funds – Fund range
2020
£m 2019
£m
Rathbone Global Opportunities Fund 3,202 1,858 Rathbone Ethical Bond Fund 2,088 1,495 Rathbone Multi-Asset Portfolios 1,714 1,134 Rathbone Income Fund 811 1,078 Offshore funds 578 517 Rathbone High Quality Bond Fund 283 210 Rathbone Active Income Fund
for Charities 227 207 Rathbone Strategic Bond Fund 204 203 Rathbone Core Investment Fund
for Charities 129 121 Rathbone UK Opportunities Fund 49 47Rathbone Global Sustainability Fund 44 11 Other funds 491 557 9,820 7,438
Funds’ financial performance is principally driven by the value and growth of funds under management. Year-on-year changes in the key performance indicators for Funds are shown in table 11.
Table 11. Funds – key performance indicators 2020 2019
Funds under management at 31 December1 £9.8bn £7.4bn
Underlying rate of net growth in Funds under management1 20.1% 16.7%
Underlying profit before tax2 £13.1m £10.3m
1. See table 12 2. See table 14
Funds under management Net retail sales in the asset management industry totalled approximately £30.8 billion in 2020, as reported by the Investment Association (IA), up around £24.3 billion on 2019. Industry-wide funds under management increased 8.5% to £1.4 trillion at the end of the year.
Globally, equities was the top seller in 2020 at £10.4 billion – a very significant increase on the £2.9 billion outflow from equities in 2019; although UK equities were a notable exception to this, with net outflows in the year. Two-thirds of the total industry inflows came in November and December, showing the significant response to the news of a vaccine and the resulting boost to stock market returns. The IA Global sector (containing Rathbone Global Opportunities Fund and Rathbone Global Sustainability Fund) was the highest selling equity sector with annual flows of £8.2 billion.
The positive momentum in sales accelerated in 2020, with gross sales up 56.5% in the year to £3.6 billion. Redemptions also increased in the year, particularly in March when investors initially retreated from investment markets, totalling £2.1 billion for the full year. As a result, net inflows of £1.5 billion for the year were up 67% on £0.9 billion in 2019. Rathbone Funds Management consistently ranked in the top 10 for net UK sales throughout the year according to the quarterly Pridham Sales Reports.
Net inflows continued to be spread across the range of funds. The Multi-Asset Portfolios, Global Opportunities Fund and Ethical Bond Fund continued to attract particularly strong net flows in the year.
Funds under management closed the year up 32.4% at £9.8 billion (see table 12).
Table 12. Funds – funds under management
2020
£bn 2019
£bn
As at 1 January 7.4 5.6 Net inflows 1.5 0.9 – inflows1 3.6 2.3 – outflows1 (2.1) (1.4)Market adjustments2 0.9 0.9 As at 31 December 9.8 7.4 Underlying rate of net growth3 20.1% 16.7% 1. Valued at the date of transfer in/(out) 2. Impact of market movements and relative performance 3. Net inflows as a percentage of opening funds under management
The Ethical Bond and Global Opportunities funds maintained their excellent long-term track records and both finished in the first quartile for performance, measured over three and five years. The UK Opportunities Fund ended the year with top decile performance for 2020 and an improved long-term track record. The multi-asset funds similarly beat their benchmarks and did well against their peers.
UK Income funds were hit by the large cuts in dividends by UK stocks as a result of the pandemic, and the Income Fund cut its dividend in the year by 20% (compared to c.40% cut for the FTSE All Share).
£1,498m
883 94
3
1,49
8
554
543
2016 2017 20192018 2020
Chart 3. Funds – annual net �ows (£m)
Segmental review continued
40 Rathbone Brothers Plc Report and accounts 2020
Strategic report |

40 Rathbone Brothers Plc Report and accounts 2020
Funds Table 10. Funds – Fund range
2020
£m 2019
£m
Rathbone Global Opportunities Fund 3,202 1,858 Rathbone Ethical Bond Fund 2,088 1,495 Rathbone Multi-Asset Portfolios 1,714 1,134 Rathbone Income Fund 811 1,078 Offshore funds 578 517 Rathbone High Quality Bond Fund 283 210 Rathbone Active Income Fund
for Charities 227 207 Rathbone Strategic Bond Fund 204 203 Rathbone Core Investment Fund
for Charities 129 121 Rathbone UK Opportunities Fund 49 47Rathbone Global Sustainability Fund 44 11 Other funds 491 557 9,820 7,438
Funds’ financial performance is principally driven by the value and growth of funds under management. Year-on-year changes in the key performance indicators for Funds are shown in table 11.
Table 11. Funds – key performance indicators 2020 2019
Funds under management at 31 December1 £9.8bn £7.4bn
Underlying rate of net growth in Funds under management1 20.1% 16.7%
Underlying profit before tax2 £13.1m £10.3m
1. See table 12 2. See table 14
Funds under management Net retail sales in the asset management industry totalled approximately £30.8 billion in 2020, as reported by the Investment Association (IA), up around £24.3 billion on 2019. Industry-wide funds under management increased 8.5% to £1.4 trillion at the end of the year.
Globally, equities was the top seller in 2020 at £10.4 billion – a very significant increase on the £2.9 billion outflow from equities in 2019; although UK equities were a notable exception to this, with net outflows in the year. Two-thirds of the total industry inflows came in November and December, showing the significant response to the news of a vaccine and the resulting boost to stock market returns. The IA Global sector (containing Rathbone Global Opportunities Fund and Rathbone Global Sustainability Fund) was the highest selling equity sector with annual flows of £8.2 billion.
The positive momentum in sales accelerated in 2020, with gross sales up 56.5% in the year to £3.6 billion. Redemptions also increased in the year, particularly in March when investors initially retreated from investment markets, totalling £2.1 billion for the full year. As a result, net inflows of £1.5 billion for the year were up 67% on £0.9 billion in 2019. Rathbone Funds Management consistently ranked in the top 10 for net UK sales throughout the year according to the quarterly Pridham Sales Reports.
Net inflows continued to be spread across the range of funds. The Multi-Asset Portfolios, Global Opportunities Fund and Ethical Bond Fund continued to attract particularly strong net flows in the year.
Funds under management closed the year up 32.4% at £9.8 billion (see table 12).
Table 12. Funds – funds under management
2020
£bn 2019
£bn
As at 1 January 7.4 5.6 Net inflows 1.5 0.9 – inflows1 3.6 2.3 – outflows1 (2.1) (1.4)Market adjustments2 0.9 0.9 As at 31 December 9.8 7.4 Underlying rate of net growth3 20.1% 16.7% 1. Valued at the date of transfer in/(out) 2. Impact of market movements and relative performance 3. Net inflows as a percentage of opening funds under management
The Ethical Bond and Global Opportunities funds maintained their excellent long-term track records and both finished in the first quartile for performance, measured over three and five years. The UK Opportunities Fund ended the year with top decile performance for 2020 and an improved long-term track record. The multi-asset funds similarly beat their benchmarks and did well against their peers.
UK Income funds were hit by the large cuts in dividends by UK stocks as a result of the pandemic, and the Income Fund cut its dividend in the year by 20% (compared to c.40% cut for the FTSE All Share).
rathbones.com 41
The High Quality Bond Fund posted good returns over the year, performing well against its cash-plus based benchmark.
The more defensively positioned Strategic Bond Fund recovered much of the poorer short-term performance measured over the prior year.
Long term performance for our retail funds remains strong and the funds are performing in line with expectations and their benchmarks.
Table 13. Funds – performance1, 2 2020/(2019) Quartile ranking3 over 1 year 3 years 5 years
Rathbone Ethical Bond Fund 2 (1) 1 (1) 1 (1)Rathbone Global Opportunities Fund 1 (1) 1 (1) 1 (1)Rathbone Global Sustainability Fund4 1 (–) – (–) – (–)Rathbone Income Fund 2 (3) 2 (3) 3 (2)Rathbone Strategic Bond Fund 2 (4) 2 (2) 2 (2)Rathbone UK Opportunities Fund 1 (2) 2 (3) 2 (2)1. Quartile ranking data is sourced from FE Trustnet 2. Excludes multi-asset funds (for which quartile rankings are prohibited by the Investment
Association (IA)), High Quality Bond Fund, which has no relevant peer group against which to measure quartile performance, non-publicly marketed funds and segregated mandates
3. Ranking of institutional share classes at 31 December 2020 and 2019 against other funds in the same IA sector, based on total return performance, net of fees (consistent with investment performance information reported in the funds’ monthly factsheets)
4. Rathbone Global Sustainability Fund was launched on 19 July 2018, therefore performance figures for periods beyond one year are not available. Over the period since launch, the fund is ranked in the 1st quartile.
5. Funds included in the above table account for 65% of the total FUM of the Funds business
As at 31 December 2020, 97% of holdings in Funds’ retail funds were in institutional units (31 December 2019: 95%).
During the year, the total number of investment professionals in Funds increased to 18 at 31 December 2020 from 15 at the end of 2019.
Financial performance Funds’ income is primarily derived from annual management charges, which are calculated on the daily value of funds under management, net of rebates payable to intermediaries.
Table 14. Funds – financial performance
2020
£m 2019
£m
Net annual management charges 43.9 36.1 Net dealing profits 0.0 0.2 Interest and other income 1.5 0.9 Underlying operating income 45.4 37.2 Underlying operating expenses1 (32.3) (26.9)Underlying profit before tax 13.1 10.3 Operating % margin2 28.9% 27.7% 1. See table 15 2. Underlying profit before tax divided by underlying operating income
Net annual management charges increased 21.6% to £43.9 million in 2020, driven principally by the rise in average funds under management. Net annual management charges as a percentage of average funds under management fell to 54 bps (2019: 56 bps) reflecting the increased proportion of holdings in institutional units and the continued growth in the fixed income mandate funds.
Underlying operating income as a percentage of average funds under management and administration fell to 55 bps in 2020 from 56 bps in 2019 for the same reasons.
Table 15. Funds – underlying operating expenses
2020
£m 2019
£m
Staff costs – Fixed 4.1 3.8 – Variable 12.0 8.7 Total staff costs 16.1 12.5 Other operating expenses 16.2 14.4 Underlying operating expenses 32.3 26.9 Underlying cost/income ratio1 71.1% 72.3% 1. Underlying operating expenses as a percentage of underlying operating income
(see table 14)
Fixed staff costs of £4.1 million for the year ended 31 December 2020 were 7.9% higher than 2019. This reflects salary inflation and growth in headcount in response to regulatory changes and growth in the business.
Variable staff costs of £12.0 million were 37.9% higher than 2019 as a result of growth in profit and the higher value of gross sales, which drove increases in sales commissions.
Other operating expenses have increased by 12.5% to £16.2 million in 2020. Growth in administration costs of £0.6 million, driven by higher levels of funds under management and sales, was contained by negotiation of more competitive rates with third-party service providers early in the year. Regulatory costs also grew by £0.3 million, reflecting the growth in levies for the Financial Services Compensation Scheme.
rathbones.com 41

Financial position
42 Rathbone Brothers Plc Report and accounts 2020
Table 16. Group’s financial position
2020 £m
(unless stated)
2019£m
(unless stated)
Own funds: – Common Equity Tier 1 ratio1 23.5% 22.0% – Total Own Funds ratio2 24.3% 23.3% – Total equity 513.8 485.4 – Tier 2 subordinated loan notes3 19.8 19.9 – Total risk exposure amount 1,247.8 1,209.0 – Leverage ratio4 9.2% 8.3% Other resources: – Total assets 3,370.6 3,398.7 – Treasury assets5 2,721.1 2,817.1 – Investment management loan book6 158.0 132.0 – Intangible assets from
acquired growth7 218.0 214.9 – Tangible assets and software8 28.0 28.4 Liabilities: – Due to customers9 2,561.8 2,668.6 – Net defined benefit pension liability 9.8 8.0 1. Common Equity Tier 1 capital as a proportion of total risk exposure amount 2. Total own funds (see table 17) as a proportion of total risk exposure amount 3. Represents the carrying value of the Tier 2 loan notes (see note 28) 4. Common Equity Tier 1 capital as a percentage of total assets, excluding intangible assets,
plus certain off balance sheet exposures 5. Balances with central banks, loans and advances to banks and investment securities 6. See note 16 to the financial statements 7. Net book value of acquired client relationships and goodwill (note 22) 8. Net book value of property, plant and equipment and computer software (notes 19
and 22) 9. Total amounts of cash in client portfolios held by Rathbone Investment Management as a
bank (note 24)
Own funds Rathbones is classified as a banking group for regulatory capital purposes and is therefore required to operate within the restrictions on capital resources and banking exposures prescribed by the Capital Requirements Regulation, as applied in the UK by the Prudential Regulation Authority (PRA).
At 31 December 2020, the group’s regulatory own funds (including verified profits for the year) were £304 million (2019: £282 million).
Table 17. Regulatory own funds
2020
£m 2019
£m
Share capital and share premium 218.0 213.8 Reserves 342.6 313.6 Less: Own shares (46.7) (42.0)Intangible assets1 (220.7) (218.9)Common Equity Tier 1 own funds 293.2 266.5 Tier 2 own funds 10.7 15.7 Total own funds 303.9 282.2
1. Net book value of goodwill, client relationship intangibles and software is deducted directly from own funds, less any related deferred tax
Common Equity Tier 1 (CET1) own funds increased by £26.5 million during 2020, due to the inclusion of verified retained profits for the 2020 financial year.
The CET1 ratio was 23.5%, an increase on the 22.0% reported at the previous year end. Our consolidated CET1 ratio remains higher than the banking industry norm, reflecting the low-risk nature of our banking activity.
The leverage ratio was 9.2% at 31 December 2020, compared to 8.3% at 31 December 2019. The leverage ratio represents our CET1 capital as a percentage of our total assets, excluding intangible assets, plus certain off balance sheet exposures. The ratio has increased during the year in line with the increase in CET1 capital.
The business is primarily funded by equity, but also supported by £20 million of 10 year Tier 2 subordinated loan notes. The notes introduce a small amount of gearing into our balance sheet as a way of financing future growth in a cost-effective and capital-efficient manner. They are repayable in August 2025, with a call option for the issuer annually each August. Interest is payable at a fixed margin of 4.375% over six-month LIBOR (note 30). As they are now within 5 years of their maturity date, they are amortised on a straight-line basis for capital eligibility purposes over these last 5 years.
The consolidated balance sheet total equity was £514 million at 31 December 2020, up 5.9% from £485 million at the end of 2019, primarily reflecting the retained profits for the year.
Own funds and liquidity requirements As required under PRA rules, we perform an Internal Capital Adequacy Assessment Process (ICAAP) and Internal Liquidity Adequacy Assessment Process (ILAAP) annually, which include performing a range of stress tests to determine the appropriate level of regulatory capital and liquidity that we need to hold. In addition, we monitor a wide range of capital and liquidity statistics on a daily, monthly or less frequent basis as required. Surplus capital levels are forecast on a monthly basis, taking account of proposed dividends and investment requirements, to ensure that appropriate buffers are maintained. Investment of proprietary funds is controlled by our treasury department.
We are required to hold capital to cover a range of own funds requirements.
Table 18. Group’s own funds requirements1
2020
£m 2019
£m
Credit risk requirement 46.9 46.5 Market risk requirement 0.6 0.4 Operational risk requirement 52.4 49.8 Pillar 1 own funds requirement 99.9 96.7 Pillar 2A own funds requirement 40.0 39.8 Total Capital Requirement (‘TCR’) 139.9 136.5
Combined buffer:– capital conservation buffer (CCB) 31.1 30.2
– countercyclical capital buffer (CCyB) 0.1 11.3
Total Capital Requirement (‘TCR’) and Combined buffer 171.1 178.0
1. Own funds requirements stated above include the impact of trading results and changes to requirements and buffers that were known as at 31 December and which became effective prior to the publication of the preliminary results
Financial position
42 Rathbone Brothers Plc Report and accounts 2020
Strategic report |

Financial position
42 Rathbone Brothers Plc Report and accounts 2020
Table 16. Group’s financial position
2020 £m
(unless stated)
2019£m
(unless stated)
Own funds: – Common Equity Tier 1 ratio1 23.5% 22.0% – Total Own Funds ratio2 24.3% 23.3% – Total equity 513.8 485.4 – Tier 2 subordinated loan notes3 19.8 19.9 – Total risk exposure amount 1,247.8 1,209.0 – Leverage ratio4 9.2% 8.3% Other resources: – Total assets 3,370.6 3,398.7 – Treasury assets5 2,721.1 2,817.1 – Investment management loan book6 158.0 132.0 – Intangible assets from
acquired growth7 218.0 214.9 – Tangible assets and software8 28.0 28.4 Liabilities: – Due to customers9 2,561.8 2,668.6 – Net defined benefit pension liability 9.8 8.0 1. Common Equity Tier 1 capital as a proportion of total risk exposure amount 2. Total own funds (see table 17) as a proportion of total risk exposure amount 3. Represents the carrying value of the Tier 2 loan notes (see note 28) 4. Common Equity Tier 1 capital as a percentage of total assets, excluding intangible assets,
plus certain off balance sheet exposures 5. Balances with central banks, loans and advances to banks and investment securities 6. See note 16 to the financial statements 7. Net book value of acquired client relationships and goodwill (note 22) 8. Net book value of property, plant and equipment and computer software (notes 19
and 22) 9. Total amounts of cash in client portfolios held by Rathbone Investment Management as a
bank (note 24)
Own funds Rathbones is classified as a banking group for regulatory capital purposes and is therefore required to operate within the restrictions on capital resources and banking exposures prescribed by the Capital Requirements Regulation, as applied in the UK by the Prudential Regulation Authority (PRA).
At 31 December 2020, the group’s regulatory own funds (including verified profits for the year) were £304 million (2019: £282 million).
Table 17. Regulatory own funds
2020
£m 2019
£m
Share capital and share premium 218.0 213.8 Reserves 342.6 313.6 Less: Own shares (46.7) (42.0)Intangible assets1 (220.7) (218.9)Common Equity Tier 1 own funds 293.2 266.5 Tier 2 own funds 10.7 15.7 Total own funds 303.9 282.2
1. Net book value of goodwill, client relationship intangibles and software is deducted directly from own funds, less any related deferred tax
Common Equity Tier 1 (CET1) own funds increased by £26.5 million during 2020, due to the inclusion of verified retained profits for the 2020 financial year.
The CET1 ratio was 23.5%, an increase on the 22.0% reported at the previous year end. Our consolidated CET1 ratio remains higher than the banking industry norm, reflecting the low-risk nature of our banking activity.
The leverage ratio was 9.2% at 31 December 2020, compared to 8.3% at 31 December 2019. The leverage ratio represents our CET1 capital as a percentage of our total assets, excluding intangible assets, plus certain off balance sheet exposures. The ratio has increased during the year in line with the increase in CET1 capital.
The business is primarily funded by equity, but also supported by £20 million of 10 year Tier 2 subordinated loan notes. The notes introduce a small amount of gearing into our balance sheet as a way of financing future growth in a cost-effective and capital-efficient manner. They are repayable in August 2025, with a call option for the issuer annually each August. Interest is payable at a fixed margin of 4.375% over six-month LIBOR (note 30). As they are now within 5 years of their maturity date, they are amortised on a straight-line basis for capital eligibility purposes over these last 5 years.
The consolidated balance sheet total equity was £514 million at 31 December 2020, up 5.9% from £485 million at the end of 2019, primarily reflecting the retained profits for the year.
Own funds and liquidity requirements As required under PRA rules, we perform an Internal Capital Adequacy Assessment Process (ICAAP) and Internal Liquidity Adequacy Assessment Process (ILAAP) annually, which include performing a range of stress tests to determine the appropriate level of regulatory capital and liquidity that we need to hold. In addition, we monitor a wide range of capital and liquidity statistics on a daily, monthly or less frequent basis as required. Surplus capital levels are forecast on a monthly basis, taking account of proposed dividends and investment requirements, to ensure that appropriate buffers are maintained. Investment of proprietary funds is controlled by our treasury department.
We are required to hold capital to cover a range of own funds requirements.
Table 18. Group’s own funds requirements1
2020
£m 2019
£m
Credit risk requirement 46.9 46.5 Market risk requirement 0.6 0.4 Operational risk requirement 52.4 49.8 Pillar 1 own funds requirement 99.9 96.7 Pillar 2A own funds requirement 40.0 39.8 Total Capital Requirement (‘TCR’) 139.9 136.5
Combined buffer:– capital conservation buffer (CCB) 31.1 30.2
– countercyclical capital buffer (CCyB) 0.1 11.3
Total Capital Requirement (‘TCR’) and Combined buffer 171.1 178.0
1. Own funds requirements stated above include the impact of trading results and changes to requirements and buffers that were known as at 31 December and which became effective prior to the publication of the preliminary results
rathbones.com 43
Pillar 1 – minimum requirement for capital Pillar 1 focuses on the determination of a total risk exposure amount (also known as ‘risk-weighted assets’) and expected losses in respect of the group’s exposure to credit, counterparty credit, market and operational risks, and sets a minimum requirement for capital.
At 31 December 2020, the group’s total risk exposure amount was £1,248 million (2019: £1,209 million).
Pillar 2 – supervisory review process Pillar 2 supplements the Pillar 1 minimum requirement with firm-specific Pillar 2A requirements and a framework of regulatory capital buffers.
The Pillar 2A own funds requirement (which is set by the PRA and the calculation of which remains confidential with the PRA) reflects those risks, specific to the firm, which are not fully captured under the Pillar 1 own funds requirement. Our Pillar 2A own funds requirement was reviewed by the PRA during the year.
Pension obligation risk The potential for additional unplanned capital strain or costs that the group would incur in the event of a significant deterioration in the funding position of the group’s defined benefit pension schemes.
Interest rate risk in the banking book The potential losses in the non-trading book resulting from interest rate changes or widening of the spread between Bank of England base rates and LIBOR rates.
Concentration risk Greater loss volatility arising from a higher level of loan default correlation than is assumed by the Pillar 1 assessment.
The group is also required to maintain a number of regulatory capital buffers, all of which must be met with CET1 capital.
Capital conservation buffer (CCB) The CCB is a general buffer, designed to provide for losses in the event of a stress, and represents 2.5% of the group’s total risk exposure amount as at 31 December 2020.
Countercyclical capital buffer (CCyB) The CCyB is designed to act as an incentive for banks to constrain credit growth in times of heightened systemic risk. The amount of the buffer is determined by reference to rates set by the FPC from time to time, depending on prevailing market conditions, for individual countries where the group has credit risk exposures.
The buffer rate is currently set at 0% for the UK. The group also has some small, relevant credit exposures in other jurisdictions, resulting in a weighted buffer rate of 0.01% of the group’s total risk exposure amount as at 31 December 2020.
The surplus of own funds (including verified profits for the full year) over Total Capital Requirement and Combined buffer was £133 million, up from £104 million at the end of 2019.
Pillar 2B PRA buffer The PRA also determines whether any incremental firm-specific buffer is required, in addition to the CCB and the CCyB. The PRA requires any such buffer to remain confidential between the group and the PRA.
In managing the group’s regulatory capital position over the next few years, we will continue to be mindful of:
– future volatility in pension scheme valuations which affect both the level of CET1 own funds and the value of the Pillar 2A requirement for pension risk;
– regulatory developments; and – the demands of future acquisitions which generate intangible
assets and, therefore, directly reduce CET1 resources.
We keep these issues under constant review to ensure that any necessary capital-raising activities are carried out in a planned and controlled manner.
The group’s Pillar 3 disclosures are published annually on our website (rathbones.com/investor-relations/results-and-presentations) and provide further details about regulatory capital resources and requirements.
Total assets Total assets at 31 December 2020 were £3.4 billion (2019: £3.4 billion), of which £2.6 billion (2019: £2.7 billion) represents the investment in the money markets of the cash element of client portfolios that is held as a banking deposit.
Treasury assets As a licensed deposit taker, Rathbone Investment Management holds our surplus liquidity on its balance sheet together with clients’ cash. Cash in client portfolios as held on a banking basis of £2.6 billion (2019: £2.7 billion) represented 5.7% of total Investment Management funds under management and administration at 31 December 2020, compared to 6.2% at the end of 2019. Cash held in client money accounts was £5.5 million (2019: £5.7 million).
The treasury department of Rathbone Investment Management, reporting through the banking committee to the board, operates in accordance with procedures set out in a board-approved treasury manual and monitors exposure to market, credit and liquidity risk as described in note 33 to the financial statements. It invests in a range of securities issued by a relatively large number of counterparties. These counterparties must be single-‘A’-rated or higher by Fitch at the time of investment and are regularly reviewed by the banking committee.
During the year, the share of treasury assets held with the Bank of England reduced to £1.8 billion from £1.9 billion at 31 December 2019. Liquidity in client portfolios fell towards the end of the year and we increased our holdings in certificates of deposit by £50 million over the course of the year.
rathbones.com 43

44 Rathbone Brothers Plc Report and accounts 2020
Loans to clients Loans are provided as a service to Investment Management clients who have short- to medium-term cash requirements. Such loans are normally made on a fully secured basis against portfolios held in our nominee name, requiring two times cover, and are usually advanced for up to one year (see note 18 to the financial statements). In addition, charges may be taken on property held by the client to meet security cover requirements.
Our ability to provide such loans is a valuable additional service, for example, to clients who require bridging finance when buying and selling their homes.
Loans advanced to clients increased to £158.0 million at end of 2020 (2019: £132.0 million) as clients demand for bridging finance increased in favour of drawing down from investment portfolios at a time of market volatility.
Intangible assets Intangible assets arise principally from acquired growth in funds under management and administration and are categorised as goodwill and client relationships. Intangible assets reported on the balance sheet also include purchased and developed software.
At 31 December 2020, the total carrying value of intangible assets arising from acquired growth was £218 million (2019: £215 million). During the year, client relationship intangible assets of £11.0 million were capitalised (2019: £5.3 million), including £6.9 million in relation to the Personal Injury and Court of Protection business of Barclays. Goodwill of £6.5 million was acquired during the year in relation to this acquisition (2019: £nil).
Client relationship intangibles are amortised over the estimated life of the client relationship, generally a period of 10 to 15 years. When client relationships are lost, any related intangible asset is derecognised in the year. The total amortisation charge for client relationships in 2020, including the impact of any lost relationships, was £14.3 million (2019: £15.4 million).
Goodwill, which arises from business combinations, is not amortised but is subject to a test for impairment at least annually. During the prior year, the goodwill relating to the trust and tax business was found to be impaired as the growth forecasts for that business have not kept pace with cost inflation. No goodwill was identified as impaired during the year. Further detail is provided in note 24 to the financial statements.
Capital expenditure During 2020, we have maintained the overall level of investment in the development of our systems and premises, with capital expenditure for the year totalling £11.7 million (2019: £11.6 million). Capital expenditure in 2020 included £1.4 million to facilitate remote working. The level of capital spend on regulatory driven projects and premises improvements reduced by a commensurate amount.
Total costs for the purchase and development of software were £7.9 million in the year (2019: £8.6 million) as work continued on the development of our digital capability.
Overall, new investment accounted for approximately 88% of total capital expenditure in 2020, compared with 84% in 2019, with the balance of total spend incurred for the maintenance and replacement of existing software and equipment.
Right-of-use assets Following the adoption of IFRS 16, the group is required to recognise each lease with a term of more than 12 months as a right-of-use lease asset on its balance sheet, along with a corresponding financial liability representing its obligation to make future lease payments.
As at 1 January 2020, the group recognised right-of-use assets of £54.3 million, largely representing the leases for premises occupied by the group. During 2020, additions of £0.3 million were made.
Right-of-use assets are generally depreciated over the lease term (or the expected life of the asset, if shorter). The total depreciation charge for right-of-use assets in 2020 was £4.9 million.
Defined benefit pension schemes We operate two defined benefit pension schemes, both of which have been closed to new members for several years. With effect from 30 June 2017, we closed both schemes, ceasing all future benefit accrual and breaking the link to salary.
At 31 December 2020 the combined schemes’ liabilities, measured on an accounting basis, had increased to £165.4 million, up 4.0% from £159.1 million at the end of 2019, primarily reflecting the decrease in interest rates used to discount the liabilities during the year. The reported position of the schemes as at 31 December 2020 was a deficit of £9.8 million (2019: deficit of £8.0 million).
Triennial funding valuations form the basis of the annual contributions that we make into the schemes. Funding valuations of the schemes as at 31 December 2019 were completed during the year. Having reviewed the long-term plan for the schemes, we have agreed with the trustees a target to fund the schemes to a self-sufficient basis over the medium term. This targets a level of assets in the scheme sufficient to fund future cash flows from interest and maturities of the scheme assets, reducing the reliance on equity returns to meet the schemes’ requirements. This will significantly reduce the volatility of the schemes and the future burden on the group. Reflecting this, we agreed a schedule of contributions totalling £25 million over the next six years. This schedule will be reviewed at the next triennial valuations, as at 31 December 2022.
Financial position continued
44 Rathbone Brothers Plc Report and accounts 2020
Strategic report |

44 Rathbone Brothers Plc Report and accounts 2020
Loans to clients Loans are provided as a service to Investment Management clients who have short- to medium-term cash requirements. Such loans are normally made on a fully secured basis against portfolios held in our nominee name, requiring two times cover, and are usually advanced for up to one year (see note 18 to the financial statements). In addition, charges may be taken on property held by the client to meet security cover requirements.
Our ability to provide such loans is a valuable additional service, for example, to clients who require bridging finance when buying and selling their homes.
Loans advanced to clients increased to £158.0 million at end of 2020 (2019: £132.0 million) as clients demand for bridging finance increased in favour of drawing down from investment portfolios at a time of market volatility.
Intangible assets Intangible assets arise principally from acquired growth in funds under management and administration and are categorised as goodwill and client relationships. Intangible assets reported on the balance sheet also include purchased and developed software.
At 31 December 2020, the total carrying value of intangible assets arising from acquired growth was £218 million (2019: £215 million). During the year, client relationship intangible assets of £11.0 million were capitalised (2019: £5.3 million), including £6.9 million in relation to the Personal Injury and Court of Protection business of Barclays. Goodwill of £6.5 million was acquired during the year in relation to this acquisition (2019: £nil).
Client relationship intangibles are amortised over the estimated life of the client relationship, generally a period of 10 to 15 years. When client relationships are lost, any related intangible asset is derecognised in the year. The total amortisation charge for client relationships in 2020, including the impact of any lost relationships, was £14.3 million (2019: £15.4 million).
Goodwill, which arises from business combinations, is not amortised but is subject to a test for impairment at least annually. During the prior year, the goodwill relating to the trust and tax business was found to be impaired as the growth forecasts for that business have not kept pace with cost inflation. No goodwill was identified as impaired during the year. Further detail is provided in note 24 to the financial statements.
Capital expenditure During 2020, we have maintained the overall level of investment in the development of our systems and premises, with capital expenditure for the year totalling £11.7 million (2019: £11.6 million). Capital expenditure in 2020 included £1.4 million to facilitate remote working. The level of capital spend on regulatory driven projects and premises improvements reduced by a commensurate amount.
Total costs for the purchase and development of software were £7.9 million in the year (2019: £8.6 million) as work continued on the development of our digital capability.
Overall, new investment accounted for approximately 88% of total capital expenditure in 2020, compared with 84% in 2019, with the balance of total spend incurred for the maintenance and replacement of existing software and equipment.
Right-of-use assets Following the adoption of IFRS 16, the group is required to recognise each lease with a term of more than 12 months as a right-of-use lease asset on its balance sheet, along with a corresponding financial liability representing its obligation to make future lease payments.
As at 1 January 2020, the group recognised right-of-use assets of £54.3 million, largely representing the leases for premises occupied by the group. During 2020, additions of £0.3 million were made.
Right-of-use assets are generally depreciated over the lease term (or the expected life of the asset, if shorter). The total depreciation charge for right-of-use assets in 2020 was £4.9 million.
Defined benefit pension schemes We operate two defined benefit pension schemes, both of which have been closed to new members for several years. With effect from 30 June 2017, we closed both schemes, ceasing all future benefit accrual and breaking the link to salary.
At 31 December 2020 the combined schemes’ liabilities, measured on an accounting basis, had increased to £165.4 million, up 4.0% from £159.1 million at the end of 2019, primarily reflecting the decrease in interest rates used to discount the liabilities during the year. The reported position of the schemes as at 31 December 2020 was a deficit of £9.8 million (2019: deficit of £8.0 million).
Triennial funding valuations form the basis of the annual contributions that we make into the schemes. Funding valuations of the schemes as at 31 December 2019 were completed during the year. Having reviewed the long-term plan for the schemes, we have agreed with the trustees a target to fund the schemes to a self-sufficient basis over the medium term. This targets a level of assets in the scheme sufficient to fund future cash flows from interest and maturities of the scheme assets, reducing the reliance on equity returns to meet the schemes’ requirements. This will significantly reduce the volatility of the schemes and the future burden on the group. Reflecting this, we agreed a schedule of contributions totalling £25 million over the next six years. This schedule will be reviewed at the next triennial valuations, as at 31 December 2022.
Liquidity and cash flow
rathbones.com 45
Table 19. Extracts from the consolidated statement of cash flows
2020
£m 2019
£m
Cash and cash equivalents at the end of the year 2,056.7 2,148.0
Net cash inflows from operating activities 32.0 499.6 Net change in cash and cash equivalents (44.6) 739.5
Fees and commissions are largely collected directly from client portfolios and a significant proportion of expenses are predictable. Consequently, we operate with a modest amount of working capital. Larger cash flows are principally generated from banking and treasury operations when investment managers make asset allocation decisions about the amount of cash to be held in client portfolios.
As a bank, we are subject to the PRA’s ILAAP regime, which requires us to hold a suitable Liquid Assets Buffer to ensure that short-term liquidity requirements can be met under certain stressed scenarios. Liquidity risks are actively managed on a daily basis and depend on operational and investment transaction activity.
Cash and balances at central banks was £1.8 billion at 31 December 2020 (2019: £1.9 billion).
Cash and cash equivalents, as defined by accounting standards, includes cash, money market funds and banking deposits, which had an original maturity of less than three months (see note 40 to the financial statements). Consequently, cash flows, as reported in the financial statements, include the impact of capital flows in treasury assets.
Net cash flows from operating activities reflect a £106.0 million decrease in banking client deposits (2019: £442.6 million increase), as a result of asset allocation decisions to reduce the proportion of funds under management and administration held as cash in clients’ portfolios, reflecting market conditions at the year end.
Cash flows from investing activities also included a net outflow of £53.1 million from the purchase of certificates of deposit (2019: net inflow of £303.9 million), as we reduced the proportion of treasury assets held with the Bank of England.
The most significant non-operating cash flows during the year were as follows:
– outflows relating to the payment of dividends of £37.8 million (2019: £36.0 million);
– payments made (net of cash acquired) in business combinations of £12.0 million (2019: £nil);
– outflows relating to payments to acquire intangible assets (other than as part of a business combination) of £9.5 million (2019: £14.9 million); and
– £3.8 million of capital expenditure on tangible property, plant and equipment (2019: £3.5 million).
rathbones.com 45

Risk management and control
Our approach to risk management continued to develop in 2020, and we have adapted to the impact COVID-19 has had on the firm. Our risk governance, processes and infrastructure ensured that risk management across the group was appropriate to existing and emerging challenges to the firm’s strategic objectives and day-to-day activities. Our primary focus going into 2021 will be to continue managing risk effectively in accordance with our risk appetite and for the long term, to meet the expectations of all of our stakeholders.
Risk management and control
In line with our strategy, the current economic outlook and the evolving regulatory landscape within the sector, the board remains committed to having a relatively low overall appetite for risk and ensuring that our internal controls mitigate risk to appropriate levels. The board recognises our performance is susceptible to fluctuations in investment markets and has the potential to bear losses from financial and operational risks from time to time, either as reductions in income or increases in operating costs.
Managing riskThe board is ultimately accountable for risk management and regularly considers the most significant risks and emerging threats to the group’s strategy and objectives. In addition, the audit and group risk committees exercise further oversight of and challenge to existing risk management and internal control. The board delegates day-to-day responsibility for managing risk across the business to the chief executive and executive committee. Our executive risk committee provides further challenge to and oversight of financial and non-financial risks (conduct and operational risk), while the banking committee oversees financial risk management. Both committees meet monthly, reporting into both the executive committee and group risk committee.
Throughout the group, all employees have a responsibility for managing risk and adhering to our control framework.
Three lines of defenceWe operate a three lines of defence model across the group to support governance and risk management. The comments below outline our expectations across the firm, with responsibility and accountability for risk management broken down as follows:
First lineSenior management, business operations and support functions are responsible for managing risks, by developing and maintaining effective internal controls to mitigate risk in line with risk appetite.
Second lineRisk, compliance and anti-money laundering functions maintain a level of independence from the first line and are responsible for providing oversight of and challenge to the first line’s day-to-day management, including monitoring and reporting of risks to both senior management and governing bodies.
Responding to COVID-19We faced multiple risks arising from the COVID-19 pandemic. We focused on service to clients, the reliability of business operations and the wellbeing of our colleagues, although this required some agility as the risk profile changed. Overall, the firm has responded well so far, although we remain alert to future uncertainty and will adapt as required to the changing landscape. The board, executive and risk committees have been fully supportive and engaged throughout to ensure that our staff are protected, our operations are resilient and the risk of material disruption to our client services has been mitigated.
Risk cultureThe risk culture embedded across the group continues to enhance the effectiveness of risk management and decision-making at all levels. The board sets the right tone, which supports a strong risk culture and, through our senior management team, encourages appropriate behaviours and collaboration on managing risk across the business. Risk management is part of everyone’s day-to-day responsibilities and activities; it is linked to performance and development, as well as to the group’s remuneration and reward schemes. Our approach creates an open and transparent working environment, encouraging employees to engage positively in risk management and support the achievement of our strategic objectives.
Risk appetiteRisk appetite is defined as the amount and type of risk the group is prepared to take or accept in pursuit of our long-term strategic objectives.
The board, executive committee and group risk committee regularly review and, at least annually, formally approve the group’s risk appetite statement, ensuring it remains consistent with our strategy and objectives. Our appetite framework is aligned with the group’s overall prudential requirements for strategic, financial and non-financial risk (conduct and operational), and specific appetite measures are set for each principal risk. Risks which have triggered key risk indicators or risk appetite measures are reported and escalated in accordance with our framework to the executive committee, group risk committee and the board as appropriate, so that risk mitigation can be reviewed and strengthened if needed.
46 Rathbone Brothers Plc Report and accounts 2020
Strategic report |

Across the year our risk assessment process considers both the impact and likelihood of risk events materialising which could affect the delivery of strategic goals and annual business plans. A top-down and bottom-up approach ensures that our assessment of Level 2 risk categories and detailed Level 3 risks is challenged and reviewed on a regular basis. The board, executive committee and executive risk committee receive regular reports and information from senior management, operational business units, risk oversight functions and specific risk committees to support this assessment.
We have a consistent approach to identifying and assessing our Level 3 risks on both an inherent and residual basis over a three-year period and against a number of different impact criteria, including financial, client, operations, reputation, strategy and regulation indicators. A residual risk exposure and overall risk profile rating of high, medium, low or very low is then derived for the three-year period including consideration of the internal control environment and/or insurance mitigation. The assessment of our control environment, undertaken by senior management within the firm, includes contributions from first, second and third line people, data, monitoring and/or assurance activity.
Senior management also maintain a watch list as part of our approach to identify and assess any current, emerging or future issues, threats, business developments and regulatory or legislative change, which will or could have the potential to impact the firm’s current or future risk profile. Any material changes may require active risk management, usually through process changes or systems development. The group’s risk profile, risk register and watch list are regularly reviewed by the executive, senior management, group risk committee and the board.
Stress tests include consideration of the impact of a number of severe but plausible events that could impact the business. The work also takes account of the availability and likely effectiveness of mitigating actions that could be taken to avoid or reduce the impact or likelihood of the underlying risks materialising.
The executive risk committee, executive committee, group risk committee and other key risk-focused committees consider the risk assessments and stress tests, providing challenge on their appropriateness, which is reported through the governance framework and ultimately considered by the board.
Third lineOur internal audit function is responsible for providing independent assurance to senior management, the board and board committees as to the effectiveness of the group’s governance, risk management and internal controls.
Outside our internal lines of defence, external independent assurance is obtained, primarily through the annual statutory audit along with other ad hoc engagements which may be required during the year.
Identification of risksRegular reviews are undertaken to ensure we identify and understand all relevant material risks which have the potential to impact future performance and the delivery of our strategic objectives and business priorities. We use a three-level hierarchical model and this year have enhanced our risk classification, so that it continues to reflect the current and future risk profile of the group. Our highest level of risk (Level 1) comprises business and strategic, financial, conduct and operational risks. Our next level (Level 2) contains 20 risk categories allocated to a Level 1 risk. Detailed risks (Level 3) are identified as sub-sets of Level 2 risks. Level 3 risks are captured and maintained within our group risk register.
We recognise that some Level 2 and Level 3 risks have features which need to be considered under more than one Level 1 risk, and our framework facilitates this through a system of primary and secondary considerations. Risk exposures and our overall risk profile are reviewed and monitored regularly, with risk owners, senior management and business units across the group considering the potential impact, existing internal controls and management actions required to mitigate the impact and likelihood of emerging issues and future events.
Risk assessment processThe board and senior management are actively involved in a continuous risk assessment process as part of our risk management framework, supported by the Internal Capital Adequacy Assessment Process (ICAAP) and Internal Liquidity Adequacy Assessment Process (ILAAP) work, which assesses the principal risks facing the group.
Three lines of defenceOverviewExternal independent assurance
Executive risk committee
Executive committee
Audit and group risk committee
First line: Business operations and support
Second line: Oversight and challenge functions
Third line: Internal independent assurance
rathbones.com 47

Profile and mitigation of principal risksOur risks are classified hierarchically in a three-level model. Following a review of our risk taxonomy in 2020 we have established four Level 1 risks, 20 Level 2 risks and 53 Level 3 risks. This approach to managing risk is underpinned by an understanding of our current risk exposures and consideration of how risks change over time. Our risks form the basis of the group’s risk register, and to identify and manage our principal risks, reviews take place with risk owners, senior management, business units and committees across the group. The firm’s senior management and risk function conduct these reviews regularly during the year.
The group’s underlying risk profile has fluctuated during this extraordinary year; however, ratings for the majority of Level 2 risks have stabilised, given our ability to respond and adapt to the challenges presented by the COVID-19 pandemic and the UK Government’s actions impacting firms. We prioritised client service, operational resilience and employee wellbeing, adjusting our operating model and processes to ensure we continued to effectively manage client assets and focus on volatile investment markets. In addition, the firm has continually monitored and responded to the uncertainty implied by the potential for a hard Brexit at the end of the transition period. While a degree of uncertainty remains around a deal on financial services between the UK and EU, our business operating model has not been seriously impacted. We will however continue to monitor how the future longer-term relationship between the UK and EU evolves. The following table identifies the most important changes to risk ratings during the year.
Based upon our risk assessment processes and notwithstanding the impact on business and wider society of COVID-19, the board believes that the principal risks and uncertainties facing the group which could impact the delivery of our strategic objectives have been identified below. These risks reflect the continued focus in 2020 on our strategic initiatives, the sustainability of our business model and client suitability in general; and more specifically towards environmental and societal challenges, the ever-changing cyber threat landscape, operational resilience in relation to our suppliers, and the macroeconomic environment. The board remains as vigilant as ever to risks that arise from the longer-term impact of COVID-19 on our business, society and the economy, and also to regulatory risks that, in turn, may arise from the continuing development of law, regulation and standards in our sector.
Our overall risk profile and the control environment for principal risks are described below. The board receives assurance from first line senior management that the systems of internal control are operating effectively and from the activities of the second line and third line that there are no material control issues which would affect the board’s view of its principal risks and uncertainties.
We include in the tables the potential impacts (I) the firm might face and our assessment of the likelihood (L) of each principal risk crystallising. These assessments take into account the controls in place to mitigate the risks. However, as is always the case, should a risk materialise, a range of outcomes (both in scale and type) might be experienced. This is particularly relevant for firms such as Rathbones where the outcome of a risk event can be influenced by market conditions as well as internal control factors.
Risk management and control continued
Key changes to risk profileRisk Description of change Risk change in 2020
Sustainability This risk was developed in our taxonomy in 2020 and was defined as the risk that the business model does not respond in an optimal manner to changing market conditions, including environmental and social factors, such that sustainable growth, market share or profitability is adversely affected.
People People risk increased in 2020 as a direct result of the pandemic. Although this has been mitigated by management action, and employee feedback during the year has been positive.
Information security and cyber
Although the external threat landscape continues to evolve, we continue to invest in improving our security posture, including staff awareness, preparedness and technology developments.
Suitability Process improvements have been made in 2020, in part to simplify workflows as a result of COVID-19. Further enhancements are expected in 2021.
Third-party supplier
This risk increased during 2020 as a result of the COVID-19 pandemic and Brexit, and also in part due to legislative changes which could have impacted on service. However, our key suppliers have been able to maintain service and together we have mitigated the risk of any material disruption to our operations.
48 Rathbone Brothers Plc Report and accounts 2020
Strategic report |

We have used ratings of high, medium, low and very low in this risk assessment. We perceive as high-risk items those which have the potential to impact the delivery of strategic objectives, with medium-, low- and very low-rated items having proportionately less impact on the firm. Likelihood is similarly based on a qualitative assessment.
Emerging risks and threatsIn 2020, we developed a new approach to monitor strategic risks and horizon threats. This was reviewed by the Board and the approach will be maintained in 2021.
Emerging risks, including legislative and regulatory change, which have the potential to impact the group and delivery of our strategic objectives, are monitored through our watch list. During the year, the executive committee continued to recognise and respond to a number of emerging risks and threats to the financial services sector as a whole and to our business.
The board and executive also recognise that actions will be required to better understand longer-term climate change risks, both physical and transitional, along with sustainability risks associated with our strategy, business model and operations. This will be an area of specific focus during 2021 and will include maintaining a climate change risk assessment as part of the wider risk management framework and process.
The group’s view is that we can reasonably expect current market conditions and uncertainties to remain throughout 2021, given the implications of COVID-19 and Brexit. We are also monitoring the political discussion around Scottish independence. Other evolving risks remain stable and continue to include cyber threats, changing regulatory expectations and further scenarios potentially arising from geopolitical developments, along with continuing tensions and uncertainty around global trade.
Principal risksThe most significant risks which could impact the delivery of our strategy and annual business plans are detailed below. The potential impacts (I) the firm might face and our assessment of the likelihood (L) of each principal risk crystallising are included in the table. Some of these risks increased at some stage in 2020, although they have since stabilised.
Residual rating
Level 2 risk How the risk arises I L Control environment
CreditThe risk that one or more counterparties fail to fulfil contractual obligations, including stock settlement
This risk can arise from placing funds with other banks and holding interest-bearing securities. There is also a limited level of lending to clients
High Low — Banking committee and senior management oversight
— Counterparty limits and credit reviews — Treasury policy and procedures — Client lending policy and procedures — Active monitoring of exposures — Annual ICAAP
PensionThe risk that the cost of funding our defined benefit pension schemes increases, or their valuation affects dividends, reserves and regulatory own funds
This risk can arise through a sustained deficit between the schemes’ assets and liabilities. A number of factors impact a deficit, including increased life expectancy, falling interest rates and falling asset values
High Med — Board, senior management and trustee oversight
— Monthly valuation estimates — Triennial independent actuarial valuations — Investment policy — Senior management review and defined management actions
— Annual ICAAP
ChangeThe risk that the change portfolio does not support delivery of the group’s strategy
This risk can arise if the business is too aggressive and unstructured in its change programme to manage project risks, or fails to make available the capacity and capabilities to deliver business benefits
High Med — Executive and board oversight of material change programmes
— Transformation Office Programme Board oversight and delivery-focused operating model
— Documented strategic and business change programmes
— Dedicated change delivery function, use of internal and, where required, external subject matter experts
— Two-stage assessment, challenge and approval of project plans
— Documented project and change procedures
rathbones.com 49

Risk management and control continued
Residual rating
Level 2 risk How the risk arises I L Control environment
SustainabilityThe risk that the business model does not respond in an optimal manner to changing market conditions, including environmental and social factors, such that sustainable growth, market share or profitability is adversely affected
This risk can arise from strategic decisions which fail to consider the current operating environment, our stakeholders’ expectations, or can be influenced by external factors such as environmental and social factors, material changes in regulation or legislation within the financial services sector
High Med — Board, executive and responsible business committee oversight
— A documented strategy, including responsible investment policy
— Annual business targets, subject to regular review and challenge
— Regular reviews of pricing structure — Continued investment in the investment process, service standards and marketing
— Trade body participation — Regular competitor benchmarking and analysis
Regulatory compliance and legalThe risk of failure by the group or a subsidiary to fulfil its regulatory or legal requirements and comply with the introduction of new or updated regulations and laws
This risk can arise from failures by the business to comply with existing regulation or failure to identify and react to regulatory change
High Med — Board and executive oversight — Management oversight and active involvement with industry bodies
— Compliance monitoring programme to examine the control of key regulatory risks
— Separate anti-money laundering function with specific responsibility
— Oversight of industry and regulatory developments — Documented policies and procedures — Staff training and development
SuitabilityThe risk of an unsuitable client outcome either through service, investment mandate, investment decisions taken, investment recommendations made or portfolio or fund construction
This risk can arise through failure to appropriately understand the wealth management needs of our clients, or failure to apply suitable advice or investment strategies
High Med — Board, executive and general managers committee oversight
— Investment governance and structured committee oversight
— Management oversight and segregated quality assurance and performance teams
— Performance measurement and attribution analysis — ‘Know your client’ (KYC) suitability processes — Weekly investment management meetings — Investment manager reviews through supervisor sampling
— Compliance monitoring
Information security and cyberThe risk of inappropriate access to, manipulation, or disclosure of, client or company-sensitive information
This risk can arise from the firm failing to maintain and keep secure sensitive and confidential data through its operating infrastructure, including the activities of employees, and through the management of cyber threats
High Med — Board and executive oversight — Data governance committee oversight — Information security policy, data protection policy and associated procedures
— System access controls and encryption — Penetration testing and multi-layer network security — Training and employee awareness programmes — Physical security
PeopleThe risk of loss of key staff, lack of skilled resources or inappropriate behaviour or actions. This could lead to lack of capacity or capability threatening the delivery of business objectives, or to behaviour leading to complaints, litigation or regulatory action
This risk can arise across all areas of the business as a result of resource management failures or from external factors such as increased competition or material changes in regulation
High Med — Board and executive oversight — Succession and contingency planning — Transparent, consistent and competitive remuneration schemes
— Contractual clauses with restrictive covenants — Continual investment in staff training and development
— Employee engagement survey — Appropriate balanced performance measurement system
— Culture monitoring and reporting
50 Rathbone Brothers Plc Report and accounts 2020
Strategic report |

Assessment of the company’s prospectsThe board reviews its strategic plan annually. This, alongside the ICAAP and ILAAP, forms the basis for capital planning which is discussed periodically with the Prudential Regulation Authority (PRA).
During the year, the board has considered a number of stress tests and scenarios which focus on material or severe but plausible events that could impact the business and the company’s financial position. The board also considers the plans and procedures in place in the event that contingency funding is required to replenish regulatory capital. On a monthly basis, critical capital projections and sensitivities have been refreshed and reviewed, taking into account current or expected market movements and business developments.
The board’s assessment considers all the principal risks identified by the group and assesses the sufficiency of our response to all Pillar 1 risks (defined as credit, market and operational risks) to the required regulatory standards. In addition, the crystallisation of the following events were focused on for enhanced stress testing: an equity market fall, a loss of business/competitive threat, business expansion, pension obligation and a combined market fall and reputational event. The economic and commercial impacts of the global pandemic on the prospects of the company were also factored into the assessment.
The group considers the possible impacts of serious business interruption as part of its operational risk assessment process and remains mindful of the importance of maintaining its reputation. Although the business is almost wholly UK-situated, it does not suffer from any material client, geographical or counterparty concentrations.
While this stress test does not consider all of the risks that the group may face, the directors consider that this stress testing based assessment of the group’s prospects is reasonable in the circumstances of the inherent uncertainty involved.
Viability statementIn accordance with the UK Corporate Governance Code, the board has assessed the prospects and viability of the group over a three-year period considering the risk assessments identified above. The directors have considered the firm’s current position and the potential impact of the principal risks and uncertainties set out above. As part of the viability statement, the directors confirm that they have carried out a robust assessment of both the principal risks facing the group, and stress tests and scenarios that would threaten the sustainability of its business model, and its future performance, solvency or liquidity.
The board regularly reviews business performance and at least annually its current strategic plan through to 2024, alongside a strategic risk assessment. The board also considers five-year projections as part of its annual regulatory reporting cycle, including strategic and investment plans. However, the directors have determined and continue to believe that a three-year period to 31 December 2023 constitutes an appropriate and prudent period over which to provide its viability statement given the uncertainties associated with the global pandemic, as well as economic and political factors and their potential impact on investment markets over a longer period. This three-year view is also more aligned to the firm’s detailed stress testing and capital planning activity.
Stress testing and scenario analysis shows that under scenarios such as a 42% fall in FTSE 100 levels or a major reputational risk event, the group would remain profitable and able to withstand the impact of such scenarios. An example of a mitigating action in such scenarios would be a reduction in costs, specifically around change initiatives, along with a reduction in dividend.
Based on this assessment, the directors confirm that they have a reasonable expectation that the company will be able to continue in operation and meet its liabilities as they fall due over the period to 31 December 2023.
Residual rating
Level 2 risk How the risk arises I L Control environment
Third-party supplierThe risk of one or more third-party suppliers failing to provide or perform authorised and/or outsourced services to standards expected by the group, impacting the ability to deliver core services. This includes intra-group outsourcing activity
This risk can arise when the firm does not have appropriate governance and oversight of its supplier relationships, in particular those considered key and material to the operational resilience of business services provided to clients or investors
High Med — Board and executive oversight — Senior dedicated relationship managers — Supplier contracts and defined service level agreements/KPIs
— New supplier due diligence and approval process — Close liaison and regular service review meetings — Documented procedures
Further detailed discussion of the group’s exposures to financial risks is included in note 33 to the financial statements.
rathbones.com 51

Responsible business report
Responsible business report
Being a responsible businessOur commitment to be a leader in responsible business stems from our purpose in society. It is core to our business. Thinking, acting and investing responsibly not only shapes what we do but how we do it. It is woven throughout our business strategy, recognising that this approach is core to our day-to-day decision-making. This focus on the long term is how we will not only create value for our clients but also make a wider contribution to society.
Our 2020 highlights
Responsible investmentPRI strategy and governance score
A+(2019: A+)
Number of companies directly engaged with
226(2019: 70)
Our peopleNumber of employees participating in share schemes
2020 employee engagement score
1,316SIP (2019: 1,325)
1,040SAYE (2019: 840)
91%(2019: 86%)
Society and communities Community investment
£467,000(2019: £360,000)
Number of charities supported
>50
Our environmental impactCarbon intensity (tCO2e/FUMA £bn)
20.5(2019: 41.5 (tCO2e/FUMA £bn))
Total emissions (tCO2e)
1,123(2019: 2,091 (tCO2e))
Our approach to responsibilityWe are committed to operating in a way that creates long-term value for our stakeholders, benefits society and actively addresses any adverse impacts our activities have on society, people and the environment. This means understanding the environmental, social and governance (ESG) issues that matter to them and to our business. The pillars of our programme – responsible investment, our people, society and communities, and our environmental impact – position us to influence the trends we face as an investor and as an active member of the societies and communities in which we operate.
Responsible investmentOur aim is to be a leader in responsible investment. We will achieve this through the purposeful integration of ESG considerations into investment management processes and ownership practices. Delivering to our clients by acting as good, long-term stewards of the investments which we manage on their behalf.
Market trendsTrends Our response Page
Responsible business
Now a recognised concept that continues to grow in importance. The language and terminology vary as does the level of strategic importance, the degree of integration, and the overall scope of responsible business. What does unite our sector is the competitive, dynamic and fast-changing nature of this area.
— Developed a new responsible business programme aligned with our strategic goals
52
— Increased resource to support and implement our activities
54
— Introduced the responsible business committee to oversee our action plans
54
The mainstreaming of environmental, social and governance issues
Already the case for some who have achieved full but customised ESG integration across asset classes and investment approaches. The next steps focus on how ESG is integrated into the broader approach, how data is blended and how analytics capabilities are leveraged for ESG-based investment insight on investment performance.
— Established a roadmap for evolving our responsible investment proposition
56
— Released a new responsible investment policy 56 — Increased our level of engagement — Developed new services and products for clients
57
22
Diversity and inclusion
Moving beyond the compliance-driven focus on female representation in senior management and boards, some firms are looking more broadly at race and ethnic diversity. The societal focus seen in 2020 on social equality leads us to expect a greater sectorial focus on race and ethnic diversity and perhaps broader social inclusion in 2021.
— Increased the coverage of our collated diversity data 60 — Piloted blind CVs as part of our recruitment process 61 — Introduced a graduate intake that is two-thirds female — Introduced internal mentoring programme for colleagues — Continued support for She Can Be and joined the 100 Black Interns initiative
61
63
61
Social criteria are a growing priority
2020 has seen the focus on regional inequalities, local economies, and how they link to globalisation intensify, accelerated by the impact of COVID-19. There is a growing expectation that companies will demonstrate their positive role in society. Investors are increasing their assessment of companies through multiple lenses that include employee conditions and human rights.
— Supported Mental Health UK and the Trussell Trust’s COVID response programmes
66
— Continued increase in charitable donations — Reviewed and updated our approach to community investment
65
65
— Audited our material suppliers to ensure Modern Slavery Act compliance
— Offered ongoing support to suppliers
65
64
Climate has taken centre stage
The combination of growing government climate regulation and policy has strengthened the case for more active engagement on issues of climate resilience and the zero-carbon transition. Initiatives and standards are proliferating, including the development of sector-specific Science Based Targets, while November saw the UK state its intent to make TCFD reporting mandatory.
— Published our climate position statement 67 — Released our first TCFD statement 70 — Continued reducing our operational footprint and offsetting our residual emissions
67
52
Strategic report |
Rathbone Brothers Plc Report and accounts 2020

Our peopleRecognising that our business relies on the commitment of our employees, we aim to become the employer of choice for the wealth management sector, through the creation of a diverse and inclusive workplace that motivates, develops and leverages the strengths of our employees, ensuring that we maintain a professional and high-performing culture.
Society and communitiesWe aim to be a trusted partner in the societies in which we operate, building on our long-standing tradition of supporting local communities, helping them to prosper. Leveraging our employees’ knowledge and experience alongside integrating clear supplier engagement processes will enable the development of sustainable and prosperous societies.
Our environmental impactOur aim is to play our part in the move to a net zero economy. Achieving this depends on us understanding the impact we have
on the environment, both directly through our operations and indirectly through the investments we make. We will actively promote approaches that mitigate and minimise our impact on the natural world.
We have a clear understanding of who we are as a business and are committed to thinking, acting and investing responsibly. This includes putting in place strong governance foundations to hold us to account. Alongside clear accountability we will set targets, track and monitor our progress and transparently report against our commitments in a timely manner.
We recognise that we cannot achieve our aims alone. Through selected partnerships we will work to deliver action and continually challenge ourselves around the issues that we can materially impact.
Rathbones has been trusted for generations to manage and preserve our clients’ wealth. Our tradition of investing and acting responsibly has been with us from the beginning and will continue to lead us forward.
Market trendsTrends Our response Page
Responsible business
Now a recognised concept that continues to grow in importance. The language and terminology vary as does the level of strategic importance, the degree of integration, and the overall scope of responsible business. What does unite our sector is the competitive, dynamic and fast-changing nature of this area.
— Developed a new responsible business programme aligned with our strategic goals
52
— Increased resource to support and implement our activities
54
— Introduced the responsible business committee to oversee our action plans
54
The mainstreaming of environmental, social and governance issues
Already the case for some who have achieved full but customised ESG integration across asset classes and investment approaches. The next steps focus on how ESG is integrated into the broader approach, how data is blended and how analytics capabilities are leveraged for ESG-based investment insight on investment performance.
— Established a roadmap for evolving our responsible investment proposition
56
— Released a new responsible investment policy 56 — Increased our level of engagement — Developed new services and products for clients
57
22
Diversity and inclusion
Moving beyond the compliance-driven focus on female representation in senior management and boards, some firms are looking more broadly at race and ethnic diversity. The societal focus seen in 2020 on social equality leads us to expect a greater sectorial focus on race and ethnic diversity and perhaps broader social inclusion in 2021.
— Increased the coverage of our collated diversity data 60 — Piloted blind CVs as part of our recruitment process 61 — Introduced a graduate intake that is two-thirds female — Introduced internal mentoring programme for colleagues — Continued support for She Can Be and joined the 100 Black Interns initiative
61
63
61
Social criteria are a growing priority
2020 has seen the focus on regional inequalities, local economies, and how they link to globalisation intensify, accelerated by the impact of COVID-19. There is a growing expectation that companies will demonstrate their positive role in society. Investors are increasing their assessment of companies through multiple lenses that include employee conditions and human rights.
— Supported Mental Health UK and the Trussell Trust’s COVID response programmes
66
— Continued increase in charitable donations — Reviewed and updated our approach to community investment
65
65
— Audited our material suppliers to ensure Modern Slavery Act compliance
— Offered ongoing support to suppliers
65
64
Climate has taken centre stage
The combination of growing government climate regulation and policy has strengthened the case for more active engagement on issues of climate resilience and the zero-carbon transition. Initiatives and standards are proliferating, including the development of sector-specific Science Based Targets, while November saw the UK state its intent to make TCFD reporting mandatory.
— Published our climate position statement 67 — Released our first TCFD statement 70 — Continued reducing our operational footprint and offsetting our residual emissions
67
rathbones.com 53

Responsible business report continued
Responsible business governanceHaving taken our first step by defining our framework in 2019, this year saw us undertake further engagement to review and update our underlying plans, review our operating environment and ensure the business had suitable governance in place to oversee the programme in the future. We also conducted an extensive engagement programme with colleagues to ensure our programme aligned with their interests and values.
To this end we formed the responsible business committee, co-chaired by our chief executive and the head of Rathbones specialist and charity business, with members from risk and investment and representatives from the business who act as workstream leads.
The board
Group executive committee
Responsible business committeeThe key activities of the committee are as follows:
— Identify emerging risks and opportunities related to the social and environmental impacts of the firm
— Provide oversight of the firm’s responsible business strategy and reporting
— Oversee the firm’s policies and progress across our framework
Committee members:
— Chief executive — Head of specialist and charity business — Chief risk officer — Company secretary — Workstream leads
Rathbones responsible business framework
Responsible investment
Led by our stewardship director
Our people
Led by our head of organisational effectiveness
Society and communities
Led by our corporate responsibility manager
Our environmental impact
Led by our head of property and facilities
It is in our clients’ best interests for the companies in which we invest to adopt best practice in managing environmental, social and governance risks. We act as good long-term stewards of the investments which we manage on their behalf and are increasingly holding companies to account on their ESG performance.
Our people are a key asset in delivering our strategy, excellent client experience and meeting our stakeholder commitments. As an equal opportunities employer, we must continue to promote diversity, transparency and equality within our workforce.
Rathbones has a long-standing tradition of supporting our local communities. The success of our business and the investments we manage are intrinsically linked to promoting the development of a sustainable and prosperous society.
Economic prosperity depends on the sustainable use of natural resources. By understanding the impact we have on the environment, through our operations and the investments we make, we actively encourage approaches that mitigate and minimise our impact on the natural world.
54 Rathbone Brothers Plc Report and accounts 2020
Strategic report |

Standards and frameworksOver the last 12 months we have worked to understand the impact we can have as a business. Our approach to responsible business clearly supports our business strategy. Our commitment to the following organisations supports our development and together we will work to have a positive impact. We have mapped our framework to the following standards and frameworks:
* FTSE Russell (the trading name of FTSE International Limited and Frank Russell Company) confirms that Rathbone Brothers Plc has been independently assessed according to the FTSE4Good criteria, and has satisfied the requirements to become a constituent of the FTSE4Good Index Series. Created by the global index provider FTSE Russell, the FTSE4Good Index Series is designed to measure the performance of companies demonstrating strong environmental, social and governance (ESG) practices. The FTSE4Good indices are used by a wide variety of market participants to create and assess responsible investment funds and other products.
Committee activity in 2020Below is a summary of the key issues that the committee considered at each of its meetings during the year.
The United Nations Sustainable Development Goals (SDGs):Rathbones maps to the SDGs on many levels across our businesses. In 2021, we will map our impact against the goals and report our progress in support of the goals in our next report.
The FTSE4Good Index*:We are pleased to have been included in the FTSE4Good Index for over 10 years. As a business we will continually develop our approaches to maintain our listing.
To find out about other standards, frameworks and ratings which we align to please see our website.
Looking forwardActing on environmental, social and governance issues is not only the right thing to do but is fundamentally beneficial to the long-term success of our business and the welfare of our stakeholders. To ensure that we deliver over the next year we will:
— engage stakeholders on ESG matters — ensure alignment with our selected standards and frameworks — enhance our data disclosure — further enhance our approach to supplier management — continue to strengthen our governance of these issues through updated policies and reviewing our committee structure.
We commit to reporting transparently and will share our progress as we deliver our responsible business programme. This will result in a standalone report alongside our 2021 annual report and accounts.
If you would like to talk to us about our responsible business programme please contact us at [email protected].
July 2020 — Approval of the committee’s terms of reference — Agreement on committee membership — Review of our stakeholder engagement feedback — Review of our 2020 progress
October 2020 — Agreement of our responsible business strategy — Review of progress against our existing responsible investment and diversity and inclusion programmes
— Assessment of our community investment approach — Review of the impact of COVID on our operational footprint
December 2020 — Agreement of our responsible business narrative — Discussion on standards and frameworks that align with our responsible business approach
— Review of our progress against our plans — Agreement on our community investment strategy — Agreement of our responsible investment proposition and updates to our responsible investment policy
rathbones.com 55

Responsible investment
Our responsible investment principlesIn 2020 we updated our RI principles. The aim of the principles is to ensure a consistent approach to RI across the group. They align to the RI policy work and apply at group level, encompassing all Rathbones business units. We practise RI via four core principles:
— ESG integration: we will consider ESG factors in the evaluation of investments to help identify ESG opportunities and risks
— voting with purpose: we will actively vote across over 95% of the value of our holdings in line with our RI commitments. This may involve voting against management to help drive positive change
— engagement with consequences: we will prioritise engagement where we can make a real difference in addressing the world’s systemic environmental and societal challenges. We are prepared to reduce our holdings in companies who continue to present an ESG risk over time
— transparency: as a prominent participant in the financial market, we are committed to being transparent about our approach to RI. We will actively report on the progress of our RI activities to our clients, shareholders and other stakeholders.
Introducing new principles and requirements cannot be done without training all our employees on our ambition and approach, with investment managers receiving more practical training. Through 2020, sessions have been run on specific issues such as AGM voting. Throughout 2021, training will be rolled out across the business explaining our RI ambition, progress to date and plans for the future. In 2020 nine members of the research team completed advanced training in responsible investment through the PRI Academy module, with four more currently working to complete it.
Our approachOur purpose, thinking, acting and investing responsibly, is intrinsic to our organisational culture as well as to our investment process. The pandemic has accelerated interest among our clients and the general public in responsible investment (RI) and sustainability. It has also brought a number of social and environmental issues and trends to the fore, sharpening the financial system’s understanding of the future risks caused by issues such as climate change and biodiversity loss. Our ambition is that our future RI proposition will cater to the needs of all clients – whether their interest in environmental, social and governance (ESG) factors is driven simply by financial materiality or by more specific sustainability preferences. At the same time, we will build on our existing expertise in Greenbank and in RUTM’s specialist funds to continue to lead the market in innovative responsible investment propositions and products. Building on the important work of 2019 which saw the introduction of our responsible investment committee and our first group RI policy, 2020 saw further development and improvement across all our RI programme.
Responsible business report continued
Our responsible investment committee defines responsible investment as, ‘the purposeful integration of environmental, social and corporate governance considerations into investment management processes and ownership practices in the belief that these factors can have an impact on financial performance.’
Matt CrossmanStewardship Director
PRI annual survey results — A+ strategy and governance (2019: A+) — A listed equity – active ownership score (2019: A) — B listed equity – incorporation score (2019: B) — C fixed income – corporate financial and non-financial score (2019: B)
We retain memberships of other organisations through our business units. To learn more please see our website.
Collaborating to drive changeWe know that collaboration will increase our ability to drive change and we are pleased to continue our support at group level for a number of organisations, including the IIGCC, ClimateAction100+ and our 11th year as a signatory of the PRI.
56 Rathbone Brothers Plc Report and accounts 2020
Strategic report |

Environmental, social and governance integrationWe are investment managers and our fiduciary responsibility is to generate returns for our clients. However, being a responsible investor means taking responsibility for the impact that the companies we invest in have on the world. We believe integrating ESG factors into the investment process helps achieve a balance between these aims. It will also help drive investment returns by limiting ESG risks and identifying emerging investment opportunities. Being leaders in RI will allow us to provide clients with new investment opportunities, identify high-quality investments and make a contribution to solving the problems facing society.
Our in-house research team is the foundation of our decision-making process and they utilise multiple data sources to support both qualitative and quantitative assessments that are included in stock selection recommendations. In 2020 we became an organisational alliance member of the Sustainability Accounting Standards Board (SASB), supporting Rathbones in our learning as we integrate financially material ESG considerations into our process. Alongside the purchase of a specific ESG data set, this will enable our team to include more indicators in their assessments and therefore support investment managers with more detailed recommendations. This increase in data will be built into updated reporting templates and ultimately feed into our client reporting, supporting conversations about a broader set of risks and opportunities that may impact a client’s investments.
StewardshipWe believe it is in our clients’ best interests for the companies in which we invest to adopt best practice in managing environmental, social and governance risks. This provides a framework for each company to be managed according to the long-term interests of its shareholders. Mindful of our responsibilities to our clients, we act as good, long-term stewards of the investments which we manage on their behalf, as expressed in our responsible investment policy. We have developed a robust approach to proxy voting as a clear expression of our stewardship responsibilities. However, stewardship is not limited to this activity. Engagement with companies on ESG issues is an important adjunct to voting activities. A summary of our activity can be found on the following page and our responsible investment report shares more detail on Rathbones’ approach to proxy voting and engagement within the context of our ESG activities over the last 12 months.
Number of direct engagements in 2020
226(2019: 70, 2018: 31)
Engagement with consequencesIt is important that we maintain a dialogue with the companies in which we invest, as our clients expect us to use our voice to influence companies towards better, more sustainable long-term performance, which takes account of all stakeholders. We recognise that engagements often present themselves across a spectrum of severity and in order to maximise the effect of our engagements and deliver on our responsibilities to clients, we must be selective and pragmatic. Whilst the specific approach taken to engagement will be decided on an ad hoc, case-by-case basis, the following principles guide the selection of an issue for more active engagement (definitions are provided in our engagement policy):
— exposure — severity — location — expertise.
Engagement must have consequences to be effective. Following our best efforts made through a campaign of focused engagement for change, we are prepared to reduce our holdings in companies who continue to present an ESG risk over time. If an existing investment conflicts with our RI policy we may decide to stop investing with them altogether and begin the divestment process. We would outline clear criteria and timescales for such divestments.
As signatories to the PRI, we make use of the organisation’s collaboration platform to participate in engagement on ESG topics with a number of global firms. To read more about our approach to engagement and examples undertaken please see our responsible investment report.
Engaging together: Votes against slaveryIn 2020, Rathbones convened an investor collaboration with £3.2 trillion in assets under management to challenge FTSE 350 companies that had failed to meet the reporting requirements of Section 54 of the Modern Slavery Act 2015. We worked with a respected international NGO to develop a target list of companies, our aim being to achieve full compliance from 22 laggard companies. We expect members of the FTSE 350 to lead in this area, taking substantive action against the prevalence of slavery in their supply chains. As at the end of December 2020, 20 out of 22 companies have now become compliant. Our engagement was shortlisted at the PRI 2020 Awards for the ‘Stewardship Project of the Year’.
rathbones.com 57

Voting with purposeThe cornerstone of all responsible investment is an active and considered approach to proxy voting. Since 2010, the group’s voting activity has been coordinated by a dedicated committee, which issues voting recommendations based on best practice, establishing a baseline for consideration by the major holders of the companies in question. Rathbone Investment Management exercises the voting rights attached to its largest holdings, covering the most widely held stocks across the business. Voting is also undertaken on any company if requested by an underlying shareholder. Our voting policy was strengthened in several areas in 2020, to align with new regulation and to deepen the integration of ESG risk factors into the voting process. We also developed a separate, detailed voting policy dealing with collective investments.
Details of our voting activity for the year can be seen in the table below. We voted against management on resolutions that were related to:
— director re-election — executive pay — business issues such as poor ESG disclosure and approval of accounts and auditors.
Voting against management is rare, but significant, and we ensure any such vote is followed up by direct engagement. To learn more about our voting and engagement see our responsible investment report.
TransparencyTransparency is essential when working to integrate ESG factors into our processes, and as we build on the support currently offered to clients to ensure they have more information to enable their decision-making. Regular communication with our stakeholders covered a variety of themes, from regular client updates on their portfolio performance, to awareness sessions looking at specific issues facing our clients. We continue to benchmark our performance against industry peers on responsible investment through involvement in the UN PRI annual reporting cycle. Our full PRI submission is available on request.
Our annual and interim responsible investment reports as well as our RI thought leadership are all available on our website. We are supportive of the TCFD recommendations and our first disclosure can be found on page 70. We will evolve this through our work in 2021 and improve alignment in our 2021 disclosure.
Looking forwardIn 2021 we will continue to evolve our well-established investment process and client proposition, giving greater scope to tailor portfolios to individual client sustainability preferences while considering a wide range of ESG risks and opportunities and emerging sustainable investment themes. We will work to mainstream RI at Rathbones. Specific initiatives will include:
— continued integration of ESG data into our research recommendations
— increased training of our employees — improved communication to clients on their exposure to ESG risks and opportunities.
From 2021 we will report publicly on our voting activities on our website, and in summary form in our annual responsible investment report, where we also provide further detailed rationale around the specific holdings that are excluded from the process (c. 5%).
Responsible business report continued
Voting activityCategory 2020 number 2020 percentage 2019 number 2019 percentage
Number of items voted 7,375 4,817Number of votes FOR 7,162 97.15% 4,759 98.80%Number of votes AGAINST 237 2.21% 62 1.29%Number of votes ABSTAIN 47 0.64% 70 1.45%Number of votes WITHHOLD 7 0.09% 0 0.00%Number of votes on shareholder proposals 144 1.95% 26 0.54%
58 Rathbone Brothers Plc Report and accounts 2020
Strategic report |

Our approachOur people faced a challenging year, having to adapt to new ways of working whilst continuing to deliver excellent client service in an uncertain and worrying time. To support our employees, the management team and the board increased ongoing engagement with all our people and this included frequent dialogue between our leaders, managers and the broader workforce. All employees were given opportunities to understand and discuss the issues impacting them, ensuring that responses were focused and proportionate.
Having introduced new values in 2019, this was a year of integration and embedding into our core processes. With a continued focus on culture, we created a dashboard to support regular reporting to the executive and board on the eight aspects of our corporate culture we have identified (see pages 88-89). Work continued across our focus areas of diversity and inclusion, engagement and wellbeing.
The wellbeing of our peopleThere is no question that 2020 was an extraordinary year for our employees. The need to work under different and varied conditions created both new opportunities and additional pressures. Ensuring the wellbeing of our people remained our utmost priority, giving security and support as they adapted to the changing conditions. Contact and virtual meeting frequency was high, and we undertook surveys to assess the wellbeing, working conditions and productivity of our employees. Our existing wellbeing programmes were reviewed and reinforced to address the new challenges. Flexibility was essential, allowing employees to select the support they need across our mental, physical and social wellbeing programmes.
We recognised that for a proportion of our people remote working was particularly difficult. As a result, we strengthened our support networks for them, including:
— continued support through the Rathbones Employee Assistance Programme provided by CiC. This offers a 24-hour advice line, a self-help website and a telephone helpline for managerial advice and confidential counselling sessions
— a range of live wellbeing sessions to give support to employees
— the Rathbones Mental Health First Aiders, who have been trained to sign-post our people to suitable support, circulated regular emails on how to take care of and improve mental health
— mental health training to managers — access to a mental wellbeing app offered free to everyone
We reprioritised investment in IT solutions and infrastructure, such as desks, chairs and screens that facilitate home working, fostered digital communication and provided physical equipment to employees at home as necessary. At times of high pressure, we understood the importance of bringing our employees together for fun. Our sports and social committee continued to organise regular virtual events for all employees, for example virtual yoga lessons, art or cookery lessons and virtual children’s parties.
Our people
Rathbones is an equal opportunity employer. We are working to create an engaged, talented and diverse workforce which can deliver to our clients whilst operating in line with our purpose.
Simon BurnettHead of Organisational Effectiveness
76%
67%76
%
76%
2019 FSB 2020
Autonomy
Rathbones 2019Financial services benchmark (FSB) 2020Rathbones 2020
91%
76%86
% 91%
2019 FSB 2020
I am proud to say I work for Rathbones
91%
77%86
% 91%
2019 FSB 2020
Overall experience
2020 survey highlights
rathbones.com 59

Responsible business report continued
Diversity and inclusionWe want Rathbones to be a company where everyone has the opportunity to build a successful career and find the right balance between work and personal life, regardless of age, ethnicity, gender, religion or background. World events in 2020, such as the international anti-racism protests and the celebrations of Pride month, have served to highlight how important this is across all businesses and sectors.
Our gender pay gapAlthough our workforce is approximately 50:50 female to male, when we look at all levels of employee, this balance shifts as we move up the business. We are committed to taking all steps possible to reduce our gender pay gap and have had some success in increasing representation in more junior professional levels, which will provide better representation at senior levels, albeit over time. We published gender pay gap data in April 2020 and will do so again before April 2021.
Our diversityOur board has three female directors out of eight and we also have three on the group executive committee (GEC), which means we have exceeded our commitment to meet the 33% of female board representation for FTSE 350 companies. We see this as a good foundation on which to build, but not an end point. It remains the fact that women have been less well represented at all levels in the investment management industry and further addressing this imbalance is a key priority. We continue to develop our plans to align with the recommendations published in the Hampton-Alexander review and are working hard to appoint more women in graduate trainee positions. We are also working to encourage more applications from women to our work experience and financial career programmes. We continue to target the progression and development of existing female employees with opportunities for leadership and management programmes. We are signatories to the Women in Finance Charter and the firm is committed to achieving 25% female senior management representation by 2023. As of 2020, we have reached 24.6% (2019: 20.3%).
Gender diversity at 31 December 2020
1. Senior managers includes senior individuals who report directly into the group executive committee
53%
47% 52
%
48% 52
%
48%
2018 20202019
All employees
90%
10%
78%
22%
70%
30%
2018 20202019
Group executive members
FemaleMale
77%
23%
80%
20%
75%
25%
2018 20202019
Senior managers1
60 Rathbone Brothers Plc Report and accounts 2020
Strategic report |

Our activityThe work of Rathbones Included, the working group set up to consider the challenges we face and suggest responses to them, accelerated in 2020. Priority workstreams for diversity and inclusion (D&I) were identified for 2020 and 2021:
Addressing our gender and race & ethnicity imbalance: — in 2020 we aligned our core processes with our values, piloted the use of anonymised CVs and increased our graduate intake to two-thirds female
— in 2021 we will continue to review and update our processes, move unconscious bias training online and make inclusive leadership mandatory for managers
Improving our D&I insight across Rathbones: — in 2020 we expanded our collation of diversity data to cover all the categories of the Equality Act of 2010
— in 2021 we will utilise the data to help us develop appropriate D&I policies and practices
Rathbones Included – Q&A with Darren Seaton
Why is diversity and inclusion important to Rathbones?It’s our opportunity to review the way we do things and to make sure everyone feels they belong and that their voice is heard. It is also important that as an organisation we are truly reflective of wider society and our employees, clients and communities.
What challenges does the business face?Turning talk into actionable outcomes is a big challenge. It is important to ensure what we are trying to achieve isn’t just a tick-box exercise but an authentic and positive cultural change to the organisation. Time is another challenge. It can take time to change processes and perceptions, but we have progressed quickly so far and are moving in the right direction.
What is Rathbones doing to make people feel included?Raising internal awareness is key to our success and we are starting to build a programme highlighting key diversity and inclusion events for employees to run throughout the year, such as conversations with the Olympic swimmer Mark Foster and Selina Flavius, author of Black Girl Finance. We have an employee-led taskforce who contribute their time and effort to help us meet our objectives.
How does Rathbones Included help the business have meaningful conversations?We are the employee voice and want to make sure we integrate D&I thinking across the organisation. We work together with our partners in other functions within the
business, such as HR, technology and change and learning & development, who are helping us to implement the changes to our processes that will enable us to meet our objectives. Together we can also find opportunities to make our processes and practices, such as employee and graduate recruitment, training and communications, more inclusive.
What does the future hold for Rathbones Included?We feel extremely positive about the future. As a group, in the challenging conditions presented by the pandemic, we have made some amazing progress this year and look forward to building on that success in the years to come. A priority in the short term is creating employee networks designed to be spaces of support, where people can share experiences and knowledge with their colleagues and allies. We will also be continuing our alliances with external organisations such as She Can Be, which endeavours to empower young women to make informed decisions about their careers.
Building D&I into our working practices: — in 2020 we developed our processes and training to increase awareness of diversity and enhance inclusivity, and expanded our employee networks. The firm joined the 100 Black Intern programme and continued to support the She Can Be initiative
— in 2021 we will run more events and embed our support of external programmes
Improving D&I awareness: — in 2020 we focused on building both internal and external awareness, including but not limited to supporting Inclusion Week and Black History Month
— in 2021 we will help our people and broader stakeholder base understand the challenges facing a diverse and inclusive workforce
rathbones.com 61

Responsible business report continued
Culture and valuesHaving introduced updated corporate values last year, 2020 was a year of integration. Values have been included in the year-end appraisal process for the first time and the link to remuneration is under review. To equip managers in this process, mandatory training was rolled out to support the year-end appraisal conversations. These sessions included guidance on how to discuss the values and examples shared for reference.
Further tracking of how the business is living our values was collated in a culture dashboard. To find out more about the dashboard see the corporate governance report (pages 88-89).
EngagementAn engaged workforce is essential to delivery of our purpose and strategy. Throughout 2020 a range of direct and indirect engagement activities was undertaken to ensure that the business was aware of relevant issues and considerations as part of its decision-making and oversight activities. A summary of employee engagement activities is provided below:
— annual employee survey — pulse surveys in light of COVID-19 — board branch visits — CEO team visits — employee townhalls — non-executive director drop-in sessions with front office and support teams across the country.
The board’s workforce engagement programme, part of our compliance with the 2018 Corporate Governance Code, moved virtual in 2020 to maintain the discussion. Colin Clark and Sarah Gentleman remain the designated non-executive directors responsible for gathering employee feedback. Feedback from the sessions is collated and the key themes are presented for discussion by the board and are taken into consideration when making decisions. For more detail on the sessions held in 2020 see pages 90-91.
The 2020 engagement survey had an 82% response rate and results saw an increase in overall engagement of 5% (91% in 2020 and 86% in 2019). Given the uncertain year these results showed that Rathbones continues to have a good corporate culture and remains higher than the Financial Service Benchmark average of 77%. Of note were positive scores across the business for caring about the future of the organisation, being proud to work here and people understanding how their role aligns to our purpose. Positive data points such as these link to employee retention, performance and productivity. The survey also identified a few specific areas where we can seek to increase engagement and showed improvements in all our target areas from last year.
Diversity in our graduate programmeRathbones is proud of our graduate programme which maintains a high-quality pipeline of younger talent. Betsy completed our graduate programme in 2020:
I joined Rathbones in September 2018. Like many graduates, I was unsure about my career direction but was completely open-minded and excited about my future – wherever it would take me. Fortunately, it took me to Rathbones and I haven’t looked back since. For 15 months, I rotated around eight different departments in the business, including a stretch in the Liverpool office and a very long stretch at home! Whilst lockdown has had its challenges, the programme continued to present me with exciting and interesting opportunities – I worked with experienced professionals, participated in corporate projects, presented to senior managers, joined a committee, completed my Investment Advice Diploma, began my studies for the CFA, became a buddy and landed my new role as Assistant Investment Manager at Rathbone Greenbank Investments. By participating in the programme, I have gained in-depth knowledge of the business and formed a development pathway to becoming an investment professional at Rathbones. I look forward to my next chapter and wish all the new graduates the best on the rotation programme!
Betsy Ashburner,Assistant Investment Manager, Rathbone Greenbank Investments
Our programme is a key part of diversifying our talent pipeline and we are pleased that in 2020 our graduate intake was two-thirds female. Having chosen to work with a recruitment agency which understood our desire to have gender balance in our process we began candidate identification. Our nine successful candidates were selected from over 1,400 applicants shortlisted via an interview process to go through to the next stage of psychometric and ability testing. The 2020 intake started in October and like Betsy are studying for their Investment Advice Diploma as they work alongside our investment management teams.
62 Rathbone Brothers Plc Report and accounts 2020
Strategic report |

Investing in our peopleAs part of the benefits that we offer, UK employees can participate in the company’s pension arrangement, which began to integrate environmental, social and governance factors into its investment decisions in 2020. We support our people through health and periods of illness by providing private medical cover, annual medicals, income protection and life assurance cover to everyone. Further, all employees have the opportunity to join the Share Incentive Plan (SIP), which enables employees to benefit from share matching by the company on a one-to-one basis and receive free shares and dividend shares, as well as the opportunity to join the Save As You Earn (SAYE) share option plan each year. Rathbones prides itself on being a ‘real Living Wage’ employer and ensures our sub-contracted workforce are paid these rates as a minimum.
We actively prioritised the development of our employees by building and delivering high-quality programmes that enable participants to put relevant learning into practice, whichever part of the business they work in. We did this by engaging line managers and other stakeholders across the business to understand what skills are needed and ensure that the opportunity and support are in place for employees to deploy them. Responding to the challenge of COVID-19, early in the year additional training sessions were offered to line managers helping them communicate with their team and enabling them to share best practice.
Understandably, COVID-19 impacted access to training and therefore the level of external training decreased. While we continued to support our people as they completed professional qualifications the average investment per person was £468 (compared to £727 in 2019). However, these figures are a conservative estimate because there is much more employee development that has no direct cost and is conducted informally; for example we supported national learning at work week where we shared stories from our senior managers about their career paths, including hearing from our CFO and COO.
In addition to the online courses offered to all new employees, we increased online learning across the firm, continuing to deliver sessions on a variety of issues, including:
— anti-money-laundering — data security — stewardship.
We rolled out new sessions focusing on:
— business continuity — client protection — client asset sourcebook (CASS) — SEC training, targeting SEC approved people but offered as optional CPD course for all.
Rathbones is committed to developing a pipeline of high-calibre talent to ensure appropriate skills and succession planning for the future and 2020 was our third graduate development programme. For existing employees we provide professional and personal development for all.
In 2020 this included the formalising of our approach to mentoring, such that at the end of 2020 we had 40 mentoring pairs. Focused on, but not limited to, our investment management community, our business development programme, continued to run over nine months and covered a number of modules including, commercial mindset, building a book of business and engaging and presenting to clients.
For all managers a suite of management and leadership courses remained available, enabling the firm to support high-potential employees to ultimately grow into senior leadership roles. An example of this was the ’Driving Productivity’ course introduced in the last quarter of 2020, covering enhanced communication and flexible leadership styles.
For our junior employees, we provided opportunities for personal and professional development through initiatives including our apprenticeship programme, which continued to run successfully.
Looking forwardWe are committed to continually improving our employee experience. Working together and supporting each other will be key to our business success, especially given the uncertainty that we face as a society. Building on the foundations we have put in place, 2021 will be a year of evolution and embedding new processes, mindful that there is only so much change people can cope with, be it in work or personally. The resilience of our employees is something we remain proud of. Next year, in addition to our existing processes we will:
— build D&I into more of our working practices — create broader awareness of D&I across the business — update our values in our appraisal and talent management process
— roll out our updated approach to hybrid working — expand our existing mentoring programme.
1,32
5
1,51
2
840
1,31
61,58
8
1,04
0
2019 2020
Headcount at 31 December 2020/2019Number of employees in SIPNumber of employees in SAYE
Number of employees and share scheme participation
rathbones.com 63

Responsible business report continued
Society and communities
As a responsible business, we work to promote the same expectations across our supply chain as we set ourselves. This year has been particularly challenging for many of our society stakeholders, be it the smaller businesses we engage with in our supply chain or the recipients of grants and support from the many charities that we have continued to partner with through, what has been a year in which they have all seen an increase in demand for their services. With the move by many of our clients and employees to remote working we have focused attention on keeping them safe by reviewing our approach to cyber security and ensuring it provides safe and secure channels through which we can communicate and continue to deliver the high-quality service of which we are proud.
Our partners and our regulators
Our relationships with regulatorsWe value our reputation for ethical behaviour and integrity and comply with the Prudential Regulation Authority (PRA) and the Financial Conduct Authority’s (FCA), client’s best interests rule. We aim to build positive relationships with our regulators and acknowledge that they provide important oversight of how we run our business. Our clients’ interests are therefore best served when we work constructively with our regulators. We regularly engage with them to ensure that our business understands and contributes to evolving regulatory requirements. Senior management hold regular meetings with regulators to foster healthy working relationships. We also report regularly to the board and the audit and risk committees on engagement with regulators and how changes in regulatory regimes may impact our business processes and procedures. In 2020, these reports included the financial implications of climate risk on our business and the impact of Brexit.
Code of conduct and whistleblowingCentral to our commitment to thinking, acting and investing responsibly is our approach to governance and risk management. We ensure all our people know the role they play through training, and our policies and processes are overseen by the board, audit and risk committees (see pages 84-99). Maintaining the highest possible standards of openness, probity and accountability means amongst other things enabling our employees and other stakeholders to raise any concerns they may have in a confidential manner. All employees undertake training on our code of conduct and whistleblowing procedures, ensuring that they understand what the business expects of them and the systems and processes in place should they wish to raise a concern.
Anti-bribery policyRathbones has zero-tolerance to bribery and corruption and we ensure all our employees and suppliers are adequately trained so as to limit our exposure to bribery by:
— setting out clear anti-bribery and anti-corruption policies — providing mandatory training to all employees — encouraging our employees to be vigilant and report breaches or concerns
— reporting suspected cases of bribery in accordance with the specified procedures
— escalating and investigating instances of suspected bribery and assisting the police or other appropriate authorities in their investigations.
We are committed to training our employees to ensure everyone understands our approach, their responsibility and the risk if our processes are not followed.
Human rightsWe recognise our responsibility to respect those who work within Rathbones and those who are in our broader stakeholder network, including but not limited to those who work within our supply chain. We support the International Labour Organization’s standards and the Universal Declaration of Human Rights. We will not tolerate child or forced labour and support the right to freedom of association and collective bargaining. Whether it is in our approach to creating a diverse and inclusive workforce (pages 61-62) or in our impact in local communities (pages 64-66), we uphold these standards not only in our operations but also through the work of our stewardship team (pages 57-58).
Rathbones has a long-standing tradition of supporting our local communities. The success of our business and the investments we manage for our clients are intrinsically linked to promoting the development of sustainable and prosperous communities.
Helen WilsonCorporate Responsibility Manager
64 Rathbone Brothers Plc Report and accounts 2020
Strategic report |

Modern slaveryAs a UK-based financial services business, Rathbones has a relatively low risk of modern slavery within its direct supply chain. Indirect suppliers further down our supply chain however present a potential elevated risk. In 2020, we engaged a third-party sustainability consultant, Avieco, to undertake our second supply chain modern slavery risk assessment. Overall, Avieco concluded that the risks identified have predominately remained unchanged since our initial assessment conducted in 2018.
The key areas of elevated risk were identified as follows:
— direct risk – UK construction and India software supply and services
— indirect risk – UK soft services (cleaning, hospitality) and UK retailers (procurement of products).
These four areas however represent a very small proportion of our total procurement expenditure. Through the identification of the procurement areas with elevated risk, we are embracing the opportunity to strengthen oversight, control and due diligence processes within our procurement practices, including through increased supplier engagement. Our modern slavery statement lays out our process in more detail and is reviewed and approved by the board.
We are continuously building capacity within Rathbones to manage the risk of modern slavery, and understand risk exposure within our operations, our supply chain, and our services. As a financial service business, Rathbones does not have significant physical inputs into its business operations, but understands that no supply chain is risk-free, and that greater risk may be present further down the supply chain with indirect suppliers. Looking forward, during 2021 our focus will be on our procurement framework, and the recruitment of specialist supplier management resource. Alongside the further strengthening of our supplier due diligence processes with additional focus on high risk sectors, and a wider internal training programme for key employees to support awareness and understanding.
Our role in keeping our clients cyber safeInstances of fraud have continued to rise, with some fraudsters using COVID-19 as an opportunity to exploit the vulnerable. The sophistication of these approaches continues to increase and in 2020 alone we saw phishing emails claiming to be from HMRC, NHS scam emails and schemes that focused on Brexit. These scams are designed to gain trust and convince people that they are dealing with legitimate representatives. Everyone is susceptible: staying alert and remembering a few key warning signs helps to protect against these attacks. In regular communication with our clients we reminded them how we will and will not contact them and reassured them that we support every effort to keep them safe. Clear and open communication helped to maintain and build trust in these testing times, and this extended to all our employees through the provision of regular cyber awareness training along with frequent reminders to remain vigilant through business communications channels.
Community investmentIn the uncertain times of 2020, the demand for support from the charitable sector saw a dramatic increase. The role of a business in looking after both its people and the communities in which it operates only gained in importance and we are pleased with how Rathbones pulled together, continuing to deliver to our clients and increasing the support we offered community partners. In 2020 the group made donations of £467,000, representing 1.1% of group pre-tax profit (2019: £360,000 and 0.9%). This consisted of support from a number of sources including the Rathbone Brothers Foundation, with each regional office selecting local projects. In total, £200,000 of financial support was shared between around 50 charities. We continued to match employee fundraising, up to £150 per employee per year, and our Give As You Earn scheme raised over £201,000 through employee donations, which was matched up to £200 per month for an annual total of £166,000. With the shift to remote working in 2020 we were able to donate over £200,000-worth of IT equipment to eligible causes.
rathbones.com 65

Responsible business report continued
We also continued with our pre-COVID-19 initiatives The Rathbones Folio Mentorships programme, which started in 2017, provides talented young writers from state schools the transformational opportunity to be mentored by published authors, one-on-one, for a year. In 2020, and in spite of COVID-19 restrictions, four young people participated through remote delivery of the programme. For the last three years we have also piloted a digital reading programme in schools, in association with The Pigeonhole (a digital book club) and HarperCollins publishers. The Rathbones Folio Mentorships programme will continue into 2021 with new mentors assigned to four new students.
As a financial services business we also recognise our role in supporting financial awareness in youngsters, we do this via the Rathbones Financial Awareness programme. Investment managers deliver presentations for 16-to-25-year-olds within our offices and at schools around the UK. The programme aims to equip those attending with the necessary information to take ownership of their finances at a young age. We migrated the programme online in response to the pandemic, enabling us to offer access to more participants and in 2020 we had 250 individuals joining sessions. This means that in the last seven years, we have reached close to 10,500 young people.
In 2020 we took the opportunity to review our approach to community investment. After revisiting our history, our purpose and engaging our people we identified equality as the theme on which we feel we could have a material impact. Focusing on disadvantaged youth will allow us to continue a number of existing projects whilst identifying opportunities to increase the impact of our community investment programmes.
Looking forwardRathbones has a strong tradition of operating responsibly. In 2021 we will look to develop our current approach, with programmes focusing on:
— the strengthening of our existing procurement processes — identification of partners to support our community investment ambition
— increasing our volunteering opportunities — improved communication on our impact.
Our COVID-19 community responseEmployees selected two national charities, Mental Health UK and the Trussell Trust, to receive additional funds which would help deliver services in response to COVID-19 programmes. Both charities received over £70,000.
Mental Health UK1
In 2020, demand for mental health services, advice and information soared across the UK. Mental Health UK connects with people and organisations to improve understanding and provide vital care. Rathbones has supported Mental Health UK to reach over three million people online with information on how to manage their mental health, and over 15,000 people directly through their helplines. Thanks to our partnership, more people across the UK have been able to find help for their own mental health, as well as their friends, family and carers.
The Trussell Trust2
The Trussell Trust supports a nationwide network of food banks who together provide emergency food and support to people locked in poverty and campaign for change to end the need for food banks in the UK. Rathbones was pleased to partner with them and our donation provided flexibility in ever-changing circumstances to allow them to continue to support their food bank network during a highly challenging time. In the first six months of the pandemic, food banks in the Trussell Trust network saw a 47% increase in need compared to the same time last year, providing 1.2 million emergency food parcels to people in crisis with approximately 2,600 food parcels going to children everyday during that time.
1. A registered charity in England and Wales, number 11708152. A registered charity in England and Wales (1110522) and Scotland (SC044246)
66 Rathbone Brothers Plc Report and accounts 2020
Strategic report |

Our environmental impact
Our approachThe world’s response to COVID-19 only served to underscore the impact that can be had if people, nations and businesses work together. Despite the inevitable postponement of COP26, 2020 did not see a decrease in effort towards slowing and reversing the climate crisis. Businesses came together to call on the UK Government to drive a green recovery. Recognising the part Rathbones can play in the transition to a net zero economy, we have continued to track and reduce our operational footprint and are working to understand the impact of climate change on our investment portfolios.
CDP Score
B(2019: B-)
As a business we continued to support CDP (formerly the Carbon Disclosure Project), both as an investor and as a responding business. With CDP’s move to align its framework to the Task Force on Climate-related Financial Disclosures (TCFD), additional financial services questions were introduced in 2020. Our score of B reflected our willingness to respond to this new methodology and we are confident that delivering on a number of existing projects, such as the setting of targets and integration of ESG factors into the decision-making for our investment portfolios, will continue to improve our score.
We support the work of the TCFD and in 2020 produced our first response in alignment with its recommendations (see pages 70-74). Allied to the work being undertaken by our business to integrate environmental, social and governance data into our investment decisions and engagement process (see page 57-58) we have created a cross-functional team to oversee our approach. The responsible business committee has oversight of both our responsible investment programme and our environmental programme and supports their interaction as well as approving our TCFD, PRI and CDP disclosures.
Carbon footprinting the Greenbank portfolioThe transition to the low-carbon economy has already begun: aligning a portfolio to both support and benefit from this transition should help to insulate it from medium- and long-term risks and position it to capitalise on long-term opportunities. In order to limit warming to 1.5°Cabove pre-industrial levels, global carbon emissions will need to fall dramatically by 2030 and achieve net zero by 2050. At Greenbank, the team works with clients to provide practical ways to align to a 1.5°C pathway:
— assess the exposure of investment portfolio holdings to climate risk
— reduce the exposure to industries whose activities are misaligned with a low-carbon pathway
— increase exposure to ‘climate-sustainable assets’ — engage with companies and policy-makers to encourage actions consistent with a low-carbon transition.
Each year, Greenbank confirms its commitment to the Montreal Pledge by publishing a footprint of the equity holdings within the investment portfolios it manages.
Recognising the part we can play in the transition to a net zero economy, we have continued to track and reduce our operational footprint and are working to understand the impact of climate change on our investment portfolios.
The impact of our investmentsAs a provider of investment and wealth management services we recognise the need to improve our understanding of the climate-related risks which will impact our clients’ investment portfolios, as this is the material proportion of our footprint. In 2020, a cross-functional team from our investment, risk, stewardship, research and responsibility divisions collaborated to expand our understanding of the impact of climate on our investments. Whilst we currently footprint our specialist funds and those offered through Greenbank, 2021 will see us expand our current portfolio footprinting to cover more of our core offerings. In 2020, the introduction of our climate statement (available on our website) formalised our commitment to engaging with investee companies on their approach to climate change and the associated risks and opportunities that face them as we transition to a zero-carbon economy.
Our operational footprintIn 2020, our carbon footprint reduced by 46.3% with total emissions of 1,123 tCO2e (2019:2,091 tCO2e). With our total funds under management increasing by 8.6% to £54.7 billion, our emissions intensity (tCO2e/£bn FUMA) has correspondingly decreased by 50.6%. Under normal circumstances energy from our built estate accounts for nearly half of our annual emissions. Given the proportion of the year in which our employees were based remotely, this year’s footprint has evidently been impacted by COVID-19. Much of our workforce has been based at home since March. Offices were made COVID-safe, which not only
Mark McGahernHead of Property and Facilities
rathbones.com 67

Responsible business report continued
meant reducing capacity and creating one-way systems but also ensuring safe ventilation. At some sites this could be done by simply opening windows; however, at our larger offices, it required the running of air circulation systems to ensure fresh air was pulled into the building rather than recirculated. All emission categories, business travel, water and waste were also reduced as we moved systems online and continued to operate remotely.
line with our support of the UN’s Sustainable Development Goals and is certified by internationally accredited bodies. As we set long-term targets we will continue to assess the role of offsetting, including the source of our credits.
Compliance with regulationsWe continue to meet the greenhouse gas (GHG) emissions reporting requirements of the Companies Act 2006 (Strategic and Directors’ Reports) Regulations 2013 and our obligations under the Companies (Directors’ Report) and Limited Liability Partnerships (Energy and Carbon Report) Regulations 2018. We have prepared this report in accordance with the requirements for quoted companies under these regulations by including our specific energy usage and energy-efficiency initiatives and have split out our global and UK emissions. Rathbones continues to report all material GHG emissions across our direct operations.
The methodology used to compile this disclosure is in accordance with Defra’s, Environmental Reporting Guidelines: Including streamlined energy and carbon reporting guidance (March 2019), and the World Resources Institute Greenhouse Gas (WRI GHG) Protocol Corporate Standard. Rathbones uses an operational control approach and has included GHG emissions arising from business activities in the reporting year 1 January 2020 to 31 December 2020.
It has not been practical to gather data on energy use at our Lymington office and we have used typical energy consumption benchmarks to calculate the energy use at this site based on floor area.
Avieco opinion statementThis statement provides Rathbones and its stakeholders with a third-party assessment of the quality and reliability of Rathbones’ carbon footprint data for the reporting period 1 January 2020 to 31 December 2020. It does not represent an independent third-party assurance of Rathbones’ management approach to sustainability.
Avieco has been commissioned by Rathbones for the twelfth consecutive year to calculate Rathbones’ carbon footprint for all offices in its 2020 annual report. Through this engagement, Avieco has assured Rathbones that the reported carbon footprint is representative of the business and that the data presented is credible and compliant with the appropriate standards and industry practices. Data has been collected and calculated following Defra’s ‘Environmental Reporting Guidelines: Including streamlined energy and carbon reporting guidance (March 2019)’ and the WRI GHG Protocol Corporate Standard principles of relevance, completeness, consistency, transparency and accuracy. Avieco’s work has included interviews with key Rathbones personnel, a review of internal and external documentation and interrogation of source data and data collection systems, including comparison with the previous years’ data. Avieco has concluded the following:
RelevanceWe have ensured the GHG inventory appropriately reflects the GHG emissions of the company and serves the decision-making needs of users, both internal and external to the company.
Total emissions (tCO2e) since baseline year
0
500
1,000
1,500
2,000
2,500
3,000
2019 20202013(baseline)
2,63
2
2,09
1
1,12
3
Intensity (tCO2 e/FU
MA £bn)
Tota
l em
issi
ons
(tCO
2e)
Intensity (tCO2e/FUMA £bn)
0
25
50
75
100
125
150
175
Given the challenges faced throughout 2020, we are pleased that we were able to accelerate several important initiatives, reflecting our continued commitment to reducing our environmental impact. In 2019, we initiated a review and upgrade of desktop IT and, due to the prolonged period of time for which our employees were remote working, this programme was completed early. Following discussions in an environmental focus group, we gathered suggestions for further improvements, such as updated waste management systems and a reduction in printed material, which we will look to implement in the near future. In 2020 we confirmed that our London and Liverpool offices were covered with green utility contracts and although not an owner-occupier at any of our sites, we will collaborate with other tenants and our building management firms on the sourcing of green energy for our other sites. The measurement of our data was also increased in 2019 to quarterly and is now reported to the responsible business committee twice a year. This regular oversight has allowed the management team to monitor the impact of COVID-19 and focus capital investment where required.
Carbon offsetting programmeWhilst our footprint has evidently reduced this year, we recognise that this level is unlikely to be sustained. Our commitment to reducing our footprinting our operations in parallel with offsetting of our residual emissions remains and we purchased and retired 1,171tonnes of CO2e credits in 2020 to compensate for our 2020 residual emissions and the additional emissions from our restatement of 2019 scope 3. Having reviewed our approach to offsetting we are furthering our partnership with ClimateCare to identify high-impact projects which reduce carbon emissions and enable community development. Each of these exciting projects was selected in
68 Rathbone Brothers Plc Report and accounts 2020
Strategic report |

CompletenessRathbones continues to use the operational control approach to define its organisational boundary. Rathbones calculates total direct Scope 1, 2 and major Scope 3 emissions. Reported environmental data covers all employees and all entities that meet the criteria of being subject to control or significant influence of the reporting organisation.
ConsistencyTo ensure comparability, we have used the same calculation methodologies and assumptions as for the previous year, or stated any updates made across all years.
TransparencyWhere relevant, we have included appropriate references to the accounting and calculation methodologies, assumptions and recalculations performed.
AccuracyTo our knowledge, data is considered accurate within the limits of the quality and completeness of the data provided.
Looking forwardWith the delayed climate talks in Glasgow now in 2021, and the strengthening commitment from government and regulators supporting the transition to a low-carbon economy, and the UK’s aim to achieve net zero by 2050, the need for business to understand and act with regard to our climate impact will only grow. Aligning work across our operations and investments will help us play our part in the economy’s transition. The focus of our environmental programme in 2021 will be:
— investigating our net zero transition pathway, including understanding the impact of climate on our investment portfolios
— setting targets across our operational footprint — transitioning our offices to green energy — expanding our external disclosures for example TCFD and CDP.
Carbon footprint by scope (tCO2e)Rathbones’ reporting period for greenhouse gas emissions is 1 January to 31 December 2020, aligned to our financial year.Location-based emissions (tco2e)1 2013 (baseline) 2019 2020 % change
Scope 1 306 322 198 -39%UK-based2 scope 1 emissions 306 322 198 -39%Global2 scope 1 emissions – – – –Natural gas 276 322 198 -39%Refrigerants 30 – – –Company cars 0 – – –Scope 2 1,424 657 455 -31%UK-based2 scope 2 emissions 1,401 638 437 -32%Global2 scope 2 emissions 23 19 18 -5%Purchased electricity 1,424 657 455 -31%Scope 3 902 1,112 470 -58%Business travel 496 827 259 -69%Data centres3 150 135 117 -13%Paper 117 87 51 -41%Waste 9 7 4 -43%Electricity transmission and distribution4 130 56 39 -30%Total location-based5 2,632 2,091 1,123 -46%UK emissions 2,609 2,072 1,105 -47%Global emissions (excl. UK) 23 19 18 -5%Total energy consumption (kWh)6 4,748,931 4,320,690 3,494,079 -19%UK consumption (kWh) 4,678,559 4,247,556 3,423,288 -19%Global consumption (excl. UK) (kWh) 70,372 73,134 70,791 -3%Intensity ratioFUMA (£bn) 22.0 50.4 54.7 +9%Emissions intensity (tCO2e/FUMA £bn) 120 41.5 20.5 -51%
1. In accordance with best practice introduced in 2015, we report two numbers to reflect emissions from electricity. Location-based emissions are based on average emissions intensity of the UK grid and market-based emissions to reflect emissions from our specific suppliers and tariffs. Total market-based emissions from 2020 are 637 tCO2e (2019: 2,5535)
2. Under SECR regulation we are required to split our global and UK emissions. Our global emissions (excl. UK) and global consumption (excl. UK) reflect electricity emissions and consumption (respectively) from our Jersey office. It is not possible to split out travel and allocate to our Jersey office at this stage
3. Data centre emissions are reported as Scope 3, as per the WRI GHG Protocol4. Electricity transmission and distribution (T&D) reflects emissions from line losses associated with electricity transmission and distribution5. Total emissions reported in 2019 has been restated from 2,043 to 2,091 tCO2e due to a processing error of electricity T&D which was previously reported as 8 instead of 56 tCO2e6. Total energy consumption (kWh) of our Scope 1 and Scope 2 emissions (electricity and natural gas)
rathbones.com 69

Responsible business report continued
Climate-related financial disclosure
GovernanceWe believe that everyone in our company has a role to play in reducing risks, from our board and executive team, down to each of our employees. If an entire workforce can operate with accountability, this in turn enhances the effectiveness of risk management and decision-making across the group. Our approach to risk governance, processes and infrastructure ensures that we are constantly considering both existing and emerging risks to our purpose, values and strategic objectives. During the year, we revised and strengthened this risk management framework in support of our ‘three lines of defence’ model, which operates across the group. Each of these lines of defence plays an important role in the Rathbones risk framework (see pages 46-51 for more detail).
Key personnel and committeesOversight of the Rathbones risk framework starts with our board of directors, which is responsible for setting the right tone for the business, supporting a strong risk management culture and, through our senior leadership team, encouraging appropriate behaviours and collaboration across the business. Supported by the group risk committee, the board ensures risk management is integrated into our company culture and that our people embrace it as part of their day-to-day responsibilities. We believe everyone at Rathbones has a role to play in risk management, which is why it is not only linked to our employees’ individual performance and development, but also to the group’s remuneration and reward schemes.
Our chief executive, Paul Stockton, has responsibility for bringing climate-related matters to the board. Meanwhile, our chief risk officer (CRO), Sarah Owen-Jones, is the senior management function responsible for climate-related financial risks, as designated in accordance with the Prudential Regulation Authority’s Supervisory Statement on managing financial risks relating to climate change (SS3/19). The CRO reports to the non-executive chair of the board’s risk committee.
The CRO plays an important role in identifying and understanding the risks that Rathbones is exposed to. In June 2020, the CRO delivered a presentation to our executive risk committee that laid out the drivers, consequences and impacts of climate-related risks on the firm, and how we believe this maps to existing issues within our framework. This report was presented alongside a paper on the impact of climate change on our Internal Capital Adequacy Assessment Process (ICAAP). Moreover, to ensure we are actively managing climate risk, we also updated our group risk register to include sustainability as a principal risk. This is defined as the risk that our business model
does not respond in an optimal manner to changing market conditions, including environmental and social factors (see page 50 for more detail).
Day-to-day responsibility for climate change-related matters lies with the company secretariat team and is led by our corporate responsibility manager, who joined Rathbones in 2020. We are committed to responding to our stakeholders’ expectations, which is why we take our corporate responsibility seriously. Ensuring we have made a positive and lasting impact is an important part of this.
Our responsible business committee, co-chaired by our chief executive and head of specialist and charity business, oversees the four pillars of our responsible business programme, which includes climate risk, helping Rathbones deliver on its overarching climate responsibility. Established in 2020, the committee will meet at least four times a year and report to the group executive committee and the board at least twice a year.
Our stewardship, responsible investment and investment executive committees oversee the impact of climate change on our portfolios. This includes the data, research and tools required to integrate climate change into our investment decisions. Updates are given on our responsible investment activities at each responsible business committee meeting.
Employee engagementRathbones creates an open and transparent working environment where employees are encouraged to engage positively in risk management and support our key objectives. We want our employees to be risk-aware and feel empowered to make decisions that are in the best interests of our company, our stakeholders and the world around us. In situations where environmental, social and governance (ESG) risks form a key part of an employee’s role, these considerations will be incorporated into their appraisal discussions and performance assessments. Remuneration will be influenced by various factors, depending on the role.
For our investment managers, we take a number of financial and non-financial factors into consideration when determining remuneration. All variable awards are subject to our risk adjustment to variable remuneration policy, through which we can adjust overall bonus pools across any schemes in consideration of current and future risks, both financial and non-financial. This policy allows us to adjust individual variable awards to take into account crystallised risk or adverse performance outcomes, such as misconduct. When we consider risk adjustments to variable remuneration, we do so to reflect the risk and performance of the firm, business area or individual employee.
At Rathbones, we see it as our responsibility to invest for everyone’s tomorrow. That means doing the right thing for our clients and for wider stakeholders. When we make decisions, we aim for sustainable outcomes by keeping the future in mind and looking beyond the short term. This allows us to build enduring value for our clients, make a wider contribution to society and create a lasting legacy. We recognise that what we do affects the world around us. Both our business, and the businesses in which we invest, have an impact on climate change. This is why we believe it is our responsibility to reduce our impact on the environment by playing our part in the transition to a net zero economy. In this, our first report aligned with the recommendations of the Task Force on Climate-related Financial Disclosures (TCFD), we lay out our approach.
70 Rathbone Brothers Plc Report and accounts 2020
Strategic report |

Our strategyClimate change is one of the biggest challenges of our times. In 2020, climate-related risks gained even greater attention as concerns about higher temperatures, rising sea levels and increasingly frequent extreme weather events came to the fore. Given these threats, our stakeholders expect us to play a role in understanding and minimising the effects of climate change, both on our business and on society.
The Rathbones board believes that the most significant climate change-related risk to our company is the potential negative impact on investment performance of our portfolios. This may affect our organisation and stakeholders in the short, medium and long term. With this in mind, we are not only working to integrate climate considerations into our investment decisions but also to provide our clients with products that not only meet their financial needs, but can also adapt to the continually evolving environment. This is fully aligned with our corporate purpose of thinking, acting and investing responsibly, and is delivered through our strategic objectives (see pages 20-21).
Our responsible investment approachAs responsible investors, we have been members of the UN-supported Principles for Responsible Investment (PRI) for 11 years. The principles set by the PRI have help to inform our approach to responsible investing and influence portfolio
decisions. Building on this foundation, and following a review of our corporate purpose, principles and values in 2019, the board and executive committee formalised our approach to responsible investment. This resulted in the formation of our responsible investment (RI) committee and the publication of our first RI policy. Following a review in 2020 we updated our principles and they are as follows:
— ESG integration – we will consider ESG factors in the evaluation of investments to help identify opportunities and risks
— Engagement with consequences – we prioritise engagement where we can make a real difference in addressing the world’s systemic environmental and social challenges. We are prepared to reduce our holdings in companies who continue to present an ESG risk over time
— Voting with purpose – as shareholders we will actively vote across over 95% of the value of our holdings in line with our RI commitments. This may involve voting against management to help drive positive change
— Transparency – as a prominent participant in the financial markets, we are committed to being transparent about our approach to RI. We will actively report on the progress of our RI activities to our clients, shareholders and other stakeholders.
We review our RI policy on an annual basis and it is readily available on our website.
Group Executive Committee
Investment Executive Committee
Responsible Business Committee
Executive Risk Committee
Stewardship Committee
Responsible Investment Committee
Group Risk Committee
Rathbone Brothers Plc Board
Governance of our climate risk
Board Committee
Executive Committee
rathbones.com 71

Responsible business report continued
Along with integrating climate change-related risk management into our business, we are committed to provide our clients opportunities to invest in a way that drives down the carbon intensity of the economy. Our overall approach to achieving this is outlined in our climate change statement. We also offer a number of products that invest in accordance with ESG principles. These include investment management offerings from Rathbone Greenbank Investments, as well as the Rathbone Greenbank Global Sustainability Fund, Rathbone Ethical Bond Fund and Rathbone Greenbank Multi-Asset Portfolios (GMAPs). See page 24 for more detail on the GMAPs.
Key transition and physical risks to our businessIn our CDP disclosure (available from the CDP website) and in our group climate statement, we recognised the potential impacts for our business, including those associated with the transition to a greener economy (transitional risks) and the physical effects of climate change.
The transitional risks that we recognise as a company include, but are not limited to:
— market risks associated with change in the preferences of our clients
— the increasing amount of climate policy and regulation impacting our business, for example the FCA commitment to make TCFD mandatory
— an increase in the likelihood of litigation if we do not deliver on our fiduciary duty to clients by including material risks in our investment decisions
— the impact on our reputation if we do not respond to growing interest and the call for action from society, by addressing our role in and limiting the effects of climate change. We may also be impacted if we do not understand the risks and opportunities facing the companies in which we invest. A lack of understanding may impact the value of our portfolios, which could lead to the loss of clients.
Meanwhile physical risks affecting our business or the companies in which we invest are classified into two categories:
— acute: such as through the effect of extreme weather on the ability to work as planned, such as worker health and safety being at risk due to extreme heat
— chronic: where longer-term issues like rising sea levels would impact sites where businesses operate, such as a manufacturing plant based near the coast as sea level rises.
Scenario analysisAs investment managers, it is important that we are aware of the climate impacts associated with our investment portfolios and are transparent in sharing this information with our clients and stakeholders. With that in mind, in 2021 we will begin conducting scenario analysis as part of our investment management process to help us understand the impact of the transitional and physical risks of climate change on their performance.
This analysis will help us respond to our clients’ requirements and expectations, as well as the changes in our operating environment. It will strengthen our resilience by allowing us to start to integrate climate risk into our stock selection process. As outlined in our responsible investment principles (which
can be found on page 56) this includes engaging with businesses that materially impact our portfolio performance and voting to support or change corporate behaviour. In addition, we also encourage our investee companies to report openly and honestly about their activities to help us better understand their operations and the risks they face. Improving our understanding of where these risks and opportunities sit will help us deliver better outcomes for our clients and support the aims of our wider stakeholder group.
In 2020, we piloted further tools to support our approach to scenario analysis. We will finalise our decision in 2021 on which best help us to assess performance against a number of scenarios, including a Paris-aligned 2oC warming scenario.
We know that, in order to deliver the required scale of change and achieve success, we need to join likeminded organisations. We are proud to be active members of the PRI, the International Investors Group on Climate Change (IIGCC), the net zero asset managers initiative and Climate Action 100+. Alongside other members of the IIGCC, we supported the UK Build Back Better campaign and called on EU heads of state to develop a sustainable recovery plan for the EU. Our RI report shares further examples of our engagements across several matters, including climate change. In 2020, the PRI, which has aligned its questions with the TCFD recommendations, once again ranked Rathbones in the ‘A+’ band for strategy and governance linked to the responsible investment agenda.
RiskAlong with robust management of our own direct risks, we also believe it is in our clients’ best interests for the companies in which we invest to adopt best practice in managing and reporting on ESG risks. We see this as part of our duty as a good, long-term steward of the investments we manage on our clients’ behalf. This is expressed in full in our RI policy, which outlines our responsible investment principles and how they are being integrated into our stewardship process. Our approach provides a framework for each company we engage with to be managed according to the long-term interests of its shareholders.
Given the significant impact that climate change represents, we are committed to playing a positive role in the transition to a net zero economy. This will involve increasing our exposure to businesses aiding or benefiting from the transition to a net zero economy, while also decreasing our exposure to high-carbon businesses that are unable to demonstrate transition plans in alignment with the Paris Agreement.
Our overarching approach comprises the following pillars:
— ESG integration — engagement with consequences — voting with purpose — transparency.
Climate change integrationWe recognise that climate risks can affect the performance and valuation of our investments. Our research team and investment committees are actively defining methods and developing systems to fully embed climate change in the investment process across all asset classes. This will lead to updated internal policies
72 Rathbone Brothers Plc Report and accounts 2020
Strategic report |

and procedures and training requirements, as well as client-facing documentation.
Our proxy voting consultant provides us with third-party research that complements our in-house function. The sustainability issues that our consultant provides to us serve as additional insights that are shared with investment teams in the form of company share profiles. Our investment professionals consider these profiles when making investment decisions. In 2020, we included external data in the review process and this helped to strengthen our existing approach.
We also continue to invest in developing our people. In 2020, we trained investment professionals across our offices in aspects of corporate governance and stewardship policy, including climate change, and will be rolling out further training in 2021. This training enables our employees to identify, manage and monitor the risks and opportunities that face the companies within their portfolios. It also lays out the stewardship process of voting and engagement undertaken on behalf of our clients.
Our commitment to RI is demonstrated by a significant number of our research team undertaking the PRI’s Foundations in RI or Advanced RI Analysis training courses and the CFA Certificate in ESG Investing. In doing so, they have deepened their knowledge of global sustainability standards and regulations that may impact businesses and apply these considerations on assessing the materiality of ESG risks and opportunities. This allows us to share insights with investment managers and incorporate our understanding into securities analysis and investment recommendations.
Engagement with consequencesIn our climate engagements with companies, we expect progress in several areas: from enhanced corporate disclosure and board accountability, to setting Paris-aligned science-based targets (SBTs) and transition pathways, along with corresponding capital expenditure plans. With many companies committing to net-zero targets for 2050, our focus is now on engaging with companies we invest in on behalf of our clients to identify meaningful short-term metrics to demonstrate they are acting on their ambition. Although we favour engagement over divestment to influence corporate behaviour, we are prepared to reduce our holdings in companies that continue to present severe climate risks over time.
Voting with purposeWe make full use of shareholder votes and ownership rights to influence companies as part of the transition to a carbon-neutral economy. As responsible investors, we are prepared to file shareholder resolutions and vote against a company’s management if we believe it is not managing climate risks appropriately. This can include, among other things, issues related to the alignment of executive remuneration with climate change targets, boards’ accountability and oversight of climate risks, climate change-related lobbying activities and credible pathways to reach net-zero carbon targets by 2050 with near-term adjustments in capital expenditure. We are also advocates for companies giving investors an annual ‘say on climate’ at their annual general meetings, and will encourage them to adopt this approach as a matter of regular business.
TransparencyAt Rathbones, we are committed to improving the quantity and quality of our climate change-related financial disclosure by endorsing and implementing the TCFD framework. We also support efforts to make TCFD-aligned disclosures mandatory across the UK by 2025, with a significant portion of mandatory requirements in place by 2023.
To oversee our approach, our RI committee is served by two working groups that deliver active proxy voting and engagement on ESG issues: our proxy voting committee and company engagement committee.
Proxy voting and shareholder engagement at Rathbones is overseen by the 10 full-time members of the stewardship committee, who are supported by the stewardship director, our stewardship team which expanded in 2020 to include new team members including a climate specialist, and an external proxy voting consultant. We target our resources where they can make the most difference to the greatest number of clients, and have recently taken steps to improve our coverage. As such, we focus our voting resources on our largest listed security holdings and where we hold more than 3% of the shares of a company.
In practice, this approach means that we cover the majority of relevant assets under management within the wealth management business with a bespoke voting policy. Wealth management clients retain the ability to issue individual voting instructions on their stocks held in our nominee account. We have recently extended the scope of the guidance provided by the proxy voting consultant to include sustainability issues and will be incorporating these considerations into our bespoke voting policy in 2021 and beyond. More information on our approach, action and engagement is published on our website.
Metrics and targetsAs with many financial services businesses, our initial assessment of our environmental impact focused on our own operations. Like many companies, we have been successful in reducing our emissions and have offset our residual emissions since 2013. The report on our 2020 emissions and the progress we have made is on pages 67-69.
At present, our operational focus is on the largest components of our footprint: our offices and travel. So far, we have reduced our carbon intensity by 79% (tCO2e per employee) since 2013 and we are working hard to make further reductions. With that in mind, we will continue to work with our landlords and travel providers to support greener choices and review our approach to offsetting in line with our net zero ambition.
While we do not currently provide a footprint report for all our portfolios, Rathbone Greenbank publishes the footprint of its equity holdings in line with its commitment to the Montreal Pledge (see the Rathbone Greenbank website). This analysis covers 97% of the equity part of the Greenbank investment portfolios, which itself accounts for 37% of their total assets under management. Greenbank continues to work on increasing the scope of coverage by also including fixed-income investments and managed funds, using a weighted average carbon intensity method rather than share ownership.
rathbones.com 73

Responsible business report continued
Non-financial information statementReporting requirement Some of our relevant policies and standards Where to read more in the report about our impact Page
Environmental matters Group sustainability policy
Responsible investment policy
Our approach to responsibility
Responsible investment
Our environmental impact
Our TCFD disclosure
52
56
67
70Employees Code of conduct
Health and safety policy
Compliance framework policy
Anti-bribery policy
Our approach to responsibility
Our people
Workforce engagement with the board
52
59
90
Human rights Modern slavery statement
Code of conduct
Human rights
Modern slavery
64
65Social matters Code of conduct Our approach to responsibility
Community investment
52
65Anti-corruption and anti-bribery Anti-bribery policy
Conflicts of interest policy
Whistleblowing policy
Code of conduct and whistleblowing
Anti-bribery policy
64
64
Business model Our business model
Our market and opportunities
08
18Non-financial key performance indicators
Our people
Our carbon footprint
59
69
The strategic report contains certain forward-looking statements, which are made by the directors in good faith based on the information available to them at the time of their approval of this annual report. Statements contained within the strategic report should be treated with some caution due to the inherent uncertainties (including but not limited to those arising from economic, regulatory and business risk factors) underlying any such forward-looking statements. The strategic report has been prepared by Rathbone Brothers Plc to provide information to its shareholders and should not be relied upon for any other purpose.
Pages 1 to 74 constitute the strategic report, which was approved by the board and signed on its behalf by:
Paul StocktonChief Executive
03 March 2021
Jennifer MathiasGroup Finance Director
This measures a portfolio’s exposure to carbon-intensive companies based on CO2 emissions per million pounds of sales, adjusted according to each holding’s weighting within a portfolio.
Footprinting is a useful tool for understanding the impact we are having on the environment. We will be expanding our use of footprinting and, as previously mentioned, scenario analysis in our efforts to achieve net zero commitments.
Looking forwardAt Rathbones, we understand the time for action on climate change is now. The risks and opportunities facing our business and our stakeholders grow at an ever-increasing rate. This is why we are working hard to put in place a robust framework for minimising and managing climate-related risks, whilst also exploring the opportunities that affect our business, our investee companies, our clients and our stakeholders. In 2021 we will continue to develop our approach and we commit to:
— gather further data deepening our understanding of the impact of climate change on our business
— review and identify the tools and processes needed to expand our understanding of how climate risk impacts our business
— investigate our net zero transition pathway — continue to reduce our impact by integrating climate factors into our decision-making process
— update our responsible investment policy to include our approach to investment in carbon-intensive businesses
— develop our understanding of climate risk at board level and across our employee base
— evaluate, update and publish our approach and strategy to managing climate risk
— engage and collaborate with other parties to play our part in achieving the UK’s goal of net zero by 2050
— strengthen our alignment to the TCFD recommendations, in particular scenario analysis, to ensure complete alignment in 2022.
74 Rathbone Brothers Plc Report and accounts 2020
Strategic report |

Corporate governance report 76
Introduction from the chairman 76
Governance at a glance 78
Board of directors 80
Group executive committee 83
Role of the board 84
Board and board committee evaluation
86
Risk management 87
Relations with shareholders 88
Workforce engagement 90
Group risk committee report 92
Audit committee report 95
Nomination committee report 100
Remuneration committee report 103
Remuneration committee chairman’s annual statement
103
Remuneration summary for 2020 106
Directors’ remuneration policy 108
Annual report on remuneration 117
Directors’ report 127
Statement of directors’ responsibilities in respect of the report and accounts
130
Governance
rathbones.com 75

Corporate governance report
Corporate governance report
The key responsibilities of the board are to ensure effective leadership, the long-term sustainability of the firm and the creation of value for our stakeholders. The board recognises that sustainable business success is not possible without a clear purpose and that good governance is about more than complying with rules; it is also about culture, behaviours and how we service our clients. The board is therefore committed to ensuring that the firm’s purpose, values and culture are set by the whole board and embedded throughout the firm. The executive directors and management team play an integral role in this, ensuring that our people understand the firm’s culture and what is expected of them to achieve our purpose. I believe that all this, together with our strong governance framework, allows the board to ensure that the whole firm is moving in the right direction as we develop and execute our strategy.
During the COVID-19 pandemic, the board has adapted its ways of working to ensure that it continues to provide effective oversight of the firm’s operations, with appropriate challenge and support for the senior management team, whilst maintaining its clear focus on stakeholder interests. The board has met regularly via video conference during the pandemic, including weekly meetings during the peak of the 2020 UK lock down. Further information on the operation of the board during the pandemic appears later in this report.
The board recognises the important role that it plays in establishing and monitoring the group’s purpose, culture and values, and setting the right tone from the top. The ongoing assessment of the contribution of culture and values to the group’s long-term success remains a focus for the board. I have direct experience of the group’s strong and distinctive culture in action, as evidenced by our employees’ desire to support customers, clients and partners during the COVID-19 pandemic.
The board has long championed the benefits of diversity across the firm as well as in the composition of the board. I am pleased that as at the date of this report, female directors comprise over 30% of our board membership. As discussed in the responsible business report, the firm is taking steps to continue improving diversity across the organisation through a variety of initiatives.
Purpose and cultureFollowing the firm’s launch of a new purpose last year, the board has continued to provide oversight through the year. In addition, we place great emphasis on the firm’s culture, which has developed over many years and represents a key competitive advantage. The firm’s client focus and integrity are fundamental to achieving the best results for clients, colleagues and shareholders over the long term. As a board, we are responsible for setting the tone and for championing a healthy, responsible culture that will promote long-term sustainable success for all of our stakeholders, which is at the heart of our purpose. In order to achieve this goal, the board has developed a new culture dashboard which is used to monitor and analyse the firm’s culture. This dashboard contains eight core drivers that help to shape the firm’s culture and address a variety of areas including leadership, clients, employees and other stakeholders, and the firm’s attitude to change. The dashboard contains both quantitative and qualitative data and each core driver has
Mark NichollsChairman
76 Rathbone Brothers Plc Report and accounts 2020
Governance |

specific KPIs with a Red-Amber-Green (RAG)-based trend rating. The culture dashboard is updated every six months and presented to the board for review and monitoring.
In addition, non-executive directors assess the firm’s culture through informal engagement, branch visits to teams as well as the workforce engagement initiatives that are discussed on pages 88-91.
Executive remunerationExecutive remuneration remains an important area of focus and debate, and the board continues to monitor developments on this topic closely. As reported last year, the Remuneration Committee has spent considerable time reviewing the impact of CRD V on executive remuneration and, as part of our triennial review of the Directors’ Remuneration Policy, a number of changes are proposed for approval at this year’s AGM. Further information on the new policy can be found on pages 107-116. Sarah Gentleman, Chair of the Remuneration Committee, carried out an extensive consultation exercise with our largest shareholders before finalising the new policy.
Responding to the COVID-19 pandemicThe board met frequently at the height of the COVID-19 pandemic to oversee the firm’s response to safeguarding the health and well being of our colleagues, clients and communities while protecting the firm. Practically speaking, we have held all board and board committee meetings electronically since March. We have continued to keep in close contact with the executive team and colleagues from across the firm despite the remote working arrangements that have been in place for a substantial part of the year. The board continues to monitor closely our response plans as the pandemic ebbs and flows. We are also focused as a board on how our business should change and adapt going forward as we learn lessons from the crisis.
Engagement with our stakeholdersStakeholder engagement continues to be a priority for the board. During the year the board has used formal meetings and other opportunities to discuss the firm’s performance and the delivery of its strategy. You can find our formal statement in relation to section 172 of the Companies Act 2006, together with further detail about how the directors have engaged with, and had regard to the interests of, stakeholders, in the Strategic Report on pages 10-13. We also continue to fulfil our other core duties to oversee the firm’s culture, governance, financial controls, risk and change management.
There are a number of routes through which the board gains an understanding of employees views. These have included additional employee surveys during the pandemic, as we were keen to learn how home working was progressing and also the state of mental health of our staff. The feedback was then used for targeted measures to improve the safety and well being of our people. Separately, the board’s workforce engagement programme, led by Colin Clark and Sarah Gentleman, continued during the year with ongoing engagement with members of staff.
This was particularly important in light of the pandemic and details of this initiative can be found on pages 90-91.
In addition, both I and my non-executive director colleagues used formal and informal opportunities to talk to members of staff across all offices through virtual events during the year.
I and other non-executive director colleagues have also been pleased to meet and talk with a number of our shareholders during the year and we found these meetings to be most constructive. They allowed us to provide useful feedback to the whole board.
Our shareholders are key stakeholders and we continue to manage a comprehensive engagement programme with them throughout the year. During this past year we undertook a number of investor meetings, either in person or virtually. The Group Finance Director continues to report to the Board regularly on shareholders’ views on the firm, and the firm’s corporate brokers present frequently to the board on market developments and shareholder perceptions. This helps to ensure that the Board is fully briefed on the views and aspirations of shareholders.
Unfortunately, because of the COVID-19 pandemic, the firm’s 2020 AGM had to be held via telephone conference due to compulsory government measures restricting public gatherings and non-essential travel. This meant that shareholders could not attend the meeting in person. We are very aware that the AGM provides an important forum for shareholders to meet the board and raise questions and to ensure this was achieved, shareholders were encouraged to raise any questions beforehand and responses were published on our website.
SuccessionAs I mentioned in last year’s report, I have served over nine years as Chairman and Director of the firm and, as required by the 2018 Code, I intend to step down at the 2021 AGM. Following an extensive recruitment process during 2020, it is intended that Clive Bannister will become chairman following the 2021 AGM, and subject to regulatory approval. I am confident that Clive and Paul will be successful in implementing our strategy. There is further insight into the search process on page 100.
In addition, Jim Pettigrew has also indicated that he will not be seeking re-election at the 2021 AGM and will step down from the board. As part of the board’s succession planning, Colin Clark will succeed Jim as senior independent director, subject to regulatory approval. As part of our review of board effectiveness and succession planning, we have monitored constantly the breadth and depth of knowledge, industry experience and diversity within the board. As a result, we have initiated a process to appoint an additional non-executive director to the board.
This report, in its entirety, has been approved by the board of directors and signed on its behalf by:
Mark NichollsChairman
3 March 2021
rathbones.com 77

Corporate governance report continued
Governance at a glance
Board activities in 2020Strategy:
— Held a number of additional board meetings in response to COVID-19
— Set up a Crisis Management Team to address the needs of the firm
— Monitored the firm’s new strategy — Held strategy day with group executive team — Conducted an external review of market trends and emerging competitors
— Focused on delivery of organic growth initiatives
Risk management: — Discussed and considered the impact of COVID-19 on our stakeholders
— Approved the firm’s risk framework and appetite
— Monitored the firm’s principal risks and compliance programme
— Received detailed reports on significant regulatory risks and management’s mitigating actions
— Reviewed the implications of Brexit for the organisation — Oversight and review of the firm’s whistleblowing report — Discussed and considered the firm’s business continuity plans
Performance review: — Discussed various financial and market scenarios in the COVID-19 climate
— Oversaw financial performance against the plan and market expectations
— Reviewed and approved capital requirements of the firm — Approved interim and full-year financial statements, interim dividend and recommended final dividend
The BoardAccountable to shareholders for the long-term sustainable success of the group. This is achieved through setting the strategy, monitoring objectives and providing oversight of the implementation of these objectives by the management team.
Group Executive CommitteeImplements the agreed strategy and oversees the day-to-day management of the group
Chairman
Nomination CommitteeResponsible for recommending changes to the composition of the board and reviewing succession planning
Chief Executive
Audit CommitteeEnsures there is confidence in the integrity of internal financial controls and corporate reporting
Senior Independent Director
Risk CommitteeProvides oversight of the firm’s risk appetite and framework
Non-executive Directors
Remuneration CommitteeResponsible for the directors’ remuneration policy and oversight of the firm’s remuneration strategy
Group Finance Director
Corporate governance framework
Read more on page 100 Read more on page 95 Read more on page 92 Read more on page 103
78 Rathbone Brothers Plc Report and accounts 2020
Governance |

Governance: — Discussed the various workforce engagement mechanisms — Assessed and oversaw the firm’s culture and how it was monitored
— Conducted an internal board evaluation — Discussed and reviewed the firm’s culture dashboard
Operational: — Reviewed executive management succession and transition plans
— Assessed the firm’s change management processes and project delivery
— Assessed and approved the firm’s 2021 budget and regulatory returns
— Discussed the firm’s suitability programme
Board activitiesdiscussed
StrategyRisk management Performance review GovernanceOperational
25%15%20%20%20%
Chief Executive — Provides executive leadership and management to the business
— Responsible for the effectiveness of the executive committee
— Delivers on strategic objectives set by the board in line with the group’s risk appetite
— Maintains strong relationships with the chairman, the board and key shareholders and stakeholders
Chairman — Leads the board and sets the agenda for board discussions
— Ensures the board is effective
— Encourages the presentation of accurate, clear and timely information
— Promotes effective and constructive dialogue between non-executive directors, executive directors and the executive team
— Chairs the nomination committee, which considers the composition of the board and succession plans
— Evaluates the performance of the board, its committees and individual directors on an annual basis
Group Finance Director
— Oversees the financial position of the group
— Together with the chief executive, leads discussions with investors
— Responsible for the management of the capital structure of the company
— Contributes to the management of the group’s operation
Senior Independent Director
— Acts as a sounding board for the chairman and serves as an intermediary for the other directors if required
— Holds meetings with the non-executive directors (without the chairman present) at least annually
— Is available to meet with a range of major shareholders to develop a balanced understanding of their issues and concerns, and reports the outcome of such meetings to the board
— Leads the board in the ongoing monitoring and annual performance evaluation of the chairman
Non-executive Directors
— Provide constructive challenge to management performance and strategy
— Contribute to the firm’s strategy
— Provide independent judgement to the board
Division of responsibilities
rathbones.com 79

Corporate governance report continued
Board of directors
Mark NichollsChairman
Jennifer MathiasGroup Finance Director
Paul StocktonChief Executive
Appointed: 01/12/2010
Experience, skills, and contributionsMark is a lawyer and corporate financier and was appointed as chairman at our 2011 AGM. After studying law at Cambridge, he qualified as a solicitor at Linklaters before joining S G Warburg in 1976. He became a director of Warburgs in 1984 and head of investment banking in 1994. In 1996, he joined Royal Bank of Scotland and became head of their private equity group, leaving in 2003 to pursue a plural career.
Current external appointmentsChairman of West Bromwich Building Society
Appointed: 01/04/2019
Experience, skills, and contributionsJennifer began her career on the Lloyds TSB Finance graduate scheme following her graduation in 1995 and qualified as a chartered management accountant in 1999. At Lloyds, Jennifer held a number of senior management roles and worked closely with the board-level team of the Lloyds TSB Group, and was a member of the Corporate Banking and Wholesale Finance Executive Committees. In addition to her position as a finance director of Corporate Banking, Jennifer spent three years as head of Credit Risk & Compliance for the Commercial Banking division of Lloyds TSB. In 2012, she joined Coutts as the global chief finance officer, and in 2015, she moved to EFG Private Bank (UK), where she was chief finance officer and deputy chief executive officer.
Current external appointmentsNone
Appointed: 09/05/2019
Experience, skills, and contributionsPaul was appointed chief executive in May 2019, having served as managing director of Rathbone Investment Management from May 2018. He was previously group finance director from 2008 to April 2019.
Paul qualified as a chartered accountant with PriceWaterhouse in 1992, subsequently taking up a position in New York before returning to London in 1996. In 1999 he joined Old Mutual Plc as group financial controller, becoming director of finance of Gerrard Limited in 2001. In 2005, two years after the sale of Gerrard, he left to work initially for Euroclear and, subsequently, as a divisional finance director of the Phoenix Group. He was formerly a non-executive director of the Financial Services Compensation Scheme.
Current external appointmentsNone
A Audit committee
N Nomination committee
Re Remuneration committee
Ri Group risk committee
GEC Executive committee
Bold in biographies indicates committee chairman
GEC GECN, Re
Chairman Executive Directors
80 Rathbone Brothers Plc Report and accounts 2020
Governance |

Jim PettigrewSenior Independent Director (Independent)
James DeanNon-executive Director (Independent)
Sarah GentlemanNon-executive Director (Independent)
Appointed: 06/03/2017
Experience, skills, and contributionsJim was appointed as a non-executive director at our 2017 AGM and was appointed as senior independent director in August 2017.
Jim has over 30 years of experience in the financial services industry. Jim was most recently non-executive chairman of Virgin Money plc. He oversaw Clydesdale Bank’s successful IPO in 2016 and its acquisition of Virgin Money plc in 2018 to create the UK’s largest challenger retail bank. He was formerly CEO at CMC Markets plc, COO at Ashmore Group plc, CFO at ICAP plc and Group Treasurer at Sedgwick Group plc.
He has extensive non-executive director experience as chairman at Edinburgh Investment Trust Plc, Miton Group Plc, RBC Europe Ltd and Scottish Financial Services trade body SFE. He has also held non-executive director positions at Aberdeen Asset Management plc, Crest Nicholson Plc, Aon UK Ltd, Hermes Fund Managers Ltd and Pacific Investments. Jim is a Past President of The Institute of Chartered Accountants of Scotland (ICAS) and was co-chair of Scotland’s Financial Services Advisory Board (FiSAB) with the First Minister of Scotland from 2016 to 2019, during which time he also sat on the City UK Advisory Board.
Current external appointmentsChair of BlueBay Asset Management LLP, Dundee Heritage Trust, and Scottish Ballet
Appointed: 01/11/2013
Experience, skills, and contributionsJames was appointed as a non-executive director in 2013 and is chair of our audit committee.
He is a chartered accountant with over 30 years’ experience working in financial services. He has worked in a variety of roles at Ernst & Young over a period of 14 years, including holding the position of managing partner for the UK Financial Services Audit Practice for four years.
Since 2012, James has gained significant non executive director experience serving on the boards of a large UK retail insurer, LV= and a small Building Society. More recently he has joined the board of a start up, PE backed London Market insurance and reinsurance company, Inigo Ltd. He is also Chairman of Reigate Grammar School
Current external appointmentsSenior Independent Director of The Stafford Railway Building Society, and Non-executive director at Inigo Ltd
Appointed: 21/01/2015
Experience, skills, and contributionsSarah is chair of our remuneration committee. She was appointed as a designated non-executive director for our workforce engagement in 2019 along with Colin Clark.
She started her career as a consultant at McKinsey & Company and then worked for several years in the telecoms and digital sectors, latterly as chief financial officer of the LCR Telecom Group. In 1999, she joined the internet bank Egg, the internet banking subsidiary of Prudential, where she was responsible for business development and strategy. In 2005, she joined Sanford C. Bernstein & Co, the institutional research and trading arm of Alliance Bernstein, as a banking analyst covering the European banking sector. Sarah is also an adviser to early-stage technology companies.
Current external appointmentsNon-executive director of Engine B Ltd
A, N, Re, Ri A, N, Re, RiA, N, Re, Ri
Non-executive Directors
rathbones.com 81

Corporate governance report continued
Terri DuhonNon-executive Director (Independent)
Appointed: 02/07/2018
Experience, skills, and contributionsTerri was appointed as a non-executive director in July 2018 and is chair of the risk committee.
Terri graduated with a Maths degree from Massachusetts Institute of Technology (MIT). She is currently a non-executive director on the board of Morgan Stanley International where she chairs the risk committee and is also chair of Morgan Stanley Investment Management Limited. She is an Associate Fellow at The Saïd Business School at Oxford University and on the MIT Corporation Visiting Committee. Previously, Terri sat on the boards of CHAPS Co and UK Operation Smile and was a founding member of the Women’s Leadership Group for the Prince’s Trust. As an executive, Terri held a number of senior roles at JP Morgan and ABN AMRO before setting up her own consultancy firm.
Current external appointmentsChair of Morgan Stanley Investment Management Ltd and non-executive director of Morgan Stanley International Ltd, and Hanover Investors Ltd.
Colin ClarkNon-executive Director (Independent)
Appointed: 24/10/2018
Experience, skills, and contributionsColin was appointed as a non-executive director in October 2018 and as a designated non-executive director for our workforce engagement programme in 2019. In addition, Colin will assume the role of senior independent director following the conclusion of 2021 AGM, and subject to regulatory approval.
He is currently chairman of Merchants Trust Plc, AXA Investment Managers UK and a non-executive director of AXA Investment Management SA. Previously, Colin worked at Mercury Asset Management and Merrill Lynch Investment Managers for over 20 years. In 2004, he was appointed a non-executive director at Standard Life Investments, and in 2010, he was appointed as an executive director of Standard Life Investments. He was appointed to the Standard Life Plc board as an executive director with responsibility for the Global Client Group and retired from this position in 2017. He was previously a non-executive director of Alpha Strategic Plc, and the Royal Marsden NHS Foundation Trust.
Current external appointmentsChairman of Merchants Trust Plc, Axa Investment Managers UK and non-executive director of AXA Investment Managers SA.
Clive BannisterChairman Designate
A, N, Re, Ri
Appointed: 12/01/2021
Experience, skills, and contributionsClive was appointed as chairman designate on 12 January 2021, subject to regulatory approval.
He started his career as a banker at First National Bank of Boston in 1981 in Boston and London, and in 1984, he joined Booz Allen & Hamilton as an associate and became a partner in the financial consulting practice in 1990.
In 1994, Clive joined HSBC Investment Bank as Director and Head of Planning and Strategy in London with a remit to help with the integration of part of James Capel. He moved to New York in 1996 to be the deputy CEO of HSBC Inc and Head of Investment Banking in the US. In 1999, he was appointed Chief Executive of HSBC Group Private Banking and subsequently became Group General Manager in July 2001, and Group Managing Director in 2006 on the Executive Committee, of Group Insurance and Asset Management at HSBC Holdings Plc. In 2011, Clive was recruited as group CEO of the Phoenix Group, the UK’s largest life and pensions consolidator. During his time at Phoenix Group, a series of successful acquisitions were made, including AXA Wealth, Sun Life, Standard Life Assurance and the acquisition of ReAssurance from Swiss Re.
Current external appointmentsClive is currently a chairman of the Museum of London.
A, N, Re, Ri
Non-executive Directors
82 Rathbone Brothers Plc Report and accounts 2020
Governance |

Paul StocktonChief Executive and chair of GEC
Rupert BaronHead of Investment Management in London
Jennifer MathiasGroup Finance Director
Andrew BrodieChief Operating Officer
Ivo DarnleyHead of Specialist and Charity Business
Mike WebbChief Executive of Funds and Head of Group Marketing and Distribution
Andrew MorrisHead of Investment Management outside of London
Sarah Owen-JonesChief Risk Officer
Richard SmeetonHead of Investment Management Special Projects and Recruitment
Group executive committee
The group executive committee (GEC) is chaired by Paul Stockton, chief executive, and he is supported by the senior management team. The key role of the GEC is day-to-day management of Rathbones. The committee actively reviews and assesses business performance supported by a range of committees that operate across the group. Kathleen Jones was appointed as an Interim Chief People Officer in June 2020 for a term of 11 months from June 2020 to May 2021.
Full biographies of the group executive committee are available at https://www.rathbones.com/investor-relations/corporate-governance/group-executive-committee
rathbones.com 83

Corporate governance report continued
Compliance with the 2018 UK Corporate Governance CodeIn relation to compliance with the 2018 UK Corporate Governance Code (the ‘Code’), which applies to the firm, this report together with the directors’ report states the position as at 3 March 2021. The directors have considered the contents and recommendations of the Code and confirm that throughout the year the company has applied the main principles and complied with the provisions of the Code with the exception of provision 19 relating to the tenure of Mark Nicholls and provision 21 relating to completion of an external board evaluation. The board has reviewed and considered provision 19 and, as reported last year, Mark Nicholls will be retiring at the 2021 AGM. With regards to provision 21, relating to an external board evaluation, the board decided it was not the right time to conduct this review and that it would be postponed until the chairman transition was completed in 2021. Nevertheless, a thorough and rigorous internal board evaluation was completed in 2020 which was supported by an external provider.
The role of the board and its committeesThe board has collective responsibility for the management, direction and performance of the company. It is accountable to shareholders for the creation and delivery of strong, sustainable financial performance and long-term shareholder value. In discharging its responsibilities, the board takes appropriate account of the interests of our wider stakeholders including clients, employees, regulators and society as a whole. To achieve its goals, the board requires a diverse and talented membership with a range of skills and experiences and the ability to challenge and support the executive management. The board has a strong non-executive membership, which comprises former executives with financial, risk management and operational experience drawn from a variety of financial institutions. In addition, the broad experience of the non-executive directors allows them to understand the challenges and opportunities that face the firm and enables them to contribute to discussions and decisions.
Board meetingsMost scheduled board meetings are preceded by a board dinner which allows for broader discussions on particular topics. The board dinners also provide an opportunity for the board to meet members of the management team or to receive training. In the months where no formal board meeting is scheduled, an informal meeting of the non-executive directors, the chairman and the chief executive is generally held. The non-executive directors also have informal meetings without the chairman or chief executive present. The roles of the chairman, the chief executive, the senior independent director and the non-executive directors have been clearly defined and agreed by the board to ensure a separation of power and authority. During the pandemic, it was important that the board continued to meet informally outside of board meetings and virtual board sessions were introduced.
At every board meeting, the chief executive updates the board on the implementation of strategy and recent developments. The group finance director reviews the financial performance and forecasts against plan and market expectations. The chief risk officer updates the board on key risk areas and any emerging regulatory issues which impact the business. The board is updated on shareholder sentiment and significant changes in the share register. In addition, members of the executive committee attend meetings as required to present and discuss progress in their individual businesses and functions.
Code principles
Leadership and purpose Our purpose 2Chairman’s statement 4Board of directors 80Group executive committee 83Stakeholder engagement (s172) 10Workforce engagement 90
Division of responsibilitiesCorporate governance framework 78Division of responsibilities 79Operations of the board 85
Composition, succession, and evaluationBoard induction 85Board and board committee evaluation 86Board diversity 86Nomination committee report 100
Audit, risk and internal controlAudit committee report 95Risk committee report 92Viability statement 51Statement of directors’ responsibilities 130
RemunerationRemuneration committee chairman’s annual statement 103Remuneration summary for 2020 106Proposed remuneration policy for 2021 107
Directors’ report 127
84 Rathbone Brothers Plc Report and accounts 2020
Governance |

Board inductionOur executive and non-executive directors are offered a comprehensive and tailored induction programme to introduce them to the business, industry and regulatory context. The programme is based on one-to-one meetings with the executive directors and executive committee members, the heads of group functions and the company secretary, and covers the areas of business outlined below:
Business review — Strategic direction and priorities — Business strategy and market analysis — Risk appetite, principal risks and risk management framework — Operations
Performance and market positioning — Review of financial and market performance — Recent analyst and media coverage — Budget review — Analysis of shareholder base and investor perception — Shareholder engagement
Regulatory environment — Overview of the group’s key compliance and regulatory policies
— Recent changes in regulatory landscape and impact of upcoming regulatory developments
— Hot topics and key priorities
People, culture, and values — Discussion of corporate values and the firm’s culture — Key people and succession plans — Board procedures and governance framework — Board structure, processes and relationships — Board interaction with key business areas — Overview of listed company obligations, reporting and governance framework
— Directors’ duties and responsibilities
Operations of the boardThe board has a rolling agenda, which ensures that key matters are addressed. The board held seven scheduled meetings during the year, a strategy day and a number of additional formal and informal meetings. The chairman and the company secretary manage board and committee meetings and ensure that the board (and particularly the non-executive directors) receive appropriate and balanced information. The company secretary manages the timely circulation of information to the board. All board papers are prepared by executives and clearly indicate any action required. As part of the annual board evaluation process, board members provided input on the level and quality of the information that is provided. In addition, the company secretary ensures board procedures are complied with and applicable rules are followed.
The company secretary facilitates the induction process for new directors, assists with their professional development and advises the board on corporate governance matters and on the rules and regulations that affect a UK-listed company. The appointment or removal of the company secretary is a matter for the board.
Board attendanceDirector Meetings attended (eligible to attend)
M P Nicholls 10(10)J W Dean 10(10)S F Gentleman 10(10)J N Pettigrew 9(10)J M Mathias 10(10)R P Stockton 10(10)T L Duhon 10(10)C M Clark 9(10)
IndependenceThe board, on the recommendation of the nomination committee, considers that all of the non-executive directors are independent, including the chairman. All board members are required to disclose any external positions or interests which might conflict with their directorship of Rathbones prior to their appointment so that any potential conflict can be properly assessed. The board has regard to the fact that experienced non-executive directors in financial firms are a valuable resource and may sit on several boards. Potential conflicts of interest of non-executive directors can generally be managed by due process and common sense.
rathbones.com 85

Board developmentThe firm is committed to the training and development of all staff to ensure professional standards are maintained and enhanced. All directors are encouraged to update their skills and any training needs are assessed as part of the board evaluation process. The knowledge and familiarity of non-executive directors with the firm is enhanced by full access to senior management and visits to teams in London and offices across the country.
The company secretary assists with the professional development requirements of the board. In addition, the board receives mandatory annual training on the following areas:
— Client Assets and Money (CASS) — Securities and Exchange Commission (SEC) obligations — Internal capital adequacy assessment process (ICAAP) and internal liquidity adequacy assessment process (ILAAP).
During the year, the board received presentations on cyber security, impact of the Capital Requirement Directive V (CRD V) and regulatory investment requirements including the associated change programmes that will be required. Committee members also receive regular updates on technical developments at scheduled meetings.
Board diversityDiversity, including ethnic diversity, is a key factor when assessing the board’s composition. It ensures there is the correct balance of skills, experience and expertise amongst non-executive directors to contribute to decision-making and assess the performance and strategy of the company.
The board has adopted a board diversity policy to ensure transparency and diversity in making appointments to the board on the recommendation of the nomination committee. This policy expresses our commitment to the principle of non-discrimination and to the promotion of fair participation and equality of opportunity for all. The gender balance of the board is also taken into consideration when recruiting a new non-executive director. This is reflected in the composition of the board, which comprised three female and five male members during 2020. The board remains committed to improving diversity at all levels across the firm. As such, it supports and is updated on diversity initiatives in place below the executive level with regular reporting to the nomination committee.
Board and board committee evaluationEach year, the board undertakes an annual review of its effectiveness with an external review taking place every three years. As discussed previously in the report, we have decided to delay our external evaluation as a result of the chairman transition that will take place in 2021.
In 2020, we conducted a self-evaluation, supported by Independent Audit Limited, who have no other connection with the firm. The board was keen for the evaluation to highlight learnings from the past and build on these for the future. The review consisted of a focused questionnaire on composition, how effectively members work together to achieve objectives, and key topics such as:
— strategy and risk — culture and stakeholders — oversight of risk management and internal audit — the effectiveness of the board committees.
In addition to responding to questions, directors provided detailed comments.
Independent Audit Limited provided a report, based on responses to this questionnaire, They presented the results, which were thoroughly discussed by the full board with a particular focus on areas where the board might develop further. Overall, the board effectiveness review was positive on the following areas:
— the board’s response to COVID-19 and how it operated in a virtual environment;
— board relations had strengthened during the year and board members appreciate one another’s strengths;
— the board has continued to develop and strengthen its oversight of the culture of the firm;
— the committees are working well and are chaired well.
Suggestions for improvement included:
— additional focus on the competitive landscape and the implementation of the firm’s strategy
— advance the people agenda and continue to build on the firm’s diversity initiatives
— continue to improve papers and information flow to the board.
The board will conduct an independent external evaluation in 2021.
Corporate governance report continued
86 Rathbone Brothers Plc Report and accounts 2020
Governance |

In addition to the board evaluation process, the senior independent director led a separate performance review in respect of the chairman which involved a discussion with the non-executive directors, excluding the chairman, and separate consultation with the chief executive. The senior independent director subsequently provided feedback to the chairman on his appraisal which confirmed his effectiveness. The chairman also conducted a performance review of each individual director, holding one-to-one meetings to discuss contribution in and outside the boardroom and any training and development needs.
Succession planningThe nomination committee is responsible for both executive and non-executive director succession planning and recommends new appointments to the board. When making board appointments, the board seeks to ensure that there is a diverse range of skills, backgrounds and experience, including relevant industry experience. Further information is included in the nomination committee report.
Board committeesDetails of the work of the principal board committees are set out in the separate reports for each committee, which follow this report.
AccountabilityThe statement of directors’ responsibility for preparing the report and accounts is set out at the end of this governance section. Within this, the directors have included a statement that the report and accounts present a fair, balanced and understandable assessment of the group’s position and prospects. To help the board discharge its responsibilities in this area, the board consulted the audit committee, which advised on the key considerations to comply with best practice and the Code’s requirements. Following the committee’s advice, the board considered and concluded that:
— the business model and strategy were clearly described — the assessment of performance was balanced — the language used was concise, with clear linkages to different parts of the document
— an appropriate forward-looking orientation had been adopted.
The directors’ report on viability and the going concern basis of accounting, which the directors have determined to be appropriate, can be found in the strategic report, which also describes the group’s performance during the year.
Risk managementIn accordance with the Code, the board is required to monitor the firm’s risk management and internal control systems on an ongoing basis and carry out a review of their effectiveness and report on this review to shareholders. Details of the company’s ongoing process for identifying, assessing and managing the principal risks, including any emerging risks, faced by the firm are contained in the risk management section on pages 46-51, together with details of those principal risks and their related mitigating factors. Whilst the board retains overall responsibility for the firm’s risk management and internal control systems, it has delegated oversight to the audit and group risk committees.
The group’s financial controls framework is designed to provide assurance that proper accounting records are adequately maintained and that financial information used within the business and for external publication is reliable and free from material misstatement, thereby safeguarding the company’s assets.
The board receives regular reports from the chairman of the group risk committee and chief risk officer on the key risks facing the firm that impact on operational and financial objectives. This assessment is completed together with assurance that the level of risk retained is consistent with and is being managed in accordance with the board’s risk appetite. These reports include current and forward-looking assessments of capital and liquidity adequacy and a summary ‘risk dashboard’ is presented. Also, during the year the board reviewed and approved the operational risk assessment process for the 2020 ICAAP document, which includes a capital assessment of financial, conduct and operational risks.
The board assesses the effectiveness of the firm’s internal controls on an annual basis and a report is provided for consideration. The report is considered one element of the overall assurance processes, and the board also considers other sources, which include reports emanating from first line of defence and second line of defence assurance teams, including group compliance, anti-money laundering (AML), as well as investment risk and information security.
A one-year risk-based approach drives internal audit coverage, and, over the course of the year, review work by the function covers all material controls across the firm including compliance, operations and finance. The observations arising from this work form the basis for the annual internal audit opinion.
rathbones.com 87

Relations with shareholdersThe board is committed to proactive and constructive engagement with the firm’s investors and is keen to develop its understanding of shareholder views.
Effective communication with investors and analysts regarding the firm’s strategy and performance is held through regular meetings and roadshows by the chief executive and finance director. The board receives and discusses shareholder and analyst feedback at each board meeting. The chairman and non-executive directors are available to meet with investors at any time including at the AGM.
Investor relations activity in 2020 included the following:
— 2019 year-end results — UK investor roadshow and analyst presentation
— Q3 trading update — analyst call — AGM — 2020 interim results — UK investor roadshow and analyst presentation
— Investec Best Ideas Conference.
During 2020, the key areas which the chief executive and finance director have discussed with investors included:
— performance expectations during COVID-19 environment — Q1 and Q2 results — resilience of the business — S & J synergies — M & A activity.
During the year, the chairman of the remuneration committee contacted our top 20 shareholders to update them on our proposed new remuneration policy and meetings were held with those interested to discuss the proposed changes. We will also continue to engage with ISS (Institutional Shareholder Services) and the Institutional Voting Information Service (IVIS) of the Investment Association, and Pensions & Investment Research Consultants Ltd (PIRC), before the AGM.
Shareholder meetingsWe welcome shareholders to our AGM in May each year. At every AGM our shareholders are given an overview of the progress of the business and outlook for the year. This is followed by the opportunity for shareholders to ask questions about the resolutions before the meeting and about the business more generally. However, in the event that there are travel restrictions in place, we plan to hold a closed AGM as we did in 2020. Shareholders will be able to appoint a proxy and send their questions to the Company Secretary before the meeting and answer will be posted on our website.
Corporate governance report continued
CultureThe board recognises the importance that culture and values play in the long-term success of the firm, and the role of the board in monitoring and assessing culture.
The board also acknowledges the importance of individual directors, and the board as a whole, acting with integrity, leading by example and promoting the desired culture. The ongoing assessment of the contribution of culture and values to the group’s long-term success remains a key focus for the board and during the year a new culture dashboard was developed based on key drivers which include leadership, clients, people, attitude to change and interaction with various stakeholders.
The board also spends time monitoring, and satisfying itself as to, the alignment of the group’s purpose, values and strategy with its culture. During the year, the board monitored, assessed and promoted the group’s culture, including in the following ways:
— half yearly review and discussion of the culture dashboard, which included setting out an assessment of culture, conduct metrics, across the firm focused on the key drivers
— regular updates to the board on external guidance and insight on culture, including from regulators and industry bodies, which are used by the board to benchmark the group’s approach and plans
— discussing feedback received from employees across the group in regular employee opinion surveys. This year, surveys included specific questions in the areas of culture and inclusivity, together with check-in surveys during the COVID-19 pandemic on employee wellbeing
— receiving updates on activities across the group in relation to culture and values, including employee training programmes
— consideration of culture, behaviour and conduct issues by the Remuneration Committee on assessing the EIP award to executives
— reviewing the group’s whistleblowing arrangements by which employees can raise concerns in confidence
— regular direct engagement with employees as part of the board’s workforce engagement programme, including site visits and participation in employee meetings
— encouraging and enabling eligible employees to participate in schemes to promote share ownership. Eligible employees are able to participate in the group’s Save As You Earn (“SAYE”) and Buy As You Earn (“BAYE”) schemes, which provide cost-effective opportunities for employees to acquire shares in the company.
The activities described above have allowed the board to effectively monitor the group’s culture during the year and to ensure that culture continues to be aligned with the group’s purpose, values and strategy.
88 Rathbone Brothers Plc Report and accounts 2020
Governance |

Rathbones Corporate
Culture
Key drivers of our corporate cultureThe board considers that there are a number of key drivers that work together to define the firm’s culture. Below is an overview of the key areas of focus that are monitored and presented back to the board in the form of a culture dashboard.
Our leadershipA leadership team that
is effective, balanced and engages with the business
Our attitude to changeChange in line with our strategy is delivered and adapted across the business
Our attitude to risk controlThe appropriate identification,
escalation and management of risk
Our interactions with our shareholdersProviding clarity and value to our shareholders
Our interactions with regulators
Maintaining open relationships and meeting
regulatory expectations
Our peopleA highly effective, collaborative and engaged workforce
How we treat our clientsA strong emphasis on client service and optimised outcomes
Our interactions with our stakeholders/
societyEngaging with our
stakeholders responsibly and positively impacting
our communities
rathbones.com 89

Corporate governance report continued
Workforce engagement with the board
Colin Clark and Sarah Gentleman are the two designated non-executive directors responsible for gathering employee feedback. A workforce engagement framework was developed which built upon existing employee engagement activities that have been in place and provide a range of opportunities to engage directly with employees and receive feedback. The framework takes account of guidance and suggestions published by the FRC in this area and is illustrated below:
Workforce engagement
structure
Workforce — contribute to engagement initiatives and provide feedback to the board
— collaborate with the board and NEDs on implementing initiatives
— able to influence new working practices and processes across the firm
Management of workforce programme
— review and analyse workforce feedback from various initiatives
— prepare and discuss findings with designated NEDs and agree recommendations for the board
— support in deliver of the annual engagement programme
Designated non-executive directors (NEDs)
— be identified and accessible to the workforce
— engage with segments of the workforce on a quarterly basis
— communicate the workforce’s feedback and messages to the board
— ongoing and regular dialogue with group executive committee/chief executive on workforce themes arising from these initiatives
Board — listen to the views and feedback of employees
— analyse the information and take into consideration inputs during its decision-making process
— communicate key messages and actions across the firm
The board acknowledges the benefits of meaningful “two-way” engagement between the directors, the executive team and the workforce. During the pandemic it was of paramount importance that the board ensured continuous engagement with our people and a range of direct and indirect employee engagement activities were launched. A summary of these activities are provided below:
Annual staff survey
CEO team visits
Quarterly pulse surveys
Virtual staff townhalls
Board branch visits
Numerous NED drop-in
sessions with front office and support teams across the
country
90 Rathbone Brothers Plc Report and accounts 2020
Governance |

Following these workforce engagement initiatives, a summary of the key themes, and actions, in 2020 are detailed below:Themes Employee feedback Management response
Communications — Enable continuous communications with colleagues and rest of the business
— Enable continuous communication with our clients
— Ongoing and regular communication from the executive team through regular virtual events on key areas of concern
— Regular ongoing board engagement and communication across the firm
— Introduction of the use of video conferencing tools to engage with clients
Employee wellbeing
— Focus on the health and safety of our employees
— Support need to manage mental wellbeing
— Support for flexible working to balance work and life at home
— Regular employee update emails on wellbeing and tools — Line managers training on wellbeing of employees — Line managers encouraged and provided guidance to interface with their teams by regular video/phone calls to support wellbeing
— Annual leave policy was reviewed and amended to enable people to take time away from work more easily
Working at home — Working effectively from home — Enabling a return to the office during COVID-19
— Rapid up scaling of secure remote access was enacted — Processes have been reviewed and redesigned to enable people to work effectively at home
— Roll-out of software and hardware across the firm — Dedicated team to address COVID-19 related questions
Clients — Communication with our clients — Quality of service delivered to our clients
— Maintaining client security
— Processes have been reviewed and redesigned to enable people to continue serving clients without reducing controls and oversight.
Examples include (but not limited to):
— Enhanced client identity verification by phone introduced — The use of video conferencing tools to engage with clients has been evaluated and approved by Risk, Compliance, Cyber and IT
— Significant uplift in deployment of recorded mobile phones for client facing employees
— Employees are regularly reminded about how to avoid data leakage, stay within GDPR requirements and ensure client security
Learning and development
— Provide support to new starters during COVID-19
— Development of our people to learn new skills
— Introduced mentoring programme across the firm — Financial planning events for our people — Offered wider online training courses
Strategy — Impact of COVID-19 on our strategy and the business model
— Key projects agreed pre-COVID have continued to progress — Launched our ESG strategy to invest responsibly and encourage greater engagement with our stakeholders
— Significant investment in technology — Consideration being given to hybrid working in the future
Feedback from our Workforce Engagement Programme:
I thought it was a very positive thing to do. Colin and Sarah seemed genuinely interested in hearing people’s thoughts. It was also a great opportunity for people across different departments to get to meet/see each other, even briefly, and understand the challenges and ideas of different areas of the business.
I felt that the board members were very open and encouraging of everyone sharing their candid views and opinions on the questions asked.
The directors were very open-minded and welcomed both positive/negative thoughts.
rathbones.com 91

Group risk committee report
Group risk committee report
Group risk committee chairman’s annual statementOn behalf of the board, I am pleased to present the group risk committee report as its chairman.
The Risk Committee’s principal roles and responsibilities are to support the board in its oversight of risk management across the group. The identification, management and mitigation of risk is fundamental to the success of the group. The committee plays an important role in setting the tone and culture that promotes effective risk management across the group.
At the start of the year, the committee had a clearly defined plan to continue embedding improvements to the firm’s risk management infrastructure, systems and skills. There was a renewed focus on monitoring the firm’s liquidity policy for investment portfolios, investment process, suitability, operational resilience and climate change risks. However, following the government announced lockdown in March 2020, the committee’s focus changed slightly to also include the changing key risks facing the firm and mitigating management actions to ensure the firm could continue serving its clients and other stakeholders. Despite the numerous challenges posed by the lockdown, which included equipping our colleagues to work from home at short notice, I am pleased to report that our response has been swift, efficient and robust. We are also seeing the clear benefits of the investment made in recent years in enhanced risk management systems, cyber defences and management information. Throughout the crisis the committee and the board have received regular and timely updates on operations, liquidity and balance sheet risks and we are well placed to meet the challenges and uncertainties ahead.
The following sections set out the committee’s membership, its key responsibilities and the principal areas of risk upon which we have focused during the year.
Committee meetingsOur current members are the independent non-executive directors, who met formally on five occasions during the year and, informally twice to review some of the inputs to key regulatory reports. In addition to the members of the committee, standing invitations are extended to the chairman, the executive directors, the chief risk officer, the chief operating officer and the head of internal audit. All attend committee meetings as a matter of course and inform the committee’s discussions. Other executive committee members and risk team members are invited to attend the committee from time to time as required to present and advise on reports commissioned.
I frequently meet with the chief risk officer in a combination of formal and informal sessions throughout the year. I also meet with senior management across all divisions of the group including the risk and compliance division throughout the year to discuss the business environment and to gather their views of emerging risks.
Membership and attendanceDirector Meetings attended (eligible to attend)
T L Duhon (chairman) 5(5)C Clark 5(5)J W Dean 5(5)S F Gentleman 5(5)J N Pettigrew 4(5)
Roles and responsibilitiesThe key activities of the committee are to provide oversight on the firm’s risk appetite and framework. To do this we:
— Review and discuss reports from the risk team on risk appetite issues and advise the board accordingly
— Discuss significant loss events, complaints and near misses, the lessons learned and management action taken
— Review end-to-end process risk assessments undertaken and any resulting internal control enhancements
— Advise the board on the risk aspects of proposed major strategic change
— The annual review of the remuneration policy this year was delayed to 2021 given the significant remuneration changes
— Review (prior to board approval) key regulatory submissions including the Group Internal Capital Adequacy Assessment Process (ICAAP) document
— Receive reports from first line risk owners on risk management and improvements to controls and processes.
Full terms of reference for the committee are reviewed annually and are available on the company’s website.
92 Rathbone Brothers Plc Report and accounts 2020
Governance |

The committee has an agreed annual standing agenda to cover key risk items in the year, which are required to be addressed in accordance with the terms of reference. The committee always starts with the chief risk officer’s report which covers the second line risk view, followed by reports from management which give the first line risk view. We then hear about financial risks, and finally internal audit gives any thoughts at the end of the meeting to cover the third line risk view. Prior to each meeting, I agree the agenda with the chief risk officer and the company secretary to identify key issues impacting on the firm that may require the committee’s attention, which either become ad hoc agenda items or standing agenda items depending on the issue.
The committee is also responsible for the inputs, outputs and the process followed to produce the following key regulatory reports:
— Internal Liquidity Adequacy Assessment Process (ILAAP); — Internal Capital Adequacy Assessment Process (ICAAP); — Pillar 3; and — Resolution and Recovery.
Committee effectivenessAn evaluation of the committee’s effectiveness was undertaken during the year as part of the internal board effectiveness review. The review found that the committee operated well and ensured that the firm’s risks were sufficiently analysed during the year.
In addition, the committee is satisfied that it has access to sufficient resource to enable it to carry out its duties and continue to perform effectively.
Committee activity in 2020In addition to reviewing the risk register, emerging risks, investment risk programme progress, suitability programme progress, contingency plans for Brexit and financial risks at each meeting, the list below summarises the key issues that the committee considered at each of its meetings during the year in addition to any other standing reports.
February 2020 — Review results of third party suitability review — Review the firm’s cyber security plan — Review the firm’s liquidity policy — Review and attest firm’s business continuity management framework
— Review of the firm’s change portfolio for the year
May 2020 — Discuss and review 2020 ICAAP and ILAAP assumptions — Review the approach towards vulnerable clients — Review the cyber threats, risks and mitigation plans — Review and consider the firm’s risk profile in the context of COVID-19 impacts
June 2020 — Discussion and approval of the ICAAP operational risk capital
— Review and consider the firm’s risk profile in the context of COVID-19 impacts
— Discuss and review firm’s IT suppliers — Discuss and review ICAAP capital stress testing model
September 2020 — Discuss firm’s people risk profile — Review and approve the 2020 recovery plan and resolution pack
— Discuss ICAAP stress testing and the impact of COVID-19 — Review and approve ILAAP liquidity stress proposal for 2020
— Discuss and review liquidity risk profiles
November 2020 — Approval of risk management policy statement — Annual approval of the firm’s risk appetite statement and risk taxonomy
— Discuss the strategic risk profile of the group — Review pension risk profile — Review insurance coverage of the group — Review the updated cyber strategy
rathbones.com 93

Group risk committee report continued
Committee activity in 2020Following the in-depth review of the risk management and risk appetite frameworks last year, the risk function continues to evolve with the three lines of defence model now well established and a mature and effective risk management framework in place. The risk design has been strengthened further with both the recruitment and development of additional skills and resource in 2020.
In light of COVID-19, the committee increased its focus on a number of areas including human capital risk, controls and processes, and the increased risk of fraud. Regarding human capital risk the focus was on employee wellness, both mental and physical. The committee received a spotlight report on this. Regarding controls and processes, the focus was on the need for review or adjustment given the new working from home environment. Regarding fraud risk, the committee and the firm continued their focus on cyber-crime during the year, as the number of industry attacks continues to increase. This risk has been mitigated by reinforcing the importance of strong cyber defences to protect client data and assets. As a result, the firm implemented a number of tangible standard operating processes, developed key structures to support the firm’s response to a cyber attack and organised regular specialist training for members of staff. In addition, the committee receives regular updates from the head of cyber security about the implementation of the firm’s cyber strategy to ensure this important risk is managed appropriately.
Notwithstanding the demands of the COVID-19 crisis, the Committee has delivered on all of its planned objectives for the year. In particular, the risk appetite framework continues to evolve, as does the quantitative analysis that supports the group’s risk management capabilities. This has allowed us to adopt and refine risk appetite measures. In addition, the committee has continued to review the firm’s suitability risks and mitigating actions to ensure progress and continuous improvement. At each meeting, a progress report was presented by management that would be reviewed and challenged by the committee.
Brexit continued to receive focus recognising that, given the group’s footprint, these were likely to be secondary in nature. Nevertheless, the firm continued to develop appropriate plans given the additional complications posed by the concurrent pandemic, with the committee being updated on status at each meeting.
A number of areas of operational and financial risks were stressed as part of the annual ICAAP and ILAAP. These conversations were particularly robust given the market moves that occurred at the beginning of the pandemic. Following extensive debate and challenge, the committee and board were satisfied that the group’s business model and allocated risk appetite remained appropriate. This is an important outcome given not only the pandemic, but also the number of change management programmes underway across the group.
The committee also increased its focus on investment risk throughout the year, looking at improved management information, processes and governance enhancements. This included providing oversight on the firm’s vulnerable clients policy and its implementation across the firm, including training for members of staff.
Finally, the links between culture, risk and remuneration are fundamental. The risk committee and chief risk officer have provided input to the remuneration committee to ensure behaviours and the management of risk during the year were considered in remuneration committee decisions.
Looking ahead to 2021In reviewing the committee’s priorities for the coming year, consideration will be given to the following areas:
— continued focus on the firm’s investment and suitability processes
— continued focus on operational resilience — oversight of the firm’s change programme — oversight of the cyber and data security programme — increased focus on climate change risk — oversight of the refreshed conduct risk framework.
Terri DuhonChairman of the group risk committee
3 March 2021
94 Rathbone Brothers Plc Report and accounts 2020
Governance |

Audit committee report
Audit committee chairman’s annual statementThe audit committee’s key role is to ensure there is confidence in the integrity of our processes and procedures as they relate to internal financial controls and corporate reporting. The board relies on the committee to review financial reporting and to appoint and oversee the work of the internal and external auditors.
During 2020, the committee has continued to provide independent scrutiny of the processes in place to monitor the company’s financial and non-financial reporting. This included oversight of the viability statement process and ensuring that this report and accounts meets the criteria for fair, balanced and understandable reporting. We have also overseen the effectiveness of the firm’s systems of internal controls. In light of the COVID-19 pandemic, there were regular internal reviews with management, the auditor and the audit chair to understand the challenges faced in delivering audited financial results.
The committee has considered a wide range of topics with a focus on the following areas:
— analysis of the firm’s financial reporting with particular consideration of accounting judgements made during the preparation of the financial statements
— review of the firm’s client assets sourcebook (CASS) audit and submissions
— defined benefit pension scheme assumptions — Speirs & Jeffrey earn-out consideration — review of the acquisition of the Personal Injury and Court of Protection business of Barclays Wealth
— refocus of the internal audit plan to include rapid assurance on control changes made to accommodate home working
— consideration of disclosures made relating to Brexit and COVID-19.
Committee meetingsOur current members are the independent non-executive directors, who met on seven occasions in 2020 (2019: seven).
The qualifications of each of the members are outlined in the biographies on pages 81 and 82. The Committee brings a diverse range of experience in finance, risk, control and business, with particular experience in the financial services sector. The composition of the committee satisfies the relevant requirements of the UK Corporate Governance Code. The board has confirmed that the members of the committee have the necessary expertise required to provide effective challenge to management. The board also considers that I have the appropriate recent and relevant experience.
In addition to the members of the committee, standing invitations are extended to the chairman, executive directors, chief risk officer, head of internal audit, group financial controller, and the external audit partner and manager. Other executives and external advisers are invited to attend the committee from time to time as required to present and advise on reports commissioned. During 2020, the audit committee met with the external auditor and head of internal audit without management present. These meetings provided an opportunity for any matters to be raised confidentially.
Membership and attendanceDirector Meetings attended (eligible to attend)
J W Dean (chairman) 7(7)C M Clark 7(7)T L Duhon 7(7)S F Gentleman 7(7)J N Pettigrew 6(7)
Roles and responsibilitiesThe key activities of the committee are as follows:
— Provide oversight of the firm’s financial performance and reporting, announcement of results and significant judgements areas
— Review the firm’s whistleblowing arrangements and ensure appropriate and independent investigations on matters
— Review the effectiveness of the firm’s internal controls and of the internal audit function
— Oversee the appointment, performance and remuneration of the external auditor, including the provision of non-audit services to the firm.
Full terms of reference for the committee are reviewed annually and are available on the company’s website.
rathbones.com 95

Audit committee report continued
Committee activity in 2020Below is a summary of the key issues that the committee considered at each of its meetings during the year.
January 2020 — Review of the report and accounts — Review the year end areas of key judgements and provisions
— Review of key corporate governance changes and disclosures
— Assessment of going concern and the viability statement — Review of internal audit plan and internal audit cycle — Approval of ISAE3402 audit report
February 2020 — Approval of the report and accounts — Assessment of the report and accounts being fair, balanced and understandable
— Review of the firm’s distributable reserves and dividend policy for 2020
— Year-end external audit report and audit opinion — Review and approval of representation letter — Review of external auditor’s letter of independence
April 2020 — Review and approval of the firm’s CASS submission — Review and approval of the Q1 interim management statement
— Review and approval of the external auditor’s letter of engagement and audit fee
— Review of internal audit plan for 2020 and completed assessments across the firm
— Ongoing review of the new internal audit co-source partner
July 2020 — Approval of half-year report for 2020 — Assessment of the firm’s statement of going concern — External auditor’s half-year review — Proposed external audit plan for the year end — Review of the FRC external audit quality inspection report — Annual review of audit and non-audit fee policy — Updated internal audit plan for 2020 in light of COVID-19 restrictions
— Approval of the internal audit charter — Approval of committee’s terms of reference
October 2020 — Review and approval of the Q3 interim management statement
— Review of internal audit plan for 2020 and completed assessments across the firm
— Review of and input to the development of the internal audit plan for 2021
— Annual review of the whistleblowing report — Annual review of the whistleblowing policy
December 2020 — Review of key judgements and provisioning for the year end — Review of audit and non-audit fees for the year — Review of internal audit plan for 2020 and approval of the 2021 internal audit plan
— Review and approval of the firm’s ISAE3402 report — Review of corporate governance changes for the year
January 2021 — Review of the report and accounts — Review of key judgements for the annual report — Review of Speirs & Jeffrey earn-out consideration — Review of 2020 internal audit plan and 2021 internal audit cycle
February 2021 — Approval of the report and accounts — Assessment of going concern and the viability statement — Assessment of the report and accounts being fair, balanced and understandable
— Review of the firm’s distributable reserves and dividend policy for 2021
— Year-end external audit report and audit opinion — Review and approval of representation letter — Review of external auditor’s letter of independence
During the year, I have regular meetings with the group finance director, head of internal audit and the external audit partner to discuss key audit-related topics ahead of each meeting.
The committee has an agreed annual standing agenda to ensure key areas are covered during the year, which it is required to address under its terms of reference. Prior to each meeting, I agree the agenda with the company secretary.
96 Rathbone Brothers Plc Report and accounts 2020
Governance |

Viability and going concernThe committee considered the requirements contained in the Code regarding the company’s viability statement, including the proposed three-year assessment period. After significant discussion, and having considered the firm’s current position and impact of potential risks, the committee concluded that the three-year assessment period continued to be appropriate and recommended the viability statement (as set out on page 51) to the board for approval. The committee also reviewed the going concern disclosure (as set out on page 129) and concluded that the firm had adequate resources to continue in operational existence for the foreseeable future and confirmed to the board that it was appropriate for the firm’s financial statements to be prepared on a going concern basis.
The carrying value of assetsWe reviewed the methodology for valuing assets where a significant amount of judgement is required, including intangible assets, particularly goodwill and client relationships.
Impairment of goodwillWe challenged management’s goodwill impairment calculations to ensure mechanical accuracy. This challenge also looked at sensitivity analysis to assess the risk whether reasonably possible changes to the assumptions used by management could give rise to an impairment. Following discussion with management, we decided not to impair any of the firm’s goodwill.
The valuation of defined benefit pension obligationsFollowing the triennial valuation of the pension schemes, we reviewed the key assumptions supporting the valuation of defined benefit pension obligations, particularly salary increases, investment returns, inflation and the discount rate, which are disclosed in note 4 to the financial statements. We reviewed the professional advice taken by the company and discussed the assumptions used by us and by other companies with the external auditors. We satisfied ourselves that the assumptions used were reasonable and consistent with the requirements of IAS19.
Speirs & Jeffrey considerationFollowing the first trigger date of the earn out payment, we reviewed the relevant calculations as well as the key assumptions supporting the forecast of the qualifying FUM for the second trigger date. In particular, we reviewed and challenged the estimated level of qualifying funds under management transfer to the firm as this was a significant judgement area for management that would lead to a wide range of potential payouts. We asked management to review the earn-out consideration in light of COVID-19 which was challenged by the committee. Additionally, Internal Audit tested the earn out calculations and reported independently on the results of this work to the committee.
Committee effectivenessThe annual review of the effectiveness of the committee was carried out internally during the year. The committee members and executive directors were invited to respond to questions on the content, management, quality and focus of discussion during meetings. I am pleased that their responses indicated that the committee is performing well with no areas of concern.
Financial reporting
Accounting judgementsAs part of the committee’s role of monitoring the integrity of the firm’s financial information contained in the interim and annual financial statements, a review of key accounting judgements and policies that were adopted by management was conducted and assessed. Following discussion with management and the external auditors, the committee concluded that these judgements were appropriate and proportionate for the firm. Details of these key significant judgements can be found in note 2 to the financial statements.
Impact of COVID-19The Committee considered the impact of COVID-19 on the financial sustainability and operational resilience of the business, taking into account the additional stress testing completed as part of the going concern and viability assessments. As a result we reviewed our approach for the interim and year end results and considered the following key areas of focus for COVID-19 impact:
— Impairment of goodwill and client intangibles — Market volatility and its impact on business performance — Increased risk of fraud — Going concern and viability — Impact on operation of key controls over financial reporting — Adequate disclosures in the Interim and Annual Report.
Fair, balanced and understandable statementOn behalf of the board, we reviewed the financial statements as a whole in order to assess whether they were fair, balanced and understandable. We discussed and challenged the balance and fairness of the overall report with the executive directors and also considered the views of the external auditor. During this review we carefully considered the clarity and coherence of disclosures made in respect of the impact of COVID-19 plus the consistency of the narrative covering the wider impacts of the pandemic on business performance and operational resilience. In addition, we carefully reviewed the s172 statement and corporate governance disclosures. We considered the overall presentation of the financial statements and was satisfied that the Annual Report could be regarded as fair, balanced and understandable and proposed that the board approve the Annual Report in that respect.
rathbones.com 97

Audit committee report continued
Per its policy, the committee reviews annually the effectiveness of the internal audit function and its level of independence. The evaluation for the year under review was completed internally and supported by feedback from stakeholders across the group. The internal audit function was operating in line with the Chartered Institute of Internal Auditors’ standard. In addition, the committee ensures the internal audit function has appropriate resources and it provides effective assurance to the firm.
As well as meetings with management, I have regular meetings on a one-to-one basis with the head of internal audit before audit committee meetings to ensure that any concerns can be raised in confidence.
Internal audit planThe Committee reviewed, challenged and approved the internal audit plan for the year, and supported the introduction of a more agile and thematic audit planning approach. This methodology has facilitated flexibility to provide assurance over controls impacted by COVID-19 and the internal audit function’s ability to meet ad hoc requests from the committee and the business.
In reviewing the audit plan, the committee continued to assess the level of internal audit resource and the appropriateness of the skills and experience of the internal audit function. Ongoing feedback on the performance of the co-source provider was presented to the committee throughout the year. The committee received regular reports on internal audit activities across the group, detailing areas identified during audits for strengthening across the group’s risk management and internal control framework. 48 audits were delivered during the period under review. These were summarised by the head of internal audit at each of the committee’s meetings.
External audit
Audit work 2020The committee has spent significant time with Deloitte during the year. In particular, the committee reviewed and challenged reports from Deloitte, which outlined their risk assessments and audit plans for 2020 (including their proposed materiality level for the performance of the annual audit), the impact of COVID-19 on their audit, and issues arising from it. Particular focus was given to their testing of internal controls, their work on the key judgement areas and possible audit adjustments. Given COVID-19 and its impact on the audit work, Deloitte enhanced their audit procedures in respect of understanding the impact on the design and operating effectiveness of internal controls on which they planned to place reliance, as a result of moving to remote working.
This year’s statutory audit is Manbhinder Rana’s second year as the audit partner and also Deloitte’s second year as auditors. The committee confirms that the Group has complied with the Statutory Audit Services for Large Companies Market Investigation (mandatory use of competitive tender processes and Audit Committee Responsibilities) Order 2014, which requires FTSE 350 companies to put their statutory audit services out to tender no less frequently than every ten years.
Acquisition of the Personal Injury and Court of Protection business of Barclays WealthIn April 2020, the firm completed its acquisition of the Personal Injury and Court of Protection business of Barclays Wealth. The transaction meets the definition of a business combination under IFRS 3 and the committee concluded that there was no impairment required on either the client relationship intangible or the goodwill balance held as at 31 December 2020. Also, the committee reviewed and challenged the earn-out arrangements and it was determined that these costs could be capitalised under IFRS 15 as these payments were deemed to be incremental and a direct cost of the transaction.
Provisions and contingent liabilitiesThe committee discussed provisions totalling £8.7 million, which have been summarised in note 26 to the financial statements. The main areas of provisions related to the Speirs & Jeffrey acquisition, deferred payment for acquired business and client compensation.
Internal audit
Internal audit functionThe internal audit function is an independent and objective team designed to add value and improve the firm’s operations by bringing a systematic and disciplined approach to evaluating and improving the effectiveness of risk management, control and governance processes. The internal audit function is the third line of defence within the controls framework, providing independent assurance to both senior management and the audit committee. EY, our co-source partner were appointed in 2019. Its role is to assist with audits which require specialist knowledge and provide support to the internal audit planning process.
Reporting and performance review of internal auditThe committee has authority to appoint or remove the head of internal audit, who reports directly to the chairman of the committee. During the year, the committee reviewed the tenure of the firm’s head of internal audit and concluded that, because it exceeded seven years, a succession plan was required for this role. As a result, a new head of internal audit was appointed and the committee will provide oversight of an orderly handover in 2021. The chairman of the committee sets the objectives of the head of internal audit, appraising her performance against those objectives and recommending her remuneration to the remuneration committee, with advice from the chief executive.
Internal audit effectivenessFollowing the EY review of the effectiveness of the internal audit function last year, the committee ensured any areas of improvement had been implemented. Also, the Annual Internal Audit Assessment, which found the governance and risk and control framework of the group to be generally effective, was reviewed by the committee in accordance with the Chartered Institute of Internal Auditors’ guidance.
98 Rathbone Brothers Plc Report and accounts 2020
Governance |

Whistleblowing policyI act as the group’s Whistleblowing Policy champion. The group continues to place a high priority on employees’ understanding of the process to enable them to speak out with confidence when appropriate. Historically, the committee has overseen the group’s whistleblowing arrangements, but this responsibility was transferred to the full board in line with the new Corporate Governance Code.
Looking forwardAs well as considering the standing items of business, the committee will also focus on the following areas during 2021:
— the induction and transition of responsibilities to the new chief internal auditor
— regular review of the Internal Audit Plan to ensure it responds to control changes as the COVID-19 pandemic evolves and working practices respond accordingly.
ApprovalIn light of its work, the committee was content with the effectiveness of the group’s processes governing financial and regulatory reporting and internal controls, its ethical standards and its relationships with regulators.
This report, in its entirety, has been approved by the committee and the board of directors and signed on its behalf by:
James DeanChairman of the audit committee
3 March 2021
External audit effectiveness and appointmentWe place great importance on the quality, effectiveness, and independence of the external audit process. In order to review the external audit process, including the performance of the external auditors, feedback is gathered from both committee members and management. This process was undertaken by internal audit. We also reviewed the annual FRC Audit Quality Inspection report prepared on our external auditor and discussed this report with the audit partner.
Auditor independence and non-audit servicesWe discussed the independence of the external auditor, the nature of non-audit services supplied by it and non-audit fee levels relative to the audit fee. As a result of the EU Audit Directive and Audit Regulations, the non-audit services policy was updated and approved. The revised policy includes prohibited services and sets a fee guide that aims to achieve a cap of 70% of the statutory audit fee in any year by 2022 following the appointment of a new auditor. The committee’s prior approval is only required where the fee for an individual non-audit service is expected to exceed £50,000 and it is on the list of pre-approved services.
Non-audit fees, excluding services required by national legislation, payable to the auditor in 2020 were £178,000. This represents 33% of the three-year average statutory audit fee of £536,000.
Prior to undertaking any non-audit service, Deloitte also completes its own independence confirmation processes, which are approved by the engagement partner. To provide the committee with oversight in this area, it submits six-monthly reports on the non-audit services it has provided.
Following a formal assessment of the external auditor’s independence and objectivity, the committee concluded that Deloitte continued to be independent and objective.
We agreed the external auditor’s fees (which are shown in note 8 to the financial statements) and reviewed the audit engagement letter. We also had discussions with the external auditor with no management present to provide an opportunity for any concerns to be raised and discussed.
rathbones.com 99

Nomination committee report
Nomination committee report
Nomination committee chairman’s annual statementThis report sets out an overview of the committee’s roles and responsibilities and its key activities during the year.
The nomination committee’s primary focus this year has been on succession planning, taking an active role in overseeing talent management and various diversity initiatives. The committee plays an increasingly broad role in ensuring the effective operation and development of the board, the executive team and the wider workforce. All are important in the delivery of our strategy.
Chairman successionAs stated in last year’s report, I will be retiring from the board as I have served over nine years as a director, which exceeds the tenure requirements of the UK corporate governance code. The nomination committee duly appointed a sub-committee (of which I was not a member) to lead the appointment process. The sub-committee, in consultation with the chief executive, prepared and approved a detailed specification for the role of chairman which included the skills, experience, knowledge and characteristics required to lead the board.
As part of the search process, the sub-committee decided to engage an external search firm and approved the appointment of Sapphire Partners (“Sapphire”). Sapphire are not connected to the company in any way and are a signatory to the voluntary code of conduct for executive search firms. To facilitate this process, Sapphire undertook detailed discussions with each member of the board in order to seek their views on the desired attributes, experience and qualities for the role of chair as well as board dynamics and the company’s culture.
A detailed search was conducted by Sapphire, as a result of which a long list of candidates was prepared from which a shortlist of potential candidates was derived. Shortlisted candidates were discussed in detail and interviews were undertaken by Sapphire, members of the sub-committee and the chief executive.
Following detailed discussions and careful consideration, the sub-committee concluded and recommended to the board that Clive Bannister be appointed to the board with effect from 12 January 2021 as a non-executive director and assume the role of chairman, subject to regulator approval, with effect from the conclusion of the 2021 Annual General Meeting, when I will step down from the board. This recommendation was approved by the board and announced on 12 January 2021.
Board successionAs part of its ongoing consideration of non-executive succession planning, the committee led the search to identify a successor to Jim Pettigrew as senior independent director as Jim indicated his intention not to seek re-election at the 2021 AGM. Following a rigourous process, on the recommendation of the committee, the board has appointed Colin Clark to take on the role of senior independent director, subject to regulatory approval.
Membership and attendanceDirector Meetings attended (eligible to attend)
M P Nicholls (chairman) 2(2)C M Clark 2(2)J W Dean 2(2)T L Duhon 2(2)S F Gentleman 2(2)J N Pettigrew 2(2)
Roles and responsibilitiesThe responsibilities of the committee include reviewing the composition (including the skills, knowledge, experience and diversity) of the board and making recommendations to the board for the appointment of directors. The board as a whole then decides on any such appointment.
The committee also has wider responsibilities for succession planning and the leadership needs of the organisation, both executive and non-executive, to ensure the continued ability of the firm to implement its strategy and compete effectively in the marketplace.
Full terms of reference for the committee are reviewed annually and are available on the company’s website.
100 Rathbone Brothers Plc Report and accounts 2020
Governance |

ChairmanExecutive directorsIndependent non-executive directors
12%25%63%
Boardcomposition
Boarddiversity
MaleFemale
53
Boardtenure
0-2 years3-5 years6-8 years9+ years
33%33%17%17%
Our board
Talent and succession planningThe committee spent time during the year reviewing our talent pipeline and considering the firm’s succession planning at board and senior management level. This included a formal review by the committee of senior management succession planning, looking at the capability and potential of incumbents in key roles and the succession pipeline, emergency cover arrangements and external market for those roles. In addition, talent management and succession planning for roles below board level has continued to be an important focus for the committee. Once again this year, it has monitored activities and initiatives to develop the group’s talent pipeline and improve gender and other diversity among senior management. The committee reviewed the skills and experience of the non-executive directors to ensure that the board continues to be able to perform its role effectively.
DiversityIn relation to board diversity, we aim to have a board that represents a wide range of skills and experiences and we value a diversity of outlook, approach and style. A balanced board is better equipped to consider matters from a broader perspective, understanding the views of our shareholders as well as other stakeholders and therefore makes decisions that fully take into consideration a wide range of issues. A board needs a range of skills and experience including knowledge of industry, culture of the firm, challenges of change, and the regulatory environment we operate in. It needs some members with a long corporate memory and others who bring fresh insights from other fields and backgrounds. There needs to be both support and challenge on the board as well as a balance of gender and commercial experience. When selecting new board members, we take these factors into account as well as professional background. A new board member needs to work well with their fellow colleagues but also to be able to provide constructive challenge.
Throughout 2020, over 33% of our board was female which ensures that we have exceeded the minimum requirements of the Hampton-Alexander review. However, the committee recognises that, due to the relatively small size of the board, the appointment or departure of a single director can have a significant impact on its ability to achieve recommendations in relation to the composition and diversity of the board as a whole at a particular point in time. The committee recognises that there is more to do in other areas, such as ethnicity and socio-economic background.
The committee expanded its remit last year to oversee certain policies and practices across the wider workforce and this includes monitoring our talent pipeline to ensure we have a diverse succession pool. Diversity is more than just gender-based and the committee considers this important issue in the wider context, considering ethnicity and social and educational background. Among other things, the committee discussed the group’s approach to recruitment, training and development programmes for employees across the group and management’s work with diversity and inclusion campaign groups. The committee believes that a wide range of experiences, backgrounds, perspectives, skills and knowledge combine to contribute towards a high performing organisation which is better able to support and delivery the firm’s strategy. During the year, the committee has ensured that the firm’s diversity and inclusion framework was a key element of the people section of our strategy.
In line with the UK Corporate Governance Code, the committee discloses that the gender balance of those in senior management (being the members of the Executive Committee and the company secretary) and their direct reports at 31 December 2020 was 25% female and 75% male. More detail on the firm’s approach to diversity and inclusion can be found in the Responsible Business Report on pages 60 to 62.
rathbones.com 101

Non-executive directors’ skillsAs mentioned above, a key responsibility of the committee is to ensure that the board maintains a balance of skills, knowledge and experience appropriate to the operation of the business and as required to deliver the strategy. During the year, the committee considered and was satisfied by the skillset and experience of the firm’s independent non-executive directors, including their extensive experience in financial services.
Independence and conflicts of interestIt is of the utmost importance that the board of a financial services firm has high-quality, experienced non-executive directors with the skills and integrity to undertake senior positions. At Rathbones, we are fortunate to have such non-executives. I maintain a dialogue with each of them on potential conflicts of interest and time commitments. I am quite satisfied that in each case any conflicts of interest are likely to be rare and will be handled appropriately by the individual concerned.
Membership and meetingsThe committee’s membership was unchanged during the year. The composition of the committee satisfies the relevant requirements of the UK Corporate Governance Code. In addition, the chief executive and group finance director attend meetings by invitation.
Board effectiveness reviewA formal and rigorous evaluation of the committee’s effectiveness was undertaken during the year as part of the internal board effectiveness review. The review found that the committee operated well during the year. Please see page 86 for more detail.
Looking forwardI look forward to working with Clive on a smooth and successful transition. The committee will continue to keep under review a succession timetable for both executives and non-executives. We will continue to monitor the development of management talent below group executive committee level, encourage greater diversity, and challenge management to develop the talent that exists in the firm.
Mark NichollsChairman of the nomination committee
3 March 2021
Nomination committee report continued
102 Rathbone Brothers Plc Report and accounts 2020
Governance |

Remuneration committee report
Remuneration committee chairman’s annual statementOn behalf of the board, I am pleased to present the directors’ remuneration report for the year ended 31 December 2020.
2020 has been an extraordinary year due to COVID-19 and the impact it has had on the firm, and also on the decisions of the remuneration committee. Nevertheless, the committee continued with its usual activities during the year and, in light of CRD V which become effective on 1 January 2021, we undertook an extensive review of the remuneration policy. This review was conducted to ensure that our remuneration policy remained fit for purpose, aligned to our business strategy, and supported the interests of shareholders and clients.
As part of this process, we wrote to and consulted with our top 20 shareholders and I had the opportunity to meet with a number of them to discuss our proposed revisions to our remuneration policy that will apply for the next three years. Their feedback has been very helpful in informing the committee’s view.
2020 performance and remuneration outcomesOur remuneration framework is closely aligned with the financial performance of the group, which has performed resiliently in 2020 despite the volatility in investment markets and FUM reached £54.7 billion at 31 December 2020 and profit before tax was £43.8m with an underlying operating margin of 25.3%. Consequently, these financial outcomes are directly reflected in the respective elements of the Executive Incentive Plan (“EIP”). Positive progress was made during the year on the non-financial objectives which cover critical project performance, stakeholder measures and client experience. We have set out in more detail the EIP results for 2020 on page 120.
Executive Incentive Plan (EIP) outcomesThe EIP performance metrics are chosen by the committee as key indicators of performance used by the firm and investors. The committee reviews the specific metrics on an annual basis at the beginning of each financial year to ensure the nature and weightings are appropriate to ensure alignment between the interests of our executive directors, our strategy and the interests of our stakeholders. These targets are set to encourage stretching levels of performance and to align with the firm’s annual budget.
The board considered a number of factors when setting and approving the final budget for 2020. This resulted in the remuneration committee approving a profit target balancing expected investment market conditions with the impact of planned investments which were critical to the execution of our strategy. As a result, and as stated at the launch of our new strategy in 2019, our underlying operating margin target range was consistent with mid-twenties market guidance. A reduction in our net organic growth target was felt to be more realistic, and the committee were comfortable that these targets were equally as stretching as those in previous years. The three-year financial targets which were disclosed in 2018 and, account for half of the overall award, remained unchanged. In addition, good progress was made during the year on the non-financial objectives which address the firm’s critical projects, stakeholder measures and client experience.
Membership and attendanceDirector Meetings attended (eligible to attend)
S F Gentleman (chairman) 5(5)C M Clark 5(5)J W Dean 5(5)T L Duhon 5(5)M P Nicholls 5(5)J N Pettigrew 4(5)
Roles and responsibilitiesThe committee’s responsibilities are to:
— Determine and set the firm’s remuneration philosophy, ensuring that it is aligned with the business plans and risk appetite
— Approve the remuneration policy for executive directors for final approval by shareholders and make remuneration decisions within the policy
— Approve total annual remuneration for executive directors based on achievements against objectives set by the committee
— Review total annual remuneration for executive committee members and material risk takers
Full terms of reference for the committee are reviewed annually and are available on the company’s website.
rathbones.com 103

Remuneration committee report continued
Proposed changes to our remuneration policyA summary of the proposed changes to our remuneration policy is detailed below:
Fixed pay: — consolidated fixed pay to include the current pension allowance of 12%, with no increases in the absolute level of fixed pay;
Annual bonus: — maximum opportunity of 135% of fixed pay — at least 60% of the award will be based on financial measures. For 2021, the financial measures will be underlying profit before tax and growth with equal weighting applied to these measures
— the remainder of the award will be focused on strategic measures that are determined by the committee each year
— 50% of the award will be deferred in shares for three years.
Restricted Stock Plan (RSP):A maximum and normal grant of 65% of fixed pay with a three-year vesting and an additional two year holding period. The award vests subject to the assessment of robust performance underpins, over a three year period.
Rationale for changeThe committee considered a wide range of alternative structures as well as taking into account the external environment on pay, shareholder views and feedback from the business and participants. In considering these factors, a summary of the committee’s key rationale for proposing the above structure is as follows:
— Simple structure: Alignment to Rathbones strategy where a simpler structure, with an annual award of shares, is the most effective way to align the pay of executives with the long term returns for shareholders.
— No increase in fixed pay: A key principle for the committee was that total pay should be broadly maintained at target, when moving from an EIP with a 300% of salary maximum, to a new 2:1 cap under CRD V. With this principle in mind, and in support of the recognition by executive directors of the sensitivities of salary increases in this environment, introducing an RSP enabled us to balance these considerations without making any increases to fixed pay.
— Quantum: In determining appropriate quantum for the bonus and RSP, we started with the current quantum of the short term and long term elements of our EIP. We used the quantum of the short term element for the annual bonus and applied a discount of 50% on the long term element to determine the RSP quantum. This results in a 6% drop in total pay at target, and an 18% drop at maximum.
Given the strong alignment between our remuneration framework and the financial performance of the firm, the financial outcomes for 2020 are directly reflected in the respective elements of the EIP. As explained in last year’s directors’ remuneration report, we had to make some adjustments to our statutory results for EIP purposes in order to fairly reflect the S&J transaction. In summary, the board approved that the acquisition be de-risked by ensuring a substantial proportion of the consideration paid for S&J was deferred and subject to the sellers remaining in employment. This meant that the deferred consideration was treated as an expense in the profit and loss accounts rather than as a capital payment and was therefore at odds with the commercial substance of the transaction. As a result, the basic earnings per share (EPS) and return on capital employed (ROCE) figures have been adjusted to fairly reflect this situation, exactly as outlined last year. There have been no further adjustments to the EIP.
The EIP vesting outcome for 2020 was 56.7% (2019: 47%) which reflects the financial measures and overall business performance for the year. We have set out in more detail the EIP results for 2020 on page 120.
A new remuneration policy for 2021The current remuneration policy has worked well over the past three years. In particular, it has consistently delivered incentive pay outs that have been well aligned to performance, and to the experience of our shareholders. However, as we indicated in last year’s report, the committee have spent time during the year considering the impact of CRD V which became effective for our business from 1st January 2021. This regulation will impact the business in a number of ways but the clear implication for our remuneration policy is that our incentives must be reduced from a 300% cap to no more than 200% of fixed pay (subject to shareholder approval).
In line with our now established three-year cycle, a new remuneration policy is being put forward to our shareholders for approval at our AGM in May 2021. In setting this policy, the priorities for the committee have been to ensure that remuneration structures and performance measures:
— support the future strategy of our business, reflecting the need for investment at different times in the market cycle and the opportunities for inorganic growth that may arise;
— align the reward received by our executive directors and the experience and interests of our shareholders;
— continue to comply with regulations and industry best practice.
104 Rathbone Brothers Plc Report and accounts 2020
Governance |

Fees and salariesThe 2021 budget for salary increases for employees across the firm was set at around 1.5%, no increases are being made for executive directors in 2021. This means that neither executive director has received a fixed pay increase since their appointment to their current roles in early 2019. The committee will continue to keep fixed pay levels under review, taking into account workforce pay and policies as per the Code, the firm’s performance and the views of shareholders. In conducting any review of fixed pay levels the committee will take into account the continued development of both executives since their appointment. The remuneration arrangements of other firms of similar size and complexity are also reviewed for guidance.
The chairman’s fee was also reviewed during the year and it is proposed to increase it in 2021 as it had not been changed since 2018.
Full details of remuneration arrangements are provided on page 118.
ConclusionI hope that you find the information in my annual statement and the directors’ remuneration report clear and useful. The remuneration landscape continues to be the subject of many political and regulatory policy changes and, as these evolve, the committee will ensure that our policy and practices remain compliant, balancing the need to remain performance-driven and competitive. I welcome any feedback you may have during the year and hope to receive your support for the approval of the remuneration report.
I would like to thank shareholders for the support they have given this year, and I hope you will recognise and approve of the substantive changes that have been made and support our 2020 DRR at the 2021 AGM.
Sarah GentlemanChairman of the remuneration committee
3 March 2021
— Alignment with long-term performance: As a wealth management business there is a strong link between the performance of Rathbones and the wider equity markets. The committee felt that an RSP structure, and a high shareholding (including post-employment), would be a more effective way of aligning the remuneration of executives with shareholder returns. A de-leveraged structure with long term shareholdings was felt to better align executives with long term performance.
— RSP Underpins: The use of performance underpins allows the committee to assess whether performance justifies the vesting of each tranche of awards. The underpins selected allow the Committee to assess performance, taking into account returns to shareholder via dividends, core financial performance (through ROCE), any operational factors (which could include any aspect of overall profitability) as well as any risk/compliance factors.
The committee are confident that the changes to the new Remuneration Policy will support the long term growth and success of Rathbones and are therefore in shareholders’ best interests. The committee strongly believes that the proposed Remuneration Policy:
— simplifies the overall remuneration structure, materially lowers the maximum potential value of remuneration, as well as moderately reducing the total remuneration at target
— protects against any “payment for failure” through the selection of robust performance underpins
— allows the executive directors to be nimble in the implementation of the strategy.
The company consulted extensively with major shareholders and their representative bodies on remuneration issues, including the development of this new directors’ remuneration policy. The consultation was well received by investors and their feedback helped inform the final scheme design. While we did not consult explicitly with employees on this new policy, the committee took account of remuneration policies elsewhere in the group.
Our new remuneration policy will have immediate effect, subject to approval from our shareholders.
Full details of the proposed changes to our policy are set out below, with further details presented on pages 112 to 116.
rathbones.com 105

Remuneration summary for 2020
The below sets out a summary of our EIP outcomes for 2020, for further information see page 118
Executive Incentive Plan performance targets
Executive Incentive Plan achievement summary 2020
One-year financial (30% of award)
— Underlying profit before tax compared to the budget
— Net organic growth in funds under management and administration compared to the target
— Underlying operating profit margin compared to target range
Three-year financial (50% of award)
— Compound annual growth in EPS over three years
— Average underlying ROCE over three years
Non-financial metrics (20% of award)
— Performance relating to delivery of strategic objectives
— Assessed and approved by remuneration committee
Remuneration committee report continued
Annual pro�t before taxTotal net organic growthUnderlying pro�t marginNon-�nancial strategic measures
% of award Achieved
10%10%
8%
10%10%10%
20% 15.6%One-yearmeasures
EPS growthUnderlying ROCE average
% of award Achieved
6.4%6.7%
25%25%
Three-yearmeasures
Remuneration outcomes (£’000)
Minimum Target Maximum Actual
1,39
3
1,96
5
1,35
8
534
934
1,31
8
912
358
Paul Stockton Jennifer Mathias
106 Rathbone Brothers Plc Report and accounts 2020
Governance |

0 300%150%75% 225%
Current as % salary
Current as % xed payFormuliac 50% discount on long term element
Final Proposal
Short term measures Bonus RSPLong term measures
150%150%
134%134%
67%134%
65%135%
0 2,0001,000500 1,500
Maximum
Target
Base EIP RSPBonusFixed payPension
Maximum
Target
Curr
ent
Prop
osed
85957477
1,43157477
347433534
347721534
The diagram below illustrates how our proposed Remuneration Policy will operate. Pages 112-116 set out how this differs from our current Policy. In summary the proposed Policy:
– Reduces the proportion of variable pay in order to comply with the 2:1 cap under CRD V – Increases the proportion of variable pay delivered in shares – Reduces total pay at target (by 6%) and at maximum (by 18%) – Consolidates and simplifies fixed pay, with no change in absolute levels
Proposed remuneration policy
Summary of proposed policy: — Annual bonus – with one year performance conditions; and
— Restricted Stock award with minimum performance underpin.
1) Bonus Award — 135% of fixed pay at maximum — 50% in cash, 50% deferred into shares with 3 year pro-rata vesting
— Assessed against financial metrics (minimum 60%) and non financial metrics (maximum 40%).
2) Restricted Share Award — 65% of fixed pay annual grant — Three year vesting period with a 2 year holding period
— Vesting based on continued employment and underpin conditions designed to avoid payment for failure.Year 0 Year 2 Year 4Year 1 Year 3 Year 5 Year 6
Fixed pay
Shares (50%)
Shares (100%)
Pre grant cond’s
Performance underpin
2 year holding periodShares
Shares
Shares
Shares
Cash (50%)
RSP (65% fixed)
Bonus (135% fixed)
Illustration of proposed policy
Overview of change in quantum vs current Policy Illustration of impact of changes for CEO
rathbones.com 107

Directors’ remuneration policy
The directors’ remuneration policy (“Policy”) outlined below is proposed for shareholder approval at the AGM in May 2021, it will apply for a period of three years from the date of the 2021 AGM unless a revised Policy is put to shareholders before then.
Fixed payPurpose and link to strategy
The core, fixed component of the package designed to enable the recruitment and retention of high-calibre individuals.
Operation
Fixed pay is reviewed annually on 1 April and is compared to fixed pay (consisting of base salary + pension) levels in other companies of similar size and complexity to ensure that a competitive rate is being paid. Adjustments may be made at other times to reflect a change of responsibility.
Opportunity
There is no maximum fixed pay, but percentage increases will normally be no higher than the general level of increase for the wider employee population, unless there are special circumstances such as a material change of responsibilities or where a salary is significantly below market median and is being brought into line.
Applicable performance measures
Not applicable.
Recovery
Not applicable.
BenefitsPurpose and link to strategy
Benefits are typically provided to directors to be generally consistent with other employees and to complement the remuneration package to ensure that it is sufficiently competitive.
Operation
Benefits are set by the committee and may include, for example:
— private medical insurance for directors and their dependants
— death in service cover — Share Incentive Plan free and matching shares
— Save As You Earn scheme — annual medicals — limited legal and professional advice on company-related matters
— relocation costs.
Opportunity
Benefits make up a small percentage of total remuneration costs.
Applicable performance measures
Not applicable.
Recovery
Not applicable.
Remuneration committee report continued
108 Rathbone Brothers Plc Report and accounts 2020
Governance |

Annual BonusPurpose and link to strategy
The Annual Bonus rewards short term performance through the achievement of corporate and individual goals and aligns the interests of shareholders and directors through the use of deferral.
The performance measures as described have been selected to support the controlled delivery of our business strategy as set out in the strategic report.
Operation
Up to 50% of the Annual Bonus is paid in cash and the remainder (at least 50%) is deferred into Rathbones shares, which vest over a three year period in equal tranches of 1/3 per annum.
The committee may award dividend equivalents on deferred shares in respect of dividends declared during the deferral period. If dividend equivalents cannot be awarded due to regulations, the number of deferred bonus shares to be awarded may be based on a share price discounted by reference to an expected dividend yield over the vesting period.
The committee retains discretion to make changes to the Annual Bonus if required by regulations including but not limited to the amount deferred, length of the deferral period, proportion paid in instruments such as shares or funds and introduction of holding periods.
Opportunity
The maximum Annual Bonus award is 135% of fixed pay.
Target performance is 60% of maximum.
Threshold performance is 25% of maximum.
Applicable performance measures
The Annual Bonus is based on the remuneration committee’s assessment of financial and non-financial performance against a balanced scorecard of measures, which are aligned to the company’s strategy.
No less than 60% of the Annual Bonus will be based on financial measures. The remainder will be based on non-financial performance measured against strategic objectives.
The performance metrics and range of outcomes for each financial measure are set by the committee and reviewed annually.
Additional considerations
The remuneration committee may make an adjustment when determining the level of the Annual Bonus, including to zero if appropriate, to take account of any of the following material events:
— underlying financial performance
— risk management or regulatory compliance issues
— personal performance
The remuneration committee may also make an adjustment when determining the level of vesting of deferred shares if there is a material downturn in financial performance.
This ability to override formulaic outcomes when determining bonus outcomes is in addition to the malus and/or clawback provisions to adjust awards.
Recovery
All unvested awards will normally lapse on termination of office unless the termination was as a “good leaver”. A ‘good’ leaver is a director who leaves on retirement, due to ill-health or disability, on the sale of the business or in any other circumstances where the committee determines good leaver treatment is appropriate. Treatment for a good leaver is defined below
Malus and/or clawback can be applied at any time up to 7 years from the date of grant in the case of share awards and 7 years from the payment of cash on cash awards. The vesting schedule for the share awards is 1/3 per annum over 3 years.
Malus and/or clawback can be applied in certain specified circumstances including: gross misconduct, material misstatement of results, where there has been an error relating to the determination of variable pay, material adverse event as determined by the committee, material failure of risk management, reputational damage, or corporate failure.
rathbones.com 109

Restricted Stock Plan (RSP)Purpose and link to strategy
The RSP provides a simple structure to align the interests of shareholders and directors in creating long term shareholder value.
Operation
An annual award of Rathbones shares, which vest after three years subject to achievement of an underpin. An additional holding period of at least two years will apply following vesting.
Notional dividends accrued on RSP awards to the extent that the underpin is met, may be delivered as shares or cash at the discretion of the committee at the same time as the delivery of vested shares. If dividend equivalents with respect to the vesting period cannot be awarded due to regulations, the number of shares to be awarded may be based on a share price discounted by reference to an expected dividend yield over the vesting period.
The committee has the discretion to make changes to its RSP policy where required under regulations including but not limited to the length of the vesting period and retention period.
Opportunity
The maximum RSP award is 65% of fixed pay. The committee will review performance prior to grant, taking individual and overall business performance into account. Subject to satisfactory individual and business performance the typical grant will be 65% of fixed pay.
Awards are granted based on satisfactory personal and group financial performance in the year prior to grant.
The committee has the discretion to adjust the number of shares vesting taking into account business, individual and wider company performance.
Applicable performance measures
The RSP is not subject to any performance measures but based on the remuneration committee’s assessment of performance relative to an underpin.
The committee will take into account the following factors (amongst others) when determining whether to exercise its discretion to adjust the number of shares vesting:
— total dividends paid relative to our generally progressive dividend policy;
— return on Capital Employed (ROCE) achieved relative to Weighted Average Cost of Capital (WACC) over the performance period; and/or
— maintenance of satisfactory operational performance and risk compliance and internal control environments over the performance period.
Additional considerations
The remuneration committee may make an adjustment when determining the level of vesting of the award, including to zero if appropriate, to take account of any material downturn in financial performance. This ability to override formulaic outcomes when determining RSP outcomes is in addition to the malus and/or clawback provisions to adjust awards.
Recovery
All unvested awards will normally lapse on termination of office unless the termination was as a “good leaver”. A ‘good’ leaver is a director who leaves on retirement, due to ill-health or disability, on the sale of the business or in any other circumstances where the committee determines good leaver treatment is appropriate. Treatment for a good leaver is defined below
Malus and/or clawback can be applied at any time up to 7 years from the date of grant.
Malus and/or clawback can be applied in certain specified circumstances including: gross misconduct, material misstatement of results, where there has been an error relating to the determination of variable pay, material adverse event as determined by the committee, material failure of risk management, or corporate failure.
Remuneration committee report continued
110 Rathbone Brothers Plc Report and accounts 2020
Governance |

Shareholding requirementsIn order to align the interests of executive directors and shareholders, the executive directors are required to acquire and retain a holding in shares or rights to shares equivalent to the value of 250% of fixed pay for the CEO and 200% of fixed pay for the CFO within five years of the date of appointment. Shares that count towards these guidelines include shares that are owned outright, vested and not exercised EIP, SIP and RSP awards and unvested deferred bonus awards. Awards count towards the shareholding requirement on a notional net of tax basis if relevant.
In addition a post-cessation shareholding requirement applies. Executive directors are required to hold 100% of the in employment requirement (or the executive’s actual shareholding on cessation if lower) for two years following cessation. This requirement can be disapplied in certain exceptional personal circumstances (e.g. death or disability).
Chairman and other non-executive directors
Base feePurpose and link to strategy
To enable the recruitment of high-calibre non-executive directors with the appropriate skills and experience.
Operation
Base fees are reviewed annually by the board on 1 April and are compared to fees in other companies of similar size and complexity to ensure that the market rate is being paid. Adjustments may be made at other times to reflect a change of responsibility. Fees are paid in cash.
Opportunity
The base fee for the chairman in 2020 was £180,000. This was increased to £195,000 on 1 January 2021. The base fee for the other non-executive directors in 2020 was £60,000. This was retained at £60,000 on 1 January 2021.
Applicable performance measures
Not applicable.
Recovery
Not applicable.
Additional responsibility feePurpose and link to strategy
To recognise the additional responsibility involved in chairing a committee (audit, group risk and remuneration) or being the senior independent director.
Operation
Additional responsibility fees are reviewed annually by the board on 1 January.
Opportunity
The additional responsibility fee remained unchanged and payable at £15,000 per annum.
Applicable performance measures
Not applicable.
Recovery
Not applicable.
rathbones.com 111

A summary of the proposed changes to our policy is provided below:
Fixed remunerationCurrent policy Proposed policy Rationale
Salary Reviewed annually on 1 January. % increases are normally in line with wider workforce.
Previous pension allowance (of 12% of salary) is consolidated with base salary into a single fixed pay figure.
No separate pension allowance is provided.
To simplify the operation of our remuneration structure, given pensions are awarded as a cash allowance and the current rate of 12% is already aligned with the wider workforce. This also allows us to demonstrate compliance with the 2:1 cap on variable.
Pension Maximum 12% of base salary
Benefits Additional benefits set by the committee and make up a small percentage of total remuneration costs.
No change. Not applicable.
Variable remunerationCurrent policy Proposed policy Rationale
Maximum opportunity
Maximum opportunity of 300% of base salary (equivalent to 268% of fixed pay).
Annual bonus – Maximum opportunity of 135% of fixed pay
RSP – Maximum opportunity of 65% of fixed pay.
Separating our current incentive into two distinct elements is more in line with market practice. The Annual bonus replaces the short term element of our previous EIP structure and the RSP replaces the long term element.
This approach allows the committee to respond to variable pay cap under CRD V (UK banking regulations) through deleveraging the current package rather than increasing fixed pay.
The same short-term quantum of our previous EIP structure is maintained and the long-term quantum of our previous EIP structure is reduced by 50%.
Deferral 60% of the EIP award deferred over a five-year period, vesting in equal tranches per annum.
Annual bonus – At least 50% of the annual bonus is deferred over a three-year period, vesting in equal tranches per annum.
RSP – Award vests after three years and subject to an additional two-year holding period.
Under our previous EIP structure, deferring a significant portion into shares is a key element of the current package that should be maintained.
The committee believes the RSP provides a simpler and strategically aligned approach to the Rathbones business model. Bonus deferral in combination with a significantly reduced long term award of restricted shares provided direct alignment to shareholders returns over the longer term. In all performance scenarios a greater proportion of variable pay is delivered in shares than under our current structure.
Performance measures
No less than 70% of the EIP will be based on financial measures. The remainder will be based on non-financial performance measured against strategic objectives.
Target pay-out is 60% of maximum.
Annual bonus – No less than 60% of the Annual Bonus will be based on financial measures. The remainder will be based on non-financial performance measured against strategic objectives.
Target pay-out is 60% of maximum.
RSP – Vesting of the award is subject to achievement of an underpin.
This maintains the same short-term element of our previous EIP structure as a standalone incentive whilst assessing performance against stretching one-year targets.
As an Investment and Wealth Management company the very nature of our business model requires us to deliver returns to our clients. At the same time our performance as a business is heavily influenced by the markets with challenges in forecasting over a longer period. We believe robust one year measures are the best way to assess managements performance.
Key changes to the remuneration policy
Remuneration committee report continued
112 Rathbone Brothers Plc Report and accounts 2020
Governance |

Variable remuneration continuedCurrent policy Proposed policy Rationale
Performance measures (continued)
Our growth strategy is based on growing both organically and inorganically through acquisitions. This provides significant complexity to both our long term targeting setting and assessment of outcomes, as seen most recently with S&J. Moving to an RSP structure ensures that management are accountable for the success an failure of any M&A through the absolute returns to shareholders rather than based on adjustments to incentive targets.
The comprehensive underpin allows the committee to assess performance and reduce the vesting (including to nil) for material adverse outcomes, taking into account returns to shareholder via dividends, core financial performance (through ROCE), any operational factors (which could include any aspect of overall profitability) as well as any risk/compliance factors.
Leaver provisions
Default approach is that all unvested awards are forfeited for a bad leaver, and vest in full at the normal time for a good leaver.
Bad leaver provisions remain unchanged.
Good leavers will receive a pro rata award
To align with best practice
Malus/clawback
Applies at any time up to seven years from grant of shares.
Applies at any time up to seven years from grant of shares with enhanced malus/clawback trigger events.
To align with emerging best practice.
OtherCurrent policy Proposed policy Rationale
Shareholding requirements
200% of base salary within five years of appointment.
Retain 200% of base salary in the first year post-cessation and 100% of base salary in the second year post-cessation.
Increased shareholding from 200% of base salary to 200% of fixed pay (250% of fixed pay for the CEO) to be maintained for two years post cessation.
To align with emerging best practice and to increase alignment with shareholder interests.
rathbones.com 113

Potential remuneration received under the proposed remuneration policy
— Fixed Pay levels are £534,000 for CEO and £358,000 for the Finance Director. Benefits are included at the same value as paid in 2020.
— Target opportunity includes fixed pay, 60% of maximum bonus (81% of fixed pay) and 100% vesting of RSP (65% of fixed pay).
— Maximum opportunity includes fixed pay, 100% of maximum bonus (135% of fixed pay) and 100% vesting of RSP (65% of fixed pay).
— Maximum opportunity with 50% share price growth includes maximum pay and 50% share increase on RSP shares over the vesting period.
Definition of performance metricsThe Annual Bonus performance metrics chosen by the committee are key indicators of performance used by the business and shareholders. Financial measures incentivise the delivery of strong financial performance for our shareholders in the relevant financial year, whilst non-financial measures link executive performance to the delivery of key strategic initiatives and projects that support the firm’s business plan. For the 2021 Annual Bonus, performance metrics will be profit before tax,
FUMA growth and strategic measures which are the three core KPIs. The committee reviews the specific choice of performance metrics for the Annual Bonus on an annual basis at the beginning of each financial year to ensure that the nature and weighting of these remain appropriate to ensure alignment between the interests of our executive directors, our business strategy and the interests of our clients and shareholders. Further details on how the specific choice of measures for the 2021 Annual Bonus links to our strategic goals is provided in the At a Glance section above.
The targets for these measures are considered annually by the committee and are set to encourage stretching levels of performance without inadvertently motivating inappropriate behaviour. Rathbones will prospectively disclose the targets on a retrospective basis as these are considered commercially sensitive.
The use of discretionThe committee may make minor amendments to the policy set out above (for regulatory, exchange control, tax or administrative purposes or to take account of a change in legislation) without obtaining shareholder approval for that amendment. In relation to the new plan, the committee retains discretion when selecting participants, determining the treatment of leavers, agreeing the timing of awards and reviewing the balanced scorecard of performance measures, targets and weightings. The committee reserves the right to retrospectively adjust performance measures and targets if events (for example, a major acquisition) make them inappropriate. Adjustments will not be made to make the conditions materially easier to satisfy.
The committee reserves the right to make any remuneration payments, and payments for loss of office (including exercising any discretions available to it in connection with such payments) notwithstanding that they are not in line with the policy set out above, where the terms of the payment were agreed (i) before the policy came into effect or (ii) at a time when the relevant individual was not a director of the company and, in the opinion of the committee, the payment was not in consideration for the individual becoming a director of the company. For these purposes ‘payments’ include awards of variable remuneration and, in relation to an award over shares, the associated terms ‘agreed’ at the time the award is granted.
ConsultationThe company consulted extensively with major shareholders and their representative bodies on remuneration issues, including in the development of this new directors’ remuneration Policy. While we did not consult explicitly with employees on this new Policy, the committee took account of remuneration policies elsewhere in the group.
Chief Executive (£'000)
0 2,0001,000500 1,500
Minimum
Target
Maximum
Maximum +50% share price growth
Fixed pay Annual Bonus Restricted Stock PlanBene�ts
2534 £536
347 £1,3164332
2
2
2
534
347 £1,604721534
521 £1,778721534
Finance Director (£'000)
Minimum
Target
Maximum
Maximum +50% share price growth
Fixed pay Annual Bonus Restricted Stock PlanBene�ts
0 2,0001,000500 1,500
£882
358
233290358
483
483
233 £1,075
349 £1,191
358
358
1
1 £359
1
1
Remuneration committee report continued
114 Rathbone Brothers Plc Report and accounts 2020
Governance |

Appointment of new directorsFor new executive and non-executive directors, the structure of the package offered will mirror that provided to current directors under the new directors’ remuneration policy. The package quantum will depend on the role and the experience and background of the new director. Advice from our remuneration consultants will be taken to ensure that the package is in line with median market levels for companies of similar size and complexity. Any future variable award will be made within the 135% maximum for Annual Bonus and 65% maximum for RSP (subject to shareholder approval).
The company may pay compensation to new directors for remuneration the individual has forfeited in order to take up the role with Rathbones. Rathbones will ensure that these awards are no more generous in either amount or terms than the awards they replace. These awards may be structured differently from awards made under our standard directors’ remuneration policy in order to best reflect the remuneration being forfeited.
Service contracts and letter of appointmentIt is company policy that service contracts should not normally contain notice periods of more than 12 months. Details of the notice periods in the contracts of employment of executive directors serving during the year are as shown below.Executive director Date of contract Notice period
R P Stockton 01 May 2019 12 monthsJ E Mathias 27 Sept 2018 6 months
There are no provisions within the contracts to provide automatic payments in excess of payment in lieu of notice upon termination by the company and no predetermined compensation package exists in the event of termination of employment. Payment in lieu of notice would include fixed pay and benefits. There are no provisions for the payment of liquidated damages or any statements in respect of the duty of mitigation. In the event of entering into a termination agreement, the board will take steps to impose a legal obligation on the director to mitigate any loss incurred. There are no clauses in contracts amending employment terms and conditions on a change of control. Executive directors’ contracts of service, which include details of remuneration, are available for inspection at the company’s registered office and will be available for inspection at the AGM.
Non-executive directors have a letter of appointment rather than a contract of employment and these are available for inspection at the AGM. As with all other directors, they are required to stand for re-election annually in accordance with the UK Corporate Governance Code. The effectiveness of the non-executive directors is subject to an annual assessment. Any term beyond six years is subject to particularly rigorous review and takes into account the need for progressive refreshing of the board. The executive directors are responsible for determining the fees of the non-executive directors.
Non-executive director Date of appointment Notice periodLength of service at 31 December 2020
M P Nicholls 01 Dec 2010 1 month 10 yearsC M Clark 24 Oct 2018 1 month 2 yearsJ W Dean 01 Nov 2013 1 month 7 yearsT L Duhon 02 Jul 2018 1 month 2 yearsS F Gentleman 21 Jan 2015 1 month 5 yearsJ N Pettigrew 06 Mar 2017 1 month 3 years
Payments for loss of officeCompensation payments will be determined on a case-by-case basis in the light of current market practice. Compensation will include loss of salary and other contractual benefits (as stated above), but mitigation will be applied where appropriate.
Any entitlement to Annual Bonus, deferred shares and RSP awards will depend on whether the individual is treated as a good or bad leaver, in line with the table opposite.
rathbones.com 115

Other directorshipsThe board believes that the firm can benefit from experience gained when executive directors hold non-executive directorships. Executive directors are permitted to hold external appointments and to receive payments provided such appointments are agreed by the board in advance, there are no conflicts of interests and the appointment does not lead to deterioration in the executive’s performance.
Consideration of remuneration across the firmThe committee provides oversight of remuneration structures across the firm, including members of the group executive committee, material risk takers and the risk and compliance teams. In addition, the committee reviews on an annual basis total remuneration costs across the firm in light of its short and longer term financial targets and ongoing sustainability.
The committee is well aware of the remuneration structures across the firm and takes these into consideration when taking decisions on remuneration for executive directors.
Consideration of shareholders’ viewsThe remuneration committee has consulted extensively with shareholders and proxy advisors during 2020, in developing this Remuneration Policy. The committee greatly values engagement with our shareholders and their views have been taken into account in finalising the design of the Policy presented here.
Legacy arrangementsAuthority is given to the committee to honour previous remuneration awards or arrangements entered into with current or former directors (such as the payment of a pension or the unwinding of legacy share schemes). Details of any payments will be set out in the annual report on remuneration as they arise.
Difference between directors’ remuneration policy and other employeesAll employees, including executive directors, benefit from fixed and variable pay, pension and non-cash benefits. The company operates a number of variable remuneration schemes within the group, some fully discretionary, others with mechanistic elements in addition to a discretionary element. Membership of such schemes is defined by status and job type. Only executive committee members are eligible to benefit from the RSP awards.
Status Definition Treatment
Good leaver Leave for reasons including retirement, ill health, sale of the business and any other reason as the committee determines.
Annual Bonus will be awarded pro-rata in the year of departure, subject to performance.
All unvested deferred shares will be delivered in line with the existing vesting schedule. The committee has the ability to accelerate vesting to the date of departure in certain exceptional circumstances (e.g. death or disability)
The default approach is that all unvested RSP awards will vest at their normal vesting date, subject to the assessment of the underpin and pro-rated for time served. Under the rules of the plan the committee has the ability to accelerate vesting and/or disapply pro-rating in exceptional circumstances.
No RSP awards will be made in the year of departure, unless the committee decides otherwise at its absolute discretion.
Bad leaver Leave for other reasons unless the committee determines otherwise.
Annual Bonus will not be awarded in the year of departure.
All unvested awards will normally lapse.
Remuneration committee report continued
116 Rathbone Brothers Plc Report and accounts 2020
Governance |

This part of the directors’ remuneration report explains how we have implemented our remuneration policy during the year. This annual report on remuneration is subject to an advisory vote at the 2021 AGM, and the financial information in this part of the remuneration report has been audited where indicated.
Role of remuneration committeeThe role of the committee is to set the overarching principles of the remuneration policy and provide oversight on remuneration across the firm. Details of the committee’s responsibilities and composition are noted above. At the invitation of the committee
chairman, the chief executive and finance director attend some or all of each meeting. The chief risk officer also advises the committee on matters relating to remuneration, and attends meetings as required. The company secretary acts as secretary and, with the chairman, agrees the agenda for each meeting.
At the end of each meeting, there is an opportunity for private discussion between committee members without the presence of management. No committee member or attendee is present when matters relating to his or her own remuneration are discussed.
Committee activity in 2020/21Below is a summary of the key issues that the committee considered at each of its meetings during the year.
February 2020 — Review information on wider workforce pay including salary budgets and forecast incentive outcomes
— Review annual risk report on variable pay targets to ensure alignment with the firm’s risk appetite
— Assess and approve the 2019 EIP award for executive directors and members of the executive committee
— Review and approve EIP performance targets for 2020 — Review and approve the directors’ remuneration report for shareholder approval
— Review and approve executive director, GEC members’ and Company Secretary’s salaries for 2021
April 2020 — Annual review of remuneration for material risk takers across the firm
— Review the implications of CRD V on the firm’s Remuneration policy
— Review and discuss shareholder and proxy agency feedback on the directors’ remuneration report
— Review regulatory developments on remuneration and their implications for the firm
July 2020 — Review of Executive Director Remuneration policy — Review remuneration of Material Risk Takers in the firm
September 2020 — Annual review of the remuneration policy statement — Propose new remuneration structures for executive directors and initiate a shareholder consultation
— Review progress against financial and non-financial EIP targets for the current year
December 2020 — Discuss shareholder feedback following consultation on the proposed changes to the firm’s Remuneration Policy
— Finalise and approve the firm’s proposed Remuneration policy
— Review progress against financial and non-financial EIP targets for 2020
— Review and approve the committee’s terms of reference — Re-appointment of the advisers to the committee
February 2021 — Review information on wider workforce pay including salary budgets and forecast incentive outcomes
— Review and approve executive director, GEC members’ and company secretary’s salaries for 2021
— Review annual risk report on variable pay targets to ensure alignment with the firm’s risk appetite
— Assess and approve the 2020 EIP award for executive directors and members of the executive committee
— Approve annual bonus performance targets for 2021 — Review and approve the directors’ remuneration report for shareholder approval
Annual report on remuneration
rathbones.com 117

Single total figure of remuneration for each executive director (audited)The table below sets out a single figure for the total remuneration received by each executive director for the year ended 31 December 2020 and the prior year:
Salary £’000
Taxable benefits and
allowances £’000
Other £’000
EIP award for the year – cash
£’000
EIP award for the year – unvested deferred shares
£’000Pensions
£’000SIP
£’000SAYE
£’000Total
£’000
Total fixed pay
£’000
Total variable pay
£’000
R P Stockton2020 477 3 – 325 487 57 4 5 1,358 537 8212019 441 2 – 248 373 53 4 4 1,125 496 629J E Mathias1
2020 320 4 – 218 327 38 – 5 912 362 5502019 240 1 50 135 203 29 – – 658 320 338
1. In 2019, Jennifer Mathias received a £50,000 award as part of her appointment in lieu of forfeiting a cash bonus from her previous employer on joining the firm. She received no further buy-outs as part of her appointment.
Taxable benefitsTaxable benefits and allowances represent the provision of private medical insurance for executive directors and their dependants and contractual travel expenses for the executive directors.
Executive Incentive PlanThe Executive Incentive Plan (EIP) was approved by shareholders at the 2015 AGM and subsequently at the 2018 AGM. The overall maximum award level achievable under the existing policy is 300% of base salary, with 60% of awards made in deferred shares, which must be held for a minimum period of five years.
Executive Incentive Plan award 2020Performance is assessed using a combination of measures that are detailed below:
Weight % % of base salary
One-year financial 30 90Three-year financial 50 150Non-financial strategic 20 60Total 100 300
1) One-year financialThe one-year financial performance measures are three key performance indicators actively used by the business, which are closely aligned to strategy. The one-year financial measures and achievement levels are provided below:
% of base salaryThreshold 75% of
base salaryOn target 180%
of base salaryMaximum 300%
of base salary ActualSpeirs & Jeffrey
adjustedWeighted payout
(% of base salary)
Financial one-yearAnnual profit before tax (£m) 30.0 61.3 68.1 74.9 43.8 76.1 30.0Total net organic growth in funds under management and administration (%) 30.0 2.0 2.5 3.0 3.0 3.0 30.0Underlying operating margin (%) 30.0 23.5 24.1 26.5 25.3 25.3 24.0
90.0 84.0
The organic growth in funds under management and administration covers both our Investment Management and Funds businesses.
2) Three-year financialThe three-year financial performance measures and achievement levels are provided below:
% of base salaryThreshold 75% of
base salaryOn target 180%
of base salaryMaximum 300%
of base salary ActualSpeirs & Jeffrey
adjusted1Weighted payout
(% of base salary)
Financial three-year EPS growth (% CAGR) 75.0 5.0 10.0 15.0 (18.8) 5.1 19.2ROCE average (%) 75.0 14.0 17.0 20.0 14.4 14.2 20.1
150.0 39.3Total one- and three-year financial 240.0 123.3
1. The adjustments for Speirs & Jeffrey are disclosed on page 104, and in further detail in report and accounts 2018 directors’ remuneration report. The key adjustment impacting the EIP outcomes for 2020 is the costs in relation to deferred consideration payable to the sellers of Speirs & Jeffrey. As a means of de-risking the transaction, these payments are subject to the sellers remaining in employment until the end of the deferral period and are therefore treated as an expense under accounting standards. For the purposes of assessing the EIP, costs of £24.1million have been reclassified as a capital item (as if paid upon completion of the transaction), to more fully reflect the commercial substance of the transaction
Remuneration committee report continued
118 Rathbone Brothers Plc Report and accounts 2020
Governance |

3) Non-financial strategicThe non-financial strategic measures are designed to drive strategic goals. Details of the performance measures, assessment and outcomes are detailed below:
Strategic objective Objective Performance in 2020Extent to which objective has been met
Client and Advisor proposition
— Development and launch of the firm’s MyRathbones portal;
— Developing the firm’s ESG proposition;
— Successful launch of Rathbones Select;
— Growth of the firm’s research capability.
— MyRathbones portal was launched on schedule, for new clients and those in selected offices;
— The firm’s ESG investment propositions were advanced during the year and the ESG data projects were implemented;
— Rathbones Select was launched during the year although slightly behind schedule.
— Redesign of the Research team was completed, with material recruitment and expansion of the team. The research universe was expanded considerably, and material used extensively during the pandemic.
Largely achieved
Delivering Growth
— Continued growth of Rathbone Unit Trust Management, distribution and, Vision Independent Financial Planning;
— Actively manage investment management team capacity;
— Launch of the advisor to advisor proposition.
— 24 new investment managers were added in 2020. — The Funds business had an exceptional year with gross inflows of £3.5bn compared to of £2.3bn of inflows in 2019. Vision continued to grow during the year achieving FUM of £2.2bn compared to £1.9bn in prior year;
— Net organic growth, excluding Funds, was below target — Fund growth and delivery of integration targets in respect of the acquired S&J business were on track;
— Successfully launched the advisor to advisor service with non-RUTM distribution flows c.50% of target.
Partially achieved
Inspiring our People
— Launch the firm’s values and redesign the performance management framework;
— Refreshed the firm’s recruitment process and diversity plans;
— Develop the firm’s future talent and initiate the graduate recruitment programme.
— Staff engagement survey score was 91% (2019: 86%). There were material improvements in most categories including change and communication;
— The firm’s values were embedded across the firm via a refreshed appraisal process. This resulted in a thorough talent assessment/succession planning throughout the business;
— An assessment of the firm’s talent pool was completed and the new Graduate Academy was completed for 2020 with a 60:40 female/male gender split, which supports wider diversity goals and targets;
— CPO appointed and team reorganisation completed.
Achieved
Operating Efficiently
— Implement changes on client on-boarding;
— Implement a progressive IT platform and deliver smaller change initiatives;
— Create an improvement road map for operational processes.
— Analogue Mifid 2 on-boarding process launched in line with plan;
— Maintain all services and operations in home working environment;
— IT change activity completed on budget and schedule; — IT stability significantly increased resulting in a reduction in events requiring action.
Achieved
Risk Management
— Ongoing momentum on suitability and improvements in documentation quality;
— Refresh SMR regime; — Conclusion of legacy operational issues;
— Proactive review of investment risk management.
— Redesigned suitability governance and the suitability management committee;
— SMR framework reviewed and updated; — Successfully managed legacy operational matters with no significant new risk issues in the year;
— Liquidity reviews completed and risks managed on an ongoing basis, which were fully reported to the group risk committee with no concerns raised.
Achieved
rathbones.com 119

Total 2020 EIP awardIn addition to the above specific measures, the committee also considered direct client feedback, investment performance and other feedback from the risk and audit committees. After taking this into account, the committee concluded that an overall score for this element of the EIP of 15.6% out of 20% was appropriate, which corresponds to 46.8% of base salary.Target Weighting Award achieved
Financial — one-year total 30% 28.0%Financial — three-year trailing 50% 13.1%Non-financial strategic measures 20% 15.6%Total award 100% 56.7%
DirectorTotal award
(£)Delivered in cash
(£)Deferred in shares
(£)
R P Stockton 811,377 324,551 486,826J E Mathias 544,320 217,728 326,592
PensionsPaul Stockton and Jennifer Mathias are paid a cash allowance of 12% of salary and neither are in receipt of a defined benefit pension.
All executive directors are eligible to participate in the Rathbone 1987 Scheme for death in service benefits.
Share Incentive Plan (SIP)This benefit is the value of the SIP matching and free share awards made in the year. All employees may contribute up to £150 per month to buy partnership shares with contributions matched on a one-for-one basis by the company. Free share awards are linked to EPS growth.
Save As You Earn (SAYE)This benefit is the value of the discount on SAYE options granted during the year.
Payments for loss of office (audited)There were no payments made to directors for loss of office during the year except as disclosed in last year’s annual report.
Payments to past directors (audited)There were no payments made to directors for loss of office during the year.
Implementation of the remuneration policy in 2021Subject to being approved by shareholders at the 2021 AGM, the remuneration policy on pages 107-116 will apply. The Committee intends to implement this policy as follows:
Fixed payNo fixed pay increases. Fixed pay levels for 2021 are £534,000 for the CEO and £358,000 for the group finance director.
Fixed pay will next be reviewed at 1st January 2022, in line with the Policy.
Remuneration committee report continued
120 Rathbone Brothers Plc Report and accounts 2020
Governance |

Annual bonusAnnual bonus for 2021 will have maximum value of 135% of fixed pay with measures and weightings as follows:
Weight % of base salary
Financial – Underlying Profit Before Tax 30% 40.5% – Total net organic growth in FUM 30% 40.5%
Strategic measures aligned to our core strategic pillars: 40% 54% – Enriching the client, adviser proposition & experience – Supporting and delivering growth – Inspiring our people – Operating more efficiently – Risk management
100% 135%
The targets under the financial metrics are deemed to be commercially sensitive and will be disclosed following the end of the performance period in next year’s DRR.
RSPThe RSP will be granted following the AGM (subject to approval) at 65% of fixed pay. The RSP will vest after three years, subject to the assessment of a performance underpin at the end of 2023. The Committee will take into account the following factors when determining whether to exercise its discretion to adjust the number of shares vesting:
— total dividends paid over the three year period relative to our generally progressive dividend policy; — return on Capital Employed (ROCE) achieved relative to Weighted Average Cost of Capital (WACC) over the three year period; — maintenance of satisfactory operational performance and risk compliance; and — internal control environments over the performance period.
Directors’ interests in shares (audited)The table below sets out details of the directors’ shareholdings and outstanding share awards that are subject to vesting conditions:
Beneficially owned shares Subject to relevant holding period
Executive directors Private shares SIP1 Total EIP
SIP (not yet beneficially
owned)1 SAYE Total
R P Stockton 83,641 3,350 86,991 49,233 686 1,658 51,577J E Mathias – – – 13,233 – 1,658 14,891Total 83,641 3,350 86,991 62,466 686 3,316 66,468
1. SIP matching and free shares held for less than three years may be forfeited in certain circumstances and so are not considered to be beneficially owned
rathbones.com 121

Executive Incentive PlanAt 1 January
2020 During 2020 At 31 December 2020
Executive directors/Grant date Type of security
Face value of award at
grant1 (£)
Number of securities originally
granted
Number of unvested securities
Securities granted2
Vested but unexercised
(subject to sales restriction
period)Unvested securities
Vested but unexercised
(subject to sales restriction
period)
Normal exercise date (end of sales
restriction period)3
R P Stockton22/03/2016 Nil paid options 272,722 12,229 4,894 – 2,445 2,449 9,780 22/03/202122/03/2017 Conditional shares 232,105 10,103 6,061 – 2,021 4,040 6,063 21/03/202223/03/2018 Conditional shares 226,485 8,864 7,091 – 1,773 5,318 3,546 23/03/202322/03/2019 Conditional shares 376,157 16,376 16,376 – 3,276 13,100 3,276 22/03/202423/03/2020 Conditional shares 372,435 24,326 24,326 – 24,326 – 23/03/2025J E Mathias23/03/2020 Conditional shares 202,608 13,233 – 13,233 – 13,233 – 23/03/2025
1. Exercise price is nil2. The number of shares awarded is calculated based on the 20-day average share price on the day prior to grant. Share price on award was £15.313. Awards vest in five equal tranches (1, 2, 3, 4 and 5 years from grant). All shares must be held until the fifth anniversary of the grant (the normal exercise date). There are no further
performance conditions on these shares
Share Incentive PlanAt 1 January
2020 During 2020At 31 December
2020
Total number of SIP shares1
Partnership shares acquired
Matching shares acquired
Dividend shares acquired
Free shares received
Total number of SIP shares1
R P Stockton 3,633 113 113 177 – 4,036J E Mathias – – – – – – Total 3,633 113 113 177 – 4,036
1. SIP matching and free shares held for less than three years may be forfeited in certain circumstances and so are not considered to be beneficially owned
Save As You Earn outstanding optionsNumber of shares
Executive directors Grant dateAt 1 January
2020Granted in
2020Exercised in
2020Lapsed in
2020
At 31 December
2020Earliest exercise
dateLatest exercise
dateMarket price on grant (p)
Exercise price (p)
R P Stockton 28/04/17 710 – – 710 – 01/06/20 01/12/20 2,373 1,89918/04/19 248 – – 248 – 01/06/22 01/12/22 2,266 1,81321/04/20 – 1,658 – – 1,658 01/06/23 01/12/23 1,356 1,085
J E Mathias 21/04/20 – 1,658 – – 1,658 01/06/23 01/12/23 1,356 1,085Total 958 3,316 – 958 3,316
Remuneration committee report continued
Shareholding guidelinesIn order to align the interests of executive directors and shareholders, with effect from 1 January 2018, the executive directors are required to acquire and retain a holding in shares or rights to shares equivalent to the value of 200% of basic salary within five years of the date of appointment, or the date of adoption of the policy. Shares that count towards these guidelines include shares that are owned outright, vested and not exercised EIP and SIP awards.
Share ownership versus policy
0% 200%100%
J E Mathias
R P Stockton 115%
534%
400%300% 500%
Bene�cially owned Conditional Remuneration policy
122 Rathbone Brothers Plc Report and accounts 2020
Governance |

Performance graphThe chart below shows the company’s total shareholder return (TSR) against the FTSE All Share Index for the 10 years to 31 December 2020. TSR is calculated assuming that dividends are reinvested on receipt. The FTSE All Share Index has been selected as a comparator as it is a suitably broad market index and has been used as a performance comparator for long-term incentive plan (LTIP) cycles since 2005-07.
Chief executive officer single figureDuring the 10 years to 31 December 2020, Andy Pomfret was chief executive until 28 February 2014. Philip Howell was chief executive until 9 May 2019 when he was succeeded by Paul Stockton.
Year Chief executive
Chief executive single figure
of total remuneration
£’000
EIP award or short-term bonus as % of maximum
opportunity
Long-term incentive vesting
as % of maximum opportunity
2020 Paul Stockton 1,358 57 – 2019 Paul Stockton 1,125 47 –2019 Philip Howell 467 52 –2018 Philip Howell 1,389 59 – 2017 Philip Howell 1,104 64 –2016 Philip Howell 1,398 66 672015 Philip Howell 1,608 78 1002014 Philip Howell 999 89 n/a2014 Andy Pomfret 342 n/a 962013 Andy Pomfret 1,204 59 1002012 Andy Pomfret 1,046 38 1002011 Andy Pomfret 678 46 –
-50
0
50
100
150
200
202020182017201620152014201320122010 2011
Rathbone Brothers Plc — TSR FTSE All Share Index — TSR
Performance graph (unaudited)
2019
rathbones.com 123

Annual percentage change in the remuneration of the directors and employeesThe table below shows the percentage year-on-year change in salary, benefits and bonus in 2020 for the directors compared with the average Rathbones employee.
Salary Benefits Annual bonus
Mark Nicholls 0% 0% 0%Paul Stockton 0% 7.1% 27%Jennifer Mathias 0% 5.5% 17.5%Jim Pettigrew 7.1% 0% 0%James Dean 7.1% 0% 0%Sarah Gentleman 7.1% 0% 0%Terri Duhon 7.1% 0% 0%Colin Clark 9.1% 0% 0%Average percentage change for board members 1.9% 6.4% 23%Average pay based on all Rathbones employees 3.6% 12.3% 11.9%
Chief executive and employee pay ratioYear Method 25th percentile pay ratio Median (50th percentile) pay ratio 75th percentile pay ratio
1 January to 31 December 2020 B 43:1 23:1 11:11 January to 31 December 2019 B 42:1 23:1 13:1
The chief executive pay ratio provides a comparison of total remuneration paid to the chief executive in the year ended 31 December 2020 with total remuneration paid to the three employees whose pay is at the 25th, 50th and 75th percentile of the group’s UK workforce (P25, P50 and P75 respectively). Where multiple employees are at these percentiles we have selected the most representative job role from across the group.
The pay data for the chief executive is taken from the total single figure of remuneration on page 118 of this report for Paul Stockton for the year ended 31 December 2020. The three employees have been identified from our 2020 gender pay gap data under ‘Option B’ of the three methodologies provided under the regulations, as the equivalent figures to the single figure table for each of the group’s UK employees (‘Option A’) are not available at the time of producing this report.
Total pay for P25, P50 and P75 has been based on actual earnings for the financial year. Variable remuneration has been calculated using the group’s forecast financial performance. Total pay and benefits for the three employees includes the following: base salary, employer pension contributions, taxable benefits, bonuses, share-based payment awards and profit share. The total pay and benefits for these individuals is as follows:
— P25 43:1 (£31,701) — P50 23:1 (£60,249) — P75 11:1 (£125,467)
The change in ratios since the prior year is due to a change in the CEO’s remuneration, and a change in the employees selected at each quartile. The group believes the median pay ratio for the year to be consistent with the group’s pay, reward and progression policies for its UK workforce.
The committee will review these ratios on an annual basis.
Chairman and non-executive directors’ fees (audited)2020
£’0002019
£’000
ChairmanM P Nicholls 180 180Non-executive directorsJ W Dean 75 70J N Pettigrew 75 70S F Gentleman 75 70T L Duhon 75 70C M Clark 60 55Total 540 515
Remuneration committee report continued
124 Rathbone Brothers Plc Report and accounts 2020
Governance |

Non-executive directors’ share interestsThe interest of the directors in the ordinary shares of the company are set out below:
Private shares SIP Total
ChairmanM P Nicholls 4,251 749 5,000Non-executive directorsC M Clark – – –J W Dean 1,000 – 1,000T L Duhon – – –S F Gentleman 100 – 100J N Pettigrew – – –Total 5,351 749 6,100
Relative importance of spend on payThe chart below shows the relationship between total employee remuneration, profit after tax and dividend distributions for 2020 and 2019. The reported profit after tax has been selected by the directors as a useful indicator when assessing the relative importance of spend on pay.
2020 2019
10%
1%5%
177.
6195.
2
26.7 37
.8
36.0
26.9
Relative importance of spend on pay (£m)
Total sta� costs
Pro�t after tax
Dividends paid
rathbones.com 125

Annual report on remuneration
(2020 AGM)
Annual report on remuneration
(2019 AGM)
Remuneration policy
(2018 AGM)
Votes cast in favour 88.82% 84.33% 85.07%Votes cast against 11.18% 15.67% 14.93%Total votes cast 78.46% 82.41% 79.17%Votes withheld 5,093 348,910 428,216
Advisers to the committee and their feesPwC were appointed as advisers to the committee in August 2017. They are members of the Remuneration Consultants Group and advise the committee on a range of matters including remuneration package assessments, scheme design and reporting best practice. PwC also provide professional services in the ordinary course of business, including advisory work to the group. The committee is of the opinion that the advice received is objective and independent. PwC’s fees are charged on a time cost basis and fees for services to the remuneration committee were £146,400 in 2020. The appointment of advisers is reviewed annually.
Evaluating the performance of the committeeThe annual evaluation of the committee’s effectiveness was undertaken as part of the board’s internal evaluation process during the year. The committee and senior management attendees were invited to respond to questions on the content, management, and quality and focus of discussion during meetings. I am pleased that responses indicated that the committee is performing well with no particular concerns.
ApprovalThe remuneration committee report, incorporating both the remuneration policy and annual report on remuneration, has been approved by the board.
Signed on behalf of the board
Sarah GentlemanChairman of the remuneration committee
3 March 2021
Votes on remuneration
0% 10% 40%20%
Remuneration policy (2018 AGM)
Annual report on remuneration(2019 AGM)
Annual report on remuneration(2020 AGM)
50%30% 60% 70% 80% 90% 100%
Votes withheld Votes cast against Votes cast in favour
14.93%
1.04%
0.63%
1.00%
15.67%
11.18%
85.07%
84.33%
88.82%
Remuneration committee report continued
Statement of shareholder votingAt the 2018 AGM, shareholders approved the remuneration policy, to apply for three years from the date of the AGM. At the 2020 AGM, shareholders also approved the remuneration report that was published in the 2019 report and accounts and the results are detailed on the opposite page.
126 Rathbone Brothers Plc Report and accounts 2020
Governance |

Directors’ report
The directors present their report for the year ended 31 December 2020.
The directors’ report includes the following sections of the annual report and accounts which forms part of the directors’ report:Section DTR Rule Page
Strategic report DTR 4.1.5R 2-74Financial statements DTR 4.1.5R 114-223Responsibility statements DTR 4.1.5R 130Corporate governance statements DTR 7.2 76
Statement by the directors under section 172 Companies Act 2006 in performance of their statutory dutiesDirectors consider that they have acted in the way they consider, in good faith, would be most likely to promote the success of the company for the benefit of its members as a whole, and in doing so having regard to the stakeholders and matters set out in section 172(1)(a-f) of the Act in the decisions taken during the year ended 31 December 2020. This is demonstrated in the strategic report on page 10.
Annual General Meeting (AGM)The 2021 AGM will be held on Thursday 6 May 2021 at 2pm at 8 Finsbury Circus, London EC2M 7AZ. Full details of all resolutions and notes are set out in the separate notice of AGM.
Group results and company dividendsThe Rathbone Brothers Plc group profit after taxation for the year ended 31 December 2020 was £26,652,000 (2019: £26,923,000).
The directors recommend the payment of a final dividend of 47.0p per share, if approved by shareholders at 2021 AGM, be paid on 11 May 2021 to shareholders on the register on 23 April 2021.
2020 2019
Pence £m Pence £m
Interim dividend 25.0 13.5 25.0 13.5Final dividend 47.0* 25.2* 45.0 24.2Total 72.0* 38.7* 70.0 37.7
* Subject to shareholder approval at the AGM on 6 May 2021
See note 12 to the financial statements.
The company operates a generally progressive dividend policy subject to market conditions. The aim is to increase the dividend in line with the growth of the business over each economic cycle. This means that there may be periods where the dividend is maintained but not increased and periods where profits are retained rather than distributed to maintain retained reserves and regulatory capital at prudent levels through troughs and peaks in the cycle.
Substantial shareholdingsAs at 31 December 2020, the company had received notifications in accordance with the Financial Conduct Authority’s Disclosure and Transparency Rule 5 of the following interests:
Shareholder Holding at
03 March 2021% held at
03 March 2021
Lindsell Train Ltd. 7,332,912 12.76Heronbridge Investment Management 3,942,497 6.86Aviva Investors 3,734,410 6.50MFS Investment Management 3,681,762 6.40BlackRock 2,734,490 4.76Vanguard Group 2,420,194 4.21Baillie Gifford & Co 2,221,794 3.86
rathbones.com 127

Share capitalThe company’s share capital comprises one class of ordinary shares of 5p each. At 31 December 2020, 57,486,413 shares were in issue (2019: 55,361,986). No shares were held in treasury. Details of the movements during the year are set out in note 30 to the financial statements. The shares carry no rights to fixed income and each share carries the right to one vote at general meetings. All shares are fully paid.
There are no specific restrictions on the size of a shareholding or on the transfer of shares, which are both covered by the provisions of the Articles of Association and prevailing legislation.
New issues of share capitalUnder section 551 of the Companies Act 2006, the board currently has the authority to allot 18,802,653 shares (approximately one third of the issued share capital at 31 March 2020). The existing authorities given to the company at the last AGM to allot shares will expire at the conclusion of the forthcoming AGM. Details of the resolutions renewing these authorities are included in the notice of AGM.
Awards under the company’s employee share plans are satisfied from a combination of shares held either in treasury or in the employee benefit trust and by newly issued shares. During the year, the company issued 264,627 shares to satisfy share awards and issued 859,800 shares to the company’s employee benefit trust, to satisfy future awards under the group’s share-based payment schemes.
Purchase of own sharesFollowing the 2020 AGM, resolution to purchase own shares, the board currently has the authority to buy back up to 2,820,000 shares under certain stringent conditions. During the year, the company did not utilise this authority but the board considers it would be appropriate to renew it. We intend to seek shareholder approval for the continued authority to purchase own shares at the forthcoming AGM in line with current investor sentiment.
Details of the resolution renewing the authority are included in the notice of AGM.
Employee share trustOn 4 April 2017, Equiniti Trust (Jersey) Limited was appointed as trustee of the second employee benefit trust. The trust is independent and holds shares for the benefit of employees and former employees of the group. The trustee has agreed to satisfy awards under the Executive Incentive Plan, Share Incentive Plan and the Savings Related Share Option Plan. As part of these arrangements, the company issued shares to the trust to enable the trustee to satisfy these awards. Further details are set out in note 32 to the financial statements. During the year, the number of shares issued by trust totalled 38,335 ordinary shares.
In addition, under the rules of the Rathbone Share Incentive Plan, shares are held in trust for participants by Equiniti Share Plan Trustees Limited (‘the Trustee’). Voting rights are exercised by the Trustee on receipt of the participant’s instructions. If no such instruction is received by the Trustee then no vote is registered. No person has any special rights of control over the company’s share capital and all issued shares are either fully or nil paid.
Appointment and removal of directorsRegarding the appointment and replacement of directors, the company is governed by the company’s Articles of Association, the UK Corporate Governance Code, the Companies Act 2006 and related legislation.
DirectorsAll those who served as directors at any time during the year are listed on page 85. Clive Bannister is our Charmain designate and will assume the role of Chairman following the 2021 AGM, and subject to regulatory approval. The directors’ interests in the share capital of the company at 31 December 2020 are set out on pages 121-122 of the remuneration committee report.
Insurance and indemnification of directorsThe company has put in place insurance to cover its directors and officers against the costs of defending themselves in civil legal action taken against them in that capacity and any damages awarded. The company has granted indemnities, which are uncapped, to its directors and to the company secretary by way of deed. Qualifying third-party indemnity provisions, as defined by section 234 of the Companies Act 2006, were therefore in place throughout 2020 and remain in force at the date of this report.
EmployeesDetails of the company’s employment practices, its policy regarding the employment of disabled persons and its employee involvement practices can be found in our people report on pages 59-63.
Directors’ report continued
128 Rathbone Brothers Plc Report and accounts 2020
Governance |

Responsible businessInformation about greenhouse gas emissions and our approach to operating as a responsible business are set out in the responsible business report on pages 52-74.
Financial instruments and risk managementThe risk management objectives and policies of the group are set out in note 33 to the financial statements.
AuditorThe audit committee reviews the appointment of the external auditor and its relationship with the group, including monitoring the group’s use of the auditor for non-audit services. Note 7 to the financial statements sets out details of the auditor’s remuneration. Deloitte LLP was appointed as external auditor at the 2020 AGM. Having reviewed the independence and effectiveness of the external auditor, the audit committee has recommended to the board that the existing auditor, Deloitte LLP, be reappointed and a resolution appointing them as auditor and authorising the directors to set their remuneration will be proposed at the 2021 AGM.
The directors in office at the date of signing of this report confirm that, so far as they are aware, there is no relevant audit information of which the auditor is unaware and that each director has taken all steps that he or she ought to have taken to make him or herself aware of any relevant audit information and to establish that the auditor is aware of that information.
Going concernDetails of the group’s business activities, results, cash flows and resources, together with the risks it faces and other factors likely to affect its future development, performance and position are set out in the chairman’s statement, chief executive’s review, financial performance and segmental review. In addition, note 1.5 to the financial statements provides further details.
The group companies are regulated by the Prudential Regulation Authority (PRA) and/or the Financial Conduct Authority (FCA) and perform annual capital adequacy assessments, which include the modelling of certain extreme stress scenarios. The company publishes Pillar 3 disclosures annually on its website, which provide detail about its regulatory capital resources and requirements. In July 2015, Rathbone Investment Management issued £20 million of 10-year subordinated loan notes to finance future growth. The group has no other external borrowings.
The directors believe that the company is well placed to manage its business risks successfully despite the continuing uncertain economic and political outlook. As the directors have a reasonable expectation that the company has adequate resources to continue in operational existence for the foreseeable future, they continue to adopt the going concern basis of accounting in preparing the annual financial statements.
Charitable donationsAs at 31 December 2020, the group made total charitable donations of £467,000 representing 1.1% of group pre-tax profits (2019: £360,000, representing 0.9% of group pre-tax profits). It also included the matching of employee donations made through the tax efficient Give As You Earn (GAYE) payroll giving scheme. In 2020, Rathbones employees made payments totalling £201,700 (2019: £195,000) through this scheme, which is administered by the Charities Aid Foundation. The company matched employee donations of up to £200 per month made through GAYE and, in 2020, donated £166,000 (2019: £158,000) to causes chosen by employees through this method.
Political donationsNo political donations were made during the year (2019: nil).
Post-balance sheet eventsDetails of post-balance sheet events are set out in note 39 to the financial statements.
Approved and authorised for issue by the board of directors
Ali JohnsonCompany Secretary
3 March 2021
Registered office: 8 Finsbury Circus, London EC2M 7AZ
rathbones.com 129

The directors are responsible for preparing the report and accounts 2020, and the group and parent company financial statements in accordance with applicable law and regulations.
Company law requires the directors to prepare group and parent company financial statements for each financial year. Under that law they are required to prepare the group financial statements in accordance with International Financial Reporting Standards as adopted by the European Union (IFRS as adopted by the EU) and applicable law and have elected to prepare the parent company financial statements on the same basis.
Under company law, the directors must not approve the financial statements unless they are satisfied that they give a true and fair view of the state of affairs of the group and parent company and of their profit or loss for that period. In preparing each of the group and parent company financial statements, the directors are required to:
— select suitable accounting policies and then apply them consistently — make judgements and estimates that are reasonable, relevant and reliable — state whether they have been prepared in accordance with IFRS as adopted by the EU — assess the group and parent company’s ability to continue as a going concern, disclosing, as applicable, matters related to going concern
— use the going concern basis of accounting unless they either intend to liquidate the group or the parent company or to cease operations, or have no realistic alternative but to do so.
The directors are responsible for keeping adequate accounting records that are sufficient to show and explain the parent company’s transactions and disclose with reasonable accuracy at any time the financial position of the parent company and enable them to ensure that its financial statements comply with the Companies Act 2006.
They are responsible for such internal controls as they determine are necessary to enable the preparation of financial statements that are free from material misstatement, whether due to fraud or error, and have general responsibility for taking such steps as are reasonably open to them to safeguard the assets of the group and to prevent and detect fraud and other irregularities.
Under applicable law and regulations, the directors are also responsible for preparing a strategic report, directors’ report, directors’ remuneration report and corporate governance statement that comply with that law and those regulations.
The directors are responsible for the maintenance and integrity of the corporate and financial information included on the company’s website. Legislation in the UK governing the preparation and dissemination of financial statements may differ from legislation in other jurisdictions.
Responsibility statement of the directors in respect of the report and accountsWe confirm that to the best of our knowledge:
— the financial statements, prepared in accordance with the applicable set of accounting standards, give a true and fair view of the assets, liabilities, financial position and profit or loss of the company and the undertakings included in the consolidation taken as a whole
— the strategic report and directors’ report include a fair review of the development and performance of the business and the position of the issuer and the undertakings included in the consolidation taken as a whole, together with a description of the principal risks and uncertainties that they face.
We consider the report and accounts, taken as a whole, is fair, balanced and understandable and provides the information necessary for shareholders to assess the group’s position and performance, business model and strategy.
By order of the board
Paul StocktonChief Executive
3 March 2021
Statement of directors’ responsibilities in respect of the report and accounts
Directors’ report continued
130 Rathbone Brothers Plc Report and accounts 2020
Governance |

Independent auditor’s report to the members of Rathbone Brothers Plc
132
Consolidated financial statements 142
Notes to the consolidated financial statements
146
Company financial statements 203
Notes to the company financial statements
206
Financial statements
rathbones.com 131

Independent auditor’s report to the members of Rathbone Brothers Plc
132 Rathbone Brothers Plc Report and accounts 2020
Report on the audit of the financial statements 1. Opinion In our opinion: – the financial statements of Rathbone Brothers Plc (the ‘parent company’) and its subsidiaries (the ‘group’) give a true and fair view of
the state of the group’s and of the parent company’s affairs as at 31 December 2020 and of the group’s profit for the year then ended; – the group financial statements have been properly prepared in accordance with international accounting standards in conformity
with the requirements of the Companies Act 2006, and International Financial Reporting Standards (IFRSs) as adopted by the European Union;
– the parent company financial statements have been properly prepared in accordance with international accounting standards in conformity with the requirements of the Companies Act 2006; and
– the financial statements have been prepared in accordance with the requirements of the Companies Act 2006.
We have audited the financial statements which comprise:
– the consolidated statement of comprehensive income; – the consolidated and parent company balance sheets; – the consolidated and parent company statements of changes in equity; – the consolidated and parent company cash flow statements; and – the related notes 1 to 60.
The financial reporting framework that has been applied in the preparation of the group financial statements is applicable law and international accounting standards in conformity with the requirements of the Companies Act 2006 and IFRSs as adopted by the European Union. The financial reporting framework that has been applied in the preparation of the parent company financial statements is applicable law and international accounting standards in conformity with the requirements of the Companies Act 2006.
2. Basis for opinion We conducted our audit in accordance with International Standards on Auditing (UK) (ISAs (UK)) and applicable law. Our responsibilities under those standards are further described in the auditor’s responsibilities for the audit of the financial statements section of our report.
We are independent of the group and the parent company in accordance with the ethical requirements that are relevant to our audit of the financial statements in the UK, including the Financial Reporting Council’s (the ‘FRC’s’) Ethical Standard as applied to listed public interest entities, and we have fulfilled our other ethical responsibilities in accordance with these requirements. The non-audit services provided to the group and parent company for the year are disclosed in note 7 to the financial statements. We confirm that the non-audit services prohibited by the FRC’s Ethical Standard were not provided to the group or the parent company.
We believe that the audit evidence we have obtained is sufficient and appropriate to provide a basis for our opinion.
3. Summary of our audit approach
Key audit matters The key audit matters that we identified in the current year were:– Impairment of client relationship intangibles and goodwill; – Defined benefit scheme liability assumptions; – Investment management fee revenue; – Speirs and Jeffrey (“S&J”) deferred consideration. These matters are consistent with the prior year.
Materiality The materiality that we used for the group financial statements was £3,915,500 which was determined on the basis of 5% of normalised profit before tax.
Scoping The scope of our audit covered substantially the entire group, with both the Investment Management and Funds business segments being subject to a full scope audit.
Significant changes in our approach
There were no significant changes in our audit approach.
132 Rathbone Brothers Plc Report and accounts 2020
| Consolidated financial statements Independent auditor’s report to the members of Rathbone Brothers Plc

Rathbone Brothers Plc Report and accounts 2020 133
4. Conclusions relating to going concern, principal risks and viability statement Going concern In auditing the financial statements, we have concluded that the directors’ use of the going concern basis of accounting in the preparation of the financial statements is appropriate.
Our evaluation of the directors’ assessment of the group’s and parent company’s ability to continue to adopt the going concern basis of accounting included:
– Evaluating management’s judgement paper, identifying the assumptions applied in the going concern assessment and testing the mechanical accuracy of the underlying forecast;
– Performing sensitivity analysis on the key assumptions applied to understand those that could give rise to a material uncertainty on the use of the going concern basis;
– Stress testing for the amount by which the FTSE would need to fall to cause a material uncertainty in the use of the going concern basis and comparing this to historical falls in the FTSE to assess the likelihood of such an event occurring and causing a material uncertainty for the group;
– Performing an analysis of the impact of negative interest rates over a long period of time to the financial forecasts for the group to assess the likelihood of such an event occurring and causing a material uncertainty for the group;
– Assessing the regulatory capital and liquidity position of the group and performing a reverse stress test to determine the point at which a material uncertainty on the use of the going concern basis may arise and assessing the likelihood of such an event occurring; and
– Checking consistency with the forecast assumptions applied in the going concern assessment across other forecasts within the Group. – Based on the work we have performed, we have not identified any material uncertainties relating to events or conditions that,
individually or collectively, may cast significant doubt on the group’s and parent company’s ability to continue as a going concern for a period of at least twelve months from when the financial statements are authorised for issue.
In relation to the reporting on how the group has applied the UK Corporate Governance Code, we have nothing material to add or draw attention to in relation to the directors’ statement in the financial statements about whether the directors considered it appropriate to adopt the going concern basis of accounting.
Our responsibilities and the responsibilities of the directors with respect to going concern are described in the relevant sections of this report.
Independent auditor’s report to the members of Rathbone Brothers Plc
132 Rathbone Brothers Plc Report and accounts 2020
Report on the audit of the financial statements 1. Opinion In our opinion: – the financial statements of Rathbone Brothers Plc (the ‘parent company’) and its subsidiaries (the ‘group’) give a true and fair view of
the state of the group’s and of the parent company’s affairs as at 31 December 2020 and of the group’s profit for the year then ended; – the group financial statements have been properly prepared in accordance with international accounting standards in conformity
with the requirements of the Companies Act 2006, and International Financial Reporting Standards (IFRSs) as adopted by the European Union;
– the parent company financial statements have been properly prepared in accordance with international accounting standards in conformity with the requirements of the Companies Act 2006; and
– the financial statements have been prepared in accordance with the requirements of the Companies Act 2006.
We have audited the financial statements which comprise:
– the consolidated statement of comprehensive income; – the consolidated and parent company balance sheets; – the consolidated and parent company statements of changes in equity; – the consolidated and parent company cash flow statements; and – the related notes 1 to 60.
The financial reporting framework that has been applied in the preparation of the group financial statements is applicable law and international accounting standards in conformity with the requirements of the Companies Act 2006 and IFRSs as adopted by the European Union. The financial reporting framework that has been applied in the preparation of the parent company financial statements is applicable law and international accounting standards in conformity with the requirements of the Companies Act 2006.
2. Basis for opinion We conducted our audit in accordance with International Standards on Auditing (UK) (ISAs (UK)) and applicable law. Our responsibilities under those standards are further described in the auditor’s responsibilities for the audit of the financial statements section of our report.
We are independent of the group and the parent company in accordance with the ethical requirements that are relevant to our audit of the financial statements in the UK, including the Financial Reporting Council’s (the ‘FRC’s’) Ethical Standard as applied to listed public interest entities, and we have fulfilled our other ethical responsibilities in accordance with these requirements. The non-audit services provided to the group and parent company for the year are disclosed in note 7 to the financial statements. We confirm that the non-audit services prohibited by the FRC’s Ethical Standard were not provided to the group or the parent company.
We believe that the audit evidence we have obtained is sufficient and appropriate to provide a basis for our opinion.
3. Summary of our audit approach
Key audit matters The key audit matters that we identified in the current year were:– Impairment of client relationship intangibles and goodwill; – Defined benefit scheme liability assumptions; – Investment management fee revenue; – Speirs and Jeffrey (“S&J”) deferred consideration. These matters are consistent with the prior year.
Materiality The materiality that we used for the group financial statements was £3,915,500 which was determined on the basis of 5% of normalised profit before tax.
Scoping The scope of our audit covered substantially the entire group, with both the Investment Management and Funds business segments being subject to a full scope audit.
Significant changes in our approach
There were no significant changes in our audit approach.
rathbones.com 133

134 Rathbone Brothers Plc Report and accounts 2020
5. Key audit matters Key audit matters are those matters that, in our professional judgement, were of most significance in our audit of the financial statements of the current period and include the most significant assessed risks of material misstatement (whether or not due to fraud) that we identified. These matters included those which had the greatest effect on: the overall audit strategy, the allocation of resources in the audit; and directing the efforts of the engagement team.
These matters were addressed in the context of our audit of the financial statements as a whole, and in forming our opinion thereon, and we do not provide a separate opinion on these matters.
5.1 Impairment of client relationship intangibles and goodwill Key audit matter description The group holds client relationship intangibles of £121.1 million (2019: £124.5 million) and goodwill of £96.9 million (2019: £90.4 million) comprising both relationships acquired through business combinations and through acquisition of individual investment managers and their client portfolios. We have identified this matter as a fraud risk, given the inherent judgement and level of estimation in the annual impairment review.
As detailed in the summary of principal accounting policies in note 1 and note 2, client relationships are reviewed for indicators of impairment at each balance sheet date and, if an indicator of impairment exists, an impairment test is performed. Goodwill is tested for impairment at least annually, whether or not indicators of impairment exist. These judgements have also been considered by the Audit Committee as set out on page 97.
For client relationship intangibles, in determining the appropriate impairment triggers for each portfolio, there is a degree of significant management judgement. This assessment is based on movements in the value of funds under management and the loss of client relationships in advance of the amortisation period.
For goodwill, the impairment assessment is performed by comparing the carrying amount of each cash generating unit (“CGU”) to its recoverable amount from its value-in-use, calculated using a discounted cash flow method. In determining the value-in-use for the CGUs, management is required to make assumptions in relation to an appropriate income growth rate, expenditure growth rate and the discount rate. The discount rate, annual growth rate and terminal growth rate used were 12.2%, 5% and 1% respectively as disclosed in note 22.
How the scope of our audit responded to the key audit matterWe obtained an understanding of relevant controls in relation to the impairment review process for client relationship intangibles for both acquired portfolios and individual relationships and for goodwill. We tested controls in place over Funds Under Management (“FUM”) values which form the basis of the impairment assessment.
For client relationship intangibles, we specifically tested the calculations prepared by management as part of the impairment review exercise to assess whether they meet the requirements of IAS 36 “Impairment of Assets”. Where the review indicated that an impairment trigger had occurred, we assessed the relevant assumptions and judgements made by management in determining whether an impairment needed to be recognised. We have challenged the key assumptions around the impairment triggers identified for each portfolio, which we have assessed for reasonableness and evaluated the accuracy of the inputs used by management.
For goodwill, in order to challenge the appropriateness of the income and expenditure growth assumptions used in the value-in-use calculation, we have back-tested the assumptions used by management against historical performance and checked for consistency with forecasts used elsewhere in the business. We challenged the determination of the discount rate applied by benchmarking to appropriate market rates of interest and recalculation. We have also independently re-performed management’s value-in-use calculation.
Focusing on those assumptions where the impairment test was most sensitive, we also performed sensitivity analysis to assess the risk that reasonably possible changes in assumptions used by management could give rise to an impairment. We challenged with reference to recent trading performance, taking into account the impact of Covid-19 and the group’s strategy.
Furthermore, we have performed a review of the disclosures included within the financial statements to determine whether all required information has been included for client relationship intangibles and goodwill.
Key observations Through our testing for client relationship intangibles and goodwill, we concluded that management’s approach and conclusion was appropriate.
134 Rathbone Brothers Plc Report and accounts 2020
| Consolidated financial statements Independent auditor’s report to the members of Rathbone Brothers Plc continued

Rathbone Brothers Plc Report and accounts 2020 135
5.2 Defined benefit pension scheme liability
Key audit matter description The group has recognised a defined benefit pension scheme liability of £9.8m (2019: £8.0m). The net liability comprises assets of £155.6m (2019: £151.1m) and liabilities of £165.4m (2019: £159.1m).
The calculation of the liability is sensitive to changes in underlying assumptions and is considered to be a key source of estimation uncertainty for the group as detailed in note 2, disclosed in note 29 to the financial statements, and as considered by the Audit Committee on page 97.
The key assumptions are in respect of the discount rate, inflation rate and mortality rate where small changes to these assumptions could result in a material change to the valuation of the pension scheme liability.
How the scope of our audit responded to the key audit matter In order to evaluate the appropriateness of the assumptions used by management, we obtained an understanding of relevant controls over the appropriate determination of assumptions and the calculation of the liability to be recognised in the financial statements.
With the involvement of our in-house actuarial specialists, we made direct enquiries of the group’s actuary to review and challenge each of the key assumptions used in the IAS 19 (“Employee Benefits”) pension valuation. In particular, we compared each assumption used by management against independently determined benchmarks derived using market and other data.
Key observations We concluded that each of the assumptions used by management to estimate the defined benefit pension scheme liability are consistent with the requirements of IAS 19 and that the valuation of the defined pension scheme liability has been appropriately determined.
5.3 Investment management (‘IM’) fee revenue
Key audit matter description As detailed in the summary of principal accounting policies in note 1 and in note 3, revenue comprises net investment management fee income of £274.2m (2019: £260.2m), net commission income of £62.3m (2019: £51.1m), net interest income of £8.4m (2019: £16.4m) and fees from advisory services and other income of £21.1m (2019: £20.3m).
Investment management (“IM”) fees from the IM segment account for approximately 80% of total revenue and are based on a percentage of an individual client’s funds under management (“FUM”). Due to its many long standing client relationships and history of acquisitions, the number of fee schedules managed by the group is high. This means that fee amendments can require a degree of manual intervention.
During the year, the group acquired the Barclays Wealth Court of Protection business (“Barclays Wealth”) and have migrated all clients onto the group’s core technology platform. In October 2020, the group also migrated all Speirs & Jeffrey (“S&J”) clients onto the set rate card.
As a result, we identified a key audit matter relating to the risk that, whether due to error or fraud, incorrect fee rates could be used to calculate investment management fees, or that manual amendments are inaccurate, incomplete or invalid.
How the scope of our audit responded to the key audit matter We tested controls over the calculation of investment management fees. This included controls relating to the set-up of client fee rates, rate card amendments, the valuation of FUM and the system generated investment management fees, including associated IT controls.
We used data analytics to recalculate the system generated amount for the total fee population. We agreed a sample of client fee rates through to client contracts and the value of FUM to third party sources.
We inspected evidence of authority and rationale for a sample of manual fee rate amendments made to system generated fees.
We also performed specific testing on the migration of Barclays Wealth clients onto the group’s core technology platform, and the migration of S&J clients onto the set rate card, to check that their fees were calculated in line with their contractual terms.
Key observations We concluded that the investment management fee revenue is appropriately recognised for the year ended 31 December 2020.
134 Rathbone Brothers Plc Report and accounts 2020
5. Key audit matters Key audit matters are those matters that, in our professional judgement, were of most significance in our audit of the financial statements of the current period and include the most significant assessed risks of material misstatement (whether or not due to fraud) that we identified. These matters included those which had the greatest effect on: the overall audit strategy, the allocation of resources in the audit; and directing the efforts of the engagement team.
These matters were addressed in the context of our audit of the financial statements as a whole, and in forming our opinion thereon, and we do not provide a separate opinion on these matters.
5.1 Impairment of client relationship intangibles and goodwill Key audit matter description The group holds client relationship intangibles of £121.1 million (2019: £124.5 million) and goodwill of £96.9 million (2019: £90.4 million) comprising both relationships acquired through business combinations and through acquisition of individual investment managers and their client portfolios. We have identified this matter as a fraud risk, given the inherent judgement and level of estimation in the annual impairment review.
As detailed in the summary of principal accounting policies in note 1 and note 2, client relationships are reviewed for indicators of impairment at each balance sheet date and, if an indicator of impairment exists, an impairment test is performed. Goodwill is tested for impairment at least annually, whether or not indicators of impairment exist. These judgements have also been considered by the Audit Committee as set out on page 97.
For client relationship intangibles, in determining the appropriate impairment triggers for each portfolio, there is a degree of significant management judgement. This assessment is based on movements in the value of funds under management and the loss of client relationships in advance of the amortisation period.
For goodwill, the impairment assessment is performed by comparing the carrying amount of each cash generating unit (“CGU”) to its recoverable amount from its value-in-use, calculated using a discounted cash flow method. In determining the value-in-use for the CGUs, management is required to make assumptions in relation to an appropriate income growth rate, expenditure growth rate and the discount rate. The discount rate, annual growth rate and terminal growth rate used were 12.2%, 5% and 1% respectively as disclosed in note 22.
How the scope of our audit responded to the key audit matterWe obtained an understanding of relevant controls in relation to the impairment review process for client relationship intangibles for both acquired portfolios and individual relationships and for goodwill. We tested controls in place over Funds Under Management (“FUM”) values which form the basis of the impairment assessment.
For client relationship intangibles, we specifically tested the calculations prepared by management as part of the impairment review exercise to assess whether they meet the requirements of IAS 36 “Impairment of Assets”. Where the review indicated that an impairment trigger had occurred, we assessed the relevant assumptions and judgements made by management in determining whether an impairment needed to be recognised. We have challenged the key assumptions around the impairment triggers identified for each portfolio, which we have assessed for reasonableness and evaluated the accuracy of the inputs used by management.
For goodwill, in order to challenge the appropriateness of the income and expenditure growth assumptions used in the value-in-use calculation, we have back-tested the assumptions used by management against historical performance and checked for consistency with forecasts used elsewhere in the business. We challenged the determination of the discount rate applied by benchmarking to appropriate market rates of interest and recalculation. We have also independently re-performed management’s value-in-use calculation.
Focusing on those assumptions where the impairment test was most sensitive, we also performed sensitivity analysis to assess the risk that reasonably possible changes in assumptions used by management could give rise to an impairment. We challenged with reference to recent trading performance, taking into account the impact of Covid-19 and the group’s strategy.
Furthermore, we have performed a review of the disclosures included within the financial statements to determine whether all required information has been included for client relationship intangibles and goodwill.
Key observations Through our testing for client relationship intangibles and goodwill, we concluded that management’s approach and conclusion was appropriate.
rathbones.com 135

136 Rathbone Brothers Plc Report and accounts 2020
5.4 Speirs & Jeffrey deferred consideration
Key audit matter description On 31 August 2018, the group acquired a 100% equity interest in S&J.
The consideration includes a variable element which is dependent on certain operational and financial targets linked to the value of S&J Funds Under Management (“FUM”) which is determined to be “Qualifying” under the terms of the sale and purchase agreement. The determination of the total deferred consideration is set based on the qualifying FUM as at the first tranche date of 31 December 2020 and the second tranche date of 31 December 2021. If qualifying FUM does not exceed £4.5bn no deferred consideration is payable.
The expected pay-out of the consideration is accrued over the period from acquisition up until pay-out in 2022, with the P&L charge spread over this period.
The first tranche date has now elapsed, with S&J achieving total qualifying FUM of £5.1bn as at 31 December 2020, resulting in total consideration of £35.0m through to the first tranche date, with a total expense charge of £15.8m in 2020. In order to determine the level of qualifying FUM, the group have had to assess a significant volume of individual client accounts to understand if the required operational and financial targets have been met.
For the second tranche date of 31 December 2021, there remains significant management judgement involved in estimating the level of qualifying FUM. The assumptions underpinning this estimate are considered to be a key source of estimation uncertainty for the Group, as detailed in note 2, disclosed in note 8 to the financial statements and considered by the Audit Committee on page 97. For the second date, management have updated their estimate of the expected pay-out of the consideration and have prospectively adjusted the P&L charge.
The disclosure in respect of this critical accounting estimate for deferred consideration payable, as set out in note 2, shows the sensitivity, for each £100m movement in qualifying FUM, to the eventual amount that could be payable.
Therefore, we have identified a key audit matter relating to the risk that, whether due to error or fraud, management’s calculation of the pay-out to 31 December 2020 and estimate of the pay-out to 31 December 2021, may be materially misstated.
How the scope of our audit responded to the key audit matter For the first tranche date of 31 December 2020, we obtained understanding of relevant controls over the underlying data used to determine the final value of qualifying FUM and controls around the calculation of the final consideration due.
For the first tranche date, we also challenged management on whether the increase in estimate should be recognised as a prior period adjustment, considering the number of highly sensitive assumptions to the estimate, which were largely out of the group’s control and were not foreseeable as at the prior year-end.
We selected a sample of client accounts from the S&J FUM listing and agreed through to contract and external client communication. We then assessed if the client account met the operational and financial targets to be deemed qualifying FUM. We have also reviewed minutes of meetings of those charged with governance, to follow through the decision making process and verify the governance process that has taken place.
For the second tranche date of 31 December 2021, we obtained an understanding of controls over the determination of the key assumptions used in the FUM conversion model.
We performed sensitivity analysis to understand which assumptions the estimate is most sensitive to and therefore, have an increased risk of material misstatement. We considered empirical evidence available, including the outcome of the first tranche date qualifying FUM and benchmarked against the investment management market, to challenge on the potential impact of external factors in achieving the group’s estimate of qualifying FUM.
We also held targeted meetings with management and key personnel within the business, including a sample of Investment Managers, to challenge the appropriateness of the qualifying FUM estimate for 31 December 2021.
We independently re-performed the calculation of the deferred consideration estimate through to 31 December 2021 and we assessed the appropriateness of the related disclosures including the sensitivity assumptions for the range of estimates included in the disclosure.
Key observations Given the sensitivity of the underlying assumptions to the estimate calculated as at 31 December 2019, we do not consider the increase in estimate for first tranche date to require a prior period adjustment.
We have concluded satisfactorily that the group’s calculation of the pay-out to 31 December 2020 is not materially misstated. Furthermore, we have concluded that the assumptions used by management to estimate the pay-out as at 31 December 2021 are appropriate.
136 Rathbone Brothers Plc Report and accounts 2020
| Consolidated financial statements Independent auditor’s report to the members of Rathbone Brothers Plc continued

Rathbone Brothers Plc Report and accounts 2020 137
6. Our application of materiality
6.1 Materiality We define materiality as the magnitude of misstatement in the financial statements that makes it probable that the economic decisions of a reasonably knowledgeable person would be changed or influenced. We use materiality both in planning the scope of our audit work and in evaluating the results of our work.
Based on our professional judgement, we determined materiality for the financial statements as a whole as follows:
Group financial statements Parent company financial statements
Materiality £3,915,500 (2019: £3,580,000) £1,918,000 (2019: £1,754,000)
Basis for determining materiality 5% of normalised pre-tax profit.
Pre-tax profit has been normalised to exclude the non-recurring acquisition costs of £34.5m for the year ended 31 December 2020.
1% of net assets, which is capped at 70% of group materiality.
Rationale for the benchmark applied Normalised profit before tax was used as the basis for determining materiality as this is the key metric used by members of the parent company and other relevant stakeholders in assessing financial performance. In determining normalised profit before tax, we have removed from statutory profit before tax, the business acquisition and integration costs on the basis that they are non-recurring and provides a consistent basis for determining materiality year on year.
The parent company primarily holds the investments in group entities and, therefore, net assets is considered to be the key focus for users of the financial statements.
136 Rathbone Brothers Plc Report and accounts 2020
5.4 Speirs & Jeffrey deferred consideration
Key audit matter description On 31 August 2018, the group acquired a 100% equity interest in S&J.
The consideration includes a variable element which is dependent on certain operational and financial targets linked to the value of S&J Funds Under Management (“FUM”) which is determined to be “Qualifying” under the terms of the sale and purchase agreement. The determination of the total deferred consideration is set based on the qualifying FUM as at the first tranche date of 31 December 2020 and the second tranche date of 31 December 2021. If qualifying FUM does not exceed £4.5bn no deferred consideration is payable.
The expected pay-out of the consideration is accrued over the period from acquisition up until pay-out in 2022, with the P&L charge spread over this period.
The first tranche date has now elapsed, with S&J achieving total qualifying FUM of £5.1bn as at 31 December 2020, resulting in total consideration of £35.0m through to the first tranche date, with a total expense charge of £15.8m in 2020. In order to determine the level of qualifying FUM, the group have had to assess a significant volume of individual client accounts to understand if the required operational and financial targets have been met.
For the second tranche date of 31 December 2021, there remains significant management judgement involved in estimating the level of qualifying FUM. The assumptions underpinning this estimate are considered to be a key source of estimation uncertainty for the Group, as detailed in note 2, disclosed in note 8 to the financial statements and considered by the Audit Committee on page 97. For the second date, management have updated their estimate of the expected pay-out of the consideration and have prospectively adjusted the P&L charge.
The disclosure in respect of this critical accounting estimate for deferred consideration payable, as set out in note 2, shows the sensitivity, for each £100m movement in qualifying FUM, to the eventual amount that could be payable.
Therefore, we have identified a key audit matter relating to the risk that, whether due to error or fraud, management’s calculation of the pay-out to 31 December 2020 and estimate of the pay-out to 31 December 2021, may be materially misstated.
How the scope of our audit responded to the key audit matter For the first tranche date of 31 December 2020, we obtained understanding of relevant controls over the underlying data used to determine the final value of qualifying FUM and controls around the calculation of the final consideration due.
For the first tranche date, we also challenged management on whether the increase in estimate should be recognised as a prior period adjustment, considering the number of highly sensitive assumptions to the estimate, which were largely out of the group’s control and were not foreseeable as at the prior year-end.
We selected a sample of client accounts from the S&J FUM listing and agreed through to contract and external client communication. We then assessed if the client account met the operational and financial targets to be deemed qualifying FUM. We have also reviewed minutes of meetings of those charged with governance, to follow through the decision making process and verify the governance process that has taken place.
For the second tranche date of 31 December 2021, we obtained an understanding of controls over the determination of the key assumptions used in the FUM conversion model.
We performed sensitivity analysis to understand which assumptions the estimate is most sensitive to and therefore, have an increased risk of material misstatement. We considered empirical evidence available, including the outcome of the first tranche date qualifying FUM and benchmarked against the investment management market, to challenge on the potential impact of external factors in achieving the group’s estimate of qualifying FUM.
We also held targeted meetings with management and key personnel within the business, including a sample of Investment Managers, to challenge the appropriateness of the qualifying FUM estimate for 31 December 2021.
We independently re-performed the calculation of the deferred consideration estimate through to 31 December 2021 and we assessed the appropriateness of the related disclosures including the sensitivity assumptions for the range of estimates included in the disclosure.
Key observations Given the sensitivity of the underlying assumptions to the estimate calculated as at 31 December 2019, we do not consider the increase in estimate for first tranche date to require a prior period adjustment.
We have concluded satisfactorily that the group’s calculation of the pay-out to 31 December 2020 is not materially misstated. Furthermore, we have concluded that the assumptions used by management to estimate the pay-out as at 31 December 2021 are appropriate.
Normalised PBTGroup materiality
Group materiality£3.9m
Component materiality range£0.2m – £2.0m
Audit Committee reporting threshold£0.2m
Normalised PBT£78.3m
rathbones.com 137

138 Rathbone Brothers Plc Report and accounts 2020
6.2 Performance materiality We set performance materiality at a level lower than materiality to reduce the probability that, in aggregate, uncorrected and undetected misstatements exceed the materiality for the financial statements as a whole.
Group financial statements Parent company financial statements
Performance materiality
70% (2019: 70%) of group materiality 70% (2019: 70%) of parent company materiality
Basis and rationale for determining performance materiality
We set performance materiality at a level lower than materiality to reduce the probability that, in aggregate, uncorrected and undetected misstatements exceed the materiality for the financial statements as a whole. Group performance materiality has been set at £2.7m for the year ended 31 December 2020, 70% of group materiality.
In determining performance materiality, we considered the following factors
– Our risk assessment, including our assessment of the group’s overall control environment and that we consider it appropriate to rely on controls over a number of business processes;
– The performance of the group during 2020, in particular the resilience of the group’s results against the impact of Covid-19 on the UK and global economy;
– Our past experience of the audit, which has indicated a low number of corrected and uncorrected misstatements identified in prior periods.
6.3 Error reporting threshold We agreed with the Audit Committee that we would report to the Committee all audit differences in excess of £195,700 (2019: £180,000), being 5% of group materiality, as well as differences below that threshold that, in our view, warranted reporting on qualitative grounds. We also report to the Audit Committee on disclosure matters that we identified when assessing the overall presentation of the financial statements.
7. An overview of the scope of our audit
7.1 Identification and scoping of components Our group audit was scoped by obtaining an understanding of the group and its environment, including group-wide controls and assessing the risks of material misstatement at the group level.
The group consists of the main trading subsidiary Rathbone Investment Management Limited along with the following entities that we have identified to be significant for the group audit; Rathbone Brothers plc, Rathbone Unit Trust Management Limited and Rathbone Investment Management International Limited. All such entities were subject to a full scope audit.
Our full scope audits and audits of specified balances covered 97% of the group’s revenue, profit before tax and assets. Our audit of Rathbones Investment Management Limited, the main trading subsidiary, used a component materiality of £2.9m.
All audit work was performed by the group engagement team.
7.2 Our consideration of the control environment Based on our understanding of the group’s control environment, we elected to test controls, including the involvement of IT specialists to assess the associated IT controls, in the following areas:
– Investment management fee income; – Investment management commission income; – Other operating income; – Other operating costs; and – Trade debtors and creditors.
The key IT systems relevant to the audit were the financial accounting system, the back office database and core IM business engine and the front office application, with the former being applicable to all components within the group. The latter two are pivotal systems for the provision of the investment management service and directly feed into the investment management fee and commission income recognised. Therefore, they are particularly relevant for Rathbone Investment Management Limited and Rathbone Investment Management International Limited.
Our IT specialists tested the operating effectiveness of the controls on the above systems, as well as supplementary systems and processes within the group. We have taken a controls reliance approach to the back office database and front office application systems and therefore, have taken a controls reliance approach to investment management fee and commission income.
We have not taken a controls reliance approach over the financial accounting system, as its operation involves a high degree of manual intervention.
138 Rathbone Brothers Plc Report and accounts 2020
| Consolidated financial statements Independent auditor’s report to the members of Rathbone Brothers Plc continued

Rathbone Brothers Plc Report and accounts 2020 139
8. Other information
The other information comprises the information included in the annual report, other than the financial statements and our auditor’s report thereon. The directors are responsible for the other information contained within the annual report.
Our opinion on the financial statements does not cover the other information and, except to the extent otherwise explicitly stated in our report, we do not express any form of assurance conclusion thereon.
Our responsibility is to read the other information and, in doing so, consider whether the other information is materially inconsistent with the financial statements or our knowledge obtained in the course of the audit, or otherwise appears to be materially misstated.
If we identify such material inconsistencies or apparent material misstatements, we are required to determine whether this gives rise to a material misstatement in the financial statements themselves. If, based on the work we have performed, we conclude that there is a material misstatement of this other information, we are required to report that fact.
We have nothing to report in this regard.
9. Responsibilities of directors As explained more fully in the directors’ responsibilities statement, the directors are responsible for the preparation of the financial statements and for being satisfied that they give a true and fair view, and for such internal control as the directors determine is necessary to enable the preparation of financial statements that are free from material misstatement, whether due to fraud or error.
In preparing the financial statements, the directors are responsible for assessing the group’s and the parent company’s ability to continue as a going concern, disclosing as applicable, matters related to going concern and using the going concern basis of accounting unless the directors either intend to liquidate the group or the parent company or to cease operations, or have no realistic alternative but to do so.
10. Auditor’s responsibilities for the audit of the financial statements Our objectives are to obtain reasonable assurance about whether the financial statements as a whole are free from material misstatement, whether due to fraud or error, and to issue an auditor’s report that includes our opinion. Reasonable assurance is a high level of assurance, but is not a guarantee that an audit conducted in accordance with ISAs (UK) will always detect a material misstatement when it exists. Misstatements can arise from fraud or error and are considered material if, individually or in the aggregate, they could reasonably be expected to influence the economic decisions of users taken on the basis of these financial statements.
A further description of our responsibilities for the audit of the financial statements is located on the FRC’s website at: www.frc.org.uk/auditorsresponsibilities. This description forms part of our auditor’s report.
11. Extent to which the audit was considered capable of detecting irregularities, including fraud Irregularities, including fraud, are instances of non-compliance with laws and regulations. We design procedures in line with our responsibilities, outlined above, to detect material misstatements in respect of irregularities, including fraud. The extent to which our procedures are capable of detecting irregularities, including fraud is detailed below.
11.1 Identifying and assessing potential risks related to irregularities In identifying and assessing risks of material misstatement in respect of irregularities, including fraud and non-compliance with laws and regulations, we considered the following:
– the nature of the industry and sector, control environment and business performance including the design of the group’s remuneration policies, key drivers for directors’ remuneration, bonus levels and performance targets;
– results of our enquiries of management ,internal audit, and the audit committee about their own identification and assessment of the risks of irregularities;
– any matters we identified having obtained and reviewed the group’s documentation of their policies and procedures relating to: – identifying, evaluating and complying with laws and regulations and whether they were aware of any instances of non-compliance; – detecting and responding to the risks of fraud and whether they have knowledge of any actual, suspected or alleged fraud; – the internal controls established to mitigate risks of fraud or non-compliance with laws and regulations;
– the matters discussed among the audit engagement team and relevant internal specialists, including tax, valuations, pensions, IT and industry specialists regarding how and where fraud might occur in the financial statements and any potential indicators of fraud.
As a result of these procedures, we considered the opportunities and incentives that may exist within the organisation for fraud and identified the greatest potential for fraud in the following areas; impairment of goodwill and client relationship intangibles, the completeness and accuracy of investment management (“IM”) fee revenue and the determination of the estimate for the Speirs & Jeffrey deferred consideration. In common with all audits under ISAs (UK), we are also required to perform specific procedures to respond to the risk of management override of controls.
138 Rathbone Brothers Plc Report and accounts 2020
6.2 Performance materiality We set performance materiality at a level lower than materiality to reduce the probability that, in aggregate, uncorrected and undetected misstatements exceed the materiality for the financial statements as a whole.
Group financial statements Parent company financial statements
Performance materiality
70% (2019: 70%) of group materiality 70% (2019: 70%) of parent company materiality
Basis and rationale for determining performance materiality
We set performance materiality at a level lower than materiality to reduce the probability that, in aggregate, uncorrected and undetected misstatements exceed the materiality for the financial statements as a whole. Group performance materiality has been set at £2.7m for the year ended 31 December 2020, 70% of group materiality.
In determining performance materiality, we considered the following factors
– Our risk assessment, including our assessment of the group’s overall control environment and that we consider it appropriate to rely on controls over a number of business processes;
– The performance of the group during 2020, in particular the resilience of the group’s results against the impact of Covid-19 on the UK and global economy;
– Our past experience of the audit, which has indicated a low number of corrected and uncorrected misstatements identified in prior periods.
6.3 Error reporting threshold We agreed with the Audit Committee that we would report to the Committee all audit differences in excess of £195,700 (2019: £180,000), being 5% of group materiality, as well as differences below that threshold that, in our view, warranted reporting on qualitative grounds. We also report to the Audit Committee on disclosure matters that we identified when assessing the overall presentation of the financial statements.
7. An overview of the scope of our audit
7.1 Identification and scoping of components Our group audit was scoped by obtaining an understanding of the group and its environment, including group-wide controls and assessing the risks of material misstatement at the group level.
The group consists of the main trading subsidiary Rathbone Investment Management Limited along with the following entities that we have identified to be significant for the group audit; Rathbone Brothers plc, Rathbone Unit Trust Management Limited and Rathbone Investment Management International Limited. All such entities were subject to a full scope audit.
Our full scope audits and audits of specified balances covered 97% of the group’s revenue, profit before tax and assets. Our audit of Rathbones Investment Management Limited, the main trading subsidiary, used a component materiality of £2.9m.
All audit work was performed by the group engagement team.
7.2 Our consideration of the control environment Based on our understanding of the group’s control environment, we elected to test controls, including the involvement of IT specialists to assess the associated IT controls, in the following areas:
– Investment management fee income; – Investment management commission income; – Other operating income; – Other operating costs; and – Trade debtors and creditors.
The key IT systems relevant to the audit were the financial accounting system, the back office database and core IM business engine and the front office application, with the former being applicable to all components within the group. The latter two are pivotal systems for the provision of the investment management service and directly feed into the investment management fee and commission income recognised. Therefore, they are particularly relevant for Rathbone Investment Management Limited and Rathbone Investment Management International Limited.
Our IT specialists tested the operating effectiveness of the controls on the above systems, as well as supplementary systems and processes within the group. We have taken a controls reliance approach to the back office database and front office application systems and therefore, have taken a controls reliance approach to investment management fee and commission income.
We have not taken a controls reliance approach over the financial accounting system, as its operation involves a high degree of manual intervention.
rathbones.com 139

140 Rathbone Brothers Plc Report and accounts 2020
We also obtained an understanding of the legal and regulatory frameworks that the group operates in, focusing on provisions of those laws and regulations that:
– had a direct effect on the determination of material amounts and disclosures in the financial statements. The key laws and regulations we considered in this context included the Prudential Regulatory Authority’s and Financial Conduct Authority’s regulations; the UK Companies Act; the Listing Rules; pensions legislation; and tax legislation; and
– do not have a direct effect on the financial statements but compliance with which may be fundamental to the group’s ability to operate or to avoid a material penalty. These included the group’s regulatory solvency requirements.
11.2 Audit response to risks identified As a result of performing the above, we identified impairment of goodwill and client relationship intangibles, the completeness and accuracy of investment management (“IM”) fee revenue recognition and the estimate of the Speirs & Jeffrey deferred consideration as a key audit matter related to the potential risk of fraud. The key audit matters section of our report explains the matter in more detail and also describes the specific procedures we performed in response to each key audit matter.
In addition to the above, our procedures to respond to risks identified included the following:
– reviewing the financial statement disclosures and testing to supporting documentation to assess compliance with provisions of relevant laws and regulations described as having a direct effect on the financial statements;
– enquiring of management, the audit committee and in-house and external legal counsel concerning actual and potential litigation and claims;
– performing analytical procedures to identify any unusual or unexpected relationships that may indicate risks of material misstatement due to fraud;
– reading minutes of meetings of those charged with governance, reviewing internal audit reports and reviewing correspondence with HMRC, the Prudential Regulatory Authority and the Financial Conduct Authority; and
– in addressing the risk of fraud through management override of controls, testing the appropriateness of journal entries and other adjustments; assessing whether the judgements made in making accounting estimates are indicative of a potential bias; and evaluating the business rationale of any significant transactions that are unusual or outside the normal course of business.
We also communicated relevant identified laws and regulations and potential fraud risks to all engagement team members including internal specialists and remained alert to any indications of fraud or non-compliance with laws and regulations throughout the audit.
Report on other legal and regulatory requirements
12. Opinions on other matters prescribed by the Companies Act 2006 In our opinion the part of the directors’ remuneration report to be audited has been properly prepared in accordance with the Companies Act 2006.
In our opinion, based on the work undertaken in the course of the audit:
– the information given in the strategic report and the directors’ report for the financial year for which the financial statements are prepared is consistent with the financial statements; and
– the strategic report and the directors’ report have been prepared in accordance with applicable legal requirements.
In the light of the knowledge and understanding of the group and the parent company and their environment obtained in the course of the audit, we have not identified any material misstatements in the strategic report or the directors’ report.
13. Corporate Governance Statement The Listing Rules require us to review the directors’ statement in relation to going concern, longer-term viability and that part of the Corporate Governance Statement relating to the group’s compliance with the provisions of the UK Corporate Governance Code specified for our review.
Based on the work undertaken as part of our audit, we have concluded that each of the following elements of the Corporate Governance Statement is materially consistent with the financial statements and our knowledge obtained during the audit:
– the directors’ statement with regards to the appropriateness of adopting the going concern basis of accounting and any material uncertainties identified set out on page 129;
– the directors’ explanation as to its assessment of the group’s prospects, the period this assessment covers and why the period is appropriate set out on page 51;
– the directors’ statement on fair, balanced and understandable set out on page 130; – the board’s confirmation that it has carried out a robust assessment of the emerging and principal risks set out on page 49; – the section of the annual report that describes the review of effectiveness of risk management and internal control systems set out on
page 46; and – the section describing the work of the audit committee set out on pages 95 to 99.
140 Rathbone Brothers Plc Report and accounts 2020
| Consolidated financial statements Independent auditor’s report to the members of Rathbone Brothers Plc continued

Rathbone Brothers Plc Report and accounts 2020 141
14. Opinion on other matter prescribed by the Capital Requirements (Country-by-Country Reporting) Regulations 2013 In our opinion the information given in note 40 to the financial statements for the financial year ended 31 December 2020 has been properly prepared, in all material respects, in accordance with the Capital Requirements (Country-by Country Reporting) Regulations 2013.
15. Matters on which we are required to report by exception
15.1 Adequacy of explanations received and accounting recordsUnder the Companies Act 2006 we are required to report to you if, in our opinion:
– we have not received all the information and explanations we require for our audit; or – adequate accounting records have not been kept by the parent company, or returns adequate for our
audit have not been received from branches not visited by us; or – the parent company financial statements are not in agreement with the accounting records and returns.
We have nothing to report in respect of these matters.
15.2 Directors’ remuneration Under the Companies Act 2006 we are also required to report if in our opinion certain disclosures of directors’ remuneration have not been made or the part of the directors’ remuneration report to be audited is not in agreement with the accounting records and returns.
We have nothing to report in respect of these matters.
16. Other matters which we are required to address
16.1 Auditor tenure Following the recommendation of the audit committee, we were appointed by Shareholders on 9 May 2019 to audit the financial statements for the year ended 31 December 2019 and subsequent financial periods. The period of total uninterrupted engagement including previous renewals and reappointments of the firm is 2 years, covering the years ended 31 December 2019 and 31 December 2020.
16.2 Consistency of the audit report with the additional report to the audit committee Our audit opinion is consistent with the additional report to the audit committee we are required to provide in accordance with ISAs (UK).
17. Use of our report This report is made solely to the company’s members, as a body, in accordance with Chapter 3 of Part 16 of the Companies Act 2006. Our audit work has been undertaken so that we might state to the company’s members those matters we are required to state to them in an auditor’s report and for no other purpose. To the fullest extent permitted by law, we do not accept or assume responsibility to anyone other than the company and the company’s members as a body, for our audit work, for this report, or for the opinions we have formed.
Manbhinder Rana FCA (Senior Statutory Auditor) For and on behalf of Deloitte LLP
Statutory Auditor
London, United Kingdom
3 March 2021
140 Rathbone Brothers Plc Report and accounts 2020
We also obtained an understanding of the legal and regulatory frameworks that the group operates in, focusing on provisions of those laws and regulations that:
– had a direct effect on the determination of material amounts and disclosures in the financial statements. The key laws and regulations we considered in this context included the Prudential Regulatory Authority’s and Financial Conduct Authority’s regulations; the UK Companies Act; the Listing Rules; pensions legislation; and tax legislation; and
– do not have a direct effect on the financial statements but compliance with which may be fundamental to the group’s ability to operate or to avoid a material penalty. These included the group’s regulatory solvency requirements.
11.2 Audit response to risks identified As a result of performing the above, we identified impairment of goodwill and client relationship intangibles, the completeness and accuracy of investment management (“IM”) fee revenue recognition and the estimate of the Speirs & Jeffrey deferred consideration as a key audit matter related to the potential risk of fraud. The key audit matters section of our report explains the matter in more detail and also describes the specific procedures we performed in response to each key audit matter.
In addition to the above, our procedures to respond to risks identified included the following:
– reviewing the financial statement disclosures and testing to supporting documentation to assess compliance with provisions of relevant laws and regulations described as having a direct effect on the financial statements;
– enquiring of management, the audit committee and in-house and external legal counsel concerning actual and potential litigation and claims;
– performing analytical procedures to identify any unusual or unexpected relationships that may indicate risks of material misstatement due to fraud;
– reading minutes of meetings of those charged with governance, reviewing internal audit reports and reviewing correspondence with HMRC, the Prudential Regulatory Authority and the Financial Conduct Authority; and
– in addressing the risk of fraud through management override of controls, testing the appropriateness of journal entries and other adjustments; assessing whether the judgements made in making accounting estimates are indicative of a potential bias; and evaluating the business rationale of any significant transactions that are unusual or outside the normal course of business.
We also communicated relevant identified laws and regulations and potential fraud risks to all engagement team members including internal specialists and remained alert to any indications of fraud or non-compliance with laws and regulations throughout the audit.
Report on other legal and regulatory requirements
12. Opinions on other matters prescribed by the Companies Act 2006 In our opinion the part of the directors’ remuneration report to be audited has been properly prepared in accordance with the Companies Act 2006.
In our opinion, based on the work undertaken in the course of the audit:
– the information given in the strategic report and the directors’ report for the financial year for which the financial statements are prepared is consistent with the financial statements; and
– the strategic report and the directors’ report have been prepared in accordance with applicable legal requirements.
In the light of the knowledge and understanding of the group and the parent company and their environment obtained in the course of the audit, we have not identified any material misstatements in the strategic report or the directors’ report.
13. Corporate Governance Statement The Listing Rules require us to review the directors’ statement in relation to going concern, longer-term viability and that part of the Corporate Governance Statement relating to the group’s compliance with the provisions of the UK Corporate Governance Code specified for our review.
Based on the work undertaken as part of our audit, we have concluded that each of the following elements of the Corporate Governance Statement is materially consistent with the financial statements and our knowledge obtained during the audit:
– the directors’ statement with regards to the appropriateness of adopting the going concern basis of accounting and any material uncertainties identified set out on page 129;
– the directors’ explanation as to its assessment of the group’s prospects, the period this assessment covers and why the period is appropriate set out on page 51;
– the directors’ statement on fair, balanced and understandable set out on page 130; – the board’s confirmation that it has carried out a robust assessment of the emerging and principal risks set out on page 49; – the section of the annual report that describes the review of effectiveness of risk management and internal control systems set out on
page 46; and – the section describing the work of the audit committee set out on pages 95 to 99.
rathbones.com 141

Consolidated statement of comprehensive income for the year ended 31 December 2020
142 Rathbone Brothers Plc Report and accounts 2020
Note
2020£’000
2019£’000
Interest and similar income 14,976 28,553 Interest expense and similar charges (6,554) (12,141)Net interest income 4 8,422 16,412 Fee and commission income 378,240 352,519 Fee and commission expense (24,491) (23,547)Net fee and commission income 5 353,749 328,972 Net trading income 6 (12) 170 Other operating income 6 3,929 2,517 Operating income 366,088 348,071 Charges in relation to client relationships and goodwill 7 (14,302) (15,964)Acquisition-related costs 9 (34,449) (33,057)Other operating expenses (273,558) (259,398)Operating expenses 7 (322,309) (308,419)Profit before tax 43,779 39,652 Taxation 11 (17,127) (12,729)Profit after tax 26,652 26,923 Profit for the year attributable to equity holders of the company 26,652 26,923 Other comprehensive income: Items that will not be reclassified to profit or loss Net remeasurement of defined benefit liability 29 (4,682) 310 Deferred tax relating to net remeasurement of defined benefit liability 21 1,668 (53)
Other comprehensive income net of tax (3,014) 257Total comprehensive income for the year net of tax attributable to equity holders of
the company 23,638 27,180 Dividends paid and proposed for the year per ordinary share 12 72.0p 70.0pDividends paid and proposed for the year 38,728 37,714 Earnings per share for the year attributable to equity holders of the company: 13 – basic 49.6p 50.3p – diluted 47.6p 48.7p
The accompanying notes form an integral part of the consolidated financial statements.
142 Rathbone Brothers Plc Report and accounts 2020
Consolidated financial statements

Consolidated statement of comprehensive income for the year ended 31 December 2020
142 Rathbone Brothers Plc Report and accounts 2020
Note
2020£’000
2019£’000
Interest and similar income 14,976 28,553 Interest expense and similar charges (6,554) (12,141)Net interest income 4 8,422 16,412 Fee and commission income 378,240 352,519 Fee and commission expense (24,491) (23,547)Net fee and commission income 5 353,749 328,972 Net trading income 6 (12) 170 Other operating income 6 3,929 2,517 Operating income 366,088 348,071 Charges in relation to client relationships and goodwill 7 (14,302) (15,964)Acquisition-related costs 9 (34,449) (33,057)Other operating expenses (273,558) (259,398)Operating expenses 7 (322,309) (308,419)Profit before tax 43,779 39,652 Taxation 11 (17,127) (12,729)Profit after tax 26,652 26,923 Profit for the year attributable to equity holders of the company 26,652 26,923 Other comprehensive income: Items that will not be reclassified to profit or loss Net remeasurement of defined benefit liability 29 (4,682) 310 Deferred tax relating to net remeasurement of defined benefit liability 21 1,668 (53)
Other comprehensive income net of tax (3,014) 257Total comprehensive income for the year net of tax attributable to equity holders of
the company 23,638 27,180 Dividends paid and proposed for the year per ordinary share 12 72.0p 70.0pDividends paid and proposed for the year 38,728 37,714 Earnings per share for the year attributable to equity holders of the company: 13 – basic 49.6p 50.3p – diluted 47.6p 48.7p
The accompanying notes form an integral part of the consolidated financial statements.
Consolidated statement of changes in equity for the year ended 31 December 2020
rathbones.com 143
Note
Sharecapital£’000
Sharepremium
£’000
Merger reserve
£’000
Own shares £’000
Retainedearnings
£’000
Totalequity£’000
At 1 January 2019 (restated) 2,760 205,273 56,785 (32,737) 232,059 464,140 Profit for the year 26,923 26,923 Net remeasurement of defined benefit liability 29 310 310
Deferred tax relating to components of other
comprehensive income 21 (53) (53) Other comprehensive income net of tax – – – – 257 257 Dividends paid 12 (35,959) (35,959) Issue of share capital 30 58 5,666 14,971 20,695 Share-based payments: – value of employee services 19,387 19,387 – cost of own shares acquired 31 (10,033) (10,033) – cost of own shares vesting 31 799 (799) – – tax on share-based payments (17) (17) At 31 December 2019 2,818 210,939 71,756 (41,971) 241,851 485,393 Profit for the year 26,652 26,652 Net remeasurement of defined benefit liability 29 (4,682) (4,682)
Deferred tax relating to components of other
comprehensive income 21 1,668 1,668 Other comprehensive income net of tax – – – – (3,014) (3,014) Dividends paid 12 (37,831) (37,831) Issue of share capital 30 56 4,153 – 4,209 Share-based payments: – value of employee services 43,635 43,635 – cost of own shares acquired 31 (5,077) (5,077) – cost of own shares vesting 31 304 (304) – – tax on share-based payments (140) (140) At 31 December 2020 2,874 215,092 71,756 (46,744) 270,849 513,827
The accompanying notes form an integral part of the consolidated financial statements.
rathbones.com 143

Consolidated balance sheet as at 31 December 2020
144 Rathbone Brothers Plc Report and accounts 2020
Note 2020
£’000 2019
£’000
Assets Cash and balances with central banks 14 1,802,706 1,932,997 Settlement balances 90,373 52,520 Loans and advances to banks 15 159,430 177,832 Loans and advances to customers 16 166,221 138,412 Investment securities: – fair value through profit or loss 17 107,559 105,967 – amortised cost 17 651,427 600,261 Prepayments, accrued income and other assets 18 98,714 95,390 Property, plant and equipment 19 14,846 15,432 Right-of-use assets 20 44,856 49,480 Net deferred tax asset 21 3,342 2,636 Intangible assets 22 231,144 227,807 Total assets 3,370,618 3,398,734 Liabilities Deposits by banks 23 893 28 Settlement balances 95,412 57,694 Due to customers 24 2,561,767 2,668,645 Accruals, provisions and other liabilities 25 112,071 93,263 Lease liabilities 27 56,124 61,004Current tax liabilities 971 4,766 Subordinated loan notes 28 19,768 19,927 Retirement benefit obligations 29 9,785 8,014 Total liabilities 2,856,791 2,913,341 Equity Share capital 30 2,874 2,818 Share premium 30 215,092 210,939 Merger reserve 30 71,756 71,756 Own shares 31 (46,744) (41,971)Retained earnings 270,849 241,851 Total equity 513,827 485,393 Total liabilities and equity 3,370,618 3,398,734
The financial statements were approved by the board of directors and authorised for issue on 3 March 2021 and were signed on their behalf by:
Paul Stockton Chief Executive
Jennifer MathiasFinance Director
Company registered number: 01000403
The accompanying notes form an integral part of the consolidated financial statements.
144 Rathbone Brothers Plc Report and accounts 2020
Consolidated financial statements

Consolidated balance sheet as at 31 December 2020
144 Rathbone Brothers Plc Report and accounts 2020
Note 2020
£’000 2019
£’000
Assets Cash and balances with central banks 14 1,802,706 1,932,997 Settlement balances 90,373 52,520 Loans and advances to banks 15 159,430 177,832 Loans and advances to customers 16 166,221 138,412 Investment securities: – fair value through profit or loss 17 107,559 105,967 – amortised cost 17 651,427 600,261 Prepayments, accrued income and other assets 18 98,714 95,390 Property, plant and equipment 19 14,846 15,432 Right-of-use assets 20 44,856 49,480 Net deferred tax asset 21 3,342 2,636 Intangible assets 22 231,144 227,807 Total assets 3,370,618 3,398,734 Liabilities Deposits by banks 23 893 28 Settlement balances 95,412 57,694 Due to customers 24 2,561,767 2,668,645 Accruals, provisions and other liabilities 25 112,071 93,263 Lease liabilities 27 56,124 61,004Current tax liabilities 971 4,766 Subordinated loan notes 28 19,768 19,927 Retirement benefit obligations 29 9,785 8,014 Total liabilities 2,856,791 2,913,341 Equity Share capital 30 2,874 2,818 Share premium 30 215,092 210,939 Merger reserve 30 71,756 71,756 Own shares 31 (46,744) (41,971)Retained earnings 270,849 241,851 Total equity 513,827 485,393 Total liabilities and equity 3,370,618 3,398,734
The financial statements were approved by the board of directors and authorised for issue on 3 March 2021 and were signed on their behalf by:
Paul Stockton Chief Executive
Jennifer MathiasFinance Director
Company registered number: 01000403
The accompanying notes form an integral part of the consolidated financial statements.
Consolidated statement of cash flows for the year ended 31 December 2020
rathbones.com 145
Note 2020
£’000 2019
£’000
Cash flows from operating activities Profit before tax 43,779 39,652 Change in fair value through profit or loss (1,881) (410)Net interest income (8,422) (16,412)Impairment losses on financial instruments 33 582 103 Net charge for provisions 26 143 3,572 Loss/(profit) on disposal of property, plant and equipment – 428 Depreciation, amortisation and impairment 31,229 33,799 Foreign exchange movements 17 1,245 2,152 Defined benefit pension scheme charges 29 200 255 Defined benefit pension contributions paid 29 (3,111) (3,128)Share-based payment charges 39,986 31,012 Interest paid (5,300) (11,421)Interest received 12,376 28,264
110,826 107,866 Changes in operating assets and liabilities: – net decrease/(increase) in loans and advances to banks and customers 29,852 (31,076)– net increase in settlement balance debtors (37,852) (12,765)– net increase in prepayments, accrued income and other assets (722) (13,725)– net (decrease)/increase in amounts due to customers and deposits by banks (106,013) 442,646 – net increase in settlement balance creditors 37,718 21,002 – net increase in accruals, deferred income, provisions and other liabilities 19,616 2,802 Cash generated from operations 53,425 516,750 Tax paid (21,410) (17,133)Net cash inflow from operating activities 32,015 499,617 Cash flows from investing activities Acquisition of subsidiaries, net of cash acquired (12,048) –Purchase of property, plant, equipment and intangible assets (13,294) (17,705)Purchase/(disposal) of right-of-use assets (238) –Proceeds from sale of property, plant and equipment – (239)Purchase of investment securities 17 (886,847) (754,958)Proceeds from sale and redemption of investment securities 17 833,712 1,058,874 Net cash (used in)/generated from investing activities (78,715) 285,972 Cash flows from financing activities Net (repurchase)/issue of ordinary shares 38 (868) (4,340)Dividends paid 12 (37,831) (35,959)Payment of lease liabilities (4,880) (4,623)Interest paid (1,060) (1,171)Net cash used in financing activities (44,639) (46,093)Net (decrease)/increase in cash and cash equivalents (91,339) 739,496 Cash and cash equivalents at the beginning of the year 2,148,033 1,408,537 Cash and cash equivalents at the end of the year 38 2,056,694 2,148,033
The accompanying notes form an integral part of the consolidated financial statements.
rathbones.com 145

Notes to the consolidated financial statements
rathbones.com 146
1 Principal accounting policies Rathbone Brothers Plc (‘the company’) is a public company limited by shares incorporated and domiciled in England and Wales under the Companies Act 2006.
1.1 Basis of preparation The consolidated and company financial statements have been prepared in accordance with International Financial Reporting Standards (IFRS) as adopted by the EU. The company financial statements are presented on pages 203 to 222.
The financial statements have been prepared on the historical cost basis, except for certain financial instruments that are measured at fair value (notes 1.12 and 1.16). The principal accounting policies adopted are set out in this note and, unless otherwise stated, have been applied consistently to all periods presented in the consolidated financial statements.
1.2 Basis of consolidation The consolidated financial statements incorporate the financial statements of the company and entities controlled by the company (its subsidiaries), together ‘the group’, made up to 31 December each year.
The group controls an entity when it is exposed to, or has rights to, variable returns from its involvement with the entity and has the ability to affect those returns through its power over the entity. Subsidiaries are fully consolidated from the date on which control is obtained, and no longer consolidated from the date that control ceases; their results are included in the consolidated financial statements up to the date that control ceases. Inter-company transactions and balances between group companies are eliminated on consolidation.
1.3 Developments in reporting standards and interpretations Standards and interpretations affecting the reported results or the financial position The following amendments to standards have been adopted in the current period, but have not had a significant impact on the amounts reported in these financial statements:
– Amendments to References to Conceptual Framework in IFRS Standards – Definition of a Business (Amendments to IFRS 3) – Definition of Material (Amendments to IAS 1 and IAS 8)
– Interest Rate Benchmark Reform (Amendments to IFRS 9, IAS 39 and IFRS 7) – Extension of the Temporary Exemption from Applying IFRS 9 (Amendments to IFRS 4).
Future new standards and interpretations The following standard is effective for annual periods beginning after 1 January 2020 and earlier application is permitted; however, the group has not early-adopted the amended standard in preparing these consolidated financial statements.
– COVID-19-Related Rent Concessions (Amendment to IFRS 16).
The below standards are not yet effective and have not yet been endorsed by the EU:
– IFRS 17 Insurance Contracts – Classification of liabilities as current or non-current (Amendments to IAS 1) – Sale or Contribution of Assets between an Investor and its Associate or Joint Venture (Amendments to IFRS 10 and IAS 28).
None of these standards are expected to have a material impact on the group’s financial statements.
1.4 Business combinations Business combinations are accounted for using the acquisition method. The consideration for each acquisition is measured at the aggregate of the fair values (at the date of exchange) of assets acquired, liabilities assumed and equity instruments issued by the group in exchange for control of the acquiree. Acquisition-related costs are recognised in profit or loss as incurred.
Where applicable, the consideration for the acquisition includes any asset or liability resulting from a contingent consideration arrangement, measured at its acquisition date fair value. Subsequent changes in such fair values may arise as a result of additional information obtained after this date about facts and circumstances that existed at the acquisition date. Provided they arise within 12 months of the acquisition date, these changes are measurement period adjustments and are reflected against the cost of acquisition. Changes in the fair value of contingent consideration resulting from events occurring after the acquisition date are charged to profit or loss or other comprehensive income, except for obligations that are classified as equity, which are not remeasured. Such changes are irrespective of the 12-month period from acquisition.
Notes to the consolidated financial statements
146 Rathbone Brothers Plc Report and accounts 2020
| Consolidated financial statements

Notes to the consolidated financial statements
rathbones.com 146
1 Principal accounting policies Rathbone Brothers Plc (‘the company’) is a public company limited by shares incorporated and domiciled in England and Wales under the Companies Act 2006.
1.1 Basis of preparation The consolidated and company financial statements have been prepared in accordance with International Financial Reporting Standards (IFRS) as adopted by the EU. The company financial statements are presented on pages 203 to 222.
The financial statements have been prepared on the historical cost basis, except for certain financial instruments that are measured at fair value (notes 1.12 and 1.16). The principal accounting policies adopted are set out in this note and, unless otherwise stated, have been applied consistently to all periods presented in the consolidated financial statements.
1.2 Basis of consolidation The consolidated financial statements incorporate the financial statements of the company and entities controlled by the company (its subsidiaries), together ‘the group’, made up to 31 December each year.
The group controls an entity when it is exposed to, or has rights to, variable returns from its involvement with the entity and has the ability to affect those returns through its power over the entity. Subsidiaries are fully consolidated from the date on which control is obtained, and no longer consolidated from the date that control ceases; their results are included in the consolidated financial statements up to the date that control ceases. Inter-company transactions and balances between group companies are eliminated on consolidation.
1.3 Developments in reporting standards and interpretations Standards and interpretations affecting the reported results or the financial position The following amendments to standards have been adopted in the current period, but have not had a significant impact on the amounts reported in these financial statements:
– Amendments to References to Conceptual Framework in IFRS Standards – Definition of a Business (Amendments to IFRS 3) – Definition of Material (Amendments to IAS 1 and IAS 8)
– Interest Rate Benchmark Reform (Amendments to IFRS 9, IAS 39 and IFRS 7) – Extension of the Temporary Exemption from Applying IFRS 9 (Amendments to IFRS 4).
Future new standards and interpretations The following standard is effective for annual periods beginning after 1 January 2020 and earlier application is permitted; however, the group has not early-adopted the amended standard in preparing these consolidated financial statements.
– COVID-19-Related Rent Concessions (Amendment to IFRS 16).
The below standards are not yet effective and have not yet been endorsed by the EU:
– IFRS 17 Insurance Contracts – Classification of liabilities as current or non-current (Amendments to IAS 1) – Sale or Contribution of Assets between an Investor and its Associate or Joint Venture (Amendments to IFRS 10 and IAS 28).
None of these standards are expected to have a material impact on the group’s financial statements.
1.4 Business combinations Business combinations are accounted for using the acquisition method. The consideration for each acquisition is measured at the aggregate of the fair values (at the date of exchange) of assets acquired, liabilities assumed and equity instruments issued by the group in exchange for control of the acquiree. Acquisition-related costs are recognised in profit or loss as incurred.
Where applicable, the consideration for the acquisition includes any asset or liability resulting from a contingent consideration arrangement, measured at its acquisition date fair value. Subsequent changes in such fair values may arise as a result of additional information obtained after this date about facts and circumstances that existed at the acquisition date. Provided they arise within 12 months of the acquisition date, these changes are measurement period adjustments and are reflected against the cost of acquisition. Changes in the fair value of contingent consideration resulting from events occurring after the acquisition date are charged to profit or loss or other comprehensive income, except for obligations that are classified as equity, which are not remeasured. Such changes are irrespective of the 12-month period from acquisition.
rathbones.com 147
1.5 Going concern The directors have, at the time of approving the financial statements, a reasonable expectation that the company and the group have adequate resources to continue in operational existence. In forming this view, the directors have considered the company’s and the group’s prospects for a period of at least 12 months, taking into consideration the potential impacts of the COVID-19 pandemic on market volatility, net organic growth and additional costs of maintaining operational resilience. As a result, the directors continue to adopt the going concern basis of accounting in preparing the financial statements.
1.6 Foreign currencies The functional and presentational currency of the company and its subsidiaries is sterling.
Transactions in currencies other than the relevant group entity’s functional currency are recorded at the rates of exchange prevailing on the dates of the transactions. At each balance sheet date, monetary assets and liabilities that are denominated in foreign currencies are retranslated at the rates prevailing on the balance sheet date. Gains and losses arising on retranslation are included in profit or loss for the year.
1.7 Income Net interest income Interest income or expense is recognised within net interest income using the effective interest method.
The effective interest method is the method of calculating the amortised cost of a financial asset or liability (or group of assets and liabilities) and of allocating the interest income or interest expense over the relevant period. The effective interest rate is the rate that exactly discounts the expected future cash payments or receipts through the expected life of the financial instrument, or when appropriate, a shorter period, to:
– the gross carrying amount of the financial asset; or – the amortised cost of the financial liability.
The application of the method has the effect of recognising income (or expense) receivable (or payable) on the instrument evenly in proportion to the amount outstanding over the period to maturity or repayment. In calculating effective interest, the group estimates cash flows considering all contractual terms of the financial instrument but excluding the impact of future credit losses.
Dividends received from money market funds are included in net interest income when received.
Net fee and commission income Portfolio or investment management fees, commissions receivable or payable and fees from advisory services are recognised on a continuous basis over the period that the related service is provided.
Commission charges for executing transactions on behalf of clients are recognised when the transaction is dealt.
Initial charges receivable from the sale of unit holdings in the group’s collective investment schemes and related rebates are recognised at the point of sale.
The group has made an assessment as to whether the work performed to earn such fees constitutes the transfer of services and, therefore, fulfils any performance obligation(s). If so, then these fees can be recognised when the relevant performance obligation has been satisfied; if not, then the fees can only be recognised in the period in which the services are provided.
A breakdown of the timing of revenue recognition can be found in note 3.
Net trading income Net trading income comprises net dealing profits on the sale and redemption of units in the Funds business and is recognised when received.
Dividend income Dividend income from final dividends on equity securities is accounted for on the date the security becomes ex-dividend. Interim dividends are recognised when received.
rathbones.com 147

148 Rathbone Brothers Plc Report and accounts 2020
1 Principal accounting policies continued
1.8 Leases The group applied IFRS 16 with effect from 1 January 2019, using the modified retrospective approach.
The group has applied the practical expedient to grandfather the definition of a lease at the date of transition. Therefore, this policy applies to all contracts entered into on or after 1 January 2019.
At inception of a contract, the group assesses whether a contract is, or contains, a lease. A contract is, or contains, a lease if the contract conveys the right to control the use of an identified asset for a period of time in exchange for consideration. To assess whether a contract conveys the right to control the use of an identified asset, the group uses the definition of a lease in IFRS 16.
The group recognises a right-of-use asset and a lease liability at the inception date of the lease. The right-of-use asset is initially measured at cost, which comprises the initial amount of the lease liability adjusted for any lease payments made at or before the commencement date, plus any initial direct costs incurred and an estimate of costs to dismantle and remove the underlying asset or to restore the underlying asset or the site on which it is located, less any lease incentives received.
The right-of-use assets are subsequently depreciated on a straight-line basis over the shorter of the expected life of the asset and the lease term, adjusted for any remeasurements of the lease liability. At the end of each reporting period, the right-of-use assets are assessed for indicators of impairment in accordance with IAS 36.
The lease liability is initially measured at the present value of the lease payments that are not paid at the commencement date, discounted using the interest rate implicit in the lease or, if that rate cannot be readily determined, the group’s incremental borrowing rate. The group uses its incremental borrowing rate as the discount rate.
Lease payments included in the measurement of the lease liability comprise the following:
– fixed payments, including in-substance fixed payments – variable lease payments that depend on an index or a rate, initially measured using the index or rate as at the commencement date
– amounts expected to be payable under a residual value guarantee – the exercise price under a purchase option that the group is reasonably certain to exercise, lease payments in an optional renewal period
if the group is reasonably certain to exercise an extension option, and penalties for early termination of a lease unless the group is reasonably certain not to terminate early.
The group’s incremental borrowing rate is derived with reference to the group’s subordinated loan notes (note 28), which is the only external financing on the consolidated balance sheet.
The lease liability is subsequently measured by adjusting the carrying amount to reflect the interest charge, the lease payments made and any reassessment or lease modifications. The lease liability is remeasured if the group changes its assessment of whether it will exercise a purchase, extension or termination option.
When the lease liability is remeasured in this way, a corresponding adjustment is made to the carrying amount of the right-of-use asset, or is recorded in profit or loss if the carrying amount of the right-of-use asset has been reduced to zero.
Where the group is an intermediate lessor in a sub-lease, it accounts for its interests in the head lease and the sub-lease separately. It assesses the lease classification of a sub-lease with reference to the right-of-use asset arising from the head lease, not with reference to the underlying asset.
1.9 Share-based payments The group engages in equity-settled and cash-settled share-based payment transactions in respect of services received from its employees.
Equity-settled awards For equity-settled share-based payments, the fair value of the award is measured by reference to the fair value of the shares or share options granted on the grant date. The cost of the employee services received in respect of the shares or share options granted is recognised in profit or loss over the vesting period, with a corresponding credit to equity.
Notes to the consolidated financial statements continued
148 Rathbone Brothers Plc Report and accounts 2020
| Consolidated financial statements

148 Rathbone Brothers Plc Report and accounts 2020
1 Principal accounting policies continued
1.8 Leases The group applied IFRS 16 with effect from 1 January 2019, using the modified retrospective approach.
The group has applied the practical expedient to grandfather the definition of a lease at the date of transition. Therefore, this policy applies to all contracts entered into on or after 1 January 2019.
At inception of a contract, the group assesses whether a contract is, or contains, a lease. A contract is, or contains, a lease if the contract conveys the right to control the use of an identified asset for a period of time in exchange for consideration. To assess whether a contract conveys the right to control the use of an identified asset, the group uses the definition of a lease in IFRS 16.
The group recognises a right-of-use asset and a lease liability at the inception date of the lease. The right-of-use asset is initially measured at cost, which comprises the initial amount of the lease liability adjusted for any lease payments made at or before the commencement date, plus any initial direct costs incurred and an estimate of costs to dismantle and remove the underlying asset or to restore the underlying asset or the site on which it is located, less any lease incentives received.
The right-of-use assets are subsequently depreciated on a straight-line basis over the shorter of the expected life of the asset and the lease term, adjusted for any remeasurements of the lease liability. At the end of each reporting period, the right-of-use assets are assessed for indicators of impairment in accordance with IAS 36.
The lease liability is initially measured at the present value of the lease payments that are not paid at the commencement date, discounted using the interest rate implicit in the lease or, if that rate cannot be readily determined, the group’s incremental borrowing rate. The group uses its incremental borrowing rate as the discount rate.
Lease payments included in the measurement of the lease liability comprise the following:
– fixed payments, including in-substance fixed payments – variable lease payments that depend on an index or a rate, initially measured using the index or rate as at the commencement date
– amounts expected to be payable under a residual value guarantee – the exercise price under a purchase option that the group is reasonably certain to exercise, lease payments in an optional renewal period
if the group is reasonably certain to exercise an extension option, and penalties for early termination of a lease unless the group is reasonably certain not to terminate early.
The group’s incremental borrowing rate is derived with reference to the group’s subordinated loan notes (note 28), which is the only external financing on the consolidated balance sheet.
The lease liability is subsequently measured by adjusting the carrying amount to reflect the interest charge, the lease payments made and any reassessment or lease modifications. The lease liability is remeasured if the group changes its assessment of whether it will exercise a purchase, extension or termination option.
When the lease liability is remeasured in this way, a corresponding adjustment is made to the carrying amount of the right-of-use asset, or is recorded in profit or loss if the carrying amount of the right-of-use asset has been reduced to zero.
Where the group is an intermediate lessor in a sub-lease, it accounts for its interests in the head lease and the sub-lease separately. It assesses the lease classification of a sub-lease with reference to the right-of-use asset arising from the head lease, not with reference to the underlying asset.
1.9 Share-based payments The group engages in equity-settled and cash-settled share-based payment transactions in respect of services received from its employees.
Equity-settled awards For equity-settled share-based payments, the fair value of the award is measured by reference to the fair value of the shares or share options granted on the grant date. The cost of the employee services received in respect of the shares or share options granted is recognised in profit or loss over the vesting period, with a corresponding credit to equity.
rathbones.com 149
The fair value of the awards or options granted is determined using a binomial pricing model, which takes into account the current share price, the risk-free interest rate, the expected volatility of the company’s share price over the life of the option or award, any applicable exercise price and other relevant factors. Only those vesting conditions that include terms related to market conditions are taken into account in estimating fair value. Non-market vesting conditions are taken into account by adjusting the number of shares or share options included in the measurement of the cost of employee services so that, ultimately, the amount recognised in profit or loss reflects the number of vested shares or share options, with a corresponding adjustment to equity. Where vesting conditions are related to market conditions, the charges for the services received are recognised regardless of whether or not the market-related vesting condition is met, provided that any non-market vesting conditions are also met. Shares purchased and issued are charged directly to equity.
Cash-settled awards For cash-settled share-based payments, a liability is recognised for the services received to the balance sheet date, measured at the fair value of the liability. At each subsequent balance sheet date and at the date on which the liability is settled, the fair value of the liability is remeasured with any changes in fair value recognised in profit or loss.
1.10 Taxation Current tax Current tax is the expected tax payable or receivable on net taxable income for the year. Current tax is calculated using tax rates enacted or substantively enacted by the balance sheet date, together with any adjustment to tax payable or receivable in respect of previous years.
Deferred tax Deferred tax is accounted for under the balance sheet liability method in respect of temporary differences using tax rates (and laws) that have been enacted or substantively enacted by the balance sheet date and are expected to apply when the liability is settled or when the asset is realised. Deferred tax liabilities are recognised for all temporary differences and deferred tax assets are recognised to the extent that it is probable that taxable profits will be available against which deductible temporary differences may be utilised, except where the temporary difference arises:
– from the initial recognition of goodwill; – from the initial recognition of other assets and liabilities in a transaction, which affects neither the tax profit nor the accounting profit,
other than in a business combination; or
– in relation to investments in subsidiaries and associates, where the group is able to control the reversal of the temporary difference and it is the group’s intention not to reverse the temporary difference in the foreseeable future.
Deferred tax assets and liabilities are offset when they relate to income taxes levied by the same taxation authority and the group intends to settle its current tax assets and liabilities on a net basis.
Current and deferred tax are recognised, in the same or a different period:
– in other comprehensive income if they relate to items recognised in other comprehensive income – directly in retained earnings if they relate to items recognised directly in retained earnings.
1.11 Cash and cash equivalents Cash comprises cash in hand.
Cash equivalents comprise money market funds which are realisable on demand and loans and advances to banks with a maturity of less than three months from the date of acquisition.
For the purposes of the consolidated statement of cash flows, cash and cash equivalents consist of cash and cash equivalents as defined above, net of outstanding bank overdrafts.
rathbones.com 149

150 Rathbone Brothers Plc Report and accounts 2020
1 Principal accounting policies continued
1.12 Financial assets Initial recognition and measurement Financial assets, excluding trade debtors, are initially recognised when the group becomes party to the contractual provisions of the asset. Trade debtors are recognised when cash is advanced to the borrowers.
Financial assets are initially recognised at fair value plus transaction costs that are directly attributable to their acquisition (except those assets classified at fair value through profit or loss). Trade debtors without a significant financing component are initially measured at the transaction price.
Financial assets are not reclassified subsequent to their initial recognition unless the group changes its business model for managing financial assets, in which case all affected financial assets are reclassified on the first day of the first reporting period following the change in the business model.
Classification and subsequent measurement Financial assets are classified and measured in the following categories:
– amortised cost Financial assets are measured at amortised cost if their contractual terms give rise to cash flows that are solely payments of principal and interest on the principal amount outstanding and they are held within a business model whose objective is to hold assets to collect contractual cash flows.
Assets are measured at amortised cost using the effective interest rate method (note 1.7), less any impairment losses. Interest income, foreign exchange gains and losses and impairment are recognised in profit or loss. Any gain or loss on derecognition is recognised in profit or loss.
– at fair value through other comprehensive income (FVOCI)
Debt instruments are measured at FVOCI if their contractual terms give rise to cash flows that are solely payments of principal and interest on the principal amount outstanding and they are held within a business model whose objective is both to hold assets to collect contractual cash flows and to sell the assets.
For debt instruments, interest income is calculated using the effective interest method. For equity instruments, dividends are recognised as income in profit or loss unless the dividend clearly represents a recovery of part of the cost of the investment. All other gains and losses on assets at FVOCI are recognised in OCI.
– at fair value through profit or loss (FVTPL) All equity instruments are measured at FVTPL unless, provided the instrument is not held for trading, the group irrevocably elects to measure the instrument at FVOCI. This election is made on an investment-by-investment basis.
All financial assets not classified as measured at amortised cost or FVOCI as described above are measured at FVTPL. On initial recognition, the group may irrevocably designate a financial asset that otherwise meets the requirements to be measured at amortised cost or FVOCI at FVTPL if doing so eliminates or significantly reduces an accounting mismatch that would otherwise arise.
Net gains and losses, including any interest or dividend income, are recognised in profit or loss.
Business model assessment The group assesses the objective of the business model in which a financial asset is held at a portfolio level. The information considered includes:
– the objectives for the portfolio and how those tie in to the current and future strategy of the group – how the performance of the portfolio is evaluated and reported to the group’s management
– the risks that affect the performance of the business model (and the financial assets held within that business model) and how those risks are managed
– how group employees are compensated, e.g. whether compensation is based on the fair value of the assets managed or the contractual cash flows collected
– the frequency, volume and timing of sales of financial assets in prior periods, the reasons for such sales and expectations about future sales activity.
Notes to the consolidated financial statements continued
150 Rathbone Brothers Plc Report and accounts 2020
| Consolidated financial statements

150 Rathbone Brothers Plc Report and accounts 2020
1 Principal accounting policies continued
1.12 Financial assets Initial recognition and measurement Financial assets, excluding trade debtors, are initially recognised when the group becomes party to the contractual provisions of the asset. Trade debtors are recognised when cash is advanced to the borrowers.
Financial assets are initially recognised at fair value plus transaction costs that are directly attributable to their acquisition (except those assets classified at fair value through profit or loss). Trade debtors without a significant financing component are initially measured at the transaction price.
Financial assets are not reclassified subsequent to their initial recognition unless the group changes its business model for managing financial assets, in which case all affected financial assets are reclassified on the first day of the first reporting period following the change in the business model.
Classification and subsequent measurement Financial assets are classified and measured in the following categories:
– amortised cost Financial assets are measured at amortised cost if their contractual terms give rise to cash flows that are solely payments of principal and interest on the principal amount outstanding and they are held within a business model whose objective is to hold assets to collect contractual cash flows.
Assets are measured at amortised cost using the effective interest rate method (note 1.7), less any impairment losses. Interest income, foreign exchange gains and losses and impairment are recognised in profit or loss. Any gain or loss on derecognition is recognised in profit or loss.
– at fair value through other comprehensive income (FVOCI)
Debt instruments are measured at FVOCI if their contractual terms give rise to cash flows that are solely payments of principal and interest on the principal amount outstanding and they are held within a business model whose objective is both to hold assets to collect contractual cash flows and to sell the assets.
For debt instruments, interest income is calculated using the effective interest method. For equity instruments, dividends are recognised as income in profit or loss unless the dividend clearly represents a recovery of part of the cost of the investment. All other gains and losses on assets at FVOCI are recognised in OCI.
– at fair value through profit or loss (FVTPL) All equity instruments are measured at FVTPL unless, provided the instrument is not held for trading, the group irrevocably elects to measure the instrument at FVOCI. This election is made on an investment-by-investment basis.
All financial assets not classified as measured at amortised cost or FVOCI as described above are measured at FVTPL. On initial recognition, the group may irrevocably designate a financial asset that otherwise meets the requirements to be measured at amortised cost or FVOCI at FVTPL if doing so eliminates or significantly reduces an accounting mismatch that would otherwise arise.
Net gains and losses, including any interest or dividend income, are recognised in profit or loss.
Business model assessment The group assesses the objective of the business model in which a financial asset is held at a portfolio level. The information considered includes:
– the objectives for the portfolio and how those tie in to the current and future strategy of the group – how the performance of the portfolio is evaluated and reported to the group’s management
– the risks that affect the performance of the business model (and the financial assets held within that business model) and how those risks are managed
– how group employees are compensated, e.g. whether compensation is based on the fair value of the assets managed or the contractual cash flows collected
– the frequency, volume and timing of sales of financial assets in prior periods, the reasons for such sales and expectations about future sales activity.
rathbones.com 151
Payments of principal and interest criterion In assessing whether the contractual cash flows are solely payments of principal and interest, the group considers:
– the contractual terms of the instrument, checking consistency with basic lending criteria – the impact of the time value of money
– features that would change the amount or timing of contractual cash flows – other factors, such as prepayment or extension features.
Derecognition Financial assets are derecognised when the contractual rights to receive cash flows have expired or the group has transferred substantially all the risks and rewards of ownership.
Impairment of financial assets The group recognises loss allowances for expected credit losses (ECLs) on financial assets measured at amortised cost and FVOCI and loan commitments held off balance sheet.
A financial asset will attract a loss allowance equal to either:
– 12-month ECLs (losses resulting from possible defaults within the next 12 months); or – lifetime ECLs (losses resulting from possible defaults over the remaining life of the financial asset).
The latter applies if there has been a significant deterioration in the credit quality of the asset; albeit lifetime ECLs will always be recognised for assets without a significant financing component.
The maximum period considered when estimating ECLs is the maximum contractual period over which the group is exposed to credit risk.
The group measures loss allowances at an amount equal to lifetime ECLs, except for treasury book and investment management loan book exposures for which credit risk has not increased significantly since initial recognition, which are measured at 12-month ECLs.
Loss allowances for trust and financial planning debtors are always measured at an amount equal to lifetime ECLs.
When assessing whether the credit risk of a financial asset has increased significantly between the reporting date and initial recognition, quantitative and qualitative indicators are used. More detail can be found at note 33.
Measurement of ECLs
Treasury book and investment management loan book The group has developed a detailed model for calculating ECLs on its treasury book and investment management loan book (which includes loan commitments held off balance sheet). The group has applied considerable judgement in developing three different economic scenarios: a base case, an upside and a downside.
The base case is assigned a 60% probability of occurring with the upside and downside each assigned a 20% probability of occurring.
The economic scenarios are based on the projections of GDP, inflation, unemployment rates, house price indices, financial markets and interest rates as set out in the banking system stress testing scenario published annually by the PRA.
Management adjust the projections for the economic variables in arriving at the upside and downside scenarios.
Under each resultant scenario, an ECL is forecast for each exposure in the treasury book and investment management loan book. The ECL is calculated based on management’s estimate of the probability of default, the loss given default and the exposure at default of each exposure taking into account industry credit loss data, the group’s own credit loss experience, the expected repayment profiles of the exposures and the level of collateral held. Industry credit loss information is drawn from data on credit defaults for different categories of exposure published by the Council of Mortgage Lenders and Standard & Poor’s.
The model adopts a staging allocation methodology, primarily based on changes in the internal and/or external credit rating of exposures to identify significant increases in credit risk since inception of the exposure.
The group has not rebutted the presumption that if an exposure is more than 30 days past due, the associated credit risk has significantly increased.
More detail on the group’s staging criteria is provided in note 33.
ECLs are discounted back to the balance sheet date at the effective interest rate of the asset.
rathbones.com 151

152 Rathbone Brothers Plc Report and accounts 2020
1 Principal accounting policies continued Trust and financial planning debtors The group’s trust and financial planning debtors are generally short term and do not contain significant financing components. Therefore, the group has applied a practical expedient by using a provision matrix to calculate lifetime ECLs based on actual credit loss experience over the past four years.
Credit-impaired financial assets At each reporting date, the group assesses whether financial assets carried at amortised cost and FVOCI are credit-impaired. A financial asset is ‘credit-impaired’ when one or more events that have a detrimental impact on the estimated future cash flows of the financial asset have occurred. The group’s definition of default is given in note 33.
Presentation of impairment Loss allowances for financial assets measured at amortised cost and FVOCI are deducted from the gross carrying amount of the assets.
Impairment losses related to the group’s treasury book and investment management loan book are presented in ‘interest expense and similar charges’ and those related to all other financial assets (including trust and financial planning debtors) are presented under ‘other operating expenses’. No losses are presented separately on the statement of the comprehensive income and there have been no reclassifications of amounts previously recognised under IAS 39.
1.13 Property, plant and equipment All property, plant and equipment is stated at historical cost, which includes directly attributable acquisition costs, less accumulated depreciation and impairment losses. Depreciation is charged so as to write off the cost of assets to their estimated residual value over their estimated useful lives, using the straight-line method, on the following bases:
– leasehold improvements: over the lease term – plant, equipment and computer hardware: over three to 10 years.
The assets’ residual lives are reviewed, and adjusted if appropriate, at each balance sheet date. Gains and losses on disposals are determined by comparing proceeds with the carrying amount and these are included in profit or loss.
1.14 Intangible assets Goodwill Goodwill arises through business combinations and represents the excess of the cost of acquisition over the group’s interest in the fair value of the identifiable assets, liabilities and contingent liabilities of a business at the date of acquisition.
Goodwill is recognised as an asset and measured at cost less accumulated impairment losses. It is allocated to groups of cash-generating units, which represent the lowest level at which goodwill is monitored for internal management purposes. Cash-generating units are identified as the smallest identifiable group of assets that generates cash inflows that are largely independent of the cash inflows from other assets or groups of assets, and are no larger than the group’s operating segments, as set out in note 3.
On disposal of a subsidiary the attributed amount of goodwill that has not been subject to impairment is included in the determination of the profit or loss on disposal.
Goodwill arising on acquisitions before 1 January 2004, being the date of the group’s transition to IFRS, has been retained at the previous UK GAAP carrying amounts and is tested for impairment annually.
Client relationships Client relationships acquired as part of a business combination are initially recognised at fair value (note 1.4). Determining whether a transaction that involves the purchase of client relationships is treated as a business combination or a separate purchase of intangible assets requires judgement. The factors that the group takes into consideration in making this judgement are set out in note 2.1.
Individually purchased client relationships are initially recognised at cost. Where a transaction to acquire client relationship intangibles includes an element of variable deferred consideration, an estimate is made of the value of consideration that will ultimately be paid. The client relationship intangible recognised on the balance sheet is adjusted for any subsequent change in the value of deferred consideration. Note 2.1 sets out the approach taken by the group where judgement is required to determine whether payments made for the introduction of client relationships should be capitalised as intangible assets or charged to profit or loss.
Client relationships are subsequently carried at the amount initially recognised less accumulated amortisation, which is calculated using the straight-line method over their estimated useful lives (normally 10 to 15 years, but not more than 15 years).
Notes to the consolidated financial statements continued
152 Rathbone Brothers Plc Report and accounts 2020
| Consolidated financial statements

152 Rathbone Brothers Plc Report and accounts 2020
1 Principal accounting policies continued Trust and financial planning debtors The group’s trust and financial planning debtors are generally short term and do not contain significant financing components. Therefore, the group has applied a practical expedient by using a provision matrix to calculate lifetime ECLs based on actual credit loss experience over the past four years.
Credit-impaired financial assets At each reporting date, the group assesses whether financial assets carried at amortised cost and FVOCI are credit-impaired. A financial asset is ‘credit-impaired’ when one or more events that have a detrimental impact on the estimated future cash flows of the financial asset have occurred. The group’s definition of default is given in note 33.
Presentation of impairment Loss allowances for financial assets measured at amortised cost and FVOCI are deducted from the gross carrying amount of the assets.
Impairment losses related to the group’s treasury book and investment management loan book are presented in ‘interest expense and similar charges’ and those related to all other financial assets (including trust and financial planning debtors) are presented under ‘other operating expenses’. No losses are presented separately on the statement of the comprehensive income and there have been no reclassifications of amounts previously recognised under IAS 39.
1.13 Property, plant and equipment All property, plant and equipment is stated at historical cost, which includes directly attributable acquisition costs, less accumulated depreciation and impairment losses. Depreciation is charged so as to write off the cost of assets to their estimated residual value over their estimated useful lives, using the straight-line method, on the following bases:
– leasehold improvements: over the lease term – plant, equipment and computer hardware: over three to 10 years.
The assets’ residual lives are reviewed, and adjusted if appropriate, at each balance sheet date. Gains and losses on disposals are determined by comparing proceeds with the carrying amount and these are included in profit or loss.
1.14 Intangible assets Goodwill Goodwill arises through business combinations and represents the excess of the cost of acquisition over the group’s interest in the fair value of the identifiable assets, liabilities and contingent liabilities of a business at the date of acquisition.
Goodwill is recognised as an asset and measured at cost less accumulated impairment losses. It is allocated to groups of cash-generating units, which represent the lowest level at which goodwill is monitored for internal management purposes. Cash-generating units are identified as the smallest identifiable group of assets that generates cash inflows that are largely independent of the cash inflows from other assets or groups of assets, and are no larger than the group’s operating segments, as set out in note 3.
On disposal of a subsidiary the attributed amount of goodwill that has not been subject to impairment is included in the determination of the profit or loss on disposal.
Goodwill arising on acquisitions before 1 January 2004, being the date of the group’s transition to IFRS, has been retained at the previous UK GAAP carrying amounts and is tested for impairment annually.
Client relationships Client relationships acquired as part of a business combination are initially recognised at fair value (note 1.4). Determining whether a transaction that involves the purchase of client relationships is treated as a business combination or a separate purchase of intangible assets requires judgement. The factors that the group takes into consideration in making this judgement are set out in note 2.1.
Individually purchased client relationships are initially recognised at cost. Where a transaction to acquire client relationship intangibles includes an element of variable deferred consideration, an estimate is made of the value of consideration that will ultimately be paid. The client relationship intangible recognised on the balance sheet is adjusted for any subsequent change in the value of deferred consideration. Note 2.1 sets out the approach taken by the group where judgement is required to determine whether payments made for the introduction of client relationships should be capitalised as intangible assets or charged to profit or loss.
Client relationships are subsequently carried at the amount initially recognised less accumulated amortisation, which is calculated using the straight-line method over their estimated useful lives (normally 10 to 15 years, but not more than 15 years).
rathbones.com 153
Computer software and software development costs Costs incurred to acquire and bring to use computer software licences are capitalised and amortised through profit or loss over their expected useful lives (three to four years).
Costs that are directly associated with the production of identifiable and unique software products controlled by the group are recognised as intangible assets when the group is expected to benefit from future use of the software and the costs are reliably measurable. Other costs of producing software are charged to profit or loss as incurred. Computer software development costs recognised as assets are amortised using the straight-line method over their useful lives (not exceeding four years).
1.15 Impairment of goodwill and intangible assets At each balance sheet date, the group reviews the carrying amounts of its intangible assets to determine whether there is any indication that those assets have suffered an impairment loss. If any such indication exists, the recoverable amount of the asset is estimated in order to determine the extent of the impairment loss (if any). Where the asset does not generate cash flows that are independent from other assets, the group estimates the recoverable amount of the cash-generating unit to which the asset belongs. The recoverable amount is the higher of fair value less costs to sell and value in use. In assessing value in use, the estimated future cash flows are discounted to their present value using a pre-tax discount rate that reflects current market assessments of the time value of money.
Goodwill is tested for impairment at least annually. For the purposes of impairment testing, goodwill is allocated to groups of cash-generating units. The carrying amount of each group of cash-generating units is compared to its value in use, calculated using a discounted cash flow method. If the recoverable amount of the group of cash-generating units is less than the carrying amount of the group of units, the impairment loss is allocated first to reduce the carrying amount of the goodwill allocated to that group of units and then to the other assets of the group of units pro rata on the basis of the carrying amount of each asset in the group of units.
Client relationship intangibles are tested for impairment by comparing the fair value of funds under management and administration for each individually acquired client relationship (or, for client relationships acquired with a business combination, each acquired portfolio of clients) with their associated amortised value. An example of evidence of impairment would be lost client relationships. In determining whether a client relationship is lost, the group considers factors such as the level of funds withdrawn and the existence of other retained family relationships. When client relationships are lost, the full amount of unamortised cost is recognised immediately in profit or loss and the intangible asset is derecognised.
If the recoverable amount of any asset other than goodwill or client relationships is estimated to be less than its carrying amount, the carrying amount of the asset is reduced to its recoverable amount.
Any impairment loss is recognised immediately in profit or loss.
1.16 Financial liabilities Initial recognition and measurement Financial liabilities are initially recognised at fair value plus transaction costs that are directly attributable to its issue.
Classification and subsequent measurement Financial liabilities are classified as measured at amortised cost or at fair value through profit or loss.
The group has not designated any liabilities as fair value through profit or loss and holds no liabilities as held for trading. Financial liabilities are measured at amortised cost using the effective interest method (note 1.7). Amortised cost is calculated by taking into account any issue costs and any discounts or premiums on settlement. Interest expense and foreign exchange gains and losses are recognised in profit or loss. Any gain or loss on derecognition is also recognised in profit or loss.
Derecognition The group derecognises financial liabilities when its contractual obligations are discharged or cancelled, or expire.
1.17 Provisions and contingent liabilities Provisions are recognised when the group has a present obligation (legal or constructive) as a result of a past event and it is probable that an outflow of economic benefits, that can be reliably estimated, will occur. Provisions are measured at the present value of the expenditures expected to be required to settle the obligation, discounted using a pre-tax rate that reflects current market assessments of the time value of money and the risks specific to the obligation.
Contingent liabilities are possible obligations that depend on the outcome of uncertain future events or those present obligations where the outflows of resources are uncertain or cannot be measured reliably. Contingent liabilities are not recognised in the financial statements but are disclosed unless the likelihood of crystallisation is judged to be remote.
rathbones.com 153

154 Rathbone Brothers Plc Report and accounts 2020
1 Principal accounting policies continued
1.18 Retirement benefit obligations on retirement benefit schemes The group’s net liability in respect of defined benefit pension plans is calculated separately for each plan by estimating the amount of future benefit that employees have earned in return for their service in the current and prior years; that benefit is discounted to determine its present value, and the fair value of any plan assets (at bid price) is deducted. Any asset resulting from this calculation is limited to the present value of available refunds and reductions in future contributions to the plan.
The cost of providing benefits under defined benefit plans is determined using the projected unit credit method, with actuarial valuations being carried out at each balance sheet date. Net remeasurements of the defined benefit liability are recognised in full in the period in which they occur in other comprehensive income.
Past service costs or gains are recognised immediately in the period of a plan amendment.
The amount recognised in the balance sheet for death-in-service benefits represents the present value of the estimated obligation, reduced by the extent to which any future liabilities will be met by insurance policies.
The company determines the net interest on the net defined benefit liability for the year by applying the discount rate used to measure the defined benefit obligation at the beginning of the year to the net defined benefit liability.
Contributions to defined contribution retirement benefit schemes are charged to profit or loss as an expense as they fall due.
1.19 Segmental reporting The group determines and presents operating segments based on the information that is provided internally to the group executive committee, which is the group’s chief operating decision-maker. Operating segments are organised around the services provided to clients; a description of the services provided by each segment is given in note 3. No operating segments have been aggregated in the group’s financial statements.
Transactions between operating segments are reported within the income or expenses for those segments; intra-segment income and expenditure is eliminated at group level. Indirect costs are allocated between segments in proportion to the principal cost driver for each category of indirect costs that is generated by each segment.
1.20 Fiduciary activities The group commonly acts as trustee and in other fiduciary capacities that result in the holding or placing of assets on behalf of individuals, trusts, retirement benefit plans and other institutions. Such assets and income arising thereon are excluded from these financial statements, as they are not assets of the group. Largely as a result of cash and settlement processing, the group holds money on behalf of some clients in accordance with the Client Money Rules of the Financial Conduct Authority, the Jersey Financial Services Commission and the Solicitors’ Accounts Rules issued by the Solicitors Regulation Authority, as applicable. Such monies and the corresponding amounts due to clients are not shown on the face of the balance sheet as the group is not beneficially entitled to them.
1.21 Financial guarantees The group provides a limited number of financial guarantees, which are backed by assets in clients’ portfolios. Financial guarantees are initially recognised in the balance sheet at fair value. Guarantees are subsequently measured at the higher of the best estimate of any amount to be paid to settle the guarantee and the amount initially recognised less cumulative amortisation, which is recognised over the life of the guarantee.
1.22 Fair value measurement The fair values of quoted financial instruments in active markets are based on current bid prices. If an active market for a financial asset does not exist, the group establishes fair value by using valuation techniques. These include the use of recent arm’s-length transactions, discounted cash flow analysis, option pricing models and other valuation techniques commonly used by market participants.
The group recognises transfers between levels of the fair value hierarchy at the end of the reporting period during which the change has occurred.
Notes to the consolidated financial statements continued
154 Rathbone Brothers Plc Report and accounts 2020
| Consolidated financial statements

154 Rathbone Brothers Plc Report and accounts 2020
1 Principal accounting policies continued
1.18 Retirement benefit obligations on retirement benefit schemes The group’s net liability in respect of defined benefit pension plans is calculated separately for each plan by estimating the amount of future benefit that employees have earned in return for their service in the current and prior years; that benefit is discounted to determine its present value, and the fair value of any plan assets (at bid price) is deducted. Any asset resulting from this calculation is limited to the present value of available refunds and reductions in future contributions to the plan.
The cost of providing benefits under defined benefit plans is determined using the projected unit credit method, with actuarial valuations being carried out at each balance sheet date. Net remeasurements of the defined benefit liability are recognised in full in the period in which they occur in other comprehensive income.
Past service costs or gains are recognised immediately in the period of a plan amendment.
The amount recognised in the balance sheet for death-in-service benefits represents the present value of the estimated obligation, reduced by the extent to which any future liabilities will be met by insurance policies.
The company determines the net interest on the net defined benefit liability for the year by applying the discount rate used to measure the defined benefit obligation at the beginning of the year to the net defined benefit liability.
Contributions to defined contribution retirement benefit schemes are charged to profit or loss as an expense as they fall due.
1.19 Segmental reporting The group determines and presents operating segments based on the information that is provided internally to the group executive committee, which is the group’s chief operating decision-maker. Operating segments are organised around the services provided to clients; a description of the services provided by each segment is given in note 3. No operating segments have been aggregated in the group’s financial statements.
Transactions between operating segments are reported within the income or expenses for those segments; intra-segment income and expenditure is eliminated at group level. Indirect costs are allocated between segments in proportion to the principal cost driver for each category of indirect costs that is generated by each segment.
1.20 Fiduciary activities The group commonly acts as trustee and in other fiduciary capacities that result in the holding or placing of assets on behalf of individuals, trusts, retirement benefit plans and other institutions. Such assets and income arising thereon are excluded from these financial statements, as they are not assets of the group. Largely as a result of cash and settlement processing, the group holds money on behalf of some clients in accordance with the Client Money Rules of the Financial Conduct Authority, the Jersey Financial Services Commission and the Solicitors’ Accounts Rules issued by the Solicitors Regulation Authority, as applicable. Such monies and the corresponding amounts due to clients are not shown on the face of the balance sheet as the group is not beneficially entitled to them.
1.21 Financial guarantees The group provides a limited number of financial guarantees, which are backed by assets in clients’ portfolios. Financial guarantees are initially recognised in the balance sheet at fair value. Guarantees are subsequently measured at the higher of the best estimate of any amount to be paid to settle the guarantee and the amount initially recognised less cumulative amortisation, which is recognised over the life of the guarantee.
1.22 Fair value measurement The fair values of quoted financial instruments in active markets are based on current bid prices. If an active market for a financial asset does not exist, the group establishes fair value by using valuation techniques. These include the use of recent arm’s-length transactions, discounted cash flow analysis, option pricing models and other valuation techniques commonly used by market participants.
The group recognises transfers between levels of the fair value hierarchy at the end of the reporting period during which the change has occurred.
rathbones.com 155
2 Critical accounting judgements and key sources of estimation uncertainty The group makes judgements and estimates that affect the application of the group’s accounting policies and reported amounts of assets, liabilities, income and expenses within the next financial year. Estimates and assumptions are continually evaluated and are based on historical experience and other factors, including expectations of future events that are believed to be reasonable under the circumstances.
The following key accounting policies involve critical judgements made in applying the accounting policy and involve estimations.
2.1 Client relationship intangibles (note 22) Critical judgements Client relationship intangibles purchased through corporate transactions When the group purchases client relationships through transactions with other corporate entities, a judgement is made as to whether the transaction should be accounted for as a business combination or as a separate purchase of intangible assets. In making this judgement, the group assesses the assets, liabilities, operations and processes that were the subject of the transaction against the definition of a business combination in IFRS 3. In particular, consideration is given to the scale of the operations subject to the transaction and whether ownership of a corporate entity has been acquired, among other factors.
Payments to newly recruited investment managers The group assesses whether payments made to newly recruited investment managers under contractual agreements represent payments for the acquisition of client relationship intangibles or remuneration for ongoing services provided to the group. If these payments are incremental costs of acquiring investment management contracts and are deemed to be recoverable (i.e. through future revenues earned from the funds that transfer), they are capitalised as client relationship intangibles (note 22). Otherwise, they are judged to be in relation to the provision of ongoing services and are expensed in the period in which they are incurred. Upfront payments made to investment managers upon joining are expensed as they are not judged to be incremental costs for acquiring the client relationships.
Estimation uncertainty Amortisation of client relationship intangibles The group makes estimates as to the expected duration of client relationships to determine the period over which related intangible assets are amortised. The amortisation period is estimated with reference to historical data on account closure rates and expectations that these will continue in the future. During the year, client relationship intangible assets were amortised over a 10-to-15-year period.
Amortisation of £14,302,000 (2019: £15,369,000) was charged during the year. At 31 December 2020, the carrying value of client relationship intangibles was £121,129,000 (2019: £124,456,000).
A reduction of three years in the amortisation period of those client relationship intangible assets currently amortised over 15 years would increase the annual amortisation charge by £5.9 million.
2.2 Retirement benefit obligations (note 29) Estimation uncertainty The principal assumptions underlying the reported deficit of £9,785,000 (2019: £8,014,000 deficit) are set out in note 29.
In setting these assumptions, the group makes estimates about a range of long-term trends and market conditions to determine the value of the surplus or deficit on its retirement benefit schemes, based on the group’s expectations of the future and advice taken from qualified actuaries. Long-term forecasts and estimates are necessarily highly subjective and subject to risk that actual events may be significantly different to those forecast. If actual events deviate from the assumptions made by the group then the reported surplus or deficit in respect of retirement benefit obligations may be materially different.
The sensitivity of the retirement benefit obligations to changes in all of the underlying estimates are set out in note 29. Of these, the most sensitive assumption is the discount rate used to measure the defined benefit obligation. Increasing the discount rate by 1.0% would decrease the schemes’ liabilities by £15,689,000 (2019: £28,701,000). A 1.0% decrease would have an equal and opposite effect.
rathbones.com 155

156 Rathbone Brothers Plc Report and accounts 2020
2 Critical accounting judgements and key sources of estimation and uncertainty continued
2.3 Business combinations (note 8) Critical judgement Treatment and fair value of consideration transferred
On 31 August 2018, the group acquired the entire share capital of Speirs & Jeffrey (‘S&J’). The group accounted for the transaction as a business combination.
As described in note 8 to the financial statements, the purchase price payable for the acquisition is split into a number of different parts. The payment of certain elements has been deferred. At 31 December 2020, one element of the deferred consideration remained unvested and subject to ongoing vesting conditions.
Vesting of the £25,000,000 initial share consideration is contingent on continued employment of the vendors and this amount is being charged to profit or loss as a share-based payment for employee services over the vesting period.
Vesting of the earn-out consideration is payable in shares and is conditional on achieving certain operational and financial targets and the continued employment of the vendors.
Estimation uncertainty Valuation of the earn-out consideration and incentivisation awards
During the year, the group revised its valuation of the-earn out consideration and related incentivisation awards, which are dependent on performance by the acquired business against certain operational and financial targets by 31 December 2020 and 31 December 2021.
The group estimates the total amount payable on these dates to be £44.7 million, based on agreed qualifying funds under management of £5.1 billion at 31 December 2020, and forecast incremental qualifying funds under management of £0.5 billion at 31 December 2021. As a result, accumulated charges of £35.3 million have been recognised since the acquisition in August 2018 with a corresponding credit to equity. An additional £0.6 million has been recognised as a provision on the balance sheet in respect of incentivisation awards to be settled in cash. The associated charge to profit or loss during the year was £23.1 million (note 8).
The value of incremental qualifying funds under management at the end of 2021 has been derived from a probability-weighted scenario analysis, which considers assumptions of forecast client attrition, and the rate at which existing clients will convert from non-discretionary to discretionary mandates.
In the prior year, the group’s results were based on forecast qualifying funds under management of £4.8 billion at the end of 2020, and incremental qualifying funds under management of £48.0 million at the end of 2021. The material increase in forecast total qualifying funds under management during the year is due to lower than expected client attrition following the application of the group’s standardised fee rates, and a higher market level at 31 December 2020. The group recognised an additional charge of £15.9 million in profit or loss during the period in relation to the increase in total forecast qualifying funds under management.
If qualifying funds under management at 31 December 2021 are £100 million higher or lower than management’s estimate then the accumulated charges as at 31 December 2020 for earn-out consideration and incentivisation awards would be £1.25 million higher or lower and the charge to profit or loss in 2020 would be £1.25 million higher or lower.
Under the terms of the agreements, the maximum possible payment for the second earn-out and incentivisation awards is capped at £91,600,000; which represents incremental qualifying funds under management of approximately £3.7 billion at the end of 2021.
Notes to the consolidated financial statements continued
156 Rathbone Brothers Plc Report and accounts 2020
| Consolidated financial statements

156 Rathbone Brothers Plc Report and accounts 2020
2 Critical accounting judgements and key sources of estimation and uncertainty continued
2.3 Business combinations (note 8) Critical judgement Treatment and fair value of consideration transferred
On 31 August 2018, the group acquired the entire share capital of Speirs & Jeffrey (‘S&J’). The group accounted for the transaction as a business combination.
As described in note 8 to the financial statements, the purchase price payable for the acquisition is split into a number of different parts. The payment of certain elements has been deferred. At 31 December 2020, one element of the deferred consideration remained unvested and subject to ongoing vesting conditions.
Vesting of the £25,000,000 initial share consideration is contingent on continued employment of the vendors and this amount is being charged to profit or loss as a share-based payment for employee services over the vesting period.
Vesting of the earn-out consideration is payable in shares and is conditional on achieving certain operational and financial targets and the continued employment of the vendors.
Estimation uncertainty Valuation of the earn-out consideration and incentivisation awards
During the year, the group revised its valuation of the-earn out consideration and related incentivisation awards, which are dependent on performance by the acquired business against certain operational and financial targets by 31 December 2020 and 31 December 2021.
The group estimates the total amount payable on these dates to be £44.7 million, based on agreed qualifying funds under management of £5.1 billion at 31 December 2020, and forecast incremental qualifying funds under management of £0.5 billion at 31 December 2021. As a result, accumulated charges of £35.3 million have been recognised since the acquisition in August 2018 with a corresponding credit to equity. An additional £0.6 million has been recognised as a provision on the balance sheet in respect of incentivisation awards to be settled in cash. The associated charge to profit or loss during the year was £23.1 million (note 8).
The value of incremental qualifying funds under management at the end of 2021 has been derived from a probability-weighted scenario analysis, which considers assumptions of forecast client attrition, and the rate at which existing clients will convert from non-discretionary to discretionary mandates.
In the prior year, the group’s results were based on forecast qualifying funds under management of £4.8 billion at the end of 2020, and incremental qualifying funds under management of £48.0 million at the end of 2021. The material increase in forecast total qualifying funds under management during the year is due to lower than expected client attrition following the application of the group’s standardised fee rates, and a higher market level at 31 December 2020. The group recognised an additional charge of £15.9 million in profit or loss during the period in relation to the increase in total forecast qualifying funds under management.
If qualifying funds under management at 31 December 2021 are £100 million higher or lower than management’s estimate then the accumulated charges as at 31 December 2020 for earn-out consideration and incentivisation awards would be £1.25 million higher or lower and the charge to profit or loss in 2020 would be £1.25 million higher or lower.
Under the terms of the agreements, the maximum possible payment for the second earn-out and incentivisation awards is capped at £91,600,000; which represents incremental qualifying funds under management of approximately £3.7 billion at the end of 2021.
rathbones.com 157
3 Segmental information For management purposes, the group is organised into two operating divisions: Investment Management and Funds. Centrally incurred indirect expenses are allocated to these operating segments on the basis of the cost drivers that generate the expenditure; principally, these are the headcount of staff directly involved in providing those services from which the segment earns revenues, the value of funds under management and administration and the segment’s total revenue. The allocation of these costs is shown in a separate column in the table below, alongside the information presented for internal reporting to the group executive committee, which is the group’s chief operating decision-maker.
31 December 2020
Investment Management
£’000 Funds £’000
Indirect expenses
£’000 Total
£’000
Net investment management fee income 230,309 43,929 – 274,238 Net commission income 62,297 – – 62,297Net interest income 8,422 – – 8,422Fees from advisory services and other income 19,629 1,502 – 21,131Underlying operating income 320,657 45,431 – 366,088 Staff costs – fixed (83,673) (4,118) (29,697) (117,488)Staff costs – variable (56,414) (12,015) (9,299) (77,728)Total staff costs (140,087) (16,133) (38,996) (195,216)Other direct expenses (33,371) (8,693) (36,278) (78,342)Allocation of indirect expenses (67,753) (7,521) 75,274 –Underlying operating expenses (241,211) (32,347) – (273,558)Underlying profit before tax 79,446 13,084 – 92,530Charges in relation to client relationships and goodwill (note 22) (14,302) – – (14,302)Acquisition-related costs (note 9) (32,433) – (2,016) (34,449)Segment profit before tax 32,711 13,084 (2,016) 43,779Profit before tax attributable to equity holders of the company 43,779Taxation (note 11) (17,127)Profit for the year attributable to equity holders of the company 26,652
Investment Management
£’000 Funds £’000
Total £’000
Segment total assets 3,243,198 121,320 3,364,518Unallocated assets 6,100Total assets 3,370,618
rathbones.com 157
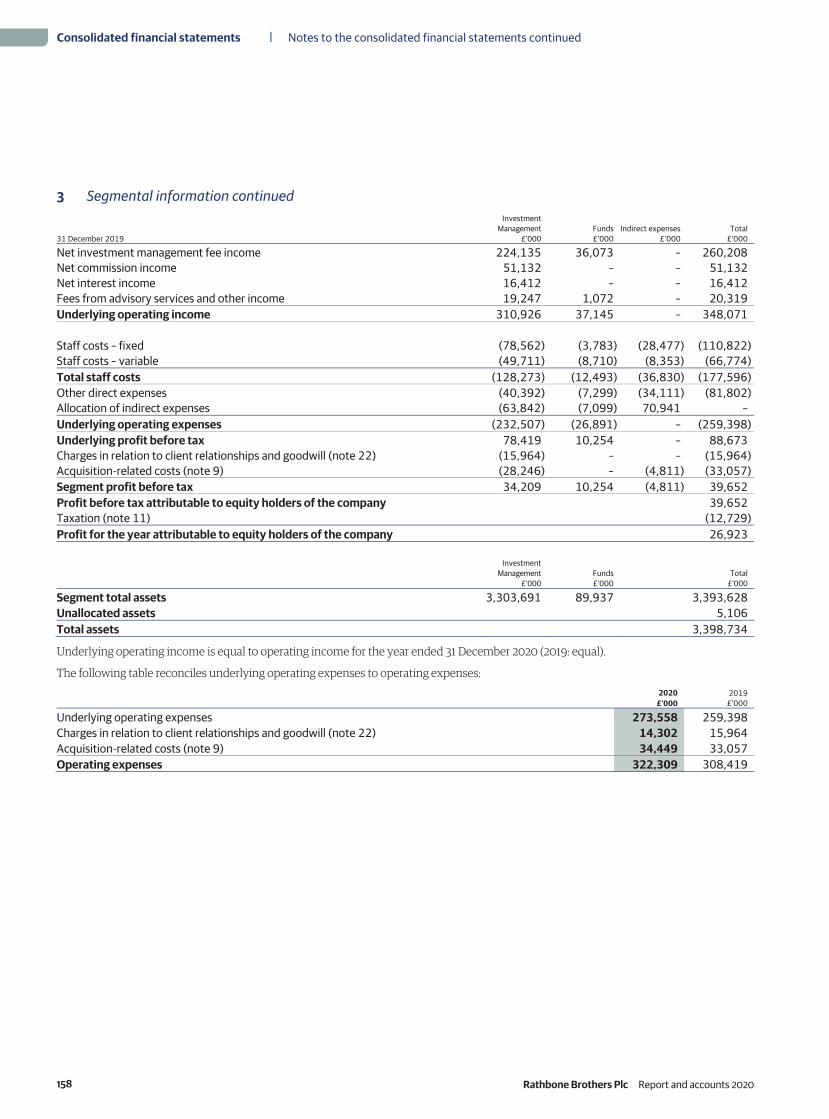
158 Rathbone Brothers Plc Report and accounts 2020
3 Segmental information continued
31 December 2019
InvestmentManagement
£’000 Funds £’000
Indirect expenses£’000
Total£’000
Net investment management fee income 224,135 36,073 – 260,208Net commission income 51,132 – – 51,132Net interest income 16,412 – – 16,412Fees from advisory services and other income 19,247 1,072 – 20,319Underlying operating income 310,926 37,145 – 348,071 Staff costs – fixed (78,562) (3,783) (28,477) (110,822)Staff costs – variable (49,711) (8,710) (8,353) (66,774)Total staff costs (128,273) (12,493) (36,830) (177,596)Other direct expenses (40,392) (7,299) (34,111) (81,802)Allocation of indirect expenses (63,842) (7,099) 70,941 –Underlying operating expenses (232,507) (26,891) – (259,398)Underlying profit before tax 78,419 10,254 – 88,673 Charges in relation to client relationships and goodwill (note 22) (15,964) – – (15,964)Acquisition-related costs (note 9) (28,246) – (4,811) (33,057)Segment profit before tax 34,209 10,254 (4,811) 39,652 Profit before tax attributable to equity holders of the company 39,652 Taxation (note 11) (12,729)Profit for the year attributable to equity holders of the company 26,923
Investment
Management £’000
Funds £’000
Total£’000
Segment total assets 3,303,691 89,937 3,393,628 Unallocated assets 5,106 Total assets 3,398,734
Underlying operating income is equal to operating income for the year ended 31 December 2020 (2019: equal).
The following table reconciles underlying operating expenses to operating expenses:
2020
£’000 2019
£’000
Underlying operating expenses 273,558 259,398 Charges in relation to client relationships and goodwill (note 22) 14,302 15,964 Acquisition-related costs (note 9) 34,449 33,057 Operating expenses 322,309 308,419
Notes to the consolidated financial statements continued
158 Rathbone Brothers Plc Report and accounts 2020
| Consolidated financial statements

158 Rathbone Brothers Plc Report and accounts 2020
3 Segmental information continued
31 December 2019
InvestmentManagement
£’000 Funds £’000
Indirect expenses£’000
Total£’000
Net investment management fee income 224,135 36,073 – 260,208Net commission income 51,132 – – 51,132Net interest income 16,412 – – 16,412Fees from advisory services and other income 19,247 1,072 – 20,319Underlying operating income 310,926 37,145 – 348,071 Staff costs – fixed (78,562) (3,783) (28,477) (110,822)Staff costs – variable (49,711) (8,710) (8,353) (66,774)Total staff costs (128,273) (12,493) (36,830) (177,596)Other direct expenses (40,392) (7,299) (34,111) (81,802)Allocation of indirect expenses (63,842) (7,099) 70,941 –Underlying operating expenses (232,507) (26,891) – (259,398)Underlying profit before tax 78,419 10,254 – 88,673 Charges in relation to client relationships and goodwill (note 22) (15,964) – – (15,964)Acquisition-related costs (note 9) (28,246) – (4,811) (33,057)Segment profit before tax 34,209 10,254 (4,811) 39,652 Profit before tax attributable to equity holders of the company 39,652 Taxation (note 11) (12,729)Profit for the year attributable to equity holders of the company 26,923
Investment
Management £’000
Funds £’000
Total£’000
Segment total assets 3,303,691 89,937 3,393,628 Unallocated assets 5,106 Total assets 3,398,734
Underlying operating income is equal to operating income for the year ended 31 December 2020 (2019: equal).
The following table reconciles underlying operating expenses to operating expenses:
2020
£’000 2019
£’000
Underlying operating expenses 273,558 259,398 Charges in relation to client relationships and goodwill (note 22) 14,302 15,964 Acquisition-related costs (note 9) 34,449 33,057 Operating expenses 322,309 308,419
rathbones.com 159
Geographic analysis The following table presents operating income analysed by the geographical location of the group entity providing the service:
2020
£’000 2019
£’000
United Kingdom 353,712 335,732 Jersey 12,376 12,339 Operating income 366,088 348,071
The following is an analysis of the carrying amount of non-current assets analysed by the geographical location of the assets:
2020
£’000 2019
£’000
United Kingdom 286,409 239,056 Jersey 4,437 4,183 Non-current assets 290,846 243,239
Timing of revenue recognition The following table presents operating income analysed by the timing of revenue recognition of the operating segment providing the service: 2020 2019
Investment Management
£’000 Funds £’000
Investment Management
£’000 Funds£’000
Products and services transferred at a point in time 56,300 (12) 53,599 172 Products and services transferred over time 264,851 44,949 257,327 36,973 Underlying operating income 321,151 44,937 310,926 37,145
Major clients The group is not reliant on any one client or group of connected clients for generation of revenues.
4 Net interest income
2020
£’000 2019
£’000
Interest income Cash and balances with central banks 4,640 11,383 Fair value through profit or loss investment securities 471 1,299 Amortised cost investment securities 5,093 8,557 Loans and advances to banks 1,401 3,328 Loans and advances to customers 3,371 3,986 14,976 28,553 Interest expense Banks and customers (1,686) (7,122)Lease liabilities (3,388) (3,640)Subordinated loan notes (note 28) (902) (1,290)Credit impairment charges (578) (89) (6,554) (12,141)Net interest income 8,422 16,412
With the exception of credit impairment charges, which are calculated as described in note 33, all net interest income is calculated using the effective interest method (note 1.7).
A reconciliation of the interest expense on subordinated loan notes is provided in note 28.
rathbones.com 159

160 Rathbone Brothers Plc Report and accounts 2020
5 Net fee and commission income
2020
£’000 2019
£’000
Fee and commission income Investment Management 327,699 308,119 Funds 50,541 44,400 378,240 352,519 Fee and commission expense Investment Management (19,774) (18,258)Funds (4,717) (5,289) (24,491) (23,547)Net fee and commission income 353,749 328,972
6 Net trading and other operating income
Net trading income Net trading expense of £12,000 comprised Funds net dealing losses. Net trading income of £170,000 recognised in 2019 related to box profits, which ceased from mid-January 2019.
Other operating income Other operating income of £3,929,000 (2019: £2,517,000) comprised gains and losses from fair value through profit or loss equity securities, rental income from sub-leases on certain properties leased by group companies and sundry income.
7 Operating expenses
2020
£’000 2019
£’000
Staff costs (note 10) 195,216 177,596 Depreciation of property, plant and equipment (note 19) 4,382 4,036 Depreciation of right-of-use assets (note 20) 4,860 4,895Amortisation of internally generated intangible assets (note 22) 1,197 919 Amortisation and impairment of purchased software (note 22) 6,488 7,985 Auditor’s remuneration (see below) 897 968 Impairment charges on loans and advances to customers (note 33) 5 4 Rental charge 1,815 2,147 Other 58,698 60,848 Other operating expenses 273,558 259,398 Charges in relation to client relationships and goodwill (note 22) 14,302 15,964 Acquisition-related costs (note 9) 34,449 33,057 Total operating expenses 322,309 308,419
A more detailed analysis of auditor’s remuneration is provided below:
2020
£’000 2019
£’000
Fees payable to the company’s auditor for the audit of the company’s annual financial statements 106 100 Fees payable to the company’s auditor and their associates for other services to the group: – audit of the company’s subsidiaries pursuant to legislation 418 395 – audit-related assurance services 483 469 – other services – 4 1,007 968
Of the above, audit-related services for the year incurred by the prevailing statutory auditor totalled £1,007,000 (2019: £899,000).
Fees payable in 2020 for the audit of the company’s annual financial statements include £110,000 (2019: £91,000) relating to prior-year audit work. In the prior year, this was undertaken by the previous statutory auditor.
Notes to the consolidated financial statements continued
160 Rathbone Brothers Plc Report and accounts 2020
| Consolidated financial statements

160 Rathbone Brothers Plc Report and accounts 2020
5 Net fee and commission income
2020
£’000 2019
£’000
Fee and commission income Investment Management 327,699 308,119 Funds 50,541 44,400 378,240 352,519 Fee and commission expense Investment Management (19,774) (18,258)Funds (4,717) (5,289) (24,491) (23,547)Net fee and commission income 353,749 328,972
6 Net trading and other operating income
Net trading income Net trading expense of £12,000 comprised Funds net dealing losses. Net trading income of £170,000 recognised in 2019 related to box profits, which ceased from mid-January 2019.
Other operating income Other operating income of £3,929,000 (2019: £2,517,000) comprised gains and losses from fair value through profit or loss equity securities, rental income from sub-leases on certain properties leased by group companies and sundry income.
7 Operating expenses
2020
£’000 2019
£’000
Staff costs (note 10) 195,216 177,596 Depreciation of property, plant and equipment (note 19) 4,382 4,036 Depreciation of right-of-use assets (note 20) 4,860 4,895Amortisation of internally generated intangible assets (note 22) 1,197 919 Amortisation and impairment of purchased software (note 22) 6,488 7,985 Auditor’s remuneration (see below) 897 968 Impairment charges on loans and advances to customers (note 33) 5 4 Rental charge 1,815 2,147 Other 58,698 60,848 Other operating expenses 273,558 259,398 Charges in relation to client relationships and goodwill (note 22) 14,302 15,964 Acquisition-related costs (note 9) 34,449 33,057 Total operating expenses 322,309 308,419
A more detailed analysis of auditor’s remuneration is provided below:
2020
£’000 2019
£’000
Fees payable to the company’s auditor for the audit of the company’s annual financial statements 106 100 Fees payable to the company’s auditor and their associates for other services to the group: – audit of the company’s subsidiaries pursuant to legislation 418 395 – audit-related assurance services 483 469 – other services – 4 1,007 968
Of the above, audit-related services for the year incurred by the prevailing statutory auditor totalled £1,007,000 (2019: £899,000).
Fees payable in 2020 for the audit of the company’s annual financial statements include £110,000 (2019: £91,000) relating to prior-year audit work. In the prior year, this was undertaken by the previous statutory auditor.
rathbones.com 161
8 Business combinations
Speirs & Jeffrey On 31 August 2018, the group acquired 100% of the ordinary share capital of Speirs & Jeffrey Limited (‘Speirs & Jeffrey’).
Contingent consideration Contingent consideration of £15,000,000 was paid in May 2019, following the satisfaction of certain operational targets. Of this, £1,050,000 was treated as consideration in the acquisition accounting, as it was paid to vendors who were not required to remain in employment with the group (note 26). The amount paid was equal to what was provided for as at the date of acquisition; therefore, no measurement period adjustment has been reflected against the cost of acquisition. The remaining £13,950,000 was paid to vendors required to remain in employment with the group until the targets were met. Hence, it has been treated as remuneration for post-combination services and the grant date fair value charged to profit and loss. The contingent consideration payment was made 100% in shares (note 31).
Other deferred payments The group continues to provide for the cost of other deferred and contingent payments to be made to vendors for the sale of the shares of Speirs & Jeffrey, as well as related incentivisation awards for other staff. These payments require the vendors to remain in employment with the group for the duration of the respective deferral periods. Hence, they are being treated as remuneration for post-combination services and the grant date fair value is charged to profit and loss over the respective vesting periods.
During the year, the group replaced a share-based incentivisation award for support staff with a cash award. The accumulated charge recognised in equity over the related vesting period has been reversed during the year, and a provision has been recognised at the year end in respect of the cash award. The award is expected to be settled within one year.
The remainder of payments are to be made in shares and are being accounted for as equity-settled share-based payments under IFRS 2:
– initial share consideration was payable on completion. However, although the shares were issued on the date of acquisition, they do not vest until the third anniversary of the acquisition date, subject to the vendors remaining employed until this date
– earn-out consideration and related incentivisation awards are payable in two parts in the third and fourth years following the acquisition date. Payment is subject to the delivery of certain operational and financial performance targets.
Further details of each of these elements is as follows:
Gross amount
£’000 Grant date
Grant date fair value
£’000 Expected vesting date
Initial share consideration 25,000 31 August 2018 23,462 31 August 2021Earn-out consideration and incentivisation awards 44,680 31 August 2018 45,344 31 December 2020/21
The gross amount in respect of the earn-out consideration and incentivisation awards represents management’s best estimate as to the extent to which the performance targets will be achieved (note 2.3).
The charge recognised in profit or loss for the year ended 31 December 2020 for the above elements is as follows:
2020
£’000 2019
£’000
Initial share consideration 9,215 8,402 Contingent consideration – 6,015 Earn-out consideration and incentivisation awards 23,042 9,724 Other deferred awards – 1,885 32,257 26,026
Other deferred awards represent cash amounts paid one year following the acquisition date.
These costs are being reported as staff costs within acquisition-related costs (see note 9).
Barclays Wealth’s Personal Injury and Court of Protection business On 3 April 2020, the group acquired the trade and assets of Barclays Wealth’s Personal Injury and Court of Protection business. The acquired trade relates to the provision of discretionary investment management services to Personal Injury and Court of Protection clients.
Cash consideration of £12,048,000 was transferred on the date of acquisition. The sale and purchase agreement also comprises an employee incentive plan that is payable in two tranches. The awards under this plan are considered to be directly attributable costs of acquiring new client relationships, hence these costs have been capitalised in line with IFRS 15 (note 22).
rathbones.com 161

162 Rathbone Brothers Plc Report and accounts 2020
8 Business combinations continued
Identifiable assets acquired and liabilities assumed The identifiable net assets of the acquired business at the acquisition date were as follows:
Fair value
£’000
Intangible assets 6,890 Deferred tax liabilities (1,309)Total net assets acquired 5,581
The fair value of the client relationship intangible assets has been measured using a multi-period earnings method (note 22). The model uses estimates of client longevity and investment performance to derive a series of cash flows, which are discounted to a present value to determine the fair value of the client relationships acquired. The deferred tax liability arises on recognition of the client relationship intangible assets, and is equal to its carrying value.
Goodwill Goodwill arising from the acquisition has been recognised as follows:
£’000
Total consideration (see above) 12,048 Fair value of identifiable net assets acquired (see above) (5,581) 6,467
Goodwill of £6,467,000 arises as a result of the acquired workforce, expected future growth, and operational synergies arising post integration. The group does not believe there are any key assumptions where reasonable changes could occur which could give rise to a material adjustment in the carrying value.
9 Acquisition-related costs
2020
£’000 2019
£’000
Acquisition of Speirs & Jeffrey 34,273 30,837 Acquisition of Vision and Castle – 2,041 Acquisition of Barclay’s Wealth Personal Injury and Court of Protection business 176 179 Acquisition-related costs 34,449 33,057
Costs relating to the acquisition of Speirs & Jeffrey The group has incurred the following costs in relation to the 2018 acquisition of Speirs & Jeffrey, summarised by the following classification within the income statement:
2020
£’000 2019
£’000
Acquisition costs: – Staff costs (note 10) 32,257 26,026 – Legal and advisory fees 20 103 Integration costs 1,996 4,708 34,273 30,837
Non-staff acquisition costs of £20,000 (2019: £103,000) and integration costs of £1,996,000 (2019: £4,708,000) have not been allocated to a specific operating segment (note 3).
Notes to the consolidated financial statements continued
162 Rathbone Brothers Plc Report and accounts 2020
| Consolidated financial statements

162 Rathbone Brothers Plc Report and accounts 2020
8 Business combinations continued
Identifiable assets acquired and liabilities assumed The identifiable net assets of the acquired business at the acquisition date were as follows:
Fair value
£’000
Intangible assets 6,890 Deferred tax liabilities (1,309)Total net assets acquired 5,581
The fair value of the client relationship intangible assets has been measured using a multi-period earnings method (note 22). The model uses estimates of client longevity and investment performance to derive a series of cash flows, which are discounted to a present value to determine the fair value of the client relationships acquired. The deferred tax liability arises on recognition of the client relationship intangible assets, and is equal to its carrying value.
Goodwill Goodwill arising from the acquisition has been recognised as follows:
£’000
Total consideration (see above) 12,048 Fair value of identifiable net assets acquired (see above) (5,581) 6,467
Goodwill of £6,467,000 arises as a result of the acquired workforce, expected future growth, and operational synergies arising post integration. The group does not believe there are any key assumptions where reasonable changes could occur which could give rise to a material adjustment in the carrying value.
9 Acquisition-related costs
2020
£’000 2019
£’000
Acquisition of Speirs & Jeffrey 34,273 30,837 Acquisition of Vision and Castle – 2,041 Acquisition of Barclay’s Wealth Personal Injury and Court of Protection business 176 179 Acquisition-related costs 34,449 33,057
Costs relating to the acquisition of Speirs & Jeffrey The group has incurred the following costs in relation to the 2018 acquisition of Speirs & Jeffrey, summarised by the following classification within the income statement:
2020
£’000 2019
£’000
Acquisition costs: – Staff costs (note 10) 32,257 26,026 – Legal and advisory fees 20 103 Integration costs 1,996 4,708 34,273 30,837
Non-staff acquisition costs of £20,000 (2019: £103,000) and integration costs of £1,996,000 (2019: £4,708,000) have not been allocated to a specific operating segment (note 3).
rathbones.com 163
Costs relating to the acquisition of Vision Independent Financial Planning and Castle Investment Solutions The group made the final payment in relation to the 2015 acquisition of Vision Independent Financial Planning and Castle Investment Solutions at the end of 2019. The group has incurred the following costs in relation to the 2015 acquisition of Vision Independent Financial Planning and Castle Investment Solutions, summarised by the following classification with the income statement:
2020
£’000 2019
£’000
Staff costs – 1,375 Interest expense – 666 – 2,041
Amounts reported in staff costs relate to deferred payments to previous owners who were required to remain in employment with the acquired companies until payment. The payment was settled at the end of 2019 (see note 26).
Costs relating to the acquisition of Barclays Wealth’s Personal Injury and Court of Protection business On 3 April 2020, the group acquired the trade and assets of Barclays Wealth’s Personal Injury and Court of Protection business. The group incurred professional services costs of £176,000 (2019: £179,000) in relation to the acquisition during the year.
10 Staff costs
2020
£’0002019
£’000
Wages and salaries 153,332 139,577 Social security costs 19,930 18,652 Equity-settled share-based payments 11,276 9,328 Acquisition-related staff costs (note 9) 32,257 26,026 Pension costs (note 29): – Defined benefit schemes 200 255 – Defined contribution schemes 10,478 9,784 10,678 10,039 Total staff costs 227,473 203,622 Acquisition-related staff costs (32,257) (26,026) Underlying staff costs (note 3) 195,216 177,596
The average number of employees, on a full-time-equivalent basis, during the year was as follows:
2020 2019
Investment Management: – investment management services 996 979 – advisory services 123 118 Funds 37 35 Shared services 379 377 1,535 1,509
rathbones.com 163

164 Rathbone Brothers Plc Report and accounts 2020
11 Income tax expense
2020
£’000 2019
£’000
Current tax: – charge for the year 18,247 16,809 – adjustments in respect of prior years (727) (893)Deferred tax (note 21): – credit for the year (1,495) (3,767)– adjustments in respect of prior years 1,102 580 17,127 12,729
The tax charge is calculated based on our best estimate of the amount payable as at the balance sheet date. Any subsequent differences between these estimates and the actual amounts paid are recorded as adjustments in respect of prior years.
The tax charge on profit for the year is higher (2019: higher) than the standard rate of corporation tax in the UK of 19.0% (2019: 19.0%).
The differences are explained below:
2020
£’000 2019
£’000
Tax on profit from ordinary activities at the standard rate of 19.0% (2019: 19.0%) effects of: 8,318 7,534 – disallowable expenses 454 537 – share-based payments 2,228 410 – tax on overseas earnings (225) (233)– adjustments in respect of prior year 375 (313)– deferred payments to previous owners of acquired companies (note 9) 5,455 4,508 – other (49) 22 – Effect of change in corporation tax rate on deferred tax 571 264 17,127 12,729
12 Dividends
2020
£’000 2019
£’000
Amounts recognised as distributions to equity holders in the year: – final dividend for the year ended 31 December 2019 of 45.0p (2018: 42.0p) per share 24,316 22,433 – interim dividend for the year ended 31 December 2020 of 25.0p (2019: 25.0p) per share 13,515 13,526 Dividends paid in the year of 70.0p (2019: 67.0p) per share 37,831 35,959 Proposed final dividend for the year ended 31 December 2020 of 47.0p (2019: 45.0p) per share 25,213 24,188
An interim dividend of 25.0p per share was paid on 6 October 2020 to shareholders on the register at the close of business on 4 September 2020 (2019: 25.0p).
A final dividend declared of 47.0p per share (2019: 45.0p) is payable on 11 May 2021 to shareholders on the register at the close of business on 23 April 2021. The final dividend is subject to approval by shareholders at the Annual General Meeting on 6 May 2021 and has not been included as a liability in these financial statements.
13 Earnings per share Earnings used to calculate earnings per share on the bases reported in these financial statements were:
2020 2019
Pre-tax
£’000 Taxation
£’000 Post-tax
£’000 Pre-tax
£’000 Taxation
£’000 Post-tax
£’000
Underlying profit attributable to shareholders 92,530 (20,928) 71,602 88,673 (17,535) 71,138 Charges in relation to client relationships and goodwill
(note 22) (14,302) 2,717 (11,585) (15,964) 3,033 (12,931)Acquisition-related costs (note 9) (34,449) 1,084 (33,365) (33,057) 1,773 (31,284)Profit attributable to shareholders 43,779 (17,127) 26,652 39,652 (12,729) 26,923
Basic earnings per share has been calculated by dividing profit attributable to shareholders by the weighted average number of shares in issue throughout the year, excluding own shares, of 53,720,680 (2019: 53,566,271).
Notes to the consolidated financial statements continued
164 Rathbone Brothers Plc Report and accounts 2020
| Consolidated financial statements

164 Rathbone Brothers Plc Report and accounts 2020
11 Income tax expense
2020
£’000 2019
£’000
Current tax: – charge for the year 18,247 16,809 – adjustments in respect of prior years (727) (893)Deferred tax (note 21): – credit for the year (1,495) (3,767)– adjustments in respect of prior years 1,102 580 17,127 12,729
The tax charge is calculated based on our best estimate of the amount payable as at the balance sheet date. Any subsequent differences between these estimates and the actual amounts paid are recorded as adjustments in respect of prior years.
The tax charge on profit for the year is higher (2019: higher) than the standard rate of corporation tax in the UK of 19.0% (2019: 19.0%).
The differences are explained below:
2020
£’000 2019
£’000
Tax on profit from ordinary activities at the standard rate of 19.0% (2019: 19.0%) effects of: 8,318 7,534 – disallowable expenses 454 537 – share-based payments 2,228 410 – tax on overseas earnings (225) (233)– adjustments in respect of prior year 375 (313)– deferred payments to previous owners of acquired companies (note 9) 5,455 4,508 – other (49) 22 – Effect of change in corporation tax rate on deferred tax 571 264 17,127 12,729
12 Dividends
2020
£’000 2019
£’000
Amounts recognised as distributions to equity holders in the year: – final dividend for the year ended 31 December 2019 of 45.0p (2018: 42.0p) per share 24,316 22,433 – interim dividend for the year ended 31 December 2020 of 25.0p (2019: 25.0p) per share 13,515 13,526 Dividends paid in the year of 70.0p (2019: 67.0p) per share 37,831 35,959 Proposed final dividend for the year ended 31 December 2020 of 47.0p (2019: 45.0p) per share 25,213 24,188
An interim dividend of 25.0p per share was paid on 6 October 2020 to shareholders on the register at the close of business on 4 September 2020 (2019: 25.0p).
A final dividend declared of 47.0p per share (2019: 45.0p) is payable on 11 May 2021 to shareholders on the register at the close of business on 23 April 2021. The final dividend is subject to approval by shareholders at the Annual General Meeting on 6 May 2021 and has not been included as a liability in these financial statements.
13 Earnings per share Earnings used to calculate earnings per share on the bases reported in these financial statements were:
2020 2019
Pre-tax
£’000 Taxation
£’000 Post-tax
£’000 Pre-tax
£’000 Taxation
£’000 Post-tax
£’000
Underlying profit attributable to shareholders 92,530 (20,928) 71,602 88,673 (17,535) 71,138 Charges in relation to client relationships and goodwill
(note 22) (14,302) 2,717 (11,585) (15,964) 3,033 (12,931)Acquisition-related costs (note 9) (34,449) 1,084 (33,365) (33,057) 1,773 (31,284)Profit attributable to shareholders 43,779 (17,127) 26,652 39,652 (12,729) 26,923
Basic earnings per share has been calculated by dividing profit attributable to shareholders by the weighted average number of shares in issue throughout the year, excluding own shares, of 53,720,680 (2019: 53,566,271).
rathbones.com 165
Diluted earnings per share is the basic earnings per share, adjusted for the effect of contingently issuable shares under the Speirs & Jeffrey initial share consideration and Executive Incentive Plan, employee share options remaining capable of exercise, and any dilutive shares to be issued under the Share Incentive Plan, all weighted for the relevant period:
2020 2019
Weighted average number of ordinary shares in issue during the year – basic 53,720,680 53,566,271 Effect of ordinary share options/Save As You Earn 231,259 97,495 Effect of dilutive shares issuable under the Share Incentive Plan 73,990 570 Effect of contingently issuable shares under the Executive Incentive Plan 929,457 574,393 Effect of contingently issuable shares under Speirs & Jeffrey initial share consideration (note 8) 1,006,522 1,006,522 Diluted ordinary shares 55,961,908 55,245,251
2020 2019
Earnings per share for the year attributable to equity holders of the company: – basic 49.6p 50.3p – diluted 47.6p 48.7p Underlying earnings per share for the year attributable to equity holders of the company: – basic 133.3p 132.8p – diluted 127.9p 128.8p
Underlying earnings per share is calculated in the same way as earnings per share, but by reference to underlying profit attributable to shareholders.
14 Cash and balances with central banks
2020
£’000 2019
£’000
Cash in hand – 1 Balances with central banks 1,803,434 1,933,218 Less impairment loss allowance (728) (222) 1,802,706 1,932,997
The fair value of balances with central banks is not materially different from their carrying amount.
2020
£’000 2019
£’000
Repayable: – on demand 1,798,000 1,930,000 – within 1 year but over 3 months 5,434 3,219 Less impairment loss allowance (728) (222) 1,802,706 1,932,997 Amounts include balances: – with variable interest rates 1,798,000 1,930,000 – which are non-interest-bearing 5,434 3,219 Less impairment loss allowance (728) (122)
1,802,706 1,932,997
The group’s exposure to credit risk arising from cash and balances with central banks is described in note 33.
rathbones.com 165

166 Rathbone Brothers Plc Report and accounts 2020
15 Loans and advances to banks
2020
£’000 2019
£’000
Current accounts 149,432 107,839 Fixed term deposits 10,000 70,000 Less impairment loss allowance (2) (7) 159,430 177,832
2020
£’000 2019
£’000
Repayable: – on demand 149,432 107,839 – within 3 months or less excluding on demand 10,000 10,000 – within 1 year but over 3 months – 60,000 Less impairment loss allowance (2) (7) 159,430 177,832 Amounts include loans and advances: – with variable interest rates 149,182 107,556 – with fixed interest rates 10,000 70,000 – which are non-interest-bearing 250 283 Less impairment loss allowance (2) (7) 159,430 177,832
The fair value of loans and advances is not materially different to their carrying amount. Fair value has been calculated as the discounted amount of estimated future cash flows expected to be received using current market rates.
Loans and advances to banks included in cash and cash equivalents at 31 December 2020 were £159,432,000 (note 38) (2019: £117,839,000).
The group’s exposure to credit risk arising from loans and advances to banks is described in note 33.
16 Loans and advances to customers
2020
£’000 2019
£’000
Overdrafts 6,384 5,148 Investment management loan book 157,957 132,034 Trust and financial planning debtors 1,425 1,273 Other debtors 557 60 Less impairment loss allowance (102) (103) 166,221 138,412
The fair value of loans and advances to customers is not materially different to their carrying amount. Fair value has been calculated as the discounted amount of estimated future cash flows expected to be received using current market rates. Debtors arising from the trust and financial planning businesses are non-interest-bearing.
2020
£’000 2019
£’000
Repayable: – on demand 7,185 5,393 – within 3 months or less excluding on demand 3,545 20,692 – within 1 year but over 3 months 107 54,389 – within 5 years but over 1 year 155,486 58,041 Less impairment loss allowance (102) (103) 166,221 138,412 Amounts include loans and advances: – with variable interest rates 164,229 136,680 – which are non-interest-bearing 2,094 1,835 Less impairment loss allowance (102) (103) 166,221 138,412
The group’s exposure to credit risk arising from loans and advances to customers is described in note 33.
Notes to the consolidated financial statements continued
166 Rathbone Brothers Plc Report and accounts 2020
| Consolidated financial statements

166 Rathbone Brothers Plc Report and accounts 2020
15 Loans and advances to banks
2020
£’000 2019
£’000
Current accounts 149,432 107,839 Fixed term deposits 10,000 70,000 Less impairment loss allowance (2) (7) 159,430 177,832
2020
£’000 2019
£’000
Repayable: – on demand 149,432 107,839 – within 3 months or less excluding on demand 10,000 10,000 – within 1 year but over 3 months – 60,000 Less impairment loss allowance (2) (7) 159,430 177,832 Amounts include loans and advances: – with variable interest rates 149,182 107,556 – with fixed interest rates 10,000 70,000 – which are non-interest-bearing 250 283 Less impairment loss allowance (2) (7) 159,430 177,832
The fair value of loans and advances is not materially different to their carrying amount. Fair value has been calculated as the discounted amount of estimated future cash flows expected to be received using current market rates.
Loans and advances to banks included in cash and cash equivalents at 31 December 2020 were £159,432,000 (note 38) (2019: £117,839,000).
The group’s exposure to credit risk arising from loans and advances to banks is described in note 33.
16 Loans and advances to customers
2020
£’000 2019
£’000
Overdrafts 6,384 5,148 Investment management loan book 157,957 132,034 Trust and financial planning debtors 1,425 1,273 Other debtors 557 60 Less impairment loss allowance (102) (103) 166,221 138,412
The fair value of loans and advances to customers is not materially different to their carrying amount. Fair value has been calculated as the discounted amount of estimated future cash flows expected to be received using current market rates. Debtors arising from the trust and financial planning businesses are non-interest-bearing.
2020
£’000 2019
£’000
Repayable: – on demand 7,185 5,393 – within 3 months or less excluding on demand 3,545 20,692 – within 1 year but over 3 months 107 54,389 – within 5 years but over 1 year 155,486 58,041 Less impairment loss allowance (102) (103) 166,221 138,412 Amounts include loans and advances: – with variable interest rates 164,229 136,680 – which are non-interest-bearing 2,094 1,835 Less impairment loss allowance (102) (103) 166,221 138,412
The group’s exposure to credit risk arising from loans and advances to customers is described in note 33.
rathbones.com 167
17 Investment securities
Fair value through profit or loss
2020
£’000 2019
£’000
Equity securities: – listed 5,728 4,587 – unlisted 2,569 1,186Money market funds: – unlisted 99,262 100,194 107,559 105,967
Amortised cost
2020
£’000 2019
£’000
Debt securities: – unlisted 651,533 600,291 Less impairment loss allowance (106) (30) 651,427 600,261
Debt securities comprise certificates of deposit and are all due to mature within one year (2019: all).
Fair value through profit or loss securities include money market funds and direct holdings in equity securities. Equity securities comprises units in Rathbone Unit Trust Management managed funds and Euroclear shares. Equity securities do not bear interest. Money market funds, which declare daily dividends that are in the nature of interest at a variable rate and which are realisable on demand, have been included within cash equivalents (note 38).
The fair value of debt securities is disclosed in note 33.
The change in the group’s holdings of investment securities in the year is summarised below.
Fair value through
profit or loss £’000
Amortisedcost
£’000 Total
£’000
At 1 January 2019 79,797 907,225 987,022Additions 62,255 754,058 816,313Disposals (sales and redemptions) (35,276) (1,058,874) (1,094,150)Foreign exchange movements (1,219) (2,152) (3,371)Gain from changes in fair value 410 – 410 Increase in impairment loss allowance – 4 4At 1 January 2020 105,967 600,261 706,228Additions 1,063 885,783 886,846Disposals (sales and redemptions) (417) (833,295) (833,712)Foreign exchange movements (386) (1,245) (1,631)Gain from changes in fair value 1,332 – 1,332 Decrease in impairment loss allowance – (77) (77)At 31 December 2020 107,559 651,427 758,986
Included within amortised cost are additions of £1,063,000 (2019: £900,000) and £417,000 (2019: nil) of disposals of financial instruments that are not classified as cash and cash equivalents.
18 Prepayments, accrued income and other assets
2020
£’000 2019
£’000
Work in progress 3,526 3,608 Prepayments and other assets 16,191 21,531 Accrued income 78,997 70,251 98,714 95,390
rathbones.com 167

168 Rathbone Brothers Plc Report and accounts 2020
19 Property, plant and equipment
Short term leasehold
improvements £’000
Plant andequipment
£’000 Total
£’000
Cost At 1 January 2019 21,492 21,101 42,593Additions 1,294 1,761 3,055Disposals (1,077) (1,250) (2,327)At 1 January 2020 21,709 21,612 43,321Additions 900 2,896 3,796Disposals – (819) (819)At 31 December 2020 22,609 23,689 46,298Depreciation At 1 January 2019 8,667 17,088 25,755Charge for the year 2,012 2,211 4,223Disposals (848) (1,241) (2,089)At 1 January 2020 9,831 18,058 27,889Charge for the year 1,950 2,432 4,382Disposals – (819) (819)At 31 December 2020 11,781 19,671 31,452Carrying amount at 31 December 2020 10,828 4,018 14,846Carrying amount at 31 December 2019 11,878 3,554 15,432Carrying amount at 1 January 2019 12,825 4,013 16,838
The group has considered the future impact of climate change when reviewing the useful economic lives of its property, plant and equipment. No reasonably foreseeable change would result in a material change to the carrying amount of the assets.
There was no indication of impairment from the impact of COVID-19 during the year.
20 Right-of-use assets
Property £’000
Motor vehicles and equipment
£’000 Total
£’000
Cost At 1 January 2019 53,806 40 53,846 Additions 603 17 620 Disposals – (40) (40)Other movements (134) 24 (110)At 1 January 2020 54,275 41 54,316 Additions 258 – 258 Disposals (42) – (42)Other movements (23) – (23)At 31 December 2020 54,468 41 54,509 Depreciation and impairment 1 January 2019 – – – Charge for the year 4,841 54 4,895 Disposals – (40) (40)Other movements (19) – (19)At 1 January 2020 4,822 14 4,836 Charge for the year 4,845 14 4,859 Other movements (42) – (42)At 31 December 2020 9,625 28 9,653 Carrying amount at 31 December 2020 44,843 13 44,856 Carrying amount at 31 December 2019 49,453 27 49,480
Notes to the consolidated financial statements continued
168 Rathbone Brothers Plc Report and accounts 2020
| Consolidated financial statements

168 Rathbone Brothers Plc Report and accounts 2020
19 Property, plant and equipment
Short term leasehold
improvements £’000
Plant andequipment
£’000 Total
£’000
Cost At 1 January 2019 21,492 21,101 42,593Additions 1,294 1,761 3,055Disposals (1,077) (1,250) (2,327)At 1 January 2020 21,709 21,612 43,321Additions 900 2,896 3,796Disposals – (819) (819)At 31 December 2020 22,609 23,689 46,298Depreciation At 1 January 2019 8,667 17,088 25,755Charge for the year 2,012 2,211 4,223Disposals (848) (1,241) (2,089)At 1 January 2020 9,831 18,058 27,889Charge for the year 1,950 2,432 4,382Disposals – (819) (819)At 31 December 2020 11,781 19,671 31,452Carrying amount at 31 December 2020 10,828 4,018 14,846Carrying amount at 31 December 2019 11,878 3,554 15,432Carrying amount at 1 January 2019 12,825 4,013 16,838
The group has considered the future impact of climate change when reviewing the useful economic lives of its property, plant and equipment. No reasonably foreseeable change would result in a material change to the carrying amount of the assets.
There was no indication of impairment from the impact of COVID-19 during the year.
20 Right-of-use assets
Property £’000
Motor vehicles and equipment
£’000 Total
£’000
Cost At 1 January 2019 53,806 40 53,846 Additions 603 17 620 Disposals – (40) (40)Other movements (134) 24 (110)At 1 January 2020 54,275 41 54,316 Additions 258 – 258 Disposals (42) – (42)Other movements (23) – (23)At 31 December 2020 54,468 41 54,509 Depreciation and impairment 1 January 2019 – – – Charge for the year 4,841 54 4,895 Disposals – (40) (40)Other movements (19) – (19)At 1 January 2020 4,822 14 4,836 Charge for the year 4,845 14 4,859 Other movements (42) – (42)At 31 December 2020 9,625 28 9,653 Carrying amount at 31 December 2020 44,843 13 44,856 Carrying amount at 31 December 2019 49,453 27 49,480
rathbones.com 169
There was no indication of impairment of the group’s right-of-use assets as a result of COVID-19 during the year.
The group recognised a charge of £43,000 in profit or loss during the year in respect of short-term leases and low-value assets (2019: £371,000).
21 Net deferred tax asset/ (liability) The UK Government legislated in the Finance Act 2020 to maintain the UK corporation tax rate at 19.0% from 1 April 2020, rather than reducing the rate to 17.0% as previously enacted. The Finance Act 2020 was enacted on 22 July 2020. Deferred income taxes are calculated on all temporary differences under the liability method using the rate expected to apply when the relevant timing differences are forecast to unwind.
The budget on 3 March 2021 signalled an increase in the UK corporation tax rate to 25.0% in 2023. This will be reflected in the deferred tax calculations when the change is enacted.
The movement on the deferred tax account is as follows:
Deferred capital
allowances £’000
Pensions £’000
Share-based payments
£’000
Staff-related
costs£’000
Fair value through
profit or loss £’000
Intangible assets £’000
Total £’000
As at 1 January 2020 1,964 1,360 3,545 4,996 (304) (8,925) 2,636Recognised in profit or loss in respect of: – current year 405 (553) 398 1,327 (360) 848 2,065– prior year 31 – 22 (1,155) – – (1,102)– change in rate 234 (618) 445 456 (37) (1,050) (570)Total 670 (1,171) 865 628 (397) (202) 393 Recognised in other comprehensive
income in respect of: – current year – 890 – – – – 890 – prior year – – – – – – – – change in rate – 778 – – – – 778Total – 1,668 – – – – 1,668 Recognised in equity in respect of: – current year – – (36) – – – (36)– prior year – – (17) – – – (17)– change in rate – – 7 – – – 7 Total – – (46) – – – (46) Business combinations – – – – – (1,309) (1,309)Total – – – – – (1,309) (1,309) As at 31 December 2020 2,634 1,857 4,364 5,624 (701) (10,436) 3,342
Deferred capital
allowances £’000
Pensions £’000
Share-based payments
£’000
Staff-related
costs£’000
Fair value through
profit or loss £’000
Intangible assets £’000
Total £’000
Deferred tax assets 2,634 1,857 4,364 5,624 – – 14,479 Deferred tax liabilities – – – – (701) (10,436) (11,137)As at 31 December 2020 2,634 1,857 4,364 5,624 (701) (10,436) 3,342
rathbones.com 169

170 Rathbone Brothers Plc Report and accounts 2020
21 Net deferred tax asset/ (liability) continued
Deferredcapital
allowances£’000
Pensions£’000
Share-basedpayments
£’000
Staff-related
costs£’000
Fair value through
profit or loss £’000
Intangibleassets£’000
Total£’000
As at 1 January 2019 1,319 1,902 1,882 4,209 (154) (9,639) (481)Recognised in profit or loss in respect of: – current year 584 (546) 1,586 1,770 (160) 798 4,032 – prior year 123 – 94 (797) – – (580)– change in rate (62) 57 – (186) 10 (84) (265)Total 645 (489) 1,680 787 (150) 714 3,187 Recognised in other comprehensive income in
respect of: – current year – (59) – – – – (59)– prior year – – – – – – –– change in rate – 6 – – – – 6 Total – (53) – – – – (53) Recognised in equity in respect of: – current year – – (17) – – – (17)– prior year – – – – – – –– change in rate – – – – – – – Total – – (17) – – – (17) As at 31 December 2019 1,964 1,360 3,545 4,996 (304) (8,925) 2,636
Deferredcapital
allowances£’000
Pensions£’000
Share-basedpayments
£’000
Staff-related
costs£’000
Fair value through
profit or loss £’000
Intangibleassets£’000
Total£’000
Deferred tax assets 1,964 1,360 3,545 4,996 – – 11,865Deferred tax liabilities – – – – (304) (8,925) (9,229)As at 31 December 2019 1,964 1,360 3,545 4,996 (304) (8,925) 2,636
Notes to the consolidated financial statements continued
170 Rathbone Brothers Plc Report and accounts 2020
| Consolidated financial statements

170 Rathbone Brothers Plc Report and accounts 2020
21 Net deferred tax asset/ (liability) continued
Deferredcapital
allowances£’000
Pensions£’000
Share-basedpayments
£’000
Staff-related
costs£’000
Fair value through
profit or loss £’000
Intangibleassets£’000
Total£’000
As at 1 January 2019 1,319 1,902 1,882 4,209 (154) (9,639) (481)Recognised in profit or loss in respect of: – current year 584 (546) 1,586 1,770 (160) 798 4,032 – prior year 123 – 94 (797) – – (580)– change in rate (62) 57 – (186) 10 (84) (265)Total 645 (489) 1,680 787 (150) 714 3,187 Recognised in other comprehensive income in
respect of: – current year – (59) – – – – (59)– prior year – – – – – – –– change in rate – 6 – – – – 6 Total – (53) – – – – (53) Recognised in equity in respect of: – current year – – (17) – – – (17)– prior year – – – – – – –– change in rate – – – – – – – Total – – (17) – – – (17) As at 31 December 2019 1,964 1,360 3,545 4,996 (304) (8,925) 2,636
Deferredcapital
allowances£’000
Pensions£’000
Share-basedpayments
£’000
Staff-related
costs£’000
Fair value through
profit or loss £’000
Intangibleassets£’000
Total£’000
Deferred tax assets 1,964 1,360 3,545 4,996 – – 11,865Deferred tax liabilities – – – – (304) (8,925) (9,229)As at 31 December 2019 1,964 1,360 3,545 4,996 (304) (8,925) 2,636
rathbones.com 171
22 Intangible assets
2020
£’000 2019
£’000
Goodwill 96,872 90,405 Other intangible assets 134,272 137,402 231,144 227,807
Goodwill Goodwill acquired in a business combination is allocated, at acquisition, to the groups of cash-generating units (CGUs) that are expected to benefit from that business combination. During 2019, the group revised its methodology by which it defines its CGUs and how it allocates goodwill to groups of CGUs. This resulted in goodwill of £227,000 previously allocated to the Rooper & Whately CGU being reallocated to the Investment Management group of CGUs.
Under this methodology, the carrying amount of goodwill has been allocated as follows:
Investment Management
£’000 Trust
£’000 Total
£’000
Cost At 1 January 2019 and 1 January 2020 90,405 1,954 92,359Acquired through business combinations 6,467 – 6,467At 31 December 2020 96,872 1,954 98,826Impairment At 1 January 2019 – 1,359 1,359Charge in the year – 595 595At 1 January 2020 – 1,954 1,954Charge in the year – – –At 31 December 2020 – 1,954 1,954Carrying amount at 31 December 2020 96,872 – 96,872Carrying amount at 31 December 2019 90,405 – 90,405Carrying amount at 1 January 2019 90,405 595 91,000
Goodwill acquired through business combinations in the period relates to the acquisition of the Barclays Wealth’s Personal Injury and Court of Protection business (note 8). This has been allocated to the Investment Management group of CGUs. The group does not believe there are any key assumptions where reasonable changes could occur which could give rise to a material adjustment in the carrying value.
Impairment The recoverable amounts of the groups of CGUs to which goodwill is allocated are assessed using value-in-use calculations. The group prepares cash flow forecasts derived from the most recent financial budgets approved by the board, covering the forthcoming and future years. Budgets are extrapolated for five years based on annual revenue and cost growth for each group of CGUs (see table below), as well as the group’s expectation of future industry growth rates. A five-year extrapolation period is chosen as this aligns with the period covered by the group’s ICAAP modelling. A terminal growth rate is applied to year five cash flows, which takes into account the net growth forecasts over the extrapolation period and the long-term average growth rate for the industry. The group estimates discount rates using pre-tax rates that reflect current market assessments of the time value of money and the risks specific to the group of CGUs.
The pre-tax rate used to discount the forecast cash flows for each group of CGU is shown in the table below; these are based on a risk-adjusted weighted average cost of capital. The group judges that these discount rates appropriately reflect the markets in which each group of CGUs operate.
There was no impairment to the goodwill allocated to the Investment Management group of CGUs during the period. The group has considered any reasonably foreseeable changes to the assumptions used in the value-in-use calculation for the Investment Management group of CGUs, including the impact of climate change and COVID-19 to its cash flow projections and the level of risk associated with those cash flows. Based on this assessment, no such change would result in an impairment of the goodwill allocated to this CGU.
During the year ended 31 December 2019, the group recognised an impairment charge of £595,000 in relation to goodwill allocated to the Trust group of CGUs. The recoverable amount of the group of CGUs was lower than the carrying value, which reflected the fact that the business associated with this goodwill is contracting. This reduced the carrying value of the goodwill allocated to the Trust group of CGUs in 2019 to £nil.
rathbones.com 171

172 Rathbone Brothers Plc Report and accounts 2020
22 Intangible assets continued Investment Management Trust
At 31 December 2020 2019 2020 2019
Discount rate 12.2% 8.7% - 10.7% Annual revenue growth rate 5.0% 3.0% - (1.0)% Terminal growth rate 1.0% (2.0)% - (3.0)%
Other intangible assets
Clientrelationships
£’000
Software development
costs £’000
Purchasedsoftware
£’000 Total
£’000
Cost At 1 January 2019 203,617 7,209 36,887 247,713Internally developed in the year – 1,485 – 1,485Purchased in the year 5,269 – 7,012 12,281Disposals (1,750) (512) (2,751) (5,013)At 1 January 2020 207,136 8,182 41,148 256,466Internally developed in the year – 1,613 – 1,613Acquired through business combinations (note 8) 6,890 – – 6,890Purchased in the year 4,085 – 6,269 10,354Disposals (1,858) – (1,228) (3,086)At 31 December 2020 216,253 9,795 46,189 272,237Amortisation and impairment At 1 January 2019 69,061 5,215 25,519 99,795Impairment charge – 415 2,727 3,142Amortisation charge 15,369 919 4,843 21,131Disposals (1,750) (512) (2,742) (5,004)At 1 January 2020 82,680 6,037 30,347 119,064Impairment charge – – – –Amortisation charge 14,302 1,197 6,488 21,987Disposals (1,858) – (1,228) (3,086)At 31 December 2020 95,124 7,234 35,607 137,965Carrying amount at 31 December 2020 121,129 2,561 10,582 134,272Carrying amount at 31 December 2019 124,456 2,145 10,801 137,402Carrying amount at 1 January 2019 134,556 1,994 11,368 147,918
Client relationships of £6,890,000 acquired through business combinations in the period relate to the acquisition of the Barclays Wealth’s Personal Injury and Court of Protection business (note 8).
Purchases of client relationships of £4,085,000 (2019: £5,269,000) in the year relate to payments made to investment managers and third parties for the introduction of client relationships.
The total amount charged to profit or loss in the year in relation to goodwill and client relationships was £14,302,000 (2019: £15,369,000).
Purchased software with a cost of £23,803,000 (2019: £20,373,000) has been fully amortised but is still in use.
23 Deposits by banks On 31 December 2020, deposits by banks included overnight cash book overdraft balances of £893,000 (2019: £28,000).
The fair value of deposits by banks was not materially different to their carrying value. Fair value has been calculated as the discounted amount of estimated future cash flows expected to be paid using current market rates.
Notes to the consolidated financial statements continued
172 Rathbone Brothers Plc Report and accounts 2020
| Consolidated financial statements

172 Rathbone Brothers Plc Report and accounts 2020
22 Intangible assets continued Investment Management Trust
At 31 December 2020 2019 2020 2019
Discount rate 12.2% 8.7% - 10.7% Annual revenue growth rate 5.0% 3.0% - (1.0)% Terminal growth rate 1.0% (2.0)% - (3.0)%
Other intangible assets
Clientrelationships
£’000
Software development
costs £’000
Purchasedsoftware
£’000 Total
£’000
Cost At 1 January 2019 203,617 7,209 36,887 247,713Internally developed in the year – 1,485 – 1,485Purchased in the year 5,269 – 7,012 12,281Disposals (1,750) (512) (2,751) (5,013)At 1 January 2020 207,136 8,182 41,148 256,466Internally developed in the year – 1,613 – 1,613Acquired through business combinations (note 8) 6,890 – – 6,890Purchased in the year 4,085 – 6,269 10,354Disposals (1,858) – (1,228) (3,086)At 31 December 2020 216,253 9,795 46,189 272,237Amortisation and impairment At 1 January 2019 69,061 5,215 25,519 99,795Impairment charge – 415 2,727 3,142Amortisation charge 15,369 919 4,843 21,131Disposals (1,750) (512) (2,742) (5,004)At 1 January 2020 82,680 6,037 30,347 119,064Impairment charge – – – –Amortisation charge 14,302 1,197 6,488 21,987Disposals (1,858) – (1,228) (3,086)At 31 December 2020 95,124 7,234 35,607 137,965Carrying amount at 31 December 2020 121,129 2,561 10,582 134,272Carrying amount at 31 December 2019 124,456 2,145 10,801 137,402Carrying amount at 1 January 2019 134,556 1,994 11,368 147,918
Client relationships of £6,890,000 acquired through business combinations in the period relate to the acquisition of the Barclays Wealth’s Personal Injury and Court of Protection business (note 8).
Purchases of client relationships of £4,085,000 (2019: £5,269,000) in the year relate to payments made to investment managers and third parties for the introduction of client relationships.
The total amount charged to profit or loss in the year in relation to goodwill and client relationships was £14,302,000 (2019: £15,369,000).
Purchased software with a cost of £23,803,000 (2019: £20,373,000) has been fully amortised but is still in use.
23 Deposits by banks On 31 December 2020, deposits by banks included overnight cash book overdraft balances of £893,000 (2019: £28,000).
The fair value of deposits by banks was not materially different to their carrying value. Fair value has been calculated as the discounted amount of estimated future cash flows expected to be paid using current market rates.
rathbones.com 173
24 Due to customers
2020
£’000 2019
£’000
Repayable: – on demand 2,453,676 2,500,578 – within 3 months or less excluding on demand 106,699 160,098 – within 1 year or less but over 3 months 1,392 7,969 2,561,767 2,668,645 Amounts include balances: – with variable interest rates 2,445,377 2,500,378 – with fixed interest rates 66,776 91,639 – which are non-interest-bearing 49,614 76,628 2,561,767 2,668,645
The fair value of amounts due to customers was not materially different from their carrying value. The estimated fair value of deposits with no stated maturity, which include non-interest-bearing deposits, is the amount at which deposits could be transferred to a third party at the measurement date. The estimated fair value of fixed-interest-bearing deposits is based on discounted cash flows using interest rates for new debts with similar remaining maturity.
25 Accruals, deferred income, provisions and other liabilities
2020
£’000 2019
£’000
Trade creditors 785 4,001 Other creditors 20,766 7,680 Accruals 81,805 72,850 Other provisions (note 26) 8,715 8,732 112,071 93,263
26 Other provisions
Deferred,variable costs
to acquire clientrelationshipintangibles
£’000
Deferred andcontingent
considerationin business
combinations£’000
Legal and compensation
£’000
Property-related£’000
Total£’000
At 1 January 2019 1,061 2,378 809 7,536 11,784 Charged to profit or loss – – 2,852 1,350 4,202 Unused amount credited to profit or loss – – (320) (310) (630) Net charge to profit or loss – – 2,532 1,040 3,572 Other movements 5,269 179 – – 5,448 Utilised/paid during the year (5,011) (2,557) (1,166) (3,338) (12,072) At 1 January 2020 1,319 – 2,175 5,238 8,732 Charged to profit or loss 588 639 (642) 585 Unused amount credited to profit or loss – – (419) (23) (442) Net charge to profit or loss – 588 220 (665) 143 Other movements 3,857 – – – 3,857 Utilised/paid during the year (1,391) – (1,801) (825) (4,017) At 31 December 2020 3,785 588 594 3,748 8,715 Payable within 1 year 1,289 588 594 – 2,471 Payable after 1 year 2,496 – – 3,748 6,244 3,785 588 594 3,748 8,715
rathbones.com 173

174 Rathbone Brothers Plc Report and accounts 2020
Deferred, variable costs to acquire client relationship intangibles Other movements in provisions relate to deferred payments to investment managers and third parties for the introduction of client relationships, which have been capitalised in the year.
Deferred and contingent consideration in business combinations Following the satisfaction of certain operational targets, contingent consideration of £1,050,000 was paid to vendors of Speirs & Jeffrey in May 2019 (see note 8). In addition, contingent consideration of £1,507,000 was paid in October 2019 in respect of the acquisition of Vision Independent Financial Planning and Castle Investment Solutions.
Legal and compensation During the ordinary course of business the group may, from time to time, be subject to complaints, as well as threatened and actual legal proceedings (which may include lawsuits brought on behalf of clients or other third parties) both in the UK and overseas. Any such material matters are periodically reassessed, with the assistance of external professional advisers where appropriate, to determine the likelihood of the group incurring a liability. In those instances where it is concluded that it is more likely than not that a payment will be made, a provision is established to the group’s best estimate of the amount required to settle the obligation at the relevant balance sheet date. The timing of settlement of provisions for client compensation or litigation is dependent, in part, on the duration of negotiations with third parties.
Property-related Property-related provisions of £3,748,000 relate to dilapidation provisions expected to arise on leasehold premises held by the group (2019: £5,238,000). Prior-year balances also included monies due under the contract with the assignee of leases on the group’s former property at 1 Curzon Street, which was fully utilised in the year.
Dilapidation provisions are calculated using a discounted cash flow model; during the year ended 31 December 2020, dilapidation provisions decreased by £645,000 (2019: increased by £677,000). The group utilised £825,000 (2019: £3,338,000) of the dilapidations provision held for the surplus property at 1 Curzon Street during the year. The impact of discounting led to an additional credit of £645,000 (2019: additional charge of £1,364,000) being recognised during the year.
Amounts payable after one year Property-related provisions of £3,748,000 are expected to be settled within 13 years of the balance sheet date, which corresponds to the longest lease for which a dilapidations provision is being held. Remaining provisions payable after one year are expected to be settled within three years of the balance sheet date.
27 Lease liabilities
Maturity analysis 2020
£’000 2019
£’000
Less than one year 4,869 5,126 One to five years 19,307 19,193 More than five years 31,948 36,685 Lease liabilities at 31 December 56,124 61,004 Current 4,869 5,126 Non-current 51,255 55,878 56,124 61,004
28 Subordinated loan notes
2020
£’000 2019
£’000
Subordinated loan notes – face value 20,000 20,000 – carrying value 19,768 19,927
Subordinated loan notes consist of 10-year Tier 2 notes (‘Notes’), which are repayable in August 2025. Interest was payable at a fixed rate of 5.856% until the first call option date in August 2020, which the group chose not to exercise. At this date, the gross carrying amount of the loan notes was recalculated as the present value of the contractual cash flows modified for the extension and discounted at the original effective interest rate. A one-off gain to profit or loss of £393,000 was subsequently recognised in the year.
The loan notes now have a call option in August 2021 and annually thereafter at a fixed margin of 4.375% over six-month LIBOR. An interest expense of £1,294,000 (2019: £1,290,000) was recognised in the year, and has been offset against the one-off gain above (see note 4).
Notes to the consolidated financial statements continued
174 Rathbone Brothers Plc Report and accounts 2020
| Consolidated financial statements

174 Rathbone Brothers Plc Report and accounts 2020
Deferred, variable costs to acquire client relationship intangibles Other movements in provisions relate to deferred payments to investment managers and third parties for the introduction of client relationships, which have been capitalised in the year.
Deferred and contingent consideration in business combinations Following the satisfaction of certain operational targets, contingent consideration of £1,050,000 was paid to vendors of Speirs & Jeffrey in May 2019 (see note 8). In addition, contingent consideration of £1,507,000 was paid in October 2019 in respect of the acquisition of Vision Independent Financial Planning and Castle Investment Solutions.
Legal and compensation During the ordinary course of business the group may, from time to time, be subject to complaints, as well as threatened and actual legal proceedings (which may include lawsuits brought on behalf of clients or other third parties) both in the UK and overseas. Any such material matters are periodically reassessed, with the assistance of external professional advisers where appropriate, to determine the likelihood of the group incurring a liability. In those instances where it is concluded that it is more likely than not that a payment will be made, a provision is established to the group’s best estimate of the amount required to settle the obligation at the relevant balance sheet date. The timing of settlement of provisions for client compensation or litigation is dependent, in part, on the duration of negotiations with third parties.
Property-related Property-related provisions of £3,748,000 relate to dilapidation provisions expected to arise on leasehold premises held by the group (2019: £5,238,000). Prior-year balances also included monies due under the contract with the assignee of leases on the group’s former property at 1 Curzon Street, which was fully utilised in the year.
Dilapidation provisions are calculated using a discounted cash flow model; during the year ended 31 December 2020, dilapidation provisions decreased by £645,000 (2019: increased by £677,000). The group utilised £825,000 (2019: £3,338,000) of the dilapidations provision held for the surplus property at 1 Curzon Street during the year. The impact of discounting led to an additional credit of £645,000 (2019: additional charge of £1,364,000) being recognised during the year.
Amounts payable after one year Property-related provisions of £3,748,000 are expected to be settled within 13 years of the balance sheet date, which corresponds to the longest lease for which a dilapidations provision is being held. Remaining provisions payable after one year are expected to be settled within three years of the balance sheet date.
27 Lease liabilities
Maturity analysis 2020
£’000 2019
£’000
Less than one year 4,869 5,126 One to five years 19,307 19,193 More than five years 31,948 36,685 Lease liabilities at 31 December 56,124 61,004 Current 4,869 5,126 Non-current 51,255 55,878 56,124 61,004
28 Subordinated loan notes
2020
£’000 2019
£’000
Subordinated loan notes – face value 20,000 20,000 – carrying value 19,768 19,927
Subordinated loan notes consist of 10-year Tier 2 notes (‘Notes’), which are repayable in August 2025. Interest was payable at a fixed rate of 5.856% until the first call option date in August 2020, which the group chose not to exercise. At this date, the gross carrying amount of the loan notes was recalculated as the present value of the contractual cash flows modified for the extension and discounted at the original effective interest rate. A one-off gain to profit or loss of £393,000 was subsequently recognised in the year.
The loan notes now have a call option in August 2021 and annually thereafter at a fixed margin of 4.375% over six-month LIBOR. An interest expense of £1,294,000 (2019: £1,290,000) was recognised in the year, and has been offset against the one-off gain above (see note 4).
rathbones.com 175
29 Long-term employee benefits
Defined contribution pension scheme The group operates a defined contribution group personal pension scheme and contributes to various other personal pension arrangements for certain directors and employees. The total of contributions made to these schemes during the year was £10,411,000 (2019: £9,726,000). The group also operates a defined contribution scheme for overseas employees, for which the total contributions were £67,000 (2019: £58,000).
Defined benefit pension schemes The group operates two defined benefit pension schemes that operate within the UK legal and regulatory framework: the Rathbone 1987 Scheme and the Laurence Keen Retirement Benefit Scheme. The schemes are currently both clients of Rathbone Investment Management, with investments managed on a discretionary basis, in accordance with the statements of investment principles agreed by the trustees. Scheme assets are held separately from those of the group.
The trustees of the schemes are required to act in the best interest of the schemes’ beneficiaries. The appointment of trustees is determined by the schemes’ trust documentation and legislation. The group has a policy that one third of all trustees should be nominated by members of the schemes.
Following a High Court ruling in 2018, the cost of equalising pension benefits for the impact of unequal Guaranteed Minimum Pensions (GMPs) has been recognised. Only the Laurence Keen Scheme was impacted. The Rathbone 1987 Scheme was never contracted out, meaning there are no GMP benefits in this scheme. Ahead of a specific method for equalisation being agreed with the scheme trustees, the cost has been estimated using a method consistent with that deemed by the High Court to be the minimum necessary to achieve equality. The High Court made a further ruling in November 2020 relating to members with GMPs that had previously transferred out, whereby the scheme remains liable for paying any required adjustments arising from GMP equalisation. An estimate of the additional payment has been recognised as a past service cost in the year.
The Laurence Keen Scheme was closed to new entrants and future accrual with effect from 30 September 1999. Past service benefits continue to be calculated by reference to final pensionable salaries. From 1 October 1999, all the active members of the Laurence Keen Scheme were included under the Rathbone 1987 Scheme for accrual of retirement benefits for further service. The Rathbone 1987 Scheme was closed to new entrants with effect from 31 March 2002 and to future accrual from 30 June 2017.
The schemes are valued by independent actuaries at least every three years using the projected unit credit method, which looks at the value of benefits accruing over the years following the valuation date based on projected salary to the date of termination of services, discounted to a present value using a rate that reflects the characteristics of the liability. The valuations are updated at each balance sheet date in between full valuations. The latest full actuarial valuations were carried out as at 31 December 2019.
The assumptions used by the actuaries, to estimate the schemes’ liabilities, are the best estimates chosen from a range of possible actuarial assumptions. Due to the timescale covered by the liability, these assumptions may not necessarily be borne out in practice.
The principal actuarial assumptions used, which reflect the different membership profiles of the schemes, were:
Laurence Keen Scheme Rathbone 1987 Scheme
2020 %
(unless stated)
2019 %
(unless stated)
2020%
(unless stated)
2019%
(unless stated)
Rate of increase of salaries n/a n/a n/a n/a Rate of increase of pensions in payment 3.40 3.40 3.00 3.10 Rate of increase of deferred pensions 3.00 3.10 3.00 3.10 Discount rate 1.30 2.05 1.30 2.05 Inflation* 3.00 3.10 3.00 3.10 Percentage of members transferring out of the schemes per annum 3.00 3.00 3.00 3.00 Average age of members at date of transferring out (years) 52.5 52.5 52.5 52.5 * Inflation assumptions are based on the Retail Prices Index
rathbones.com 175

176 Rathbone Brothers Plc Report and accounts 2020
29 Long-term employee benefits continued Over the year, the financial assumptions have been amended to reflect changes in market conditions. Specifically:
1. the discount rate has been decreased by 0.75% to reflect a decrease in the yields available on AA-rated corporate bonds 2. the assumed rate of future inflation has decreased by 0.1% and reflects expectations of long-term inflation as implied by changes in the
Bank of England inflation yield curve 3. the assumed rates of future increases to pensions in payment has decreased by 0.1% for the Rathbone 1987 Scheme, consistent with the
assumed rate of future inflation. For the Laurence Keen Scheme they have remained the same (once rounded).
Over the year the mortality assumptions have been updated. The CMI model used to project future improvements in mortality has been updated from the 2018 version to the 2019 version, and the mortality base tables have been updated from the S2NxA tables with an 85% scaling factor to the S3PxA ‘Light’ tables with no scaling factor. Other demographic assumptions have remained unchanged.
The assumed duration of the liabilities for the Laurence Keen Scheme is 16 years (2019: 19 years) and the assumed duration for the Rathbone 1987 Scheme is 21 years (2019: 22 years).
The normal retirement age for members of the Laurence Keen Scheme is 65 (60 for certain former directors). The normal retirement age for members of the Rathbone 1987 Scheme is 60 for service prior to 1 July 2009 and 65 thereafter, following the introduction of pension benefits based on Career-Average Revalued Earnings (CARE) from that date. The assumed life expectancy for the membership of both schemes is based on the S3PA ‘Light’ actuarial tables (2019: S2NA tables) with improvements in line with the CMI 2019 tables with a long-term rate of improvement of 1.5% p.a. The assumed life expectancies on retirement were:
2020 2019 Males Females Males Females
Retiring today: aged 60 28.2 29.8 27.9 30.0 aged 65 23.3 24.8 23.1 25.1 Retiring in 20 years: aged 60 29.9 31.5 29.7 31.9 aged 65 24.8 26.5 24.7 26.9
The amount included in the balance sheet arising from the group’s assets in respect of the schemes is as follows: 2020 2019
Laurence Keen Scheme
£’000
Rathbone 1987 Scheme
£’000 Total
£’000
Laurence Keen Scheme
£’000
Rathbone1987 Scheme
£’000 Total
£’000
Present value of defined benefit obligations (12,374) (153,030) (165,404) (12,726) (146,398) (159,124)Fair value of scheme assets 12,592 143,027 155,619 12,178 138,932 151,110 Net defined benefit liability 218 (10,003) (9,785) (548) (7,466) (8,014)
The amounts recognised in profit or loss, within operating expenses, are as follows: 2020 2019
Laurence Keen Scheme
£’000
Rathbone 1987 Scheme
£’000 Total
£’000
Laurence Keen Scheme
£’000
Rathbone1987 Scheme
£’000 Total
£’000
Net interest on net liability 7 117 124 15 240 255 Past service cost 76 – 76 – – 83 117 200 15 240 255
Remeasurements of the net defined benefit asset have been reported in other comprehensive income. The actual return on scheme assets was a rise in value of £451,000 (2019: £1,380,000 rise) for the Laurence Keen Scheme and a rise in value of £9,660,000 (2019: £18,357,000 rise) for the Rathbone 1987 Scheme.
Notes to the consolidated financial statements continued
176 Rathbone Brothers Plc Report and accounts 2020
| Consolidated financial statements

176 Rathbone Brothers Plc Report and accounts 2020
29 Long-term employee benefits continued Over the year, the financial assumptions have been amended to reflect changes in market conditions. Specifically:
1. the discount rate has been decreased by 0.75% to reflect a decrease in the yields available on AA-rated corporate bonds 2. the assumed rate of future inflation has decreased by 0.1% and reflects expectations of long-term inflation as implied by changes in the
Bank of England inflation yield curve 3. the assumed rates of future increases to pensions in payment has decreased by 0.1% for the Rathbone 1987 Scheme, consistent with the
assumed rate of future inflation. For the Laurence Keen Scheme they have remained the same (once rounded).
Over the year the mortality assumptions have been updated. The CMI model used to project future improvements in mortality has been updated from the 2018 version to the 2019 version, and the mortality base tables have been updated from the S2NxA tables with an 85% scaling factor to the S3PxA ‘Light’ tables with no scaling factor. Other demographic assumptions have remained unchanged.
The assumed duration of the liabilities for the Laurence Keen Scheme is 16 years (2019: 19 years) and the assumed duration for the Rathbone 1987 Scheme is 21 years (2019: 22 years).
The normal retirement age for members of the Laurence Keen Scheme is 65 (60 for certain former directors). The normal retirement age for members of the Rathbone 1987 Scheme is 60 for service prior to 1 July 2009 and 65 thereafter, following the introduction of pension benefits based on Career-Average Revalued Earnings (CARE) from that date. The assumed life expectancy for the membership of both schemes is based on the S3PA ‘Light’ actuarial tables (2019: S2NA tables) with improvements in line with the CMI 2019 tables with a long-term rate of improvement of 1.5% p.a. The assumed life expectancies on retirement were:
2020 2019 Males Females Males Females
Retiring today: aged 60 28.2 29.8 27.9 30.0 aged 65 23.3 24.8 23.1 25.1 Retiring in 20 years: aged 60 29.9 31.5 29.7 31.9 aged 65 24.8 26.5 24.7 26.9
The amount included in the balance sheet arising from the group’s assets in respect of the schemes is as follows: 2020 2019
Laurence Keen Scheme
£’000
Rathbone 1987 Scheme
£’000 Total
£’000
Laurence Keen Scheme
£’000
Rathbone1987 Scheme
£’000 Total
£’000
Present value of defined benefit obligations (12,374) (153,030) (165,404) (12,726) (146,398) (159,124)Fair value of scheme assets 12,592 143,027 155,619 12,178 138,932 151,110 Net defined benefit liability 218 (10,003) (9,785) (548) (7,466) (8,014)
The amounts recognised in profit or loss, within operating expenses, are as follows: 2020 2019
Laurence Keen Scheme
£’000
Rathbone 1987 Scheme
£’000 Total
£’000
Laurence Keen Scheme
£’000
Rathbone1987 Scheme
£’000 Total
£’000
Net interest on net liability 7 117 124 15 240 255 Past service cost 76 – 76 – – 83 117 200 15 240 255
Remeasurements of the net defined benefit asset have been reported in other comprehensive income. The actual return on scheme assets was a rise in value of £451,000 (2019: £1,380,000 rise) for the Laurence Keen Scheme and a rise in value of £9,660,000 (2019: £18,357,000 rise) for the Rathbone 1987 Scheme.
rathbones.com 177
Movements in the present value of defined benefit obligations were as follows: 2020 2019
Laurence Keen Scheme
£’000
Rathbone 1987 Scheme
£’000 Total
£’000
Laurence Keen Scheme
£’000
Rathbone1987 Scheme
£’000 Total
£’000
At 1 January 12,726 146,398 159,124 12,383 134,150 146,533 Service cost (employer’s part) – – – – – – Interest cost 257 2,916 3,173 336 3,739 4,075 Contributions from members – – – – – – Actuarial experience gains (1,081) (3,272) (4,353) 10 121 131 Actuarial (gains)/losses arising from: – demographic assumptions (389) (5,154) (5,543) (293) (3,243) (3,536)– financial assumptions 1,158 20,482 21,640 1,452 17,560 19,012 Past service cost 76 – 76 – – – Benefits paid (373) (8,340) (8,713) (1,162) (5,929) (7,091)At 31 December 12,374 153,030 165,404 12,726 146,398 159,124
Movements in the fair value of scheme assets were as follows:
2020 2019
Laurence Keen Scheme
£’000
Rathbone 1987 Scheme
£’000 Total
£’000
Laurence Keen Scheme
£’000
Rathbone1987 Scheme
£’000 Total
£’000
At 1 January 12,178 138,932 151,110 11,624 123,712 135,336 Remeasurement of net defined benefit liability: – interest income 250 2,799 3,049 321 3,499 3,820 – return on scheme assets (excluding amounts included
in interest income) 201 6,861 7,062 1,059 14,858 15,917 Contributions from the sponsoring companies 336 2,775 3,111 336 2,792 3,128 Contributions from scheme members – – – – – – Benefits paid (373) (8,340) (8,713) (1,162) (5,929) (7,091)At 31 December 12,592 143,027 155,619 12,178 138,932 151,110
The statements of investment principles set by the trustees of both schemes were revised in 2020. They require that the assets of the schemes are invested in a diversified portfolio of assets, split between return-seeking assets (primarily equities) and safer assets (corporate bonds and liability-driven investments).
The expected asset allocations at 31 December 2020 as set out in the statements of investment principles are as follows:
Target asset allocation at 31 December 2020 Laurence Keen
Scheme Rathbone
1987 Scheme
Benchmark Safer assets 60% 60%Growth assets 40% 40%Range Safer assets 50% – 70% 50% – 70%Growth assets 30% – 50% 30% – 50%
rathbones.com 177

178 Rathbone Brothers Plc Report and accounts 2020
29 Long-term employee benefits continued The analysis of the scheme assets, measured at bid prices, at the balance sheet date was as follows:
Laurence Keen Scheme
2020 Fair
value £’000
2019 Fair
value £’000
2020Current
allocation%
2019Current
allocation%
Equity instruments: – United Kingdom 485 3,320 – Eurozone 555 408 – North America 2,284 696 – Other 2,048 704 5,372 5,128 43 42 Debt instruments: – United Kingdom government bonds – 4,693 – Overseas corporate bonds – 158 – United Kingdom corporate bonds 4,489 1,847 4,489 6,698 36 55 Liability-driven investments 2,441 – 19 – Cash 161 79 1 1 Other 129 273 1 2 At 31 December 12,592 12,178 100 100
Rathbone 1987 Scheme
2020 Fair
value £’000
2019 Fair
value £’000
2020Current
allocation%
2019Current
allocation%
Equity instruments: – United Kingdom 29,299 42,518 – Eurozone 5,948 6,769 – North America 15,978 9,492 – Other 15,497 8,887 66,722 67,666 46 48 Debt instruments: – United Kingdom government bonds – 37,184 – Overseas government bonds – 1,324 – United Kingdom corporate bonds 41,509 11,198 – Overseas corporate bonds – – 41,509 49,706 29 36 Derivatives: – Interest rate swap funds – 14,615 – 14,615 – 11 Liability-driven investments 32,700 – 24 – Cash 2,096 6,945 1 5 Other – – – – At 31 December 143,027 138,932 100 100
All equity instruments have quoted prices in active markets. ‘Other’ scheme assets comprise commodities (2019: comprise commodities and property funds). Buy and maintain credit funds have been classified as UK corporate bonds.
The Rathbone 1987 Scheme previously held shares in real-time inflation-linked interest rate swap funds, which had a fair value of £14,615,000 at 31 December 2019. During the year, a proportion of assets were transferred to new fund managers, Legal and General Investment Management, and the interest rate swap instrument was subsequently sold. The Scheme now holds liability-driven investments, which act to reduce the group’s exposure to changes in net defined benefit pension obligations arising from changes in interest rates and inflation.
Notes to the consolidated financial statements continued
178 Rathbone Brothers Plc Report and accounts 2020
| Consolidated financial statements

178 Rathbone Brothers Plc Report and accounts 2020
29 Long-term employee benefits continued The analysis of the scheme assets, measured at bid prices, at the balance sheet date was as follows:
Laurence Keen Scheme
2020 Fair
value £’000
2019 Fair
value £’000
2020Current
allocation%
2019Current
allocation%
Equity instruments: – United Kingdom 485 3,320 – Eurozone 555 408 – North America 2,284 696 – Other 2,048 704 5,372 5,128 43 42 Debt instruments: – United Kingdom government bonds – 4,693 – Overseas corporate bonds – 158 – United Kingdom corporate bonds 4,489 1,847 4,489 6,698 36 55 Liability-driven investments 2,441 – 19 – Cash 161 79 1 1 Other 129 273 1 2 At 31 December 12,592 12,178 100 100
Rathbone 1987 Scheme
2020 Fair
value £’000
2019 Fair
value £’000
2020Current
allocation%
2019Current
allocation%
Equity instruments: – United Kingdom 29,299 42,518 – Eurozone 5,948 6,769 – North America 15,978 9,492 – Other 15,497 8,887 66,722 67,666 46 48 Debt instruments: – United Kingdom government bonds – 37,184 – Overseas government bonds – 1,324 – United Kingdom corporate bonds 41,509 11,198 – Overseas corporate bonds – – 41,509 49,706 29 36 Derivatives: – Interest rate swap funds – 14,615 – 14,615 – 11 Liability-driven investments 32,700 – 24 – Cash 2,096 6,945 1 5 Other – – – – At 31 December 143,027 138,932 100 100
All equity instruments have quoted prices in active markets. ‘Other’ scheme assets comprise commodities (2019: comprise commodities and property funds). Buy and maintain credit funds have been classified as UK corporate bonds.
The Rathbone 1987 Scheme previously held shares in real-time inflation-linked interest rate swap funds, which had a fair value of £14,615,000 at 31 December 2019. During the year, a proportion of assets were transferred to new fund managers, Legal and General Investment Management, and the interest rate swap instrument was subsequently sold. The Scheme now holds liability-driven investments, which act to reduce the group’s exposure to changes in net defined benefit pension obligations arising from changes in interest rates and inflation.
rathbones.com 179
The key assumptions affecting the results of the valuation are the discount rate, future inflation, mortality, the rate of members transferring out and the average age at the time of transferring out. In order to demonstrate the sensitivity of the results to these assumptions, the actuary has recalculated the defined benefit obligations for each scheme by varying each of these assumptions in isolation whilst leaving the other assumptions unchanged. For example, in order to demonstrate the sensitivity of the results to the discount rate, the actuary has recalculated the defined benefit obligations for each scheme using a discount rate that is 0.5% higher than that used for calculating the disclosed figures. A similar approach has been taken to demonstrate the sensitivity of the results to the other key assumptions. A summary of the sensitivities in respect of the total of the two schemes’ defined benefit obligations is set out below.
Combined impact on schemes’ liabilities
(Decrease)/increase
£’000 (Decrease)/increase
%
1.0% increase in: – discount rate (15,689) (9.5%)0.5% increase in: 11,608 7.0%– rate of inflation Reduce allowance for future transfers to nil 3,189 1.9%1-year increase to: – longevity at 60 7,356 4.4%– average age of members at the time of transferring out 872 0.5%
The total contributions made by the group to the 1987 Scheme during the year were £2,775,000 (2019: £2,792,000). The group has a commitment to pay deficit-reducing contributions of £4,750,000 by 31 August 2021, £3,750,000 by 31 August 2022 and a further £2,750,000 by 31 August 2023 and each subsequent 31 August up to and including 31 August 2026, so long as that scheme remains in deficit. The deficit funding plan will be reviewed following the next triennial valuation, as at 31 December 2022.
The total contributions made by the group to the Laurence Keen Scheme during the year were £336,000 (2019: £336,000). The group has a commitment to pay deficit-reducing contributions of £168,000 by 28 February each year from 2021 to 2026 (inclusive) and a further £168,000 by 31 August in each of those years, so long as that scheme remains in deficit.
No allowance has been made for a minimum funding requirement under IFRIC 14. The funding plans only require further contributions if the schemes remain in deficit.
30 Share capital and share premium The following movements in share capital occurred during the year:
Number of
shares
Exercise/issue price
Pence
Sharecapital£’000
Share premium
£’000 Merger reserve
£’000 Total
£’000
At 1 January 2019 (restated) 55,206,957 2,760 205,273 56,785 264,818Shares issued: – in relation to business combinations (note 9) 603,913 2,484.0 30 – 14,971 15,001– to Share Incentive Plan 150,766 2,085.0 – 2,540.0 8 3,364 – 3,372– to Save As You Earn scheme 143,502 1,556.0 – 1,648.0 7 2,302 – 2,309– to Employee Benefit Trust 256,848 5.0 13 – – 13At 1 January 2020 56,361,986 2,818 210,939 71,756 285,513Shares issued: – to Share Incentive Plan 259,619 1,296.0 – 2,110.0 13 4,070 – 4,083– to Save As You Earn scheme 5,008 1,641.0 – 1,648.0 – 83 – 83– to Employee Benefit Trust 859,800 5.0 43 – – 43At 31 December 2020 57,486,413 2,874 215,092 71,756 289,722
The total number of issued and fully paid up ordinary shares at 31 December 2020 was 57,486,413 (2019: 56,361,986) with a par value of 5p per share.
The holders of ordinary shares are entitled to receive dividends as declared from time to time, and are entitled to one vote per share at meetings of the company. The ordinary shareholders are entitled to any residual assets on the winding up of the company.
On 28 May 2019, the company issued 603,913 shares in respect of the contingent consideration from the acquisition of Speirs & Jeffrey (see note 8), following the satisfaction of certain operational targets.
rathbones.com 179

180 Rathbone Brothers Plc Report and accounts 2020
31 Own shares The following movements in own shares occurred during the year:
Number of
shares £’000
At 1 January 2019 1,943,853 32,737Acquired in the year 694,152 10,033Released on vesting (26,563) (799)At 1 January 2020 2,611,442 41,971Acquired in the year 1,187,938 5,077Released on vesting (42,010) (304)At 31 December 2020 3,757,370 46,744
Own shares represent the cost of the company’s own shares, either purchased in the market or issued by the company, that are held by the company or in an employee benefit trust to satisfy future awards under the group’s share-based payment schemes (note 32). A total of 2,343,738 shares were held in the Employee Benefit Trust at 31 December 2020 (2019: 1,292,627), and 407,110 shares were held by the trustees of the Share Incentive Plan but were not unconditionally gifted to employees (2019: 312,293). A further 1,006,522 (2019: 1,006,522) shares were held in nominee in respect of the initial share consideration for the acquisition of Speirs & Jeffrey (see note 30). No shares were acquired through share buybacks during the year (2019: 317,281).
32 Share-based payments
Share Incentive Plan The group operates a Share Incentive Plan (SIP), which is available to all employees. Employees can contribute up to £150 per month to acquire partnership shares, which are purchased or allotted in monthly accumulation periods. The group currently matches employee contributions on a one-for-one basis to acquire matching shares.
The group also provides performance-related free shares, with eligible employees receiving shares valued at the rate of £100 per 1% real increase in earnings per share up to a maximum of £3,000 per annum.
For UK employees, SIP dividends are reinvested and used to purchase dividend shares, whilst for Jersey employees dividends are paid in cash.
As at 31 December 2020, the trustees of the SIP held 1,240,212 (2019: 1,065,917) ordinary shares of 5p each in Rathbone Brothers Plc with a total market value of £19,099,000 (2019: £22,704,000). Of the total number of shares held by the trustees, 406,012 (2019: 311,972) have been conditionally gifted to employees and 1,098 (2019: 321) remain unallocated. Dividends on the unallocated shares have been waived by the trustees.
The group recognised a charge of £1,760,980 in relation to this scheme in 2020 (2019: £1,324,000).
Savings-related share option or Save as You Earn (SAYE) plan Under the SAYE plan, employees can contribute up to £500 per month to acquire shares at the end of a three- or five-year savings period.
Options with an aggregate estimated fair value of £3,931,000, determined using a binomial valuation model including expected dividends, were granted on 21 April 2020 to directors and staff under the SAYE plan. The inputs into the binomial model for options granted during 2020, as at the date of issue, were as follows:
2020 2019
Share price (pence) 1,380 2,400 Exercise price (pence) 1,085 1,813 Expected volatility 26% 24% Risk-free rate 0.1% 0.8% Expected dividend yield 2.8% 2.8%
Notes to the consolidated financial statements continued
180 Rathbone Brothers Plc Report and accounts 2020
| Consolidated financial statements

180 Rathbone Brothers Plc Report and accounts 2020
31 Own shares The following movements in own shares occurred during the year:
Number of
shares £’000
At 1 January 2019 1,943,853 32,737Acquired in the year 694,152 10,033Released on vesting (26,563) (799)At 1 January 2020 2,611,442 41,971Acquired in the year 1,187,938 5,077Released on vesting (42,010) (304)At 31 December 2020 3,757,370 46,744
Own shares represent the cost of the company’s own shares, either purchased in the market or issued by the company, that are held by the company or in an employee benefit trust to satisfy future awards under the group’s share-based payment schemes (note 32). A total of 2,343,738 shares were held in the Employee Benefit Trust at 31 December 2020 (2019: 1,292,627), and 407,110 shares were held by the trustees of the Share Incentive Plan but were not unconditionally gifted to employees (2019: 312,293). A further 1,006,522 (2019: 1,006,522) shares were held in nominee in respect of the initial share consideration for the acquisition of Speirs & Jeffrey (see note 30). No shares were acquired through share buybacks during the year (2019: 317,281).
32 Share-based payments
Share Incentive Plan The group operates a Share Incentive Plan (SIP), which is available to all employees. Employees can contribute up to £150 per month to acquire partnership shares, which are purchased or allotted in monthly accumulation periods. The group currently matches employee contributions on a one-for-one basis to acquire matching shares.
The group also provides performance-related free shares, with eligible employees receiving shares valued at the rate of £100 per 1% real increase in earnings per share up to a maximum of £3,000 per annum.
For UK employees, SIP dividends are reinvested and used to purchase dividend shares, whilst for Jersey employees dividends are paid in cash.
As at 31 December 2020, the trustees of the SIP held 1,240,212 (2019: 1,065,917) ordinary shares of 5p each in Rathbone Brothers Plc with a total market value of £19,099,000 (2019: £22,704,000). Of the total number of shares held by the trustees, 406,012 (2019: 311,972) have been conditionally gifted to employees and 1,098 (2019: 321) remain unallocated. Dividends on the unallocated shares have been waived by the trustees.
The group recognised a charge of £1,760,980 in relation to this scheme in 2020 (2019: £1,324,000).
Savings-related share option or Save as You Earn (SAYE) plan Under the SAYE plan, employees can contribute up to £500 per month to acquire shares at the end of a three- or five-year savings period.
Options with an aggregate estimated fair value of £3,931,000, determined using a binomial valuation model including expected dividends, were granted on 21 April 2020 to directors and staff under the SAYE plan. The inputs into the binomial model for options granted during 2020, as at the date of issue, were as follows:
2020 2019
Share price (pence) 1,380 2,400 Exercise price (pence) 1,085 1,813 Expected volatility 26% 24% Risk-free rate 0.1% 0.8% Expected dividend yield 2.8% 2.8%
rathbones.com 181
The number of share options outstanding for the SAYE plan at the end of the year, the period in which they were granted and the dates on which they may be exercised are given below.
Year of grant Exercise price
Pence Exercise
period
2020 Number of share options
2019Numberof shareoptions
2014 1,556.0 2019 – 964 2015 1,641.0 2020 309 43,456 2016 1,648.0 2019 and 2021 8,988 44,972 2017 1,899.0 2020 and 2022 6,874 109,285 2018 1,977.0 2021 and 2023 31,228 127,363 2019 1,813.0 2022 and 2024 43,246 194,564 2020 1,085.0 2023 and 2025 1,158,317 – At 31 December 1,248,962 520,604
Movements in the number of share options outstanding for the SAYE plan were as follows: 2020 2019
Number of share options
Weighted average
exercise price Pence
Numberof shareoptions
Weightedaverage
exercise pricePence
At 1 January 520,604 1,842.0 501,379 1,800.0 Granted in the year 1,177,277 1,085.0 201,406 1,813.0 Forfeited or cancelled in the year (442,665) 1,808.0 (38,679) 1,893.0 Exercised in the year (6,254) 1,690.0 (143,502) 1,612.0 At 31 December 1,248,962 1,141.0 520,604 1,842.0
The weighted average share price at the dates of exercise for share options exercised during the year was £16.85 (2019: £23.11). The options outstanding at 31 December 2020 had a weighted average contractual life of 3.7 years (2019: 2.5 years) and a weighted average exercise price of £11.41 (2019: £18.42).
Executive Incentive Plan Details of the general terms of this plan are set out in the remuneration committee report on page 106, and pages 118 to 120.
Under the remuneration policy, 40% of the total award will be given in cash with the remaining 60% of the award granted in shares. The group treats the cash element of the award as an employee benefit under IAS 19 and the share element of the award as an equity-settled share-based payment under IFRS 2.
The group recognised a charge of £2,399,000 in relation to the equity-settled share-based payment element of this scheme in 2020 (2019: £3,104,000).
Staff Equity Plan The Staff Equity Plan is for individuals within Rathbone Investment Management and Rathbone Investment Management International. The aim of the scheme is to promote increased equity interest in Rathbone Brothers Plc amongst employees.
rathbones.com 181

182 Rathbone Brothers Plc Report and accounts 2020
32 Share-based payments continued Participants are granted awards under the plan in the form of an option with an exercise price of £nil. The option awards are subject to certain service and performance conditions. Following the satisfaction of these performance conditions, the awards will vest (or lapse) and become exercisable on the fifth anniversary of the grant date. The awards will be exercisable from the vesting date until the tenth anniversary of the grant date.
The group recognised a charge of £4,327,000 in relation to this scheme in 2020 (2019: £3,647,000).
Other schemes The group operates a number of other plans for rewarding employees. Participants are granted awards under these plans in the form of options, which vest automatically on an anniversary of the grant date (generally between one and five years). As the intention is to settle the options in such plans in shares, the awards are treated as equity-settled share-based payments under IFRS 2.
The group recognised total charges of £11,276,000 in relation to share-based payment transactions in 2020 (2019: £9,328,000) (see note 10).
Speirs & Jeffrey share-based payments Details of the general terms of share-based payments associated with the acquisition of Speirs & Jeffrey are set out in note 8.
33 Financial risk management The group has identified the financial, business and operational risks arising from its activities and has established policies and procedures to manage these items in accordance with its risk appetite, as described in the group risk committee report on pages 92 to 94.
The group categorises its financial risks into the following primary areas:
(i) credit risk (which includes counterparty default risk);
(ii) liquidity risk;
(iii) market risk (which includes fair value interest rate risk, cash flow interest rate risk, foreign exchange risk and price risk); and
(iv) pension risk.
The group’s exposures to pension risk are set out in note 29.
The group’s financial risk management policies are designed to identify and analyse the financial risks that the group faces, to set appropriate risk tolerances, limits and controls, and to monitor the financial risks and adherence to limits by means of reliable and up-to-date information systems. The group regularly reviews its financial risk management policies and systems to reflect changes in the business, counterparties, markets and the range of financial instruments that it utilises.
The treasury department, reporting through the banking committee, has principal responsibility for monitoring exposure to credit risk, liquidity risk and market risk. Procedures and delegated authorities are documented in a group treasury manual and policy documents prescribe the management and monitoring of each type of risk. The primary objective of the group’s treasury policy is to manage short term liquidity requirements whilst maintaining an appropriate level of exposure to other financial risks in accordance with the group’s risk appetite.
(i) Credit risk The group takes on exposure to credit risk, which is the risk that a counterparty will be unable to pay amounts in full when due, through its banking, treasury, trust and financial planning activities. The principal source of credit risk arises from placing funds in the money market and holding interest-bearing securities. The group also has exposure to credit risk through its client loan book and guarantees given on clients’ behalf.
It is the group’s policy to place funds generated internally and from deposits by clients with a range of high-quality financial institutions and the Bank of England. Investments with financial institutions are spread to avoid excessive exposure to any individual counterparty. Loans made to clients are secured against clients’ assets that are held and managed by group companies.
Exposure to credit risk is managed through setting appropriate ratings requirements and lending limits. Limits are reviewed regularly, taking into account the ability of borrowers and potential borrowers to meet repayment obligations.
The group categorises its exposures based on the long-term ratings awarded to counterparties by Fitch or Moody’s. Each exposure is assessed individually, both at inception and in ongoing monitoring. In addition to formal external ratings, the banking committee also utilises market intelligence information to assist with its ongoing monitoring.
Notes to the consolidated financial statements continued
182 Rathbone Brothers Plc Report and accounts 2020
| Consolidated financial statements

182 Rathbone Brothers Plc Report and accounts 2020
32 Share-based payments continued Participants are granted awards under the plan in the form of an option with an exercise price of £nil. The option awards are subject to certain service and performance conditions. Following the satisfaction of these performance conditions, the awards will vest (or lapse) and become exercisable on the fifth anniversary of the grant date. The awards will be exercisable from the vesting date until the tenth anniversary of the grant date.
The group recognised a charge of £4,327,000 in relation to this scheme in 2020 (2019: £3,647,000).
Other schemes The group operates a number of other plans for rewarding employees. Participants are granted awards under these plans in the form of options, which vest automatically on an anniversary of the grant date (generally between one and five years). As the intention is to settle the options in such plans in shares, the awards are treated as equity-settled share-based payments under IFRS 2.
The group recognised total charges of £11,276,000 in relation to share-based payment transactions in 2020 (2019: £9,328,000) (see note 10).
Speirs & Jeffrey share-based payments Details of the general terms of share-based payments associated with the acquisition of Speirs & Jeffrey are set out in note 8.
33 Financial risk management The group has identified the financial, business and operational risks arising from its activities and has established policies and procedures to manage these items in accordance with its risk appetite, as described in the group risk committee report on pages 92 to 94.
The group categorises its financial risks into the following primary areas:
(i) credit risk (which includes counterparty default risk);
(ii) liquidity risk;
(iii) market risk (which includes fair value interest rate risk, cash flow interest rate risk, foreign exchange risk and price risk); and
(iv) pension risk.
The group’s exposures to pension risk are set out in note 29.
The group’s financial risk management policies are designed to identify and analyse the financial risks that the group faces, to set appropriate risk tolerances, limits and controls, and to monitor the financial risks and adherence to limits by means of reliable and up-to-date information systems. The group regularly reviews its financial risk management policies and systems to reflect changes in the business, counterparties, markets and the range of financial instruments that it utilises.
The treasury department, reporting through the banking committee, has principal responsibility for monitoring exposure to credit risk, liquidity risk and market risk. Procedures and delegated authorities are documented in a group treasury manual and policy documents prescribe the management and monitoring of each type of risk. The primary objective of the group’s treasury policy is to manage short term liquidity requirements whilst maintaining an appropriate level of exposure to other financial risks in accordance with the group’s risk appetite.
(i) Credit risk The group takes on exposure to credit risk, which is the risk that a counterparty will be unable to pay amounts in full when due, through its banking, treasury, trust and financial planning activities. The principal source of credit risk arises from placing funds in the money market and holding interest-bearing securities. The group also has exposure to credit risk through its client loan book and guarantees given on clients’ behalf.
It is the group’s policy to place funds generated internally and from deposits by clients with a range of high-quality financial institutions and the Bank of England. Investments with financial institutions are spread to avoid excessive exposure to any individual counterparty. Loans made to clients are secured against clients’ assets that are held and managed by group companies.
Exposure to credit risk is managed through setting appropriate ratings requirements and lending limits. Limits are reviewed regularly, taking into account the ability of borrowers and potential borrowers to meet repayment obligations.
The group categorises its exposures based on the long-term ratings awarded to counterparties by Fitch or Moody’s. Each exposure is assessed individually, both at inception and in ongoing monitoring. In addition to formal external ratings, the banking committee also utilises market intelligence information to assist with its ongoing monitoring.
rathbones.com 183
The group’s financial assets are categorised as follows:
Balances with central banks (note 14) The group has exposure to central banks through its deposits held with the Bank of England.
Loans and advances to banks (note 15) and debt and other securities (note 17) The group has exposures to a wide range of financial institutions through its treasury portfolio, which includes bank deposits, certificates of deposit, money market funds and treasury bills. These exposures principally arise from the placement of clients’ cash, where it is held under a banking relationship, and the group’s own reserves.
Balances with central banks, loans and advances to banks and debt and other securities (excluding equity securities) are collectively referred to as the group’s treasury book.
Treasury book 2020
£’000 2019
£’000
Balances with central banks 1,803,434 1,933,218 Loans and advances to banks – fixed deposits 10,000 70,000 Unlisted debt securities 651,427 600,261 Money market funds 99,262 100,194 Gross amount 2,564,123 2,703,673
The group’s policy requires that all such exposures are only taken with counterparties that have been awarded a minimum long-term rating of single A by Fitch or equivalent rating by Moody’s. Counterparty limits are also in place to limit exposure to an individual counterparty or connected group of counterparties. Counterparty exposures are monitored on a daily basis by the treasury department and reviewed by the banking committee on a monthly basis, or more frequently when necessary. The banking committee may suspend dealing in a particular counterparty, or liquidate specific holdings, in the light of adverse market information.
Loans and advances to customers (note 16) The group provides loans to clients through its investment management operations (‘the investment management loan book’). The group is also exposed to credit risk on overdrafts on clients’ investment management accounts, trade debtors arising from the trust, tax and financial planning businesses (‘trust and financial planning debtors’) and other debtors.
(a) Overdrafts Overdrafts on clients’ investment management accounts arise from time to time due to short-term timing differences between the purchase and sale of assets on a client’s behalf. Overdrafts are actively monitored and reported to the banking committee on a monthly basis.
(b) Investment management loan book Loans are provided as a service to investment management clients, who are generally asset-rich but have short- to medium-term cash requirements. Such loans are normally made on a fully secured basis against portfolios held in Rathbones’ nominee name, and some loans may be partially secured by property. Extensions to the initial loan period may be granted subject to credit criteria.
At 31 December 2020, the total lending exposure limit for the investment management loan book was £225,000,000 (2019: £200,000,000), of which £157,304,000 had been advanced (2019: £131,848,000) and a further £39,510,000 had been committed (2019: £31,284,000).
(c) Trust and financial planning debtors Trust and financial planning debtors relate to fees which have been invoiced but not yet settled by clients. The collection and ageing of trust and financial planning debtors are reviewed on a monthly basis by the management committees of the group’s trust and financial planning businesses.
(d) Other debtors Other loans and advances to customers relate to management fees receivable.
rathbones.com 183

184 Rathbone Brothers Plc Report and accounts 2020
33 Financial risk management continued
(i) Credit risk continued Settlement balances Settlement risk arises in any situation where a payment in cash or transfer of a security is made in the expectation of a corresponding delivery of a security or receipt of cash. The majority of transactions are carried out on a delivery versus payment basis, which results in securities and cash being exchanged within a very close timeframe. Settlement balances outside standard terms are monitored on a daily basis.
The Investment Management and Funds segments have exposure to market counterparties in the settlement of trades. Settlement balances arising in the Investment Management segment are primarily in relation to client trades and risk of non-settlement is borne by clients.
Maximum exposure to credit risk
2020
£’000 2019
£’000
Credit risk relating to on-balance-sheet exposures: Cash and balances with central banks 1,803,434 1,933,218 Settlement balances 90,373 52,520 Loans and advances to banks 159,430 177,832 Loans and advances to customers: – overdrafts 6,384 5,148 – investment management loan book 157,957 132,033 – trust and financial planning debtors 1,424 1,272 – other debtors 557 60 Investment securities: – unlisted debt securities and money market funds 750,795 700,492 – equity securities 2,569 1,186 Other financial assets 92,386 86,963 Credit risk relating to off-balance-sheet exposures: Loan commitments 39,510 31,284 Financial guarantees (note 35) – 117 3,104,819 3,122,125
The above table represents the group’s gross credit risk exposure at 31 December 2020 and 2019, without taking account of any associated collateral held or other credit enhancements. For on-balance-sheet assets, the exposures set out above are based on gross carrying amounts.
Of the total maximum exposure, 10.5% is derived from loans and advances to banks and customers (2019: 10.1%) and 24.2% represents investment securities (2019: 22.4%).
The credit risk relating to off-balance-sheet exposures for financial guarantees reflects the group’s gross potential exposure of guarantees held on balance sheet (see note 1.21).
Impairment of financial instruments The group’s accounting policy governing impairment of financial assets is given in note 1.12. Impairment losses on financial assets recognised in profit or loss were as shown in the table below. The main class of asset these impairment losses have arisen against is cash and balances held with central banks.
2020
£’000 2019
£’000
Impairment losses/(reversals) arising from: – treasury book 577 99 – investment management loan book – (11)– trust and financial planning debtors 5 15 582 103
Notes to the consolidated financial statements continued
184 Rathbone Brothers Plc Report and accounts 2020
| Consolidated financial statements

184 Rathbone Brothers Plc Report and accounts 2020
33 Financial risk management continued
(i) Credit risk continued Settlement balances Settlement risk arises in any situation where a payment in cash or transfer of a security is made in the expectation of a corresponding delivery of a security or receipt of cash. The majority of transactions are carried out on a delivery versus payment basis, which results in securities and cash being exchanged within a very close timeframe. Settlement balances outside standard terms are monitored on a daily basis.
The Investment Management and Funds segments have exposure to market counterparties in the settlement of trades. Settlement balances arising in the Investment Management segment are primarily in relation to client trades and risk of non-settlement is borne by clients.
Maximum exposure to credit risk
2020
£’000 2019
£’000
Credit risk relating to on-balance-sheet exposures: Cash and balances with central banks 1,803,434 1,933,218 Settlement balances 90,373 52,520 Loans and advances to banks 159,430 177,832 Loans and advances to customers: – overdrafts 6,384 5,148 – investment management loan book 157,957 132,033 – trust and financial planning debtors 1,424 1,272 – other debtors 557 60 Investment securities: – unlisted debt securities and money market funds 750,795 700,492 – equity securities 2,569 1,186 Other financial assets 92,386 86,963 Credit risk relating to off-balance-sheet exposures: Loan commitments 39,510 31,284 Financial guarantees (note 35) – 117 3,104,819 3,122,125
The above table represents the group’s gross credit risk exposure at 31 December 2020 and 2019, without taking account of any associated collateral held or other credit enhancements. For on-balance-sheet assets, the exposures set out above are based on gross carrying amounts.
Of the total maximum exposure, 10.5% is derived from loans and advances to banks and customers (2019: 10.1%) and 24.2% represents investment securities (2019: 22.4%).
The credit risk relating to off-balance-sheet exposures for financial guarantees reflects the group’s gross potential exposure of guarantees held on balance sheet (see note 1.21).
Impairment of financial instruments The group’s accounting policy governing impairment of financial assets is given in note 1.12. Impairment losses on financial assets recognised in profit or loss were as shown in the table below. The main class of asset these impairment losses have arisen against is cash and balances held with central banks.
2020
£’000 2019
£’000
Impairment losses/(reversals) arising from: – treasury book 577 99 – investment management loan book – (11)– trust and financial planning debtors 5 15 582 103
rathbones.com 185
Expected credit loss assessment At each reporting date, for both the treasury book and investment management loan book, the group assesses whether there has been a significant increase in credit risk of exposures since initial recognition, by comparing the change in the risk of a default occurring over the expected life of the instrument between the reporting date and the date of initial recognition. The following criteria are used to identify significant increases in credit risk and are monitored and reviewed periodically for appropriateness by the treasury team.
Qualitative indicators The group periodically monitors its exposures and uses a set of defined criteria to flag any counterparties that may be experiencing financial difficulties. Such exposures are added to a watch list maintained by the treasury team, and those that are considered to have experienced a significant increase in credit risk are classified as ‘stage 2’, on which a lifetime ECL is recognised.
Quantitative indicators The lifetime probability of default at the reporting date is compared to the original lifetime probability of default at initial recognition and if the difference exceeds a predefined threshold (for the current analysis this threshold is set at 50% of the value at initial recognition) the exposure is moved to stage 2.
Probability of defaults used for identifying significant increases in credit risk for staging purposes are calculated using the same methodology and data used for estimating probability of defaults for the purpose of measuring expected credit losses.
The ‘30 days past due’ backstop indicator has not been rebutted by the group, albeit it is not a significant driver of stage movements as the opportunity for a counterparty to miss a payment is low due to the fact that over the life of exposure, any interest and or principal is directly debited from the counterparty’s investment balance and investment income, which is in turn held as collateral under the bank’s custody.
Materially all exposures in both the treasury book and investment management loan book follow a bullet repayment structure; therefore, the exposure at any point in time reflects the outstanding balance of the instrument at that point in time.
Definition of default The group considers an investment management loan book exposure to be in default when a client fails to respond to three sets of default notices (every 30 days for a period of 90 days). A treasury book exposure is deemed to be in default when a payment is past due by more than one working day (grace period).
Probability of default (PD) The group uses a lifetime PD for each exposure, which is the probability-weighted result of considering three economic scenarios: a base case, an upside scenario and a downside scenario. These scenarios include the forecast of the macroeconomic factors that have been identified as relevant to the bank’s exposures, namely GDP and UK unemployment rates, which are incorporated into the estimation of lifetime PDs.
The methodology for estimating lifetime PDs and adjustments for macroeconomic scenarios used for identifying significant increases in credit risk are as follows:
Treasury book assessment The 12-month PD for each exposure is initially estimated as the historical 12-month PD sourced from Standard & Poor’s, by credit rating and country of exposure. In order to estimate the PDs occurring over the lifetime of an underlying exposure, the group applies its expectations of future progression in point in time (‘PiT’) default probabilities, which inherently revolve around expectations of future development of macroeconomic factors relevant to treasury assets, namely UK GDP, UK unemployment rates, UK inflation and UK interest rates.
Loss given default (LGD) for treasury book assets is dependent on the nature of the counterparty and the region in which the instrument was issued. For sovereign exposures, the group applies a flat LGD rate, which is externally sourced from Moody’s most recent sovereign default and recovery rates research statistics, by country of issuer. For unsecured corporate exposures, a time series of historical corporate recovery rates is sourced from Moody’s annual publication on corporate defaults and recovery rates.
rathbones.com 185

186 Rathbone Brothers Plc Report and accounts 2020
33 Financial risk management continued
(i) Credit risk continued The following table presents an analysis of the credit quality of treasury book exposures at amortised cost and FVTPL. It indicates whether assets measured at amortised cost were subject to a 12-month ECL or lifetime ECL allowance and, in the latter case, whether they were credit-impaired: 2020 2019 At amortised cost
Fair value through profit or
loss £’000
12-month ECL £’000
Lifetime ECL – not credit-
impaired £’000
Lifetime ECL –
credit-impaired
£’000
Fair value through profit or loss
£’000 12-month ECL
£’000
Lifetime ECL – not credit-
impaired£’000
Lifetime ECL –
credit-impaired
£’000
AAA 99,262 – – – 100,194 – – – AA+ to AA- – 2,095,029 – – – 2,138,435 – – A+ to A- – 369,987 – – – 465,074 – – Gross carrying amounts 99,262 2,465,016 – – 100,194 2,603,509 – – Loss allowance (836) – – (259) – – Carrying amount 99,262 2,464,180 – – 100,194 2,603,250 – – Cash and balances with central banks – 1,802,706 – – – 1,932,996 – – Loans and advances to banks – 9,998 – – – 69,993 – – Unlisted debt securities – 651,427 – – – 600,261 – – Money market funds 99,262 – – – 100,194 – – – Carrying amount 99,262 2,464,131 – – 100,194 2,603,250 – –
The movement in allowance for impairment for the treasury book during the year was as follows.
12-month ECL
£’000
Lifetime ECL – not credit-
impaired £’000
Lifetime ECL – credit-impaired
£’000 Total ECL
£’000
Balance at 1 January 2019 259 – – 259Net remeasurement of loss allowance 577 577Balance at 31 December 2020 836 – – 836 Cash and balances with central banks 728 – – 728Loans and advances to banks 2 – – 2Unlisted debt securities 106 – – 106ECL provision 836 – – 836
As a result of the COVID-19 pandemic, there has been a material deterioration in the macroeconomic factors that serve as an input to the group’s PDs. The increase in the loss allowance during 2020 is predominantly due to an increase in the gross amount held with the Bank of England, against which the group holds the largest ECL provision.
Investment Management loan book assessment Due to the lack of historical defaults within the investment management loan book, the model uses publicly available default data for UK secured lending as a starting point in order to obtain an initial estimate for PD. The 12-month PD is estimated as the historical long-term default rate on lending in the UK as sourced from the Council of Mortgage Lenders (CML).
In order to estimate the PDs occurring over the lifetime of an underlying exposure, the group develops its expectations of future progression in PiT default probabilities, which inherently revolves around expectations of future development of macroeconomic factors relevant to the bank’s lending portfolio, namely UK GDP (‘GDP’) and UK unemployment rates (UR).
In order to develop and apply such forward-looking expectations, a historical relationship between PD, GDP and UR is estimated statistically through a multi-factor regression analysis of past movements between these variables. The relationship resulting from this analysis reflects the relative quantitative behaviour of the regressed macroeconomic factors against PD.
Using the calculated 12-month PiT PD as a starting point, conditional PDs for each future period within the period of exposure are estimated by applying the GDP and UR coefficients to the group’s forecasts of UK GDP and UK UR respectively, as sourced from International Monetary Fund (IMF) forecast data. This analysis forms the base case scenario for estimating lifetime PDs. The same methodology is applied for separate upside and downside scenarios as required by the standard.
Notes to the consolidated financial statements continued
186 Rathbone Brothers Plc Report and accounts 2020
| Consolidated financial statements

186 Rathbone Brothers Plc Report and accounts 2020
33 Financial risk management continued
(i) Credit risk continued The following table presents an analysis of the credit quality of treasury book exposures at amortised cost and FVTPL. It indicates whether assets measured at amortised cost were subject to a 12-month ECL or lifetime ECL allowance and, in the latter case, whether they were credit-impaired: 2020 2019 At amortised cost
Fair value through profit or
loss £’000
12-month ECL £’000
Lifetime ECL – not credit-
impaired £’000
Lifetime ECL –
credit-impaired
£’000
Fair value through profit or loss
£’000 12-month ECL
£’000
Lifetime ECL – not credit-
impaired£’000
Lifetime ECL –
credit-impaired
£’000
AAA 99,262 – – – 100,194 – – – AA+ to AA- – 2,095,029 – – – 2,138,435 – – A+ to A- – 369,987 – – – 465,074 – – Gross carrying amounts 99,262 2,465,016 – – 100,194 2,603,509 – – Loss allowance (836) – – (259) – – Carrying amount 99,262 2,464,180 – – 100,194 2,603,250 – – Cash and balances with central banks – 1,802,706 – – – 1,932,996 – – Loans and advances to banks – 9,998 – – – 69,993 – – Unlisted debt securities – 651,427 – – – 600,261 – – Money market funds 99,262 – – – 100,194 – – – Carrying amount 99,262 2,464,131 – – 100,194 2,603,250 – –
The movement in allowance for impairment for the treasury book during the year was as follows.
12-month ECL
£’000
Lifetime ECL – not credit-
impaired £’000
Lifetime ECL – credit-impaired
£’000 Total ECL
£’000
Balance at 1 January 2019 259 – – 259Net remeasurement of loss allowance 577 577Balance at 31 December 2020 836 – – 836 Cash and balances with central banks 728 – – 728Loans and advances to banks 2 – – 2Unlisted debt securities 106 – – 106ECL provision 836 – – 836
As a result of the COVID-19 pandemic, there has been a material deterioration in the macroeconomic factors that serve as an input to the group’s PDs. The increase in the loss allowance during 2020 is predominantly due to an increase in the gross amount held with the Bank of England, against which the group holds the largest ECL provision.
Investment Management loan book assessment Due to the lack of historical defaults within the investment management loan book, the model uses publicly available default data for UK secured lending as a starting point in order to obtain an initial estimate for PD. The 12-month PD is estimated as the historical long-term default rate on lending in the UK as sourced from the Council of Mortgage Lenders (CML).
In order to estimate the PDs occurring over the lifetime of an underlying exposure, the group develops its expectations of future progression in PiT default probabilities, which inherently revolves around expectations of future development of macroeconomic factors relevant to the bank’s lending portfolio, namely UK GDP (‘GDP’) and UK unemployment rates (UR).
In order to develop and apply such forward-looking expectations, a historical relationship between PD, GDP and UR is estimated statistically through a multi-factor regression analysis of past movements between these variables. The relationship resulting from this analysis reflects the relative quantitative behaviour of the regressed macroeconomic factors against PD.
Using the calculated 12-month PiT PD as a starting point, conditional PDs for each future period within the period of exposure are estimated by applying the GDP and UR coefficients to the group’s forecasts of UK GDP and UK UR respectively, as sourced from International Monetary Fund (IMF) forecast data. This analysis forms the base case scenario for estimating lifetime PDs. The same methodology is applied for separate upside and downside scenarios as required by the standard.
rathbones.com 187
The following table presents an analysis of the credit quality of investment management loan book exposures at amortised cost. It indicates whether assets measured at amortised cost were subject to a 12-month ECL or lifetime ECL allowance and, in the latter case, whether they were credit-impaired.
2020 2019 At amortised cost
12-month ECL
£’000
Lifetime ECL – not credit-
impaired £’000
Lifetime ECL – credit-impaired
£’000 12-month ECL
£’000
Lifetime ECL – not credit-
impaired£’000
Lifetime ECL – credit-impaired
£’000
Very low 29,931 – – 28,718 – – Low 103,626 – – 84,452 – – Medium 20,146 – – 18,471 – – High 3,917 337 – 40 353 – Gross carrying amounts 157,620 337 – 131,681 353 – Loss allowance – – – – – – Carrying amount 157,620 337 – 131,681 353 –
The movement in allowance for impairment of the investment management loan book during the year was as follows.
12-month ECL
£’000
Lifetime ECL – not credit-
impaired £’000
Lifetime ECL – credit-impaired
£’000 Total ECL
£’000
Balance at 1 January 2020 and 31 December 2020 – – – –
Trust and financial planning debtors assessment The group uses a provision matrix to measure the ECLs of trust and financial planning debtors, which comprise a large number of small balances. For such debts, a normal settlement period of up to 30 days is expected.
The following table provides information about the exposure to credit risk and ECLs for trust and financial planning debtors as at 31 December 2020:
2020
£’000 2019
£’000
Rathbone Trust Company 814 808 Rathbone Trust & Legal Services 324 221 Rathbone Financial Planning 287 244 Gross carrying amounts 1,425 1,273 Loss allowance (102) (103)Carrying amount 1,323 1,170
Loss allowance
Rathbone Trust Company
Weighted average loss rate
£’000
Gross carrying amount
£’000
Not credit impaired
£’000 Credit impaired
£’000 Total
£’000
<90 days overdue 0.3% 505 (2) – (2)90-180 days overdue 1.6% 97 (2) – (2)180-270 days overdue 2.8% 80 (2) (3) (5)270-365 days overdue 4.7% 26 (1) – (1)>365 days overdue 26.3% 106 (6) (82) (88) 814 (13) (85) (98)
rathbones.com 187

188 Rathbone Brothers Plc Report and accounts 2020
33 Financial risk management continued
(i) Credit risk continued Loss allowance
Rathbone Trust & Legal Services
Weighted average loss rate
£’000
Gross carrying amount
£’000
Not credit-impaired
£’000 Credit-impaired
£’000 Total
£’000
<90 days overdue 0.0% 272 – (4) (4)90-180 days overdue 0.0% 14 – – –180-270 days overdue 0.0% 21 – – –270-365 days overdue 0.0% 4 – – –>365 days overdue 0.0% 13 – – – 324 – (4) (4)
The movement in allowance for impairment in respect of trust and financial planning debtors during the year is set out below.
Movement in impairment provision during the year
Trust and financial planning debtors
£’000
At 1 January 103Amounts written off (6)Credit to profit or loss 5At 31 December 2020 102
Concentration of credit risk The group has counterparty credit risk within its financial assets in that exposure is to a number of similar credit institutions. The banking committee actively monitors counterparties and may reduce risk by either suspending dealing or liquidating investments in light of adverse market information, for example in anticipation of or in response to any formal Fitch or Moody’s rating downgrade. This may happen in relation to specific banks or banks within a particular country or sector.
(a) Geographical sectors The following table analyses the group’s credit exposures, at their carrying amounts, by geographical region as at the balance sheet date. In this analysis, exposures are categorised based on the country of domicile of the counterparty.
At 31 December 2020
United Kingdom
£’000 Eurozone
£’000
Rest ofthe World
£’000 Total
£’000
Cash and balances with central banks 1,802,706 – – 1,802,706Settlement balances 83,747 1,323 5,303 90,373Loans and advances to banks 157,618 – 1,812 159,430Loans and advances to customers: – overdrafts 5,633 25 726 6,384– investment management loan book 139,068 310 18,579 157,957– trust and financial planning debtors 1,323 – – 1,323– other debtors 557 – – 557Investment securities: – equity securities – 2,569 – 2,569– unlisted debt securities and money market funds 219,909 209,204 321,576 750,689Other financial assets 85,450 1,004 1,998 88,452 2,496,011 214,435 349,994 3,060,440
Notes to the consolidated financial statements continued
188 Rathbone Brothers Plc Report and accounts 2020
| Consolidated financial statements

188 Rathbone Brothers Plc Report and accounts 2020
33 Financial risk management continued
(i) Credit risk continued Loss allowance
Rathbone Trust & Legal Services
Weighted average loss rate
£’000
Gross carrying amount
£’000
Not credit-impaired
£’000 Credit-impaired
£’000 Total
£’000
<90 days overdue 0.0% 272 – (4) (4)90-180 days overdue 0.0% 14 – – –180-270 days overdue 0.0% 21 – – –270-365 days overdue 0.0% 4 – – –>365 days overdue 0.0% 13 – – – 324 – (4) (4)
The movement in allowance for impairment in respect of trust and financial planning debtors during the year is set out below.
Movement in impairment provision during the year
Trust and financial planning debtors
£’000
At 1 January 103Amounts written off (6)Credit to profit or loss 5At 31 December 2020 102
Concentration of credit risk The group has counterparty credit risk within its financial assets in that exposure is to a number of similar credit institutions. The banking committee actively monitors counterparties and may reduce risk by either suspending dealing or liquidating investments in light of adverse market information, for example in anticipation of or in response to any formal Fitch or Moody’s rating downgrade. This may happen in relation to specific banks or banks within a particular country or sector.
(a) Geographical sectors The following table analyses the group’s credit exposures, at their carrying amounts, by geographical region as at the balance sheet date. In this analysis, exposures are categorised based on the country of domicile of the counterparty.
At 31 December 2020
United Kingdom
£’000 Eurozone
£’000
Rest ofthe World
£’000 Total
£’000
Cash and balances with central banks 1,802,706 – – 1,802,706Settlement balances 83,747 1,323 5,303 90,373Loans and advances to banks 157,618 – 1,812 159,430Loans and advances to customers: – overdrafts 5,633 25 726 6,384– investment management loan book 139,068 310 18,579 157,957– trust and financial planning debtors 1,323 – – 1,323– other debtors 557 – – 557Investment securities: – equity securities – 2,569 – 2,569– unlisted debt securities and money market funds 219,909 209,204 321,576 750,689Other financial assets 85,450 1,004 1,998 88,452 2,496,011 214,435 349,994 3,060,440
rathbones.com 189
At 31 December 2019
UnitedKingdom
£’000 Eurozone
£’000
Rest ofthe World
£’000 Total
£’000
Cash and balances with central banks 1,932,996 – – 1,932,996Settlement balances 50,503 397 1,620 52,520Loans and advances to banks 176,032 – 1,800 177,832Loans and advances to customers: – overdrafts 4,868 37 243 5,148– investment management loan book 120,046 508 11,480 132,034– trust and financial planning debtors 1,170 – – 1,170– other debtors 60 – – 60Investment securities: –– equity securities – 1,186 – 1,186– unlisted debt securities and money market funds 189,984 280,283 230,188 700,455– Other financial assets 77,794 546 4,052 82,392 2,553,453 282,957 249,383 3,085,793
At 31 December 2020, materially all eurozone exposures were to counterparties based in the Netherlands, France, Finland, Ireland and Luxembourg (2019: Netherlands, France, Finland, Ireland and Luxembourg) and materially all rest of the world exposures were to counterparties based in Switzerland, Sweden, Norway, Canada and Australia (2019: Switzerland, Sweden, Norway, Canada and Australia). At 31 December 2020, the group had no exposure to sovereign debt (2019: no exposure to sovereign debt).
(b) Industry sectors The group’s credit exposures at the balance sheet date, analysed by the primary industry sectors in which our counterparties operate, were:
At 31 December 2020
Public sector £’000
Financial institutions
£’000
Clients and other
corporates £’000
Total £’000
Cash and balances with central banks 1,802,706 – – 1,802,706Settlement balances – 90,373 – 90,373Loans and advances to banks – 159,430 – 159,430Loans and advances to customers: – overdrafts – – 6,384 6,384– investment management loan book – – 157,957 157,957– trust and financial planning debtors – – 1,323 1,323– other debtors – – 557 557Investment securities: – equity securities – 2,569 – 2,569– unlisted debt securities and money market funds – 750,689 – 750,689Other financial assets 75 3,048 85,329 88,452 1,802,781 1,006,109 251,550 3,060,440
rathbones.com 189

190 Rathbone Brothers Plc Report and accounts 2020
33 Financial risk management continued
(i) Credit risk continued
At 31 December 2019
Publicsector£’000
Financial institutions
£’000
Clientsand other
corporates£’000
Total£’000
Cash and balances with central banks 1,932,996 – – 1,932,996Settlement balances – 52,520 – 52,520Loans and advances to banks – 177,832 – 177,832 Loans and advances to customers: – overdrafts – – 5,148 5,148– investment management loan book – – 132,034 132,034 – trust and financial planning debtors – – 1,170 1,170– other debtors – – 60 60Investment securities: – – equity securities – 1,186 – 1,186– unlisted debt securities and money market funds – 700,455 – 700,455Other financial assets 500 4,788 77,104 82,392 1,933,496 936,781 215,516 3,085,793
(ii) Liquidity risk Liquidity risk is the risk that the group will encounter difficulty in meeting obligations associated with financial liabilities that are settled by delivering cash or another financial asset.
The primary objective of the group’s treasury policy is to manage short- to medium-term liquidity requirements. In addition to setting the treasury policy, Rathbone Investment Management (‘the Bank’) performs an annual assessment of liquidity adequacy in accordance with the regulatory requirements of the Prudential Regulation Authority (PRA) (our Internal Liquidity Adequacy Assessment Process). The Bank faces two principal risks, namely that a significant proportion of client funds are withdrawn over a short period of time (retail funding risk) and the risk that marketable assets may not be capable of being realised in the time and at the value required (marketable assets risk).
Funding risks are monitored by daily cash mismatch analyses and CRR ratios using expected cash and asset maturity profiles and regular forecasting work. This is supported by stress tests which cover firm-specific idiosyncratic scenarios and/or the effects of unforeseen market-wide stresses. Marketable assets risk is primarily managed by holding cash and marketable instruments which are realisable at short notice. The group operates strict criteria to ensure that investments are liquid and placed with high-quality counterparties. A minimum liquid assets buffer (to be held in eligible liquid assets) is set by the board at least annually in conjunction with an amount prescribed by the PRA.
Non-derivative cash flows The table below presents the undiscounted cash flows receivable and payable by the group under non-derivative financial assets and liabilities analysed by the remaining contractual maturities at the balance sheet date.
Notes to the consolidated financial statements continued
190 Rathbone Brothers Plc Report and accounts 2020
| Consolidated financial statements

190 Rathbone Brothers Plc Report and accounts 2020
33 Financial risk management continued
(i) Credit risk continued
At 31 December 2019
Publicsector£’000
Financial institutions
£’000
Clientsand other
corporates£’000
Total£’000
Cash and balances with central banks 1,932,996 – – 1,932,996Settlement balances – 52,520 – 52,520Loans and advances to banks – 177,832 – 177,832 Loans and advances to customers: – overdrafts – – 5,148 5,148– investment management loan book – – 132,034 132,034 – trust and financial planning debtors – – 1,170 1,170– other debtors – – 60 60Investment securities: – – equity securities – 1,186 – 1,186– unlisted debt securities and money market funds – 700,455 – 700,455Other financial assets 500 4,788 77,104 82,392 1,933,496 936,781 215,516 3,085,793
(ii) Liquidity risk Liquidity risk is the risk that the group will encounter difficulty in meeting obligations associated with financial liabilities that are settled by delivering cash or another financial asset.
The primary objective of the group’s treasury policy is to manage short- to medium-term liquidity requirements. In addition to setting the treasury policy, Rathbone Investment Management (‘the Bank’) performs an annual assessment of liquidity adequacy in accordance with the regulatory requirements of the Prudential Regulation Authority (PRA) (our Internal Liquidity Adequacy Assessment Process). The Bank faces two principal risks, namely that a significant proportion of client funds are withdrawn over a short period of time (retail funding risk) and the risk that marketable assets may not be capable of being realised in the time and at the value required (marketable assets risk).
Funding risks are monitored by daily cash mismatch analyses and CRR ratios using expected cash and asset maturity profiles and regular forecasting work. This is supported by stress tests which cover firm-specific idiosyncratic scenarios and/or the effects of unforeseen market-wide stresses. Marketable assets risk is primarily managed by holding cash and marketable instruments which are realisable at short notice. The group operates strict criteria to ensure that investments are liquid and placed with high-quality counterparties. A minimum liquid assets buffer (to be held in eligible liquid assets) is set by the board at least annually in conjunction with an amount prescribed by the PRA.
Non-derivative cash flows The table below presents the undiscounted cash flows receivable and payable by the group under non-derivative financial assets and liabilities analysed by the remaining contractual maturities at the balance sheet date.
rathbones.com 191
At 31 December 2020
On demand
£’000
Not more than
3 months £’000
After 3 months but not
more than 1 year £’000
After 1 year but
not more than
5 years £’000
After 5 years £’000
No fixed maturity
date £’000
Total £’000
Cash and balances with central banks 1,798,000 75 5,434 – – – 1,803,509Settlement balances – 90,373 – – – – 90,373Loans and advances to banks 149,441 10,115 – – – – 159,556Loans and advances to customers 7,185 3,538 120 172,915 – – 183,758Debt securities and money market funds 99,274 216,041 438,845 – – – 754,160Equity securities 2,569 – – – – – 2,569Other financial assets 52 84,033 1,435 3,493 804 – 89,817Cash flows arising from financial assets 2,056,521 404,175 445,834 176,408 804 – 3,083,742 Deposits by banks 893 – – – – – 893Settlement balances – 95,412 – – – – 95,412Due to customers 2,453,676 106,706 1,392 – – – 2,561,774Subordinated loan notes – 453 20,453 – – – 20,906Other financial liabilities 1,478 57,914 8,088 62,313 52,621 – 182,414Cash flows arising from
financial liabilities 2,456,047 260,485 29,933 62,313 52,621 – 2,861,399 Net liquidity gap (399,526) 143,690 415,901 114,095 (51,817) – 222,343Cumulative net liquidity gap (399,526) (255,836) 160,065 274,160 222,343 222,343
At 31 December 2019
Ondemand
£’000
Not morethan
3 months£’000
After 3monthsbut not
more than1 year£’000
After 1year but
not morethan
5 years£’000
After 5 years
£’000
No fixedmaturity
date£’000
Total£’000
Cash and balances with central banks 1,930,001 500 3,218 – – – 1,933,719Settlement balances – 52,521 – – – – 52,521Loans and advances to banks 107,835 10,125 60,756 – – – 178,716Loans and advances to customers 5,393 20,743 55,251 61,864 – – 143,251Debt securities and money market funds 100,282 277,971 328,298 – – – 706,551Equity securities 1,186 – – – – – 1,186Other financial assets 671 74,783 1,026 3,954 1,585 – 82,019Cash flows arising from financial assets 2,145,368 436,643 448,549 65,818 1,585 – 3,097,963 Deposits by banks 28 – – – – – 28Settlement balances – 57,694 – – – – 57,694Due to customers 2,500,578 160,178 8,019 – – – 2,668,775Subordinated loan notes – 586 20,586 – – – 21,172Other financial liabilities 148 59,961 7,859 49,083 59,263 – 176,314Cash flows arising from
financial liabilities 2,500,754 278,419 36,464 49,083 59,263 – 2,923,983 Net liquidity gap (355,386) 158,224 412,085 16,735 (57,678) – 173,980 Cumulative net liquidity gap (355,386) (197,162) 214,923 231,658 173,980 173,980
Liabilities which do not have a contractual maturity date are categorised as ‘on demand’. Included within the amounts due to customers on demand are balances which historical experience shows are unlikely to be called in the short term. A prudent level of highly liquid assets is retained to cover reasonably foreseeable short-term changes in client deposits. All debt securities are readily marketable and can be realised through disposals.
The group holds £5,728,000 of equity investments (2019: £4,587,000) which are subject to liquidity risk but are not included in the table above. These assets are held as fair value through profit or loss securities and have no fixed maturity date; cash flows arise from receipt of dividends or through sale of the assets.
rathbones.com 191

192 Rathbone Brothers Plc Report and accounts 2020
33 Financial risk management continued
(iii) Market risk Off-balance-sheet items Cash flows arising from the group’s off-balance-sheet financial liabilities (note 35) are summarised in the table below.
The contractual value of the group’s commitments to extend credit to clients and maximum potential value of financial guarantees are analysed by the duration of the commitment. Future minimum lease payments under non-cancellable operating leases are reported by their contractual payment dates. Capital commitments are summarised by the earliest expected date of payment.
At 31 December 2020
Not morethan
3 months£’000
After 3 months but not
more than 1 year £’000
After 1 year but
not more than
5 years £’000
After5 years
£’000 Total
£’000
Loan commitments 39,510 – – – 39,510Financial guarantees – – – – –Capital commitments 26 – – – 26Total off-balance-sheet items 39,536 – – – 39,536
At 31 December 2019
Not morethan
3 months£’000
After 3monthsbut not
more than1 year£’000
After 1 year but
not more than
5 years £’000
After5 years
£’000 Total
£’000
Loan commitments 31,284 – – – 31,284Financial guarantees – – 117 – 117Capital commitments 787 – – – 787Total off-balance-sheet items 32,071 – 117 – 32,188
Total liquidity requirement
At 31 December 2020
On demand
£’000
Not more than
3 months £’000
After 3 months but not
more than 1 year £’000
After 1 year but
not more than
5 years £’000
After 5 years
£’000 Total
£’000
Cash flows arising from financial liabilities 2,456,047 260,485 29,933 62,313 52,621 2,861,399Total off-balance-sheet items – 39,536 – – – 39,536Total liquidity requirement 2,456,047 300,021 29,933 62,313 52,621 2,900,935
At 31 December 2019
Ondemand
£’000
Not morethan
3 months£’000
After 3monthsbut not
more than1 year£’000
After 1 year but
not more than
5 years £’000
After5 years
£’000 Total
£’000
Cash flows arising from financial liabilities 2,500,754 278,419 36,464 49,083 59,263 2,923,983Total off-balance-sheet items – 32,071 – 117 – 32,188Total liquidity requirement 2,500,754 310,490 36,464 49,200 59,263 2,956,171
Notes to the consolidated financial statements continued
192 Rathbone Brothers Plc Report and accounts 2020
| Consolidated financial statements

192 Rathbone Brothers Plc Report and accounts 2020
33 Financial risk management continued
(iii) Market risk Off-balance-sheet items Cash flows arising from the group’s off-balance-sheet financial liabilities (note 35) are summarised in the table below.
The contractual value of the group’s commitments to extend credit to clients and maximum potential value of financial guarantees are analysed by the duration of the commitment. Future minimum lease payments under non-cancellable operating leases are reported by their contractual payment dates. Capital commitments are summarised by the earliest expected date of payment.
At 31 December 2020
Not morethan
3 months£’000
After 3 months but not
more than 1 year £’000
After 1 year but
not more than
5 years £’000
After5 years
£’000 Total
£’000
Loan commitments 39,510 – – – 39,510Financial guarantees – – – – –Capital commitments 26 – – – 26Total off-balance-sheet items 39,536 – – – 39,536
At 31 December 2019
Not morethan
3 months£’000
After 3monthsbut not
more than1 year£’000
After 1 year but
not more than
5 years £’000
After5 years
£’000 Total
£’000
Loan commitments 31,284 – – – 31,284Financial guarantees – – 117 – 117Capital commitments 787 – – – 787Total off-balance-sheet items 32,071 – 117 – 32,188
Total liquidity requirement
At 31 December 2020
On demand
£’000
Not more than
3 months £’000
After 3 months but not
more than 1 year £’000
After 1 year but
not more than
5 years £’000
After 5 years
£’000 Total
£’000
Cash flows arising from financial liabilities 2,456,047 260,485 29,933 62,313 52,621 2,861,399Total off-balance-sheet items – 39,536 – – – 39,536Total liquidity requirement 2,456,047 300,021 29,933 62,313 52,621 2,900,935
At 31 December 2019
Ondemand
£’000
Not morethan
3 months£’000
After 3monthsbut not
more than1 year£’000
After 1 year but
not more than
5 years £’000
After5 years
£’000 Total
£’000
Cash flows arising from financial liabilities 2,500,754 278,419 36,464 49,083 59,263 2,923,983Total off-balance-sheet items – 32,071 – 117 – 32,188Total liquidity requirement 2,500,754 310,490 36,464 49,200 59,263 2,956,171
rathbones.com 193
Interest rate risk Cash flow interest rate risk is the risk that the future cash flows of a financial instrument will fluctuate because of changes in market interest rates. Fair value interest rate risk is the risk that the value of a financial instrument will fluctuate because of changes in market interest rates.
The group’s principal exposure to cash flow interest rate risk arises from the mismatch between the repricing of its financial assets and liabilities. In particular, customer accounts and loan balances are repriced very shortly after changes in base rates, whereas the yield on the group’s interest-bearing assets is correlated to the future expectation of base rates and varies depending on the maturity profile of the group’s treasury portfolio. The average maturity mismatch is controlled by the banking committee, which generally lengthens the mismatch when the yield curve is rising and shortens it when the yield curve is falling.
The table below shows the consolidated repricing profile of the group’s financial assets and liabilities, stated at their carrying amounts, categorised by the earlier of contractual repricing or maturity dates.
At 31 December 2020
Not more than
3 months £’000
After 3 months but not
more than 6 months
£’000
After 6 months but not
more than 1 year £’000
After 1 year but
not more than
5 years £’000
After 5 years
£’000
Non- interest-
bearing £’000
Total £’000
Assets Cash and balances with central banks 1,797,275 – – – – 5,431 1,802,706Settlement balances – – – – – 90,373 90,373Loans and advances to banks 159,180 – – – – 250 159,430Loans and advances to customers 163,879 – – 410 – 1,932 166,221Investment securities: – equity securities 2,569 – – – – 5,728 8,297– unlisted debt securities and money
market funds 313,840 206,930 229,919 – – – 750,689 Other financial assets 574 – – – – 87,878 88,452Total financial assets 2,437,317 206,930 229,919 410 – 191,592 3,066,168Liabilities Deposits by banks 893 – – – – – 893Settlement balances – – – – – 95,412 95,412Due to customers 2,510,762 1,391 – – – 49,614 2,561,767Subordinated loan notes – – 19,768 – – – 19,768Other financial liabilities – – – – – 135,548 135,548Total financial liabilities 2,511,655 1,391 19,768 – – 280,574 2,813,388Interest rate repricing gap (74,338) 205,539 210,151 410 – (88,982) 252,780
rathbones.com 193

194 Rathbone Brothers Plc Report and accounts 2020
33 Financial risk management continued
(iii) Market risk continued
At 31 December 2019
Not morethan
3 months£’000
After 3monthsbut not
more than6 months
£’000
After 6monthsbut not
more than1 year£’000
After 1year but
not morethan
5 years£’000
After 5 years
£’000
Non-interest-
bearing£’000
Total£’000
Assets Cash and balances with central banks 1,929,779 – – – – 3,218 1,932,997Settlement balances – – – – – 52,520 52,520Loans and advances to banks 117,555 29,998 29,996 – – 283 177,832Loans and advances to customers 136,680 – – – – 1,732 138,412Investment securities: – equity securities – – – – – 5,773 5,773– unlisted debt securities and money
market funds 375,483 204,989 119,983 – – – 700,455 Other financial assets 1,565 – – – – 82,013 83,578Total financial assets 2,561,062 234,987 149,979 – – 145,539 3,091,567 Liabilities Deposits by banks 28 – – – – – 28Settlement balances – – – – – 57,694 57,694Due to customers 2,584,048 7,969 – – – 76,628 2,668,645Subordinated loan notes – – 19,927 – – – 19,927Other financial liabilities – – – – 469 133,633 134,102Total financial liabilities 2,584,076 7,969 19,927 – 469 267,955 2,880,396 Interest rate repricing gap (23,014) 227,018 130,052 – (469) (122,416) 211,171
The banking committee has set an overall pre-tax interest rate exposure limit of £8,000,000 (2019: £7,000,000) for the total potential profit or loss resulting from an unexpected immediate and sustained 2% movement in sterling interest rates for the Bank, the principal operating subsidiary. The potential total profit or loss is calculated on the basis of the average number of days to repricing of the interest-bearing liabilities compared with the period to repricing on a corresponding amount of interest-bearing assets.
At 31 December 2020, the Bank had a net present value sensitivity of £4,756,000 (2019: £3,035,000) for an upward 2% shift in rates. The group held no forward rate agreements at 31 December 2020 (2019: none).
The group has assessed the impact of climate change and COVID-19 on the carrying amount of its financial assets and liabilities at the year end and considers there to be no material impact.
Notes to the consolidated financial statements continued
194 Rathbone Brothers Plc Report and accounts 2020
| Consolidated financial statements

194 Rathbone Brothers Plc Report and accounts 2020
33 Financial risk management continued
(iii) Market risk continued
At 31 December 2019
Not morethan
3 months£’000
After 3monthsbut not
more than6 months
£’000
After 6monthsbut not
more than1 year£’000
After 1year but
not morethan
5 years£’000
After 5 years
£’000
Non-interest-
bearing£’000
Total£’000
Assets Cash and balances with central banks 1,929,779 – – – – 3,218 1,932,997Settlement balances – – – – – 52,520 52,520Loans and advances to banks 117,555 29,998 29,996 – – 283 177,832Loans and advances to customers 136,680 – – – – 1,732 138,412Investment securities: – equity securities – – – – – 5,773 5,773– unlisted debt securities and money
market funds 375,483 204,989 119,983 – – – 700,455 Other financial assets 1,565 – – – – 82,013 83,578Total financial assets 2,561,062 234,987 149,979 – – 145,539 3,091,567 Liabilities Deposits by banks 28 – – – – – 28Settlement balances – – – – – 57,694 57,694Due to customers 2,584,048 7,969 – – – 76,628 2,668,645Subordinated loan notes – – 19,927 – – – 19,927Other financial liabilities – – – – 469 133,633 134,102Total financial liabilities 2,584,076 7,969 19,927 – 469 267,955 2,880,396 Interest rate repricing gap (23,014) 227,018 130,052 – (469) (122,416) 211,171
The banking committee has set an overall pre-tax interest rate exposure limit of £8,000,000 (2019: £7,000,000) for the total potential profit or loss resulting from an unexpected immediate and sustained 2% movement in sterling interest rates for the Bank, the principal operating subsidiary. The potential total profit or loss is calculated on the basis of the average number of days to repricing of the interest-bearing liabilities compared with the period to repricing on a corresponding amount of interest-bearing assets.
At 31 December 2020, the Bank had a net present value sensitivity of £4,756,000 (2019: £3,035,000) for an upward 2% shift in rates. The group held no forward rate agreements at 31 December 2020 (2019: none).
The group has assessed the impact of climate change and COVID-19 on the carrying amount of its financial assets and liabilities at the year end and considers there to be no material impact.
rathbones.com 195
Foreign exchange risk The group is exposed to translational foreign exchange risk as it undertakes transactions in foreign currencies and is therefore exposed to foreign exchange rate fluctuations. The group monitors its currency exposures that arise in the ordinary course of business on a daily basis and significant exposures are managed through the use of spot contracts, from time to time, so as to reduce any currency exposure to a minimal amount. The group has no structural foreign currency exposure.
The group does not have any material exposure to transactional foreign exchange risk. The table below summarises the group’s exposure to foreign currency translation risk at 31 December 2020. Included in the table are the group’s financial assets and liabilities, at carrying amounts, categorised by currency.
At 31 December 2020 Sterling
£’000 US dollar
£’000 Euro
£’000 Other £’000
Total £’000
Assets Cash and balances with central banks 1,802,706 – – – 1,802,706Settlement balances 88,192 1,609 178 394 90,373Loans and advances to banks 118,645 12,457 20,843 7,485 159,430Loans and advances to customers 158,077 4,310 3,834 – 166,221Investment securities: – equity securities 5,728 – 2,569 – 8,297– unlisted debt securities and money market funds 684,849 65,840 – – 750,689Other financial assets 87,897 377 130 48 88,452Total financial assets 2,946,094 84,593 27,554 7,927 3,066,168Liabilities Deposits by banks 893 – – – 893Settlement balances 88,109 3,284 1,103 2,916 95,412Due to customers 2,453,375 79,839 23,784 4,769 2,561,767Subordinated loan notes 19,768 – – – 19,768Other financial liabilities 135,308 181 59 – 135,548Total financial liabilities 2,697,453 83,304 24,946 7,685 2,813,388Net on-balance-sheet position 248,641 1,289 2,608 242 252,780Loan commitments 39,510 – – – 39,510
At 31 December 2019 Sterling
£’000 US dollar
£’000 Euro
£’000 Other£’000
Total£’000
Assets Cash and balances with central banks 1,932,997 – – – 1,932,997Settlement balances 51,918 376 90 136 52,520Loans and advances to banks 130,462 22,029 17,026 8,315 177,832Loans and advances to customers 131,263 3,543 3,606 – 138,412Investment securities: – equity securities 4,587 – 1,186 – 5,773– unlisted debt securities and money market funds 624,969 75,486 – – 700,455Other financial assets 82,881 440 185 72 83,578Total financial assets 2,959,077 101,874 22,093 8,523 3,091,567 Liabilities Deposits by banks 28 – – – 28Settlement balances 45,084 12,274 113 223 57,694Due to customers 2,552,287 88,668 19,726 7,964 2,668,645Subordinated loan notes 19,927 – – – 19,927Other financial liabilities 134,030 70 2 – 134,102Total financial liabilities 2,751,356 101,012 19,841 8,187 2,880,396 Net on-balance-sheet position 207,721 862 2,252 336 211,171 Loan commitments 31,284 – – – 31,284
rathbones.com 195

196 Rathbone Brothers Plc Report and accounts 2020
33 Financial risk management continued
(iii) Market risk continued A 10% weakening of the US dollar against sterling, occurring on 31 December 2020, would have reduced equity and profit after tax by £104,000 (2019: reduced by £70,000). A 10% weakening of the euro against sterling, occurring on 31 December 2020, would have reduced equity and profit after tax by £211,000 (2019: increased by £182,000). A 10% strengthening of the US dollar or euro would have had an equal and opposite effect. This analysis assumes that all other variables, in particular other exchange rates, remain constant.
Price risk Price risk is the risk that the fair value or future cash flows of a financial instrument will fluctuate because of changes in market prices (other than those arising from interest rate risk or foreign exchange risk). The group is exposed to price risk through its holdings of equity investment securities, which are reported at their fair value (note 17).
At 31 December 2020, the fair value of listed equity securities recognised on the balance sheet was £5,728,000 (2019: £4,587,000). A 10% fall in global equity markets would, in isolation, have resulted in a pre-tax decrease to net assets of £483,000 (2019: £348,000); there would have been no impact on profit after tax. A 10% rise in global markets would have had an equal and opposite effect.
Fair values The table below analyses financial instruments measured at fair value into a fair value hierarchy based on the valuation technique used to determine the fair value:
– Level 1: quoted prices (unadjusted) in active markets for identical assets or liabilities
– Level 2: inputs other than quoted prices included within level 1 that are observable for the asset or liability, either directly or indirectly. – Level 3: inputs for the asset or liability that are not based on observable market data.
At 31 December 2020 Level 1
£’000 Level 2
£’000 Level 3
£’000 Total
£’000
Assets Fair value through profit or loss: – equity securities 5,728 – 2,569 8,297– money market funds – 99,262 – 99,262 5,728 99,262 2,569 107,559
At 31 December 2019 Level 1
£’000 Level 2
£’000 Level 3
£’000 Total
£’000
Assets Fair value through profit or loss: – equity securities 4,587 – 1,186 5,773– money market funds – 100,194 – 100,194 4,587 100,194 1,186 105,967
The group recognises transfers between levels of the fair value hierarchy at the end of the reporting period during which the change has occurred. There have been no transfers between levels during the year (2019: none).
The fair value of listed equity securities is their quoted price. Money market funds are demand securities and changes to estimates of interest rates will not affect their fair value. The fair value of money market funds is their daily redemption value.
The fair values of the group’s other financial assets and liabilities are not materially different from their carrying values, with the exception of the following:
– Investment debt securities measured at amortised cost (note 17) comprise bank and building society certificates of deposit, which have fixed coupons. The fair value of debt securities at 31 December 2020 was £654,769,000 (2019: £604,462,000) and the carrying value was £651,533,000 (2019: £600,291,000). Fair value of debt securities is based on market bid prices, and hence would be categorised as level 1 within the fair value hierarchy.
– Subordinated loan notes (note 28) comprise Tier 2 loan notes. The fair value of the loan notes at 31 December 2020 was £21,726,000 (2019: £21,302,000) and the carrying value was £19,768,000 (2019: £19,927,000). Fair value of the loan notes is based on discounted future cash flows using current market rates for debts with similar remaining maturity, and hence would be categorised as level 2 in the fair value hierarchy.
Notes to the consolidated financial statements continued
196 Rathbone Brothers Plc Report and accounts 2020
| Consolidated financial statements

196 Rathbone Brothers Plc Report and accounts 2020
33 Financial risk management continued
(iii) Market risk continued A 10% weakening of the US dollar against sterling, occurring on 31 December 2020, would have reduced equity and profit after tax by £104,000 (2019: reduced by £70,000). A 10% weakening of the euro against sterling, occurring on 31 December 2020, would have reduced equity and profit after tax by £211,000 (2019: increased by £182,000). A 10% strengthening of the US dollar or euro would have had an equal and opposite effect. This analysis assumes that all other variables, in particular other exchange rates, remain constant.
Price risk Price risk is the risk that the fair value or future cash flows of a financial instrument will fluctuate because of changes in market prices (other than those arising from interest rate risk or foreign exchange risk). The group is exposed to price risk through its holdings of equity investment securities, which are reported at their fair value (note 17).
At 31 December 2020, the fair value of listed equity securities recognised on the balance sheet was £5,728,000 (2019: £4,587,000). A 10% fall in global equity markets would, in isolation, have resulted in a pre-tax decrease to net assets of £483,000 (2019: £348,000); there would have been no impact on profit after tax. A 10% rise in global markets would have had an equal and opposite effect.
Fair values The table below analyses financial instruments measured at fair value into a fair value hierarchy based on the valuation technique used to determine the fair value:
– Level 1: quoted prices (unadjusted) in active markets for identical assets or liabilities
– Level 2: inputs other than quoted prices included within level 1 that are observable for the asset or liability, either directly or indirectly. – Level 3: inputs for the asset or liability that are not based on observable market data.
At 31 December 2020 Level 1
£’000 Level 2
£’000 Level 3
£’000 Total
£’000
Assets Fair value through profit or loss: – equity securities 5,728 – 2,569 8,297– money market funds – 99,262 – 99,262 5,728 99,262 2,569 107,559
At 31 December 2019 Level 1
£’000 Level 2
£’000 Level 3
£’000 Total
£’000
Assets Fair value through profit or loss: – equity securities 4,587 – 1,186 5,773– money market funds – 100,194 – 100,194 4,587 100,194 1,186 105,967
The group recognises transfers between levels of the fair value hierarchy at the end of the reporting period during which the change has occurred. There have been no transfers between levels during the year (2019: none).
The fair value of listed equity securities is their quoted price. Money market funds are demand securities and changes to estimates of interest rates will not affect their fair value. The fair value of money market funds is their daily redemption value.
The fair values of the group’s other financial assets and liabilities are not materially different from their carrying values, with the exception of the following:
– Investment debt securities measured at amortised cost (note 17) comprise bank and building society certificates of deposit, which have fixed coupons. The fair value of debt securities at 31 December 2020 was £654,769,000 (2019: £604,462,000) and the carrying value was £651,533,000 (2019: £600,291,000). Fair value of debt securities is based on market bid prices, and hence would be categorised as level 1 within the fair value hierarchy.
– Subordinated loan notes (note 28) comprise Tier 2 loan notes. The fair value of the loan notes at 31 December 2020 was £21,726,000 (2019: £21,302,000) and the carrying value was £19,768,000 (2019: £19,927,000). Fair value of the loan notes is based on discounted future cash flows using current market rates for debts with similar remaining maturity, and hence would be categorised as level 2 in the fair value hierarchy.
rathbones.com 197
Level 3 financial instruments Fair value through profit or loss The group holds 1,809 shares in Euroclear Holdings SA, which are classed as level 3 in the fair value hierarchy since no observable market data is available. At 31 December 2019, the fair value of these shares was calculated with reference to the last buyback event in May 2017 when shares were sold at €774.
In the current period, the valuation of €1,586 per share has been calculated by reference to the most readily available data, which is the indicative price derived from recent transactions of the shares in the market. The valuation at the balance sheet date has been adjusted for movements in exchange rates since the acquisition date. A 10% weakening of the euro against sterling, occurring on 31 December 2020, would have reduced equity and profit after tax by £208,000 (2019: £96,000). A 10% strengthening of the euro against sterling would have had an equal and opposite effect.
Changes in the fair values of financial instruments categorised as level 3 within the fair value hierarchy were as follows:
2020 2019
At 1 January 1,186 1,259 Total unrealised (losses)/gains recognised in profit or loss 1,383 (73)At 31 December 2,569 1,186
The gains or losses relating to the fair value through profit or loss equity securities is included within ‘other operating income’ in the consolidated statement of comprehensive income.
There were no other gains or losses arising from changes in the fair value of financial instruments categorised as level 3 within the fair value hierarchy.
34 Capital management Rathbone Brothers Plc’s capital is defined for accounting purposes as total equity. As at 31 December 2020 this totalled £513,827,000 (2019: £485,393,000).
Rathbone Investment Management has issued 10-year subordinated Tier 2 loan notes (note 28). As at 31 December 2020, the carrying value of the notes was £19,768,000 (2019: £19,927,000). From time to time, the group also runs small overnight overdraft balances as part of working capital.
The group’s objectives when managing capital are to:
– safeguard the group’s ability to continue as a going concern so that it can continue to provide returns for shareholders and benefits for other stakeholders
– maintain a strong capital base in a cost-efficient manner to be able to support the development of the business when required – optimise the distribution of capital across group companies, reflecting the requirements of each business
– strive to make capital freely transferable across the group where possible – comply with regulatory requirements at all times.
Rathbones is classified for capital purposes as a banking group and performs an Internal Capital Adequacy Assessment Process (ICAAP), which is presented to the PRA on an annual basis. Regulatory capital resources for ICAAP purposes are calculated in accordance with published rules. These require certain adjustments to and certain deductions from accounting capital, the latter largely in respect of intangible assets. The ICAAP compares regulatory capital resources against regulatory capital requirements derived using the PRA’s Pillar 1 and Pillar 2 methodology. The group has adopted the standardised approach to calculating its Pillar 1 credit risk component and the basic indicator approach to calculating its operational risk component. Capital management policy and practices are applied at both group and entity level.
At 31 December 2020 the group’s regulatory capital resources, including retained earnings for 2020, were £303,752,000 (2019: £282,087,000). The increase in reserves during 2020 is due to an increase in the group’s retained earnings, on account of profits generated in the year.
In addition to a variety of stress tests performed as part of the ICAAP process, and daily reporting in respect of treasury activity, capital levels are monitored and forecast on a monthly basis to ensure that dividends and investment requirements are appropriately managed and appropriate buffers are kept against adverse business conditions.
No breaches were reported to the PRA during the financial years ended 31 December 2019 and 2020.
The group has not applied transitional relief in recognising expected credit losses (ECLs) in regulatory capital resources. As such, there is no difference between accounting ECLs and regulatory capital ECLs.
rathbones.com 197

198 Rathbone Brothers Plc Report and accounts 2020
35 Contingent liabilities and commitments (a) Capital expenditure authorised and contracted for at 31 December 2020 but not provided in the financial statements amounted
to £26,000 (2019: £787,000). This related to expenditure on fixtures and fittings (2019: leasehold improvements and fixtures and fittings).
(b) The contractual amounts of the group’s commitments to extend credit to its clients are as follows:
2020
£’000 2019
£’000
Guarantees – 117 Undrawn commitments to lend of 1 year or less 30,240 23,344 Undrawn commitments to lend of more than 1 year 9,270 7,940 39,510 31,401
The fair value of the guarantees is £nil (2019: £nil).
(c) The arrangements put in place by the Financial Services Compensation Scheme (FSCS) to protect depositors and investors from loss in the event of failure of financial institutions has resulted in significant levies on the industry in recent years. The financial impact of unexpected FSCS levies is largely out of the group’s control as they result from other industry failures.
There is uncertainty over the level of future FSCS levies as they depend on the ultimate cost to the FSCS of industry failures. The group contributes to the deposit class, investment fund management class and investment intermediation levy classes and accrues levy costs for future levy years when the obligation arises.
36 Related party transactions
Transactions with key management personnel The remuneration of the key management personnel of the group, who are defined as the company’s directors and other members of senior management who are responsible for planning, directing and controlling the activities of the group, is set out below.
Gains on options exercised by directors during the year totalled £nil (2019: £7,000). Further information about the remuneration of individual directors is provided in the audited part of the directors’ remuneration report on page 118.
2020
£’000 2019
£’000
Short-term employee benefits 9,829 14,176 Post-employment benefits 298 296 Other long-term benefits 941 2,695 Share-based payments 3,170 3,408 14,238 20,575
Dividends totalling £98,000 were paid in the year (2019: £95,000) in respect of ordinary shares held by key management personnel and their close family members.
As at 31 December 2020, the group had outstanding interest-free season ticket loans of nil (2019: nil) issued to key management personnel.
At 31 December 2020, key management personnel and their close family members had gross outstanding deposits of £616,000 (2019: £636,000) and gross outstanding banking loans of nil (2019: nil), all of which (2019: all) were made on normal business terms. A number of the group’s key management personnel and their close family members make use of the services provided by companies within the group. Charges for such services are made at various staff rates.
Notes to the consolidated financial statements continued
198 Rathbone Brothers Plc Report and accounts 2020
| Consolidated financial statements

198 Rathbone Brothers Plc Report and accounts 2020
35 Contingent liabilities and commitments (a) Capital expenditure authorised and contracted for at 31 December 2020 but not provided in the financial statements amounted
to £26,000 (2019: £787,000). This related to expenditure on fixtures and fittings (2019: leasehold improvements and fixtures and fittings).
(b) The contractual amounts of the group’s commitments to extend credit to its clients are as follows:
2020
£’000 2019
£’000
Guarantees – 117 Undrawn commitments to lend of 1 year or less 30,240 23,344 Undrawn commitments to lend of more than 1 year 9,270 7,940 39,510 31,401
The fair value of the guarantees is £nil (2019: £nil).
(c) The arrangements put in place by the Financial Services Compensation Scheme (FSCS) to protect depositors and investors from loss in the event of failure of financial institutions has resulted in significant levies on the industry in recent years. The financial impact of unexpected FSCS levies is largely out of the group’s control as they result from other industry failures.
There is uncertainty over the level of future FSCS levies as they depend on the ultimate cost to the FSCS of industry failures. The group contributes to the deposit class, investment fund management class and investment intermediation levy classes and accrues levy costs for future levy years when the obligation arises.
36 Related party transactions
Transactions with key management personnel The remuneration of the key management personnel of the group, who are defined as the company’s directors and other members of senior management who are responsible for planning, directing and controlling the activities of the group, is set out below.
Gains on options exercised by directors during the year totalled £nil (2019: £7,000). Further information about the remuneration of individual directors is provided in the audited part of the directors’ remuneration report on page 118.
2020
£’000 2019
£’000
Short-term employee benefits 9,829 14,176 Post-employment benefits 298 296 Other long-term benefits 941 2,695 Share-based payments 3,170 3,408 14,238 20,575
Dividends totalling £98,000 were paid in the year (2019: £95,000) in respect of ordinary shares held by key management personnel and their close family members.
As at 31 December 2020, the group had outstanding interest-free season ticket loans of nil (2019: nil) issued to key management personnel.
At 31 December 2020, key management personnel and their close family members had gross outstanding deposits of £616,000 (2019: £636,000) and gross outstanding banking loans of nil (2019: nil), all of which (2019: all) were made on normal business terms. A number of the group’s key management personnel and their close family members make use of the services provided by companies within the group. Charges for such services are made at various staff rates.
rathbones.com 199
Other related party transactions The group’s transactions with the pension funds are described in note 29. At 31 December 2020, no amounts were outstanding with either the Laurence Keen Scheme or the Rathbone 1987 Scheme (2019: none).
One group subsidiary, Rathbone Unit Trust Management, has authority to manage the investments within a number of unit trusts. Another group company, Rathbone Investment Management International, acted as investment manager for a protected cell company offering unitised private client portfolio services. During 2020, the group managed 28 unit trusts, Sociétés d’Investissement à Capital Variable (SICAVs) and open-ended investment companies (OEICs) (together, ‘collectives’) (2019: 27 unit trusts and OEICs).
The group charges each fund an annual management fee for these services, but does not earn any performance fees on the unit trusts. The management charges are calculated on the bases published in the individual fund prospectuses, which also state the terms and conditions of the management contract with the group.
The following transactions and balances relate to the group’s interest in the unit trusts:
Year ended 31 December 2020
£’000 2019
£’000
Total management fees 45,657 40,111
As at 31 December 2020
£’0002019
£’000
Management fees owed to the group 4,885 3,904 Holdings in unit trusts (note 17) 5,728 4,587 10,613 8,491
Total management fees are included within ‘fee and commission income’ in the consolidated statement of comprehensive income.
Management fees owed to the group are included within ‘accrued income’ and holdings in unit trusts are classified as ‘fair value through profit or loss equity securities’ in the consolidated balance sheet. The maximum exposure to loss is limited to the carrying amount on the balance sheet as disclosed above.
All amounts outstanding with related parties are unsecured and will be settled in cash. No guarantees have been given or received. No expected credit loss provisions have been made in respect of the amounts owed by related parties.
37 Interest in unconsolidated structured entities As described in note 36, at 31 December 2020, the group owned units in collectives managed by Rathbone Unit Trust Management with a value of £5,728,000 (2019: £4,587,000), representing 0.06% (2019: 0.08%) of the total value of the collectives managed by the group. These assets are held to hedge the group’s exposure to deferred remuneration schemes for employees of Funds.
The group’s primary risk associated with its interest in the unit trusts is from changes in the fair value of its holdings in the funds.
The group is not judged to control, and therefore does not consolidate, the collectives. Although the fund trustees have limited rights to remove Rathbone Unit Trust Management as manager, the group is exposed to very low variability of returns from its management and share of ownership of the funds and is therefore judged to act as an agent rather than having control under IFRS 10.
rathbones.com 199

200 Rathbone Brothers Plc Report and accounts 2020
38 Consolidated statement of cash flows For the purposes of the consolidated statement of cash flows, cash and cash equivalents comprise the following balances with less than three months until maturity from the date of acquisition:
2020
£’000 2019
£’000
Cash and balances at central banks (note 14) 1,798,000 1,930,000 Loans and advances to banks (note 15) 159,432 117,839 Fair value through profit or loss investment securities (note 17) 99,262 100,194 At 31 December 2,056,694 2,148,033
Fair value thought profit or loss investment securities are amounts invested in money market funds, which are realisable on demand.
Cash flows arising from the (repurchase)/issue of ordinary shares comprise:
2020
£’000 2019
£’000
Share capital issued (note 30) 56 58 Share premium on shares issued (note 30) 4,153 5,666 Merger reserve on shares issued (note 30) – 14,971 Shares issued in relation to share-based schemes for which no cash consideration was received – (15,001)Shares issued in relation to share buybacks (5,077) (10,034) (868) (4,340)
A reconciliation of the movements of liabilities to cash flows arising from financing activities was as follows: Liabilities Equity
Subordinated loan notes
£’000
Share capital/ premium
£’000 Reserves
£’000
Retained earnings
£’000 Total
£’000
At 1 January 2020 19,927 213,757 29,785 241,851 505,320 Changes from financing cash flows Proceeds from issue of share capital – 4,209 – – 4,209Proceeds from sale of treasury shares – – (4,773) (304) (5,077)Dividends paid – – – (37,831) (37,831)Total changes from financing cash flows – 4,209 (4,773) (38,135) (38,699)The effect of changes in foreign exchange rates – – – – –Changes in fair value – – – – –Other changes (393) – – – (393)Liability-related Interest expense 1,294 – – – 1,294Interest paid (1,060) – – – (1,060)Total liability-related changes (159) – – – (159)Total equity-related other changes – – – 67,133 67,133At 31 December 2020 19,768 217,966 25,012 270,849 533,595
Notes to the consolidated financial statements continued
200 Rathbone Brothers Plc Report and accounts 2020
| Consolidated financial statements

200 Rathbone Brothers Plc Report and accounts 2020
38 Consolidated statement of cash flows For the purposes of the consolidated statement of cash flows, cash and cash equivalents comprise the following balances with less than three months until maturity from the date of acquisition:
2020
£’000 2019
£’000
Cash and balances at central banks (note 14) 1,798,000 1,930,000 Loans and advances to banks (note 15) 159,432 117,839 Fair value through profit or loss investment securities (note 17) 99,262 100,194 At 31 December 2,056,694 2,148,033
Fair value thought profit or loss investment securities are amounts invested in money market funds, which are realisable on demand.
Cash flows arising from the (repurchase)/issue of ordinary shares comprise:
2020
£’000 2019
£’000
Share capital issued (note 30) 56 58 Share premium on shares issued (note 30) 4,153 5,666 Merger reserve on shares issued (note 30) – 14,971 Shares issued in relation to share-based schemes for which no cash consideration was received – (15,001)Shares issued in relation to share buybacks (5,077) (10,034) (868) (4,340)
A reconciliation of the movements of liabilities to cash flows arising from financing activities was as follows: Liabilities Equity
Subordinated loan notes
£’000
Share capital/ premium
£’000 Reserves
£’000
Retained earnings
£’000 Total
£’000
At 1 January 2020 19,927 213,757 29,785 241,851 505,320 Changes from financing cash flows Proceeds from issue of share capital – 4,209 – – 4,209Proceeds from sale of treasury shares – – (4,773) (304) (5,077)Dividends paid – – – (37,831) (37,831)Total changes from financing cash flows – 4,209 (4,773) (38,135) (38,699)The effect of changes in foreign exchange rates – – – – –Changes in fair value – – – – –Other changes (393) – – – (393)Liability-related Interest expense 1,294 – – – 1,294Interest paid (1,060) – – – (1,060)Total liability-related changes (159) – – – (159)Total equity-related other changes – – – 67,133 67,133At 31 December 2020 19,768 217,966 25,012 270,849 533,595
rathbones.com 201
Liabilities Equity
Subordinated loan notes
£’000
Share capital/premium
£’000 Reserves
£’000
Retainedearnings
£’000 Total
£’000
At 1 January 2019 (restated) 19,807 208,033 24,048 232,059 483,947 Changes from financing cash flows Proceeds from issue of share capital – 5,694 – – 5,694Proceeds from sale of treasury shares – – (9,234) (799) (10,033)Dividends paid – – – (35,959) (35,959)Total changes from financing cash flows – 5,694 (9,234) (36,758) (40,298)The effect of changes in foreign exchange rates – – – – – Changes in fair value – – – – – Other changes Liability-related Interest expense 1,291 – – – 1,291Interest paid (1,171) – – – (1,171)Total liability-related changes 120 – – – 120 Total equity-related other changes – 30 14,971 46,550 61,551 At 31 December 2019 19,927 213,757 29,785 241,851 505,320
39 Events after the balance sheet date There have been no material events occurring between the balance sheet date and the date of signing this report.
rathbones.com 201

202 Rathbone Brothers Plc Report and accounts 2020
40 Country-by-country reporting HM Treasury has transposed the requirements set out under the Capital Requirements Directive IV (CRD IV) and issued the Capital Requirements Country-by-Country Reporting Regulations 2013, effective 1 January 2014. The legislation requires Rathbone Brothers Plc (together with its subsidiaries, ‘the group’) to publish certain additional information, on a consolidated basis, for the year ended 31 December 2020.
Basis of preparation:
Country In most cases, we have determined the country by reference to the country of tax residence. Where an entity is not subject to tax (e.g. a partnership) we have considered the location of management or the jurisdiction in which the revenues are generated. In these cases it is possible that tax is paid in a different country to the one in which profits are reported.
Nature of activities The nature of activities within the United Kingdom are described within our services on pages 6 and 7.Discretionary investment management is the sole activity which occurs in Jersey.
Turnover Turnover is defined as operating income. As the consolidated results are split by country, there is an element of double counting when inter-jurisdictional transactions (for example, the payment of dividends) occur. The entries to eliminate this double counting are included at the bottom of the table to enable the disclosed figures to agree to the published consolidated accounts of the group.
Profit/(loss) before taxation These are accounting profits. As with turnover some double counting may arise and again this has been eliminated at the bottom of the table. The majority of the total relates to the elimination of inter-jurisdictional dividends, which are reflected as profits in the United Kingdom.
Tax paid This column reflects corporation tax actually paid in the year. Note that it is rare that tax paid in any given year relates directly to the profits earned in the same period.
Public subsidies received The group received no public subsidies in the year.
Number of employees The number of employees reported is the average number of full-time employees who were permanently employed by the group, or one of its subsidiaries, during the year. Contractors are excluded.
Subsidiaries A list of the subsidiaries of the group, including their main activity and country of incorporation, is shown within note 45.
Country Turnover
£’000
Profit/(loss) before
taxation £’000
Tax paid £’000
Number of employees
United Kingdom 357,888 75,726 21,090 1,511Jersey 12,488 2,501 321 24Sub-total 370,376 78,227 21,411 1,535Inter-group eliminations and other entries arising on consolidation (4,288) (34,448) – –Total 366,088 43,779 21,411 1,535
Notes to the consolidated financial statements continued
202 Rathbone Brothers Plc Report and accounts 2020
| Consolidated financial statements

202 Rathbone Brothers Plc Report and accounts 2020
40 Country-by-country reporting HM Treasury has transposed the requirements set out under the Capital Requirements Directive IV (CRD IV) and issued the Capital Requirements Country-by-Country Reporting Regulations 2013, effective 1 January 2014. The legislation requires Rathbone Brothers Plc (together with its subsidiaries, ‘the group’) to publish certain additional information, on a consolidated basis, for the year ended 31 December 2020.
Basis of preparation:
Country In most cases, we have determined the country by reference to the country of tax residence. Where an entity is not subject to tax (e.g. a partnership) we have considered the location of management or the jurisdiction in which the revenues are generated. In these cases it is possible that tax is paid in a different country to the one in which profits are reported.
Nature of activities The nature of activities within the United Kingdom are described within our services on pages 6 and 7.Discretionary investment management is the sole activity which occurs in Jersey.
Turnover Turnover is defined as operating income. As the consolidated results are split by country, there is an element of double counting when inter-jurisdictional transactions (for example, the payment of dividends) occur. The entries to eliminate this double counting are included at the bottom of the table to enable the disclosed figures to agree to the published consolidated accounts of the group.
Profit/(loss) before taxation These are accounting profits. As with turnover some double counting may arise and again this has been eliminated at the bottom of the table. The majority of the total relates to the elimination of inter-jurisdictional dividends, which are reflected as profits in the United Kingdom.
Tax paid This column reflects corporation tax actually paid in the year. Note that it is rare that tax paid in any given year relates directly to the profits earned in the same period.
Public subsidies received The group received no public subsidies in the year.
Number of employees The number of employees reported is the average number of full-time employees who were permanently employed by the group, or one of its subsidiaries, during the year. Contractors are excluded.
Subsidiaries A list of the subsidiaries of the group, including their main activity and country of incorporation, is shown within note 45.
Country Turnover
£’000
Profit/(loss) before
taxation £’000
Tax paid £’000
Number of employees
United Kingdom 357,888 75,726 21,090 1,511Jersey 12,488 2,501 321 24Sub-total 370,376 78,227 21,411 1,535Inter-group eliminations and other entries arising on consolidation (4,288) (34,448) – –Total 366,088 43,779 21,411 1,535
Company statement of changes in equity for the year ended 31 December 2020
rathbones.com 203
Note Share capital
£’000 Share premium
£’000 Merger Reserve
£’000 Own shares
£’000
Retained earnings
£’000 Total equity
£’000
At 1 January 2019 (restated) 2,760 205,273 24,950 (32,737) 101,624 301,870 Profit for the year – – – – 29,451 29,451
Net remeasurement of defined
benefit liability 53 – – – – 310 310
Deferred tax relating to components of
other comprehensive income 49 – – – – (53) (53) Other comprehensive income net of tax – – – – 257 257 Dividends paid 44 – – – – (35,959) (35,959) Issue of share capital 54 58 5,666 14,971 – – 20,695 Share-based payments: – value of employee services – – – – 19,387 19,387 – cost of own shares acquired 54 – – – (10,033) – (10,033) – cost of own shares vesting 54 – – – 799 (799) – – tax on share-based payments – – – – (17) (17) At 31 December 2019 2,818 210,939 39,921 (41,971) 113,944 325,651 Profit for the year 24,155 24,155
Net remeasurement of defined
benefit liability 53 – – – – (4,682) (4,682)
Deferred tax relating to components of
other comprehensive income 49 – – – – 1,668 1,668 Other comprehensive income net of tax – – – – (3,014) (3,014) Dividends paid 44 – – – – (37,831) (37,831) Issue of share capital 54 56 4,153 – – – 4,209 Share-based payments: – value of employee services – – – – 43,634 43,634 – cost of own shares acquired 54 – – – (5,077) – (5,077) – cost of own shares vesting 54 – – – 304 (304) – – tax on share-based payments – – – – (140) (140) At 31 December 2020 2,874 215,092 39,921 (46,744) 140,444 351,587
The accompanying notes form an integral part of the company financial statements.
rathbones.com 203

Company balance sheet for the year ended 31 December 2020
204 Rathbone Brothers Plc Report and accounts 2020
Note
2020 £’000
2019£’000
Non-current assets Investment in subsidiaries 45 323,055 273,055 Other investments 46 15,728 14,587 Right-of-use assets 48 43,897 48,540 Deferred tax 49 6,100 5,106 388,780 341,288 Current assets Trade and other receivables 47 112,361 124,722 Cash and cash equivalents 12,611 4,204 124,972 128,926 Total assets 513,752 470,214 Current liabilities Trade and other payables 50 (89,804) (69,990)Lease liabilities (55,123) (60,026)Current tax liability (5) (647)Provisions for liabilities and charges 52 (7,448) (5,886) (152,380) (136,549) Net current assets (27,408) (7,623) Non-current liabilities Retirement benefit obligations 53 (9,785) (8,014)Total liabilities (162,165) (144,563) Net assets 351,587 325,651 Equity Share capital 54 2,874 2,818 Share premium 54 215,092 210,939 Merger reserve 57 39,921 39,921 Own shares 54 (46,744) (41,971)Retained earnings 140,444 113,944Equity shareholders’ funds 351,587 325,651
As permitted by section 408 of the Companies Act 2006 the company has elected not to present its own statement of comprehensive income for the year. Rathbone Brothers Plc reported a profit after tax for the financial year ended 31 December 2020 of £24,155,000 (2019: £29,451,000).
The financial statements were approved by the board of directors and authorised for issue on 3 March 2021 and were signed on their behalf by:
Paul Stockton Chief Executive
Jennifer MathiasFinance Director
Company registered number: 01000403
The accompanying notes form an integral part of the company financial statements.
204 Rathbone Brothers Plc Report and accounts 2020
Company financial statements

Company balance sheet for the year ended 31 December 2020
204 Rathbone Brothers Plc Report and accounts 2020
Note
2020 £’000
2019£’000
Non-current assets Investment in subsidiaries 45 323,055 273,055 Other investments 46 15,728 14,587 Right-of-use assets 48 43,897 48,540 Deferred tax 49 6,100 5,106 388,780 341,288 Current assets Trade and other receivables 47 112,361 124,722 Cash and cash equivalents 12,611 4,204 124,972 128,926 Total assets 513,752 470,214 Current liabilities Trade and other payables 50 (89,804) (69,990)Lease liabilities (55,123) (60,026)Current tax liability (5) (647)Provisions for liabilities and charges 52 (7,448) (5,886) (152,380) (136,549) Net current assets (27,408) (7,623) Non-current liabilities Retirement benefit obligations 53 (9,785) (8,014)Total liabilities (162,165) (144,563) Net assets 351,587 325,651 Equity Share capital 54 2,874 2,818 Share premium 54 215,092 210,939 Merger reserve 57 39,921 39,921 Own shares 54 (46,744) (41,971)Retained earnings 140,444 113,944Equity shareholders’ funds 351,587 325,651
As permitted by section 408 of the Companies Act 2006 the company has elected not to present its own statement of comprehensive income for the year. Rathbone Brothers Plc reported a profit after tax for the financial year ended 31 December 2020 of £24,155,000 (2019: £29,451,000).
The financial statements were approved by the board of directors and authorised for issue on 3 March 2021 and were signed on their behalf by:
Paul Stockton Chief Executive
Jennifer MathiasFinance Director
Company registered number: 01000403
The accompanying notes form an integral part of the company financial statements.
Company statement of cash flows for the year ended 31 December 2020
rathbones.com 205
Note
2020 £’000
2019£’000
Cash flows from operating activities Profit before tax 26,920 29,327 Change in fair value through profit or loss (494) (482)Net interest and dividends receivable (54,764) (53,980)Net charge for provisions 52 (428) 1,590 Depreciation and amortisation 4,643 4,499 Defined benefit pension scheme charges 53 200 255 Defined benefit pension scheme contributions paid 53 (3,111) (3,128)Share-based payment charges 54 39,986 31,012 12,952 9,093 Changes in operating assets and liabilities: – net decrease/(increase) in prepayments, accrued income and other assets 12,579 (22,177)– net increase in accruals, deferred income, provisions and other liabilities 25,413 4,309 Cash used in/(generated from) operations 50,944 (8,775)Tax (paid)/received (2,876) (814)Net cash inflow/(outflow) from operating activities 48,068 (9,589)Cash flows from investing activities Interest received 66 107 Interest paid (3,299) (4,127)Inter-company dividends received 58,000 58,000 Investment in subsidiaries 45 (50,000) – Purchase of right-of-use assets 45 (182) – Purchase of other investments (1,063) (899)Proceeds from sale of investments 417 –Net cash generated from investing activities 3,939 53,081 Cash flows from financing activities Net (repurchase)/issue of ordinary shares 54 (868) (4,340)Dividends paid 44 (37,831) (35,959)Payment of lease liabilities (4,901) (4,375)Net cash used in financing activities (43,600) (44,674)Net increase/(decrease) in cash and cash equivalents 8,407 (1,182)Cash and cash equivalents at the beginning of the year 4,204 5,386 Cash and cash equivalents at the end of the year 59 12,611 4,204
The accompanying notes form an integral part of the company financial statements.
rathbones.com 205

Notes to the company financial statements
206 Rathbone Brothers Plc Report and accounts 2020
41 Significant accounting policies
Statement of compliance The separate financial statements of the company are presented as required by the Companies Act 2006 and have been prepared in accordance with International Financial Reporting Standards (IFRS), as adopted by the European Union, and IAS 27 ‘Separate Financial Statements’.
On publishing the parent company financial statements here together with the group financial statements, the company is taking advantage of the exemption in section 408 of the Companies Act 2006 not to present its individual statement of comprehensive income and related notes that form a part of these approved financial statements.
Developments in reporting standards and interpretations Developments in reporting standards and interpretations are set out in note 1.3 to the consolidated financial statements.
Principal accounting policies The financial statements have been prepared on the historical cost basis, except for the revaluation of certain financial instruments. The principal accounting policies adopted are as set out below.
Investments in subsidiaries Investments in subsidiaries are stated at cost less, where appropriate, provision for impairment.
Management charges Intra-group management charges arise in relation to staff costs and other administrative expenses that are initially borne by the company and then recharged to other group companies, when incurred.
Accounting policies in relation to impairment, interest income, dividend income, operating leases, foreign currency, retirement benefit obligations, taxation, cash and cash equivalents and share-based payments are set out in note 1 to the consolidated financial statements.
42 Critical accounting judgements and key sources of estimation uncertainty The critical accounting judgements and key sources of estimation uncertainty arise from the company’s defined benefit pension schemes and valuation of the provision for the Speirs & Jeffrey earn-out consideration. These are described in note 2 to the consolidated financial statements.
43 Expenses for the year The auditor’s remuneration for audit and other services to the company is set out in note 7 to the financial statements.
The average number of employees, on a full-time-equivalent basis, during the year was as follows: 2020 2019
Investment Management: – investment management services 932 956 – advisory services 123 118 Funds 37 35 Shared services 379 377 1,471 1,486
Notes to the company financial statements
206 Rathbone Brothers Plc Report and accounts 2020
| Company financial statements

Notes to the company financial statements
206 Rathbone Brothers Plc Report and accounts 2020
41 Significant accounting policies
Statement of compliance The separate financial statements of the company are presented as required by the Companies Act 2006 and have been prepared in accordance with International Financial Reporting Standards (IFRS), as adopted by the European Union, and IAS 27 ‘Separate Financial Statements’.
On publishing the parent company financial statements here together with the group financial statements, the company is taking advantage of the exemption in section 408 of the Companies Act 2006 not to present its individual statement of comprehensive income and related notes that form a part of these approved financial statements.
Developments in reporting standards and interpretations Developments in reporting standards and interpretations are set out in note 1.3 to the consolidated financial statements.
Principal accounting policies The financial statements have been prepared on the historical cost basis, except for the revaluation of certain financial instruments. The principal accounting policies adopted are as set out below.
Investments in subsidiaries Investments in subsidiaries are stated at cost less, where appropriate, provision for impairment.
Management charges Intra-group management charges arise in relation to staff costs and other administrative expenses that are initially borne by the company and then recharged to other group companies, when incurred.
Accounting policies in relation to impairment, interest income, dividend income, operating leases, foreign currency, retirement benefit obligations, taxation, cash and cash equivalents and share-based payments are set out in note 1 to the consolidated financial statements.
42 Critical accounting judgements and key sources of estimation uncertainty The critical accounting judgements and key sources of estimation uncertainty arise from the company’s defined benefit pension schemes and valuation of the provision for the Speirs & Jeffrey earn-out consideration. These are described in note 2 to the consolidated financial statements.
43 Expenses for the year The auditor’s remuneration for audit and other services to the company is set out in note 7 to the financial statements.
The average number of employees, on a full-time-equivalent basis, during the year was as follows: 2020 2019
Investment Management: – investment management services 932 956 – advisory services 123 118 Funds 37 35 Shared services 379 377 1,471 1,486
rathbones.com 207
44 Dividends Details of the company’s dividends paid and proposed for approval at the Annual General Meeting are set out in note 12 to the consolidated financial statements.
The company’s dividend policy is described in the directors’ report on page 127.
Reserves available for distribution as at 31 December were as follows:
2020
£’000 2019
£’000
Net assets 351,587 325,651 Less: – share capital (2,874) (2,818)– share premium (215,092) (210,939)– merger reserve (39,921) (39,921)Distributable reserves 93,700 71,973
Movements in reserves available for distribution were as follows:
2020
£’000 2019
£’000
As at 1 January 71,973 68,887 Profit for the year 24,155 29,451 Net remeasurement of defined benefit liability (3,014) 257 Dividends paid (37,831) (35,959)Other movements 38,417 9,337 As at 31 December 93,700 71,973
45 Investment in subsidiaries
Equities
£’000 Total
£’000
At 1 January 2019 273,055 273,055 Additions 92,552 92,552 Disposals (92,552) (92,552)At 1 January 2020 273,055 273,055 Additions 50,000 50,000 Disposals – – At 31 December 2020 323,055 323,055
rathbones.com 207

208 Rathbone Brothers Plc Report and accounts 2020
45 Investment in subsidiaries continued
Equities On 1 July 2019, ordinary shares of 5p in Rathbone Investment Management Limited were issued to the company at a price of £90 per share in exchange for the company’s equity holding in Speirs & Jeffrey Limited.
On 30 April 2020, 588,235 ordinary shares of £1 each in Rathbone Investment Management Limited were issued to the company at a price of £85 per share for cash consideration.
At 31 December 2020 the company’s subsidiary undertakings were as follows: Subsidiary undertaking Activity and operation
Rathbone Investment Management Limited Investment management and banking servicesRathbone Investment Management International Limited* Investment managementRathbone Trust Company Limited Trust and tax servicesRathbone Unit Trust Management Limited* Unit trust managementArcticstar Limited Introducer of private clientsVision Independent Financial Planning Limited Financial planning servicesCastle Investment Solutions Limited Investment support servicesRathbone Trust Legal Services Limited* Trust and legal servicesLaurence Keen Holdings Limited Intermediate holding companyRathbone Directors Limited* Corporate director servicesRathbone Secretaries Limited* Corporate secretarial servicesLaurence Keen Nominees Limited* Corporate nomineeNeilson Cobbold Client Nominees Limited* Corporate nomineeRathbone Nominees Limited* Corporate nomineeCitywall Nominees Limited* Corporate nomineePenchart Nominees Limited* Corporate nomineeArgus Nominee Limited Corporate nomineeRathbone Pension & Advisory Services Limited Non-tradingRathbone Stockbrokers Limited* Non-tradingDean River Asset Management Limited* Non-tradingR.M. Walkden & Co. Limited* Non-tradingRathbone Funds Advisers Unipessoal LDA* European fund marketingSpeirs & Jeffrey Limited* Investment managementSpeirs & Jeffrey Client Nominees Limited* Corporate nomineeSpeirs & Jeffrey Portfolio Management Limited* Corporate nomineeSpeirs & Jeffrey Fund Management Limited* Corporate nominee* Held by subsidiary undertaking
The registered office for all subsidiary undertakings is 8 Finsbury Circus, London EC2M 7AZ except for the following:
Subsidiary undertaking Registered office
Rathbone Investment Management Limited Port of Liverpool Building, Pier Head, Liverpool L3 1NWRathbone Investment Management International Limited 26 Esplanade, St Helier, Jersey JE1 2RBVision Independent Financial Planning Limited Vision House, Unit 6A Falmouth Business Park,
Bickland Water Road, Falmouth, Cornwall TR11 4SZ Castle Investment Solutions Limited Vision House, Unit 6A Falmouth Business Park,
Bickland Water Road, Falmouth, Cornwall TR11 4SZ Speirs & Jeffrey Limited George House, 50 George Square, Glasgow G2 1EHSpeirs & Jeffrey Client Nominees Limited George House, 50 George Square, Glasgow G2 1EHSpeirs & Jeffrey Portfolio Management Limited George House, 50 George Square, Glasgow G2 1EHSpeirs & Jeffrey Fund Management Limited George House, 50 George Square, Glasgow G2 1EHRathbone Funds Advisers Unipessoal LDA R Tierno Galvan 10 Torre 3, Piso 6 Sala 602, 1070-274,
Campo Ourique Lisbon, Lisbon, Portugal
The company owns, directly or indirectly, 100% of the ordinary share capital of all subsidiary undertakings.
Notes to the company financial statements continued
208 Rathbone Brothers Plc Report and accounts 2020
| Company financial statements

208 Rathbone Brothers Plc Report and accounts 2020
45 Investment in subsidiaries continued
Equities On 1 July 2019, ordinary shares of 5p in Rathbone Investment Management Limited were issued to the company at a price of £90 per share in exchange for the company’s equity holding in Speirs & Jeffrey Limited.
On 30 April 2020, 588,235 ordinary shares of £1 each in Rathbone Investment Management Limited were issued to the company at a price of £85 per share for cash consideration.
At 31 December 2020 the company’s subsidiary undertakings were as follows: Subsidiary undertaking Activity and operation
Rathbone Investment Management Limited Investment management and banking servicesRathbone Investment Management International Limited* Investment managementRathbone Trust Company Limited Trust and tax servicesRathbone Unit Trust Management Limited* Unit trust managementArcticstar Limited Introducer of private clientsVision Independent Financial Planning Limited Financial planning servicesCastle Investment Solutions Limited Investment support servicesRathbone Trust Legal Services Limited* Trust and legal servicesLaurence Keen Holdings Limited Intermediate holding companyRathbone Directors Limited* Corporate director servicesRathbone Secretaries Limited* Corporate secretarial servicesLaurence Keen Nominees Limited* Corporate nomineeNeilson Cobbold Client Nominees Limited* Corporate nomineeRathbone Nominees Limited* Corporate nomineeCitywall Nominees Limited* Corporate nomineePenchart Nominees Limited* Corporate nomineeArgus Nominee Limited Corporate nomineeRathbone Pension & Advisory Services Limited Non-tradingRathbone Stockbrokers Limited* Non-tradingDean River Asset Management Limited* Non-tradingR.M. Walkden & Co. Limited* Non-tradingRathbone Funds Advisers Unipessoal LDA* European fund marketingSpeirs & Jeffrey Limited* Investment managementSpeirs & Jeffrey Client Nominees Limited* Corporate nomineeSpeirs & Jeffrey Portfolio Management Limited* Corporate nomineeSpeirs & Jeffrey Fund Management Limited* Corporate nominee* Held by subsidiary undertaking
The registered office for all subsidiary undertakings is 8 Finsbury Circus, London EC2M 7AZ except for the following:
Subsidiary undertaking Registered office
Rathbone Investment Management Limited Port of Liverpool Building, Pier Head, Liverpool L3 1NWRathbone Investment Management International Limited 26 Esplanade, St Helier, Jersey JE1 2RBVision Independent Financial Planning Limited Vision House, Unit 6A Falmouth Business Park,
Bickland Water Road, Falmouth, Cornwall TR11 4SZ Castle Investment Solutions Limited Vision House, Unit 6A Falmouth Business Park,
Bickland Water Road, Falmouth, Cornwall TR11 4SZ Speirs & Jeffrey Limited George House, 50 George Square, Glasgow G2 1EHSpeirs & Jeffrey Client Nominees Limited George House, 50 George Square, Glasgow G2 1EHSpeirs & Jeffrey Portfolio Management Limited George House, 50 George Square, Glasgow G2 1EHSpeirs & Jeffrey Fund Management Limited George House, 50 George Square, Glasgow G2 1EHRathbone Funds Advisers Unipessoal LDA R Tierno Galvan 10 Torre 3, Piso 6 Sala 602, 1070-274,
Campo Ourique Lisbon, Lisbon, Portugal
The company owns, directly or indirectly, 100% of the ordinary share capital of all subsidiary undertakings.
rathbones.com 209
46 Other investments
Fair value through profit or loss securities
2020
£’000 2019
£’000
Equity securities: – listed 5,728 4,587 Money market funds: – unlisted 10,000 10,000 15,728 14,587
47 Trade and other receivables
2020
£’000 2019
£’000
Prepayments and other receivables 4,526 7,989 Amounts owed by group undertakings 107,835 116,733 112,361 124,722 Current 112,361 124,722 Non-current – – 112,361 124,722
48 Right-of-use assets Property
£’000 Total
£’000
Cost At 1 January 2019 50,186 50,186 Additions 601 601 Acquisitions 2,506 2,506 Other movements (134) (134)At 31 December 2019 and 31 December 2020 53,159 53,159 Depreciation and impairment 1 January 2019 – –Charge for the year 4,499 4,499 Acquisitions 139 139 Other movements (19) (19)At 1 January 2020 4,619 4,619 Charge for the year 4,643 4,643 At 31 December 2020 9,262 9,262 Carrying amount at 31 December 2020 43,897 43,897
There was no indication of impairment of the company’s right-of-use assets as a result of COVID-19 during the year.
During the year, the company recognised a charge of £7,000 in profit or loss in respect of short-term leases and low-value assets (2019: £370,000).
rathbones.com 209

210 Rathbone Brothers Plc Report and accounts 2020
49 Deferred tax The UK Government legislated in the Finance Act 2020 to maintain the UK corporation tax rate at 19.0% from 1 April 2020, rather than reducing the rate to 17.0% as previously enacted. The Finance Act 2020 was enacted on 22 July 2020. Deferred income taxes are calculated on all temporary differences under the liability method using the rate expected to apply when the relevant timing differences are forecast to unwind.
The budget on 3 March 2021 signalled an increase in the UK corporation tax rate to 25.0% in 2023. This will be reflected in the deferred tax calculations when the change is enacted.
The movement on the deferred tax account is as follows:
Pensions
£’000
Share-based payments
£’000
Staff- related
costs £’000
Fair value through
profit or loss £’000
Total £’000
As at 1 January 2020 1,360 3,545 304 (103) 5,106 Recognised in profit or loss in respect of: – current year (553) 398 (11) (97) (263)– prior year – 22 (211) – (189)– change in rate (618) 445 11 (12) (174)Total recognised in profit or loss (1,171) 865 (211) (109) (626) Recognised in other comprehensive income in respect of: – current year 890 – – – 890 – prior year – – – – –– change in rate 778 – – – 778 Total recognised in other comprehensive income 1,668 – – – 1,668 Recognised in equity in respect of: – current year – (38) – – (38)– prior year – (17) – – (17)– change in rate – 7 – – 7 Total recognised in equity – (48) – – (48) As at 31 December 2020 1,857 4,362 93 (212) 6,100
Pensions
£’000
Share-based payments
£’000
Staff- related
costs £’000
Fair value through
profit or loss £’000
Total £’000
Deferred tax assets 1,857 4,362 93 – 6,312 Deferred tax liabilities – – – (212) (212)As at 31 December 2020 1,857 4,362 93 (212) 6,100
Notes to the company financial statements continued
210 Rathbone Brothers Plc Report and accounts 2020
| Company financial statements

210 Rathbone Brothers Plc Report and accounts 2020
49 Deferred tax The UK Government legislated in the Finance Act 2020 to maintain the UK corporation tax rate at 19.0% from 1 April 2020, rather than reducing the rate to 17.0% as previously enacted. The Finance Act 2020 was enacted on 22 July 2020. Deferred income taxes are calculated on all temporary differences under the liability method using the rate expected to apply when the relevant timing differences are forecast to unwind.
The budget on 3 March 2021 signalled an increase in the UK corporation tax rate to 25.0% in 2023. This will be reflected in the deferred tax calculations when the change is enacted.
The movement on the deferred tax account is as follows:
Pensions
£’000
Share-based payments
£’000
Staff- related
costs £’000
Fair value through
profit or loss £’000
Total £’000
As at 1 January 2020 1,360 3,545 304 (103) 5,106 Recognised in profit or loss in respect of: – current year (553) 398 (11) (97) (263)– prior year – 22 (211) – (189)– change in rate (618) 445 11 (12) (174)Total recognised in profit or loss (1,171) 865 (211) (109) (626) Recognised in other comprehensive income in respect of: – current year 890 – – – 890 – prior year – – – – –– change in rate 778 – – – 778 Total recognised in other comprehensive income 1,668 – – – 1,668 Recognised in equity in respect of: – current year – (38) – – (38)– prior year – (17) – – (17)– change in rate – 7 – – 7 Total recognised in equity – (48) – – (48) As at 31 December 2020 1,857 4,362 93 (212) 6,100
Pensions
£’000
Share-based payments
£’000
Staff- related
costs £’000
Fair value through
profit or loss £’000
Total £’000
Deferred tax assets 1,857 4,362 93 – 6,312 Deferred tax liabilities – – – (212) (212)As at 31 December 2020 1,857 4,362 93 (212) 6,100
rathbones.com 211
Pensions
£’000
Share-basedpayments
£’000
Staff- related
costs £’000
Fair valuethrough
profit or loss£’000
Total£’000
As at 1 January 2019 1,902 1,882 304 (21) 4,067 Recognised in profit or loss in respect of: – current year (546) 1,586 – (92) 948 – prior year – 94 – – 94 – change in rate 57 – – 10 67 Total recognised in profit or loss (489) 1,680 – (82) 1,109 Recognised in other comprehensive income in respect of: – current year (59) – – – (59)– prior year – – – – –– change in rate 6 – – – 6 Total recognised in other comprehensive income (53) – – – (53) Recognised in equity in respect of: – current year – (17) – – (17)– prior year – – – – –– change in rate – – – – –Total recognised in equity – (17) – – (17) As at 31 December 2019 1,360 3,545 304 (103) 5,106
Deferred tax assets 1,360 3,545 304 – 5,209 Deferred tax liabilities – – – (103) (103)As at 31 December 2019 1,360 3,545 304 (103) 5,106
50 Trade and other payables
2020
£’0002019
£’000
Trade creditors 117 629 Accruals, deferred income and other creditors 71,344 61,799 Amounts owed to group undertakings – – Other taxes and social security costs 18,343 7,562 89,804 69,990
The fair value of trade and other payables is not materially different from their carrying amount.
rathbones.com 211

212 Rathbone Brothers Plc Report and accounts 2020
51 Lease liabilities
Maturity analysis
2020
£’0002019
£’000
Less than one year 4,654 4,901 One to five years 18,708 18,556 More than five years 31,761 36,569 Lease liabilities at 31 December 55,123 60,026 Current 4,654 4,901 Non-current 50,469 55,125 55,123 60,026
52 Provisions for liabilities and charges
Deferred,variable costs
to acquire clientrelationshipintangibles
£’000
Deferred andcontingent
considerationin business
combinations£’000
Legal and compensation
£’000
Property-related£’000
Total£’000
As at 1 January 2019 1,059 2,378 – 6,786 10,223 Charged to profit or loss – – – 1,300 1,300 Unused amount credited to profit or loss – – – 290 290 Net credit to profit or loss – – – 1,590 1,590 Other movements 4,770 179 – – 4,949 Utilised/paid during the year (4,981) (2,557) – (3,338) (10,876) At 31 December 2019 848 – – 5,038 5,886 Charged to profit or loss – 588 118 (589) 117 Unused amount credited to profit or loss – – – (23) (23) Net charge to profit or loss – 588 118 (612) 94 Other movements 2,521 – – – 2,521 Utilised/paid during the year (227) – – (825) (1,052) As at 31 December 2020 3,142 588 118 3,601 7,449 Payable within 1 year 1,010 588 118 – 1,716 Payable after 1 year 2,132 – – 3,601 5,733 3,142 588 118 3,601 7,449
Other movements in provisions relate to deferred payments to investment managers and third parties for the introduction of client relationships, which have been capitalised in the year.
Following the satisfaction of certain operational targets, contingent consideration of £1,050,000 was paid to vendors of Speirs & Jeffrey in May 2019 (see note 8). In addition, contingent consideration of £1,507,000 was paid in October 2019 in respect of the acquisition of Vision Independent Financial Planning and Castle Investment Solutions.
Property-related provisions of £3,601,000 relate to dilapidation provisions expected to arise on leasehold premises held by the group (2019: £5,038,000). Prior-year balances also included monies due under the contract with the assignee of leases on the group’s former property at 1 Curzon Street, which was fully utilised in the year.
Dilapidation provisions are calculated using a discounted cash flow model; during the year, provisions have decreased by £591,000 (2019: increased by £1,228,000). The group utilised £825,000 (2019: £3,338,000) of the dilapidations provision held for the surplus property at 1 Curzon Street during the year. The impact of discounting led to an additional credit of £591,000 (2019: additional charge of £1,669,000) being recognised during the year.
Provisions payable after one year are expected to be settled within two years of the balance sheet date (2019: two years), except for the property-related provisions of £3,601,000 (2019: £4,191,000), which are expected to be settled within 13 years of the balance sheet date (2019: 14 years).
Notes to the company financial statements continued
212 Rathbone Brothers Plc Report and accounts 2020
| Company financial statements

212 Rathbone Brothers Plc Report and accounts 2020
51 Lease liabilities
Maturity analysis
2020
£’0002019
£’000
Less than one year 4,654 4,901 One to five years 18,708 18,556 More than five years 31,761 36,569 Lease liabilities at 31 December 55,123 60,026 Current 4,654 4,901 Non-current 50,469 55,125 55,123 60,026
52 Provisions for liabilities and charges
Deferred,variable costs
to acquire clientrelationshipintangibles
£’000
Deferred andcontingent
considerationin business
combinations£’000
Legal and compensation
£’000
Property-related£’000
Total£’000
As at 1 January 2019 1,059 2,378 – 6,786 10,223 Charged to profit or loss – – – 1,300 1,300 Unused amount credited to profit or loss – – – 290 290 Net credit to profit or loss – – – 1,590 1,590 Other movements 4,770 179 – – 4,949 Utilised/paid during the year (4,981) (2,557) – (3,338) (10,876) At 31 December 2019 848 – – 5,038 5,886 Charged to profit or loss – 588 118 (589) 117 Unused amount credited to profit or loss – – – (23) (23) Net charge to profit or loss – 588 118 (612) 94 Other movements 2,521 – – – 2,521 Utilised/paid during the year (227) – – (825) (1,052) As at 31 December 2020 3,142 588 118 3,601 7,449 Payable within 1 year 1,010 588 118 – 1,716 Payable after 1 year 2,132 – – 3,601 5,733 3,142 588 118 3,601 7,449
Other movements in provisions relate to deferred payments to investment managers and third parties for the introduction of client relationships, which have been capitalised in the year.
Following the satisfaction of certain operational targets, contingent consideration of £1,050,000 was paid to vendors of Speirs & Jeffrey in May 2019 (see note 8). In addition, contingent consideration of £1,507,000 was paid in October 2019 in respect of the acquisition of Vision Independent Financial Planning and Castle Investment Solutions.
Property-related provisions of £3,601,000 relate to dilapidation provisions expected to arise on leasehold premises held by the group (2019: £5,038,000). Prior-year balances also included monies due under the contract with the assignee of leases on the group’s former property at 1 Curzon Street, which was fully utilised in the year.
Dilapidation provisions are calculated using a discounted cash flow model; during the year, provisions have decreased by £591,000 (2019: increased by £1,228,000). The group utilised £825,000 (2019: £3,338,000) of the dilapidations provision held for the surplus property at 1 Curzon Street during the year. The impact of discounting led to an additional credit of £591,000 (2019: additional charge of £1,669,000) being recognised during the year.
Provisions payable after one year are expected to be settled within two years of the balance sheet date (2019: two years), except for the property-related provisions of £3,601,000 (2019: £4,191,000), which are expected to be settled within 13 years of the balance sheet date (2019: 14 years).
rathbones.com 213
53 Long-term employee benefits Details of the defined benefit pension schemes operated by the company are provided in note 29 to the consolidated financial statements.
54 Share capital, own shares and share-based payments Details of the share capital of the company and ordinary shares held by the company together with changes thereto are provided in notes 30 and 31 to the consolidated financial statements. Details of options on the company’s shares and share-based payments are set out in note 32 to the consolidated financial statements.
55 Financial instruments The company’s risk management policies and procedures are integrated with the wider Rathbones group’s risk management process. The Rathbones group has identified the risks arising from all of its activities, including those of the company, and has established policies and procedures to manage these items in accordance with its risk appetite. The company categorises its financial risks into the following primary areas:
(i) credit risk (ii) liquidity risk (iii) market risk (which includes fair value interest rate risk, cash flow interest rate risk, foreign exchange risk and price risk) (iv) pension risk.
The company’s exposures to pension risk are set out in note 29 to the consolidated financial statements.
The sections below outline the group risk appetite, as applicable to the company, and explain how the company defines and manages each category of financial risk.
The company’s financial risk management policies are designed to identify and analyse the financial risks that the company faces, to set appropriate risk tolerances, limits and controls, and to monitor the financial risks and adherence to limits by means of reliable and up-to-date information systems. The company regularly reviews its financial risk management policies and systems to reflect changes in the business and the wider industry.
The company’s overall strategy and policies for monitoring and management of financial risk are set by the board of directors (‘the board’). The board has embedded risk management within the business through the executive committee and senior management.
(i) Credit risk The company takes on exposure to credit risk, which is the risk that a counterparty will be unable to pay amounts in full when due, through its trading activities. The principal sources of credit risk arise from depositing funds with banks and through providing long-term and working capital financing for subsidiaries.
The company’s financial assets are categorised as follows.
Trade and other receivables Trade and other receivables relate to amounts placed with subsidiaries and staff advances. The prior-year total also includes amounts held in escrow following the assignment of leases on 1 Curzon Street, which were fully utilised in the year.
The collection and ageing of trade and other receivables are reviewed on a periodic basis by management.
The company places surplus funds with its banking subsidiary, which operates under the group’s credit risk management policies. Group policy requires that funds are placed with a range of high-quality financial institutions. Investments are spread to avoid excessive exposure to any individual counterparty.
For the purposes of financial reporting the company categorises its exposures based on the long-term ratings awarded to counterparties by Fitch or Moody’s.
rathbones.com 213

214 Rathbone Brothers Plc Report and accounts 2020
55 Financial instruments continued
(i) Credit risk continued Cash and cash equivalents (balances at banks) The company has exposure to financial institutions through its bank deposits (reported within cash equivalents).
Maximum exposure to credit risk
2020
£’000 2019
£’000
Other investments: – money market funds 10,000 10,006 Trade and other receivables: – amounts owed by group undertakings 107,835 116,733 – other financial assets 6,472 8,429 Balances at banks 12,611 4,204 136,918 139,372
The above table represents the gross credit risk exposure of the company at 31 December 2020 and 2019, without taking account of any collateral held or other credit enhancements attached.
Other investments The table below presents an analysis of other investments by rating agency designation, as at 31 December 2020, based on Fitch or Moody’s long-term rating designation.
2020 2019
Money market
funds £’000
Total
£’000
Moneymarket
funds£’000
Total£’000
AAA 10,000 10,000 10,000 10,000
Trade and other receivables No trade and other receivables have been written off or are credit-impaired at the reporting date.
Amounts owed by group undertakings do not have specific repayment dates and are paid down periodically as trading requires.
Balances at banks The credit quality of balances at banks is analysed below by reference to the long-term credit rating awarded by Fitch, or equivalent rating by Moody’s, as at the balance sheet date.
2020
£’000 2019
£’000
A 12,611 4,204 12,611 4,204
Notes to the company financial statements continued
214 Rathbone Brothers Plc Report and accounts 2020
| Company financial statements

214 Rathbone Brothers Plc Report and accounts 2020
55 Financial instruments continued
(i) Credit risk continued Cash and cash equivalents (balances at banks) The company has exposure to financial institutions through its bank deposits (reported within cash equivalents).
Maximum exposure to credit risk
2020
£’000 2019
£’000
Other investments: – money market funds 10,000 10,006 Trade and other receivables: – amounts owed by group undertakings 107,835 116,733 – other financial assets 6,472 8,429 Balances at banks 12,611 4,204 136,918 139,372
The above table represents the gross credit risk exposure of the company at 31 December 2020 and 2019, without taking account of any collateral held or other credit enhancements attached.
Other investments The table below presents an analysis of other investments by rating agency designation, as at 31 December 2020, based on Fitch or Moody’s long-term rating designation.
2020 2019
Money market
funds £’000
Total
£’000
Moneymarket
funds£’000
Total£’000
AAA 10,000 10,000 10,000 10,000
Trade and other receivables No trade and other receivables have been written off or are credit-impaired at the reporting date.
Amounts owed by group undertakings do not have specific repayment dates and are paid down periodically as trading requires.
Balances at banks The credit quality of balances at banks is analysed below by reference to the long-term credit rating awarded by Fitch, or equivalent rating by Moody’s, as at the balance sheet date.
2020
£’000 2019
£’000
A 12,611 4,204 12,611 4,204
rathbones.com 215
Concentration of credit risk The company has counterparty credit risk within its balances at banks in that the principal exposure is to its banking subsidiary. The board sets and monitors the group policy for the management of group funds, which include the placement of funds with a range of high-quality financial institutions.
(a) Geographical sectors The following table analyses the company’s credit exposures, at their carrying amounts, by geographical region as at the balance sheet date. In this analysis, exposures are categorised based on the country of domicile of the counterparty.
At 31 December 2020
United Kingdom
£’000
Rest of the World
£’000 Total
£’000
Other investments: – money market funds 10,000 – 10,000 Trade and other receivables: – amounts owed by group undertakings 107,279 556 107,835 – other financial assets 2,136 403 2,539 Balances at banks 12,611 – 12,611 132,026 959 132,985
At 31 December 2019
United Kingdom
£’000
Rest ofthe World
£’000 Total
£’000
Other investments: – money market funds 10,000 – 10,000 Trade and other receivables: – amounts owed by group undertakings 116,334 399 116,733 – other financial assets 3,408 450 3,858 Balances at banks 4,204 – 4,204 133,946 849 134,795
At 31 December 2020, all rest of the world exposures were to counterparties based in Jersey, the Eurozone, and the United States of America (2019: Jersey and the United States of America). At 31 December 2020, the company had no exposure to sovereign debt (2019: none).
rathbones.com 215

216 Rathbone Brothers Plc Report and accounts 2020
55 Financial instruments continued
(i) Credit risk continued (b) Industry sectors
The company’s credit exposures at the balance sheet date, analysed by the primary industry sectors in which our counterparties operate, were:
At 31 December 2020
Financial institutions
£’000
Clients and other corporates
£’000 Total
£’000
Other investments: – money market funds 10,000 – 10,000 Trade and other receivables: – amounts owed by group undertakings 66,110 41,725 107,835 – other financial assets – 2,539 2,539 Balances at banks 12,611 – 12,611 88,721 44,264 132,985
At 31 December 2019
Financial institutions
£’000
Clients and othercorporates
£’000 Total
£’000
Other investments: – money market funds 10,000 – 10,000 Trade and other receivables: – amounts owed by group undertakings 79,271 37,462 116,733 – other financial assets 6 3,852 3,858 Balances at banks 4,204 – 4,204 93,481 41,314 134,795
(ii) Liquidity risk Liquidity risk is the risk that the company will encounter difficulty in meeting obligations associated with financial liabilities that are settled by delivering cash or another financial asset. The company places its funds in short-term or demand facilities with financial institutions to ensure liquidity. The company has no bank loans (2019: £nil) and does not rely on external funding for its activities.
Non-derivative cash flows The table below presents the undiscounted cash flows receivable and payable by the company on its non-derivative financial assets and liabilities by remaining contractual maturities at the balance sheet date.
At 31 December 2020
On demand
£’000
Not more than
3 months £’000
After 3 months but not
more than 1 year £’000
After 1 year but
not more than
5 years £’000
After 5 years £’000
No fixed maturity
date £’000
Total £’000
Other investments: – money market funds 10,000 – – – – – 10,000 Trade and other receivables: – amounts owed by group undertakings 107,835 – – – – – 107,835 – other financial assets 53 786 1,338 3,491 804 – 6,472 Balances at banks 12,611 – – – – – 12,611 Cash flows arising from financial assets 130,499 786 1,338 3,491 804 – 136,918 Trade and other payables: – amounts owed to group undertakings – – – – – – –– other financial liabilities 146 47,659 7,083 61,315 52,506 – 168,709 Cash flows arising from
financial liabilities 146 47,659 7,083 61,315 52,506 – 168,709 Net liquidity gap 130,353 (46,873) (5,745) (57,824) (51,702) – (31,791)Cumulative net liquidity gap 130,353 83,480 77,735 19,911 (31,791) (31,791)
Notes to the company financial statements continued
216 Rathbone Brothers Plc Report and accounts 2020
| Company financial statements

216 Rathbone Brothers Plc Report and accounts 2020
55 Financial instruments continued
(i) Credit risk continued (b) Industry sectors
The company’s credit exposures at the balance sheet date, analysed by the primary industry sectors in which our counterparties operate, were:
At 31 December 2020
Financial institutions
£’000
Clients and other corporates
£’000 Total
£’000
Other investments: – money market funds 10,000 – 10,000 Trade and other receivables: – amounts owed by group undertakings 66,110 41,725 107,835 – other financial assets – 2,539 2,539 Balances at banks 12,611 – 12,611 88,721 44,264 132,985
At 31 December 2019
Financial institutions
£’000
Clients and othercorporates
£’000 Total
£’000
Other investments: – money market funds 10,000 – 10,000 Trade and other receivables: – amounts owed by group undertakings 79,271 37,462 116,733 – other financial assets 6 3,852 3,858 Balances at banks 4,204 – 4,204 93,481 41,314 134,795
(ii) Liquidity risk Liquidity risk is the risk that the company will encounter difficulty in meeting obligations associated with financial liabilities that are settled by delivering cash or another financial asset. The company places its funds in short-term or demand facilities with financial institutions to ensure liquidity. The company has no bank loans (2019: £nil) and does not rely on external funding for its activities.
Non-derivative cash flows The table below presents the undiscounted cash flows receivable and payable by the company on its non-derivative financial assets and liabilities by remaining contractual maturities at the balance sheet date.
At 31 December 2020
On demand
£’000
Not more than
3 months £’000
After 3 months but not
more than 1 year £’000
After 1 year but
not more than
5 years £’000
After 5 years £’000
No fixed maturity
date £’000
Total £’000
Other investments: – money market funds 10,000 – – – – – 10,000 Trade and other receivables: – amounts owed by group undertakings 107,835 – – – – – 107,835 – other financial assets 53 786 1,338 3,491 804 – 6,472 Balances at banks 12,611 – – – – – 12,611 Cash flows arising from financial assets 130,499 786 1,338 3,491 804 – 136,918 Trade and other payables: – amounts owed to group undertakings – – – – – – –– other financial liabilities 146 47,659 7,083 61,315 52,506 – 168,709 Cash flows arising from
financial liabilities 146 47,659 7,083 61,315 52,506 – 168,709 Net liquidity gap 130,353 (46,873) (5,745) (57,824) (51,702) – (31,791)Cumulative net liquidity gap 130,353 83,480 77,735 19,911 (31,791) (31,791)
rathbones.com 217
At 31 December 2019
Ondemand
£’000
Not morethan
3 months£’000
After 3monthsbut not
more than1 year£’000
After 1year but
not morethan
5 years£’000
After 5 years
£’000
No fixedmaturity
date£’000
Total£’000
Other investments: – money market funds 10,006 – – – – – 10,006 Trade and other receivables: – amounts owed by group undertakings 116,733 – – – – – 116,733 – other financial assets 115 1,911 903 3,915 1,585 – 8,429 Balances at banks 4,204 – – – – – 4,204 Cash flows arising from financial assets 131,058 1,911 903 3,915 1,585 – 139,372 Trade and other payables: – amounts owed to group undertakings – – – – – – –– other financial liabilities 143 46,978 7,060 47,980 59,092 – 161,253 Cash flows arising from
financial liabilities 143 46,978 7,060 47,980 59,092 – 161,253 Net liquidity gap 130,915 (45,067) (6,157) (44,065) (57,507) – (21,881)Cumulative net liquidity gap 130,915 85,848 79,691 35,626 (21,881) (21,881)
Included within trade and other payables disclosed above are balances that are repayable on demand or that do not have a contractual maturity date, which historical experience shows are unlikely to be called in the short term.
The company holds £5,728,000 of equity investments (2019: £4,587,000) which are subject to liquidity risk but are not included in the table above. These assets are held as fair value through profit or loss securities and have no fixed maturity date; cash flows arise from receipt of dividends or through sale of the assets.
Total liquidity requirement
At 31 December 2020
Ondemand
£’000
Not more than
3 months £’000
After 3 months but not
more than 1 year £’000
After 1 year but
not more than
5 years £’000
After 5 years £’000
Total £’000
Cash flows arising from financial liabilities 146 47,659 7,083 61,315 52,506 168,709 Total off-balance-sheet items – – – – – –Total liquidity requirement 146 47,659 7,083 61,315 52,506 168,709
At 31 December 2019
Ondemand
£’000
Not morethan
3 months£’000
After 3monthsbut not
more than1 year£’000
After 1 year but
not more than
5 years £’000
After 5years
£’000 Total
£’000
Cash flows arising from financial liabilities 143 46,978 7,060 47,980 59,092 161,253 Total off-balance-sheet items – – – – – –Total liquidity requirement 143 46,978 7,060 47,980 59,092 161,253
rathbones.com 217

218 Rathbone Brothers Plc Report and accounts 2020
55 Financial instruments continued
(iii) Market risk Interest rate risk Cash flow interest rate risk is the risk that the future cash flows of a financial instrument will fluctuate because of changes in market interest rates. Fair value interest rate risk is the risk that the value of a financial instrument will fluctuate because of changes in market interest rates.
The company’s principal exposure to cash flow interest rate risk arises from the mismatch between the repricing of its financial assets and liabilities.
The table below shows the repricing profile of the company’s financial assets and liabilities, stated at their carrying amounts, categorised by the earlier of contractual repricing or maturity dates.
At 31 December 2020
Not more than
3 months £’000
After 3 months but not
more than 6 months
£’000
After 6 months but not
more than 1 year £’000
After 1 year but
not more than
5 years £’000
After 5 years
£’000
Non- interest-
bearing £’000
Total £’000
Assets Other investments: – equity securities – – – – – 5,728 5,728 – money market funds 10,000 – – – – – 10,000 Trade and other receivables: – amounts owed by group undertakings – – – – – 107,835 107,835 – other financial assets 575 – – – – 1,964 2,539 Balances at banks 12,606 – – – – 5 12,611 Total financial assets 23,181 – – – – 115,532 138,713 Liabilities Trade and other payables: – amounts owed to group undertakings – – – – – – –– other financial liabilities – – – – – 121,956 121,956 Total financial liabilities – – – – – 121,956 121,956 Interest rate repricing gap 23,181 – – – – (6,424) 16,757
Notes to the company financial statements continued
218 Rathbone Brothers Plc Report and accounts 2020
| Company financial statements

218 Rathbone Brothers Plc Report and accounts 2020
55 Financial instruments continued
(iii) Market risk Interest rate risk Cash flow interest rate risk is the risk that the future cash flows of a financial instrument will fluctuate because of changes in market interest rates. Fair value interest rate risk is the risk that the value of a financial instrument will fluctuate because of changes in market interest rates.
The company’s principal exposure to cash flow interest rate risk arises from the mismatch between the repricing of its financial assets and liabilities.
The table below shows the repricing profile of the company’s financial assets and liabilities, stated at their carrying amounts, categorised by the earlier of contractual repricing or maturity dates.
At 31 December 2020
Not more than
3 months £’000
After 3 months but not
more than 6 months
£’000
After 6 months but not
more than 1 year £’000
After 1 year but
not more than
5 years £’000
After 5 years
£’000
Non- interest-
bearing £’000
Total £’000
Assets Other investments: – equity securities – – – – – 5,728 5,728 – money market funds 10,000 – – – – – 10,000 Trade and other receivables: – amounts owed by group undertakings – – – – – 107,835 107,835 – other financial assets 575 – – – – 1,964 2,539 Balances at banks 12,606 – – – – 5 12,611 Total financial assets 23,181 – – – – 115,532 138,713 Liabilities Trade and other payables: – amounts owed to group undertakings – – – – – – –– other financial liabilities – – – – – 121,956 121,956 Total financial liabilities – – – – – 121,956 121,956 Interest rate repricing gap 23,181 – – – – (6,424) 16,757
rathbones.com 219
At 31 December 2019
Not morethan
3 months£’000
After 3monthsbut not
more than6 months
£’000
After 6monthsbut not
more than1 year£’000
After 1year but
not morethan
5 years£’000
After 5 years
£’000
Non-interest-
bearing£’000
Total£’000
Assets Other investments: – equity securities – – – – – 4,587 4,587– money market funds 10,000 – – – – – 10,000 Trade and other receivables: – amounts owed by group undertakings – – – – – 116,733 116,733– other financial assets 1,565 – – – – 2,293 3,858Balances at banks 4,199 – – – – 5 4,204Total financial assets 15,764 – – – – 123,618 139,382 Liabilities Trade and other payables: – amounts owed to group undertakings – – – – – – –– other financial liabilities – – – – – 119,101 119,101Total financial liabilities – – – – – 119,101 119,101 Interest rate repricing gap 15,764 – – – – 4,517 20,281
A 1% parallel increase/decrease in the sterling yield curve would have no impact on profit after tax or equity (2019: no impact).
The company has assessed the impact of climate change and COVID-19 on the carrying amount of its financial assets and liabilities at the year end, and considers there to be no material impact.
Foreign exchange risk The company does not have any material exposure to transactional foreign exchange risk. The table below summarises the company’s exposure to foreign currency translation risk at 31 December 2020. Included in the table are the company’s financial assets and liabilities, at carrying amounts, categorised by currency.
At 31 December 2020 Sterling
£’000 US dollar
£’000 Euro
£’000 Total
£’000
Assets Other investments: – equity securities 5,728 – – 5,728 – money market funds 10,000 – – 10,000 Trade and other receivables: – amounts owed by group undertakings 107,835 – – 107,835 – other financial assets 2,421 118 – 2,539 Balances at banks 12,611 – – 12,611 Total financial assets 138,595 118 – 138,713 Liabilities Trade and other payables: – amounts owed to group undertakings – – – –– other financial liabilities 121,838 118 – 121,956 Total financial liabilities 121,838 118 – 121,956 Net on-balance-sheet position 16,757 – – 16,757
rathbones.com 219

220 Rathbone Brothers Plc Report and accounts 2020
55 Financial instruments continued
(iii) Market risk continued
At 31 December 2019 Sterling
£’000 US dollar
£’000 Euro
£’000 Total
£’000
Assets Other investments: – equity securities 4,587 – – 4,587 – money market funds 10,000 – – 10,000 Trade and other receivables: – amounts owed by group undertakings 116,733 – – 116,733 – other financial assets 3,593 265 – 3,858 Balances at banks 4,204 – – 4,204 Total financial assets 139,117 265 – 139,382 Liabilities Trade and other payables: – amounts owed to group undertakings – – – –– other financial liabilities 119,101 – – 119,101 Total financial liabilities 119,101 – – 119,101 Net on-balance-sheet position 20,016 265 – 20,281
A 10% weakening of the US dollar against sterling would have reduced equity and profit after tax by £21,000 in 2019. A 10% strengthening of the US dollar would have had an equal and opposite effect. This analysis assumes that all other variables, in particular other exchange rates, remain constant.
Price risk The group’s exposure to price risk, all of which is through the company’s holdings of equity investment securities, is described in note 33.
Fair values The table below analyses financial instruments measured at fair value into a fair value hierarchy based on the valuation technique used to determine the fair value:
– Level 1: quoted prices (unadjusted) in active markets for identical assets or liabilities. – Level 2: inputs other than quoted prices included within level 1 that are observable for the asset or liability, either directly or indirectly. – Level 3: inputs for the asset or liability that are not based on observable market data.
At 31 December 2020 Level 1
£’000 Level 2
£’000 Level 3
£’000 Total
£’000
Assets Fair value through profit or loss: – equity securities 5,728 – – 5,728 – money market funds – 10,000 – 10,000 5,728 10,000 – 15,728
At 31 December 2019 Level 1
£’000 Level 2
£’000 Level 3
£’000 Total
£’000
Assets Fair value through profit or loss: – equity securities 4,587 – – 4,587 – money market funds – 10,000 – 10,000 4,587 10,000 – 14,587
The company recognises transfers between levels of the fair value hierarchy at the end of the reporting period during which the change has occurred. There have been no transfers between levels during the year (2019: none).
Details of the methods and assumptions used to determine the fair values of the financial assets in the above table, along with how reasonably possible changes to the assumptions affect these fair values, are provided in note 33 to the consolidated financial statements.
The fair values of the company’s financial assets and liabilities are not materially different from their carrying values, with the exception of equity investments in subsidiaries, which are carried at historical cost (note 45).
Notes to the company financial statements continued
220 Rathbone Brothers Plc Report and accounts 2020
| Company financial statements

220 Rathbone Brothers Plc Report and accounts 2020
55 Financial instruments continued
(iii) Market risk continued
At 31 December 2019 Sterling
£’000 US dollar
£’000 Euro
£’000 Total
£’000
Assets Other investments: – equity securities 4,587 – – 4,587 – money market funds 10,000 – – 10,000 Trade and other receivables: – amounts owed by group undertakings 116,733 – – 116,733 – other financial assets 3,593 265 – 3,858 Balances at banks 4,204 – – 4,204 Total financial assets 139,117 265 – 139,382 Liabilities Trade and other payables: – amounts owed to group undertakings – – – –– other financial liabilities 119,101 – – 119,101 Total financial liabilities 119,101 – – 119,101 Net on-balance-sheet position 20,016 265 – 20,281
A 10% weakening of the US dollar against sterling would have reduced equity and profit after tax by £21,000 in 2019. A 10% strengthening of the US dollar would have had an equal and opposite effect. This analysis assumes that all other variables, in particular other exchange rates, remain constant.
Price risk The group’s exposure to price risk, all of which is through the company’s holdings of equity investment securities, is described in note 33.
Fair values The table below analyses financial instruments measured at fair value into a fair value hierarchy based on the valuation technique used to determine the fair value:
– Level 1: quoted prices (unadjusted) in active markets for identical assets or liabilities. – Level 2: inputs other than quoted prices included within level 1 that are observable for the asset or liability, either directly or indirectly. – Level 3: inputs for the asset or liability that are not based on observable market data.
At 31 December 2020 Level 1
£’000 Level 2
£’000 Level 3
£’000 Total
£’000
Assets Fair value through profit or loss: – equity securities 5,728 – – 5,728 – money market funds – 10,000 – 10,000 5,728 10,000 – 15,728
At 31 December 2019 Level 1
£’000 Level 2
£’000 Level 3
£’000 Total
£’000
Assets Fair value through profit or loss: – equity securities 4,587 – – 4,587 – money market funds – 10,000 – 10,000 4,587 10,000 – 14,587
The company recognises transfers between levels of the fair value hierarchy at the end of the reporting period during which the change has occurred. There have been no transfers between levels during the year (2019: none).
Details of the methods and assumptions used to determine the fair values of the financial assets in the above table, along with how reasonably possible changes to the assumptions affect these fair values, are provided in note 33 to the consolidated financial statements.
The fair values of the company’s financial assets and liabilities are not materially different from their carrying values, with the exception of equity investments in subsidiaries, which are carried at historical cost (note 45).
rathbones.com 221
56 Capital management The company’s objectives when managing capital are to:
– safeguard the company’s ability to continue as a going concern so that it can continue to provide returns for shareholders and benefits for other stakeholders
– maintain a strong capital base to support the development of its business.
For monitoring purposes, the company defines capital as distributable reserves (see note 44). The company monitors the level of distributable reserves on a monthly basis and compares this to forecast dividends. Capital is distributed to the company from operating subsidiaries on a timely basis to ensure sufficient capital is maintained. The board of directors monitors the level of capital held in relation to forecast performance, dividend payments and wider plans for the business, although formal quantitative targets are not set.
There were no changes in the company’s approach to capital management during the year.
57 Contingent liabilities and commitments The company had no contingent liabilities or commitments at the year end (2019: £nil).
58 Related party transactions Rathbone Brothers Plc is considered to be the ultimate controlling party.
Transactions with key management personnel The remuneration of the key management personnel of the company, who are defined as the company’s directors and other members of senior management who are responsible for planning, directing and controlling the activities of the company, is set out below.
2020
£’000 2019
£’000
Short-term employee benefits 1,435 1,854 Other long-term benefits 50 52 Share-based payments 550 648 2,035 2,554
Dividends totalling £98,000 were paid in the year (2019: £95,000) in respect of ordinary shares held by key management personnel and their close family members.
All amounts outstanding with related parties are unsecured and will be settled in cash. No guarantees have been given or received. No provisions have been made for doubtful debts in respect of the amounts owed by related parties.
rathbones.com 221

222 Rathbone Brothers Plc Report and accounts 2020
Company financial statements |
222 Rathbone Brothers Plc Report and accounts 2020
58 Related party transactions continued
Other related party transactions During the year, the company entered into the following transactions with its subsidiaries:
2020 2019
Receivable
£’000 Payable
£’000 Receivable
£’000 Payable
£’000
Charges for management services 209,878 – 192,188 – Dividends received 58,000 – 58,000 – 267,878 – 250,188 –
The company’s balances with fellow group companies at 31 December 2020 are set out in notes 47 and 50.
The company’s transactions with the pension funds are described in note 53. At 31 December 2020, no amounts were due from the pension schemes (2019: £nil).
All transactions and outstanding balances with fellow group companies are priced on an arm’s-length basis and are to be settled in cash. None of the balances are secured and no provisions have been made for doubtful debts for any amounts due from fellow group companies.
59 Cash and cash equivalents For the purposes of the company statement of cash flows, cash and cash equivalents comprise the following balances with less than three months until maturity from the date of acquisition:
2020
£’000 2019
£’000
Cash at bank (excluding amounts held by employee benefit trust) 12,611 4,204
A reconciliation of the movements of liabilities to cash flows arising from financing activities is provided in note 38 to the consolidated financial statements.
60 Events after the balance sheet date There have been no material events occurring between the balance sheet date and the date of signing this report.
Notes to the company financial statements continued

Further information
rathbones.com 223
Five-year record
2020
£’000 2019
£’000 2018
£’000 2017
£’000 2016
£’000
Operating income (and underlying operating income)1 366,088 348,071 311,963 286,049 251,283 Underlying profit before tax1 92,530 88,673 91,558 87,520 74,880 Profit before tax 43,779 39,652 61,306 58,901 50,129 Profit after tax 26,652 26,923 46,169 46,829 38,157 Equity dividends paid and proposed 38,728 37,714 35,204 30,429 28,267 Basic earnings per share 49.6p 50.3p 88.7p 92.7p 78.9p Diluted earnings per share 47.6p 48.7p 86.2p 91.9p 78.2p Underlying earnings per share1 133.3p 132.8p 142.5p 138.8p 122.1p Dividends per ordinary share 72.0p 70.0p 66.0p 61.0p 57.0p Equity shareholders’ funds 513,827 485,393 325,550 363,278 324,813 Total funds under management and administration £54.7bn £50.4bn £44.1bn £39.1bn £34.2bn 1. A reconciliation between the underlying measure and its closest IFRS equivalent for the current year and the prior year is shown in table 2 on page 35
Corporate information Investment Management Funds
Principal trading names Rathbone Investment ManagementRathbone Investment Management International Rathbone Greenbank Investments Rathbone Trust Company Rathbone Trust Legal Services Vision Independent Financial Planning Castle Investment Solutions
Rathbone Unit Trust Management
Offices 15 2 Websites rathbones.com
rathboneimi.com rathbonegreenbank.com
rathbones.com rutm.com
Company secretary and registered office Registrars and transfer office A Johnson Rathbone Brothers Plc 8 Finsbury Circus London EC2M 7AZ
Equiniti Aspect House Spencer Road Lancing West Sussex BN99 6DA
Company No. 01000403 rathbones.com [email protected]
equiniti.com
rathbones.com 223
222 Rathbone Brothers Plc Report and accounts 2020
58 Related party transactions continued
Other related party transactions During the year, the company entered into the following transactions with its subsidiaries:
2020 2019
Receivable
£’000 Payable
£’000 Receivable
£’000 Payable
£’000
Charges for management services 209,878 – 192,188 – Dividends received 58,000 – 58,000 – 267,878 – 250,188 –
The company’s balances with fellow group companies at 31 December 2020 are set out in notes 47 and 50.
The company’s transactions with the pension funds are described in note 53. At 31 December 2020, no amounts were due from the pension schemes (2019: £nil).
All transactions and outstanding balances with fellow group companies are priced on an arm’s-length basis and are to be settled in cash. None of the balances are secured and no provisions have been made for doubtful debts for any amounts due from fellow group companies.
59 Cash and cash equivalents For the purposes of the company statement of cash flows, cash and cash equivalents comprise the following balances with less than three months until maturity from the date of acquisition:
2020
£’000 2019
£’000
Cash at bank (excluding amounts held by employee benefit trust) 12,611 4,204
A reconciliation of the movements of liabilities to cash flows arising from financing activities is provided in note 38 to the consolidated financial statements.
60 Events after the balance sheet date There have been no material events occurring between the balance sheet date and the date of signing this report.

Our offices
Head office8 Finsbury Circus London EC2M 7AZ +44 (0)20 7399 0000
8 Finsbury Circus London EC2M 7AZ +44 (0)20 7399 0000
1 Albert Street Aberdeen AB25 1XX +44 (0)1224 218 180
The Colmore Building 20 Colmore Circus Queensway Birmingham B4 6AT +44 (0)121 233 2626
10 Queen Square Bristol BS1 4NT +44 (0)117 929 1919
North Wing, City House 126–130 Hills Road Cambridge CB2 1RE +44 (0)1223 229 229
1 Northgate Chichester West Sussex PO19 1AT +44 (0)1243 775 373
28 St Andrew Square Edinburgh EH2 1AF +44 (0)131 550 1350
The Senate Southernhay Gardens Exeter EX1 1UG +44 (0)1392 201 000
Vision House Unit 6A Falmouth Business Park Bickland Water Road Falmouth Cornwall TR11 4SZ +44 (0)1326 210904
George House 50 George Square Glasgow G2 1EH +44 (0)141 397 9900
26 Esplanade St Helier Jersey JE1 2RB Channel Islands +44 (0)1534 740500
The Stables Levens Hall Kendal Cumbria LA8 0PB +44 (0)1539 561 457
Port of Liverpool Building Pier Head Liverpool L3 1NW +44 (0)151 236 6666
48 High Street Lymington SO41 9AG +44 (0)1590 647 657
Earl Grey House 75–85 Grey Street Newcastle upon Tyne NE1 6EF +44 (0)191 255 1440
Fiennes House 32 Southgate Street Winchester SO23 9EH +44 (0)1962 857 000
Funds8 Finsbury Circus London EC2M 7AZ +44 (0)20 7399 0000
Investment Management
224 Rathbone Brothers Plc Report and accounts 2020
Further information

It is important to us that all materials used in the production of this document are environmentally sustainable.The forest-based material in this report is recycled.Both the printer and paper manufacturer are certified to the ISO 14001 environmental standard.Once you have finished with this report please recycle it.

Rathbone Brothers Plc8 Finsbury Circus, London, EC2M 7AZ
+44 (0)20 7399 0000 rathbones.com
Rathbone Brothers Plc Report and accounts 2020