L B Finance PLC | Annual Report 2020/21
426
L B Finance PLC | Annual Report 2020/21
-
Upload
khangminh22 -
Category
Documents
-
view
0 -
download
0
Transcript of L B Finance PLC | Annual Report 2020/21

L B F i n a n c e P L C | A n n u a l R e p o r t 2 0 2 0 / 2 1


At L B Finance even amid a challenging business terrain, we kept moving steadily towards making our goals a reality.
As this report demonstrates our commendable performance amid a year of change and uncertainty, the L B Finance team
continued to develop and share long-term value through strategically improved initiatives – all focused on strengthening
our capital positions, enhancing our business model, and expanding our potential in the years ahead.
Today, we believe that our unmatched experience, expertise and understanding of our business will enable us to keep
delighting thousands of stakeholders across the island through any eventuality. And now as we approach our
50th year of successful operations in 2021– we are leveraging our potential and resources to successfully navigate the next 50 years, with hopes of dominating the future of the financial
services sector in Sri Lanka.
NAVIGATING THE FUTURE
After reaching the summit of a mountain, a lion often looks back and ponders on the journey that led him to this point. It is a moment of enlightenment - one that gives him a deep awareness that it is indeed
the past that drives him to aspire for an even more ambitous future.
Just like the mighty lion, LB Finance, having dedicated the past 50 years in service to the people of Sri Lanka, is now ready to embrace an even brighter vision. Our legacy spanning the past half century has enlightened us and given us the assurance to envision an even more vibrant future for all Sri Lankans for
the next one hundred years and beyond.

L B Finance PLC | Annual Report 2020/212
We secure the inputs required to transform, grow, innovate and compete effectively
INTRODUCTION TO OUR INTEGRATED REPORT
About the report 04How to read this report 09
CHAPTER 1STABILITYAbout us 14
Our strategic journey 20Our contribution to the economy 22
CHAPTER 2LEADERSHIPFinancial highlights 28
Non-financial highlights 30Chairperson’s statement 33Managing Director’s review 37Board of Directors 40
Senior Management 44
CHAPTER 3STRENGTHManagement Discussion and Analysis
Business model 50Integrated stakeholder engagement 52
Materiality determination 66Delivering on our strategy and
resource allocation 74Operation in overseas 84
CHAPTER 4AGILITYManagement Discussion and Analysis
Our business environment and outlook 88Awards and accolades 101Delivering our strategy through our business clusters 102
Capital Management Reports
Financial capital 116Manufactured capital 144Human capital 154Intellectual capital 166Social and relationship capital 176Natural capital 196
CHAPTER 5RESPONSIBILITYCorporate governance report 206
Annual report of the Board of Directors on the affairs of the Company 223
Board subcommittee reports
Remuneration committee report 231Nomination committee report 232Audit committee report 233Integrated risk management
committee report 236Related party transaction
committee report 239Summarised risk management report 241
CHAPTER 6SUSTAINABILITYSustainability hot topics 246Consolidated Set of IR Standards 252
CONTENTS
Our leaders discuss the dynamics in our markets and how these are influencing our strategic priorities
33Page :
37Page :
50Page :

L B Finance PLC | Annual Report 2020/21 3
CHAPTER 7SUCCESSFinancial Information
Financial statement highlights 262Financial calendar 264Independent assurance report to the Board of Directors 265Directors’ responsibility statement on internal control over financial reporting 266Directors’ responsibility for financial reporting 267Independent auditors’ report 268Income statement 273Statement of comprehensive income 274Statement of financial position 275Statement of changes in equity
• Company 276• Group 277Statement of cash flows 278Notes to the financial statements 280
Our progress for the year and prospects for the year ahead
Supplementary Information
Decade at a glance 398Quarterly financial statements 2020/21 400Income statement (US Dollars) 402Statement of comprehensive income (US Dollars) 403Statement of financial position (US Dollars) 404Creating opportunities for gender equity 405Independent assurance report on sustainability 410List of abbreviations 411Glossary of terms 412Corporate information 416Notice of annual general meeting 418Form of proxy 419Feedback form annual report 2020/21 421
Chairperson’s statement
Managing Director’s review
Summarized VideowithSign Language
A Dedicated websitefor Annual Report and Integrated Reporting Information
Audio VersionScan and listen
Audio VersionScan and listen
Sinhala
Sinhala
Tamil
Tamil
English
English
Discuss the LBF’s governance approach and priorities
206Page :
102Page :

L B Finance PLC | Annual Report 2020/214
ABOUT THE REPORT
Our 9th Integrated Report
WELCOME TO OUR 2020/21 INTEGRATED REPORT
INTEGRATED THINKING FORMS THE BASIS OF OUR ANNUAL REPORT
L B Finance PLC (LBF) produces and publishes an Annual Integrated Report to demonstrate how integrated thinking is applied across all core business activities to ensure they are able to deliver short, medium and long term value for all stakeholders.
Since embarking on LBF integrated reporting journey in 2012/13, we have been progressively expanding LBF reporting approaches in order to increase transparency and improve the quality of LBF disclosures. LBF latest Integrated Annual Report for 2020/21 marks the 9th installment in LBF’s integrated reporting journey. The current report which has been prepared in accordance with the International Integrated Reporting Framework of the International Integrated Reporting Council (IIRC), is designed to inform LBF stakeholders how the LBF Group has systematically managed its core business activities to generate consistent financial results, create sustainable value and stay ahead of peers notwithstanding challenges in the year under review. The report also contains Standard Disclosures outlined by the GRI Sustainability Reporting Guidelines.
The 2020/21 report also carries a historical significance for it marks the culmination of 50 years of hard work and dedication that has brought the LBF Group to where it stands today - a top tier financial institution in Sri Lanka. To commemorate this important landmark, the release of the 2020/21 Integrated Annual Report is scheduled to coincide with LBF’s 50th anniversary in May 2021.
BOUNDARY AND SCOPE OF REPORTING
OUR INTEGRATED REPORTING BOUNDARY
OUR FINANCIAL REPORTING BOUNDARY
Our Group Strategy
LBF business activities Subsidiary business activities
Risk and opportunities arise from our operating activities
Risk and opportunities arise from our stakeholder relationship
TARGET AUDIENCE
This report which provides a comprehensive view of LBF economic, environmental and social performance for the period under review, is intended to fulfill the information needs of the Group’s key stakeholders - individuals, groups and organisations that materially affect or could be materially affected by LBF strategy execution and how LBF conduct business activities.
OUR REPORTING SUITES
LBF remain committed to provide transparent and honest reporting to LBF diverse set of stakeholders. Please visit LBF website to see the whole suite.
Navigating the future
L B F i n a n c e P L C | A n n u a l R e p o r t 2 0 2 0 / 2 1
Integrated Report
LBF integrated report is the primary report to LBF stakeholders. It is structured to show the relationship between the interdependent elements involved in LBF value creation story over the short, medium and long term period
Corporate Governance and Risk Management Report
The report involves a detail description of the LBF’s corporate governance information, and also includes integrated risk management information for the year of 2020/21
Sustainability GRI index
Report is covering sustainability information of environmental, social and governance elements and the report also includes GRI related information with the GRI navigating index

L B Finance PLC | Annual Report 2020/21 5
Voluntary Reporting Frameworks and Guidelines
Integrated reporting
International Integrated Reporting Council’s (IIRC) Integrated Reporting <IR> Framework
A Preparer’s Guide to Integrated Reporting by the Institute of Chartered Accountants of Sri Lanka
Sustainability reporting
GRI Standards
UNGC Principles and Sustainable Development Goals
AccountAbility – AA1000SES
REPORTING FUNDAMENTALS
Mandatory Reporting Frameworks and Guidelines
Financial reporting
Sri Lanka Accounting Standards comprising Sri Lanka Financial Reporting Standards (SLFRSs)
Sri Lanka Accounting Standards (LKASs) promulgated by the Institute of Chartered Accountants of Sri Lanka
Companies Act No. 07 of 2007
Finance Business Act No. 42 of 2011
Corporate Governance reporting
Corporate Governance Direction No. 3 of 2008 (as amended) issued by the Central Bank of Sri Lanka
Listing Rules of the Colombo Stock Exchange
The Code of Best Practice on Corporate Governance 2017 issued by the Institute of Chartered Accountants of Sri Lanka
Securities and Exchange Commission of Sri Lanka Act No. 36 of 1987 (as amended)
Assurance
Sri Lanka Auditing Standards (SLAuSs)
Sri Lanka Standard on Assurance Engagements (SLSAE) 3000; Assurance Engagements other than Audits or Review of Historical Financial Information, issued by CA Sri Lanka
Progressive action taken by LBF to improve the quality of reporting ;
Financial and Non-financial Reporting
The report extends beyond financial reporting and includes non-financial performance, opportunities, risks and outcomes attributable to or associated with our key stakeholders, which have a significant influence on our ability to create value.
Integrated Sustainability Reporting
Using the GRI Standards as a point of reference, LBF maintains its own internally developed sustainability reporting index which consists of a series of targeted Sustainable Development Outcomes (SDOs) that define our key sustainability priorities. Relevant SDO’s have been incorporated in our narrative on value creation (Page 62 to 65), to enable readers to measure LBF’s actual performance outcomes against respective SDO’s.

L B Finance PLC | Annual Report 2020/216
ABOUT THE REPORT
CUSTOMERS
BUSINESS PARTNERS
COMMUNITY
REGULATORS
EMPLOYEES
SHAREHOLDERS
Strategic response to
areas of sustainability
Building an inclusive and
ethical value chain
Advancing employee
opportunity and
diversity
Doing good in the local community
Being environmentally
sustainable
Promoting healthy
living
Revamping risk and governance reporting
To align with global best practices for reporting on our governance and risk management approaches, we have done away with stand-alone governance and risk sections and instead of having integrated these aspects into the narrative itself to bring a more holistic perspective to what is being discussed. To help our readers, we have introduced a series of icons that show the impact on the governance frameworks and the Group’s risk profile. Detailed disclosures on these aspects are available in our supplementary reports.
KEY CONCEPTS
Value creation means to LBF
The success of our business is determined by the ability to create value for our stakeholders. Value creation is therefore the key principle that underpins everything we do. Our value creation process is embedded in our Vision, Mission, Values and Goals (page 14) which forms an integral part of our business model (on pages 50 to 51). It is how we ensure that the way we think, our strategy and the decisions we make are all driven by the desire to create stakeholder value.
Value creation via the six capitals
Our relevance as a financial institution today and in the future is fundamentally depend on the capital inputs available to us and how we channel these resources into value-adding activities in order to generate results by the way of outputs and outcomes. Please refer to the Capital Management Report on page 116 to 204.
This value creation process often calls for some compromise. Such tradeoffs between our capital areas are discussed on Capital reports.
Materiality and material matters
We apply the principle of materiality in assessing what information should be included in our integrated report. This report therefore focuses particularly on those issues, opportunities and challenges that have a material impact on the LBF Group and its ability to consistently deliver value to shareholders and key stakeholders. The material matters applicable for 2020/21 reporting cycle described on pages 66 to 73.
The below infographic illustrates how our sustainability strategy is aligned with our stakeholder needs and with the seventeen United Nations Sustainable Development Goals (SDGs) most relevant to our business.
Strategic realignment with the United Nations Sustainable Development Goals (SDGs)
LBF has taken a step forward in deepening its understanding of the opportunities the SDG framework presents towards creating value for our stakeholders, whilst contributing towards achieving these global goals. As part of this commitment, we completed an impact review of our value chain and used the results to assess the completeness of our material issues and facilitate the reorientation of our strategies if needed. In reviewing the SDGs with reference to international guidance, we have identified some emerging concerns that have been incorporated into the ‘Future Focus’ under the respective SDGs. This provides a sense of our future direction, including how we will deliver on outcomes that will bring us closer to our vision to become the leading financial services institution in Sri Lanka.

L B Finance PLC | Annual Report 2020/21 7
Material changes during the year
Segment Material change Value creation
Business expansion of L B Microfinance Myanmar Company Limited.
Added 04 new branches, total 12 branches.
Introduced a micro finance model, which is geared to support the growth and development of small-scale farmers in rural areas of Myanmar through the provision of much-needed financial assistance and business development advice that would enable them to develop stable livelihoods, raise their living standards and improve overall quality of life.
COMMITMENT TO STAKEHOLDERS
Our stakeholders are those individuals, groups and organisations that materially affect or could be materially affected by our strategy execution and how we conduct our business activities. The LBF Group remains firmly committed to regularly engage with all key stakeholders (Page 52) to understand their concern and reorient our strategy, if needed. Our core values expressed in our culture which guide us in our interactions with stakeholders.
STATEMENT OF PRECAUTIONARY APPROACH
The precautionary principle calls for preventive actions when an activity is believed to threaten human health or the environment, even if there is no scientifically established evidence. As part of our mandate as a responsible financial institution, the LBF Group applies the precautionary principle where necessary, including in the areas of;
Human health and well-being
As a financial services provider, the core business activities of the LBF Group poses little or zero risk to human health and well-being. However, the Group considers the health and well-being of all our stakeholders to be of paramount importance and as such has implemented a comprehensive framework of policies and procedures to ensure the safety and well-being of all stakeholders. Please refer to the Human Capital Report (Page 154) and the Social and Relationship Capital Report (Page 176) for more specific details.
Balancing stakeholder interests
The LBF Group is constantly working to balance the interest of its various stakeholders, for we believe that doing so enhances the legitimacy of our business and strengthens our position against powers. In this regard, we aim to develop solutions that will not have a detrimental impact on the environment or the community. At the same time, we continue to undertake environmental and community-based initiatives for the benefit of society at large.
Governance and ethics
As a provider of financial services, our business is subject to a risk in terms of ethical and transparent equitable practices. We comply with all applicable local legislation to safeguard our reputation and brand. At the same time, we continue to work towards greater transparency and accountability, by enhancing our ethical practices, stakeholder relationships and strengthening our Code of Ethics to ensure the protection of all stakeholder rights. Going forward, we will also focus on refining our governance framework to accurately track and address ethical transgressions will also remain a priority for the LBF.
ASSURANCE
We have adopted a combined assurance approach to verify the accuracy and the completeness of the information contained in this Integrated Report. The contents included herein have been first approved by the respective business Heads with all financial information further reviewed by the Audit Committee prior to submission to the Board of Directors for approval. Moreover, Messers Ernst and Young, Chartered Accountants have
provided an independent assurance of the Consolidated Financial Statements on page 268 as well as the non-financial sustainability indicators as per the Global Reporting Initiative (GRI) Standards. This independent external assurance report on sustainability can be found on page 410 of this report.
FORWARD LOOKING STATEMENTS
This Integrated Annual Report may contain forward-looking statements with respect to the LBF Group’s future performance and prospects. While these statements reflect our future expectations at the time of publishing, it is important to remain mindful that a number of risks, uncertainties and other important factors could cause actual results to differ materially from our expectations. Hence the LBF Group does not accept any obligation to revise or update at a later date, the information expressed in these forward-looking statements.

L B Finance PLC | Annual Report 2020/218
FEEDBACK, FURTHER INFORMATION AND SUGGESTIONS
We appreciate the comments and suggestions received regarding our previous Annual Reports and have made every effort to bring in appropriate changes in the 2020/21 report. We welcome your comments and suggestions on this Report as well and request that you use the attached feedback form or raise your concerns directly to:
AGM – Finance/ Manager – Integrated Reporting and SustainabilityL B Finance PLC (Corporate office)No. 20, Dharmapala Mawatha, Colombo 03.
Tel: 011 2155 504 Fax: 011 2575 096
BOARD RESPONSIBILITY STATEMENT
The L B Finance PLC Board has applied its collective knowledge and expertise to ensure the integrity of the 2020/21 Integrated Report as well as any supplementary information referenced therein. The Board has considered the completeness of the material aspects addressed in the report, and the reliability of financial and non-financial information presented, based on the combined assurance process outlined above.
OUR APPROACH TO ONLINE REPORTING
Our Integrated Annual Report is available online on the LBF’s website at www.lbfinance.lk. Printed copies are available on request from our Company Secretaries, P W Corporates Secretarial (Pvt) Ltd, Tel: 0114640360-3
Online and web disclosures
To assist in the reduction of the Company’s carbon footprint, we urge our stakeholders to make use of our reporting site to view our reporting suite at www.lbfinance.lk/reporting or scan the QR code to be directed to the page.
ABOUT THE REPORT
On this basis, the Board is satisfied that the 2020/21 Integrated Report provides a fair and accurate representation of the performance of the Company for the year under review. Further the Board is of the view that the report confirms to the guidelines set out under the International Integrated Reporting <IR> Framework. The 2020/21 Integrated Report was approved by the Board and signed on its behalf by:
Anandhiy Gunawardhana Sumith AdhihettyChairperson Managing Director
scan the QR code to read this report online
MOST RECENT REPORTS
2019/20
2015/16
2018/19
2014/15
2017/18
2013/14
2016/17
2012/13
L B Finance PLC | Annual Report 2020/21 9
HOW TO READ THIS REPORT
Navigating through this report
The key objective of this report is to provide a comprehensive assessment of our Company and illustrate the strategies deployed to create value in the long run. It is centered around six capitals and our activities, held in place through the common thread of our focus on engaging with our stakeholders at a human level. Navigating through this report will require the reader to ask seven key questions:
Core questions to ask Where to look Page No. What you will find
Who governs the Company and how do they approach the evolving market dynamics ?
a) Letter from the Chairperson 206 • Broad overview of the Company’s current position and future direction.
• LBF’s key success factors and incisive analysis of the existing business verticals.
• The experience and competence of LBF’s leadership.
• In-depth review of the Governance and Control Framework.
b) Committees of the Board and
Management
231
c) Statement of Corporate
Governance
206
d) Performance analysis by the
Managing Director
37
What are the broad risks facing the Company and how are they managed?
a) Statement of Risk Management
241 • Risk identification and measuring techniques.
• Risk impacts and likelihoods, through heat maps.
• Risk mitigating tools and techniques.
• Breakdown of risk exposures in separate categories.
• Stress testing.
What role does the Company have in the bigger picture and how does LBF structure its activities to optimise value creation?
a) Value creation process 50 • Bird’s eye view of the Company’s role in the big picture.
• Key components of the business model that make it possible to transform resources.
• The organisational structure designed to complement LBF’s business model.
What are the various challenges within the operating environment and competitive landscape affecting LBF’s business?
a) Operating Environment and Strategic Response
88 • Macroeconomic aspects that shape the industry.
• Market forces and the competitive landscape that shape our business.
• LBF’s key competencies and scope of improvement.
b) Business model 50
c) Operating structure 17

L B Finance PLC | Annual Report 2020/2110
HOW TO READ THIS REPORT
Core questions to ask Where to look Page No. What you will find
How are strategies formulated and resources allocated?
a) Strategy and Resource Allocation
74 • Risks and opportunities identified through analysis of operating environment and stakeholder engagement.
• Business model adaptability and change requirements.
• Responses to issues raised through stakeholder engagement.
• Resource allocation strategies to meet growth objectives.
• Interdependencies, complexities and trade-offs between capitals.
• Measuring the efficiency of objectives.
How are resources transformed through the various capitals – in order to create value for stakeholders?
a) Financial Capital 116 • Financial resources.
• Tangible inputs.
• People.
• Knowledge-based intangibles.
• Key relationships and engagement with stakeholders.
• Environmental resources.
b) Manufactured Capital 144
c) Human Capital 154
d) Intellectual Capital 166
e) Social and Relationship Capital 176
f) Natural Capital 196
How did the different segments of the business contribute towards the overall results of the Company?
a) Business Segment Review 102 • Performance reviews.
• Influential trends affecting business segments and subsidiaries.
• Risks and outlook.
QUICK READERS TO UNDERSTAND OUR REPORT If you need a quick snapshot or brief of our Annual Report, please go through the following pages:
Chairperson’s statement
Business review
Managing Director’s review
Financial statement highlights
Financial highlights
Capital reports
Non-financial highlights
SOCIAL ECONOMIC
Page 33 Page 102
Page 28
Page 116
Page 37 Page 262
Page 30
ENVIRONMENTAL

L B Finance PLC | Annual Report 2020/21 11
LEADING THE WAY FOR VALUE CREATION THROUGH NEW REPORTING ERA
1st Time in Sri LankaAccessibility via equity design
We differentiate ourselves by placing stakeholders at the heart of what we do.
Navigating the future
L B F i n a n c e P L C | A n n u a l R e p o r t 2 0 2 0 / 2 1
Printed Annual Reports are available on request
Trilingual
Digital Version
Accessibility
Audio Version Web Site
Summarized Videowith
Sign Language
Chairperson and Managing Director
Statements
Mobile OptimizedPDF Version
Sign Language for multimedia users
Chairperson and Managing Director
Statements
A dedicated website for Annual Report and integrated reporting
information
High QualityPDF Version
Colorblind - Friendly Design
TRANSFORMING REPORTING STYLE - EQUALLY REPORTING DESIGN TO EQUITABLE REPORTING DESIGN
We have always made a concerted effort to make our reports more inclusive and equally accessible to all stakeholders. This year we have taken a further step to ensure equitable access to reach out to an even wider audience. We have used softer design elements and special tones that make it easier on the eye for those who are sensitive to sharp colours. We have introduced some new, unique features in our online report as well to make it more accessible. We have incorporated a trilingual video presentation summarising our report and added audio versions of our Chairperson’s Statement and Managing Director’s Review. Fully translated versions of both these statements are also available online.
ECONOMIC
SOCIALENVIRONMENT
Scan QR code to read L B Finance PLC Integrated Annual Report 2020/21 online
L B Finance PLCAnnual Report 2020/21STRATEGIC FOCUS
TRIPLE BOTTOM LINE
OUR STAKEHOLDERS
CUSTOMERS
OPERATIONAL EXCELLENCE
CUSTOMER AND STAKEHOLDERS EXPERIENCE
BUSINESS SIMPLIFY AND ACCELERATE
RESOURCE OPTIMIZATION
POWERED BY PEOPLE AND GROWING REPUTATION
SOCIETY/COMMUNITY
EMPLOYEES
REGULAORS
SHAREHOLDERS
BUSINESS PARTNERS
MANUFACTURED
CAPITAL
HUMAN
CAPITAL
INTELLECTUAL
CAPITAL
SOCIAL
CAPITAL
NATURAL
CAPITAL
Pursuing
sustainable
business
growth
amidst socio
economic
uncertainty
Page references
Link to online
video
Becoming
more
customer-
centric
Managing
social and
environmental
inequalities
Developing
a highly
engaged,
satisfied and
motivated
workforce
Demand
for stricter
governance,
tighter
regulatory
control and
improved risk
management
Technological
advancement
and higher
competitive
pressure
L B Finance PLC
Annual Report 2020/21
CAPITALS
MATERIAL MATTERS
REFERENCES
FINANCIAL
CAPITAL
BOOK MARK
We have introduced user-friendly icons as a quick reference guide to our Annual Report and have also included a book mark to help you easily navigate through the pages.

L B Finance PLC | Annual Report 2020/2112
OUR INTEGRATED REPORTING PRINCIPLES
LBF report provides insights in to the LBF’s strategy and value creation in the short term, medium term and long-term to their stakeholders and impact on the capitals
LBF reporting suite is presented in a consistent and comparable manner, accompanied by clear navigation icons, corresponding information for past years, along with links and references to additional information contained within the report and online
Completeness of the content is sought through the application of a materiality approach, while reliability of information is clarified through internal audits and the external assurance of our financial and sustainability information
LBF integrated reporting requirements and has the primary purpose of demonstrating how LBF engages with their key stakeholders and delivers on their needs, wants and expectations reflecting on their stakeholder relationships
This Integrated Annual Report outlines key information pertaining to the Company’s value creation process. Additional details can be found in the supplementary reports
The report seeks to demonstrate the interconnectivity between value creation and the key value drivers
STRATEGY FOCUS AND FUTURE ORIENTATION
COMPARABILITY AND CONSISTENCY
RELIABILITY AND COMPLETENESS
STAKEHOLDER RESPONSIVENESS
MATEREALITY AND CONCISENESS
CONNECTIVITY INFORMATIONOUR INTEGRATED REPORT 2020/21
L B Finance PLC | Annual Report 2020/21 13
C H A P T E R
01Stability
A Steadfast CourseWe are led by an unwavering
vision that keeps us on the right track – moving firmly onwards
with stability and purpose
About us – LB at a glance 14 Vision, Mission, Values, Goals 14 Our profile 16 Product portfolio 18
Our strategic journey 20
Our contribution to the economy 22

L B Finance PLC | Annual Report 2020/2114
ABOUT US
LBF AT A GLANCE
Being a purpose-driven financial institution
At L B Finance PLC, we aim to be purpose-driven in everything we do. Our strategy and business model to our corporate culture, all reflect our desire to go beyond a mainstream financial services institution to touch the lives of people, support businesses and help the country to embrace the progress.
Where we want to go
What we need to do
Who we are
VISIONTo contribute to the quality of life experienced by our depositors, customers, employees and the general public through partnerships that fuel the growth of our Company and to create shareholder value both in the short term and long term.
MISSION
VALUES GOAL
To mobilise public funds by innovating investment products that will enhance the value delivered to our depositors.
To engage in prudent lending to entrepreneurs to assist them in the creation of wealth.
To use training and career development to create an empowered and committed group of employees who will drive the Company to
high levels of achievement.
To embark on investments in which results can be clearly assessed and seize new opportunities in the market.
To offer a caring and personalised service that will form the foundation for developing lasting partnerships with our stakeholders, employees and the general public.
Excellence Transparency
Ethics To be a major player in the financial services sector in Sri Lanka
Innovation
Professionalism Quality
L B Finance PLC | Annual Report 2020/21 15
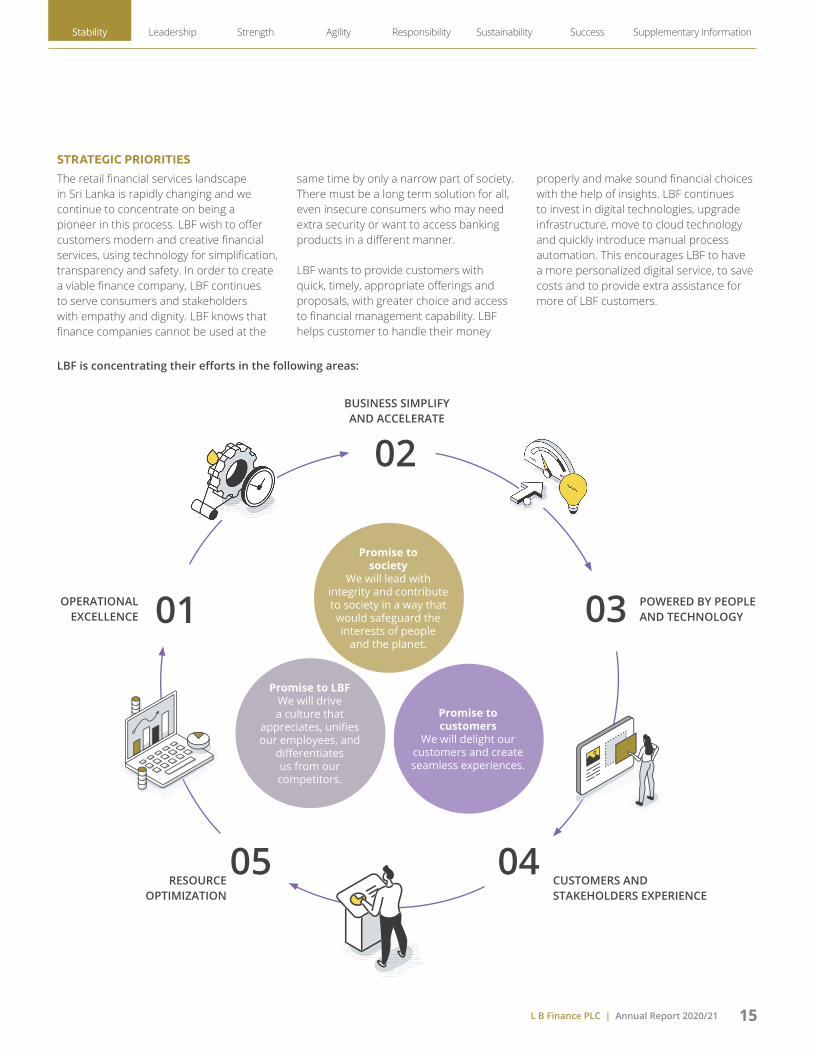
STRATEGIC PRIORITIES
The retail financial services landscape in Sri Lanka is rapidly changing and we continue to concentrate on being a pioneer in this process. LBF wish to offer customers modern and creative financial services, using technology for simplification, transparency and safety. In order to create a viable finance company, LBF continues to serve consumers and stakeholders with empathy and dignity. LBF knows that finance companies cannot be used at the
same time by only a narrow part of society. There must be a long term solution for all, even insecure consumers who may need extra security or want to access banking products in a different manner.
LBF wants to provide customers with quick, timely, appropriate offerings and proposals, with greater choice and access to financial management capability. LBF helps customer to handle their money
properly and make sound financial choices with the help of insights. LBF continues to invest in digital technologies, upgrade infrastructure, move to cloud technology and quickly introduce manual process automation. This encourages LBF to have a more personalized digital service, to save costs and to provide extra assistance for more of LBF customers.
LBF is concentrating their efforts in the following areas:
BUSINESS SIMPLIFY AND ACCELERATE
POWERED BY PEOPLE AND TECHNOLOGY
CUSTOMERS AND STAKEHOLDERS EXPERIENCE
OPERATIONAL EXCELLENCE
RESOURCE OPTIMIZATION
Promise to society
We will lead with integrity and contribute to society in a way that
would safeguard the interests of people
and the planet.
Promise to customers
We will delight our customers and createseamless experiences.
Promise to LBFWe will drive a culture that
appreciates, unifies our employees, and
differentiates us from our competitors.
02
01 03
0405
Stability Leadership Strength Agility Responsibility Sustainability Success Supplementary Information

L B Finance PLC | Annual Report 2020/2116
ABOUT US
OUR PROFILE
L B Finance PLC (LBF) was incorporated in May 1971 as a private limited liability Company and in 1982 converted into a public limited liability Company. Several years later, in 1997, the Company was listed on the Colombo Stock Exchange and again in June 2008 re-registered under the new Companies Act No. 7 of 2007. Initially, the majority shareholding was held by Lewis Brown & Company Limited and subsequently, in 1994, Vanik Incorporation Limited acquired the controlling interest of the Company.
Mr. Dhammika Perera, a renowned Sri Lankan entrepreneur, took over the Company in 2003, after which L B Finance PLC became part of the Vallibel One PLC Group, a highly diversified local conglomerate with interests in; lifestyle, finance, aluminium, plantation, leisure, consumer and investments.
L B Finance PLC’s journey over the past 50 years is marked by a long list of accomplishments that places the Company as one of the top tier financial institutions in Sri Lanka today.
LBF in context
Backed by a strong financial tradition spanning 50 years, coupled with our local experience, has gained the trust of corporates, SMEs, micro entrepreneurs and individuals alike. LBF’s footprint is marked by a network of 152 branches and 17 gold loan centres across Sri Lanka. In 2017, LBF strategically expanded its operations beyond the shores of Sri Lanka to Myanmar, where the Company has setup 12 branches in Bago and Magway regions with the aim of bringing prosperity to the people of that country as well.
Our motivation
At LBF, our ambition is to help customers to improve their quality of life by providing them with financial solutions to assist them to interact with the world as it evolves. At the same time, we believe that these financial services should not cost to our customers excessive amounts of money. Our aim is therefore to make financial services simpler, more affordable, accessible and personalised.
As a testament to our approach, we succeeded in onboarding new customers in the twelve months ending 31st March 2021, a commendable achievement in a challenging year. The numerous awards and accolades, LBF continues to receive also further confirms the versatility of our value proposition and customer centric approach.
How we do business
At LBF, we committed to act ethically and with integrity in everything we do. Through our approach, we seek to build long term relationships with stakeholders based on trust. The LBF Board of Directors set the tone from the top to promote a culture of ethics and transparent behaviour across the Group. This is supported by a range of policies that specify the ethical conduct expected from all employees including specific actions to deal with corruption and bribery, guidelines on receiving and giving gifts and the exclusion of political party sponsorships. Frequently we communicate these policies to our employees and also continuously reiterate the importance of legal and regulatory compliance.
The market opportunity
While we accept that although financial services are a necessity, it is the first priority for many Sri Lankans. LBF see this scenario as an opportunity to create financial solutions that make it possible for people to choose a unique and most affordable way to control their money.
We have also identified that millions of underpriviledged Sri Lankans are not part of the formal financial system. Current research indicates that, some of Sri Lankans do not have even a savings account. This creates an opportunity for LBF to bridge the gap through the provision of basic financial services that will enable rural communities to gain access to much needed financial resources.
Key attributes that gives LBF its competitive edge in the market
A unique corporate culture that supports the creation of a highly engaged and motivated workforce
Experienced management teams that brings together the best minds in the industry
Managed evolution and digital focus that enables the delivery of more agile and dynamic solutions
Prudent cost management to enable a reduction in our cost-to-income ratio overtime
Strong captive market share representing an opportunity for consistent revenue growth
Robust risk management practices coupled with a prudent lending strategy that has resulted in the lowest NPL in the industry
Long standing reputation that reflects the continuous and ongoing commitment to excellence in governance, transparency in corporate reporting and carbon neutral focus

L B Finance PLC | Annual Report 2020/21 17
Doing business according to four fundamentals
The LBF way describes how we do business according to four fundamentals:
We apply these fundamentals in how we behave and how we think about our business. This includes product and branch design, pricing, processes and communication. Financial services are complex, but we design for simplicity and transparency in the eyes of the customers and always adhere to our fundamentals.
Simplicity
Simplicity is the hallmark of our value proposition and the essence of how LBF operates. We apply the principle of simplicity to the way we behave and how we think about our business. This includes product and pricing structures, branch design, back-end systems and communication. We now increasingly rely on technology as an enabler of simplicity.
Accessibility
Our aim is to empower our customers by enabling them to access our financial solutions from anywhere, at any time. Premised on this, we provide our customers with a range of options from physical touch-points such as branches, gold loan centres and CDMs to digital platforms such as CIM mobile wallet and e-connect online financing solutions that facilitate 24/7 - 365 days access from anywhere in the world.
Affordability
Affordability means ensuring that our customers always get value for money. We achieve this by consciously controlling our costs and pursuing efficiency improvements that would translate into value for money for our customers.
Personalised experience
We see every LBF customer as unique and try to create customized solutions to meet their specific financial needs. Combining digital tools with one-on-one personal relationships, we aim to understand the unique financial needs and goals of each customer and help our customers to manage their money in the best way possible.
OUR ORGANISATIONAL STRUCTURE
Vallibel One PLC is an innovation driven diversified conglomerate which operates 46 subsidiaries across 7 industry sectors. Vallibel One PLC and Royal Ceramics Lanka PLC have shareholdings of 51.75% and 26.07% in LBF respectively. The Company’s latest venture, L B Microfinance Myanmar Company Limited with 100% stake held by L B Finance PLC.
LB MICROFINANCE MYANMAR
55.96%
26.07% 22.18%
51.75%
100.00%
Other Shareholders
LBF competitive advantage as a financial solutions provider is based on:
A culture of ethics and integrity
A strong captive market share
Solid risk management fundamentals
A prudent lending strategy
Stability Leadership Strength Agility Responsibility Sustainability Success Supplementary Information
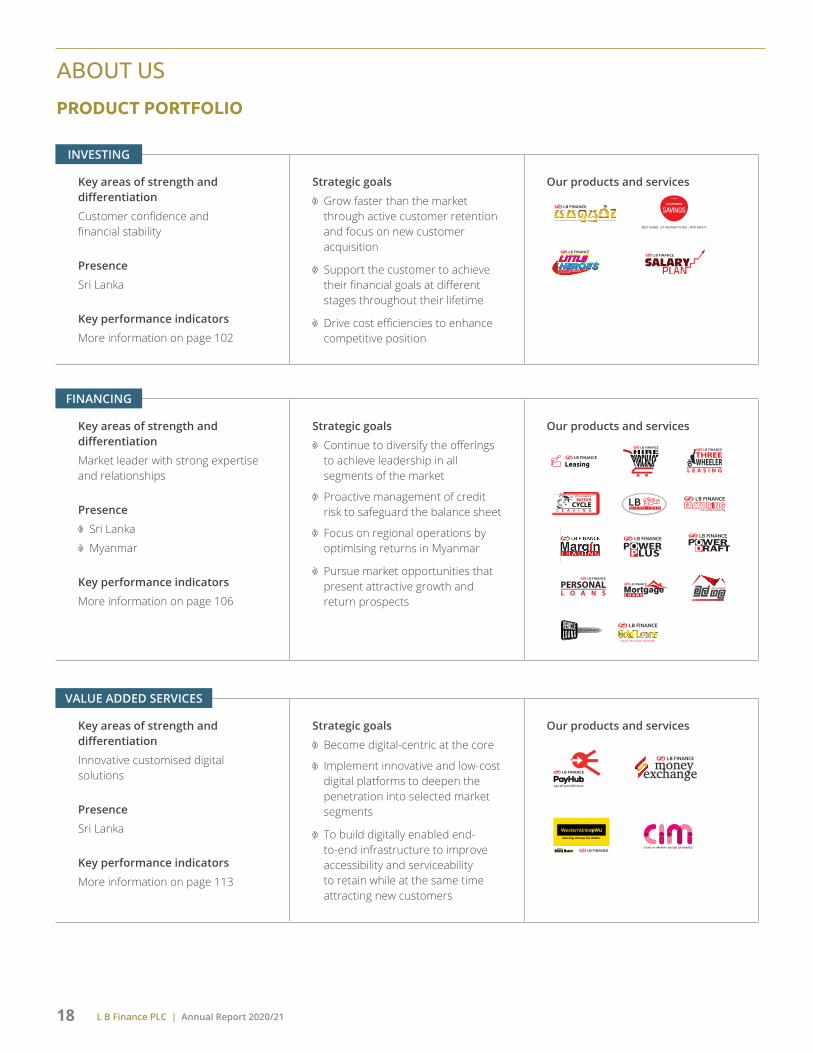
L B Finance PLC | Annual Report 2020/2118
Key areas of strength and differentiation
Innovative customised digital solutions
Presence
Sri Lanka
Key performance indicators
More information on page 113
Strategic goals
Become digital-centric at the core
Implement innovative and low-cost digital platforms to deepen the penetration into selected market segments
To build digitally enabled end-to-end infrastructure to improve accessibility and serviceability to retain while at the same time attracting new customers
Our products and services
Key areas of strength and differentiation
Market leader with strong expertise and relationships
Presence
Sri Lanka
Myanmar
Key performance indicators
More information on page 106
Strategic goals
Continue to diversify the offerings to achieve leadership in all segments of the market
Proactive management of credit risk to safeguard the balance sheet
Focus on regional operations by optimising returns in Myanmar
Pursue market opportunities that present attractive growth and return prospects
Our products and services
Key areas of strength and differentiation
Customer confidence and financial stability
Presence
Sri Lanka
Key performance indicators
More information on page 102
Strategic goals
Grow faster than the market through active customer retention and focus on new customer acquisition
Support the customer to achieve their financial goals at different stages throughout their lifetime
Drive cost efficiencies to enhance competitive position
Our products and services
ABOUT US
PRODUCT PORTFOLIO
INVESTING
FINANCING
VALUE ADDED SERVICES

L B Finance PLC | Annual Report 2020/21 19
We seek to be a leading financial institution in sustainable performance and customer satisfaction. The purpose of our brand is to promote positive changes in the lives of people and society. Our products and services seek to meet the needs of our customers, reflecting our continuous efforts to provide the best experience to everyone who interacts with us.
OUR COMPETITIVE ADVANTAGES
Here are the main characteristics that distinguish us from our peers and defend us against them.
PURPOSE-ORIENTED COMPANY
“Where solution begins”, we are committed to driving sustainable, inclusive growth across Sri Lanka diversified customer base, unmatched service offerings.
Our businesses and revenue streams are well-diversified across client, sector, product and geography, which provides protection in times of volatility.
HIGH OPPORTUNITIES FOR GROWTH
Our future growth prospects are driven by regional economic fundamentals and growing financial inclusion and penetration, which provide an opportunity to boost market share, particularly where we have relatively small market shares in some large markets.
Our strong and liquid balance sheet provides flexibility to manage uncertainty, change, innovation and growth.
INTEGRATED PLANNING TO CREATE SUSTAINABLE VALUE
Leading the way as a responsible corporate citizen, LBF has embraced sustainability as a high priority item in its corporate agenda. Having understood the importance of being sustainable in all aspects of our operations, values of sustainability are embedded in our strategy, product development process as well as across operations at all levels. We drive our sustainability values with commitment and dedication, and necessary board oversight to focus on creating value for stakeholders. It is our firm belief, that a sustainable business model is the key to ensure that the Company and its stakeholders continue to grow and thrive in the long term.
RECOGNIZED, STRONG BRAND
We seek to be a leading financial institution in sustainable performance and customer satisfaction. The purpose of our brand is to promote positive changes in the lives of people and society. Our products and services seek to meet the needs of our customers, reflecting our continuous efforts to provide the best experience to everyone who interacts with us. We encourage people to have a good relationship with money, making better choices and planning their investments on a more effective way. The responsibility for the development of the nation is the core of our brand and encourages us to invest and work for great causes, such as culture, education, sports and community development.
OUR BRAND EVOLUTION
One of our oldest branches
Stability Leadership Strength Agility Responsibility Sustainability Success Supplementary Information

L B Finance PLC | Annual Report 2020/2120
OUR STRATEGIC JOURNEY
2021 marked the 50th year of LBF. Our customers, shareholders, employees, business partners, regulators, and the community at large, have each been an integral part that made us whole and who we are today; one of the most recognized and the largest financial institution of the country. Hand-in-hand we have trekked over mountains and have attained new heights. Despite many challenges along the way we, as a
family, grew together. Thus, at this milestone we reflect on the lives we have touched, gave us a reason to exist and provided us the opportunity to give back to the community. This year we are sharing with you the stories which we consider as our achievements and inspiration for our journey ahead...... Navigating future.
Rs. ‘000 Rs. ‘000
19931990 1996 1999 2002 2005 2008 2014 2017 2018 2019 2020 20212011 19931990 1996 1999 2002 2005 2008 2014 2017 2018 2019 2020 202120110
30,000,000
60,000,000
90,000,000
120,000,000
150,000,000
Rs.
0
1,000,000
2,000,000
3,000,000
4,000,000
5,000,000
6,000,000
7,000,000
8,000,000
0
3
6
9
12
15
Total assets Profit After TaxDeposits from customers Earnings per Share
2002-20111971-1981
Established as a private company on 30th May 1971 with its registered office at No. 101, Vinayalankara Mawatha, Colombo 10. Majority shareholding of 94.9% was held by Lewis Brown & Company Limited
Changed its status as a public company
Vanik Incorporation Limited’s shareholding increased to 83.26%
Listed on the Colombo Stock Exchange
Commence pawn broking
First pawning centre opened in Maradana
Moved Head Office to Prof. Stanley Wijesundera Mawatha, Colombo 7
Introduced lottery based deposit scheme “Siya Savi”
Mr. K D D Perera took over a stake of 58.74% to turn around the loss-making Company into a profitable venture
Registered in terms of Section 2 of the Finance Companies Act No. 78 of 1988
The Company re-registered under the new Companies Act No. 07 of 2007
Developed a new website with online payment and vehicle trade-in facility
Profits doubled and reached over Rs. 1 billion for the first time in the history
North and East market presence for the first time
Became a part of Vallibel One umbrella which is a diversified company
Upgraded the ratings from BBB+/P2 to A-/P2 by RAM Ratings (Lanka) Limited
Company has emerged as the second largest Licensed Finance Company (LFC) in Sri Lanka introducing Global Reporting Initiative (GRI) to the Annual Report
Moved to our new corporate office located at Dharmapala Mawatha, Colombo 03
Introduced LB Savings to customers
Largest expansion drive within the industry with 20 new outlets
Recorded the largest deposit base among the NBFI sector
Launched Pay Hub facility
Global Banking and Finance Review UK awarded us as the ‘Best Retail Finance in Sri Lanka for 2013’
Opened first Premier branch in Mount Lavinia
Staff strength surpassed 2,000
Became the first carbon conscious finance company in Sri Lanka.
Became the 1st finance company in Sri Lanka to comply with ISO 27001:2013
Interbank Payment System (SLIPS)
CSR re-branded as LB Sustainability
Started 24 hours service call center
Opened the 100th branch in Jaffna
Introduced the VISA shopping card
Became the first carbon neutral finance institution in Sri Lanka.
LB Finance ranked 26 among the top 100 brands in the country by Brand Finance
1982-2001 2012-2015

OUR STRATEGIC JOURNEY
2021 marked the 50th year of LBF. Our customers, shareholders, employees, business partners, regulators, and the community at large, have each been an integral part that made us whole and who we are today; one of the most recognized and the largest financial institution of the country. Hand-in-hand we have trekked over mountains and have attained new heights. Despite many challenges along the way we, as a
family, grew together. Thus, at this milestone we reflect on the lives we have touched, gave us a reason to exist and provided us the opportunity to give back to the community. This year we are sharing with you the stories which we consider as our achievements and inspiration for our journey ahead...... Navigating future.
Rs. ‘000 Rs. ‘000
19931990 1996 1999 2002 2005 2008 2014 2017 2018 2019 2020 20212011 19931990 1996 1999 2002 2005 2008 2014 2017 2018 2019 2020 202120110
30,000,000
60,000,000
90,000,000
120,000,000
150,000,000
Rs.
0
1,000,000
2,000,000
3,000,000
4,000,000
5,000,000
6,000,000
7,000,000
8,000,000
0
3
6
9
12
15
Total assets Profit After TaxDeposits from customers Earnings per Share
Successfully completed 45 years in the finance Industry with a profit growth of 70%, profit of Rs. 3.7 billion (PAT)
Launched LB e-connect online platform to saving customers
Obtained MoneyGram agentship for international money transfer
Integrated with Common Electronic Fund Transfer Switch (CEFTS)
Exceeded Rs. 100 billion asset base
Launched of LB Gift Store
Mortgage loan product was re-branded and re-launched as ‘Mulgala’
Launched of ‘Krutha Hastha’ senior citizens loan scheme
First overseas expansion of L B Finance to Myanmar
Going into cloud based IT platform
Ranked among the top 20 brands in Sri Lanka by Interbrand
Launched Cash Deposit Machine (CDM) facility
A-(lka) credit rating assigned by Fitch Ratings Lanka Limited
Revamped sustainability website
Profits reached over Rs. 5 billion for the first time in the history
Successfully launched ORACLE Fusion finance module
Established a Digital Financial Services (DFS) unit
Introduced digital wallet, paperless credit approval process and launched Eclipse credit module
Commenced planting 50,000 trees under ‘Thuru Wawamu’ project
Opened LBFs’ 3rd and 4th Premier centres at Colombo 07 and Negombo
Shifted Disaster Recovery data centre to Sri lanka Telecom dedicated ‘Data Centre’ in Pitipana
Launched the CIM (Cash In Mobile) wallet
Introduced Cash Recycle Machines (CRM) for cash withdrawals
Implemented Artificial Intelligence technology for leasing module
2016-2020
2021
Chatbot was introduced to the corporate website and social media
platforms
Automation of the credit verification process
Automation of the insurance renewal process
Fully automated risk assessment scorecard for branches and
gold loan centers
L B Finance PLC | Annual Report 2020/21 21
Stability Leadership Strength Agility Responsibility Sustainability Success Supplementary Information

L B Finance PLC | Annual Report 2020/2122
OUR CONTRIBUTION TO THE ECONOMY
As a leading financial services institution, LBF makes an impactful contribution to Sri Lankan economy even in the COVID-19 pandemic. Our core business activities help to reduce inequalities and minimize inherent socioeconomic discrepancies within the country. The mainstream financial services we offer to create opportunities for individuals to enhance their lifestyle and living standards, while our efforts to promote digital and financial inclusion focus on empowering grass root level entrepreneurs and strengthening the country’s SME sector. Being an authorized agent for Western Union Money transfer systems, we also facilitate the inflow of foreign currency to the country.
As a responsible corporate steward, LBF pays its share of taxes and levies applicable to the business. In addition, we employ 3,564 men and women from all across the island and strive to maintain a 1: 0.65 local hiring ratio to ensure that the benefits of stable employment are channeled back into the provincial economies.
Furthermore, we invest in CSR projects that focus on addressing key national issues such as uplifting health and education standards and also undertake environmental sustainability initiatives for the benefit of future generations of Sri Lankans.
Global trends
Given the nature of our business as a financial solutions provider, the single most influential global trend continues to affect our operations, is the rapid pace of digital advancement in recent years. The COVID-19 pandemic has significantly intensified the global appetite for digital technology solutions especially in the financial domain.
While early adoption of technology is the key to gain a competitive advantage in this evolving landscape, we believe it is equally important to remain mindful of the consequences that arise as a result of our decision to embrace digital technology, especially the impact on our workforce. The grid below depicts our efforts to strike a balance between the digital technology transition and human capital outcomes.
Artificial Intelligence and machine learning tools will enable more process automation, leading to efficient and more productive use of the Company’s resources including human capital.
This scenario also presents some very important career transition opportunities for both men and women.
The adoption of digital technology in response to COVID-19 restrictions, in particular, the work from home model, virtual meetings, etc. have proven to work well for the Company’s back office and administrative employees.
However, given the way of our business operates, our sales teams adapted to these mechanisms in carrying out their specific job roles.
Investing in training for existing employees to acquire the necessary skills and competencies to specialize in digital marketing, will be vital in safeguarding the Company’s long term growth trajectory.
Employing tech savy millennials will help to accelerate the Company’s digital agenda and also support the achievement of LBF’s gender equality goals. Millennials are deemed to be more suited for roles involving tech aspects of the business such as the call centre operation, the innovation center, the digital finance unit as well as for marketing of digital channels. This is because millennials are driven by the desire to succeed and not by gender-based stereotypes.
Hig
h so
cial
equ
ality
Low
soc
ial e
qual
ity
Sustainable growth through low resource usage Sustainable growth through high resource usage
GLOBAL TRENDS IMPACT ON LBF
L B Finance PLC | Annual Report 2020/21 23
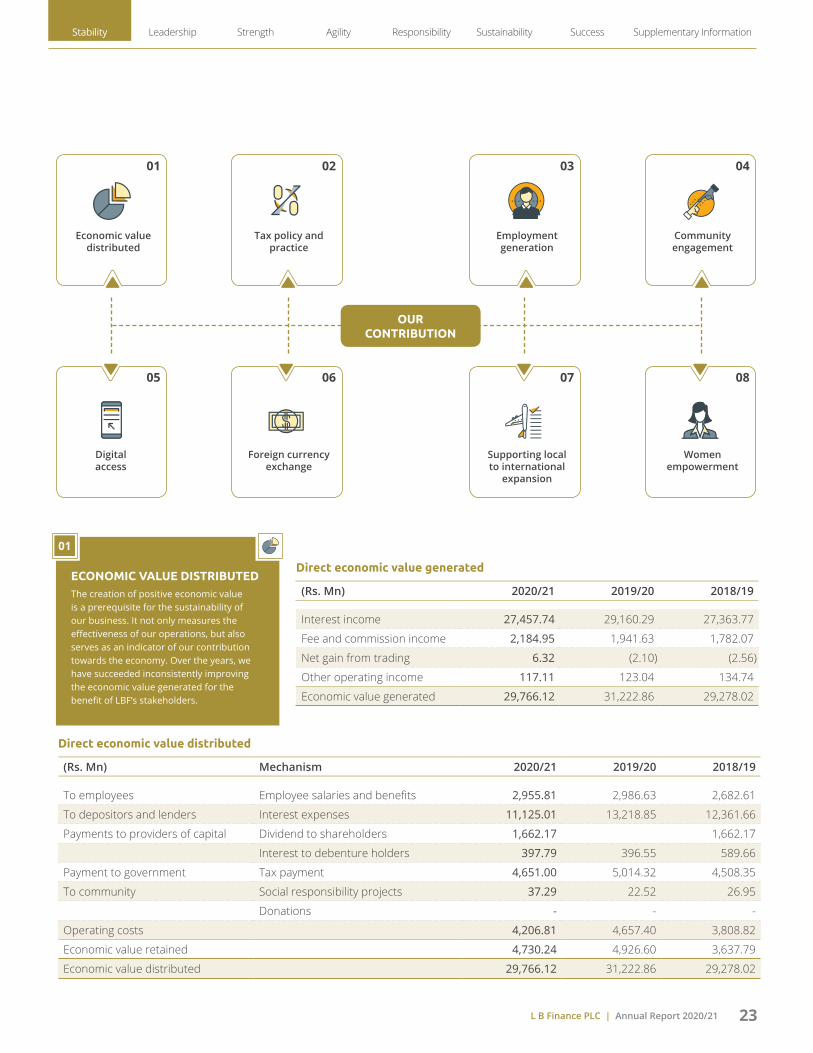
ECONOMIC VALUE DISTRIBUTED The creation of positive economic value is a prerequisite for the sustainability of our business. It not only measures the effectiveness of our operations, but also serves as an indicator of our contribution towards the economy. Over the years, we have succeeded inconsistently improving the economic value generated for the benefit of LBF’s stakeholders.
Direct economic value generated
(Rs. Mn) 2020/21 2019/20 2018/19
Interest income 27,457.74 29,160.29 27,363.77
Fee and commission income 2,184.95 1,941.63 1,782.07
Net gain from trading 6.32 (2.10) (2.56)
Other operating income 117.11 123.04 134.74
Economic value generated 29,766.12 31,222.86 29,278.02
Direct economic value distributed
(Rs. Mn) Mechanism 2020/21 2019/20 2018/19
To employees Employee salaries and benefits 2,955.81 2,986.63 2,682.61
To depositors and lenders Interest expenses 11,125.01 13,218.85 12,361.66
Payments to providers of capital Dividend to shareholders 1,662.17 1,662.17
Interest to debenture holders 397.79 396.55 589.66
Payment to government Tax payment 4,651.00 5,014.32 4,508.35
To community Social responsibility projects 37.29 22.52 26.95
Donations - - -
Operating costs 4,206.81 4,657.40 3,808.82
Economic value retained 4,730.24 4,926.60 3,637.79
Economic value distributed 29,766.12 31,222.86 29,278.02
OUR CONTRIBUTION
01
05
03
07
02
06
04
08
Economic valuedistributed
Digital access
Employment generation
Supporting local to international
expansion
Tax policy and practice
Foreign currency exchange
Community engagement
Women empowerment
01
Stability Leadership Strength Agility Responsibility Sustainability Success Supplementary Information

L B Finance PLC | Annual Report 2020/2124
Market Value Added (MVA)
Market value added statement reflects the Company’s performance evaluated by the market through LBF’s share price. This statement shows the difference between the Company’s market value and the capital contributed by investors. In other words, it is the sum of all capital claims held against the Company plus the market value of debt and equity.
A high MVA indicates substantial wealth creation for the shareholders and vice versa. A negative MVA means that the value of management’s actions and investments have not succeeded in achieving the desired growth objectives.
(Rs. Mn) 2020/21 2019/20 2018/19
Market capitalisation 26,262.30 16,690.97 16,635.57
Book value of equity 28,189.29 22,999.55 18,427.15
Market value added/(destroyed) (1,926.98) (6,308.58) (1,791.58)
(Rs. Mn) 2020/21 2019/20 2018/19
Direct Taxes
Income Tax 2,017.68 2,875.24 1,588.32
Value Added Tax on Financial Services 1,473.11 1,607.38 1,402.28
Nation Building Tax on Financial Services - 157.17 186.5
Debt Repayment Levy on Financial Services - 749.18 337.06
Crop Insurance Levy 52.44 54.79 47.32
Economic Service Charge - 157.33 142.41
Indirect Taxes (Collected and Paid)
Value Added Tax 161.61 255.96 292.98
Nation Building Tax 31.40 36.5
Stamp Duty 179.71 324.98 411.3
Withholding Tax on Dividend and Interest 2.14 508.60 360.32
PAYE Tax/Advanced Personal Income Tax 82.13 102.61 106.61
Total Taxes Paid during the Financial Year 3,968.85 6,824.68 4,911.63
OUR CONTRIBUTION TO THE ECONOMY
OUR TAX POLICY AND PRACTICE LBF’s tax policy and practices are in-line with the regulatory requirements outlined by the regulatory body. LBF remains one of the largest tax payers among the Non-Bank Financial Institutions in the country.
02
Taxes paid to thegovernment
0
2,000
4,000
6,000
8,000
2018
2017
2019
2020
2021
Rs.Mn

L B Finance PLC | Annual Report 2020/21 25
(Rs. Mn) 2020/21 2019/20 2018/19
Investment on CSR 37.29 22.52 26.95
62
21
51
43
2020 2021
NORTHERN PROVINCE
EASTERN PROVINCE
NORTH CENTRAL PROVINCE
NORTH WESTERN
PROVINCE
CENTRAL PROVINCE
UVA PROVINCE
WESTERN PROVINCE
SABARAGAMUWA PROVINCE
SOUTHERN PROVINCE
EMPLOYMENT GENERATION As a large financial services organisation, we provide employment to over 3,500 individuals across Sri Lanka and with our accelerated growth trajectory continue to offer new opportunities each year. Moreover, through our lending activities that support self-employed individuals, SMEs and micro entrepreneurs, we contribute indirectly towards the creation of thousands of job opportunities across Sri Lanka.
03
COMMUNITY ENGAGEMENT The commitment to social welfare and community development is an integral part of our value culture. To bring greater focus to the community work we undertake, we now use the SDGs (Sustainable Development Goals) announced by the United Nations as part of their 2030 sustainability development agenda. On this basis we have progressively increased our investment towards more meaningful and impactful CSR projects that have the capacity to benefit a larger cross section of the community.
04
No. of CSR projects
0
5
10
15
20
25
30
35
2019
2020
2021
(No.)Investment on CSR
05
10152025303540
2019
2020
2021
(Rs.Mn)CSR contribution (%)
Access to educationEmpowering entrepreneurs Community well being Business linked CSRBuilding parnerships Youth empowerment
26.32
9.75
58.23
2.75 1.021.93
2021
83
80
36
46
37
77
30
617
69
57
787
78
35
81
Stability Leadership Strength Agility Responsibility Sustainability Success Supplementary Information

L B Finance PLC | Annual Report 2020/2126
OUR CONTRIBUTION TO THE ECONOMY
Success stories of our women empowerment programme
Sarojini’s success story
Kalyani’s success story
Samantha’s success story
Priyanka’s success story
DIGITAL ACCESS Reinforcing its commitment to support the national initiative to promote a cashless society, LBF launched the ‘CIM’ (Cash In Mobile) mobile wallet in 2019. In 2020/21, the ‘CIM’ wallet gained considerable traction in the market as a versatile and highly effective digital money management solution.
FOREIGN CURRENCY EXCHANGE As an authorized agent for Western Union Money Transfer Systems, LBF facilitates the inflow of foreign currency to the country from Sri Lankans living and working around the world. In addition, we also offer foreign currency trading services to meet the needs of the tourism and trade sectors.
SUPPORTING LOCAL TO INTERNATIONAL EXPANSION LBF assists businesses seeking to expand internationally. Demonstrating our commitment to SDG 17, we work closely with our counterparts at LBF Myanmar, to facilitate cross border trade and also support local organizations seeking venture into new markets to set up operations in Myanmar.
WOMEN EMPOWERMENT We are committed to transform as an economic imperative not only essential to the growth of the Company, but also to the Sri Lankan economy. We are determined to contribute towards the transformation of the economy by proactively enabling the meaningful participation of women in the mainstream economy. We do this in a way that has a valuable impact on employment, income redistribution, structural readjustment and economic growth.
05
06
07
08
Over 60,000LB CIM app downloaded
Over 1 Mn
Over 4,000
transactions generated
merchant acquisition
LB Foreign ExchangeTransactions
0
1,000
2,000
3,000
4,000
5,000
6,000
(No.) (Rs.Mn)
0
50
100
150
200
No. of transactionsValue of transactions (Rs.)
2017
2018
2019
2020
2021
Western UnionTransactions
0
10,000
20,000
30,000
40,000
50,000
60,000
2017
2018
2019
2020
2021
(No.) (Rs.Mn)
0
5,000
1,000
1,500
2,000
2,500
3,000
No. of transactionsValue of transactions (Rs.)
Business operations in Myanmar
2020/21 2019/20 2018/19
Profit After Tax (Rs. Mn) 4.20 23.80 24.71
Lending portfolio (Rs. Mn) 688.39 554.09 378.68
No. of facilities granted 12,633 16,717 14,680

L B Finance PLC | Annual Report 2020/21 27
C H A P T E R
02Leadership
Leading the Way Our spirit of leadership and
dominance over the surrounding environment ensures we remain
far ahead of our peers
Financial highlights 28
Non-financial highlights 30
Chairperson’s statement 33
Managing Director’s review 37
Board of Directors 40
Senior Management 44

L B Finance PLC | Annual Report 2020/2128
FINANCIAL HIGHLIGHTS
Indicator 2020/21 2019/20 Change (%)
Operating results
Income Rs. Million 29,766.12 31,222.86 (4.67)
Interest income Rs. Million 27,457.74 29,160.29 (5.84)
Net interest income Rs. Million 15,934.94 15,544.90 2.51
Profit before taxation (PBT) Rs. Million 9,306.37 7,610.29 22.29
Profit after taxation (PAT) Rs. Million 6,802.60 5,187.05 31.15
Financial position
Total assets Rs. Million 140,576.52 143,963.72 (2.35)
Lending portfolio Rs. Million 114,137.82 118,865.92 (3.98)
Deposits Rs. Million 85,860.07 89,256.43 (3.81)
Borrowings Rs. Million 19,581.09 25,882.27 (24.35)
Shareholders’ funds Rs. Million 28,189.29 22,999.55 22.56
Share information
Market price per share** Rs. 47.40 120.50 (60.66)
Market capitalisation Rs. Million 26,262.31 16,690.97 57.34
Net asset value per share* Rs. 50.88 41.51 22.56
Earnings per share (EPS)* Rs. 12.28 9.36 31.15
Price earning ratio (PE) Times 3.86 3.22 19.98
Dividend per share (DPS) Rs. 7.00 - 100.00
Dividend yield % 23.24 - 100.00
Dividend payout ratio % 57.01 - 100.00
Statutory ratios
Core capital to risk weighted assets ratio (Tier I) (Minimum 7%) % 23.87 19.04 25.38
Total risk weighted capital ratio (Tier I & II) (Minimum 11%) % 25.32 20.75 22.00
Equity to deposits (Minimum 10%) % 32.83 25.77 27.41
Liquidity ratio % 17.89 15.65 14.31
Other ratios
Return on assets (ROA) % 4.78 3.70 29.22
Return on equity (ROE) % 26.58 25.04 6.14
Net interest margin (NIM) % 12.15 11.96 1.65
Cost to income % 30.56 33.44 (8.59)
Loan to deposits Times 1.33 1.33 (0.18)
Gross non-performing loans ratio (Gross NPL) % 5.36 3.93 (36.51)
Net non-performing loans ratio (Net NPL) % 0.10 (0.12) >(100.00)
*2019/20 Ratios have been restated based on the post sub-division of shares.
**Market price per share of 2019/20 represents the share price before the sub-division.

L B Finance PLC | Annual Report 2020/21 29
Earnings per Share
0
3
6
9
12
15
(Rs.) 31%
2021Rs. 12.28
2020Rs. 9.36
20165 years agoRs. 6.71
5 ye
ars
ago
2020
2021
Due to Depositors
0
20,000
40,000
60,000
80,000
100,000
(Rs. Mn) -4%
2021Rs. 85,860 Mn
2020Rs. 89,256 Mn
20165 years agoRs. 53,380 Mn
5 ye
ars
ago
2020
2021
Equity
0
5,000
10,000
15,000
20,000
25,000
30,000
(Rs. Mn) 23%
2021Rs.28,189 Mn
2020Rs.23,000 Mn
20165 years agoRs.10,479 Mn
5 ye
ars
ago
2020
2021
Income
0
5,000
10,000
15,000
20,000
25,000
30,000
35,000
(Rs. Mn) -5%
2021Rs. 29,766 Mn
2020Rs. 31,223 Mn
20165 years agoRs. 15,646 Mn
5 ye
ars
ago
2020
2021
Lending Portfolio
0
20,000
40,000
60,000
80,000
100,000
120,000
(Rs. Mn) -4%
2021Rs. 114,138 Mn
2020Rs. 118,866 Mn
20165 years agoRs. 71,554 Mn
5 ye
ars
ago
2020
2021
Market Capitalisation
0
5,000
10,000
15,000
20,000
25,000
30,000
(Rs. Mn) 57%
2021Rs. 26,262 Mn
2020Rs. 16,691 Mn
20165 years agoRs. 14,696 Mn
5 ye
ars
ago
2020
2021
Net Interest Income
0
5,000
10,000
15,000
20,000
(Rs. Mn) 3%
2021Rs. 15,935 Mn
2020Rs. 15,545 Mn
20165 years agoRs. 8,655 Mn
5 ye
ars
ago
2020
2021
Non-Performing Loans Ratio (NPL)
0
1
2
3
4
5
6
(%) 37%
20215.36%
20203.93%
20165 years ago3.28%
5 ye
ars
ago
2020
2021
Profit before Tax
0
2,000
4,000
6,000
8,000
10,000
(Rs. Mn) 22%
2021Rs. 9,306 Mn
2020Rs. 7,610 Mn
20165 years agoRs. 5,325 Mn
5 ye
ars
ago
2020
2021
Profit after Tax
0
2,000
4,000
6,000
8,000
5 ye
ars
ago
2020
2021
(Rs. Mn) 31%
2021Rs. 6,803 Mn
2020Rs. 5,187 Mn
20165 years agoRs. 3,718 Mn
Return on Assets (ROA)
0
1
2
3
4
5
29%
20214.78%
20203.70%
20165 years ago4.89%
(%)
5 ye
ars
ago
2020
2021
Total Assets
0
30,000
60,000
90,000
120,000
150,000
(Rs. Mn) -2%
2021Rs. 140,577 Mn
2020Rs. 143,964 Mn
20165 years agoRs. 84,517 Mn
5 ye
ars
ago
2020
2021
Stability Leadership Strength Agility Responsibility Sustainability Success Supplementary Information

L B Finance PLC | Annual Report 2020/2130
Macro dimension Indicator Measurement 2016/17 2017/18 2018/19 2019/20 2020/21 Our priority Capital GRI
Economic wellbeing
Economic value created Rs. Million 2,341.15 3,090.42 3,716.34 4,330.14 6,148.39 SC 201-1Economic value distributed to: SC 201-1 Depositors and Lenders Rs. Million 7,766.75 11,077.1 12,361.66 13,218.85 11,125.01 SC Employees Rs. Million 2,324.85 2,389.35 2,682.61 2,986.63 2,955.81 SC Government Rs. Million 2,660.77 3,038.17 4,508.35 5,014.32 4,651.00 SC Shareholders Rs. Million 1,246.63 1,523.66 1,662.17 0 1,662.17 SC
Social wellbeingCommunity development programmes Number 17 26 28 12 22 SCStaff volunteered hours Hours 2,302 9,079 14,195 20,131 5,764 SC
Environment and landscape
Environment related projects Number 9 6 6 5 15 HCWater consumption m3 30,388.00 29,891.91 43,007.00 39,793.00 31,013.00 HC 303-1Water consumption per Rs. million of profit m3 7.76 7.03 8.51 7.67 4.56 HCTrees planted/distributed Number 400 612 20,194 34,853 6,180 HCTrees saved from recycling Number 122 68 92 94 68 HCInvestment on green initiatives Rs. Million 3.29 3.51 16.49 9.54 1.01 HCPaper recycled Kg 7,938 2,943 5,432 5,501 3,986 HCEnergy consumption GJ 23,720.00 18,231.87 20,020.70 20,538.00 15,418.08 HC 302-1Energy per Rs. million of profit GJ 6.05 4.29 3.96 3.96 2.27 HCTotal carbon footprint tCO2e 4,361 3,223 3,997 4,484 3,110 HC 305Total carbon footprint per Rs. million of profit tCO2e 0.14 0.11 0.09 0.11 0.10 HC 305
Business sophistication
Total outlets Number 154 159 163 165 169 MC 102-4Total branches Number 118 123 127 129 152 MCCDM machines Number 0 3 23 23 24 MCBranches outside western province Number 80 82 83 84 88 MCGold loan centres Number 36 36 36 36 17 MCNew outlets opened Number 8 5 4 2 4 MC
Infrastructure and quality of services
Investment on ICT Rs. Million 79.25 197.2 150.52 115.65 46.40 MC 203-1Online transactions Number 44 1,738 7,274 Over 400,000 Over 1,000,000 ICInvestment on freehold land and building Rs. Million 1,385.97 1,002.96 1,894.80 230.13 481.96 MC
Employee wellbeing
Total workforce Number 3,221 3,441 3,618 3,606 3,536 MC 102-7Employees hired Number 1,096 1,313 1,407 1,291 999 MC 401-1Employment opportunities created Number 477 220 177 - - MCTraining programs carried out Number 88 113 195 137 19 MC 404-2Investment on training and development Rs. Million 8.04 8.56 10.95 18.56 4.01 MC Total training hours Hours 20,672 25,846 38,832 52,788 7,737 MC 404-1Average hours of training per employee Hours 6.42 7.52 10.73 14.73 2.17 MC 404-1Staff remuneration and benefits Rs. Million 2,254.00 2,305.87 2,693.56 3,005.18 2,959.82 MC
ReputationBrand value (Brand Finance) Rs. Million 3,853 4,236 5,021 5,133 6,237 IC 102-16Brand ranking (Brand Finance) Number 80 28 30 29 25 ICCredit rating (fitch rating) Rating A- (lka) A- (lka) A- (lka) A- (lka) A- (lka) IC
CustomersTotal customer base Number Over 500,000 Over 500,000 Over 600,000 Over 600,000 Over 600,000 SCCustomer financial solutions Number 27 28 29 30 31 SC
NON FINANCIAL HIGHLIGHTS
High Medium LowH M L FC - Financial Capital | MC - Manufactured Capital | HC - Human Capital | IC - Intellectual Capital SC - Social and Relationship Capital | NC - Natural Capital

L B Finance PLC | Annual Report 2020/21 31
Carbon Neutral Company for 6th consecutive year
A- (lka) Fitch ratings reaffirmed
New branches
Branches relocated
+60,000 CIM wallet downloaded
+41,000 Trees planted under 50 to 50,000 tree planting programme
04
04
CIM wallet transactions grew by
253.78%
Saved 68fully grown trees
ChatbotIntroduce for social media and corporate website
Automated credit verification system
Rs. 37.29 MnInvested in CSR
DedicatedTechnology and innovation Centre
Macro dimension Indicator Measurement 2016/17 2017/18 2018/19 2019/20 2020/21 Our priority Capital GRI
Economic wellbeing
Economic value created Rs. Million 2,341.15 3,090.42 3,716.34 4,330.14 6,148.39 SC 201-1Economic value distributed to: SC 201-1 Depositors and Lenders Rs. Million 7,766.75 11,077.1 12,361.66 13,218.85 11,125.01 SC Employees Rs. Million 2,324.85 2,389.35 2,682.61 2,986.63 2,955.81 SC Government Rs. Million 2,660.77 3,038.17 4,508.35 5,014.32 4,651.00 SC Shareholders Rs. Million 1,246.63 1,523.66 1,662.17 0 1,662.17 SC
Social wellbeingCommunity development programmes Number 17 26 28 12 22 SCStaff volunteered hours Hours 2,302 9,079 14,195 20,131 5,764 SC
Environment and landscape
Environment related projects Number 9 6 6 5 15 HCWater consumption m3 30,388.00 29,891.91 43,007.00 39,793.00 31,013.00 HC 303-1Water consumption per Rs. million of profit m3 7.76 7.03 8.51 7.67 4.56 HCTrees planted/distributed Number 400 612 20,194 34,853 6,180 HCTrees saved from recycling Number 122 68 92 94 68 HCInvestment on green initiatives Rs. Million 3.29 3.51 16.49 9.54 1.01 HCPaper recycled Kg 7,938 2,943 5,432 5,501 3,986 HCEnergy consumption GJ 23,720.00 18,231.87 20,020.70 20,538.00 15,418.08 HC 302-1Energy per Rs. million of profit GJ 6.05 4.29 3.96 3.96 2.27 HCTotal carbon footprint tCO2e 4,361 3,223 3,997 4,484 3,110 HC 305Total carbon footprint per Rs. million of profit tCO2e 0.14 0.11 0.09 0.11 0.10 HC 305
Business sophistication
Total outlets Number 154 159 163 165 169 MC 102-4Total branches Number 118 123 127 129 152 MCCDM machines Number 0 3 23 23 24 MCBranches outside western province Number 80 82 83 84 88 MCGold loan centres Number 36 36 36 36 17 MCNew outlets opened Number 8 5 4 2 4 MC
Infrastructure and quality of services
Investment on ICT Rs. Million 79.25 197.2 150.52 115.65 46.40 MC 203-1Online transactions Number 44 1,738 7,274 Over 400,000 Over 1,000,000 ICInvestment on freehold land and building Rs. Million 1,385.97 1,002.96 1,894.80 230.13 481.96 MC
Employee wellbeing
Total workforce Number 3,221 3,441 3,618 3,606 3,536 MC 102-7Employees hired Number 1,096 1,313 1,407 1,291 999 MC 401-1Employment opportunities created Number 477 220 177 - - MCTraining programs carried out Number 88 113 195 137 19 MC 404-2Investment on training and development Rs. Million 8.04 8.56 10.95 18.56 4.01 MC Total training hours Hours 20,672 25,846 38,832 52,788 7,737 MC 404-1Average hours of training per employee Hours 6.42 7.52 10.73 14.73 2.17 MC 404-1Staff remuneration and benefits Rs. Million 2,254.00 2,305.87 2,693.56 3,005.18 2,959.82 MC
ReputationBrand value (Brand Finance) Rs. Million 3,853 4,236 5,021 5,133 6,237 IC 102-16Brand ranking (Brand Finance) Number 80 28 30 29 25 ICCredit rating (fitch rating) Rating A- (lka) A- (lka) A- (lka) A- (lka) A- (lka) IC
CustomersTotal customer base Number Over 500,000 Over 500,000 Over 600,000 Over 600,000 Over 600,000 SCCustomer financial solutions Number 27 28 29 30 31 SC
FC - Financial Capital | MC - Manufactured Capital | HC - Human Capital | IC - Intellectual Capital SC - Social and Relationship Capital | NC - Natural Capital
Stability Leadership Strength Agility Responsibility Sustainability Success Supplementary Information

CHAIRPERSON’S STATEMENT
L B Finance PLC | Annual Report 2020/2132
L B Finance PLC | Annual Report 2020/21 33
The year under review was unique. Consequent to the detection of the first COVID-19 case in Sri Lanka, the pandemic has had a widespread deleterious effect on persons, families and communities - impacting key sectors of the economy and culminating 3.6% contraction in the country’s GDP in 2020.
Anandhiy GunawardhanaChairperson
DIGITAL VERSION
English
AUDIO VERSIONSCAN AND LISTEN
Sinhala Tamil
MEASURING SUCCESS
Sustained dialogues
LBF aims to create value for everyone we serve, balanced across the short, medium and the long term
Female representation at the Board level 30%
Leveraging digital capabilities
We are strengthening our digital capabilities and integrating our business to transform customer experiences and to drive operational efficiency
Investment on IT infrastructure Rs. 46.40 Mn
Market capitalization Rs. 26.26 Bn
Certified as carbon neutral company for 6th consecutive year
CIM wallet transaction volume growth 337.78%
A- (lka) Fitch rating reaffirmed
Brand value Rs. 6,327 Mn by Brand Finance 2020
Strong growth prospects
Our prospects for future growth are driven by regional economic fundamentals and increasing financial inclusion, penetration providing opportunities to increase our market share
Employing our strengths
Delivering long term value depends on deep and thoughtful engagement with the numerous stakeholders who represent wider society
Economic valuedistributed
0
10,000
20,000
30,000
40,000
(Rs.Mn)
2017 2018 2019 2020 2021
Invested in communitydevelopment projects
0
10
20
30
40
(Rs.Mn)
2017 2018 2019 2020 2021
CIM wallet user base
0
1,000
2,000
3,000
4,000
Apr 2
0M
ay 2
0Ju
n 20
Jul 2
0Au
g 20
Sep
20O
ct 2
0N
ov 2
0D
ec 2
0Ja
n 21
Feb
21M
ar 2
1
(No.)
Dividend per share Rs. 7/-
Assets base
0306090
120150
(Rs.Bn)
2017 2018 2019 2020 2021
Stability Leadership Strength Agility Responsibility Sustainability Success Supplementary Information
L B Finance PLC | Annual Report 2020/2134
CHAIRPERSON’S STATEMENT
The year under review was unique. Consequent to the detection of the first COVID-19 case in Sri Lanka, the pandemic has had a widespread deleterious effect on persons, families and communities - impacting key sectors of the economy and culminating in a 3.6% contraction in the country’s GDP in 2020. This is not a situation that any one of us could have envisioned at the end of the previous financial year. I am, therefore, especially pleased to report that L B Finance PLC stayed on course to deliver a PAT of Rs. 6.80 billion for FY 2020/21. We are proof that a resilient and well-managed organisation can succeed even in the most trying of circumstances. LBF’s credit rating too was reaffirmed at A-(lka), by Fitch ratings, which I feel points to the stability of our Company.
It is against this backdrop that I present to you the Annual Report and financial statements of L B Finance PLC for the year ending 31st March 2021.
NAVIGATING THROUGH WHAT HAS BEEN AN UNPRECEDENTED YEAR
The COVID-19 pandemic posed significant unforeseen challenges for all businesses, including L B Finance PLC. Nevertheless, I am glad to say that the transformative organisational changes we have been implementing consistently over past few years, in particular, the increased adoption of digital technology, provided a sound foundation enabling us to face and overcome these challenges with confidence.
Beginning the year under lockdown, we found ourselves in a situation that we had not encountered in our 50-year history. Our first priority was to ensure we could continue to service our customers, which led to the immediate activation of our BCP framework. Virtually overnight, we empowered our entire workforce of 3,536 employees to work remotely. Concurrently, the Board continued to work closely with corporate management to define and implement measures to safeguard the business and strengthen the Company’s resilience.
Having recognised that technology can play a vital role in contingency planning and business continuity, as part of our overall resilience building programme, we prioritized and expedited key facets of our digital transformation strategy. It was a busy year for our IT teams who were tasked with simplifying our internal process architecture. This enabled LBF to maintain its service delivery timelines notwithstanding pandemic related challenges. We leveraged technology to further broaden our risk outlook and to keep LBF’s risk profile under constant review vis-a-vis the evolving external scenario.
As a precaution against the risk of an extended lockdown, we acted decisively to put in place measures to protect the Company’s cash flows, while simultaneously clamping down on costs at all levels of
operations. It must be noted that our decision regarding cost control did not affect employee remuneration. In fact, very early on in our cost containment discussions, it was resolved that no salary cuts will be made. Moreover, being fully appreciative of the disquiet our employees were likely feeling due to the pandemic, bonus entitlements under the 2019/20 performance cycle were also paid in full in April 2020.
Shareholder interest was another focal point during our Board deliberations. It was decided to pay an interim dividend of Rs. 12/- per share, which was paid in full immediately after the government-imposed restriction on cash dividends was removed in 2021.
I am pleased to report that our share split too achieved its desired objectives both for the Company and its shareholders. The 1 into 4 share split declared in January 2021, increased LBF’s market capitalisation and also saw our share price soaring to a record high.
COMMITMENT TO ACTING RESPONSIBLY
At LBF we pride ourselves on our determination to act fairly and ethically. Over the past 50 years, we have remained true to our values and have succeeded in building a reputation based on our collective commitment to act with integrity at all times. Going forward, we reaffirm our commitment to the highest standards of behaviour based on industry practice, laws and regulations as well as good corporate citizenship.
I am pleased to report that our share split too achieved its desired objectives both for the Company and its shareholders. The 1 into 4 share split declared in January 2021, increased LBF’s market capitalisation and also saw our share price soaring to a record high.

L B Finance PLC | Annual Report 2020/21 35
Our pledge to uphold these principles were reinforced during the pandemic, with the Board playing an active role in promoting the values embedded in LBF’s mission. As many of our employees were working remotely for a good part of the year, we focused on tightening due diligence controls and oversight procedures at all levels of the business.
LOOKING AHEAD
While our journey this past year has been challenging, there are many positives that give me reason to believe that LBF is well situated to tackle the road ahead.
The success we achieved this past year together with our 50-year track record of excellence, puts LBF at a considerable advantage to reap the benefits of the post-pandemic recovery as it materializes.
In the meantime, I want to reassure all our stakeholders that LBF will continue to approach every challenge that comes its way with the same dynamism and energy as in the past twelve months. This is by staying true to our long term vision - “to contribute to the quality of life of customers, employees and the general public through partnerships that fuel the growth of our Company and to create shareholder value both in the short-term and long-term”.
APPRECIATIONS
First and foremost, I would like to thank all employees of LB Finance PLC for their dedication and support. I greatly admire the tenacity with which you responded to the crisis and continued to work tirelessly despite some major disruptions to your customary work practices.
I would also like to express my appreciation to my fellow Board members for their unwavering commitment and untiring efforts.
Finally, on behalf of all at LBF, I want to express our deep appreciation of the work being done throughout the country by healthcare workers, the emergency services, community groups, volunteers and all others on the frontline of efforts to combat the pandemic. Thank you and stay safe.
Anandhiy GunawardhanaChairperson
19 May 2021
Stability Leadership Strength Agility Responsibility Sustainability Success Supplementary Information

MANAGING DIRECTOR’S REVIEW
L B Finance PLC | Annual Report 2020/2136

L B Finance PLC | Annual Report 2020/21 3737
I am sure we can all agree that this past year has been uniquely challenging for everyone - countries, business, people and communities. It was no different for LB Finance PLC. We too, like most businesses around the world, found ourselves dealing with disruptions on a level never seen before in most of our lifetimes.
Sumith AdhihettyManaging Director
DIGITAL VERSION
English
AUDIO VERSIONSCAN AND LISTEN
Sinhala Tamil
MEASURING SUCCESS
Focus on customers center of the business
Putting them at the heart of the decisions we make about running our business and shaping it for the future
Digital market place
Enable our customers to interact as they want and improve the efficiency through the digital platforms
Strengthen our footprint
Diversify our Company by business, geography and income type to be more resilient to economic headwinds and future trends
Our unique culture
Draw on our purpose and values to guide our choices as employees and as the Company
Surpassed profit after tax of Rs. 6 Bn
Over 60,000 LB CIM app downloaded
Established 4 new branches in Myanmar
Investment on CSR Rs. 37.29 Mn
Profit before tax
02468
10(Rs.Bn)
2017 2018 2019 2020 2021
No. of CIM wallet transactions
0300600900
1,2001,500(No.)
2017 2018 2019 2020 2021
Total outlets
0
50
100
150
200(No.)
2017 2018 2019 2020 2021
New employment opportunities
0300600900
1,2001,500(No.)
2017 2018 2019 2020 2021
Assets base
0306090
120150
(Rs.Bn)
2017 2018 2019 2020 2021
CIM wallettransactions
0
2,000
4,000
6,000
8,000(Rs.Mn)
2017 2018 2019 2020 2021
Branchrelocations
0369
1215
(No.)
2017 2018 2019 2020 2021
Carbonfootprint
01,0002,0003,0004,0005,000
2017 2018 2019 2020 2021
tCO2e
NPL ratio 5.36%(Industry NPL 13.9%)As at 31st December 2020
Over 4,000 merchants registered for CIM wallet
Profit per outlet Rs. 40.25 Mn(2019/20 Rs. 31.44 Mn)
Total employees 3,536(2019/20 3,606)
Stability Leadership Strength Agility Responsibility Sustainability Success Supplementary Information

L B Finance PLC | Annual Report 2020/2138
MANAGING DIRECTOR’S REVIEW
OPERATING CONTEXT
It is perhaps the first time since world war II that the entire world was thrown into chaos as no country was spared by the rapid surge of the COVID-19 virus throughout 2020 and over into 2021. With nations around the world focused on controlling the spread of the virus, global trade and economic activity took a back seat, even coming to a virtual standstill in many parts of the world. In Sri Lanka, the first signs of COVID-19 emerged just after the local economy was regaining its balance after the Easter Sunday attacks had shaken the country to its core. Government efforts to lockdown the country in a bid to curb the spread of the first wave of age virus, while commendable, had far reaching consequences which saw Sri Lanka’s economy contracting by 3.6% in 2020.
The SME sector, despite recording good growth in recent years, continues to remain highly vulnerable to economic shocks and as such was among the worst affected by the pandemic induced economic downturn. The impact on the SME had a cascading effect on the NBFI’s, which have long been the key enablers of the SME sector growth. Seeing as SMEs were unable to service their debt commitments, NBFIs were confronted with the prospect of higher non-performing loans.
To add to this the NBFI sector’s core leasing model also came under pressure owing to the vehicle import ban introduced by the government as part of its fiscal control measures aimed at softening the impact of the economic downturn. Burdened by higher NPL’s on one hand and limited opportunities for credit expansion on the other, the NBFI sector recorded a highly diluted performance in 2020.
TAKING DECISIVE ACTION
Although we entered the current financial year in lockdown, I am pleased to say that thanks to swift action taken at the onset of the shutdown in mid-March 2020, our people including our call centre teams were geared to work remotely and continued with business as usual.
Meanwhile seeing our lending activities hampered during the lockdown months, we quickly shifted gears to focus on recoveries. Recovery efforts began in earnest at the start of the lockdown with all frontline teams being called in to drive the effort. The momentum was maintained throughout the year with the support of the recoveries unit and the call centre teams. These collective efforts helped to stabilise NPLs to a great extent and it is indeed very encouraging to note that at 5.36%, LBF’s NPL ratio was well below the sector average as at 31st March 2021 and also among the lowest recorded in the NBFI sector as of the same date.
Noting a gradual revival in economic activity during post-lockdown, we resumed many of our lending activities. In our core auto finance business, we redirected our attention to capitalise on the strong demand for registered vehicles, which had ballooned overnight following the complete ban on unregistered vehicle imports. I must admit that while the consistently low interest rate would have been an excellent opportunity for LBF to grow its loan book, we nonetheless decided to maintain a prudent lending strategy in light of the underlying market weakness. The ongoing repossession ban was another key factor that influenced our decision to be ultra cautious in our lending this year.
As a dynamic organisation, we continued exploring potential opportunities. Observing a robust demand for gold loans on the back of higher world gold prices, we moved quickly to expand our bandwidth in this space. As part of this overall effort, we invested in strengthening LBF’s island-wide gold loan footprint.
As always we remained firm that deposit mobilization activities should reflect the Company’s liquidity requirements. With
the Company’s liquidity at healthy levels throughout the current financial year, we did not pursue aggressive deposit mobilisation activities and instead looked to consolidate our deposit base. We are however quite proactive in our efforts to leverage on the low interest rate to streamline our deposit mix, and benefit from lower funding costs.
It is very pleasing to see our overseas operation - L B Microfinance Myanmar Company (LBMF), making excellent progress in the year under review, notwithstanding pandemic related challenges. Having first started up in the small town of Pyay in the Bago region, LBFM has since been deepening its penetration into the Magway region. In the year under review, LBFM further cemented its presence in the region with 4 new branches being added to the network, bringing the total branch count to 12 as at 31st March 2021.
KEY FINANCIAL HIGHLIGHTS
Supporting stakeholders to navigate the pandemic
Having entered the current financial year in the midst of the nation-wide lockdown, our priority was to ensure our customers would be supported during these critical times. We began by assisting eligible customers to benefit from the debt moratorium scheme announced by the government to bring relief to COVID-19 affected individuals and businesses. Beyond this we also accommodated customer requests for reschedulements, fee waivers and grace periods on a case by case basis.
Moreover determined to ensure our customers stay at home and stay safe, we rolled out a series of upgrades to the LB CIM mobile wallet. Some of the new features include: the mobile reload option
As a dynamic organisation, we continued exploring potential opportunities. Observing a robust demand for gold loans on the back of higher world gold prices, we moved quickly to expand our bandwidth in this space.
L B Finance PLC | Annual Report 2020/21 39
and the settlement facility both for retail customers and the direct debit faculty for business users.
The safety and welfare of our valued employees took on a whole new meaning during the pandemic. As you know we issued strict instructions that all employees should work from home during the lockdown. To help our employees adjust to this new normal, we launched “SMILE”, a 24/7 counselling hotline for employees to reach out in confidence, should the need arise. Meanwhile all recommended health guidelines were implemented to enable employees safely return to work in batches from June 2020 onwards, while a health declaration form was introduced and all employees asked to update their safety status on a daily basis. I am also very pleased to announce that no COVID related retrenchments or pay cuts were declared at any point during the year and all LBF employees were paid their full salary entitlement throughout the financial year. Despite strict cost containment measures deployed across the business, employees’ bonus entitlements for the previous year were paid in full while medical expenses were also fully reimbursed.
Building resilience for the future
With many things around us changing, we looked inward to strengthen our systems and processes which helps to face the future with confidence. Despite the constraints imposed by the pandemic, I am happy to report we made progress on many fronts. A new Credit Policy Framework was developed and rolled out to create a foundation to promote more high quality lending. We were able to complete our data warehousing project and increase the degree of automation across the business in order to promote greater cost discipline at a business unit level.
We also began working on a new Data Protection procedure in readiness to comply with the CBSL’s proposed new Data Protection Act due to be gazetted in 2021 and went ahead with new protocols
to strengthen our information security architecture aimed at building our defences against cyber attacks. In parallel, our primary data center was shifted to the Sri Lanka Telecom tier III data center located at Pitipana, while a secondary backup data center was created at the Dialog facility in Pothuarawa.
Commissioning of the LB Center for Technology and Innovation (CTI) was another huge milestone for the current financial year. The CTI is resourced with a team of specialist data scientists focusing on developing customised solutions to boost our operational capability and network capacity, which I believe will play a vital role in strengthening LBF’s resilience in the years to come.
GOING FORWARD
With Sri Lanka now in the throes of a fully blown third wave of COVID-19 infections, it seems obvious that the pandemic is something we will have to live with for some time. On this basis it can be assumed that more challenges are likely to materialise in the coming months. Nonetheless, having emerged relatively unscathed from the pandemic impact thus far, definitely puts LBF on a firmer footing to tackle what lies ahead.
One thing I can already foresee is the fierce competition LBF will probably face in the medium term as NBFI’s rush to take advantage of the record low interest rates to capture a larger share of the SME market. This is where I believe LBF’s solid credentials and track record 50 years will prove to be a distinct advantage.
Going forward, we expect to remain fully focused on supporting SME sector growth. We have set out ambitious plans in this regard and have even commenced talks to secure a special USD credit line to empower the SME sector to reach its true potential and position itself as the backbone of the Sri Lankan economy in the years ahead.
APPRECIATIONS
While readily admitting that the strategic choices made last year have underpinned LBF’s progress, the ability of our people to adapt toinnovations. I believe, it has made all the difference in our helping the Company to ride out the difficult times. On this note, I wish to extend my deep appreciation of all LBF employees for the unity and strength shown during these unprecedented times.
My sincere thanks also go to the Chairman and Board of Directors as well as the Board and committees whose decisiveness and vision have contributed to the resilient organisation we are today.
I am deeply grateful to LBF’s loyal customers who have been a pillar of strength not only in this past year but over the past 50 years. On behalf of everyone at LBF, let me say that we consider it an absolute privilege to serve you.
I wish to take this opportunity to thank the Governor of the Central Bank of Sri Lanka and the officials at the department of Supervision of Non-Bank Financial Institutions, for their support extended during the course of this year as well as in the past.
Finally, I would like to express my appreciation to our shareholders, bankers and other stakeholders for their unwavering support. I look forward to your patronage in the years ahead as well.
Sumith AdhihettyManaging Director
19 May 2021
Stability Leadership Strength Agility Responsibility Sustainability Success Supplementary Information
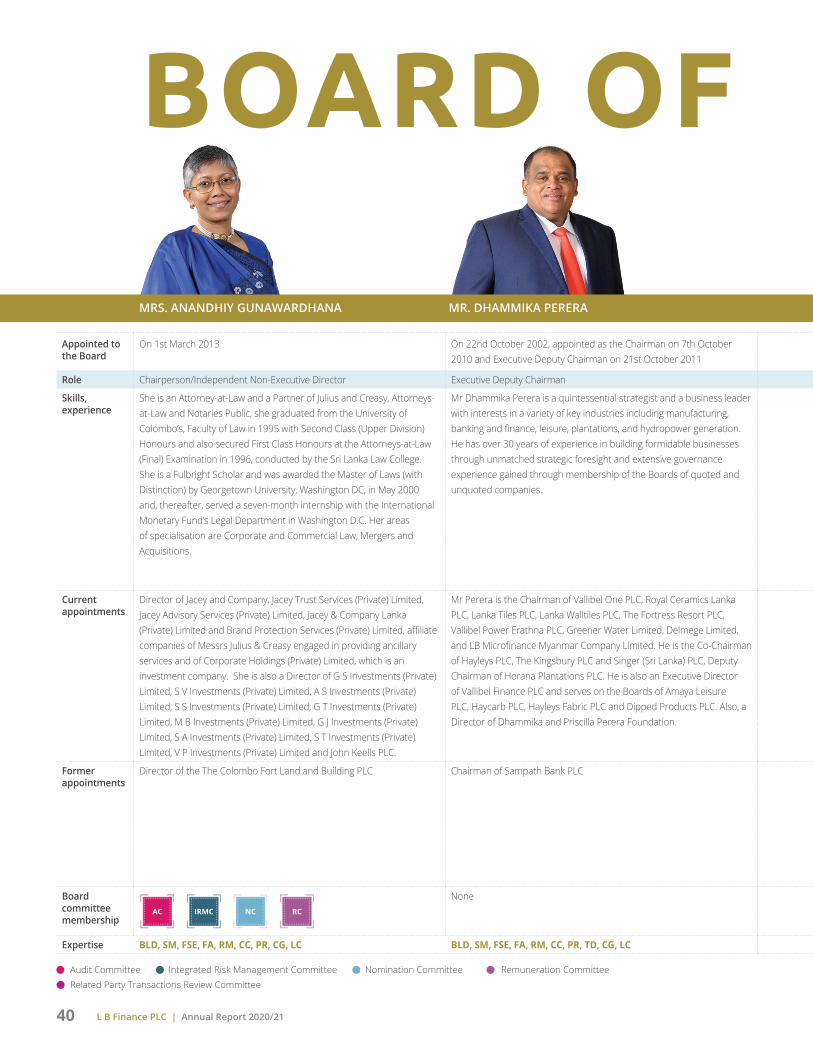
L B Finance PLC | Annual Report 2020/2140
Appointed to the Board
On 1st March 2013 On 22nd October 2002, appointed as the Chairman on 7th October 2010 and Executive Deputy Chairman on 21st October 2011
On 10th December 2003 On 1st January 2007 On 1st January 2007
Role Chairperson/Independent Non-Executive Director Executive Deputy Chairman Managing Director Deputy Managing Director Executive Director
Skills, experience
She is an Attorney-at-Law and a Partner of Julius and Creasy, Attorneys-at-Law and Notaries Public, she graduated from the University of Colombo’s, Faculty of Law in 1995 with Second Class (Upper Division) Honours and also secured First Class Honours at the Attorneys-at-Law (Final) Examination in 1996, conducted by the Sri Lanka Law College. She is a Fulbright Scholar and was awarded the Master of Laws (with Distinction) by Georgetown University, Washington DC, in May 2000 and, thereafter, served a seven-month internship with the International Monetary Fund’s Legal Department in Washington D.C. Her areas of specialisation are Corporate and Commercial Law, Mergers and Acquisitions.
Mr Dhammika Perera is a quintessential strategist and a business leader with interests in a variety of key industries including manufacturing, banking and finance, leisure, plantations, and hydropower generation. He has over 30 years of experience in building formidable businesses through unmatched strategic foresight and extensive governance experience gained through membership of the Boards of quoted and unquoted companies.
He is a well-known professional in the marketing field, counts over 42 years of experience in the finance sector.
He holds Bachelor’s Degree in Science from the University of Colombo and possesses 30 years of experience in the field of leasing and finance, including 10 years at Lanka Orix Leasing Company PLC and 03 years at Mercantile Investments Limited prior to joining L B Finance PLC in 2004.
He has undergone extensive training in Strategy and Management in Banking conducted by Intentional Development Ireland Ltd in Dublin and London and also successfully completed High Potentials Leadership Program at Harvard Business School in Boston, MA, USA in 2012.
He is an Associate Member of the Chartered Institute of Management Accountants ACMA, CGMA (UK) and holds a BSc (Business Administration) Special Degree from the University of Sri Jayewardenapura, successfully completed High Potentials Leadership Program in 2012 at Harvard Business School in Boston, MA, USA. Counts over 23 years of experience in the leasing industry that includes positions at Commercial Leasing Company Limited, Lanka Orix Leasing Company PLC and a Merchant Bank in Bangladesh.
Current appointments
Director of Jacey and Company, Jacey Trust Services (Private) Limited, Jacey Advisory Services (Private) Limited, Jacey & Company Lanka (Private) Limited and Brand Protection Services (Private) Limited, affiliate companies of Messrs Julius & Creasy engaged in providing ancillary services and of Corporate Holdings (Private) Limited, which is an investment company. She is also a Director of G S Investments (Private) Limited, S V Investments (Private) Limited, A S Investments (Private) Limited, S S Investments (Private) Limited, G T Investments (Private) Limited, M B Investments (Private) Limited, G J Investments (Private) Limited, S A Investments (Private) Limited, S T Investments (Private) Limited, V P Investments (Private) Limited and John Keells PLC.
Mr Perera is the Chairman of Vallibel One PLC, Royal Ceramics Lanka PLC, Lanka Tiles PLC, Lanka Walltiles PLC, The Fortress Resort PLC, Vallibel Power Erathna PLC, Greener Water Limited, Delmege Limited, and LB Microfinance Myanmar Company Limited. He is the Co-Chairman of Hayleys PLC, The Kingsbury PLC and Singer (Sri Lanka) PLC, Deputy Chairman of Horana Plantations PLC. He is also an Executive Director of Vallibel Finance PLC and serves on the Boards of Amaya Leisure PLC, Haycarb PLC, Hayleys Fabric PLC and Dipped Products PLC. Also, a Director of Dhammika and Priscilla Perera Foundation.
Director of Vallibel One PLC, The Fortress Resorts PLC, Greener Water Ltd., Summer Season Ltd., Summer Season Mirissa (Pvt) Ltd., Summer Season Residencies Ltd., La Fortresse (Private) Limited and L B Microfinance Myanmar Company Limited.
Director of L B Microfinance Myanmar Company Limited, Chairman of the Finance Houses Association of Sri Lanka (FHA), Director of Credit Information Bureau of Sri Lanka (CRIB), Member of the Financial System Stability Consultative Committee established by the Central Bank of Sri Lanka.
Director of L B Microfinance Myanmar Company Limited, Director of Pan Asia Banking Corporation PLC
Former appointments
Director of the The Colombo Fort Land and Building PLC Chairman of Sampath Bank PLC Deputy Managing Director of Mercantile Investments Limited and served as a Director of Nuwara Eliya Hotels Company Limited, Grand Hotel (Private) Limited, Royal Palm Beach Hotels Limited, Tangerine Tours Limited, Security Ceylon (Private) Limited, Director of Vallibel Finance PLC and Pan Asia Banking Corporation PLC. Also served as the Managing Director of The Fortress Resorts PLC.
Director of Hayleys Fibre PLC Director of Hayleys Fibre PLC
Board committee membership
None
Expertise BLD, SM, FSE, FA, RM, CC, PR, CG, LC BLD, SM, FSE, FA, RM, CC, PR, TD, CG, LC BLD, SM, FSE, FA, RM, CC, PR, TD, CG, LC BLD, SM, FSE, FA, RM, CC, PR, TD, CG, LC BLD, SM, FSE, FA, RM, CC, PR, TD, CG, LC
BOARD OF DIRECTORS
MRS. ANANDHIY GUNAWARDHANA MR. DHAMMIKA PERERA
AC IRMC NC RC
Audit Committee Integrated Risk Management Committee Nomination Committee Remuneration Committee Related Party Transactions Review Committee
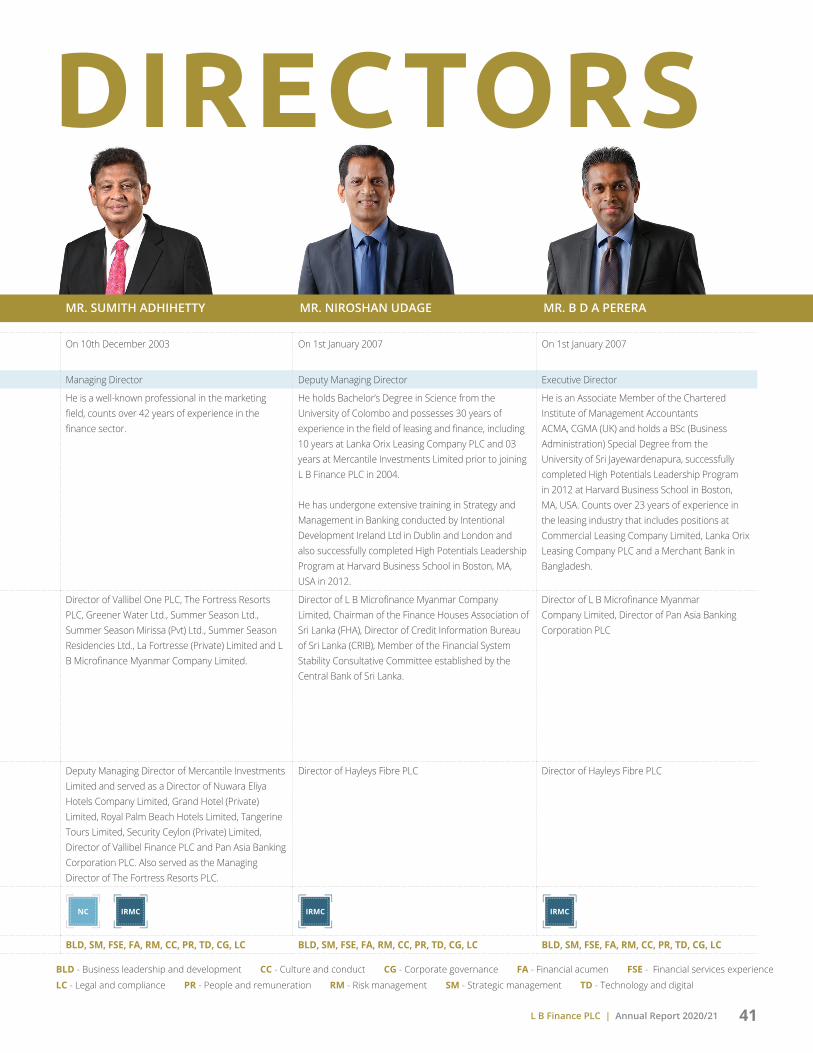
L B Finance PLC | Annual Report 2020/21 41
Appointed to the Board
On 1st March 2013 On 22nd October 2002, appointed as the Chairman on 7th October 2010 and Executive Deputy Chairman on 21st October 2011
On 10th December 2003 On 1st January 2007 On 1st January 2007
Role Chairperson/Independent Non-Executive Director Executive Deputy Chairman Managing Director Deputy Managing Director Executive Director
Skills, experience
She is an Attorney-at-Law and a Partner of Julius and Creasy, Attorneys-at-Law and Notaries Public, she graduated from the University of Colombo’s, Faculty of Law in 1995 with Second Class (Upper Division) Honours and also secured First Class Honours at the Attorneys-at-Law (Final) Examination in 1996, conducted by the Sri Lanka Law College. She is a Fulbright Scholar and was awarded the Master of Laws (with Distinction) by Georgetown University, Washington DC, in May 2000 and, thereafter, served a seven-month internship with the International Monetary Fund’s Legal Department in Washington D.C. Her areas of specialisation are Corporate and Commercial Law, Mergers and Acquisitions.
Mr Dhammika Perera is a quintessential strategist and a business leader with interests in a variety of key industries including manufacturing, banking and finance, leisure, plantations, and hydropower generation. He has over 30 years of experience in building formidable businesses through unmatched strategic foresight and extensive governance experience gained through membership of the Boards of quoted and unquoted companies.
He is a well-known professional in the marketing field, counts over 42 years of experience in the finance sector.
He holds Bachelor’s Degree in Science from the University of Colombo and possesses 30 years of experience in the field of leasing and finance, including 10 years at Lanka Orix Leasing Company PLC and 03 years at Mercantile Investments Limited prior to joining L B Finance PLC in 2004.
He has undergone extensive training in Strategy and Management in Banking conducted by Intentional Development Ireland Ltd in Dublin and London and also successfully completed High Potentials Leadership Program at Harvard Business School in Boston, MA, USA in 2012.
He is an Associate Member of the Chartered Institute of Management Accountants ACMA, CGMA (UK) and holds a BSc (Business Administration) Special Degree from the University of Sri Jayewardenapura, successfully completed High Potentials Leadership Program in 2012 at Harvard Business School in Boston, MA, USA. Counts over 23 years of experience in the leasing industry that includes positions at Commercial Leasing Company Limited, Lanka Orix Leasing Company PLC and a Merchant Bank in Bangladesh.
Current appointments
Director of Jacey and Company, Jacey Trust Services (Private) Limited, Jacey Advisory Services (Private) Limited, Jacey & Company Lanka (Private) Limited and Brand Protection Services (Private) Limited, affiliate companies of Messrs Julius & Creasy engaged in providing ancillary services and of Corporate Holdings (Private) Limited, which is an investment company. She is also a Director of G S Investments (Private) Limited, S V Investments (Private) Limited, A S Investments (Private) Limited, S S Investments (Private) Limited, G T Investments (Private) Limited, M B Investments (Private) Limited, G J Investments (Private) Limited, S A Investments (Private) Limited, S T Investments (Private) Limited, V P Investments (Private) Limited and John Keells PLC.
Mr Perera is the Chairman of Vallibel One PLC, Royal Ceramics Lanka PLC, Lanka Tiles PLC, Lanka Walltiles PLC, The Fortress Resort PLC, Vallibel Power Erathna PLC, Greener Water Limited, Delmege Limited, and LB Microfinance Myanmar Company Limited. He is the Co-Chairman of Hayleys PLC, The Kingsbury PLC and Singer (Sri Lanka) PLC, Deputy Chairman of Horana Plantations PLC. He is also an Executive Director of Vallibel Finance PLC and serves on the Boards of Amaya Leisure PLC, Haycarb PLC, Hayleys Fabric PLC and Dipped Products PLC. Also, a Director of Dhammika and Priscilla Perera Foundation.
Director of Vallibel One PLC, The Fortress Resorts PLC, Greener Water Ltd., Summer Season Ltd., Summer Season Mirissa (Pvt) Ltd., Summer Season Residencies Ltd., La Fortresse (Private) Limited and L B Microfinance Myanmar Company Limited.
Director of L B Microfinance Myanmar Company Limited, Chairman of the Finance Houses Association of Sri Lanka (FHA), Director of Credit Information Bureau of Sri Lanka (CRIB), Member of the Financial System Stability Consultative Committee established by the Central Bank of Sri Lanka.
Director of L B Microfinance Myanmar Company Limited, Director of Pan Asia Banking Corporation PLC
Former appointments
Director of the The Colombo Fort Land and Building PLC Chairman of Sampath Bank PLC Deputy Managing Director of Mercantile Investments Limited and served as a Director of Nuwara Eliya Hotels Company Limited, Grand Hotel (Private) Limited, Royal Palm Beach Hotels Limited, Tangerine Tours Limited, Security Ceylon (Private) Limited, Director of Vallibel Finance PLC and Pan Asia Banking Corporation PLC. Also served as the Managing Director of The Fortress Resorts PLC.
Director of Hayleys Fibre PLC Director of Hayleys Fibre PLC
Board committee membership
None
Expertise BLD, SM, FSE, FA, RM, CC, PR, CG, LC BLD, SM, FSE, FA, RM, CC, PR, TD, CG, LC BLD, SM, FSE, FA, RM, CC, PR, TD, CG, LC BLD, SM, FSE, FA, RM, CC, PR, TD, CG, LC BLD, SM, FSE, FA, RM, CC, PR, TD, CG, LC
BOARD OF DIRECTORS
MR. SUMITH ADHIHETTY MR. NIROSHAN UDAGE MR. B D A PERERA
NC IRMC IRMC IRMC
BLD - Business leadership and development CC - Culture and conduct CG - Corporate governance FA - Financial acumen FSE - Financial services experience
LC - Legal and compliance PR - People and remuneration RM - Risk management SM - Strategic management TD - Technology and digital
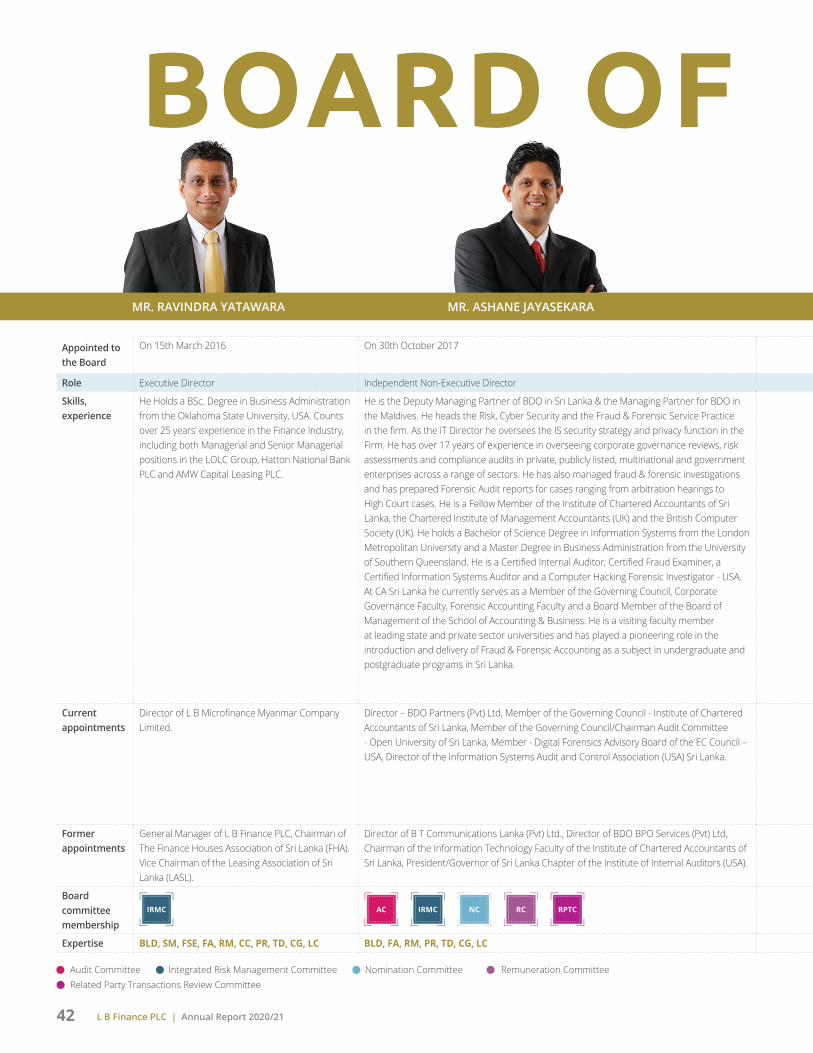
L B Finance PLC | Annual Report 2020/2142
BOARD OF DIRECTORS
MR. ASHANE JAYASEKARAMR. RAVINDRA YATAWARA
Appointed to the Board
On 15th March 2016 On 30th October 2017 On 15th March 2016 On 1st September 2018 On 10th April 2019
Role Executive Director Independent Non-Executive Director Non-Executive Director Independent Non-Executive Director Non-executive Director
Skills, experience
He Holds a BSc. Degree in Business Administration from the Oklahoma State University, USA. Counts over 25 years’ experience in the Finance Industry, including both Managerial and Senior Managerial positions in the LOLC Group, Hatton National Bank PLC and AMW Capital Leasing PLC.
He is the Deputy Managing Partner of BDO in Sri Lanka & the Managing Partner for BDO in the Maldives. He heads the Risk, Cyber Security and the Fraud & Forensic Service Practice in the firm. As the IT Director he oversees the IS security strategy and privacy function in the Firm. He has over 17 years of experience in overseeing corporate governance reviews, risk assessments and compliance audits in private, publicly listed, multinational and government enterprises across a range of sectors. He has also managed fraud & forensic investigations and has prepared Forensic Audit reports for cases ranging from arbitration hearings to High Court cases. He is a Fellow Member of the Institute of Chartered Accountants of Sri Lanka, the Chartered Institute of Management Accountants (UK) and the British Computer Society (UK). He holds a Bachelor of Science Degree in Information Systems from the London Metropolitan University and a Master Degree in Business Administration from the University of Southern Queensland. He is a Certified Internal Auditor, Certified Fraud Examiner, a Certified Information Systems Auditor and a Computer Hacking Forensic Investigator - USA. At CA Sri Lanka he currently serves as a Member of the Governing Council, Corporate Governance Faculty, Forensic Accounting Faculty and a Board Member of the Board of Management of the School of Accounting & Business. He is a visiting faculty member at leading state and private sector universities and has played a pioneering role in the introduction and delivery of Fraud & Forensic Accounting as a subject in undergraduate and postgraduate programs in Sri Lanka.
She is a Fellow of the Chartered Institute of Management Accountants UK (FCMA), Fellow of CPA Australia (FCPA) and an Associate Member of the Institute of Bankers, Sri Lanka
She is a qualified legal practitioner from India, specialising in Technology, Media and Telecommunications (TMT) Law. She currently lectures at APIIT Law School in Colombo, Sri Lanka while consulting on TMT Law issues including those concerning financial technology (FinTech). She also works on research projects relating to data protection, privacy, right to information, alternative dispute resolution mechanisms, etc.
In India, she has previously worked in litigation and corporate law offices including with Senior Counsel Mr. P. Wilson, former Additional Solicitor General of India and former Additional Advocate General of Tamil Nadu.
She holds an LL.M (Master of Laws) in International Business Law from Faculty of Law, National University of Singapore where she graduated in the top five of her class. She has a Bachelor of Arts and Law (B.A. LL.B (Hons.), Distinction) from the School of Excellence in Law, Tamil Nadu Dr. Ambedkar Law University, Chennai, India. Additionally, she has diplomas in International Business Management (offered by Loyola Institute of Business Administration, India) and Commercial Arbitration (offered by ICLP, Sri Lanka).
He is a retired Senior Commissioner of the Department of Inland Revenue (Special Grade). He has over 34 years of experience in the Government (Public) Sector, including 31 years of experience of Tax Administration as an Assessor, a Deputy Commissioner, a Commissioner, and a Senior Commissioner. He obtained the Master of Commerce (M. Com) Degree from the University of Kelaniya, the Bachelor of Commerce (B. Com) Special Degree-Second Class Upper Division (Honours) from the University of Kelaniya. He has completed all course work relating to the Doctoral Degree Programmer at the Open University of Malaysia. He is also a fellow member of the Sri Lanka Institute of Taxation, Sri Lanka. He was a visiting Lecturer at the University of Kelaniya, Malambe Campus (SLIIT), Business School of Institute of Charted Accountants of Sri Lanka, and the Sri Lanka Institute of Taxation-Sri Lanka.
Current appointments
Director of L B Microfinance Myanmar Company Limited.
Director – BDO Partners (Pvt) Ltd, Member of the Governing Council - Institute of Chartered Accountants of Sri Lanka, Member of the Governing Council/Chairman Audit Committee - Open University of Sri Lanka, Member - Digital Forensics Advisory Board of the EC Council – USA, Director of the Information Systems Audit and Control Association (USA) Sri Lanka.
Chief Executive Officer of Vallibel One PLC. Director of Vallibel Power Erathna PLC and Alternate Director to Mr. Dhammika Perera on the Boards of Dipped Products PLC, Hayleys Fabric PLC and Haycarb PLC. Director of Delmege Limited, Delmege Air Line Services (Private) Limited, Delmege Aero Services (Private) Limited and Country Energy (Private) Limited.
Mr. Rangalle serves as a Non-Executive Director of Fentons Limited, Hayleys Aventura (Pvt.) Ltd., and Hayleys Advantis Limited, which are subsidiaries of Hayleys PLC, and DHS Holdings (Pvt) Ltd, He is also a member of the Executive Council-Sri Lanka Institute of Taxation-Sri Lanka.
Former appointments
General Manager of L B Finance PLC, Chairman of The Finance Houses Association of Sri Lanka (FHA). Vice Chairman of the Leasing Association of Sri Lanka (LASL).
Director of B T Communications Lanka (Pvt) Ltd., Director of BDO BPO Services (Pvt) Ltd, Chairman of the Information Technology Faculty of the Institute of Chartered Accountants of Sri Lanka, President/Governor of Sri Lanka Chapter of the Institute of Internal Auditors (USA).
Assistant General Manager (Finance & Planning) of Pan Asia Banking Corporation PLC, Financial Controller of several Australian companies in Melbourne
Senior Commissioner of the Department of Inland Revenue (Special Grade)
Board committee membership
Expertise BLD, SM, FSE, FA, RM, CC, PR, TD, CG, LC BLD, FA, RM, PR, TD, CG, LC BLD, SM, FSE, FA, RM, CC, PR, CG SM, RM, CC, TD, CG BLD, SM, FSE, FA, RM, CC, PR, CG, LC
RPTCIRMC AC IRMC NC RC
Audit Committee Integrated Risk Management Committee Nomination Committee Remuneration Committee Related Party Transactions Review Committee

L B Finance PLC | Annual Report 2020/21 43
BOARD OF DIRECTORS
MR. DHARMADASA RANGALLEMRS. YOGADINUSHA BHASKARAN MRS. ASHWINI NATESAN
AC RC RPTC IRMC RPTC
Appointed to the Board
On 15th March 2016 On 30th October 2017 On 15th March 2016 On 1st September 2018 On 10th April 2019
Role Executive Director Independent Non-Executive Director Non-Executive Director Independent Non-Executive Director Non-executive Director
Skills, experience
He Holds a BSc. Degree in Business Administration from the Oklahoma State University, USA. Counts over 25 years’ experience in the Finance Industry, including both Managerial and Senior Managerial positions in the LOLC Group, Hatton National Bank PLC and AMW Capital Leasing PLC.
He is the Deputy Managing Partner of BDO in Sri Lanka & the Managing Partner for BDO in the Maldives. He heads the Risk, Cyber Security and the Fraud & Forensic Service Practice in the firm. As the IT Director he oversees the IS security strategy and privacy function in the Firm. He has over 17 years of experience in overseeing corporate governance reviews, risk assessments and compliance audits in private, publicly listed, multinational and government enterprises across a range of sectors. He has also managed fraud & forensic investigations and has prepared Forensic Audit reports for cases ranging from arbitration hearings to High Court cases. He is a Fellow Member of the Institute of Chartered Accountants of Sri Lanka, the Chartered Institute of Management Accountants (UK) and the British Computer Society (UK). He holds a Bachelor of Science Degree in Information Systems from the London Metropolitan University and a Master Degree in Business Administration from the University of Southern Queensland. He is a Certified Internal Auditor, Certified Fraud Examiner, a Certified Information Systems Auditor and a Computer Hacking Forensic Investigator - USA. At CA Sri Lanka he currently serves as a Member of the Governing Council, Corporate Governance Faculty, Forensic Accounting Faculty and a Board Member of the Board of Management of the School of Accounting & Business. He is a visiting faculty member at leading state and private sector universities and has played a pioneering role in the introduction and delivery of Fraud & Forensic Accounting as a subject in undergraduate and postgraduate programs in Sri Lanka.
She is a Fellow of the Chartered Institute of Management Accountants UK (FCMA), Fellow of CPA Australia (FCPA) and an Associate Member of the Institute of Bankers, Sri Lanka
She is a qualified legal practitioner from India, specialising in Technology, Media and Telecommunications (TMT) Law. She currently lectures at APIIT Law School in Colombo, Sri Lanka while consulting on TMT Law issues including those concerning financial technology (FinTech). She also works on research projects relating to data protection, privacy, right to information, alternative dispute resolution mechanisms, etc.
In India, she has previously worked in litigation and corporate law offices including with Senior Counsel Mr. P. Wilson, former Additional Solicitor General of India and former Additional Advocate General of Tamil Nadu.
She holds an LL.M (Master of Laws) in International Business Law from Faculty of Law, National University of Singapore where she graduated in the top five of her class. She has a Bachelor of Arts and Law (B.A. LL.B (Hons.), Distinction) from the School of Excellence in Law, Tamil Nadu Dr. Ambedkar Law University, Chennai, India. Additionally, she has diplomas in International Business Management (offered by Loyola Institute of Business Administration, India) and Commercial Arbitration (offered by ICLP, Sri Lanka).
He is a retired Senior Commissioner of the Department of Inland Revenue (Special Grade). He has over 34 years of experience in the Government (Public) Sector, including 31 years of experience of Tax Administration as an Assessor, a Deputy Commissioner, a Commissioner, and a Senior Commissioner. He obtained the Master of Commerce (M. Com) Degree from the University of Kelaniya, the Bachelor of Commerce (B. Com) Special Degree-Second Class Upper Division (Honours) from the University of Kelaniya. He has completed all course work relating to the Doctoral Degree Programmer at the Open University of Malaysia. He is also a fellow member of the Sri Lanka Institute of Taxation, Sri Lanka. He was a visiting Lecturer at the University of Kelaniya, Malambe Campus (SLIIT), Business School of Institute of Charted Accountants of Sri Lanka, and the Sri Lanka Institute of Taxation-Sri Lanka.
Current appointments
Director of L B Microfinance Myanmar Company Limited.
Director – BDO Partners (Pvt) Ltd, Member of the Governing Council - Institute of Chartered Accountants of Sri Lanka, Member of the Governing Council/Chairman Audit Committee - Open University of Sri Lanka, Member - Digital Forensics Advisory Board of the EC Council – USA, Director of the Information Systems Audit and Control Association (USA) Sri Lanka.
Chief Executive Officer of Vallibel One PLC. Director of Vallibel Power Erathna PLC and Alternate Director to Mr. Dhammika Perera on the Boards of Dipped Products PLC, Hayleys Fabric PLC and Haycarb PLC. Director of Delmege Limited, Delmege Air Line Services (Private) Limited, Delmege Aero Services (Private) Limited and Country Energy (Private) Limited.
Mr. Rangalle serves as a Non-Executive Director of Fentons Limited, Hayleys Aventura (Pvt.) Ltd., and Hayleys Advantis Limited, which are subsidiaries of Hayleys PLC, and DHS Holdings (Pvt) Ltd, He is also a member of the Executive Council-Sri Lanka Institute of Taxation-Sri Lanka.
Former appointments
General Manager of L B Finance PLC, Chairman of The Finance Houses Association of Sri Lanka (FHA). Vice Chairman of the Leasing Association of Sri Lanka (LASL).
Director of B T Communications Lanka (Pvt) Ltd., Director of BDO BPO Services (Pvt) Ltd, Chairman of the Information Technology Faculty of the Institute of Chartered Accountants of Sri Lanka, President/Governor of Sri Lanka Chapter of the Institute of Internal Auditors (USA).
Assistant General Manager (Finance & Planning) of Pan Asia Banking Corporation PLC, Financial Controller of several Australian companies in Melbourne
Senior Commissioner of the Department of Inland Revenue (Special Grade)
Board committee membership
Expertise BLD, SM, FSE, FA, RM, CC, PR, TD, CG, LC BLD, FA, RM, PR, TD, CG, LC BLD, SM, FSE, FA, RM, CC, PR, CG SM, RM, CC, TD, CG BLD, SM, FSE, FA, RM, CC, PR, CG, LC
BLD - Business leadership and development CC - Culture and conduct CG - Corporate governance FA - Financial acumen FSE - Financial services experience
LC - Legal and compliance PR - People and remuneration RM - Risk management SM - Strategic management TD - Technology and digital

L B Finance PLC | Annual Report 2020/2144
SENIOR MANAGEMENT
01
02
03
04
05
06
07 10
08
09
11
12
14
We believe that ethical leadership is the foundation of long term value creation. The commitment, experience, and diversity of our senior management exemplify the caliber of our leadership across our organization.
13

L B Finance PLC | Annual Report 2020/21 45
1 MR. MARLON PERERA
Senior Deputy General Manager – Deposits
Joined LBF in 1986
Over 33 years of experience in the finance industry and has held many managerial positions
2 MR. BIMAL PERERA
Deputy General Manager – Strategy and Digital Finance
Joined LBF in 2013CFA Charter holder, Certified FRM
Over 17 years in the areas of risk management, strategic planning, treasury and fintech solutions in the financial service domain
3 MR. AINSLEY MOTHA
Deputy General Manager – Credit and Branch Operations
Joined LBF in 2013MBA (Aus.), MABE (UK)
Over 30 years of experience in the field of banking, leasing and finance industry
4 MR. CHETHANA KAHANDUGODA
Deputy General Manager – Information Technology
Joined LBF in 2010MSc Information Technology (University of Colombo), MCS(SL), MIEEE.
Over 22 years of experience in the field of information technology, information security, project management, software development, business intelligence, infrastructure and data communications predominantly in finance sector
5 MR. ROSHAN JAYAWARDENA
Senior Assistant General Manager – Microfinance
Joined LBF in 2007DipM, MCIM (UK), MBA (University of Sunderland, UK), FSSM (UK).
Over 31 years of experience in the fields of banking, leasing, finance, marketing and business development
6 MR. PRASANNA KALINGA
Assistant General Manager – Human Resources
Joined LBF in 2016BA (MGM), KDA.IPMA certified professional
Over 21 years of industry experience both locally and overseas
7 MR. WICKRAMA PUNCHIHEWA
Head of Legal (Assistant General Manager)
Joined LBF in 2017LL.B, Attorney-at-Law (Hons), GDIBM (UK), MBA, CIMA Adv Dip MA, PGDBM, CCHRM, CPM, Notary Public
Over 19 years as an Attorney-at-Law and experience in non-banking finance sector and commercial law sector
8 MR. KALPA SANJEEWA
Assistant General Manager – Credit and Branch Operations
Joined LBF in 2005MBA (UK).
Over 20 years of experience in the areas of credit, marketing, recovery and branch operations
9 MR. MALITH HEWAGE
Assistant General Manager – Finance
Joined LBF in 2013BSc Accounting (Sp) (University of Sri Jayewardenepura), ACA (SL), AIB (SL)
More than 11 years of experience in the fields of financial reporting, accounting and auditing
10 MR SUNETH DABARERA
Chief Internal Auditor
Joined LBF in 2019MBA (University of Sri Jayewardenepura), FCA (SL), ACMA (SL), MAAT (SL)
Over 18 years of experience in the fields of auditing and finance in banking and finance sectors
11 MR. KENNETH DANIEL
Senior Chief Manager – Credit and Branch Operations
Joined LBF in 2011Dip. in Bank Management (IBSL), MBA (UK).
Over 26 years of experience in the leasing, finance and banking industry
12 MR. CHINTHAKA CHANDRASENA
Chief Manager – Credit and Branch Operations
Joined LBF in 1996MBA (UK).
Over 25 years of experience in the areas of credit, marketing, recovery and branch operations
13 MR GIHAN DE SILVA
Chief Manager – Recoveries
Joined LBF in 2004AMDP (PIM University of Sri Jayewardenepura)
Over 19 years of experience in the finance industry
14 MR. GAYAN AYUWARDANE
Chief Manager – Central Region
Joined LBF in 2015MBA (UK)
Over 19 years of experience in the leasing, finance and banking industry
Stability Leadership Strength Agility Responsibility Sustainability Success Supplementary Information

L B Finance PLC | Annual Report 2020/2146
SENIOR MANAGEMENT
17
18
19
20
21
22
23
24
25
26
27
28
29
15
16

L B Finance PLC | Annual Report 2020/21 47
15 MR. SURAJ KARUNANAYAKA
Chief Manager – Gold Loan
Joined LBF in 2016BSc. Physical Science (University of Kelaniya)
Over 11 years of experience in the banking and finance industry
16 MS. DESHIKA YATAWARA
Chief Manager – Treasury
Joined LBF in 2008MBA (PIM-USJ), ACMA (UK), CGMA.
Over 12 years of experience in the field of finance
17 MS. NIROSHA AMANULLA
Senior Manager – Kandy Branch
Joined LBF in 1985
Over 35 years of experience in the financial industry and features many managerial positions
18 MR. DINUDAYA ABEYWARDENA
Senior Manager – Corporate Lending
Joined LBF in 2016MBA (PIM-USJ), ACMA(UK), CGMA, AIB(SL)
Over 16 years of experience in the banking and finance industry
19 MR. SHANAKA PERERA
Senior Manager – Administration
Joined LBF in 1998.
Over 23 years of experience in the fields of administration and procurement
20 MR SEBENSTAIN PULLE
Compliance Officer
Joined LBF in 2020ACM (UK),CGMA.
Over 40 years of experience in the fields of finance and auditing in manufacturing and finance sectors
21 MR. DINUSHA MUDUNKOTUWA
Senior Manager – Business Analysis
Joined LBF in 2017BICT (University of Colombo), PMP (PMI USA), ACMA(UK), CGMA
Over 11 years of experience in the fields of information technology, accounting and auditing, specializing in banking and finance sector
22 MR. SUDEEP PERERA
Head of Marketing
Joined LBF in 2017B.Sc. (Colombo), PG.Dip.M, MCIM(UK), MSLIM, MBA Sp. Marketing (Colombo).
Over 17 years of marketing experience in the fields of travel, automobile, consumer trade, banking and finance
23 MR WARUNA PERERA
Country Manager – Myanmar
Joined LBF in 2019Diploma in Microfinance -University of Colombo
Over 17 years of experience in the areas of microfinance and recovery in both locally and overseas
24 MR DAYAN PRASANNA
Senior Manager – Finance
Joined LBF in 2020ACMA, CGMA, MBA (PIM-USJ)
Over 11 years of experience in the fields of finance reporting, accounting and auditing
25 MR SAMEERA WANNINAYAKE
Senior Manager – Business Process Development
Joined LBF in 2008BSc in Physical Science (University of Kelaniya), MSc in Financial Mathematics (University of Moratuwa), Business Continuity Certified Specialist, Business Continuity Certified Planner (BCMI,Singapore)
Over 12 years of experience in business process development and re-engineering, business continuity managements, system process and product development
26 MS WARUNI PERERA
Senior Manager – Risk Management
Joined LBF in 2013ACMA(UK), CGMA, MA in financial economics (University of Colombo), BSc (Hons) in accounting (Sp) (University of Sri Jayawardenepura)
Over 11 years of experience in the fields of risk management, corporate planning and equity research
27 MR MAHESHAN KARUNARATHNA
Senior Manager – Credit & Branch Operations
Joined LBF in 2019 Dip. in Marketing - ACHE
Over 16 years of experience in the areas of leasing, credit, finance and banking industry
28 MR. PRASAD SURENDRA
Senior Manager – Credit & Branch Operations
Joined LBF in 2006MBA – UK BSc, Physical Science (University of Kelaniya) AMDP (PIM University of Sri Jayawardhanapura)
Over 17 years’ experience in finance industry
29 MR CHANAKA ALEXANDER
Senior Manager – Credit & Branch Operations
Joined LBF in 2010ABE (UK)
Over 20 years of experience in the areas of leasing, credit, finance and banking industry
Stability Leadership Strength Agility Responsibility Sustainability Success Supplementary Information

L B Finance PLC | Annual Report 2020/2148
WE ARE CARBON NEUTRAL FOR 6TH CONSECUTIVE YEAR
Transportation of locally purchased items
CARBON NEUTRAL CERTIFICATE
Certificate No : ClimateSI/CNO/012
Date of Certification : 05/ 05/ 2021
Period of Assessment : 01/04/2020 to 31/03/2021
Period of Validity : 01/04/2021 to 31/03/2022
Scope of Certification : Financially controlled business activities belongs to LB Finance PLC
: 144 tonnes of CO equivalent2
Indirect GHG Emissions 2
Total : 3,110 tonnes of CO equivalent 2
Climate Smart Initiatives (Pvt ) Ltd assures that
is a carbon neutral organization having offset organization’s carbon footprint by purchasing United Nations Certified Emission
Reductions (CERs) from the project activity 2936 registered under UN Clean Development Mechanism.
Organization carbon footprint has been measured and reported in accordance with the requirements of
ISO 14064-1: 2018 – Specification with guidance at the organizational level for the quantification and reporting of greenhouse gas emissions and removals.
Climate Smart Initiatives (Pvt) Ltd
2
Direct : Onsite diesel generators, Fire extinguishers, Company owned vehicles, Employee transport paid by the company
Indirect : Imported energy (Grid electricity), Transmission & distribution loss, Municipal water, Paper waste, Employee commuting
Exclusions : Refrigerant leakage, Transportation of locally purchased items, Emissions of client/ guest transportation, Waste disposal (Excluding paper waste) & transportation
for the year 2020/21,
LB FINANCE PLC,
The certificate is issued in accordance with the procedure for voluntary cancellation in the CDM Registry. The reason for cancellation included in this certificate is provided by the canceller.
ns
Climate Change
Number and typeof units cancelled
Presented to:
Reason for cancellation:
Date:
Start serial number: - - - - - -End serial number: - - - - - -
Equivalent tonne(s) of CO2
CANCELLATION
Presented toCitizens Development Business Finance PLC
Reason for cancellationTo achieve the carbon neutrality of Citizens Development Business Finance PLC for thefinancial year 2018, assessed by Climate Smart Initiatives (Pvt) Ltd.
Number of unitscancelled Equivalent to 2,433 tonne(s) of CO2
Start serial number: IN52208374091102698
End serial number: IN52208398411102698
The certificate is issued in accordance with the procedure for voluntary
cancellation in the CDM Registry. The reason included in this certificate is
provided by the cancellor.
DATE: 13 FEBRUARY 2019
REFERENCE: VC6821/2019
: 2,966 tonnes of CO equivalent
.......................................................Eng.H.M. Buddika Hemashantha
(Bsc (Hons) Eng., M.Eng.)
Chief Executive Officer
Direct GHG Emissions
VOLUNTARYCANCELLATIONCERTIFICATE
Presented toLB Finance PLC
Reason for cancellationTo achieve the carbon neutrality of LB Finance PLC for the financial year 2020/2021,assessed by Climate Smart Initiatives (Pvt) Ltd.
Number of unitscancelled
3,110 CERsEquivalent to 3,110 tonne(s) of CO2
Start serial number: IN-5-202718193-2-2-0-2936
End serial number: IN-5-202721302-2-2-0-2936
The certificate is issued in accordance with the procedure for voluntary
cancellation in the CDM Registry. The reason included in this certificate is
provided by the cancellor.
DATE: 30 APRIL 2021
REFERENCE: VC18891/2021
2012/13
Introduced Environmental Management Policy
Identified the importance of carbon footprint
2013/14
Joined hands with Sri Lanka Carbon Fund
Became the first carbon conscious finance company in Sri Lanka
Carbon footprint 2,006 tCO2e
2014/15
Carried out energy audits with assistance from Sri Lanka Carbon Fund
Promoting the importance of knowing the carbon footprint
Carbon footprint 2,343 tCO2e
2015/16
Became the first carbon neutral financial institution in Sri Lanka
Implemented a Carbon Management Policy
Neutralised carbon footprint 2,717 tCO2e
2016/17
Neutralised carbon footprint 4,361 tCO2e
2017/18
Neutralised carbon footprint 3,223 tCO2e
2019/120
Neutralised carbon footprint 4,484 tCO2e
2020/21
Neutralised carbon footprint 3,110 tCO2e
Our commitment to protect and preserve the environment by continuously refining our policies and procedures and improving our products and services through the use of technology has enabled L B Finance PLC to be certified as a Carbon Neutral Company.
LBF’s commitment towards nature and sustainability by promoting environment-friendly business practices to the various business segments of the country as well as reducing carbon footprints from our organisational framework.
2018/19
Neutralised carbon footprint 3,997 tCO2e

L B Finance PLC | Annual Report 2020/21 49
C H A P T E R
03Strength
Driven by Strength We are built on a model of excellence
and strength that propels us into a future designed for every single
stakeholder we serve
Business model 50
Integrated stakeholder engagement 52
Materiality determination 66
Delivering on our strategy and resource allocation 74
Operation in overseas 84
Management Discussion and Analysis
For long-term sustainability, LBF business model magnets from the six capitals and Scorecard delivers us with the framework against which we reflect how we transform, increase or decrease capitals in generating value creation outputs.
The diagram illustrates each of our core activities and how they translate into products and services to meet the needs of our Stakeholders.
MACRO AND MICRO ENVIRONMENT
IMPACT TO THE STAKEHOLDER WEALTH CREATION
STRATEGIES
OUTCOME
Cost structure
Interest ExpensesPersonnel ExpensesOperating ExpensesIncome Tax Expense
Supporting departments
TreasuryFinanceHuman resourcesDigital financial services
Revenue structure
TreasuryFinanceHuman resourcesDigital financial services
Customer segments
Kids/TeenagersMillennials
Young families
Established familiesMature well-offSenior citizens
Self-employedSME’s
Corporate
OPERATIONAL EXCELLENCE
BUSINESS SIMPLIFY AND ACCELERATE
POWERED BY PEOPLE AND
GROWING REPUTATION
CUSTOMER AND STAKEHOLDERS
EXPERIENCE
RESOURCE OPTIMIZATION
Key Resources(Six capitals) Stakeholders
Key activities
Investing FinancingValue Added
ServiceSupporting departments
LegalAdministration
Credit back officeTechnology and innovation
Impact to the income statement
Impact to the Balance sheet
GovernanceStakeholder relationships Risk management
LBF BUSINESS MODEL

Vision & Mission Goals
Inputs
ValuesOUR VALUE CREATING - BUSINESS MODEL
SDGs Capital - Resources (Page 116) Key Inputs (Page 28)
Skills and competencies
Experience
Motivations to innovate
Value Drivers Components of value creation
Business Activities
Sustainable business practices
Risk Management
Micro Environment
Macro Environment
Strategic focus (Page 74) How we do business (Page 88)
Business simplify and accelerate
Profit growth Liquidity Asset & Portfolio
growth
Powered by people and technology
Responsible business Continuous
development Sustainability and CSR
Operational excellence
Corporate Governance and compliance
Financing solutions Providing value added
services
Resource optimisation
Enhance revenue streams Productivity Efficient resource utilisation
Value Creation process
VALUE CREATION FOUNDATIONS
OPERATING ENVIRONMENT
FY 2019/20
Investment products(Page 102)
Value-added
services(Page 113)
Financing products(Page 106)
Opera
tion
Treasury
Hum
an Resources M
arketing
L
egal
Finance Administration
IT
Customer and stakeholder experience
Extended stakeholder service
Customer reach Privacy and new
technology
HUMANCAPITAL
Shareholders’ funds
Borrowed funds
Customer deposits
Shareholders’ funds Rs. 22.99 Bn
Borrowings Rs. 25.88 Bn
Depositors Rs. 89.25 BnFINANCIALCAPITAL
Lands and buildings
Equipment
InfrastructureMANUFACTUREDCAPITAL
Institutionalised knowledge
Technology and systems
Process and proceduresINTELLECTUALCAPITAL
Environmental resources
Water
EnergyNATURALCAPITAL
Relationships with communities
Groups of stakeholders
NetworksSOCIALCAPITAL
Political
Human resource
Suppliers
EnvironmentalTechnical
Plans & policies
Society
Governance Framework
Internal Environment
Und
erst
andi
ng s
take
hold
er n
eeds
and
exp
ecta
tions
, co
mm
unic
atin
g th
roug
h st
akeh
olde
r en
gage
men
t (pa
ge 5
2)
Fee and commission
Trading income Interest income Other operating
income
Interest expense Infrastructure and
technology Human resources Other administrative
expenses
Cost StructureRevenue Stream
Total outlets 165
Property Plant and Equipments Rs. 6.57 Bn
CDM machines 23
Total workforce 3,583
Investment on training Rs. 18.56 Mn
Training Hours 52,778
Brand value Rs. 5.13 bn
Brand Rank 29
Investment on ICT Rs. 115.65 Mn
Customer base 600,000+
Customer financial solutions 31
Community development programmes 12
Investment on green initiatives Rs. 9.54 Bn
Water consumption 39,793 m3
Energy consumption 15,418.08 GJ
L B Finance PLC | Annual Report 2020/2150
Ethics
Quality
Respect
Prof
essi
onal
ism
Excellence
Transparency
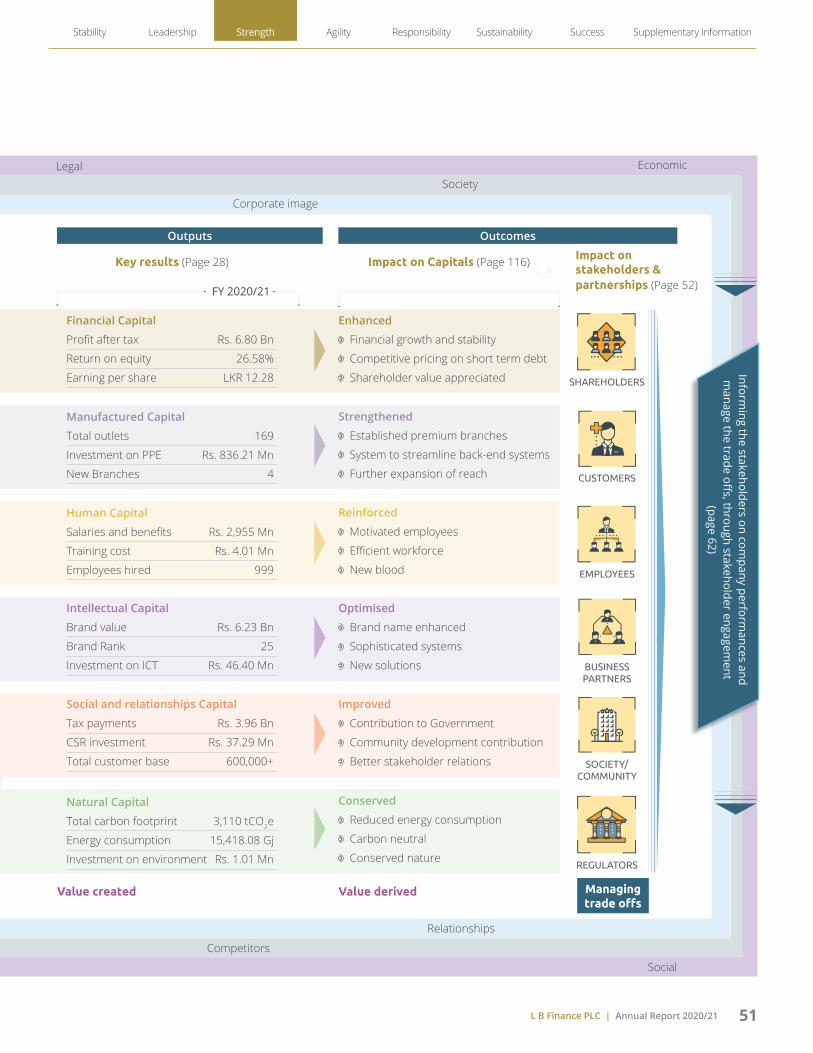
L B Finance PLC | Annual Report 2020/21 51
Reinforced
Motivated employees
Efficient workforce
New blood
Outputs Outcomes
Human Capital
Salaries and benefits Rs. 2,955 Mn
Training cost Rs. 4.01 Mn
Employees hired 999
Key results (Page 28) Impact on Capitals (Page 116) Impact on stakeholders & partnerships (Page 52)
CUSTOMERS
SHAREHOLDERS
EMPLOYEES
SOCIETY/COMMUNITY
BUSINESS PARTNERS
REGULATORS
Value created Value derived Managing trade offs
FY 2020/21
Enhanced
Financial growth and stability
Competitive pricing on short term debt
Shareholder value appreciated
Financial Capital
Profit after tax Rs. 6.80 Bn
Return on equity 26.58%
Earning per share LKR 12.28
Strengthened
Established premium branches
System to streamline back-end systems
Further expansion of reach
Manufactured Capital
Total outlets 169
Investment on PPE Rs. 836.21 Mn
New Branches 4
Optimised
Brand name enhanced
Sophisticated systems
New solutions
Intellectual Capital
Brand value Rs. 6.23 Bn
Brand Rank 25
Investment on ICT Rs. 46.40 Mn
Conserved
Reduced energy consumption
Carbon neutral
Conserved nature
Natural Capital
Total carbon footprint 3,110 tCO2e
Energy consumption 15,418.08 Gj
Investment on environment Rs. 1.01 Mn
Legal Economic
Social
Relationships
Competitors
Society
Corporate image
Informing the stakeholders on com
pany performances and
manage the trade off
s, through stakeholder engagement
(page 62)
Social and relationships Capital
Tax payments Rs. 3.96 Bn
CSR investment Rs. 37.29 Mn
Total customer base 600,000+
Stability Leadership Strength Agility Responsibility Sustainability Success Supplementary Information
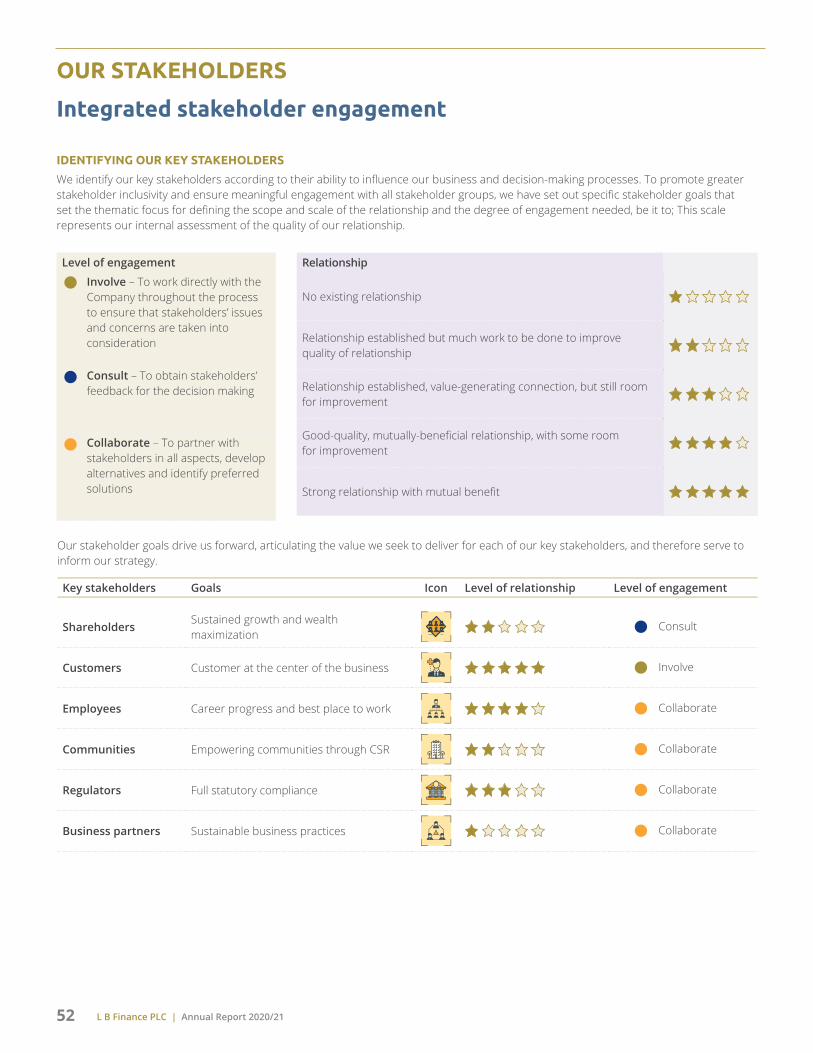
L B Finance PLC | Annual Report 2020/2152
OUR STAKEHOLDERS
Integrated stakeholder engagement
IDENTIFYING OUR KEY STAKEHOLDERS
We identify our key stakeholders according to their ability to influence our business and decision-making processes. To promote greater stakeholder inclusivity and ensure meaningful engagement with all stakeholder groups, we have set out specific stakeholder goals that set the thematic focus for defining the scope and scale of the relationship and the degree of engagement needed, be it to; This scale represents our internal assessment of the quality of our relationship.
Our stakeholder goals drive us forward, articulating the value we seek to deliver for each of our key stakeholders, and therefore serve to inform our strategy.
Key stakeholders Goals Icon Level of relationship Level of engagement
ShareholdersSustained growth and wealth maximization Consult
Customers Customer at the center of the business Involve
Employees Career progress and best place to work Collaborate
Communities Empowering communities through CSR Collaborate
Regulators Full statutory compliance Collaborate
Business partners Sustainable business practices Collaborate
Level of engagement
Involve – To work directly with the Company throughout the process to ensure that stakeholders’ issues and concerns are taken into consideration
Consult – To obtain stakeholders’ feedback for the decision making
Collaborate – To partner with stakeholders in all aspects, develop alternatives and identify preferred solutions
Relationship
No existing relationship
Relationship established but much work to be done to improve quality of relationship
Relationship established, value-generating connection, but still room for improvement
Good-quality, mutually-beneficial relationship, with some room for improvement
Strong relationship with mutual benefit

L B Finance PLC | Annual Report 2020/21 53
STAKEHOLDER IDENTIFICATION AND MANAGEMENT FRAMEWORK
IMPROVE THE VALUE CHAIN ACTIVITIES
Change requirements
Identification
Prioritisation
Review
Business valueRelationship and influence Processes and organisations
Stakeholder expectations
Stakeholder issues
Identify material inputs
Building relationships
Formulating sustainable business objectives
STAKEHOLDER ENGAGEMENT
STAKEHOLDER MANAGEMENT
Visit web page for more information on the stakeholder
engagement framework
PRINCIPLES OF ENGAGEMENT
Purposeful
Conducting focused and meaningful engagement while striving to meet the different communication needs and preferences of stakeholders wherever possible.
Relevant
Selecting the most suitable engagement methods to engage with stakeholders.
Open and honest
Timely provision of information to stakeholders to promote meaningful participation and foster a culture of information sharing, including the provision of providing access to information about objectives, goals and strategies.
• Promoting transparency and feedback processes
• Expressing the willingness to acknowledge mistakes
Inclusive
Being open to alternative views and to listen as well as contribute to conversations.
• Respecting stakeholders’ expertise and appreciating the benefits of mutual learning
Responsive
Proactively acknowledging and addressing stakeholders’ needs and concerns and responding to stakeholders in a timely manner.
Stability Leadership Strength Agility Responsibility Sustainability Success Supplementary Information

L B Finance PLC | Annual Report 2020/2154
OUR STAKEHOLDERS
Not reported Less reported
Reporting scope
Fully reported
STAK
EHO
LDER
S’ IN
FLU
ENCE
ON
LBF
LBF’S IMPACT ON STAKEHOLDERS
Hig
h
High
Med
ium
Medium
Low
Low
Regulators
Government (national, provincial and local)
Media
General public
Employees
Shareholders
Customers
Communities
Suppliers and service providers
Industry bodies
STAKEHOLDER MAPPING
SURVEY INSIGHTSStudy conducted by: The Department of Marketing ManagementUniversity of Sri Jayewardenepura
0
200
400
600
800
1,000
Bank
s
LB F
inan
ce
Oth
er F
inan
cial
In
stitu
tions
1st Preference 2nd Preference 3rd Preference
Num
ber o
f Res
pond
ents
Attractiveness of Interest Rates
Trustworthiness of the Organization
0
200
400
600
800
1000
Bank
s
LB F
inan
ce
Oth
er F
inan
cial
In
stitu
tions
1st Preference 2nd Preference 3rd Preference
Num
ber o
f Res
pond
ents
Goodwill and recognitionof the Organization
0
200
400
600
800
1,000
Bank
s
LB F
inan
ce
Oth
er F
inan
cial
In
stitu
tions
1st Preference 2nd Preference 3rd Preference
Num
ber o
f Res
pond
ents

L B Finance PLC | Annual Report 2020/21 55
INTEGRATED STAKEHOLDER ENGAGEMENT REPORTING PROCESS
Our stakeholder engagement process is effectively integrated into every step of our value creation process and thus serves as a key source of informing our strategy.
ANALYSE
The impact we have on our stakeholders, and our impact on them
Stakeholder influence on our business decisions and the level of management
What value means for them and what value means for us
KEY INPUTS
Positive and inclusive relationships between management and employees
Maintaining sustained confidence of shareholders in our business
Constructive engagement with government representatives and regulators
Collaborative relationships with customers and suppliers, based on mutually agreed
Open channels of communication and positive relationships with communities, non-governmental organisations and the media
Effective partnerships with business peers, sector organisations and research bodies
ACTIVITIES
Understanding and being responsive to our stakeholders’ interests
Developing and enhancing markets for our products and services
Creating and sustaining an enabling environment for investment
Continually seek opportunities to strengthen relationships
Collaborative partnerships to find solutions to collective challenges, and drive needs based development
Prioritising social investment, partnering with business peers and fosters positive employee relationships
IDENTIFY
Identify our key stakeholders
Our key stakeholder goals
Key risks and opportunities arise from these relationships
FORMULATE STRATEGY
Determining material matters for the business, as well as our short, medium and long-term strategies and goals
Develop business initiatives to improve engagement and achieve our goals
Formulate an integrated stakeholder engagement strategy
IMPLEMENT
Business initiatives
Engagement strategies for key stakeholders
KEY OUTCOME
The quality of our relationships
KEY OUTPUT
Economic value added for the year
Why we engage How we engage
Issues raisedOur strategic response
1 2
34
Managing stakeholder relationships
Addressing key stakeholder concerns
Stakeholder reviewPage 62
Capital review Page 64
Value creation to stakeholders
Stability Leadership Strength Agility Responsibility Sustainability Success Supplementary Information

L B Finance PLC | Annual Report 2020/2156
OUR STAKEHOLDERS
MANAGING STAKEHOLDER RELATIONSHIPS
LBF’s stakeholder management framework provides clear guidelines that help to streamline stakeholder engagement and communication activities and ensure they are undertaken in a coordinated manner in order to generate the desired mutually beneficial outcomes. The ownership of the stakeholder management framework lies with LBF’s Sustainability Committee.
Visit web page for more information onStakeholder management framework
New
slet
ters
AGM
Extr
a or
dina
ry m
eetin
g
Emai
ls
Mee
tings
Soci
al m
edia
Even
ts
Repo
rts
Phon
e ca
lls
web
site
s
Form
al le
tter
s
Med
ia re
leas
e
Dig
ital c
hann
els
Annu
al re
port
One
to o
ne
Surv
ey
Site
vis
its
Internal
Shareholder A W W Ah A Ah A
Board of Directors A W W R Ah M W P W R W
Management A W W W R Ah R W P W R W
Employees Q W W R Ah W R W R W A
External
Customers W W R Ah R W W R W A W
Business partners W W R W W W W A W
Communities W Ah W W W
Regulators W M W W Q W
R M Q A W Ah PRegular basis Monthly Quarterly Annual When necessary Ad hoc Periodic
SURVEY INSIGHTSStudy conducted by: The Department of Marketing ManagementUniversity of Sri Jayewardenepura
Respondents summary of the factors influencingin selecting Finance institute for savings and loans
0 200 400 600 800 1,000
Trustworthiness of the CompanyAttractiveness of the interest rate
Quickness when refunding the depositGoodwill of the Company
Friendliness of the serviceEasy documentation
Location convienienceInternet facilities
Extra benefitsOther
Not at all Important Unimportant Moderately important Important Very Important
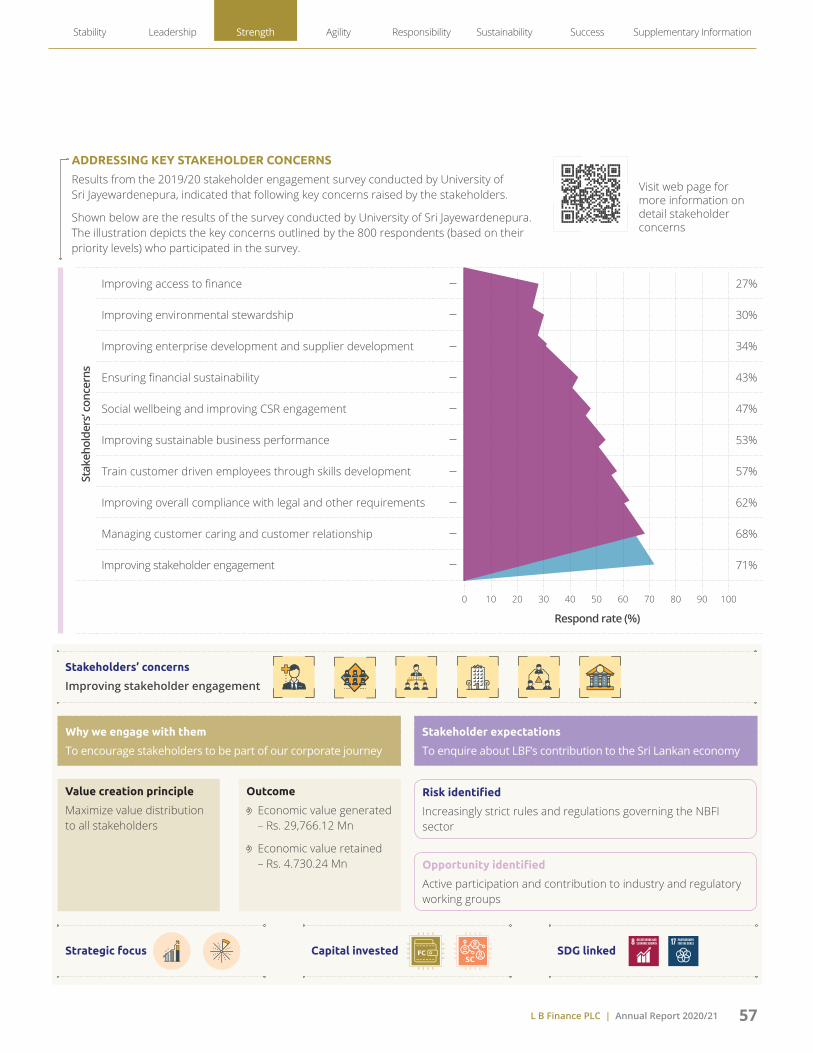
L B Finance PLC | Annual Report 2020/21 57
Stak
ehol
ders
’ con
cern
s
Improving access to finance 27%
Improving environmental stewardship 30%
Improving enterprise development and supplier development 34%
Ensuring financial sustainability 43%
Social wellbeing and improving CSR engagement 47%
Improving sustainable business performance 53%
Train customer driven employees through skills development 57%
Improving overall compliance with legal and other requirements 62%
Managing customer caring and customer relationship 68%
Improving stakeholder engagement 71%
Respond rate (%)
ADDRESSING KEY STAKEHOLDER CONCERNS
Results from the 2019/20 stakeholder engagement survey conducted by University of Sri Jayewardenepura, indicated that following key concerns raised by the stakeholders.
Shown below are the results of the survey conducted by University of Sri Jayewardenepura. The illustration depicts the key concerns outlined by the 800 respondents (based on their priority levels) who participated in the survey.
Visit web page for more information on detail stakeholder concerns
Stakeholders’ concerns
Improving stakeholder engagement
Strategic focus Capital invested SDG linked
Why we engage with them
To encourage stakeholders to be part of our corporate journey
Value creation principle
Maximize value distribution to all stakeholders
Outcome
Economic value generated – Rs. 29,766.12 Mn
Economic value retained – Rs. 4.730.24 Mn
Stakeholder expectations
To enquire about LBF’s contribution to the Sri Lankan economy
Risk identified
Increasingly strict rules and regulations governing the NBFI sector
Opportunity identified
Active participation and contribution to industry and regulatory working groups
10 20 30 40 50 60 70 80 90 1000
Stability Leadership Strength Agility Responsibility Sustainability Success Supplementary Information
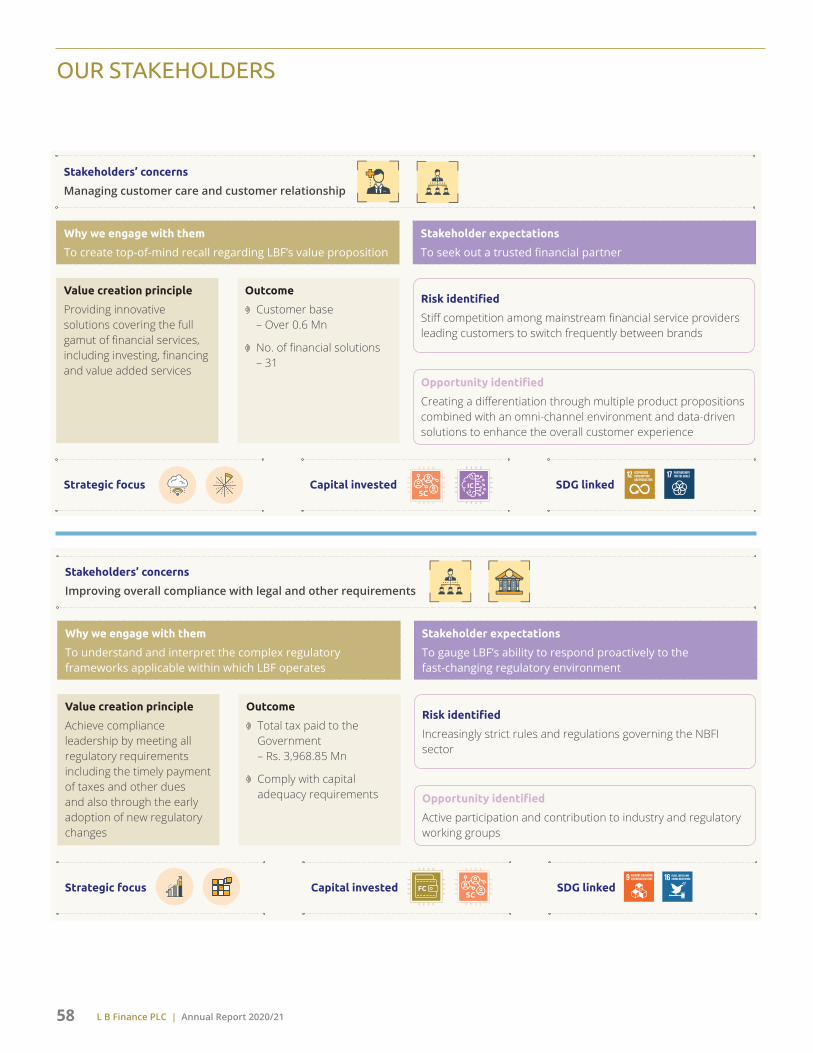
L B Finance PLC | Annual Report 2020/2158
OUR STAKEHOLDERS
Stakeholders’ concerns
Improving overall compliance with legal and other requirements
Strategic focus Capital invested SDG linked
Why we engage with them
To understand and interpret the complex regulatory frameworks applicable within which LBF operates
Value creation principle
Achieve compliance leadership by meeting all regulatory requirements including the timely payment of taxes and other dues and also through the early adoption of new regulatory changes
Outcome
Total tax paid to the Government – Rs. 3,968.85 Mn
Comply with capital adequacy requirements
Stakeholder expectations
To gauge LBF’s ability to respond proactively to the fast-changing regulatory environment
Risk identified
Increasingly strict rules and regulations governing the NBFI sector
Opportunity identified
Active participation and contribution to industry and regulatory working groups
Stakeholders’ concerns
Managing customer care and customer relationship
Strategic focus Capital invested SDG linked
Why we engage with them
To create top-of-mind recall regarding LBF’s value proposition
Value creation principle
Providing innovative solutions covering the full gamut of financial services, including investing, financing and value added services
Outcome
Customer base – Over 0.6 Mn
No. of financial solutions – 31
Stakeholder expectations
To seek out a trusted financial partner
Risk identified
Stiff competition among mainstream financial service providers leading customers to switch frequently between brands
Opportunity identified
Creating a differentiation through multiple product propositions combined with an omni-channel environment and data-driven solutions to enhance the overall customer experience

L B Finance PLC | Annual Report 2020/21 59
Stakeholders’ concerns
Train customer centric employees through skills development
Strategic focus Capital invested
Capital invested
SDG linked
Why we engage with them
To unite and guide employees to work as a team towards a common purpose, that being to put the customer at the center of everything they do
Value creation principle
Attract and retain the best in-class talent on the basis of fair and equitable remuneration, effective performance management, ongoing training and development as well as continuous recognition and rewards
Outcome
Total no. of promotions – 1,237
Investment on training – Rs. 4.01 Mn
Stakeholder expectations
To understand the future direction of the Company and sync their personal career aspirations to the Company’s strategic objectives
Risk identified
The competitive nature of the local financial service industry leading to the possibility of high labour turnover among certain employee segments
Opportunity identified
Demonstrate LBF’s credibility as an employer of choice
Stakeholders’ concerns
Social wellbeing, community support and improving CSR engagement
Strategic focus SDG linked
Why we engage with them
In search of collaborative value adding partnerships to facilitate our CSR and sustainability activities
To create awareness, gain insights and advice on how to maximize the outcomes of our integrated sustainability initiatives
Value creation principle
Promoting socio economic transformation by enabling entrepreneurship, job creation and poverty alleviation
Outcome
Investment on CSR – Rs. 37.29 Mn
No. of job opportunities provided – 999
Stakeholder expectations
To find solutions that will enable them to improve their livelihood and uplift living standards for themselves, their families, with cascading benefits for their community
Risk identified
Failure of projects to achieve desired outcomes, which could adversely impact the Company’s reputation
Opportunity identified
Leverage on the connections made to carve out new markets to grow LBF’s core business
Stability Leadership Strength Agility Responsibility Sustainability Success Supplementary Information

L B Finance PLC | Annual Report 2020/2160
OUR STAKEHOLDERS
Stakeholders’ concerns
Improving enterprise development and supplier development
Strategic focus Capital invested SDG linked
Why we engage with them
To ensure continuity and sustainability of the business over time
Value creation principle
Develop a strong supplier network based on mutual trust and shared values
Outcome
Registered business partners – Over 3,000
Payment to the business partners – Rs. 10.13 Bn
Stakeholder expectations
To be able to correlate their growth prospects in tandem with LBF’s growth trajectory
Risk identified
Lack of supplier diversity may lead to a breakdown in the supply chain
Opportunity identified
Promote local suppliers
Stakeholders’ concerns
Ensuring financial sustainability
Strategic focus Capital invested SDG linked
Why we engage with them
To identify profitable business/product segments and test the market for new financial solutions
Value creation principle
An agile business model capable of responding quickly to market opportunities coupled with strong risk management fundamentals to build resilience against challenges
Outcome
Return on equity – 26.58%
Return on assets – 4.78%
Stakeholder expectations
To seek out solutions to meet their immediate financial needs
To learn about investment and wealth management opportunities that will help them to achieve their long term financial goals
Risk identified
Lack of investor confidence due to market vulnerabilities in the NBFI sector
Opportunity identified
Ability to leverage our financial strength, to raise the necessary capital and funding at the best possible rates

L B Finance PLC | Annual Report 2020/21 61
Stakeholders’ concerns
Improving environmental stewardship
Strategic focus Capital invested SDG linked
Why we engage with them
To raise awareness regarding LBF’s environmental initiatives, commitment to lean resource management and green business practices
Value creation principle
Support the country’s transition to the low carbon economy over time through the ongoing focus on carbon neutral business operations
Outcome
Certified as carbon neutral entity for 6th consecutive year
Carbon footprint – 3,110 tCO2e
Stakeholder expectations
To partner with like minded institutions and environmental preservation and conservation activities
Risk identified
Adverse impact of climate change leading to tighter regulatory controls that may affect certain aspects of the conventional business model
Opportunity identified
Focus on increasing the exposure to large scale clean energy projects
Stakeholders’ concerns
Improving access to finance and improving sustainable business
Strategic focus SDG linked
Why we engage with them
To deliver benefits of the formal financial system to low income households
Value creation principle
Focus on underserved market segments, especially grass root level communities, and small-scale rural enterprises to access structured financial solutions
Outcome
Merchants registered for CIM wallet – Over 4,000
Micro leasing customer base – Over 50,000
Stakeholder expectations
To reduce their dependence on informal channels
Risk identified
High level of default risk
Opportunity identified
Expand the micro finance business segment
Capital invested
Stability Leadership Strength Agility Responsibility Sustainability Success Supplementary Information

L B Finance PLC | Annual Report 2020/2162
Stak
ehol
der Value for the stakeholder Value for the Company Outcomes Managing the outcomes
Indicator 2020/21 2019/20 Trend
CUST
OMER
S
Innovative, efficient, cost-effective financial solutions that meet customers’ needs
Improved access to markets and financial services including access to information and advice
A safe and trustworthy financial services provider
More satisfied customers
Enhances LBF’s reputation as a trusted financial services institution
Increased customer loyalty
Higher revenue from existing and new customers
Growth in customer base (%) 8.81 8.59 Ongoing work to stem customer losses; re-shape the customer profile and restore trust and confidence
Driving innovation and articulation of a digital strategy to reshape the group
No. of complaints solved 100% 100%
No. of financial solutions offered
31 30
CIM app downloaded over 36,000 over 26,000
EMPL
OYEE
S
A robust and challenging work environment where all employees can achieve their full potential
Performance-based culture that recognizes and rewards high performance
Self-led development and opportunities for career progression
Highly motivated and engaged workforce as a key competitive advantage
A dynamic and experienced talent pool equipped to meet current and future needs of the Company
Employee voluntarism (hours) 5,764 20,131 Culture reset
Delivering a target culture and new corporate values
Implementation of multiple engagement forums
Focus on employee turnover
Total headcount broken down by: - Full time 3,515 3,558
- Contract 49 25
Female 1,407 1,393
Male 2,157 2,190
Investment on training (Rs. Mn) 4.01 18.56
SOCI
ETY
Support for economic growth
Increased access to, and funding for, education opportunities
Lower environmental footprint
Access to new markets
Confirms LBF’s status quo as a responsible corporate steward
Total energy use (GJ) 15,418.08 20,538.00 Ongoing stakeholder engagements informed by a revised group policy and engagement framework
Continuous improvement of corporate governance, compliance and risk management practices
Establishment of a group wide sustainability programme
Carbon emissions (tco2) 3,083.30 4,448.90
No. of CSR projects 22 17
Invest on CSR (Rs. Mn) 37.29 22.52
No. of trees planted at present (50 to 50,000 tree planting programme)
41,083 34,853
SHAR
EHOL
DERS Sustainable return on investment through
attractive dividends
Increased earning potential due to the upwards movement in the share price
Strong capital base to fuel growth
Public trust in the brand
Return on equity (%) 26.58 25.04 New strategy and medium term performance targets alongside a focused separation programme
Amended remuneration approach to address shareholder concerns
Return on assets (%) 4.78 3.70
Debt to equity (Times) 3.74 5.01
Cost-to-income ratio (%) 30.56 33.44
REGU
LATO
RS A
ND
BUSI
NESS
PAR
TNER
S
Fair and ethical engagement when dealing with the Company
Contribution towards the overall stability of the Country’s financial system
Sound corporate values, high ethical standards, market integrity and good conduct practices
Sustainable operations
Employees completing no. of training on compliance
2 3 Continued engagement with regulators across all presence countries with a focus on the separation
Ongoing engagement/contribution to legislative developmentsFine or charge against non-compliance
None None
VALUE CREATION SCORECARD - STAKEHOLDER VIEW
The table below demonstrates how LBF’s integrated strategy is generating positive outcomes for the Company, through its holistic efforts to create stakeholder value.
OUR STAKEHOLDERS

L B Finance PLC | Annual Report 2020/21 63
Stak
ehol
der Value for the stakeholder Value for the Company Outcomes Managing the outcomes
Indicator 2020/21 2019/20 Trend
CUST
OMER
S
Innovative, efficient, cost-effective financial solutions that meet customers’ needs
Improved access to markets and financial services including access to information and advice
A safe and trustworthy financial services provider
More satisfied customers
Enhances LBF’s reputation as a trusted financial services institution
Increased customer loyalty
Higher revenue from existing and new customers
Growth in customer base (%) 8.81 8.59 Ongoing work to stem customer losses; re-shape the customer profile and restore trust and confidence
Driving innovation and articulation of a digital strategy to reshape the group
No. of complaints solved 100% 100%
No. of financial solutions offered
31 30
CIM app downloaded over 36,000 over 26,000
EMPL
OYEE
S
A robust and challenging work environment where all employees can achieve their full potential
Performance-based culture that recognizes and rewards high performance
Self-led development and opportunities for career progression
Highly motivated and engaged workforce as a key competitive advantage
A dynamic and experienced talent pool equipped to meet current and future needs of the Company
Employee voluntarism (hours) 5,764 20,131 Culture reset
Delivering a target culture and new corporate values
Implementation of multiple engagement forums
Focus on employee turnover
Total headcount broken down by: - Full time 3,515 3,558
- Contract 49 25
Female 1,407 1,393
Male 2,157 2,190
Investment on training (Rs. Mn) 4.01 18.56
SOCI
ETY
Support for economic growth
Increased access to, and funding for, education opportunities
Lower environmental footprint
Access to new markets
Confirms LBF’s status quo as a responsible corporate steward
Total energy use (GJ) 15,418.08 20,538.00 Ongoing stakeholder engagements informed by a revised group policy and engagement framework
Continuous improvement of corporate governance, compliance and risk management practices
Establishment of a group wide sustainability programme
Carbon emissions (tco2) 3,083.30 4,448.90
No. of CSR projects 22 17
Invest on CSR (Rs. Mn) 37.29 22.52
No. of trees planted at present (50 to 50,000 tree planting programme)
41,083 34,853
SHAR
EHOL
DERS Sustainable return on investment through
attractive dividends
Increased earning potential due to the upwards movement in the share price
Strong capital base to fuel growth
Public trust in the brand
Return on equity (%) 26.58 25.04 New strategy and medium term performance targets alongside a focused separation programme
Amended remuneration approach to address shareholder concerns
Return on assets (%) 4.78 3.70
Debt to equity (Times) 3.74 5.01
Cost-to-income ratio (%) 30.56 33.44
REGU
LATO
RS A
ND
BUSI
NESS
PAR
TNER
S
Fair and ethical engagement when dealing with the Company
Contribution towards the overall stability of the Country’s financial system
Sound corporate values, high ethical standards, market integrity and good conduct practices
Sustainable operations
Employees completing no. of training on compliance
2 3 Continued engagement with regulators across all presence countries with a focus on the separation
Ongoing engagement/contribution to legislative developmentsFine or charge against non-compliance
None None
Increase Decrease Neutral
Stability Leadership Strength Agility Responsibility Sustainability Success Supplementary Information

L B Finance PLC | Annual Report 2020/2164
Capitals Stakeholders Key indicators of capital management Unit Outcome on the capital Trend
2020/21 2019/20
Shareholders
Lenders
Employees (Management KMPs)
Income growth % (4.67) 6.64
PAT growth % 31.15 2.62
Assets growth % (2.35) 5.55
Market price per share Rs. *47.40 120.50
Dividend yield % 23.24 -
Market capitalization Rs. Mn 26,262 16,691
Dividend per share Rs. 7.00 -
Shareholders
Employees (Management KMPs)
Branches in Myanmar number 12 8
Profit per outlet Rs. Mn 40.25 31.44
Income per outlet Rs. Mn 184.75 180.40
Gold loan centre converted to branches number 18 -
Freehold land and building Rs. Mn 181.79 230.13
Employees
Investment on training and developments Rs. Mn 4.01 18.56
No. of promotions 1,237 854
Remuneration and benefit paid Rs. Mn 2,959.82 3,005.18
Customers
Investment on software development Rs. Mn 0.65 17.84
Re-certifcation of 27001:2013 Done Done
Investment of IT Rs. Mn 46.40 115.65
VALUE CREATION STAKEHOLDER SCORECARD – SIX CAPITAL VIEW
OUR STAKEHOLDERS
MANUFACTUREDCAPITAL
MC
HUMANCAPITAL
HC
INTELLECTUALCAPITAL
IC
FINANCIALCAPITAL
FC
*Price per share represents the share price after the share sub-division.

L B Finance PLC | Annual Report 2020/21 65
Capitals Stakeholders Key indicators of capital management Unit Outcome on the capital Trend
2020/21 2019/20
Employees
Regulators
Community
Projects to uplift the communities wellbeing number 22 17
Taxes paid to government Rs. Mn 3,968.85 6,824.68
Corporate social investment number 37.29 22.52
Economic value distributed Rs. Mn 29,766.12 31,222.86
Community
Employees
No. of trees planted at present (50 to 50,000 tree planting programe) number 41,083 34,583
Paper recycle Kg 3,986 5,501
Energy consumption GJ 15,418 20,538
Carbon footprint tco2e 3,110 4,484
SOCIALCAPITAL
SC
NATURALCAPITAL
NC
Increase Decrease Neutral
SURVEY INSIGHTSStudy conducted by: The Department of Marketing ManagementUniversity of Sri Jayewardenepura
Elderly Brand
Outdated Systems
Youth Brand
Digitalized
Tech Savvy
Highly Convinient
11% 54%
35%
Well Treated
Friendly
Updated Systems
High Trustworthiness
Very low Technology Usage
Traditional
High Technology Driven
Modern-Less technology driven
Matured Brand
Moderate Techonology Usage
WHICH IMAGE IS A GOOD
REFLECTION OF L B FINANCE ?
Stability Leadership Strength Agility Responsibility Sustainability Success Supplementary Information

L B Finance PLC | Annual Report 2020/2166
MATERIALITY DETERMINATION
OUR APPROACH
Our material issues relate how LBF creates value for stakeholders, our business and our wider community in the short, medium and long term. These material issues therefore form the foundation of LBF’s strategy.
Our materiality assessment for the FY 2020/21 was carried out with due consideration of the guidelines issued by the International Integrated Reporting Council’s (IIRC) <IR> Framework, the Global Reporting Initiative (GRI) Standards and with reference to the AccountAbility- AA1000SES.
EXPECTED OUTCOME THROUGH ADDRESSING MATERIAL ISSUES
Addressing our most material issues are our main priorities. To achieve this task, we have linked each material issue with six key performance outcomes. Throughout this report we make reference to these performance outcomes, where each relevant material issue is discussed.
PERF
ORM
ANCE
OU
TCO
ME
AREA
VALUE CREATION
Pursuing sustainable
business growth
amidst socio economic
uncertainty
Becoming more customer-centric
Managing social and
environmental inequalities
Developing a highly
engaged, satisfied and
motivated workforce
SDG Alignment
Material issue raised by
Capital invested
Demand for stricter
governance, tighter regulatory
control and improved risk management
Technological advancement
and higher competitive
pressure
Visit web page for more information on detail material determination

L B Finance PLC | Annual Report 2020/21 67
Pursuing sustainable business growth amidst socio economic uncertainty
As a leading financial institution in Sri Lanka, we believe that there is a need to strike a balance between our financial performance and our ability to provide appropriate business outcomes. This will ensure LBF’s long term sustainability, improve trust in the financial system and safeguard the Company against future shocks
Material themes
Strategic objectives Target set in 2020/21 Progress Opportunities for future value creation
Sustainably growing revenue
Improve our business margins and create shareholder value in a sustainable way
Demonstrate sector leadership by creating a more innovative and sustainable business
Lead the way in understanding and managing our risk profile
Focus on productivity and efficiency improvements in order to achieve cost leadership
Ongoing Digitization and process automation
Identify most appropriate financial requirements to tap into under-served market segments
Pursue continuous innovation to develop and launch groundbreaking solutions to gain first mover advantage in the mainstream financial solutions market
Improve the agility of the business model to effectively respond to macroeconomic variables such as shifts in interest rates, credit demand and credit risk
Risk and capital management
Continue to implement and support a comprehensive enterprise risk management approach
Achieved Enterprise risk process plans have been implemented by ongoing review and reporting
Delivering appropriate shareholder returns
Remain focused on achieving sustainable, long term earnings growth in order to generate consistent dividend returns for shareholders
Ongoing Dividend per share Rs. 7/- (2020/21)
Process excellence
Bring NIM on par with the historical average level
Achieved NIM recorded at 12.15%
Material issue Why it matters most Risk associate
CREDIT RISK
MARKET RISK
Short term Medium term Long term
Respond to special key material matter - COVID-19 and its impact
Material aspects Actions taken Progress Opportunities for future value creation
Our COVID-19 response focused on ensuring the health and safety of our employees, customers, broader stakeholders and community at large. In addition, through our immediate actions, we ensured the continuity of our business operations in every corner of Sri Lanka
Effective remote working practices
Introducing strict hygiene health guidelines and sanitization facilities
Providing employee support and help desk for those infected with or exposed to the virus
Further strengthening of Business Continuity Plans (BCP) and Disaster Recovery plans (DR)
Reviewing business and strategic imperatives with business Heads
Use data analytics to increase efficiency of compilation, application evaluation, improvements in the behaviour and requirements of customers
Enhancing organizational service quality and connectivity by automating and using emerging channels
Risk associate
Remote working practices could increase exposure to information security risks and lead to data breaches
Widespread infections can adversely affect health and safety and operational continuity of employees
S M L
M
S
L
S
Stability Leadership Strength Agility Responsibility Sustainability Success Supplementary Information

L B Finance PLC | Annual Report 2020/2168
Demand for stricter governance, tighter regulatory control and improved risk management
Complying with legal and regulatory frameworks and operating in good faith in-line with industry best practices, strengthens the legitimacy of the business and enhance the LBF brand reputation in the market
Material themes
Strategic objectives Target set in 2020/21
Progress Opportunities for future value creation
Corporate governance
Maintaining high ethical standards, responsible lending practices, proactive risk management and fair treatment of employees, customers and other stakeholders in compliance with legal and regulatory frameworks and other best practices applicable to the non-bank financial services sector
Implement the mandates included in the new enterprise wide risk management policy introduced in 2019
Achieved Upgraded the enterprise wide risk management framework to strengthen the LBF’s resilience against external shocks
Early adoption of new regulatory requirements to achieve compliance leadership
Seamless integration of new regulatory requirements as part of the operating processes to minimise compliance lapses
Create a suitable environment that promotes responsible risk taking at all levels of the business
Ethics and transparency
Champion the value culture set out in under LBF’s Code of Business Conduct
Ongoing Continue with culture shaping initiatives to reinforce the importance of ethics and integrity among employees
Material issue Why it matters most Risk associate
LEGAL RISK
REPUTATIONAL RISK
MATERIALITY DETERMINATION
Developing a highly engaged, satisfied and motivated workforce
An agile and highly skilled workforce is vital to ensure business continuity and to maintain its competitive advantage
Material themes
Strategic objectives Target set in 2020/21 Progress Opportunities for future value creation
Employee engagement
Develop human capital to complement the Company’s long term aspirations
Increase motivation levels in order to reduce employee turnover
Increase employee engagement in CSR activities by 5%
Not achieved 370 employees engaged in the CSR activities
Position LBF as an employer of choice in the NBFI sector
Branch expansion to create new employment opportunities especially at a provincial level
Achieve gender equality
Occupational health, safety and wellbeing
Maintain safe work environment to ensure zero accidents
Ongoing Continuous monitoring of occupational health and safety environment
Retention, training and development
Systematically increase training hours based on the Company’s requirements and to promote personal growth of employees
Ongoing 19 training programmes conducted for 2020/21
Compensation and incentives
Expand the special schemes to recognize high performers
Achieved Performance-based bonus for employees
Material issue Why it matters most Risk associate
OPERATIONAL RISK
REPUTATIONAL RISK
Short term Medium term Long termS M L
S
L
S
L
L
M

L B Finance PLC | Annual Report 2020/21 69
Technological advancement and higher competitive pressure
Technology is at the heart of LBF’s business approach and defines the way we think and act. We use technology driven platforms as a key differentiator to achieve business excellence in a fiercely competitive market
Material themes
Strategic objectives Target set in 2020/21 Progress Opportunities for future value creation
Innovation
Leverage on technology and innovation to remain competitive and lead the industry in the creation of value
Pursue collaborative and value adding partnerships to strengthen LBF’s overall capabilities
Streamline the product development process, from ideation to commercial deployment
Achieved Launch of CIM (Cash In Mobile) an industry-leading digital wallet solution
Capitalise on digital technology to deliver first to market products and services that secure captive market share
Use digital technology to create a parallel ecosystem to serve alongside the conventional brick and mortar branch model
Information security
Strengthen information security architecture through targeted investments, including an Information Security Operation Centre (ISOC) to identify external cyber attacks, intrusion and threats
Ongoing Continuous and ongoing monitoring to detect areas for further enhancement
Technological advancement
Continue to build IT capacity with incremental improvements and new tactical solutions to strategically enhance core IT platforms
Achieved Roll out of the new gold loan system (Eclipse) to speed up processing times, ultimately leading to improved service delivery
Industry trends
Foster and promote new ideas that have the potential to generate viable business outcomes
Ongoing Evaluation of business diversification strategies
Material issue Why it matters most Risk associate
INFORMATION SECURITY RISK
Short term Medium term Long termS M L
S
L
S
M
Stability Leadership Strength Agility Responsibility Sustainability Success Supplementary Information

L B Finance PLC | Annual Report 2020/2170
Becoming more customer-centric
LBF’s ability to grow sustainably depends on understanding and responding to the evolving needs of the customer with a greater degree of efficiency
Material themes
Strategic objectives Target set in 2020/21 Progress Opportunities for future value creation
Customer satisfaction
Effective and efficient management of customer complaints, including taking responsibility to address the root cause and thereby eliminate the possibility of recurrence
Create brand awareness through clear transparent communication to enable customers to make informed decisions
To take immediate actions for customer complaints/inquiries
Achieved Received 1,170 customer complaints/inquiries satisfactorily resolved 100%. Recurring complaints increased by 2.63% due to pandemic
Higher customer satisfaction creates an opportunity to grow the customer base through cross selling activities
Brand loyalty and Company reputation
To become the best brand in the brand ranking
Ongoing Declared one of Sri Lanka’s top 10 Most respected entities in 2019 by Nielsen
Regional expansion
Expand the branch footprint in Myanmar
Opened 04 branches in Addalaichenai, Vaddukoddai, Athurugiriya and Mallavi
Material issue Why it matters most Risk associate
REPUTATIONAL RISK
Managing social and environmental inequalities
Reaffirms LBF’s status quo as a responsible corporate steward
Material themes
Strategic objectives Target set in 2020/21 Progress Opportunities for future value creation
Financial literacy and digital financial inclusion
Leverage on LBF’s expertise as a financial solutions provider to offer rural communities the benefits of the formal financial system
Consider the impact of our operational decisions on society and work to strike a balance that will ensure our everyday actions deliver positive outcomes for all our stakeholders over time
3,000 merchant registrations for the digital wallet
Achieved +4,000 merchant registrations
Provide financial assistance to promote investment in alternative energy and renewable energy in-line with the national sustainable energy initiative
Take action to combat climate change
Corporate citizenship
10% of CSR budget allocated for educational development
Not achieved 2.75% spend on educational development via CSR activities
Supply chain management
Implement a comprehensive supplier on-boarding mechanism
Achieved On-boarded +3,000 suppliers via the new system
Environment management
Plant 50,000 trees under the “Thuru Wawamu” project in 2021
Ongoing +42,000 trees planted island wide up to now
Material issue Why it matters most Risk associate
REPUTATIONAL RISK
MATERIALITY DETERMINATION
Short term Medium term Long termS M L
S
L
M
M
S
S
M

L B Finance PLC | Annual Report 2020/21 71
MATERIALITY RADAR
We seek to ensure that our reporting continues to reflect our response to the material issues raised by our stakeholders and hence have plotted these issues on a materiality radar. The materiality radar presents the results of the materiality process in a different way. The gold and blue lines show the business and external stakeholders’ views and illustrates the synergy for most of our issues.
We regularly review our material issues in the context of the rapidly changing business and societal context, as well as stakeholder feedback and emerging trends.
Way forward
The Stakeholder Engagement survey for 2020/21 - the third consecutive study commissioned by LBF was conducted with the expertise of several leading state universities. As in the past, the recent survey too provided the opportunity to mine stakeholder views, exchange ideas as well as to understand their needs and expectations. Based on the findings of the survey, we have learnt that there are certain issues that show a divergence between the business and external
stakeholders’ views. We feel that such issues require more attention, particularly where they are more important to external stakeholders than they are to the business. Accordingly, we are now taking steps to refine our strategies to address these issues more holistically in the future. Going forward, we are also planning to expand the scope of our next stakeholder survey by focusing on a larger sample size under each stakeholder group, which we hope would provide a broader situational assessment of our material issues.
0
1
2
3
4
5
6
7
Risk and capital management
Sustainably growing revenue
Retention, training and development
Employee engagement
Environment management
Delivering appropriate shareholder returnsSupply chain management
Operational excellence
Innovation
Corporate citizenship
Information securityFinancial education and inclusion
Technological advancementGlobal expansion
Industry trendsBrand loyalty and Company reputation
Corporate governanceCustomer satisfaction
Ethics and transparency Compensation and incentives
Occupational health, safety and wellbeing
Shareholder concerns Business impact
Stability Leadership Strength Agility Responsibility Sustainability Success Supplementary Information

L B Finance PLC | Annual Report 2020/2172
MATERIALITY IMPACT MATRIX
Material matters Material themes Impact to the capital Strategic focus Stakeholders
FIN
ANCI
AL C
APIT
AL
MAN
UFA
CTU
RED
CAP
ITAL
INTE
LLEC
TUAL
CAP
ITAL
HU
MAN
CAP
ITAL
SOCI
AL A
ND
REL
ATIO
NSH
IP C
APIT
AL
ENVI
RON
MEN
T CA
PITA
L
OPE
RATI
ON
AL E
XCEL
LEN
CE
BUSI
NES
S SI
MPL
IFY
AND
ACC
ELER
ATE
POW
ERED
BY
PEO
PLE
AND
TEC
HN
OLO
GY
CUST
OM
ER A
ND
STA
KEH
OLD
ERS
EXPE
RIEN
CE
RESO
URC
E O
PTIM
IZAT
ION
SHAR
EHO
LDER
S
CUST
OM
ERS
EMPL
OYE
ES
COM
MU
NIT
IES
REG
ULA
TORS
BUSI
NES
S PA
RTN
ERS
Pursuing sustainable business growth amidst socio economic uncertainty
Sustainably growing revenue
Risk and capital management
Delivering appropriate shareholder returns
Process excellence
Technological advancement and higher competitive pressure
Innovation
Information security
Technological advancement
Industry trends
Demand for stricter governance, tighter regulatory control and improved risk management
Corporate governance
Ethics and transparency
Becoming more customer-centric
Customer satisfaction
Brand loyalty and Company reputation
Regional expansion
Managing social and environmental inequalities
Financial literacy and digital financial inclusion
Corporate citizenship
Supply chain management
Environment management
Developing a highly engaged, satisfied and motivated workforce
Employee engagement
Occupational health, safety and wellbeing
Retention, training and development
Compensation and incentives
MATERIALITY DETERMINATION
High impact Medium impact Low impactH M L
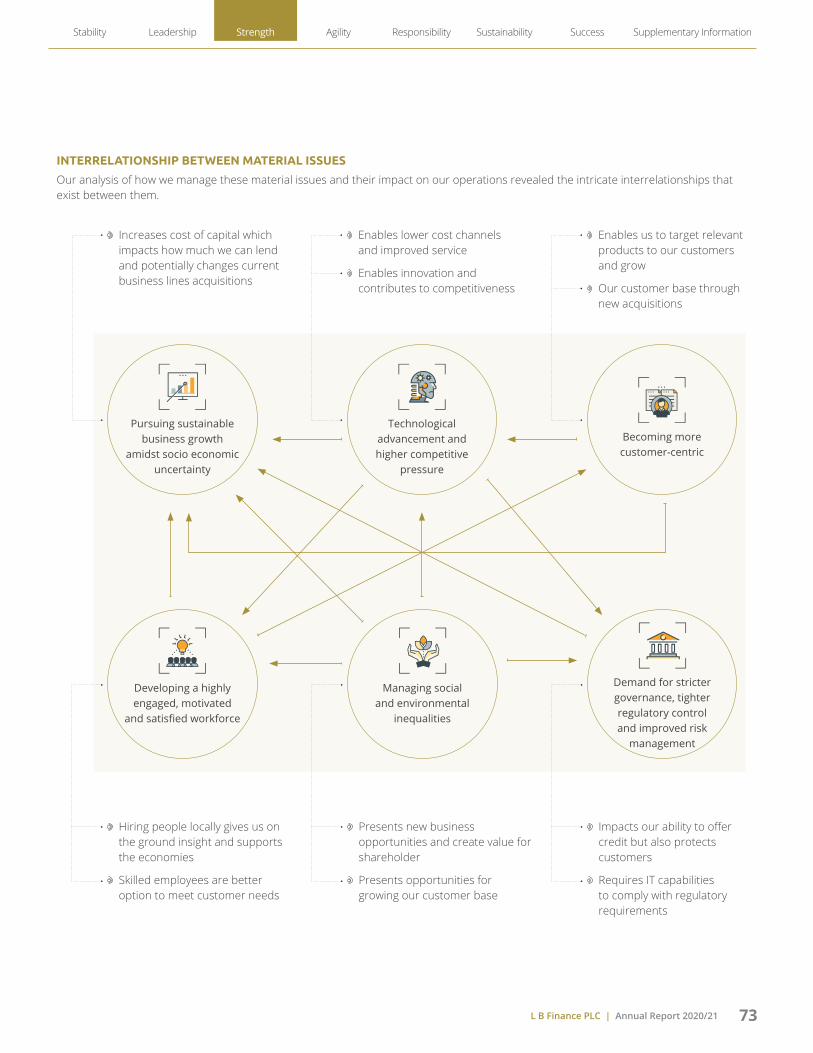
L B Finance PLC | Annual Report 2020/21 73
INTERRELATIONSHIP BETWEEN MATERIAL ISSUES
Our analysis of how we manage these material issues and their impact on our operations revealed the intricate interrelationships that exist between them.
Hiring people locally gives us on the ground insight and supports the economies
Skilled employees are better option to meet customer needs
Presents new business opportunities and create value for shareholder
Presents opportunities for growing our customer base
Impacts our ability to offer credit but also protects customers
Requires IT capabilities to comply with regulatory requirements
Enables us to target relevant products to our customers and grow
Our customer base through new acquisitions
Enables lower cost channels and improved service
Enables innovation and contributes to competitiveness
Increases cost of capital which impacts how much we can lend and potentially changes current business lines acquisitions
Becoming more customer-centric
Technological advancement and higher competitive
pressure
Pursuing sustainable business growth
amidst socio economic uncertainty
Developing a highly engaged, motivated
and satisfied workforce
Managing social and environmental
inequalities
Demand for stricter governance, tighter regulatory control and improved risk
management
Stability Leadership Strength Agility Responsibility Sustainability Success Supplementary Information

L B Finance PLC | Annual Report 2020/2174
DELIVERING OUR STRATEGY AND RESOURCE ALLOCATION
OUR VALUE BASED STRATEGY
It is clear that global trends will continue to drive increased demand in the markets we serve. Hence in developing our strategy, we consider both opportunities and risks, informed by local and global developments. Through this approach we are looking to refine our strategy to improve LBF’s responsiveness to these trends and thereby remain competitive and relevant.
Our strategy keeps us focused, setting a clear path to deliver sustainable growth, accelerate shareholder returns and create ongoing value for all our stakeholders over the short, medium and long term.
Visit our web page for more information on strategic formulation
OUR STRATEGIC PROMISE
Promise to LBF Promise to customers Promise to society
We genuinely care about the communities we serve
We will form a strong bond with our customers
We will understand and anticipate our customers’ needs and aspirations
We will empower our customers to make their future better
We will provide integrated solutions that address customer needs
We will deliver seamless service to our customers
We will create solutions that continuously aim to make our customers’ lives better and easier
We will make financial services possible anytime and anywhere
Caring
Connected
Simple, but not basic
Individually responsible for our organisation’s success
Stronger together, than the sum of our individual parts
Embrace individual uniqueness and diversity
Transformed and diverse workforce
Each colleague has a role in achieving our purpose
Bringing to life the ‘art of the possible’
People united in serving customers and humanity
Actively promote learning and growth
Create organisation-wide development opportunities
Enabled working environments
Shared identity
Common purpose
Meaningful experiences
We will provide thought leadership regarding the development of new and innovative solutions to societal challenges
We will aim to promote inclusive growth in the societies in which we operate
We will contribute by caring for our environment and by helping others to do the same
We will test our decisions against the promise of:
‘Best’ as the most desirable and sustained standard
‘People’ are individuals, communities and society
‘Planet’ is the natural environment
Contributing and empowering
Do the best for people and planet

L B Finance PLC | Annual Report 2020/21 75
OUR STRATEGIC AGENDA
Our strategy is implemented through our key drivers, which take into account stakeholder aspiration, influences arising from our immediate operating environment, including the risks and opportunities that could potentially impact our business model. Our strategic agenda consists of three interconnected components: strategic planning, strategic matrix and strategic opportunities, which collectively help to optimise the use of capitals and achieve our objectives enrooted to our ultimate goal of sustainable income and capital growth.
To support the systematic allocation of capital resources, we have established three distinct planning cycles; short term strategies, medium term strategies and long term strategies.
Strategic agenda
Strategic matrix
Strategic opportunity
Strategic planning
STRATEGIC PLANNING
Long term planning focus beyond 2025/26
Medium term planning focus beyond 2020/21
Short term planning focus for 2020/21
From expertise financial services by operating a deep Sri Lankan insights from our local operations
Access to technologies and products and our ability to connect our customers seamlessly
By embodying shared growth as a business ethos and a sustainable way of conducting business
Strategic Intent Strategic Thrust Strategic Enablers
Company Growth Business Integration
Operational excellence
Business simplify and accelerate
Powered by people and growing reputation
Customers and stakeholders experience
Resource optimization
New customers and value creation
By pursuing value creation for stakeholders, we will accelerate the commercialization of new business models
Capturing new products
Maximize speed and front-line vitality by developing motivated human resources and cutting-edge IT
Business expansion Capturing new markets
Business Differentiation Market Penetration
Competitiveness through innovation
High levels of differentiation of product and services to enhance our competitive edge
Product differentiation
Competitiveness by creating innovative technologies using our key devices and establishing industry standards
Adapting sustainable business practices
Market differentiation
Long term Profitability Grow with Human and Digital
Solid the earning base
Enhance the profitability of our existing business and further solidify earnings base
Profitability to support future growth
Develop businesses with an awareness of the SDGs and ESG in order to create a sustainable society
Resource utilization sustainably
Commitment to the community operate in
Stability Leadership Strength Agility Responsibility Sustainability Success Supplementary Information

L B Finance PLC | Annual Report 2020/2176
DELIVERING OUR STRATEGY AND RESOURCE ALLOCATION
STRATEGIC MATRIX
10 – 20 Years 05 – 10 Years 01 – 05 Years 01 Year Day/Week/Month
Purpose Align with country goals and SDGs
Long term business capacity development
Achieve strategic targets
Resource planning Resource allocation
Focus (What)Contribution to the economy
Value creation for all stakeholders
Company overall profitability
Business line growth
Business targets
Focus (Where) National economy Entire companyMain business domains
Individual product lines
Business units
PlanNational level strategies
Long term strategies
Corporate level strategies
Business level strategies
Operational level strategies
Level 01 Level 02 Level 03 Level 04 Level 05
VALUE CREATION THROUGH OUR STRATEGIC FOCUS
We aim to leverage our extensive experience and expertise developed through our leadership position in Sri Lanka’s NBFI sector over the past 50 years, to continue to grow our market share. In response to the rapidly changing operating environment, needs and expectations of our stakeholders, we have developed five strategic focus areas that drive the activities in our value creating business model. These strategic focus areas are the key catalysts in achieving the desired objectives to deliver our strategy.
Value creation to stakeholders
Value delivering to stakeholders
Customer satisfaction
Delivered through
Leading to
Result in
Revenue growth
Operating efficiency
Cost saving
Operational excellence
Business simplify and accelerate
Powered by people and technology
Customers and stakeholders experience
Resource optimization
LEVELS OF PLANNING
TIME FRAME
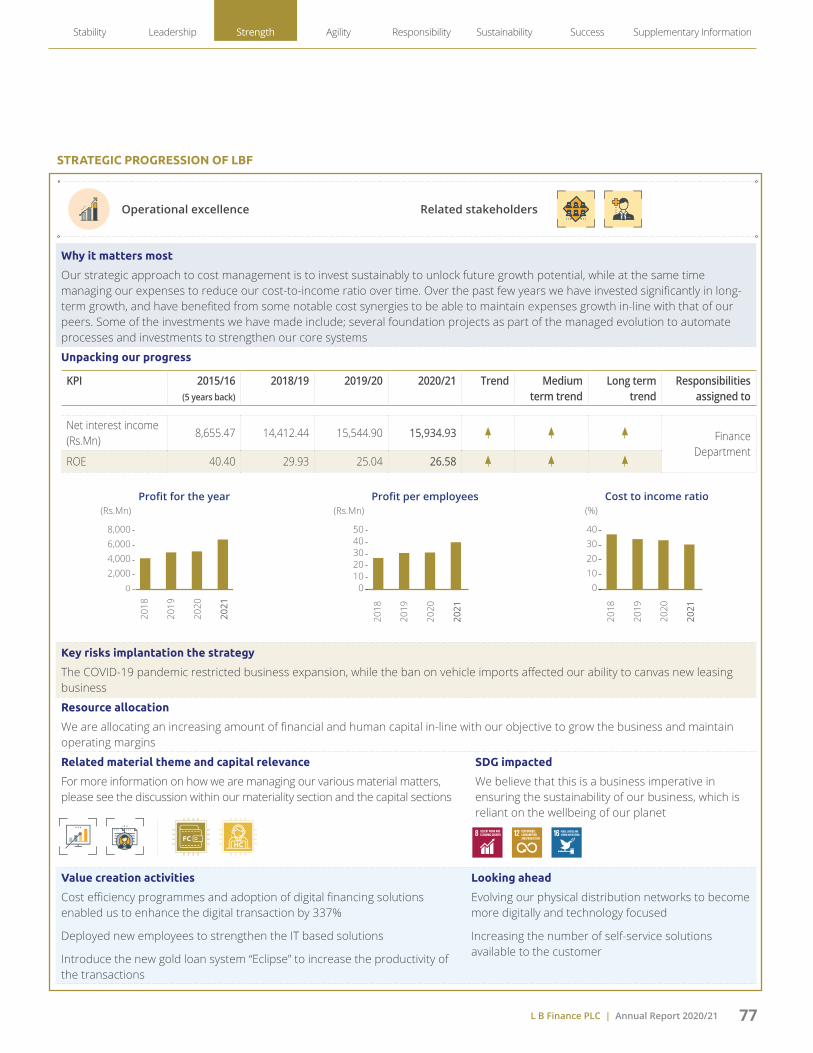
L B Finance PLC | Annual Report 2020/21 77
Why it matters most
Our strategic approach to cost management is to invest sustainably to unlock future growth potential, while at the same time managing our expenses to reduce our cost-to-income ratio over time. Over the past few years we have invested significantly in long-term growth, and have benefited from some notable cost synergies to be able to maintain expenses growth in-line with that of our peers. Some of the investments we have made include; several foundation projects as part of the managed evolution to automate processes and investments to strengthen our core systems
Unpacking our progress
KPI 2015/16(5 years back)
2018/19 2019/20 2020/21 Trend Medium term trend
Long term trend
Responsibilities assigned to
Net interest income (Rs.Mn)
8,655.47 14,412.44 15,544.90 15,934.93 Finance Department
ROE 40.40 29.93 25.04 26.58
Key risks implantation the strategy
The COVID-19 pandemic restricted business expansion, while the ban on vehicle imports affected our ability to canvas new leasing business
Resource allocation
We are allocating an increasing amount of financial and human capital in-line with our objective to grow the business and maintain operating margins
Related material theme and capital relevance
For more information on how we are managing our various material matters, please see the discussion within our materiality section and the capital sections
SDG impacted
We believe that this is a business imperative in ensuring the sustainability of our business, which is reliant on the wellbeing of our planet
Value creation activities
Cost efficiency programmes and adoption of digital financing solutions enabled us to enhance the digital transaction by 337%
Deployed new employees to strengthen the IT based solutions
Introduce the new gold loan system “Eclipse” to increase the productivity of the transactions
Looking ahead
Evolving our physical distribution networks to become more digitally and technology focused
Increasing the number of self-service solutions available to the customer
STRATEGIC PROGRESSION OF LBF
Operational excellence Related stakeholders
Profit for the year (Rs.Mn)
0
2,0004,0006,0008,000
2018
2019
2020
2021
Profit per employees(Rs.Mn)
01020304050
2018
2019
2020
2021
Cost to income ratio(%)
010203040
2018
2019
2020
2021
Stability Leadership Strength Agility Responsibility Sustainability Success Supplementary Information

L B Finance PLC | Annual Report 2020/2178
DELIVERING OUR STRATEGY AND RESOURCE ALLOCATION
Why it matters most
Offering a complete range of financial solutions stems from our commitment to customer centricity. To achieve this, our field teams, branch staff and administrative support functions are required to work together in a seamless way to serve the needs of the customer. In this regard we want to simplify our processes in order to accelerate service delivery to the customer
Unpacking our progress
KPI 2015/16(5 years back)
2018/19 2019/20 2020/21 Trend Medium term trend
Long term trend Responsibilities assigned to
CIM wallet downloads
- - 26,915 36,819DFS and IT
CDM transactions
- 212,415 291,488 215,813
Key risks implantation the strategy
Unsustainable products and services that fail to deliver market leading customer experiences
Resource allocation
We devote financial resources to cater to the needs of the market. Our aim is to assign financial capital to enhance, increase and safeguard internal services in order to attract and maintain a loyal base of high quality customers
Related material theme and capital relevance
For more information on how we are managing our various material matters, please see the discussion within our materiality section and the capital sections
SDG impacted
To achieve our purpose, our capital allocation decisions must take the long term consequences of our investments into consideration
Value creation activities
With conventional income sources under strain, we are seeking new opportunities for revenue growth
The launch of the LB CIM wallet to enable customers to perform business transactions and find merchant through merchant locator
Looking ahead
In the next few business cycles, our emphasis on marketing big data will pick up as we seek to per-sonalize our customers’ offer of goods and pursue cross-selling
We will also increase the use of AI based predictive analysis tools to preempt customer behaviour
Business simplify and accelerate Related stakeholders
LB Outlets(No.)
050
100150200
2018
2019
2020
2021
Branches opened in Myanmar
(No.)
01234
2018
2019
2020
2021
Investment on IT(Rs.Mn)
050
100150200
2018
2019
2020
2021

L B Finance PLC | Annual Report 2020/21 79
Why it matters most
We believe there are strong links between employee engagement, customer engagement and business performance. This is why we continually improve our performance culture by creating a differentiating employee experience and enhancing the capabilities of our leaders and teams. By focusing on offering a superior employee experience we are looking to enhance LBF’s reputation as an employer of choice among Sri Lanka’s financial sector institutions
Unpacking our progress
KPI 2015/16(5 years back)
2018/19 2019/20 2020/21 Trend Medium term trend
Long term trend
Responsibilities assigned to
Brand ranking (by Brand Financin)g
26 23 29 25 Marketing and HR
Employees 2,744 3,618 3,606 3,536
Key risks implantation the strategy
Skill obsolescence and change management issues that arise due to employees resisting digital adoption
Resource allocation
Facilitate succession planning by allocating additional financial capital to create the necessary infrastructure, training and skill management initiatives to help maximize organizational sustainability
Related material theme and capital relevance
For more information on how we’re managing our various material matters, please see the discussion within our materiality section and the capital sections
SDG impacted
We are taking the steps to help our employees to raise the payroll through acquiring useful knowledge, education, public relation and expertise through our internal programs, by building identities, developing competencies and generating opportunities
Value creation activities
Continued with our ongoing training initiatives across the middle, senior and executive cadre to build a stable talent pipeline for the future
Specific trainings for employee skills development and to build critical skills in areas such as IT, customer services and marketing
Looking ahead
Creating a compelling and differentiated Employer Value Proposition (EVP) to attract and retain talent in the highly competitive financial services sector
Powered by people and growing reputation Related stakeholders
Brand value (Rs.Mn)
02,0004,0006,0008,000
2018
2019
2020
2021
New recruitments(No.)
0300600900
1,2001,500
2018
2019
2020
2021
No. of trainingprogrammes
2018
2019
2020
2021
(No.)
07
14212835
Stability Leadership Strength Agility Responsibility Sustainability Success Supplementary Information
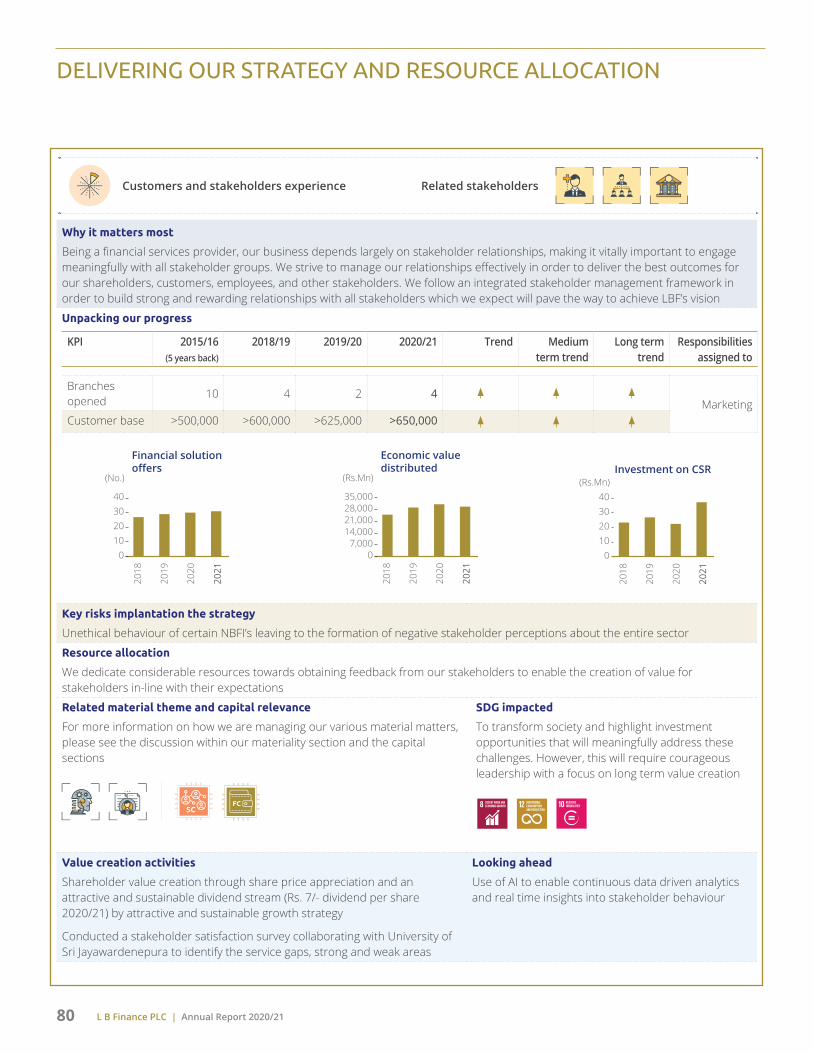
L B Finance PLC | Annual Report 2020/2180
DELIVERING OUR STRATEGY AND RESOURCE ALLOCATION
Why it matters most
Being a financial services provider, our business depends largely on stakeholder relationships, making it vitally important to engage meaningfully with all stakeholder groups. We strive to manage our relationships effectively in order to deliver the best outcomes for our shareholders, customers, employees, and other stakeholders. We follow an integrated stakeholder management framework in order to build strong and rewarding relationships with all stakeholders which we expect will pave the way to achieve LBF’s vision
Unpacking our progress
KPI 2015/16(5 years back)
2018/19 2019/20 2020/21 Trend Medium term trend
Long term trend
Responsibilities assigned to
Branches opened
10 4 2 4Marketing
Customer base >500,000 >600,000 >625,000 >650,000
Key risks implantation the strategy
Unethical behaviour of certain NBFI’s leaving to the formation of negative stakeholder perceptions about the entire sector
Resource allocation
We dedicate considerable resources towards obtaining feedback from our stakeholders to enable the creation of value for stakeholders in-line with their expectations
Related material theme and capital relevance
For more information on how we are managing our various material matters, please see the discussion within our materiality section and the capital sections
SDG impacted
To transform society and highlight investment opportunities that will meaningfully address these challenges. However, this will require courageous leadership with a focus on long term value creation
Value creation activities
Shareholder value creation through share price appreciation and an attractive and sustainable dividend stream (Rs. 7/- dividend per share 2020/21) by attractive and sustainable growth strategy
Conducted a stakeholder satisfaction survey collaborating with University of Sri Jayawardenepura to identify the service gaps, strong and weak areas
Looking ahead
Use of AI to enable continuous data driven analytics and real time insights into stakeholder behaviour
Customers and stakeholders experience Related stakeholders
Financial solutionoffers
2018
2019
2020
2021
(No.)
010203040
Economic valuedistributed
2018
2019
2020
2021
(Rs.Mn)
07,000
14,00021,00028,00035,000
Investment on CSR
2018
2019
2020
2021
(Rs.Mn)
010203040

L B Finance PLC | Annual Report 2020/21 81
Why it matters most
We understand that responsible resource utilisation cascades down to benefit the environment over time, and thereby contributing towards lowering the global risk of climate change. Large corporate entities like LBF can play a leading role in bringing about this change
Unpacking our progress
KPI 2015/16(5 years back)
2018/19 2019/20 2020/21 Trend Medium term trend
Long term trend
Responsibilities assigned to
Green lending (Rs. Mn)
1,081.61 8,566.00 5,401.45 3,515.66Finance and
business unitsReturn on asset (%)
4.89 3.93 3.70 4.78
Key risks implantation the strategy
Adverse economic conditions that were seen in 2020 might result in a shift in resource utilisation priorities
Resource allocation
We continue to measure and monitor our progress against global benchmarks to recalibrate the use of existing resources to drive the business and drive revenue
Related material theme and capital relevance
For more information on how we are managing our various material matters, please see the discussion within our materiality section and the capital sections
SDG impacted
Strengthening the balance sheet to build a diversified and sustainable capital structure through disciplined allocation of scarce capital ensures that we have the resources at our disposal to support our long term ambitions
Value creation activities
Maintained interest cover ratio at 1.81 (2019/20: 1.56)
Monitored and oversaw the Group’s high-quality credit portfolio, despite prolonged, adverse macroeconomic environment while maintain NPL at 5.36% (industry average 13.9% as at 31st December 2020)
Looking ahead
Develop and implement to a sustainable resource utilization framework to ensure systematic progress regardless of external challenges
Resource optimization Related stakeholders
Investment onintangible assets
(Rs.Mn)
05
101520
2018
2019
2020
2021
Net interest incomeper employee
2018
2019
2020
2021
(Rs.Mn)
012345
NPL ratio(%)
0
2
4
6
2018
2019
2020
2021
Stability Leadership Strength Agility Responsibility Sustainability Success Supplementary Information

L B Finance PLC | Annual Report 2020/2182
DELIVERING OUR STRATEGY AND RESOURCE ALLOCATION
STRATEGIC FOCUS MAKING TRADE OFF WITH CAPITALS
We continue to allocate our capital and resources efficiently through our strategic enablers to our five strategic focus areas to create long-term value for shareholders. This requires making tradeoffs, assessing the availability and quality of capital inputs, balancing the short and the long term, and taking tough decisions. Below are the primary tradeoffs we made and the rationale behind our decisions.
Strategic focus area
Tradeoffs, quality and impact on capitals
Capitals Tradeoffs in action
Operational excellence
Digital banking versus traditional banking
As services and products are increasingly digitised there is a trade off between staff, physical outlets and digital innovations. Through automation and customer adoption of digital solutions that drive better customer experiences and the need for direct human interaction is reduced
Business simplify and accelerate
Penetrating across all customer segments
As a large financial institution, LBF is present in all customer segments, including entry level and youth segments which are typically driven by low risk low return products. However, the same high service standards will need to be maintained
Powered by people and technology
Migrating to a digital workplace
Introduction of digital work models are intended to improve employee productivity. However, the resistance to change may have a negative impact on employee satisfaction levels
Total employees
01,0002,0003,0004,000(No.)
2017
2018
2019
2020
2021
Outlets expansion
140150160170180
(No.)
2017
2018
2019
2020
2021
Customer basegrowth
05
101520
(%)
2017
2018
2019
2020
2021
Financialsolutions
2426283032
(No.)
2017
2018
2019
2020
2021
Investment on ITsoftware
(Rs.Mn)
010203040
2017
2018
2019
2020
2021
Investment on IT hardware
(Rs.Mn)
050
100150200
2017
2018
2019
2020
2021

L B Finance PLC | Annual Report 2020/21 83
Strategic focus area
Tradeoffs, quality and impact on capitals
Capitals Tradeoffs in action
Customers and
stakeholders experience
Balancing stakeholder expectations
Managing short term stakeholder performance expectations whilst operating in a long term asset class. Therefore, we seek to manage our impacts and trade-offs vigorously to improve the long term outcomes of our activities, while meeting the short term expectations of our stakeholders, where possible
Resource optimization
Portfolio tilt
The strategic portfolio tilt, in the context of scarce capital and liquidity is an ongoing and conscious trade off between business and product opportunities that are highly capitalized and liquidity consuming with low economic profit. We are realigning our portfolio in areas that will optimize risk-adjusted returns
Return on equity (%)
010203040
2017
2018
2019
2020
2021
Return on assets
2017
2018
2019
2020
2021
(%)
012345
Economic valuedistribution and retain
2017
2018
2019
2020
2021
(Rs. Mn)
010,00020,00030,00040,000
Economic value retainEconomic value distribution
Stability Leadership Strength Agility Responsibility Sustainability Success Supplementary Information
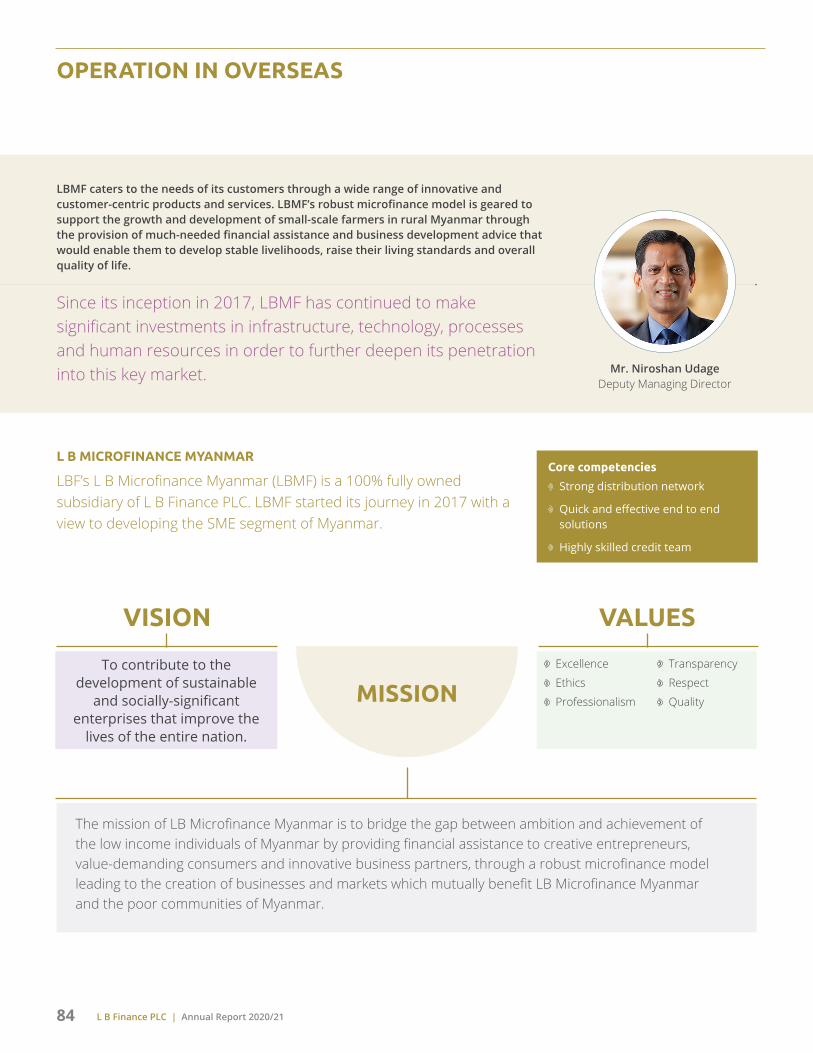
L B Finance PLC | Annual Report 2020/2184
OPERATION IN OVERSEAS
LBMF caters to the needs of its customers through a wide range of innovative and customer-centric products and services. LBMF’s robust microfinance model is geared to support the growth and development of small-scale farmers in rural Myanmar through the provision of much-needed financial assistance and business development advice that would enable them to develop stable livelihoods, raise their living standards and overall quality of life.
Since its inception in 2017, LBMF has continued to make significant investments in infrastructure, technology, processes and human resources in order to further deepen its penetration into this key market. Mr. Niroshan Udage
Deputy Managing Director
Core competencies
Strong distribution network
Quick and effective end to end solutions
Highly skilled credit team
L B MICROFINANCE MYANMAR
LBF’s L B Microfinance Myanmar (LBMF) is a 100% fully owned subsidiary of L B Finance PLC. LBMF started its journey in 2017 with a view to developing the SME segment of Myanmar.
MISSION
The mission of LB Microfinance Myanmar is to bridge the gap between ambition and achievement of the low income individuals of Myanmar by providing financial assistance to creative entrepreneurs, value-demanding consumers and innovative business partners, through a robust microfinance model leading to the creation of businesses and markets which mutually benefit LB Microfinance Myanmar and the poor communities of Myanmar.
VISION VALUES
To contribute to the development of sustainable
and socially-significant enterprises that improve the
lives of the entire nation.
Excellence Transparency
Ethics Respect
Professionalism Quality

L B Finance PLC | Annual Report 2020/21 85
Strengths
String regional branch footprint
Skilled employee base
Weaknesses
Highly competitive environment
Opportunities
Technological advancement and increasing popularity of digital financial solutions
Threats
Political instability in the country
SWOT ANALYSIS
REGIONAL FOOTPRINT
Region Branch Number of employees
Sri Lankan Burmese
Magway Sinbaungwe - 7
Magway 2 7
Aunglan - 7
Minbu - 4
Thyet - 5
Bago Pyay 3 20
Paukkaung - 8
Shwedaung - 9
Paungde - 10
Letpadan - 6
Okeshitpin - 8
Nattalin - 8
Magway
Bago
Branch openings
In line with its mission, LBMF’s microfinance model is geared to support the growth and development of small-scale farmers in rural Myanmar through the provision of much- needed financial assistance and business development advice that would enable them to develop stable livelihoods, raise their living standards and overall quality of life. As part of a broader strategy, the Company has also undertaken to improve the level of financial literacy among community stakeholders through grass-root level training and knowledge sharing workshops aimed at developing a strong credit culture
Stability Leadership Strength Agility Responsibility Sustainability Success Supplementary Information

L B Finance PLC | Annual Report 2020/2186
OPERATION IN OVERSEAS
PERFORMANCE REVIEW
2020/21 2019/20 2018/19
Total Equity (Rs. ‘000) 719,116 681,391 358,816
Total Assets (Rs. ‘000) 909,935 895,372 409,431
Income (Rs. ‘000) 164,197 136,811 57,074
Profit After Tax (Rs. ‘000) 4,208 23,805 24,712
ROA 2.37% 6.58% 11.38%
ROE 0.6% 4.58% 9.66%
Lending portfolio (Rs. ‘000) 688,394 554,090 378,680
BUILDING FOR FUTURE
Term Objectives Related strategic focus
Related material drivers
Related stakeholders SDGs impact
GO
ALS
Short term
New customer acquisition to grow the lending portfolio
Medium term
Customer capacity building through regular and ongoing financial literacy programmes
Long term
Adopt advanced technologies in business to drive operational efficiencies and expand the customer base

L B Finance PLC | Annual Report 2020/21 87
C H A P T E R
04Agility
A Responsive Trajectory We continue to respond to external factors, displaying
an inherent agility and adaptability in the face of challenges and change
Our business environment and outlook 88
Delivering our strategy through our business clusters Investing 102 Financing 106 Value Added Services 113
Capital Management Report Financial capital 116 Manufactured capital 144 Human capital 154 Intellectual capital 166 Social and relationship capital 176 Natural capital 196
Management Discussion and Analysis

L B Finance PLC | Annual Report 2020/2188
OUR BUSINESS ENVIRONMENT AND OUTLOOK
Global Economic Highlights
Sri Lankan Economic
Highlights and its Impact
– PESTEL Analysis
Influencing Market Drivers,
Risks and Opportunities
SWOT Analysis
Market Forces and
Competitive Landscape
GLOBAL ECONOMIC HIGHLIGHTS
As COVID-19 continued to spread around the world with rapid escalation of the virus in some countries, the global economy tipped into a recession, the severity of which has not been seen for three quarters of a century. On the back of weak global trade, anemic investment and the collapse of international tourism, the global economy is estimated to have contracted by an unprecedented 4.3% in 2020.
While advanced economies appear to have exhibited a greater degree of resilience to stave off the recessionary pressures, emerging economies seem to have been slipping into a deepening slump as the year progressed. Meanwhile, as corporations around the world began facing the reality of high debt burdens amidst sluggish growth, the strength of the global financial system was put to the test as the balance sheets of banks and financial institutions over the
world came under pressure due to falling profitability and asset quality deterioration. However on a positive note, aggressive policy actions by Central Banks helped to prevent the global financial system from falling into crisis year under review.
Source: Global Economic Prospects - January 2021
SRI LANKAN ECONOMIC HIGHLIGHTS AND ITS IMPACT
PESTEL Analysis
Political
Operating environment
Relative stability on the political front enabled targeted policies to be implemented to help Sri Lanka in overcoming initial pandemic related setbacks and ensure the rapid restoration of normal economic activity. Fiscal policy was reoriented towards supporting the ailing economy. However, pressures on the fiscal sector were aggravated by constrained access to foreign financing in 2020 amidst unfavourable global financial market conditions and downgrades of Sri Lanka’s rating by sovereign rating agencies. Heightened global uncertainties and the
cautious approach adopted by investors towards Foreign Direct Investment (FDI) led to a moderation in the country’s financial account.
Meanwhile subdued inflationary pressures and well-anchored inflation expectations provided the necessary impetus for the Central Bank to significantly relax its monetary policy stance during 2020. Key monetary policy easing measures implemented by the Central Bank in 2020, included the reduction of the key policy interest rates to historic lows with a downward adjustment of 250 basis points
in total, and lowering of the Statutory Reserve Ratio (SRR) applicable on rupee deposit liabilities of Licensed Commercial Banks (LCBs) by a total of 300 basis points and the bank rate by 650 basis points. These monetary policy easing measures were focused on lowering costs of funds for businesses and individuals, ensuring adequate liquidity in the money market and facilitating the smooth functioning of the financial system under the challenging circumstances caused by the pandemic.
Source: CBSL AR 2020

L B Finance PLC | Annual Report 2020/21 89
Impact on the NBFI sector
Backed by the monetary policy easing measures implemented by the Central Bank, the NBFI sector maintained adequate liquidity buffers well above the regulatory minimum levels by end December 2020. The overall regulatory liquid assets available in the sector indicated a surplus of Rs. 89.0 billion as against the stipulated minimum requirement of Rs. 50.7 billion. The Central Bank’s decision to relax the liquid asset requirements also facilitated the sector to escalate the liquidity surplus.
Impact to LBF and the Company’s response
LBF experienced a temporary increase in liquidity levels at the start of the financial year, mainly on account of inability to lend during the lockdown period. However, with the resumption of lending activities on a prudent basis from mid-2020 together with the Company’s robust liquidity management strategy ensured that liquidity levels were well managed and always above the regulatory limits for the remainder of the financial year.
Impact Risk associate
Liquidity risk
Short to medium term strategy
Maintain liquidity levels in-line with regulatory benchmarks
Long-term strategy
Ensure adequate liquidity buffers to meet emergency requirements of customers, if needed
Related strategies Related material matters
Business segment reviews on page 102
High Medium LowH M L
Overnight Liquidity
050
100150200250300350400
Jan
2020
Feb
2020
Mar
202
0
Apr 2
020
May
202
0
Jun
2020
Jul 2
020
Aug
2020
Sep
2020
Oct
202
0
Nov
202
0
Dec
202
0
(Rs.Bn)
Market interest rates declined notably responding to Monetary Easing measures in 2020
Yields on government securities recorded a notable decline during 2020, reflecting the impact of monetary easing
Headline, food and Non-food inflation based on the CCPI (2013=100, YoY)
Weekly AWPR
364 days Treasury Bill Yeild Rate
AWDR
5 year Treasury Bond Yeild Rate
AWLR
End 20199.74%
End 20198.45%
393 bps
340 bps
240 bps
308 bps
330 bps
End 20205.81%
End 20205.05%
Jan 20 Jun 20 Dec 20
Food inflation
Headline inflation
Non-food inflation
Target range
Mar 21
End 20198.20%
End 20199.87%
End 20205.80%
End 20206.79%
End 201913.59%
End 202010.29%
12.4%
5.7%
2.9% 1.8%
4.1%
9.6%
H
Source: CBSL AR 2020
Stability Leadership Strength Agility Responsibility Sustainability Success Supplementary Information

L B Finance PLC | Annual Report 2020/2190
OUR BUSINESS ENVIRONMENT AND OUTLOOK
Economic
Operating environment
Alongside the global economic downturn induced by the pandemic, the Sri Lankan economy contracted by 3.6% in real terms in 2020, recording the deepest recession since independence. Mobility restrictions and other containment measures imposed locally and internationally, with a view to prevent the spread of COVID-19, hampered real economic activities across all sectors. Consequently all sectors of the economy contracted during 2020 - agriculture by 2.4%, industry by 6.9% and services by 1.5% compared to the previous year. Within the services sector, the tourism industry was severely affected by both local and global travel restrictions. A culmination of these factors saw the overall size of the Sri Lankan economy shrink to US dollars 80.7 billion in 2020 from US dollars 84.0
billion in the previous year and per capita GDP to decline to US dollars 3,682 in 2020 from US dollars 3,852 in 2019.
Meanwhile taking into account the difficulties faced by borrowers due to the pandemic, the government declared a debt moratorium to bring relief to COVID-19 affected individuals and businesses. The moratorium which came into effect in April 2020, was to end in September 2020, but was further extended for certain sectors considering the longer recovery period of those sectors affected by the pandemic.
On a positive note, Sri Lanka’s external sector performed reasonably well even amidst COVID-19 related uncertainties, supported by a resilient export sector coupled with timely measures taken by the Government and the Central Bank. After
experiencing a slump at the onset of the pandemic, export earnings rebounded strongly within a relatively short span of time to reach pre-pandemic levels, while measures to curtail non-essential imports (including vehicles), together with the significantly low global petroleum prices, helped to reduce the import expenditure in 2020, leading to a notable reduction in the country’s trade deficit.
Despite pressures experienced during March-April 2020, and in late 2020, significant volatilities in the exchange rate too were prevented thanks to timely interventions by the Central Bank, ensuring that the depreciation of the Sri Lankan rupee against the US dollar was contained at 2.6% in 2020.
Source: CBSL AR 2020
GDP Growth Rate
-20
-15
-10
-5
0
5
10
2015
Q1
Q2
Q3
Q4
(%)
2016
Q1
Q2
Q3
Q4
2017
Q1
Q2
Q3
Q4
2018
Q1
Q2
Q3
Q4
2019
Q1
Q2
Q3
Q4
2020
Q1
Q2
Q3
Q4
Source: CBSL AR 2020
US$ (1.8) Bn US$ (1.1) Bn
Source: CBSL AR 2020

L B Finance PLC | Annual Report 2020/21 91
Impact on the NBFI sector
Lending by the NBFI sector slowed considerably during 2020 as business activities continued to contract amidst the COVID-19 lockdowns and curtailment of vehicle imports. Credit provided by the sector contracted by 5.7 % compared to the contraction of 3.0% in 2019. Consequently, sector assets recorded negative growth of 2.2% during the year reaching Rs. 1,401.6 billion by end December 2020.
Sector-wide asset quality deteriorated significantly in 2020. With the NBFI sectors’ main target market - self employed individuals and MSME’s being among the worst affected pandemic induced economic downturn, the NBFI sector gross NPL ratio shot up to 13.9% by end December 2020 from 10.6 % reported as at end December 2019, showing a severe deterioration in the sector-wide asset quality. It should also be noted that NPLs of the sector could be underestimated due to debt moratorium together with other concessions and NPL levels may increase further after the end of the debt moratorium.
A combination of weak credit growth and higher NPL’s saw the NBFI sector reporting a significant deterioration in profitability for 2020. Net interest income - the key measure of sector profitability declined by 5.3% to Rs.111.2 billion from the figure reported in 2019.
The sector continued to be funded mainly through public deposits in 2020 as well. However, given the muted interest in deposits amidst the record low interest rates, the sectors’ deposit base contracted by 1.1% in 2020 compared to the previous year.
Source: CBSL AR 2020
Impact to LBF and the Company’s response
The inability to lend during the two months lockdown period as well as the CBSL’s decision to ban the import of vehicles, had a sizable impact on LBF’s core auto finance business. However quick action by the Company to reorient its focus towards available opportunities from mid-2020 helped to ensure consistent lending throughout the remainder of the year.
The ambiguity surrounding the announcement of the debt moratoriums caused a spike in the Company NPL’s in the Q1 of the financial year. However, proactive recovery action ensured LBF’s NPL ratio was brought under control by end September 2020 and remained consistent from that point on.
LBF’s performance for the current financial year was also somewhat affected. However, proactive lending along with strict recovery action ensured the Company’s performance was more or less on par with the previous year.
With the low interest rate environment proving to be a deterrent in attracting new deposits, LBF’s deposit mobilization activities were driven primarily with the intention of minimizing the Company’s asset and liability mismatch and also lowering the cost of funds.
Impact Risk associate
Credit risk
Interest rate risk
Short to medium term strategy
Keep satisfactory control of recoveries to minimise the impact at the end of the moratorium
Leverage on market opportunities to pursue organic and inorganic growth
Long-term strategy
Focus on further lowering funding costs
Related strategies Related material matters
MD’s statement on page 37, Business segment reviews on page 102
High Medium LowH M L
H
Stability Leadership Strength Agility Responsibility Sustainability Success Supplementary Information
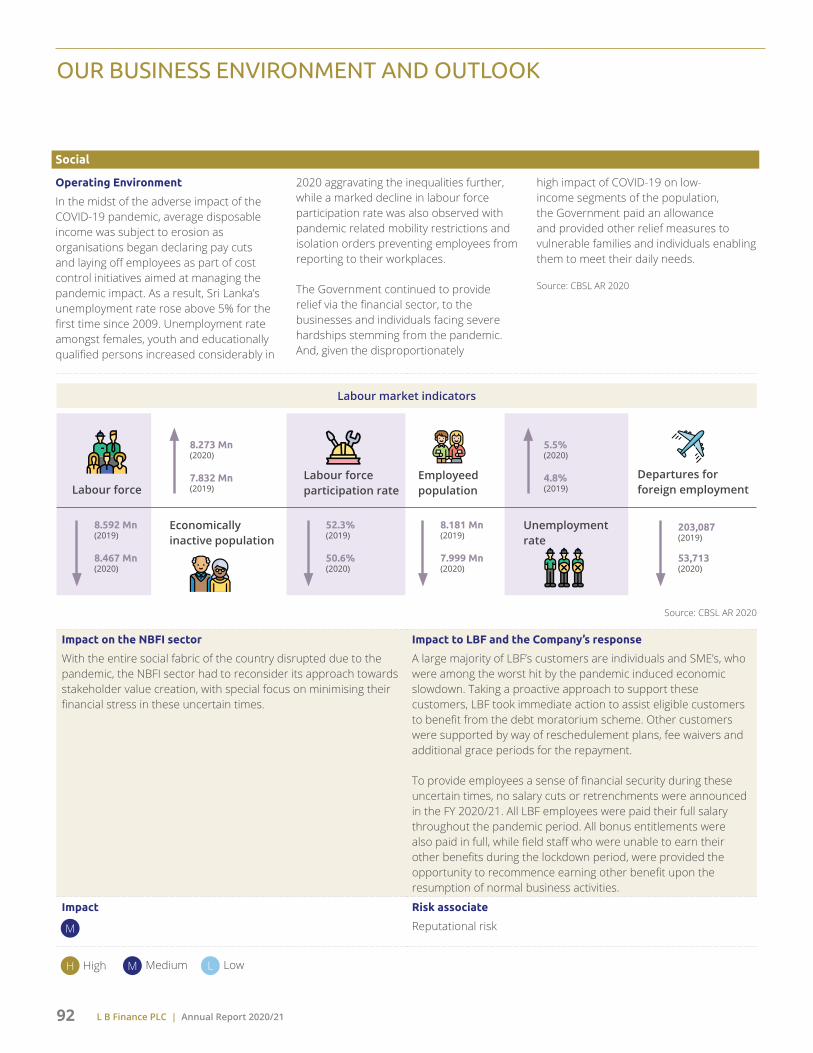
L B Finance PLC | Annual Report 2020/2192
OUR BUSINESS ENVIRONMENT AND OUTLOOK
Social
Operating Environment
In the midst of the adverse impact of the COVID-19 pandemic, average disposable income was subject to erosion as organisations began declaring pay cuts and laying off employees as part of cost control initiatives aimed at managing the pandemic impact. As a result, Sri Lanka’s unemployment rate rose above 5% for the first time since 2009. Unemployment rate amongst females, youth and educationally qualified persons increased considerably in
2020 aggravating the inequalities further, while a marked decline in labour force participation rate was also observed with pandemic related mobility restrictions and isolation orders preventing employees from reporting to their workplaces.
The Government continued to provide relief via the financial sector, to the businesses and individuals facing severe hardships stemming from the pandemic. And, given the disproportionately
high impact of COVID-19 on low-income segments of the population, the Government paid an allowance and provided other relief measures to vulnerable families and individuals enabling them to meet their daily needs.
Source: CBSL AR 2020
Impact on the NBFI sector
With the entire social fabric of the country disrupted due to the pandemic, the NBFI sector had to reconsider its approach towards stakeholder value creation, with special focus on minimising their financial stress in these uncertain times.
Impact to LBF and the Company’s response
A large majority of LBF’s customers are individuals and SME’s, who were among the worst hit by the pandemic induced economic slowdown. Taking a proactive approach to support these customers, LBF took immediate action to assist eligible customers to benefit from the debt moratorium scheme. Other customers were supported by way of reschedulement plans, fee waivers and additional grace periods for the repayment.
To provide employees a sense of financial security during these uncertain times, no salary cuts or retrenchments were announced in the FY 2020/21. All LBF employees were paid their full salary throughout the pandemic period. All bonus entitlements were also paid in full, while field staff who were unable to earn their other benefits during the lockdown period, were provided the opportunity to recommence earning other benefit upon the resumption of normal business activities.
Impact Risk associate
Reputational risk
High Medium LowH M
M
L
Labour market indicators
8.592 Mn(2019)
52.3%(2019)
8.181 Mn(2019)
203,087(2019)
8.273 Mn(2020)
5.5%(2020)
8.467 Mn(2020)
50.6%(2020)
7.999 Mn(2020)
53,713(2020)
7.832 Mn(2019)
4.8%(2019)Labour force
Labour force participation rate
Employeed population
Departures for foreign employment
Economically inactive population
Unemployment rate
Source: CBSL AR 2020

L B Finance PLC | Annual Report 2020/21 93
Technological
Operating environment
During 2020, COVID-19 created an unprecedented change in the lifestyles of people around the world. Demand for traditional goods and services changed significantly with need for Information
Technology related services becoming the top priority. E-commerce became the new norm as merchants who had previously relied on conventional sales through physical outlets quickly adopted online sales platforms. At the same time,
customers also rapidly shifted to online shopping due to lockdowns and travel restrictions imposed to prevent the rapid spread of COVID-19.
Source: CBSL AR 2020
Short to medium term strategy
Develop new technology based solutions tailored to meet the needs of different customer segments
Long-term strategy
Track customer satisfaction and loyalty as a more frequent indicator across business units, channels, product interactions and customer journey moments
Related strategies Related material matters
MD’s statement on page 37, Strategic & resource allocation on page 74, Business segment reviews on page 102, Social and relationship capital on page 176
High Medium LowH M L
Stability Leadership Strength Agility Responsibility Sustainability Success Supplementary Information

L B Finance PLC | Annual Report 2020/2194
OUR BUSINESS ENVIRONMENT AND OUTLOOK
Impact on the NBFI sector
For the NBFI sector, the surge in demand for digital technology was the ideal opportunity to accelerate its digital strategy. Most NBFI’s were seen encouraging their customers to use online financial services to minimise their visits to branches. This resulted in increased usage of online banking websites and mobile banking applications. In yet another interesting development, even those with low levels of IT literacy were seen using these online financial services for their daily needs.
On the other hand, the boom of e-commerce poses a growth threat to information security, including customers’ sensitive data.
Impact to LBF and the Company’s response
As was the case across the industry, LBF too, saw a massive increase in the use of its digital platforms. A total of over one million transactions were channeled through LB CIM, the Company’s wallet application during the FY 2020/21, a 253.78% fold increase compared to the previous year.
As part of its ongoing efforts to build cyber resilience, LBF successfully completed its 3rd consecutive re-certification of the ISO 27001:2013 Information Security Standard for a further three-year period. A comprehensive new due diligence programme was also rolled out during the year in-line with industry best practices set under the IT audit framework by ISACA.
Impact Risk associate
Cyber security risk
Short to medium term strategy
Further strengthen information security architecture by implementing the data protection protocol and by investing in the latest DLP (Data Leakage Prevention) and PAM (Privilege Access Management) software
Long-term strategy
Further enhance the reliability of the BCP model by moving to a cloud-based environment
Related strategies Related material matters
MD’s statement on page 37, Strategic & resource allocation on page 74, Intellectual capital on page 166
Environment
Operating environment
While climate change issues may have taken a back seat in 2020 due to pandemic, such environmental concerns are ongoing both locally and in the global context. In the Global Climate Risk Index 2019, Sri Lanka was ranked 30 out of 180 countries in 2019 and was ranked 23 out of 180 countries in terms of overall performance over the
period 2000 – 2019. While it seems the country has moved out of the 10 most affected countries’ category in the index, climate change related vulnerabilities still persist.
Clear examples include the decline in the country’s forest cover. According to the forest cover assessment survey – 2015
(published in 2020) by the Department of Forest Conservation, the estimated total forest cover of the country was 1,865,671 hectares representing 28.4% of the land in Sri Lanka. The sizable decline from previously noted figures is attributed to population growth and rapid urbanisation in recent years.
Source: CBSL AR 2020
High Medium LowH M L
H

L B Finance PLC | Annual Report 2020/21 95
Impact on the NBFI sector
The most impactful way in which the NBFI sector can contribute towards reducing the country’s climate change risk, is by financing environmentally friendly projects. Many of the large NBFI’s in Sri Lanka have already entered the green lending sphere through products that focus on leasing hybrid vehicles and renewable energy financing
Impact to LBF and the Company’s response
As part of its auto finance business, LBF maintains a special green lending line which offers concessionary terms for the lease of hybrid vehicles and electric vehicles, which are deemed to have a significantly lower carbon footprint compared to traditional diesel or petrol vehicles
Impact Risk associate
Liquidity risk
Short to medium term strategy
Establish greed buildings and digital branches
Process automation
Long-term strategy
Expanded the coverage of green lending line to include renewable energy projects
Related strategies Related material matters
Strategy & resource allocation on page 74, Natural capital on page 196, Business segment reviews on page 102
Legal
Operating environment
The Financial Sector Consolidation Master Plan (FSCMP) was introduced in 2020 to address non-compliance with the
minimum core capital requirement and/or the minimum capital adequacy ratios by NBFI’s. The Central Bank also continued to introduce law reforms to major legislations during the year, key among them
amendments to the Finance Business Act to augment the regulatory and supervisory powers on non-bank financial institutions.
Source: CBSL AR 2020
Impact on the NBFI sector
The FSCMP and the revisions to the Finance Business Act are primarily aimed at maintaining the stability of NBFI’s in order to safeguard the interest of depositors, thereby enhancing the overall credibility of the sector as a whole
Impact to LBF and the Company’s response
LBF has always been a keen proponent of early adoption of regulations. In this year too, the Company continued to review and reorient itself to take cognizance of the latest regulatory developments as well as proposed changes come into effect in due course
Impact Risk associate
Liquidity risk
Short to medium term strategy
Maintain liquidity levels in line with regulatory benchmarks
Long-term strategy
Early adapted the new regulations which are imposed by the regulatory bodies
Related strategies Related material matters
MD’s statement on page 37, Strategy & resource allocation on page 74
High Medium LowH
H
M L
L
Stability Leadership Strength Agility Responsibility Sustainability Success Supplementary Information

L B Finance PLC | Annual Report 2020/2196
OUR BUSINESS ENVIRONMENT AND OUTLOOK
INFLUENCING MARKET DRIVERS, RISKS AND OPPORTUNITIES
There are a number of distinct factors that are shaping the financial services industry now and will continue to do so into the future. Linked to these market drivers are risks and opportunities, both general to
the external environment and a number that are specific to LBF. These are actively assessed and appropriate responses implemented, with the performance monitored both against our strategic
ambitions as well as through our principal and key risks as defined in our Risk Management Framework. Read more about on our Risk Management Report.
Competition and technological changeIncreasing competition, technology and the pace of change, impacts our ability to remain relevant to our customers as well as our competitiveness and the associated operational risk
LBF context
Launch L B finance CIM (Cash In Mobile) digital wallet to engage our customers to digital transactions
Market drivers
Disruption through new digitally-led competitor platforms which have the capacity to influence customer preferences
The need for threat detection software to safeguard against security breaches, and the possibility of data leakage
Ever increasing sophistication of cybercrime, fraud risk and financial crime requires continuous monitoring and ongoing investment to protect customers and the Group
Opportunities
Focus on creating innovative products and solutions to cater to maintain top of mind recall across a broader spectrum of customer segments
Leveraging on AI tools to strengthen resilience and protect against cyber crime
Key risks
Reputational risk (specifically brand risk) and people risk
Mitigation activities
Ongoing employee education on the prevention of cyber related risks
Ongoing investment in technology platforms, processes and controls including monitoring
Regulatory oversightNew and emerging regulations impact on our operations as well as our products and services
LBF context
Early adapted the new regulations which are imposed by the regulatory bodies
Market drivers
The increasing pace and evolving complexity of regulatory and statutory requirements across the Group’s operation
Opportunities
Maintaining a coordinated, comprehensive and forward-looking approach to evaluate regulatory change and respond through early adoption
Key risks
Market risk
Mitigation activities
Participating in regulatory and statutory advocacy groups across all stakeholder groups

L B Finance PLC | Annual Report 2020/21 97
Focus on social, governance and environmental mattersSocial and climate change risk impact on the Group, its customers and other stakeholders
LBF context
Promoting corporate social initiatives within the organization and outside the organization
Market drivers
Persistent inequality, increasing activism as well as emerging regulation and reporting requirements focused on a broader range of ESG (Environmental, Social and Governance) matters
Adverse weather conditions resulting in extreme environmental events (e.g. floods) impacting community sustainability
Opportunities
Engaging internally and with external stakeholders through Group-wide strategic sustainability programmes, to understand and assess impacts and opportunities on the Group, for customers and other stakeholders
Engaging with communities and supporting initiatives as part of the Group’s commitment to play a role in society
Key risks
Credit risk
Mitigation activities
Continuously assessing the suitability and strategic alignment of products and customer value propositions against changing environmental factors and the impact on the Group’s risk profile
Macroeconomic, socio and political fluxThe macroeconomic environment impacts on our ability to sustain business and achieve our strategic objectives while the social and political environments impact on our ability to deliver on stakeholder commitments
LBF context
Provide highest contribution to the economy in numerous ways
Market drivers
Increasing cost and scarcity of capital, funding and liquidity across Sri Lankan and global markets
Subdued economic growth, high unemployment, increased inequality and low business and consumer confidence impacting the Sri Lankan economy
Opportunities
Strengthening the Group’s position in key growth markets while seeking opportunities to diversify into new markets
Key risks
Political risk
Mitigation activities
Monitoring and managing risk strategy and appetite based on the ongoing evaluation of global and Sri Lankan developments to identify and mitigate risks as they arise, while enabling business to pursue opportunities
Stability Leadership Strength Agility Responsibility Sustainability Success Supplementary Information
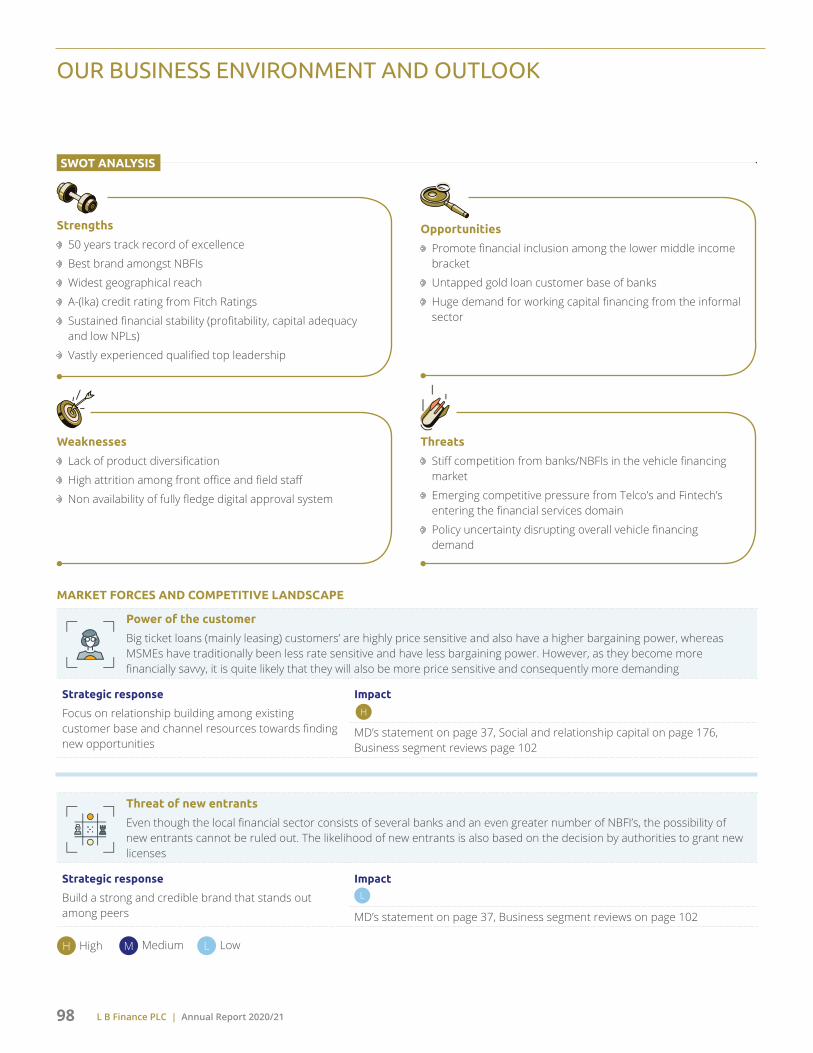
L B Finance PLC | Annual Report 2020/2198
OUR BUSINESS ENVIRONMENT AND OUTLOOK
Strengths
50 years track record of excellence
Best brand amongst NBFIs
Widest geographical reach
A-(lka) credit rating from Fitch Ratings
Sustained financial stability (profitability, capital adequacy and low NPLs)
Vastly experienced qualified top leadership
Weaknesses
Lack of product diversification
High attrition among front office and field staff
Non availability of fully fledge digital approval system
Opportunities
Promote financial inclusion among the lower middle income bracket
Untapped gold loan customer base of banks
Huge demand for working capital financing from the informal sector
Threats
Stiff competition from banks/NBFIs in the vehicle financing market
Emerging competitive pressure from Telco’s and Fintech’s entering the financial services domain
Policy uncertainty disrupting overall vehicle financing demand
SWOT ANALYSIS
MARKET FORCES AND COMPETITIVE LANDSCAPE
Power of the customer
Big ticket loans (mainly leasing) customers’ are highly price sensitive and also have a higher bargaining power, whereas MSMEs have traditionally been less rate sensitive and have less bargaining power. However, as they become more financially savvy, it is quite likely that they will also be more price sensitive and consequently more demanding
Strategic response
Focus on relationship building among existing customer base and channel resources towards finding new opportunities
Impact
MD’s statement on page 37, Social and relationship capital on page 176, Business segment reviews page 102
Threat of new entrants
Even though the local financial sector consists of several banks and an even greater number of NBFI’s, the possibility of new entrants cannot be ruled out. The likelihood of new entrants is also based on the decision by authorities to grant new licenses
Strategic response
Build a strong and credible brand that stands out among peers
Impact
MD’s statement on page 37, Business segment reviews on page 102
High Medium LowH
H
M L

L B Finance PLC | Annual Report 2020/21 99
High Medium Low
Competitive rivalry
Number of competitors
The financial sector of Sri Lanka consists of 33 banks and 43 NBFI’s operating in the space
Switching cost
The switching cost for a customer is low due to a high concentration of service providers
Customer loyalty
Traditionally Sri Lankan customers have been reasonably loyal; however, competitive tactics among entities have greatly reduced loyalty levels especially across high net worth customer segments
Strategic response
Improve product mix, customer service and process efficiency to attract and retain customers. Explore new ways of delivering value and innovative means of utilising existing resources to extend our range of offerings
Impact
MD’s statement on page 37, Social and relationship capital on page 176, Business segment reviews on page 102
Power of the business partners
As a financial institution, our major suppliers comprise of support services. Given that they only provide support services, the bargaining power of business partners are low
Strategic response
Focus on a diversified pool of support service providers to reduce risk of over- dependence on any specific group of service providers
Impact
Social and relationship capital on page 176, Business segment reviews on page 102
Threat of substitute products
Low threat within the NBFI Industry. However, if we consider loan and leasing products from banks and the leasing companies as substitute products, then the threat is high. Additionally, for some segments, there exists a high threat of substitute products; for instance, in vehicle loans where some of the vehicle suppliers themselves offer the vehicles in installments, removing the need of getting a financier involved. There is a material threat in the medium and long run, with the potential for innovating alternative ways of creating value in meeting lending needs of businesses and individuals
Strategic response
Stay updated with industry best practices and new opportunities offered through technology and incentives
Impact
Social and relationship capital on page 176, Business segment reviews on page 102
Stability Leadership Strength Agility Responsibility Sustainability Success Supplementary Information

L B Finance PLC | Annual Report 2020/21100
OUR BUSINESS ENVIRONMENT AND OUTLOOK
TACKLING COVID-19
Actions taken Future actions
Introduced the WFH (Work-from-home) model at the onset of the two months island-wide lockdown in compliance with mandatory stay at home orders by the government
Implemented innovative IT solutions to support the WFH model
Virtual and online platform to ensure proper credit assessment even during the lockdown
Online knowledge sharing sessions were arranged between directors to share their business insight and awareness regarding industry trends
Increased focus on liquidity management to bring relief to customers
Providing digital solutions to customers
Focused on safeguarding the LBFs’ wellbeing of employees operating through the WFH model
Continue prioritization of the health and safety of employees
Enable customers to receive real time transaction updates via App based solution
Invest in improving digital ecosystems with a view to enhancing customer convenience
Maintain a strong liquidity buffers to support the emergency requirements of customers if needed
PANDEMIC INDUCED TRENDS AMONG GLOBAL BANKS AND FINANCIAL INSTITUTIONS
Focus on the digital customer experience
The year 2020 will go down in history as the turning point for the digital revolution, especially in the financial services industry. Banks and financial institutions everywhere were seen clamouring to deliver their products and services via digital channels to support customers who were unable to access physical branches due to strict economic lockdowns and other COVID-19 related mobility restrictions. Online platforms, wallet apps, credit/debit cards and other digital-enabled mediums became the mainstay of the global financial sector in 2020 amidst the biggest ever digital migration that saw all customer
segments from youth, millennials to the generation X and even retirees all embraced digital financial solutions as part of the new normal lifestyle.
Use of AI based tools to strengthen MIS
AI tools became a game changer in past years especially for financial institutions, in the face of deteriorating asset quality were searching for more preemptive solutions to boost their decision making capability. AI based predictive analytics in particular gathered momentum as a vital source to support recovery action and strengthen liquidity management processes.
Information security risk due to the reliance on the WFH (Work-from-home) model
With no option but to direct most of its employees to work from home, financial institutions were faced with the risk of internal system breaches as well the exposure to external cyber attacks. Unlike at any time in the past, financial institutions were seen increasing their investment in building their information security architecture to safeguard against both internal data leakages and protect their information security assets from being exposed to external cyber attacks.
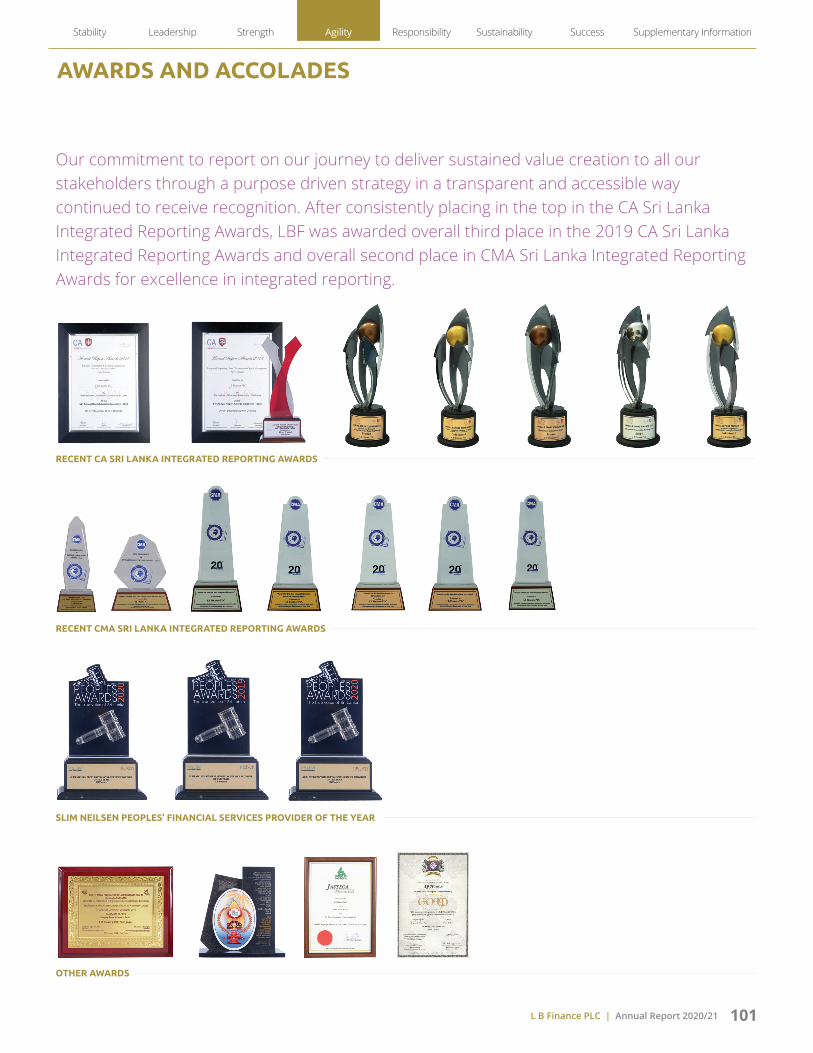
L B Finance PLC | Annual Report 2020/21 101
AWARDS AND ACCOLADES
Our commitment to report on our journey to deliver sustained value creation to all our stakeholders through a purpose driven strategy in a transparent and accessible way continued to receive recognition. After consistently placing in the top in the CA Sri Lanka Integrated Reporting Awards, LBF was awarded overall third place in the 2019 CA Sri Lanka Integrated Reporting Awards and overall second place in CMA Sri Lanka Integrated Reporting Awards for excellence in integrated reporting.
RECENT CA SRI LANKA INTEGRATED REPORTING AWARDS
RECENT CMA SRI LANKA INTEGRATED REPORTING AWARDS
SLIM NEILSEN PEOPLES’ FINANCIAL SERVICES PROVIDER OF THE YEAR
OTHER AWARDS
Stability Leadership Strength Agility Responsibility Sustainability Success Supplementary Information

L B Finance PLC | Annual Report 2020/21102
DELIVERING OUR STRATEGY THROUGH OUR BUSINESS CLUSTERS
INVESTING SAFE PLACE TO SAVE AND INVEST YOUR MONEY
In light of the pandemic induced economic uncertainty, our deposit mobilization activities for the FY 2020/21 were driven primarily with the intention of minimizing the Company’s asset and liability mismatch as well as to lower the cost of funds.
While our efforts for the year were focused predominantly on customer retention, we did nonetheless take some measured steps to broad our deposit base. We also took advantage of the prevailing low interest rate environment, to reinforce our savings franchise.
Mr. Niroshan UdageDeputy Managing Director
Core competencies
A diverse range of highly customer centric products
Convenient process for deposit account opening any one of LBF’s 152 branches across the country
Additional support including greater flexibility and improved visibility through the CIM wallet
Strengths
Having over 50 years of experience in the marketplace, track record as a responsible, stable, proactive and customer-focused financial service provider in investment products and services segment
Weaknesses
Non-availability of a fully integrated process capability to facilitate seamless end-to-end solutions for the customer
Opportunities
Ability to promote financial inclusion through the release of targeted solutions, including alternative channels
Threats
Increased pressures from competitors who resort to price wars and other unethical business practices
Product offerings
SWOT ANALYSIS
RESPONDING TO COVID–19
Actions taken For next financial years
Online service portal was developed to provide our customers all necessary services from the safety of their homes
Focus on creating more online channels and modules for depositors by leveraging technology to minimize the need for physical interactions
Work from home facility from the beginning of pandemic to ensure the interact with the customers in safety manner
Explore and expand in less crowded customer segment and geographical locations
Fixed deposits
Salary plan
Savings
Minor savings

L B Finance PLC | Annual Report 2020/21 103
BUSINESS PERFORMANCE
Indicator 2016/17 2017/18 2018/19 2019/20 2020/21
Growth in customer base (deposit) (%) 27.16 18.25 13.48 13.48 3.52
ATM transaction growth (%) 6.57 4.13 4.98 (12.26) 6.76
CIM wallet transaction growth (%) - - - - 253.78
DEPOSITS
Offering competitive interest rates and a broad range of tenure options, LBF’s term deposits cater to all segments of the market. Similarly, LBF’s savings proposition too serves all main segments of the market.
Depositbase mix(%)
FDSavings
4.80
95.20
Deposit base
0
20,000
40,000
60,000
80,000
100,000(Rs.Mn)
FDSavings
2018
2017
2019
2020
2021
Fixed deposit
It was a tough year for mobilising deposits, especially with the investing public showing great reluctance to tie up their funds in fixed deposits, in light of the economic uncertainty triggered by the COVID-19 pandemic. Furthermore, with deposits perceived as a less attractive investments option in a low interest rate environment, many high networth investors were seen diverting their funds towards more lucrative avenues of investment.
Amidst this backdrop, LBF’s deposit mobilization activities were driven primarily with the intention of maintain proper assets, liability ratio and lowering the cost of funds.
Taking a strategic approach to consolidate the deposit base, customer retention was declared the key priority for the year. While no specific promotional activities were conducted in this regard, a mass media campaign on LBF’s long standing reputation and credibility over the past 50 years, was run a campaign to create top of mind awareness and thereby encourage customers to retain their deposit with the Company.
Impact on LBF’s Risk Profile Liquidity Risk (H)
Refer Risk Management Report on page 241
Taking a cue from the low interest rate environment, strong emphasis was also placed on capturing a larger number of smaller ticket retail deposits to help stabilise the deposit base over the long term. At the same time it was decided to allow high cost term deposits to move out on maturity.
Tenure wise FD mix (%)
17.96
50.28
18.03
13.73
1 - 6 months7 -12 months13 - 24 months25 - 60 months
DELIVERING OUR STRATEGY THROUGH OUR BUSINESS CLUSTERS
Stability Leadership Strength Agility Responsibility Sustainability Success Supplementary Information

L B Finance PLC | Annual Report 2020/21104
DELIVERING OUR STRATEGY THROUGH OUR BUSINESS CLUSTERS
Investing
Amount wise fixeddeposit mix (volume) (%)
Rs 5000 - 100,000Rs 100,001 - 500,000Rs 500,001 - 1,000,000Rs 1,000,001 - 5,000,000Above Rs. 5,000,000
10.571.05
14.11
41.52
32.76
2021
Province wise fixeddeposit base (%)
WesternSouthernSabaragamuwaUvaCentral
82.31
3.721.17
0.675.75
0.810.56 3.011.992021
North CentralEasternNorth westernNorthern
FD renewal ratio
50
60
70
80
90
100
(%)
Apr-
20M
ay-2
0Ju
n-20
Jul-2
0Au
g-20
Sep-
20O
ct-2
0N
ov-2
0D
ec-2
0Ja
n-21
Feb-
21M
ar-2
1
Savings
Prompted by the marginal gap between the savings and FD rates for much of 2020 and the uncertain economic scenario, many retail investors appeared to show a strong inclination to retain funds in the form of savings. Having identified this trend very early on, LBF took swift action to encourage customers to convert their FDs to the savings format. In parallel, the LB CIM wallet application was also upgraded to improve functionality in order to give savings customers greater visibility and control over their day to day financial position.
A strong push was also made to grow its savings base through new customer acquisitions. To support this endeavor, a highly focused banner campaign was rolled out on all social media platforms in 2020, followed by a series of broad based digital marketing initiatives aimed at promoting LBF’s mainstream savings proposition.
Performance outcome
LBF overall portfolio recorded a year on year decline of 3.81%, which was only to be expected given the depressed market conditions during the FY 2020/21. On a positive note however, aggressive efforts to promote savings appear to have paid off as evidenced by the shift in the deposit mix for the year which indicates a greater skew towards savings.
ATM transactions
0
50,000
100,000
150,000
200,000
2019
2018
2020
2021
(No.) (Rs.Mn)
0
300
600
900
1,200
1,500
No. of transactions Value of transactions (Rs.)
CIM wallet transactions
0100200300400500600700800
020,00040,00060,00080,000
100,000120,000140,000160,000
Apr 2
020
May
202
0
Jun
2020
Jul 2
020
Aug
2020
Sep
2020
Oct
202
0
Nov
202
0
Dec
202
0
Jan
2021
Feb
2021
Mar
202
1
(No.)(Rs.Mn)
Total value (Rs.) No. of transactions

L B Finance PLC | Annual Report 2020/21 105
BUILDING FOR FUTURE
Term Objectives Related strategic focus
Related material drivers
Related stakeholders SDGs impact
GO
ALS
Short term
Digitalization of deposit products under the LB CIM digital wallet
Medium term
Explore alternative channels to on-board customers
Long term
Interactive digital platform to facilitate real time customer engagement
Developing your savings habit with us
Outlook for the future
Given that the low interest rate environment is likely to continue for the foreseeable future, LBF’s deposit mobilization strategy will remain more or less unchanged. Going forward, the Company will focus on further strengthening its retention ratio, while strategically pursuing opportunities to secure lower the cost of funding via the FD proposition. As always building up the savings base will also be a key priority in the years ahead. In this regard LBF will strive for differentiation through structured savings products coupled with advanced technology-based solutions to secure a definite competitive advantage over peers.
Reason to start investing young Cultivate your habit of saving money 5 Timeless rules about saving money
Stability Leadership Strength Agility Responsibility Sustainability Success Supplementary Information

L B Finance PLC | Annual Report 2020/21106
FINANCING BEST PLACE TO OBTAIN FINANCING FACILITIES
With the economic crisis that arose on the back of the COVID-19 pandemic setting the backdrop for the year, the entire financial services sector found itself challenged by the sluggish credit appetite in the market. Not willing to let this scenario define LBF’s prospects for the FY 2020/21, the Company’s lending teams swung into action in a bid to seize available opportunities in the market.
Tactical strategies were deployed with the aim of retaining LBF’s captive market in the auto finance segment - the Company’s core business.
Mr. Ravindra YatawaraExecutive Director
Strengths
Strong physical and digital presence and the diverse product portfolio coupled with the Company’s long standing reputation for service excellence provides a clear competitive advantage over peers
Weaknesses
Non-availability of a fully integrated process capability to facilitate seamless end-to-end customer relationship management
Opportunities
Increased automation and digitization to enhance the customer experience
Threats
Unscrupulous behaviour by some NBFI’s could tarnish the reputation of the sector as a whole
DELIVERING OUR STRATEGY THROUGH OUR BUSINESS CLUSTERS
Core competencies
A diverse product suite to cater all customer segments
Flexible and tailored solutions to match customer needs
Robust multi channels environment for convenient access
Best in-class service that includes guaranteed quick turnaround times and continuous support
SWOT ANALYSIS
RESPONDING TO COVID – 19
Actions taken For next financial years
Implemented innovative IT solutions, which facilitated all employees to work from home
Close monitoring of customers who have been highly affected by pandemic
Virtual customer visit to ensure proper credit assessment even during the lockdown
There is a chance that the pandemic would have a slow effect on customer sales and subsequent cash flows. Special consideration must be given to those companies and their potential cash flows in order to retain a stable asset portfolio
Ensuring the readiness of the company to completely operate virtually in case of any pandemic situation where physical movement might be restricted
Launch online onboarding for customers
Product offerings

L B Finance PLC | Annual Report 2020/21 107
BUSINESS PERFORMANCE
Portfolio growth (%) 2016/17 2017/18 2018/19 2019/20 2020/21
Lease 28.70 13.62 6.01 (8.18) (21.88)
Vehicle loan (17.95) (3.10) 40.91 107.63 40.55
Mortgage loan 66.75 12.49 (10.56) (18.15) (28.85)
Personal loan 173.24 190.57 38.76 29.09 6.44
FD loan 37.56 34.94 10.69 15.98 (10.10)
Power draft 45.52 25.54 38.50 4.33 0.59
Gold loan 23.84 23.61 27.89 20.02 17.32
Other (21.74) (42.78) (58.55) (48.57) (8.13)
AUTO FINANCE
The year under review was a challenging one for LBF’s auto finance business. Despite myriad challenges presented by the COVID-19 pandemic, focused strategies and early actions to capitalise market opportunities enabled the auto finance business to register satisfactory for the FY 2020/21.
The two months island-wide lockdown period declared by the government at the onset of the COVID-19 pandemic in Sri Lanka made the Q1 of the current financial year particularly tough for LBF’s auto finance business. With the entire country under curfew orders and many sectors forced to shut down, there was very little opportunity to grow the leasing business during this period. Around the same time, LBF also began seeing higher NPLs purely because customers found it difficult to meet their repayment obligations due to ongoing mobility restrictions in place. Taking immediate actions to bring the situation under control, LBF intensified recovery efforts during the lockdown period with all branch teams being mobilised to lend support to the recoveries unit and call centre. Continuing to maintain a focus on recoveries, after giving consideration to moratorium requests even after lockdown restrictions were lifted enabled LBF to gradually lower the NPL ratio.
Furthermore, with the demand for unregistered vehicles disappearing virtually overnight after the announcement of the vehicle import ban, the auto finance unit moved swiftly to seize available opportunities in the registered vehicle market. Despite this change in market dynamics, it was resolved to work towards achieving pre-COVID volume targets set for the year under review. Consequently a tactical realignment of the marketing strategy saw a broad based promotional campaign being rolled out from May 2020 onwards aimed at expanding the Company’s registered vehicle finance portfolio. As part of this same effort, a series of dealer engagement activities were also carried out to strengthen ties with dealer networks. These well timed initiatives coupled with strategic repricing to reflect the low interest environment that prevailed throughout the year, helped drive a month-on-month improvement in auto finance volumes from Q2 onwards. Notably while a slight volume drop was seen in the aftermath of Sri Lanka’s COVID-19 second wave in October 2020, this proved to be only a temporary setback as consistent volume growth was registered thereafter. With the trend continuing until end March 2021, LBF’s auto finance unit succeeded in achieving the pre-COVID leasing targets for the current financial year.
Impact on LBF’s Risk Profile Credit Risk (H)
Liquidity Risk (M)Refer Risk Management Report
Key macroeconomic challenges
COVID-19 pandemic impact
Ongoing tightening of LTV rules
Additional regulatory controls to restrict import of vehicles
Currency depreciation
Poor performance of certain key sectors leading to weak economic conditions
LB Auto Finance
Stability Leadership Strength Agility Responsibility Sustainability Success Supplementary Information
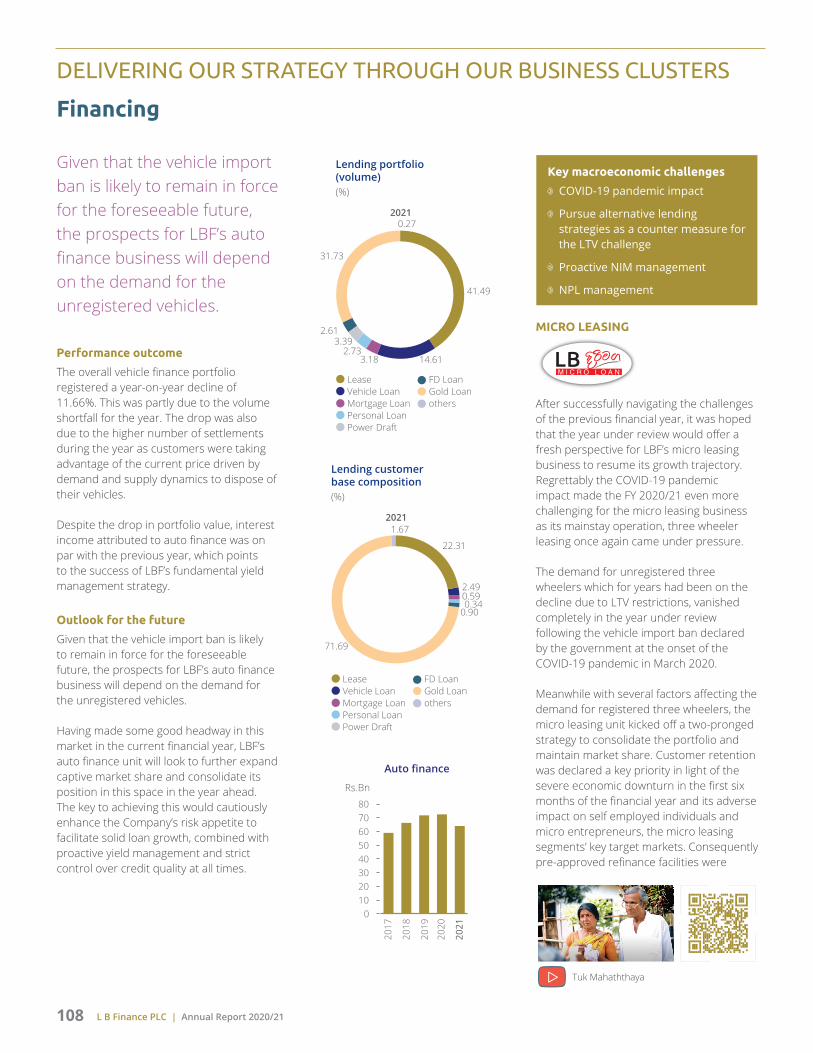
L B Finance PLC | Annual Report 2020/21108
Performance outcome
The overall vehicle finance portfolio registered a year-on-year decline of 11.66%. This was partly due to the volume shortfall for the year. The drop was also due to the higher number of settlements during the year as customers were taking advantage of the current price driven by demand and supply dynamics to dispose of their vehicles.
Despite the drop in portfolio value, interest income attributed to auto finance was on par with the previous year, which points to the success of LBF’s fundamental yield management strategy.
Outlook for the future
Given that the vehicle import ban is likely to remain in force for the foreseeable future, the prospects for LBF’s auto finance business will depend on the demand for the unregistered vehicles.
Having made some good headway in this market in the current financial year, LBF’s auto finance unit will look to further expand captive market share and consolidate its position in this space in the year ahead. The key to achieving this would cautiously enhance the Company’s risk appetite to facilitate solid loan growth, combined with proactive yield management and strict control over credit quality at all times.
Lending portfolio (volume)(%)
LeaseVehicle LoanMortgage LoanPersonal LoanPower Draft
FD LoanGold Loanothers
41.49
14.613.182.73
3.392.61
31.73
0.272021
Lending customerbase composition (%)
LeaseVehicle LoanMortgage LoanPersonal LoanPower Draft
FD LoanGold Loanothers
22.31
2.490.590.34
0.90
71.69
1.672021
Auto finance
01020304050607080
2018
2017
2019
2020
2021
Rs.Bn
MICRO LEASING
After successfully navigating the challenges of the previous financial year, it was hoped that the year under review would offer a fresh perspective for LBF’s micro leasing business to resume its growth trajectory. Regrettably the COVID-19 pandemic impact made the FY 2020/21 even more challenging for the micro leasing business as its mainstay operation, three wheeler leasing once again came under pressure.
The demand for unregistered three wheelers which for years had been on the decline due to LTV restrictions, vanished completely in the year under review following the vehicle import ban declared by the government at the onset of the COVID-19 pandemic in March 2020.
Meanwhile with several factors affecting the demand for registered three wheelers, the micro leasing unit kicked off a two-pronged strategy to consolidate the portfolio and maintain market share. Customer retention was declared a key priority in light of the severe economic downturn in the first six months of the financial year and its adverse impact on self employed individuals and micro entrepreneurs, the micro leasing segments’ key target markets. Consequently pre-approved refinance facilities were
Key macroeconomic challenges
COVID-19 pandemic impact
Pursue alternative lending strategies as a counter measure for the LTV challenge
Proactive NIM management
NPL management
DELIVERING OUR STRATEGY THROUGH OUR BUSINESS CLUSTERS
Financing
Given that the vehicle import ban is likely to remain in force for the foreseeable future, the prospects for LBF’s auto finance business will depend on the demand for the unregistered vehicles.
Tuk Mahaththaya

L B Finance PLC | Annual Report 2020/21 109
offered to existing customers to help them tide over the difficult times. Eligible customers were also given the opportunity to benefit from the debt moratorium scheme announced by the government to bring relief to COVID-19 affected individuals and businesses. At the same time recovery actions were strengthened in bid to minimize NPL’s among customers who were not eligible for the moratorium.
The demand for registered three wheelers remained sluggish in the second half of the year as well. This was primarily due to the higher LTV requirements associated with the upward movement in the market price of registered three wheelers. The price of registered three wheelers increased immediately following the government decision to indefinitely extend the import ban, effectively halting the import of unregistered three wheelers for the foreseeable future.
Faced with these multiple challenges, LBF’s micro leasing operation refreshed its rate structures and rolled out several focused campaigns to appeal to the target market. This was followed by “Tuk Mahaththaya”, a social media awareness campaign launched in 2020 across all digital platforms, with the aim of further expanding the customer base. Dealer promotional activities also continued throughout the year.
Performance outcome
Micro leasingportfolio
0
5,000,000
10,000,000
15,000,000
20,000,000
2018
2017
2019
2020
2021
(Rs. ‘000)
Three wheeler UnregisteredThree wheeler RegisteredMotor Bicycles
Micro leasing customerbase composition (%)
9.84
84.57
5.592021
Three wheeler UnregisteredThree wheeler RegisteredMotor Bicycles
Outlook for the future
The micro leasing segment will move forward based on the assumption that the import ban will remain in place for at least the next twelve months. Amidst this backdrop it would be imperative for the segment to improve the competitiveness of its offering in order to target the broader island-wide market for registered three wheelers.
GOLD LOAN
LBF’s gold loan business recorded good results for the FY 2020/21, despite facing some notable challenges at the start of the year - Q1 in particular, where the opportunity to generate new business was lost due to the two months island-wide lockdown.
However, moving swiftly to take advantage of the high world gold prices and the low interest rate environment, LBF gold loan
business was able to significantly accelerate its growth trajectory from Q2 onwards. Given the consistently high demand for gold loans throughout the year, LBF took wide ranging action to secure a competitive advantage. Seeing a strong demand for gold loans from all market segments, LB Gold, a new high value gold loan offering was launched several times in 2020.
At the same time promotional activities were stepped up. Prevented from conducting face to face campaigns due to COVID-19 restrictions, island-wide promotional activities were done mostly with the use of the mobile propaganda vehicle. A sizable portion of the activities were also moved to digital mediums, a move that has helped LBF to make inroads into yet untapped market segments.
A concerted effort was also made to strengthen LBF’s island-wide gold loan footprint, which saw new branches being opened to deepen the presence. Four branches were relocated to bring greater visibility in the areas. The ongoing counter expansion programme was also rolled out across more branches in the year under review.
Performance outcome
Despite the fact that no new business was generated during the two months lockdown period, overall volume targets for the year were successfully met, enabling the gold loan portfolio to even record a slight year on year growth of 17.32%. The customer base too grew compared to the previous year.
Gold loan portfoliogrowth
0
5
10
15
20
25
30
(%)
2018
2017
2019
2020
2021
Key macroeconomic challenges
COVID-19 pandemic impact
Movements in world gold prices
Tough competition in the market
Stability Leadership Strength Agility Responsibility Sustainability Success Supplementary Information

L B Finance PLC | Annual Report 2020/21110
Outlook for the future
As it stands now, the short term outlook for LBF’s gold loan operation appears to indicate the potential for solid growth over the next 6 -12 months. However, given that the prospects of the gold loan operation remains largely predicted on the movement in world gold prices, LBF will continue to exercise greater vigilance to proactively realign its strategy and safeguard the gold loan portfolio against adverse price movements in the months ahead.
MORTGAGE LOAN
LBF’s mortgage loan portfolio consists of lending through the “Mul Gala” product. “Mul Gala” which is essentially a consumption loan, designed to facilitate the home improvement needs of customers. In recent times, it has also been promoted as an easily accessible working capital loan for self-employed individuals and micro entrepreneurs. The mortgage loan product suite was further expanded in mid-2019 with the introduction of the mortgage-backed educational loan.
The COVID-19 pandemic impacted the mortgage loan portfolio in multiple ways, starting with the sharp increase in NPL’s owing to the widespread economic uncertainty. Moreover the market demand for “Mul Gala’’ more or less disappeared during the two months lockdown period. Demand stayed muted for the remainder of the year as well amidst a visible lack of interest in construction activity after the second wave of the pandemic in October 2020.
Nonetheless taking advantage of the prevailing low interest rates, promotional activities were accelerated on digital mediums in a bid to stimulate demand for the “Mul Gala” product. While the campaign succeeded in generating notable interest for the product, LBF continued to face practical challenges due to restricted operations across many regulatory bodies. Processing delays of this nature meant conversion was at a much slower pace than usual, which in turn affected overall portfolio growth during the year.
After showing promising results following its launch in 2019, the demand for the mortgage-backed educational loan also fizzled out due to pandemic related challenges in the year under review.
Performance outcome
The mortgage loan portfolio recorded a year-on-year decline of 28.85%
Outlook for the future
As the economic environment regains a sense of normalcy over the coming months, construction activity is thought to be one of the first to restart. This scenario presents some clear opportunities for the mortgage loan operation to drive growth of its “Mul Gala” product in the FY 2021/22.
PERSONAL LOANS
It was a highly successful year for LBF’s personal loan operation, which reported solid growth on the back of a compelling demand for its core product the “Krutha Hastha‘’ pension loan offered to senior citizens. The robust demand for pension loans in the current financial year was attributed to the nature of the product which makes it a highly practical and manageable borrowing proposition during uncertain economic conditions.
Taking preemptive action to combat emerging competitive pressure in this growth conducive environment, LBF initiated a series of targeted promotional campaigns to make inroads into several untapped market segments. The main aim of these focused efforts was to enable LBF‘s “Krutha Hastha” pension loan product to claim first mover advantage among these segments. These promotional strategies were further supported by extensive training to enhance product knowledge of frontline branch teams.
Improvements to backend systems were also expedited, with steps being taken to introduce a greater degree of automation to reduce procedural complexity and improve the efficiency of end-to-end processes, leading to faster service delivery.
Key macroeconomic challenges
COVID-19 pandemic impact
Rising trend in interest rates
Regulatory controls
Poor performance of certain key sectors leading to weak economic conditions
Key macroeconomic challenges
COVID-19 pandemic impact
Competition among peers
Regulatory controls
DELIVERING OUR STRATEGY THROUGH OUR BUSINESS CLUSTERS
Financing
LB Gold loan – Supreme, speedy and courteous service

L B Finance PLC | Annual Report 2020/21 111
Performance outcome
Quick action to capitalize on the market demand led to an incremental growth in the monthly volumes. On this basis LBF’s personal loan portfolio as at 31st March 2021, succeeded in registering a commendable 6.44% year on year growth over the previous year. Similarly the customer base too reported growth compared to the previous year.
Outlook for the future
Going forward LBF will seek to further build on the success of this past year to ensure the “Krutha Hastha’’ pension loan product can make a steady contribution to the Company’s performance. Strengthening island-wide product coverage is seen as the key catalyst in achieving these objectives.
FACTORING
LBF offers flexible, tailor-made factoring solutions catering mainly to the SME sector by offering cheque and invoice discounting facility at very competitive rates. The key differentiator that sets apart LBF’s factoring solution is the Company’s undertaking to follow up debtor collections, thereby freeing the customer to focus entirely on executing their business plans. Despite stiff competition from the banking sector, LBF’s factoring solutions continue to experience a strong market uptake especially in the Western Province.
Given the challenging economic environment, no aggressive promotional activities were carried out in the year under review. Instead all efforts were focused on managing the existing portfolio, with specific control policies being implemented to minimise LBF’s risk exposure in the cheque discounting operation. Accordingly cheque discounting was only undertaken on condition that the customer maintains a lien over savings account balance with LBF, with a stipulated monthly amount assigned to the lien account from their savings account. In addition discounting of higher value cheques was undertaken only on the strength of an asset mortgaged to
LBF. Continuing with the strategy adopted for the past few years, the main thrust for this year too was to improve the quality of the portfolio.
Outlook for the future
The focus for the immediate future would be to consolidate the cheque discounting portfolio in order to minimise potential default risk to the Company. Meanwhile should there be an improvement in the macroeconomic conditions, LBF would also likely recommence Invoice discounting on a selective basis.
Maintain a quality portfolio
Actively promote the product in other regions of the country
POWER DRAFT
The power draft was introduced in April 2011 to enable individuals and SMEs to obtain an overdraft facility against asset-backed collateral, with the value of the facility being used to determine the duration, usually up to maximum twelve months.
Performance outcome
The power draft portfolio grew from Rs. 3,841.50 million in 2019/20 to Rs. 3,864.17 million in 2020/21.
Outlook for the future
Portfolio growth of 30% in 2021/22
Increase market share to achieve market leadership
Stability Leadership Strength Agility Responsibility Sustainability Success Supplementary Information

L B Finance PLC | Annual Report 2020/21112
DELIVERING OUR STRATEGY THROUGH OUR BUSINESS CLUSTERS
Financing
BUILDING FOR FUTURE
Term Objectives Related strategic focus
Related material drivers
Related stakeholders SDGs impact
GO
ALS
Short term
Differentiate LBF’s value proposition through a more personalised, relationship based approach
Medium term
Enhance the customer experience through the CIM wallet integration
Long term
Holistically improve the customer relationship management model
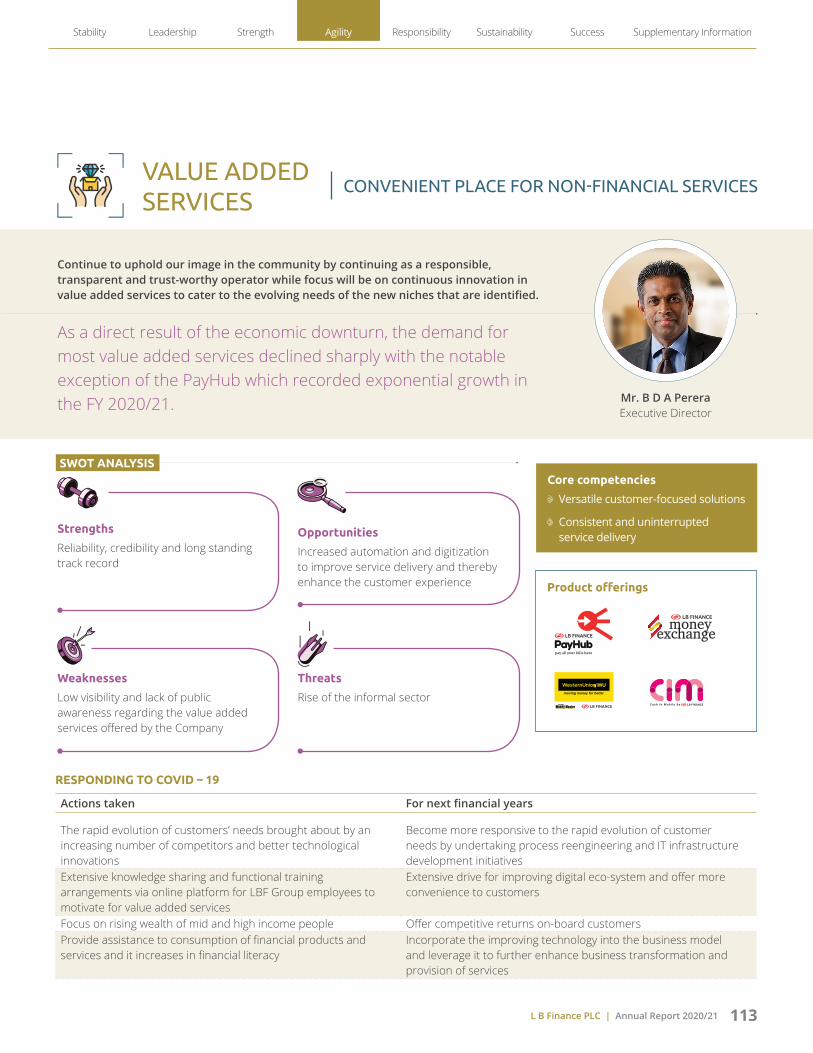
L B Finance PLC | Annual Report 2020/21 113
VALUE ADDED SERVICES
Continue to uphold our image in the community by continuing as a responsible, transparent and trust-worthy operator while focus will be on continuous innovation in value added services to cater to the evolving needs of the new niches that are identified.
As a direct result of the economic downturn, the demand for most value added services declined sharply with the notable exception of the PayHub which recorded exponential growth in the FY 2020/21. Mr. B D A Perera
Executive Director
Strengths
Reliability, credibility and long standing track record
Weaknesses
Low visibility and lack of public awareness regarding the value added services offered by the Company
Opportunities
Increased automation and digitization to improve service delivery and thereby enhance the customer experience
Threats
Rise of the informal sector
RESPONDING TO COVID – 19
Actions taken For next financial years
The rapid evolution of customers’ needs brought about by an increasing number of competitors and better technological innovations
Become more responsive to the rapid evolution of customer needs by undertaking process reengineering and IT infrastructure development initiatives
Extensive knowledge sharing and functional training arrangements via online platform for LBF Group employees to motivate for value added services
Extensive drive for improving digital eco-system and offer more convenience to customers
Focus on rising wealth of mid and high income people Offer competitive returns on-board customersProvide assistance to consumption of financial products and services and it increases in financial literacy
Incorporate the improving technology into the business model and leverage it to further enhance business transformation and provision of services
SWOT ANALYSISCore competencies
Versatile customer-focused solutions
Consistent and uninterrupted service delivery
Product offerings
CONVENIENT PLACE FOR NON-FINANCIAL SERVICES
Stability Leadership Strength Agility Responsibility Sustainability Success Supplementary Information

L B Finance PLC | Annual Report 2020/21114
FOREIGN CURRENCY OPERATION
The FY 2020/21 was a particularly challenging one for LBF’s foreign currency operation. With tourist arrivals at a standstill in 2020 due to COVID-19 mobility restrictions, currency circulation in the market plummeted to an all time low, leaving the unit to look for alternative market segments. This too proved to be a tough task amidst weak economic conditions. Therefore, foreign currency unit was unable to pursue currency trading activities as many banks began scaling back on their dealing operations in light of the economic crisis.
Performance outcome
On a positive note however, LBF’s currency stock was revalued following the depreciation of the Rupee against the US Dollar in 2020. On this basis, the Foreign Currency unit was able to record a sizable capital gain for the FY 2020/21.
Outlook for the future
The foreign currency operation remains cautiously optimistic regarding the future. It is hoped that reopening of the airport will slowly pave the way for tourist arrivals to start trickling into the country, thus providing a much needed boost for LBF’s currency exchange business.
PAYHUB
PayHub which was first introduced as a value added service to provide a hassle free solution for existing LBF customers to settle their utility bills through the Company’s island-wide branch network. Since then PayHub has gained considerable momentum, prompting LBF to extend it as a structured product for the mainstream market.
In the year under review, PayHub gained further traction. Demand which surged sharply during the lockdown period, remained consistently high even after mobility restrictions were lifted, leading to month on month increase in transaction volumes for the remainder of the year.
Amidst the upswing demand, LBF took immediate action to further expand the bandwidth of the PayHub model with the inclusion of a number of leading educational institutes and insurance companies.
Performance outcome
A series of system modifications were also performed to facilitate the payment lease rentals as well using PayHub facility.
Outlook for the future
Going forward, the focus for PayHub would be to build on the success achieved in the FY 2020/21. This means ensuring PayHub remains the most versatile solution in the market at any given time. Creating top of mind awareness will also be a key priority in the year ahead.
DELIVERING OUR STRATEGY THROUGH OUR BUSINESS CLUSTERS
Value Added Services
PayHub transactions
0
10
20
30
40
50
0
20,000
40,000
60,000
80,000
100,000
120,000
Apr 2
020
May
202
0
Jun
2020
Jul 2
020
Aug
2020
Sep
2020
Oct
202
0
Nov
202
0
Dec
202
0
Jan
202 1
Feb
2021
Mar
202
1
(No.)(Rs.Mn)
Total value (Rs.) No. of payments

L B Finance PLC | Annual Report 2020/21 115
BUILDING FOR FUTURE
Term Objectives Related strategic focus
Related material drivers
Related stakeholders SDGs impact
GO
ALS
Short term
Increase targeted promotional activities to create top of mind awareness across all relevant customer segments for foreign currency exchange
Medium term
Enhance the customer experience through digital integration for money transferring
Long term
Financial education and awareness building to enhance for digital utility payments
WESTERN UNION
Baked by a broad based approach to tackle challenges and mobilise available opportunities, LBF’s money transfer operation concluded the current financial year on a positive note. After experiencing a sizable contraction in volumes during the two months lockdown period, a favourable increase in inward remittances to the country from mid 2020 presented the opportunity to grow volumes. Consequently promotional activities were intensified to bring greater visibility for LBF’s offering and also to reinforce LBF’s reputation and credibility as a long standing sub-agent of the Western Union (WU) money transfer network.
In parallel, efforts to augment the overall value proposition also continued with a range of versatile solutions to give beneficiaries quick access to their dues notwithstanding pandemic restrictions, most notably the remote unlock feature and the CIM wallet integration with the beneficiaries savings account.
Meanwhile, leveraging on its track record as a sub agent for the past years, LBF commenced negotiations with WU in pursuit of a direct tie up which would change the Company’s status quo from that of a sub agent to a WU principal agent. As a principal agent, LBF will have the authority to appoint its own network of sub agents, thus expanding its island-wide coverage. A direct tie up with WU will also make it possible for LBF to receive direct dollar remittances.
Performance outcome
Consistent efforts to build volumes from Q2 onwards helped to make up for the volume decline in Q1 and in turn enabling LBF to retain its position as one of the top sub agents (on volume based market share) in the local WU network in Sri Lanka.
Outlook for the future
The future prospects for LBF’s money transfer operation look promising especially with the direct tie up with WU likely to materialize at the start of the next financial year. The appointment as a principal agent is seen as a good starting point for LBF’s money transfer operation to build the scale required to differentiate its value proposition, and thereby drive consistent revenue growth over the medium to long term.
Stability Leadership Strength Agility Responsibility Sustainability Success Supplementary Information

HOW IT ADDS VALUES Returns generated by our business enhances our financial capital, which in turn is used to repay our investors with dividend payments and the rest retained to aid business operations and growth through enhancing other capitals.
FINANCIALCAPITAL
WHAT IT INCLUDES Our Financial Capital includes our monetary resources, which have been contributed by our investors and are being enhanced through our business activities. Our key sources of financial capital comprise equity, debt and customer deposits besides other sources of funds.
STRATEGIC DRIVERS
Focus more on core business
Grow exposures prudently, aligned to risk appetite
Maintain the NIM at different market conditions
Continuation of cost optimisation
Improved operating efficiency through process optimisation and automation
Maintain the lowest Non-performing loan ratio in the industry
Be cost efficient while investing for growth
Deliver consistent return on equity
INPUT
Shareholders’ funds
Deposits base
Other income sources
Long and short-term borrowings
Earnings retained after dividend distribution
CHALLENGES
Lackluster macroeconomic conditions
Elevated credit risk exerted pressure on earnings
Maintaining the NIM when market interest rates are volatile and uncertain
Continuation of revenue generating activities with the COVID-19 restrictions
1 2 3
TRADE OFF
The software and infrastructural investments into our core systems, that we make towards achieving process efficiency, in turn, helps us to maintain our low cost to income ratio and quicker service in the form of
turnaround times, which enables us to operate competitively in the market. While monetary investments in our manufactured, intellectual, human, social and relationship and natural capitals are key to the development of these capitals
in themselves, these investments also translate to utilisation of the capitals to be transformed back to financial capital in the form of material returns to these various stakeholders.
4
Fitch rating reaffirmed
NPL Paid to the government as taxes
Highest ever PAT
ROE
A- (lka) 5.36% Rs. 3.96 Bn Rs. 6.80 Bn 26.58%
CAPITAL REPORTS
FC
L B Finance PLC | Annual Report 2020/21116

Total assets
Dividend per share
Cost to income ratio
Rs. 140.57 Bn Rs. 7/-
30.56 %KEY OUTPUT
Highest ever profit after tax in LBF history
Lowest cost to income ratio in LBF history
Dynamic impairment model powered by machine learning to improve the accuracy of forecasting
FUTURE
Introduce business intelligent platforms and use of artificial intelligence for credit decisions
Achieve sustainable growth
7
8
SDG impactRelated material themes and drivers Related stakeholders and concerns
Sustainably growing revenue
Delivering appropriate shareholder returns
Regional expansion
Process excellence
Improving sustainable business performance
Ensuring financial sustainability
Improving stakeholder engagement
SPACE FOR DEVELOPMENT
Portfolio growth opportunities through new business locations and relocation of existing outlets align with business expansion strategy
Enhance credit evaluation and collection efforts to reduce the NPLs to pre COVID-19 levels
5 APPROACHES TO MANAGING FINANCE CAPITAL OUTCOMES
Budgetary controls and monthly management accounts
Branch and product profitability through Oracle profitability and cost management cloud service
Cash flow and liquidity management
Sound risk management, compliance framework and internal policies and procedures
6
Visit web page for our philosophy, Management approaches and analysis of Financial Capital
L B Finance PLC | Annual Report 2020/21 117
Stability Leadership Strength Agility Responsibility Sustainability Success Supplementary Information

L B Finance PLC | Annual Report 2020/21118
Despite the pandemic creating a challenging business environment underpinned by high uncertainty, L B Finance PLC navigated the year with resilience and closed it with strong business momentum, by delivering a profit after tax of Rs. 6.80 Billion which reflected 31.15% growth over the previous financial year.
In assessing the financial performance of the Group, management uses a range of Key Performance Indicators (KPIs) which focus on the Company’s financial strength, delivery of sustainable returns and cost management. We believe that the performance given in below KPIs which are not part of SLFRSs would provide valuable information to our stakeholders.
The framework used in the analysis of the KPIs is the CAMEL rating system. CAMEL is a rating system that is used to rate banks and financial institutions according to five factors. The five factors are represented by the acronym “CAMEL – Capital Adequacy, Assets Quality, Management’s Efficiency, Earnings and Liquidity”.
KPI Definition Its Importance and How L B Finance Performed
C CAPITAL ADEQUACY
Tier I and Tier II
Capital requirements are part of the regulatory framework to ensure banks and non-banking financial institutions are supervised. Capital ratios express the capital as a percentage of its Risk Weighted Assets (RWA) as defined by the Central Bank of Sri Lanka (CBSL). Capital requirements are measured at two tiers, namely Tier I and Tier II.
L B Finance’s capital management objective is to maximise the shareholder value by prudently managing the level and mix of its capital.
L B Finance Tier I and Tier II capital adequacy ratios as at the end of the financial year stood at 23.87% and 25.32% respectively compared to the minimum regulatory requirement of 7% (Tier I) and 11% (Tier II). This reflects the resilient capital generation through the profits of the Company. Capital generation during the year was partially offset by the Rs. 1.66 Billion interim dividend paid during the financial year.
Tier I Ratio
23.87%2020 : 19.04% Tier II Ratio
25.32%2020 : 20.75%
A ASSETS QUALITY
Non-Performing Advances (NPA)
Gross NPA indicates the amount of defaulted loans granted by an institution beyond a defined period. This ratio aims to identify NPA as a percentage of its total advances. On the other hand, Net NPA ratio indicates the outstanding amount of gross NPA, net of provisioning for the NPA as a percentage of its total advances. Provisioning is the recognition of potential losses arising from NPA.
L B Finance aims to prevent undue concentration and tail-risks (large unexpected losses) by maintaining a diversified credit portfolio, client, industry and product-specific concentrations are assessed and managed against its risk appetite.
Gross NPA ratio slightly increased to 5.36% in 2020/21 from 3.93% in 2019/20. Deterioration of Gross NPA ratio during the year was driven by the unprecedented economic impact and disruption from COVID-19. Nevertheless the Net NPA ratio in year 2020/21 is only 0.10% which reflects that the Company has provided for NPAs with a strong provision coverage close to 100%.
Even during the lackluster macroeconomic conditions Company was able to maintain its record of NPA ratios substantially lower than the NBFI sector.
Gross NPL
5.36% 2020 : 3.93% Net NPL
0.10% 2020 : (0.12%)
M MANAGEMENT’S EFFICIENCY
Cost to Income Ratio
Cost to income ratio is a financial measure derived through operating expenses divided by total operating income.
This is a measure L B Finance uses to assess the productivity of the business operations. Managing the cost base is a key execution priority for management and includes a review of all categories of spending and an analysis of how we can run the business more efficiently to ensure that costs are increasing at a slower rate than income. L B Finance’s cost to income ratio improved to 30.56% in year 2020/21 compared to 33.44% in year 2019/20 which demonstrates improved management efficiency.
Cost to Income
30.56% 2020 : 33.44%
E EARNINGS
Return on Equity (ROE)
ROE is calculated by dividing the profit after tax from the average total equity.
Return on Equity (ROE) is the most common internal performance measure of a Company’s profitability from the shareholder’s point of view. This measure indicates how well the management generates return from the shareholder’s equity.
L B Finance achieved ROE of 26.58% in the year 2020/21 compared to 25.04% in the previous year which demonstrates L B Finance’s ability to execute its strategies to maximise the shareholder wealth.
Return on Equity
26.58% 2020 : 25.04%
L LIQUIDITY
Liquid Assets Ratio
Liquid assets ratio is calculated by dividing the liquid assets from total deposit liabilities and relevant borrowings.
CBSL required minimum amount of liquid assets remain at 6% of time deposits, 10% of savings deposits and 5% of outstanding borrowings excluding secured borrowings. The Company has maintained its liquidity levels well above the required liquid assets as per CBSL Requirement.
The Company’s overall objective is to maintain the adequate liquidity while managing the trade off with the profitability. The Company’s overall liquid assets as a percentage of total deposit liabilities and borrowings hovered around 16% during the year ended 2020/21 and 2019/20 which indicates that L B Finance is in a strong position in terms of its liquidity.
Liquidity Ratio
17.89% 2020 : 15.65%
CAPITAL REPORTS
Financial Capital

L B Finance PLC | Annual Report 2020/21 119
KPI Definition Its Importance and How L B Finance Performed
C CAPITAL ADEQUACY
Tier I and Tier II
Capital requirements are part of the regulatory framework to ensure banks and non-banking financial institutions are supervised. Capital ratios express the capital as a percentage of its Risk Weighted Assets (RWA) as defined by the Central Bank of Sri Lanka (CBSL). Capital requirements are measured at two tiers, namely Tier I and Tier II.
L B Finance’s capital management objective is to maximise the shareholder value by prudently managing the level and mix of its capital.
L B Finance Tier I and Tier II capital adequacy ratios as at the end of the financial year stood at 23.87% and 25.32% respectively compared to the minimum regulatory requirement of 7% (Tier I) and 11% (Tier II). This reflects the resilient capital generation through the profits of the Company. Capital generation during the year was partially offset by the Rs. 1.66 Billion interim dividend paid during the financial year.
Tier I Ratio
23.87%2020 : 19.04% Tier II Ratio
25.32%2020 : 20.75%
A ASSETS QUALITY
Non-Performing Advances (NPA)
Gross NPA indicates the amount of defaulted loans granted by an institution beyond a defined period. This ratio aims to identify NPA as a percentage of its total advances. On the other hand, Net NPA ratio indicates the outstanding amount of gross NPA, net of provisioning for the NPA as a percentage of its total advances. Provisioning is the recognition of potential losses arising from NPA.
L B Finance aims to prevent undue concentration and tail-risks (large unexpected losses) by maintaining a diversified credit portfolio, client, industry and product-specific concentrations are assessed and managed against its risk appetite.
Gross NPA ratio slightly increased to 5.36% in 2020/21 from 3.93% in 2019/20. Deterioration of Gross NPA ratio during the year was driven by the unprecedented economic impact and disruption from COVID-19. Nevertheless the Net NPA ratio in year 2020/21 is only 0.10% which reflects that the Company has provided for NPAs with a strong provision coverage close to 100%.
Even during the lackluster macroeconomic conditions Company was able to maintain its record of NPA ratios substantially lower than the NBFI sector.
Gross NPL
5.36% 2020 : 3.93% Net NPL
0.10% 2020 : (0.12%)
M MANAGEMENT’S EFFICIENCY
Cost to Income Ratio
Cost to income ratio is a financial measure derived through operating expenses divided by total operating income.
This is a measure L B Finance uses to assess the productivity of the business operations. Managing the cost base is a key execution priority for management and includes a review of all categories of spending and an analysis of how we can run the business more efficiently to ensure that costs are increasing at a slower rate than income. L B Finance’s cost to income ratio improved to 30.56% in year 2020/21 compared to 33.44% in year 2019/20 which demonstrates improved management efficiency.
Cost to Income
30.56% 2020 : 33.44%
E EARNINGS
Return on Equity (ROE)
ROE is calculated by dividing the profit after tax from the average total equity.
Return on Equity (ROE) is the most common internal performance measure of a Company’s profitability from the shareholder’s point of view. This measure indicates how well the management generates return from the shareholder’s equity.
L B Finance achieved ROE of 26.58% in the year 2020/21 compared to 25.04% in the previous year which demonstrates L B Finance’s ability to execute its strategies to maximise the shareholder wealth.
Return on Equity
26.58% 2020 : 25.04%
L LIQUIDITY
Liquid Assets Ratio
Liquid assets ratio is calculated by dividing the liquid assets from total deposit liabilities and relevant borrowings.
CBSL required minimum amount of liquid assets remain at 6% of time deposits, 10% of savings deposits and 5% of outstanding borrowings excluding secured borrowings. The Company has maintained its liquidity levels well above the required liquid assets as per CBSL Requirement.
The Company’s overall objective is to maintain the adequate liquidity while managing the trade off with the profitability. The Company’s overall liquid assets as a percentage of total deposit liabilities and borrowings hovered around 16% during the year ended 2020/21 and 2019/20 which indicates that L B Finance is in a strong position in terms of its liquidity.
Liquidity Ratio
17.89% 2020 : 15.65%
Stability Leadership Strength Agility Responsibility Sustainability Success Supplementary Information

L B Finance PLC | Annual Report 2020/21120
Year ended 31 March 2021 2020 Change
Rs. ‘000 Rs. ‘000 %
Income 29,766,124 31,222,860 (5)
Interest Income 27,457,741 29,160,292 (6)
Less: Interest Expenses 11,522,802 13,615,391 (15)
Net Interest Income 15,934,939 15,544,901 3
Non-Interest Income
Fee and Commission Income 2,184,947 1,941,626 13
Net Trading Income 6,323 (2,099) >100
Other Operating Income 117,113 123,041 (5)
Total Operating Income 18,243,322 17,607,469 4
Less: Impairment Charges and Other Losses 1,691,734 1,831,057 (8)
Net Operating Income 16,551,588 15,776,412 5
Less: Operating Expenses
Personnel Expenses 2,959,823 3,005,189 (2)
Depreciation of Property, Plant and Equipment 728,793 697,508 4
Amortisation of Intangible Assets 16,446 15,882 4
Other Operating Expenses 1,870,828 2,168,986 (14)
Total Operating Expenses 5,575,890 5,887,565 (5)
Operating Profit before Tax on Financial Services 10,975,698 9,888,847 11
Less: Tax on Financial Services 1,669,323 2,278,560 (27)
Profit before Taxation 9,306,375 7,610,287 22
Less: Income Tax Expense 2,503,778 2,423,234 3
Profit for the Year 6,802,597 5,187,053 31
Net Interest Income
Definition: Interest income recognised from our lending products that we offer to our customers, less interest expense on the deposits that our customers place with us and debt funding source from our lenders.
Drivers: Lending base, NPL ratio, product pricing, market volatility, market interest rates.
Non-Interest Income
Definition: Also known as other income, consisting of fee and commission income, net trading income and other operating income.
Drivers: Capital market activities, market volatility, other income recognise on credit granting.
Impairment Charges and Other losses
Definition: Expected losses arising due to the inability of customers to repay their debt to the entity.
Drivers: Customer repayment behavior, loss given default rate, probability of default rate, macroeconomic factors, exposure at default.
Operating Expenses
Definition: Costs incurred to generate current and future revenues. Consisting of personnel expenditure, depreciation and amortisation and other operating expenses.
Drivers: Inflation, head count, investments in branches and IT infrastructure, general costs to operate, marketing and promotional activities.
Taxes
Definition: Include direct taxes such as income tax, debt repayment levy, VAT and NBT on financial services. Tax is a compulsory financial charge or some other type of levy imposed on taxpayers.
Drivers: Level of operational profitability, government policies, applicable tax rates, allowable credits and exempt income.
INCOME STATEMENT
CAPITAL REPORTS
Financial Capital
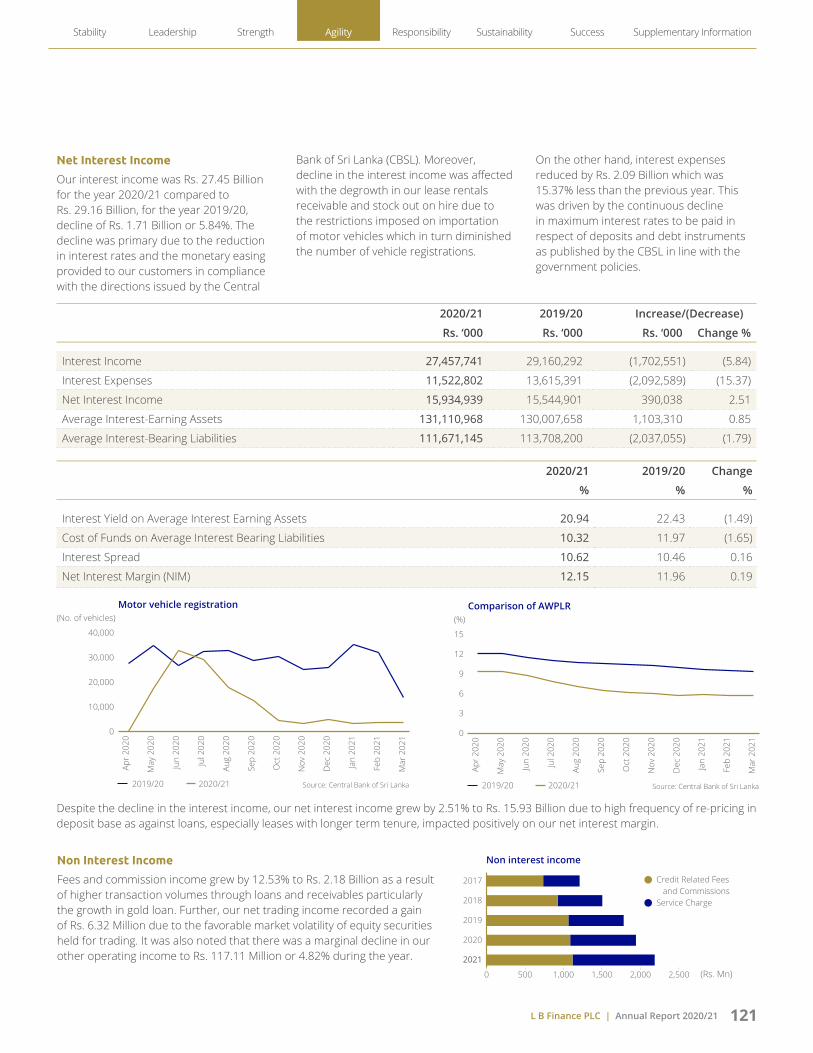
L B Finance PLC | Annual Report 2020/21 121
Net Interest Income
Our interest income was Rs. 27.45 Billion for the year 2020/21 compared to Rs. 29.16 Billion, for the year 2019/20, decline of Rs. 1.71 Billion or 5.84%. The decline was primary due to the reduction in interest rates and the monetary easing provided to our customers in compliance with the directions issued by the Central
Bank of Sri Lanka (CBSL). Moreover, decline in the interest income was affected with the degrowth in our lease rentals receivable and stock out on hire due to the restrictions imposed on importation of motor vehicles which in turn diminished the number of vehicle registrations.
On the other hand, interest expenses reduced by Rs. 2.09 Billion which was 15.37% less than the previous year. This was driven by the continuous decline in maximum interest rates to be paid in respect of deposits and debt instruments as published by the CBSL in line with the government policies.
2020/21 2019/20 Increase/(Decrease)
Rs. ‘000 Rs. ‘000 Rs. ‘000 Change %
Interest Income 27,457,741 29,160,292 (1,702,551) (5.84)
Interest Expenses 11,522,802 13,615,391 (2,092,589) (15.37)
Net Interest Income 15,934,939 15,544,901 390,038 2.51
Average Interest-Earning Assets 131,110,968 130,007,658 1,103,310 0.85
Average Interest-Bearing Liabilities 111,671,145 113,708,200 (2,037,055) (1.79)
2020/21 2019/20 Change
% % %
Interest Yield on Average Interest Earning Assets 20.94 22.43 (1.49)
Cost of Funds on Average Interest Bearing Liabilities 10.32 11.97 (1.65)
Interest Spread 10.62 10.46 0.16
Net Interest Margin (NIM) 12.15 11.96 0.19
Motor vehicle registration
0
10,000
20,000
30,000
40,000
Apr 2
020
May
202
0
Jun
2020
Jul 2
020
Aug
2020
Sep
2020
Oct
202
0
Nov
202
0
Dec
202
0
Jan
2021
Feb
2021
Mar
202
1
(No. of vehicles)
2019/20 2020/21 Source: Central Bank of Sri Lanka
Comparison of AWPLR
0
3
6
9
12
15
Apr 2
020
May
202
0
Jun
2020
Jul 2
020
Aug
2020
Sep
2020
Oct
202
0
Nov
202
0
Dec
202
0
Jan
202 1
Feb
2021
Mar
202
1
(%)
2019/20 2020/21 Source: Central Bank of Sri Lanka
Despite the decline in the interest income, our net interest income grew by 2.51% to Rs. 15.93 Billion due to high frequency of re-pricing in deposit base as against loans, especially leases with longer term tenure, impacted positively on our net interest margin.
Non Interest Income
Fees and commission income grew by 12.53% to Rs. 2.18 Billion as a result of higher transaction volumes through loans and receivables particularly the growth in gold loan. Further, our net trading income recorded a gain of Rs. 6.32 Million due to the favorable market volatility of equity securities held for trading. It was also noted that there was a marginal decline in our other operating income to Rs. 117.11 Million or 4.82% during the year.
Non interest income
0 500 1,000 1,500 2,000 2,500
2018
2017
2019
2020
2021
(Rs. Mn)
Credit Related Fees and Commissions Service Charge
Stability Leadership Strength Agility Responsibility Sustainability Success Supplementary Information

L B Finance PLC | Annual Report 2020/21122
ANALYSIS OF IMPAIRMENT
CHARGES AND OTHER LOSSES
Loans and Receivables
Stage 01 Stage 02 Stage 03 Total
Lease Rentals Receivable and
Stock out on Hire
Total
Total Impairment Charges and Other Losses
Others
Rs. 550 Mn2020 : Rs. 100 Mn
Rs. 66 Mn2020 : Rs. 0.6 Mn
Rs. 526 Mn2020 : Rs. 1,012 Mn
Rs. 1,142 Mn2020 : Rs. 1,113 Mn
Rs. 143 Mn2020 : (Rs. 114 Mn)
Rs. 693 Mn2020 : (Rs. 14 Mn)
Rs. 1,691 Mn2020 : Rs. 1,831 Mn
(Rs. 62 Mn)2020 : (Rs. 71 Mn)
Rs. 1,147 Mn2020 : Rs. 1,865 Mn
Rs. 1,753 Mn2020 : Rs. 1902 Mn
(Rs. 153 Mn)2020 : Rs. 50 Mn
(Rs. 87 Mn)2020 : Rs. 51 Mn
Rs. 621 Mn2020 : Rs. 853 Mn
Rs. 611 Mn2020 : Rs. 789 Mn
Operating Expenses
Operating expenses decreased by 5.29% to Rs. 5.57 Billion for the year 2020/21, due to reduction in general and administrative expenses compared to the previous year following a disciplined cost management with reductions in cost across all major cost categories.
Advertising and business promotions included in the other operating expenses plummeted by 55.81% in the year 2020/21 compared to prior year as a consequence of subsiding our advertising and business promotion.
Moreover, the Company managed to maintain its cost per employee within the budgeted levels demonstrating its ability to align with the Company strategy in unprecedent timeframes. It is also noteworthy that the cost to income ratio of the Company improved by 2.88% from 33.44% to 30.56% during the year by reporting the lowest cost to income ratio in L B Finance history indicating the effective and efficient cost management efforts of the Company.
Total operating expensesvs total operating income
0
5,000
10,000
15,000
20,000
0
10
20
30
40
(Rs. Mn) (%)
Total operating incomeTotal operating expensesCI Ratio
2017
2018
2019
2020
2021
CAPITAL REPORTS
Financial Capital
Impairment Charges and Other Losses
Impairment charges and other losses were Rs. 1.69 Billion for the year 2020/21. This was primarily driven by negative impacts from COVID-19 which resulted in extreme macroeconomic downturn.
However, the management of the Company continued to provide oversight to the credit monitoring, management and recovery of finance receivables in managing credit risk and improving asset quality helped to reduce the impairment charges for the current financial year compared to the previous financial year.
In addition the decrease of impairment charges and other losses of 7.61% was also contributed by the additional impairment provisions in the year 2019/20 as management overlay to flatten the high amplitude of the future impairment with the expected adverse macroeconomic condition due to COVID-19 crisis. Further, the reduction in impairment charges and other losses were contributed by the overall reduction in the lending base due to,
The slower growth than expected in the lending volumes
Pre-termination of credit facilities resulting from the improved vehicle prices in the market
Inherent early terminations that are witnessed when the market interest rates are reducing
It should be taken into consideration that the reduction in the impairment charges and other losses, also demonstrates the asset quality of the Company which was evident with the one of the lowest NPA ratios in NBFI sector.

L B Finance PLC | Annual Report 2020/21 123
Taxes
L B Finance tax expense consists of two main elements namely taxes on financial services and income tax.
Tax on financial services reduced to Rs. 1.66 Billion, which was 26.74% less than the prior year. This was mainly due to tax reforms to abolish the debt repayment levy and NBT on financial services with effect from 1 January 2020.
Financial Highlights 2020/21 2019/20 2018/19
Rs.’000 Rs.’000 Rs.’000
Profit before Tax on Financial Services 10,975,698 9,888,847 9,756,268Tax on Financial Services 1,669,323 2,278,560 2,015,619Profit after Tax on Financial Services 9,306,375 7,610,287 7,740,649Current Income Tax (A) 2,913,969 2,683,698 2,441,729Deferred Taxation Charge/(Reversal)
- Income statement (B) (410,191) (260,464) 244,260Taxation Charge - Income Statement C=(A + B) 2,503,778 2,423,234 2,685,989Deferred Taxation Charge/(Reversal)
- Other Comprehensive Income (D) 9,684 (11,678) 6,712Total Tax Expense for the Financial Year
E=(C+D) 2,513,462 2,411,556 2,692,701Effective Tax Rate (Taxation Charge/Profit
after Tax on Financial Services) 27.01% 31.69% 34.79%Effective Tax Rate (Taxation Charge/Profit
before Tax on Financial Services) 22.90% 24.39% 27.60%
The effective income tax rate of the Company decreased to 27.01% during the year from 31.69% reported in the previous year. This was mainly due to following downward tax adjustments effected during the last quarter of 2019/20.
Corporate tax rate revision from 28% to 24% had a favorable impact to the reduction in effective income tax rate.
Decrease in taxes on financial services due to the abolition of the debt repayment levy (effective from 1 January 2020), nation building tax (effective from 1 December 2019) enabled the Company to post an increase in the operating profit after tax on financial services.
The Company as a responsible taxpayer has a tax strategy that outline the framework by which the Company’s tax obligations are met from an operational and risk management perspective. We adopt an overarching risk philosophy in relation to tax matters which aims to mitigate any adverse or unexpected financial consequences and protect our reputation. Total direct tax paid from the Company amounted to Rs. 3.54 Billion compared to the Rs. 5.60 Billion in the prior year down by Rs. 2.06 Billion due to the above said tax reforms introduced.
Similarly, indirect tax collected from Value Added Tax (VAT), Withholding Tax (WHT), PAYE and stamp duty amounted to Rs. 425.60 Million compared to the Rs. 1,223.56 Million paid in the prior year which represents a 65.22% reduction due to the tax reforms introduced.
Direct taxes
0
500
1,000
1,500
2,000
2,500
3,000
2020 2021
(Rs. Mn)
Income TaxValue Added Tax on Financial ServicesCrop Insurance Levy
Indirect taxes (%)
Value Added TaxNation Building TaxStamp DutyWithholding Tax on Dividend and InterestPAYE Tax/Advanced Personal Income Tax
37.97
20.92
2.57
26.56
8.38
41.57
42.22
0.5
19.31
2021
2020
Rs. 1.7 Bn Rs. 1.1 Bn
Profit After Tax
Despite the disruptions on operations caused by COVID-19 pandemic the Company was able to deliver a resilient performance. The Company reported profit after tax of Rs. 6.80 Billion which is Rs. 1.62 Billion or 31.15% higher than the previous year. The rise in profit primarily reflecting the impact of the increase in net interest income, effective credit cost management resulting in manageable impairment charges, reduction in operating expenses and the savings resulting from the tax regulatory reforms.
PROFIT AFTER TAX For the year ended 31 March 2021
PROFIT BEFORE TAX ON FINANCIAL SERVICES For the year ended 31 March 2021
31% 11%
FY 21 Rs. 6.8 Bn
FY 20 Rs. 5.1 Bn
FY 21 Rs. 10.9 Bn
FY 20 Rs. 9.8 Bn
Stability Leadership Strength Agility Responsibility Sustainability Success Supplementary Information

L B Finance PLC | Annual Report 2020/21124
As at 31 March 2021 2020 Change
Rs. ‘000 Rs. ‘000 %
Assets
Cash and Cash Equivalents 6,187,300 6,162,637 0
Financial Assets Recognised Through Profit or Loss - Measured at Fair Value 10,862 4,648 >100
Financial Assets at Amortised Cost - Loans and Receivables 66,778,188 58,239,254 15
Financial Assets at Amortised Cost - Lease Rentals Receivable and Stock out on Hire 47,359,635 60,626,670 (22)
Financial Assets Measured at Fair Value Through Other Comprehensive Income 77,789 59,141 32
Other Financial Assets 10,453,903 9,119,681 15
Other Non Financial Assets 920,406 967,469 (5)
Investment in Subsidiary 521,162 521,162 -
Property, Plant and Equipment and Right-of-Use Assets 8,241,259 8,221,248 0
Intangible Assets 26,021 41,809 (38)
Total Assets 140,576,525 143,963,719 (2)
Liabilities
Due to Banks 16,467,179 22,771,085 (28)
Financial Liabilities at Amortised Cost - Due to Depositors 85,860,070 89,256,435 (4)
Debt Instruments Issued and Other Borrowed Funds 3,113,916 3,111,186 0
Other Financial Liabilities 3,043,526 2,766,410 10
Other Non Financial Liabilities 1,028,054 909,266 13
Current Tax Liabilities 1,872,154 766,752 >100
Deferred Tax Liabilities 637,073 1,037,580 (39)
Post Employment Benefit Liability 365,265 345,456 6
Total Liabilities 112,387,237 120,964,170 (7)
Equity
Stated Capital 838,282 838,282 -
Reserves 7,596,106 6,216,939 22
Retained Earnings 19,754,900 15,944,328 24
Total Equity Attributable to Equity Holders of the Company 28,189,288 22,999,549 23
Non-Controlling Interest - - -
Total Equity 28,189,288 22,999,549 23
Total Liabilities and Equity 140,576,525 143,963,719 (2)
Cash and Cash Equivalents
Definition: Value of a Company’s assets that are cash or can be converted into cash immediately. Includes cash in hand, bank balances and treasury bills/bonds repurchase agreements.
Drivers: Liquidity requirements (Company and CBSL), credit granting, recoveries and funding from deposits and other sources.
Lending Portfolio
Definition: Main interest earning assets to the Company which consists of loans and receivables, lease rentals receivable and stock out on hire.
Drivers: Market interest rates, Companies risk appetite, market competition, lending volumes, pre-terminations and repayments.
Other Financial Assets
Definition: Consists of treasury bills repurchase agreements, investment in fixed deposits, insurance premium receivable and sundry debtors.
Drivers: Liquidity requirements, market interest rates, excess funds.
Due to Banks
Definition: Consists of the external borrowings from banks including overdrafts, securitisations, term loans and syndications.
Drivers: Market growth, funding requirements, market interest rates, repayments, gearing ratio.
Financial Liabilities at Amortised Cost - Due to Depositors
Definition: Comprise of interest bearing savings deposits and term deposits.
Drivers: Funding requirements, market growth, market interest rates, deposit renewal ratio.
Debt Instruments Issued and Other Borrowed Funds
Definition: Consist of listed unsecured debentures.
Drivers: Funding requirements, market interest rates, Company stability, Tier II capital adequacy requirements.
STATEMENT OF FINANCIAL POSITION
CAPITAL REPORTS
Financial Capital
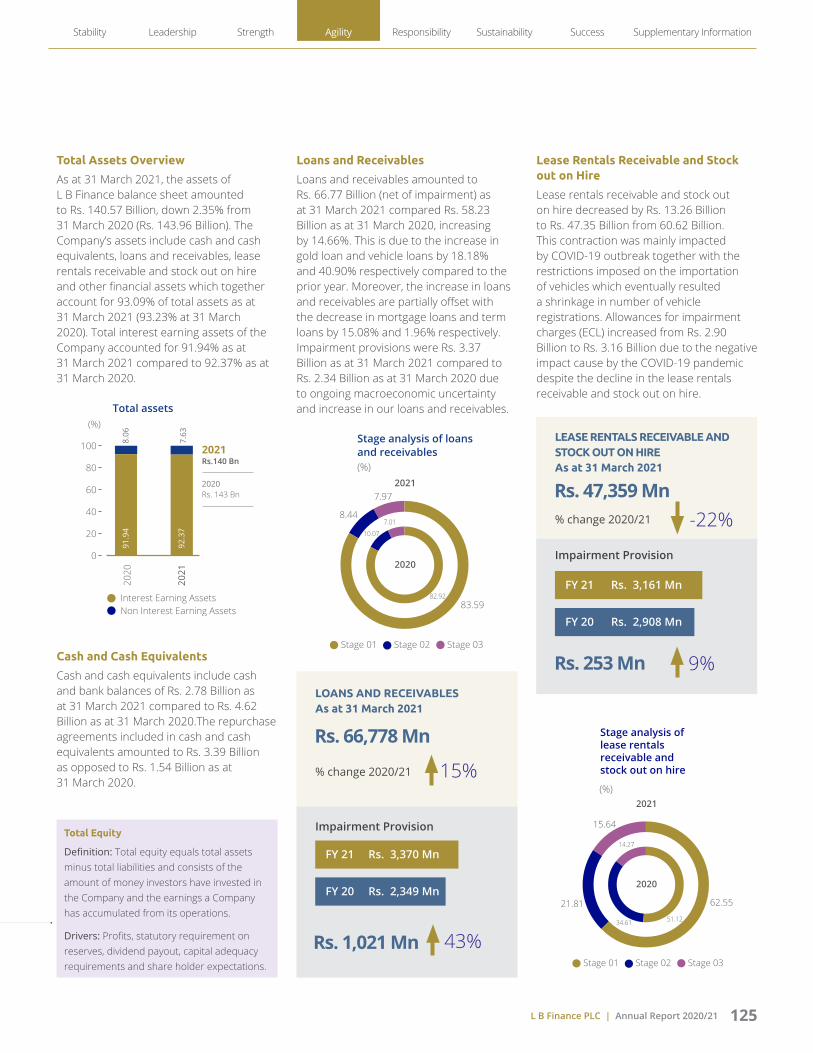
L B Finance PLC | Annual Report 2020/21 125
Total Equity
Definition: Total equity equals total assets minus total liabilities and consists of the amount of money investors have invested in the Company and the earnings a Company has accumulated from its operations.
Drivers: Profits, statutory requirement on reserves, dividend payout, capital adequacy requirements and share holder expectations.
Total Assets Overview
As at 31 March 2021, the assets of L B Finance balance sheet amounted to Rs. 140.57 Billion, down 2.35% from 31 March 2020 (Rs. 143.96 Billion). The Company’s assets include cash and cash equivalents, loans and receivables, lease rentals receivable and stock out on hire and other financial assets which together account for 93.09% of total assets as at 31 March 2021 (93.23% at 31 March 2020). Total interest earning assets of the Company accounted for 91.94% as at 31 March 2021 compared to 92.37% as at 31 March 2020.
Total assets
0
20
40
60
80
100
2020
2021
(%)
2021Rs.140 Bn
2020Rs. 143 Bn
Interest Earning AssetsNon Interest Earning Assets
92.3
7
91.9
48.
06
7.63
Cash and Cash Equivalents
Cash and cash equivalents include cash and bank balances of Rs. 2.78 Billion as at 31 March 2021 compared to Rs. 4.62 Billion as at 31 March 2020.The repurchase agreements included in cash and cash equivalents amounted to Rs. 3.39 Billion as opposed to Rs. 1.54 Billion as at 31 March 2020.
Loans and Receivables
Loans and receivables amounted to Rs. 66.77 Billion (net of impairment) as at 31 March 2021 compared Rs. 58.23 Billion as at 31 March 2020, increasing by 14.66%. This is due to the increase in gold loan and vehicle loans by 18.18% and 40.90% respectively compared to the prior year. Moreover, the increase in loans and receivables are partially offset with the decrease in mortgage loans and term loans by 15.08% and 1.96% respectively. Impairment provisions were Rs. 3.37 Billion as at 31 March 2021 compared to Rs. 2.34 Billion as at 31 March 2020 due to ongoing macroeconomic uncertainty and increase in our loans and receivables.
Stage analysis of loansand receivables (%)
Stage 01 Stage 02 Stage 03
83.5982.92
10.07
7.018.44
7.972021
2020
Lease Rentals Receivable and Stock out on Hire
Lease rentals receivable and stock out on hire decreased by Rs. 13.26 Billion to Rs. 47.35 Billion from 60.62 Billion. This contraction was mainly impacted by COVID-19 outbreak together with the restrictions imposed on the importation of vehicles which eventually resulted a shrinkage in number of vehicle registrations. Allowances for impairment charges (ECL) increased from Rs. 2.90 Billion to Rs. 3.16 Billion due to the negative impact cause by the COVID-19 pandemic despite the decline in the lease rentals receivable and stock out on hire.
Rs. 47,359 Mn
Rs. 253 Mn
LEASE RENTALS RECEIVABLE AND STOCK OUT ON HIRE As at 31 March 2021
% change 2020/21 -22%
Impairment Provision
9%
Rs. 66,778 Mn
Rs. 1,021 Mn
LOANS AND RECEIVABLES As at 31 March 2021
% change 2020/21 15%
43%
Impairment Provision
(%)
62.5521.81
15.64
34.61
14.27
51.12
2021
2020
Stage analysis oflease rentalsreceivable andstock out on hire
Stage 01 Stage 02 Stage 03
FY 21 Rs. 3,370 Mn
FY 20 Rs. 2,349 Mn
FY 21 Rs. 3,161 Mn
FY 20 Rs. 2,908 Mn
Stability Leadership Strength Agility Responsibility Sustainability Success Supplementary Information

L B Finance PLC | Annual Report 2020/21126
Credit Quality
Credit quality of the Company was affected with the disruption to economic activities which had an adverse impact on increase in our impairment provision by Rs. 1.28 Billion from Rs. 5.25 Billion as at 31 March 2020 to Rs. 6.53 Billion as at 31 March 2021.
We identify counterparties that, demonstrate the likelihood of defaults and made provisions based on the ECL model of the Company, which factors in the forward economic outlook. L B Finance uses a dynamic impairment model powered by machine learning techniques developed with Colombo Science and Technology CELL of University of Colombo to improve the accuracy of forecasting which ensures that the Company adequately provided for the delinquent facilities.
Credit Quality of Assets Gross Carrying Value Allowance for Impairment
Allowance by Categories
Defaulted Exposures
Non- Defaulted Exposures
Individual Collective
Rs. ’000 Rs. ’000 Rs. ’000 Rs. ’000 Rs. ’000
As at 31 March 2021Loans and Receivables 5,590,002 64,558,907 3,370,721 2,339,239 1,031,482 Lease Rentals Receivable and Stock out on Hire 7,903,567 42,617,339 3,161,271 2,487,333 673,938 Total 13,493,569 107,176,246 6,531,992 4,826,572 1,705,420
11.18% 88.82%
As at 31 March 2020Loans and Receivables 4,249,210 56,339,350 2,349,306 1,915,499 433,807 Lease Rentals Receivable and Stock out on Hire 9,069,309 54,465,394 2,908,033 2,223,973 684,060 Total 13,318,519 110,804,746 5,257,339 4,139,472 1,117,867
10.73% 89.27%
Financial Highlights 2021 2020 2019
Rs. ‘000 Rs. ‘000 Rs. ‘000
Gross Loans (With Unearned Income) 134,801,208 143,625,411 140,149,944Unearned Income 14,131,393 19,502,148 22,950,300Gross Loans 120,669,815 124,123,263 117,199,644Gross Non-Performing Loans (With Unearned Income) 7,232,046 5,648,464 3,773,333Unearned Income of Non-Performing Loans 575,528 536,198 276,867Gross Non-Performing Loans 6,656,518 5,112,266 3,496,466SLFRS 09 ECL Provision 6,531,992 5,257,339 3,746,911Regulatory Provision 5,194,045 3,897,772 2,642,510Excess/(Shortfall) ECL Provision Compared to Regulatory Provision 1,337,947 1,359,567 1,104,401
ECL Provision as a Percentage of Gross Loans 5.41% 4.24% 3.20%ECL Provision as a Percentage of Non-Performing Loans 98.13% 102.84% 107.16%
Regulatory Provision as a Percentage of Gross Loans 4.30% 3.14% 2.25%Regulatory Provision as a Percentage of Non-Performing Loans 78.03% 76.24% 75.58%NPL: Gross Loans 5.52% 4.12% 2.98%NPL: Gross Loans-Unearned Income Basis 5.36% 3.93% 2.69%Net Non-Performing Loans 0.10% -0.12% -0.21%
The regulatory provisions are made on loans and advances under the Direction No 03 of 2006 on “Provision for bad and doubtful debts” (and subsequent amendments thereof ) issued by the CBSL.
The ECL as per SLFRS 09 - Financial Instruments is Rs. 1,337.94 Million excess as at the end of 31 March 2021 (Rs. 1,359.56 Million as at 31 March 2020) over the regulatory provision required as per the said directions issued by the Central Bank of Sri Lanka.
CAPITAL REPORTS
Financial Capital

L B Finance PLC | Annual Report 2020/21 127
Other Financial Assets
Other financial assets mainly composed of treasury bills repurchased agreements and investments in fixed deposits to meet statutory liquidity requirements. Other financial assets increased by 14.63% to Rs. 10.45 Billion from Rs. 9.11 Billion. This was driven by the increase in investments in fixed deposits from Rs. 3.42 Billion to Rs. 6.50 Billion which overshadowed the decline in treasury bill repurchased agreements by Rs. 1.92 Billion as at 31 March 2021.
Other financial assets (%)
Investment in Fixed DepositsTreasury Bills Repurchase AgreementsOthers
62.21
33.84
3.95
2.52 59.90
37.58
2020
2021
Liability Overview
The Company’s liabilities amounted to Rs. 112.38 Billion as at 31 March 2021 down 7.09% from Rs. 120.96 Billion as at 31 March 2020.The Company’s main liabilities consist of due to banks, due to depositors and debt instruments issued and other borrowed funds. These items together represented 93.82% of our total liabilities as at 31 March 2021 (95.18% as at 31 March 2020). The 7.09% decrease in liability was mainly due to the 27.68% drop or Rs. 6.30 Billion decrease in due to banks compared to prior year of Rs. 22.77 Billion in line with the lending portfolio contraction.
Due to Banks
Due to banks declined by 27.68% to Rs. 16.46 Billion as at 31 March 2021 from Rs. 22.77 Billion as at 31 March 2020. While the decrease is mainly due to the settlement of the amounts due to banks with its strong liquidity position. The Company has borrowed Rs. 15.78 Billion in the year 2021 (2020 - Rs. 14.58 Billion) to manage the maturity mismatch of assets and liabilities and maintain the existing funding mix of the Company.
2021 2020
Rs. ‘000 Rs. ‘000
Bank Overdrafts 988,099 720,411
Debt Funding from Banks 15,479,080 22,050,674
Due to Banks 16,467,179 22,771,085
22.05
15.782.38
(24.73)
(Rs. Bn)
15.48
As a
t 1Ap
ril 2
020
Loan
sO
btai
ned
Inte
rest
Reco
gnis
ed
Repa
ymen
ts
As a
t 31
Mar
ch 2
021
Debt funding
Due to Depositors
Due to depositors amounts to Rs. 85.86 Billion down Rs. 3.39 Billion from 31 March 2020. This was primarily driven by the 4.48% drop in the fixed deposits easing the concentration on larger value deposits while maintaining healthy levels of liquidity for business operation.
Debt Instruments Issued and Other Borrowed Funds – Debentures
This category includes Rs. 3.00 Billion listed debentures issued in December 2017 of which Rs. 2.00 Billion were subordinated debentures to strengthen Tier II capital. Debt instruments issued and other borrowed funds remained at Rs. 3.11 Billion as at 31 March 2021 and 2020.
Shareholders’ Equity
Shareholders’ equity amounts to Rs. 28.18 Billion as at 31 March 2021 compared with Rs. 22.99 Billion as at 31 March 2020. This Rs. 5.18 Billion increase is mainly attributable to the profit of the year which amounted to Rs. 6.80 Billion and partially offset by the Rs. 1.66 Billion interim dividends paid in respect of the year ended 31 March 2021.
It is also noteworthy that the Company sub-divided its shares on 10 March 2021 whereby every share was sub-divided into four shares without any change to the stated capital of the Company thereby increasing the number of shares in issue from 138,514,284 shares to 554,057,136 shares.
Change 2020/21
Rs. 5.2 Bn
Rs. 28.2 Bn2020 Rs. 23.0 Bn
SHAREHOLDERS’ EQUITY As at 31 March 2021
Rs. 6.8 Bn Profits
(Rs. 1.6 Bn) Interim Dividends
23%
Stability Leadership Strength Agility Responsibility Sustainability Success Supplementary Information

L B Finance PLC | Annual Report 2020/21128
Commitments and Contingencies
Commitments and contingencies mainly consist of import letter of credits, guarantees issued to banks and other institutions and financing commitments given to customers.
Commitments and contingencies balances declined by 53.15% from Rs. 1.92 Billion as at 31 March 2020 to Rs. 0.90 Billion as at 31 March 2021 mainly due to the decline in financing commitments given to customers.
Commitments andcontingencies
0
500
1,000
1,500
2,000
2020 2021
(Rs. Mn)
Contingent LiabilitiesCommitmentsTotal Commitments andContingent Liabilities
53%
CAPITAL REPORTS
Financial Capital
Statement of Cash Flows
We actively manage the Company’s liquidity and funding to support our business strategy and meet regulatory requirements at all times, including under stress. This is evident with the increase in our operating cash flow from operating activities from Rs. 5.67 Billion to Rs. 8.42 Billion with the increase in profits demonstrating its ability to turnout the profits generated by the Company into cash. The cash generated through the operations are being mainly used to settle the amounts due to banks and to pay interim dividend to our shareholders.
This reflects an additional way of viewing our performance that we believe is useful to investors because it represents cash that has been generated by the company through its operations.
5.44
8.41
(Rs. Bn)
(0.42)
(8.23)
(8.23)
5.20
Statement of cash flows
As a
t Beg
inni
ngof
the
Year
Inve
stin
gAc
tiviti
es
Ope
ratin
gAc
tiviti
es
Fina
ncin
gAc
tiviti
es
As a
t End
of th
e Ye
ar
L B MICROFINANCE MYANMAR COMPANY LIMITED (LBM)
Profit before tax of LBM operation decreased 50.03% to Rs. 21.44 Million from Rs. 42.90 Million reflecting a challenging operating environment and increased credit impairment charges. Net interest income of LBM increased 9.83% to Rs. 132.71 Million despite the COVID-19 pandemic due to the higher transactional volumes during the first three quarters of the financial year. Our operations at Myanmar during the last quarter of the financial year was disrupted due to the risks associated with political instability, civil unrest and military conflict prevailed.
Impairment charges and other losses increased to Rs. 36.17 Million (2020 - Rs. 25.43 Million) due to the deterioration in economic outlook driven by the COVID-19 pandemic and current political tension.
Operational expenses increased 64.74% to Rs. 86.06 Million from Rs. 52.23 Million reflecting the LBM’s expansions into the new regions.
Total assets of LBM amounted to Rs. 909.93 Million as at 31 March 2021 primarily consist of loans and receivables balance which accounts for 75.74% of the total assets of LBM.
Gross loans and receivables increased to Rs. 688.39 Million from Rs. 554.09 Million or 24.24% increase predominantly due to the continued customer support of LBM to the customers as well as strong customer retention. Due to depositors increased 36.62% to Rs. 80.14 Million from Rs. 58.66 Million aligning with the increase in loans and receivables.

L B Finance PLC | Annual Report 2020/21 129
HORIZONTAL ANALYSIS OF FINANCIAL STATEMENTS
Horizontal analysis is used in the review of a Company’s Financial Statements over multiple periods. It is usually depicted as percentage growth over the same line item in the base year. Our horizontal analysis allows financial statement users to easily spot trends and growth patterns.
Statement of Financial Position
As at 31 March
CAGR* Current Year Rs. ‘000
Percentage Change Base Year Rs. ‘000
2021 2021 2020 2019 2018 2017 2016
AssetsCash and Cash Equivalents 0% 6,187,300 2% 2% (33%) (3%) (52%) 6,051,898 Financial Assets Recognised Through
Profit or Loss - Measured at Fair Value 0% 10,862 2% (56%) (36%) (9%) (5%) 10,645
Financial Assets at Amortised Cost - Loans and Receivables 20% 66,778,188 152% 120% 79% 51% 27% 26,449,169
Financial Assets at Amortised Cost - Lease Rentals Receivable and Stock Out on Hire 1% 47,359,635 5% 34% 46% 39% 23% 45,104,836
Financial Assets Measured at Fair Value Through Other Comprehensive Income (11%) 77,789 (44%) (57%) (35%) (12%) (15%) 138,411
Other Financial Assets 20% 10,453,903 152% 120% 161% 63% 62% 4,142,716 Other Non Financial Assets 11% 920,406 71% 80% 98% 51% (43%) 538,898 Investment in Subsidiary 100% 521,162 100% 100% 100% 100% 0% - Property, Plant and Equipment 32% 8,241,259 303% 302% 222% 129% 72% 2,045,295 Intangible Assets (6%) 26,021 (25%) 20% 15% 38% 41% 34,765 Total Assets 11% 140,576,525 66% 70% 61% 43% 22% 84,516,636
Liabilities Due to Banks 2% 16,467,179 13% 56% 69% 57% 63% 14,577,233 Financial Liabilities at Amortised Cost
- Due to Depositors 10% 85,860,070 61% 67% 56% 37% 13% 53,379,801 Debt Instruments Issued and Other
Borrowed Funds 4% 3,113,916 20% 20% 19% 98% (21%) 2,601,282 Other Financial Liabilities 10% 3,043,526 63% 48% 6% (6%) 7% 1,869,940 Other Non Financial Liabilities 11% 1,028,054 72% 52% 246% 43% 13% 597,806 Current Tax Liabilities 20% 1,872,154 153% 3% 88% (15%) (7%) 741,251 Deferred Tax Liabilities 35% 637,073 345% 625% 815% 640% 252% 143,142 Post Employment Benefit Liability 24% 365,265 188% 172% 102% 82% 21% 126,858 Total Liabilities 9% 112,387,237 52% 63% 59% 42% 22% 74,037,317
EquityStated Capital 0% 838,282 0% 0% 0% 0% 0% 838,282 Reserves 23% 7,596,106 184% 133% 95% 60% 28% 2,670,537 Retained Earnings 23% 19,754,900 183% 129% 78% 47% 18% 6,970,499 Total Equity 22% 28,189,288 169% 119% 76% 46% 19% 10,479,319 Total Liabilities and Equity 11% 140,576,525 66% 70% 61% 43% 22% 84,516,636
*CAGR - Compound Annual Growth Rate
Stability Leadership Strength Agility Responsibility Sustainability Success Supplementary Information

L B Finance PLC | Annual Report 2020/21130
Income Statement CAGR* Current Year Rs. ‘000
Percentage Change Base Year Rs. ‘000
Year ended 31 March 2021 2021 2020 2019 2018 2017 2016
Income 14% 29,766,124 90% 100% 87% 60% 24% 15,646,467
Interest Income 14% 27,457,741 90% 102% 90% 62% 24% 14,428,729
Interest Expenses 15% 11,522,802 100% 136% 124% 99% 41% 5,773,255
Net Interest Income 13% 15,934,939 84% 80% 67% 37% 13% 8,655,474
Other Operating Income 14% 2,308,383 90% 69% 57% 36% 19% 1,217,737
Total Operating Income 13% 18,243,322 85% 78% 65% 37% 14% 9,873,212
Impairment Charges and Other Losses 33% 1,691,734 311% 345% 139% 63% (110%) 411,793
Total Operating Expenses 9% 5,575,890 57% 66% 58% 43% 24% 3,543,352
Profit before Taxation 12% 9,306,375 75% 43% 45% 22% 10% 5,324,615
Tax on Financial Services 23% 1,669,323 181% 284% 240% 125% 73% 593,452
Income Tax Expense 9% 2,503,778 56% 51% 67% 39% 22% 1,606,822
Profit for the Year 13% 6,802,597 83% 40% 36% 14% 5% 3,717,792
CAPITAL REPORTS
Financial Capital
*CAGR - Compound Annual Growth Rate
Statement of Financial Position
0
50
100
150
200
2017
2018
2019
2020
2021
(%)
Lending Base Total AssetsDue to Depositors Total Equity
Income Statement
0
30
60
90
120
150
(%)
Interest Income Total Operating Expenses Interest Expenses Profit for the Year
2017
2018
2019
2020
2021
TREND ANALYSIS OF FINANCIAL STATEMENTS

L B Finance PLC | Annual Report 2020/21 131
VERTICAL ANALYSIS OF FINANCIAL STATEMENTS
Vertical analysis is a method of Financial Statements analysis in which each line item is listed as a percentage of a base figure within the statement.
Statement of Financial Position Percentage ChangeAs at 31 March 2021 2020 2019 2018 2017 2016
AssetsCash and Cash Equivalents 4% 4% 3% 5% 3% 7%Financial Assets Recognised Through Profit or Loss
- Measured at Fair Value 0% 0% 0% 0% 0% 0%Financial Assets at Amortised Cost - Loans and Receivables 48% 40% 35% 33% 33% 31%Financial Assets at Amortised Cost - Lease Rentals Receivable and
Stock Out on Hire 34% 42% 48% 52% 54% 53%Financial Assets Measured at Fair Value Through Other
Comprehensive Income 0% 0% 0% 0% 0% 0%Other Financial Assets 7% 6% 8% 6% 7% 5%Other Non Financial Assets 1% 1% 1% 1% 0% 1%Investment in Subsidiary 0% 0% 0% 0% 0% 0%Property, Plant and Equipment 6% 6% 5% 4% 3% 2%Intangible Assets 0% 0% 0% 0% 0% 0%
Total Assets 100% 100% 100% 100% 100% 100%
Liabilities
Due to Banks 12% 16% 18% 19% 23% 17%Financial Liabilities at Amortised Cost - Due to Depositors 61% 62% 61% 60% 59% 63%Debt Instruments Issued and Other Borrowed Funds 2% 2% 2% 4% 2% 3%Other Financial Liabilities 2% 2% 1% 1% 2% 2%Other Non Financial Liabilities 1% 1% 2% 1% 1% 1%Current Tax Liabilities 1% 1% 1% 1% 1% 1%Deferred Tax Liabilities 0% 1% 1% 1% 0% 0%Post Employment Benefit Liability 0% 0% 0% 0% 0% 0%Total Liabilities 80% 84% 86% 87% 88% 88%
Equity
Stated Capital 1% 1% 1% 1% 1% 1%Reserves 14% 11% 9% 8% 8% 8%Retained Earnings 5% 4% 4% 4% 3% 3%Total Equity 20% 16% 14% 13% 12% 12%
Total Liabilities and Equity 100% 100% 100% 100% 100% 100%
Stability Leadership Strength Agility Responsibility Sustainability Success Supplementary Information
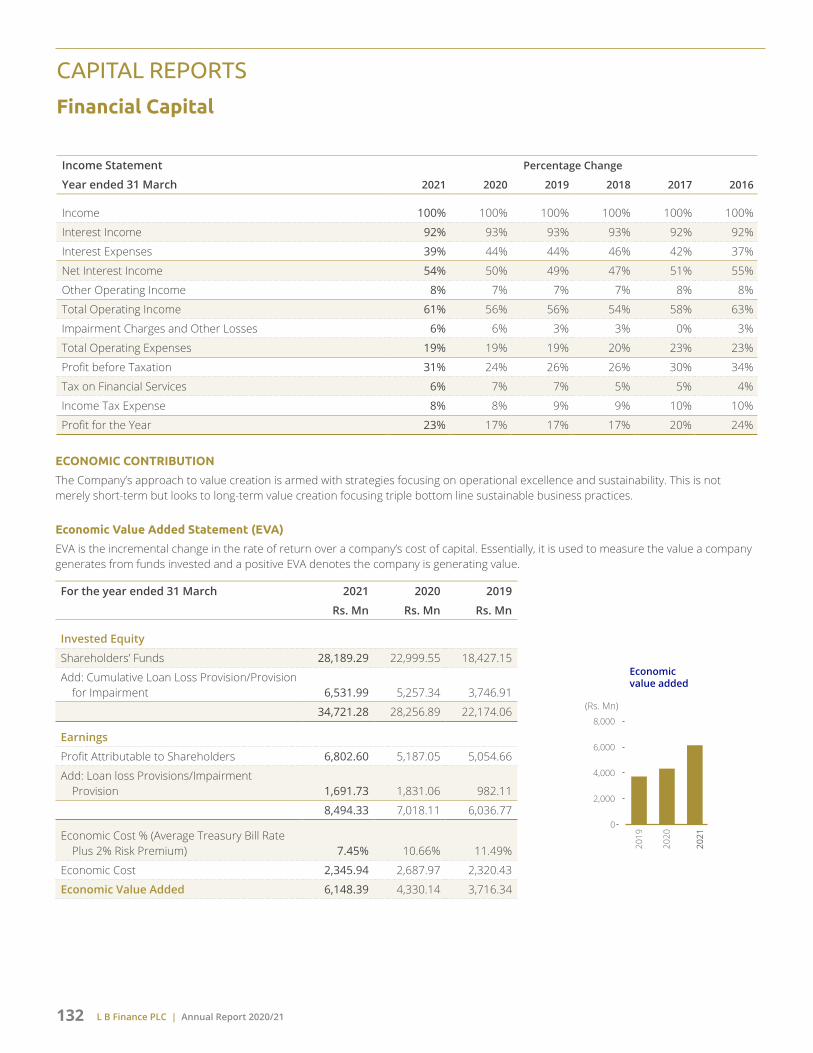
L B Finance PLC | Annual Report 2020/21132
Income Statement Percentage Change
Year ended 31 March 2021 2020 2019 2018 2017 2016
Income 100% 100% 100% 100% 100% 100%
Interest Income 92% 93% 93% 93% 92% 92%
Interest Expenses 39% 44% 44% 46% 42% 37%
Net Interest Income 54% 50% 49% 47% 51% 55%
Other Operating Income 8% 7% 7% 7% 8% 8%
Total Operating Income 61% 56% 56% 54% 58% 63%
Impairment Charges and Other Losses 6% 6% 3% 3% 0% 3%
Total Operating Expenses 19% 19% 19% 20% 23% 23%
Profit before Taxation 31% 24% 26% 26% 30% 34%
Tax on Financial Services 6% 7% 7% 5% 5% 4%
Income Tax Expense 8% 8% 9% 9% 10% 10%
Profit for the Year 23% 17% 17% 17% 20% 24%
ECONOMIC CONTRIBUTION
The Company’s approach to value creation is armed with strategies focusing on operational excellence and sustainability. This is not merely short-term but looks to long-term value creation focusing triple bottom line sustainable business practices.
Economic Value Added Statement (EVA)
EVA is the incremental change in the rate of return over a company’s cost of capital. Essentially, it is used to measure the value a company generates from funds invested and a positive EVA denotes the company is generating value.
For the year ended 31 March 2021 2020 2019
Rs. Mn Rs. Mn Rs. Mn
Invested Equity
Shareholders’ Funds 28,189.29 22,999.55 18,427.15
Add: Cumulative Loan Loss Provision/Provision for Impairment 6,531.99 5,257.34 3,746.91
34,721.28 28,256.89 22,174.06
Earnings
Profit Attributable to Shareholders 6,802.60 5,187.05 5,054.66
Add: Loan loss Provisions/Impairment Provision 1,691.73 1,831.06 982.11
8,494.33 7,018.11 6,036.77
Economic Cost % (Average Treasury Bill Rate Plus 2% Risk Premium) 7.45% 10.66% 11.49%
Economic Cost 2,345.94 2,687.97 2,320.43
Economic Value Added 6,148.39 4,330.14 3,716.34
Economic value added
0
2,000
4,000
6,000
8,000
2019
2020
2021
(Rs. Mn)
CAPITAL REPORTS
Financial Capital

L B Finance PLC | Annual Report 2020/21 133
Market Value Added (MVA)
MVA is the difference between the market value of the Company and the capital contributed by investors. In other words, it is the sum of all Company capital claims held against the market value of debt and equity.
For the Year ended 31 March 2021 2020 2019
Rs. Mn Rs. Mn Rs. Mn
Market Capitalisation
Market Value of Equity 26,262.31 16,690.97 16,635.57
Less: Equity Owners' Funds
Shareholders’ Funds 28,189.29 22,999.55 18,427.15
Total Equity Owners’ Funds 28,189.29 22,999.55 18,427.15
Market Value Added/(Destroyed) (1,926.98) (6,308.58) (1,791.58)
MVAbreakup
0
5,000
10,000
15,000
20,000
25,000
30,000
2019
2020
2021
(Rs. Mn)
Market CapitalisationTotal Equity Owners' Funds
Market value added
-7,000
-5,000
-3,000
-1,000
1,000
3,000
2019
2020
2021
(Rs. Mn)
Stability Leadership Strength Agility Responsibility Sustainability Success Supplementary Information

L B Finance PLC | Annual Report 2020/21134
VALUEDISTRIBUTED
Rs. 29,766 Mn
InterestIncome
Rs. 27,458 Mn
Fee and CommissionIncome
Rs. 2,185 Mn
Net Trading Income
Rs. 6 Mn
Other OperatingIncome
Rs. 117 Mn
ValueGenerated
Rs. 29,766 Mn
16% 10%Economic Value Retained within the Business To Employees Salaries and Benefits
14% 37%Operating Costs To Depositors and Lenders
2019
2020
2021
2019
2020
2021
Rs. 3
,638
Mn
Rs. 4
,927
Mn
Rs. 4
,730
Mn
Rs. 2
,683
Mn
Rs. 2
,987
Mn
Rs. 2
,956
Mn
2019
2020
2021
2019
2020
2021
Rs. 3
,809
Mn
Rs. 4
,657
Mn
Rs. 4
,207
Mn
Rs. 1
3,21
9 M
n
Rs. 1
2,36
2 M
n
Rs. 1
1,12
5 M
n
7%To Providers of Capital
2019
2020
2021
Rs. 2
,252
Mn
Rs. 3
97 M
n
Rs. 2
,060
Mn
16% To Government
2019
2020
2021
Rs. 5
,014
Mn
Rs. 4
,651
Mn
Rs. 4
,508
Mn
Information on the generated and distributed value provides a basic indication of how the Company has created wealth for the stakeholders.
Components of the economic value generated and distributed provide an economic profile of the Company, which may be useful for controlling other performance indicators. Economic value generated and distributed portrays the direct monetary value added to local economy.
DIRECT ECONOMIC VALUE GENERATED AND DISTRIBUTED
For the Year ended 31 March 2021 2020 2019
Rs. Mn % Rs. Mn % Rs. Mn %
Direct Economic Value GeneratedInterest Income 27,457.74 29,160.29 27,363.77 Fee and Commission Income 2,184.95 1,941.63 1,782.07 Net Trading Income 6.32 (2.10) (2.56)Other Operating Income 117.11 123.04 134.74 Economic Value Generated 29,766.12 31,222.86 29,278.02
Economic Value DistributedOperating CostsDepreciation and Amortisation Set Aside 745.24 713.39 435.38 Impairment Charge for Loans and Other Losses 1,691.73 1,831.06 982.11 Training Cost 4.02 18.56 10.95 Other Operating Expenses 1,765.83 2,094.40 2,380.39
4,206.82 14.13 4,657.41 14.92 3,808.83 13.01
To EmployeesEmployees Salaries and Benefits 2,955.81 2,986.63 2,682.61
2,955.81 9.93 2,986.63 9.57 2,682.61 9.16
To Depositors and LendersInterest Expenses 11,125.01 13,218.85 12,361.66
11,125.01 37.37 13,218.85 42.34 12,361.66 42.22
To Providers of CapitalDividend to Shareholders 1,662.17 - 1,662.17 Interest to Debenture Holders 397.79 396.55 589.66
2,059.96 6.92 396.55 1.27 2,251.83 7.69
To GovernmentIncome Tax Expenses 2,913.97 2,683.70 2,441.73 Debt Repayment Levy - 684.71 401.53 VAT and NBT on Financial Services 1,669.32 1,593.85 1,614.09 Crop Insurance Levy 67.71 52.06 51.00
4,651.00 15.63 5,014.32 16.06 4,508.35 15.40
To CommunitySocial Responsibility Projects 37.29 22.52 26.95
37.29 0.13 22.52 0.07 26.95 0.09
Economic Value Retained 4,730.24 15.89 4,926.60 15.78 3,637.79 12.42
Economic Value Distributed 29,766.12 100.00 31,222.86 100.00 29,278.02 100.00
CAPITAL REPORTS
Financial Capital
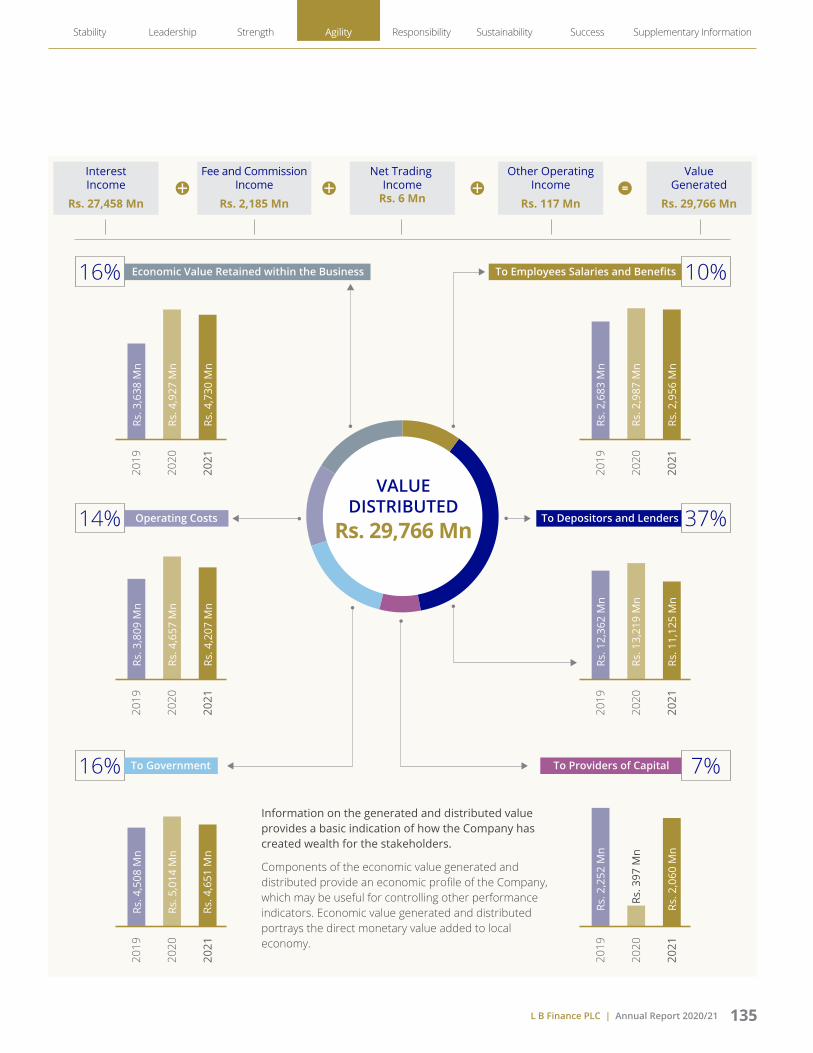
L B Finance PLC | Annual Report 2020/21 135
VALUEDISTRIBUTED
Rs. 29,766 Mn
InterestIncome
Rs. 27,458 Mn
Fee and CommissionIncome
Rs. 2,185 Mn
Net Trading Income
Rs. 6 Mn
Other OperatingIncome
Rs. 117 Mn
ValueGenerated
Rs. 29,766 Mn
16% 10%Economic Value Retained within the Business To Employees Salaries and Benefits
14% 37%Operating Costs To Depositors and Lenders
2019
2020
2021
2019
2020
2021
Rs. 3
,638
Mn
Rs. 4
,927
Mn
Rs. 4
,730
Mn
Rs. 2
,683
Mn
Rs. 2
,987
Mn
Rs. 2
,956
Mn
2019
2020
2021
2019
2020
2021
Rs. 3
,809
Mn
Rs. 4
,657
Mn
Rs. 4
,207
Mn
Rs. 1
3,21
9 M
n
Rs. 1
2,36
2 M
n
Rs. 1
1,12
5 M
n
7%To Providers of Capital
2019
2020
2021
Rs. 2
,252
Mn
Rs. 3
97 M
n
Rs. 2
,060
Mn
16% To Government
2019
2020
2021
Rs. 5
,014
Mn
Rs. 4
,651
Mn
Rs. 4
,508
Mn
Information on the generated and distributed value provides a basic indication of how the Company has created wealth for the stakeholders.
Components of the economic value generated and distributed provide an economic profile of the Company, which may be useful for controlling other performance indicators. Economic value generated and distributed portrays the direct monetary value added to local economy.
Stability Leadership Strength Agility Responsibility Sustainability Success Supplementary Information

L B Finance PLC | Annual Report 2020/21136
INVESTORS
LBF always pay attention to maximise shareholders’ wealth by carefully managing risk and return while crafting the business strategies in the best interest of its shareholders since the lifeblood of LBF is its investors. We engage with our shareholders who are interested and invested in the success and sustainability of our business. Doing so helps us to understand expectations and leads to better outcomes over the long-term.
This helped the Board to build an understanding of what matters to our investors in the long-term and to build a lasting and trusting relationship with our shareholders.
How does LBF Engage with its Stakeholders?
The Board adopts a variety of methods to engagement with it shareholders to understand the view of the shareholders.
The AGM is an important event in the Company’s corporate calendar and an excellent opportunity to engage with shareholders and for shareholders to ask questions from the Board.
Annual report and interim financial statements of the company with the endeavors to provide all shareholders with clear, consistent, high-quality information at regular intervals, in accordance with best market practice and the recommendations of stock market authorities is also another form of communication.
LBF also uses press conferences and media releases to provide briefing about the Company’s strategy, major events concerning the Company’s business as well.
Engagement in Action During COVID-19
Despite the challenges caused by the pandemic, the Company held its 2020 AGM with a attendance of limited number of shareholders presence where possible as a result of the prohibition on public gatherings. The Board also ensured that all shareholders had the opportunity to raise questions at the AGM.
Shareholders Return
Share priceappreciation
0
10
20
30
40
50
(Rs.) 57%
2021Rs. 47.40
2020Rs. 30.13
2020
2021
In light of the challenges imposed by the COVID-19 pandemic and in response to the restrictions imposed on cash dividend from the Central Bank of Sri Lanka, the Board decided not to declare final dividend payment for financial year 2019/20 which was expected to be paid in the first quarter of 2020/21. The Board concluded this difficult decision was prudent to preserve additional capital to continue to serve the needs of the customers in time of crisis while understanding the short-term adverse impact on the shareholders. However, with the improvements in the performance during the year, the Company paid an interim dividend of Rs. 12.00 per share (based on number of shares prior to the share sub-division) during the financial year 2020/21. The Company also proposed a final dividend of Rs. 4.00 share (based on post sub-division of shares) to ensure a
sustainable return to the shareholders of the Company.
Despite the COVID-19 pandemic, the share prices of the Company increased by 57% based on the restated market price per share reflecting the continued investor interest in shares of the Company during the year.
Share Price as at the Beginning of the Year Rs. 120.50
Restated Market Price Based on the Sub-Division Rs. 30.13
Share Price as at the End of the Year Rs. 47.40
Share Price Appreciation Rs. 17.28
Dividend per Share (based on Post Sub-Division) Rs. 7.00
Total Return per Share Rs. 24.28
Total Yield per Share 80.58%
This demonstrates that we remain focused on achieving sustainable, long-term earnings growth and maintain stable dividend income stream to our shareholders.
Share Sub-Division
Based on the recommendations made by the Board, on 10 March 2021 shareholders approved the sub-division of ordinary shares on the basis of a sub-division of every one (01) ordinary share into four (04) ordinary shares, thus increasing the existing 138,514,284 issued ordinary shares of the Company to 554,057,136 ordinary shares without in anyway changing the Stated Capital of the Company, which would remain at Rs. 838,282,159/-. The share split was effected with the intention of lowering the share prices of the shares to a price range which is affordable to most investors and increasing the liquidity of shares.
CAPITAL REPORTS
Financial Capital

L B Finance PLC | Annual Report 2020/21 137
The Colombo Stock Exchange
Colombo Stock Exchange (CSE) ended the financial year on a positive note, despite a very challenging economic and operating environment prevailed throughout the year primarily due to the outbreak of COVID-19 during the first quarter of the financial year. Although the pandemic resulted in an early shock at the start of the year, All Share Price Index (ASPI) stood at 7,121 as at 31 March 2021 reflecting a resilient performance of trading activities at CSE. Standard and Poor’s (S&P SL 20) which tracks the performance of larger blue-chip companies raised to 2,850 points as at 31 March 2021 from 1,947 points as at 20 March 2020 prior to the activities being closed for nearly two months due to the outbreak of COVID-19.
0
2,000
4,000
6,000
8,000
10,000
ASPI, S&P SL 20 Index and Market Turnover
0
2,000
4,000
6,000
8,000
10,000
Market Turnover
Mar
20
Apr 2
0
May
20
Jun
20
Jul 2
0
Aug
20
Sep
20
Oct
20
Nov
20
Dec
20
Jan
21
Feb
21
Mar
21
ASPI
S&P
DF Sector Index
(Rs. Mn) ASPI and S&P
Although, ASPI and S&P SL 20 indexes recovering gradually over the financial year, diversified financial (DF) sector index did not follow the same trend during the first few quarters of the financial year mainly due to the uncertainties surrounding the business growth with the pandemic and the monetary easing offered to the affected customers as per the directions of the Central Bank of Sri Lanka. However, in the late third quarter and the final quarter, DF sector index was more aligned with recoveries reflected in ASPI and S&P SL 20 indexes due to the resurgence of economic activities and expectation that the vaccine could drive the economic recovery.
Performance of LBF Share
LBF share price movement
0
50
100
150
200
250
300
350
Actual Market Price Restated Market Price
(Rs.)
Mar
21
Apr 2
0
May
20
Jun
20
Jul 2
0
Aug
20
Sep
20
Oct
20
Nov
20
Dec
20
Jan
21
Feb
21
As depicted in the graphs above the market price of LBF shares increased by 103.77% at the end of January 2021 from Rs. 146.00 per share at the end of December 2020. There was a continued interest in the shares of the Company and the trading of the Company’s shares peaked to 4.73 Million shares trade in hands at the month of January 2021.
LBF shares traded and turnover
No. of Shares
0
200
400
600
800
1,000
1,200
0
1,000,000
2,000,000
3,000,000
4,000,000
5,000,000
Turnover (Rs. Mn)
(No. of Shares) Turnover (Rs. Mn)
Mar
21
Apr 2
0
May
20
Jun
20
Jul 2
0
Aug
20
Sep
20
Oct
20
Nov
20
Dec
20
Jan
21
Feb
21
Stability Leadership Strength Agility Responsibility Sustainability Success Supplementary Information

L B Finance PLC | Annual Report 2020/21138
Annual Performance
2020/21 2019/20 2018/19
Share Price
Highest (Rs.) 348.75 167.50 129.90
Lowest (Rs.) *42.6 114.00 110.00
Closing (Rs.) *47.4 120.50 120.10
Number of Transactions 21,681 2,995 1,857
Number of Shares Traded 12,559,335 3,552,610 2,845,955
Value of Shares Traded (Rs. Billion) 2.32 0.5 0.33
Number of Days Traded 216 223 218
Average Daily Turnover (Rs. Million) 10.73 2.27 1.41
Market Capitalisation (Rs. Billion) 26.26 16.69 16.70
*Price per share represents the share price after the share sub-division.
Quarterly Performance
Quarter 1 Quarter 2 Quarter 3 Quarter 4
Share PriceHighest (Rs.) 142.00 154.00 151.90 348.75
Lowest (Rs.) 114.80 128.00 129.00 *42.6
Closing (Rs.) 140.00 143.70 146.00 *47.4
Number of Transactions 685 3,540 3,319 14,137
Number of Shares Traded 169,819 1,790,586 1,810,166 8,788,764
Value of Shares Traded (Rs. Million) 23.40 242.09 254.59 1,798.27
Number of Days Traded 35 64 62 55
Average Daily Turnover (Rs. Million) 0.67 3.78 4.11 32.70
*Noticeable reduction in price per share of the quarter 4 represents the share price after the share sub-division.
FLOAT ADJUSTED MARKET CAPITALISATION
The Float adjusted market capitalisation as at 31 March 2021 – Rs. 5,714,447,683/-
The Float adjusted market capitalisation of the Company falls under Option 5 of Rule 7.13.1 (a) of the Listing Rules of the Colombo Stock Exchange and the Company has complied with the minimum public holding requirement applicable under the said option.
LBF SHARE
General Information
As at 31 March 2021 2020
Total Number of Shares in Issue 554,057,136 138,514,284
Public Shareholding 21.76% 21.83%
Beta Value Against ASPI 2.48 1.43
Other Information
Stock symbol LFIN.N0000
Newswire codes of LBF Share:
Bloomberg LFIN.SL
Dow jones LFINN
Reuters LFIN. CM
CAPITAL REPORTS
Financial Capital

L B Finance PLC | Annual Report 2020/21 139
We aim to deliver the expectation of our shareholders through execution of our strategies while serving our customer to meet their needs.
L B Finance prudently manage its earnings with a policy to provide sustainable return to shareholders while giving the management the flexibility to reinvest capital to grow the Company.
We are invested to provide long term value to our shareholders.
L B Finance strive to create value for our shareholder funding in assessing the performance of a fund against the market or industry benchmarks.
We ensure that the company is operated on a foundation of strength and is well-positioned to deliver sustainable returns to our shareholders.
MARKET CAPITALISATION (AS AT 31 MARCH)
Year Shareholders’ Funds
Rs. Mn
LFIN Market Capitalisation
Rs. Mn
CSE Market Capitalisation
Rs. Mn
Market Capitalisation as % of CSE Market
Capitalisation
2016 10,479 14,696 2,586,150 0.57%
2017 12,510 16,400 2,662,860 0.62%
2018 15,349 16,604 3,032,710 0.54%
2019 18,427 16,635 2,605,899 0.64%
2020 22,999 16,690 2,128,266 0.78%
2021 28,189 26,262 3,111,259 0.84%
2019
2020
2021
29.9
3%
26.5
8%
Return onEquity
25.0
4%
2019
2020
2021
Rs. 9
.12
Rs. 9
.36
Rs. 1
2.28
EarningsPer Share
2019
2020
2021
Rs. 3
3.26
Rs. 4
1.51
Rs. 5
0.88
Net Assets Valueper Share
2019
2020
2021
3.29
3.22
3.86
Price Earnings (PE)
2019
2020
2021
Rs. 1
8,42
7 M
n
Rs. 2
2,99
9 M
n
Rs. 2
8,18
9 M
n
ShareholderFunds
As indicated above the market capitalisation of the Company increased from Rs. 16.69 Billion in 2020 to Rs. 26.26 Billion in 2021 accounting for 0.84% (2020 – 0.78%) of the total market capitalisation. The Company’s shares are one of the most prominent shares among the listed shares of the Company. The total market capitalisation of the CSE as at 31 March 2021 was Rs. 3,111 Billion compared to Rs. 2,128 Billion as at 31 March 2020 an increase of 46.19%. Market capitalisation of the Company also increased significantly from Rs.16.69 Billion to Rs. 26.26 Billion or 57.34% increase.
KEY SHAREHOLDER DATA
Stability Leadership Strength Agility Responsibility Sustainability Success Supplementary Information

L B Finance PLC | Annual Report 2020/21140
CAPITAL REPORTS
Financial Capital
FINANCIAL CAPITAL ANALYSIS
Dupont analysis (ROE analysis)
Return onEquity (ROE)
0
5
10
15
20
25
30
(%)
2019
2020
2021
Profit after tax/Average assets
0
1
2
3
4
5
(%)
2019
2020
2021
Average assets/Averageshareholders’ funds
0
2
4
6
8
(No. of Times)
2019
2020
2021
Income/Averageassets
0
5
10
15
20
25
(%)
2019
2020
2021
Profit/Income
0
5
10
15
20
25
(%)
2019
2020
2021
Interest income/Average assets
0
5
10
15
20
25
(%)
2019
2020
2021
Non-interest income/Average assets
0.0
0.5
1.0
1.5
2.0
(%)
2019
2020
2021

L B Finance PLC | Annual Report 2020/21 141
LARGEST SHAREHOLDERS OF THE COMPANY
Shareholders As at 31 March 2021 As at 31 March 2020
No. of No. of
Shares (%) Shares (%)
1 Vallibel One PLC 286,729,600 51.751 71,682,400 51.751
2 Royal Ceramics Lanka PLC
Commercial Bank of Ceylon PLC/Royal Ceramics Lanka PLC 144,492,928 26.079 36,123,232 26.079
3 Esna Holdings (Pvt) Ltd 56,249,600 10.152 14,062,400 10.152
4 BNYM Re-Frontaura Global Frontier Fund LLC 8,853,464 1.598 2,290,135 1.653
5 Pershing LLC S/A Averbach Grauson & Co. 8,024,312 1.448 2,006,078 1.448
6 Hatton National Bank PLC/Mr. Karuna Ranaraja Ekanayaka
Mudiyanselage Dharshan Maduranga Bandara Jayasundara 2,600,000 0.469 401,249 0.290
7 Janashakthi Insurance PLC - NON PAR 2,000,000 0.361 500,000 0.361
8 Mr. K D A Perera 1,708,116 0.308 438,996 0.317
9 Mr. N Udage 1,616,540 0.292 329,135 0.238
10 Finco Holdings (Private) Limited 1,566,358 0.283 - -
11 Seylan Bank PLC/W D N H Perera 1,280,000 0.231 - -
12 Mr. A A Page 1,259,200 0.227 314,800 0.227
13 Mr. A M Weerasinghe 1,220,944 0.220 - -
14 People’s Leasing & Finance PLC/Dr. H S D Soysa & Mrs. G Soysa 923,264 0.167 230,816 0.167
15 Mrs. P C Cooray 834,528 0.151 208,632 0.151
16 J B Cocoshell (Pvt) Ltd 803,712 0.145 237,626 0.172
17 Mr.N P D E Samaranayake 800,000 0.144 240,000 0.173
18 Commercial Bank of Ceylon PLC/Janashakthi Capital Limited 640,000 0.116 - -
19 Mr. W D N H Perera 638,180 0.115 - -
20 Mr. P Somadasa 578,700 0.104 138,051 0.100
522,819,446 94.362 129,203,550 93.278
Others 31,237,690 5.638 9,310,734 6.722
Total 554,057,136 100.000 138,514,284 100.000
DISTRIBUTION OF SHAREHOLDINGS AS AT 31 MARCH 2021
From To No. of Shareholders
No. of Shares %
1 1,000 1,744 507,678 0.09
1,001 10,000 1,273 4,804,807 0.87
10,001 100,000 496 14,055,043 2.54
100,001 1,000,000 63 17,088,546 3.08
Over 1,000,000 14 517,601,062 93.42
3,590 554,057,136 100.00
No. of shareholders
0 500 1,000 1,500 2,000
1 - 1,000
1,001 - 10,000
10,001 - 100,000
100,001 - 1,000,000
Over 1,000,000
Stability Leadership Strength Agility Responsibility Sustainability Success Supplementary Information

L B Finance PLC | Annual Report 2020/21142
DISTRIBUTION OF SHAREHOLDINGS AS AT 31 MARCH 2020
From To No. of Shareholders
No. of Shares %
1 1,000 1,235 286,758 0.09
1,001 10,000 499 1,730,147 0.87
10,001 100,000 127 3,690,102 2.54
100,001 1,000,000 17 3,988,348 3.08
Over 1,000,000 8 128,818,929 93.42
1,886 138,514,284 100.00
COMPOSITION OF SHAREHOLDERS
2020/21 2019/20
Category No. of Shareholders
No. of Shares
% No. of Shareholders
No. of Shares
%
Local Individuals 3,414 35,311,308 6.37 1,766 7,246,739 5.23
Local Institutions 147 500,874,760 90.40 94 124,148,216 89.63
Foreign Individuals 25 535,292 0.10 21 131,432 0.09
Foreign Institutions 4 17,335,776 3.13 5 6,987,897 5.04
Total 3,590 554,057,136 100.00 1,886 138,514,284 100.00
SHARE PRICES FOR THE YEAR
2020/21 Date 2019/20 Date
Market Price per Share
Highest During the Period Rs. 348.75 27 January 2021 Rs. 167.50 18 February 2020
Lowest During the Period *Rs. 42.60 24 March 2021 Rs. 114.00 24 April 2019
As at End of the Period *Rs. 47.40 Rs. 120.50
*Price per share represents the share price after the sub-division.
SHARE TRADING DETAILS
2020/21 2019/20
No. of Transactions 21,681 2,995
No. of Shares Traded 12,559,335 3,552,610
Value of Shares Traded (Rs.) 2,318,348,085 507,729,473
PUBLIC HOLDING
Public Holdings percentage as at 31 March 2021 21.76%
Number of shareholders representing the above percentage 3,582
No. of shareholders
0 300 600 900 1,200 1,500
1 - 1,000
1,001 - 10,000
10,001 - 100,000
100,001 - 1,000,000
Over 1,000,000
CAPITAL REPORTS
Financial Capital

L B Finance PLC | Annual Report 2020/21 143
DIRECTORS’ SHAREHOLDINGS
Names of Directors No. of Shares as at 31 March 2021
As a % of Total Shares
No. of Shares as at 31 March 2020
As a % of Total Shares
Mrs. A K Gunawardhana - - - -
Mr. K D D Perera - - - -
Mr. J A S S Adhihetty 424,480 0.077 106,120 0.077
Mr. N Udage 1,616,540 0.292 329,135 0.238
Mr. B D A Perera - - - -
Mr. R S Yatawara 7,620 0.001 905 0.001
Mrs. Y Bhaskaran - - - -
Mr. M A J W Jayasekara - - - -
Mrs. Ashwini Natesan - - - -
Mr. D Rangalle - - - -
DEBENTURES
In December 2017, L B Finance raised Rs. 3.0 Billion to boost business growth opportunity, reducing the mismatch of maturity period, to improve the capital adequacy of the Company and to strengthen Tier II capital position.
Year 2020/21 2019/20
Issued Date 11-Dec-17 11-Dec-17
Type of Debenture Type A Type B Type A Type B
Maturity Date 11-Dec-22 11-Dec-22 11-Dec-22 11-Dec-22
CSE Listing Listed Listed Listed Listed
Code LFIN/ BD/11/12/22-C2 387-A-12.75
LFIN/ BD/11/22/22-C2 388-B-13.25
LFIN/ BD/11/12/22-C2 387-A-12.75
LFIN/ BD/11/22/22-C2 388-B-13.25
Interest Payment Frequency Bi-Annually Bi-Annually Bi-Annually Bi-Annually
Coupon Interest Rate 12.75% p.a 13.25% p.a 12.75% p.a 13.25% p.a
Traded Yield (%) - - - 13.10%
No. of Debentures 10,000,000 20,000,000 10,000,000 20,000,000
Amount (Rs. Mn) 1,000 2,000 1,000 2,000
Market price
Highest (Rs.) Did not trade during the year
Did not trade during the year
Did not trade during the year
100.34
Lowest (Rs.) 100.34
Close (Rs.) 100.34
Credit Ratings
The Company’s credit rating, A- (lka), was affirmed by Fitch Ratings Lanka Limited in 2021.
Credit Rating - Debentures
The credit rating of the Company’s Senior and Subordinated Debentures was affirmed at A- (lka) and BBB (lka) by Fitch Ratings Lanka Limited.
Stability Leadership Strength Agility Responsibility Sustainability Success Supplementary Information

HOW IT ADD VALUESManufactured capital supports our day-to-day operations and enables the delivery of our services to customers
MANUFACTURED CAPITAL
WHAT IT INCLUDES LBF’s Manufactured capital consists of the Company’s physical assets ranging from our branches, our digital channels to IT infrastructure and network architecture that are an integral part of our business model
STRATEGIC DRIVERS
Strengthen LBF’s physical and digital footprint
Adoption of world class IT systems
Improve customer centricity of distribution channels
INPUT
Fit-for-purpose branch network
Invest in core systems and processes
Customer focused, digitally enabled workforce
CHALLENGES
The cost involved in keeping up with rapid changes in technology
Ensuring timely and relevant infrastructure to support the Company’s growth strategy
Competitive landscape in regional markets
Difficulty in planning for the long term due to political instability and policy inconsistencies
1 2 3
TRADE OFF
Investing in digital channels (Manufactured capital) will drive better customer experiences (Social and Relationship capital) and thereby enhance the Company’s reputation (Intellectual capital). Digitization and automation also enhances the work environment and contributes towards employee motivation (Human capital)
4
Branches Branches relocated
Gold loan centres
Invested in IT infrastructure
152 04 17 Rs. 46.40 Mn
CAPITAL REPORTS
MC
L B Finance PLC | Annual Report 2020/21144

Investment in land and building
Cash deposit machines
Branches in Myanmar
Branch expansion
Digital products
Smart branches
Rs. 181.79 Mn 24 12
KEY OUTPUT
Modernized branches
Premier branches
Digital wallet users
FUTURE
Build and expand strong digitally enabled financial institution
7
8
SDG impactRelated material themes and drivers Related stakeholders and concerns
Customer satisfaction
Global expansion
Technology advancement
Innovation
Improving access to finance
Ensuring financial sustainability
SPACE FOR DEVELOPMENT
Diversify distribution channels
Launch alternate distribution channels
Introduce non-financial services
5 APPROACHES OF MANAGING MANUFACTURED CAPITAL OUTCOMES
Continuously improve branch accessibility and facilities
Provide digital support to assist employees to maintain the Company’s service excellence parameters
Establish dedicated teams to conduct tech-based research
Launch of an industry leading digital wallet for smartphone users
6
Invest made on core system and process
Visit web page for our philosophy, Management approaches and analysis of Manufactured Capital
L B Finance PLC | Annual Report 2020/21 145
Stability Leadership Strength Agility Responsibility Sustainability Success Supplementary Information
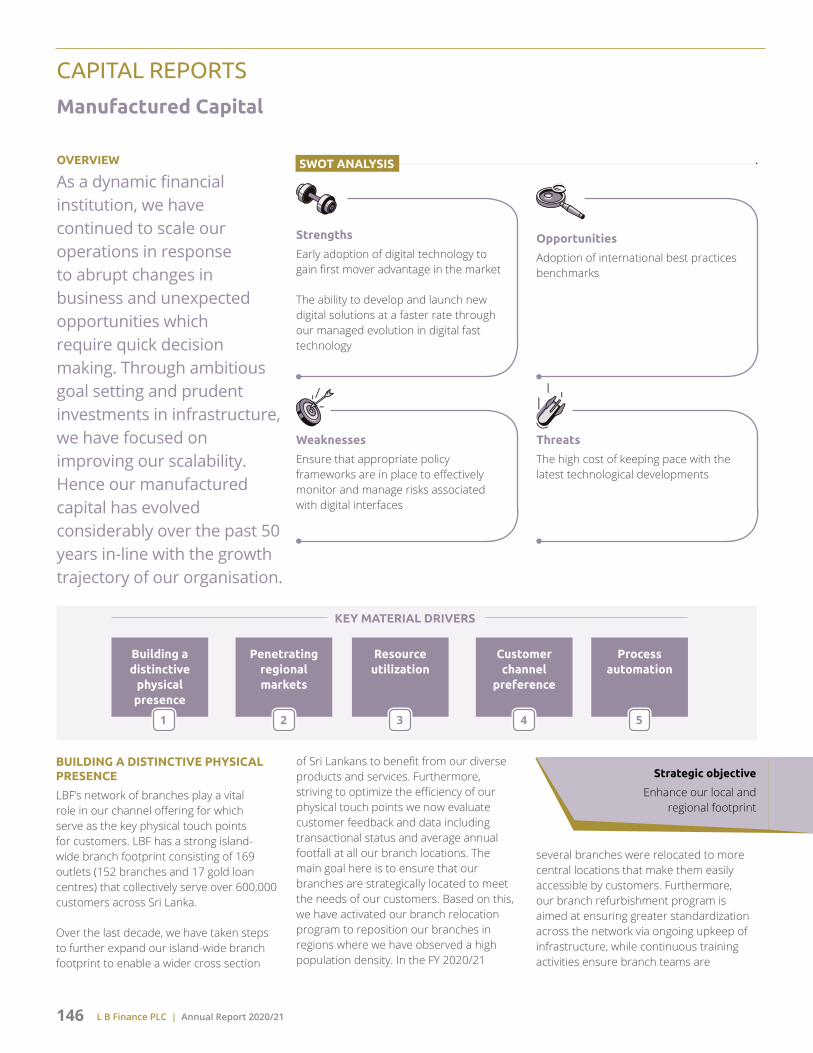
L B Finance PLC | Annual Report 2020/21146
CAPITAL REPORTS
Manufactured Capital
OVERVIEW
As a dynamic financial institution, we have continued to scale our operations in response to abrupt changes in business and unexpected opportunities which require quick decision making. Through ambitious goal setting and prudent investments in infrastructure, we have focused on improving our scalability. Hence our manufactured capital has evolved considerably over the past 50 years in-line with the growth trajectory of our organisation.
Strengths
Early adoption of digital technology to gain first mover advantage in the market
The ability to develop and launch new digital solutions at a faster rate through our managed evolution in digital fast technology
Weaknesses
Ensure that appropriate policy frameworks are in place to effectively monitor and manage risks associated with digital interfaces
Opportunities
Adoption of international best practices benchmarks
Threats
The high cost of keeping pace with the latest technological developments
Building a distinctive
physical presence
Penetrating regional markets
Resource utilization
Customer channel
preference
Process automation
BUILDING A DISTINCTIVE PHYSICAL PRESENCE
LBF’s network of branches play a vital role in our channel offering for which serve as the key physical touch points for customers. LBF has a strong island-wide branch footprint consisting of 169 outlets (152 branches and 17 gold loan centres) that collectively serve over 600,000 customers across Sri Lanka.
Over the last decade, we have taken steps to further expand our island-wide branch footprint to enable a wider cross section
of Sri Lankans to benefit from our diverse products and services. Furthermore, striving to optimize the efficiency of our physical touch points we now evaluate customer feedback and data including transactional status and average annual footfall at all our branch locations. The main goal here is to ensure that our branches are strategically located to meet the needs of our customers. Based on this, we have activated our branch relocation program to reposition our branches in regions where we have observed a high population density. In the FY 2020/21
Strategic objective
Enhance our local and regional footprint
SWOT ANALYSIS
several branches were relocated to more central locations that make them easily accessible by customers. Furthermore, our branch refurbishment program is aimed at ensuring greater standardization across the network via ongoing upkeep of infrastructure, while continuous training activities ensure branch teams are
KEY MATERIAL DRIVERS
1 2 3 4 5

L B Finance PLC | Annual Report 2020/21 147
Taking a major step to diversify our overall branch proposition, we unveiled the Premier branch concept in 2019. This was done in response to the expectation of a highly personalized experience by our high net worth depositors. The Premier branch concept demonstrates LBF’s commitment to provide a world-class branch experience through the combination of technology and human interaction.
Our flagship Premier branch located at Dharmapala Mawatha, Colombo 07, with its relaxed ambiance and interactive environment sets the tone for our premier offering.
equipped to maintain LBF’s high service standards. Supported by these resources, our branch teams continue to increase the engagement with customers and potential customers in their respective areas, enabling each branch to develop a loyal customer base. These efforts in turn have added a significant boost to the Company’s Return on Equity (ROE) over the past years.
Year 2016/17 2017/18 2018/19 2019/20 2020/21
Branches opened 08 05 04 02 04
Relocations 03 04 13 05 04
16 136 1,143 711
16 188 1,729 865
7 101 1,377 815
10 213 2,551 1,609
15 293 2,766 1,719
6 123 1,376 806
64 2,061 6,149 5,849
6 167 2,058 1,145
12 254 2,654 1,490
LB Premier branch
NORTHERN PROVINCE
EASTERN PROVINCE
NORTH CENTRAL PROVINCE
NORTH WESTERN PROVINCE
CENTRAL PROVINCE
UVA PROVINCE
WESTERN PROVINCE
SABARAGAMUWA PROVINCE
SOUTHERN PROVINCE
Branches
Gold loan centres
Employees
152
17
3,536
Branches Employees Population 2018 (‘000) GDP 2019 (Rs. Bn)
Stability Leadership Strength Agility Responsibility Sustainability Success Supplementary Information

L B Finance PLC | Annual Report 2020/21148
PENETRATING REGIONAL MARKETS
Venturing beyond Sri Lanka to the regional market, LBF set up LB Microfinance Myanmar Company (LBMF) in December 2017 to penetrate into Myanmar’s robust Microfinance market. Over the past years, LBMF has continued to make good headway in its target market in the Bago region and Magway region of Myanmar. Having first started up in the small town of Pyay, LBMF has since expanded its branch network to the several regions in Myanmar.
Page 84 for more information
RESOURCE UTILIZATION
Industry leading digital channels
We believe that technology driven solutions are the most cost effective and efficient way to ensure our manufactured capital serves its purpose of reaching out to customers. Our goal is to present a versatile range of digital solutions to encourage increased digital adoption among our customers. It is this premise that has led LBF to steadily expand its suite of digital channels over the past years.
Today LBF offers a comprehensive range of mainstream digital channels such as our digital suite also includes Cash Deposit Machines (CDM). CDM’s which form part of the branch infrastructure, are digitally connected to our core systems.
However, what truly sets us apart from our peers is the LB CIM (Cash In Mobile), the app-based mobile wallet for smartphone users launched in 2019. Since its launch we have been continuously updating the CIM value proposition to give the customer a cutting edge wallet experience. We made some notable strides in the year under review, to ensure CIM is the only wallet application in the local market equipped with the highest level of network integration with the core banking system.
Best practice digital marketing
Unique digital experiences for
different customer segments
Creating distinctive digital customer
experience
Relevant and valued engagements
Creating lasting relationships
Leading rapid development
Mass adoption
Building a strong commercial digital
business
Enabling new markets
Secure ‘Always on’ (24/7)
reliable service
Enable digital communities D
IGIT
AL R
ELAT
ION
SHIP
AT
CEN
TRE
OF
CUST
OM
ER
RELA
TIO
NSH
IP
CAPITAL REPORTS
Manufactured Capital
Locations
12
LB Microfinance (Pvt) Ltd.Myanmar
Branch opening

L B Finance PLC | Annual Report 2020/21 149
LB CIM wallet, is a multi-faceted digital banking solutions offered in the form of a smartphone app, built with ultra-simple UI/UX and trilingual functionality to cater all communities in Sri Lanka. LB CIM app has two distinct products; the CIM Customer App
and CIM Business App, each tailored to meet the specific needs of the customer as well as the merchants.
CIM Customer App
Earn an attractive interest for the balance in CIM digital account (secured under the deposit insurance scheme of the Central Bank of Sri Lanka)
Review the status and pay the installments for LB lease/loans or gold loans anytime
Check FD portfolio details
Link bank accounts and pull money using JustPay facility
Send money to anyone, any bank, anytime instantly
Reload mobiles and pay all utility bills
Settle credit card bills with no convenience fee
Pay any insurance premium real time
Make payments at LankaQR accepted +200,000 merchants anywhere
Settle any payment automatically using standing order feature
Keep track of earnings and expenses through the transaction history and the monthly e-statement
CIM Business App
Integrated with LankaQR to facilitate inter-operability between mobile wallets whilst offering the lowest fees in the market
Convenient and cost effective solution to make supplier payments, utility bill payments, salary payments and money transfers to any third party savings or current account
Get money credited to the wallet savings account directly to start earning interest instantly
Direct debit instructions in real time
Real time tracking of all transactions
Cost containment and increased efficiencies
Cost control goes hand in hand with efforts to develop LBF’s manufactured capital. In this regard, we regularly review our cost structures to determine the optimal ratio of owned and leased properties to support our branch network. At the same time, we have established cost saving targets for our branches and maintain a strong focus on continuous improvement to optimise economies of scale in all our channel management activities. The progress made in achieving these plans are monitored on a regular basis.
Growth in property,plant and equipment
0
2,000
4,000
6,000
8,000
10,000
2018
2017
2019
2020
2021
Rs.Mn
SURVEY INSIGHTSStudy conducted by: The Department of Marketing ManagementUniversity of Sri Jayewardenepura
0
50
100
150
200
250
Strongly Satisfied SatisfiedModerateDissatisfiedStrongly Dissatisfied
Freq
uenc
y
Accessibility to the branch
Stability Leadership Strength Agility Responsibility Sustainability Success Supplementary Information

L B Finance PLC | Annual Report 2020/21150
CUSTOMER CHANNEL PREFERENCE
Customer segment Branches & gold loan centres
LB digital wallet
Connected ATMs
Social media
LB e-connect
Marketing officers
CDMs Call centre
Individual customerKids/ teenagers
Millennials
Young families
Established families
Mature well-off
Senior citizens
Corporate customersCorporates/ institutions
SME/MSME
PROCESS AUTOMATION
Network support
We believe a strong, reliable network support system is another vital component of our manufactured capital base. It provides mission critical support to ensure the smooth functioning of day-to-day operations with minimum downtime to the customer. In the year under review we focused on improving our structures, unifying systems, as well as automating, digitizing and simplifying processes in order to minimize the interruptions to our workflow systems and prevent systems downtime during the COVID-19 pandemic situation. Key highlights include:
Creating a remote work environment to assist employees to continue to work-from-home during the two months island-wide lockdown period. This included automation of the call centre activities to facilitate call centre operators also to work from home.
Introduced a load balancing solution to maintain system availability to facilitate the increase in the digital transaction load generated as a result of the pandemic.
Established the primary data center at the Sri Lanka Telecom tier III data center located at Pitipana. A secondary data center was also set up at the Dialog
facility in Pothuwarawa. A series of live drills were carried to test the capacity of both sites to support LBF’s operations for an extended period of time.
The latest teleconferencing equipment was commissioned at the Company’s Board room in order to facilitate a hybrid AGM.
Set up the LBF innovation center with a dedicated team to focus on developing customised solutions to strengthen LBF’s network support systems.
Completed the data warehousing project, all the transactional data was brought to a common platform enabling business units to directly access analytical data. We invested in the TABLEAU software system which works to enhance the visualization and analytical capability of information with the use of dashboards. The first phase of the dashboard initiative was rolled out to the deposit and gold loan segments. Developed
using predictive analytics as well as external scenario analysis, the dashboard gives the management a robust set of indicators to forecast business performance over time.
Gaining efficiencies
We have continued to leverage on technology to streamline and re-engineer internal processes to be able to meet LBF’s exceptional customer service standards in a more cost effective manner. Some of the initiatives implemented during the year include;
Using the functionality of Eclipse - LBF’s core system, an end-to-end digital solution was introduced to support the leasing business with the entire workflow system starting from loan origination all the way up to credit approval fully digitized and made a paperless operation. To operationalize the system at ground level, a mobile app was also developed for field staff. The new digitized workflow system which was developed during the lockdown period and rolled out immediately thereafter
Strategic objective
Adapting world class systems and processes
CIM transactions CIM App downloaded
+100,000 +60,000
CAPITAL REPORTS
Manufactured Capital

L B Finance PLC | Annual Report 2020/21 151
has led an improvement in the average lead time between loan origination and disbursement. This is attributed to the fact that field staff can now fulfill almost the initial screening requirements immediately through the app itself.
The gold loan system was integrated to the LB CIM mobile app to enable customers to manage their settlements and review their status via the app.
An AI based Chatbot was introduced to the corporate website as well as all social media platforms to manage routine
queries and thereby reduce the load on the call centre.
Robotic process automation tools were used to streamline a number of key back office credit processes and also monitor the insurance renewal process for leased vehicles.
Resources at the innovation center were further expanded with a team of new data scientists being recruited to conduct research to determine areas for cost reduction.
Enhanced working environment
Investing in manufactured capital brings benefits to our employees as well. It creates a more conducive working environment and also eases employees work stress. The most notable example for the current financial year is the facilitation of the remote working environment which allowed employees to work from home during the pandemic. The mobile app created for field staff of the leasing business is also another good example of how developments to LBF’s manufactured capital has benefited our employees.
Creating value for manufactured capital
Reaping benefits of investing in manufactured capital
By enabling process innovations and knowledge sharing through investment in technology and platforms expenditure in IT infrastructure
Value for LBFValue for customer
A strong physical and digital presence reinforces LBF’s credibility and competitive position in the market
A robust multi channel environment that caters to the preferences of all customer segments
Value for employee
The knowledge and expertise gained by working in a sophisticated digital workplace
Investing in infrastructure
facilities for the branches
New employment opportunities opening up
Advance the IT infrastructure to serve the
customer channel preferences
Enhance the financial inclusion and the financial
literacy
Extend our products and services to a wider geographical location
FCHC SC
IC
Investment on front-end and
backend systems
branches
Some existing jobs may become
redundant and some new jobs creates from technology
Develop new ICT competencies and
digital skills
World class ICT, product innovation
and business process efficiency reduce the time of the business
transactions
Process innovations and knowledge sharing through investment in technology and platforms
FCHC
ICSC
Increase Decrease
Stability Leadership Strength Agility Responsibility Sustainability Success Supplementary Information

L B Finance PLC | Annual Report 2020/21152
Tradeoff between capitals
Financial Human Intellectual Manufactured Social & Relationship
Natural
S M L S M L S M L S M L S M L S M L
Investment in digital finance
Branch expansion
Branch relocations
S – Short term M – Medium term L – Long term Increase Decrease Neutral
Building for the future
LBF continuously tries adopt to technology, innovate simpler processes and create infrastructure that are aligned with business objectives.
Short term (<1) Medium term (1-3) Long term (3-5)
Improve the integration between the core business activities and LB CIM wallet
Expand the range of low cost digital channels
Branch expansion beyond the South Asian region
Build branch level digital infrastructure Leverage on the capabilities of the data warehouse and the team of in-house data scientists to find more productive ways of using data to grow the business
Invest in cloud-based network architecture
GROWTH SUSTAINABLE OPPORTUNITYFully fledged digital branches
VISIONBe Sri Lanka’s No. 1 tech-driven financial entity
CAPITAL REPORTS
Manufactured Capital
Throughout the challenging year, we are proud of the support we have been able to provide to our customers. Now, we are committed to help them rebuild. We continue to observe a growing trend towards online transactions and servicing, further reducing customers’ use of our branch infrastructure. Downloads of our mobile banking apps continue to increase as more and more customers look for ways to self-serve.
Mr. Niroshan UdageDeputy Managing Director

L B Finance PLC | Annual Report 2020/21 153
2010/11
2018/19
2012/13
2020/21
2014/15 2016/172011/12
2019/20
2013/14 2015/16 2017/18
Fully-fledged end-to-end core financial application
13 LBF outlets strategically relocated to areas where customer can experience better convenience
LBF acquired premium properties in Colombo and Kandy
Opened 03 branches in Myanmar
23 CDMs were installed at high volume branches
Launched of ORACLE Fusion system and backend ERP system
Opened the Digital Financial Services (DFS) unit
Paperless Board room initiative, introduction of VISA debit card with highest security features
Opened 04 branches in Myanmar
Set up LBF innovation center
18 gold loan centres converted as fully fledged branches
04 branches added to the branch network
Introduced AI based Chatbots
Social media marketing and introduction of a daily collection loans system
Opened 08 branches
Introduce giftstore.lk – an online e-commerce site and CEFT integration for LB e-connect customers
Savings accounts with ATM integration, SMS alerts on transactions
Opened 06 branches in Myanmar
Relocated 05 outlets
Introduced the CIM (Cash In Mobile) wallet
SLIPS integration
ISO 27001:2013 certification
Opened 09 branches and 02 gold loan centres
Implemented a fully-fledged Treasury Management System (TMS)
Introduced mobile based microfinance solutions
05 new branches were opened
LBF expanded its footprint beyond Sri Lanka by setting up LB Microfinance Myanmar Company Limited (LBMF)
MANUFACTURED CAPITAL JOURNEY
Stability Leadership Strength Agility Responsibility Sustainability Success Supplementary Information

HOW IT ADD VALUESA diverse, highly skilled and multi talented workforce whose passion and commitment to LBF’s corporate culture and work ethic, creates a solid foundation for the Company to execute its strategy and meet stakeholder deliverables
HUMAN CAPITAL
WHAT IT INCLUDES Our Human capital refers to the collective knowledge, expertise and innovative mindset of our employees as well as their commitment to take ownership for LBF’s strategy and future growth prospects
STRATEGIC DRIVERS
Improve workforce productivity
Invest in strengthening employee knowledge and skills
Empower employees through better work life balance
Provide opportunities for innovation and idea generation
INPUT
Workforce composition
Pay and benefits
Skills, qualifications and competencies
Regulatory compliance
CHALLENGES
Attracting, retaining key staff in the highly competitive financial services sector
Meeting the high standards required from an employer of choice
Addressing change management issues arising from increased digitization and process automation
1 2 3
TRADE OFF
The cost of hiring new employees and investing on existing employees inevitably impacts our financial capital. LBF’s “Think Forward” digital strategy launched in 2018 forms part of a broader effort to manage our headcount and achieve cost saving at the same time. To further underscore the
importance of cost control, we have also set specific targets to drive continuous improvement across all aspects of the Human Resources (HR) model. Although cost saving is always top of mind, we do remain firm that it will not be at the expense of the health, wellbeing and development of our employees. This
is based on the fundamental premise that a healthy and motivated workforce will bring consistent benefit to boost the Company’s financial performance (Financial capital), improve service standards (Social and Relationship capital) and strengthen brand reputation (Intellectual capital)
4
Total No. of employees
New employees
No. of interns
Investment on training
Employees were promoted
3,536 999 262 Rs. 4.01 Mn 1,237
CAPITAL REPORTS
HC
L B Finance PLC | Annual Report 2020/21154

Female employees
Employee work life balance
Automated performance evaluation
Virtual training
Virtual meeting
Training hours
1,407 7,737
KEY OUTPUT
Leadership capability
Workforce capability
Workforce performance
FUTURE
Build a strong employer brand and emerge as one of the top employer of choice
7
8
SDG impactRelated material themes and drivers Related stakeholders and concerns
Recruitment and retention
Performance management
Training and development
Employee engagement
Occupational health, safety and wellbeing
Remuneration and benefits
Rewards and recognition
Career progression
Work-life balance
SPACE FOR DEVELOPMENT
Encouraging and motivating employees to stay aligned with LBF’s organisational values and culture
Developing critical skills and succession planning to achieve long term strategic objectives
Promote employee wellbeing at all levels
5 APPROACHES TO MANAGING HUMAN CAPITAL OUTCOMES
Recruitment and retention Performance management Learning and competency development Organisational development and design Reward and recognition Workforce and succession planning Employee engagement Employee wellness
6
Diversity and inclusivity
Engagement and wellbeing
Visit web page for our philosophy, Management approaches and analysis of Human Capital
L B Finance PLC | Annual Report 2020/21 155
Stability Leadership Strength Agility Responsibility Sustainability Success Supplementary Information

L B Finance PLC | Annual Report 2020/21156
CAPITAL REPORTS
Human Capital
OVERVIEW
Our employee vision is to position LBF as an employer of choice. We believe doing so will enable LBF to attract and retain the best in-class talent needed to fulfill the Company’s purpose “to use our financial expertise to do good for individuals, families, businesses and society”.
Strengths
Ability to recruit and retain a multi-talented team by providing them with competitive remuneration and a robust work environment that promotes engagement and performance-based rewards
Weaknesses
Non-availability of a streamlined mechanism to offer emotional and psychological support to employees in the event of an unforeseen crisis such as the COVID-19 pandemic
Opportunities
Create a framework to help employees adapt to a better work-life balance in the post COVID-19 era
Improve succession planning at all levels to minimize the dependency on a few key individuals
Threats
High turnover among frontline branch teams due to stiff competition in the NBFI sector
OUR PEOPLE MANAGEMENT MODEL
LBF has a seasoned people management model in place to support its routine business needs. Compliance and best practices are key pillars of our people management model. LBF remains fully compliant with all applicable labour law. Going beyond mere compliance, our people management model is benchmarked against globally accepted best practices for human resource management.
Over the years, our core model had continued to evolve dynamically in response to the developments associated with the nature of our business as a financial services institution.
As highly customer-centric organisations, finance companies the world over face similar people related challenges. The task of attracting the right talent to suit specific job roles remains a universal challenge for all financial institutions, especially given the complex and rapidly changing financial environment. LBF too continues to experience these challenges.
During the period, LBF was able to create numerous employment opportunities to satisfy the staffing needs of its new branches opening up across the country. However, having more or less reached our expansion goals, the number of new positions at branches have started to level out in recent times. As such our recruitment programme of late has been targeting a proportionally younger employee pool. This strategy is in-line with our efforts to recruit millennials who have a greater appetite for success and thus can be nurtured and cultivated to match the Company’s requirements.
SWOT ANALYSIS
KEY MATERIAL DRIVERS
Our people management
model
1
Our employee proposition
2
Sustaining the employee
resource
3
Creating an entrepreneurial and innovation
culture
4
Life at LB
5
Human resource
accounting
6

L B Finance PLC | Annual Report 2020/21 157
Another challenge we have encountered in recent years stems from LBF’s “Think Forward” strategy which focuses on creating a fully digitized ecosystem to support the Company’s internal operations and distribution channels. Over the last two years, we have picked up the pace of our “Think Forward” strategy, which has placed some extra demand on our employees. We have found in particular that the speed of digital adoption over 40 category typically takes place at a slower pace. However, continuous training and ongoing support from our IT teams have enabled these employees to fast track their digital migration process journey. This proved to be a massive advantage in this year, as employees were able to apply the learnings from their digital adoption process to quickly adapt to the work-from-home environment that became necessary during the two months island-wide lockdown period and its immediate aftermath.
MORECompetitive
Customer focused
Digital
Skilled
Efficient
Agile
EMPLOYEEOUR EMPLOYEE VALUE PROPOSITION (EVP)
We recognize that our employees are LBF’s most powerful brand ambassadors and the driving force behind our success. Hence we want our employees to know that their unique skills and attributes as well as their collective contribution to the Company is
Strategic objective
Provide access to strengthen knowledge and skills
highly valued by LBF. On this basis, we offer a compelling EVP that focuses on providing the best in-class employee experience to ensure every single LBF employee has the opportunity to benefit from a long and fulfilling career within the organization. The following principles form the building blocks of our EVP;
People are the core strength of our business
The customer is central to everything we do
A cohesive team effort is the key to achieving consistent results
Cascading from this, our EVP aims to build a group of “passionate and empowered” people who understand the business, are willing to work tenaciously to deliver LBF’s purpose and have the capacity to exercise sound judgment in order to honour the Company’s values and uphold LBF’s reputation. To further underscore our commitment to our employees, we are now focusing more deeply on creating a holistic employee value proposition that is distinctly different from any other.
Talent acquisition
To remain competitive, we need to attract employees who have the appropriate skills, diversity, experience and values required by our business model and ambition. Rather than following a single channel approach, we use a combination of job specific sourcing and selection strategies based on the nature of the talent we seek for each position. Because the required mix of skills and experience in the branches continues to evolve, our aim is to make appointments that will support our journey as a fast growing financial institution in the future.
In certain areas of the business, including entry level frontline positions, our strategy is to hire for potential and train for competence. In more specialised areas such as IT and finance, we often headhunt experienced and competent employees
Building the Right Team
Developing the Right Skill
Creating the Right Culture
FUTURE FIT
New employees hiredby region and gender
0
100
200
300
400
500
600
700
800
Male Female
Cent
ral
East
ern
Nor
ther
n
Nor
th-c
entr
al
Nor
th-w
este
rn
Saba
raga
muw
a
Sout
hern
Uva
Wes
tern
Stability Leadership Strength Agility Responsibility Sustainability Success Supplementary Information

L B Finance PLC | Annual Report 2020/21158
who can make an immediate contribution based on their knowledge and expertise.
In recent years we have been further diversifying this talent sourcing approach to gain access to a wider talent pool of potential candidates in specialized disciplines.
Regardless of the sourcing methodology, our recruitment process includes a holistic assessment of candidates to determine whether the person fits in terms of the position, our service model and our values. Moreover, all new recruits are on-boarded via a rigorous orientation and induction procedure to help them understand and assimilate into LBF’s corporate culture and work ethics.
A temporary recruitment freeze was declared in the first half of the current financial year as part of the cost control measures initiated during the lockdown period and its immediate aftermath. However, following the resumption of full business activities in September 2020, frontline and entry level recruitments commenced thereafter.
As at 31st March 2021, our cadre consisted of 3,536 employees (2019/20: 3,583) of which 3,515 were full-time employees (2109/20: 3,558).
Meanwhile, given the pandemic related restrictions in the year under review, the careers page of the corporate website was revamped to allow applicants to submit their applications directly via email. The entire onboarding process was also moved online owing to the inability to conduct face to face interactions due to the COVID-19 restrictions. Accordingly new recruits were granted access to the HR policy, Code of Conduct etc. via the e-learning platform. The post-orientation review was also incorporated to the e-learning platform to enable new recruits to complete the procedure online.
Talent retention
At LBF, talent retention goes hand in hand with succession planning. As such we aim to identify and develop suitable employees who are able to be considered for future senior leadership positions. This ensures that we can retain talented employees who have the ability to take ownership for the future growth of the Company.
Nevertheless retaining employees remains a challenge due to several reasons; LBF’s cadre consists predominantly of millennials. These highly talented and upwardly mobile individuals are by nature impulse driven and as such have a high propensity to make frequent transitions in order to fastrack their career. Retaining millennials therefore remains one of LBF’s key human capital challenges. The
heightened competition within the NBFI sector has also proven to be another major challenge in retaining talent, especially in specialized disciplines such as IT and marketing.
To manage talent retention, we use robust talent metrics, diagnostics and performance review discussions. Analysing employee data, predicting and managing succession needs and identifying opportunities for talent development in this manner helps to mitigate human capital risks.
Turnoverby gender
0
200
400
600
800
1,000
2018
2019
2020
2021
(Rs.Mn)
Male Female
Talent management
Building a reliable talent pipeline is a major priority in LBF’s human capital development agenda. To facilitate this we have in place a performance appraisal mechanism carried out annually following the conclusion of the financial year-end. Every LBF employee is entitled to benefit from the annual performance appraisal mechanism to determine his/her progress vis-a-vis the goals and targets set at the start of the year. Career aspirations and training needs are also reviewed during this performance appraisal process. Using talent diagnostic and review discussions, combined with the analysis of people data, succession needs, development opportunities and potential risks, the performance appraisal mechanism provides input for succession planning decisions.
Given the pandemic related work disruptions we faced in the FY 2020/21
Female Contract Type Male
1,395 Full-time employees 2,120
12 Employees on contract basis 37
Staff Category
3 Board of Directors 7
3 Senior Management 26
51 Middle Management 352
805 Executive 953
546 Clerical 755
- Minor 66
CAPITAL REPORTS
Human Capital

L B Finance PLC | Annual Report 2020/21 159
it was decided to further strengthen the existing performance appraisal mechanism with the inclusion of the nine box competency evaluation matrix, a globally recognized talent management toolkit to measure both performance and leadership potential of an employee. With the nine box competency evaluation matrix expected to be rolled out in the next performance cycle, we conducted extensive training for managers who will be the evaluators coupled with a series of awareness building sessions to help employees to understand and adapt to the changeover.
Distinctive development opportunities
Our fresh approach to talent management is supported by distinctive training and development opportunities, encompassing classroom training, on the job training, continuous professional development through job rotation and special projects as well as overseas training and exposure.
While LBF’s annual training investment is Rs. 4.01 million in the FY 2020/21 due to COVID-19 restrictions which prevented face-to-face meetings and physical gatherings. Taking immediate action at the onset of the lockdown itself, necessary system modifications were done to ensure LBF’s annual training calendar for the FY 2020/21 could be moved to the e-learning platform with effect from 2020. Based on a three-pronged training approach, training activities for the year focused on developing marketing skills, improving customer service and building leadership skills of executives and managers.
A majority of these training activities were conducted through the e-learning platform until February 2021, whereafter classroom training activities were allowed to resume on a limited basis.
Meanwhile during the lockdown period,
we encouraged employees to participate in selected webinars. A weekly webinar calendar was developed and circulated to Head of departments.
In addition to the training opportunities for our own employees, LBF offers training opportunities for students.
Meanwhile a total of 262 interns were on-boarded to LBF’s Management Training programme in the 2020/21 intake. They joined as young graduates who have started their careers with the Company since the programme’s inception in 2008.
Investment ontraining anddevelopment
0
5
10
15
20
2018
2019
2020
2021
(Rs.Mn)
Number of programmes 2020/21 2019/20
Induction/on-boarding 01 03
Functional/technical 09 17
Management/leadership 06 10
Compliance risk 03 03
SUSTAINING THE EMPLOYEE RESOURCE
Remuneration and benefits
As a responsible employer, LBF strives to create an environment where all employees understand how their contribution towards the achievement of corporate goals can influence their personal rewards and career prospects. Fair, equitable and industry competitive remuneration and benefits are key attributes of our EVP. Our policy is to ensure that all full time employees of LBF are entitled to be adequately remunerated in-line with market standards. While firmly aligned to all statutory requirements, LBF’s remuneration and benefit model is underpinned by three parameters: job profile, work performance and commitment to corporate values. Accordingly, all employees are entitled to the following benefits;
Employee benefits 2020/21 Rs. Mn
2019/20 Rs. Mn
2018/19 Rs. Mn
2017/18Rs. Mn
Salaries and other related expenses
2,520.98 2,537.98 2,289.61 2,034.81
Employer’s contribution to EPF 232.85 239.16 214.90 188.58
Employer’s contribution to ETF 46.57 47.83 42.98 37.71
Gratuity 93.91 75.94 63.09 44.68
Strategic objective
Improve the productivity of workforce
Stability Leadership Strength Agility Responsibility Sustainability Success Supplementary Information

L B Finance PLC | Annual Report 2020/21160
Despite the challenges arising out of the pandemic, LBF made a strategic decision to refrain from resorting to any pay cuts in the FY 2020/21. Accordingly all LBF employees were paid their full salary entitlement throughout the pandemic period. All bonus entitlements for the previous year were paid in full and reimbursements of medical expenses etc. under the employee insurance scheme also continued as per usual despite strict cost containment measures.
Accelerate diversity
We firmly believe that a diverse workforce broadens perspectives and enhances performance. As such we maintain a non-discriminatory approach to ensure that no LBF employee is subject to discrimination on the basis of gender, age, disability, religious beliefs or any other status protected by law. LBF remains committed to honour these principles of equality and diversity at every stage of the employment process including recruitment, selection, evaluation, promotion, training and development.
Gender parity however is an ongoing challenge especially in LBF’s field operations, which even in this day and age remains male dominated. In this regard the key deterrent for women appears to be the nature of the frontline jobs, which requires marketing officers to spend a majority of their time on the move meeting customers.
In contrast LBF has succeeded in maintaining a healthy gender balance in other spheres of the business, most notably in administrative and managerial roles.
While the Company’s overall gender ratio is at 1:1.53, the percentage of women at the executive level and middle management level at 1:0.84 and 1:6.90 respectively as at 31st March 2021.
Ethical business conduct
The financial services industry relies on trust. In our line of business, trust is founded on good conduct and ethical behaviour in our day-to-day operations, exhibited through the individual and collective actions and decisions of LBF employees, management and the Board. It is why we demand that all LBF employees adhere to the highest standards of ethics and integrity and maintain a comprehensive approach to integrate into the culture of trust. In this regard, LBF’s Code of Conduct for employees serves as a guide for interactions with stakeholders across the business and in doing so set out appropriate behaviours expected of employees as well as their rights and responsibilities as representatives of the Company. From the very beginning, starting with the orientation and induction procedure for new recruits, we continue to impress upon our employees, the importance of complying with the Code of Conduct. We also conduct regular refresher sessions to ensure that all employees are aware of the values and behaviours expected of them. As part of the overall approach to promoting a culture of ethics and good conduct, we conduct regular training to educate employees on the fair treatment of customers. In 2020/21, we conducted the four customer care and service training programmes covering 794 LBF employees.
Our employees are provided with a range of channels to raise concerns regarding ethical behaviour including the Company’s whistleblower policy for reporting of fraud or financial irregularities or misappropriations. Quarterly awareness programmes are carried out to build employee capacity and help them to develop a sensitivity to situations of real or perceived conflict of interest and learn how to deal with them when they arise.
LBF’s current HR policy manual was reviewed and updated in the year under review. Taking into consideration the unprecedented changes arising out of the
pandemic, especially the introduction of the work-from-home model, special emphasis was placed on strengthening the Code of Conduct for employees, the grievance handling and disciplinary management policy and the anti-harassment policy.
Work stress
If not managed correctly, stress at work can lead to illness, absence and potentially a loss of income. To mitigate this, LBF continues to take proactive steps to promote a healthy work culture. Our HR department is tasked with ensuring adequate resources are allocated to promote employee well-being and help employees to manage stress.
Marking a major step in this regard, the SMILE counselling support was launched at the onset of the lockdown period in late March 2020. The main aim of the initiative was to create a secure 24/7 counselling hotline for employees to reach out in confidence, should the need arise. The programme is managed by the HR department with the support of a team of professionally qualified counsellors. Weekly banners were sent out to all employees as a constant reminder to encourage them to make use of the SMILE facility. The weekly banner programme which started during the lockdown period in April 2020, remains in place.
Health and safety
Given the nature of our business as a financial services institution, our employees work in a relatively low risk environment and as such are not exposed to any significant occupational health and safety hazards.
Nevertheless, we have taken all reasonable and practical precautions to provide a safe working environment for our employees. All our premises are fitted with standard safety equipment, with basic safety instructions prominently displayed at all locations.
CAPITAL REPORTS
Human Capital

L B Finance PLC | Annual Report 2020/21 161
We remain proactive in monitoring the effectiveness of our safety systems and conduct regular safety drills as part of our Business Continuity Plan (BCP). Moreover, to enforce the safety culture, we continue to provide regular safety training, with all branches being covered at least once every year.
The year under review with the COVID-19 pandemic presenting a whole new dimension to employee health and safety, LBF initiated a broad based action plan to comply with the health guidelines issued by the Ministry of Health. All recommended health protocols were established for the protection of our 3,536 employees around the country. Work-from-home orders were issued to all employees during the two months island-wide lockdown period and even with the resumption of branch operations thereafter, employees reporting to work were rostered to minimize the risk of exposure. In parallel, a safety declaration form was introduced with all employees required to update their safety status on
a daily basis. All employees were given detailed information regarding COVID-19 safety measures to ensure they remain vigilant and protect themselves and others.
Furthermore, with health guidelines constantly being updated in tandem with the rapidly evolving pandemic situation, steps were taken to appoint LBF’s Head of HR as the main liaison between the Company and the health authorities. This was done to proactively receive information regarding the latest developments and also ensure the proper interpretation and timely dissemination of relevant information. We began using the Life at LB Facebook page as a platform to keep employees updated regarding the latest developments.
CREATING AN ENTREPRENEURIAL AND INNOVATION CULTURE
Digitalisation and the changing organisation
Like all companies, LBF too takes great care in planning its resources to meet future needs. This process often involves finding ways to make operational processes more efficient and effective through increased digitization or process automation and may be even by restructuring part of our business as and when needed. The most notable examples of this is the Digital Finance Service (DFS) unit which was set up in late 2019 and the Innovation and Research center established in mid 2020. The decision to set up these units stems from LBF’s “Think Forward” strategy which
We always keep engagement with our employees constant in different capacities to maintain continuous motivation which was especially important in the times of the pandemic. In normal times, employees are motivated to go beyond their regular activities and engage in different team building activities. At LBF, we recognize our people to be the key custodians of our business - the driving force of our competitive advantage and the defining factor of our success.
Mr. Niroshan UdageDeputy Managing Director
is designed to position the Company as the country’s top digital financial services institution. However, attracting and retaining right people with the skills and the right fit for a digital, data-driven Company, is one of the main challenges faced with when addressing the staffing requirements for these units. While at present the staffing requirements at the DFS have been met, LBF is still on the lookout for suitable talent for the Innovation and Research center. The fact remains that these skills are highly sought after and competition for this talent is fierce and as LBF moves ahead with expansion plans, the demand for skills is expected to grow significantly in the coming years.
The year under review with the COVID-19 pandemic presenting a whole new dimension to employee health and safety, LBF initiated a broad based action plan to comply with the health guidelines issued by the Ministry of Health.
A FUTURE-FIT CULTURE
Result OrientedResult Oriented
Open
Inclusive
Caring
Strategic objective
Provide opportunity to research and development
Stability Leadership Strength Agility Responsibility Sustainability Success Supplementary Information

L B Finance PLC | Annual Report 2020/21162
LIFE AT LB
Employees’ journey
Employees drive our business and we consider it as our responsibility to make their life journey more comfortable and trouble-free
EM
PLO
YE
ES
Family
Support our employees and their families through their vulnerable moments and difficult life circumstances
Extend our culture of savings and investment to encourage our employees and their families to cultivate the savings habit
Provide a better work-life balance to enable our employees to manage to their family commitments
Financial Support development of financial acumen and a culture of saving and investment to
empower our employees
Physical and mental wellbeing Provide a healthy, supportive and enabling work environment free from discrimination or
harassment
Relationships
Create a place to work that:
Embraces diversity and facilitates opportunities for employees to “give back”
Promotes a culture of respect, and fosters positive working relationships
Work, job, career and employment
Empower employees through meaningful work and an environment that supports career progression, collaboration and learning from mistakes, while encouraging high performance
Lifestyle, dreams, aspirations Position LBF as a prominent financial services company by engaging prospective
employees prior to their LBF journey
Employee engagement
We believe a work environment that embodies a consultative and participative approach to engaging employees is vital not only to retain seasoned professionals but is also critical in attracting younger generations of employees who join the workforce with expectations that they too will be consulted on key issues and decisions impacting their career.
Premised on this, LBF strives to promote a culture of engaging employees by;
Facilitating open and honest communication to employees on both business and individual performance
Seeking input from employees on important initiatives that impact on their role and work environment
Collaborating on the development of business and individual objectives
Carefully considering employee feedback and where appropriate act on suggestions offered and/or concerns raised
Providing mechanisms for the investigation and effective resolution of grievances
In addition, we maintain a robust activity calendar for employees to engage in an informal setting, thereby providing opportunities to develop camaraderie and team spirit. While all planned activities for the current financial year could not be held due to the pandemic, we worked to strengthen employee engagement via digital mediums mainly through the Life at LB facebook page. In this regard, we conducted several online competitions, most notably the favourite branch competition which was based on the number of likes. By reaching out to our employees during the pandemic, we were also able to develop a corporate song which was incorporated as a ring-in tone
for all official mobile phones. Our aim in all this was to nurture a unique sense of community and rally the LB team to collectively face the pandemic impact on the business.
Grievance handling
LBF’s HR policy manual sets out clear guidelines for the effective handling of grievances. In the year under review, the grievance handling framework was reviewed and further strengthened with the establishment of an impartial grievance handling committee to investigate reported incidents of harassment. Workflow systems for the escalation, investigation and conclusion were also further streamlined to ensure impartiality of the process and confidentiality of the aggrieved party.
Strategic objective
Enable work life balance while sustaining income
CAPITAL REPORTS
Human Capital

L B Finance PLC | Annual Report 2020/21 163
Employee volunteerism
LBF encourages employees to become involved in their communities, lending their voluntary support to programs that positively impact the quality of life within these communities. We believe these endavours will help employees to develop an understanding of systemic issues that led to the major socioeconomic disparities in our country, and thereby contribute more effectively towards resolving these matters.
Employee wellbeing offerings
Career Health Emotional Social Financial
Career assessments
Training programmes
Leadership programmes
Development plans
Advanced development programme
Health awareness programmes
Eye check-up
Health screening
Counseling programmes
Motivational programmes
Employee volunteerism
Team building
Benefits assessments
Digital money handling
LBF encourages employees to become involved in their communities, lending their voluntary support to programs that positively impact the quality of life within these communities.
HR governance
LBF’s Human Resources Department (HRD) headed by the AGM HR is the main body in charge of the Company’s HR matters. The AGM HR reports directly to the Board on all key areas. The HRD is responsible for ensuring the Company remains fully compliant with all applicable labour laws and for benchmarking globally accepted.
HUMAN RESOURCE ACCOUNTING
Human Resource Accounting (HRA) involves quantifying the value of the LBF’s human capital (management and employees) in terms of its capacity to create value for the Company in the future. Essentially HRA is the process of identifying, measuring and reporting on the investments made on human resources that is currently not accounted for in the conventional accounting practices. As per the HRA approach, the expenditures related to human resources are reported as assets on the balance sheet as opposed to the traditional accounting approach which considers personnel costs as an expense item in the profit and loss account.
Per employee highlights (Rs. million)
2020/21 2019/20 2018/19 2017/18 2016/17
Income 8.35 8.66 8.09 7.28 6.01
Net interest income 4.47 4.31 3.98 3.46 3.04
Operating income 5.12 4.88 4.51 3.94 3.49
Operating expenses
1.56 1.63 1.54 1.47 1.36
PBT 2.61 2.11 2.14 1.88 1.82
PAT 1.91 1.44 1.40 1.24 1.22
Total assets 39.44 39.92 37.70 35.11 31.90
Legends with LB LB theme song
Stability Leadership Strength Agility Responsibility Sustainability Success Supplementary Information

L B Finance PLC | Annual Report 2020/21164
Creating value for our employees
Employees and intermediaries create value by supplying the necessary capacity, skills and expertise to deliver our promises to stakeholders
Reaping benefits of investing in human capital
Value for employee Value for LBF Value for customer
Incentives linked to performance
Career advancement through comprehensive development programmes
Fringe benefits that recognise practical day-to-day employee needs
An appropriately skilled and motivated workforce
Insights through diversity
Lower employee turnover and therefore lower costs
High service levels
Products that meet their needs
Responsible financial advice and compliant products and services
Spending on training
Spend on benefits
Improved productivity and
innovation
Outstanding services for customers
More professional people
Motivated employees working towards company
objectives
Unmatched customer services through
trained staff
Expanding opportunities for strategic locations
CAPITAL REPORTS
Human Capital
Training and development to build competencies, collective values, operational excellence and innovation
Performance and benefit management to establish solid employee relationships
Tradeoff between capitals
Financial Human Intellectual Manufactured Social & Relationship
Natural
S M L S M L S M L S M L S M L S M L
New recruits
Training and development
Benefit structure
S – Short term M – Medium term L – Long term Increase Decrease Neutral
FC
FC
HC
HC
SC
SC
IC
Increase Decrease

L B Finance PLC | Annual Report 2020/21 165
Building for the future
Over the past few years, our human capital has evolved significantly and the impact is prominent in our recent year’s performance. In terms of attracting further human capital, we want to become one of the top 10 “Employers of choice” in Sri Lanka. In order to achieve this, our focus would be;
Short term (<1) Medium term (1-3) Long term (3-5)
Strengthen the talent acquisition process by strengthening screening and evaluation procedures
Strengthen gender diversity among frontline teams
Drive a competitive reward strategy at all levels
Implement solutions to enhance the digital user experience for employees
Developing an in-house training academy to comprehensively manage training needs of all employees
Increase the depth and breadth of talent pool with role-based specialised training and development programmes
GROWTH SUSTAINABLE OPPORTUNITYDigital equipped workforce
TOWARDS VISIONTech savvy working culture
2013/14 2015/16 2017/18 2019/202014/15 2016/17 2018/19 2020/21
Conducted 106 training programmes for 4,859 participants
1,036 employees were recruited
309 employees were promoted
Employee training hours 30,647 and cost incurred Rs. 11.18 Mn
Launched Readers club
1,313 employees were recruited
Employee training hours 25,845 and cost incurred Rs. 3.9 Mn for 4,835 employees
698 employees were promoted
Generated 1,243 new employment opportunities
Employee training hours 52,788 and Rs. 18.56 Mn invested on training and development
854 employees were promoted
Provided 267 new employment opportunities
Provided over 15,000 training hours
Conducted a workshop on physical fitness and health medicine
Organized annual sports day (and religious ceremonies)
Initiated photographic society
1,096 employees were recruited
Invested Rs. 4.53 Mn on training and development covering 20,672 training hours for 3,335 employees
571 employees were promoted
Created 1407 new employment opportunities
Employee training hours 38,832 and Rs. 10 Mn invested on training and development
733 employees were promoted
999 employees were recruited
1237 employees were promoted
Rs. 4.01 Mn invested on training and development
HUMAN CAPITAL JOURNEY
Stability Leadership Strength Agility Responsibility Sustainability Success Supplementary Information

+ 60,000
HOW IT ADD VALUES Intellectual capital plays a vital role in differentiating LBF’s value proposition to enable the Company to gain a competitive advantage and accelerate its growth trajectory.
INTELLECTUAL CAPITAL
WHAT IT INCLUDES Our Intellectual capital consists of the unique attributes that include; the distinctive LBF brand, technology based assets, framework of system control such as global certifications as well our intrinsic knowledge based processes and protocols.
STRATEGIC DRIVERS
Maintain a consistent brand position
Adhere to the latest globally accepted best practices
Continuous R & D to boost ideation and innovation capabilities
Pursue automation as a means of improving internal efficiency and service delivery to customers
INPUT
Launch of LB CIM
Strengthening BCP framework
Revamping the system audit model
Setting up of the L B Finance Center for Technology and Innovation
CHALLENGES
Risk associated system failure and connectivity failure
Rapid increase in cyber threats
Competitive pressure in the digital finance space, especially from the banking sector
1 2 3
TRADE OFF
Intellectual capital by nature does not involve any material trade off between other capitals, except for the cost outlay (Financial capital) of implementation
4
Credit rating
A- (lka) Fitch Ratings reaffirmed
Best financial services provider 2020 (SLIM- Nielsen)
Brand value Rs. 6,327 Mn by LMD
ISO 27001:2013 Information Security Standard recertified
+ 1 MnLB CIM wallet transactions
LB CIM App downloaded
CAPITAL REPORTS
IC
L B Finance PLC | Annual Report 2020/21166
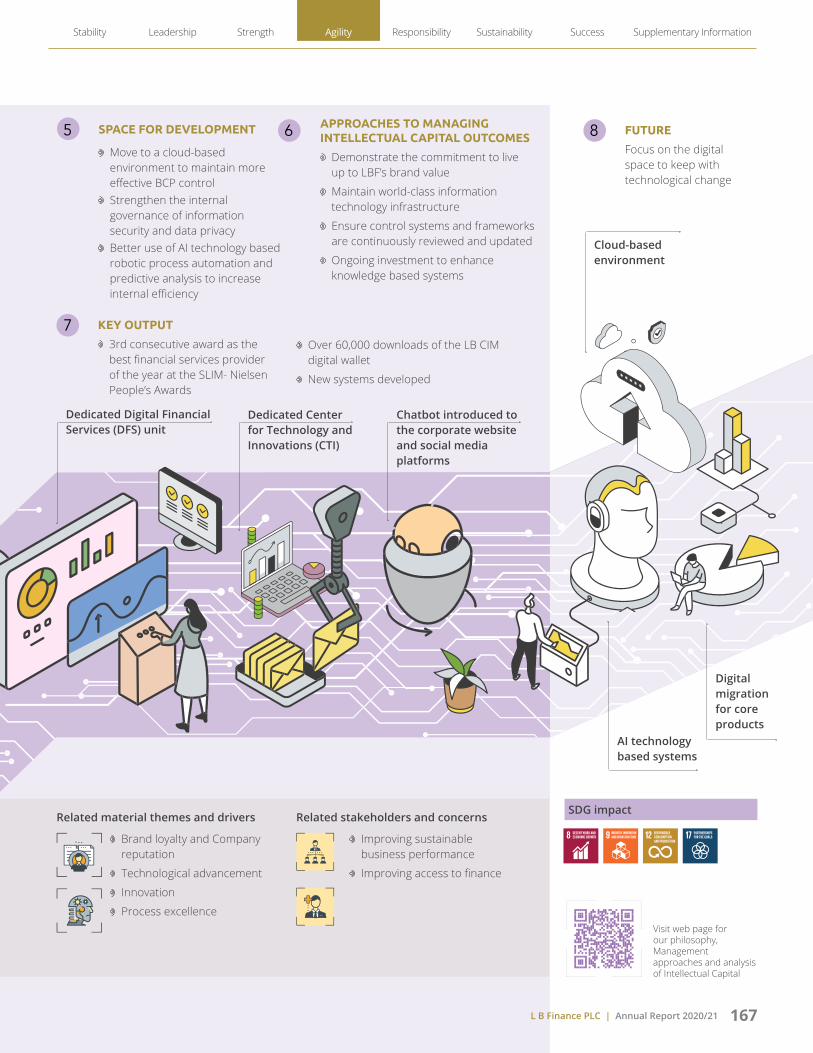
Dedicated Digital Financial Services (DFS) unit
Dedicated Center for Technology and Innovations (CTI)
Chatbot introduced to the corporate website and social media platforms
Cloud-basedenvironment
Digital migration for core products
AI technology based systems
KEY OUTPUT
3rd consecutive award as the best financial services provider of the year at the SLIM- Nielsen People’s Awards
FUTURE
Focus on the digital space to keep with technological change
7
8
SDG impactRelated material themes and drivers Related stakeholders and concerns
Brand loyalty and Company reputation
Technological advancement
Innovation
Process excellence
Improving sustainable business performance
Improving access to finance
SPACE FOR DEVELOPMENT
Move to a cloud-based environment to maintain more effective BCP control
Strengthen the internal governance of information security and data privacy
Better use of AI technology based robotic process automation and predictive analysis to increase internal efficiency
5 APPROACHES TO MANAGING INTELLECTUAL CAPITAL OUTCOMES
Demonstrate the commitment to live up to LBF’s brand value
Maintain world-class information technology infrastructure
Ensure control systems and frameworks are continuously reviewed and updated
Ongoing investment to enhance knowledge based systems
6
Over 60,000 downloads of the LB CIM digital wallet
New systems developed
Visit web page for our philosophy, Management approaches and analysis of Intellectual Capital
L B Finance PLC | Annual Report 2020/21 167
Stability Leadership Strength Agility Responsibility Sustainability Success Supplementary Information
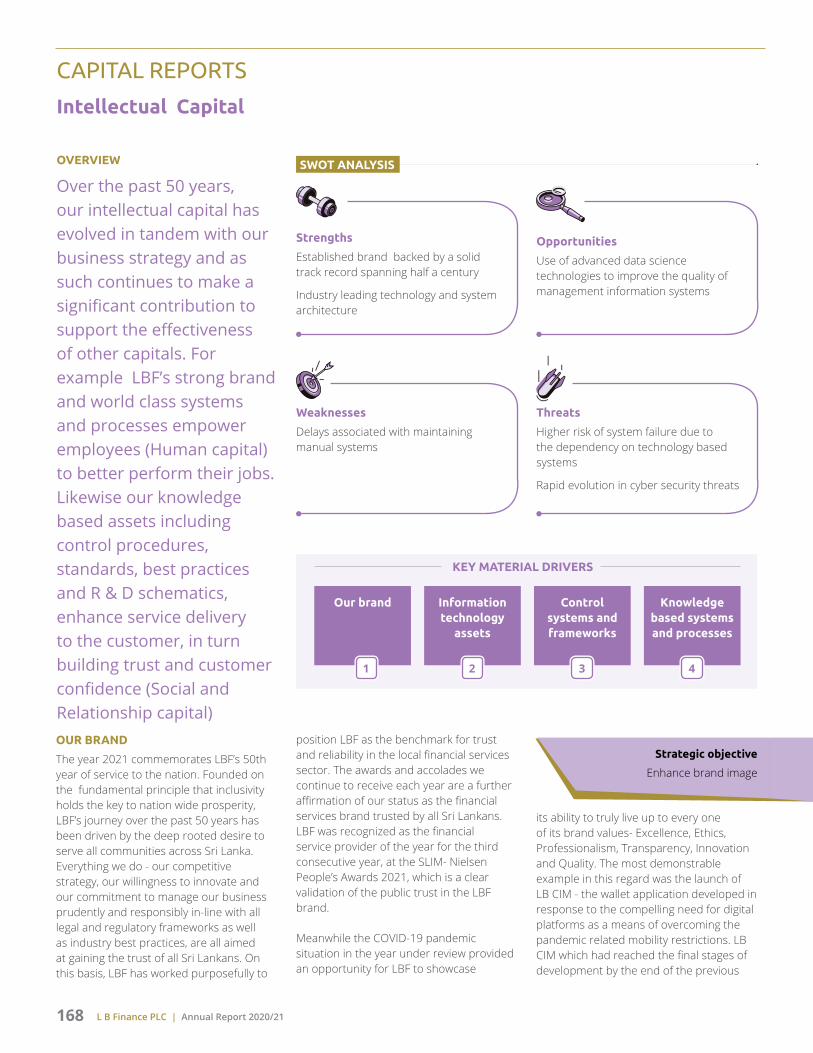
L B Finance PLC | Annual Report 2020/21168
CAPITAL REPORTS
Intellectual Capital
OVERVIEW
Over the past 50 years, our intellectual capital has evolved in tandem with our business strategy and as such continues to make a significant contribution to support the effectiveness of other capitals. For example LBF’s strong brand and world class systems and processes empower employees (Human capital) to better perform their jobs. Likewise our knowledge based assets including control procedures, standards, best practices and R & D schematics, enhance service delivery to the customer, in turn building trust and customer confidence (Social and Relationship capital)
Strengths
Established brand backed by a solid track record spanning half a century
Industry leading technology and system architecture
Weaknesses
Delays associated with maintaining manual systems
Opportunities
Use of advanced data science technologies to improve the quality of management information systems
Threats
Higher risk of system failure due to the dependency on technology based systems
Rapid evolution in cyber security threats
OUR BRAND
The year 2021 commemorates LBF’s 50th year of service to the nation. Founded on the fundamental principle that inclusivity holds the key to nation wide prosperity, LBF’s journey over the past 50 years has been driven by the deep rooted desire to serve all communities across Sri Lanka. Everything we do - our competitive strategy, our willingness to innovate and our commitment to manage our business prudently and responsibly in-line with all legal and regulatory frameworks as well as industry best practices, are all aimed at gaining the trust of all Sri Lankans. On this basis, LBF has worked purposefully to
position LBF as the benchmark for trust and reliability in the local financial services sector. The awards and accolades we continue to receive each year are a further affirmation of our status as the financial services brand trusted by all Sri Lankans. LBF was recognized as the financial service provider of the year for the third consecutive year, at the SLIM- Nielsen People’s Awards 2021, which is a clear validation of the public trust in the LBF brand.
Meanwhile the COVID-19 pandemic situation in the year under review provided an opportunity for LBF to showcase
its ability to truly live up to every one of its brand values- Excellence, Ethics, Professionalism, Transparency, Innovation and Quality. The most demonstrable example in this regard was the launch of LB CIM - the wallet application developed in response to the compelling need for digital platforms as a means of overcoming the pandemic related mobility restrictions. LB CIM which had reached the final stages of development by the end of the previous
SWOT ANALYSIS
Strategic objective
Enhance brand image
KEY MATERIAL DRIVERS
Our brand
1
Information technology
assets
2
Control systems and frameworks
3
Knowledge based systems and processes
4

L B Finance PLC | Annual Report 2020/21 169
Leasing FD
Savings Treasury
financial year was further enhanced and unveiled in April 2020. Developed in-house by LBF’s Digital Financial Services (DFS) unit using sophisticated dual platform architecture to support the transactional capability of both customers and merchants, LB CIM has been fully approved by the CBSL. LB CIM which became an instant hit during the two months island-wide lockdown period, has since continued to gather momentum and remains one of the most downloaded wallet applications in the local market to date.
INFORMATION TECHNOLOGY ASSETS
LBF’s IT infrastructure is built to handle large and variable workloads ensuring high level of performance, stability and availability of business critical systems. We continuously try to adopt new technology, promote innovation that reduce process complexity and deliver technology solutions that are aligned with business objectives. In addition to hardware
Gold Loan Module Oracle Fusion ERP
Credit Appraisal Module Oracle Budgeting and Planning
Credit Mobile App Oracle Profitability Management
Common Cashier Module E-Financial System
Common Business Partner Management
HRIS system
ATM Switch
Document Management System
and physical IT infrastructure, LBF also leverages on software solutions to drive economies of scale across various aspects of the business. In this regard, we use a combination of licensed software procured from vendors as well as software solutions developed by our in-house IT teams, the DFS Center for Technology and Innovation (CTI).
CONTROL SYSTEMS AND FRAMEWORKS
Business continuity planning
Business Continuity Planning (BCP) is an integral part of LBF overall approach to building resilience and ensuring business continuity. In this regard, our BCP process is designed with the capability to help the Company to prevent, prepare and respond effectively in the event of a disruption. The BCP also serves as a guideline for managing and recovering from impacts of a business disruption.
To measure the effectiveness of the BCP, LBF’s system audit team performs scheduled DR (Disaster Recovery) and BCP drills in order to observe the activities and examine whether the RTO (Recovery Time Objective) and RPO (Recovery Point Objective) of critical systems meet the planned objectives. Company also plan to use cloud based infrastructure to further reduce business impact during a disaster situation.
In light of the COVID-19 pandemic, some notable changes were made to the existing BCP framework in the year under review. The work-from-home model was implemented for all employees, including call center teams, to enable them to continue with their day to day work schedules during the lockdown period. A hybrid system was created to ensure Key Management Personnel (KMP) could function from alternate locations in the event a localised lockdown would prevent them from accessing their offices.
LICENSED SOFTWARE
IN HOUSE SOFTWARE
Stability Leadership Strength Agility Responsibility Sustainability Success Supplementary Information

L B Finance PLC | Annual Report 2020/21170
Identified LBF branches in the Colombo, Gampaha, Kandy and Galle Districts were set up as core location centers, while the Company’s main DR site was moved to the SLT’s Tier III data center in Pitipana and secondary data center was established at the Dialog data center in Pothuwarawa.
All scheduled BCP drills for the FY 2020/21 were carried out as planned. In addition, several new audit protocols were introduced to monitor unauthorized access to the Company’s systems amidst the work-from-home environment. As part of the continuous risk assessment process audits were conducted to determine the effectiveness of the employee awareness regarding BCP procedures was also subject to audit.
Information security management
The rapid evolution in the information security threat landscape in recent years has drawn our attention to the need for safeguarding our information assets from both external and internal threats. LBF’s fundamental approach is based on the ISO
27001:2013 Information Security Standard, which has been in place since 2014. Accordingly both data center locations are ISO 27001:2013 certified facilities. Business critical systems at the data center are configured with on-site high availability, load balancing and redundancy features to ensure uninterrupted service. Furthermore, to protect our systems from the risk of data breach and malicious intrusion, we have implemented multi layer access controls including network, application and database level access controls. In addition, we conducted regular training to raise awareness among our employees regarding unintentional data disclosure.
In the current financial year, LBF successfully completed its 3rd consecutive re-certification of the ISO 27001:2013 Information Security Standard for further three year period. The new certification covers a wider scope and includes the information security systems of the newly set up Innovation center as well, in addition to LBF’s data center architecture.
Also in an effort to further streamline operations and ensure transparency in information systems auditing, the Information Systems (IS) audit team was restructured and brought under the purview of the internal audit department with effect from mid-2020. With this change, the scope of the IS Audit Programme was further expanded to include the protection of information assets, system development life cycle and quality assurance, disaster recovery and business continuity planning as well as data base information security database management.
The existing Auditing Programme was also revamped in-line with industry best practices such as IT audit framework by ISACA, the ISO 27001:2013 standard and CBSL guidelines. The new audit schedule consists of several customised audits including backup management audits, change management audits, patch management audits, application system audits, mobile application audits as well as physical and environmental security audits. In addition to the mainstream system audit, operations security audits and access control audits conducted in the past.
With the year under review bringing new concerns regarding information security, especially with employees required to work-from-home as a result of COVID-19 restrictions, a new verification framework was established along with a stringent monitoring to detect unauthorised access of the Company’s information systems. Audits were also carried out to verify the physical security of mobile devices to prevent data leakage while remote working.
With the year under review bringing new concerns regarding information security, especially with employees required to work-from-home as a result of COVID-19 restrictions, a new verification framework was established along with a stringent monitoring to detect unauthorised access of the Company’s information systems.
CAPITAL REPORTS
Intellectual Capital
Strategic objective
Increase technology and process audit
Investment on ITsoftware
2017
2018
2019
2020
2021
(Rs.Mn)
010203040
Investment on IT hardware
(Rs.Mn)
050
100150200
2017
2018
2019
2020
2021

L B Finance PLC | Annual Report 2020/21 171
Data privacy
We are committed to protect the personal information in our custody and to comply with the regulations relating to data privacy.
To further reiterate our commitment, we took early action to develop a new data protection procedure in readiness to comply with the CBSL’s proposed new Data Protection Act due to be gazetted in 2021. LBF’s data protection procedure will outline the necessary procedural, technological and physical controls that need to be implemented to ensure LBF’s information assets remain protected at all times.
The data protection procedure will also include data classification guidelines to enable all employees to recognize the information that needs to be protected, scale out the level of their sensitivity, control access to sensitive information and its communication within internal staff and outsiders.
KNOWLEDGE BASED SYSTEMS AND PROCESSES
Innovation capabilities
LBF is continuously innovating to cater to the customers’ needs. And as we move ahead with our “Think Forward” strategy, the focus on digital driven solutions has become a key priority. LBF’s Digital Financial Services (DFS) unit is the key enabler of this effort. Established in the early 2019, the DFS seeks to achieve two clear objectives; develop digital financial products and services to support LBF to widen its island-wide reach and create digital solutions to complement LBF’s core product suite. The development of the LB CIM wallet application was spearheaded by the DFS.
Customised research
LB Finance Center for Technology & Innovation (CTI) was set up in mid 2020 with the aim of strengthening our core financial system and to introduce AI based system. This project initiated in early 2019, called “Eclipse” and continue to the future. Machine learning tools and advanced data
analytics to disseminate the large volume of data generated on daily basis, in ways that could contribute towards increasing revenue, improve efficiency, effectiveness and productivity, ultimately leading to a positive impact on the LBF’s overall profitability.
Process re-engineering
Process re-engineering plays a major role in our efforts to improve internal efficiencies that would benefit the Company’s bottom line as well as to enhance service delivery to customers. As such existing processes and technology are regularly reviewed to determine scope for improvement, while changes made are strictly monitored to determine if the desired results are being achieved.
Human resource development
The continuous and ongoing investment in human resource development stems partly from the need to augment LBF’s intrinsic knowledge base. Steps taken in this regard are described in detail in the Human capital report.
Investment made to
automated systems
Capacity enhancement
equivalent of full time employees
Documents are shared through the
digital platforms lead to reduce the
paper usage
Enhance customer relationship
management and business intelligence
Automated more services to improve the efficiency
Investment made on new infrastructure
equipment
New products and services development
and new revenue streams
Reputational gains as industry best tech leader and
innovator
New skills and innovation, Improved innovative
decision-making
Advanced data analytics, digital financing and machine learning platform which improves reliability and productivity
Reaping benefits of investing in intellectual capital
FCHC
HC
NCSC
SCFC IC
Increase Decrease
Stability Leadership Strength Agility Responsibility Sustainability Success Supplementary Information

L B Finance PLC | Annual Report 2020/21172
CAPITAL REPORTS
Intellectual Capital
2010/11 2012/13 2014/15 2016/172011/12 2013/14 2015/16 2017/18
Fully-fledged end-to-end core financial application
Paperless boardroom initiative
Introduced VISA debit card with added security features
Social media marketing and introduction of daily collection loans system
Introduced LB giftstore.lk - an online e-commerce site
CEFT integration for LB e-connect customers
Savings accounts with ATM integration and SMS alerts on transactions
SLIPS integration
ISO 27001:2013 Certification
Launched LB e-connect an online financial platform
Mobile-based microfinance solution to cater to people who do not have access to banks, ATMs, etc.
Introduced Eclipse gold loan system Installed Cash Deposit Machines (CDM)
Revamped sustainability website with new outlook
Introduced e-learning module
Introduced ORACLE Fusion cloud financial system, the first finance Company in South Asia to do so
Introduced gold loan and leasing payment via CDM
Implemented paperless gold loan transaction process
Tradeoff between capitals
Financial Human Intellectual Manufactured Social & Relationship
Natural
S M L S M L S M L S M L S M L S M L
Process automation
Design new products and services
Training efficiency through e-learning
S – Short term M – Medium term L – Long term Increase Decrease Neutral
INTELLECTUAL CAPITAL JOURNEY
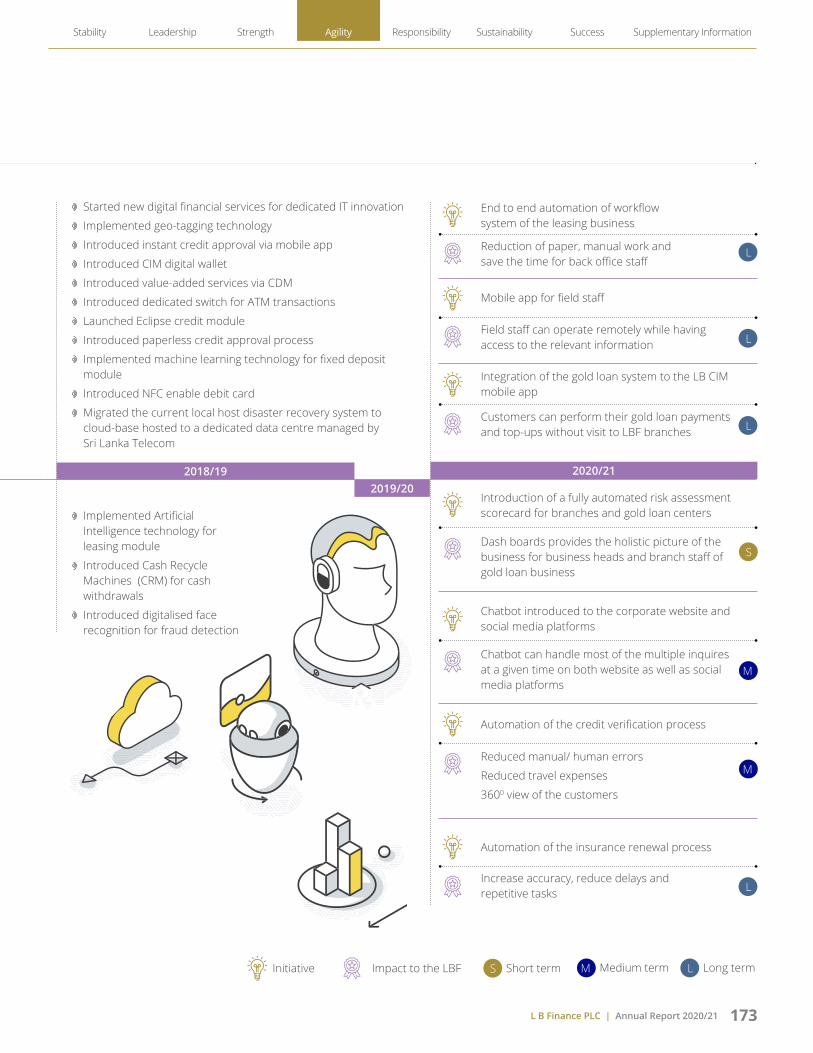
L B Finance PLC | Annual Report 2020/21 173
2018/192019/20
2020/21
Started new digital financial services for dedicated IT innovation
Implemented geo-tagging technology
Introduced instant credit approval via mobile app
Introduced CIM digital wallet
Introduced value-added services via CDM
Introduced dedicated switch for ATM transactions
Launched Eclipse credit module
Introduced paperless credit approval process
Implemented machine learning technology for fixed deposit module
Introduced NFC enable debit card
Migrated the current local host disaster recovery system to cloud-base hosted to a dedicated data centre managed by Sri Lanka Telecom
Implemented Artificial Intelligence technology for leasing module
Introduced Cash Recycle Machines (CRM) for cash withdrawals
Introduced digitalised face recognition for fraud detection
End to end automation of workflow system of the leasing business
Introduction of a fully automated risk assessment scorecard for branches and gold loan centers
Mobile app for field staff
Chatbot introduced to the corporate website and social media platforms
Automation of the insurance renewal process
Integration of the gold loan system to the LB CIM mobile app
Automation of the credit verification process
Reduction of paper, manual work and save the time for back office staff
Dash boards provides the holistic picture of the business for business heads and branch staff of gold loan business
Field staff can operate remotely while having access to the relevant information
Chatbot can handle most of the multiple inquires at a given time on both website as well as social media platforms
Increase accuracy, reduce delays and repetitive tasks
Customers can perform their gold loan payments and top-ups without visit to LBF branches
Reduced manual/ human errors
Reduced travel expenses
3600 view of the customers
L
L
L
L
S
S
Short termInitiative Impact to the LBF Medium term Long termM
M
M
L
Stability Leadership Strength Agility Responsibility Sustainability Success Supplementary Information

L B Finance PLC | Annual Report 2020/21174
We continue to operate in a highly competitive environment. The rapid growth of e-commerce continues, amplified even during the pandemic, and a number of payments focused mobile wallet have benefited from this trend. This creates an imperative for LBF to continue investing in new digital architecture, not only to keep pace with competitors, but at a rate that allows us to develop ahead of them
Building for the future
Short term (<1) Medium term (1-3) Long term (3-5)
Improve efficiency of the system audit process using AI technology
Expand the scope of the audit programme to cover non-critical systems
Further enhance the reliability of the BCP model by moving to a cloud-based environment
Introduce a new audit programme to provide assurance regarding LBF’s IT compliance status
Work towards introducing end-to-end automation of the deposit business
Enable the digital migration of core products
GROWTH SUSTAINABLE OPPORTUNITYPursue continuous process enhancements
TOWARDS VISIONFinalize an integrated cost-effective digital strategy for LBF
Mr. B D A PereraExecutive Director
CAPITAL REPORTS
Intellectual Capital
SURVEY INSIGHTSStudy conducted by: The Department of Marketing ManagementUniversity of Sri Jayewardenepura
Respondents Awareness about Company Services
0100200300400500600700800
LB E-Connect
EmailService
SMSService
CIM MobileWallet
PromotionCampaigns
Num
ber o
f Res
pond
ents
Yes No

L B Finance PLC | Annual Report 2020/21 175
FUTURE CRAFTING
Investing in our brand of improved technologies
Our brand identity is an important component of our intellectual property and a driving force behind our corporate plans and decisions. Our brand and ethos are being used to get our staff and business practices into line with our brand pledge. Our integrated stakeholder engagement approach, which is part of our broader reputation management framework, is a key focus field. Our customer engagement initiative, which we call our customer relationship management (CRM) approach, is a core differentiator of our brand promise.
Our integrated stakeholder engagement approach, which is part of our broader reputation management framework, is a key focus field. The key differentiator of our brand promise is our approach for customer relationships management (CRM), which we call our customer experiences programme. Our Interaction was improved during past years and analysis into other digital tools for stakeholder interaction ensures that we are up-to-date with state of the art technologies. Our brand protection remains a core priority and we are committed to strong brand leadership values, including our brand guidelines on the use of our brand, which we also cover with external engagements.
Identify business excellence opportunities
We are still looking to improve our business procedures and functions more effectively in order to satisfy the demands of our customers. We use business processes and technology for business analysis to define key performance processes that enable us to concentrate on core expertise. In addition, LBF has developed a center of innovation and technology to supervise management activities of business processes.
Leveraging technology in our spaces
We are committed to creativity to maximize our market worth and our stakeholders and have thus taken the unorthodox path to our infrastructure. This ensures that we have the freedom to take the decisions to mold our experience as desired and still keep control of the produced results. We also wanted to follow a new world class digital platforms.
We partner with media agencies to capitalize our room and our own screens to achieve ‘space’ or slots on digital advertisement space. We thus build on established ties and industrial know-how of our stakeholders while ensuring that the bulk of revenue is kept within our company.
Stability Leadership Strength Agility Responsibility Sustainability Success Supplementary Information

HOW IT ADDS VALUES Our active engagement with all our stakeholders creates sustainable value and helps us to achieve our objectives in a mutually beneficial way.
SOCIAL AND RELATIONSHIP CAPITAL
WHAT IT INCLUDES Our social and relationship capital involves the relationships we have created and nurtured with our stakeholders as well as the inter-relationships between them that enable greater value creation for all.
STRATEGIC DRIVERS
Updated software, increased automation and employee training
Partnerships with multilateral organizations
Analysts and increased engagement through social media
INPUT
Excellent customer services
Proactive interaction with communities
Enhance business partnerships
Increase branding effort to be to reach more segments
CHALLENGES
Addressing customers’ queries and potential complaints
Finding the right partnerships that can bolster value creation
Attaining process improvements for continuous development
1 2 3
TRADE OFF
Our social and relationship capital is intricately linked with our people strategy and the way we engage with our customer and other
stakeholders. The services and operations of many of our branches are designed to best serve the customers within their closest vicinities, so that
we can specialize in customizing our offerings to their specific needs.
4
Customer base
Over
Comprehensive financial solutions
Paid to the government as taxes
CSR projects Invested in community development projects
600,000 31 Rs. 3,968 Mn 22 Rs. 37 Mn
CAPITAL REPORTS
SC
L B Finance PLC | Annual Report 2020/21176

Business partners
Digital transaction growth
Enhance social media engagement
Digital modules for speedy transactions
Innovative products
3,000 337%
KEY OUTPUT
Increased customer base by 8.81%
Investment on CSR Rs. 37.24 Mn
Strong partnership and focus to let out our spaces
FUTURE
Align our business strategies with our branding approach for solidifying our long-term stakeholder relationships
7
8
SDG impactRelated material themes and drivers Related stakeholders and concerns
Operational excellence
Innovation
Customer satisfaction
Corporate citizenship
Supply chain management
Managing customer caring and customer relationship
Train customer centric employees through skills development
Social wellbeing, community support and improving CSR engagement
Improving enterprise development and supplier development
SPACE FOR DEVELOPMENT
Events that bring various stakeholders on common platforms
Innovative funding options for non-captured segments in partnership with multilateral institutions
Customer service enhancement initiatives
5 APPROACHES TO MANAGING SOCIAL AND RELATIONSHIP CAPITAL OUTCOMES
Contribute to a stable operating environment by supporting uplifting our communities
CSR programmes - provide support for communities within and around operations
Building trust with business partners through proactive communication for business continuity
6
5,764 Active employee volunteer hours for CSR
Visit web page for our philosophy, Management approaches and analysis of Social and Relationship Capital
Over
Employee Volunteer Hours
5,764
L B Finance PLC | Annual Report 2020/21 177
Stability Leadership Strength Agility Responsibility Sustainability Success Supplementary Information

L B Finance PLC | Annual Report 2020/21178
CAPITAL REPORTS
Social and Relationship Capital
OVERVIEW
Our social and relationship capital is made up of the stakeholder ecosystems that support LBF to achieve its strategic intent. These include the relationships with customers, suppliers and the community at large.
Social and Relationship Capital
Customer capital Community capital Business partner capital
CUSTOMER CAPITAL
Fulfilling our customer promise
Managing our channels
Ensuring trust and safety
Customer relationship management
Monitoring customer
loyalty and satisfaction
KEY MATERIAL DRIVERS
1 2 3 4 5
Customers are the reason we remain in business. Therefore, we believe that serving our customers is not an obligation but rather an opportunity to prove that LBF stands a cut above the rest.
Who are our customers?
Individuals and businesses that make use of LBF’s portfolio of investing and financing solutions and value added services
Why do our customers choose us?
The strength of the LBF brand together with the highly customer centric product offerings and the commitment to service excellence translates into positive experiences for individuals and business customers
Best customer experience is great for our customers, but also great for LBF: We measure it by looking at the extent to which our performance compares with that of our next best competitor. We should see the benefits in our ability to bring on more customers than our natural market share, growing this over time. In markets where we have a best customer experience allows us to protect and even grow the market share.
Fulfilling our customer promise
Our promise to our customers is the assurance of responsible financial products and services combined with the best in-class experience. At a minimum this means ensuring full compliance with all legal and regulatory requirements applicable to our business. In recent years, LBF has gone beyond these minimum expectations and has voluntarily undertaken to abide by accepted industry norms and best practices to safeguard the interest of the customer more holistically. Accordingly, we now measure the environmental and social impact of all new products against available standards.
Strengths
A diverse portfolio of highly customer centric products and services to cater to all market segments along with superior digital capabilities to enable the launch of first-to-market products and sevices
Weaknesses
Inadequate mechanisms to track customer satisfaction and loyalty in a more consistent manner
Opportunities
Use of digital technology to map out pain points in the customer journey and find appropriate solutions
Threats
Highly competitive environment with a large number of players fighting for market share
SWOT ANALYSIS

L B Finance PLC | Annual Report 2020/21 179
Principle Our Responsibility
Customer first Consider the customer’s needs and wants first
Customer accountability Own the issue and don’t pass the blame
Simple, clear and transparent Communicate in clear and uncomplicated language
Continuous improvement Continuously improve our products, services and channels in line with customer expectations and changing needs
Monitor and reporting Identify gaps and initiate appropriate corrective action
LBF’s Customer Promise
The execution of our customer promise is pivoted on four key pillars:
Offering World-Class Integrated Financial Solutions
Strategy
Develop solutions that address the customers’ needs more holistically. This means focusing not only on meeting the customers’ need for financial products but also satisfying their desire for convenience and overall ease of access.
Action
We recognize that technology adoption needs to be successful and that our organization and community have been restructured to allow our employees to better their customer experience. The conventional silo strategy shifts to cross-functional teams focused on agile customer service.
Launch of the LB CIM wallet application
Highlights
Speedy leasing facilities
Enabled the direct debit facility on the LB CIM wallet
Integration with Lanka QR to allow micro merchants direct access to finance via the LB CIM app
Integration of the gold loan system to the LB CIM mobile app
1
LB LeasingBenefits of using CIM AppAwareness LB CIM app
Stability Leadership Strength Agility Responsibility Sustainability Success Supplementary Information
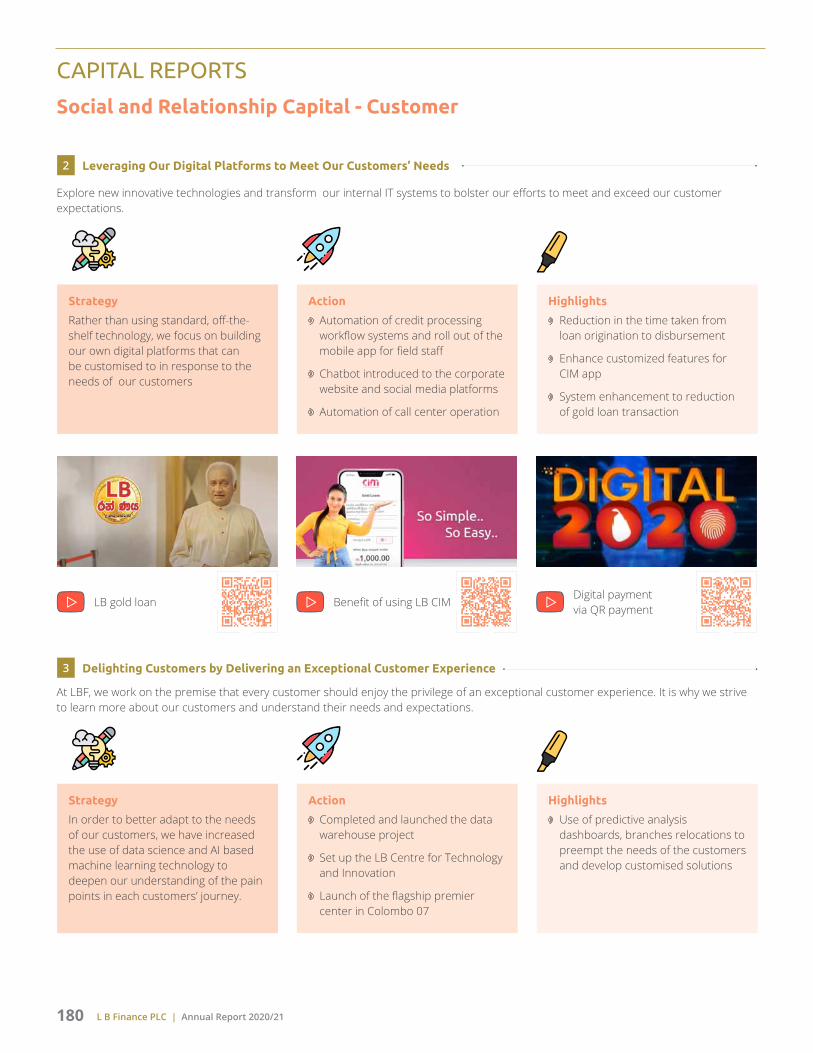
L B Finance PLC | Annual Report 2020/21180
Strategy
Rather than using standard, off-the-shelf technology, we focus on building our own digital platforms that can be customised to in response to the needs of our customers
Strategy
In order to better adapt to the needs of our customers, we have increased the use of data science and AI based machine learning technology to deepen our understanding of the pain points in each customers’ journey.
Action
Automation of credit processing workflow systems and roll out of the mobile app for field staff
Chatbot introduced to the corporate website and social media platforms
Automation of call center operation
Action
Completed and launched the data warehouse project
Set up the LB Centre for Technology and Innovation
Launch of the flagship premier center in Colombo 07
Highlights
Reduction in the time taken from loan origination to disbursement
Enhance customized features for CIM app
System enhancement to reduction of gold loan transaction
Highlights
Use of predictive analysis dashboards, branches relocations to preempt the needs of the customers and develop customised solutions
Explore new innovative technologies and transform our internal IT systems to bolster our efforts to meet and exceed our customer expectations.
At LBF, we work on the premise that every customer should enjoy the privilege of an exceptional customer experience. It is why we strive to learn more about our customers and understand their needs and expectations.
CAPITAL REPORTS
Social and Relationship Capital - Customer
Leveraging Our Digital Platforms to Meet Our Customers’ Needs 2
Benefit of using LB CIM LB gold loan Digital payment via QR payment
Delighting Customers by Delivering an Exceptional Customer Experience3

L B Finance PLC | Annual Report 2020/21 181
Strategy
LBF’s media and promotional material conform to all regulatory compliance requirements as well as industry norms and standards. In addition we use insights from our engagements with our customers to continuously enhance the quality of the content of our promotional material
Action
Focus on mass media
Increased promotional material made available on social media platforms
Highlights
Introduce LB Easy digital loan facilities
Partner with Lanka QR-strengthening the digital vision of Sri Lanka
Organize the social media customer engagements
We are of the opinion that every customer has the right to make informed decisions and believe that giving them the required tools to do so builds trust in the LBF brand.
LB Finance premier
Savings habits
LB Divijaya – Success stories
LB digital loan
Building Customer Awareness 4
Branch opening
Winner – SMS Three Wheel Number
Stability Leadership Strength Agility Responsibility Sustainability Success Supplementary Information

L B Finance PLC | Annual Report 2020/21182
Managing our channels
LBF maintains a broad range of physical and digital channels to give customers the opportunity to access the Company’s
products and services. A multitude of factors influence our channel management decisions. Some of the factors considered are; customer profiles, customer life-cycles, geographical location, population density
and competitive positioning. In recent years we have also been paying keen attention to emerging tech trends both globally and locally.
CUST
OM
ER S
EGM
ENT
Kids/Teenagers 01-18 Millennials 19-29 Young families 30-39 Established families 40-55 Mature well-off 55-60 Senior citizens 60+ Self-employed individuals SME’s
Children are the custodians of the future
Nurturing their hopes and dreams in the right way is the key to a stable future
Millennials are focused on life experiences and as such express a strong skew towards investment and retirement products
Young families are often under financial pressures brought on by lifestyle aspirations including; bigger homes, family vehicles, etc
Balancing work commitments, children’s education expenses and retirement planning often compels the need of flexible products to accommodate unplanned expenses
Mature, financially –stable customers who focus on a higher quality of life and enjoying their retirement
Senior citizens who expect secure product returns in order to maintain quality of life they are accustomed to
Independent self sufficient individuals seeking dynamic solutions to progress to the next level
Deemed the backbone of the national economy, SME’s require stable long term solutions that would help their businesses to grow and mature
FOCU
S PR
OD
UCT
S
LB Minor Savings, LB Regular Savings
Personal loan, Digital financing leasing and savings products
Leasing, Mortgage Loan, Gold loan, Digital financing and savings products
Education loan, Gold loan and savings products
FD products and Savings products
Senior citizens’ FD and savings products
Personal loan, Leasing, Savings, Mortgage and Gold loan
Personal loan, Gold loan, Mortgage, Micro Leasing and Savings
CHAN
NEL
PRE
FERE
NCE
S
BRANCH
CONNECTED ATMS
DEPOSIT KIOSKS
LB E-CONNECT
LB CIM WALLET
SOCIAL MEDIA
Ensuring trust and safety
Customer trust is a key determinant in our success as a financial services institution. We believe creating a safe and secure environment for our customers to transact with the Company is the fundamental principle in building customer trust. In this regard, LBF’s Code of Conduct for employees provides a foundational
guidance regarding the behaviours and protocols all employees are expected to follow, including a chapter on anti-corruption and anti-bribery practices. Furthermore we undertake to continually train our employees to educate them on customer rights and the importance of honesty and integrity in their dealings with customers.
Data privacy, customer privacy and information security
LBF is fully committed to protect the privacy and integrity of customers’ personal data and information. In this regard we comply with all national information security regulations and do not disclose customer information to the public domain unless otherwise compelled by law. All
CAPITAL REPORTS
Social and Relationship Capital - Customer

L B Finance PLC | Annual Report 2020/21 183
customer information is stored securely at LBF’s data centers and is protected by the best in-class firewalls and 24/7 monitoring to detect and flag irregularities in the form of external breaches or internal data leakages.
Going beyond compliance, LBF’s systems are benchmarked against the ISO 27001 Information security standard, following
the successful completion of the annual audit, the ISO 27001 was renewed in 2020, for a further three year period ending in August 2023. The Company’s information security architecture, including system controls, policies and procedures, all stem from the best practices outlined by the ISO 27001. These frameworks were further strengthened in the year under review, in view of the fact that a majority of the
Company’s employees were working from home for several months. In addition, LBF was one of the first financial institutions to tie up with FinCSIRT, the only dedicated computer security incident response team for Sri Lanka’s financial sector.
Meanwhile, taking early action to improve its readiness to comply with the proposed Data Governance Act due to be gazette
CUST
OM
ER S
EGM
ENT
Kids/Teenagers 01-18 Millennials 19-29 Young families 30-39 Established families 40-55 Mature well-off 55-60 Senior citizens 60+ Self-employed individuals SME’s
Children are the custodians of the future
Nurturing their hopes and dreams in the right way is the key to a stable future
Millennials are focused on life experiences and as such express a strong skew towards investment and retirement products
Young families are often under financial pressures brought on by lifestyle aspirations including; bigger homes, family vehicles, etc
Balancing work commitments, children’s education expenses and retirement planning often compels the need of flexible products to accommodate unplanned expenses
Mature, financially –stable customers who focus on a higher quality of life and enjoying their retirement
Senior citizens who expect secure product returns in order to maintain quality of life they are accustomed to
Independent self sufficient individuals seeking dynamic solutions to progress to the next level
Deemed the backbone of the national economy, SME’s require stable long term solutions that would help their businesses to grow and mature
FOCU
S PR
OD
UCT
S
LB Minor Savings, LB Regular Savings
Personal loan, Digital financing leasing and savings products
Leasing, Mortgage Loan, Gold loan, Digital financing and savings products
Education loan, Gold loan and savings products
FD products and Savings products
Senior citizens’ FD and savings products
Personal loan, Leasing, Savings, Mortgage and Gold loan
Personal loan, Gold loan, Mortgage, Micro Leasing and Savings
CHAN
NEL
PRE
FERE
NCE
S
BRANCH
CONNECTED ATMS
DEPOSIT KIOSKS
LB E-CONNECT
LB CIM WALLET
SOCIAL MEDIA
Stability Leadership Strength Agility Responsibility Sustainability Success Supplementary Information

L B Finance PLC | Annual Report 2020/21184
in the near future, LBF began the initial groundwork for the development of a specific data protection protocol. The new protocol once established, would cover a wide range of areas including data classification, access control frameworks, duties and responsibilities etc.
Customer relationship management
Customer relations are the bedrock of any organization seeking to become more customer centric and LBF is no different. LBF’s customer relationship management strategy aims to cultivate and build solid relationships with customers. Hoping that earning their loyalty and respect will help to retain customers in the long term.
Building customer relations requires special skills and as such is most often undertaken by all branch teams, the call center and other customer departments that come into direct contact with customers. As part of the customer relationship building effort, these teams are required to identify customer needs and dynamically provide suitable solutions to cater to the diverse needs of different customer segments at different stages of the customer lifecycle. The feedback our teams receive during their interactions with customers are vital as it paves the way for innovation and continuous improvement
of products and services and optimising service delivery.
In light of the COVID-19 pandemic, customer relationship management was thrust into a new dimension and became an all-round effort involving LBF’s entire workforce. Immediately following the announcement of the lockdown, the management took some proactive steps to assist customers to tide over the difficult times. After conducting detailed assessments of all leasing customers on a case by case basis, we began offering reschedulement plans and fee waivers while yet others were granted additional grace periods for the repayment. We also took proactive steps to extend the debt moratorium scheme to eligible customers. At the same time front office teams were requested to remain in constant contact with customers under moratorium.
Gold loan customers too who were unable to meet their settlement deadlines due to the lockdown were given a grace period.
An AI-based chatbot was introduced to the corporate website as well as all social media platforms to streamline the handling of routine queries. Consequently, complaints received through the call center reduced significantly in the current financial year.
In addition, a new complaint handling protocol was established specifically for the purpose of addressing complaints received via the CBSL’s complaint hotline, which was set up in the wake of the pandemic. The protocol included clear guidelines for branches for the handling of such complaints along with relevant duties and responsibilities and oversight procedures.
Monitoring customer loyalty and satisfaction
LBF believe the only way which can assess Company’s efforts are successful is to quantifiably measure customer loyalty and satisfaction with the first such customer satisfaction survey was done in FY 2020/21. In the year under review, LBF commissioned the research unit of the Department of Marketing - University of Sri Jayewardenepura to carry out another customer satisfaction survey. With an expanded scope and larger sample size, the latest survey was designed to provide quantitative information as well as a range of qualitative indicators to measure customer loyalty towards LBF.
CAPITAL REPORTS
Social and Relationship Capital - Customer
SURVEY INSIGHTSStudy conducted by: The Department of Marketing ManagementUniversity of Sri Jayewardenepura
0
50
100
150
200
250
Strongly Satisfied SatisfiedModerateDissatisfiedStrongly Dissatisfied
Freq
uenc
y
Friendliness in service
0
50
100
150
200
250
300
350
Strongly Satisfied SatisfiedModerateDissatisfiedStrongly Dissatisfied
Freq
uenc
y
Attractiveness of theinterest rate

L B Finance PLC | Annual Report 2020/21 185
Creating value for Customer Capital
Value for LBFValue for customer
Income generated through lending activities
Access to funds through deposit mobilisation activities
Ability to earn fee-based income through value added services
Customised products to satisfy every financial need
Investment products that provide retirement income and meet savings goals
Responsible and objective financial advices
Value for Society
Ensure financial well-being of the individuals and businesses across the country
Increase national savings
Enhanced trust in the financial services industry
Building for the future – Customer capital
Short term (<1) Medium term (1-3) Long term (3-5)
Continue to refine internal systems and processes through increased automation, in order to improve customer service delivery parameters
Further strengthen information security architecture by implementing the data protection protocol and by investing in the latest DLP (Data Leakage Prevention) and PAM (Privilege Access Management) software
Track customer satisfaction and loyalty as a more frequent indicator across business units, channels, product interactions and customer journey moments
Improve the effectiveness of the customer survey process
Develop new technology based solutions tailored to meet the needs of different customer segments
Focus on creating more customized promotional content on all mediums
GROWTH SUSTAINABLE OPPORTUNITYImproving new customer numbers, customer retention and attention
on the 360 degree view of customer
TOWARDS VISIONLeading loyal customer brand in Sri Lanka
We want as many people as possible to be able to benefit from access to financial services. We continue to see growing demand from many of our customers for more digital ways to bank, not least as a result of the COVID-19 pandemic. LBF is embedded in the community. As a result, we see social and relationship capital as the link between our business and society. We are able to create and identify new opportunities to deliver enduring value and mutual benefit to the societies in which we operate
Mr. Ravindra YatawaraExecutive Director
Stability Leadership Strength Agility Responsibility Sustainability Success Supplementary Information

L B Finance PLC | Annual Report 2020/21186
BUSINESS PARTNER CAPITAL
LBF business partners, whom rely on to deliver our value proposition to our other stakeholders, are critical components of the Company value chain.
Strengths
A strong, dependable supplier base ensuring the uninterrupted procurement of goods and services to maintain business continuity
Weaknesses
Lack of a planned engagement agenda
Opportunities
Promote local sourcing for routine requirements at branches
Threats
Unscrupulous tactics adopted by some suppliers after securing a contract with the Company
Supply chain profile
LBF’s supply chain consists of a several large suppliers and a few hundred small suppliers broadly categorized segments based on the degree of functional support they provide to the Company. Business partner base and annual spend value
Financial Year 2020/21 2019/20 2018/19
No. of business partners More than 3,000
More than 4,000
More than 1,500
Supply chain management approach
LBF maintains a centralised approach to supply chain management, where all procurement activities, with the exception of IT, is managed centrally by the Company’s administrative department. As the main authority in charge, the administrative department is required to ensure that procurement activities are fully streamlined with the requirements of each business unit and carried out as per LBF’s procurement policy. Developed in line with global best practices, our procurement policy creates a level playing field to ensure that all suppliers are treated equally and fairly throughout their relationship with LBF.
Developing suppliers as strategic partners
As part of their duties, the administrative department is tasked with overseeing the development of suppliers as long term strategic partners. This means maintaining continuous and ongoing engagement with suppliers to ensure they remain fully aligned with LBF’s standard operating procedures and code of ethics at all times. We meet with suppliers as and when needed. However, with these interactions suspended in the current financial year due to the COVID-19, we reached out to suppliers through social media and other online channels, whenever possible and practical.
CAPITAL REPORTS
Social and Relationship Capital - Business Partners
SWOT ANALYSIS
Why does LBF need suppliers and business partners?
To obtain necessary goods and services needed to carry out the day-to-day operations of the Company
Why do business partners choose LBF?
To grow their business over time by providing goods and services to meet LBF’s requirements
KEY MATERIAL DRIVERS
Supply chain profile
1
Supply chain management
approach
2
Developing suppliers
as strategic partners
3

L B Finance PLC | Annual Report 2020/21 187
Creating value for business partner capital
Value for LBFValue for business partners
Ability to procure high quality goods and services at competitive prices facilitated by long term contracts
Assurance of business continuity
Leverage on new technology for more cost effective solutions
Quick settlement of dues
Possibility to establish long term business relationships
Earnings stability even amidst uncertainty
Value for society
Enhances the service quality of the LBF’s value proposition
Improves trust in the financial services industry
Opportunity for development of start-ups
Asset and material
Vehicles
Furniture
Office equipment
Stationary
Outsourced services
Security
Food and drinking water
Sanitary facilities
Traveling and transport
Courier
Financial service provide
Banks and financial institutions
IT
IT hardware suppliers
Software development services
Network service security
Software services (ORACLE)
Other Services
Auditors
Utility services
Media
Consultancy
Premises providers
Building for the future - Business partner capital
Short term (<1) Medium term (1-3) Long term (3-5)
Further strengthen the quality and reliability of the supply through diversification
Increase supplier training to raise awareness on ethics, integrity and best business practices
Create digital solutions to promote greater financial inclusion among small scale suppliers
Create opportunities for suppliers to develop their business in line with LBF’s growth trajectory
Use of technology solutions to streamline the supplier screening procedure
Encourage suppliers to align with LBF’s social and environmental priorities
GROWTH SUSTAINABLE OPPORTUNITYDevelop the MSME sector as an essential enabler for the creation of much-needed employment opportunities
TOWARDS VISIONEnsuring that beneficiary suppliers focus on integrated services and value creation for
LBF as well as LBF customers.
Stability Leadership Strength Agility Responsibility Sustainability Success Supplementary Information

L B Finance PLC | Annual Report 2020/21188
COMMUNITY CAPITAL
As a responsible corporate citizen, LBF aim is to contribute towards social and economic development on a regular basis. Company maintain an open ended approach and undertake projects that demonstrate the capacity to significantly improve the quality of life of underserved communities around the Country.
Why do LBF connect with the community?
To understand how LBF can assist in addressing key community issues and also to forge partnerships that will support the achievement of the Company’s integrated sustainability objectives
Why do business partners choose LBF?
To find real solutions for pressing issues that hinder the progress of their communities
Strengths
Solid reputation as a responsible community steward derived through consistent efforts to tackle community issues over the years
Weaknesses
Lack of a formal employee volunteer programme
Opportunities
Conduct valid, reliable research into an identified area and design a mix of projects that will meet the unique needs of the chosen community
Threats
Failure of projects due to the inability to tie up with the right partners who can add value to the Company’s efforts
Knowledge and beyond
Access to education
We believe a quality education at primary, secondary and tertiary levels will lay the foundation to reduce inequalities and pave the way for sustainable socio economic development in the long term. LBF’s CSR strategy prioritises access to education with the aim of eliminating the persistent knowledge disparity that exists in Sri Lanka. Furthermore, as a responsible financial institution, we feel we have a bigger role to play in improving financial literacy among the wider community which in turn would support the creation of self-sustaining communities with the capacity to fuel economic growth.
CAPITAL REPORTS
Social and Relationship Capital - Community
SWOT ANALYSIS
Knowledge and beyond
Knowledge sharing
Community wellbeing
Build partnerships
Business linked CSR
KEY MATERIAL DRIVERS
1 2 3 4 5
Investmenton CSR
05
10152025303540
2018
2019
2021
(Rs.Mn)
Contribution (%)
Access to educationEmpowering entrepreneurs Community well being Business linked CSRBuilding parnerships Youth empowerment
26.32
58.23
9.75 2.75 1.021.93
2021

L B Finance PLC | Annual Report 2020/21 189
Access to education
Description Achievements Employee volunteerism
(hours)
2020/21 Expenditure
(Rs.)
Primary educationLB preschool development project
Infrastructure facilities are provides to the selected preschools in Sri Lanka, continuation of the LB preschool development project
Provide accesses to education
Establish pleasant environment for kids to learn
Filling the gap of the education facilities in rural preschools
75 preschools completed and 08 preschool developed in this year
427 750,000/-
Christmas with LB
Creative greeting card contest on Christmas celebration for children and printed them as our seasonal greeting cards
Provide mentally relaxation for the COVID-19 pandemic
Enhance the aesthetic ability of the children
96 candidates participated and 10 selected as winners
96 45,000/-
Kids entertainment
Share video songs release DP kids with LB Finance with Sibil Weththasinghes’ books
Facilitate the video learning platforms
Develop the listening and understanding capabilities 02 video clips, more than 400 viewers
54 -
Puzzle competition for Kids
In line with world children day conducted a puzzle competition through social media platform
Support for the early education
Develop the education interest through the funny activities
113 kids participated for the competition and 20 awarded with gifts
61 13,000/-
Secondary education Digital classroom
Donated DP Education Digital Classroom to Siri Kurusa Vidyalaya, Payagala
Enhance digital inclusiveness
Up lift digital literacy in the early stages
184 180,000/-
Puzzle competition for secondary level
In line with world children day conducted a puzzle competition through social media platform
Enhance the general knowledge of the students
Provide in house activities for stay home situation in the country
113 students participated for the competition and 20 awarded with gifts
83 37,000/-
Tertiary and post-tertiaryTrain your brain
Distribute a train your brain video and soft skill development video on the social media to explain the “Rules of train your brain” and 5 tips at the public speaking
Provide guidance to enhance the capacity
Ready the future leaders of the Sri Lanka
02 video clips, more than 500 viewers
64 -
Consumer Education Education on financial management
Conducted video series on social media to build awareness of the financial management under the topics of building investment habits, developing your savings habit, golden rules for strong financial security
Enhance the savings habit of the customers and non-customers
Provide the wealth maximization opportunities
02 video clips
75 -
Stability Leadership Strength Agility Responsibility Sustainability Success Supplementary Information
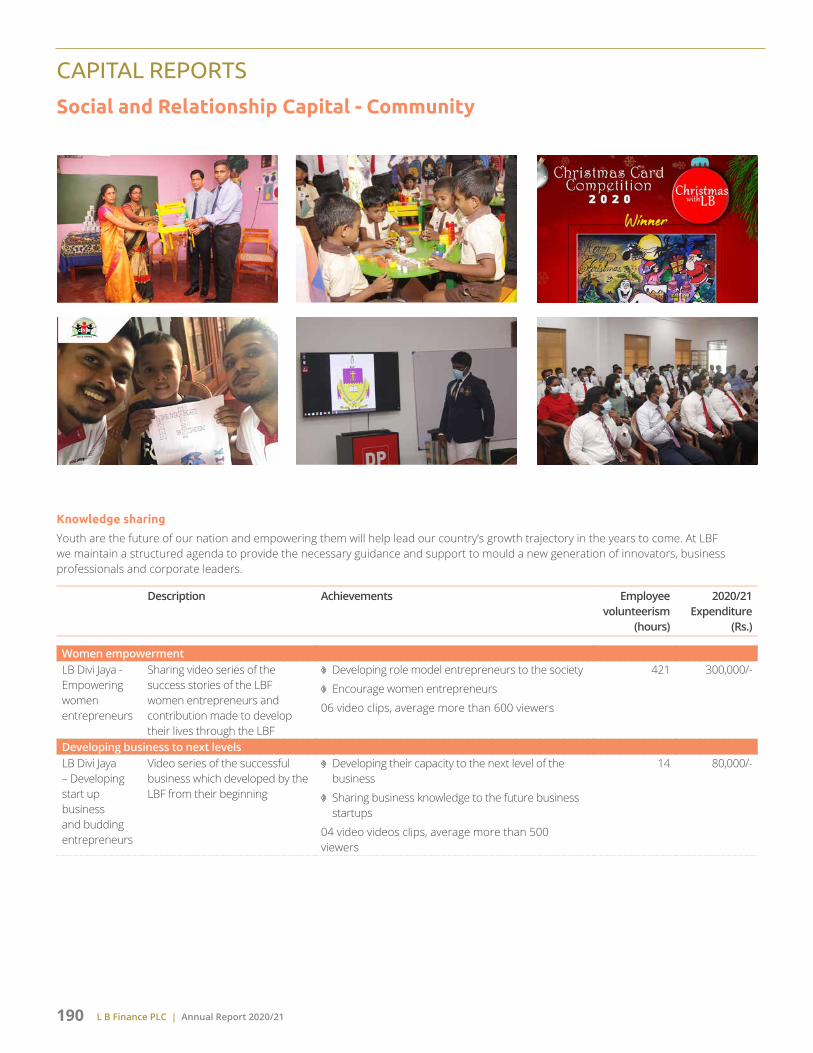
L B Finance PLC | Annual Report 2020/21190
Knowledge sharing
Youth are the future of our nation and empowering them will help lead our country’s growth trajectory in the years to come. At LBF we maintain a structured agenda to provide the necessary guidance and support to mould a new generation of innovators, business professionals and corporate leaders.
Description Achievements Employee volunteerism
(hours)
2020/21 Expenditure
(Rs.)
Women empowermentLB Divi Jaya - Empowering women entrepreneurs
Sharing video series of the success stories of the LBF women entrepreneurs and contribution made to develop their lives through the LBF
Developing role model entrepreneurs to the society
Encourage women entrepreneurs
06 video clips, average more than 600 viewers
421 300,000/-
Developing business to next levelsLB Divi Jaya – Developing start up business and budding entrepreneurs
Video series of the successful business which developed by the LBF from their beginning
Developing their capacity to the next level of the business
Sharing business knowledge to the future business startups
04 video videos clips, average more than 500 viewers
14 80,000/-
CAPITAL REPORTS
Social and Relationship Capital - Community

L B Finance PLC | Annual Report 2020/21 191
Community wellbeing
Description Achievements Employee volunteerism
(hours)
2020/21 Expenditure
(Rs.)
Community supportDistribution of dry rations for police officers
Donation of dry rations to police officer families who are affected Corona virus within their duties
Building up moral of the “Suwa viruwo” who dedicated their works to protect Sri Lanka from the Corona virus
47 114,000/-
Distribution of dry rations for underprivileged people in Myanmar
Our team members of Myanmar donated dry rations and face masks to the under privileged community in Myanmar
Support to reduce the financial difficulties under the COVID-19 pandemic
79 587,500/-
Health and SafetyBlood donation campaign
In line with 4th Anniversary celebration kekirawa branch conducted a blood donation campaign and LBF corporate office joined hand with Senehasa Padanama has been oraganized another a blood donation campaign
Supported to diminish the shortage of blood due to the COVID-19 pandemic
Build up the brand as responsible corporate citizen among the community
192 donors
161 20,000/-
Awareness programmes
Conducted a social media base COVID 19 Awareness programmes, covering health habits, importance of using face mask, way of using QR scan code to enter details, guidelines on how to resume activity in areas where quarantined curfew not imposed and video on how to protect in corona
Establish the safety measure among the community in the pandemic situation
Awareness building on government health guidelines in the special situations ( Dos and Don’ts)
02 video clips, average more than 1,500 viewers
77 -
Stability Leadership Strength Agility Responsibility Sustainability Success Supplementary Information

L B Finance PLC | Annual Report 2020/21192
CAPITAL REPORTS
Social and Relationship Capital - Community
Build partnerships
We have come to understand that strategic partnerships with like-minded institutions can bring synergies that greatly enhance the impact of our community initiatives. As such, we seek to forge appropriate value-adding partnerships from time to time, depending on the scope and scale of the projects that we undertake.
Description Achievements Employee volunteerism
(hours)
2020/21 Expenditure
(Rs.)
With Government institutions
National Hospital of Kandy and Apeksha Hospital Maharagama
Donating high quality US Brand Hamilton C3 model mechanical ventilators and ICU beds to the Cardio Therapeutic ICU
Donated mechanical ventilators are the most preferred brand by the health sector with ASV® and INTELLiVENT®-ASV, Protective Ventilation P/V Tool® Pro for lung assessment and recruitment, integrated high flow oxygen therapy and adult, pediatric, and neonatal ventilation
Building partnerships with Government Institutions to increase the health levels of the general public during the COVID 19 pandemic
Immediate react for the national health issues under the COVID-19 pandemic
Developing infrastructures of the health sector in Sri Lanka
Benefit distributed to unlimited patients
97 21,625,000/-
With Charity organizations
Ruth Children’s Home
Partnering Ruth Children’s Home, a non-profit organisation for providing IT literacy to residing children
Developing IT literacy of the undeserving peoples
Enhance IT skilled at the younger ages
40 Children obtain IT literacy
81 93,446/-
Diabetes screening project
In line with celebrating world diabetic day,partnered with Lions Club of Thalangama South to conducted a Diabetes screening project for head office and corporate office staff to improve the health level of employees
Awareness build on healthy lifestyles
Providing health habits based on the healthy levels
120 employees were tested
172 -
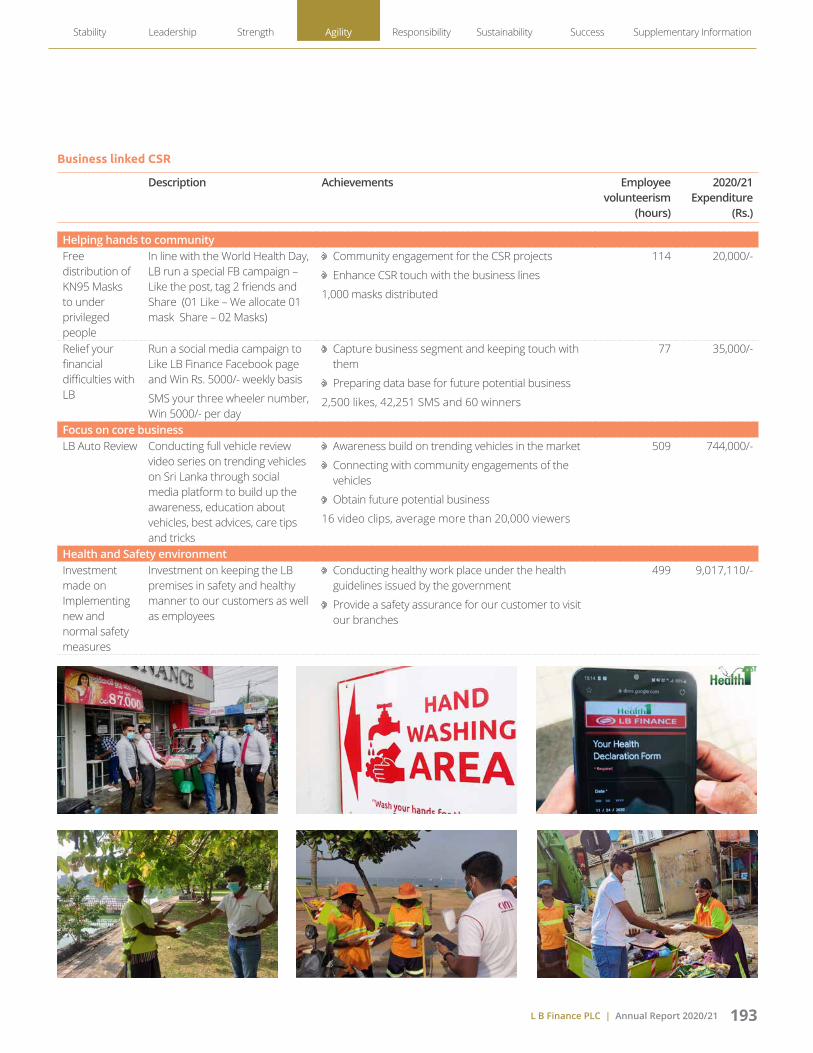
L B Finance PLC | Annual Report 2020/21 193
Business linked CSR
Description Achievements Employee volunteerism
(hours)
2020/21 Expenditure
(Rs.)
Helping hands to communityFree distribution of KN95 Masks to under privileged people
In line with the World Health Day, LB run a special FB campaign – Like the post, tag 2 friends and Share (01 Like – We allocate 01 mask Share – 02 Masks)
Community engagement for the CSR projects
Enhance CSR touch with the business lines
1,000 masks distributed
114 20,000/-
Relief your financial difficulties with LB
Run a social media campaign to Like LB Finance Facebook page and Win Rs. 5000/- weekly basis
SMS your three wheeler number, Win 5000/- per day
Capture business segment and keeping touch with them
Preparing data base for future potential business
2,500 likes, 42,251 SMS and 60 winners
77 35,000/-
Focus on core business LB Auto Review Conducting full vehicle review
video series on trending vehicles on Sri Lanka through social media platform to build up the awareness, education about vehicles, best advices, care tips and tricks
Awareness build on trending vehicles in the market
Connecting with community engagements of the vehicles
Obtain future potential business
16 video clips, average more than 20,000 viewers
509 744,000/-
Health and Safety environment Investment made on Implementing new and normal safety measures
Investment on keeping the LB premises in safety and healthy manner to our customers as well as employees
Conducting healthy work place under the health guidelines issued by the government
Provide a safety assurance for our customer to visit our branches
499 9,017,110/-
Stability Leadership Strength Agility Responsibility Sustainability Success Supplementary Information

L B Finance PLC | Annual Report 2020/21194
CAPITAL REPORTS
Social and Relationship Capital
Creating value for community capital
Value for LBFValue for community
Improved brand equity
Increased brand recognition and awareness of products and services
Creating a pool of future potential stakeholders
Reduced inequalities
Sustainable communities
Development of the rural economy
Value for customers
Association with a trusted financial partner
Ability to benefit from sound investment advice
Enhanced trust in the financial services industry
Building for the future - community capital
Short term (<1) Medium term (1-3) Long term (3-5)
Systematically expand the community investment in priority areas
Partnerships with multilateral organizations to develop innovative financing solutions for underserved segments
Establish a formal mechanism to handle community grievances
Increase community engagement through social media
Develop and launch a formal employee volunteer programme
Introduce a set of quantitative and qualitative indicators to measure the effectiveness of each project over time
GROWTH SUSTAINABLE OPPORTUNITYWorking for the society and achieving better sustainability by all of our stakeholders at large
TOWARDS VISIONAddressing the burden CSR segment to national sustainable development of Sri Lanka
Reaping benefits of investing in social and relationship capital
Focus on enhancing our operational efficiency and fine-tuning our structures to build strong relationships with our customers. We understand, however, that in optimising costs, there are relational trade-offs that need to be carefully managed
Develop new partnerships with new vehicles sales
Increased the reputational value
and market visibility
shared skills and competencies
Proactive interaction with stakeholders as
responsible corporate citizenship
Open for new revenue streams
Develop new Entrepreneur
development in the wider economy
Acquiring more customers and cross selling
opportunities
A positive relationship with employees and the
community
Partner with vehicle sales to creates end-to-end business solutions for customers and new revenue streams
Provide support for communities within and around operations under the CSR initiatives
FC
FC
HC
HC
SC
SC
IC
IC
Increase Decrease

L B Finance PLC | Annual Report 2020/21 195
Tradeoff between capitals of social and relationship capital
Financial Human Intellectual Manufactured Social & Relationship
Natural
S M L S M L S M L S M L S M L S M L
Investment towards customer service
Systamized the supplier registration
Increasing community service efforts
S – Short term M – Medium term L – Long term Increase Decrease Neutral
Building for the future - social and relationship capital
Short term (<1) Medium term (1-3) Long term (3-5)
Improve our customer profiling, analytical and identify the cross-selling capabilities
Addressing customers’ queries and potential complaints through digital mediums
Leveraging key relationships for long-term value creation
Improving collective wellbeing through utilizing relationships within and across communities
Partnerships with multilateral organisations to innovate financing and community engagement solutions for underserved segments
Effective management of stakeholder relationship through active engagement has enabled us to foster a strong goodwill with our customers, business partners and community at large
GROWTH SUSTAINABLE OPPORTUNITYImplement digital Customer Relationship Management (CRM) solution across the company
TOWARDS VISIONImplement long-term community service and engagement initiatives based on our CSR approach
2013/14 2015/16 2019/202017/182014/15 2016/17 2020/212018/19
Dirimaga’ credit facilities to SME sector
Introduced Power Plus and Money Gram agent ship for international money transfer
Rs. 4.99 million invested on CSR
LB digital CIM wallet
Invested Rs. 12.9 million on community development projects
‘LB Mulgala’ mortgage loan
Children’s’ savings product renamed as ‘Little Heroes’
Re-launched ‘L B Yasaisuru’ product
Rs. 23.51 million invested on sustainable development projects
VISA debit card Invested Rs. 14.5 million for the betterment of society
Invested Rs. 37.29 million on CSR projects
Digital Financial services Invested
Rs. 26.95 million on CSR projects
SOCIAL CAPITAL JOURNEY
Stability Leadership Strength Agility Responsibility Sustainability Success Supplementary Information

Carbon footprint
3,110 tCO2e
WHAT IT INCLUDES Natural capital comprises renewable and non-renewable resources needed to carry out our day-to-day operations as a financial services institution
HOW IT ADDS VALUES Efficient use of natural resources enhances LBF’s capacity to support its customers in achieving their own corporate sustainability goals
NATURALCAPITAL
STRATEGIC DRIVERS
Environmental strategy
Environmental initiatives
Green financing
INPUT
Energy Management System (EMS)
Carbon footprint calculation
Employee voluntarism for green initiatives
Actions taken for resource utilization
Focus digital financing for green business practices
CHALLENGES
Reducing the paper usage
Lowering the carbon footprint across the organisation
Increasing the green financing
1 2 3
TRADE OFF
Efforts to build natural capital only generate positive outcomes. For example, responsible consumption of resources to lower our carbon footprint, helps to improve the lifespan of our assets (Manufactured capital) and also enhances LBF’s reputation (Intellectual capital).
4
CAPITAL REPORTS
NC
Carbon neutral Company Trees planted
More than
Green lending Invested inEnvironmental initiatives
42,000 Rs. 3.51 Bn Rs. 1.01 Mn
L B Finance PLC | Annual Report 2020/21196
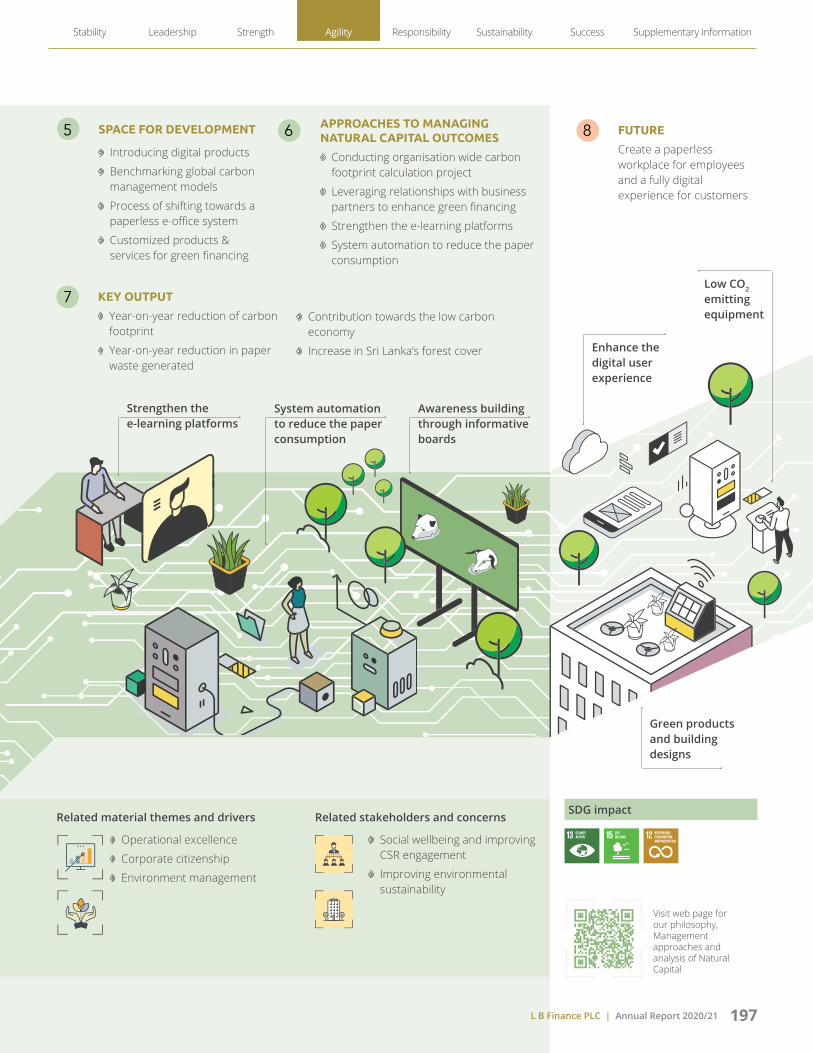
Low CO2 emitting equipment
Enhance thedigital user experience
Green products and building designs
KEY OUTPUT
Year-on-year reduction of carbon footprint
Year-on-year reduction in paper waste generated
FUTURE
Create a paperless workplace for employees and a fully digital experience for customers
7
8
SDG impactRelated material themes and drivers Related stakeholders and concerns
Operational excellence
Corporate citizenship
Environment management
SPACE FOR DEVELOPMENT
Introducing digital products
Benchmarking global carbon management models
Process of shifting towards a paperless e-office system
Customized products & services for green financing
5 APPROACHES TO MANAGING NATURAL CAPITAL OUTCOMES
Conducting organisation wide carbon footprint calculation project
Leveraging relationships with business partners to enhance green financing
Strengthen the e-learning platforms
System automation to reduce the paper consumption
6
Contribution towards the low carbon economy
Increase in Sri Lanka’s forest cover
Visit web page for our philosophy, Management approaches and analysis of Natural Capital
Social wellbeing and improving CSR engagement
Improving environmental sustainability
Strengthen the e-learning platforms
System automation to reduce the paper consumption
Awareness building through informative boardsRs. 1.01 Mn
L B Finance PLC | Annual Report 2020/21 197
Stability Leadership Strength Agility Responsibility Sustainability Success Supplementary Information

L B Finance PLC | Annual Report 2020/21198
OVERVIEW
Climate change is one of the biggest challenges that the planet faces, with ramifications for the environment, society and the economy. It is a leading source of physical hazards and a driving force behind a transition taking place in society.
Time to time various global bodies have from time to time made important declarations to create benchmarks for countries and corporations to work towards addressing climate change. In 2015, the Paris Agreement set out a global action plan with the long-term objective of keeping the rise in average global temperature to well under 2°C compared to pre-industrial levels and limiting the increase to 1.5°C. Also in 2015, the United Nations General Assembly ratified a set of 17 Sustainable Development Goals (SDGs)that are intended to be achieved by the year 2030.
Strengths
Well established EMS to promote sustainable waste and energy management
Weaknesses
High dependency on non-renewable sources for the Company’s energy requirements
Opportunities
Moving towards a low carbon operations by embedding emission reducing initiatives into operational plans
Threats
Stiff competitive pressure for green financing
Emission
Water
Energy
Waste
Green Business
Conserved Environment
Green Employee
Environment Management
System (EMS)
Reduce
Reuse
Recycle
Training
Policies and Practices
Employee Engagement
OUR APPROACH TO ENVIRONMENTAL SUSTAINABILITY
CAPITAL REPORTS
Natural Capital
SWOT ANALYSIS
KEY MATERIAL DRIVERS
Our approach to environmental sustainability
1
Responsible operations
2
Responsible products and
services
3
Environmental protection and conservation
4
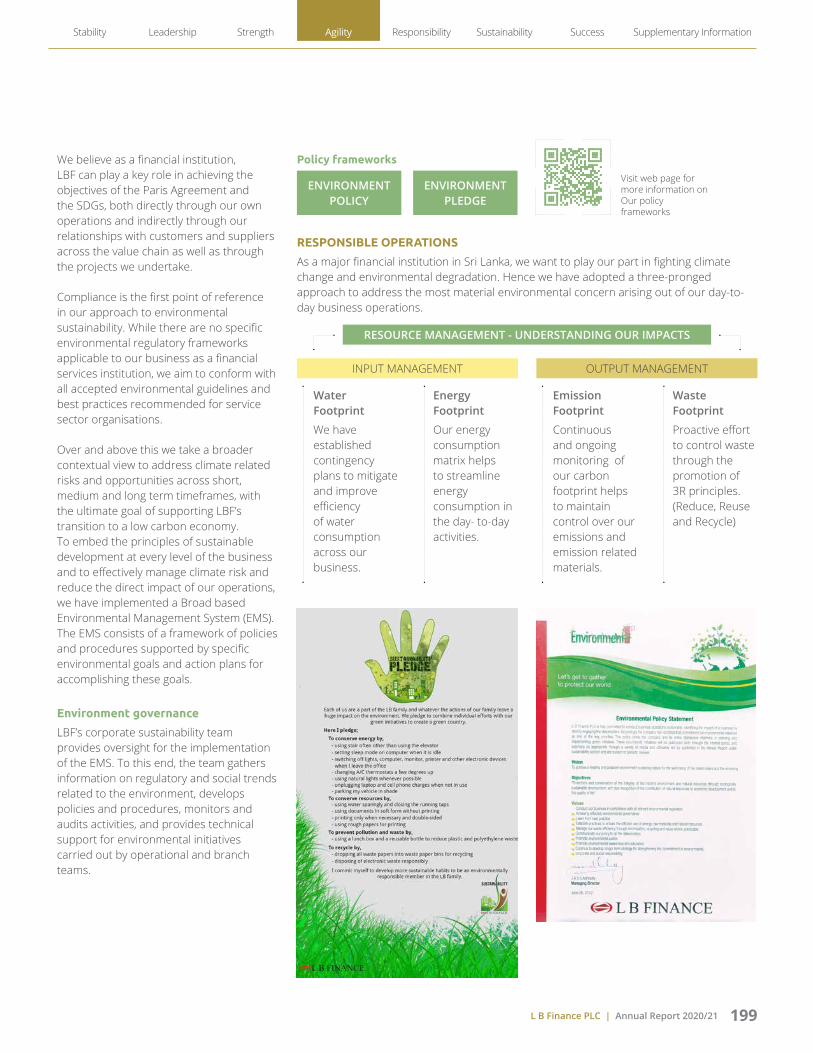
L B Finance PLC | Annual Report 2020/21 199
We believe as a financial institution, LBF can play a key role in achieving the objectives of the Paris Agreement and the SDGs, both directly through our own operations and indirectly through our relationships with customers and suppliers across the value chain as well as through the projects we undertake.
Compliance is the first point of reference in our approach to environmental sustainability. While there are no specific environmental regulatory frameworks applicable to our business as a financial services institution, we aim to conform with all accepted environmental guidelines and best practices recommended for service sector organisations.
Over and above this we take a broader contextual view to address climate related risks and opportunities across short, medium and long term timeframes, with the ultimate goal of supporting LBF’s transition to a low carbon economy. To embed the principles of sustainable development at every level of the business and to effectively manage climate risk and reduce the direct impact of our operations, we have implemented a Broad based Environmental Management System (EMS). The EMS consists of a framework of policies and procedures supported by specific environmental goals and action plans for accomplishing these goals.
Environment governance
LBF’s corporate sustainability team provides oversight for the implementation of the EMS. To this end, the team gathers information on regulatory and social trends related to the environment, develops policies and procedures, monitors and audits activities, and provides technical support for environmental initiatives carried out by operational and branch teams.
Policy frameworks
ENVIRONMENT POLICY
ENVIRONMENT PLEDGE
Visit web page for more information onOur policy frameworks
RESPONSIBLE OPERATIONS
As a major financial institution in Sri Lanka, we want to play our part in fighting climate change and environmental degradation. Hence we have adopted a three-pronged approach to address the most material environmental concern arising out of our day-to-day business operations.
RESOURCE MANAGEMENT - UNDERSTANDING OUR IMPACTS
INPUT MANAGEMENT OUTPUT MANAGEMENT
Water Footprint
We have established contingency plans to mitigate and improve efficiency of water consumption across our business.
Emission Footprint
Continuous and ongoing monitoring of our carbon footprint helps to maintain control over our emissions and emission related materials.
Energy Footprint
Our energy consumption matrix helps to streamline energy consumption in the day- to-day activities.
Waste Footprint
Proactive effort to control waste through the promotion of 3R principles. (Reduce, Reuse and Recycle)
Stability Leadership Strength Agility Responsibility Sustainability Success Supplementary Information

L B Finance PLC | Annual Report 2020/21200
Water management strategy
LBF’s water consumption is limited as it is typically used only for the utilities purposes of our staff. Nonetheless reducing our water footprint is one of the key objectives of LBF’s EMS. As part of our EMS, we have put in place a Company wide water management plan which provides clear guidelines to reduce daily consumption. To complement these efforts, we continue to raise awareness and encourage employees to remain vigilant in order to minimise wastage.
LBF’s ongoing actions on water management
Main focus Actions taken
Reduce consumption Usage of pressure reducing valves to maintain consistent water pressure
Taps with spray attachment to regulate water flow
Use of high-intensity pressure pumps for vehicle washing
Awareness Signage providing water saving tips
Reuse Usage of drain water for air conditioning cooling
Water efficiency interventions
Leak detection tools
Automatic shutdown valves
Policies and procedures
Commitment of employees via the sustainability pledge
Our water footprint
2020 marks the year since we undertook to measure LBF annual water footprint. Our total water withdrawal footprint for 2020/21 was 31,013 m3 liters, which is lower than our total water withdrawal in the last five years.
Energy management strategy
Grid electricity is our primary energy source. It is also the single largest contributor towards our carbon footprint. LBF’s energy consumption levels have continued to increase over the years in direct correlation to the growth in our business. Given the obvious impact on our carbon footprint, we continue to strengthen our energy management framework. Going beyond mere energy conservation initiatives, we have deepened our focus by incorporating baseline standards into our EMS in order to measure and monitor our weekly usage.
LBF’s ongoing actions on energy management
Main focus Actions taken
Reduce consumption Use of high-tech energy efficient equipment
Energy reduction methodologies
Electronic data collection and analysis
Energy audits
Installation of solar water heating systems to save electricity
Energy efficient lighting for sign boards at outlets
Maximum usage of natural lightAwareness Display of energy saving tips
E-mail campaign on the benefits of energy saving
Employee engagement Use of energy reduction methods at office and home
Policies and procedures
Commitment of employees to the sustainability pledge
Regulate the operating time of equipment
Total water consumption
31,013 m3
2019/20 - 39,793 m3
Per employee 8.70 m3
2019/20 - 11.04 m3
Per working day 140.97 m3
2019/20 - 180.88 m3
Per outlet 183.51 m3
2019/20 - 241.17 m3
Overall energy consumption
15,418.08 GJ2019/20 - 20,538.00 GJ
Per employee 4.33 GJ
2019/20 - 5.70 GJ
Per working day 70.08 GJ
2019/20 - 93.35 GJ
Per outlet 91.23 GJ
2019/20 - 124.47 GJ
Energy footprint
CAPITAL REPORTS
Natural Capital

L B Finance PLC | Annual Report 2020/21 201
Emission management strategy
LBF’s emission management strategy is underpinned by Principle 15 of the Rio Declaration: The precautionary approach on managing the physical impacts of a changing climate. As per the principle, we believe that lack of full scientific data should not be used as a reason for postponing cost-effective measures to prevent environmental degradation, where there are threats of serious or irreversible damage, including severe weather events, rising sea levels and shifting temperature zones.
On this basis LBF has committed to minimising the environmental impact associated with its operations by targeting a year-on-year reduction in total emission as well as by taking steps to offset direct emissions. As a medium term goal we are aiming to be a carbon credit generating organisation by 2025.
LBF’s ongoing actions on emission management
Main focus Actions taken
Reduce Moving away from high energy consuming equipment in favour of energy saving solutions
Promote the use of shared transport such as car pooling as opposed to the use of individual vehicles
Regulating usage during peak times
Providing integrated transport solutions for business duties
Awareness Email campaign on energy saving mechanisms to raise awareness among employees
Educate customers and the general public to accelerating Sri Lanka’s transition to a low carbon economy
Leadership Lead by example to encourage peers to strive for carbon neutrality by adopting best practices
Policies and procedures
Secure the commitment of employees to the EMS
Our emission footprint
The carbon footprint calculation is the key measure to determine LBF’s emission footprint. In 2013 LBF undertook to calculate its carbon footprint as per the GHG protocol covering direct emissions (Scope 1 as defined by the GHG protocol) resulting from business activities as well as Scope 2 and Scope 3 emissions due respectively to electricity purchased in the course of business and the emissions caused by employees commuting to and from work. Since then LBF has been reporting annually on GHG emissions against three WBCSD/ WRI scopes; which is further verified by the ISO 14064 - 1:2006 standards.
Our assessments for the year under review, did not reveal any significant air emissions or emission of ozone depleting substances, pollutants and other hazardous compounds arising from LBF’s operations. As a result, no detailed measurement of emissions was carried out for LBF, except for what was computed under the carbon footprint calculation process.
Total CO2 emitted
3,083.30 tCO22019/20 - 4,448.90 tCO2
Per employee 0.87 tCO2
2019/20 - 1.23 tCO2
Per working day 14.02 tCO2
2019/20 - 20.22 tCO2
Per outlet 18.24 tCO2
2019/20 - 26.96 tCO2
Stability Leadership Strength Agility Responsibility Sustainability Success Supplementary Information

L B Finance PLC | Annual Report 2020/21202
SCOPE 01Direct emission
144 tCO2e2019/20 - 189 tCO2e
SCOPE 02Indirect emission
2,128 tCO2e2019/20 - 3,335 tCO2e
SCOPE 03Other indirect emission
838 tCO2e2019/20 - 960 tCO2e
Total carbon footprint
3,110 tCO2e2019/20 - 4,484 tCO2e
Total Emission (Tones co2e)
Carbon footprint calculation
The carbon footprint calculation is the key driver of our emission management strategy. For this calculation we have adopted the methodology promulgated by GHG protocol. Accordingly LBF reports on GHG emissions against three WBCSD/WRI scopes; which is further verified by the ISO 14064 - 1:2006 standards.
Visit web page for more information on the Carbon Footprint Report
Green lending scheme
LBF’s green lending scheme offers concessionary terms for the lease of hybrid vehicles and electric vehicles, which are deemed to have a significantly lower carbon footprint compared to traditional diesel or petrol vehicles.
Year No. of green financing facilities
Amount granted
(Rs. million) 2020/21 1,747 3,515.66
2019/20 2,576 5,401.45
2018/19 3,561 8,566.00
2017/18 450 1,159.00
2016/17 800 2,471.36
CIM digital wallet
LB CIM Wallet application launched in 2020 reflects our commitment to promote products with a low environmental footprint. Being a cashless solution, LB CIM presents a fully digital customer experience requiring no use of paper and no commuting.
ENVIRONMENTAL PROTECTION AND CONSERVATION
‘Thuru Wawamu’ 50 to 50,000
‘Thuru Wawamu’ is LBF’s flagship environmental project. Launched on 13th September 2018 ‘Thuru Wawamu’ is an ambitious project to systematically increase the forest cover in Sri Lanka by planting 50,000 saplings over a three year period. The ‘Thuru’ mobile app launched subsequently in 2019 was also aimed at supporting the overall effort. As per the initial plan, the project was due to conclude in May 2021 to coincide with LBF’s 50th anniversary. However pandemic related constraints in 2020 saw plans being postponed. As at 31st March 2021, over 42,000 saplings were planted under the project.
Awareness building through informative boards
As part of our ongoing efforts to increase awareness, LBF has undertaken to install and maintain display boards and warning messages at the entrance to all national parks. The project is an ongoing initiative of the Company conducted in partnership with the Young Zoologists’ Association of Sri Lanka.
Year Project location
2020/21 Dehiwala
2019/20 Ridiyagama, Pinnawala
2018/19 Ridiyagama, Pinnawala, Dehiwala
2017/18 Wasgamuwa
2016/17 Udawalawe, Wilpattu, Minneriya, Horton Plains and Bundala
Continuous Awareness
LBF promotes sustainability knowledge and good practice across our markets and among our customers and communities. Awareness campaign run through the social media to inform the importance of environment protection and conservation.
CAPITAL REPORTS
Natural Capital
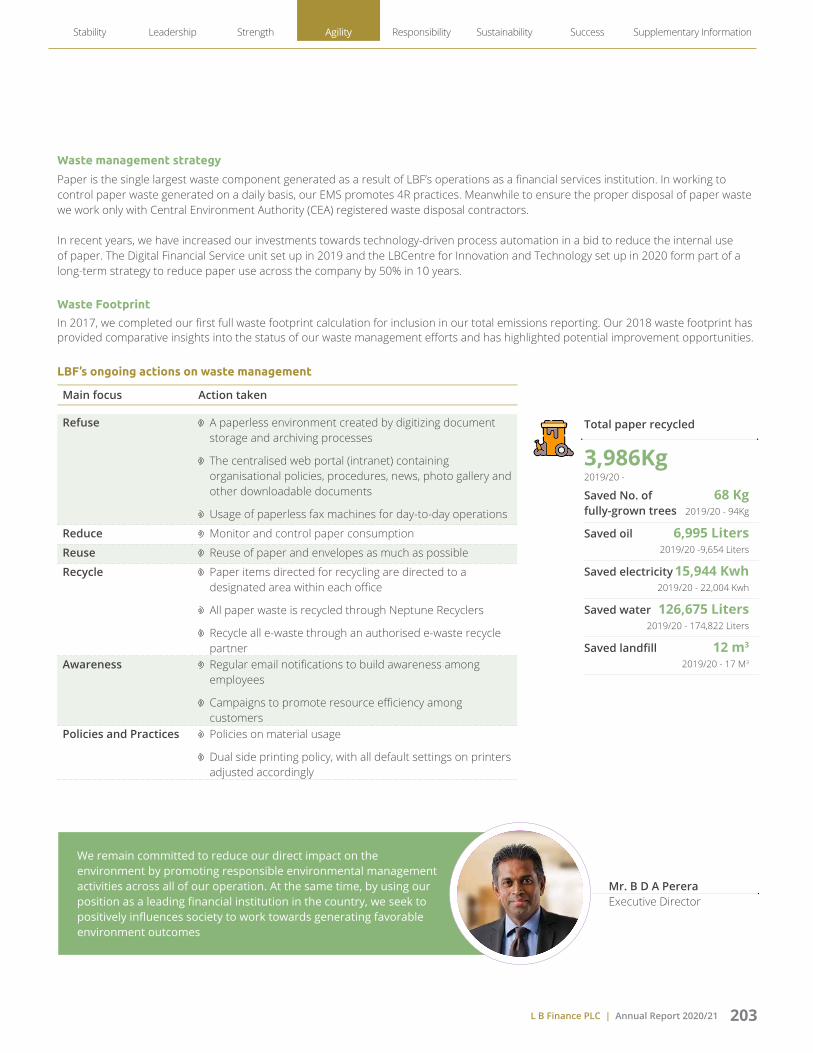
L B Finance PLC | Annual Report 2020/21 203
Waste management strategy
Paper is the single largest waste component generated as a result of LBF’s operations as a financial services institution. In working to control paper waste generated on a daily basis, our EMS promotes 4R practices. Meanwhile to ensure the proper disposal of paper waste we work only with Central Environment Authority (CEA) registered waste disposal contractors.
In recent years, we have increased our investments towards technology-driven process automation in a bid to reduce the internal use of paper. The Digital Financial Service unit set up in 2019 and the LBCentre for Innovation and Technology set up in 2020 form part of a long-term strategy to reduce paper use across the company by 50% in 10 years.
Waste Footprint
In 2017, we completed our first full waste footprint calculation for inclusion in our total emissions reporting. Our 2018 waste footprint has provided comparative insights into the status of our waste management efforts and has highlighted potential improvement opportunities.
LBF’s ongoing actions on waste management
Main focus Action taken
Refuse A paperless environment created by digitizing document storage and archiving processes
The centralised web portal (intranet) containing organisational policies, procedures, news, photo gallery and other downloadable documents
Usage of paperless fax machines for day-to-day operations
Reduce Monitor and control paper consumption
Reuse Reuse of paper and envelopes as much as possible
Recycle Paper items directed for recycling are directed to a designated area within each office
All paper waste is recycled through Neptune Recyclers
Recycle all e-waste through an authorised e-waste recycle partner
Awareness Regular email notifications to build awareness among employees
Campaigns to promote resource efficiency among customers
Policies and Practices Policies on material usage
Dual side printing policy, with all default settings on printers adjusted accordingly
Total paper recycled
3,986Kg2019/20 -
Saved No. of 68 Kg
fully-grown trees 2019/20 - 94Kg
Saved oil 6,995 Liters
2019/20 -9,654 Liters
Saved electricity 15,944 Kwh
2019/20 - 22,004 Kwh
Saved water 126,675 Liters
2019/20 - 174,822 Liters
Saved landfill 12 m3
2019/20 - 17 M3
We remain committed to reduce our direct impact on the environment by promoting responsible environmental management activities across all of our operation. At the same time, by using our position as a leading financial institution in the country, we seek to positively influences society to work towards generating favorable environment outcomes
Mr. B D A PereraExecutive Director
Stability Leadership Strength Agility Responsibility Sustainability Success Supplementary Information

L B Finance PLC | Annual Report 2020/21204
Improve process efficiencies and
enhance resource utilization to low
the emission levels
Employees voluntary engage for the green CSR
activities
Invest in training to expand on our
organisational knowledge enhance
for emission management
Encourage green financing and green
lending
Using green concepts and using
day lights to the branches
Manual work paper works and physical meetings replace
through IT systems
Purchase low emission tools and equipment
Arranging community based tree planting
programme in public and private places
Reduction of carbon foot print through emission management
Empowering and expanding green initiatives
FCHC
HC
IC
SCICFC
CAPITAL REPORTS
Natural Capital
Tradeoff between capitals of natural capital
Financial Human Intellectual Manufactured Social & Relationship
Natural
S M L S M L S M L S M L S M L S M L
Green office practices
Green financing
S – Short term M – Medium term L – Long term Increase Decrease Neutral
Building for the future
Short term (<1) Medium term (1-3) Long term (3-5)
Invest in alternative energy such as solar power to meet at least 80% of LBF’s energy requirements
Using low CO2 emitting equipment and materials
Reduce carbon emissions through green building design
Implement solutions to enhance the digital user experience for employees.
Supporting the low carbon economy by promoting the use of electric or hybrid vehicles
Improve environmental tracking and reporting
GROWTH SUSTAINABLE OPPORTUNITYIncreased focus on organisation-wide carbon management
TOWARDS VISIONOrganisation-wide resource optimization
Increase Decrease

L B Finance PLC | Annual Report 2020/21 205
C H A P T E R
05Responsibility
A Dependable Approach We are structured to last and built
to endure, holding ourselves to the highest standards, and governed by
integrity and trust
Letter from the Chairperson 206
Corporate governance report 207
Annual report of the Board of Directors on the affairs of the Company 223
Board subcommittee reports Remuneration committee report 231 Nomination committee report 232 Audit committee report 233 Integrated risk management committee report 236 Related party transaction committee report 239
Summarised risk management report 241

L B Finance PLC | Annual Report 2020/21206
CORPORATE GOVERNANCE REPORT
Dear StakeholdersThat 2020/21 was an unusual year is a total understatement. There were several factors, modes and methods of operation that we had to reconsider in light of the pandemic. Many of these called for urgent rethinking and rapid action. I am quite confident that LB Finance PLC would not have been able to respond as quickly or as effectively to these rapidly evolving situations, had it not been for the strong foundation provided by our governance framework. That said, let me briefly touch on the areas that the Board focused on this past year in order to further strengthen LBF’s overall corporate governance model.
STRENGTHENING OVERALL GOVERNANCE STRUCTURES
LBF’s management structures were revised in the year under review. This was done primarily to increase governance and oversight as well as to help align our succession planning program with the Company’s growth objectives for the forthcoming 3 to 5-year time frame.
IMPROVING COMPANY-WIDE DUE DILIGENCE
With non-bank financial institutions coming under increased scrutiny in recent years, the Board decided to strengthen LBF’s due diligence framework across the business. With this in mind, the scope of the Internal Audit Department was expanded and an independent new system audit function set
up under its purview to focus on improving due diligence across all critical functions of the Company, with special emphasis on IT networks and information security systems.
COMPLIANCE WITH BEST PRACTICES
Consequent to the amendments made to the Finance Companies (Corporate Governance) Direction No. 03 of 2008, by Finance Business Act, Directions No. 05 of 2020 and based on an application made by the Company, the Monetary Board of the Central Bank of Sri Lanka granted approval for Mr. J A S S Adhihetty, Managing Director of the Company to continue in office for a period of one year, upon reaching the age of 70 years.
The Company also received approval from the Director – Department of Supervision of Non-Bank Financial Institutions of the Central Bank of Sri Lanka for the said re-appointment in terms of Finance Companies (Assessment of Fitness and Propriety of Directors and Officers performing Executive Functions) Direction No.3 of 2011.
Subsequently, shareholder approval was obtained for the non-application of the age limit stipulated in Section 210 of the Companies Act No.07 of 2007 to Mr. Adhihetty and he was re-appointed a Director of the Company at the last Annual General Meeting.
BOARD DECLARATION
On behalf of the Board, I wish to confirm that throughout the financial year ending 31st March 2021 and as at the date of publishing this Annual Report, LB Finance PLC was compliant with the Listing Rules of the Colombo Stock Exchange and Finance Companies Direction No. 3 of 2008 on Corporate Governance and amendments thereto. The tables set out in pages 16 to 27 of Corporate Governance and Risk Management Report depict the extent of adherence with the Code of Best Practice on Corporate Governance, issued by the ICASL.
Further, the Company has complied with the provisions of the Companies Act No. 07 of 2007 and other statutes as applicable to the Company. All statutory payments due to Government, which have fallen due, have been made or (where relevant) provided for, except for certain assessments against which appeals have been lodged. Retirement gratuities have been provided for in accordance with LKAS 19 – ‘Employee Benefits’.
I declare that all the members of the Board of Directors and all Company employees have acted in compliance with the applicable regulatory and statutory requirements and, towards this end, have discharged their duties in accordance with the policies, procedures and standards covered by LB Finance PLC’s internal Code of Conduct.
Anandhiy GunawardhanaChairperson

L B Finance PLC | Annual Report 2020/21 207
OUR CORPORATE GOVERNANCE PHILOSOPHY AND HOW IT CREATES VALUE
Strong Corporate Governance has always been the bedrock of LBF’s success. L B Finance PLC’s Corporate Governance framework serves as the foundation to conduct the Company’s affairs in such a way that meets the expectations of its stakeholders. The LBF Board leads the Company towards the achievement of its strategic objectives and the delivery of positive outcomes to stakeholders.
LBF’s corporate governance philosophy stems from our belief that corporate governance is an integral element in improving efficiency and growth as well as enhancing investor confidence. The corporate governance philosophy is scripted as:
“As a good corporate citizen, the Company is committed to sound corporate practices based on conscience, openness, fairness, professionalism and accountability in building confidence of its various stakeholders in it thereby paving the way for its long-term success.”
Our governance philosophy is based on providing a control framework for the Board and its Committees to execute their fiduciary responsibilities to all stakeholders by ensuring transparency, accountability, fairness and independence in their decision making. However, we believe Corporate Governance is not just limited to creating checks and balances; it is more about creating organizational excellence leading to increasing employee and customer satisfaction and shareholder value without compromising on our ethics and values.
The Company believes in sustainable corporate growth that emanates from the top leadership down through the organisation to the various stakeholders which is reflected in its sound financial system, enhanced market reputation and improved efficiency.
We believe that our Company shall go beyond adherence to the regulatory framework. Our corporate structure, business, operations and disclosure practices have been strictly aligned to our corporate governance philosophy. Transparency, accountability, fairness and intensive communication with stakeholders are integral to our functioning.
We believe in system-driven performance and performance-oriented systems. We accord highest priority to these systems and protect the interests of all our shareholders, particularly the minority shareholders.
We have tried to blend growth and efficiency with governance and ethics. Our Board of Directors, guided by the mission statement, formulate strategies and policies having focus on optimizing value for various stakeholders including customers, shareholders and society at large.
The Board leads the Company with the integrity and competence in a manner that is responsible, accountable, fair and transparent, show as to ensure leadership that results in the achievement of the Company’s strategic objectives, positive outcomes, overtime and value creation to the stakeholders.
Stability Leadership Strength Agility Responsibility Sustainability Success Supplementary Information

L B Finance PLC | Annual Report 2020/21208
CORPORATE GOVERNANCE REPORT
CORPORATE GOVERNANCE REPORT
We believe that our Company shall go beyond adherence to the regulatory framework. Our corporate structure, business, operations and disclosure practices have been strictly aligned to our corporate governance philosophy.
GOVERNANCE FRAMEWORK
Our governance framework is anchored on (i) competent leadership, (ii) effective internal controls, (iii) a strong risk culture and (iv) accountability to shareholders.
We believe that it is crucial to have a good balance between continuity and fresh perspectives on the Board. Our Board plays a key role in setting our governance standards to meet our stakeholders’ expectations. Our leadership model ensures an appropriate balance of power, accountability and independence in decision-making.
Compliance with applicable laws, regulations and governance practices
Leadership, ethics and corporate citizenship
Collective responsibility for primary governance roles
Strategy, performance and reporting
Custodians of corporate governance
Risk, oversight and compliance
Stakeholder relations
Cultivation and exhibition of ethical characteristics
Remuneration
Corporate governance
VALUE CREATION THROUGH OUR GOVERNANCE STRUCTURES
VALUE CREATION
ACTIVITIES
OUTCOMES
Enable and support the Company’s value creation process
Achievement of and benefits realised through good governance outcomes
Achievement of stakeholder goalsSource of sustained growth in total
returns
Ethical culture
Effective control
Good performance
Delivery on strategic matters
Operate efficiency
Invest strategically
Optimise capital
Employer of choice
Provider of relevant space
Preferred business partner
Responsible community participant

L B Finance PLC | Annual Report 2020/21 209
REGULATORY BENCHMARKS
Stewardship
Strategic oversightEthical culture
Cont
inuo
us im
prov
emen
t
Accountability
Independence
Risk o
vers
ight
CORPORATE GOVERNANCE FRAMEWORK
Accountability to shareholder
Effective internal control
Competent leadership
Strong risk culture
INTERNAL BENCHMARKS
REGULATORY BENCHMARKS AND INTERNAL BENCHMARKS
Regulatory benchmarks on corporate governance
Internal benchmarks on corporate governance
Assurance Processes
Companies Act No. 07 of 2007
Finance Business Act No. 42 of 2011 and all Directions/Guidelines issued
Corporate Governance Direction No. 03 of 2008 (as amended) issued by the Monetary Board of the Central Bank of Sri Lanka
Listing Rules of the Colombo Stock Exchange (CSE)
The Code of Best Practice on Corporate Governance as published by the Institute of Chartered Accountants of Sri Lanka (voluntary)
Securities and Exchange Commission of Sri Lanka Act No. 36 of 1987 (as amended)
Inland Revenue Act No. 24 of 2017 and amendments thereto and other statutes Shop and Office Employees Act No. 19 of 1954 and amendments thereto
Sri Lanka Accounting and Auditing Standards Act No. 15 of 1995
Anti-Money Laundering Laws and Regulations and Financial Transactions Reporting Act No. 6 of 2006
Articles of Association of the Company
Charters/Terms of Reference of Board, Subcommittees and Management Committees
Organisational structure
Code of Ethics and Conduct for all employees
All Board-approved Policies on operational areas
Internal Audit Framework
Internal Compliance Audit Programme
ISO 27001: 2013 Information Security Standard Surveillance Audit
ISACA (ITAF) audit framework
External Audit (Financial)
External Assurance on Sustainability indicators
Stability Leadership Strength Agility Responsibility Sustainability Success Supplementary Information

L B Finance PLC | Annual Report 2020/21210
CORPORATE GOVERNANCE REPORT
CORPORATE GOVERNANCE PRINCIPLES
LBF’s approach to corporate governance is guided by the following core principles:
Ethical culture
Trust, integrity and good governance are hallmarks of the Board’s governance approach. By setting the tone from above, the Board champions the values of trust, integrity and good governance that are well entrenched in the culture of LBF, and reinforces the ethical principles on which LBF’s reputation and success are founded. To maximise shareholder value on a sustainable basis, these values must extend into every segment of LBF operations and business activities.
Stewardship
The members of the Board are the stewards of LBF, exercising independent judgment in overseeing management and safeguarding the interests of shareholders. In fulfilling its stewardship role, the Board seeks to instill and foster a corporate environment founded on integrity and to provide Management with sound guidance in pursuit of long-term shareholder value.
Strategic oversight
The members of the Board are the key advisors to Management, advising on strategic direction, objectives and action plans, taking into account both the opportunities and LBF’s risk appetite. In carrying out this oversight role, the Board actively engages in setting the long term strategic goals for the organisation, reviews and approves business strategies, corporate financial objectives and financial and capital plans that are consistent with the strategic goals, and monitors LBF’s performance in executing strategies and meeting objectives.
Risk-oversight
The Board oversees the framework, policies and systems to identify and manage risks to the businesses and seeks to embed a strong risk management culture throughout LBF. The Board actively monitors the organisation’s risk profile relative to risk appetite and seeks to ensure that Management’s plans and activities provide an appropriate balance of return for the risks assumed and are prudently focused on generating shareholder value.
Independence
Independence from Management is fundamental to the Board’s effective oversight and mechanisms are in place to ensure its independence. All direct and indirect material relationships with LBF are considered in determining whether a member of the Board is independent.
Accountability
Transparency is a key component of good governance. The Board is committed to clear and comprehensive financial reporting and disclosure, and constructive shareholder engagement. The Board has carefully defined the expectations and scope of duties of the Board, its committees and Management.
Continuous improvement
The Board is committed to continuous improvement of its corporate governance principles, policies and practices, which are designed to align the interests of the Board and Management with those of shareholders, to support the stewardship role of the Board and to enhance the Board’s ability to safeguard the interests of shareholders through independent supervision of Management. To ensure policies and practices meet or exceed evolving best practices and regulatory expectations, LBF’s corporate governance system is subject to ongoing review by the Board.

L B Finance PLC | Annual Report 2020/21 211
OUR BOARD
The size and composition of the LB Finance PLC Board is deemed appropriate given the current scale and geographic footprint of our operations. The LBF Board comprises a mix of Executive, non-executive Directors and Independent non-executive Directors. The balance between non-executive and executive directors enables the Board to provide clear and effective leadership across LBF’s business activities.
The views of Non-Executive Directors and Independent non-executive Directors carry significant weight in Board decisions that provide strategic leadership for the Company. Accordingly we have ensured that Non-Executive Directors and Independent non-executive Directors are all professionals/academics/business leaders, holding / having held senior positions in their respective fields who are deemed to be of sufficient and appropriate calibre. Furthermore a healthy age and gender diversity among our Directors brings fresh perspectives that improve the sustainability of our business. Non-Executive Directors meet during the year, without the presence of Executive Directors, to discuss the effectiveness of management.
Separate sessions are also arranged for the independent Directors to meet at least once a year to ensure effective Corporate Governance in managing the affairs of the Board and the Company.
Business leadership and developmentStrategyFinancial services experienceFinancial acumenRisk managementCulture and conduct
People and remunerationTechnology and digitalCorporate governanceLegal and compliance
Composition
Diversity of expertise
Executive Directors Non-Executive Directors
Composition
55
Independent Non-independent directors
9
8
8
9
108
9
7
107
7
3
Female Male
7
3
Tenure of the Non-Executive Directors
Less than 3 years 3 to 5 years 6 to 10 years
21
2
Risk
Compliance
Audit & IS Compliance
Internal Audit
Integrated Risk Management Committee
Assets and Liabilities Management
Audit Committee
Credit Committee
Related Party Transactions Committee
IT Steering Committee
Nomination Committee
Sustainability Committee
Remuneration Committee
Business Continuity Management
Assurance – External AuditorsGOVERNANCE STRUCTURE
ORGANIZATION
Shareholders
Board of Directors
Executive Management
Management Committees
GOVERNANCE STRUCTURE
Stability Leadership Strength Agility Responsibility Sustainability Success Supplementary Information

L B Finance PLC | Annual Report 2020/21212
CORPORATE GOVERNANCE REPORT
Appointment of new Directors
Board are required to offer themselves for re-election by shareholders at the annual general meeting immediately following their appointments. The standard terms and conditions of appointment of new Directors (both Executive and Non Executive) has been documented and approved by the Board. The Board considers the independence of each director, taking into account the factors outlined in the Corporate Governance Principles and Recommendations. To assist in determination of independence, each Non-Executive Director is further required to make an annual declaration to the Board detailing all relevant information.
A register of Directors’ material interests is maintained and regularly updated by each Director annually or more frequently as needed.
As a listed entity all new appointments to the LBF Board are first communicated to the shareholders via the Colombo Stock Exchange (CSE) in the English language, together with brief resumes of such Directors covering qualifications, experience, Directorships in other Companies and the number of LB Finance PLC shares held. The CSE announcement is also required to specify if new appointments are to be made as a Non-Executive Director or Executive capacity and whether the person will function as an
Independent or Non-Independent Director on the LBF Board. Independent non-executive Directors are required to be free of any business or other association that could materially interfere with his or her ability to act in the best interests of LBF.
Based on declaration submitted, the board has determined that each independent Non-Executive. The Board has determined that each Non-Executive director who has served on the LBF Board during the FY 2020/21 has retained independence of character and judgment and has not formed associations with management or others that might compromise their ability to fulfill their role as an independent director.
Collective Responsibilities of the LBF Board
The primary role of the Board is to provide oversight to ensure LBF is managed in the best interests of the shareholders and the expectations of all other stakeholders. The LBF Board operates as per the terms of reference outlined in the LBF Board Charter.
Board oversight for the management of the Company Key Highlights for 2020/21
Strategic Oversight
Developing short term targets and medium to long objectives to support the Company’s growth trajectory
Preserve LBF’s brand reputation and credibility in the industry by ensuring that the Company operates in accordance with policies approved by the Board
Updating the Company’s governance structure to reflect changes in LBF’s strategy
Ensuring capital investment decisions are in line with the Company’s strategy
Ensuring the Company’s funding strategy takes cognisance of regulatory capital adequacy and liquidity requirements
Increasing the scalability of the Company’s IT strategy to stay ahead of peers
Board approved the Strategic Plan - 2020/21 to 2022/23
Quarterly review of strategic plan was performed
More details on page 74 (Strategy and Resource allocation section)

L B Finance PLC | Annual Report 2020/21 213
Board oversight for the management of the Company Key Highlights for 2020/21
Financial control Ensuring that the Company operates in such a way as to preserve its financial integrity and in accordance with policies approved by the Board
Ensuring the quality and integrity of the accounting and financial reporting systems, disclosure and procedures and internal controls;
Ensuring appropriate mechanisms are in place to provide independent assurance to verify the integrity of the Company’s financial statements
Financial reporting
Reviewed the Interim Financial Statements for the year ended 31st March 2021
Dividend Policy was approved by the Board
Finance Manual was reviewed by the Board
Credit Approval Manual and Leasing Operations Manual were reviewed by the Board
More details on page 280 (Notes to the financial statements)
Compliance Oversight
Ensuring appropriate controls are in place to comply with all applicable regulatory frameworks, including liquidity, capital adequacy and taxation obligations
Report on LBF’s performance by providing a balanced and understandable assessment of the Company’s performance, position and prospects, in line with regulatory requirements applicable to a listed entity
Monitoring and reporting on related party transactions
Implement best practices to achieve compliance leadership in all areas of the business
Whistle Blowing Policy was reviewed and approved by the Board.
Non-Executive and Executive and Directors and some members of staff participated on a Web Conference on Key Aspects of AML/CFT Obligations for Board of Directors and Senior Management of the Licensed Finance Companies.
Business Expansion Policy was approved by the Board of Directors in order to comply with Finance Business Act No. 06 of 2020 – Business Expansion and Operations.
Outsourcing arrangements proposed for the Financial Year 2021/22 was reviewed by the Audit Committee in order to comply with Finance Business Act No. 07 of 2018
AML Compliance reports were submitted to the Board as per CDD rule No 1 of 2016 and updated monthly compliance checklists were also presented.
For more details refer compliance tables
Risk Oversight Reviewing and approving the Company’s risk appetite in line with LBF’s strategy and in consideration of macro-economic variables
Ensuring the quality and adequacy of LBF’s enterprise-wide risk management processes and monitoring systems
Ensuring appropriate mechanisms are in place to provide independent assurance of the Company’s risk management framework
Promoting the risk culture at all levels across the Company
ML & TF Risk Assessment of all deposit and lending products and all processes was presented to the Integrated Risk Management Committee
IRMC Charter was reviewed by the Board.
More details on Risk Management Report
HR Best Practices
Developing human resources to support the Company’s growth strategy
Safeguarding employee wellbeing
Setting the tone for a culture of ethics
Succession Plan for Key Management Personnel was reviewed by the Board of Directors.
Employee Hand Book was approved by the Board.
More details on page 154 (Human Capital Report)
Stability Leadership Strength Agility Responsibility Sustainability Success Supplementary Information

L B Finance PLC | Annual Report 2020/21214
CORPORATE GOVERNANCE REPORT
Board oversight for the management of the Company Key Highlights for 2020/21
IT Governance Strengthening the Company’s core IT infrastructure
Improving LBF’s Information security architecture
To assess and report IT-related risks and organisational impact.
Ensure LBF is adhering to CBSL’s IT compliance requirements for NBFI’s
In terms of corporate governance Direction No. 3 of 2008 (as amended), section 2, Audit Committee discussed the paper submitted jointly by AGM Finance, Head of IT, Internal Audit and IS Audit and reviewed the adequacy and the integrity of the Company’s internal control system and Management Information System (MIS)
Reviewed IT Policies
More details on page 166 (Intellectual Capital Report)
Sustainability Integration
Ensure LBF plays an active role is addressing sustainability issues
Promote sustainability best practices at all labels of the business
Improve transparency of sustainability reporting in line with global best practices
Carried out unannounced Real time testing on the comprehensive business continuity plan (BCP Drill) on 10th of July 2020.
More details on page 196 (Natural Capital Report)
MATTERS FOR WHICH BOARD APPROVAL IS SOUGHT
Material acquisition and disposal of assets
Annual Financial Statements
Annual Strategic Plan
Corporate or financial restructuring initiatives
Share issuance, dividends and other returns to shareholders
Ensuring the effectiveness of Board Meetings
Board Meetings are governed by a structured Agenda and held as per a predetermined meeting calendar. The meeting calendar scheduling all Board meetings for the ensuing year is prepared well in advance and circulated to all Board Members.
Before each meeting
The Company Secretary seeks advice from the Chairperson and the Managing Director to set the agenda to ensure sufficient time is allocated at each meeting to address all pertinent matters. Routine matters on the agenda include: discussions on strategy, the Company’s performance, Industry Performance, Financial Results, status of Human Resources, Risk Management and Compliance, progress on Company’s digital initiatives, status on Cyber Security and Data Privacy etc.
A Board approved procedure is in place to enable any Director to include additional
matters and proposals to the Agenda. In line with this procedure, Directors are required to make a written request to the Chairperson detailing matters to be included.
Once the agenda has been finalized, all Directors are provided with detailed information on all items on the agenda. To give Directors sufficient time to prepare, the information pack containing relevant Board Papers is circulated at least seven (07) working days prior to the meeting date. All information and Board Papers are also uploaded to a secure portal to give Directors remote access.
Aside from the Board, selected members of the Corporate Management / Board Committees may also be invited to be present at Board Meetings depending on the items set out under the agenda.
All Directors are required to come well prepared for each meeting and actively participate in all matters outlined under the agenda. To facilitate this, all Directors are allowed to reach out to the Company’s Senior Managers to obtain necessary information or clarifications. They also have the right to seek independent professional advice.
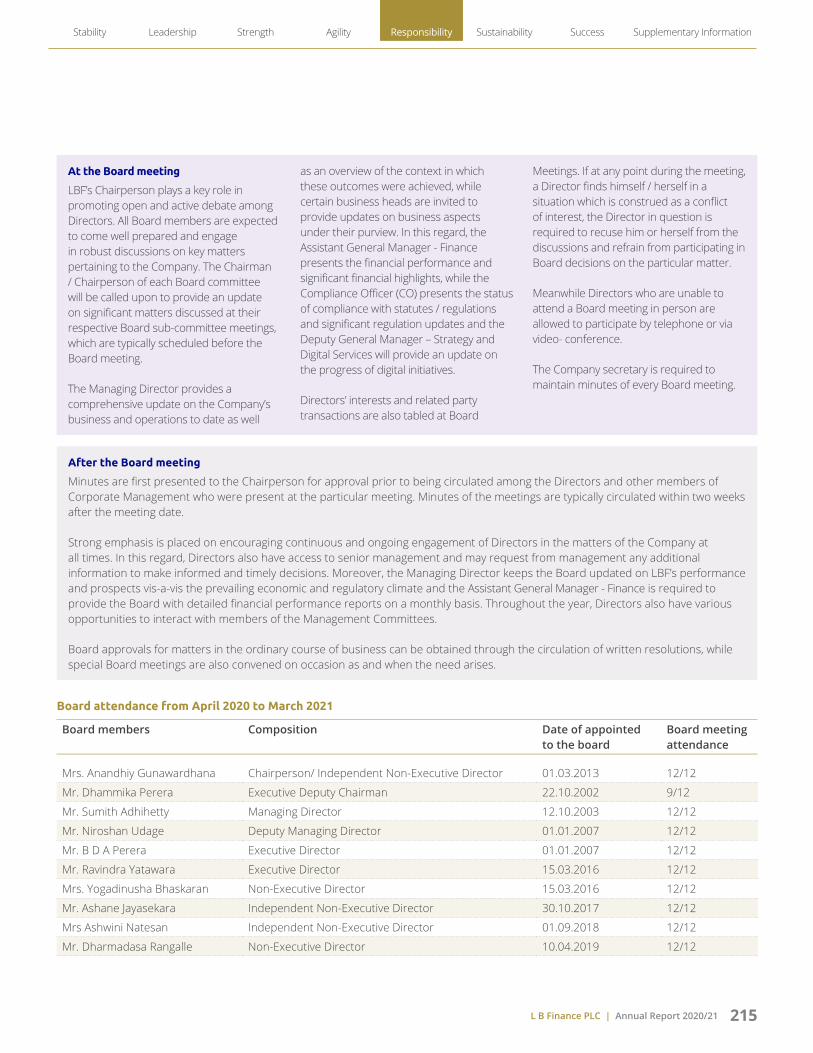
L B Finance PLC | Annual Report 2020/21 215
At the Board meeting
LBF’s Chairperson plays a key role in promoting open and active debate among Directors. All Board members are expected to come well prepared and engage in robust discussions on key matters pertaining to the Company. The Chairman / Chairperson of each Board committee will be called upon to provide an update on significant matters discussed at their respective Board sub-committee meetings, which are typically scheduled before the Board meeting.
The Managing Director provides a comprehensive update on the Company’s business and operations to date as well
as an overview of the context in which these outcomes were achieved, while certain business heads are invited to provide updates on business aspects under their purview. In this regard, the Assistant General Manager - Finance presents the financial performance and significant financial highlights, while the Compliance Officer (CO) presents the status of compliance with statutes / regulations and significant regulation updates and the Deputy General Manager – Strategy and Digital Services will provide an update on the progress of digital initiatives.
Directors’ interests and related party transactions are also tabled at Board
Meetings. If at any point during the meeting, a Director finds himself / herself in a situation which is construed as a conflict of interest, the Director in question is required to recuse him or herself from the discussions and refrain from participating in Board decisions on the particular matter.
Meanwhile Directors who are unable to attend a Board meeting in person are allowed to participate by telephone or via video- conference.
The Company secretary is required to maintain minutes of every Board meeting.
After the Board meeting
Minutes are first presented to the Chairperson for approval prior to being circulated among the Directors and other members of Corporate Management who were present at the particular meeting. Minutes of the meetings are typically circulated within two weeks after the meeting date.
Strong emphasis is placed on encouraging continuous and ongoing engagement of Directors in the matters of the Company at all times. In this regard, Directors also have access to senior management and may request from management any additional information to make informed and timely decisions. Moreover, the Managing Director keeps the Board updated on LBF’s performance and prospects vis-a-vis the prevailing economic and regulatory climate and the Assistant General Manager - Finance is required to provide the Board with detailed financial performance reports on a monthly basis. Throughout the year, Directors also have various opportunities to interact with members of the Management Committees.
Board approvals for matters in the ordinary course of business can be obtained through the circulation of written resolutions, while special Board meetings are also convened on occasion as and when the need arises.
Board attendance from April 2020 to March 2021
Board members Composition Date of appointed to the board
Board meeting attendance
Mrs. Anandhiy Gunawardhana Chairperson/ Independent Non-Executive Director 01.03.2013 12/12
Mr. Dhammika Perera Executive Deputy Chairman 22.10.2002 9/12
Mr. Sumith Adhihetty Managing Director 12.10.2003 12/12
Mr. Niroshan Udage Deputy Managing Director 01.01.2007 12/12
Mr. B D A Perera Executive Director 01.01.2007 12/12
Mr. Ravindra Yatawara Executive Director 15.03.2016 12/12
Mrs. Yogadinusha Bhaskaran Non-Executive Director 15.03.2016 12/12
Mr. Ashane Jayasekara Independent Non-Executive Director 30.10.2017 12/12
Mrs Ashwini Natesan Independent Non-Executive Director 01.09.2018 12/12
Mr. Dharmadasa Rangalle Non-Executive Director 10.04.2019 12/12
Stability Leadership Strength Agility Responsibility Sustainability Success Supplementary Information

L B Finance PLC | Annual Report 2020/21216
Board Sub Committees
In accordance with the relevant rules and regulations, the LBF Board has established 04 mandatory sub committees named, Audit, remuneration, Integrated risk management and related party transaction. Each Committee is chaired by a Non-Executive Director, and has its own terms of reference. These terms of reference along with the activities of each subcommittee are set out Committees’ reports from pages 231 to 240 of this report.
Attendance of Directors at meeting of sub-committees from April to March 2020/21
Committee members Composition Remuneration committee
Nomination committee
Audit committee
Integrated risk management committee
Related party transaction review committee
Total meetings held 3 4 13 4 5
Mrs. Anandhiy Gunawardhana CP/IND 3/3 4/4 13/13 4/4
Mr. J A S S Adhihetty MD 2/4 4/4
Mr. Niroshan Udage DMD 2/4
Mr. B D A Perera ED 2/4 PI
Mr. Ravi Yatawara ED
Ms. Yogadinusha Bhaskaran NDN 3/3 13/13
Mr. Ashane Jayasekara IND 3/3 4/4 13/13 4/4 5/5
Mrs Ashwini Natesan IND 4/4 5/5
Mr Dharmadasa Rangalle NDN 5/5
Chairman/Chairperson of the Committee
CP Chairperson
MD Managing Director
DMD Deputy Managing Director
IND Independent Non-Executive Director
ED Executive Director
NDN Non Independent Non Executive Director
PI Permanent invitee
EVALUATING THE PERFORMANCE OF THE BOARD AND BOARD COMMITTEES
Directors collectively evaluate the performance of the Board and Board Committees whilst the Chairperson and Nominating Committee Chairman evaluate the performance of each individual Director. These assessments are made against pre-established criteria which are derived from the Board’s charter and responsibilities. The results of the evaluation are used constructively to discuss improvements to the Board and ensure that each Director remains qualified for office. The Chairperson and / or Nomination Committee Chairman / Chairperson acts on the results of the evaluation, and if appropriate, proposes new Directors or seeks the resignation of Directors.
CORPORATE GOVERNANCE REPORT

L B Finance PLC | Annual Report 2020/21 217
Board subcommittee areas of oversight activities for 2020/21
Board sub committee Board Members Areas of oversight Report reference (page no.)
Remuneration committee Mr. M A J W Jayasekara
Mrs. Anandhiy K Gunawardhana
Mrs. Dinusha Bhaskaran
Remuneration policy
Directors remuneration and compensations
231
Nomination committee Mr. Ashane Jayasekara
Mrs. Anandhiy K Gunawardhana
Mr. J A S S Adhihetty
Review the Board structure, size, composition and competencies
Board member and key personnel appointments
232
Audit committee Mrs. Yogadinusha Bhaskaran
Mrs. Anandhiy K Gunawardhana
Mr. M A J W Jayasekara
Reviewing the financial reporting
Internal and external audit
Ensure the whistleblower policy
233
Integrated risk management committee
Mr. M A J W Jayasekara
Mrs. Anandhiy K Gunawardhana
Mrs. Ashwini Natesan
Mr. J A S S Adhihetty
Mr. Niroshan Udage
Mr. B D A Perera
Mr. Ravi Yatawara
Risk Management Framework
Risk measurement, monitoring and management
Compliance with regulatory and internal prudential requirements
236
Related party transactions review committee
Mrs. Ashwini Natesan
Mr. M A J W Jayasekara
Mr. Dharmadasa Rangalle
Related party transaction policy
Providing independent review, approval and oversight of RPT
Ensuring relevant market disclosures
239
Stability Leadership Strength Agility Responsibility Sustainability Success Supplementary Information

L B Finance PLC | Annual Report 2020/21218
DIFFERENTIATING THE ROLE OF THE CHAIRPERSON AND THE MANAGING DIRECTOR
LBF has an Independent Chairperson. The role of LBF’s Chairperson is distinct and separate from that of the Managing Director / Chief Executive Officer, with a
clear division of responsibilities between the two. Mrs. Anandhiy Gunwardana - LBF’s Independent Chairperson leads the Board while Mr. Sumith Adhihetty - our Managing
Director provides oversight for LBF day to day business operations as per the authority delegated to him by the Board.
Role of the Chairperson Role of the Managing Director
Key responsibilities - Independent Chairperson
Provide strong and effective leadership to the Board and sets the tone from the top in terms of culture and values
Ensure the Board is structured effectively, with the appropriate balance of skills and independence to maintain the highest standards of integrity and corporate governance
Foster open and inclusive discussions at Board meetings / Committee meetings to challenge executives, where appropriate;
Work with the Managing Director and the Company Secretary to ensure that Board members receive accurate, timely and clear information to enable them to take sound decisions and effectively monitor the performance of executive management;
Ensure that the performance of individual directors and of the Board as a whole and its committees is evaluated regularly
Ensure LBF maintains effective communication with shareholders and other stakeholders.
Key responsibilities - Managing Director
Accountability for operational management and oversight for the full range of activities of the customer businesses and functions in line with the Board approved strategy
Delivery of performance against approved budgets
Promulgate ethics and integrity at all levels of the Company
Promote a performance driven culture where employees are engaged and motivated to deliver customer outcomes
Lead, manage and develop LBF’s senior leadership team, ensuring professional capability is developed and that succession coverage meets the needs of LBF;
Ensure LBF has effective frameworks and structures to identify, assess and mitigate day to day risks
DUTIES AND RESPONSIBILITIES OF INDIVIDUAL DIRECTORS
Directors are expected to set aside adequate time to fulfill their obligations towards the Company, including partaking in Board meetings.
Directors are expected to lead by example in acting ethically and with integrity at all times. All Directors must be guided by the provisions of the Conflict of Interest Policy under which it is mandated that Directors should avoid any situation which might give rise to a conflict between their personal interests and those of the Company. Directors are responsible for disclosure as soon as they become aware of conflict situations. During the nomination process, all disclosed conflicts of interest (actual and potential) are reviewed and assessed to ensure that there are no matters which would prevent that person from offering himself / herself for election to the Office of Director. If at any point during the nomination process, a Director finds
himself / herself in a situation which is construed as a conflict of interest, the Director in question is required to recuse him or herself from the discussions and refrain from voting on the matter.
Directors’ Training and Development
LBF’s Board of Directors, as the highest authority receive regular training to empower and equip them with skill and aptitude required to perform their role in a transparent, objective and ethical manner as per the best corporate governance practices. Training needs of Directors are identified through the Annual Board self evaluation process as well as through regular feedback to the Board Chairperson and Sub- Committee Chairs. The Company secretary in collaboration with the Nomination Committee are responsible for ensuring Directors receive adequate training to enable them to continuously update their knowledge and understanding of the industry within which the Company operates.
Role of the Company Secretary
The Company Secretary is not a Director, but attends all Board meetings and serves in an advisory capacity to support the Chairperson and the LBF Board in executing their duties. Furthermore, the Company Secretary facilitates communication between the Board, its committees and management and also assists in the induction of new Directors. Should they require advice on corporate governance best practice and regulatory developments, Directors have separate and independent access to the Company Secretary at all times. Managing LBF’s profile with key stakeholders, including oversight of relations with key influencers and regulators also comes under the purview of the Company Secretary. The appointment and removal of the Company Secretary require the approval of the Board
CORPORATE GOVERNANCE REPORT

L B Finance PLC | Annual Report 2020/21 219
MANAGEMENT COMMITTEES
In addition to the mandatory sub committees, the Board has appointed several Management Committees; The Asset and Liability Committee, The Credit and Recoveries Committee, The Sustainability Committee and The IT Steering Committee, all of which function under the guidance of the Managing Director and other Executive Directors. These Management Committees focus on implementing best practices in the areas under their purview. The main objective of forming these committees is to promote a strong culture of accountability by encouraging LBF’s middle management tier to participate in the decision-making process. The functions of the management committees are summarized below;
Description Tasks Members Frequency of meetings held
IT steering committee
To ensure that IT strategy is aligned with the strategic goals of the Company whilst its top most mandate is to find and align business solutions that may leverage technology. IT Steering Committee also looks into information security-related matters on a regular basis
Executive Director -Asset Management
Head of IT
Representatives from relevant departments
Monthly
Assets and liability committee
To monitor and manage the assets and liabilities of the Company and also overall liquidity position to keep the Company’s liquidity at healthy levels, whilst satisfying regulatory requirements
Managing Director
Deputy Managing Director
Executive Directors
Head of Treasury Head of Deposits
Assistant General Manager - Finance
Deputy General Manager - Strategy and Digital Finance
Head of Risk Management
Weekly
Credit committee Is responsible for laying out the overall credit policy for the Company. This includes setting lending guidelines in conformity with credit risk appetite set by the Board of Directors
Managing Director Executive Directors
Assistant General Manager - Finance
Head of Risk Management
Monthly
Sustainability committee
The formulation and the review of the Company’s CSR policy, and ensuring that CSR activities are integrated into the Company’s operations. Keeping in line with the Company’s triple bottom line focus, the Committee is tasked with the responsibility of steering the Company’s CSR activities aimed at uplifting the communities we work with and preserving the environment
Deputy Managing Director
Head of Treasury
Senior Manager Strategy
Representatives from relevant departments.
When necessary
Business continuity management steering committee
Committee is responsible for align BCM goals with business goals and provides strategic direction and support in establishing, implementing, operating, monitoring, reviewing and improving the BCMS.
Deputy Managing Director
Business Continuity Manager
Representatives from the relevant departments
Monthly
Stability Leadership Strength Agility Responsibility Sustainability Success Supplementary Information

L B Finance PLC | Annual Report 2020/21220
SUSTAINABILITY REPORTING
Effective integration and operative management of Sustainability Committee at a company needs dedicated leadership, clear vision, business direction, and strategic focus and none of this will happen without a robust governance structure. Sustainability governance benefits a company to implement sustainability strategy across the business, manage goal-setting and reporting processes, strengthen relations with external stakeholders, and ensure overall accountability.
Sustainability fits into the overall corporate structure can be very revealing of a company’s direction and priorities. It’s important to keep in mind that there is no cookie-cutter structure that can be applied; every company must tailor its approach for what makes most sense given its business
model, structure, resources, and level of sustainability integration into the business.
LBF’s stakeholder engagement is governed by the Sustainability Committee. The unit is responsible for facilitating an integrated approach to stakeholder engagement across the group. This approach is aligned with LBF’s organisational philosophy, brand ethos and values, material sustainability focus areas and strategy. The frequency of engagement varies according to each stakeholder group and the particular issue at hand. LBF is proactive in identifying and responding to its stakeholders’ expectations, concerns and conflicts. A centralised approach is used to manage investors, employees, regulators and communities. LBF’s customer facing units undertake stakeholder engagement relevant to each of their areas and are
responsible for identifying relevant] stakeholder concerns and taking appropriate action. The Board of Directors is kept appraised of engagement activities, concerns raised and mitigating action taken through the group social, ethics and transformation through the Sustainability Committee.
Sustainability Reporting is a mechanism used by the Board to inform Stakeholders of the progress made in meeting their expectations. To execute this commitment the Board has undertaken to prepare an integrated report in line with the IIRC (International Integrated Reporting Council) Framework and the GRI (Global Reporting Initiative) Standards detailing the Company’s progress on sustainability initiatives.
Commitment coming from the top
Reporting to the Board of Directors or other key leaderships can help demonstrate that a company is serious about sustainability.
Accountability must be established and communicated clearly
Accountability helps ensure that sustainability is integrated with other business goals. Including sustainability performance into the company’s annual goals and employee performance review and compensation processes may be helpful mechanisms.
Sustainability programme
Flexibility to adapt and build up on the sustainability program across business units and regions can advance the sustainability agenda. Allowing for some adaptation can help ensure the sustainability program’s relevance to
a business unit’s own strategies or region’s local conditions. It also can generate employee engagement.
Alignment between the structure and the business is imperative
Sustainability governance structures that align with and complement the existing business model and organisational structures can be more successful than creating redundant or competing structures.
CORPORATE GOVERNANCE REPORT
L B Finance PLC | Annual Report 2020/21 221
RISK GOVERNANCE
As a financial institution engaged in a varied offering of financial services, assuming and active management of risks plays an integral part of our business strategy. The integrated risk management committee, on behalf of the Board, is responsible for the overall oversight of reviewing the effectiveness of risk management activities. The Company has implemented a wide array of risk management strategies to treat the risks that the Company is exposed to; while aligning the business strategy within the boundaries of the risk appetite of the Company. The principal risks identified and the mitigation strategies are set out on in the Risk Management section of the Annual Report. (More details on Risk management report)
IT GOVERNANCE
In the corporate world, Information Technology (IT) plays a vital role. Increasing complexities and criticalities in IT decision-making demands the Company to adopt an effective IT governance system. IT governance, which forms an integral part of the Company’s corporate governance, deals primarily with optimising the linkage between strategic direction and information systems management of the Company. IT governance of the Company creates value that fits into the overall corporate governance strategy of the Company and is not a discipline on its own. IT governance of the Company ensures that the investments in IT generate value, avoids failure and mitigates IT associated risks. (More details on page 166 - Intellectual capital report)
HR GOVERNANCE
Human Capital relates to the actual resources or people of the organization and that create the productivity and sustainability of the business. Hence HR governance strategy allows for inclusion and effective delivery towards the business strategy. This strategic intent is achieved through HR governance with regards to culture, performance, controls and legitimacy. (More details on page 154 - Human capital report)
BOARD COMMITMENTS TO SHAREHOLDERS
Shareholder rights
LBF promotes fair and equitable treatment of all shareholders. All shareholders enjoy specific rights under the Companies’ Act. These rights include, among others, the right to participate in profit distributions and the right to attend and vote at general meetings.
Ordinary shareholders are entitled to attend and vote at the AGM in person or by proxy. LBF respects the equal information rights of all shareholders and is committed to the practice of fair, transparent and timely disclosure. All price-sensitive information is publicly released prior to any sessions with individual investors or analysts.
As part of its commitment to uphold Shareholder Rights, the LBF Board has also laid down a “Share Trading Policy” to serve as the code of Internal Procedures and Conduct for the Prevention of Insider Trading. The main objective of the “Share Trading Policy” is to prevent the purchase and/or sale of shares of the Company by an Insider (Director or employee of LBF and their dependents) on the basis of unpublished price sensitive information. Under this Policy, insiders are prevented from dealing in the Company’s shares during the closure of Trading Window, while express permission is required to deal in securities beyond specified limits. All Directors and designated employees are further required to disclose related information periodically as defined by the “Share Trading Policy”.
Conduct of shareholder meetings
The Annual General Meeting (AGM) provides shareholders with the opportunity to share their views and to meet the Board, including the chairpersons of the Board committees and members of Key Management Personnel. At the AGM, LBF’ financial performance for the preceding year is presented to shareholders. LBF’s external auditors are also present at the AGM to answer shareholders’ queries.
In accordance with the recommendations contained in the Code and the Guidelines, resolutions requiring shareholder approval are tabled separately for adoption at the Company’s general meetings unless they are closely related and are more appropriately tabled together.
Communication with shareholders
The Board welcomes engagement with shareholders and encourages them to express their views. The Annual Report is designed to provide Shareholders with a comprehensive view of the Company’s affairs during a particular financial year. Procedures are in place to provide timely information to current and potential shareholders. The Board reviews and approves the contents of the Annual Report to determine its effectiveness in providing shareholders with timely, accurate and relevant information regarding the business activities of LBF. The Feedback Form which was incorporated into the Annual Report serves as the key mechanism for shareholders to communicate with the Company.
As a large organisation, LBF deals with several stakeholder Groups. We believe that adopting a structured approach to engaging with and involving stakeholders will allow us to collaborate and learn from one another in the pursuit of mutually supportive relationships. Accordingly the LBF Board reinforces its commitment to inclusive stakeholder engagement is based on the principles of:
Relevance: Focusing on those issues of material concern to our stakeholders and identifying how best to address them for our mutual benefit
Completeness: Understanding the views, needs, performance expectations and perceptions associated with these material issues while also taking cognisance of prevailing local and global trends
Responsiveness: Engaging with stakeholders on these issues and giving regular, comprehensive, coherent feedback
Stability Leadership Strength Agility Responsibility Sustainability Success Supplementary Information

L B Finance PLC | Annual Report 2020/21222
More compressive details regarding LBF’s Stakeholder Engagement activities can be found on page 52 of this report.
In addition, Shareholders are invited to have a direct communication to raise their queries and concerns by contacting LBF’s Company Secretary, P W Corporate Secretarial (Pvt) Ltd., through the following channels:
Telephone: 0114640360 - 3
Fax: 0114740588
Email : [email protected]
Address : P W Corporate Secretarial (Pvt) LtdNo. 3/17, Kynsey RoadColombo 08
The Board continues to proactively consider and adapt, as suitable to the circumstances of LBF, emerging practices to promote engagement with Shareholders.
FUTURE OUTLOOK
Corporate governance plays a vital role in business and future emphasis is to further satisfy the Company’s stakeholders whilst sustaining growth of the Company. Therefore we believe in the following; operating structure, internal control, review, benchmark, feedback, effective and transparent communication.
By Order of the Board,L B Finance PLC
P W Corporate Secretarial (Pvt) LtdSecretaries
19 May 2021
CORPORATE GOVERNANCE REPORT

L B Finance PLC | Annual Report 2020/21 223
ANNUAL REPORT OF THE BOARD OF DIRECTORS ON THE AFFAIRS OF THE COMPANY
The Directors of L B Finance PLC have pleasure in presenting to the shareholders the Annual Report of the Board of Directors on the affairs of the Company together with the Consolidated Financial Statements of the Company and its subsidiary for the year ended 31st March 2021 and the Independent Auditors Report on those Financial Statements, conforming to the relevant statutory requirements.
This Report includes the information as required by the Companies Act No. 07 of 2007, Finance Companies (Corporate Governance) Direction No. 03 of 2008 (as amended) and the Listing Rules of the Colombo Stock Exchange. It is also guided by the Recommended Best Practices on Corporate Governance.
GENERAL
L B Finance PLC (the Company) is a Licensed Finance Company in terms of the Finance Business Act No.42 of 2011.
It was incorporated under the Companies Ordinance No. 51 of 1938 as a private limited liability company on 30th May 1971, converted to a public limited liability company on 29th September 1982 and was admitted to the Official List of the Colombo Stock Exchange on 30th December 1997. The Company was re-registered as per the Companies Act No. 07 of 2007 on 6th June 2008 under Company Registration No. PQ 156.
The Company is a Registered Finance Leasing Establishment in terms of the Finance Leasing Act No. 56 of 2000.
The ordinary shares of the Company and Debentures issued by the Company 10,000,000 Senior Unsecured Redeemable Rated Debentures (redeemable in 2022) and 20,000,000 Subordinated Unsecured, Redeemable, Rated Debentures (redeemable in 2022) are listed on the Main Board of the Colombo Stock Exchange.
The Company has been affirmed a national long-term rating at A-(lka) with a stable outlook by Fitch Ratings Lanka Limited. The rating in respect of the Debentures issued by the Company are 10,000,000 Senior Unsecured Debentures redeemable in 2022 - national long term rating at A-(lka) and 20,000,000 Subordinated Debentures redeemable in 2022 - national long term rating at BBB (lka).
Both the registered office of the Company and its head office are situated at No. 275/75, Prof. Stanley Wijesundera Mawatha, Colombo 07.
As per the requirements set out in Section 168 of the Companies Act No. 07 of 2007, the following information is disclosed in this Report for the year under review.
Information required to be disclosed as per the Companies Act No. 07 of 2007 Reference to the Companies Act
Level of compliance by the Company
The nature of the business of the Company Section 168 (1) (a) Page 223
Signed Group Financial Statements of the Company for the accounting period under review Section 168 (1) (b) Page 273 to 396
Auditor’s Report on Group Financial Statements of the Company Section 168 (1) (c) Page 268 to 270
Changes in Accounting Policies during the accounting period Section 168 (1) (d) Page 283
Particulars of entries in the Interests Register made during the accounting period Section 168 (1) (e) Page 226
Remuneration and other benefits paid to the Directors during the accounting period Section 168 (1) (f) Page 387
Total amount of donations made by the Company during the accounting period Section 168 (1) (g) Page 229
Information on Directorate of the Company at the end of the accounting period Section 168 (1) (h) Page 225
Amounts payable to the Auditor as audit fees and fees for other services rendered during the accounting period as a separate disclosure
Section 168 (1) (i) Page 296
Auditors’ relationship or any interest with the Company Section 168 (1) (j) Page 229
Annual Report of the Board of Directors on the affairs of the Company to be signed on behalf of the Board by two Directors and the Company Secretary
Section 168 (1) (k) Page 230
Information as per Section 168 (i)(b) to (j) in relation to the subsidiary Section 168 (2) Pages 225, 229 and 280
VISION, MISSION AND CORPORATE CONDUCT
The Company’s Vision, Mission, Values and Goals are given on page 14 of this Report.
PRINCIPAL ACTIVITIES
The Company’s principal activities during the year were savings/deposit mobilisation, lending activities including finance lease/vehicle loan facilities, gold loans, mortgage loans, personal loans and other credit facilities, value added services and digital financial services.
The Company’s only subsidiary, which is incorporated in the Republic of the Union of Myanmar, L B Microfinance Myanmar Company Limited, carried on micro finance business in Myanmar.
Stability Leadership Strength Agility Responsibility Sustainability Success Supplementary Information

L B Finance PLC | Annual Report 2020/21224
The Company has an interest in the leisure sector through its investment in The Fortress Resorts PLC.
There were no significant changes in the nature of the principal activities of the Company during the year under review.
REVIEW OF OPERATIONS
A review of the business of the Company and its subsidiary and their performance during the year with comments on financial results, future strategies and prospects are contained in the Managing Director’s Review on pages 37 to 39 which forms an integral part of this Report.
FUTURE DEVELOPMENTS
An overview of the future developments of the Company is given in the Chairperson’s Message on pages 33, Managing Director’s Review on pages 37 and the Management Discussion and Analysis on pages 50.
FINANCIAL STATEMENTS
The Consolidated Financial Statements of the Company and its subsidiary have been prepared and presented in accordance with the Sri Lanka Accounting Standards comprising Sri Lanka Financial Reporting Standards (SLFRSs) and Sri Lanka Accounting Standards (LKASs) laid down by The Institute of Chartered Accountants of Sri Lanka and in compliance with the requirements of the Companies Act No. 07 of 2007, Finance Business Act No.42 of 2011 the directions and guidelines issued under the said Finance Business Act and the Listing Rules of the Colombo Stock Exchange.
Consequent to the Audit Committee’s recommendations, the Financial Statements were reviewed and approved by the Board of Directors on 19th May 2021.
The Consolidated Financial Statements of the Company and its subsidiary duly signed by the Assistant General Manager - Finance and two Directors on behalf of the Board
which are attached hereto form an integral part of the Annual Report.
DIRECTORS’ RESPONSIBILITY FOR FINANCIAL REPORTING
In terms of Section 150(1), 151, 152(1) and 153(1) and (2) of the Companies Act No. 07 of 2007, the Board of Directors of the Company is responsible for the preparation of the Financial Statements of the Group and the Company which reflect a true and fair view of the state of affairs of the Company and its subsidiary as at the reporting date and the profit or loss or income and expenditure of the Company and its subsidiary for the accounting period ending as at the reporting date.
The Directors confirm that the Income Statement, Statement of Financial Position, Statement of Changes in Equity, Cash Flow Statement and Notes to Financial Statements appearing on pages 273 to 396 have been prepared in conformity with the requirements of the Sri Lanka Accounting Standards, Sri Lanka Accounting and Auditing Standards Act No. 15 of 1995 and the amendments thereto, Companies Act No. 07 of 2007, directions and guidelines issued under the Finance Business Act No. 42 of 2011 and the Listing Rules of the Colombo Stock Exchange.
The Statement of Directors’ Responsibilities for Financial Reporting is given on page 267 and forms an integral part of the Annual Report of the Board of Directors on the Affairs of the Company.
DIRECTORS’ STATEMENTS ON INTERNAL CONTROLS OVER FINANCIAL REPORTING
The Board has issued a statement on the internal control mechanism of the Company as per Section 10 (2) (b) of Finance Companies (Corporate Governance) Direction No. 03 of 2008.
The said statement which forms an integral part of the Annual Report of the Board of Directors on the Affairs of the Company is given on page 223.
The Board has obtained an Assurance Report from the Independent Auditors on the Directors’ Statement on Internal Controls over Financial Reporting as referred to in page 266.
AUDITORS’ REPORT
The Report of the Independent Auditors on the Financial Statements of the Company and the Group is given on pages 268 to 271.
ACCOUNTING POLICIES AND CHANGES DURING THE YEAR
The accounting policies adopted in the preparation of the Financial Statements are given on pages 280 to 396. There were no significant changes to the accounting policies used by the Company during the year under review vis-à-vis those used in the previous year.
INCOME
The income of the Company for the year ended 31st March 2021 was Rs. 29,766 million (in the year 2019/20 it was Rs. 31,222 million)
Group Income during the year was Rs. 29,930 million (2019/20 – Rs. 31,359 million)
An analysis of the Income is given in Note 4.1.1 to the Financial Statements.
FINANCIAL RESULTS AND APPROPRIATIONS
The profit before tax increased by 22% whilst the Company recorded a growth of 31% in net profit after tax for the year under review in comparison to those of the preceding year.
The growth in total comprehensive income was 34%.
ANNUAL REPORT OF THE BOARD OF DIRECTORS ON THE AFFAIRS OF THE COMPANY

L B Finance PLC | Annual Report 2020/21 225
Details of appropriation of profit of the Company and the Group are given below:
2020/21 Rs. ‘000
2019/20 Rs. ‘000
Profit for the year after payment of all the expenses of management, provision for depreciation and amortisation, impairment of loans and other losses, gold loan auction losses and tax on financial services. 9,306,375 7,610,287 Less: Income tax expense 2,503,778 2,423,234 Profit after tax 6,802,597 5,187,053 Unappropriated balance brought forward from previous year 15,944,328 12,378,772 Actuarial gains/(losses) on defined benefit plans 30,665 (30,029)Profit available for appropriation 22,777,590 17,535,796 Less: AppropriationsDividend paid for previous financial year - 554,057 Interim dividend payable/paid for current financial year 1,662,171 - Transfers during the year 1,360,519 1,037,411 Total appropriation 3,022,690 1,591,468 Unappropriated balance carried forward 19,754,900 15,944,328
Proposed final dividend Rs. 4/- per share -
RESERVES
The reserves of the Company and the Group with the movements during the year are given in Note 4.35 to the Financial Statements on pages 359 to 360.
TAXATION
The Income Tax rate applicable to the Company’s operations is 24% (24%-28% in 2019/20)
The Company was also liable for Value Added Tax (VAT) on Financial Services at 15% (2019/20 - 15%).
THE BOARD OF DIRECTORS
The Board of Directors of the Company as at 31st March 2021 consisted of 10 Directors with a balance of skills, wide knowledge and experience in entrepreneurship, banking, finance, audit and assurance, legal and marketing which is appropriate for the business carried out by the Company.
The names of the Directors who held office as at the end of the accounting period are given below and their brief profiles appear on pages 40 to 43.
Executive Directors
Mr. Dhammika Perera – Executive Deputy ChairmanMr. J A S S Adhihetty – Managing DirectorMr. Niroshan Udage – Deputy Managing DirectorMr. B D A PereraMr. R S Yatawara
Non-Executive Directors
Mrs. Anandhiy K. Gunawardhana - Chairperson*Mrs. Yogadinusha BhaskaranMr. M A J W Jayasekara * Mrs. Ashwini Natesan *Mr. Dharmadasa Rangalle
* Independent Director as per the Listing Rules and the Finance Companies (Corporate Governance) Direction No. 03 of 2008 (as amended).
Extension of office of the Managing Director
Pursuant to receiving regulatory approval in terms of Finance Business Act, Directions No.05 of 2020, No. 03 of 2011 and the shareholders’ approval at the Annual General Meeting held on 30th July 2020, Mr J A S S Adhihetty continued to function
as the Managing Director of the Company, since attaining the age of 70 years on 4th July 2020, for a further period of one year.
Re-designations during the year
Mr Niroshan Udage, Executive Director – Asset Finance was appointed the Deputy Managing Director of the Company with effect from 8th March 2021.
The relevant regulatory approval in terms of Finance Companies (Structural Changes) Direction No.01 of 2013 was obtained for the aforesaid structural change.
Resignations/cessations during the year
There were no resignations / cessations during the year.
Directors of Subsidiary
The Directors of the subsidiary, L B Microfinance Myanmar Company Limited as at 31st March 2021 consisted of the following;Mr. Dhammika PereraMr. Sumith AdhihettyMr. Dulan De SilvaMr. Niroshan UdageMr. B D A PereraMr. R S Yatawara
There were no changes in the Directors of the subsidiary, during the year under review and upto the date of this Report.
Retirement by rotation and re-election of Directors
The names of the Directors who are
(i) subject to retirement by rotation in terms of Articles 85 and 86 of the Articles of Association and
(ii) proposed for re-appointment in terms of Section 211 of the Companies Act,
and the applicable provisions thereto, are set out in the undernoted Table;
The Nomination Committee and the Board have recommended the re-election/re-appointment of the said Directors, subject to the relevant regulatory approval/s in terms of the applicable Directions issued under the Finance Business Act.
Stability Leadership Strength Agility Responsibility Sustainability Success Supplementary Information

L B Finance PLC | Annual Report 2020/21226
ANNUAL REPORT OF THE BOARD OF DIRECTORS ON THE AFFAIRS OF THE COMPANY
Directors’ interests register and Directors’ interests in contracts or proposed contracts
The Company maintains the Directors’ Interests Register in terms of the Companies Act No. 07 of 2007.
Directors of the Company have made necessary declarations of their interests in Contracts and proposed Contracts in terms of Section 192 (1) and 192 (2) of the Companies Act. These interests are entered in the Interests Register which is deemed to form part and parcel of this Annual Report and available for inspection upon request.
The particulars of the Directors Interests in Contracts with the Company are given
in Note 6.1 to the Financial Statements on pages 387 to 390 and form an integral part of this Annual Report.
The remuneration paid to the Directors during the year under review is entered in the Interests Register and the aggregate of such remuneration is disclosed in this Annual Report under ‘Directors’ Remuneration’ on page 227.
The relevant interests of Directors in the shares/debentures of the Company as at 31st March 2021 as recorded in the Interests Register are given in this Report under Directors’ shareholding on page 227.
In accordance with the Myanmar Companies Law, Directors of the subsidiary have disclosed their interests in shares
and securities in the said subsidiary and related companies and also their interests in contracts and other arrangements with the said company.
Directors’ Declarations in terms of paragraph 7(3) of the Finance Companies (Corporate Governance) Direction No. 03 of 2008
The Chairperson and the Directors of the Company have made declarations as per the requirements in Section 7 (3) of the Finance Companies (Corporate Governance) Direction No. 03 of 2008 (as amended), that there is no financial, business, family or other material/relevant relationship(s) between the Chairperson and the Managing Director and/or amongst the members of the Board.
Name of Director Applicable Article of the Articles of Association / Section of the Companies Act
Other information
Mrs. Ashwini Natesan
Mr Dharmadasa Rangalle
Articles 85 and 86 According to Article 85 and 86 the Directors to retire by rotation at the Annual General Meeting are those who (been subject to retirement by rotation) have been longest in office since their last election or appointment.
If one-third of the Directors eligible for retirement by rotation is not a multiple of three, the number nearest to (but not greater than) one-third shall retire from office. As per the Articles, in calculating the said number, Executive Directors and Directors who were appointed to fill casual vacancies and as additional Directors are excluded.
Accordingly after excluding the five Executive Directors, the number of Directors subject to retirement by rotation is five and therefore, one Director should retire by rotation. However, considering that both Mrs Ashwini Natesan and Mr Dharmadasa Rangalle were re-elected Directors at the Annual General Meeting held on 27th June 2019, it was decided that they both will retire and offer themselves for re-election at the forthcoming Annual General Meeting.
The Company has applied to the Director – Department of Supervision of Non Bank Financial Institutions of the Central Bank of Sri Lanka, for the requisite regulatory approval in terms of Finance Companies Direction No.03 of 2011, with respect to the said re-elections.
Accordingly, resolutions will be placed before the shareholders at the forthcoming Annual General Meeting for the re-election of the said Directors which will be effective, only upon the receipt of requisite regulatory approval as aforesaid.

L B Finance PLC | Annual Report 2020/21 227
Name of Director Applicable Article of the Articles of Association / Section of the Companies Act
Other information
Mr. J A S S Adhihetty
Section 211 of the Companies Act
Mr. J A S S Adhihetty, who holds the position of Managing Director of the Company, attained the age of 70 years on 4th July 2020. The Board at its meeting held on 19th May 2021, having considered the Finance Business Act Directions No.05 of 2020 and the approval granted by the Monetary Board on 8th July 2020, for a period of one year from 4th July 2020, resolved to seek the prior approval of the Monetary Board for a further extension of time period vis-à-vis Mr. Adhihetty.
In terms of Section 210 of the Companies Act, Mr. Adhihetty vacates office at the conclusion of the next Annual General Meeting, unless reappointed by the shareholders, subject to reappoint of regulatory approvals.
In line with the Board’s decision to seek an extension of time period for Mr. Adhihetty in terms of the aforesaid Directions No. 05 of 2020 and the Company’s application for the requisite regulatory approval in terms of the said Directions No. 05 of 2020 and Finance Companies Direction No.03 of 2011, the Board further resolved to place a resolution before the shareholders at the forthcoming Annual General Meeting in terms of Section 211 of the Companies Act seeking the approval of the shareholders for the re-appointment of Mr. Adhihetty specially declaring that the age limit referred to in Section 210 of the Companies Act shall not apply to Mr. Adhihetty, which will be effective only if the Company receives the requisite regulatory approvals in terms of the said Directions. Additionally, the approval of the shareholders is sought for the aforesaid Resolution in compliance with the Guidelines attached to the said Directions No. 05 of 2020, with respect to determining the fitness and propriety of Directors beyond the age of 70 years upto a maximum of 75 years.
RELATED PARTY TRANSACTIONS WITH THE COMPANYThe Directors have also disclosed transactions, if any, that could be classified as related party transactions in terms of LKAS 24.
With effect from 1st January 2016, all proposed non-recurrent related party transactions have been placed before the Related Party Transactions Review
Committee formed under the Listing Rules of the Colombo Stock Exchange, for its review and recommendations.
The aggregate value of transactions of related parties (as defined in LKAS 24 – ‘Related Parties Disclosure’) with the Company are set out in Note 6.1 to the Financial Statements on pages 387 to 390.
The Board confirms that the Company has not engaged in transactions with any related party in a manner that would grant such party ‘more favorable treatment’ than that accorded to other similar constituents of the Company.
The Directors declare that the Company is in compliance with Section 9 of the Listing Rules of the Colombo Stock Exchange pertaining to Related Party Transactions during the financial year ended 31st March 2021.
DIRECTORS’ REMUNERATIONThe remuneration of Directors of the Company and its subsidiary is disclosed under key management personnel compensation in Note 6.1.1 to the Financial Statements on page 387.
RELEVANT INTERESTS OF DIRECTORS’ IN SHARESThe Directors shareholding and the relevant interests of Directors in the shares of the Company as at 31st March 2021 and 31st March 2020 are as follows;
Shareholding as at 31st March 2021 Shareholding as at 31st March 2020
Mrs. Anandhiy K Gunawardhana - -Mr. Dhammika Perera - -Mr. J A S S Adhihetty 424,480 106,120Mr. N Udage 1,616,540 329,135Mr. B D A Perera - -Mr. R S Yatawara 7,620 905Mrs. Yogadinusha Bhaskaran - -Mr. M A J W Jayasekara - -Mrs. Ashwini Natesan - -Mr. Dharmadasa Rangalle - -
Stability Leadership Strength Agility Responsibility Sustainability Success Supplementary Information

L B Finance PLC | Annual Report 2020/21228
Mr. Dhammika Perera is the major shareholder of Vallibel One PLC, which holds 286,729,600 shares constituting 51.75% of the shares representing the stated capital of the Company.
Vallibel One PLC is also the holding company of Royal Ceramics Lanka PLC which holds 144,492,928 shares constituting 26.08% of the shares representing the stated capital of the Company.
Mr. Dhammika Perera and Mr. J A S S Adhihetty are Directors of Vallibel One PLC, where they serve as Chairman/Managing Director and Non- Executive Director respectively.
Mrs. Yogadinusha Bhaskaran is the Chief Executive Officer of Vallibel One PLC.
Mr. Dhammika Perera, also serves as the Chairman of Royal Ceramics Lanka PLC.
DIRECTORS’ INTERESTS IN DEBENTURES
Except for 15,000 Subordinated, Unsecured, Listed, Redeemable Rated Debentures held by Mrs.Anandhiy K Gunawardhana, no debentures were registered in the name of any Director during the year under review.
BOARD SUBCOMMITTEES
The Board of Directors of the Company has formed five Committees in compliance with the Finance Companies (Corporate Governance) Direction No. 03 of 2008 (as amended), Listing Rules of the Colombo Stock Exchange and as per the Recommended Best Practices on Corporate Governance.
They are the Audit Committee, Integrated Risk Management Committee, Remuneration Committee, Related Party Transactions Review Committee and the Nomination Committee.
The composition of the said Committees is as follows:
Audit committee
Mrs . Yogadinusha Bhaskaran – Chairperson/Non-Executive Director Mrs. Anandhiy Gunawardhana - Independent Non-Executive DirectorMr. M A J W Jayasekara - Independent Non-Executive Director
The Report of the Audit Committee appears on page 233.
Integrated risk management committee (IRMC)
Mr. M A J W Jayasekara – Chairman/Independent Non-Executive Director Mrs. Anandhiy Gunawardhana - Independent Non-Executive DirectorMrs. Ashwini Natesan - Independent Non-Executive DirectorMr. J A S S Adhihetty – Managing DirectorMr. Niroshan Udage – Deputy Managing Director Mr. B D A Perera – Executive Director – Asset ManagementMr. Ravi Yatawara – Executive DirectorMr. Malith Hewage – AGM FinanceMr. Sebestian Pulle – Compliance Officer Mrs. Waruni Perera – Senior Manager - Risk Management
The Report of the IRMC appears on page 236.
Remuneration committee
Mr. M A J W Jayasekara – Chairman/ Independent Non-Executive DirectorMrs. Anandhiy Gunawardhana - Independent Non-Executive Director Mrs . Yogadinusha Bhaskaran – Non-Executive Director
The Report of the Remuneration Committee appears on page 231.
Related party transactions review committee (RPTRC)
Mrs. Ashwini Natesan – Chairperson/ Independent Non-Executive Director
Mr. M A J W Jayasekara - Independent - Non-Executive Director
Mr. Dharmadasa Rangalle - Non-Executive Director
The Report of the RPTRC appears on page 239.
Nomination Committee
Mr. M A J W Jayasekera – Chairman – Independent Non Executive DirectorMrs. Anandhiy Gunawardhana – Independent Non Executive DirectorMr. J A S S Adhihetty – Managing Director
The Report of the Nomination Committee appears on page 232.
STATED CAPITAL AND DEBENTURES
The Stated Capital of the Company as at 31st March 2021 was Rs. 838,282,159/-represented by 554,057,136 ordinary shares. There were no changes in the Stated Capital of the Company during the year, except that the number of shares in issue increased from 138,514,284 ordinary shares to 554,057,136 ordinary shares consequent to the sub-division (splitting) of shares approved by the shareholders on 10th March 2021 whereby every share was sub-divided into four (4) shares.
The details of the debentures in issue as at 31st March 2021 are set out in Note 4.28 to the Financial Statements on page 352.
SHARE INFORMATION AND SUBSTANTIAL SHAREHOLDINGS
Shareholders
There were 3,590 shareholders registered as at 31st March 2021 (1,886 shareholders as at 31st March 2020).
Distribution schedule of shareholders, major shareholders, public holding and ratios and market price information
Information as required by the Listing Rules on distribution of shareholding with the respective percentages, twenty largest shareholders, public holding and ratios and market price information are set out on pages 138, 141 and 142 under Financial Review.
Ratios and market prices of debentures
Interest rate of comparable government securities, ratios and market prices of the debentures issued by the Company, as required by the Listing Rules are set out on page 143.
ANNUAL REPORT OF THE BOARD OF DIRECTORS ON THE AFFAIRS OF THE COMPANY

L B Finance PLC | Annual Report 2020/21 229
During the year under review, there were no changes in the credit rating for the Company and/or the Debentures issued by the Company.
DIVIDENDS
The Company paid an interim dividend of Rs. 12/- per share for the year under review out of the profits of the Company, on the then issued shares of 138,514,284.
The Directors have recommended a final dividend of Rs. 4/- per share for the year under review on the shares in issue of 554,057,136 to be approved by the shareholders at the forthcoming Annual General Meeting.
As required by Section 56 of the Companies Act, the Directors have certified that they are satisfied that the Company will, immediately after the said distribution is made, satisfy the solvency test in accordance with the Companies Act and subsequent to such declaration, the Directors have obtained the Auditors certificate of solvency thereon.
In compliance with Finance Companies Guideline No. 01 of 2013, the Company has obtained the approval of the Director, Department of Supervision of Non-Bank Financial Institutions of the Central Bank of Sri Lanka for the proposed final dividend.
The said final dividend will, subject to approval by the shareholders, be payable on 5th July 2021 (to those shareholders who have provided accurate dividend disposal instructions, by way of direct credit to their respective Bank Accounts, through SLIPS) and on 22nd July 2021 (to those shareholders whose payments are to be made by way of cheques).
Property plant & equipment and significant changes in the Company’s and its subsidiary’s fixed assets/market value of land
The details of Property, Plant and Equipment are given in Note 4.24 of the Financial Statements.
The land and buildings owned by the Company are recorded at cost and details of those properties and their market values as at 31st March 2021 as per valuations conducted by H V Manjula Basnayake an Independent Valuer are set out in Note 4.24.9 to the Financial Statements on page 345.
HUMAN RESOURCES
The Company’s employment policy is totally non-discriminatory which respects individuals and provides career opportunities irrespective of the gender race or religion.
As at 31st March 2021, the Company had 3,536 employees (3,606 employees as at 31st March 2020).
Material issues pertaining to employees and industrial relations pertaining to the Company
No material issues pertaining to employees or industrial relations of the Company occurred during the year under review which required disclosure under Rule 7.6 (vii) of the Listing Rules.
Employee share option schemes/employee share purchase schemes
The Company has not implemented any Share Option/Share Purchase Schemes for its employees.
DONATIONS
During the year under review the Company and its subsidiary made donations to the value of Rs.545,286/- and Rs. 36,036/- respectively.
AUDITORS
Messrs Ernst & Young, Chartered Accountants served as the Independent Auditors during the year under review and also provided audit related services and permitted non-audit/consultancy services.
The Auditor of the subsidiary company, L B Microfinance Myanmar Company Ltd is UTW (Myanmar) Limited, a Member of Ernst & Young Global Limited.
A total amount of Rs. 6,968,084/- is payable by the Company to the Auditors for the year under review comprising Rs. 3,646,976/- as Audit Fees, and 3,077,568/- as audit related fees and expenses and Rs.243,540/- for non-audit services. The amounts payable to the Auditors of the subsidiary company for the year under review are Rs.2,745,525/- as Audit Fees – Statutory and Rs.933,478/- as Audit Fees – Group Audit.
The Auditors of the Company have expressed their willingness to continue in office. The Audit Committee at a meeting
held on 10th March 2021 recommended that they be re-appointed as Auditors. A resolution to re-appoint the Auditors and to authorise the Directors to determine their remuneration will be proposed at the Annual General Meeting.
RISK MANAGEMENT AND INTERNAL CONTROL
An ongoing process is in place to identify and manage the risks that are associated with the business and operations of the Company. The Directors review this process through the Audit Committee and the Integrated Risk Management Committee. Specific steps taken by the Company to manage the Risks are detailed in the section on Risk Management Report on pages 32 to 56.
Directors’ statement on Internal Controls over Financial Reporting is on pages 366.
MATERIAL FORESEEABLE RISK FACTORS
Material Foreseeable Risk Factors as applicable to the business operations of the Company and subsidiary are set out in Notes 5.1 to 5.6 to the Financial Statements.
APPRAISAL OF BOARD PERFORMANCE
A scheme of self-assessment is undertaken annually by each Director in conformity with the Section 2 (8) of the Finance Companies (Corporate Governance) Direction No. 03 of 2008 by answering a self-assessment questionnaire. The responses are collated by the Company Secretary, which are submitted to the Board for discussion and further evaluated by the Board.
The Board also carried out an annual self-evaluation of its own performance and that of the Sub-Committees to ensure that they discharge their duties and responsibilities satisfactorily in terms of the Companies Act No. 07 of 2007, Finance Companies (Corporate Governance) Direction No. 03 of 2008, Listing Rules of the Colombo Stock Exchange and Best Practices on Corporate Governance.
Board and sub-committee evaluations for the year under review were discussed at the Board Meetings held in the month May 2021.
Stability Leadership Strength Agility Responsibility Sustainability Success Supplementary Information

L B Finance PLC | Annual Report 2020/21230
CORPORATE GOVERNANCE
The Board of Directors is responsible for the governance of the Company.
The Board has placed considerable emphasis on developing rules, structures and processes to ensure integrity and transparency in all of Company’s dealings and on making the best effort in achieving performance and quality profits. The Board has continuously refined the structure and systems to ensure governance on the lines as defined, being aware all the time that it is accountable to the stakeholders and to the general public.
The Report on Corporate Governance on pages 206 to 222 describes the application of the Corporate Governance practices within the Company during the year under review.
COMPLIANCE WITH LAWS AND REGULATIONS
The Compliance Officer independently monitors adherence with all applicable laws, regulations and statutory requirements and reports to the Board, the Audit Committee and the Integrated Risk Management Committee.
STATUTORY PAYMENTS
The Directors confirm that, to the best of their knowledge, all taxes, duties and levies payable by the Company, all contributions, levies and taxes payable on behalf of and in respect of employees of the Company and all other known statutory dues as were due and payable by the Company as at the reporting date have been paid or where relevant provided for, except for certain assessments where appeals have been lodged.
ENVIRONMENTAL PROTECTION
The Company has not engaged in any activity that is harmful or hazardous to the environment. Measures taken by the Company on environmental protection are given in the report on Natural Capital on page 196.
OUTSTANDING LITIGATION
In the opinion of the Directors and Company’s Lawyers, pending litigation by and against the Company will not have a material impact on the financial position of the Company or its future operations.
CONTINGENT LIABILITIES
Except as disclosed in Note 6.5 to the Financial Statements, there were no material contingent liabilities as at the reporting date.
EVENTS AFTER THE REPORTING DATE
Except for matters disclosed in Note 6.9 to the Financial Statements, there are no material events as at the date of the Auditor’s Report which require adjustment to or disclosure in the Financial Statements.
GOING CONCERN
The Board of Directors has reviewed the Company’s corporate/business plans and is satisfied that the Company has adequate resources to continue its operations in the foreseeable future. Accordingly, the Financial Statements of the Company are prepared based on the going concern concept.
ANNUAL GENERAL MEETING
The Notice of the Forty Eighth (48th) Annual General Meeting appears on page 418.
In view of the current regulations/restrictions prevailing in the country due to the COVID-19 pandemic, the Board has decided to hold the Annual General Meeting of the Company as a Hybrid Meeting (hybrid of physical and electronic means) in line with the guidelines issued by the Colombo Stock Exchange for the conducting of Hybrid AGMs and on the assumption that no curfew will be in force on the date of the AGM and that there would be no restrictions imposed by the authorities on travel and/or conducting of meetings.
Shareholders are advised to refer to the Circular to Shareholders dated 7th June 2021 for further instructions in this regard.
ACKNOWLEDGEMENT OF THE CONTENT OF THE REPORT
As required by section 168 (1) (k) of the Companies Act, this Report is signed on behalf of the Board of the Company by two Directors and the Secretaries of the Company in pursuance of the authority granted by the Board by a Resolution passed on 7 June 2021 having acknowledged the contents of this Annual Report.
Signed on behalf of the Board by
Anandhiy GunawardhanaChairperson
Sumith AdhihettyManaging Director
P W Corporate Secretarial (Pvt) LtdSecretaries
7 June 2021
ANNUAL REPORT OF THE BOARD OF DIRECTORS ON THE AFFAIRS OF THE COMPANY

L B Finance PLC | Annual Report 2020/21 231
REMUNERATION COMMITTEE REPORT
The Managing Director and the Executive Directors attend meetings of the Committee by invitation and provide relevant information and their views to the Committee for its deliberations, except when the Executive Directors’ own remuneration packages and other matters relating to them are discussed.
The Company Secretary functions as the Secretary to the Remuneration Committee.
REGULATIONS/RULES RELEVANT TO THE FUNCTIONS OF THE COMMITTEE
The Remuneration Committee was formed by the Board in compliance with Rule 7.10.5 of the Listing Rules of the Colombo Stock Exchange and its composition and functions are in conformity with the Listing Rules.
Aligning remuneration with performance, and making continued progress towards ensuring a high performing culture in line with the Company’s values.
Mr. Ashane JayasekaraChairman
Remuneration Committee
FUNCTIONS
The functions of the Committee include the following
To make recommendations to the Board on the Remuneration Policy of the Company.
To make recommendations on the compensation and benefits of the Managing Director and Executive Directors.
To oversee any major changes in the employee remuneration and benefit structures throughout the Company,
To consider and examine such matters as it considers appropriate.
To make recommendations on other related matters referred to the Committee by the Board of Directors.
ACTIVITIES DURING THE YEAR
The Committee met thrice during the year, where it reviewed and made recommendations to the Board on bonus payments to Executive Directors, reviewed and made recommendations to the Board on the policy for remuneration of Directors and reviewed the remuneration framework of the Deputy Managing Director.
POLICIES AND PROCEDURES
Remunerations committee operates within the terms of reference as approved by the Board.
As per the said terms of reference, the Committee shall consist of not less than three (3) members, comprising exclusively of non-executive directors, a majority of whom shall be independent.
The Committee shall meet at least twice in a financial year and additional meetings may be called at anytime at the Chairman’s
discretion or by a member in consultation with the Chairman.
As required by the said terms of reference, the Committee reviewed the revised terms of reference in April 2021, and having assessed the adequacy thereof, noted that no revisions / amendments were necessary to the said terms of reference.
REMUNERATION POLICY
The primary objective of the Remuneration Policy of the Company is to align remuneration with performance, whilst ensuring that the Company is able to attract and retain employees critical to deliver the Company’s strategy and to make continued progress towards ensuring a high performing culture in line with the Company’s values.
Through the Remuneration Policy, the Company endeavours to encourage an entrepreneurial mindset by creating a working environment that motivates high performance so that all employees can positively and ethically contribute to the strategy, vision and goals of the Company while upholding its values.
DIRECTORS’ REMUNERATION
The total amount paid as Directors’ remuneration during the year under review is set out in Note 6.1.1 to the Financial Statements, which is in line with the Policy for Directors’ Remuneration adopted by the Board on 17th February 2021.
Ashane JayasekaraChairmanRemuneration Committee
19 May 2021
COMPOSITION OF THE COMMITTEE
Board member Board status
Mr. Ashane Jayasekara
Chairman/Independent Non-Executive Director
Mrs. Anandhiy Gunawardhana
Independent Non-Executive Director
Mrs. Yogadinusha Bhaskaran
Non-Executive Director
ATTENDANCE AT MEETINGS HELD DURING THE YEAR
Board member Attendance
Mrs. Anandhiy Gunawardhana
3/3
Mr. Ashane Jayasekara 3/3
Mrs. Yogadinusha Bhaskaran
3/3
Stability Leadership Strength Agility Responsibility Sustainability Success Supplementary Information

L B Finance PLC | Annual Report 2020/21232
NOMINATION COMMITTEE REPORT
Assessing whether the balance of skills, experience, knowledge and independence is appropriate to enable the Board to operate effectively.
Mr. Ashane JayasekaraChairman
Nomination Committee
REGULATIONS/RULES RELEVANT TO THE FUNCTIONS OF THE COMMITTEE
The Nomination Committee was formed in line with the Best Practices on Corporate Governance.
FUNCTIONS
The functions of the Nomination Committee include:
To regularly review the structure, size, composition and competencies of the Board, the requirement of additional / new expertise and the succession arrangements for retiring Directors and make recommendations to the Board with regard to any changes;
To consider the making of any appointments to the Board and to provide advice and recommendations to the Board on such appointments;
To ensure that Directors are fit and proper persons to hold office as per the criteria
COMPOSITION OF THE COMMITTEE
Board member Board status
Mr. Ashane Jayasekara
Chairman/ Independent Non-Executive Director
Mrs. Anandhiy Gunawardhana
Independent Non-Executive Director
Mr Sumith Adhihetty
Managing Director
ATTENDANCE AT MEETINGS HELD DURING THE YEAR
Board member Attendance
Mr. Ashane Jayasekara 4/4
Mrs. Anandhiy Gunawardhana
4/4
Mr Sumith Adhihetty 2/4
The Company Secretary functions as the Secretary to the Committee.
Company arising from the appointment of the Deputy Managing Director, and made its recommendations to the Board.
Based on the Committee’s recommendations, extension of the period of office of the Managing Director was approved by the Board on 22nd June 2020, appointment of the Deputy Managing Director and the addition of a new Board Member were approved on 27th January 2021 subject to the requisite regulatory approvals and revisions to the succession plan for key management personnel and the organisational structure were approved by the Board on 19th August 2020, 16th December 2020, 17th and 25th February 2021 respectively.
POLICIES AND PROCEDURES
The Nomination Committee operates within the terms of reference as approved by the Board As per the said terms of reference, the Committee shall consist of not less than three members, majority of whom shall be Non-Executive Directors, and the Managing Director.
The Committee shall meet at least twice in a financial year and additional meetings may be called at anytime at the Chairman’s discretion or by a member in consultation with the Chairman.
As required by the said terms of reference, the Committee reviewed the revised terms of reference in May 2021, and having assessed the adequacy thereof, noted that no revisions / amendments were necessary to the said terms of reference.
Ashane JayasekaraChairmanNomination Committee
19 May 2021
set out in the Directions issued by the Central Bank of Sri Lanka and the relevant Statutes;
To evaluate and recommend the appointment, promotion, transfer and re-designation of the Managing Director and Executive Directors.
To recommend Directors who are retiring by rotation to be placed before the shareholders, for re-election.
To oversee and review the Board’s succession plan.
To consider and examine such matters as it considers appropriate.
To make recommendations on other related matters referred to the Committee by the Board of Directors.
ACTIVITIES DURING THE YEAR
The Committee met four times during the year to deliberate on re-election of Directors retiring at the Annual General Meeting, recommendation on seeking an extension of period of office of the Managing Director beyond the age limit of 70 years in terms of the Finance Business Act Directions 05 of 2020, succession planning for a key management personnel, appointment of the Executive Director – Asset Finance as the Deputy Managing Director and also to review and make its recommendations on a revised organizational chart with the introduction of a key position to the corporate structure of the Company
Additionally, the Committee reviewed the structure and composition of the Board and recommended the requirement of additional/new expertise on the Board and also discussed the succession arrangements for retiring Directors
The Committee also reviewed two matters by circulation, namely, revised succession plan for key management personnel and the revised organisational structure of the

L B Finance PLC | Annual Report 2020/21 233
AUDIT COMMITTEE REPORT
The fundamental role of the Audit Committee is to assist the board in effecting its oversight responsibilities in the areas of internal and external audit, internal financial controls and financial reporting.
While formal meetings of the Audit Committee are at the heart of the chair’s work, our contact goes beyond the boardroom through engaging with various stakeholders, including meetings with internal and external auditors, working closely with other board subcommittees and achieving synergies across our coordinated assurance process.
Mrs. Yogadinusha BhaskaranChairperson
Audit Committee
COMMITTEE RESPONSIBILITIES
The Audit Committee is set up primarily to assist the Board in carrying out its overall independent oversight functions in relation to the accuracy and integrity of the financial statements, internal control systems and compliance with Company policies, legal and regulatory requirements. This is done to safeguard the interests of shareholders, depositors and other stakeholders.
The Committee is vested with the responsibility for supervision to ensure the effectiveness of the system of internal controls, financial reporting, risk management, compliance with laws, regulations and directions of the CBSL and other regulators, as well as the adequacy and effectiveness of the governance process of the organisation.
The Committee shall exercise its independent oversight on internal and external assurance functions and ensure both internal and external auditors’ independence, objectivity and the effectiveness of the audit process, taking in to consideration relevant Sri Lankan professional and regulatory requirements.
COMPOSITION OF THE COMMITTEE
During the year, the Board Audit Committee consisted of three Non-Executive Directors, a majority of whom are independent, in line with the composition requirements specified by the regulators. The Board is satisfied that the current members of the Committee are competent in financial matters and have recent and relevant experience.
Board member Board status
Mrs. Yogadinusha Bhaskaran Non-Executive Director
Mrs. Anandhiy K Gunawardhana Chairperson/Independent Non-Executive Director
Mr. Ashane Jayasekara Independent Non-Executive Director
The Managing Director, Executive Directors and the senior management of LBF including Chief Internal Auditor and Assistant General Manager – Finance attended the meetings by invitation. The members of the management team and the Company’s External Auditor, Messrs. Ernst & Young were invited to participate at the meetings as and when required.
P W Corporate Secretarial (Pvt) Ltd acted as Secretary to the Committee, the proceedings of which were periodically reported to the Board.
The profiles of the Audit Committee members are given on pages 40 to 43.
MEETING ATTENDANCE
Board member Attendance
Mrs. Yogadinusha Bhaskaran 13/13
Mrs. Anandhiy K Gunawardhana 13/13
Mr. Ashane Jayasekara 13/13
Stability Leadership Strength Agility Responsibility Sustainability Success Supplementary Information

L B Finance PLC | Annual Report 2020/21234
Reviewing of the internal audit reports and steps shall be taken liaising with the senior management of LBF to ensure that precautionary measures are taken to mitigate the risk that could arise due to reported control weaknesses, procedure violations, frauds and errors.
The Committee is provided with sufficient resources to perform its duties including support, as necessary, from the Internal Audit Department, the external auditor, legal counsel and management in examining all matters relating to the Company’s adopted accounting principles and practices, and in reviewing all material financial, operational and compliance controls.
COMMITTEE ACTIVITIES DURING THE FINANCIAL YEAR
Audit committee charter
The Board approved Charter of the Audit Committee clearly defines the Terms of Reference of the Committee. The Charter is reviewed annually, to ensure new developments to the Committee’s functions and concerns are catered to. The Audit Committee Charter was last reviewed and approved by the Board of Directors in May 2020.
Financial reporting system
The Committee assisted the Board of Directors in the discharge of its duties by reviewing the financial reporting system adopted by the Company. The Committee satisfied itself that accounting policies, practices and internal controls in place are adequate to provide reasonable assurance that the financial reporting system is effective and efficient to provide reliable and timely information. The Committee discharged its duties with particular reference to the following:
the preparation, presentation and adequacy of the disclosures in the Company’s annual and interim financial statements in accordance with Sri Lanka accounting standards, regulatory and statutory requirements applicable to LBF;
the rationale and basis for the ‘significant estimates and judgments’ underlying the financial statements;
the systems and procedures in place to ensure that all transactions are accurately recorded in the books of accounts; and
the effectiveness of the financial reporting system/s including the management accounts to ensure reliability of the information provided to the Board and other stakeholders of the Company.
the Committee focused special attention on the assessment of adequacy of provision for Expected Credit Loss (ECL) recognized in the financial statements by factoring the potential implications of the COVID-19 pandemic and the moratorium schemes introduced by the government to support the recovery of the economy.
Regulatory compliance
Regulatory compliance is a priority. Mechanisms to ensure timely and effective implementation of regulatory requirements are necessary to safeguard the interests of all stakeholders. Process owners are responsible for compliance with regulations as part of their standard operating procedure.
The Compliance Officer reviews and reports on any gaps or areas of non-compliance to the Audit Committee. It is also the mandate of the Compliance Officer to disseminate new regulatory requirements and update policies and procedure manuals to incorporate such requirements. The reports of the Compliance Officer are also periodically submitted to the Board.
A process has been set up to obtain periodic confirmations from the senior management regarding compliance with the statutory and regulatory requirements through the compliance function. The Committee also obtains assurance from internal auditors on several key regulatory compliance of the Company, in line with their respective internal audit programmes.
Internal Audit
The Committee established a fully-fledged Internal Audit Department to provide independent assurance to the Committee in discharging its duties. The Committee ensures that the internal audit function is independent of the activities it audits and it possesses proficiency and exercises due professional care. The Procedure Manual of the Internal Audit Department is in place to reflect current practices of the Internal Audit Department.
The annual internal audit plan is reviewed by the Committee before commencement of the financial year and assesses the adequacy of resources for the department to provide uninterrupted assurance service. The Committee has reviewed the performance of the chief internal auditor for the period.
The Committee reviewed the efficacy of the internal control system and compliance with regulatory requirements and also the Company’s accounting and operational policies through the internal audit function. Prior to the commencement of audits, the scope of audit is reviewed by the Committee which recommends amendments where necessary, prior to approval. Control weaknesses highlighted in the internal audit reports are critically examined by the Committee. Follow-up action taken by the management on the audit recommendations are also reviewed. The Committee recommends re-audits of certain processes where necessary, to ensure effectiveness of the internal controls.
The Committee retained the services of Messrs. KPMG Sri Lanka to supplement the Internal Audit Department in performing branch audits. The representatives of Messrs. KPMG Sri Lanka present their audit reports to the Committee during their monthly meetings.
AUDIT COMMITTEE REPORT
L B Finance PLC | Annual Report 2020/21 235
External Audit
The Committee assisted the Board by recommending the appointment of the External Auditor in compliance with the relevant statutes and regulations. It monitors the service period, approves the audit fee and any resignation or dismissal of the auditor.
The Committee reviewed the independence and objectivity of the external auditor - Messrs. Ernst & Young, Chartered Accountants. The Committee together with management reviewed and discussed the scope of audit, approach and audit plan with Messrs. Ernst & Young, prior to the commencement of the audit for 2020/21.
The Auditors were provided with the opportunity of meeting the Non-Executive Directors separately, without any executive officer present, to ensure that the Auditors had the unrestricted opportunity to discuss and express their opinions on any relevant matter. This process assured the Committee that the management has fully cooperated in providing the information and explanations requested by the Auditor.
The Committee met the external auditors to discuss the management letter pertaining to the previous year’s audit and the management’s response thereto. Follow-up actions were taken to ensure that the recommendations contained in the management letter were implemented by management.
The Committee reviewed the non-audit services provided by the auditor to ensure that the provision of these services does not impair their independence and objectivity. The Committee is satisfied that there is no conflict of interests between the Company and the Auditor which would
hinder the independence and objectivity of the Auditor. The Policy for obtaining non-audit services was reviewed and approved this year.
During the year, the Committee evaluated the performance of the external auditor. The Audit Committee has recommended to the Board of Directors that Messrs. Ernst & Young, Chartered Accountants, be reappointed as the external auditor for the financial year ending 31st March 2022, subject to the approval of the shareholders at the next annual general meeting.
CORPORATE GOVERNANCE AND WHISTLEBLOWING POLICY
The highest standards of corporate governance and adherence to the internal policies and procedures were ensured by the Committee to establish good governance within the organisation. The Committee is satisfied with the present corporate governance framework of the organisation which ensures a balance of power and authority.
The Committee ensures the Whistleblowing Policy of the Company is a current, active set of measures to which all employees/incidents have recourse. There were no complaints by whistleblowers during the year. All employees are encouraged to practice whistleblowing if they suspect any wrongdoing. Senior Management, from time to time conducts awareness programs to encourage staff to raise genuine concerns. The Compliance Officer reports on the whistleblowing incidents to the Committee each quarter end. The Committee remains committed to follow-up on any future complaints/incidents, should they occur.
AUDIT COMMITTEE EFFECTIVENESS
As in the previous years, the effectiveness of the Committee was self-evaluated by its members and the results were presented to the Board. The Committee has concluded that its performance was effective.
I wish to thank my fellow Committee members, Executive Directors and the Senior Management for their cooperation during the year.
Yogadinusha BhaskaranChairperson
19 May 2021
Stability Leadership Strength Agility Responsibility Sustainability Success Supplementary Information
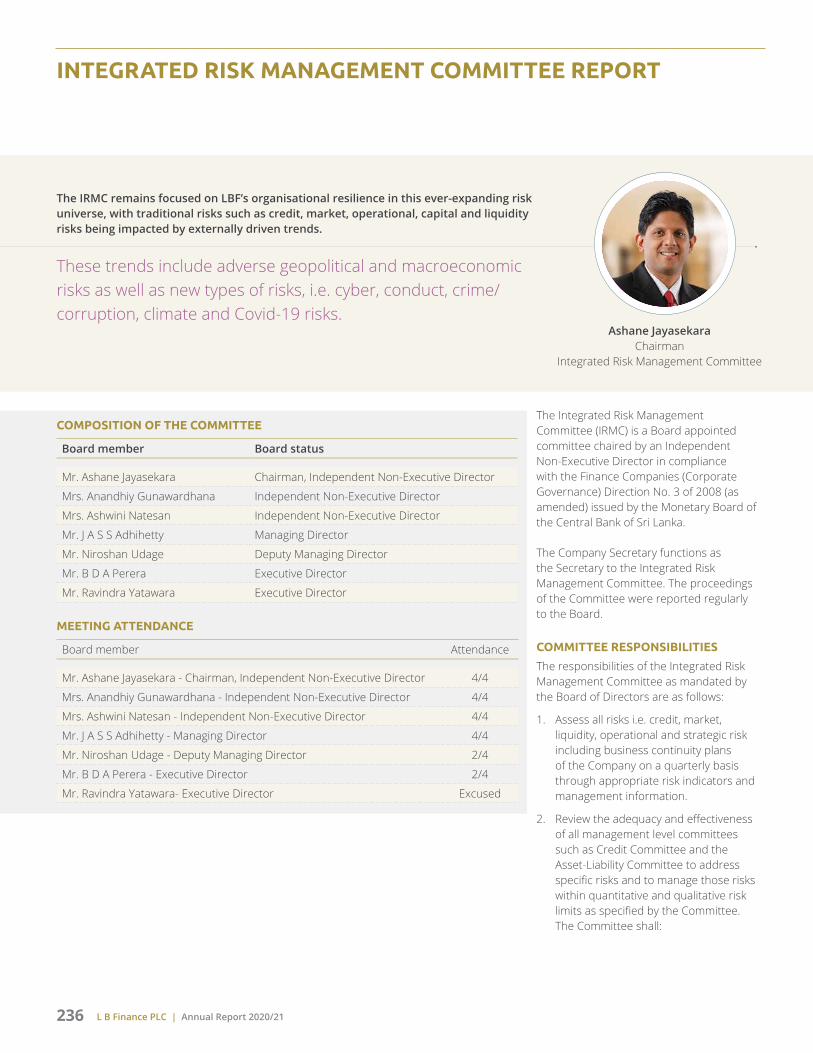
L B Finance PLC | Annual Report 2020/21236
INTEGRATED RISK MANAGEMENT COMMITTEE REPORT
The IRMC remains focused on LBF’s organisational resilience in this ever-expanding risk universe, with traditional risks such as credit, market, operational, capital and liquidity risks being impacted by externally driven trends.
These trends include adverse geopolitical and macroeconomic risks as well as new types of risks, i.e. cyber, conduct, crime/corruption, climate and Covid-19 risks.
Ashane JayasekaraChairman
Integrated Risk Management Committee
The Integrated Risk Management Committee (IRMC) is a Board appointed committee chaired by an Independent Non-Executive Director in compliance with the Finance Companies (Corporate Governance) Direction No. 3 of 2008 (as amended) issued by the Monetary Board of the Central Bank of Sri Lanka.
The Company Secretary functions as the Secretary to the Integrated Risk Management Committee. The proceedings of the Committee were reported regularly to the Board.
COMMITTEE RESPONSIBILITIES
The responsibilities of the Integrated Risk Management Committee as mandated by the Board of Directors are as follows:
1. Assess all risks i.e. credit, market, liquidity, operational and strategic risk including business continuity plans of the Company on a quarterly basis through appropriate risk indicators and management information.
2. Review the adequacy and effectiveness of all management level committees such as Credit Committee and the Asset-Liability Committee to address specific risks and to manage those risks within quantitative and qualitative risk limits as specified by the Committee. The Committee shall:
COMPOSITION OF THE COMMITTEE
Board member Board status
Mr. Ashane Jayasekara Chairman, Independent Non-Executive Director
Mrs. Anandhiy Gunawardhana Independent Non-Executive Director
Mrs. Ashwini Natesan Independent Non-Executive Director
Mr. J A S S Adhihetty Managing Director
Mr. Niroshan Udage Deputy Managing Director
Mr. B D A Perera Executive Director
Mr. Ravindra Yatawara Executive Director
MEETING ATTENDANCE
Board member Attendance
Mr. Ashane Jayasekara - Chairman, Independent Non-Executive Director 4/4
Mrs. Anandhiy Gunawardhana - Independent Non-Executive Director 4/4
Mrs. Ashwini Natesan - Independent Non-Executive Director 4/4
Mr. J A S S Adhihetty - Managing Director 4/4
Mr. Niroshan Udage - Deputy Managing Director 2/4
Mr. B D A Perera - Executive Director 2/4
Mr. Ravindra Yatawara- Executive Director Excused

L B Finance PLC | Annual Report 2020/21 237
a. receive reports from management concerning capital adequacy, asset quality, credit, market, liquidity, operational, new and emerging risks etc in order to oversee the risks and assess their effect on capital levels.
b. receive reports from management concerning resolution of significant risk exposures and risk events, in order to monitor them and, if thought fit, approve them.
3. Take prompt corrective action to mitigate the effects of specific risks in case such risks are at levels beyond the prudent levels, decided by the Board on the basis of the Company’s policies and regulatory and supervisor’s requirements.
4. Take appropriate action against the officers for failure to identify specific risks and take prompt corrective action as recommended by the Committee.
5. Report and recommend to Board of Directors on Risk Management and Compliance related matters seeking the Board’s view, concurrence and /or specific directions.
6. Consider, monitor and approve, as required, the Company’s material strategies, frameworks, plans, policies, processes, models, limits and regulatory requirements in place to govern risk-taking that are consistent with the risk management strategy and the established risk appetite of the Company.
7. Review any issues raised by External Auditors or Internal Audit that may materially impact the Company’s risk management framework or the risk management.
8. Oversee and review the outcomes of stress testing of the risk portfolio, including both scenario analysis and sensitivity analysis for the capital adequacy assessment process and liquidity adequacy assessment process.
9. Oversee the management processes to ensure adherence to the Company’s Risk Management Policy and Procedure.
10. Review the overall and the individual branch level risk reports on a quarterly basis.
COMMITTEE ACTIVITIES DURING THE FINANCIAL YEAR
Credit Risk
Key focus area for the year under review was on the deterioration of credit quality level of the industry due to socioeconomic factors caused by Covid-19 and discussed the measures to be undertaken to improve credit quality.
Local and global macro-economic factors were discussed with a view to identify the impact of such factors on the Company in order to initiate actions in a proactive manner.
Reviewed the activities of the Credit Committee through the assessment of the performance of significant exposures against the Company and internal credit rating.
Reviewed the effectiveness of the current mortgage bond registration process and proposed recommendations to further strengthen the process.
Introduced a comprehensive Credit Risk Management Framework and Policy.
Liquidity and Market Risk
Reviewed the impact of challenges arising from excess liquidity due to the subpar credit growth and celling rates imposed by the CBSL on maximum interest rates.
Reviewed the Gold Price outlook to assess the impact of gold price volatility.
Reviewed the adequacy and effectiveness of ALCO activities by assessing the asset and liability limits, single borrower exposure/single group exposure, single depositor exposure/large depositor exposure, duration of deposits and optimal funding mix.
Reviewed the liquidity position, funding pipeline and liquidity management strategies of the Company.
Information and Cyber Security
Reviewed the adequacy of the existing control environment on protecting confidential / sensitive information of LBF’s customers and recommended further preventive measures to strengthen the process.
Reviewed the IT security aspects in the remote working environment and effectiveness of business continuity planning.
Operational and Human Resource Risks
Introduced a comprehensive Operational Risk Management Framework and Policy and recommended risk appetites for operational risks to the Board.
Reviewed the control environment of operational risks with a special focus on external frauds and work place safety including;
• adequacy of cash in transit / cash in safe
• adequacy of firefighting equipment and fire training
• adequacy and effectiveness of CCTV network coverage and surveillance
• proposed mechanisms to strengthen the security arrangements at branches.
Compliance
Carried out an impact assessment of the Consultation Paper on the Proposed Direction on Corporate Governance.
Introduced and reviewed the methodology of the overall and individual branch level risk scorecards which were developed to meet the requirements of the Finance Business Act No.06 of 2020 on Business Expansion and Operations.
Stability Leadership Strength Agility Responsibility Sustainability Success Supplementary Information
L B Finance PLC | Annual Report 2020/21238
INTEGRATED RISK MANAGEMENT COMMITTEE REPORT
Reviewed the annual risk assessment for existing outsourced activities and new outsourcing arrangements.
Reviewed the annual risk assessment of Money Laundering and Terrorist Financing (ML & TF) risks of the customers, deposit products, lending products, processes and the overall Company.
Assessed the Company’s compliance with laws, regulations and regulatory guidelines, CBSL directions, internal policies in all areas of business operations.
General
Monitored the effectiveness of the risk communication framework in place to escalate the new risks faced by each department in a timely manner and improvements were recommended to streamline the process.
Potential risks arising from recent changes in the business environment were discussed with a view to identify the impact of such events on the achievement of the Company’s objectives and to initiate remedial action in a proactive manner.
Reviewed the KRIs used in FY 2020/21 for their appropriateness for FY 2021/22 in light of the changing business, economic, industry and Company dynamics while recommending prompt corrective measures to mitigate the adverse impacts of key risks.
Reviewed and approved the risk appetite statement of the Company for FY 2021/22.
Reviewed and strengthened the IRMC Charter and the Risk Management Policy of the Company.
Ashane JayasekaraChairmanIntegrated Risk Management Committee
19 May 2021
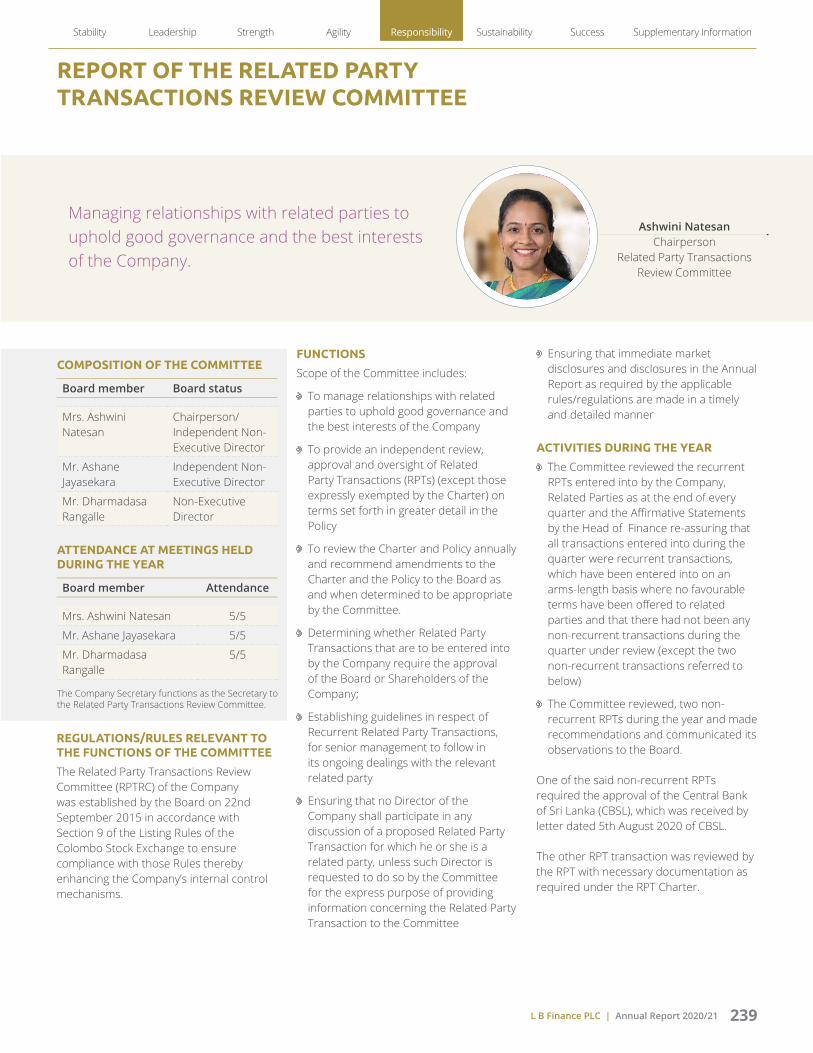
L B Finance PLC | Annual Report 2020/21 239
REPORT OF THE RELATED PARTY TRANSACTIONS REVIEW COMMITTEE
Managing relationships with related parties to uphold good governance and the best interests of the Company.
Ashwini NatesanChairperson
Related Party Transactions Review Committee
REGULATIONS/RULES RELEVANT TO THE FUNCTIONS OF THE COMMITTEE
The Related Party Transactions Review Committee (RPTRC) of the Company was established by the Board on 22nd September 2015 in accordance with Section 9 of the Listing Rules of the Colombo Stock Exchange to ensure compliance with those Rules thereby enhancing the Company’s internal control mechanisms.
COMPOSITION OF THE COMMITTEE
Board member Board status
Mrs. Ashwini Natesan
Chairperson/ Independent Non-Executive Director
Mr. Ashane Jayasekara
Independent Non-Executive Director
Mr. Dharmadasa Rangalle
Non-Executive Director
ATTENDANCE AT MEETINGS HELD DURING THE YEAR
Board member Attendance
Mrs. Ashwini Natesan 5/5
Mr. Ashane Jayasekara 5/5
Mr. Dharmadasa Rangalle
5/5
The Company Secretary functions as the Secretary to the Related Party Transactions Review Committee.
FUNCTIONS
Scope of the Committee includes:
To manage relationships with related parties to uphold good governance and the best interests of the Company
To provide an independent review, approval and oversight of Related Party Transactions (RPTs) (except those expressly exempted by the Charter) on terms set forth in greater detail in the Policy
To review the Charter and Policy annually and recommend amendments to the Charter and the Policy to the Board as and when determined to be appropriate by the Committee.
Determining whether Related Party Transactions that are to be entered into by the Company require the approval of the Board or Shareholders of the Company;
Establishing guidelines in respect of Recurrent Related Party Transactions, for senior management to follow in its ongoing dealings with the relevant related party
Ensuring that no Director of the Company shall participate in any discussion of a proposed Related Party Transaction for which he or she is a related party, unless such Director is requested to do so by the Committee for the express purpose of providing information concerning the Related Party Transaction to the Committee
Ensuring that immediate market disclosures and disclosures in the Annual Report as required by the applicable rules/regulations are made in a timely and detailed manner
ACTIVITIES DURING THE YEAR
The Committee reviewed the recurrent RPTs entered into by the Company, Related Parties as at the end of every quarter and the Affirmative Statements by the Head of Finance re-assuring that all transactions entered into during the quarter were recurrent transactions, which have been entered into on an arms-length basis where no favourable terms have been offered to related parties and that there had not been any non-recurrent transactions during the quarter under review (except the two non-recurrent transactions referred to below)
The Committee reviewed, two non-recurrent RPTs during the year and made recommendations and communicated its observations to the Board.
One of the said non-recurrent RPTs required the approval of the Central Bank of Sri Lanka (CBSL), which was received by letter dated 5th August 2020 of CBSL.
The other RPT transaction was reviewed by the RPT with necessary documentation as required under the RPT Charter.
Stability Leadership Strength Agility Responsibility Sustainability Success Supplementary Information

L B Finance PLC | Annual Report 2020/21240
REPORT OF THE RELATED PARTY TRANSACTIONS REVIEW COMMITTEE
Neither of the above non-recurrent RPTs exceeded the threshold for immediate disclosure to the Colombo Stock Exchange as per the Listing Rules.
POLICIES AND PROCEDURES
The RPTRC operates within the Charter of the Committee as approved by the Board of Directors. It includes a RPT Policy whereby the categories of persons/entities who shall be considered as ‘related parties’ have been identified.
In accordance with the RPT Policy, monthly self-declarations are obtained from each Director for the purpose of identifying parties related to them and such declarations are filed with the Company Secretary. The Company Secretary communicates any changes in the Related Parties to the officer responsible for collation of information on related parties.
The Company uses a RPT System that enables the Company to retrieve data on RPTs throughout the Company’s network. Based on the information furnished in the declarations submitted by the Directors, the database of related parties maintained in the RPT system is continuously updated and the system automatically generates a comprehensive report every quarter for Management’s review, which is also tabled at RPTRC meetings and where necessary, at Board Meetings held after the completion of the relevant quarter. The said report reflects all types of transactions with related parties including general payments, creditors, debtors, savings, fixed deposits and lending.
In its review of RPTs, RPTRC considers the terms and conditions of the RPT, value, and the aggregate value of transactions with the said related party during the financial year, comparison with market pricing etc. in order to determine whether they are carried out on an arm’s length basis, the disclosure requirements as per the Listing Rules of the Colombo Stock Exchange and the level of approval required for the respective RPTs are complied with.
The RPTRC ensures that all transactions with related parties are in the best interests of all stakeholders, with adequate transparency in processes and are in compliance with the Listing Rules.
The Committee has established guidelines in respect of Recurrent RPTs to be followed by the Management of the Company, in the Company’s dealings with related parties.
The Committee has also suggested mechanism that can be followed by the Management of the Company whist reporting that related party transactions are being conducted at arm’s length.
Reviewing and approval of RPTs are either at a meeting of a majority of the members who form the quorum or by circulation, approved by all the members.
The Committee reviewed the Charter and the Policy in April 2021 and noted that they did not require any amendments.
RELATED PARTY TRANSACTIONS/ DISCLOSURES DURING THE YEAR
1. Information on all related parties, as extracted as at the end of each quarter, was presented to the RPTRC and where necessary, to the Board at their meetings held in the immediately following month.
2. All Directors made a monthly declaration, where any transactions entered/to be entered into by the respective Directors and/or any related parties of the said Director were disclosed, which were tabled at the RPTRC.
3. The value of non-recurrent RPTs during the year was below the threshold for immediate disclosure in terms of Rule 9.3.1 of the Listing Rules or disclosure in the Annual Report as per Rule 9.3.2 (a) of the Listing Rules.
4. The aggregate value of recurrent Related Party Transactions entered into during the year was below the threshold for disclosure in the Annual Report as per Rule 9.3.2(b) of the Listing Rules.
5. The aggregate value of all RPTs during the year is disclosed in Note 6.1 to the Financial Statements in terms of LKAS 24 – Related Party Disclosures.
DECLARATION
A declaration by the Board of Directors as an affirmative statement of the compliance with the Listing Rules pertaining to related party transactions is given on page .227 of the Annual Report.
Ashwini NatesanChairpersonRelated Party Transactions Review Committee
19th May 2021

L B Finance PLC | Annual Report 2020/21 241
SUMMARISED RISK MANAGEMENT REPORT
LBF’s strong risk foundations ensured the Company’s performance for the FY 2020/21 was consistent with the expectations. The Company’s overall risk profile remained stable in the FY 2020/21. All key risks continued to be well managed during the year in line with the board-approved risk appetite. However, the notable exception was the higher default risk attributed to the economic uncertainties stemming from the COVID-19 pandemic.
Taking action to address the situation at the outset itself, credit risk protocols were tightened with special emphasis on managing default risk and concentration risk.
Ashane JayasekaraChairmanIntegrated Risk Management Committee
The single most significant risk event detected in all of the FY 2020/21, was the economic and social impact of the COVID-19 pandemic. The pandemic-induced global economic downturn had a cascading effect on the Sri Lankan economy causing some major challenges amidst dwindling export markets and severe disruptions in global trade activity. Moreover, restrictions imposed by the government including the 2-month island-wide lockdown, the closure of the airport for over 10 months, isolation orders and inter-district mobility restrictions issued from time to time, collectively led to muted economic activity in turn applying severe pressure on almost all key sectors of the economy. This has subsequently caused financial stress among the retail, SME and corporate clients which has led to elevated levels of credit risk in the short term. For LBF, this meant having to contend with a higher default risk when compared against last financial years.
Risk Appetite Criteria Appetite Regulatory Limit Actual as at 31st March
2021
Actual as at 31st March
2020
Credit Risk
Loans and Advances
Non-performing loans ratio – Gross 5%-7% 5.36% 3.93%
Non-performing loans ratio – Net < 1.0% 0.10% -0.12%
Exposure to secured loans and advances >95% 97.00% 97.26%
Maximum exposure to single borrower – secured - Individual
<=5% 15% of capital funds 1.67% 1.78%
Maximum exposure to single borrower – secured - Group
<=10% 20% of capital funds 1.67% 1.78%
Maximum exposure to single borrower – unsecured – Individual
<=0.5% 1% of Core capital 0.07% 0.07%
Maximum exposure to aggregate unsecured financing
<=4% 5% of capital funds 0.58% 1.12%
Liquidity Risk
Liquid assets ratio 12.00% Fixed Deposits - 6% Savings -10% Unsecured Borrowings -5%
17.89% 15.65%
Deposits renewal ratio >=75% 83.52% 87.87%
Maximum single depositor/group exposure <=5% of total deposits 2.10% 2.68%Maximum exposure to large deposits (Over Rs.50 mn) <=20% of total deposits 18.06% 20.23%
Stability Leadership Strength Agility Responsibility Sustainability Success Supplementary Information
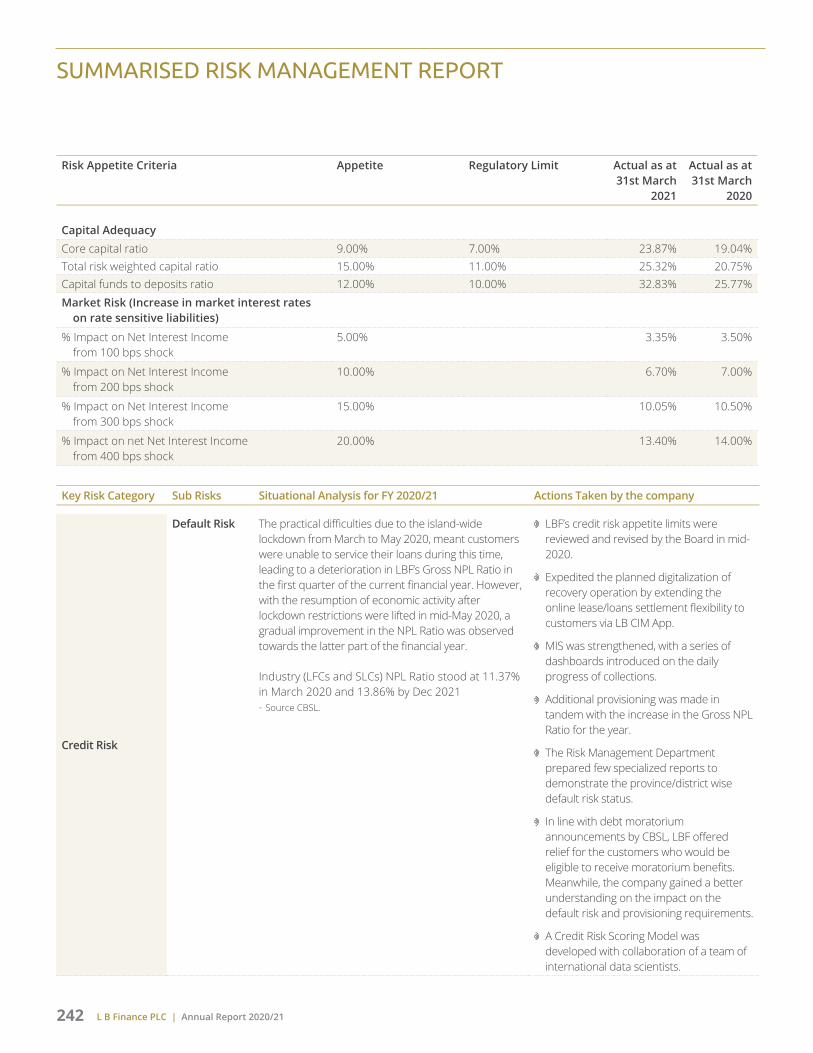
L B Finance PLC | Annual Report 2020/21242
Key Risk Category Sub Risks Situational Analysis for FY 2020/21 Actions Taken by the company
Credit Risk
Default Risk The practical difficulties due to the island-wide lockdown from March to May 2020, meant customers were unable to service their loans during this time, leading to a deterioration in LBF’s Gross NPL Ratio in the first quarter of the current financial year. However, with the resumption of economic activity after lockdown restrictions were lifted in mid-May 2020, a gradual improvement in the NPL Ratio was observed towards the latter part of the financial year.
Industry (LFCs and SLCs) NPL Ratio stood at 11.37% in March 2020 and 13.86% by Dec 2021 - Source CBSL.
LBF’s credit risk appetite limits were reviewed and revised by the Board in mid-2020.
Expedited the planned digitalization of recovery operation by extending the online lease/loans settlement flexibility to customers via LB CIM App.
MIS was strengthened, with a series of dashboards introduced on the daily progress of collections.
Additional provisioning was made in tandem with the increase in the Gross NPL Ratio for the year.
The Risk Management Department prepared few specialized reports to demonstrate the province/district wise default risk status.
In line with debt moratorium announcements by CBSL, LBF offered relief for the customers who would be eligible to receive moratorium benefits. Meanwhile, the company gained a better understanding on the impact on the default risk and provisioning requirements.
A Credit Risk Scoring Model was developed with collaboration of a team of international data scientists.
Risk Appetite Criteria Appetite Regulatory Limit Actual as at 31st March
2021
Actual as at 31st March
2020
Capital AdequacyCore capital ratio 9.00% 7.00% 23.87% 19.04%Total risk weighted capital ratio 15.00% 11.00% 25.32% 20.75%Capital funds to deposits ratio 12.00% 10.00% 32.83% 25.77%Market Risk (Increase in market interest rates
on rate sensitive liabilities)
% Impact on Net Interest Income from 100 bps shock
5.00% 3.35% 3.50%
% Impact on Net Interest Income from 200 bps shock
10.00% 6.70% 7.00%
% Impact on Net Interest Income from 300 bps shock
15.00% 10.05% 10.50%
% Impact on net Net Interest Income from 400 bps shock
20.00% 13.40% 14.00%
SUMMARISED RISK MANAGEMENT REPORT

L B Finance PLC | Annual Report 2020/21 243
Key Risk Category Sub Risks Situational Analysis for FY 2020/21 Actions Taken by the company
Concentration risk
With many customers reluctant to borrow amidst widespread economic uncertainty, the demand for large scale facilities declined significantly in FY 2020/21. The Company also followed a cautious approach in lending large scale facilities. Meanwhile on the back of the vehicle import ban, the demand for leasing of unregistered vehicles also slumped during the financial year. However, the market appeared to correct itself in the latter part of the financial year leading to a surge in demand for registered vehicle leases, a trend that was seen for the remainder of the financial year. A strong demand for the Gold Loans was seen in FY 2020/21 as the product continues to gain traction as a mainstream financial solution. The upward movement in world gold prices helped to further bolster the demand for Gold Loans throughout the current financial year.
Realigning with the market by promoting leasing and auto financing as a solution for registered vehicles.
Improving portfolio diversity by increasing the skew towards Gold Loans.
Continuous and ongoing monitoring of all portfolios, sectors / geographical thresholds to detect the likelihood of higher concentration or overexposure.
Stress testing at the total portfolio and sub-portfolio level, to assess the impact of changing economic conditions on LBF’s asset quality, earnings performance, capital adequacy and liquidity.
Liquidity Risk
The Company continued to maintain adequate liquidity throughout the year, ensuring that sufficient funds were available to meet sudden/unforeseen funding requirements such as Fixed Deposit withdrawals. However, withdrawals were not high as the expected levels which exhibited the trust placed on the Company’s stability. Company has maintained high liquidity buffer than the average levels throughout the year.
This was mainly due to the following reasons;
The Company further strengthened its funding pipeline to withstand liquidity related shocks which would have arisen due to debt moratoriums announce by CBSL.
The credit slump created by the pandemic induced economic downturn leading to the lack of viable lending opportunities compared to previous years.
The high renewal rate for existing deposits and the steady inflow of new deposits in spite of the low interest rate environment.
The CBSL’s decision to lower the Statutory Liquid Asset ratio applicable to NBFIs from April 2020.
The CBSL’s decision to reduce the statutory minimum threshold for investments held in government securities by NBFIs.
The Risk management Department prepared a comprehensive cash flow analysis to assess the impact on cash flows under stressed conditions, in particular by taking into consideration the lower cash inflows from customers during the moratorium period. The findings were presented to the ALCO and to the relevant Board Sub-Committees.
Based on the findings of the cash flow analysis a series of early warning signals were implemented to ensure the LBF’s liquidity position continues to be consistently well managed under both normal and stressed conditions.
Realigned the funding mix by systematically replacing large deposits in with higher number of more sustainable smaller-ticket deposits (More details on page 103 - Deposits).
Stability Leadership Strength Agility Responsibility Sustainability Success Supplementary Information

L B Finance PLC | Annual Report 2020/21244
SUMMARISED RISK MANAGEMENT REPORT
Key Risk Category Sub Risks Situational Analysis for FY 2020/21 Actions Taken by the company
Market Risk
Interest Rate Risk
The CBSL cut down the policy interest rates on two consecutive occasions in 2020, in order to stimulate credit growth of pandemic affected economy of the country. Thus, the Company too brought down its lending rates in tandem with the market. Further, the interest rates of bank borrowings with variable rates structure declined in FY 2020/21. On the other hand, the treasury bill rate pegged ceiling rate on deposits also came down and repriced the deposit base at a lower interest rate. Hence, the Company had a blended impact on its NII during the financial year.
Strategic repricing of assets to reflect the current market interest rates environment.
Reduce the rate sensitivity of the funding base by shedding high cost deposits and increasing the share of savings deposits which by nature are less rate sensitive.
Promote lending products with shorter repricing cycle to reduce interest rate sensitive gaps.
Commodity Price Risk
The global price for gold faced many fluctuations during the year under review owing to factors such as world economic downturn due to COVID-19, the US presidential elections, success rate of COVID-19 vaccines, trade war between the US and China, changes in the US treasury yields etc. In August 2020, gold price spiked to USD 2070 and thereafter showed a slight declining trend towards the end of the year. The local price for gold remained stable despite the slight moderation of global prices due to elevated demand for recycled gold caused by import restrictions. Therefore, with the price being stable in local market, a surge in demand for gold backed lending was seen throughout the year.
Strategically realigning the gold loan product to take advantage of the upward movement in world gold prices.
VaR calculation methodology was further strengthened based on new assumptions. This was done with the intention of introducing a dynamic provisioning based on more accurate predictive analysis.
Visit web page to read our full Integrated Risk Management report

L B Finance PLC | Annual Report 2020/21 245
C H A P T E R
06Sustainability
A Sustainable Journey Our path is fuelled by sustainable
principles and efficient management of resources – ensuring the continuity
of people, profit and planet
Sustainability hot topics 246
Consolidated set of IR standards 252

L B Finance PLC | Annual Report 2020/21246
SUSTAINABILITY HOT TOPICS
We explore key global trends impacting businesses as they transition towards a more sustainable economy. In our observations we have seen continued political instability, more pronounced climate impacts and accelerating rates of biodiversity loss to be some of the major sustainability concerns globally. While the scale and complexity of the sustainability challenges we face is daunting, there is also reason for optimism for we are witnessing unprecedented leadership and innovation driven by governments and corporations, rising activism to raise awareness about issues such as plastic pollution.
As a financial services institution, LBF strives to lead the way in finding solutions to the challenges of these key sustainability by:
Developing accessible products and services and driving innovation to promote greater financial inclusion
Offering customised financing solutions to address environmental and social challenges
Supporting the transition to a more sustainable economy and managing our impacts on the environment
Supporting fair and equitable procurement in order to drive economic growth and job creation
Helping people gain access to education as well as skills development through high quality training initiatives
Contributing to the stability of the financial services system though sound governance, ethical conduct, fraud and data security and the prevention of money laundering and terrorism financing
Providing employment free from discrimination and in compliance accordance with fair labour practices
Ensuring the wellbeing of employees
Supporting greater inclusivity in the workplace by reduce the gender parity at all levels of the operation
Global trend LBF context
Technology-driven organizations are more sustainable
Technology in the workplace is no longer considered to be for the privileged few, but rather a part of a standard infrastructure of an efficient and progressive organisation. Technology adoption is something that employers are increasingly embracing. Of late more and more corporations have begun migrating to digital technology to fuel growth in a more sustainable way.
LB Finance Center for Technology & Innovation (CTI) was set up in mid 2020 with the aim of strengthening our MIS framework. The CTI is tasked with using machine learning tools and advanced data analytics to disseminate the large volume of data generated on a daily basis, in ways that could contribute towards increasing revenue, improve efficiency, effectiveness and productivity, ultimately leading to a positive impact on the LBF’s overall profitability.
Global trend LBF context
Information security threats
The downside of technology use is that it leads to a higher risk of information leakage and cyber threats. Companies have become increasingly vulnerable to cyber attacks, especially as hackers too are seemingly becoming more sophisticated.
LBF’s information security architecture, including system controls, policies and procedures, all stem from the best practices outlined by the ISO 27001:2013. The Company adopted the ISO 27001:2013 Information Security Standard in which has since been renewed twice. The most recent renewal cycle covers LBF’s information security systems.
Global trend LBF context
Sustainability = community
Corporates have been playing an increasingly active role in supporting their local communities as a sustainable and strategic business practice. These initiatives continue to play a vital role in supporting the broader efforts of governments towards achieving a more sustainable future.
As a responsible corporate citizen, LBF leverages on its position as a leading financial services institution and aims to contribute towards social and economic development on a regular basis. Our current projects are in the following areas;
Access to education and knowledge sharing: to eliminate the persistent knowledge disparity that exists in Sri Lanka by strengthening the quality education at primary, secondary and tertiary levels
Community empowerment: to provide the necessary guidance and support to mound a new generation of innovators, business professionals and corporate leaders
Thuru Wawamu greening Sri Lanka initiative: aims to plant 50,000 trees in the Sri Lankan by end of 2021, to increase the Country’s forest cover

L B Finance PLC | Annual Report 2020/21 247
OUR CSR JOURNEY
CSR journey more focus on digital (According to digitalization strategy we conduct several CSR programmes in the social media platform)
OUR CSR JOURNEY AND LEVEL OF PRIORITY
Philonthropic CSR
Strategic CSRStrategic CSR
Strategic CSR
Digital driven CSR
Philonthropic CSR
Business driven CSR
Strategic CSRPhilonthropic CSR
Philonthropic CSRPhilonthropic CSR
1971-1990 1991-2000 2001-2010 2011-2019 2020 onwards
SUSTAINABILITY GOALS AND PERFORMANCE
LBF identify and communicate goals for those charge with and monitor the progress of ongoing projects, at the end of the year.
Performance summary – Describe progress towards the goals and any changes made to boost
CSR Project Investment in CSR activities
LKR
Volunteer hours
Engagement type
Sustainable development goals
LB preschool development project 750,000 427 Pro bono
Christmas with LB - Children programme 45,000 96 In-kind
Puzzle competition for kids - Children day 50,000 144 In-kind
Digital classroom 180,000 184 Pro bono
LB Divi Jaya - Empowering startups/ women entrepreneurs 380,000 624 Pro bono
Distribution of dry rations for police members 114,000 47 In-kind
Distribution of dry rations for underprivileged people in Myanmar 587,500 79 In-kind
Blood donation campaign 20,000 161 Pro bono
Free distribution of KN95 masks to underprivileged people 20,000 114 In-kind
Relief financial difficulties with LB 35,000 77 In-kind
LB Auto review awareness progamme 744,000 509 Pro bono
Equipments donations to national hospitals on COVID-19 21,625,000 97 In-kind
Donation to early childhood development centre 93,446 81 In-kind
Develop the soft skills and technical skills of the fresh graduations 3,851,117 2,183 Pro bono
*in-kind - in goods or services as opposed to money
Pro bono- work undertaken voluntarily and without payment or at a reduced fee as a public service
Stability Leadership Strength Agility Responsibility Sustainability Success Supplementary Information
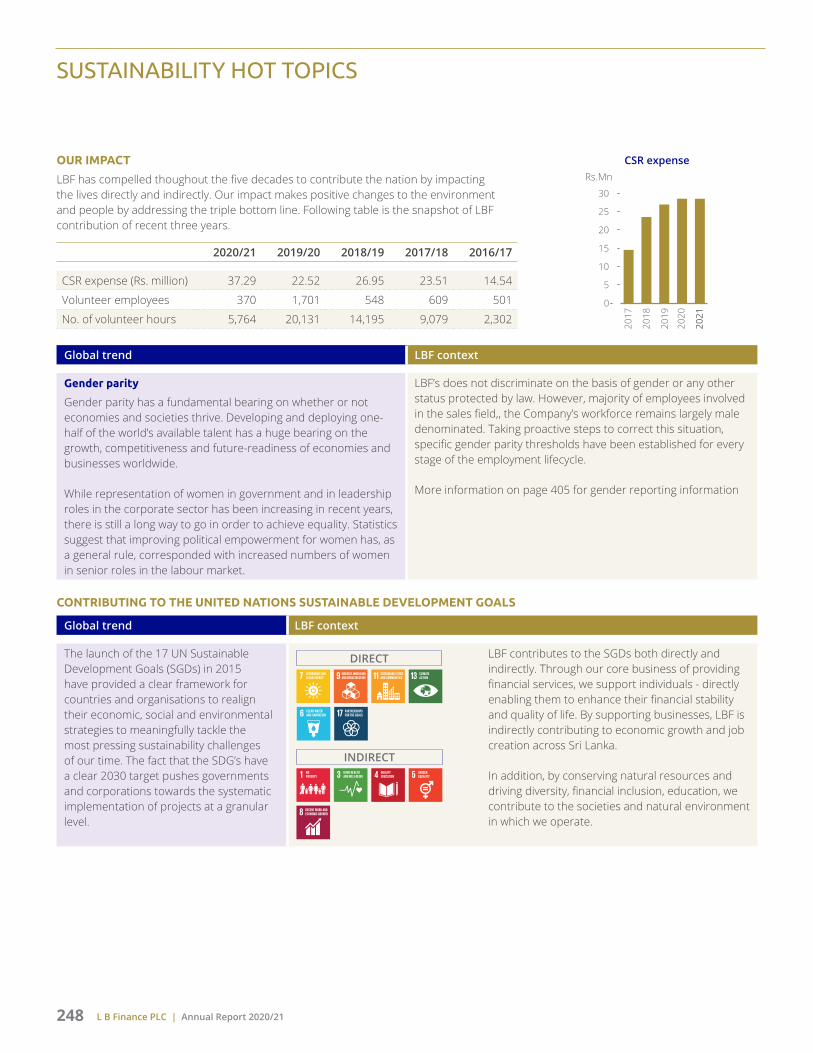
L B Finance PLC | Annual Report 2020/21248
SUSTAINABILITY HOT TOPICS
OUR IMPACT
LBF has compelled thoughout the five decades to contribute the nation by impacting the lives directly and indirectly. Our impact makes positive changes to the environment and people by addressing the triple bottom line. Following table is the snapshot of LBF contribution of recent three years.
2020/21 2019/20 2018/19 2017/18 2016/17
CSR expense (Rs. million) 37.29 22.52 26.95 23.51 14.54
Volunteer employees 370 1,701 548 609 501
No. of volunteer hours 5,764 20,131 14,195 9,079 2,302
CSR expense
0
5
10
15
20
25
30
2018
2017
2019
2020
2021
Rs.Mn
Global trend LBF context
Gender parity
Gender parity has a fundamental bearing on whether or not economies and societies thrive. Developing and deploying one-half of the world’s available talent has a huge bearing on the growth, competitiveness and future-readiness of economies and businesses worldwide.
While representation of women in government and in leadership roles in the corporate sector has been increasing in recent years, there is still a long way to go in order to achieve equality. Statistics suggest that improving political empowerment for women has, as a general rule, corresponded with increased numbers of women in senior roles in the labour market.
LBF’s does not discriminate on the basis of gender or any other status protected by law. However, majority of employees involved in the sales field,, the Company’s workforce remains largely male denominated. Taking proactive steps to correct this situation, specific gender parity thresholds have been established for every stage of the employment lifecycle.
More information on page 405 for gender reporting information
CONTRIBUTING TO THE UNITED NATIONS SUSTAINABLE DEVELOPMENT GOALS
Global trend LBF context
The launch of the 17 UN Sustainable Development Goals (SGDs) in 2015 have provided a clear framework for countries and organisations to realign their economic, social and environmental strategies to meaningfully tackle the most pressing sustainability challenges of our time. The fact that the SDG’s have a clear 2030 target pushes governments and corporations towards the systematic implementation of projects at a granular level.
LBF contributes to the SGDs both directly and indirectly. Through our core business of providing financial services, we support individuals - directly enabling them to enhance their financial stability and quality of life. By supporting businesses, LBF is indirectly contributing to economic growth and job creation across Sri Lanka.
In addition, by conserving natural resources and driving diversity, financial inclusion, education, we contribute to the societies and natural environment in which we operate.
DIRECT
INDIRECT

L B Finance PLC | Annual Report 2020/21 249
OUR CAPITAL REPORTING PRACTICES AND RELEVANCE TO SDGS
Inputs Outcomes Page references Related SDGs
Monetary investment Monetary gains/savings 116
Management hours Employee benefits & living standards 154
Physical infrastructure & materials Sustainability & longevity of infrastructure
144
Knowledge investment Knowledge enhancement 166
Partnerships Community inclusion and well-being 176
Natural resources Protection/optimization of resources 196
OUR SUSTAINABLE RESOURCE ALLOCATION PRACTICES AND RELEVANCE TO SDGS
Project G1 G2 G3 G4 G5 G6 G7 G8 G9 G10 G11 G12 G13 G14 G15 G16 G17
Special attention for women empowerment
Community initiatives
Capacity development
Skill development
Green lending practices
Green initiative
Sustainable business expansion
Digital literacy
G - United Nations Sustainable Development Goals
Stability Leadership Strength Agility Responsibility Sustainability Success Supplementary Information

L B Finance PLC | Annual Report 2020/21250
SUSTAINABILITY HOT TOPICS
OUR 2030 SUSTAINABILITY AMBITIONS
We have defined a new set of ambitions with a 2030 vision to strengthen LBF’s commitment to build a better world and help to alleviate some of the biggest challenges that communities are facing today
Focus area KPIs 2015Where
we were
2021Where we are
2025Where
we will be
Link to the SDGs
Wealth generation Economic value generation H H H
Customer centricity Smarter business solutions H H H
Workforce utilization Outlet per employee H H H
Climate changesReduction of carbon footprint of the company
L H H
Brand visibility Brand value H H H
Gender parity Men : Women ratio L M M
Community engagementCommunity engagement for the CSR activities
H H H
Supplier management Supplier screen assessment
L M M
Up hold governance and compliance
Governance and compliance training programmes
M M M
ICT involvement Invest for ICT M H L
High impact Medium impact Low impactH M L

L B Finance PLC | Annual Report 2020/21 251
OUR MATERIAL DETERMINATION PROCESS
We consider matters to be Material if they have the potential to substantially alter our strategic direction or impact our ability to fulfill our commitment to create and sustain value for our stakeholders over the short, medium and long-term. Identifying our Material Themes therefore goes hand in hand with our integrated decision-making approach.
QUALITATIVE ANALYSIS
Interview with external experts
Social networks
Value chain
Industry trends
Researches and surveys
QUANTITATIVE ANALYSIS
External External
Sector reports
Regulatory frameworks
Voluntary frameworks
Materiality of peers
Research agencies
Sustainability committee
Internal workshops
Company goals
Management directions
Internal business analysis
QUANTITATIVE QUANTITATIVE
Identify KPIs set by the Sustainability Committee
Regulatory frameworks
Issues raised stakeholders
Business requirements and Risk Management
Prioritization
ValidationEvaluation
Material matters and practices that allow materiality identification through integrated thinking
Pursuing sustainable
business growth
amidst socio economic
uncertainty
Becoming more customer-centric
Managing social and
environmental inequalities
Developing a highly
engaged, satisfied and
motivated workforce
Demand for stricter
governance, tighter regulatory
control and improved risk management
Technological advancement
and higher competitive
pressure
Stability Leadership Strength Agility Responsibility Sustainability Success Supplementary Information

L B Finance PLC | Annual Report 2020/21252
CONSOLIDATED SET OF IR STANDARDS
Ref. no
Particulars Page Reference
Chapter/Section Reference
1 ELEMENTS OF AN INTEGRATED REPORT
1.1 Organizational overview and external environment
An integrated report should disclose the main activities of the organization and the environment in which it operates
4 - 8, 50 - 51, 88 - 97, 18
About the report, Business model, Our business environment and outlook, Product portfolio, Risk management
An integrated report should identify the organization’s mission and vision, and provides essential context by identifying matters
14 Vision, Mission, Values and Goals statements
The organization’s:
Culture, ethics and values 14, 416 - 417 Organisational values, Organisational hierarchy
Ownership and operating structure including size of the organization, location of its operations
16 - 17 About us, Organisational structure
Principal activities and markets 50 - 51, 18 Business model, Product portfolio
Competitive landscape and market positioning 98 Company SWOT
Position within the value chain and its process 186 - 187 Social and relationship capital- business partners
Key quantitative information (Employees/Operating results /Highlights)
50 - 51 Business model
Significant factors affecting the external environment and the organization’s response
28 - 31, 16 - 17 Financial and non-financial highlights, About us
The legitimate needs and interests of key stakeholders 88 - 97, 36 - 39 Our business environment and outlook, Managing director’s review
Macro and micro economic conditions, such as economic stability, globalization, and sustainability / industry trends
52 - 61 Integrated stakeholder engagement
Market forces, such as the relative strengths and weaknesses of competitors and customer demand
32 - 35, 88 - 97 Chairperson’s statement, Our business environment and outlook
Environmental challenges, such as climate change, the loss of ecosystems, and resource shortages as planetary limits are approached
166 - 175 Intellectual capital
The legislative and regulatory environment in which the organization operates
176 - 195 Social and relationship capital
1.2 Governance
An integrated report should show how the organization’s governance structure supports its ability to create value in the short, medium and long term
50 - 51, 74 - 81, 207 - 222
Business model, Delivering our strategy and resource allocation, Corporate governance
An integrated report needs to provide an insight about its ability to create value
50 - 51, 74 - 81 Business model, Delivering our strategy and resource allocation
The organization’s leadership structure, including the skills and diversity
40 - 43, 207 - 222
Profile of the Board of directors, Statement of corporate governance
Mandatory and voluntary code of corporate governance adopted by the Company
207 - 222 Corporate governance tables
Code of ethical conduct adopted by the Company in relation to ethical business
207 - 222 Statement of corporate governance - Ethics and Compliance

L B Finance PLC | Annual Report 2020/21 253
Ref. no
Particulars Page Reference
Chapter/Section Reference
Specific processes used to make strategic decisions and to establish and monitor the culture of the organization, including its attitude to risk and mechanisms for addressing integrity and ethical issues
236 - 238 Integrated risk management committee report
Governance have taken to influence and monitor the strategic direction of the organization and its approach to risk management
236 - 238 Integrated risk management committee report
How the organization’s culture, ethics and values are reflected in its use of and effects on the capitals, including its relationships with key stakeholders
207 - 222 Corporate governance
Whether the organization is implementing governance practices that exceed legal requirements / Key Policies
116 - 204 Capital reports
The responsibility those charged with governance take for promoting and enabling innovation
207 - 222 Corporate governance
How remuneration and incentives are linked to value creation in the short, medium and long term, including how they are linked to the organization’s use of and effects on the capitals
- Not reported
1.3 Stakeholder Identification/relationships
An integrated report should identify its key stakeholders and provide insight into the nature and quality of the organization’s relationships with its key stakeholders,
52 - 61 Integrated stakeholder engagement
At what extent the organization understands 52 - 61 Integrated stakeholder engagement
Takes into account and responds to their legitimate needs and interest
52 - 61 Integrated stakeholder engagement
Disclose the following in their integrated reports in respect of stakeholder relationships:
52 - 61 Integrated stakeholder engagement
How the company has identified its stakeholders 52 - 61 Integrated stakeholder engagement
Stakeholder engagement methodology 52 - 61 Integrated stakeholder engagement
Identification of material matters of stakeholders 66 - 73, 52 - 61 Materiality determination, Integrated stakeholder engagement
How the Company has applied such matters 66 - 73, 52 - 61 Materiality determination, Integrated stakeholder engagement
How the stakeholders are engaged in assessing impacts, implications and outlook unrespects of Company’s business model
66 - 73, 52 - 61 Materiality determination, Integrated stakeholder engagement
Capitals
An integrated report needs to provide insight about the resources and the relationships used and affected by the organization
116 - 204, 74 - 83
Capital reports, Delivering our strategy and resource allocation
How the organization interacts with the capitals to create value over the short, medium and long term
116 - 204, 50 -51
Capital reports, Business model
An integrated report need to identify the various forms of capitals which are essential for the success of its business operations
116 - 204, 50 -51
Capital reports, Business model
Stability Leadership Strength Agility Responsibility Sustainability Success Supplementary Information

L B Finance PLC | Annual Report 2020/21254
CONSOLIDATED SET OF IR STANDARDS
Ref. no
Particulars Page Reference
Chapter/Section Reference
Financial Capital -The pool of funds that is available to the organization for use in the production of goods or provision of services
116 - 143 Financial capital
Manufacturing Capital - Manufactured physical objects that are available to the organization for use in the production of goods and provision of services
144 - 153 Manufactured capital
Intellectual Capital - Organizational Knowledge based intangibles
166 - 175 Intellectual capital
Human Capital - People’s competencies, capabilities and experience, and their motivations to innovate
154 - 165 Human capital
Social & Relationship Capital - The institutions and the relationships within and between communities, groups of stakeholders and other networks and collective wellbeing
176 - 195 Social and relationship capital
Natural Capital - All renewable and non-renewable environmental resources and processes that provide goods and services that support the past, current and future prosperity of the organization
196 - 204 Natural capital
1.4 Business model
An integrated report should describe the organization’s business model
An integrated report need to describe the business model, including key:
Inputs
Business activities
Outputs
Outcomes
50 - 51 Value creation process, Business model
Features that can enhance the effectiveness and readability of the description of the business model include:
Explicit identification of the key elements of the business model
A simple diagram highlighting key elements, supported by a clear explanation of the relevance of those elements to the organization
50 -51 Business model
Narrative flow that is logical given the particular circumstances of the organization
50 - 51 Business model
Identification of critical stakeholder and other dependencies and important factors affecting the external environment
52 - 61 Integrated stakeholder engagement
Connection to information covered by other Content Elements, such as strategy, risks and opportunities, and performance
50 - 51, 74 - 83 Business model, Delivering our strategy and resource allocation

L B Finance PLC | Annual Report 2020/21 255
Ref. no
Particulars Page Reference
Chapter/Section Reference
Inputs
An integrated report shows how key inputs relate to the capitals on which the organization depends, or that provide a source of differentiation for the organization
50 - 51 Business model
Business activities
An integrated report describes key business activities. This can include:
How the organization differentiates itself in the market place
50 - 51, 102 - 115
Business model, Delivering our strategy through business clusters
How the organization approaches the need to innovate 50 -51, 102- 115
Business model, Delivering our strategy through business clusters
How the business model has been designed to adapt to change
74 - 83 Delivering our strategy and resource allocation
Outputs
An integrated report identifies an organization’s key products and services.
There might be other outputs, such as by-products and waste (including emissions), that need to be discussed within the business model disclosure depending on their materiality
102 - 115 Delivering our strategy through business clusters
Outcomes
Both internal outcomes and external outcomes
Both internal outcomes and negative outcomes
50 - 51 Business model
1.5 Performance
An integrated report needs to explain the extent to which the organization has achieved its strategic objectives for the period and what are its outcomes in terms of effects on the capitals?
30 - 31 Non-financial highlights
An integrated report should contain qualitative and quantitative information such as:
Quantitative indicators with respect to targets and risks and opportunities,
Explaining their significance, their implications, and the methods and
Assumptions used in compiling them
30 - 31 Non-financial highlights
The organization’s effects (both positive and negative) on the capitals, including material effects on capitals up and down the value chain
66 - 73 Materiality determination
The state of key stakeholder relationships and how the organization has responded to key stakeholders’ legitimate needs and interests
176 - 195 Social and relationship capital
Stability Leadership Strength Agility Responsibility Sustainability Success Supplementary Information
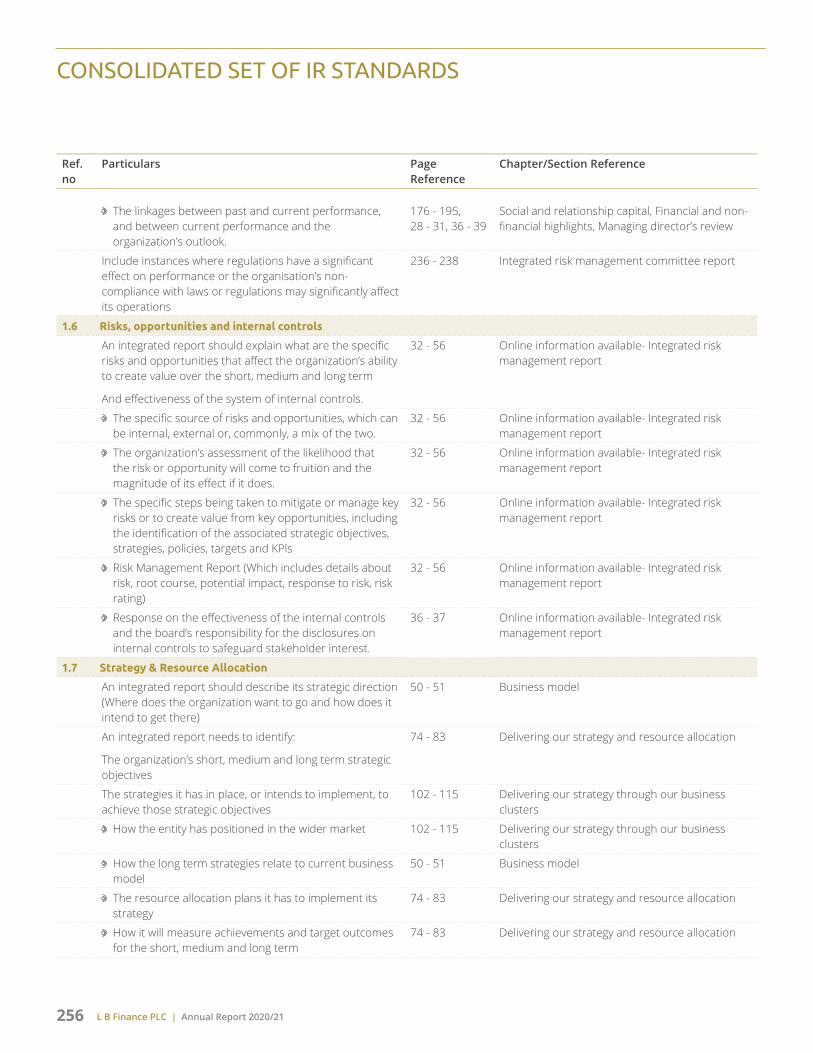
L B Finance PLC | Annual Report 2020/21256
CONSOLIDATED SET OF IR STANDARDS
Ref. no
Particulars Page Reference
Chapter/Section Reference
The linkages between past and current performance, and between current performance and the organization’s outlook.
176 - 195, 28 - 31, 36 - 39
Social and relationship capital, Financial and non-financial highlights, Managing director’s review
Include instances where regulations have a significant effect on performance or the organisation’s non-compliance with laws or regulations may significantly affect its operations
236 - 238 Integrated risk management committee report
1.6 Risks, opportunities and internal controls
An integrated report should explain what are the specific risks and opportunities that affect the organization’s ability to create value over the short, medium and long term
And effectiveness of the system of internal controls.
32 - 56 Online information available- Integrated risk management report
The specific source of risks and opportunities, which can be internal, external or, commonly, a mix of the two.
32 - 56 Online information available- Integrated risk management report
The organization’s assessment of the likelihood that the risk or opportunity will come to fruition and the magnitude of its effect if it does.
32 - 56 Online information available- Integrated risk management report
The specific steps being taken to mitigate or manage key risks or to create value from key opportunities, including the identification of the associated strategic objectives, strategies, policies, targets and KPls
32 - 56 Online information available- Integrated risk management report
Risk Management Report (Which includes details about risk, root course, potential impact, response to risk, risk rating)
32 - 56 Online information available- Integrated risk management report
Response on the effectiveness of the internal controls and the board’s responsibility for the disclosures on internal controls to safeguard stakeholder interest.
36 - 37 Online information available- Integrated risk management report
1.7 Strategy & Resource Allocation
An integrated report should describe its strategic direction (Where does the organization want to go and how does it intend to get there)
50 - 51 Business model
An integrated report needs to identify:
The organization’s short, medium and long term strategic objectives
74 - 83 Delivering our strategy and resource allocation
The strategies it has in place, or intends to implement, to achieve those strategic objectives
102 - 115 Delivering our strategy through our business clusters
How the entity has positioned in the wider market 102 - 115 Delivering our strategy through our business clusters
How the long term strategies relate to current business model
50 - 51 Business model
The resource allocation plans it has to implement its strategy
74 - 83 Delivering our strategy and resource allocation
How it will measure achievements and target outcomes for the short, medium and long term
74 - 83 Delivering our strategy and resource allocation

L B Finance PLC | Annual Report 2020/21 257
Ref. no
Particulars Page Reference
Chapter/Section Reference
The linkage between the organization’s Strategy & Resource Allocation and the information covered by other Content Elements, including
Relationship with the organization’s business model
What changes to that business model might be necessary to implement chosen strategies to provide an understanding of the organization’s ability to adapt to change
Respond to the external environment and the identified risks and opportunities affect the capitals, and the risk management arrangements related to those capitals
74 - 83, 50 - 51, 116, 144, 154, 166, 176, 196
Delivering our strategy and resource allocation, Business model,
What differentiates the organization to give it competitive advantage and enable it to create value, such as:
The role of innovation
How the organization develops and exploits intellectual capital
The extent to which environmental and social considerations have been embedded into the organization’s strategy to give it a competitive advantage
Key features and findings of stakeholder engagement that were used in formulating its Strategy & Resource Allocation plans.
166 - 175, 74 - 83
Intellectual capital, Delivering our strategy and resource allocation
1.8 Outlook
An integrated report should explain what challenges and uncertainties is the organization likely to encounter in pursuing its strategy, and what are the potential implications for future performance?
116 - 204, 39
Capital reports, Managing director’s review- Going forward
An integrated report should highlight anticipated changes over time and provides information on:
The organization’s expectations about the external environment the organization is likely to face in the short, medium and long term
How that will affect the organization
How the organization is currently equipped to respond to the critical challenges and uncertainties that are likely to arise.
88 - 97, 74 - 83
Our business environment and outlook, Delivering our strategy and resource allocation
The discussion of the potential implications, including implications for future financial performance may include:
The external environment, and risks and opportunities, with an analysis of how these could affect the achievement of strategic objectives
88 - 97 Our business environment and outlook
Stability Leadership Strength Agility Responsibility Sustainability Success Supplementary Information

L B Finance PLC | Annual Report 2020/21258
CONSOLIDATED SET OF IR STANDARDS
Ref. no
Particulars Page Reference
Chapter/Section Reference
An integrated report may also provide lead indicators and sensitivity analyses. If forecasts or projections are included in reporting the organization’s
Outlook
Summary of related assumptions is useful Comparisons of actual performance to previously identified targets further enables evaluation of the current outlook
116 - 204, 50 - 51, 32 - 56
Capital reports, Business model, Online information available- Integrated risk management report
Disclosures about an organization’s outlook in an integrated report should consider the legal or regulatory requirements to which the organization is subject
4 - 8 About the report
1.9 Basis of preparation and presentation
An integrated report should answer the question: How does the organization determine what matters to include in the integrated report and how are such matters quantified or evaluated,
66 - 73 Materiality determination
An integrated report describes its basis of preparation and presentation, including:
A summary of the organization’s materiality determination process
66 - 73 Materiality determination
Brief description of the process used to identify relevant matters, evaluate their importance and narrow them down to material matters
66 - 73 Materiality determination
Identification of the role of those charged with governance and key personnel in the identification and prioritization of material matters.
66 - 73 Materiality determination
A description of the reporting boundary and how it has been determined
4 - 8 About the report- scope and boundaries
Eg: Include process used for identifying the reporting boundary, geographic scope, the entities represented in the report and the nature of the information provided for each entity
A summary of the significant frameworks and methods used to quantify or evaluate material matters
66 - 73 Materiality determination
(e.g., the applicable financial reporting standards used for compiling financial information, a company-defined formula for measuring customer satisfaction, or an industry based framework for evaluating risks).
2 RESPONSIBILITY FOR AN INTEGRATED REPORT
An integrated report should include a statement from those charged with governance that includes:
206 Corporate governance- Chairperson’s message
An acknowledgement of their responsibility to ensure the integrity of the integrated report

L B Finance PLC | Annual Report 2020/21 259
Ref. no
Particulars Page Reference
Chapter/Section Reference
An acknowledgement that they have applied their collective mind to the preparation and presentation of the integrated report
Their opinion or conclusion about whether the integrated report is presented in accordance with the Framework
3 OTHER QUALITATIVE CHARACTERISTICS OF AN INTEGRATED REPORT
3.1 Conciseness
An integrated report should be concise.
An integrated report need to include sufficient context to understand the organization’s strategy, governance, performance and prospects without being burdened with less relevant information
66 - 73 Materiality determination
Follows logical structure and includes internal cross-reference as appropriate to limit repetition.
66 - 73 Materiality determination
Express concepts clearly and in as few words. 66 - 73 Materiality determination
Favours plain language over the use of jargon or highly technical terminology.
Avoids highly generic disclosures.
3.2 Reliability and completeness
An integrated report should include all material matters, both positive and negative, in a balanced way and without material error
74 - 83, 206 -222
Delivering our strategy and resource allocation, Corporate governance
The organization achieves the reliability and completeness through,
Selection of presentation formats that are not likely to unduly or inappropriately influence assessments made on the basis of integrated report.
66 - 73 Materiality determination
Giving equal conservation to both increases and decreases in the capitals, both strengths and weaknesses of the organization, both positive and negative performance etc.
50 - 204 Management discussion and analysis
When information includes estimates, this is clearly communicated and the nature of limitations of the estimation process are explained.
268 Independent auditor’s report
3.3 Consistency and comparability
The information in an integrated report should be presented:
On a basis that is consistent over time 262 - 263 Financial statements highlights for the year
In a way that enables comparison with other organizations to the extent it is material to the organization’s own ability to create value over time
398, 116 - 143 Decade at a glance, Financial capital
Presenting information in the form of ratios
Stability Leadership Strength Agility Responsibility Sustainability Success Supplementary Information

L B Finance PLC | Annual Report 2020/21260
CONSOLIDATED SET OF IR STANDARDS
Ref. no
Particulars Page Reference
Chapter/Section Reference
Reporting quantitative indicators commonly used by other organizations with similar activities, particularly when standardized definitions are stipulated by an independent organization
Reporting policies are followed consistently from one period to other unless a change is needed to improve the quality of information reported.
116 - 143, 273 - 279
Financial capital, Financial statements
Reporting the same KPIs if they continue to be material across reporting period.
3.4 Connectivity of information
An integrated report should show a holistic picture of the combination, interrelatedness and dependencies between the factors that affect the organization’s ability to create value over time.
50 - 51 Business model
Capitals 50 - 51 Business model
Content elements
Past, Present & Future 116 - 204, 36 - 39
Capital reports, Managing director’s review
Finance and other information 116 - 143 Finance capital
3.5 Materiality
An integrated report should disclose information about matters that substantively affect the organization’s ability to create value over the short, medium and long term
66 - 73 Materiality determination
3.6 Assurance on the Report
The policy and practice relating to seeking assurance on the report
268 - 271, 266 - 267, 206 - 222
Independent auditors report on financial statements, Directors’ responsibility for internal control, Financial reporting and corporate governance
The nature and scope of assurance provided for this particular report
L B Finance PLC | Annual Report 2020/21 261
C H A P T E R
07Success
Accomplishing our Goals As we pass yet another milestone in
our journey of growth, we look forward to unmatched performance and value
delivery in the years to come
Independent auditors’ report 268
Income statement 273
Statement of comprehensive income 274
Statement of financial position 275
Statement of changes in equity
Company 276
Group 277
Statement of cash flows 278
Notes to the financial statements 280
Financial statement highlights 262
Financial calendar 264
Independent assurance report to the Board of Directors 265
Directors’ responsibility statement on internal control over financial reporting 266
Directors’ responsibility for financial reporting 267

L B Finance PLC | Annual Report 2020/21262
Financial Statement Highlights
DIVIDEND PAYMENT VS RETAINED PROFIT
DividendPayout Ratio
0
20
40
60
80
100
2020
2021
(%)
202157.01%
20200%
Retained profits
Dividend payout
GROSS PROFIT MARGIN*
0
10
20
30
40
50
60
2020
2021
(%)
202153.53%
202049.79%
*Net interest income as a % of income
INCOME
0
5
10
15
20
25
30
35
2020
2021
(Rs. Bn)
2021Rs. 29.77 Bn
2020Rs. 31.22 Bn
NET INTEREST INCOME
0
5
10
15
20
2020
2021
(Rs. Bn)
2021Rs. 15.93 Bn
2020Rs. 15.54 Bn
NET PROFIT MARGIN*
0
5
10
15
20
25
2020
2021
(%)
202122.85%
202016.61%
*Profit after tax as a % of income
PROFIT AFTER TAX
012345678
2020
2021
(Rs. Bn)
2021Rs. 6.80 Bn
2020Rs. 5.19 Bn
PROFIT BEFORE TAX
0
2
4
6
8
10
2020
2021
(Rs. Bn)
2021Rs. 9.31 Bn
2020Rs. 7.61 Bn
RETURN ON ASSETS
0
1
2
3
4
5
2020
2021
(%)
20214.78%
20203.70%
RETURN ON EQUITY
0
5
10
15
20
25
30
2020
2021
(%)
202126.58%
202025.04%
OPERATING RESULTS
PROFITABILITY RATIOS
OPERATING PROFIT MARGIN*
05
10152025303540
2020
2021
(%)
202136.87%
202031.67%
*Operating profit before tax as a % of income

L B Finance PLC | Annual Report 2020/21 263
Stability Leadership Strength Agility Responsibility Sustainability Success Supplementary Information
EQUITY RATIOS
DEBT RATIOS
DEBT TO EQUITY RATIO
0
2
4
6
8
2020
2021
(No. of times)
20213.74 Times
20205.01 Times
MARKET CAPITALISATION
0
5
10
15
20
25
30
2020
2021
(Rs. Bn)
2021Rs. 26.26
2020Rs. 16.69
EARNINGS PER SHARE
0
3
6
9
12
15
2020
2021
(Rs.)
2021Rs. 12.28
2020Rs. 9.36
EQUITY ASSETS RATIO
0
5
10
15
20
25
2020
2021
(%)
202120.05%
202015.98%
INTEREST COVER
0
0.5
1.0
1.5
2.0
2020
2021
(No. of times)
20211.81 Times
20201.56 Times
MARKET PRICE PER SHARE
0
50
100
150
200
250
300
350
2020
2021
(Rs.)
2021Rs. 47.40
2020Rs. 120.50
ClosingMarket Price
HighestLowestClosing
*Market prices for 2020 and highest price for 2021 were prior to the share sub-division
NET ASSETS VALUE PER SHARE
0
10
20
30
40
50
60
2020
2021
(Rs.)
2021Rs. 50.88
2020Rs. 41.51
PRICE EARNINGS RATIO
0
1
2
3
4
2020
2021
(No. of times)
20213.86 Times
20203.22 Times

L B Finance PLC | Annual Report 2020/21264
Financial Calendar
2020/21
Publication of Interim Financial Statements for the quarter ended 31 March 2020 28 May 2020
Authorisation for issue of Audited Financial Statements for 2019/20 22 June 2020
Publication of Annual Report for the financial year ended 31 March 2020 8 July 2020
Held 47th Annual General Meeting of the company 30 July 2020
Publication of Interim Financial Statements for the quarter ended 30 June 2020 14 August 2020
Publication of Interim Financial Statements for the quarter ended 30 September 2020 22 October 2020
Publication of Interim Financial Statements for the quarter ended 31 December 2020 29 January 2021
2021/22
Payment of interim dividend of Rs. 12.00 per share for the financial year ended 31 March 2021 23 February 2021
Publication of Interim Financial Statements for the quarter ended 31 March 2021 19 May 2021
Publication of Annual Report for the financial year ended 31 March 2021 7 June 2021
48th Annual General Meeting of the company 30 June 2021
Payment of final dividend of Rs. 4.00 per share for the financial year ended 31 March 2021 *July 2021
Submission of the Interim Financial Statements in terms of the rule 7.4 of the Colombo Stock Exchange (CSE)
2020/21 Submitted on
2021/22 to be Submitted on or before
For the 3 months ended 30 June (unaudited) 14 August 2020 15 August 2021
For the 3 and 6 months ended 30 September (unaudited) 22 October 2020 15 November 2021
For the 3 and 9 months ended 31 December (unaudited) 22 January 2021 15 February 2022
For the 3 months and year ended 31 March (unaudited) 19 May 2021 30 May 2022
Publication of the six month Financial Statements as per requirements of the Central Bank of Sri Lanka
2020/21 Published in News Papers on 2021/22 to be Published on or beforeEnglish Sinhala Tamil
For the year ended 31 March (audited) 30 June 2020 30 June 2020 30 June 2020 30 June 2021
For the 6 months ended 30 September (unaudited) 26 November 2020
26 November 2020
26 November 2020
30 November 2021
*The proposed payment of final dividend per share is based on post sub-division of shares and subject to approval of shareholders at the forthcoming Annual General Meeting.

L B Finance PLC | Annual Report 2020/21 265
Stability Leadership Strength Agility Responsibility Sustainability Success Supplementary Information
Independent Assurance Report to the Board of Directors
TO THE BOARD OF DIRECTORS OF L B FINANCE PLC
Report on the Director’s Statement on Internal Control
We were engaged by the Board of Directors of L B Finance PLC (the “Company”) to provide assurance on the Directors’ Statement on Internal Control over Financial Reporting (the “Statement”) included in the annual report for the year ended 31 March 2021.
Management’s responsibility
Management is responsible for the preparation and presentation of the Statement in accordance with the “Guidance for Directors of License Finance Company/ Finance Leasing Company on the Directors’ Statement on Internal Control” issued in compliance with the section 10 (2) (b) of the Finance Companies (Corporate Governance) Direction no. 3 of 2008/ section 10 (2) (b) of the Finance Leasing (Corporate Governance) Direction no. 4 of 2009, by the Institute of Chartered Accountants of Sri Lanka.
Our Independence and Quality Control
We have complied with the independence and other ethical requirement of the Code of Ethics for Professional Accountants issued by the Institute of Chartered Accountants of Sri Lanka, which is founded on fundamental principles of integrity, objectivity, professional competence and due care, confidentiality and professional behavior.
The firm applies Sri Lanka Standard on Quality Control 1 and accordingly maintains a comprehensive system of quality control including documented policies and procedures regarding compliance with ethical requirements, professional
standards and applicable legal and regulatory requirements.
Our responsibilities and compliance with SLSAE 3051
Our responsibility is to assess whether the Statement is both supported by the documentation prepared by or for directors and appropriately reflects the process the directors have adopted in reviewing the design and effectiveness of the internal control of the Company.
We conducted our engagement in accordance with Sri Lanka Standard on Assurance Engagements (SLSAE) 3051, Assurance Report for License Finance Company/ Finance Leasing Company on Directors’ Statement on Internal Control, issued by the Institute of Chartered Accountants of Sri Lanka.
This Standard required that we plan and perform procedures to obtain limited assurance about whether Management has prepared, in all material respects, the Statement on Internal Control.
For purpose of this engagement, we are not responsible for updating or reissuing any reports, nor have we, in the course of this engagement, performed an audit or review of the financial information.
Summary of work performed
We conducted our engagement to assess whether the Statement is supported by the documentation prepared by or for directors; and appropriately reflected the process the directors have adopted in reviewing the system of internal control over financial reporting of the Company.
The procedures performed were limited primarily to inquiries of the Company personnel and the existence of documentation on a sample basis that supported the process adopted by the Board of Directors.
SLSAE 3051 does not require us to consider whether the Statement covers all risks and controls or to form an opinion on the effectiveness of the Company’s risk and control procedures. SLSAE 3051 also does not require us to consider whether the processes described to deal with material internal control aspects of any significant problems disclosed in the annual report will, in fact, remedy the problems.
The procedures selected depend on our judgement, having regard to our understanding of the nature of the Company, the event or transaction in respect of which the Statement has been prepared.
We believe that the evidence we have obtained is sufficient and appropriate to provide a basis for our conclusion.
Our conclusion
Based on the procedures performed, nothing has come to our attention that causes us to believe that the Statement included in the annual report is inconsistent with our understanding of the process the Board of Directors has adopted in the review of the design and effectiveness of internal control over financial reporting of the Company.
19 May 2021Colombo

L B Finance PLC | Annual Report 2020/21266
Directors’ Responsibility Statement onInternal Control Over Financial Reporting
RESPONSIBILITY
In line with the section 10 (2) (b) of the Finance Companies Direction No. 03 of 2008 as amended by Direction No. 06 of 2013, and principle D.1.5 of the Code of Best Practice on Corporate Governance 2017 issued by Chartered Accountants of Sri Lanka, the Board of Directors (“Board”) presents this report on internal control over financial reporting.
The Board has overall responsibility for ensuring the adequacy and effectiveness of L B Finance PLC’s (“Company”) internal control over financial reporting. The Company’s system of internal controls is primarily designed towards managing the Company’s key areas of risk within an acceptable risk profile, rather than to eliminate the risk of failure to achieve the policies and business objectives of the Company. We note that the system of internal controls stipulated can only provide reasonable but not absolute assurance against material misstatement of financial information and records or against financial losses or frauds.
In light of the above the Board has established a continuous process of identifying, evaluating and managing the significant risks faced by the Company and this process includes enhancing the system of internal control over financial reporting especially when there are changes to the business environment or regulatory guidelines. This process is regularly reviewed by the Board assessing key processes related risks against the compensating controls which may affect significant accounts of the company.
The management is tasked with assisting the Board in the implementation of the policies and procedures on risk and control, by identifying and assessing the risks faced. It also provides inputs on design, operation and monitoring of suitable internal control over financial reporting to mitigate and control these risks.
The Board is of the view that the system of internal control over financial reporting is adequate to provide reasonable assurance regarding the reliability of financial reporting. This ensures that the preparation of the financial statements for external purposes is in accordance with relevant accounting principles and regulatory requirements.
KEY FEATURES OF THE PROCESS ADOPTED IN APPLYING AND REVIEWING THE DESIGN AND EFFECTIVENESS OF THE INTERNAL CONTROL SYSTEM OF FINANCIAL REPORTING
The processes that have been established in reviewing the adequacy and integrity of the system of internal controls with respect to financial reporting include the following:
The Board has established specialised sub-committees to assist in ensuring the effectiveness of the Company’s day-to-day operations and to make sure that all such operations are performed in accordance with the corporate objectives, strategies and the annual budget as well as the policies and business directions that have been approved.
Policies / charters / procedures are in place covering functional areas of the Company and these are recommended by the Board-appointed Committees and are approved by the Board. All policies, charters and procedures are regularly reviewed and approved by the Board.
The Internal Audit Department of the Company monitors compliance with policies and procedures and their suitability of design and effectiveness on an ongoing basis. Statistical verification procedures are used and significant findings of non-compliance are highlighted. The annual audit plan is reviewed and approved by the Board Audit Committee. Branches and service departments are audited to provide independent and objective assurance reports on operations and performance. Additionally, Messrs. KPMG Sri Lanka provides independent and objective assessment thereof. The scope, quality and reports of internal audits are reviewed by the Board Audit Committee at its monthly meetings and refinements are applied wherever necessary.
Overall, the Board Audit Committee of the Company reviews internal control issues identified by the Internal Audit Department, the External Auditor, regulatory authorities and the management, and evaluates the adequacy and effectiveness of the risk management and internal control systems.
The Company adopts Sri Lanka Accounting Standards comprising LKAS and SLFRS and
progressive improvements on processes to comply with requirements of recognition, measurement, classification and disclosure. Financial reporting and management information processes will be further strengthened by constant monitoring and adaptation to market realities. The company reviewed the existing models in use to ascertain the potential implications of the COVID 19 pandemic and the moratorium schemes introduced to support the recovery of the economy.
CONFIRMATION
Based on the above processes, the Board affirms that the financial reporting system of the Company has been designed to provide reasonable assurance regarding the reliability of financial reporting and the preparation of financial statements for external purposes and has been done in accordance with Sri Lanka Accounting Standards and the regulatory requirements of the Central Bank of Sri Lanka.
REVIEW OF THE STATEMENT BY EXTERNAL AUDITOR
The external auditor, Messrs. Ernst & Young, has reviewed the above Directors’ Statement on Internal Controls over Financial Reporting and report is included in the Company’s Annual Report for the year ended 31st March 2021. They have reported to the Board that nothing has come to their attention that causes them to believe that the statement is inconsistent with their understanding of the process adopted by the Board in the review of the design and effectiveness of the internal control over financial reporting of the Company. Their report on the statement of internal control over financial reporting is given on page 265 of this annual report.
By order of the Board,
Mrs. Yogadinusha BhaskaranChairperson - Audit Committee
J A S Sumith AdhihettyManaging Director
19 May 2021
L B Finance PLC | Annual Report 2020/21 267
Stability Leadership Strength Agility Responsibility Sustainability Success Supplementary Information
Directors’ Responsibility for Financial Reporting
The following statement sets out responsibility of the Directors in relation to the Financial Statements of the Company and its Subsidiary prepared in accordance with the provisions of the Companies Act No. 07 of 2007.
The responsibility of the Independent Auditor in relation to the Financial Statements is set out in the Report of the Auditors given on pages 268 to 271 of the Annual Report.
As per the provisions of sections 151, 153(1) and (2), 150 (1) and 152(1) of the Companies Act No. 07 of 2007, the Directors are required to prepare Financial Statements for each financial year, which should give a true and fair view of the state of affairs of the Company and its Subsidiary as at the reporting date and its profit or loss for the financial year then ended, ensure that they are completed within six months or such extended period as may be determined by the Registrar General of Companies, certified by the person responsible for the preparation of the Financial Statements that it is in compliance with the said Companies Act and dated and signed on behalf of the Board by two Directors of the Company.
In terms of section 166(1) read together with sections 168(1)(b) and (c) and section 167(1) of the Companies Act, the Directors shall cause a copy of the aforesaid Financial Statements together with the annual report of the Board of Directors of the Company prepared as per section 166(1) of the Companies Act to be sent to every shareholder not less than fifteen working days before the date fixed for holding the Annual General Meeting. However, under the current travel/ health restrictions / regulations imposed by the health authorities and the Government in view of the COVID-19 pandemic, the above obligation is discharged by the Directors by making available a copy of the Annual Report on the Company’s official Website and the Colombo Stock Exchange Website. Alternatively, hard copies will be made available to shareholders on request. Further, the convening of the Annual
General Meeting and availability of Annual Reports as aforesaid will also be published in the print media in Sinhala, Tamil and English languages in a daily newspaper
In preparing the Financial Statements, the Directors are responsible to ensure that appropriate accounting policies have been selected and applied consistently, reasonable and prudent judgments and estimates have been made and all applicable accounting standards have been complied with.
The Directors are also required to ensure that the Company and its Subsidiary have adequate resources to continue in operation to justify applying the going concern basis in preparing these Financial Statements.
Further, the Directors have a responsibility to ensure that the Companies within the Group maintains sufficient accounting records to disclose with reasonable accuracy, the financial position of the Company and the Subsidiary.
Financial Statements prepared and presented in this report have been prepared based on Sri Lanka Accounting Standards (SLFRSs/LKASs) and are consistent with the underlying books of accounts and are in conformity with the requirements of Sri Lanka Accounting Standards, Companies Act No. 07 of 2007, Sri Lanka Accounting and Auditing Standards Act No. 15 of 1995 directions and guidelines issued uner the Finance Business Act No. 42 of 2011 and the Listing Rules of the Colombo Stock Exchange.
The Directors have also instituted effective and comprehensive systems of internal control for identifying, recording, evaluating and managing the significant risks faced by the Company throughout the year, which is primarily handled through the Audit Committee and the Integrated Risk Management Committee as set out in their Reports that appear on pages 233 to 235 and 236 to 237 respectively.
The Directors have taken appropriate steps to ensure that the Company and its Subsidiary maintain proper books of accounts and the financial reporting system is directly reviewed by the Directors at their regular meetings and also through the Board Audit Committee.
The Board of Directors also approves the interim Financial Statements prior to their release following a review and recommendation by the Board Audit Committee.
The Board of Directors accepts responsibility for the integrity and objectivity of the Financial Statements presented in this Annual Report.
The Financial Statements of the Company and the Subsidiary have been certified by the AGM - Finance of the Company, the officer responsible for their preparation as required by section 152(1)(b) and they have also been signed by two Directors of the Company as required by section 152(1)(c) of the Companies Act.
The Directors to the best of their knowledge and belief, are satisfied that all statutory payments in relation to all relevant regulatory and statutory authorities, which were due and payable by the Company and the Subsidiary as at the reporting date have been paid or where relevant, provided for.
The Directors are of the view that they have discharged their responsibilities as set out in this statement.
By Order of the BoardL B Finance PLC
P W Corporate Secretarial (Pvt) LtdCompany Secretaries
19 May 2021

L B Finance PLC | Annual Report 2020/21268
Independent Auditors’ Report
TO THE SHAREHOLDERS OF L B FINANCE PLC
Report on the audit of the consolidated financial statements
Opinion
We have audited the financial statements of L B Finance PLC (“the Company”) and the consolidated financial statements of the Company and its subsidiary (“the Group”), which comprise the statement of financial position as at 31 March 2021, income statement and the statement of comprehensive income, statement of changes in equity and statement of cash flows for the year then ended, and notes to the financial statements, including a summary of significant accounting policies.
In our opinion, the accompanying financial statements of the Company and the Group give a true and fair view of the financial position of the Company and the Group as at 31 March 2021, and of their financial performance and cash flows for the year then ended in accordance with Sri Lanka Accounting Standards.
Basis for opinion
We conducted our audit in accordance with Sri Lanka Auditing Standards (SLAuSs). Our responsibilities under those standards are further described in the Auditor’s responsibilities for the audit of the financial statements section of our report. We are independent of the Group in accordance with the Code of Ethics issued by CA Sri Lanka (Code of Ethics) and we have fulfilled our other ethical responsibilities in accordance with the Code of Ethics. We believe that the audit evidence we have obtained is sufficient and appropriate to provide a basis for our opinion.
Key audit matters
Key audit matters are those matters that, in our professional judgment, were of most significance in our audit of the financial statements of the current period. These matters were addressed in the context of our audit of the financial statements as a whole, and in forming our opinion thereon, and we do not provide a separate opinion on these matters. For each matter below, our description of how our audit addressed the matter is provided in that context.
We have fulfilled the responsibilities described in the Auditor’s responsibilities for the audit of the financial statements section of our report, including in relation to these matters. Accordingly, our audit included the performance of procedures designed to respond to our assessment of the risks of material misstatement of the financial statements. The results of our audit procedures, including the procedures performed to address the matters below, provide the basis for our audit opinion on the accompanying financial statements.
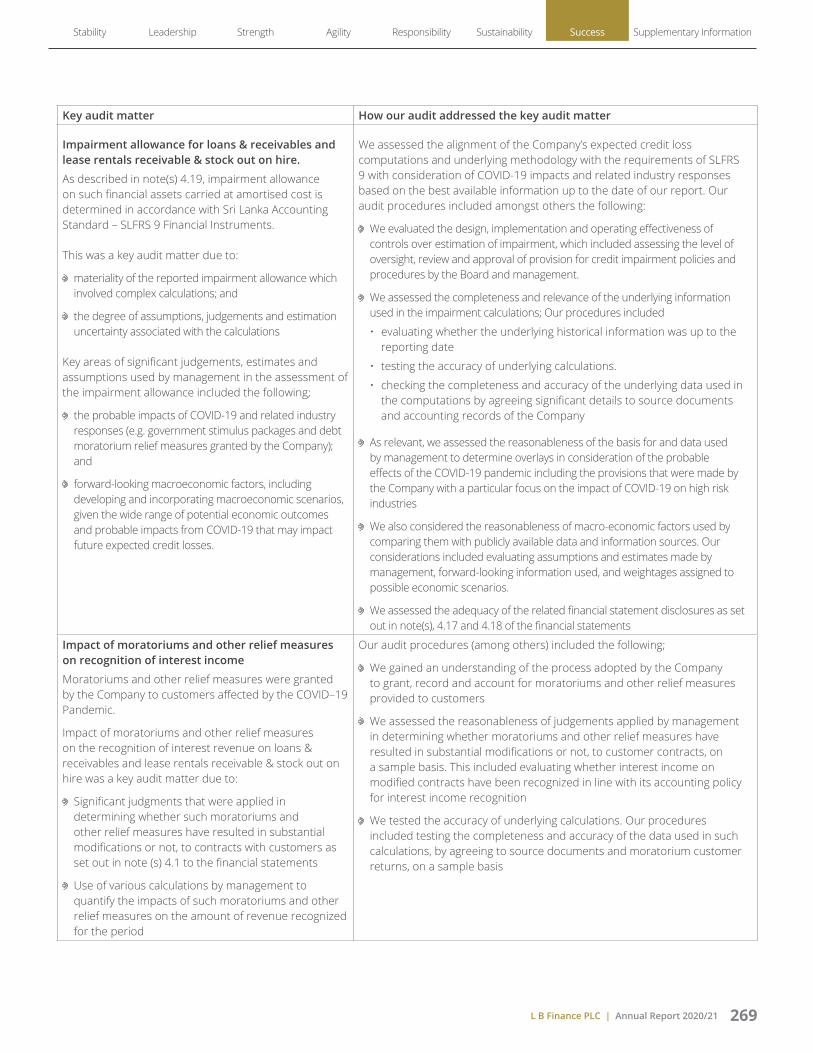
L B Finance PLC | Annual Report 2020/21 269
Stability Leadership Strength Agility Responsibility Sustainability Success Supplementary Information
Key audit matter How our audit addressed the key audit matter
Impairment allowance for loans & receivables and lease rentals receivable & stock out on hire.
As described in note(s) 4.19, impairment allowance on such financial assets carried at amortised cost is determined in accordance with Sri Lanka Accounting Standard – SLFRS 9 Financial Instruments.
This was a key audit matter due to:
materiality of the reported impairment allowance which involved complex calculations; and
the degree of assumptions, judgements and estimation uncertainty associated with the calculations
Key areas of significant judgements, estimates and assumptions used by management in the assessment of the impairment allowance included the following;
the probable impacts of COVID-19 and related industry responses (e.g. government stimulus packages and debt moratorium relief measures granted by the Company); and
forward-looking macroeconomic factors, including developing and incorporating macroeconomic scenarios, given the wide range of potential economic outcomes and probable impacts from COVID-19 that may impact future expected credit losses.
We assessed the alignment of the Company’s expected credit loss computations and underlying methodology with the requirements of SLFRS 9 with consideration of COVID-19 impacts and related industry responses based on the best available information up to the date of our report. Our audit procedures included amongst others the following:
We evaluated the design, implementation and operating effectiveness of controls over estimation of impairment, which included assessing the level of oversight, review and approval of provision for credit impairment policies and procedures by the Board and management.
We assessed the completeness and relevance of the underlying information used in the impairment calculations; Our procedures included
• evaluating whether the underlying historical information was up to the reporting date
• testing the accuracy of underlying calculations.
• checking the completeness and accuracy of the underlying data used in the computations by agreeing significant details to source documents and accounting records of the Company
As relevant, we assessed the reasonableness of the basis for and data used by management to determine overlays in consideration of the probable effects of the COVID-19 pandemic including the provisions that were made by the Company with a particular focus on the impact of COVID-19 on high risk industries
We also considered the reasonableness of macro-economic factors used by comparing them with publicly available data and information sources. Our considerations included evaluating assumptions and estimates made by management, forward-looking information used, and weightages assigned to possible economic scenarios.
We assessed the adequacy of the related financial statement disclosures as set out in note(s), 4.17 and 4.18 of the financial statements
Impact of moratoriums and other relief measures on recognition of interest income
Moratoriums and other relief measures were granted by the Company to customers affected by the COVID–19 Pandemic.
Impact of moratoriums and other relief measures on the recognition of interest revenue on loans & receivables and lease rentals receivable & stock out on hire was a key audit matter due to:
Significant judgments that were applied in determining whether such moratoriums and other relief measures have resulted in substantial modifications or not, to contracts with customers as set out in note (s) 4.1 to the financial statements
Use of various calculations by management to quantify the impacts of such moratoriums and other relief measures on the amount of revenue recognized for the period
Our audit procedures (among others) included the following;
We gained an understanding of the process adopted by the Company to grant, record and account for moratoriums and other relief measures provided to customers
We assessed the reasonableness of judgements applied by management in determining whether moratoriums and other relief measures have resulted in substantial modifications or not, to customer contracts, on a sample basis. This included evaluating whether interest income on modified contracts have been recognized in line with its accounting policy for interest income recognition
We tested the accuracy of underlying calculations. Our procedures included testing the completeness and accuracy of the data used in such calculations, by agreeing to source documents and moratorium customer returns, on a sample basis
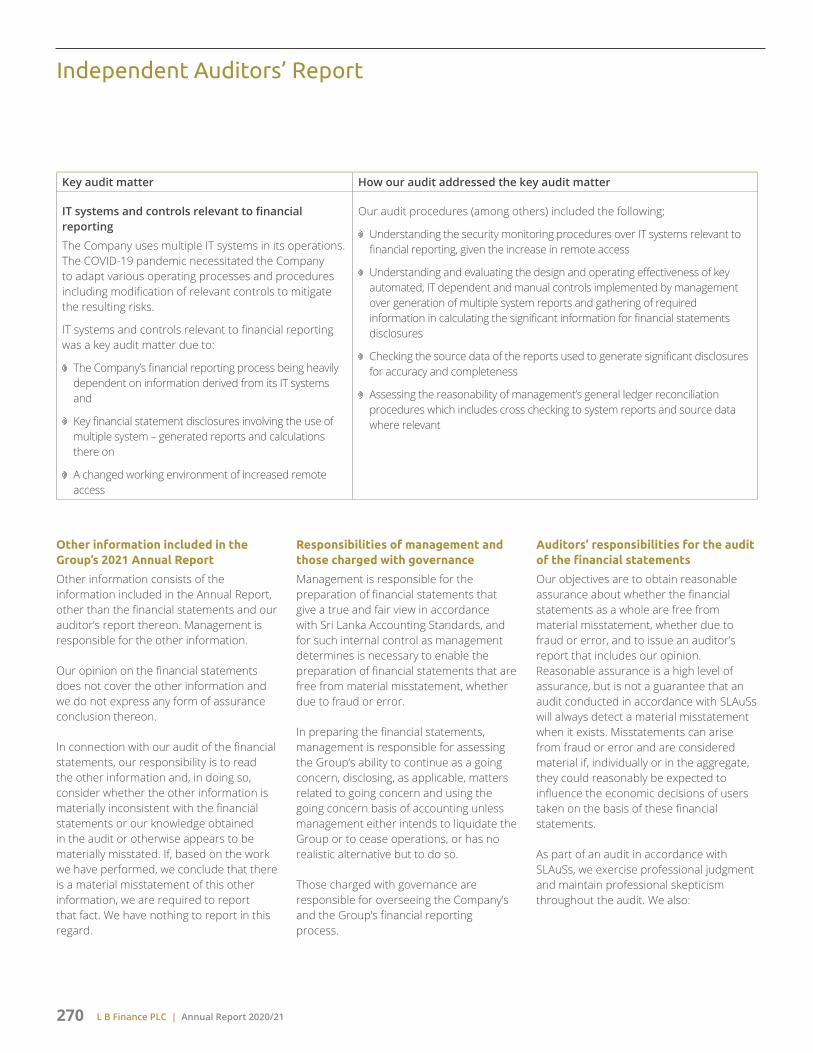
L B Finance PLC | Annual Report 2020/21270
Independent Auditors’ Report
Other information included in the Group’s 2021 Annual Report
Other information consists of the information included in the Annual Report, other than the financial statements and our auditor’s report thereon. Management is responsible for the other information.
Our opinion on the financial statements does not cover the other information and we do not express any form of assurance conclusion thereon.
In connection with our audit of the financial statements, our responsibility is to read the other information and, in doing so, consider whether the other information is materially inconsistent with the financial statements or our knowledge obtained in the audit or otherwise appears to be materially misstated. If, based on the work we have performed, we conclude that there is a material misstatement of this other information, we are required to report that fact. We have nothing to report in this regard.
Responsibilities of management and those charged with governance
Management is responsible for the preparation of financial statements that give a true and fair view in accordance with Sri Lanka Accounting Standards, and for such internal control as management determines is necessary to enable the preparation of financial statements that are free from material misstatement, whether due to fraud or error.
In preparing the financial statements, management is responsible for assessing the Group’s ability to continue as a going concern, disclosing, as applicable, matters related to going concern and using the going concern basis of accounting unless management either intends to liquidate the Group or to cease operations, or has no realistic alternative but to do so.
Those charged with governance are responsible for overseeing the Company’s and the Group’s financial reporting process.
Auditors’ responsibilities for the audit of the financial statements
Our objectives are to obtain reasonable assurance about whether the financial statements as a whole are free from material misstatement, whether due to fraud or error, and to issue an auditor’s report that includes our opinion. Reasonable assurance is a high level of assurance, but is not a guarantee that an audit conducted in accordance with SLAuSs will always detect a material misstatement when it exists. Misstatements can arise from fraud or error and are considered material if, individually or in the aggregate, they could reasonably be expected to influence the economic decisions of users taken on the basis of these financial statements.
As part of an audit in accordance with SLAuSs, we exercise professional judgment and maintain professional skepticism throughout the audit. We also:
Key audit matter How our audit addressed the key audit matter
IT systems and controls relevant to financial reporting
The Company uses multiple IT systems in its operations. The COVID-19 pandemic necessitated the Company to adapt various operating processes and procedures including modification of relevant controls to mitigate the resulting risks.
IT systems and controls relevant to financial reporting was a key audit matter due to:
The Company’s financial reporting process being heavily dependent on information derived from its IT systems and
Key financial statement disclosures involving the use of multiple system – generated reports and calculations there on
A changed working environment of increased remote access
Our audit procedures (among others) included the following;
Understanding the security monitoring procedures over IT systems relevant to financial reporting, given the increase in remote access
Understanding and evaluating the design and operating effectiveness of key automated, IT dependent and manual controls implemented by management over generation of multiple system reports and gathering of required information in calculating the significant information for financial statements disclosures
Checking the source data of the reports used to generate significant disclosures for accuracy and completeness
Assessing the reasonability of management’s general ledger reconciliation procedures which includes cross checking to system reports and source data where relevant

L B Finance PLC | Annual Report 2020/21 271
Stability Leadership Strength Agility Responsibility Sustainability Success Supplementary Information
1. Identify and assess the risks of material misstatement of the financial statements, whether due to fraud or error, design and perform audit procedures responsive to those risks, and obtain audit evidence that is sufficient and appropriate to provide a basis for our opinion. The risk of not detecting a material misstatement resulting from fraud is higher than for one resulting from error, as fraud may involve collusion, forgery, intentional omissions, misrepresentations, or the override of internal control.
2. Obtain an understanding of internal control relevant to the audit in order to design audit procedures that are appropriate in the circumstances, but not for the purpose of expressing an opinion on the effectiveness of the internal controls of the Company and the Group.
3. Evaluate the appropriateness of accounting policies used and the reasonableness of accounting estimates and related disclosures made by management.
4. Conclude on the appropriateness of management’s use of the going concern basis of accounting and, based on the audit evidence obtained, whether a material uncertainty exists related to events or conditions that may cast significant doubt on the Group’s ability to continue as a going concern. If we conclude that a material uncertainty exists, we are required to draw attention in our auditor’s report to the related disclosures in the financial statements or, if such disclosures are
inadequate, to modify our opinion. Our conclusions are based on the audit evidence obtained up to the date of our auditor’s report. However, future events or conditions may cause the Group to cease to continue as a going concern.
5. Evaluate the overall presentation, structure and content of the financial statements, including the disclosures, and whether the financial statements represent the underlying transactions and events in a manner that achieves fair presentation.
6. Obtain sufficient appropriate audit evidence regarding the financial information of the entities or business activities within the Group to express an opinion on the consolidated financial statements. We are responsible for the direction, supervision and performance of the group audit. We remain solely responsible for our audit opinion.
We communicate with those charged with governance regarding, among other matters, the planned scope and timing of the audit and significant audit findings, including any significant deficiencies in internal control that we identify during our audit.
We also provide those charged with governance with a statement that we have complied with ethical requirements in accordance with the Code of Ethics regarding independence, and to communicate with them all relationships and other matters that may reasonably be thought to bear on our independence, and where applicable, related safeguards.
From the matters communicated with those charged with governance, we determine those matters that were of most significance in the audit of the financial statements of the current period and are therefore the key audit matters. We describe these matters in our auditor’s report unless law or regulation precludes public disclosure about the matter or when, in extremely rare circumstances, we determine that a matter should not be communicated in our report because the adverse consequences of doing so would reasonably be expected to outweigh the public interest benefits of such communication.
Report on Other Legal and Regulatory Requirements
As required by section 163 (2) of the Companies Act No. 07 of 2007, we have obtained all the information and explanations that were required for the audit and, as far as appears from our examination, proper accounting records have been kept by the Company.
CA Sri Lanka membership number of the engagement partner responsible for signing this independent auditor’s report is 1884.
19 May 2021Colombo

L B Finance PLC | Annual Report 2020/21272
Financial Statements - Table of Contents
Note No.
Page No.
Section 01 - Primary Financial StatementsIncome statement 273Statement of comprehensive income 274Statement of financial position 275Statement of changes in equity - company 276Statement of changes in equity - group 277Statement of cash flows 278
Section 02 - Corporate InformationReporting entity 2.1 280Consolidated financial statements 2.2 280Principal business activities, nature of operations of the
group and ownership by the company in its subsidiary 2.3 280Approval of financial statements by directors 2.4 280Statement of compliance 2.5 281Responsibilities for the financial statements 2.6 281Application of Sri Lanka accounting standards 2.7 281Basis of measurement 2.8 281Going concern 2.9 281Functional and presentation currency 2.10 282Presentation of financial statements 2.11 282Use of materiality, aggregation, offsetting and rounding 2.12 282Comparative information 2.13 282Sri Lanka accounting standards issued but not yet
effective as at 31 march 2021 2.14 282Changes in accounting policies 2.15 283Significant accounting assumptions, judgments and
estimation uncertainties 2.16 283
Section 03 - General Accounting Policies and NotesBasis of consolidation 3.1 284Foreign currency 3.2 284Provisions 3.3 285Operational risk events 3.4 285Other taxes 3.5 285Borrowing costs 3.6 285Financial guarantees and loan commitments 3.7 285Impairment of non financial assets 3.8 286Estimating the incremental borrowing rate 3.9 286
Section 04 - Specific Accounting Policies and NotesNet interest income 4.1 287Fee and commission income 4.2 289Net trading income 4.3 289Other operating income 4.4 290Impairment charges and other losses 4.5 290Personnel expenses 4.6 294Depreciation and amortisation 4.7 295Other operating expenses 4.8 296Tax on financial services 4.9 296Taxation 4.10 297Earnings per ordinary share 4.11 299
Note No.
Page No.
Dividend paid and proposed 4.12 301Financial instruments 4.13 302Fair value measurement 4.14 306Cash and cash equivalents 4.15 319Financial assets recognised through profit or loss
- measured at fair value 4.16 320Financial assets at amortised cost
- loans and receivables 4.17 321Financial assets at amortised cost
- lease rentals receivable and stock out on hire 4.18 326Allowance for impairment losses 4.19 328Financial assets measured at fair value through
other comprehensive income 4.20 336Other financial assets 4.21 338Other non financial assets 4.22 339Investment in subsidiary 4.23 340Property, plant and equipment and right-of-use assets 4.24 340Intangible assets 4.25 346Due to banks 4.26 347Financial liabilities at amortised cost - due to depositors 4.27 350Debt instruments issued and other borrowed funds 4.28 352Other financial liabilities 4.29 352Other non financial liabilities 4.30 354Current tax liabilities 4.31 354Deferred tax liabilities 4.32 354Post employment benefit liability 4.33 356Stated capital 4.34 358Reserves 4.35 359Retained earnings 4.36 360Non-controlling interest 4.37 360
Section 05 - Risk Management DisclosuresIntroduction 5.1 361Credit risk 5.2 361Liquidity risk and funding management 5.3 372Market risk 5.4 380Capital adequacy 5.5 386Probable impact of COVID-19 outbreak on business
operations of the group 5.6 386
Section 06 - Other DisclosuresRelated party disclosures 6.1 387Capital 6.2 390Current and non current analysis of assets and liabilities 6.3 391Segmental information 6.4 392Commitments and contingencies 6.5 393Net asset value per share 6.6 394Assets pledged 6.7 394Comparative information 6.8 395Events occurring after the reporting date 6.9 395Changes in liabilities arising from financing activities 6.10 395

L B Finance PLC | Annual Report 2020/21 273
Stability Leadership Strength Agility Responsibility Sustainability Success Supplementary Information
SECTION 01Income Statement
Year ended 31 March Note Page No.
Company Group
2021 2020 Change 2021 2020 Change
Rs. ‘000 Rs. ‘000 % Rs. ‘000 Rs. ‘000 %
Income 4.1.1 287 29,766,124 31,222,860 (5) 29,930,319 31,359,418 (5)
Interest Income 4.1.2 287 27,457,741 29,160,292 (6) 27,610,976 29,297,103 (6)
Less: Interest Expenses 4.1.6 288 11,522,802 13,615,391 (15) 11,543,326 13,631,371 (15)
Net Interest Income 4.1.8 289 15,934,939 15,544,901 3 16,067,650 15,665,732 3
Fee and Commission Income 4.2 289 2,184,947 1,941,626 13 2,196,387 1,950,180 13
Net Trading Income 4.3 289 6,323 (2,099) >100 6,323 (2,099) >100
Other Operating Income 4.4 290 117,113 123,041 (5) 116,633 114,234 2
Total Operating Income 18,243,322 17,607,469 4 18,386,993 17,728,047 4
Less: Impairment Charges and Other Losses 4.5 290 1,691,734 1,831,057 (8) 1,727,907 1,856,495 (7)
Net Operating Income 16,551,588 15,776,412 5 16,659,086 15,871,552 5
Less: Operating Expenses
Personnel Expenses 4.6 294 2,959,823 3,005,189 (2) 3,007,941 3,034,198 (1)
Depreciation of Property, Plant and Equipment 4.7.1 295 728,793 697,508 4 730,913 698,639 5
Amortisation of Intangible Assets 4.7.2 295 16,446 15,882 4 20,019 18,125 10
Other Operating Expenses 4.8 296 1,870,828 2,168,986 (14) 1,903,077 2,188,842 (13)
Total Operating Expenses 5,575,890 5,887,565 (5) 5,661,950 5,939,804 (5)
Operating Profit before Tax on Financial Services 10,975,698 9,888,847 11 10,997,136 9,931,748 11
Less: Tax on Financial Services 4.9 296 1,669,323 2,278,560 (27) 1,669,323 2,278,560 (27)
Profit before Taxation 9,306,375 7,610,287 22 9,327,813 7,653,188 22
Less: Income Tax Expense 4.10.1 (a) 298 2,503,778 2,423,234 3 2,521,008 2,442,327 3
Profit for the Year 6,802,597 5,187,053 31 6,806,805 5,210,861 31
Profit Attributable to:
Equity Holders of the Company 6,802,597 5,187,053 31 6,806,805 5,210,861 31
Non-Controlling Interest - - - - - -
Profit for the Year 6,802,597 5,187,053 31 6,806,805 5,210,861 31
Earnings per Share: Basic/Diluted (Rs.) 4.11 299 12.28 9.36 31 12.29 9.40 31
Dividend per Share (Rs.)* 4.12.3 301 7.00 -
*Dividend per share is calculated based on the interim dividend paid and the proposed final dividend which is to be approved at the Annual General Meeting.
Accounting Policies and Notes from pages 280 to 396 form an integral part of these Financial Statements.

L B Finance PLC | Annual Report 2020/21274
Statement of Comprehensive Income
Year ended 31 March Note Page No.
Company Group
2021 2020 Change 2021 2020 Change
Rs. ‘000 Rs. ‘000 % Rs. ‘000 Rs. ‘000 %
Profit for the Year 6,802,597 5,187,053 31 6,806,805 5,210,861 31
Other Comprehensive Income that will be Reclassified to Income Statement
Net Gains/(Losses) from Translating the Financial Statements of the Foreign Operations - - - 33,514 96,608 (65)
Less: Deferred Tax Charge/(Reversal) on above Items - - - - - -
Net Other Comprehensive Income that will be Reclassified to Income Statement - - - 33,514 96,608 (65)
Other Comprehensive Income that will never be Reclassified to Income Statement
Net Gains/(Losses) on Investment in Equity Instruments - Fair Value Through Other Comprehensive Income 18,648 (30,569) >100 18,648 (30,569) >100
Actuarial Gains/(Losses) on Defined Benefit Plans 4.33.3 357 40,349 (41,707) >100 40,349 (41,707) >100
Less: Deferred Tax Charge/(Reversal) on Actuarial Gains and Losses 4.10.1 (b) 298 9,684 (11,678) >100 9,684 (11,678) >100
Net Actuarial Gains/(Losses) on Defined Benefit Plans 30,665 (30,029) >100 30,665 (30,029) >100
Net Other Comprehensive Income that will never be Reclassified to Income Statement 49,313 (60,598) >100 49,313 (60,598) >100
Other Comprehensive Income for the Year, Net of Tax 49,313 (60,598) >100 82,827 36,010 >100
Total Comprehensive Income for the Year, Net of Tax 6,851,910 5,126,455 34 6,889,632 5,246,871 31
Attributable to:
Equity Holders of the Company 6,851,910 5,126,455 34 6,889,632 5,246,871 31
Non-Controlling Interest - - - - - -
Total Comprehensive Income for the Year, Net of Tax 6,851,910 5,126,455 34 6,889,632 5,246,871 31
Accounting Policies and Notes from pages 280 to 396 form an integral part of these Financial Statements.

L B Finance PLC | Annual Report 2020/21 275
Stability Leadership Strength Agility Responsibility Sustainability Success Supplementary Information
Statement of Financial Position
As at 31 March Note PageNo.
Company Group2021 2020 Change 2021 2020 Change
Rs. ‘000 Rs. ‘000 % Rs. ‘000 Rs. ‘000 %
AssetsCash and Cash Equivalents 4.15 319 6,187,300 6,162,637 0 6,380,786 6,472,312 (1)Financial Assets Recognised Through
Profit or Loss - Measured at Fair Value 4.16 320 10,862 4,648 >100 10,862 4,648 >100 Financial Assets at Amortised Cost
- Loans and Receivables 4.17 321 66,778,188 58,239,254 15 67,466,581 58,793,344 15 Financial Assets at Amortised Cost - Lease
Rentals Receivable and Stock out on Hire 4.18 326 47,359,635 60,626,670 (22) 47,359,635 60,626,670 (22)Financial Assets Measured at Fair Value
Through Other Comprehensive Income 4.20 336 77,789 59,141 32 77,789 59,141 32 Other Financial Assets 4.21 338 10,453,903 9,119,681 15 10,433,149 9,105,761 15 Other Non Financial Assets 4.22 339 920,406 967,469 (5) 927,830 976,489 (5)Investment in Subsidiary 4.23 340 521,162 521,162 - - - - Property, Plant and Equipment and
Right-of-Use Assets 4.24 340 8,241,259 8,221,248 0 8,250,546 8,228,222 0 Intangible Assets 4.25 346 26,021 41,809 (38) 36,271 55,064 (34)Total Assets 140,576,525 143,963,719 (2) 140,943,449 144,321,651 (2)
Liabilities Due to Banks 4.26 347 16,467,179 22,771,085 (28) 16,526,657 22,882,941 (28)Financial Liabilities at Amortised Cost
- Due to Depositors 4.27 350 85,860,070 89,256,435 (4) 85,940,213 89,315,097 (4)Debt Instruments Issued and
Other Borrowed Funds 4.28 352 3,113,916 3,111,186 0 3,113,916 3,111,186 0 Other Financial Liabilities 4.29 352 3,043,526 2,766,410 10 3,044,340 2,766,775 10 Other Non Financial Liabilities 4.30 354 1,028,054 909,266 13 1,051,185 925,778 14 Current Tax Liabilities 4.31 354 1,872,154 766,752 >100 1,877,558 777,057 >100 Deferred Tax Liabilities 4.32 354 637,073 1,037,580 (39) 637,073 1,037,580 (39)Post Employment Benefit Liability 4.33 356 365,265 345,456 6 365,265 345,456 6 Total Liabilities 112,387,237 120,964,170 (7) 112,556,207 121,161,870 (7)
EquityStated Capital 4.34 358 838,282 838,282 - 838,282 838,282 - Reserves 4.35 359 7,596,106 6,216,939 22 7,747,007 6,334,326 22 Retained Earnings 4.36 360 19,754,900 15,944,328 24 19,801,953 15,987,173 24 Total Equity Attributable to
Equity Holders of the Company 28,189,288 22,999,549 23 28,387,242 23,159,781 23 Non-Controlling Interest 4.37 360 - - - - - - Total Equity 28,189,288 22,999,549 23 28,387,242 23,159,781 23 Total Liabilities and Equity 140,576,525 143,963,719 (2) 140,943,449 144,321,651 (2)
Commitments and Contingencies 6.5 393 903,553 1,928,805 (53) 844,075 1,816,949 (54)Net Asset Value per Share (Rs.) 6.6 394 50.88 41.51 23 51.24 41.80 23
Accounting Policies and Notes from pages 280 to 396 form an integral part of these Financial Statements.
I certify that these Financial Statements are in compliance with the requirements of the Companies Act No. 07 of 2007.
Malith HewageAssistant General Manager - Finance
The Board of Directors is responsible for these Financial Statements. Approved and signed for and on behalf of the Board of Directors by,
J A S Sumith Adhihetty Mrs. Yogadinusha BhaskaranManaging Director Director
19 May 2021Colombo

L B Finance PLC | Annual Report 2020/21276
Not
ePa
ge
No.
St
ated
Capi
tal
Re
tain
ed
Ea
rnin
gs
Stat
utor
y
Re
serv
e F
air V
alue
Rese
rve
Fo
reig
n
Cu
rren
cy
Tr
ansl
atio
n
Re
serv
e
To
tal E
quity
Attr
ibut
able
to E
quity
Hol
ders
of t
he
Co
mpa
ny
N
on-
Co
ntro
lling
Inte
rest
To
tal
Eq
uity
Rs. ‘
000
Rs. ‘
000
Rs. ‘
000
Rs. ‘
000
Rs. ‘
000
Rs. ‘
000
Rs. ‘
000
Rs. ‘
000
Not
e 4.
34N
ote
4.36
Not
e 4.
35.1
Not
e 4.
35.2
Not
e 4.
35.3
Not
e 4.
37
Bala
nce
as a
t 31
Mar
ch 2
019
838
,282
12
,397
,809
5
,285
,759
(7
5,66
2) 2
0,77
9 1
8,46
6,96
7 -
1
8,46
6,96
7
Net
Pro
fit fo
r the
Yea
r -
5
,210
,861
-
-
-
5
,210
,861
-
5
,210
,861
Oth
er C
ompr
ehen
sive
Inco
me,
Net
of T
ax -
(3
0,02
9) -
(3
0,56
9) 9
6,60
8 3
6,01
0 -
3
6,01
0
Tota
l Com
preh
ensi
ve In
com
e fo
r the
Yea
r, N
et o
f Tax
-
5,1
80,8
32
-
(30,
569)
96,
608
5,2
46,8
71
-
5,2
46,8
71
Tran
sact
ions
with
Ow
ners
, Rec
ogni
sed
Dire
ctly
in E
quity
, Con
trib
utio
ns a
nd
Dis
trib
utio
ns to
Ow
ners
Tran
sfer
s D
urin
g th
e Ye
ar4.
35.1
359
-
(1,0
37,4
11)
1,0
37,4
11
-
-
-
-
-
Fina
l Divi
dend
for 2
018/
194.
12.1
301
-
(554
,057
) -
-
-
(5
54,0
57)
-
(554
,057
)
Tota
l Tra
nsac
tions
with
Equ
ity H
olde
rs
-
(1,5
91,4
68)
1,0
37,4
11
-
-
(554
,057
) -
(5
54,0
57)
Bala
nce
as a
t 31
Mar
ch 2
020
838
,282
15
,987
,173
6
,323
,170
(1
06,2
31)
117
,387
2
3,15
9,78
1 -
2
3,15
9,78
1
Net
Pro
fit fo
r the
Yea
r -
6
,806
,805
-
-
-
6
,806
,805
-
6
,806
,805
Oth
er C
ompr
ehen
sive
Inco
me,
Net
of T
ax -
3
0,66
5 -
1
8,64
8 3
3,51
4 8
2,82
7 -
8
2,82
7
Tota
l Com
preh
ensi
ve In
com
e fo
r the
Yea
r, N
et o
f Tax
-
6,8
37,4
70
-
18,
648
33,
514
6,8
89,6
32
-
6,8
89,6
32
Tran
sact
ions
with
Ow
ners
, Rec
ogni
sed
Dire
ctly
in E
quity
, Con
trib
utio
ns a
nd
Dis
trib
utio
ns to
Ow
ners
Tran
sfer
s D
urin
g th
e Ye
ar4.
35.1
359
-
(1,3
60,5
19)
1,3
60,5
19
-
-
-
-
-
Inte
rim D
ivide
nd fo
r 202
0/21
4.12
.130
1 -
(1
,662
,171
) -
-
-
(1
,662
,171
) -
(1
,662
,171
)
Tota
l Tra
nsac
tions
with
Equ
ity H
olde
rs
-
(3,0
22,6
90)
1,3
60,5
19
-
-
(1,6
62,1
71)
-
(1,6
62,1
71)
Bala
nce
as a
t 31
Mar
ch 2
021
838
,282
19
,801
,953
7
,683
,689
(8
7,58
3) 1
50,9
01
28,
387,
242
-
28,
387,
242
Figu
res
in b
rack
ets
indi
cate
ded
uctio
ns.
Acco
untin
g Po
licie
s an
d N
otes
from
pag
es 2
80 to
396
form
an
inte
gral
par
t of t
hese
Fin
anci
al S
tate
men
ts.
Note Page No.
Stated Capital
Retained Earnings
Statutory Reserve
Fair Value Reserve
Total Equity
Rs. ‘000 Rs. ‘000 Rs. ‘000 Rs. ‘000 Rs. ‘000
Note 4.34 Note 4.36 Note 4.35.1 Note 4.35.2
Balance as at 31 March 2019 838,282 12,378,772 5,285,759 (75,662) 18,427,151
Net Profit for the Year - 5,187,053 - - 5,187,053
Other Comprehensive Income, Net of Tax - (30,029) - (30,569) (60,598)
Total Comprehensive Income for the Year, Net of Tax - 5,157,024 - (30,569) 5,126,455
Transactions with Owners, Recognised Directly in Equity, Contributions and Distributions to Owners
Transfers During the Year 4.35.1 359 - (1,037,411) 1,037,411 - -
Final Dividend for 2018/19 4.12.1 301 - (554,057) - - (554,057)
Total Transactions with Equity Holders - (1,591,468) 1,037,411 - (554,057)
Balance as at 31 March 2020 838,282 15,944,328 6,323,170 (106,231) 22,999,549
Net Profit for the Year - 6,802,597 - - 6,802,597
Other Comprehensive Income, Net of Tax - 30,665 - 18,648 49,313
Total Comprehensive Income for the Year, Net of Tax - 6,833,262 - 18,648 6,851,910
Transactions with Owners, Recognised Directly in Equity, Contributions and Distributions to Owners
Transfers During the Year 4.35.1 359 - (1,360,519) 1,360,519 - -
Interim Dividend for 2020/21 4.12.1 301 - (1,662,171) - - (1,662,171)
Total Transactions with Equity Holders - (3,022,690) 1,360,519 - (1,662,171)
Balance as at 31 March 2021 838,282 19,754,900 7,683,689 (87,583) 28,189,288
Figures in brackets indicate deductions.
Accounting Policies and Notes from pages 280 to 396 form an integral part of these Financial Statements.
Statement of Changes in Equity - Company

L B Finance PLC | Annual Report 2020/21 277
Stability Leadership Strength Agility Responsibility Sustainability Success Supplementary Information
Statement of Changes in Equity - GroupN
ote
Page
N
o.
Stat
ed
Ca
pita
l
Reta
ined
Earn
ings
St
atut
ory
Rese
rve
Fai
r Val
ue
Re
serv
e
Fore
ign
Curr
ency
Tran
slat
ion
Rese
rve
To
tal E
quity
Attr
ibut
able
to E
quity
Hol
ders
of t
he
Co
mpa
ny
N
on-
Co
ntro
lling
Inte
rest
To
tal
Eq
uity
Rs. ‘
000
Rs. ‘
000
Rs. ‘
000
Rs. ‘
000
Rs. ‘
000
Rs. ‘
000
Rs. ‘
000
Rs. ‘
000
Not
e 4.
34N
ote
4.36
Not
e 4.
35.1
Not
e 4.
35.2
Not
e 4.
35.3
Not
e 4.
37
Bala
nce
as a
t 31
Mar
ch 2
019
838
,282
12
,397
,809
5
,285
,759
(7
5,66
2) 2
0,77
9 1
8,46
6,96
7 -
1
8,46
6,96
7
Net
Pro
fit fo
r the
Yea
r -
5
,210
,861
-
-
-
5
,210
,861
-
5
,210
,861
Oth
er C
ompr
ehen
sive
Inco
me,
Net
of T
ax -
(3
0,02
9) -
(3
0,56
9) 9
6,60
8 3
6,01
0 -
3
6,01
0
Tota
l Com
preh
ensi
ve In
com
e fo
r the
Yea
r, N
et o
f Tax
-
5,1
80,8
32
-
(30,
569)
96,
608
5,2
46,8
71
-
5,2
46,8
71
Tran
sact
ions
with
Ow
ners
, Rec
ogni
sed
Dire
ctly
in E
quity
, Con
trib
utio
ns a
nd
Dis
trib
utio
ns to
Ow
ners
Tran
sfer
s D
urin
g th
e Ye
ar4.
35.1
359
-
(1,0
37,4
11)
1,0
37,4
11
-
-
-
-
-
Fina
l Divi
dend
for 2
018/
194.
12.1
301
-
(554
,057
) -
-
-
(5
54,0
57)
-
(554
,057
)
Tota
l Tra
nsac
tions
with
Equ
ity H
olde
rs
-
(1,5
91,4
68)
1,0
37,4
11
-
-
(554
,057
) -
(5
54,0
57)
Bala
nce
as a
t 31
Mar
ch 2
020
838
,282
15
,987
,173
6
,323
,170
(1
06,2
31)
117
,387
2
3,15
9,78
1 -
2
3,15
9,78
1
Net
Pro
fit fo
r the
Yea
r -
6
,806
,805
-
-
-
6
,806
,805
-
6
,806
,805
Oth
er C
ompr
ehen
sive
Inco
me,
Net
of T
ax -
3
0,66
5 -
1
8,64
8 3
3,51
4 8
2,82
7 -
8
2,82
7
Tota
l Com
preh
ensi
ve In
com
e fo
r the
Yea
r, N
et o
f Tax
-
6,8
37,4
70
-
18,
648
33,
514
6,8
89,6
32
-
6,8
89,6
32
Tran
sact
ions
with
Ow
ners
, Rec
ogni
sed
Dire
ctly
in E
quity
, Con
trib
utio
ns a
nd
Dis
trib
utio
ns to
Ow
ners
Tran
sfer
s D
urin
g th
e Ye
ar4.
35.1
359
-
(1,3
60,5
19)
1,3
60,5
19
-
-
-
-
-
Inte
rim D
ivide
nd fo
r 202
0/21
4.12
.130
1 -
(1
,662
,171
) -
-
-
(1
,662
,171
) -
(1
,662
,171
)
Tota
l Tra
nsac
tions
with
Equ
ity H
olde
rs
-
(3,0
22,6
90)
1,3
60,5
19
-
-
(1,6
62,1
71)
-
(1,6
62,1
71)
Bala
nce
as a
t 31
Mar
ch 2
021
838
,282
19
,801
,953
7
,683
,689
(8
7,58
3) 1
50,9
01
28,
387,
242
-
28,
387,
242
Figu
res
in b
rack
ets
indi
cate
ded
uctio
ns.
Acco
untin
g Po
licie
s an
d N
otes
from
pag
es 2
80 to
396
form
an
inte
gral
par
t of t
hese
Fin
anci
al S
tate
men
ts.

L B Finance PLC | Annual Report 2020/21278
Statement of Cash Flows
Accounting Policy The cash flow statement has been prepared by using ‘The Indirect Method’ in accordance with the Sri Lanka Accounting Standard - LKAS 07 (Statement of Cash Flows), whereby operating activities, financing activities and investing activities have been recognised. Cash and cash equivalents comprise short term, highly liquid investments that are readily convertible to known amounts of cash and are subject to an insignificant risk of changes in value. The cash and cash equivalents consist of cash in hand, balances with banks, placements with banks, money at call and short notice.
Year ended 31 March Note Page No.
Company Group
2021 2020 2021 2020
Rs. ‘000 Rs. ‘000 Rs. ‘000 Rs. ‘000
Cash Flows From/(Used in) Operating Activities
Profit and Other Comprehensive Income before Taxation 9,365,372 7,538,011 9,420,324 7,677,520
Adjustments for -
Depreciation of Property, Plant and Equipment 4.7.1 295 728,793 697,508 730,913 698,639
Amortisation of Intangible Assets 4.7.2 295 16,446 15,882 20,019 18,125
Impairment Charges and Other Losses 4.5 290 1,691,734 1,831,057 1,727,907 1,856,495
Diminution/(Appreciation) in Value of Investments (24,862) 32,786 (24,862) 32,786
Loss/(Profit) on Disposal of Property, Plant and Equipment 4.4 290 (24,425) (4,110) (24,425) (4,110)
Provision/(Reversal) for Defined Benefit Plans 4.33.1 356 53,569 117,650 53,569 117,650
Foreign Currency Exchange (Gain)/Loss - - 479 8,480
Dividend Received (3,496) (6,777) (3,496) (6,777)
Net Unrealised (Gains)/Losses Arising from Translating the Financial Statements of Foreign Operations - - (33,514) (96,608)
Operating Profit before Changes in Operating Assets and Liabilities 11,803,131 10,222,007 11,866,914 10,302,200
(Increase)/Decrease in Operating Assets
(Increase)/Decrease in Financial Assets at Amortised Cost-Loans and Receivables (9,654,407) (11,958,602) (9,824,884) (12,159,450)
(Increase)/Decrease in Financial Assets at Amortised Cost-Lease Rentals Receivable and Stock out on Hire 12,699,246 4,714,850 12,699,246 4,714,850
(Increase)/Decrease in Other Financial Assets (1,342,692) 1,677,062 (1,335,857) 1,681,138
(Increase)/Decrease in Other Non Financial Assets 47,063 99,892 48,659 193,185
1,749,210 (5,466,798) 1,587,164 (5,570,277)
Increase/(Decrease) in Operating Liabilities
Increase/(Decrease) in Financial Liabilities at Amortised Cost - Due to Depositors (3,396,365) 6,041,485 (3,374,884) 6,072,480
Increase/(Decrease) in Other Financial Liabilities (20,411) (620,905) 13,552 (620,539)
Increase/(Decrease) in Other Non Financial Liabilities 327,909 (1,599,039) 335,808 (1,591,414)
(3,088,867) 3,821,541 (3,025,524) 3,860,527
Cash Generated From Operations 10,463,474 8,576,750 10,428,554 8,592,450
Retirement Benefit Liabilities Paid 4.33.1 356 (33,760) (28,706) (33,760) (28,706)
Income Tax Paid 4.10.4 299 (2,017,689) (2,875,243) (2,042,147) (2,897,059)
Net Cash From/(Used in) Operating Activities 8,412,025 5,672,801 8,352,647 5,666,685
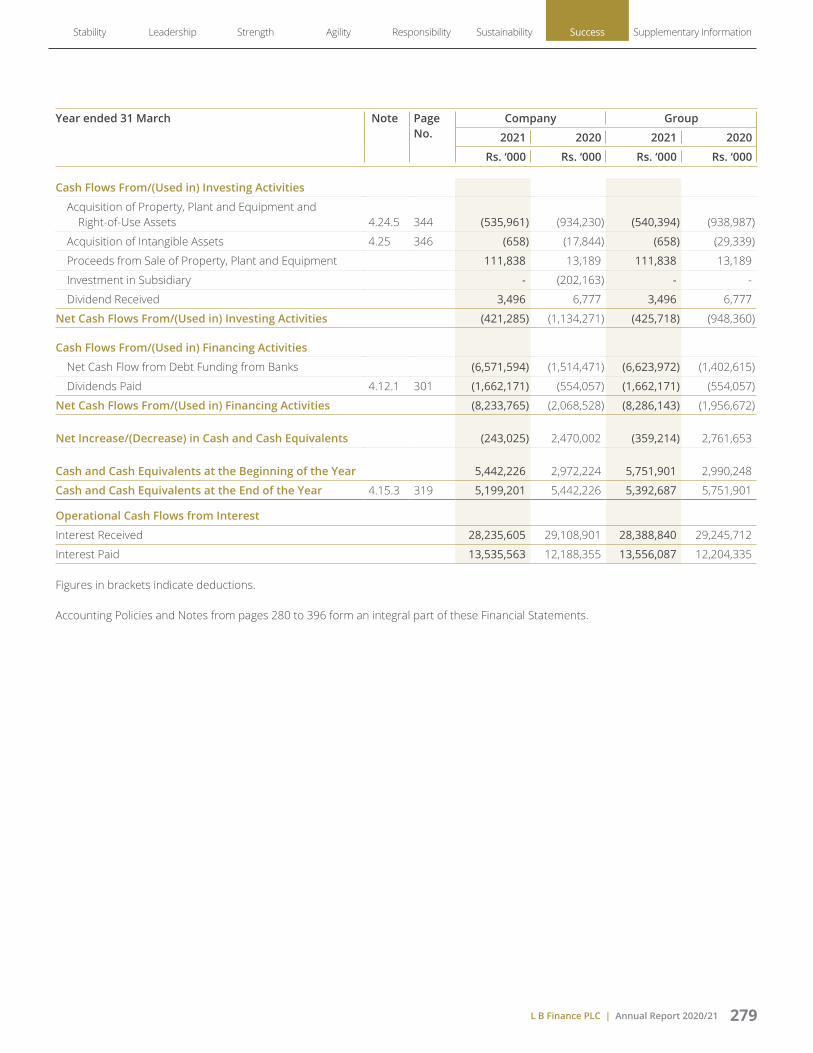
L B Finance PLC | Annual Report 2020/21 279
Stability Leadership Strength Agility Responsibility Sustainability Success Supplementary Information
Year ended 31 March Note Page No.
Company Group
2021 2020 2021 2020
Rs. ‘000 Rs. ‘000 Rs. ‘000 Rs. ‘000
Cash Flows From/(Used in) Investing Activities
Acquisition of Property, Plant and Equipment and Right-of-Use Assets 4.24.5 344 (535,961) (934,230) (540,394) (938,987)
Acquisition of Intangible Assets 4.25 346 (658) (17,844) (658) (29,339)
Proceeds from Sale of Property, Plant and Equipment 111,838 13,189 111,838 13,189
Investment in Subsidiary - (202,163) - -
Dividend Received 3,496 6,777 3,496 6,777
Net Cash Flows From/(Used in) Investing Activities (421,285) (1,134,271) (425,718) (948,360)
Cash Flows From/(Used in) Financing Activities
Net Cash Flow from Debt Funding from Banks (6,571,594) (1,514,471) (6,623,972) (1,402,615)
Dividends Paid 4.12.1 301 (1,662,171) (554,057) (1,662,171) (554,057)
Net Cash Flows From/(Used in) Financing Activities (8,233,765) (2,068,528) (8,286,143) (1,956,672)
Net Increase/(Decrease) in Cash and Cash Equivalents (243,025) 2,470,002 (359,214) 2,761,653
Cash and Cash Equivalents at the Beginning of the Year 5,442,226 2,972,224 5,751,901 2,990,248
Cash and Cash Equivalents at the End of the Year 4.15.3 319 5,199,201 5,442,226 5,392,687 5,751,901
Operational Cash Flows from Interest
Interest Received 28,235,605 29,108,901 28,388,840 29,245,712
Interest Paid 13,535,563 12,188,355 13,556,087 12,204,335
Figures in brackets indicate deductions.
Accounting Policies and Notes from pages 280 to 396 form an integral part of these Financial Statements.
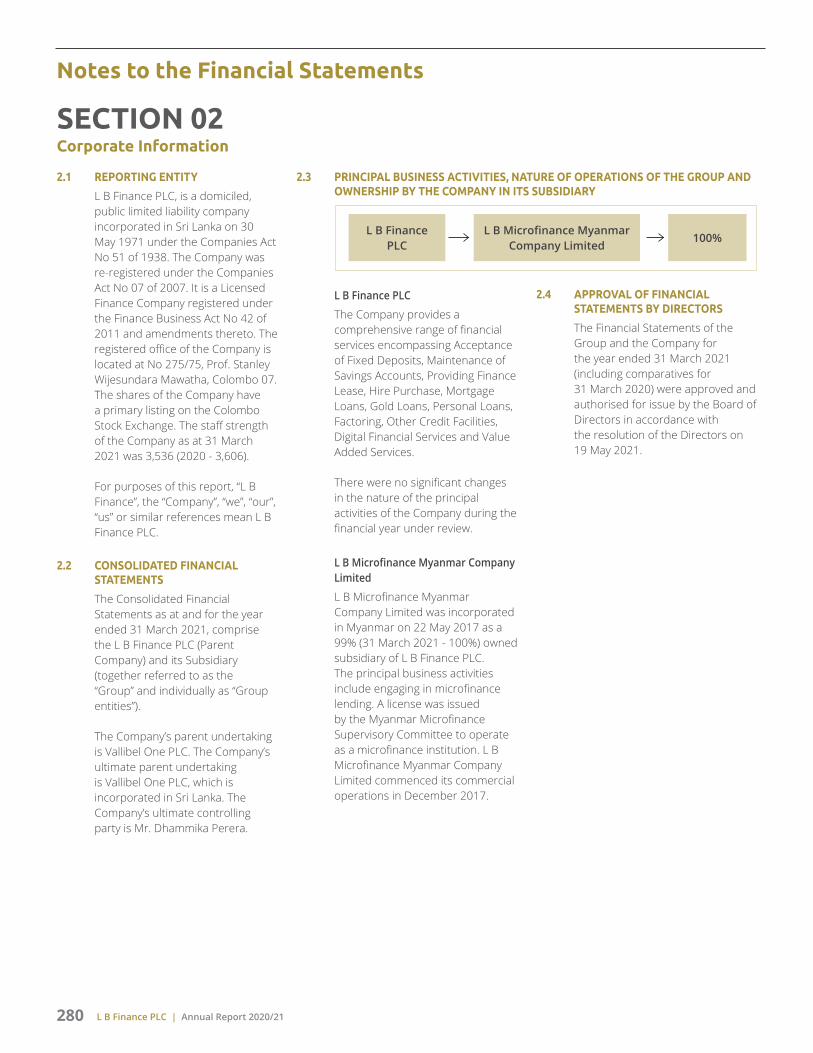
L B Finance PLC | Annual Report 2020/21280
Notes to the Financial Statements
SECTION 02
Corporate Information
2.1 REPORTING ENTITY
L B Finance PLC, is a domiciled, public limited liability company incorporated in Sri Lanka on 30 May 1971 under the Companies Act No 51 of 1938. The Company was re-registered under the Companies Act No 07 of 2007. It is a Licensed Finance Company registered under the Finance Business Act No 42 of 2011 and amendments thereto. The registered office of the Company is located at No 275/75, Prof. Stanley Wijesundara Mawatha, Colombo 07. The shares of the Company have a primary listing on the Colombo Stock Exchange. The staff strength of the Company as at 31 March 2021 was 3,536 (2020 - 3,606).
For purposes of this report, “L B Finance”, the “Company”, “we”, “our”, “us” or similar references mean L B Finance PLC.
2.2 CONSOLIDATED FINANCIAL STATEMENTS
The Consolidated Financial Statements as at and for the year ended 31 March 2021, comprise the L B Finance PLC (Parent Company) and its Subsidiary (together referred to as the “Group” and individually as “Group entities”).
The Company’s parent undertaking is Vallibel One PLC. The Company’s ultimate parent undertaking is Vallibel One PLC, which is incorporated in Sri Lanka. The Company’s ultimate controlling party is Mr. Dhammika Perera.
2.3 PRINCIPAL BUSINESS ACTIVITIES, NATURE OF OPERATIONS OF THE GROUP AND OWNERSHIP BY THE COMPANY IN ITS SUBSIDIARY
100%L B Finance
PLCL B Microfinance Myanmar
Company Limited
L B Finance PLC
The Company provides a comprehensive range of financial services encompassing Acceptance of Fixed Deposits, Maintenance of Savings Accounts, Providing Finance Lease, Hire Purchase, Mortgage Loans, Gold Loans, Personal Loans, Factoring, Other Credit Facilities, Digital Financial Services and Value Added Services.
There were no significant changes in the nature of the principal activities of the Company during the financial year under review.
L B Microfinance Myanmar Company Limited
L B Microfinance Myanmar Company Limited was incorporated in Myanmar on 22 May 2017 as a 99% (31 March 2021 - 100%) owned subsidiary of L B Finance PLC. The principal business activities include engaging in microfinance lending. A license was issued by the Myanmar Microfinance Supervisory Committee to operate as a microfinance institution. L B Microfinance Myanmar Company Limited commenced its commercial operations in December 2017.
2.4 APPROVAL OF FINANCIAL STATEMENTS BY DIRECTORS
The Financial Statements of the Group and the Company for the year ended 31 March 2021 (including comparatives for 31 March 2020) were approved and authorised for issue by the Board of Directors in accordance with the resolution of the Directors on 19 May 2021.

L B Finance PLC | Annual Report 2020/21 281
Stability Leadership Strength Agility Responsibility Sustainability Success Supplementary Information
Basis of Preparation2.5 STATEMENT OF COMPLIANCE
Financial Statements of the Group and the separate Financial Statements of the Company which comprise the Statement of Financial Position, Income Statement, Statement of Comprehensive Income, Statement of Changes in Equity, Statement of Cash Flows, Accounting Policies and Notes, have been prepared and presented in accordance with Sri Lanka Accounting Standards (SLFRSs and LKASs) laid down by the Institute of Chartered Accountants of Sri Lanka (CA Sri Lanka) and in compliance with the requirements of the Companies Act No 07 of 2007. The presentation of these Financial Statements is also in compliance with the requirements of Finance Business Act No 42 of 2011, Listing Rules of the Colombo Stock Exchange and the Central Bank of Sri Lanka (CBSL) guidelines.
These Financial Statements, except for information on cash flows have been prepared following the accrual basis of accounting.
The Group did not adopt any inappropriate accounting treatments, which are not in compliance with the requirements of the SLFRSs and LKASs, regulations governing the preparation and presentation of the Financial Statements.
2.6 RESPONSIBILITIES FOR THE FINANCIAL STATEMENTS
The Board of Directors of the Company is responsible for these Financial Statements of the Group and the Company as per the provisions of the Companies Act No 07 of 2007 and Sri Lanka Accounting Standards.
The Board of Directors acknowledges the responsibility in relation to the Financial
Statements, as set out in the ‘Directors’ Responsibility for Financial Reporting’, ‘Annual Report of the Board of Directors’ and in the statement appearing with the Statement of Financial Position of the Annual Report.
2.7 APPLICATION OF SRI LANKA ACCOUNTING STANDARDS
2.7.1 Amendments to LKAS 01 and LKAS 08: Definition of Material
Amendments to Sri Lanka Accounting Standard - LKAS 01 (Presentation of Financial Statements) and Sri Lanka Accounting Standard - LKAS 08 (Accounting Policies, Changes in Accounting Estimates and Errors) are made to align the definition of ‘material’ across the standards and to clarify certain aspects of the term ‘definition’. These amendments had no significant impact on the Consolidated Financial Statements of, nor is there expected to be any future impact to, the Group.
2.7.2 Amendments to SLFRS 03: Definition of a Business
Amendments to the definition of a business in Sri Lanka Accounting Standard - SLFRS 03 (Business Combinations) are made to help entities determine whether an acquired set of activities and assets is a business or not. These amendments had no impact on the Consolidated Financial Statements of the Group, but may impact future periods should the Group enter into any business combinations.
2.7.3 Amendments to the Conceptual Framework for Financial Reporting
CA Sri Lanka issued a revised Conceptual Framework which included some new concepts, updated definitions and recognition
criteria for assets and liabilities and clarified some important concepts. These amendments had no significant impact on the Consolidated Financial Statements of the Group.
2.8 BASIS OF MEASUREMENT
The Financial Statements of the Group have been prepared on the historical cost basis, except for the following material items in the Statement of Financial Position:
Financial assets recognised through profit or loss - measured at fair value
Financial assets measured at fair value through other comprehensive income
Liabilities for defined benefit obligations are recognised using an actuarial technique (projected unit credit method)
2.9 GOING CONCERN
The Management has made an assessment of its ability to continue as a going concern and is satisfied that it has the resources to continue in business for the foreseeable future. In making this assessment, the Board has considered a wide range of information relating to present and future conditions. The Directors assessed the future performance of the business and satisfied that it has the resources in place that are required to meet its ongoing regulatory requirements. The assessment is based upon business plans which contain future projections of profitability as well as projections of regulatory capital requirements and business funding needs. The forecast also includes an assessment of the impact under stressed scenario which reflects the impact of uncertainty that the COVID-19 has had on Group’s operation.

L B Finance PLC | Annual Report 2020/21282
Notes to the Financial Statements
The business plan showed that the Group had sufficient capital in place to support its future business requirements and remained above its regulatory minimum requirements in the stress scenarios. Accordingly, the Directors concluded that there was a reasonable expectation that the Group has adequate resources to continue as a Going Concern for a period of at least 12 months from the date of approval of the financial statements. Furthermore, the Management is not aware of any material uncertainties that may cast significant doubt upon the Group’s ability to continue as a going concern. Therefore, the Financial Statements of the Group continue to be prepared on a going concern basis.
2.10 FUNCTIONAL AND PRESENTATION CURRENCY
The Financial Statements of the Company are presented in Sri Lankan Rupees, which is the currency of the primary economic environment in which L B Finance PLC operates.
Each entity in the Group determines its own functional currency and items included in the Financial Statements of these entities are measured using that Functional Currency. These Financial Statements are presented in Sri Lankan Rupees, the Group’s Functional and Presentation Currency.
2.11 PRESENTATION OF FINANCIAL STATEMENTS
Assets and Liabilities of the Group presented in their Statements of Financial Position are grouped by nature and listed in an order that reflects their relative liquidity and maturity pattern. No adjustments have been made for inflationary factors affecting the Financial Statements. An analysis on recovery or settlement within 12 months after the reporting date (current)
and more than 12 months after the reporting date (non–current) is presented in Note 6.3 on ‘Current and Non Current Analysis of Assets and Liabilities’ to these Financial Statements.
2.12 USE OF MATERIALITY, AGGREGATION, OFFSETTING AND ROUNDING
Materiality and Aggregation
In compliance with Sri Lanka Accounting Standard - LKAS 01 (Presentation of Financial Statements), each material class of similar items is presented separately in the Financial Statements. Items of dissimilar nature or functions too are presented separately unless they are immaterial.
Offsetting
Financial assets and financial liabilities are offset and the net amount reported in the Statement of Financial Position only when there is a legally enforceable right to offset the recognised amounts and there is an intention to settle on a net basis, or to realise the assets and settle the liability simultaneously. Income and expenses are not offset in the Income Statement unless required or permitted by an Accounting Standard.
Rounding
The amounts in the Financial Statements have been rounded off to the nearest Rupees thousands, except where otherwise indicated as permitted by the Sri Lanka Accounting Standard - LKAS 01 (Presentation of Financial Statements).
2.13 COMPARATIVE INFORMATION
Comparative information including quantitative, narrative and descriptive information is disclosed in respect of the previous period in the Financial Statements in order to enhance the understanding
of the current period’s Financial Statements and to enhance the inter period comparability. The presentation and classification of the Financial Statements of the previous year are amended, where relevant for better presentation and to be comparable with those of the current year.
2.14 SRI LANKA ACCOUNTING STANDARDS ISSUED BUT NOT YET EFFECTIVE AS AT 31 MARCH 2021
The new and amended standards and interpretations that are issued, but not yet effective, upto the date of issuance of Financial Statements are disclosed below. The Group intends to adopt these new and amended standards and interpretations, if applicable, when they become effective.
2.14.1 Amendments to SLFRS 09, LKAS 39, SLFRS 07, SLFRS 04 and SLFRS 16: Interest Rate Benchmark Reform (Phase 1 & 2)
The amendments to Sri Lanka Accounting Standard - SLFRS 09 (Financial Instruments) & Sri Lanka Accounting Standard - LKAS 39 (Financial Instruments Recognition & Measurement) provide a number of reliefs, which apply to all hedging relationships that are directly affected by interest rate benchmark reform. A hedging relationship is affected if the reform gives rise to uncertainty about the timing and/or amount of benchmark-based cash flows of the hedged item or the hedging instrument. IBOR reforms Phase 2 include number of reliefs and additional disclosures. Amendments supports companies in applying SLFRS when changes are made to contractual cashflows or hedging relationships because of the reform. These amendments to various standards are effective for the annual reporting periods beginning on or after 1 January 2021.

L B Finance PLC | Annual Report 2020/21 283
Stability Leadership Strength Agility Responsibility Sustainability Success Supplementary Information
2.14.2 Amendments to SLFRS 16: COVID-19 Related Rent Concessions
The amendments provide relief to lessees from applying Sri Lanka Accounting Standard - SLFRS 16 (Leases) guidance on lease modification accounting for rent concessions arising as a direct consequence of the COVID-19 pandemic. As a practical expedient, a lessee may elect not to assess whether a COVID-19 related rent concession from a lessor is a lease modification. A lessee that makes this election accounts for any change in lease payments resulting from COVID-19 related rent concession the same way it would account for the change under SLFRS16, if the change were not a lease modification. The amendment applies to annual reporting periods beginning on or after 1 June 2020.
None of the new or amended pronouncements are expected to have a material impact on the Financial Statements of the Group in the foreseeable future.
2.15 CHANGES IN ACCOUNTING POLICIES
The accounting policies adopted by the Group are consistent with those used in the previous financial year.
2.16 SIGNIFICANT ACCOUNTING ASSUMPTIONS, JUDGMENTS AND ESTIMATION UNCERTAINTIES
The preparation of Financial Statements of the Group in conformity with Sri Lanka Accounting Standards requires the management to make assumptions, judgments and estimates that affect the application of accounting policies and the reported amounts of assets, liabilities, income and expenses. Due to the inherent uncertainty involved with estimates, actual results may differ from these estimates.
Estimates and underlying assumptions are reviewed on an ongoing basis. Revisions to accounting estimates are recognised in the period in which the estimate is revised and in any future periods affected.
During 2021, estimation uncertainty has been affected by the COVID-19 pandemic and continued to cause significant economic and social disruption. While the specific areas of judgement may not change, the impact of COVID-19 resulted in the application of further judgement within those areas due to the evolving nature of the pandemic and the limited recent experience of the economic and financial impacts of such an event. The Group used the key financial estimates based on management’s latest available information while ensuring the compliances with the circulars and guidelines issued by the CBSL and the CA Sri Lanka. The Group has adopted additional judgements due to the prolonged financial effect of the COVID-19 pandemic on the economy.
The most significant areas of estimation uncertainties, critical judgments and assumptions in applying accounting policies that have most significant effect on the amounts recognised in the Financial Statements of the Group are as follows;
3.8 Impairment of Non Financial Assets
3.9 Estimating Incremental Borrowing Rate
4.10 Taxation
4.13 Classification of Financial Assets and Liabilities
4.14 Fair Value of Financial Instruments
4.19 Allowance for Impairment Losses
4.23 Investment in Subsidiary
4.24 Useful Lifetime of the Property, Plant and Equipment
4.25 Useful Lifetime of the Intangible Assets
4.32 Deferred Tax Liabilities
4.33 Post Employment Benefit Liability
6.5 Commitments and Contingencies
6.9 Events Occurring after the Reporting Date

L B Finance PLC | Annual Report 2020/21284
SECTION 03General Accounting Policies and Notes
Accounting policy relating to each accounting topic is given along with the relevant note to the Financial Statements. The other significant accounting policies are described below;
3.1 BASIS OF CONSOLIDATION
The Group’s Financial Statements comprise, Consolidated Financial Statements of the Company and its Subsidiary in terms of the Sri Lanka Accounting Standard - SLFRS 10 (Consolidated Financial Statements).
3.1.1 Non-Controlling Interest
Details of Non-Controlling Interest are given in Note 4.37 to these Financial Statements.
3.1.2 Subsidiary
Details of the Company’s subsidiary are set out in Note 4.23 to these Financial Statements.
3.1.3 Loss of Control
When the Group losses control over a subsidiary, it derecognises the assets and liabilities of the subsidiary, and any related Non-Controlling Interest and other components of equity. Any resulting gain or loss is recognised in Income Statement. Any interest retained in the former subsidiary is measured at fair value when control is lost. Subsequently, it is accounted for as an Associate or in accordance with the Group’s Accounting Policy for financial instruments depending on the level of influence retained.
3.1.4 Transactions Eliminated on Consolidation
Intra-group balances, transactions and any unrealised income and expenses (except for foreign currency transaction gains or losses) arising from intra-group transactions are eliminated in
preparing the Consolidated Financial Statements. Unrealised gains arising from transactions with equity accounted investees are eliminated against the investment to the extent of the Group’s interest in the investee. Unrealised losses are eliminated in the same way as unrealised gains, but only to the extent that there is no evidence of impairment.
3.2 FOREIGN CURRENCY
3.2.1 Foreign Currency Transactions and Balances
Foreign currency transactions are translated into the functional currency, which is Sri Lankan Rupees, using the exchange rates prevailing at the dates of the transactions. In this regard, the Company’s practice is to use the middle rate of exchange ruling at the date of the transaction.
Monetary assets and liabilities denominated in foreign currencies as at the reporting date are translated into the functional currency at the middle exchange rate of the functional currency ruling as at the reporting date. The foreign currency gain or loss on monetary items is the difference between amortised cost in the functional currency as at the beginning of the year adjusted for effective interest and payments during the year and the amortised cost in foreign currency translated at the exchange rate as at the reporting date.
Non-monetary assets and liabilities denominated in foreign currencies that are measured at fair value are translated into the functional currency at the spot exchange rate at the date that the fair value was determined. Non-monetary
items that are measured in terms of historical cost in a foreign currency are translated using the exchange rate as at the date of the transaction.
Foreign currency differences arising on translation are generally recognised in Income Statement. However, foreign currency differences arising from the translation of available for sale equity instruments are recognised in Other Comprehensive Income.
3.2.2 Foreign Currency Translations
The Group’s Consolidated Financial Statements are presented in Sri Lankan Rupees, which is also the Company’s functional currency. The Financial Statements of the foreign operations of the Company have been translated into the Group’s presentation currency as explained under Note 3.2.3 below.
3.2.3 Foreign Operations
The results and financial position of overseas operations that have a functional currency different from the Company’s presentation currency are translated into the Company’s presentation currency as follows;
Assets and liabilities, including goodwill and fair value adjustments arising on acquisition, are translated at the rates of exchange rates ruling as at the reporting date.
Income and expenses are translated at the average exchange rate for the period, unless this average rate is not a reasonable approximation of the rate prevailing at the transaction date, in which case income and expenses are translated at the exchange rates ruling at the transaction date.
Notes to the Financial Statements

L B Finance PLC | Annual Report 2020/21 285
Stability Leadership Strength Agility Responsibility Sustainability Success Supplementary Information
All resulting exchange differences are recognised in the Other Comprehensive Income and accumulated in the Foreign Currency Translation Reserve (Translation Reserve), which is a separate component of Equity, except to the extent that the translation difference is allocated to the Non-Controlling Interest.
When a foreign operation is disposed of such that the control is lost, the cumulative amount in the translation reserve related to that foreign operation is reclassified to Income Statement as part of the gain or loss on disposal. If the Group disposes of only part of its interest in a subsidiary that includes a foreign operation while retaining control, then the relevant proportion of the cumulative amount of the translation reserve is reattributed to Non-Controlling Interest.
3.3 PROVISIONS
A provision is recognised if, as a result of a past event, the Group has a present legal or constructive obligation that can be estimated reliably, and it is probable that an outflow of economic benefits will be required to settle the obligation.
The amount recognised is the best estimate of the consideration required to settle the present obligation at the reporting date, taking into account the risks and uncertainties surrounding the obligation at that date. Where a provision is measured using the cash flows estimated to settle the present obligation, its carrying amount is determined based on the present value of those cash flows. A provision for onerous contracts is recognised when the expected benefits to be derived by the Group from a contract are lower than the unavoidable cost of meeting its obligations under the contract. The provision is measured as the present value of the lower of the
expected cost of terminating the contract and the expected net cost of continuing with the contract.
Before a provision is established, the Group recognises any impairment loss on the assets associated with that contract. The expense relating to any provision is presented in the Income Statement net of any reimbursement.
3.4 OPERATIONAL RISK EVENTS
Provisions for operational risk events are recognised for losses incurred by the Group which do not relate directly to amounts of principal outstanding for loans and advances. The amount recognised as a provision is the best estimate of the expenditure required to settle the present obligation as at the reporting date, taking into account the risks and uncertainties that surround the events and circumstances that affect the provision.
3.5 OTHER TAXES
3.5.1 Economic Service Charge (ESC)
As per provisions of the Economic Service Charge (ESC) Act No 13 of 2006 and subsequent amendments thereto, ESC was payable on Company’s liable turnover at 0.5% and was deductible from income tax payable. As per Notice dated 31 December 2019 published by the Department of Inland Revenue, ESC was abolished with effect from 1 January 2020.
3.5.2 Withholding Tax (WHT) on Dividends
Withholding Tax arises from the distribution of dividends by the Company and is recognised at the time the liability to pay the related dividend is recognised. As per Notice dated 18 February 2020 published by the Department of Inland Revenue, requirement to deduct WHT on dividends has been removed effective 1 January 2020.
3.6 BORROWING COSTS
As per the Sri Lanka Accounting Standard – LKAS 23 (Borrowing Costs), the Group capitalises borrowing costs that are directly attributable to the acquisition, construction or production of a qualifying asset as part of the cost of the asset. A qualifying asset is an asset which takes a substantial period of time to get ready for its intended use or sale. Other borrowing costs are recognised in the Income Statement in the period in which they occur.
3.7 FINANCIAL GUARANTEES AND LOAN COMMITMENTS
Financial guarantees are contracts that require the Group to make specified payments to reimburse the holder for a loss that it incurs because a specified debtor fails to make payment when it is due in accordance with the terms of a debt instrument. Loan commitments are firm commitments to provide credit under pre-specified terms and conditions.
Loan commitments at below market interest rates drawdown are initially measured at fair value and subsequently measured at the higher of the amount of the ECL allowance and the amount initially recognised less, when appropriate, the cumulative amount of income recognised.
The nominal contractual value of financial guarantees, letters of credit and undrawn loan commitments, where the loan agreed to be provided is on market terms, are not recorded in the Statement of Financial Position.
Loan types with undrawn limits are expected to change the exposure over a period due to the available portion in the unutilised limit. The drawdowns for unutilised portions (only for Stage 01 and 02) is considered by applying the

L B Finance PLC | Annual Report 2020/21286
behavioral (average) use of the facility over the given period and current excess over the average (positive net exposure).Then the positive net exposure is classified as 12 month or lifetime expected credit loss.
Details of commitments and contingencies are presented in Note 6.5 to these Financial Statements.
3.8 IMPAIRMENT OF NON FINANCIAL ASSETS
The Group assess at each reporting date whether there is an indication that an asset may be impaired. If any indication exists, or when annual impairment testing for an asset is required, the Group estimates the asset’s recoverable amount. An asset’s recoverable amount is the higher of an asset’s or Cash Generating Unit’s (CGU’s) fair value less costs to sell and its value in use. Where the carrying amount of an asset or CGU exceeds its recoverable amount, the asset is considered impaired and is written down to its recoverable amount.
In assessing value in use, the estimated future cash flows are discounted to their present value using a pre–tax discount rate that reflects current market assessments of the time value of money and the risks specific to the asset. In determining fair value less costs to sell, an appropriate valuation model is used. These calculations are corroborated by valuation multiples, quoted share prices for publicly traded subsidiaries or other available fair value indicators.
For assets excluding goodwill, an assessment is made at each reporting date as to whether there is any indication that previously recognised impairment losses may no longer exist or may have decreased. If such indication exists, the Group estimates the asset’s or CGU’s recoverable amount. A previously recognised impairment loss is reversed only if there has been a change in the assumptions used to determine the asset’s recoverable amount since the last impairment loss was recognised. The reversal is limited so that the carrying amount of the asset does not exceed its recoverable amount, nor exceeds the carrying amount that would have been determined, net of depreciation, had no impairment loss been recognised for the asset in prior years. Such reversal is recognised in the Income Statement.
3.9 ESTIMATING THE INCREMENTAL BORROWING RATE
Further, as the Group cannot readily determine the interest rate implicit in the lease, it uses its Incremental Borrowing Rate (IBR) to measure the lease liabilities. The IBR is the rate of interest that the Group would have to pay to borrow over a similar term, and with a similar security, the funds necessary to obtain an asset of a similar value to the right-of-use asset in a similar economic environment. The IBR therefore reflects what the Group ‘would have to pay’, which requires estimation when no observable rates are available (or when they need to be adjusted to reflect the terms and conditions of the lease).The Group estimates the IBR using observable input when available and is required to make certain entity-specific adjustments.
Notes to the Financial Statements
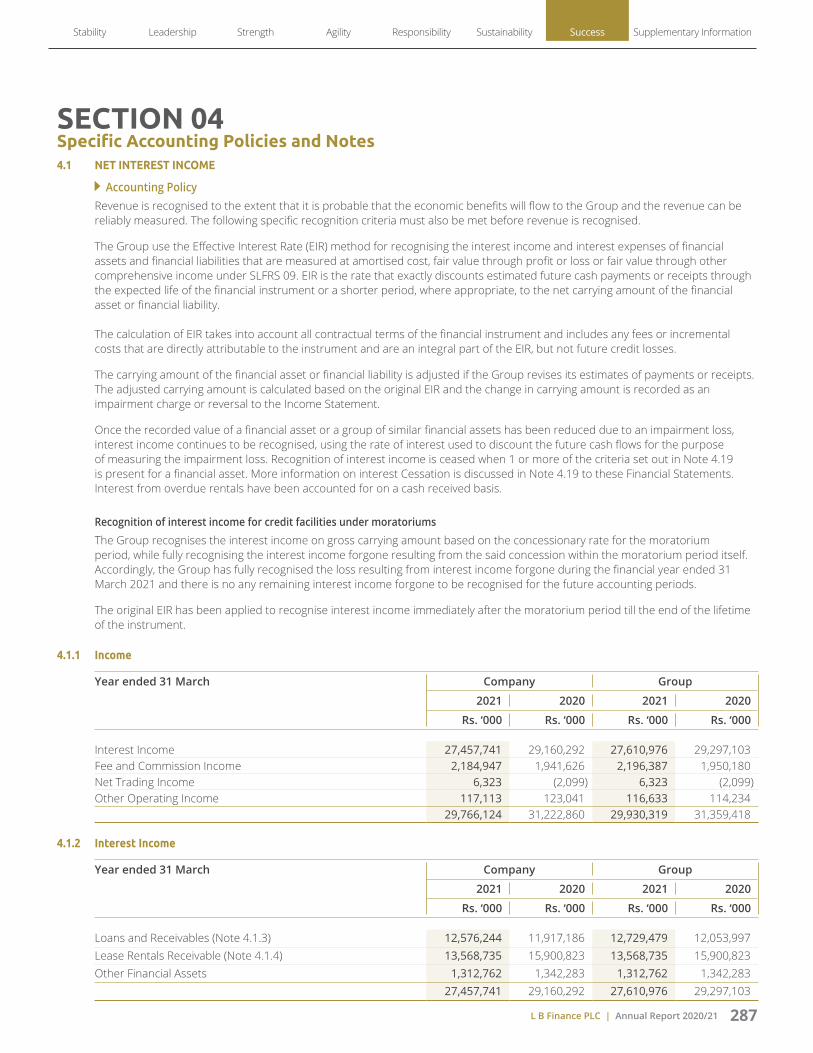
L B Finance PLC | Annual Report 2020/21 287
Stability Leadership Strength Agility Responsibility Sustainability Success Supplementary Information
SECTION 04Specific Accounting Policies and Notes4.1 NET INTEREST INCOME
Accounting PolicyRevenue is recognised to the extent that it is probable that the economic benefits will flow to the Group and the revenue can be reliably measured. The following specific recognition criteria must also be met before revenue is recognised.
The Group use the Effective Interest Rate (EIR) method for recognising the interest income and interest expenses of financial assets and financial liabilities that are measured at amortised cost, fair value through profit or loss or fair value through other comprehensive income under SLFRS 09. EIR is the rate that exactly discounts estimated future cash payments or receipts through the expected life of the financial instrument or a shorter period, where appropriate, to the net carrying amount of the financial asset or financial liability. The calculation of EIR takes into account all contractual terms of the financial instrument and includes any fees or incremental costs that are directly attributable to the instrument and are an integral part of the EIR, but not future credit losses.
The carrying amount of the financial asset or financial liability is adjusted if the Group revises its estimates of payments or receipts. The adjusted carrying amount is calculated based on the original EIR and the change in carrying amount is recorded as an impairment charge or reversal to the Income Statement.
Once the recorded value of a financial asset or a group of similar financial assets has been reduced due to an impairment loss, interest income continues to be recognised, using the rate of interest used to discount the future cash flows for the purpose of measuring the impairment loss. Recognition of interest income is ceased when 1 or more of the criteria set out in Note 4.19 is present for a financial asset. More information on interest Cessation is discussed in Note 4.19 to these Financial Statements. Interest from overdue rentals have been accounted for on a cash received basis.
Recognition of interest income for credit facilities under moratoriumsThe Group recognises the interest income on gross carrying amount based on the concessionary rate for the moratorium period, while fully recognising the interest income forgone resulting from the said concession within the moratorium period itself. Accordingly, the Group has fully recognised the loss resulting from interest income forgone during the financial year ended 31 March 2021 and there is no any remaining interest income forgone to be recognised for the future accounting periods.
The original EIR has been applied to recognise interest income immediately after the moratorium period till the end of the lifetime of the instrument.
4.1.1 Income
Year ended 31 March Company Group
2021 2020 2021 2020
Rs. ‘000 Rs. ‘000 Rs. ‘000 Rs. ‘000
Interest Income 27,457,741 29,160,292 27,610,976 29,297,103 Fee and Commission Income 2,184,947 1,941,626 2,196,387 1,950,180 Net Trading Income 6,323 (2,099) 6,323 (2,099)Other Operating Income 117,113 123,041 116,633 114,234
29,766,124 31,222,860 29,930,319 31,359,418
4.1.2 Interest Income
Year ended 31 March Company Group
2021 2020 2021 2020
Rs. ‘000 Rs. ‘000 Rs. ‘000 Rs. ‘000
Loans and Receivables (Note 4.1.3) 12,576,244 11,917,186 12,729,479 12,053,997 Lease Rentals Receivable (Note 4.1.4) 13,568,735 15,900,823 13,568,735 15,900,823 Other Financial Assets 1,312,762 1,342,283 1,312,762 1,342,283
27,457,741 29,160,292 27,610,976 29,297,103
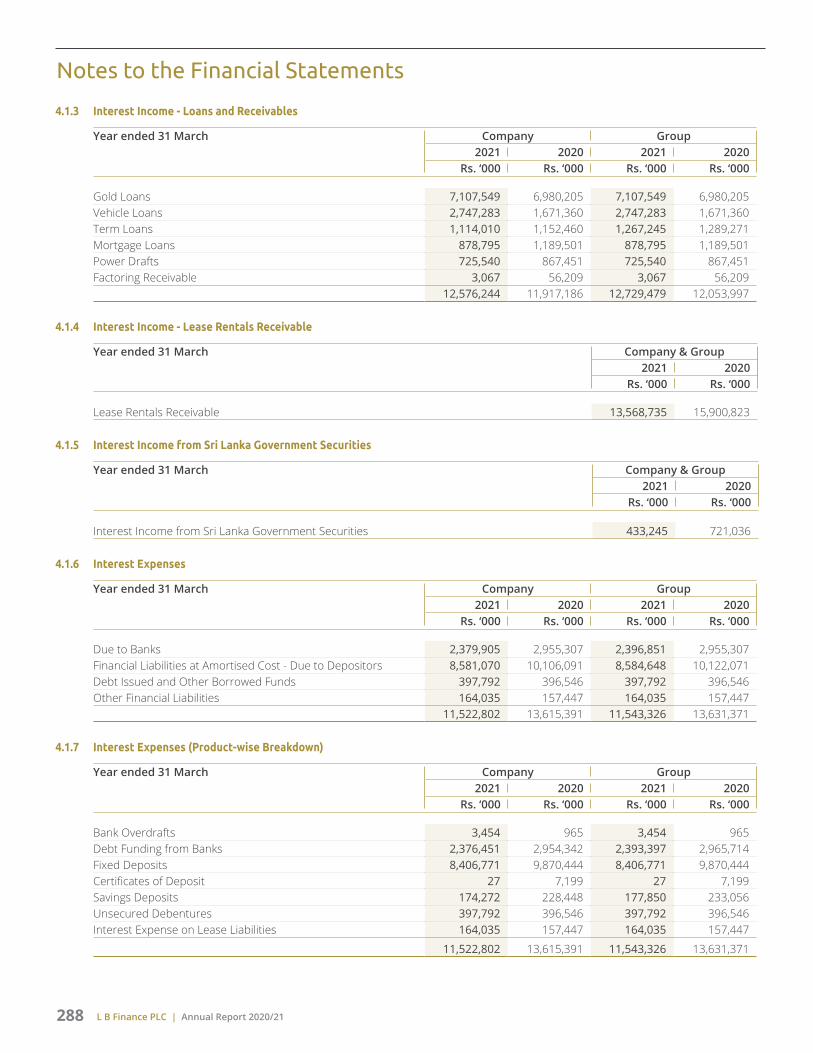
L B Finance PLC | Annual Report 2020/21288
4.1.3 Interest Income - Loans and Receivables
Year ended 31 March Company Group2021 2020 2021 2020
Rs. ‘000 Rs. ‘000 Rs. ‘000 Rs. ‘000
Gold Loans 7,107,549 6,980,205 7,107,549 6,980,205 Vehicle Loans 2,747,283 1,671,360 2,747,283 1,671,360 Term Loans 1,114,010 1,152,460 1,267,245 1,289,271 Mortgage Loans 878,795 1,189,501 878,795 1,189,501 Power Drafts 725,540 867,451 725,540 867,451 Factoring Receivable 3,067 56,209 3,067 56,209
12,576,244 11,917,186 12,729,479 12,053,997
4.1.4 Interest Income - Lease Rentals Receivable
Year ended 31 March Company & Group2021 2020
Rs. ‘000 Rs. ‘000
Lease Rentals Receivable 13,568,735 15,900,823
4.1.5 Interest Income from Sri Lanka Government Securities
Year ended 31 March Company & Group2021 2020
Rs. ‘000 Rs. ‘000
Interest Income from Sri Lanka Government Securities 433,245 721,036
4.1.6 Interest Expenses
Year ended 31 March Company Group2021 2020 2021 2020
Rs. ‘000 Rs. ‘000 Rs. ‘000 Rs. ‘000
Due to Banks 2,379,905 2,955,307 2,396,851 2,955,307 Financial Liabilities at Amortised Cost - Due to Depositors 8,581,070 10,106,091 8,584,648 10,122,071 Debt Issued and Other Borrowed Funds 397,792 396,546 397,792 396,546 Other Financial Liabilities 164,035 157,447 164,035 157,447
11,522,802 13,615,391 11,543,326 13,631,371
4.1.7 Interest Expenses (Product-wise Breakdown)
Year ended 31 March Company Group2021 2020 2021 2020
Rs. ‘000 Rs. ‘000 Rs. ‘000 Rs. ‘000
Bank Overdrafts 3,454 965 3,454 965 Debt Funding from Banks 2,376,451 2,954,342 2,393,397 2,965,714 Fixed Deposits 8,406,771 9,870,444 8,406,771 9,870,444 Certificates of Deposit 27 7,199 27 7,199 Savings Deposits 174,272 228,448 177,850 233,056 Unsecured Debentures 397,792 396,546 397,792 396,546 Interest Expense on Lease Liabilities 164,035 157,447 164,035 157,447
11,522,802 13,615,391 11,543,326 13,631,371
Notes to the Financial Statements

L B Finance PLC | Annual Report 2020/21 289
Stability Leadership Strength Agility Responsibility Sustainability Success Supplementary Information
4.1.8 Net Interest Income
Year ended 31 March Company Group
2021 2020 2021 2020
Rs. ‘000 Rs. ‘000 Rs. ‘000 Rs. ‘000
Interest Income 27,457,741 29,160,292 27,610,976 29,297,103
Interest Expenses 11,522,802 13,615,391 11,543,326 13,631,371
15,934,939 15,544,901 16,067,650 15,665,732
4.2 FEE AND COMMISSION INCOME
Accounting PolicyThe Group earns fee and commission income from a diverse range of services it provides to its customers. These fees include credit-related fees and commission income. All fees and commissions are recognised to the Income Statement on an accrual basis. Fee and commission income that are integral to the EIR of a financial asset or financial liability are capitalised and included in the measurement of the EIR and recognised in the Income Statement over the expected life of the instrument.
Year ended 31 March Company Group
2021 2020 2021 2020
Rs. ‘000 Rs. ‘000 Rs. ‘000 Rs. ‘000
Credit Related Fees and Commissions 1,117,107 1,087,193 1,128,547 1,095,747
Service Charge 1,067,840 854,433 1,067,840 854,433
2,184,947 1,941,626 2,196,387 1,950,180
4.3 NET TRADING INCOME
Accounting PolicyNet trading income includes all gains and losses from changes in fair value and related dividends for financial assets and financial liabilities recognised through profit or loss other than interest income.
Dividend income received from financial assets recognised through profit or loss is recognised when the Group’s right to receive the payment is established.
Year ended 31 March Company & Group
2021 2020
Rs. ‘000 Rs. ‘000
Dividend Income from Financial Assets Recognised Through Profit or Loss 109 118
Appreciation/(Depreciation) in Market Value of Financial Assets Recognised Through Profit or Loss 6,214 (2,217)
6,323 (2,099)
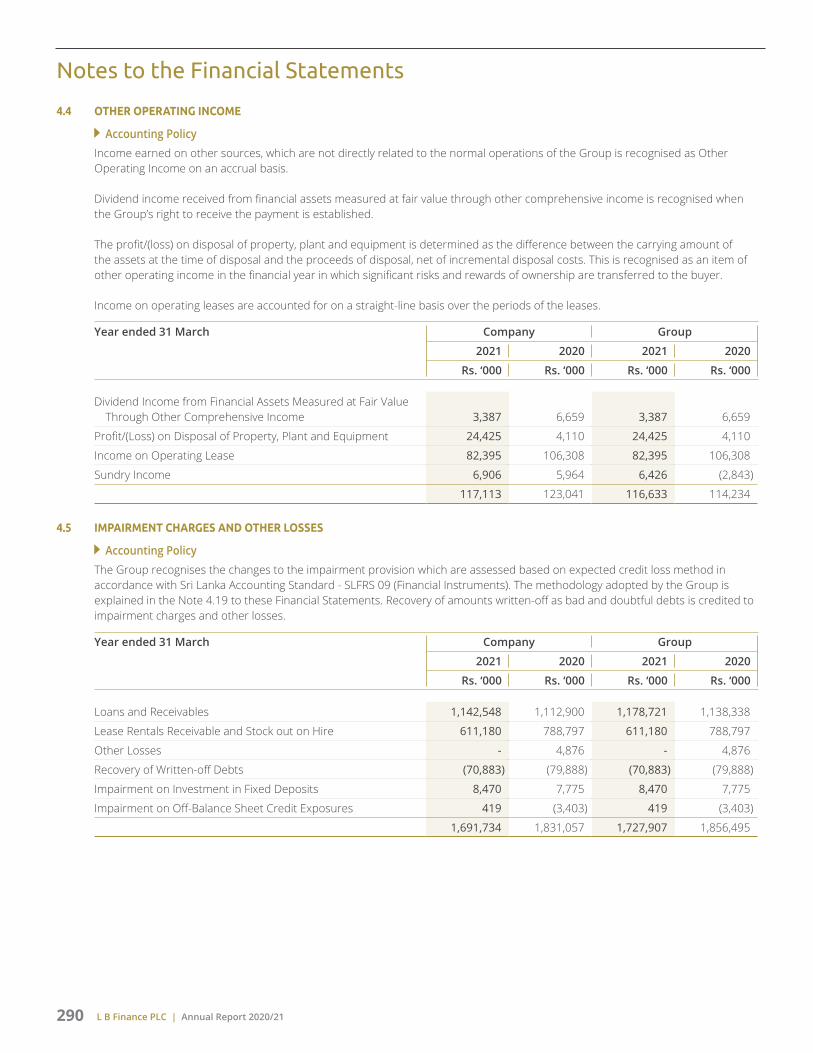
L B Finance PLC | Annual Report 2020/21290
4.4 OTHER OPERATING INCOME
Accounting PolicyIncome earned on other sources, which are not directly related to the normal operations of the Group is recognised as Other Operating Income on an accrual basis.
Dividend income received from financial assets measured at fair value through other comprehensive income is recognised when the Group’s right to receive the payment is established.
The profit/(loss) on disposal of property, plant and equipment is determined as the difference between the carrying amount of the assets at the time of disposal and the proceeds of disposal, net of incremental disposal costs. This is recognised as an item of other operating income in the financial year in which significant risks and rewards of ownership are transferred to the buyer.
Income on operating leases are accounted for on a straight-line basis over the periods of the leases.
Year ended 31 March Company Group
2021 2020 2021 2020
Rs. ‘000 Rs. ‘000 Rs. ‘000 Rs. ‘000
Dividend Income from Financial Assets Measured at Fair Value Through Other Comprehensive Income 3,387 6,659 3,387 6,659
Profit/(Loss) on Disposal of Property, Plant and Equipment 24,425 4,110 24,425 4,110
Income on Operating Lease 82,395 106,308 82,395 106,308
Sundry Income 6,906 5,964 6,426 (2,843)
117,113 123,041 116,633 114,234
4.5 IMPAIRMENT CHARGES AND OTHER LOSSES
Accounting PolicyThe Group recognises the changes to the impairment provision which are assessed based on expected credit loss method in accordance with Sri Lanka Accounting Standard - SLFRS 09 (Financial Instruments). The methodology adopted by the Group is explained in the Note 4.19 to these Financial Statements. Recovery of amounts written-off as bad and doubtful debts is credited to impairment charges and other losses.
Year ended 31 March Company Group
2021 2020 2021 2020
Rs. ‘000 Rs. ‘000 Rs. ‘000 Rs. ‘000
Loans and Receivables 1,142,548 1,112,900 1,178,721 1,138,338
Lease Rentals Receivable and Stock out on Hire 611,180 788,797 611,180 788,797
Other Losses - 4,876 - 4,876
Recovery of Written-off Debts (70,883) (79,888) (70,883) (79,888)
Impairment on Investment in Fixed Deposits 8,470 7,775 8,470 7,775
Impairment on Off-Balance Sheet Credit Exposures 419 (3,403) 419 (3,403)
1,691,734 1,831,057 1,727,907 1,856,495
Notes to the Financial Statements

L B Finance PLC | Annual Report 2020/21 291
Stability Leadership Strength Agility Responsibility Sustainability Success Supplementary Information
4.5.1 Impairment Charges and Other Losses (Detailed Breakdown) - Company
Year ended 31 March 2021 2020
Direct Write-offs
Charge/ (Reversal) for the Year
Net Amount
Direct Write-offs
Charge/ (Reversal) for the Year
Net Amount
Rs. '000 Rs. '000 Rs. '000 Rs. '000 Rs. '000 Rs. '000
Loans and Receivables 28,293 1,114,255 1,142,548 27,121 1,085,779 1,112,900
Lease Rentals Receivable and Stock out on Hire 55,633 555,547 611,180 43,435 745,362 788,797
Other Losses - - - - 4,876 4,876
83,926 1,669,802 1,753,728 70,556 1,836,017 1,906,573
Recovery of Written-off Debts (70,883) (79,888)
Impairment on Investment in Fixed Deposits 8,470 7,775
Impairment on Off-Balance Sheet Credit Exposures 419 (3,403)
1,691,734 1,831,057
4.5.2 Impairment Charges and Other Losses (Detailed Breakdown) - Group
Year ended 31 March 2021 2020
Direct Write-offs
Charge/ (Reversal) for the Year
Net Amount
Direct Write-offs
Charge/ (Reversal) for the Year
Net Amount
Rs. '000 Rs. '000 Rs. '000 Rs. '000 Rs. '000 Rs. '000
Loans and Receivables 28,293 1,150,428 1,178,721 27,121 1,111,217 1,138,338
Lease Rentals Receivable and Stock out on Hire 55,633 555,547 611,180 43,435 745,362 788,797
Other Losses - - - - 4,876 4,876
83,926 1,705,975 1,789,901 70,556 1,861,455 1,932,011
Recovery of Written-off Debts (70,883) (79,888)
Impairment on Investment in Fixed Deposits 8,470 7,775
Impairment on Off-Balance Sheet Credit Exposures 419 (3,403)
1,727,907 1,856,495

L B Finance PLC | Annual Report 2020/21292
4.5.3 Analysis of Impairment Charges and Other Losses - Company
Year ended 31 March 2021 Stage 01 Stage 02 Stage 03 Total
Rs. '000 Rs. '000 Rs. '000 Rs. '000
Gold Loans 250,606 48,518 (189) 298,935
Vehicle Loans 84,000 358 80,820 165,178
Term Loans 108,851 (4,015) 20,424 125,260
Mortgage Loans 91,376 18,783 386,886 497,045
Power Drafts 15,608 1,933 60,276 77,817
Factoring Receivable - - (21,687) (21,687)
Loans and Receivables 550,441 65,577 526,530 1,142,548
Leases 143,689 (153,482) 623,890 614,097
Hire Purchase - (11) (2,906) (2,917)
Lease Rentals Receivable and Stock out on Hire 143,689 (153,493) 620,984 611,180
Recovery of Written-off Debts (70,883)
Impairment on Investment in Fixed Deposits 8,470
Impairment on Off-Balance Sheet Credit Exposures 419
Total Allowance for Impairment Losses 1,691,734
Year ended 31 March 2020 Stage 01 Stage 02 Stage 03 Total
Rs. '000 Rs. '000 Rs. '000 Rs. '000
Gold Loans 102,065 - 8,722 110,787
Vehicle Loans 24,335 28,377 39,983 92,695
Term Loans 18,373 (7,329) 95,518 106,562
Mortgage Loans (12,571) (20,706) 814,812 781,535
Power Drafts (5,386) 260 4,907 (219)
Factoring Receivable (26,463) - 48,003 21,540
Loans and Receivables 100,353 602 1,011,945 1,112,900
Leases (113,735) 49,616 877,021 812,902
Hire Purchase (135) (68) (23,902) (24,105)
Lease Rentals Receivable and Stock out on Hire (113,870) 49,548 853,119 788,797
Other Losses - - 4,876 4,876
Recovery of Written-off Debts (79,888)
Impairment on Investment in Fixed Deposits 7,775
Impairment on Off-Balance Sheet Credit Exposures (3,403)
Total Allowance for Impairment Losses 1,831,057
Notes to the Financial Statements
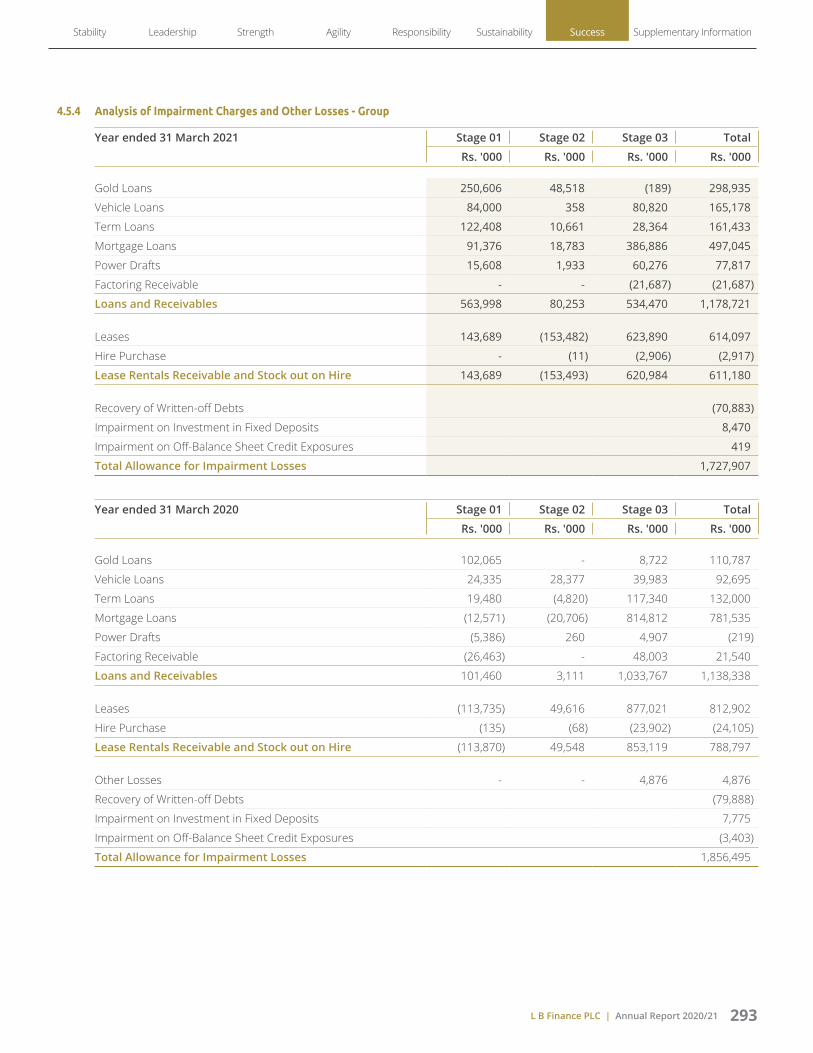
L B Finance PLC | Annual Report 2020/21 293
Stability Leadership Strength Agility Responsibility Sustainability Success Supplementary Information
4.5.4 Analysis of Impairment Charges and Other Losses - Group
Year ended 31 March 2021 Stage 01 Stage 02 Stage 03 Total
Rs. '000 Rs. '000 Rs. '000 Rs. '000
Gold Loans 250,606 48,518 (189) 298,935
Vehicle Loans 84,000 358 80,820 165,178
Term Loans 122,408 10,661 28,364 161,433
Mortgage Loans 91,376 18,783 386,886 497,045
Power Drafts 15,608 1,933 60,276 77,817
Factoring Receivable - - (21,687) (21,687)
Loans and Receivables 563,998 80,253 534,470 1,178,721
Leases 143,689 (153,482) 623,890 614,097
Hire Purchase - (11) (2,906) (2,917)
Lease Rentals Receivable and Stock out on Hire 143,689 (153,493) 620,984 611,180
Recovery of Written-off Debts (70,883)
Impairment on Investment in Fixed Deposits 8,470
Impairment on Off-Balance Sheet Credit Exposures 419
Total Allowance for Impairment Losses 1,727,907
Year ended 31 March 2020 Stage 01 Stage 02 Stage 03 Total
Rs. '000 Rs. '000 Rs. '000 Rs. '000
Gold Loans 102,065 - 8,722 110,787
Vehicle Loans 24,335 28,377 39,983 92,695
Term Loans 19,480 (4,820) 117,340 132,000
Mortgage Loans (12,571) (20,706) 814,812 781,535
Power Drafts (5,386) 260 4,907 (219)
Factoring Receivable (26,463) - 48,003 21,540
Loans and Receivables 101,460 3,111 1,033,767 1,138,338
Leases (113,735) 49,616 877,021 812,902
Hire Purchase (135) (68) (23,902) (24,105)
Lease Rentals Receivable and Stock out on Hire (113,870) 49,548 853,119 788,797
Other Losses - - 4,876 4,876
Recovery of Written-off Debts (79,888)
Impairment on Investment in Fixed Deposits 7,775
Impairment on Off-Balance Sheet Credit Exposures (3,403)
Total Allowance for Impairment Losses 1,856,495

L B Finance PLC | Annual Report 2020/21294
4.6 PERSONNEL EXPENSES
Accounting PolicyPersonnel Expenses include salaries and bonus, terminal benefits and other staff-related expenses. The provision for bonus is recognised when it is probable that an outflow of resource embodying economic benefits will be required to settle the obligation and a reliable estimate can be made on the amount of the obligation.
Defined Contribution Plans - Employees’ Provident Fund and Employees’ Trust Fund - Company
A defined contribution plan is a post employment benefit plan under which an entity pays fixed contributions into a separate entity (a fund) and will have no legal or constructive obligation to pay further contributions if the fund does not hold sufficient assets to pay all employee benefits relating to employee services in the current and prior periods as defined in the Sri Lanka Accounting Standard - LKAS 19 (Employee Benefits).
The contribution payable to a defined contribution plan is in proportion to the services rendered to the Company by the employees and is recorded as an expense when they become due. Unpaid contributions are recorded as a liability.
The Company and the employees contribute 15% and 10% respectively on the salary of each employee to the Employees’ Provident Fund.
The Company contributes 3% of the salary of each employee to the Employees’ Trust Fund.
Defined Contribution Plans - Social Security Fund - L B Microfinance Myanmar Company Limited
The Company and the employees contribute 3% and 2% respectively on the salary of each employee to the Social Security Board. The maximum contribution is limited to Myanmar kyat 9,000/- by the Company and Myanmar kyat 6,000/- by the employee.
Defined Benefit Plans - Company
A defined benefit plan is a post employment benefit plan other than a defined contribution plan. Accordingly, staff gratuity was considered as defined benefit plan as per Sri Lanka Accounting Standard - LKAS 19 (Employee Benefits).
Day 01 Loss on Staff Loan
The ‘Day 01 loss’ arising in the case of loans granted to employees at concessionary rates under uniformly applicable schemes is amortised using Effective Interest Rates (EIR) over the tenure of the loan.
Year ended 31 March Company Group
2021 2020 2021 2020
Rs. ‘000 Rs. ‘000 Rs. ‘000 Rs. ‘000
Salaries and Other Related Expenses 2,520,984 2,537,989 2,566,454 2,565,475
Employer’s Contribution to Employees' Provident Fund 232,853 239,164 232,853 239,164
Employer’s Contribution to Employees' Trust Fund 46,571 47,833 46,571 47,833
Gratuity Charge/(Reversal) for the Year 93,917 75,942 93,917 75,942
Staff Training 4,015 18,560 4,212 18,755
Staff Welfare Expenses 57,220 79,269 59,671 80,597
Amortisation of Staff Loan Day 01 Difference 4,263 6,432 4,263 6,432
2,959,823 3,005,189 3,007,941 3,034,198
Notes to the Financial Statements

L B Finance PLC | Annual Report 2020/21 295
Stability Leadership Strength Agility Responsibility Sustainability Success Supplementary Information
4.7 DEPRECIATION AND AMORTISATION
Accounting Policy
Depreciation of Property, Plant and Equipment
Depreciation is calculated to write-off the cost of items of property, plant and equipment less their estimated residual values using the straight-line method over their estimated useful lives and is recognised in the Income Statement. Freehold land is not depreciated.
Right-of-use assets are depreciated over the useful lives of the assets. However, if there is no reasonable certainty that the Group will obtain the ownership by the end of the lease term, the assets are depreciated over the shorter of the estimated useful lives and the lease terms as defined in Note 4.24.
Amortisation of Intangible Assets
Intangible assets are amortised using the straight-line method to write down the cost over its estimated useful economic lives from the date on which it is available for use at the rates specified in Note 4.25.
Year ended 31 March Company Group
2021 2020 2021 2020
Rs. ‘000 Rs. ‘000 Rs. ‘000 Rs. ‘000
Depreciation of Property, Plant and Equipment 470,496 456,800 472,616 457,931
Depreciation of Right-of-Use Assets 258,297 240,708 258,297 240,708
Amortisation of Intangible Assets 16,446 15,882 20,019 18,125
745,239 713,390 750,932 716,764
4.7.1 Depreciation of Property, Plant and Equipment
Year ended 31 March Company Group
2021 2020 2021 2020
Rs. ‘000 Rs. ‘000 Rs. ‘000 Rs. ‘000
Freehold Buildings and Edifices 19,356 18,410 19,356 18,410
Furniture and Fittings 35,256 33,669 35,691 33,923
Equipment 103,795 101,654 104,363 101,969
Motor Vehicles 37,967 42,469 38,006 42,480
Computer Hardware and Equipment 107,490 101,156 108,568 101,707
Improvement of Leasehold Asset 60,120 58,822 60,120 58,822
Fixtures and Fittings 106,512 100,620 106,512 100,620
470,496 456,800 472,616 457,931
Right-of-Use Assets 258,297 240,708 258,297 240,708
728,793 697,508 730,913 698,639
4.7.2 Amortisation of Intangible Assets
Year ended 31 March Company Group
2021 2020 2021 2020
Rs. ‘000 Rs. ‘000 Rs. ‘000 Rs. ‘000
Computer Software 16,446 15,882 20,019 18,125
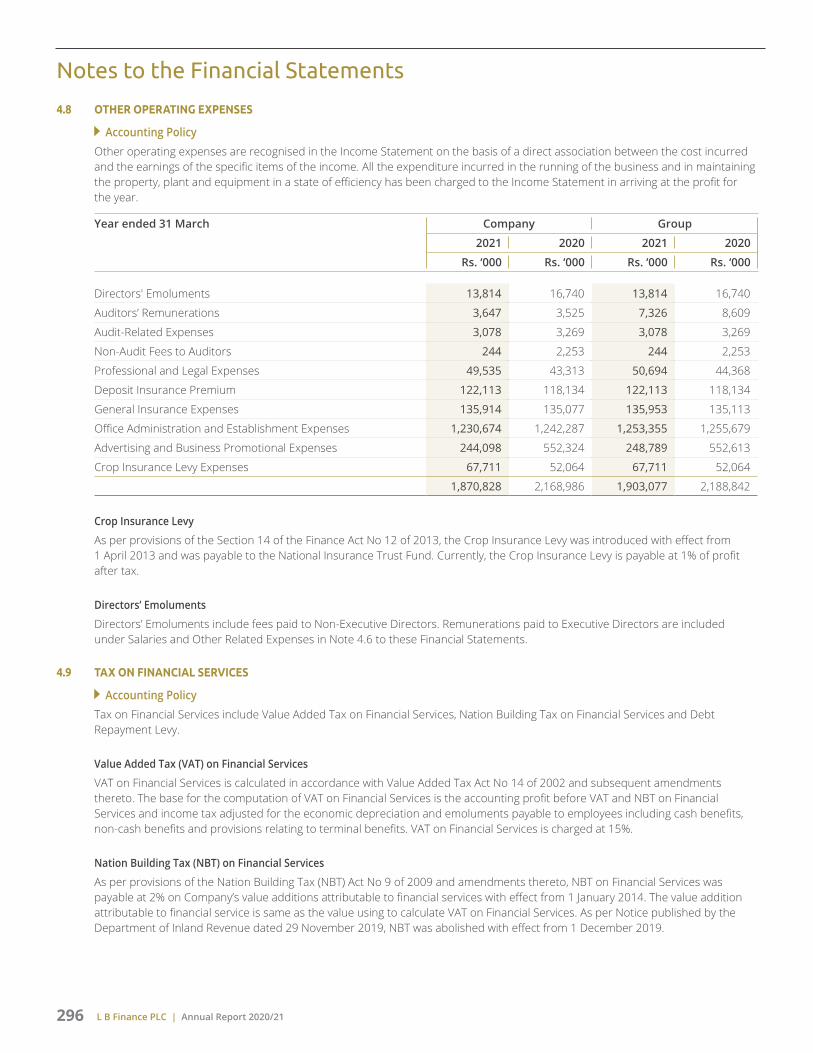
L B Finance PLC | Annual Report 2020/21296
4.8 OTHER OPERATING EXPENSES
Accounting PolicyOther operating expenses are recognised in the Income Statement on the basis of a direct association between the cost incurred and the earnings of the specific items of the income. All the expenditure incurred in the running of the business and in maintaining the property, plant and equipment in a state of efficiency has been charged to the Income Statement in arriving at the profit for the year.
Year ended 31 March Company Group
2021 2020 2021 2020
Rs. ‘000 Rs. ‘000 Rs. ‘000 Rs. ‘000
Directors' Emoluments 13,814 16,740 13,814 16,740
Auditors’ Remunerations 3,647 3,525 7,326 8,609
Audit-Related Expenses 3,078 3,269 3,078 3,269
Non-Audit Fees to Auditors 244 2,253 244 2,253
Professional and Legal Expenses 49,535 43,313 50,694 44,368
Deposit Insurance Premium 122,113 118,134 122,113 118,134
General Insurance Expenses 135,914 135,077 135,953 135,113
Office Administration and Establishment Expenses 1,230,674 1,242,287 1,253,355 1,255,679
Advertising and Business Promotional Expenses 244,098 552,324 248,789 552,613
Crop Insurance Levy Expenses 67,711 52,064 67,711 52,064
1,870,828 2,168,986 1,903,077 2,188,842
Crop Insurance Levy
As per provisions of the Section 14 of the Finance Act No 12 of 2013, the Crop Insurance Levy was introduced with effect from 1 April 2013 and was payable to the National Insurance Trust Fund. Currently, the Crop Insurance Levy is payable at 1% of profit after tax.
Directors’ Emoluments
Directors’ Emoluments include fees paid to Non-Executive Directors. Remunerations paid to Executive Directors are included under Salaries and Other Related Expenses in Note 4.6 to these Financial Statements.
4.9 TAX ON FINANCIAL SERVICES
Accounting PolicyTax on Financial Services include Value Added Tax on Financial Services, Nation Building Tax on Financial Services and Debt Repayment Levy.
Value Added Tax (VAT) on Financial Services
VAT on Financial Services is calculated in accordance with Value Added Tax Act No 14 of 2002 and subsequent amendments thereto. The base for the computation of VAT on Financial Services is the accounting profit before VAT and NBT on Financial Services and income tax adjusted for the economic depreciation and emoluments payable to employees including cash benefits, non-cash benefits and provisions relating to terminal benefits. VAT on Financial Services is charged at 15%.
Nation Building Tax (NBT) on Financial Services
As per provisions of the Nation Building Tax (NBT) Act No 9 of 2009 and amendments thereto, NBT on Financial Services was payable at 2% on Company’s value additions attributable to financial services with effect from 1 January 2014. The value addition attributable to financial service is same as the value using to calculate VAT on Financial Services. As per Notice published by the Department of Inland Revenue dated 29 November 2019, NBT was abolished with effect from 1 December 2019.
Notes to the Financial Statements

L B Finance PLC | Annual Report 2020/21 297
Stability Leadership Strength Agility Responsibility Sustainability Success Supplementary Information
Debt Repayment Levy (DRL) on Financial Services
As per the Finance Act No 35 of 2018, with effect from 1 October 2018, DRL of 7% was introduced on the value addition attributable to the supply of financial services by each financial institution. DRL is chargeable on the same base used for calculation of VAT on Financial Services. As per notice published by the Department of Inland Revenue dated 20 January 2020, DRL was abolished with effect from 1 January 2020.
Year ended 31 March Group
2021 2020
Rs. ‘000 Rs. ‘000
Value Added Tax 1,669,323 1,456,843
Nation Building Tax - 137,005
Debt Repayment Levy - 684,712
1,669,323 2,278,560
4.10 TAXATION
Accounting PolicyAs per Sri Lanka Accounting Standard - LKAS 12 (Income Taxes), tax expense is the aggregate amount included in determination of profit or loss for the period in respect of current and deferred taxation. Income tax expense is recognised in the Income Statement except to the extent it relates to items recognised directly in ‘Equity’ or ‘Other Comprehensive Income (OCI)’, in which case it is recognised in Equity or in OCI.
Current Taxation
Current tax assets and liabilities consist of amounts expected to be recovered from or paid to the Commissioner General of Inland Revenue in respect of the current year and any adjustment to tax payable in respect of prior years. The tax rates and tax laws used to compute the amount are those that are enacted or substantially enacted by the reporting date. Accordingly, provision for taxation is based on the profit for the year adjusted for taxation purposes in accordance with the provisions of the Inland Revenue Act No 24 of 2017 and the amendments thereto at the rates specified in Note 4.10.3 to these Financial Statements.
Provision for taxation on the overseas operations is made on the basis of the accounting profit for the year, as adjusted for taxation purposes, in accordance with the provisions of the relevant statutes in those countries, using the tax rates enacted or substantively enacted as at the reporting date.
Accounting Estimates
Significant judgment was required to determine the total provision for current and deferred taxes. Uncertainties exist, with respect to the interpretation of the applicability of tax laws, at the time of the preparation of these Financial Statements. The Company recognised assets and liabilities for current and deferred taxes based on estimates of whether additional taxes will be due. Where the final tax outcome of these matters is different from the amounts that were initially recorded, such differences will impact the income and deferred tax amounts in the period in which the determination is made.
Deferred Tax Liabilities
Detailed disclosure of accounting policies and estimate of deferred tax is available in Note 4.32 to these Financial Statements.

L B Finance PLC | Annual Report 2020/21298
4.10.1 The Major Components of Income Tax Expense are as follows;
Year ended 31 March Company Group
2021 2020 2021 2020
Rs. ‘000 Rs. ‘000 Rs. ‘000 Rs. ‘000
4.10.1 (a) Income Statement
Current Income Tax
Income Tax for the Year 2,925,546 2,724,337 2,939,914 2,735,062
Under/(Over) Provision of Current Taxes in respect of Previous Years (11,577) (40,639) (8,715) (32,271)
Deferred Tax
Deferred Taxation Charge/(Reversal) (Note 4.32) (410,191) (260,464) (410,191) (260,464)
2,503,778 2,423,234 2,521,008 2,442,327
4.10.1 (b) Other Comprehensive Income
Deferred Tax
Deferred Taxation Charge/(Reversal) (Note 4.32) 9,684 (11,678) 9,684 (11,678)
9,684 (11,678) 9,684 (11,678)
4.10.1 (c) Total Tax Expense for the Financial Year 2,513,462 2,411,556 2,530,692 2,430,649
4.10.2 Reconciliation of Accounting Profit and Taxable Income
A reconciliation between the tax expense and the accounting profit multiplied by relevant tax rate is as follows;
Year ended 31 March Tax Rate Company Group
2021 2020 2021 2020
Rs. ‘000 Rs. ‘000 Rs. ‘000 Rs. ‘000
Accounting Profit before Income Taxation 9,306,375 7,610,287 9,327,813 7,653,188
Income Tax Expense at the Statutory Income
L B Finance PLC 28% 2,130,880 2,130,880
L B Finance PLC 24% 2,233,530 - 2,233,530 -
L B Microfinance Myanmar Company Limited 25% 5,360 10,725
Tax Effect of Non-Deductible Expenses 291,509 398,649 300,517 398,649
Tax Effect of Exempt Income - (1,231) - (1,231)
Tax Effect of Rate change to 24% with effect from 1 January 2020 - (76,103) - (76,103)
Under/(Over) Provision of Current Taxes in respect of Previous Years (11,577) (40,639) (8,715) (32,271)
2,513,462 2,411,556 2,530,692 2,430,649
Charge/(Reversal) for Deferred Tax (410,191) (260,464) (410,191) (260,464)
Effective Tax Rate 27.01% 31.69% 27.13% 31.76%
Effective Tax Rate (Excluding Deferred Tax) 31.42% 35.11% 31.53% 35.16%
Accounting Profit before Tax on Financial Services 10,975,698 9,888,847 10,997,136 9,931,748
Effective Tax Rate (Excluding Tax on Financial Services) 22.90% 24.39% 23.01% 24.47%
Notes to the Financial Statements

L B Finance PLC | Annual Report 2020/21 299
Stability Leadership Strength Agility Responsibility Sustainability Success Supplementary Information
4.10.3 Income Tax expense of the Company and its subsidiary have been recorded for on the taxable income at rates shown below;
2021 2020
L B Finance PLC* 24% 24-28%
L B Microfinance Myanmar Company Limited 25% 25%
*1 April 2019 to 31 December 2019 - 28%
4.10.4 Summary of the Taxes Paid During the Financial Year
Company Group
2021 2020 2021 2020
Rs. ‘000 Rs. ‘000 Rs. ‘000 Rs. ‘000
Direct TaxesIncome Tax 2,017,689 2,875,243 2,042,147 2,897,059 Value Added Tax on Financial Services 1,473,111 1,607,388 1,473,111 1,607,388 Nation Building Tax on Financial Services - 157,173 - 157,173 Debt Repayment Levy on Financial Services - 749,182 - 749,182 Crop Insurance Levy 52,448 54,797 52,448 54,797 Economic Service Charge - 157,338 - 157,338
3,543,248 5,601,121 3,567,706 5,622,937
Indirect Taxes (Collected and Paid)Value Added Tax 161,611 255,963 161,611 255,963 Nation Building Tax - 31,402 - 31,402 Stamp Duty 179,712 324,986 179,712 324,986 Withholding Tax on Dividend and Interest 2,145 508,602 2,145 508,602 PAYE Tax/Advanced Personal Income Tax 82,139 102,611 82,377 102,795
425,607 1,223,564 425,845 1,223,748 Total Taxes Paid during the Financial Year 3,968,855 6,824,685 3,993,551 6,846,685
4.11 EARNINGS PER ORDINARY SHARE
Accounting PolicyThe Group presents Basic and Diluted Earnings per Share (EPS) data for its ordinary shares. Basic earnings per share is calculated by dividing the net profit for the year attributable to ordinary shareholders by weighted average number of ordinary shares outstanding during the year, as per the Sri Lanka Accounting Standard - LKAS 33 (Earnings Per Share).
Diluted EPS is determined by adjusting the profit or loss attributable to the ordinary shareholders and the weighted average number of ordinary shares outstanding for the effects of all potentially dilutive ordinary shares, which comprise share options granted to employees. The Group does not have any potentially dilutive shares.

L B Finance PLC | Annual Report 2020/21300
4.11.1 Income and Shares Details Used in the Basic Earning per Share Computation
Company Group
2021 2020 2020 2021 2020 2020
Restated Restated
Amounts Used as the Numerators:Profit after Tax for the Year Attributable to
Equity Holders (Rs. '000) 6,802,597 5,187,053 5,187,053 6,806,805 5,210,861 5,210,861
Number of Ordinary Shares Used as Denominators for Basic Earnings per Share
Weighted Average Number of Ordinary Shares in Issue 554,057,136 554,057,136 138,514,284 554,057,136 554,057,136 138,514,284
Basic/Diluted Earnings per Ordinary Share (Rs.) 12.28 9.36 37.45 12.29 9.40 37.62
Basic earnings per ordinary share of 2020 have been restated based on the post sub-division weighted average number of ordinary shares as at 31 March 2021.
On 10 March 2021, the Company effected the sub-division of ordinary shares on the basis of a sub-division of every one (01) ordinary share into four (04) ordinary shares, thus increasing the existing 138,514,284 issued ordinary shares of the Company to 554,057,136 ordinary shares.
4.11.2 The Diluted earnings per ordinary share is equal to the basic earnings per ordinary share since the Company and the Group does not have any convertible securities as at the reporting date.
4.11.3 Movement of Weighted Average Number of Ordinary Shares
Company Group
2021 2020 2021 2020
Rs. ‘000 Rs. ‘000 Rs. ‘000 Rs. ‘000
Ordinary Shares at the Beginning of the Year 138,514,284 138,514,284 138,514,284 138,514,284
Ordinary Shares on Share Split 415,542,852 - 415,542,852 -
Ordinary Shares at the End of the Year 554,057,136 138,514,284 554,057,136 138,514,284
Notes to the Financial Statements

L B Finance PLC | Annual Report 2020/21 301
Stability Leadership Strength Agility Responsibility Sustainability Success Supplementary Information
4.12 DIVIDEND PAID AND PROPOSED
Accounting Policy Provision for final dividends is recognised at the time the dividend recommended and declared by the Board of Directors, is
approved by the shareholders. Interim dividends payable is recognised when the Board approves such dividend in accordance with the Companies Act No 07 of 2007.
Company2021 2020
Rs. ‘000 Rs. ‘000
4.12.1 Declared and Paid During the Year
Dividends on Ordinary Shares:No Final Dividend for 2020 (Final Dividend for 2019 - Rs. 4.00 per Share*) - 554,057 Interim Dividend for 2021 - Rs. 12.00 per Share* (No Interim Dividend for 2020) 1,662,171 -
1,662,171 554,057
4.12.2 Proposed for Approval at Annual General Meeting
(not recognised as a liability as at 31 March)Dividends on Ordinary Shares: 2,216,229 - Final Dividend for 2021 - Rs. 4.00 per Share (No Final Dividend for 2020) 2,216,229 -
4.12.3 Dividend per Share
Dividends on Ordinary Shares:Interim Dividend 1,662,171 -Final Dividend 2,216,229 -Total Dividend 3,878,400 -
Number of Ordinary Shares at the End of the Year 554,057,136 138,514,284
Dividend per Share (Rs.)** 7.00 -
*Number of shares at the time of dividend declared and paid was 138,514,284 which were subdivided into 554,057,136 as described in Note 4.34.1.
**Dividend per share was calculated by dividing the total dividend in respect of the financial year from number of shares after the sub-division of shares.
During last financial year, as response to the restrictions imposed on cash dividends from the Central Bank of Sri Lanka, and to preserve additional capital for use in serving LB Finance PLC’s customers through the extraordinary challenges presented by the COVID-19 pandemic, the Board agreed to cancel the final dividend of Rs. 12.00 per ordinary share for the year 2020. However, the Company was paid an interim dividend of Rs. 12.00 per share in respect of the year 2021 on the then issued shares of 138,514,284 after obtaining the requisite approval of the Central Bank of Sri Lanka. In addition, the Directors have approved a final dividend of Rs. 4.00 per ordinary share on the post sub division shares in issue of 554,057,136. The final dividend for 2021 will be paid in the month of July 2021 to shareholders on the Share Register on 2 July 2021. The Financial Statements for the year ended 31 March 2021 do not reflect this dividend, which will be accounted for in shareholders’ equity as an appropriation of retained profits in the year ending 31 March 2022. Dividends are funded out of distributable reserves.

L B Finance PLC | Annual Report 2020/21302
4.13 FINANCIAL INSTRUMENTS
Accounting Policy
Date of Recognition
Financial assets and liabilities, with the exception of loans and advances to customers and balances due to depositors, are initially recognised on the trade date, i.e., the date that the Group becomes a party to the contractual provisions of the instrument. This includes regular way trades, purchases or sales of financial assets that require delivery of assets within the time frame generally established by regulation or convention in the market place. Loans and advances to customers are recognised on the date on which it originated. The Group recognises balances due to depositors when funds are transferred to the Group.
Classification and Initial Measurement of Financial Instruments
The classification of financial instruments at initial recognition depends on their contractual terms and the business model for managing the instruments. A financial asset or financial liability is measured initially at fair value plus or minus transaction costs that are directly attributable to its acquisition or issue, except in the case of financial assets and financial liabilities at fair value through profit or loss as per Sri Lanka Accounting Standard - SLFRS 09 (Financial Instruments). Trade receivables of subsidiaries are measured at the transaction price. When the fair value of financial instruments at initial recognition differs from the transaction price, the Group accounts for the Day 01 profit or loss.
Day 01 Profit or Loss
When the transaction price of the instrument differs from the fair value at origination and the fair value is based on a valuation technique using only inputs observable in market transactions, the Group recognises the difference between the transaction price and the fair value in net trading income. In those cases where fair value is based on models for which some of the inputs are not observable, the difference between the transaction price and the fair value is deferred and is only recognised in profit or loss when the inputs become observable, or when the instrument is derecognised.
Classification and Subsequent Measurement of Financial Assets
As per SLFRS 09, the Group classifies all of its financial assets based on the business model for managing the assets and the assets’ contractual terms measured at either;
Amortised Cost
Fair Value through Other Comprehensive Income (FVOCI)
Fair Value through Profit or Loss (FVTPL)
The subsequent measurement of financial assets depends on their classification.
Business Model Assessment
Group determines its business model at the level that best reflects how it manages the financial assets to achieve its objectives. The Group’s business model is not assessed on an instrument by instrument basis, but at a higher level of aggregated portfolios and is based on observable factors such as;
How the performance of the business model and the financial asset held within that business model are evaluated and reported to the entity’s key management personnel
The risks that affect the performance of the business model (and the financial assets held within that business model) and, in particular, the way those risks are managed
How managers of the business are compensated (for example, whether the compensation is based on the fair value of the assets managed or on the contractual cash flow collected)
The expected frequency, value and timing of sales
The business model assessment is based on reasonably expected scenarios without taking ‘worst case’ or ‘stress case’ scenarios into account. If cash flows after initial recognition are realised in a way that is different from the Group’s original expectation, the Group does not change the classification of the remaining financial assets held in that business model, but incorporates such information when assessing newly originated or newly purchased financial assets.
Notes to the Financial Statements
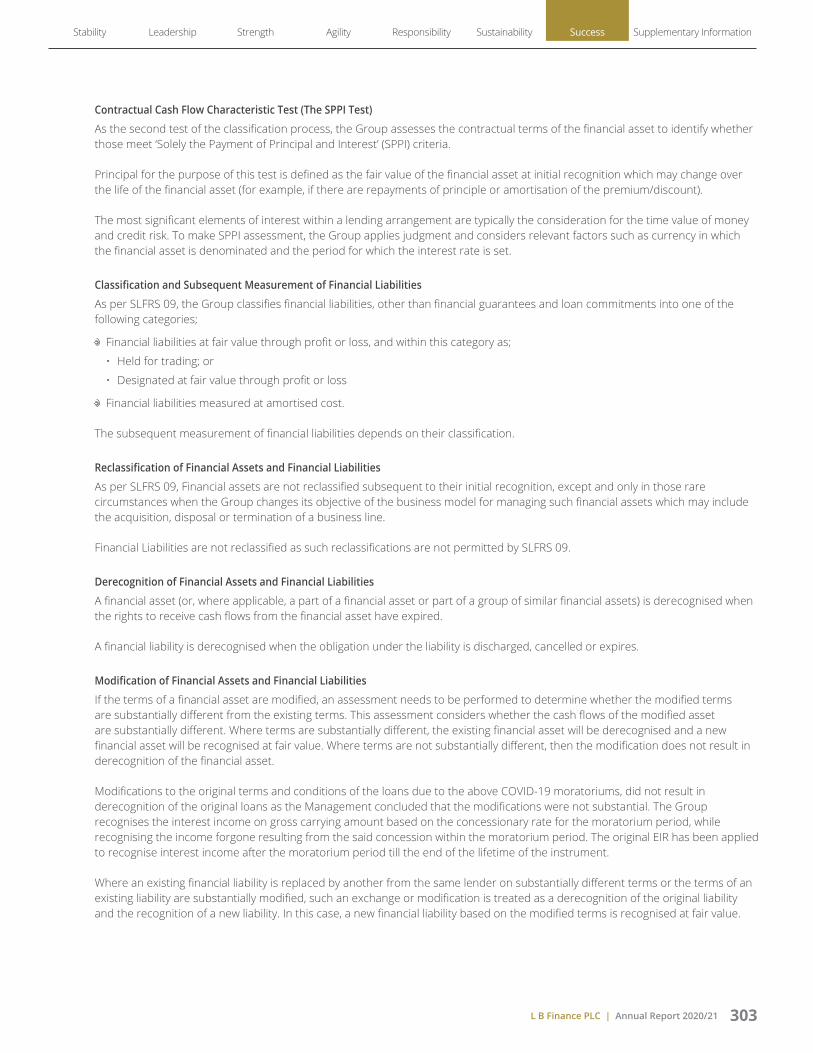
L B Finance PLC | Annual Report 2020/21 303
Stability Leadership Strength Agility Responsibility Sustainability Success Supplementary Information
Contractual Cash Flow Characteristic Test (The SPPI Test)
As the second test of the classification process, the Group assesses the contractual terms of the financial asset to identify whether those meet ‘Solely the Payment of Principal and Interest’ (SPPI) criteria.
Principal for the purpose of this test is defined as the fair value of the financial asset at initial recognition which may change over the life of the financial asset (for example, if there are repayments of principle or amortisation of the premium/discount).
The most significant elements of interest within a lending arrangement are typically the consideration for the time value of money and credit risk. To make SPPI assessment, the Group applies judgment and considers relevant factors such as currency in which the financial asset is denominated and the period for which the interest rate is set.
Classification and Subsequent Measurement of Financial Liabilities
As per SLFRS 09, the Group classifies financial liabilities, other than financial guarantees and loan commitments into one of the following categories;
Financial liabilities at fair value through profit or loss, and within this category as;
• Held for trading; or
• Designated at fair value through profit or loss
Financial liabilities measured at amortised cost.
The subsequent measurement of financial liabilities depends on their classification.
Reclassification of Financial Assets and Financial Liabilities
As per SLFRS 09, Financial assets are not reclassified subsequent to their initial recognition, except and only in those rare circumstances when the Group changes its objective of the business model for managing such financial assets which may include the acquisition, disposal or termination of a business line.
Financial Liabilities are not reclassified as such reclassifications are not permitted by SLFRS 09.
Derecognition of Financial Assets and Financial Liabilities
A financial asset (or, where applicable, a part of a financial asset or part of a group of similar financial assets) is derecognised when the rights to receive cash flows from the financial asset have expired.
A financial liability is derecognised when the obligation under the liability is discharged, cancelled or expires.
Modification of Financial Assets and Financial Liabilities
If the terms of a financial asset are modified, an assessment needs to be performed to determine whether the modified terms are substantially different from the existing terms. This assessment considers whether the cash flows of the modified asset are substantially different. Where terms are substantially different, the existing financial asset will be derecognised and a new financial asset will be recognised at fair value. Where terms are not substantially different, then the modification does not result in derecognition of the financial asset.
Modifications to the original terms and conditions of the loans due to the above COVID-19 moratoriums, did not result in derecognition of the original loans as the Management concluded that the modifications were not substantial. The Group recognises the interest income on gross carrying amount based on the concessionary rate for the moratorium period, while recognising the income forgone resulting from the said concession within the moratorium period. The original EIR has been applied to recognise interest income after the moratorium period till the end of the lifetime of the instrument.
Where an existing financial liability is replaced by another from the same lender on substantially different terms or the terms of an existing liability are substantially modified, such an exchange or modification is treated as a derecognition of the original liability and the recognition of a new liability. In this case, a new financial liability based on the modified terms is recognised at fair value.
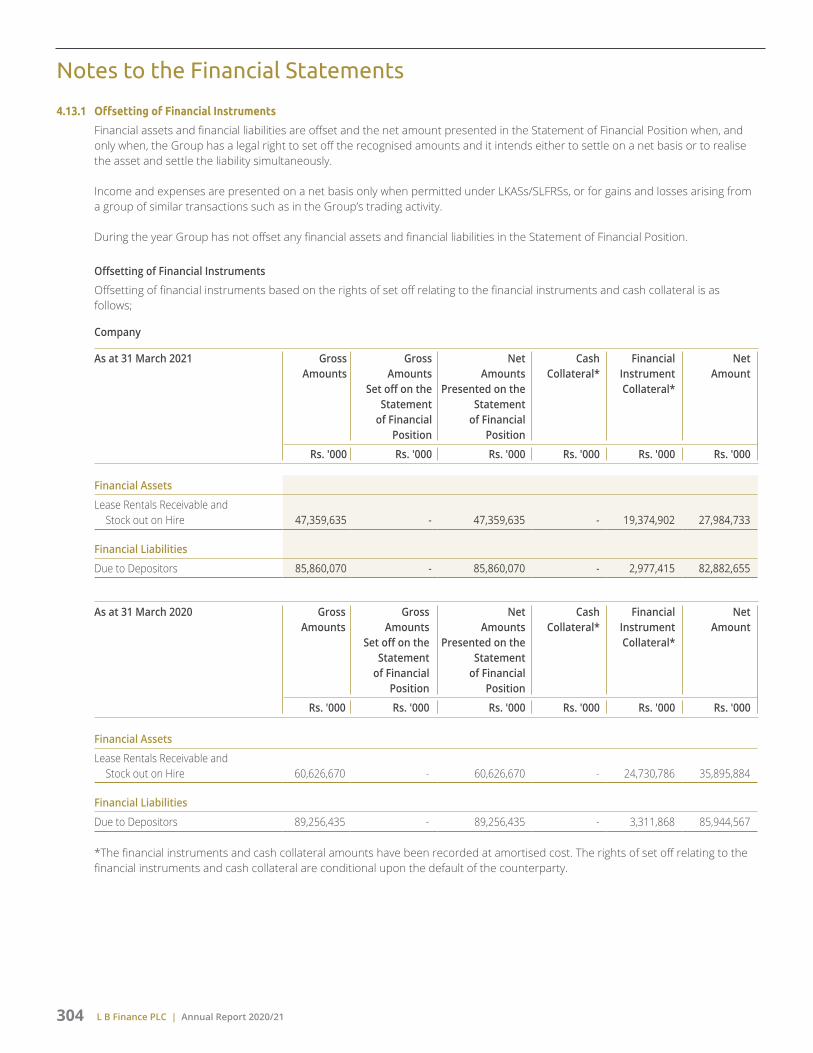
L B Finance PLC | Annual Report 2020/21304
4.13.1 Offsetting of Financial Instruments
Financial assets and financial liabilities are offset and the net amount presented in the Statement of Financial Position when, and only when, the Group has a legal right to set off the recognised amounts and it intends either to settle on a net basis or to realise the asset and settle the liability simultaneously.
Income and expenses are presented on a net basis only when permitted under LKASs/SLFRSs, or for gains and losses arising from a group of similar transactions such as in the Group’s trading activity.
During the year Group has not offset any financial assets and financial liabilities in the Statement of Financial Position.
Offsetting of Financial Instruments
Offsetting of financial instruments based on the rights of set off relating to the financial instruments and cash collateral is as follows;
Company
As at 31 March 2021 Gross Amounts
Gross Amounts Set off on the Statement of Financial Position
Net Amounts Presented on the Statement of Financial Position
Cash Collateral*
Financial Instrument Collateral*
Net Amount
Rs. '000 Rs. '000 Rs. '000 Rs. '000 Rs. '000 Rs. '000
Financial Assets
Lease Rentals Receivable and Stock out on Hire 47,359,635 - 47,359,635 - 19,374,902 27,984,733
Financial Liabilities
Due to Depositors 85,860,070 - 85,860,070 - 2,977,415 82,882,655
As at 31 March 2020 Gross Amounts
Gross Amounts Set off on the Statement of Financial Position
Net Amounts Presented on the Statement of Financial Position
Cash Collateral*
Financial Instrument Collateral*
Net Amount
Rs. '000 Rs. '000 Rs. '000 Rs. '000 Rs. '000 Rs. '000
Financial Assets
Lease Rentals Receivable and Stock out on Hire 60,626,670 - 60,626,670 - 24,730,786 35,895,884
Financial Liabilities
Due to Depositors 89,256,435 - 89,256,435 - 3,311,868 85,944,567
*The financial instruments and cash collateral amounts have been recorded at amortised cost. The rights of set off relating to the financial instruments and cash collateral are conditional upon the default of the counterparty.
Notes to the Financial Statements

L B Finance PLC | Annual Report 2020/21 305
Stability Leadership Strength Agility Responsibility Sustainability Success Supplementary Information
Group
As at 31 March 2021 Gross Amounts
Gross Amounts Set off on the Statement of Financial Position
Net Amounts Presented on the Statement of Financial Position
Cash Collateral*
Financial Instrument Collateral*
Net Amount
Rs. '000 Rs. '000 Rs. '000 Rs. '000 Rs. '000 Rs. '000
Financial Assets
Lease Rentals Receivable and Stock out on Hire 47,359,635 - 47,359,635 - 19,374,902 27,984,733
Financial Liabilities
Due to Depositors 85,940,213 - 85,940,213 - 2,977,415 82,962,798
As at 31 March 2020 Gross Amounts
Gross Amounts Set off on the Statement of Financial Position
Net Amounts Presented on the Statement of Financial Position
Cash Collateral*
Financial Instrument Collateral*
Net Amount
Rs. '000 Rs. '000 Rs. '000 Rs. '000 Rs. '000 Rs. '000
Financial Assets
Lease Rentals Receivable and Stock out on Hire 60,626,670 - 60,626,670 - 24,730,786 35,895,884
Financial Liabilities
Due to Depositors 89,315,097 - 89,315,097 - 3,311,868 86,003,229
*The financial instruments and cash collateral amounts have been recorded at amortised cost. The rights of set off relating to the financial instruments and cash collateral are conditional upon the default of the counterparty.
L B Finance PLC | Annual Report 2020/21306
4.14 FAIR VALUE MEASUREMENT
Accounting PolicyFair value is the price that would be received to sell an asset or paid to transfer a liability in an orderly transaction between market participants at the measurement date. The fair value measurement is based on the presumption that the transaction to sell the asset or transfer the liability takes place either:
01. In the principal market for the asset or liability; or
02. In the absence of a principal market, in the most advantageous market for the asset or liability.
The principal or the most advantageous market must be accessible by the Group.
The fair value of an asset or a liability is measured using the assumptions that market participants would use when pricing the asset or liability, assuming that market participants act in their economic best interest. A fair value measurement of a non financial asset takes into account a market participant’s ability to generate economic benefits by using the asset in its highest and best use or by selling it to another market participant that would use the asset in its highest and best use. The Group uses various valuation methodologies that are appropriate in the circumstances and for which sufficient data is available to measure fair value, maximising the use of relevant observable inputs and minimising the use of unobservable inputs. The use of observable and unobservable inputs and their significance in measuring fair value are reflected in our fair value hierarchy assessment.
Level 1: Inputs include quoted prices for identical instruments.
Level 2: Inputs include quoted prices for similar instruments and observable inputs such as interest rates, currency exchange rates and yield curves.
Level 3: Inputs include data not observable in the market and reflect management judgment about the assumptions market participants would use in pricing the instruments.
Valuation Framework
The Company has an established control framework for the measurement of fair values. Finance Department is responsible for the valuation of financial instruments. Obtaining input data, valuing of financial instruments and verifying the valuation models are being segregated within the finance department.
We review the inputs to the fair value measurements to ensure they are appropriately categorised within the fair value hierarchy. Transfers into and transfers out of the hierarchy levels are recognised as if they had taken place at the end of the reporting period.
Notes to the Financial Statements
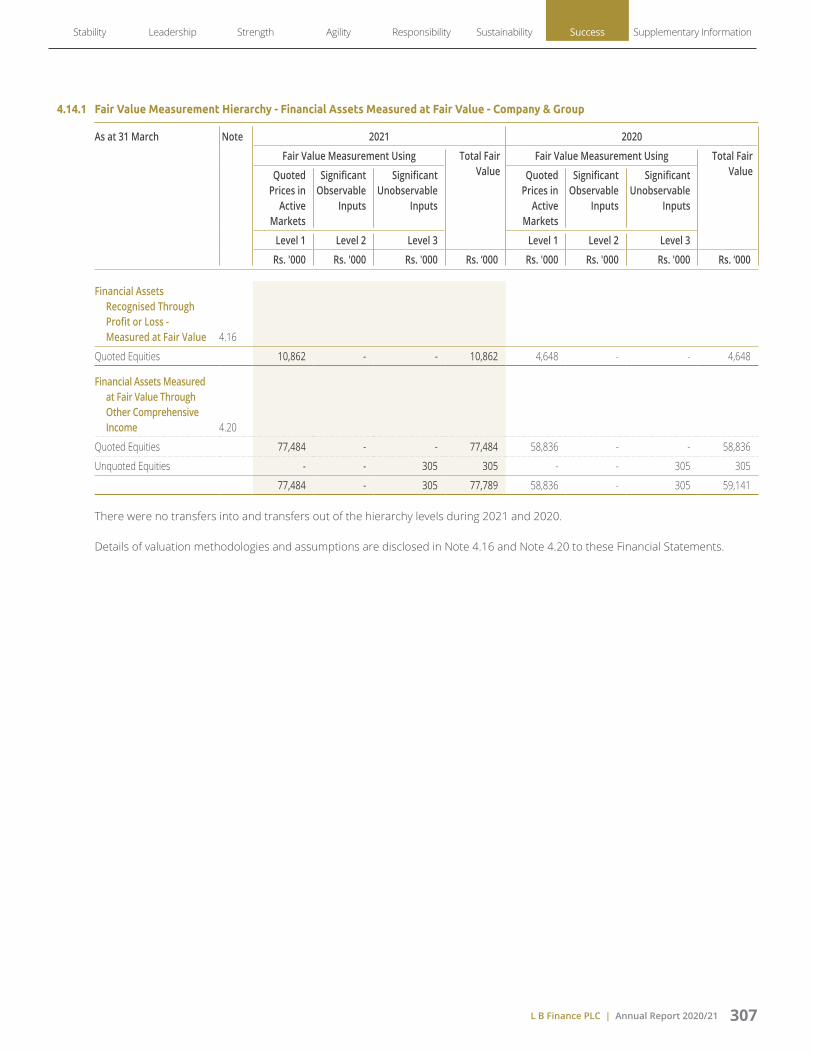
L B Finance PLC | Annual Report 2020/21 307
Stability Leadership Strength Agility Responsibility Sustainability Success Supplementary Information
4.14.1 Fair Value Measurement Hierarchy - Financial Assets Measured at Fair Value - Company & Group
As at 31 March Note 2021 2020
Fair Value Measurement Using Total Fair Value
Fair Value Measurement Using Total Fair ValueQuoted
Prices in Active
Markets
Significant Observable
Inputs
Significant Unobservable
Inputs
Quoted Prices in
Active Markets
Significant Observable
Inputs
Significant Unobservable
Inputs
Level 1 Level 2 Level 3 Level 1 Level 2 Level 3
Rs. '000 Rs. '000 Rs. '000 Rs. ‘000 Rs. '000 Rs. '000 Rs. '000 Rs. ‘000
Financial Assets Recognised Through Profit or Loss - Measured at Fair Value 4.16
Quoted Equities 10,862 - - 10,862 4,648 - - 4,648
Financial Assets Measured at Fair Value Through Other Comprehensive Income 4.20
Quoted Equities 77,484 - - 77,484 58,836 - - 58,836
Unquoted Equities - - 305 305 - - 305 305
77,484 - 305 77,789 58,836 - 305 59,141
There were no transfers into and transfers out of the hierarchy levels during 2021 and 2020.
Details of valuation methodologies and assumptions are disclosed in Note 4.16 and Note 4.20 to these Financial Statements.

L B Finance PLC | Annual Report 2020/21308
4.14.2 Fair Value Measurement Hierarchy - Financial Assets and Liabilities Measured at Amortised Cost
4.14.2 (a) Financial Assets Measured at Amortised Cost - Company
As at 31 March Note 2021 2020
Fair Value Measurement Using Total Fair Value
Carrying Value at Amortised
Cost
Fair Value Measurement Using Total Fair Value
Carrying Value at Amortised
CostQuoted Prices
in Active Markets
Significant Observable
Inputs
Significant Unobservable
Inputs
Quoted Prices in Active Markets
Significant Observable
Inputs
Significant Unobservable
Inputs
Level 1 Level 2 Level 3 Level 1 Level 2 Level 3
Rs. '000 Rs. '000 Rs. '000 Rs. '000 Rs. '000 Rs. '000 Rs. '000 Rs. '000 Rs. '000 Rs. '000
Cash and Cash Equivalents 4.15
Notes and Coins Held 1,126,735 - - 1,126,735 1,126,735 936,075 - - 936,075 936,075
Balances with Banks 1,660,900 - - 1,660,900 1,660,900 3,683,718 - - 3,683,718 3,683,718
Treasury Bills Repurchase Agreements - 3,399,665 - 3,399,665 3,399,665 - 1,542,844 - 1,542,844 1,542,844
2,787,635 3,399,665 - 6,187,300 6,187,300 4,619,793 1,542,844 - 6,162,637 6,162,637
Financial Assets at Amortised Cost - Loans and Receivables 4.17
Gold Loans - - 36,211,852 36,211,852 36,211,852 - - 30,865,783 30,865,783 30,865,783
Vehicle Loans - - 17,462,156 17,462,156 16,672,550 - - 12,386,581 12,386,581 11,862,685
Term Loans - - 6,585,120 6,585,120 6,402,524 - - 6,558,503 6,558,503 6,571,733
Mortgage Loans - - 3,802,358 3,802,358 3,627,087 - - 5,532,136 5,532,136 5,097,547
Power Drafts - - 3,958,033 3,958,033 3,864,175 - - 3,939,431 3,939,431 3,841,506
- - 68,019,519 68,019,519 66,778,188 - - 59,282,434 59,282,434 58,239,254
Financial Assets at Amortised Cost - Lease Rentals Receivable and Stock out on Hire 4.18
Lease Rentals Receivable - - 49,448,716 49,448,716 47,359,414 - - 62,559,507 62,559,507 60,624,088
Stock out on Hire - - 221 221 221 - - 4,433 4,433 2,582
- - 49,448,937 49,448,937 47,359,635 - - 62,563,940 62,563,940 60,626,670
Other Financial Assets 4.21
Treasury Bills Repurchase Agreements - 3,537,745 - 3,537,745 3,537,745 - 5,462,735 - 5,462,735 5,462,735
Investment in Fixed Deposits - 6,503,654 - 6,503,654 6,503,654 - 3,426,929 - 3,426,929 3,426,929
Insurance Premium Receivables - 331,731 - 331,731 331,731 - 206,038 - 206,038 206,038
Due from Subsidiary - 21,848 - 21,848 21,848 - 16,278 - 16,278 16,278
Sundry Debtors - 58,925 - 58,925 58,925 - 7,701 - 7,701 7,701
- 10,453,903 - 10,453,903 10,453,903 - 9,119,681 - 9,119,681 9,119,681
Notes to the Financial Statements

L B Finance PLC | Annual Report 2020/21 309
Stability Leadership Strength Agility Responsibility Sustainability Success Supplementary Information
4.14.2 Fair Value Measurement Hierarchy - Financial Assets and Liabilities Measured at Amortised Cost
4.14.2 (a) Financial Assets Measured at Amortised Cost - Company
As at 31 March Note 2021 2020
Fair Value Measurement Using Total Fair Value
Carrying Value at Amortised
Cost
Fair Value Measurement Using Total Fair Value
Carrying Value at Amortised
CostQuoted Prices
in Active Markets
Significant Observable
Inputs
Significant Unobservable
Inputs
Quoted Prices in Active Markets
Significant Observable
Inputs
Significant Unobservable
Inputs
Level 1 Level 2 Level 3 Level 1 Level 2 Level 3
Rs. '000 Rs. '000 Rs. '000 Rs. '000 Rs. '000 Rs. '000 Rs. '000 Rs. '000 Rs. '000 Rs. '000
Cash and Cash Equivalents 4.15
Notes and Coins Held 1,126,735 - - 1,126,735 1,126,735 936,075 - - 936,075 936,075
Balances with Banks 1,660,900 - - 1,660,900 1,660,900 3,683,718 - - 3,683,718 3,683,718
Treasury Bills Repurchase Agreements - 3,399,665 - 3,399,665 3,399,665 - 1,542,844 - 1,542,844 1,542,844
2,787,635 3,399,665 - 6,187,300 6,187,300 4,619,793 1,542,844 - 6,162,637 6,162,637
Financial Assets at Amortised Cost - Loans and Receivables 4.17
Gold Loans - - 36,211,852 36,211,852 36,211,852 - - 30,865,783 30,865,783 30,865,783
Vehicle Loans - - 17,462,156 17,462,156 16,672,550 - - 12,386,581 12,386,581 11,862,685
Term Loans - - 6,585,120 6,585,120 6,402,524 - - 6,558,503 6,558,503 6,571,733
Mortgage Loans - - 3,802,358 3,802,358 3,627,087 - - 5,532,136 5,532,136 5,097,547
Power Drafts - - 3,958,033 3,958,033 3,864,175 - - 3,939,431 3,939,431 3,841,506
- - 68,019,519 68,019,519 66,778,188 - - 59,282,434 59,282,434 58,239,254
Financial Assets at Amortised Cost - Lease Rentals Receivable and Stock out on Hire 4.18
Lease Rentals Receivable - - 49,448,716 49,448,716 47,359,414 - - 62,559,507 62,559,507 60,624,088
Stock out on Hire - - 221 221 221 - - 4,433 4,433 2,582
- - 49,448,937 49,448,937 47,359,635 - - 62,563,940 62,563,940 60,626,670
Other Financial Assets 4.21
Treasury Bills Repurchase Agreements - 3,537,745 - 3,537,745 3,537,745 - 5,462,735 - 5,462,735 5,462,735
Investment in Fixed Deposits - 6,503,654 - 6,503,654 6,503,654 - 3,426,929 - 3,426,929 3,426,929
Insurance Premium Receivables - 331,731 - 331,731 331,731 - 206,038 - 206,038 206,038
Due from Subsidiary - 21,848 - 21,848 21,848 - 16,278 - 16,278 16,278
Sundry Debtors - 58,925 - 58,925 58,925 - 7,701 - 7,701 7,701
- 10,453,903 - 10,453,903 10,453,903 - 9,119,681 - 9,119,681 9,119,681

L B Finance PLC | Annual Report 2020/21310
4.14.2 (b) Financial Assets Measured at Amortised Cost - Group
As at 31 March Note 2021 2020
Fair Value Measurement Using Total Fair Value
Carrying Value at Amortised
Cost
Fair Value Measurement Using Total Fair Value
Carrying Value at Amortised
CostQuoted Prices
in Active Markets
Significant Observable
Inputs
Significant Unobservable
Inputs
Quoted Prices in Active Markets
Significant Observable
Inputs
Significant Unobservable
Inputs
Level 1 Level 2 Level 3 Level 1 Level 2 Level 3
Rs. '000 Rs. '000 Rs. '000 Rs. '000 Rs. '000 Rs. '000 Rs. '000 Rs. '000 Rs. '000 Rs. '000
Cash and Cash Equivalents 4.15
Notes and Coins Held 1,132,788 - - 1,132,788 1,132,788 936,604 - - 936,604 936,604
Balances with Banks 1,848,333 - - 1,848,333 1,848,333 3,992,864 - - 3,992,864 3,992,864
Treasury Bills Repurchase Agreements - 3,399,665 - 3,399,665 3,399,665 - 1,542,844 - 1,542,844 1,542,844
2,981,121 3,399,665 - 6,380,786 6,380,786 4,929,468 1,542,844 - 6,472,312 6,472,312
Financial Assets at Amortised Cost - Loans and Receivables 4.17
Gold Loans - - 36,211,852 36,211,852 36,211,852 - - 30,865,783 30,865,783 30,865,783
Vehicle Loans - - 17,462,156 17,462,156 16,672,550 - - 12,386,581 12,386,581 11,862,685
Term Loans - - 7,273,513 7,273,513 7,090,917 - - 7,112,593 7,112,593 7,125,823
Mortgage Loans - - 3,802,358 3,802,358 3,627,087 - - 5,532,136 5,532,136 5,097,547
Power Drafts - - 3,958,033 3,958,033 3,864,175 - - 3,939,431 3,939,431 3,841,506
- - 68,707,912 68,707,912 67,466,581 - - 59,836,524 59,836,524 58,793,344
Financial Assets at Amortised Cost - Lease Rentals Receivable and Stock out on Hire 4.18
Lease Rentals Receivable - - 49,448,716 49,448,716 47,359,414 - - 62,559,507 62,559,507 60,624,088
Stock out on Hire - - 221 221 221 - - 4,433 4,433 2,582
- - 49,448,937 49,448,937 47,359,635 - - 62,563,940 62,563,940 60,626,670
Other Financial Assets 4.21
Treasury Bills Repurchase Agreements - 3,537,745 - 3,537,745 3,537,745 - 5,462,735 - 5,462,735 5,462,735
Investment in Fixed Deposits - 6,503,654 - 6,503,654 6,503,654 - 3,426,929 - 3,426,929 3,426,929
Insurance Premium Receivables - 331,731 - 331,731 331,731 - 206,038 - 206,038 206,038
Sundry Debtors - 60,019 - 60,019 60,019 - 10,059 - 10,059 10,059
- 10,433,149 - 10,433,149 10,433,149 - 9,105,761 - 9,105,761 9,105,761
Notes to the Financial Statements

L B Finance PLC | Annual Report 2020/21 311
Stability Leadership Strength Agility Responsibility Sustainability Success Supplementary Information
4.14.2 (b) Financial Assets Measured at Amortised Cost - Group
As at 31 March Note 2021 2020
Fair Value Measurement Using Total Fair Value
Carrying Value at Amortised
Cost
Fair Value Measurement Using Total Fair Value
Carrying Value at Amortised
CostQuoted Prices
in Active Markets
Significant Observable
Inputs
Significant Unobservable
Inputs
Quoted Prices in Active Markets
Significant Observable
Inputs
Significant Unobservable
Inputs
Level 1 Level 2 Level 3 Level 1 Level 2 Level 3
Rs. '000 Rs. '000 Rs. '000 Rs. '000 Rs. '000 Rs. '000 Rs. '000 Rs. '000 Rs. '000 Rs. '000
Cash and Cash Equivalents 4.15
Notes and Coins Held 1,132,788 - - 1,132,788 1,132,788 936,604 - - 936,604 936,604
Balances with Banks 1,848,333 - - 1,848,333 1,848,333 3,992,864 - - 3,992,864 3,992,864
Treasury Bills Repurchase Agreements - 3,399,665 - 3,399,665 3,399,665 - 1,542,844 - 1,542,844 1,542,844
2,981,121 3,399,665 - 6,380,786 6,380,786 4,929,468 1,542,844 - 6,472,312 6,472,312
Financial Assets at Amortised Cost - Loans and Receivables 4.17
Gold Loans - - 36,211,852 36,211,852 36,211,852 - - 30,865,783 30,865,783 30,865,783
Vehicle Loans - - 17,462,156 17,462,156 16,672,550 - - 12,386,581 12,386,581 11,862,685
Term Loans - - 7,273,513 7,273,513 7,090,917 - - 7,112,593 7,112,593 7,125,823
Mortgage Loans - - 3,802,358 3,802,358 3,627,087 - - 5,532,136 5,532,136 5,097,547
Power Drafts - - 3,958,033 3,958,033 3,864,175 - - 3,939,431 3,939,431 3,841,506
- - 68,707,912 68,707,912 67,466,581 - - 59,836,524 59,836,524 58,793,344
Financial Assets at Amortised Cost - Lease Rentals Receivable and Stock out on Hire 4.18
Lease Rentals Receivable - - 49,448,716 49,448,716 47,359,414 - - 62,559,507 62,559,507 60,624,088
Stock out on Hire - - 221 221 221 - - 4,433 4,433 2,582
- - 49,448,937 49,448,937 47,359,635 - - 62,563,940 62,563,940 60,626,670
Other Financial Assets 4.21
Treasury Bills Repurchase Agreements - 3,537,745 - 3,537,745 3,537,745 - 5,462,735 - 5,462,735 5,462,735
Investment in Fixed Deposits - 6,503,654 - 6,503,654 6,503,654 - 3,426,929 - 3,426,929 3,426,929
Insurance Premium Receivables - 331,731 - 331,731 331,731 - 206,038 - 206,038 206,038
Sundry Debtors - 60,019 - 60,019 60,019 - 10,059 - 10,059 10,059
- 10,433,149 - 10,433,149 10,433,149 - 9,105,761 - 9,105,761 9,105,761

L B Finance PLC | Annual Report 2020/21312
Sensitivity Analysis of Financial Assets Measured at Amortised Cost under Level 3 Category
Company Group
2021 2020 2021 2020
Rs. ‘000 Rs. ‘000 Rs. ‘000 Rs. ‘000
Increase/(Decrease) in Interest Rate
1bp Up (9,525) (10,013) (9,525) (10,013)
1bp Down 9,526 10,015 9,526 10,015
Unobservable Inputs Used in Measuring Fair Value under Level 3 Category
The following table sets out information about significant unobservable inputs used as at 31 March 2021 and 2020 in measuring financial instruments categorised as Level 3 in the fair value hierarchy.
Type of Financial Instrument
Company Group Valuation Technique
Significant Unobservable Input
Range of Estimates for
Unobservable Input
Fair Value Measurement Sensitivity to Unobservable Inputs
Fair Values as at 31
March 2021
Fair Values as at 31
March 2021
Rs. ‘000 Rs. ‘000
Financial Assets at Amortised Cost - Loans and Receivables
68,019,519 59,282,434 (2020)
68,707,912 59,836,524
(2020)
Discounted cash flow
Spread 2-11.1% (2020 : 2-11.5%)
A significant increase in the spread would result in a lower fair value.
Probability of default
10.65-25% (2020 : 1.5-7.1%)
Significant increases in probability of default isolation would result in lower fair values.
Loss severity 5-100% (2020 : 5-100%)
A significant reduction would result in higher fair values.
Expected prepayment rate
0.03-15.8% (2020 : 0.03-3.4%)
Correlates with the current interest rates.
Financial Assets at Amortised Cost - Lease Rentals Receivable and Stock out on Hire
49,448,937 62,563,940 (2020)
49,448,937 62,563,940 (2020)
Discounted cash flow
Spread 10.5% (2020 : 9%)
A significant increase in the spread would result in a lower fair value.
Probability of default
13.5-19.9% (2020 : 1.5-7.1%)
Significant increases in probability of default isolation would result in lower fair values.
Loss severity 5-100% (2020 : 5-100%)
A significant reduction would result in higher fair values.
Expected prepayment rate
0.5-7% (2020: 0.5-3.85%)
Correlates with the current interest rates.
There were no transfers into and transfers out of the hierarchy levels during 2021 and 2020.
Notes to the Financial Statements

L B Finance PLC | Annual Report 2020/21 313
Stability Leadership Strength Agility Responsibility Sustainability Success Supplementary Information
Valuation Methodologies and Assumptions
Cash and Cash Equivalents
Included in cash and cash equivalents are highly liquid investments that are readily convertible to known amounts of cash, and which are subject to an insignificant risk of change in value due to interest rate, quoted price, or penalty on withdrawal. A debt security is classified as a cash equivalent if it meets these criteria and if it has a remaining time to maturity of three months or less from the date of acquisition. Amounts on deposit and available upon demand, or negotiated to provide for daily liquidity without penalty, are classified as cash and cash equivalents. Time deposits, certificates of deposit and money market accounts that meet the above criteria are reported at par value on our Statement of Financial Position.
Finance Receivables (Loans, Lease Rentals Receivable and Stock out on Hire)
We measure performing finance receivables at fair value for purposes of disclosure using internal valuation models. These models project future cash flows of financing contracts based on scheduled contract payments (including principal and interest). The projected cash flows are discounted to present value based on assumptions regarding credit losses, prepayment speed, and applicable spreads to approximate current rates. Our assumptions regarding prepayment speed and credit losses are based on historical performance. We use the fair value of collateral to determine the fair value of non-performing finance receivables. The collateral for finance receivables is the vehicle financed, real estate, gold or other property. The fair value of finance receivables is categorised within Level 3 of the fair value measurement hierarchy. Loans and advances granted to customers with a variable rate are considered to be carried at fair value in the books net of credit losses.
Other Financial Assets
Since all the balances which are under other financial assets have short-term maturities, it is assumed that the carrying amounts of those balances approximate their fair values.

L B Finance PLC | Annual Report 2020/21314
4.14.2 (c) Financial Liabilities Measured at Amortised Cost - Company
As at 31 March Note 2021 2020
Fair Value Measurement Using Total Fair Value
Carrying Value at Amortised
Cost
Fair Value Measurement Using Total Fair Value
Carrying Value at Amortised
CostQuoted Prices
in Active Markets
Significant Observable
Inputs
Significant Unobservable
Inputs
Quoted Prices in Active Markets
Significant Observable
Inputs
Significant Unobservable
Inputs
Level 1 Level 2 Level 3 Level 1 Level 2 Level 3
Rs. '000 Rs. '000 Rs. '000 Rs. '000 Rs. '000 Rs. '000 Rs. '000 Rs. '000 Rs. '000 Rs. '000
Due to Banks 4.26
Bank Overdrafts - 988,099 - 988,099 988,099 - 720,411 - 720,411 720,411
Debt Funding from Banks - 16,095,838 - 16,095,838 15,479,080 - 24,096,491 - 24,096,491 22,050,674
- 17,083,937 - 17,083,937 16,467,179 - 24,816,902 - 24,816,902 22,771,085
Financial Liabilities at Amortised Cost - Due to Depositors 4.27
Fixed Deposits - - 83,251,581 83,251,581 81,916,722 - - 86,353,155 86,353,155 85,761,986
Certificates of Deposit - - 7,500 7,500 7,500 - - 10,373 10,373 10,373
Savings Deposits - - 3,935,848 3,935,848 3,935,848 - - 3,484,076 3,484,076 3,484,076
- - 87,194,929 87,194,929 85,860,070 - - 89,847,604 89,847,604 89,256,435
Debt Instruments Issued and Other Borrowed Funds 4.28
Unsecured Debentures - 3,405,315 - 3,405,315 3,113,916 - 3,215,338 - 3,215,338 3,111,186
- 3,405,315 - 3,405,315 3,113,916 - 3,215,338 - 3,215,338 3,111,186
Other Financial Liabilities 4.29
Trade Payables - 277,055 - 277,055 277,055 - 68,309 - 68,309 68,309
Insurance Premium Payables - 495,145 - 495,145 495,145 - 482,244 - 482,244 482,244
Unclaimed Balances - 677,661 - 677,661 677,661 - 657,711 - 657,711 657,711
Lease Liability - 1,440,965 - 1,440,965 1,440,965 - 1,321,454 - 1,321,454 1,321,454
Advances Collected from Customers - 46,750 - 46,750 46,750 - 99,166 - 99,166 99,166
Other Payables - 105,950 - 105,950 105,950 - 137,526 - 137,526 137,526
- 3,043,526 - 3,043,526 3,043,526 - 2,766,410 - 2,766,410 2,766,410
Notes to the Financial Statements

L B Finance PLC | Annual Report 2020/21 315
Stability Leadership Strength Agility Responsibility Sustainability Success Supplementary Information
4.14.2 (c) Financial Liabilities Measured at Amortised Cost - Company
As at 31 March Note 2021 2020
Fair Value Measurement Using Total Fair Value
Carrying Value at Amortised
Cost
Fair Value Measurement Using Total Fair Value
Carrying Value at Amortised
CostQuoted Prices
in Active Markets
Significant Observable
Inputs
Significant Unobservable
Inputs
Quoted Prices in Active Markets
Significant Observable
Inputs
Significant Unobservable
Inputs
Level 1 Level 2 Level 3 Level 1 Level 2 Level 3
Rs. '000 Rs. '000 Rs. '000 Rs. '000 Rs. '000 Rs. '000 Rs. '000 Rs. '000 Rs. '000 Rs. '000
Due to Banks 4.26
Bank Overdrafts - 988,099 - 988,099 988,099 - 720,411 - 720,411 720,411
Debt Funding from Banks - 16,095,838 - 16,095,838 15,479,080 - 24,096,491 - 24,096,491 22,050,674
- 17,083,937 - 17,083,937 16,467,179 - 24,816,902 - 24,816,902 22,771,085
Financial Liabilities at Amortised Cost - Due to Depositors 4.27
Fixed Deposits - - 83,251,581 83,251,581 81,916,722 - - 86,353,155 86,353,155 85,761,986
Certificates of Deposit - - 7,500 7,500 7,500 - - 10,373 10,373 10,373
Savings Deposits - - 3,935,848 3,935,848 3,935,848 - - 3,484,076 3,484,076 3,484,076
- - 87,194,929 87,194,929 85,860,070 - - 89,847,604 89,847,604 89,256,435
Debt Instruments Issued and Other Borrowed Funds 4.28
Unsecured Debentures - 3,405,315 - 3,405,315 3,113,916 - 3,215,338 - 3,215,338 3,111,186
- 3,405,315 - 3,405,315 3,113,916 - 3,215,338 - 3,215,338 3,111,186
Other Financial Liabilities 4.29
Trade Payables - 277,055 - 277,055 277,055 - 68,309 - 68,309 68,309
Insurance Premium Payables - 495,145 - 495,145 495,145 - 482,244 - 482,244 482,244
Unclaimed Balances - 677,661 - 677,661 677,661 - 657,711 - 657,711 657,711
Lease Liability - 1,440,965 - 1,440,965 1,440,965 - 1,321,454 - 1,321,454 1,321,454
Advances Collected from Customers - 46,750 - 46,750 46,750 - 99,166 - 99,166 99,166
Other Payables - 105,950 - 105,950 105,950 - 137,526 - 137,526 137,526
- 3,043,526 - 3,043,526 3,043,526 - 2,766,410 - 2,766,410 2,766,410

L B Finance PLC | Annual Report 2020/21316
4.14.2 (d) Financial Liabilities Measured at Amortised Cost - Group
As at 31 March Note 2021 2020
Fair Value Measurement Using Total Fair Value
Carrying Value at Amortised
Cost
Fair Value Measurement Using Total Fair Value
Carrying Value at Amortised
CostQuoted Prices
in Active Markets
Significant Observable
Inputs
Significant Unobservable
Inputs
Quoted Prices in Active Markets
Significant Observable
Inputs
Significant Unobservable
Inputs
Level 1 Level 2 Level 3 Level 1 Level 2 Level 3
Rs. '000 Rs. '000 Rs. '000 Rs. '000 Rs. '000 Rs. '000 Rs. '000 Rs. '000 Rs. '000 Rs. '000
Due to Banks 4.26
Bank Overdrafts - 988,099 - 988,099 988,099 - 720,411 - 720,411 720,411
Debt Funding from Banks - 16,155,316 - 16,155,316 15,538,558 - 24,208,348 - 24,208,348 22,162,530
- 17,143,415 - 17,143,415 16,526,657 - 24,928,759 - 24,928,759 22,882,941
Financial Liabilities at Amortised Cost - Due to Depositors 4.27
Fixed Deposits - - 83,251,581 83,251,581 81,916,722 - - 86,353,155 86,353,155 85,761,986
Certificates of Deposit - - 7,500 7,500 7,500 - - 10,373 10,373 10,373
Savings Deposits - - 4,015,991 4,015,991 4,015,991 - - 3,542,738 3,542,738 3,542,738
- - 87,275,072 87,275,072 85,940,213 - - 89,906,266 89,906,266 89,315,097
Debt Instruments Issued and Other Borrowed Funds 4.28
Unsecured Debentures - 3,405,315 - 3,405,315 3,113,916 - 3,215,338 - 3,215,338 3,111,186
- 3,405,315 - 3,405,315 3,113,916 - 3,215,338 - 3,215,338 3,111,186
Other Financial Liabilities 4.29
Trade Payables - 277,055 - 277,055 277,055 - 68,309 - 68,309 68,309
Insurance Premium Payables - 495,145 - 495,145 495,145 - 482,244 - 482,244 482,244
Unclaimed Balances - 678,461 - 678,461 678,461 - 658,068 - 658,068 658,068
Lease Liability - 1,440,965 - 1,440,965 1,440,965 - 1,321,454 - 1,321,454 1,321,454
Advances Collected from Customers - 46,750 - 46,750 46,750 - 99,166 - 99,166 99,166
Other Payables - 105,964 - 105,964 105,964 - 137,534 - 137,534 137,534
- 3,044,340 - 3,044,340 3,044,340 - 2,766,775 - 2,766,775 2,766,775
Notes to the Financial Statements
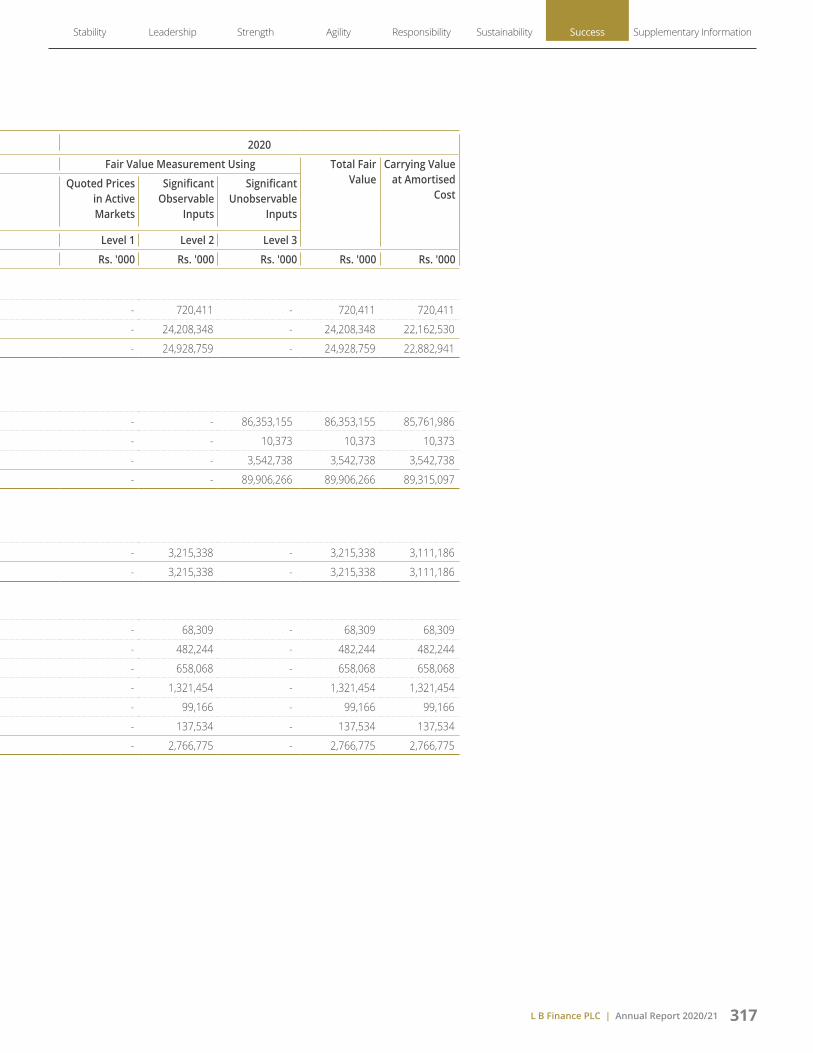
L B Finance PLC | Annual Report 2020/21 317
Stability Leadership Strength Agility Responsibility Sustainability Success Supplementary Information
4.14.2 (d) Financial Liabilities Measured at Amortised Cost - Group
As at 31 March Note 2021 2020
Fair Value Measurement Using Total Fair Value
Carrying Value at Amortised
Cost
Fair Value Measurement Using Total Fair Value
Carrying Value at Amortised
CostQuoted Prices
in Active Markets
Significant Observable
Inputs
Significant Unobservable
Inputs
Quoted Prices in Active Markets
Significant Observable
Inputs
Significant Unobservable
Inputs
Level 1 Level 2 Level 3 Level 1 Level 2 Level 3
Rs. '000 Rs. '000 Rs. '000 Rs. '000 Rs. '000 Rs. '000 Rs. '000 Rs. '000 Rs. '000 Rs. '000
Due to Banks 4.26
Bank Overdrafts - 988,099 - 988,099 988,099 - 720,411 - 720,411 720,411
Debt Funding from Banks - 16,155,316 - 16,155,316 15,538,558 - 24,208,348 - 24,208,348 22,162,530
- 17,143,415 - 17,143,415 16,526,657 - 24,928,759 - 24,928,759 22,882,941
Financial Liabilities at Amortised Cost - Due to Depositors 4.27
Fixed Deposits - - 83,251,581 83,251,581 81,916,722 - - 86,353,155 86,353,155 85,761,986
Certificates of Deposit - - 7,500 7,500 7,500 - - 10,373 10,373 10,373
Savings Deposits - - 4,015,991 4,015,991 4,015,991 - - 3,542,738 3,542,738 3,542,738
- - 87,275,072 87,275,072 85,940,213 - - 89,906,266 89,906,266 89,315,097
Debt Instruments Issued and Other Borrowed Funds 4.28
Unsecured Debentures - 3,405,315 - 3,405,315 3,113,916 - 3,215,338 - 3,215,338 3,111,186
- 3,405,315 - 3,405,315 3,113,916 - 3,215,338 - 3,215,338 3,111,186
Other Financial Liabilities 4.29
Trade Payables - 277,055 - 277,055 277,055 - 68,309 - 68,309 68,309
Insurance Premium Payables - 495,145 - 495,145 495,145 - 482,244 - 482,244 482,244
Unclaimed Balances - 678,461 - 678,461 678,461 - 658,068 - 658,068 658,068
Lease Liability - 1,440,965 - 1,440,965 1,440,965 - 1,321,454 - 1,321,454 1,321,454
Advances Collected from Customers - 46,750 - 46,750 46,750 - 99,166 - 99,166 99,166
Other Payables - 105,964 - 105,964 105,964 - 137,534 - 137,534 137,534
- 3,044,340 - 3,044,340 3,044,340 - 2,766,775 - 2,766,775 2,766,775

L B Finance PLC | Annual Report 2020/21318
Sensitivity Analysis of Financial Liabilities Measured at Amortised Cost under Level 3 Category
Company Group
2021 2020 2021 2020
Rs. ‘000 Rs. ‘000 Rs. ‘000 Rs. ‘000
Increase/(Decrease) in Interest Rate
1bp Up (7,524) (9,972) (7,524) (9,972)
1bp Down 7,525 9,974 7,525 9,974
Unobservable Inputs Used in Measuring Fair Value under Level 3 Category
The following table sets out information about significant unobservable inputs used as at 31 March 2021 and 2020 in measuring financial instruments categorised as Level 3 in the fair value hierarchy.
Type of Financial Instrument
Company Group Valuation Technique
Significant Unobservable Input
Range of Estimates for
Unobservable Input
Fair Value Measurement Sensitivity to Unobservable Inputs
Fair Values as at 31
March 2021
Fair Values as at 31
March 2021
Rs. ‘000 Rs. ‘000
Financial Liabilities at Amortised Cost - Due to Depositors
87,194,929 89,847,604 (2020)
87,275,072 89,906,266 (2020)
Discounted cash flow
Spread 0-2.38% (2020 : 0-2.66%)
A significant increase in the spread would result in a lower fair value.
Expected prepayment rate
0.46-0.98% (2020 : 0.36-2.83%)
Correlates with the current interest rates.
There were no financial liabilities recorded at fair value as at 31 March 2021 and 2020.
There were no transfers into and transfers out of the hierarchy levels during 2021 and 2020.
Valuation Methodologies and Assumptions
Due to Depositors
We measure the fair value using internal valuation models. These models project future cash flows of fixed deposits based on scheduled maturities (including principal and interest) and pre-maturities of deposits. The projected cash flows are discounted to present value based on applicable spreads to approximate current deposit rates for each tenor. Our assumptions regarding pre-maturity speed and spreads are based on historical performance. Certificates of deposit that have a maturity less than one year and savings deposits without a specific maturity are assumed that the carrying amounts approximate their fair values. The fair value of Due to Depositors is categorised within Level 3 of the hierarchy.
Debentures, Bank Borrowings, Securitised Notes and Debt Instruments
We measure fair value for listed debentures using quoted prices for our own debentures with approximately the same remaining maturities, where possible. If the particular debenture is off the run, we estimate the fair value using discounted cash flows and market-based expectations for interest rates, credit risk, and the contractual terms of the debenture. Comparable on the run debenture Yield to Maturity (YTM) assumed to be a good approximation for the fair value estimation of off the run debentures. We estimate the fair value of Bank borrowings and debt instruments using discounted cash flows and use the most recent transacted rate and/or unexpired offered rate of a similar instrument or borrowing. Debt instrument and bank borrowing do not carry prepayment or embedded options. The fair value of debt is categorised within Level 2 of the hierarchy.
Other Financial Liabilities
Since all the liabilities which are under other financial liabilities have short-term maturities, it is assumed that the carrying amounts of those liabilities approximate their fair values.
Notes to the Financial Statements
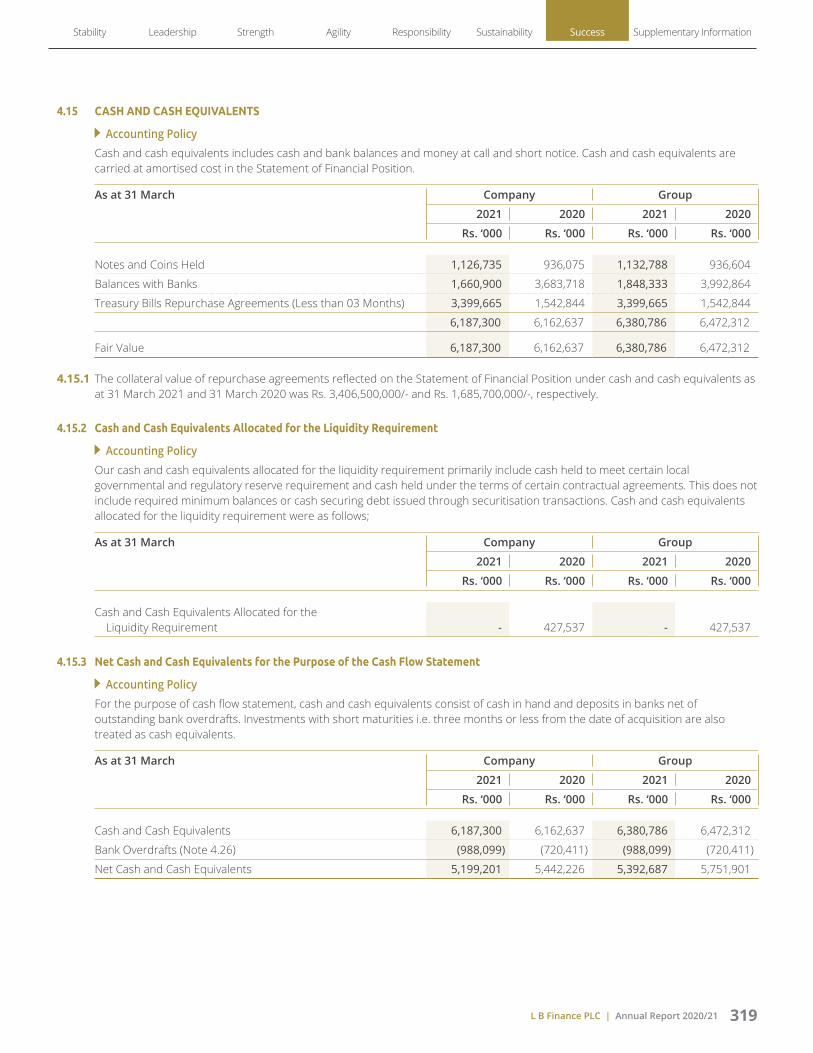
L B Finance PLC | Annual Report 2020/21 319
Stability Leadership Strength Agility Responsibility Sustainability Success Supplementary Information
4.15 CASH AND CASH EQUIVALENTS
Accounting Policy Cash and cash equivalents includes cash and bank balances and money at call and short notice. Cash and cash equivalents are carried at amortised cost in the Statement of Financial Position.
As at 31 March Company Group
2021 2020 2021 2020
Rs. ‘000 Rs. ‘000 Rs. ‘000 Rs. ‘000
Notes and Coins Held 1,126,735 936,075 1,132,788 936,604
Balances with Banks 1,660,900 3,683,718 1,848,333 3,992,864
Treasury Bills Repurchase Agreements (Less than 03 Months) 3,399,665 1,542,844 3,399,665 1,542,844
6,187,300 6,162,637 6,380,786 6,472,312
Fair Value 6,187,300 6,162,637 6,380,786 6,472,312
4.15.1 The collateral value of repurchase agreements reflected on the Statement of Financial Position under cash and cash equivalents as at 31 March 2021 and 31 March 2020 was Rs. 3,406,500,000/- and Rs. 1,685,700,000/-, respectively.
4.15.2 Cash and Cash Equivalents Allocated for the Liquidity Requirement
Accounting Policy Our cash and cash equivalents allocated for the liquidity requirement primarily include cash held to meet certain local governmental and regulatory reserve requirement and cash held under the terms of certain contractual agreements. This does not include required minimum balances or cash securing debt issued through securitisation transactions. Cash and cash equivalents allocated for the liquidity requirement were as follows;
As at 31 March Company Group
2021 2020 2021 2020
Rs. ‘000 Rs. ‘000 Rs. ‘000 Rs. ‘000
Cash and Cash Equivalents Allocated for the Liquidity Requirement - 427,537 - 427,537
4.15.3 Net Cash and Cash Equivalents for the Purpose of the Cash Flow Statement
Accounting Policy For the purpose of cash flow statement, cash and cash equivalents consist of cash in hand and deposits in banks net of outstanding bank overdrafts. Investments with short maturities i.e. three months or less from the date of acquisition are also treated as cash equivalents.
As at 31 March Company Group
2021 2020 2021 2020
Rs. ‘000 Rs. ‘000 Rs. ‘000 Rs. ‘000
Cash and Cash Equivalents 6,187,300 6,162,637 6,380,786 6,472,312
Bank Overdrafts (Note 4.26) (988,099) (720,411) (988,099) (720,411)
Net Cash and Cash Equivalents 5,199,201 5,442,226 5,392,687 5,751,901

L B Finance PLC | Annual Report 2020/21320
4.16 FINANCIAL ASSETS RECOGNISED THROUGH PROFIT OR LOSS - MEASURED AT FAIR VALUE
Accounting Policy The Group classifies financial assets as financial assets recognised through profit or loss when they have been purchased primarily for short-term profit making through trading activities. Financial assets recognised through profit or loss are recorded and measured in the Statement of Financial Position at fair value. Changes in fair value are recognised in net trading income.
Financial assets recognised through profit or loss include quoted equity securities that have been acquired principally for the purpose of selling in the near term, and are recorded at fair values. The quoted equity securities are valued using the market prices published by the Colombo Stock Exchange.
SLFRS 09 requires financial instruments to be classified based on a combination of the entity’s business model for managing the assets and the instruments’ contractual cash flow characteristics. For financial assets that are debt instruments, held for trading is a business model objective that results in measurement at fair value through profit or loss.
As at 31 March Company & Group
2021 2020
Rs. ‘000 Rs. ‘000
Equity Securities - Quoted (Note 4.16.1) 10,862 4,648
4.16.1 Equity Securities - Quoted
As at 31 March Company & Group Company & Group
2021 2020
Number ofShares
Cost Market Value
Number ofShares
Cost Market Value
Rs. '000 Rs. '000 Rs. '000 Rs. '000
Banks
Seylan Bank PLC (Non-Voting) 107,479 1,685 4,643 104,110 1,685 2,301
1,685 4,643 1,685 2,301
Food, Beverage and Tobacco
Bairaha Farms PLC 17,600 425 2,424 17,600 425 1,385
425 2,424 425 1,385
Capital Goods
Lanka Walltiles PLC* 19,740 790 3,721 19,740 790 811
Hayleys PLC* 1,222 207 74 1,222 207 151
997 3,795 997 962
Total 3,107 10,862 3,107 4,648
Global Industry Classification Standard (GICS)
*Investments made in related parties
Notes to the Financial Statements

L B Finance PLC | Annual Report 2020/21 321
Stability Leadership Strength Agility Responsibility Sustainability Success Supplementary Information
4.17 FINANCIAL ASSETS AT AMORTISED COST - LOANS AND RECEIVABLES
Accounting Policy Loans and advances include financial assets measured at amortised cost if both of the following conditions are met;
Assets that are held within a business model whose objective is to hold the assets in order to collect contractual cash flows.
Contractual terms of the assets give rise on specific dates to cash flows that are solely payment of principal and interest on the principal outstanding.
After initial measurement loans and advances are subsequently measured at amortised cost using the Effective Interest Rate (EIR), less allowance for impairment. Amortised cost is calculated by taking into account any discount or premium on acquisition and fees and costs that are an integral part of the EIR. The amortisation is included in ‘Interest Income’ in the Income Statement. The losses arising from impairment are recognised in ‘impairment charges and other losses’ in the Income Statement.
As at 31 March Company Group
2021 2020 2021 2020
Rs. ‘000 Rs. ‘000 Rs. ‘000 Rs. ‘000
Gold Loans 36,656,594 31,017,589 36,656,594 31,017,589
Vehicle Loans 17,085,331 12,125,470 17,085,331 12,125,470
Term Loans 6,788,112 6,923,995 7,549,199 7,511,817
Mortgage Loans 5,483,381 6,456,908 5,483,381 6,456,908
Power Drafts 4,052,550 3,960,962 4,052,550 3,960,962
Factoring Receivable 82,941 103,636 82,941 103,636
Gross Loans and Receivables 70,148,909 60,588,560 70,909,996 61,176,382
Allowance for Impairment Losses (Note 4.19) (3,370,721) (2,349,306) (3,443,415) (2,383,038)
Net Loans and Receivables Subject to Fair Value (Note 4.17.2) 66,778,188 58,239,254 67,466,581 58,793,344
Fair Value 68,019,519 59,282,434 68,707,912 59,836,524
4.17.1 Loans and Receivables Include Loans Granted to Employees, the Movement of which is as Follows;
Company & Group
2021 2020
Rs. ‘000 Rs. ‘000
As at the Beginning of the Year 564,853 508,402
Loans Granted During the Year 464,052 588,462
Repayments During the Year (612,459) (532,011)
As at the End of the Year 416,446 564,853

L B Finance PLC | Annual Report 2020/21322
4.17.2 Contractual Maturity Analysis of Loans and Receivables - Company
As at 31 March 2021 Within One Year
1 - 5 Years
Over 5 Years
Total
Rs. ‘000 Rs. ‘000 Rs. ‘000 Rs. ‘000
Gold Loans 36,656,594 - - 36,656,594
Vehicle Loans 5,301,055 11,745,962 38,314 17,085,331
Term Loans 3,382,386 1,995,097 1,410,629 6,788,112
Mortgage Loans 2,325,310 2,746,738 411,333 5,483,381
Power Drafts 2,330,241 1,722,309 - 4,052,550
Factoring Receivable 77,535 5,406 - 82,941
Gross Loans and Receivables 50,073,121 18,215,512 1,860,276 70,148,909
Allowance for Impairment Losses (Note 4.19) (3,370,721)
Net Loans and Receivables 66,778,188
As at 31 March 2020 Within One Year
1 - 5 Years
Over 5 Years
Total
Rs. ‘000 Rs. ‘000 Rs. ‘000 Rs. ‘000
Gold Loans 31,017,589 - - 31,017,589
Vehicle Loans 3,910,128 8,138,698 76,645 12,125,471
Term Loans 4,021,403 2,902,592 - 6,923,995
Mortgage Loans 2,055,326 3,783,094 618,487 6,456,907
Power Drafts 3,305,596 655,366 - 3,960,962
Factoring Receivable 99,579 4,057 - 103,636
Gross Loans and Receivables 44,409,621 15,483,807 695,132 60,588,560
Allowance for Impairment Losses (Note 4.19) (2,349,306)
Net Loans and Receivables 58,239,254
Our loans and receivables are prepayable, so prepayments may cause actual maturities to differ from contractual maturities.
Notes to the Financial Statements

L B Finance PLC | Annual Report 2020/21 323
Stability Leadership Strength Agility Responsibility Sustainability Success Supplementary Information
4.17.3 Contractual Maturity Analysis of Loans and Receivables - Group
As at 31 March 2021 Within One Year
1 - 5 Years
Over 5 Years
Total
Rs. ‘000 Rs. ‘000 Rs. ‘000 Rs. ‘000
Gold Loans 36,656,594 - - 36,656,594
Vehicle Loans 5,301,055 11,745,962 38,314 17,085,331
Term Loans 4,125,871 2,012,699 1,410,629 7,549,199
Mortgage Loans 2,325,310 2,746,738 411,333 5,483,381
Power Drafts 2,330,241 1,722,309 - 4,052,550
Factoring Receivable 77,535 5,406 - 82,941
Gross Loans and Receivables 50,816,606 18,233,114 1,860,276 70,909,996
Allowance for Impairment Losses (Note 4.19) (3,443,415)
Net Loans and Receivables 67,466,581
As at 31 March 2020 Within One Year
1 - 5 Years
Over 5 Years
Total
Rs. ‘000 Rs. ‘000 Rs. ‘000 Rs. ‘000
Gold Loans 31,017,589 - - 31,017,589
Vehicle Loans 3,910,128 8,138,698 76,645 12,125,471
Term Loans 4,600,545 2,911,272 - 7,511,817
Mortgage Loans 2,055,326 3,783,094 618,487 6,456,907
Power Drafts 3,305,596 655,366 - 3,960,962
Factoring Receivable 99,579 4,057 - 103,636
Gross Loans and Receivables 44,988,763 15,492,487 695,132 61,176,382
Allowance for Impairment Losses (Note 4.19) (2,383,038)
Net Loans and Receivables 58,793,344
Our loans and receivables are prepayable, so prepayments may cause actual maturities to differ from contractual maturities.

L B Finance PLC | Annual Report 2020/21324
4.17.4 Credit Exposure Movement - ECL Stage-wise - Company
Loans and Receivables 2021
Stage 01 Stage 02 Stage 03 Total
Rs. '000 Rs. '000 Rs. '000 Rs. '000
Gross Carrying Amount as at 1 April 2020 50,239,377 6,099,973 4,249,210 60,588,560
Transfer to Stage 01 1,380,753 (1,225,754) (154,999) -
Transfer to Stage 02 (1,362,142) 1,604,585 (242,443) -
Transfer to Stage 03 (591,504) (788,642) 1,380,146 -
New Assets Originated or Purchased 21,748,150 5,488,919 3,265,150 30,502,219
Financial Assets Derecognised or Repaid (12,779,122) (5,255,685) (2,785,930) (20,820,737)
Write-offs - - (121,132) (121,132)
As at 31 March 2021 58,635,512 5,923,396 5,590,002 70,148,910
Loans and Receivables 2020
Stage 01 Stage 02 Stage 03 Total
Rs. '000 Rs. '000 Rs. '000 Rs. '000
Gross Carrying Amount as at 1 April 2019 41,856,465 4,329,972 2,529,711 48,716,148
Transfer to Stage 01 424,101 (396,489) (27,612) -
Transfer to Stage 02 (2,143,465) 2,256,215 (112,750) -
Transfer to Stage 03 (979,231) (1,323,489) 2,302,720 -
New Assets Originated or Purchased 22,513,747 5,282,778 2,898,540 30,695,065
Financial Assets Derecognised or Repaid (11,432,205) (4,048,788) (3,256,963) (18,737,956)
Write-offs (35) (226) (84,436) (84,697)
As at 31 March 2020 50,239,377 6,099,973 4,249,210 60,588,560
Notes to the Financial Statements

L B Finance PLC | Annual Report 2020/21 325
Stability Leadership Strength Agility Responsibility Sustainability Success Supplementary Information
4.17.5 Credit Exposure Movement - ECL Stage-wise - Group
Loans and Receivables 2021
Stage 01 Stage 02 Stage 03 Total
Rs. '000 Rs. '000 Rs. '000 Rs. '000
Gross Carrying Amount as at 1 April 2020 50,797,876 6,104,577 4,273,929 61,176,382
Transfer to Stage 01 1,381,107 (1,225,972) (155,135) -
Transfer to Stage 02 (1,506,052) 1,748,495 (242,443) -
Transfer to Stage 03 (819,185) (793,698) 1,612,883 -
New Assets Originated or Purchased 22,220,718 5,698,555 3,311,933 31,231,206
Financial Assets Derecognised or Repaid (13,358,888) (5,260,959) (2,786,546) (21,406,393)
Write-offs - - (121,132) (121,132)
Exchange Rate Variance on Foreign Currency Provisions 29,934 - - 29,934
As at 31 March 2021 58,745,510 6,270,998 5,893,489 70,909,997
Loans and Receivables 2020
Stage 01 Stage 02 Stage 03 Total
Rs. '000 Rs. '000 Rs. '000 Rs. '000
Gross Carrying Amount as at 1 April 2019 42,239,348 4,329,972 2,529,711 49,099,031
Transfer to Stage 01 424,101 (396,489) (27,612) -
Transfer to Stage 02 (2,143,465) 2,256,215 (112,750) -
Transfer to Stage 03 (979,231) (1,323,489) 2,302,720 -
New Assets Originated or Purchased 23,016,720 5,287,796 2,921,470 31,225,986
Financial Assets Derecognised or Repaid (11,824,698) (4,049,202) (3,255,174) (19,129,074)
Write-offs (35) (226) (84,436) (84,697)
Exchange Rate Variance on Foreign Currency Provisions 65,136 - - 65,136
As at 31 March 2020 50,797,876 6,104,577 4,273,929 61,176,382

L B Finance PLC | Annual Report 2020/21326
4.18 FINANCIAL ASSETS AT AMORTISED COST - LEASE RENTALS RECEIVABLE AND STOCK OUT ON HIRE
Accounting PolicyAgreements which transfer to counterparties substantially all the risks and rewards incidental to the ownership of assets, but not necessarily legal title, are classified as finance leases. When the Group is the lessor under finance leases the amounts due under the leases, after deduction of unearned charges, are recognised on the Statement of Financial Position. The finance income receivable is recognised in ‘interest income’ over the periods of the leases so as to give a constant rate of return on the net investment in the leases.
Lease and stock out on hire include financial assets measured at amortised cost if both of the following conditions are met;
Assets that are held within a business model whose objective is to hold the assets in order to collect contractual cash flows.
Contractual terms of the assets give rise on specific dates to cash flows that are solely payment of principal and interest on the principal outstanding.
After initial measurement, lease rentals receivable and stock out on hire are subsequently measured at amortised cost using the Effective Interest Rate (EIR), less allowance for impairment. Amortised cost is calculated by taking into account any discount or premium on acquisition and fees and costs that are an integral part of the EIR. The amortisation is included in ‘interest income’ in the Income Statement. The losses arising from impairment are recognised in ‘impairment charges and other losses’ in the Income Statement.
As at 31 March Company & Group Company & Group
2021 2020
Lease Hire Purchase
Total Lease Hire Purchase
Total
Rs. '000 Rs. '000 Rs. '000 Rs. '000 Rs. '000 Rs. '000
Gross Rentals Receivable 64,551,127 104,480 64,655,607 82,924,583 117,309 83,041,892
Unearned Income (14,131,368) (25) (14,131,393) (19,502,061) (87) (19,502,148)
Net Rentals Receivable 50,419,759 104,455 50,524,214 63,422,522 117,222 63,539,744
Rentals Received in Advance (3,308) - (3,308) (5,041) - (5,041)
Allowance for Impairment Losses (Note 4.19) (3,057,037) (104,234) (3,161,271) (2,793,393) (114,640) (2,908,033)
Total Net Rentals Receivable Subject to Fair Value (Note 4.18.2) 47,359,414 221 47,359,635 60,624,088 2,582 60,626,670
Fair Value 49,448,937 62,563,940
Operating Lease
All other leases are classified as operating leases. When acting as lessor, the Group includes the assets subject to operating leases in ‘property, plant and equipment’ and accounts for them accordingly. Impairment losses are recognised to the extent that residual values are not fully recoverable and the carrying value of the assets is thereby impaired.
4.18.1 Lease and Hire Purchase Facilities Granted to Employees, the Movement of which is as Follows;
Company & Group
2021 2020
Rs. ‘000 Rs. ‘000
As at the Beginning of the Year 35,168 48,957
Lease and Hire Purchase Facilities Granted During the Year 6,009 17,448
Repayments During the Year (21,934) (31,237)
As at the End of the Year 19,243 35,168
Notes to the Financial Statements

L B Finance PLC | Annual Report 2020/21 327
Stability Leadership Strength Agility Responsibility Sustainability Success Supplementary Information
4.18.2 Contractual Maturity Analysis of Lease Rentals Receivable and Stock out on Hire - Company & Group
As at 31 March 2021 Lease Hire Purchase
Within One Year
1 - 5 Years
Over 5 Years
Total Within One Year
1 - 5 Years
Over 5 Years
Total
Rs. '000 Rs. '000 Rs. '000 Rs. ‘000 Rs. '000 Rs. '000 Rs. ‘000 Rs. '000
Gross Rentals Receivable 28,863,006 35,682,196 5,925 64,551,127 104,401 79 - 104,480
Unearned Income (7,483,700) (6,647,373) (295) (14,131,368) (24) (1) - (25)
Net Rentals Receivable 21,379,306 29,034,823 5,630 50,419,759 104,377 78 - 104,455
Rentals Received in Advance (3,308) -
Allowance for Impairment Losses (3,057,037) (104,234)
Total Net Rentals Receivable 47,359,414 221
As at 31 March 2020 Lease Hire Purchase
Within One Year
1 - 5 Years
Over 5 Years
Total Within One Year
1 - 5 Years
Over 5 Years
Total
Rs. '000 Rs. '000 Rs. '000 Rs. ‘000 Rs. '000 Rs. '000 Rs. ‘000 Rs. '000
Gross Rentals Receivable 36,692,691 46,202,072 29,820 82,924,583 116,644 665 - 117,309
Unearned Income (10,079,620) (9,420,682) (1,759) (19,502,061) (64) (23) - (87)
Net Rentals Receivable 26,613,071 36,781,390 28,061 63,422,522 116,580 642 - 117,222
Rentals Received in Advance (5,041) -
Allowance for Impairment Losses (2,793,393) (114,640)
Total Net Rentals Receivable 60,624,088 2,582
Our lease rentals receivable and stock out on hire are prepayable, so prepayments may cause actual maturities to differ from contractual maturities.

L B Finance PLC | Annual Report 2020/21328
4.18.3 Credit Exposure Movement - ECL Stage-wise Lease Rentals Receivable and Stock out on Hire
Company & Group Company & Group
2021 2020
Stage 01 Stage 02 Stage 03 Total Stage 01 Stage 02 Stage 03 Total
Rs. '000 Rs. '000 Rs. '000 Rs. '000 Rs. '000 Rs. '000 Rs. '000 Rs. '000
Gross Carrying Amount as at the Beginning of the Year 32,481,283 21,984,111 9,069,308 63,534,702 44,672,064 18,700,586 5,103,566 68,476,216
Transfer to Stage 01 6,643,342 (5,895,550) (747,792) - 2,257,459 (2,095,376) (162,083) -
Transfer to Stage 02 (4,471,360) 5,457,333 (985,973) - (12,202,504) 12,624,522 (422,018) -
Transfer to Stage 03 (1,315,361) (2,993,444) 4,308,805 - (2,531,399) (4,398,591) 6,929,990 -
New Assets Originated or Purchased 18,672,757 10,189,423 4,825,552 33,687,732 29,602,847 17,016,383 7,044,878 53,664,108
Financial Assets Derecognised or Repaid (20,409,212) (17,725,983) (8,208,392) (46,343,587) (29,317,134) (19,862,726) (9,119,208) (58,299,068)
Write-offs - - (357,941) (357,941) (50) (687) (305,816) (306,553)
As at the End of the Year 31,601,449 11,015,890 7,903,567 50,520,906 32,481,283 21,984,111 9,069,309 63,534,703
4.19 ALLOWANCE FOR IMPAIRMENT LOSSES
Accounting Policy
Overview of the Expected Credit Loss (ECL) Principles
The adoption of SLFRS 09 has fundamentally changed the Group’s loan loss impairment method by replacing LKAS 39’s incurred loss approach with a forward-looking Expected Credit Loss (ECL) approach. From 1 April 2018, the Group has been recording the allowance for expected credit losses for all loans and other debt financial assets not held at FVPL, together with loan commitments and financial guarantee contracts, in this section all referred to as ‘financial instruments’. Equity instruments are not subject to impairment under SLFRS 09.
The ECL allowance is based on the credit losses expected to arise over the life of the asset.
The 12 months ECL is the portion of Lifetime ECLs that represent the ECLs that result from default events on a financial instrument that are possible within the 12 months after the reporting date.
Both Lifetime ECLs and 12 months ECLs are calculated on either an individual basis or a collective basis, depending on the nature of the underlying portfolio of financial instruments.
The Group has established a policy to perform an assessment, at the end of each reporting period, of whether a financial instrument’s credit risk has increased significantly since initial recognition, by considering the change in the risk of default occurring over the remaining life of the financial instrument. Based on such process Group allocates loans into Stage 01, Stage 02, Stage 03 as described below;
Stage 01
When loans are first recognised, the Group recognises an allowance based on 12 months ECLs. Stage 01 loans also include facilities where the credit risk has improved and the loan has been reclassified from Stage 02.
Stage 02
When a loan has shown a significant increase in credit risk since origination, the Group records an allowance for the Lifetime ECLs. Stage 02 loans also include facilities, where the credit risk has improved and the loan has been reclassified from Stage 03.
Notes to the Financial Statements

L B Finance PLC | Annual Report 2020/21 329
Stability Leadership Strength Agility Responsibility Sustainability Success Supplementary Information
Stage 03
When a loan is considered to be credit impaired/contain objective evidences of incurred loss, the Group records an allowance for the Lifetime ECLs.
Significant Increase in Credit Risk
The Group continuously monitors all assets subject to ECL, in order to determine whether there has been a significant increase in credit risk since initial recognition and whether the instrument or a portfolio of instruments is subject to 12 months ECL or Lifetime ECL. The Group considers an exposure to have a significant increase in credit risk at 30 days past due.
Individually Significant Impairment Assessment and Loans which are Not Impaired Individually
Group will individually assess all significant customer exposures to identify whether there are any indicators of impairment. Loans with objective evidence of incurred losses are classified as Stage 03. Loans which are individually significant but not impaired will be assessed collectively for impairment under either Stage 01 or Stage 02, based on the above specified criteria to identify whether there have been a significant credit deterioration since origination.
While establishing significant credit deterioration, Group will consider the following criteria;
Other changes in the rates or terms of an existing financial instrument that would be significantly different if the instrument was newly originated.
Significant changes in external market indicators of credit risk for a particular financial instrument or similar financial instrument.
Other information related to the borrower, such as changes in the price of a borrower’s debt/equity instrument.
An actual/expected internal credit rating downgrade for the borrower or decrease in behavioural score used to assess credit risk internally.
Existing or forecasted adverse changes in business, financial or economic conditions that are expected to cause a significant change in the borrower’s ability to meet its obligation.
An actual or expected significant change in the operating results of the borrower in relation to actual/expected decline in revenue, increase in operating risk, working capital deficiency, decrease in asset quality, increase in gearing and liquidity management problems.
Significant increase in credit risk on other financial instruments of the same borrower.
An actual or expected significant adverse change in the regulatory, economic or technological environment of the borrower that results in a significant change in the borrower’s ability to meet the debt obligation.
Grouping Financial Assets Measured on a Collective Basis
As explained above, Group calculates ECL either on a collective or individual basis. Asset classes where Company calculates ECL on an individual basis includes all individually significant assets which belong to Stage 03. All assets which belong to Stage 01 and 02 will be assessed collectively for impairment.
The Group allocates smaller homogeneous exposures based on a combination of internal and external characteristics such as product type, customer type, days past due etc.
Calculation of ECL
The expected cash shortfalls are calculated by multiplying respective loan level PDs, EADs and LGDs. The cash shortfall is discounted to the Effective Interest Rate (EIR). A cash shortfall is the difference between the cash flows that are due to an entity in accordance with the contract and the cash flows that the entity expects to receive.
PDs and LGDs are adjusted to the forward looking information using statistically quantified variance.
The mechanics of the ECL calculation are outlined below and the key elements are as follows;
Probability of Default (PD) : PD is an estimate of the likelihood of default over a given time horizon. Hence majority of our client base being retail; we use internal information to estimate the PDs. The client has two credit statuses which can be identified as default or not default. We used Cohort Method (CM) to compute the PDs.
L B Finance PLC | Annual Report 2020/21330
Exposure at Default (EAD) : EAD is the estimate of the exposure at a future default date, taking into account expected changes in the exposure after the reporting date, including repayments of the principal and interest, whether scheduled by contract or otherwise and expected draw downs on committed facilities.
Loss Given Default (LGD) : LGD is an estimate of the loss arising, where a default occurs at a given time calculated based on historical recovery data. It is usually expressed as percentage of the EAD.
For all products, Company considers the maximum period over which the credit losses are determined is the contractual life of a financial instrument.
The published global financial sector credit rating migration matrix Probability of Default used for fixed income (bank deposits) securities expected loss calculation, Value at Risk Methodology (VAR) is used for gold based loan expected loss calculation. Any financial asset, fully secured through a cash collateral, has not taken into the expected loss calculation.
Forward Looking Information
Company relies on broad range of qualitative/quantitative forward looking information as economic inputs in the Multiple economic factor model developed to forecast the expected Non-Performing Loans (NPL).
The model predicts the forward industry NPL levels and which has been used to adjust the Company PD curve using statistically quantified variance. The economic factor model is developed by the University of Colombo, Science and Technology CELL and consent to use with an annual review. The economic factor model uses the machine learning technique to predict the NPL based on the use of some key economic factors as an input to the model. The key variables of the model is as follows;
Industry NPL
Business Confidence Index
All Share Price Index(ASPI)
Exchange Rates
Fuel Prices
GDP Growth Rate
Interest Rates
Inflation Rates
Unemployment Rates
Per Capita GDP
Assets Recovery Ratio
Reversals of Impairment
If the amount of an impairment loss decreases in a subsequent period, and the decrease can be related objectively to an event occurring after the impairment was recognised, the excess is written back by reducing the financial asset impairment allowance account accordingly. The write-back is recognised in the Income Statement.
Write-off of Loans and Receivables
Financial assets and the related impairment allowance accounts are normally written-off when there is no realistic prospect of recovery. Where financial assets are secured, this is generally after receipt of any proceeds from the realisation of security.
Collateral Valuation
Revaluation of immovable properties obtained as collaterals against any accommodation granted are assessed based on the requirements in the Direction No 04 of 2018 on ‘Valuation of Immovable Properties’ and subsequent amendments thereto issued by the Central Bank of Sri Lanka (CBSL). The assessment of immovable properties is carrying out by independent professional valuers as required by the said direction issued by CBSL.
The assessed fair value of the immovable properties does not consider for measurement of regulatory provisions for bad and doubtful debts as per Direction No 03 of 2006 and subsequent amendments thereto issued by CBSL.
Collateral Repossessed
Repossessed collateral will not be taken into books of accounts unless the Group has taken those collaterals into its business operations. However such additions from the repossessed collaterals to the business operations are not significant.
Non-Accrual Receivables
Cessation of Interest income recognition is triggered out when the receivables are more than four months in arrears, receivables are subject to legal action/ongoing legal action, receivables are subject to untraceable or unattainable collaterals, or receivables are determined to be uncollectible. For receivables in non-accrual status, subsequent financing revenue is recognised only to the extent a payment is received. Payments are generally applied first to outstanding interest and then to the unpaid principal balance.
Notes to the Financial Statements

L B Finance PLC | Annual Report 2020/21 331
Stability Leadership Strength Agility Responsibility Sustainability Success Supplementary Information
4.19.1 Stage-wise Analysis of the Allowance for Impairment Losses - Company
2021 2020
Stage 01 Stage 02 Stage 03 Total Stage 01 Stage 02 Stage 03 Total
Rs. '000 Rs. '000 Rs. '000 Rs. '000 Rs. '000 Rs. '000 Rs. '000 Rs. '000
4.19.1 (a) As at the Beginning of the Year 591,582 526,285 4,139,472 5,257,339 579,701 477,047 2,690,163 3,746,911 Charge/(Reversal) for the Year 675,846 (88,293) 1,166,173 1,753,726 11,896 49,699 1,840,102 1,901,697 Amounts Written-Off - - (479,073) (479,073) (15) (461) (390,793) (391,269)
As at the End of the Year 1,267,428 437,992 4,826,572 6,531,992 591,582 526,285 4,139,472 5,257,339
4.19.1 (b) Individual Impairment - - 4,826,572 4,826,572 - - 4,139,472 4,139,472 Collective Impairment 1,267,428 437,992 - 1,705,420 591,582 526,285 - 1,117,867
Total 1,267,428 437,992 4,826,572 6,531,992 591,582 526,285 4,139,472 5,257,339
4.19.1 (c) Gross Amount of Loans Individually Determined to be Impaired, before Deducting the Individually Assessed Impairment Allowance - - 13,493,569 13,493,569 - - 13,318,518 13,318,518 Gross Amount of Loans Collectively
Assessed for the Impairment 90,236,960 16,939,286 - 107,176,246 82,720,661 28,084,084 - 110,804,745 Gross Receivables 90,236,960 16,939,286 13,493,569 120,669,815 82,720,661 28,084,084 13,318,518 124,123,263
Gross Amount of Loans Individually Determined to be Impaired 11.18% 10.73%
4.19.2 Stage-wise Analysis of the Allowance for Impairment Losses - Group
2021 2020
Stage 01 Stage 02 Stage 03 Total Stage 01 Stage 02 Stage 03 Total
Rs. '000 Rs. '000 Rs. '000 Rs. '000 Rs. '000 Rs. '000 Rs. '000 Rs. '000
4.19.2 (a) As at the Beginning of the Year 597,753 529,127 4,164,191 5,291,071 583,905 477,047 2,690,163 3,751,115 Charge/(Reversal) for the Year 689,804 (73,183) 1,174,350 1,790,971 13,149 52,540 1,864,821 1,930,510 Amounts Written-Off - - (479,073) (479,073) (15) (461) (390,793) (391,269)Exchange Rate Variance on
Foreign Currency Provisions 314 144 1,259 1,717 714 - - 714 As at the End of the Year 1,287,871 456,088 4,860,727 6,604,686 597,753 529,127 4,164,191 5,291,071
4.19.2 (b) Individual Impairment - - 4,860,727 4,860,727 - - 4,164,191 4,164,191 Collective Impairment 1,287,871 456,088 - 1,743,959 597,753 529,127 - 1,126,880
Total 1,287,871 456,088 4,860,727 6,604,686 597,753 529,127 4,164,191 5,291,071
4.19.2 (c) Gross Amount of Loans Individually Determined to be Impaired, before Deducting the Individually Assessed Impairment Allowance - - 13,797,056 13,797,056 - - 13,343,237 13,343,237 Gross Amount of Loans Collectively
Assessed for the Impairment 90,346,958 17,286,888 - 107,633,846 83,279,160 28,088,688 - 111,367,848 Gross Receivables 90,346,958 17,286,888 13,797,056 121,430,902 83,279,160 28,088,688 13,343,237 124,711,085
Gross Amount of Loans Individually Determined to be Impaired 11.36% 10.70%

L B Finance PLC | Annual Report 2020/21332
4.19.3 Product-wise Analysis of the Allowance for Impairment Losses - Company
As at 31 March 2021 2020
Stage 01 Stage 02 Stage 03 Total Stage 01 Stage 02 Stage 03 Total
Rs. '000 Rs. '000 Rs. '000 Rs. '000 Rs. '000 Rs. '000 Rs. '000 Rs. '000
Gold Loans 373,668 48,518 22,557 444,743 141,187 - 10,619 151,806
Vehicle Loans 142,665 49,558 220,557 412,780 58,667 49,200 154,918 262,785
Term Loans 181,931 10,729 192,928 385,588 73,111 14,925 263,234 351,270
Mortgage Loans 121,911 71,391 1,662,992 1,856,294 30,535 52,609 1,276,216 1,359,360
Power Drafts 20,701 10,410 157,264 188,375 5,093 8,480 105,883 119,456
Factoring Receivable - - 82,941 82,941 - - 104,629 104,629
Loans and Receivables 840,876 190,606 2,339,239 3,370,721 308,593 125,214 1,915,499 2,349,306
Leases 426,552 247,385 2,383,100 3,057,037 282,989 401,059 2,109,345 2,793,393
Hire Purchase - 1 104,233 104,234 - 12 114,628 114,640
Lease Rentals Receivable and Stock out on Hire 426,552 247,386 2,487,333 3,161,271 282,989 401,071 2,223,973 2,908,033
Total Allowance for Impairment Losses 1,267,428 437,992 4,826,572 6,531,992 591,582 526,285 4,139,472 5,257,339
4.19.4 Product-wise Analysis of the Allowance for Impairment Losses - Group
As at 31 March 2021 2020
Stage 01 Stage 02 Stage 03 Total Stage 01 Stage 02 Stage 03 Total
Rs. '000 Rs. '000 Rs. '000 Rs. '000 Rs. '000 Rs. '000 Rs. '000 Rs. '000
Gold Loans 373,668 48,518 22,557 444,743 141,187 - 10,619 151,806
Vehicle Loans 142,665 49,558 220,557 412,780 58,667 49,200 154,918 262,785
Term Loans 202,374 28,825 227,083 458,282 79,282 17,767 287,952 385,001
Mortgage Loans 121,911 71,391 1,662,992 1,856,294 30,535 52,609 1,276,216 1,359,360
Power Drafts 20,701 10,410 157,264 188,375 5,093 8,480 105,884 119,457
Factoring Receivable - - 82,941 82,941 - - 104,629 104,629
Loans and Receivables 861,319 208,702 2,373,394 3,443,415 314,764 128,056 1,940,218 2,383,038
Leases 426,552 247,385 2,383,100 3,057,037 282,989 401,059 2,109,345 2,793,393
Hire Purchase - 1 104,233 104,234 - 12 114,628 114,640
Lease Rentals Receivable and Stock out on Hire 426,552 247,386 2,487,333 3,161,271 282,989 401,071 2,223,973 2,908,033
Total Allowance for Impairment Losses 1,287,871 456,088 4,860,727 6,604,686 597,753 529,127 4,164,191 5,291,071
Notes to the Financial Statements
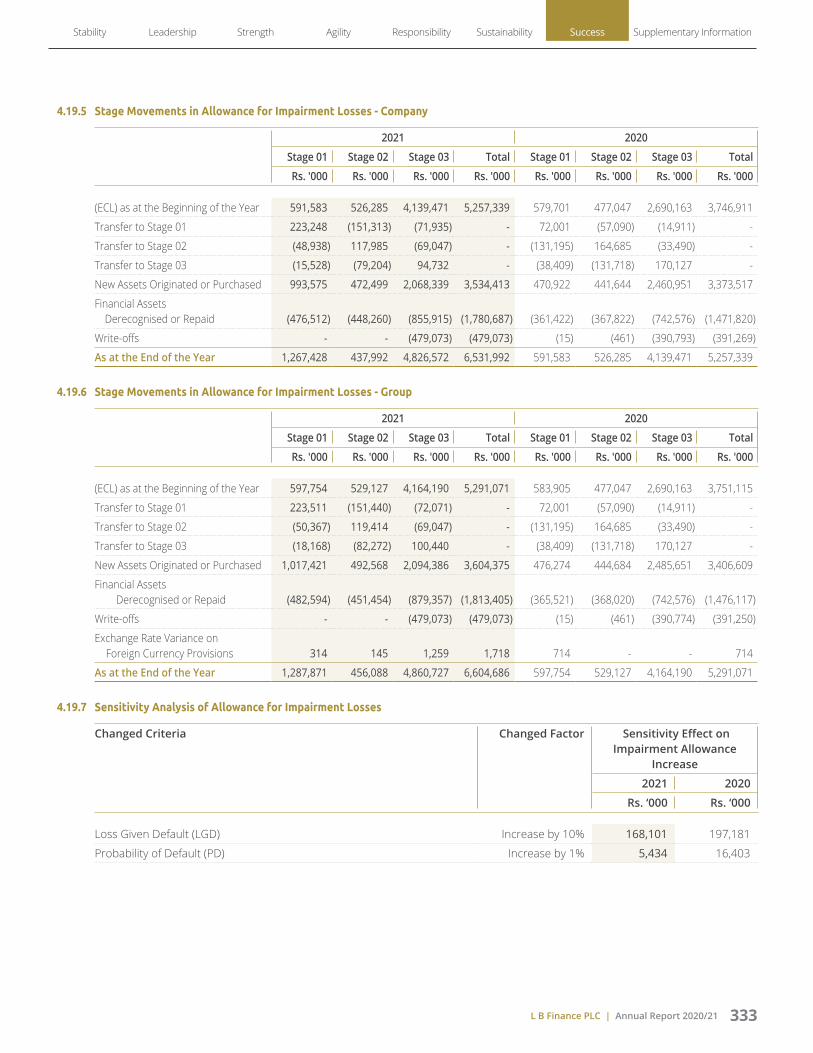
L B Finance PLC | Annual Report 2020/21 333
Stability Leadership Strength Agility Responsibility Sustainability Success Supplementary Information
4.19.5 Stage Movements in Allowance for Impairment Losses - Company
2021 2020
Stage 01 Stage 02 Stage 03 Total Stage 01 Stage 02 Stage 03 Total
Rs. '000 Rs. '000 Rs. '000 Rs. '000 Rs. '000 Rs. '000 Rs. '000 Rs. '000
(ECL) as at the Beginning of the Year 591,583 526,285 4,139,471 5,257,339 579,701 477,047 2,690,163 3,746,911
Transfer to Stage 01 223,248 (151,313) (71,935) - 72,001 (57,090) (14,911) -
Transfer to Stage 02 (48,938) 117,985 (69,047) - (131,195) 164,685 (33,490) -
Transfer to Stage 03 (15,528) (79,204) 94,732 - (38,409) (131,718) 170,127 -
New Assets Originated or Purchased 993,575 472,499 2,068,339 3,534,413 470,922 441,644 2,460,951 3,373,517
Financial Assets Derecognised or Repaid (476,512) (448,260) (855,915) (1,780,687) (361,422) (367,822) (742,576) (1,471,820)
Write-offs - - (479,073) (479,073) (15) (461) (390,793) (391,269)
As at the End of the Year 1,267,428 437,992 4,826,572 6,531,992 591,583 526,285 4,139,471 5,257,339
4.19.6 Stage Movements in Allowance for Impairment Losses - Group
2021 2020
Stage 01 Stage 02 Stage 03 Total Stage 01 Stage 02 Stage 03 Total
Rs. '000 Rs. '000 Rs. '000 Rs. '000 Rs. '000 Rs. '000 Rs. '000 Rs. '000
(ECL) as at the Beginning of the Year 597,754 529,127 4,164,190 5,291,071 583,905 477,047 2,690,163 3,751,115
Transfer to Stage 01 223,511 (151,440) (72,071) - 72,001 (57,090) (14,911) -
Transfer to Stage 02 (50,367) 119,414 (69,047) - (131,195) 164,685 (33,490) -
Transfer to Stage 03 (18,168) (82,272) 100,440 - (38,409) (131,718) 170,127 -
New Assets Originated or Purchased 1,017,421 492,568 2,094,386 3,604,375 476,274 444,684 2,485,651 3,406,609
Financial Assets Derecognised or Repaid (482,594) (451,454) (879,357) (1,813,405) (365,521) (368,020) (742,576) (1,476,117)
Write-offs - - (479,073) (479,073) (15) (461) (390,774) (391,250)
Exchange Rate Variance on Foreign Currency Provisions 314 145 1,259 1,718 714 - - 714
As at the End of the Year 1,287,871 456,088 4,860,727 6,604,686 597,754 529,127 4,164,190 5,291,071
4.19.7 Sensitivity Analysis of Allowance for Impairment Losses
Changed Criteria Changed Factor Sensitivity Effect on Impairment Allowance
Increase
2021 2020
Rs. ‘000 Rs. ‘000
Loss Given Default (LGD) Increase by 10% 168,101 197,181
Probability of Default (PD) Increase by 1% 5,434 16,403

L B Finance PLC | Annual Report 2020/21334
4.19.8 Measurement Uncertainty and Sensitivity Analysis of ECL Estimates
The recognition and measurement of ECL involves the use of significant judgement and estimation including estimation of Probabilities of Default (PD), Loss Given Default (LGD), a range of unbiased future economic scenarios, estimation of expected lives, estimation of Exposures at Default (EAD) and assessing significant increases in credit risk. This becomes more complex, particularly in times of economic volatility and uncertainty. The Group form multiple economic scenarios based on economic forecasts to estimate future credit losses and to determine an unbiased ECL estimate. Management judgements are used to address the data and model limitations and expert credit judgements.
Methodology
The Group have been used three scenarios at multiple confidence levels to capture the exceptional nature of the current economic environment and to simulate management’s view of the range of potential outcomes. The range of forecasts are generated through the model due to the uncertainty caused by COVID-19 and resultant restrictions on mobility and economic activities. These three scenarios are drawn from the model developed by the Company with Colombo Science and Technology CELL of University of Colombo. The model uses multiple economic variables like GDP, unemployment, inflation, and trained to identify the historical correlations. The impact arising from the upside, downside and base scenarios have been simulated through a machine learning technique. Economic forecasts are subject to a high degree of uncertainty in the current environment. Limitations of forecasts and economic models require a greater reliance on management judgement in addressing both the error inherent in economic forecasts and in assessing associated ECL outcomes.
ECL Scenarios and Sensitivity Analysis of Allowance for Impairment Losses
As expected, the scenarios create differing impacts on ECL and the impacts are deemed reasonable. In this simulation, it is assumed that existing modelled relationships between key economic variables and loss drivers hold, but in practice other factors would also have an impact, for example, potential customer behaviour changes and policy changes by lenders that might impact on the wider availability of credit.
The simulated ECL impacts of the multiple scenarios are presented in the table below;
Economic Factor Adjustment - Percentage Variance
Upto 01 Year
Base Upside Downside
Forecast -5.32%
At 99% Confidence -32.50% 21.50%
At 95% Confidence -26.28% 15.32%
At 90% Confidence -22.83% 12.02%
At 80% Confidence -18.83% 8.26%
Beyond 01 Year
Base Upside Downside
Forecast -19.24%
At 99% Confidence -57.25% 19.47%
At 95% Confidence -48.77% 9.85%
At 90% Confidence -44.01% 5.26%
At 80% Confidence -38.37% -0.08%
Notes to the Financial Statements

L B Finance PLC | Annual Report 2020/21 335
Stability Leadership Strength Agility Responsibility Sustainability Success Supplementary Information
Economic Factor Adjustment - Value Variance
Upto 01 Year
Base Upside Downside
Rs. ‘000 Rs. ‘000 Rs. ‘000
Forecast (28,931)
At 99% Confidence (176,587) 116,798
At 95% Confidence (142,788) 83,241
At 90% Confidence (124,025) 65,304
At 80% Confidence (102,292) 44,907
Beyond 01 Year
Base Upside Downside
Rs. ‘000 Rs. ‘000 Rs. ‘000
Forecast (104,556)
At 99% Confidence (311,079) 105,768
At 95% Confidence (265,010) 53,502
At 90% Confidence (239,135) 28,588
At 80% Confidence (208,475) (456)
Scenario Analysis
Base Scenario
Economic Factor Adjustment (EFA) model of the Company features a moderate improvement in non-performing advances in 2021 according to the Base Scenario as economic activities gradually return to the levels experienced prior to the outbreak of COVID-19. This results in the positive impact of 5.32% and 19.24% in the year 2021 and 2022, respectively. Despite the sharp contraction in activity, the measures from Government and the Central Bank of Sri Lanka including moratoria, lowering the policy interest rates, measures for funding markets are expected to support the economy and the financial system. Such support intends to ensure economic activities will improve. In addition, the deployment of mass vaccination programmes mark a significant step forward in combating the virus and will ease the burden on healthcare systems. We expect vaccination programmes across our key markets to contribute positively to recovery prospects.
Upside Scenario
Compared with the Base Scenario, the Upside Scenario features a faster recovery in economic activity during the first two years. These include the successful containment and prompt deployment of a vaccine; speedy recover of the industries that were affected by the pandemic. The Upside Scenario expects a significant decrease in the EFA 32.50% and 57.25% respectively in the first two years at confidence level of 99% which declines when the confidence level move downwards.
Downside Scenario
In the Downside Scenario, economic recovery is considerably weaker compared with the Base Scenario. GDP growth remains weak, unemployment rates stay elevated and asset and commodity prices fall before gradually recovering towards their long-run trends. This tend to impact the EFA negatively 21.50% in year 1 and 19.47% in year 2 at 99% confidence level. The slow recovery expects the EFA to be improve gradually over the next two years.

L B Finance PLC | Annual Report 2020/21336
Management Judgemental Adjustments
Management judgemental adjustments are short-term increases or decreases to the ECL at either a customer or portfolio level to account for late-breaking events, model and data limitations and deficiencies, and expert credit judgement applied following management review and challenge. Given the degree of uncertainty surrounding the economic impact of COVID-19 and the lack of reliable data to model the impact on portfolio, as well as the operational and timing challenges in incorporating the latest available macroeconomic inputs into the ECL models, it was necessary to place greater emphasis on judgemental adjustments to modelled outcomes than in previous years.
The Company decided to use the down side scenario at 95% confidence level when assessing the economic factor adjustments with the objective of capturing the impact of COVID-19 and uncertainties in the future outlook on the ECL computation as at the reporting date.
The governmental support programmes and customer payment reliefs have dislocated the correlation between economic conditions and defaults on which models are based. The Group recognised that the Management judgemental adjustments are required to help ensure that an appropriate amount of ECL impairment is recognised. Although the granting of the customer reliefs as directed by governmental and CBSL support programmes do not necessarily indicate that the credit risk of those facilities have significantly increased nor credit impaired. However, the management judged that the PDs applicable for credit impaired facilities to be applied in calculating the ECL for these facilities that are in stage 01 and stage 02.
Measures taken to contain the spread of the COVID-19 has affected economic activities, which in turn, has resulted in lost revenue and disrupted supply chain. This adversely affected business dealing in many industries, especially those that involve close in-person contact industries. Industries that have been severely affected do not automatically trigger in additional consideration of ECL through the model. The Group judged that the portfolios concentrated in tourism and transport sectors require further judgement. Thus, credit impaired PDs were applied for the facilities where the credit risk has not significantly increased or credit impaired under the tourism and transport sectors.
4.20 FINANCIAL ASSETS MEASURED AT FAIR VALUE THROUGH OTHER COMPREHENSIVE INCOME
Accounting PolicyUpon initial recognition, the Group occasionally elects to classify irrevocably some of its equity investments as equity instruments at FVOCI when they meet the definition of Equity under Sri Lanka Accounting Standard - LKAS 32 (Financial Instruments: Presentation) and are not held for trading. Such classification is determined on an instrument-by instrument basis.
Gains and losses on these equity instruments are never recycled to Income Statement. Dividends are recognised in the Income Statement as other operating income when the right of the payment has been established, except when the Group benefits from such proceeds as a recovery of part of the cost of the instrument, in which case, such gains are recorded in Other Comprehensive Income. Equity instruments at FVOCI are not subject to an impairment assessment.
As at 31 March Company & Group
2021 2020
Rs. ‘000 Rs. ‘000
Equity Securities - Quoted (Note 4.20.1) 77,484 58,836
Equity Securities - Unquoted (Note 4.20.2) 305 305
77,789 59,141
Notes to the Financial Statements

L B Finance PLC | Annual Report 2020/21 337
Stability Leadership Strength Agility Responsibility Sustainability Success Supplementary Information
4.20.1 Equity Securities - Quoted
As at 31 March 2021 2020
Number ofShares
Cost Market Value
Number ofShares
Cost Market Value
Rs. '000 Rs. '000 Rs. '000 Rs. '000
Capital Goods
Central Industries PLC 8,569 150 883 8,184 150 268
Royal Ceramics Lanka PLC* 31,320 843 8,049 31,320 843 1,751
Samson International PLC 5,899 930 792 5,899 930 425
1,923 9,724 1,923 2,444
Consumer Services
The Fortress Resorts PLC* 4,051,100 81,990 45,372 4,051,100 81,990 31,599
Aitken Spence Hotel Holdings PLC 308 6 9 308 6 5
Hotel Sigiriya PLC 700 30 40 700 30 25
82,026 45,421 82,026 31,629
Retailing
Hunters & Company PLC 10 3 6 10 3 4
3 6 3 4
Banks
Commercial Bank of Ceylon PLC 349 15 23 285 15 17
Seylan Bank PLC 2,774 155 136 2,718 155 91
Sampath Bank PLC 5 - - 5 - 1
170 159 170 109
Food, Beverage and Tobacco
Keells Food Products PLC 500 21 81 500 21 54
Lanka Milk Foods PLC 5,500 250 826 5,500 250 406
Convenience Foods (Lanka) PLC 22 1 27 22 1 7
Ceylon Grain Elevators PLC 44 5 5 44 5 2
277 939 277 469
Consumer Durables and Apparel
Dankotuwa Porcelain PLC 32,512 1,012 335 32,512 1,012 146
1,012 335 1,012 146
Diversified Financials
Softlogic Finance PLC 2,090,000 79,656 20,900 2,090,000 79,656 24,035
79,656 20,900 79,656 24,035
Total 165,067 77,484 165,067 58,836
Global Industry Classification Standard (GICS)
*Investments made in related parties

L B Finance PLC | Annual Report 2020/21338
4.20.2 Equity Securities - Unquoted
As at 31 March 2021 2020
Number ofShares
Cost Market Value
Number ofShares
Cost Market Value
Rs. '000 Rs. '000 Rs. '000 Rs. '000
Credit Information Bureau of Sri Lanka 1,047 105 105 1,047 105 105
Finance House Association of Sri Lanka 20,000 200 200 20,000 200 200
Total 305 305 305 305
Cost is assumed to be the best approximation for the fair value of unquoted equity shares due to the absence of most recent exit prices.
4.20.2 (a) Reconciliation of Fair Value Measurement for Unquoted Equity Securities under Level 3 Hierarchy
Company & Group
2021 2020
Rs. ‘000 Rs. ‘000
As at the Beginning of the Year 305 305
Remeasurement Recognised in Other Comprehensive Income - -
Purchases - -
Sales - -
Transfers into or out of Level 3 Hierarchy - -
Remeasurement Recognised in Income Statement - -
As at the End of the Year 305 305
4.21 OTHER FINANCIAL ASSETS
Accounting PolicyThese include treasury bills repurchase agreements, where we are the transferee and investments in fixed deposits with banks and other financial institutions. Treasury bills repurchase agreements allow us to offset our entire gross exposure in the event of default or breach of contract. Other financial assets are initially recognised at fair value net of transactions cost. Subsequently, they are stated at amortised cost; any difference between the proceeds (net of transaction cost) and the receivable amount (including interest income) is recognised in the Income Statement over the period of the assets using effective interest method.
As at 31 March Company Group
2021 2020 2021 2020
Rs. ‘000 Rs. ‘000 Rs. ‘000 Rs. ‘000
Treasury Bills Repurchase Agreements (Note 4.21.1) 3,537,745 5,462,735 3,537,745 5,462,735
Investment in Fixed Deposits (Note 4.21.2) 6,503,654 3,426,929 6,503,654 3,426,929
Insurance Premium Receivables 331,731 206,038 331,731 206,038
Due from Subsidiary 21,848 16,278 - -
Sundry Debtors 58,925 7,701 60,019 10,059
10,453,903 9,119,681 10,433,149 9,105,761
Fair Value 10,453,903 9,119,681 10,433,149 9,105,761
Notes to the Financial Statements
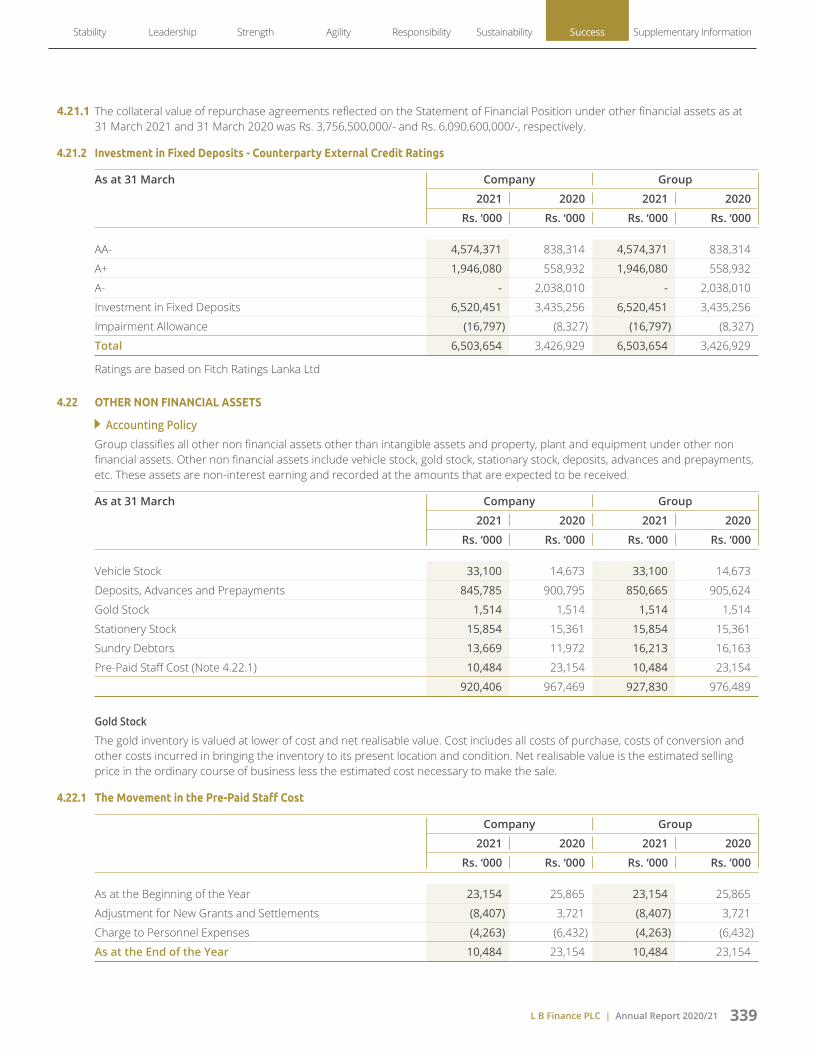
L B Finance PLC | Annual Report 2020/21 339
Stability Leadership Strength Agility Responsibility Sustainability Success Supplementary Information
4.21.1 The collateral value of repurchase agreements reflected on the Statement of Financial Position under other financial assets as at 31 March 2021 and 31 March 2020 was Rs. 3,756,500,000/- and Rs. 6,090,600,000/-, respectively.
4.21.2 Investment in Fixed Deposits - Counterparty External Credit Ratings
As at 31 March Company Group
2021 2020 2021 2020
Rs. ‘000 Rs. ‘000 Rs. ‘000 Rs. ‘000
AA- 4,574,371 838,314 4,574,371 838,314
A+ 1,946,080 558,932 1,946,080 558,932
A- - 2,038,010 - 2,038,010
Investment in Fixed Deposits 6,520,451 3,435,256 6,520,451 3,435,256
Impairment Allowance (16,797) (8,327) (16,797) (8,327)
Total 6,503,654 3,426,929 6,503,654 3,426,929
Ratings are based on Fitch Ratings Lanka Ltd
4.22 OTHER NON FINANCIAL ASSETS
Accounting PolicyGroup classifies all other non financial assets other than intangible assets and property, plant and equipment under other non financial assets. Other non financial assets include vehicle stock, gold stock, stationary stock, deposits, advances and prepayments, etc. These assets are non-interest earning and recorded at the amounts that are expected to be received.
As at 31 March Company Group
2021 2020 2021 2020
Rs. ‘000 Rs. ‘000 Rs. ‘000 Rs. ‘000
Vehicle Stock 33,100 14,673 33,100 14,673
Deposits, Advances and Prepayments 845,785 900,795 850,665 905,624
Gold Stock 1,514 1,514 1,514 1,514
Stationery Stock 15,854 15,361 15,854 15,361
Sundry Debtors 13,669 11,972 16,213 16,163
Pre-Paid Staff Cost (Note 4.22.1) 10,484 23,154 10,484 23,154
920,406 967,469 927,830 976,489
Gold Stock
The gold inventory is valued at lower of cost and net realisable value. Cost includes all costs of purchase, costs of conversion and other costs incurred in bringing the inventory to its present location and condition. Net realisable value is the estimated selling price in the ordinary course of business less the estimated cost necessary to make the sale.
4.22.1 The Movement in the Pre-Paid Staff Cost
Company Group
2021 2020 2021 2020
Rs. ‘000 Rs. ‘000 Rs. ‘000 Rs. ‘000
As at the Beginning of the Year 23,154 25,865 23,154 25,865
Adjustment for New Grants and Settlements (8,407) 3,721 (8,407) 3,721
Charge to Personnel Expenses (4,263) (6,432) (4,263) (6,432)
As at the End of the Year 10,484 23,154 10,484 23,154

L B Finance PLC | Annual Report 2020/21340
4.23 INVESTMENT IN SUBSIDIARY
Accounting PolicySubsidiary is an investee controlled by the Group. The Group ‘controls’ an investee if it is exposed to, or has rights to, variable returns from its involvement with the investee and has the ability to affect those returns through its power over the investee. The Group reassesses whether it has control if there are changes to one or more of the elements of control. This includes circumstances in which protective rights held (e.g. those resulting from a lending relationship) become substantive and lead to the Group having power over an investee.
The cost of an acquisition is measured at fair value of the consideration, including contingent consideration. The acquired identifiable assets, liabilities and contingent liabilities are measured at their fair values at the date of acquisition. Subsequent to the initial measurement the company continues to recognise the investments in Subsidiaries at cost.
The Financial Statements of Subsidiaries are included in the Consolidated Financial Statements from the date on which control commences until the date when control ceases.
The Financial Statements of the Subsidiary in the Group had a common financial year which ends on 31 March. However the financial year end of its Subsidiary L B Microfinance Myanmar Company Limited has changed from 31 March to 30 September. The reason for using different reporting date by L B Microfinance Myanmar Company Limited was due to the requirements imposed by Financial Regulatory Department of Myanmar. The Financial Statements of the Company’s Subsidiary are prepared using consistent accounting policies.
All intra-group balances, transactions, unrealised gains and losses resulting from intra-group transactions, income and expenses are eliminated in full.
There are no significant restrictions on the ability of the Subsidiary to transfer funds to the Parent (the Company) in the form of cash dividend or repayment of loans and advances.
As at 31 March Holding Company
2021 2020
Cost Market Value Cost Market Value
% Rs. '000 Rs. '000 Rs. '000 Rs. '000
L B Microfinance Myanmar Company Limited 100 521,162 521,162 521,162 521,162
The L B Microfinance Myanmar Company Limited was incorporated as a 99% (100% - 31 March 2021) owned subsidiary in Myanmar. The Company obtained a license from the Myanmar Microfinance Supervisory Enterprise to operate as a microfinance organisation.
Cost is assumed to be the best approximation for the market value of the investment due to the absence of most recent exit prices.
4.24 PROPERTY, PLANT AND EQUIPMENT AND RIGHT-OF-USE ASSETS
Property, plant and equipment are tangible items that are held for use in the production or supply of goods or services, for rental to others or for administrative purposes and are expected to be used for more than one year. The Group applies the requirements of the Sri Lanka Accounting Standard - LKAS 16 (Property, Plant and Equipment) in accounting for these assets.
Accounting Policy
Basis of RecognitionProperty, plant and equipment are recognised if it is probable that future economic benefits associated with the asset will flow to the Group and the cost of the asset can be reliably measured.
Measurement An item of property, plant and equipment that qualifies for recognition as an asset is initially measured at its cost. Cost includes expenditure that is directly attributable to the acquisition of the asset and cost incurred subsequently to add, replace part of, or service it. The cost of self constructed assets includes the cost of materials and direct labour, any other costs directly attributable to bringing the asset to a working condition for its intended use and the costs of dismantling and removing the items and restoring the site on which they are located. Purchased software that is integral to the functionality of the related equipment is capitalised as part of computer equipment.
Notes to the Financial Statements

L B Finance PLC | Annual Report 2020/21 341
Stability Leadership Strength Agility Responsibility Sustainability Success Supplementary Information
Cost Model The Group applies cost model to property, plant and equipment and records at cost of purchase or construction together with any incidental expenses thereon less accumulated depreciation and any accumulated impairment losses. Such cost includes the cost of replacing part of the equipment when that cost is incurred, if the recognition criteria are met.
Subsequent CostThe subsequent cost of replacing a component of an item of property, plant and equipment is recognised in the carrying amount of the item if it is probable that the future economic benefits embodied within that part will flow to the Group and its cost can be reliably measured. The costs of day-to-day servicing of property, plant and equipment are charged to the Income Statement as incurred. Costs incurred in using or redeploying an item is not included under carrying amount of an item.
DerecognitionThe carrying amount of an item of property, plant and equipment is derecognised on disposal or when no future economic benefits are expected from its use or disposal. The gain or loss arising from derecognition of an item of property, plant and equipment is included in the Income Statement when the item is derecognised.
When replacement costs are recognised in the carrying amount of an item of property, plant and equipment, the remaining carrying amount of the replaced part is derecognised. Major inspection costs are capitalised. At each such capitalisation, the remaining carrying amount of the previous cost of inspections is derecognised.
Right-of-Use AssetsRight-of-use assets are presented together with property, plant and equipment in the Statement of Financial Position. Right-of-use assets of the Group include land and buildings under long term rental agreements for its use as offices and branches.
The Group recognises right-of-use assets at the date of commencement of the lease, which is the present value of lease payments to be made over the lease term. Right-of-use assets are measured at cost less any accumulated amortisation and impairment losses and adjusted for any re-measurement of lease liabilities. The cost of the right-of-use assets includes the amount of lease liabilities recognised, initial direct cost incurred, and lease payments made at or before the commencement date less any lease incentives received. Right-of-use assets are amortised on the straight line basis over the lease term.
DepreciationThe Group provides depreciation from the date the assets are available for use up to the date of disposal, at the following rates on a straight line basis over the periods appropriate to the estimated useful lives, based on the pattern in which the asset’s future economic benefits are expected to be consumed by the Group. Depreciation of an asset ceases at the earlier of the date that the asset is classified as held for sale or the date that the asset is derecognised. Depreciation does not cease when the assets become idle or is retired from active use unless the asset is fully depreciated. Freehold land is not depreciated.
The estimated useful lives of the property, plant and equipment of the Company as at 31 March 2021 are as follows;
Asset Category Period (Years)
Depreciation % per Annum
Freehold Buildings and Edifices 50 2%Furniture and Fittings 5-6.67 15-20%Equipment 5 20%Motor Vehicles 5-8 12.50-20%Computer Hardware and Equipment 5 20%Improvement of Leasehold Asset 6.67 15%Fixtures and Fittings 5 20%
The above rates are compatible with the rates used by all Group entities.
Accounting Estimates
Useful Lifetime of the Property, Plant and EquipmentThe Group reviews the residual values, useful lives and methods of depreciation of property, plant and equipment at each reporting date. Judgment of the management is exercised in the estimation of these values, rates, methods and hence they are subject to uncertainty.

L B Finance PLC | Annual Report 2020/21342
4.24
.1
Com
pany
- 20
21
Fr
eeho
ld
La
nd
Fr
eeho
ld
Bu
ildin
gs
an
d Ed
ifice
s
Fu
rnitu
re
an
d Fi
ttin
gsEq
uipm
ent
M
otor
Vehi
cles
Co
mpu
ter
Ha
rdw
are a
nd
Eq
uipm
ent
Impr
ovem
ent
of L
ease
hold
Asse
t
Fi
xtur
es
an
d Fi
ttin
gs R
ight
-of-U
se
As
sets
Tota
l
Rs. '
000
Rs. '
000
Rs. '
000
Rs. '
000
Rs. '
000
Rs. '
000
Rs. '
000
Rs. '
000
Rs. ‘0
00Rs
. '00
0
Cost
Bala
nce
as a
t 1 A
pril 2
020
4,7
27,1
23
921
,174
3
69,5
43
863
,447
4
19,9
81
942
,505
6
95,2
10
693
,955
1
,577
,675
1
1,21
0,61
3 Ad
ditio
ns 1
28,0
11
53,
784
20,
980
49,
897
16,
000
45,
746
65,
004
102
,539
3
54,2
56
836
,217
Tr
ansf
ers
-
-
-
-
-
-
-
-
-
-
Disp
osal
s/W
rite-
offs
-
-
(13,
281)
(26,
507)
(50,
503)
(12,
950)
(67,
009)
(22,
826)
(81,
819)
(274
,895
)Ba
lanc
e as
at 3
1 M
arch
202
1 4
,855
,134
9
74,9
58
377
,242
8
86,8
37
385
,478
9
75,3
01
693
,205
7
73,6
68
1,8
50,1
12
11,
771,
935
Accu
mul
ated
Dep
reci
atio
n an
d Im
pairm
ent L
osse
sBa
lanc
e as
at 1
Apr
il 202
0 -
1
18,3
39
235
,150
5
86,0
98
256
,718
6
42,6
18
490
,408
4
19,3
26
240
,708
2
,989
,365
Ch
arge
for t
he Y
ear
-
19,
356
35,
256
103
,795
3
7,96
7 1
07,4
90
60,
120
106
,512
2
58,2
97
728
,793
Im
pairm
ent L
oss
-
-
-
-
-
-
-
-
-
-
Tran
sfer
s -
-
-
-
-
-
-
-
-
-
Di
spos
als/
Writ
e-off
s -
-
(12,
528)
(26,
043)
(30,
704)
(12,
169)
(65,
175)
(20,
708)
(20,
155)
(187
,482
)Ba
lanc
e as
at 3
1 M
arch
202
1 -
1
37,6
95
257
,878
6
63,8
50
263
,981
7
37,9
39
485
,353
5
05,1
30
478
,850
3
,530
,676
Net
Boo
k Va
lue
as a
t 31
Mar
ch 2
021
4,8
55,1
34
837
,263
1
19,3
64
222
,987
1
21,4
97
237
,362
2
07,8
52
268
,538
1
,371
,262
8
,241
,259
4.24
.2
Com
pany
- 20
20
Fr
eeho
ld
La
nd
Fr
eeho
ld
Bu
ildin
gs
an
d Ed
ifice
s
Fu
rnitu
re
an
d Fi
ttin
gsEq
uipm
ent
M
otor
Vehi
cles
Co
mpu
ter
Ha
rdw
are a
nd
Eq
uipm
ent
Impr
ovem
ent
of L
ease
hold
Asse
t
Fi
xtur
es
an
d Fi
ttin
gs R
ight
-of-U
se
As
sets
Tota
l
Rs. '
000
Rs. '
000
Rs. '
000
Rs. '
000
Rs. '
000
Rs. '
000
Rs. '
000
Rs. '
000
Rs. ‘0
00Rs
. '00
0
Cost
Bala
nce
as a
t 1 A
pril 2
019
4,4
98,2
64
919
,897
3
10,4
41
777
,662
4
35,2
55
859
,217
6
06,3
01
521
,794
-
8
,928
,831
Im
pact
from
the
Impl
emen
tatio
n of
SL
FRS
16 -
-
-
-
-
-
-
-
1
,436
,599
1
,436
,599
Ad
ditio
ns 2
28,8
59
1,2
77
63,
129
101
,446
1
20
97,
814
100
,277
1
79,8
60
141
,076
9
13,8
58
Tran
sfer
s -
-
-
-
-
-
-
-
-
-
Di
spos
als/
Writ
e-off
s -
-
(4
,027
) (1
5,66
1) (1
5,39
4) (1
4,52
6) (1
1,36
8) (7
,699
) -
(6
8,67
5)Ba
lanc
e as
at 3
1 M
arch
202
0 4
,727
,123
9
21,1
74
369
,543
8
63,4
47
419
,981
9
42,5
05
695
,210
6
93,9
55
1,5
77,6
75
11,
210,
613
Accu
mul
ated
Dep
reci
atio
n an
d Im
pairm
ent L
osse
sBa
lanc
e as
at 1
Apr
il 201
9 -
9
9,92
9 2
05,1
43
499
,736
2
23,1
71
555
,324
4
42,2
13
325
,936
-
2
,351
,452
Ch
arge
for t
he Y
ear
-
18,
410
33,
669
101
,654
4
2,46
9 1
01,1
56
58,
822
100
,620
2
40,7
08
697
,508
Im
pairm
ent L
oss
-
-
-
-
-
-
-
-
-
-
Tran
sfer
s -
-
-
-
-
-
-
-
-
-
Di
spos
als/
Writ
e-off
s -
-
(3
,662
) (1
5,29
2) (8
,922
) (1
3,86
2) (1
0,62
7) (7
,230
) -
(5
9,59
5)Ba
lanc
e as
at 3
1 M
arch
202
0 -
1
18,3
39
235
,150
5
86,0
98
256
,718
6
42,6
18
490
,408
4
19,3
26
240
,708
2
,989
,365
Net
Boo
k Va
lue
as a
t 31
Mar
ch 2
020
4,7
27,1
23
802
,835
1
34,3
93
277
,349
1
63,2
63
299
,887
2
04,8
02
274
,629
1
,336
,967
8
,221
,248
Notes to the Financial Statements

L B Finance PLC | Annual Report 2020/21 343
Stability Leadership Strength Agility Responsibility Sustainability Success Supplementary Information
4.24
.3
Gro
up -
2021
Fr
eeho
ld
La
nd
Fr
eeho
ld
Bu
ildin
gs
an
d Ed
ifice
s
Fu
rnitu
re
an
d Fi
ttin
gsEq
uipm
ent
M
otor
Vehi
cles
Co
mpu
ter
Ha
rdw
are a
nd
Eq
uipm
ent
Impr
ovem
ent
of L
ease
hold
Asse
t
Fi
xtur
es
an
d Fi
ttin
gs R
ight
-of-U
se
As
sets
Tota
l
Rs. '
000
Rs. '
000
Rs. '
000
Rs. '
000
Rs. '
000
Rs. '
000
Rs. '
000
Rs. '
000
Rs. ‘0
00Rs
. '00
0
Cost
Bala
nce
as a
t 1 A
pril 2
020
4,7
27,1
23
921
,174
3
71,7
10
865
,592
4
20,0
83
947
,102
6
95,2
10
693
,955
1
,577
,675
1
1,21
9,62
4 Ad
ditio
ns 1
28,0
11
53,
784
22,
190
51,
004
16,
289
47,
281
65,
004
102
,539
3
54,2
56
840
,358
Tr
ansf
ers
-
-
-
-
-
-
-
-
-
-
Exch
ange
Rat
e Va
rianc
e -
-
1
11
110
5
2
36
-
-
-
462
Di
spos
als/
Writ
e-off
s -
-
(1
3,28
1) (2
6,50
7) (5
0,50
3) (1
2,95
0) (6
7,00
9) (2
2,82
6) (8
1,81
9) (2
74,8
95)
Bala
nce
as a
t 31
Mar
ch 2
021
4,8
55,1
34
974
,958
3
80,7
30
890
,199
3
85,8
74
981
,669
6
93,2
05
773
,668
1
,850
,112
1
1,78
5,54
9 Ac
cum
ulat
ed D
epre
ciat
ion
and
Impa
irmen
t Los
ses
Bala
nce
as a
t 1 A
pril 2
020
-
118
,339
2
35,6
05
586
,666
2
56,7
48
643
,602
4
90,4
08
419
,326
2
40,7
08
2,9
91,4
02
Char
ge fo
r the
Yea
r -
1
9,35
6 3
5,69
1 1
04,3
63
38,
006
108
,568
6
0,12
0 1
06,5
12
258
,297
7
30,9
13
Impa
irmen
t Los
s -
-
-
-
-
-
-
-
-
-
Tr
ansf
ers
-
-
-
-
-
-
-
-
-
-
Exch
ange
Rat
e Va
rianc
e -
-
3
8 4
5 4
8
3 -
-
-
1
70
Disp
osal
s/W
rite-
offs
-
-
(12,
528)
(26,
043)
(30,
704)
(12,
169)
(65,
175)
(20,
708)
(20,
155)
(187
,482
)Ba
lanc
e as
at 3
1 M
arch
202
1 -
1
37,6
95
258
,806
6
65,0
31
264
,054
7
40,0
84
485
,353
5
05,1
30
478
,850
3
,535
,003
Net
Boo
k Va
lue
as a
t 31
Mar
ch 2
021
4,8
55,1
34
837
,263
1
21,9
24
225
,168
1
21,8
20
241
,585
2
07,8
52
268
,538
1
,371
,262
8
,250
,546
4.24
.4
Gro
up -
2020
Fr
eeho
ld
La
nd
Fr
eeho
ld
Bu
ildin
gs
an
d Ed
ifice
s
Fu
rnitu
re
an
d Fi
ttin
gsEq
uipm
ent
M
otor
Vehi
cles
Co
mpu
ter
Ha
rdw
are a
nd
Eq
uipm
ent
Impr
ovem
ent
of L
ease
hold
Asse
t
Fi
xtur
es
an
d Fi
ttin
gs R
ight
-of-U
se
As
sets
Tota
l
Rs. '
000
Rs. '
000
Rs. '
000
Rs. '
000
Rs. '
000
Rs. '
000
Rs. '
000
Rs. '
000
Rs. ‘0
00Rs
. '00
0
Cost
Bala
nce
as a
t 1 A
pril 2
019
4,4
98,2
64
919
,897
3
11,6
03
778
,652
4
35,3
42
860
,971
6
06,3
01
521
,794
-
8,9
32,8
24
Impa
ct fr
om th
e Im
plem
enta
tion
of
SLFR
S 16
-
-
-
-
-
-
-
-
1,4
36,5
99
1,4
36,5
99
Addi
tions
228
,859
1
,277
6
3,93
5 1
02,4
33
120
1
00,3
59
100
,277
1
79,8
60
141
,076
9
18,1
96
Tran
sfer
s -
-
-
-
-
-
-
-
-
-
Ex
chan
ge R
ate
Varia
nce
-
-
199
1
68
15
298
-
-
-
6
80
Disp
osal
s/W
rite-
offs
-
-
(4,0
27)
(15,
661)
(15,
394)
(14,
526)
(11,
368)
(7,6
99)
-
(68,
675)
Bala
nce
as a
t 31
Mar
ch 2
020
4,7
27,1
23
921
,174
3
71,7
10
865
,592
4
20,0
83
947
,102
6
95,2
10
693
,955
1
,577
,675
1
1,21
9,62
4 Ac
cum
ulat
ed D
epre
ciat
ion
and
Impa
irmen
t Los
ses
Bala
nce
as a
t 1 A
pril 2
019
-
99,
929
205
,286
4
99,9
17
223
,186
5
55,6
32
442
,213
3
25,9
36
-
2,3
52,0
99
Char
ge fo
r the
Yea
r -
1
8,41
0 3
3,92
3 1
01,9
69
42,
480
101
,707
5
8,82
2 1
00,6
20
240
,708
6
98,6
39
Impa
irmen
t Los
s -
-
-
-
-
-
-
-
-
-
Tr
ansf
ers
-
-
-
-
-
-
-
-
-
-
Exch
ange
Rat
e Va
rianc
e -
-
5
8 7
2 4
1
25
-
-
-
259
Di
spos
als/
Writ
e-off
s -
-
(3
,662
) (1
5,29
2) (8
,922
) (1
3,86
2) (1
0,62
7) (7
,230
) -
(5
9,59
5)Ba
lanc
e as
at 3
1 M
arch
202
0 -
1
18,3
39
235
,605
5
86,6
66
256
,748
6
43,6
02
490
,408
4
19,3
26
240
,708
2
,991
,402
Net
Boo
k Va
lue
as a
t 31
Mar
ch 2
020
4,7
27,1
23
802
,835
1
36,1
05
278
,926
1
63,3
35
303
,500
2
04,8
02
274
,629
1
,336
,967
8
,228
,222

L B Finance PLC | Annual Report 2020/21344
4.24.5 Property, Plant and Equipment and ROU Assets Acquired During the Financial Year - Company & Group
During the financial year, the Company acquired property, plant and equipment to the aggregate value of Rs. 836,217,067/- (2020 - Rs. 913,858,542/-). Cash payments amounting to Rs. 535,961,733/- (2020 - Rs. 934,230,105/-) was paid during the year for purchases of property, plant and equipment.
During the financial year, the Group acquired property, plant and equipment to the aggregate value of Rs. 840,358,237/- (2020 - Rs. 918,195,965/-). Cash payments amounting to Rs. 540,394,355/- (2020 - Rs. 938,987,401/-) was paid during the year for purchases of property, plant and equipment.
4.24.6 Property, Plant and Equipment subjected to Operating Lease - Company & Group
Included in property, plant and equipment are assets subject to operating lease where the Company is a lessor. At 31 March 2021, the net carrying value amount of those assets was Rs. 26,331,910/- (2020 - Rs. 53,852,056/-), on which the accumulated depreciation as at 31 March 2021 was Rs. 65,618,133/- (2020 - Rs. 50,597,988/-).
Summary of future operating lease receivable was as follows;
As at 31 March 2021 Within One Year
1 - 5 Years
Over 5 Years
Total
Rs. ‘000 Rs. ‘000 Rs. ‘000 Rs. ‘000
Future Operating Lease Receivable 26,540 11,294 - 37,834
As at 31 March 2020 Within One Year
1 - 5 Years
Over 5 Years
Total
Rs. ‘000 Rs. ‘000 Rs. ‘000 Rs. ‘000
Future Operating Lease Receivable 31,118 41,268 - 72,386
4.24.7 Borrowing Costs - Company & Group
There were no capitalised borrowing cost related to the acquisition of property, plant and equipment during the financial year 2021 and 2020.
4.24.8 Fully-Depreciated Property, Plant and Equipment - Company & Group
The initial cost of fully-depreciated property, plant and equipment, which are still in use as at reporting date is Rs. 1,699,302,710/- (2020 - Rs. 1,527,144,852/-).
Notes to the Financial Statements

L B Finance PLC | Annual Report 2020/21 345
Stability Leadership Strength Agility Responsibility Sustainability Success Supplementary Information
4.24.9 Information on the Freehold Land and Buildings - Company & GroupFreehold land and buildings of the Company are revalued at minimum once in every two years or more frequently if the fair values previously disclosed are substantially different from the fair values as at the reporting date.
The Company engages independent professional valuers for revaluation of its freehold land and buildings as specified by the Direction No 04 of 2018 on ‘Valuation of Immovable Properties’ and subsequent amendments thereto issued by the Central Bank of Sri Lanka.
Information on the freehold land and buildings as required by the Rule No 7.6 (viii) of the ‘Continuing Listing Requirements’ of the Colombo Stock Exchange.
As at 31 March 2021 2020
Location
Number of Buildings
Extent Buildings Revalued Amount
Net Book Value
Revalued Amount as a % of Net
Book Value
Net Book Value
PerchesSquare
Feets Rs. ‘000 Rs. ‘000 Rs. ‘000
KollupitiyaNo 20, Dharmapala Mawatha,
1 52.82 57,020 2,128,835 869,333 245 881,885 Colombo 03.KollupitiyaNo 676, Galle Road,
5 167.65 63,251 4,358,900 2,204,470 198 2,186,858 Colombo 03.Cinnamon GardensNo 165, Dharmapala Mawatha, Colombo 07. 1 48.95 7,400 1,177,650 1,034,914 114 1,003,953 KandyNo 115B, Kotugodella Veediya,
1 25.76 7,780 580,335 519,255 112 519,624 Kandy.KandyNo 226, D S Senanayaka Street, Kandy. 1 7.05 3,674 83,061 10,284 808 10,345 KandyMoragaspitiyawatta Road,
2 110.00 2,400 59,800 29,406 203 29,577 Balagolla, Kengalla.KandyNo 47/10 A, Luwiss Pieris Mawatha, Buwelikada, Kandy. - 42.40 - 40,280 34,085 118 34,085 MaradanaNo 104/1, Vipulasena Mawatha, Colombo 10. 1 50.60 5,750 358,800 75,493 475 76,169 Nuwara EliyaNo 35/4, Upper Lake Road,
- 359.00 - 466,700 64,906 719 64,906 Nuwara Eliya.WellawattaNo 51A, W A Silva Mawatha,
1 14.23 5,678 224,736 157,187 143 156,442 Colombo 06.PanaduraNo 37, Jayathilake Mawatha,
1 42.00 1,925 139,869 104,224 134 104,224 Panadura.KalutaraNo 334, Main Street,
1 26.27 10,620 218,685 194,119 113 195,181 Kalutara South.BorellaNo 1024, Maradana Road,
- 25.50 - 344,250 266,710 129 266,710 Borella.Rajagiriya*No 1149, Kotte Road,
- 16.30 - 128,011 128,011 100 - Rajagiriya.
*Freehold land and building purchased during the financial year ended 31 March 2021.Valuation of freehold land and buildings of the Company was carried out as at 31 March 2021 by H.B. Manjula Basnayaka. AIV (Sri Lanka), N.C.T., QS, (COT), incorporated valuer. Investment method, Contractor’s Test method, Comparison method and Residual method have been used for the valuation.Freehold land and buildings of the Company are considered under Level 3 of fair value hierarchy.

L B Finance PLC | Annual Report 2020/21346
4.24.10 Title Restriction on Property, Plant and Equipment - Company & Group
There were no restrictions existed on the title of the property, plant and equipment as at the reporting date.
4.24.11 Property, Plant and Equipment Pledged as Security for Liabilities - Company & Group
There were no items of property, plant and equipment pledged as securities for liabilities as at the reporting date other than those disclosed in the Note 6.7 of these Financial Statements.
4.24.12 Compensation from Third Parties for Items of Property, Plant and Equipment - Company & Group
There were no compensation receivable from third parties for items of property, plant and equipment that were impaired, lost or given up as at the reporting date.
4.24.13 Temporarily Idle Property, Plant and Equipment - Company & Group
There were no temporarily idle property, plant and equipment as at the reporting date.
4.24.14 Property, Plant and Equipment Retired from Active Use - Company & Group
There were no property, plant and equipment retired from active use as at the reporting date.
4.25 INTANGIBLE ASSETS
An intangible asset is an identifiable monetary asset without physical substance held for use in the production or supply of goods or services, for rental to others or for administrative purposes.
Accounting Policy
Basis of Recognition
An intangible asset is recognised if it is probable that the future economic benefits that are attributable to the asset will flow to the entity and the cost of the assets can be measured reliably. An intangible asset is initially measured at cost.
Computer Software
Cost of all computer software licensed for use by the Group, which are not integrally related to associated hardware, which can be clearly identified, reliably measured and it’s probable that they will lead to future economic benefits, are included in the Statement of Financial Position under the category of intangible assets and carried at cost less accumulated amortisation and any accumulated impairment losses.
Subsequent Expenditure
Expenditure incurred on software is capitalised only when it is probable that this expenditure will enable the asset to generate future economic benefits in excess of its originally assessed standard of performance and this expenditure can be measured and attributed to the asset reliably. All other expenditure is expensed as incurred.
Derecognition of Intangible Assets
The carrying amount of an item of intangible asset is derecognised on disposal or when no future economic benefits are expected from its use. The gain or loss arising from derecognition of an item of intangible asset is included in the Income Statement when the item is derecognised.
Amortisation of Intangible Assets
Intangible assets, except for goodwill, are amortised on a straight line basis in the Income Statement from the date when the asset is available for use, over the best estimate of its useful economic life based on a pattern in which the asset’s economic benefits are consumed by the Group. Indefinite-lived intangible assets are not amortised, but are tested for impairment annually or more frequently if events or circumstances indicate the asset may be impaired. Only finite-lived intangible asset is computer software of the Group. There is no indefinite-lived intangible assets which are subject to annual impairment test. Amortisation methods, useful lives and residual values are reviewed at each reporting date and adjusted if appropriate. The Group assumes that there is no residual value for its intangible assets.
Notes to the Financial Statements

L B Finance PLC | Annual Report 2020/21 347
Stability Leadership Strength Agility Responsibility Sustainability Success Supplementary Information
Intangible assets mainly represent the cost of computer software and the useful lifetime is as follows;
Intangible Asset Category Period (Years)
Depreciation % per Annum
Computer Software 5 20%
Computer Software Company Group
2021 2020 2021 2020
Rs. ‘000 Rs. ‘000 Rs. ‘000 Rs. ‘000
Cost Cost as at the Beginning of the Year 191,272 173,428 208,769 178,557 Additions and Improvements 658 17,844 658 29,339 Disposals/Write-off (9) - (9) - Exchange Rate Variance - - 890 873 Cost as at the End of the Year 191,921 191,272 210,308 208,769
Amortisation and Impairment Losses
Amortisation as at the Beginning of the Year 149,463 133,581 153,705 135,034 Charge for the Year 16,446 15,882 20,019 18,125 Impairment Loss - - - - Disposals/Write-off (9) - (9) -Exchange Rate Variance - - 322 546 Accumulated Amortisation as at the End of the Year 165,900 149,463 174,037 153,705
Net Book Value as at 31 March 26,021 41,809 36,271 55,064
4.25.1 There were no restrictions on the title of the intangible assets as at the reporting date. Further there were no items pledged as securities for liabilities.
4.26 DUE TO BANKS
Accounting Policy These include bank overdrafts, finance leases, syndicated loans, term loans, securitisation loans and other bank facilities. Due
to bank balances are initially recognised at fair value net of transactions cost. Subsequently, they are stated at amortised cost; any difference between the proceeds (net of transaction cost) and the repayable amount (including interest) is recognised in the Income Statement over the period of the loan using effective interest rate method.
Under finance leases, the leased assets are capitalised and included in ‘property, plant and equipment’ and the corresponding liability to the lessor is included in ‘Due to Banks’. A finance lease and its corresponding liability are recognised initially at the fair value of the asset or, if lower, the present value of the minimum lease payments. Finance charges payable are recognised in ‘Interest Expense’ over the period of the lease based on the interest rate implicit in the lease so as to give a constant rate of interest on the remaining period of the liability.
As at 31 March Company Group
2021 2020 2021 2020
Rs. ‘000 Rs. ‘000 Rs. ‘000 Rs. ‘000
Bank Overdrafts 988,099 720,411 988,099 720,411 Debt Funding from Banks (Note 4.26.1) 15,479,080 22,050,674 15,538,558 22,162,530
16,467,179 22,771,085 16,526,657 22,882,941
Fair Value 17,083,937 24,816,902 17,143,415 24,928,759

L B Finance PLC | Annual Report 2020/21348
4.26.1 Debt Funding from Banks
As at 1 April 2020
Loans Obtained*
Interest Recognised
Repayments As at 31 March 2021
Capital Interest
Rs. '000 Rs. '000 Rs. '000 Rs. '000 Rs. '000 Rs. '000
Syndicated LoansSyndication 1 909,034 - 27,715 (910,000) (26,749) - Syndication 2 850,793 - 34,728 (625,000) (260,521) - Syndication 3 2,510,530 - 240,655 (2,000,000) (751,185) - Syndication 4 1,195,631 - 117,174 (1,000,000) (312,805) - Syndication 5 1,176,934 - 113,854 (1,000,000) (290,788) - Syndication 6 1,381,358 - 126,169 (1,300,000) (207,527) -
8,024,280 - 660,295 (6,835,000) (1,849,575) -
Term LoansBank of Ceylon 419,339 - 6,774 (416,667) (9,446) - Commercial Bank 1 62,626 - 1,133 (62,500) (1,259) - Commercial Bank 2 780,463 - 44,636 (779,000) (46,099) - Commercial Bank 3 2,034,014 - 171,715 (625,000) (173,471) 1,407,258 Commercial Bank 4 294,649 - 19,157 (124,800) (20,887) 168,119 Nations Trust Bank 1 706,200 - 54,761 (252,000) (54,907) 454,054 Nations Trust Bank 2 389,986 - 27,191 (168,000) (28,479) 220,698 Hatton National Bank 1 - 1,495,763 111,177 (281,250) (104,388) 1,221,302 Hatton National Bank 2 - 1,491,960 33,848 (1,500,000) (25,808) - Hatton National Bank 3 - 1,500,000 1,125 (1,500,000) (1,125) - Hatton National Bank 4 - 1,500,000 488 (1,500,000) (488) - Hatton National Bank 5 - 1,000,000 137 (1,000,000) (137) - Public Bank 1 60,096 - 3,460 (40,000) (3,535) 20,021 Public Bank 2 40,029 - 2,567 (20,000) (2,584) 20,012 Seylan Bank 1 189,026 - 8,635 (187,474) (10,187) - Seylan Bank 2 - 250,000 1,282 (250,000) (1,282) - Seylan Bank 3 - 500,000 66 (500,000) (66) - DFCC Bank 1 299,420 - 13,131 (296,875) (15,676) - DFCC Bank 2 566,836 - 38,087 (250,000) (40,777) 314,146 DFCC Bank 3 1,006,613 - 74,435 (171,429) (77,743) 831,876 DFCC Bank 4 972,945 - 72,962 (200,000) (76,176) 769,731 Habib Bank 158,276 - 6,933 (158,333) (6,876) - Sampath Bank 1 2,864,825 - 294,208 (750,000) (299,470) 2,109,563 Sampath Bank 2 - 1,996,000 115,172 (416,750) (111,991) 1,582,431 Standard Chartered Bank - 750,000 16,068 (750,000) (16,068) - National Development Bank 1 - 1,000,000 32,263 (583,800) (32,166) 416,297 National Development Bank 2 - 700,000 22,581 (408,800) (22,513) 291,268 National Development Bank 3 - 300,000 15,386 - (15,306) 300,080 National Development Bank 4 - 1,500,000 76,932 - (76,531) 1,500,401 National Development Bank 5 - 500,000 25,907 - (25,772) 500,135 National Development Bank 6 - 1,300,000 67,358 - (67,007) 1,300,351
10,845,343 15,783,723 1,359,575 (13,192,678) (1,368,220) 13,427,743
Securitisation LoansSampath Bank 3,181,051 - 356,581 (1,125,000) (361,295) 2,051,337
3,181,051 - 356,581 (1,125,000) (361,295) 2,051,337
Total Debt Funding from Banks - Company 22,050,674 15,783,723 2,376,451 (21,152,678) (3,579,090) 15,479,080
Notes to the Financial Statements

L B Finance PLC | Annual Report 2020/21 349
Stability Leadership Strength Agility Responsibility Sustainability Success Supplementary Information
As at 1 April 2020
Loans Obtained*
Interest Recognised
Repayments As at 31 March 2021
Capital Interest
Rs. '000 Rs. '000 Rs. '000 Rs. '000 Rs. '000 Rs. '000
L B Microfinance Myanmar Company Limited
Term LoanCB Bank 111,856 - 16,946 (56,960) (12,364) 59,478
111,856 - 16,946 (56,960) (12,364) 59,478
Total Debt Funding from Banks - Group 22,162,530 15,783,723 2,393,397 (21,209,638) (3,591,454) 15,538,558
*Net of transaction cost
The Group has unutilised borrowing facilities of Rs. 5,453,000,000/- as at 31 March 2021 (2020 - Rs. 4,492,727,321/-).
Details of the assets pledged as security for liabilities are disclosed in Note 6.7 to these Financial Statements.
4.26.2 Contractual Maturity Analysis of Debt Funding from Banks - Company
As at 31 March 2021 Within One Year
1 - 5 Years
Over 5 Years
Total
Rs. ‘000 Rs. ‘000 Rs. ‘000 Rs. ‘000
Syndicated Loans - - - -
Term Loans 5,842,357 7,585,386 - 13,427,743
Securitisation Loans 2,051,337 - - 2,051,337
7,893,694 7,585,386 - 15,479,080
As at 31 March 2020 Within One Year
1 - 5 Years
Over 5 Years
Total
Rs. ‘000 Rs. ‘000 Rs. ‘000 Rs. ‘000
Syndicated Loans 1,882,308 6,141,972 - 8,024,280
Term Loans 4,058,782 6,643,744 142,817 10,845,343
Securitisation Loans 1,364,311 1,816,740 - 3,181,051
7,305,401 14,602,456 142,817 22,050,674

L B Finance PLC | Annual Report 2020/21350
4.26.3 Contractual Maturity Analysis of Debt Funding from Banks - Group
As at 31 March 2021 Within One Year
1 - 5 Years
Over 5 Years
Total
Rs. ‘000 Rs. ‘000 Rs. ‘000 Rs. ‘000
Syndicated Loans - - - -
Term Loans 5,901,835 7,585,386 - 13,487,221
Securitisation Loans 2,051,337 - - 2,051,337
7,953,172 7,585,386 - 15,538,558
As at 31 March 2020 Within One Year
1 - 5 Years
Over 5 Years
Total
Rs. ‘000 Rs. ‘000 Rs. ‘000 Rs. ‘000
Syndicated Loans 1,882,308 6,141,972 - 8,024,280
Term Loans 4,116,438 6,697,944 142,817 10,957,199
Securitisation Loans 1,364,311 1,816,740 - 3,181,051
7,363,057 14,656,656 142,817 22,162,530
4.27 FINANCIAL LIABILITIES AT AMORTISED COST - DUE TO DEPOSITORS
Accounting PolicyDue to depositors comprise of interest bearing savings deposits and term deposits. Customer deposits are initially recognised at fair value net of transactions cost. Subsequent to the initial recognition they are measured at their amortised cost using the effective interest rate method. Interest expense on these deposits is recognised to the Income Statement.
As at 31 March Company Group
2021 2020 2021 2020
Rs. ‘000 Rs. ‘000 Rs. ‘000 Rs. ‘000
Fixed Deposits 81,916,722 85,761,986 81,916,722 85,761,986
Certificates of Deposit 7,500 10,373 7,500 10,373
Savings Deposits 3,935,848 3,484,076 4,015,991 3,542,738
85,860,070 89,256,435 85,940,213 89,315,097
Fair Value 87,194,929 89,847,604 87,275,072 89,906,266
4.27.1 Sri Lanka Deposit Insurance and Liquidity Support Scheme - Company
Under the Direction No 1 of 2021 [Finance Companies (Insurance of Deposit Liabilities)] issued by the Central Bank of Sri Lanka and subsequent amendments thereto, all the eligible deposit liabilities have been insured with the Sri Lanka Deposit Insurance and Liquidity Support Scheme implemented by the Monetary Board for compensation upto a maximum of Rs. 1,100,000/- for each depositor. The Company has paid Rs. 122,113,256/- as the premium of the said insurance scheme during the current financial year (2020 - Rs. 118,134,385/-).
Notes to the Financial Statements

L B Finance PLC | Annual Report 2020/21 351
Stability Leadership Strength Agility Responsibility Sustainability Success Supplementary Information
4.27.2 Contractual Maturity Analysis of Customer Deposits - Company
As at 31 March 2021 Within One Year
1 - 5 Years
Over 5 Years
Total
Rs. ‘000 Rs. ‘000 Rs. ‘000 Rs. ‘000
Fixed Deposits 68,380,102 13,536,620 - 81,916,722
Certificates of Deposit 7,500 - - 7,500
Savings Deposits 3,935,848 - - 3,935,848
72,323,450 13,536,620 - 85,860,070
As at 31 March 2020 Within One Year
1 - 5 Years
Over 5 Years
Total
Rs. ‘000 Rs. ‘000 Rs. ‘000 Rs. ‘000
Fixed Deposits 71,230,589 14,531,397 - 85,761,986
Certificates of Deposit 10,373 - - 10,373
Savings Deposits 3,484,076 - - 3,484,076
74,725,038 14,531,397 - 89,256,435
4.27.3 Contractual Maturity Analysis of Customer Deposits - Group
As at 31 March 2021 Within One Year
1 - 5 Years
Over 5 Years
Total
Rs. ‘000 Rs. ‘000 Rs. ‘000 Rs. ‘000
Fixed Deposits 68,380,102 13,536,620 - 81,916,722
Certificates of Deposit 7,500 - - 7,500
Savings Deposits 4,015,991 - - 4,015,991
72,403,593 13,536,620 - 85,940,213
As at 31 March 2020 Within One Year
1 - 5 Years
Over 5 Years
Total
Rs. ‘000 Rs. ‘000 Rs. ‘000 Rs. ‘000
Fixed Deposits 71,230,589 14,531,397 - 85,761,986
Certificates of Deposit 10,373 - - 10,373
Savings Deposits 3,542,738 - - 3,542,738
74,783,700 14,531,397 - 89,315,097
We have raised fixed deposits with a pre-termination option to the customers, so fixed deposit pre-terminations may cause actual maturities to differ from contractual maturities.

L B Finance PLC | Annual Report 2020/21352
4.28 DEBT INSTRUMENTS ISSUED AND OTHER BORROWED FUNDS
Accounting PolicyDebt instruments and other borrowings are initially recognised at fair value net of transactions cost. Subsequently, they are stated at amortised cost; any difference between the proceeds (net of transaction cost) and the repayable amount (including interest) is recognised in the Income Statement over the period of the loan instrument using effective interest rate method.
As at 31 March Company & Group2021 2020
Rs. ‘000 Rs. ‘000
Unsecured Debentures (Note 4.28.1) 3,113,916 3,111,186 Fair Value 3,405,315 3,215,338
4.28.1 Unsecured Debentures
Category Interest Payable
Features Amortised Cost
Face Value Interest Rate
Issued Date Redemption Date
Rs. ‘000 Rs. ‘000
Type A (60 Months) Biannually Listed 1,036,959 1,000,000 12.75% p.a 11 December 2017 11 December 2022Type B (60 Months) Biannually Listed 2,076,957 2,000,000 13.25% p.a 11 December 2017 11 December 2022
3,113,916 3,000,000
4.28.2 Contractual Maturity Analysis of Debt Instruments Issued and Other Borrowed Funds - Company & Group
As at 31 March 2021 Within One Year
1 - 5 Years
Over 5 Years
Total
Rs. ‘000 Rs. ‘000 Rs. ‘000 Rs. ‘000
Unsecured Debentures 116,224 2,997,692 - 3,113,916
As at 31 March 2020 Within One Year
1 - 5 Years
Over 5 Years
Total
Rs. ‘000 Rs. ‘000 Rs. ‘000 Rs. ‘000
Unsecured Debentures 116,611 2,994,575 - 3,111,186
4.29 OTHER FINANCIAL LIABILITIES
Accounting PolicyOther financial liabilities are recognised initially at fair value and subsequently measured at amortised cost using the effective interest rate method. Trade payables are obligations to pay for vehicle suppliers in the ordinary course of business.
As at 31 March Company Group2021 2020 2021 2020
Rs. ‘000 Rs. ‘000 Rs. ‘000 Rs. ‘000
Trade Payables 277,055 68,309 277,055 68,309 Insurance Premium Payables 495,145 482,244 495,145 482,244 Unclaimed Balances 677,661 657,711 678,461 658,068 Lease Liability (Note 4.29.1) 1,440,965 1,321,454 1,440,965 1,321,454 Advances Collected from Customers 46,750 99,166 46,750 99,166 Other Payables 105,950 137,526 105,964 137,534
3,043,526 2,766,410 3,044,340 2,766,775
Fair Value 3,043,526 2,766,410 3,044,340 2,766,775
Notes to the Financial Statements
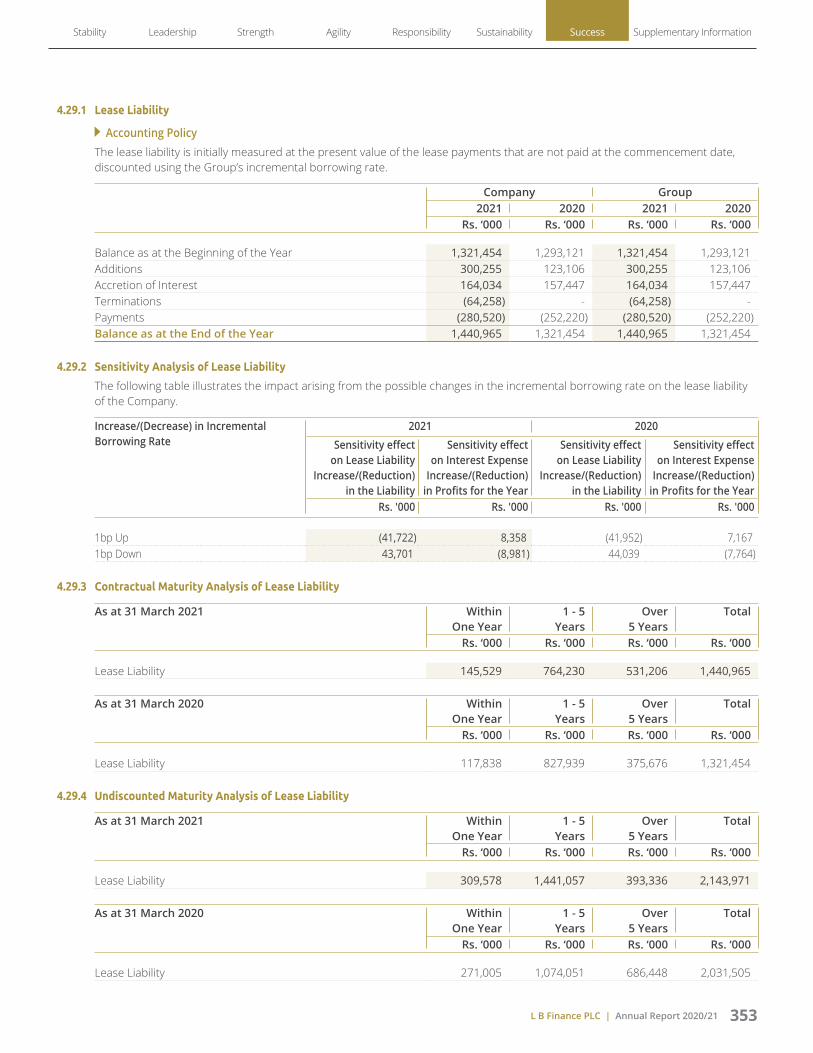
L B Finance PLC | Annual Report 2020/21 353
Stability Leadership Strength Agility Responsibility Sustainability Success Supplementary Information
4.29.1 Lease Liability
Accounting PolicyThe lease liability is initially measured at the present value of the lease payments that are not paid at the commencement date, discounted using the Group’s incremental borrowing rate.
Company Group2021 2020 2021 2020
Rs. ‘000 Rs. ‘000 Rs. ‘000 Rs. ‘000
Balance as at the Beginning of the Year 1,321,454 1,293,121 1,321,454 1,293,121 Additions 300,255 123,106 300,255 123,106 Accretion of Interest 164,034 157,447 164,034 157,447 Terminations (64,258) - (64,258) - Payments (280,520) (252,220) (280,520) (252,220)Balance as at the End of the Year 1,440,965 1,321,454 1,440,965 1,321,454
4.29.2 Sensitivity Analysis of Lease Liability
The following table illustrates the impact arising from the possible changes in the incremental borrowing rate on the lease liability of the Company.
Increase/(Decrease) in Incremental Borrowing Rate
2021 2020 Sensitivity effect
on Lease Liability Increase/(Reduction)
in the Liability
Sensitivity effect on Interest Expense
Increase/(Reduction) in Profits for the Year
Sensitivity effect on Lease Liability
Increase/(Reduction) in the Liability
Sensitivity effect on Interest Expense
Increase/(Reduction) in Profits for the Year
Rs. '000 Rs. '000 Rs. '000 Rs. '000
1bp Up (41,722) 8,358 (41,952) 7,167 1bp Down 43,701 (8,981) 44,039 (7,764)
4.29.3 Contractual Maturity Analysis of Lease Liability
As at 31 March 2021 Within One Year
1 - 5 Years
Over 5 Years
Total
Rs. ‘000 Rs. ‘000 Rs. ‘000 Rs. ‘000
Lease Liability 145,529 764,230 531,206 1,440,965
As at 31 March 2020 Within One Year
1 - 5 Years
Over 5 Years
Total
Rs. ‘000 Rs. ‘000 Rs. ‘000 Rs. ‘000
Lease Liability 117,838 827,939 375,676 1,321,454
4.29.4 Undiscounted Maturity Analysis of Lease Liability
As at 31 March 2021 Within One Year
1 - 5 Years
Over 5 Years
Total
Rs. ‘000 Rs. ‘000 Rs. ‘000 Rs. ‘000
Lease Liability 309,578 1,441,057 393,336 2,143,971
As at 31 March 2020 Within One Year
1 - 5 Years
Over 5 Years
Total
Rs. ‘000 Rs. ‘000 Rs. ‘000 Rs. ‘000
Lease Liability 271,005 1,074,051 686,448 2,031,505

L B Finance PLC | Annual Report 2020/21354
4.30 OTHER NON FINANCIAL LIABILITIES
Accounting PolicyGroup classifies all non financial liabilities other than post employment benefit liability, deferred tax liabilities and current tax liabilities under other non financial liabilities. Other non financial liabilities include accruals, advances and provisions. These liabilities are non-interest bearing and recorded at the amounts that are expected to be paid.
ProvisionsProvisions are recognised when the Group has a present obligation (legal or constructive) as a result of a past event, and it is probable that an outflow of resources embodying economic benefits will be required to settle the obligation and a reliable estimate can be made of the amount of the obligation. The expense relating to any provision is presented in the Income Statement net of any reimbursement.
As at 31 March Company Group2021 2020 2021 2020
Rs. ‘000 Rs. ‘000 Rs. ‘000 Rs. ‘000
Accrued Expenses 851,774 768,511 861,213 779,949 Stamp Duty Payable 81,310 53,959 81,310 53,959 EPF/ETF/PAYE Payable 37,537 38,331 37,537 38,331 Crop Insurance Levy Payable 28,414 13,152 28,414 13,152 Other Payables 23,774 23,980 37,466 29,054 Withholding Tax Payable 870 7,378 870 7,378 Impairment Provision in Respect of
Off-Balance Sheet Credit Exposures 4,375 3,955 4,375 3,955 1,028,054 909,266 1,051,185 925,778
4.31 CURRENT TAX LIABILITIES
As at 31 March Company Group2021 2020 2021 2020
Rs. ‘000 Rs. ‘000 Rs. ‘000 Rs. ‘000
Income Tax 1,657,779 761,499 1,663,183 771,804 Value Added Tax (VAT) 214,375 5,253 214,375 5,253
1,872,154 766,752 1,877,558 777,057
4.32 DEFERRED TAX LIABILITIES
Accounting PolicyDeferred tax is provided on temporary differences at the reporting date between the tax bases of assets and liabilities and their carrying amounts for financial reporting purposes. Deferred tax liabilities are recognised for all taxable temporary differences.
Deferred tax assets are recognised for all deductible temporary differences, carry forward of unused tax credits and unused tax losses (if any), to the extent that it is probable that taxable profit will be available against which the deductible temporary differences, and the unused tax credits and unused tax losses carried forward can be utilised.
The carrying amount of deferred tax assets is reviewed at each reporting date and reduced to the extent that it is no longer probable that sufficient taxable profit will be available to allow all or part of the deferred tax asset to be utilised. Unrecognised deferred tax assets are reassessed at each reporting date and are recognised to the extent that it has become probable that future taxable profit will allow the deferred tax asset to be recovered.
Deferred tax assets and liabilities are measured at the tax rates that are expected to apply in the year when the asset is realised or the liability is settled, based on tax rates (and tax laws) that have been enacted or substantively enacted at the reporting date. Deferred tax assets and deferred tax liabilities are offset if a legally enforceable right exists to set off current tax assets against current tax liabilities and the deferred taxes relate to the same taxable entity and the same taxation authority.
Accounting EstimatesDeferred tax assets are recognised in respect of tax losses to the extent that it is probable that future taxable profits will be available against which such tax losses can be utilised. Judgment is required to determine the amount of deferred tax assets that can be recognised, based upon the likely timing and level of future taxable profits, together with the future tax planning strategies.
Notes to the Financial Statements

L B Finance PLC | Annual Report 2020/21 355
Stability Leadership Strength Agility Responsibility Sustainability Success Supplementary Information
D
efer
red
Tax
Asse
ts a
nd L
iabi
litie
s an
d In
com
e Ta
x Re
late
to th
e Fo
llow
ings
;
Refle
cted
inRe
flect
ed in
Refle
cted
in
Stat
emen
t of F
inan
cial
Pos
ition
Inco
me
Stat
emen
tSt
atem
ent o
f Com
preh
ensi
ve In
com
e
Com
pany
Grou
pCo
mpa
nyGr
oup
Com
pany
Grou
p
2021
2020
2021
2020
2021
2020
2021
2020
2021
2020
2021
2020
Rs. '
000
Rs. '
000
Rs. '
000
Rs. '
000
Rs. '
000
Rs. '
000
Rs. '
000
Rs. '
000
Rs. '
000
Rs. '
000
Rs. '
000
Rs. '
000
Defe
rred
Tax
Lia
bilit
ies
Depr
ecia
tion
of L
ease
d As
sets
687
,133
1
,043
,577
6
87,1
33
1,0
43,5
77
(356
,443
) (9
0,40
6) (3
56,4
43)
(90,
406)
Depr
ecia
tion
of P
rope
rty,
Plan
t and
Equ
ipm
ent
165
,815
2
20,9
56
165
,815
2
20,9
56
(55,
141)
(8,0
96)
(55,
141)
(8,0
96)
852
,948
1
,264
,533
8
52,9
48
1,2
64,5
33
(411
,584
) (9
8,50
2) (4
11,5
84)
(98,
502)
Defe
rred
Tax
Ass
ets
Righ
t-of-U
se A
sset
s (4
3,08
9) (2
5,20
0) (4
3,08
9) (2
5,20
0) (1
7,88
9) (2
5,20
0) (1
7,88
9) (2
5,20
0)
Defin
ed B
enefi
t Obl
igat
ion
- I
ncom
e St
atem
ent
(74,
871)
(74,
252)
(74,
871)
(74,
252)
(619
) (1
3,22
7) (6
19)
(13,
227)
Defin
ed B
enefi
t Obl
igatio
n
- Oth
er C
ompr
ehen
sive I
ncom
e (1
2,79
2) (2
2,47
6) (1
2,79
2) (2
2,47
6) 9
,684
(1
1,67
8) 9
,684
(1
1,67
8)
Carr
ied
Forw
ard
Impa
irmen
t Pr
ovisi
on (8
5,12
3) (1
05,0
25)
(85,
123)
(105
,025
) 1
9,90
1 (1
23,5
35)
19,
901
(123
,535
)
(215
,875
) (2
26,9
53)
(215
,875
) (2
26,9
53)
1,3
93
(161
,962
) 1
,393
(1
61,9
62)
9,6
84
(11,
678)
9,6
84
(11,
678)
Defe
rred
Inco
me
Tax
Char
ge/
(Rev
ersa
l) (4
10,1
91)
(260
,464
) (4
10,1
91)
(260
,464
) 9
,684
(1
1,67
8) 9
,684
(1
1,67
8)
Net
Def
erre
d Ta
x Lia
bilit
y/(A
sset
) 6
37,0
73
1,0
37,5
80
637
,073
1
,037
,580
4.32
.1
Revi
sed
inco
me
tax
rate
s pr
opos
ed to
the
Inla
nd R
even
ue A
ct, N
o. 2
4 of
201
7 by
Circ
ular
No.
PN
/IT/2
020-
03 (R
evis
ed),
be im
plem
ente
d w
ith e
ffect
from
01
Janu
ary
2020
. On
23 A
pril
2021
, CA
Sri L
anka
issu
ed G
uide
line
on A
pplic
atio
n of
Tax
Rat
es in
Mea
sure
men
t of C
urre
nt T
ax a
nd D
efer
red
Tax
in L
KAS
12 In
com
e Ta
x to
pro
vide
an
inte
rpre
tatio
n on
the
appl
icat
ion
of ta
x ra
tes
whi
ch is
sub
stan
tivel
y en
acte
d in
the
mea
sure
men
t of c
urre
nt ta
x an
d de
ferr
ed ta
x fo
r fina
ncia
l rep
ortin
g pe
riod
endi
ng 2
6 M
arch
202
1. A
ccor
ding
ly, t
he C
ompa
ny a
pplie
d 24
% in
com
e ta
x ra
te fo
r the
det
erm
inat
ion
of d
efer
red
tax
in 2
021
and
reco
gnis
ed a
n ad
just
men
t to
defe
rred
tax
liabi
litie
s am
ount
ing
to R
s. 1
48,2
25,7
09 /-
from
redu
ctio
n in
tax
rate
.

L B Finance PLC | Annual Report 2020/21356
4.33 POST EMPLOYMENT BENEFIT LIABILITY
Accounting Estimates
Our end of service benefit obligations are measured based on the present value of projected future benefit payments for all participants for services rendered to date. The measurement of projected future benefits is dependent on the stipulated formula, salary assumptions, demographics of the group covered by the plan, and other key measurement assumptions. The net periodic benefit costs associated with the Company’s defined benefit plans are determined using assumptions regarding the benefit obligations. Due to the long-term nature of these plans, such estimates are subject to significant uncertainty. All assumptions are reviewed at each reporting date.
In determining the appropriate discount rate, management considers the interest rates of Sri Lanka Government Bonds with extrapolated maturities corresponding to the expected duration of the defined benefit obligation. The mortality rate is based on publicly available mortality tables. Future salary increases are based on expected future inflation rates and expected future salary increase rate of the Company.
Provision has been made for retirement gratuities from the beginning of service for all employees, in conformity with Sri Lanka Accounting Standard LKAS 19 on ‘Employee Benefit’. However, under the Payment of Gratuity Act No 12 of 1983, the liability to an employee arises only on completion of five years of continued service.
Recognition of Actuarial Gains and Losses
The Company recognises the total actuarial gains and losses that arise in calculating the Company’s obligation in respect of the plan in Other Comprehensive Income during the period in which it occurs.
Expected Return on Assets
Expected return on assets is zero as the plan is not pre-funded.
Funding Arrangements
The gratuity liability is not externally funded.
4.33.1 Post Employment Benefit Liability
Company Group
2021 2020 2021 2020
Rs. ‘000 Rs. ‘000 Rs. ‘000 Rs. ‘000
Balance as at the Beginning of the Year 345,456 256,512 345,456 256,512
Amount Charged/(Reversed) for the Year 53,569 117,650 53,569 117,650
Payments Made During the Year (33,760) (28,706) (33,760) (28,706)
Balance as at the End of the Year 365,265 345,456 365,265 345,456
4.33.2 Amounts Recognised in the Income Statement
Company Group
2021 2020 2021 2020
Rs. ‘000 Rs. ‘000 Rs. ‘000 Rs. ‘000
Current Service Cost for the Year 59,372 46,443 59,372 46,443
Interest Cost on the Net Defined Benefit Liability for the Year 34,546 29,500 34,546 29,500
93,918 75,943 93,918 75,943
Notes to the Financial Statements

L B Finance PLC | Annual Report 2020/21 357
Stability Leadership Strength Agility Responsibility Sustainability Success Supplementary Information
4.33.3 Amounts Recognised in the Other Comprehensive Income
Company Group
2021 2020 2021 2020
Rs. ‘000 Rs. ‘000 Rs. ‘000 Rs. ‘000
Liability (Gains)/Losses due to Changes in Assumptions 19,051 33,472 19,051 33,472
Liability Experience (Gains)/Losses Arising During the Year (59,400) 8,235 (59,400) 8,235
(40,349) 41,707 (40,349) 41,707
4.33.4 Defined Benefit Obligation Reconciliation
Company & Group
2021 2020
Rs. ‘000 Rs. ‘000
Benefit Obligation at the End of Prior Year 345,456 256,512
Current Service Cost for the Year 59,372 46,443
Net Interest Cost on the Net Defined Benefit Liability for the Year 34,546 29,500
Liability (Gains)/Losses due to Changes in Assumptions 19,051 33,472
Liability Experience (Gains)/Losses Arising During the Year (59,400) 8,235
Payments Made During the Year (33,760) (28,706)
365,265 345,456
4.33.5 Average future working lifetime as per the assumptions made is 14.6 years as of 31 March 2021 (14.7 years as of 31 March 2020).
4.33.6 Assumptions
2021 2020
Discount Rate 8.50% 10.00%
Salary Increment 8.00% 9.00%
Staff Turnover
20 - 40 Years 25.00% 25.00%
41 - 49 Years 1.00% 1.00%
50 Years or Above 1.00% 1.00%
Mortality - GA 1983 Mortality Table
Disability - Long Term Disability 1987 Soc. Sec. Table
Retirement Age - Normal Retirement Age (55 Years), or Age on Valuation Date, if greater
An actuarial valuation of the gratuity was carried out as at 31 March 2021 by Piyal S. Goonetilleke & Associates, a firm of professional actuaries. The valuation method used by the actuary to value the Fund is the ‘Projected Unit Credit Method’, required by the Sri Lanka Accounting Standard - LKAS 19 (Employee Benefits).

L B Finance PLC | Annual Report 2020/21358
4.33.7 Sensitivity of Assumptions Employed in Actuarial Valuation
The following table demonstrates the sensitivity to a reasonably possible change in the key assumptions employed with all other variables held constant in the retirement benefit liability measurement.
The sensitivity of the Statement of Comprehensive Income and Statement of Financial Position is the effect of the assumed changes in discount rate and salary increment on the profit or loss and retirement benefit obligation for the year.
Increase/(Decrease) in Discount Rate
Increase/(Decrease) in Salary Increment
2021 2020
Sensitivity Effect on Statement of Comprehensive
Income - Increase/(Reduction) in Results
for the Year
Sensitivity Effect on Retirement Benefit
Obligation - Increase/(Reduction) in the
Liability
Sensitivity Effect on Statement of Comprehensive
Income - Increase/(Reduction) in Results
for the Year
Sensitivity Effect on Retirement Benefit
Obligation - Increase/(Reduction) in the
Liability
Rs. '000 Rs. '000 Rs. '000 Rs. '000
1% 35,634 (35,634) 32,917 (32,917)
-1% (42,603) 42,603 (39,291) 39,291
1% (41,417) 41,417 (38,366) 38,366
-1% 35,355 (35,355) 32,766 (32,766)
4.33.8 The Expected Benefit Payout in the Future Years for Retirement Gratuity
Company & Group
2021 2020
Rs. ‘000 Rs. ‘000
Within the Next 12 Months 34,678 14,091
Between 2 and 5 Years 146,776 182,133
Beyond 5 Years 172,252 191,319
353,706 387,543
The expected benefits are estimated based on the same assumptions used to measure the benefit obligation at the end of the financial year and include benefits attributable to estimated future employee service.
4.34 STATED CAPITAL
4.34.1 Issued and Fully Paid Ordinary Shares
Company & Group Company & Group
2021 2020
No. of Shares Rs. '000 No. of Shares Rs. '000
At the Beginning of the Year 138,514,284 838,282 138,514,284 838,282
Ordinary Shares on Share Split 415,542,852 - - -
At the End of the Year 554,057,136 838,282 138,514,284 838,282
On 10 March 2021, the Company effected the sub-division of ordinary shares on the basis of a sub-division of every one (01) ordinary share into four (04) ordinary shares, thus increasing the existing 138,514,284 issued ordinary shares of the Company to 554,057,136 ordinary shares without in anyway changing the Stated Capital of the Company, which would remain at Rs. 838,282,159/-.
Notes to the Financial Statements

L B Finance PLC | Annual Report 2020/21 359
Stability Leadership Strength Agility Responsibility Sustainability Success Supplementary Information
4.34.2 Rights of Shareholders
The holders of ordinary shares have the right to receive dividends as declared from time to time and are entitled to one vote per share at meetings. All shares rank equally with regard to the Company’s residual assets.
4.35 RESERVES
Company Group
As at 1 April 2020
Movement/ Transfers
As at 31 March 2021
As at 1 April 2020
Movement/ Transfers
As at 31 March 2021
Rs. '000 Rs. '000 Rs. '000 Rs. '000 Rs. '000 Rs. '000
Statutory Reserve 6,323,170 1,360,519 7,683,689 6,323,170 1,360,519 7,683,689
Fair Value Reserve (106,231) 18,648 (87,583) (106,231) 18,648 (87,583)
Foreign Currency Translation Reserve - - - 117,387 33,514 150,901
6,216,939 1,379,167 7,596,106 6,334,326 1,412,681 7,747,007
4.35.1 Statutory Reserve
Company & Group
2021 2020
Rs. ‘000 Rs. ‘000
Balance as at the Beginning of the Year 6,323,170 5,285,759
Transfers Made During the Year 1,360,519 1,037,411
Balance as at the End of the Year 7,683,689 6,323,170
Statutory reserve is a capital reserve which contains profits transferred as required by Section 3(b)(ii) of Central Bank Direction No 1 of 2003.
4.35.2 Fair Value Reserve
Company & Group
2021 2020
Rs. ‘000 Rs. ‘000
Balance as at the Beginning of the Year (106,231) (75,662)
Transfers Made During the Year/Net Gains/(Losses) on Investment in Equity Instruments - Fair Value Through Other Comprehensive Income 18,648 (30,569)
Balance as at the End of the Year (87,583) (106,231)
The fair value through other comprehensive income reserve comprises the cumulative net change in the fair value of financial assets measured at fair value through other comprehensive income until they are derecognised or impaired.

L B Finance PLC | Annual Report 2020/21360
4.35.3 Foreign Currency Translation Reserve
Company Group
2021 2020 2021 2020
Rs. ‘000 Rs. ‘000 Rs. ‘000 Rs. ‘000
Balance as at the Beginning of the Year - - 117,387 20,779
Net Gains/(Losses) from Translating the Financial Statements of the Foreign Operations - - 33,514 96,608
Balance as at the End of the Year - - 150,901 117,387
The foreign currency translation reserve comprises of all foreign currency differences arising from the translation of the Financial Statements of foreign operations. As at the reporting date, the assets and liabilities of the L B Microfinance Myanmar Company Limited a subsidiary of the Company were translated into the presentation currency (Sri Lankan Rupee) at the exchange rate ruling at the reporting date and the Income Statement and Comprehensive Income was translated at the average exchange rate for the period. The exchange differences arising on the translation are taken to foreign currency translation reserve through other comprehensive income.
4.36 RETAINED EARNINGS
Company Group
2021 2020 2021 2020
Rs. ‘000 Rs. ‘000 Rs. ‘000 Rs. ‘000
Balance as at the Beginning of the Year 15,944,328 12,378,772 15,987,173 12,397,809
Dividend Paid (1,662,171) (554,057) (1,662,171) (554,057)
Profit for the Year 6,802,597 5,187,053 6,806,805 5,210,861
Other Comprehensive Income, Net of Tax 30,665 (30,029) 30,665 (30,029)
Transfers During the Year (1,360,519) (1,037,411) (1,360,519) (1,037,411)
Balance as at the End of the Year 19,754,900 15,944,328 19,801,953 15,987,173
Retained earnings represents the undistributed earnings held to be used in its operations. This could be used to absorb future losses or dividends payable.
4.37 NON-CONTROLLING INTEREST
Accounting PolicyNon-Controlling Interest (NCI) are measured at their proportionate share of the acquiree’s identifiable net assets at the date of acquisition. Changes in the Group’s interest in a subsidiary that do not result in a loss of control are accounted for as equity transactions.
The Company owned 100% shares of its subsidiary as at the reporting date. Accordingly, there were no Non-Controlling interest as at 31 March 2021 and 31 March 2020.
Notes to the Financial Statements

L B Finance PLC | Annual Report 2020/21 361
Stability Leadership Strength Agility Responsibility Sustainability Success Supplementary Information
SECTION 05
Risk Management Disclosures5.1 INTRODUCTION
Risk is inherent in the Group’s activities but is managed through a process of ongoing identification, measurement and monitoring, subject to risk limits and other controls. This process of risk management is critical to the Group’s continuing profitability and each individual within the Group is accountable for managing the risk exposures relating to his/her functional areas.
The Group identifies the following key financial risks in its business operations.
Credit Risk
Liquidity Risk
Market Risk
Capital Adequacy
Risk Management Framework
The Risk Management Framework of the Group has been optimised through the application and the embedment of the risk management process including risk identification, risk analysis, risk measurement, risk management decision and execution, risk monitoring and reporting.
The overall responsibility and oversight of the Risk Management framework of the Group is vested with the Board of Directors. The Integrated Risk Management Committee (IRMC), a sub committee appointed by the Board, is responsible for developing and monitoring Group’s risk management policies practiced.
The following management committees, each with a defined responsibility, support the IRMC by executing their respective risk management mandates.
Asset and Liability Committee
Credit Committee
IT Steering Committee
Sustainability Committee
Risk Management Department (RMD)
Whilst the business units have primary responsibility for Risk Management, the RMD provides an independent oversight function acting as a second line of defence. RMD is headed by the Head of Risk Management who directly reports to the Managing Director and also has a functional reporting to the IRMC. The RMD co-exists with other control functions in the Group that might uncover risk management issues, most notably Internal Audit, Compliance and Finance. Each of the control functions has a different focus and potential overlap between them is kept at a minimum, while ensuring that the approaches taken are complementary and lead to consistent, effective and timely escalation of risks.
5.2 CREDIT RISK
Credit risk is the risk of financial loss to the Group if a borrower or counterparty to a financial instrument, fails to meet its contractual obligations, and arises principally from the Group’s loans and advances to customers/other companies and investments in debt securities. Credit risk constitutes the Group’s largest risk exposure category. This can be broadly categorised into three types; default, concentration and settlement risk.
Default risk is the risk of the potential financial loss resulting from the failure of customer or counterparty to meet its debt or contractual obligations and arises principally from the Group’s loans and advances to customers.
Concentration risk is the credit exposure being concentrated as a result of excessive build-up of exposure to a single counterparty, industry, product, geographical location or insufficient diversification.
Settlement risk is the risk of loss arising from trading/investment activities when there is a mutual undertaking to deliver on a progressive basis.
Group manages credit risk by focusing on following steps;
The loan origination stage comprises preliminary screening and credit appraisal. The objective of this process is to assess the borrower’s ability to meet its obligations in an objective manner. The Group has clearly defined guidelines for credit approvals where the limits have been set taking into consideration the factors such as maximum counterparty exposures, loan to value ratio and forced sale value. These steps enables the Group in assessing the default risk of the borrower.
A comprehensive set of credit risk indicators are monitored monthly to review credit concentrations, status of loan recoveries and compliance with regulatory and prudent exposure limits.

L B Finance PLC | Annual Report 2020/21362
Post Disbursement Review
Initial monitoring and follow up activities are carried out by the Credit Department. Once a loan is overdue for a period exceeding the tolerance period, responsibility for recovery and collections is transferred to Recoveries Department. Risk Management Department (RMD) reviews asset quality performance regularly. Delinquencies are handled early with effective follow ups and reminders. Swift recovery actions are taken against critical exposures.
Management of Large Exposures
Credit Committee
The Credit Committee consists of the Managing Director, Deputy Managing Director, Executive Directors, Assistant General Manager-Finance and Head of Risk Management. Sanctioning of large exposures are primarily handled by the Credit Committee. RMD independently monitors post sanctioning performance of large exposures.
Impairment Assessment
The methodology of the impairment assessment has been explained in the Note 4.19 to these Financial Statements.
Collateral and Other Credit Enhancements
The Group uses collateral, where possible, to mitigate its risks on financial assets. The collateral comes in various forms such as cash, vehicles, gold, securities, letters of guarantees, real estate, receivables, inventories and other non financial assets. The fair value of collateral is generally assessed at the inception based on the guidelines issued by the Central Bank of Sri Lanka and the Central Bank of Myanmar.
To the extent possible, the Group uses active market data for valuing financial assets, held as collateral. Non financial collateral, such as real estate, is valued based on data provided by third parties such as independent valuers.
Repossession of collaterals was halted as per the directions issued by the Central Bank which was introduced a relief measure to the COVID-19 affected individuals and entities.
COVID-19 Impact Assessment
The Company’s Enterprise Risk Management Framework strives to manage the outcomes of adverse economic and market conditions proactively, whilst achieving the risk-return objectives of the Company. This has been proven through the Company’s ability to maintain its
NPL at a lower level compared to the industry average (LFCs & SLCs). Company has always acted with due care and taken prudent measures to ensure an effective, efficient and healthy repayment behavior of credit customers while safeguarding the interests of the stakeholders. The subsequent adverse economic effects induced by the outbreak of COVID-19 pandemic, have caused financial stress among our retail, SME and corporate clients which inserted pressure on credit risk in the short term and the Company has provided relief measures to the affected businesses and individuals who are eligible as per the directions issued by the CBSL.
Impact to Myanmar Subsidiary Operations
Through out the year under review, the impact on Myanmar business operations has been closely supervised by the Management and the directions issued by Myanmar Financial Regulatory Department in relation to COVID-19 are being strictly adhered to. Following the military coup occurred since February 2021, the operations of the Myanmar subsidiary have been disrupted. However, the development of the current situation and its impact to the business operations are being closely monitored by the Management.
Notes to the Financial Statements

L B Finance PLC | Annual Report 2020/21 363
Stability Leadership Strength Agility Responsibility Sustainability Success Supplementary Information
5.2.1 Analysis of Credit Risk Exposure
The fair value of collateral for finance receivables is calculated based on the number of contracts multiplied by the loss severity and the Probability of Default (PD) percentage or the outstanding receivable balances multiplied by the Average Recovery Value (ARV) percentage to determine the fair value adjustment.
The following tables shows the maximum exposure to credit risk by class of financial asset. It further shows the net exposure to credit risk.
5.2.1 (a) Company
As at 31 March 2021 2020
Maximum Exposure to Credit Risk
Net Exposure
Maximum Exposure to Credit Risk
Net Exposure
Rs. ‘000 Rs. ‘000 Rs. ‘000 Rs. ‘000
Cash and Cash Equivalents 6,187,300 - 6,162,637 -
Financial Assets Recognised Through Profit or Loss - Measured at Fair Value 10,862 10,862 4,648 4,648
Loans and Receivables (Gross) 70,148,909 6,211,143 60,588,560 5,702,886
Lease Rentals Receivable and Stock out on Hire (Gross) 50,520,906 2,856,391 63,534,703 3,117,674
Financial Assets Measured at Fair Value Through Other Comprehensive Income 77,789 77,789 59,141 59,141
Other Financial Assets* 10,453,903 6,916,158 9,119,681 3,656,946
Total Financial Assets 137,399,669 16,072,343 139,469,370 12,541,295
*Net exposure of the Other Financial Assets mainly includes investment in fixed deposits in banks and other financial institutions. As at 31 March 2021, the net carrying value amount of those investments was Rs. 6,503,654,162/- (2020 - Rs. 3,426,929,172/-).
5.2.1 (b) Group
As at 31 March 2021 2020
Maximum Exposure to Credit Risk
Net Exposure
Maximum Exposure to Credit Risk
Net Exposure
Rs. ‘000 Rs. ‘000 Rs. ‘000 Rs. ‘000
Cash and Cash Equivalents 6,380,786 - 6,472,312 -
Financial Assets Recognised Through Profit or Loss - Measured at Fair Value 10,862 10,862 4,648 4,648
Loans and Receivables (Gross) 70,909,996 6,972,230 61,176,382 6,290,708
Lease Rentals Receivable and Stock out on Hire (Gross) 50,520,906 2,856,391 63,534,703 3,117,674
Financial Assets Measured at Fair Value Through Other Comprehensive Income 77,789 77,789 59,141 59,141
Other Financial Assets* 10,433,149 6,895,404 9,105,761 3,643,026
Total Financial Assets 138,333,488 16,812,676 140,352,947 13,115,197
*Net exposure of the Other Financial Assets mainly includes investment in fixed deposits in banks and other financial institutions. As at 31 March 2021, the net carrying value amount of those investments was Rs. 6,503,654,162/- (2020 - Rs. 3,426,929,172/-).

L B Finance PLC | Annual Report 2020/21364
5.2.2 Collateral and Other Credit Enhancements
The below tables provide an analysis of the values of collateral held and credit enhancements for Stage 03 assets. The values in the tables represent the expected market value on an open market basis. No adjustment has been made to the collateral for any expected costs of recovery.
5.2.2 (a) Company
As at 31 March 2021 Maximum Exposure to Credit Risk
Movable Securities
Immovable Securities
Total Collateral
Net Exposure
Associated ECL
Rs. '000 Rs. '000 Rs. '000 Rs. '000 Rs. '000 Rs. '000
Loans and Receivables 5,590,002 5,673,053 12,574,165 18,247,218 (12,657,216) 2,339,239 Lease Rentals Receivable and
Stock out on Hire 7,903,567 20,360,205 - 20,360,205 (12,456,638) 2,487,333 13,493,569 26,033,258 12,574,165 38,607,423 (25,113,854) 4,826,572
As at 31 March 2020 Maximum Exposure to Credit Risk
Movable Securities
Immovable Securities
Total Collateral
Net Exposure
Associated ECL
Rs. '000 Rs. '000 Rs. '000 Rs. '000 Rs. '000 Rs. '000
Loans and Receivables 4,249,210 3,755,674 10,456,698 14,212,372 (9,963,161) 1,915,499 Lease Rentals Receivable and
Stock out on Hire 9,069,309 22,301,171 - 22,301,171 (13,231,862) 2,223,973 13,318,519 26,056,845 10,456,698 36,513,543 (23,195,023) 4,139,472
5.2.2 (b) Group
As at 31 March 2021 Maximum Exposure to Credit Risk
Movable Securities
Immovable Securities
Total Collateral
Net Exposure
Associated ECL
Rs. '000 Rs. '000 Rs. '000 Rs. '000 Rs. '000 Rs. '000
Loans and Receivables 5,893,489 5,673,053 12,574,165 18,247,218 (12,353,729) 2,373,394 Lease Rentals Receivable and
Stock out on Hire 7,903,567 20,360,205 - 20,360,205 (12,456,638) 2,487,333 13,797,056 26,033,258 12,574,165 38,607,423 (24,810,367) 4,860,727
As at 31 March 2020 Maximum Exposure to Credit Risk
Movable Securities
Immovable Securities
Total Collateral
Net Exposure
Associated ECL
Rs. '000 Rs. '000 Rs. '000 Rs. '000 Rs. '000 Rs. '000
Loans and Receivables 4,273,929 3,755,674 10,456,698 14,212,372 (9,938,443) 1,940,218 Lease Rentals Receivable and
Stock out on Hire 9,069,309 22,301,171 - 22,301,171 (13,231,862) 2,223,973
13,343,238 26,056,845 10,456,698 36,513,543 (23,170,305) 4,164,191
Notes to the Financial Statements
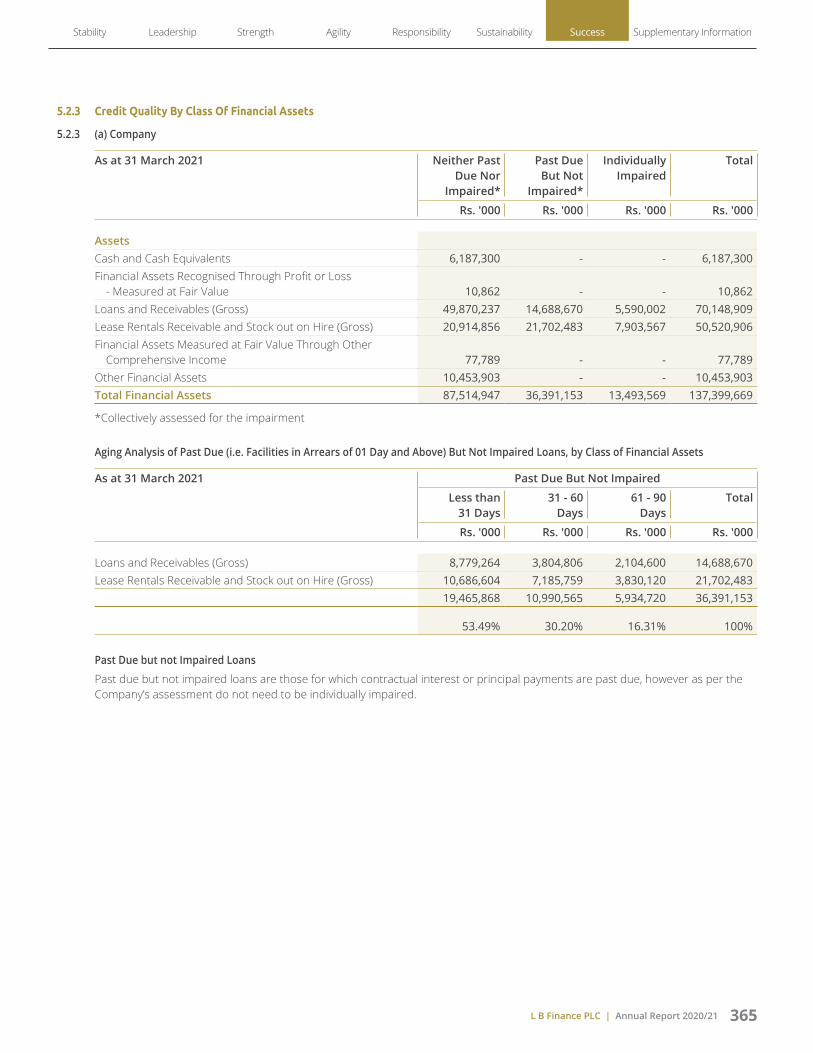
L B Finance PLC | Annual Report 2020/21 365
Stability Leadership Strength Agility Responsibility Sustainability Success Supplementary Information
5.2.3 Credit Quality By Class Of Financial Assets
5.2.3 (a) Company
As at 31 March 2021 Neither Past Due Nor Impaired*
Past Due But Not Impaired*
Individually Impaired
Total
Rs. '000 Rs. '000 Rs. '000 Rs. '000
AssetsCash and Cash Equivalents 6,187,300 - - 6,187,300 Financial Assets Recognised Through Profit or Loss
- Measured at Fair Value 10,862 - - 10,862 Loans and Receivables (Gross) 49,870,237 14,688,670 5,590,002 70,148,909 Lease Rentals Receivable and Stock out on Hire (Gross) 20,914,856 21,702,483 7,903,567 50,520,906 Financial Assets Measured at Fair Value Through Other
Comprehensive Income 77,789 - - 77,789 Other Financial Assets 10,453,903 - - 10,453,903 Total Financial Assets 87,514,947 36,391,153 13,493,569 137,399,669
*Collectively assessed for the impairment
Aging Analysis of Past Due (i.e. Facilities in Arrears of 01 Day and Above) But Not Impaired Loans, by Class of Financial Assets
As at 31 March 2021 Past Due But Not Impaired
Less than 31 Days
31 - 60 Days
61 - 90 Days
Total
Rs. '000 Rs. '000 Rs. '000 Rs. '000
Loans and Receivables (Gross) 8,779,264 3,804,806 2,104,600 14,688,670 Lease Rentals Receivable and Stock out on Hire (Gross) 10,686,604 7,185,759 3,830,120 21,702,483
19,465,868 10,990,565 5,934,720 36,391,153
53.49% 30.20% 16.31% 100%
Past Due but not Impaired Loans
Past due but not impaired loans are those for which contractual interest or principal payments are past due, however as per the Company’s assessment do not need to be individually impaired.
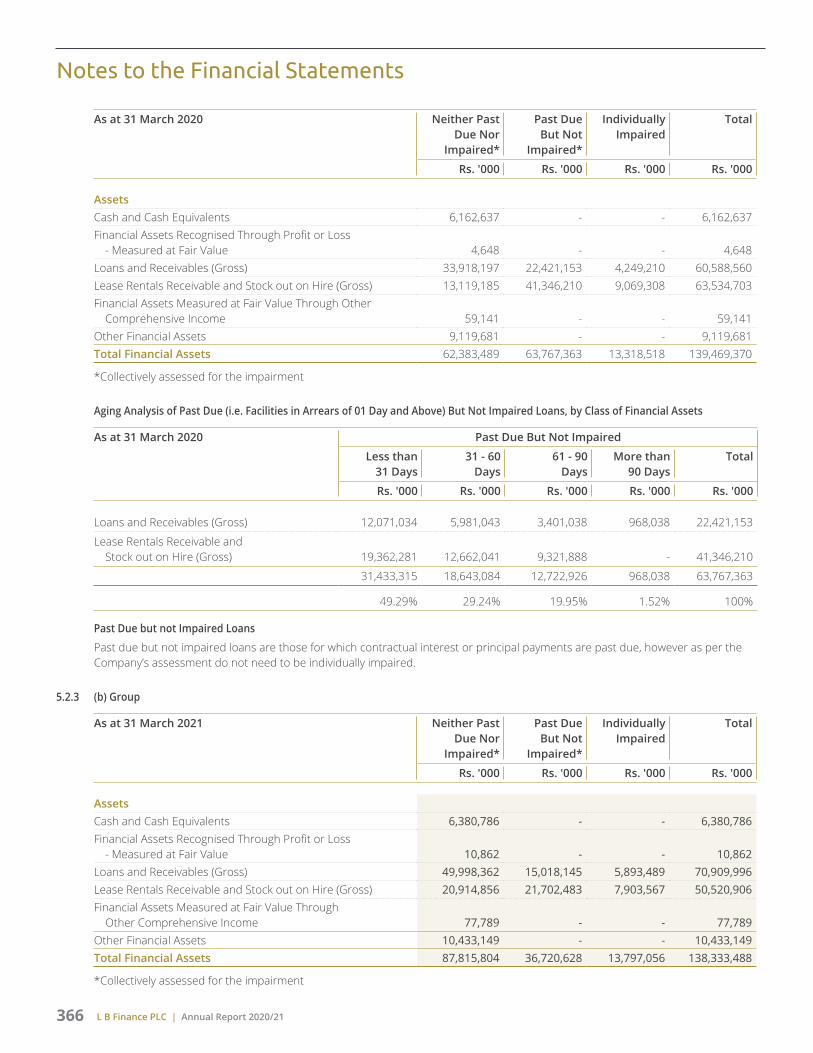
L B Finance PLC | Annual Report 2020/21366
As at 31 March 2020 Neither Past Due Nor Impaired*
Past Due But Not Impaired*
Individually Impaired
Total
Rs. '000 Rs. '000 Rs. '000 Rs. '000
AssetsCash and Cash Equivalents 6,162,637 - - 6,162,637 Financial Assets Recognised Through Profit or Loss
- Measured at Fair Value 4,648 - - 4,648 Loans and Receivables (Gross) 33,918,197 22,421,153 4,249,210 60,588,560 Lease Rentals Receivable and Stock out on Hire (Gross) 13,119,185 41,346,210 9,069,308 63,534,703 Financial Assets Measured at Fair Value Through Other
Comprehensive Income 59,141 - - 59,141 Other Financial Assets 9,119,681 - - 9,119,681 Total Financial Assets 62,383,489 63,767,363 13,318,518 139,469,370
*Collectively assessed for the impairment
Aging Analysis of Past Due (i.e. Facilities in Arrears of 01 Day and Above) But Not Impaired Loans, by Class of Financial Assets
As at 31 March 2020 Past Due But Not Impaired
Less than 31 Days
31 - 60 Days
61 - 90 Days
More than 90 Days
Total
Rs. '000 Rs. '000 Rs. '000 Rs. '000 Rs. '000
Loans and Receivables (Gross) 12,071,034 5,981,043 3,401,038 968,038 22,421,153
Lease Rentals Receivable and Stock out on Hire (Gross) 19,362,281 12,662,041 9,321,888 - 41,346,210
31,433,315 18,643,084 12,722,926 968,038 63,767,363
49.29% 29.24% 19.95% 1.52% 100%
Past Due but not Impaired Loans
Past due but not impaired loans are those for which contractual interest or principal payments are past due, however as per the Company’s assessment do not need to be individually impaired.
5.2.3 (b) Group
As at 31 March 2021 Neither Past Due Nor Impaired*
Past Due But Not Impaired*
Individually Impaired
Total
Rs. '000 Rs. '000 Rs. '000 Rs. '000
AssetsCash and Cash Equivalents 6,380,786 - - 6,380,786 Financial Assets Recognised Through Profit or Loss
- Measured at Fair Value 10,862 - - 10,862 Loans and Receivables (Gross) 49,998,362 15,018,145 5,893,489 70,909,996 Lease Rentals Receivable and Stock out on Hire (Gross) 20,914,856 21,702,483 7,903,567 50,520,906 Financial Assets Measured at Fair Value Through
Other Comprehensive Income 77,789 - - 77,789 Other Financial Assets 10,433,149 - - 10,433,149 Total Financial Assets 87,815,804 36,720,628 13,797,056 138,333,488
*Collectively assessed for the impairment
Notes to the Financial Statements

L B Finance PLC | Annual Report 2020/21 367
Stability Leadership Strength Agility Responsibility Sustainability Success Supplementary Information
Aging Analysis of Past Due (i.e. Facilities in Arrears of 01 Day and Above) But Not Impaired Loans, by Class of Financial Assets
As at 31 March 2021 Past Due But Not Impaired
Less than 31 Days
31 - 60 Days
61 - 90 Days
Total
Rs. '000 Rs. '000 Rs. '000 Rs. '000
Loans and Receivables (Gross) 8,897,843 3,914,138 2,206,164 15,018,145
Lease Rentals Receivable and Stock out on Hire (Gross) 10,686,604 7,185,759 3,830,120 21,702,483
19,584,447 11,099,897 6,036,284 36,720,628
0.53% 30.23% 16.44% 100%
Past Due but not Impaired Loans
Past due but not impaired loans are those for which contractual interest or principal payments are past due, however as per the Group’s assessment do not need to be individually impaired.
As at 31 March 2020 Neither Past Due Nor Impaired*
Past Due But Not Impaired*
Individually Impaired
Total
Rs. '000 Rs. '000 Rs. '000 Rs. '000
AssetsCash and Cash Equivalents 6,472,312 - - 6,472,312 Financial Assets Recognised Through Profit or Loss
- Measured at Fair Value 4,648 - - 4,648 Loans and Receivables (Gross) 34,471,513 22,430,940 4,273,929 61,176,382 Lease Rentals Receivable and Stock out on Hire (Gross) 13,119,185 41,346,210 9,069,308 63,534,703 Financial Assets Measured at Fair Value Through Other
Comprehensive Income 59,141 - - 59,141 Other Financial Assets 9,105,761 - - 9,105,761 Total Financial Assets 63,232,560 63,777,150 13,343,237 140,352,947
*Collectively assessed for the impairment
Aging Analysis of Past Due (i.e. Facilities in Arrears of 01 Day and Above) But Not Impaired Loans, by Class of Financial Assets
As at 31 March 2020 Past Due But Not Impaired
Less than 31 Days
31 - 60 Days
61 - 90 Days
More than 90 Days
Total
Rs. '000 Rs. '000 Rs. '000 Rs. '000 Rs. '000
Loans and Receivables (Gross) 12,075,802 5,983,943 3,403,157 968,038 22,430,940
Lease Rentals Receivable and Stock out on Hire (Gross) 19,362,281 12,662,041 9,321,888 - 41,346,210
31,438,083 18,645,984 12,725,045 968,038 63,777,150
49.29% 29.24% 19.95% 1.52% 100%
Past Due but not Impaired Loans
Past due but not impaired loans are those for which contractual interest or principal payments are past due, however as per the Group’s assessment do not need to be individually impaired.

L B Finance PLC | Annual Report 2020/21368
5.2.4 Concentration of Credit Risk
By setting various concentration limits under different criteria within the established risk appetite framework, the Group ensures that an acceptable level of risk diversification is maintained on an ongoing basis. These limits are monitored and reviewed by the Credit Committee, Risk Management Department and Integrated Risk Management Committee on a regular basis to capture the developments in market, regulatory and economic environment to strengthen the dynamic portfolio management practices and to provide an early warning on possible credit concentrations.
The Group monitors concentration of credit risk by sector and by geographic location. An analysis of risk concentration of financial assets based on industry sector and geographical location is given below.
5.2.4 (a) Industry-wise Concentration
The outbreak of COVID-19 pandemic highlighted the importance of maintaining a well-diversified portfolio mix through which adverse impact on a certain sector can be covered from the other unaffected sectors to minimise the overall impact on the resilience of the Company. Being a Domestic Systematically Important LFC (D-SILFC), Company has identified its wider responsibility and review the risk appetite and tolerance levels regularly by monitoring the business environment continuously to eliminate being exposed to risky asset classes and customer segments beyond the tolerance levels. This is a prudent measure taken by the Company to manage its concertation risk effectively.
The following table shows the risk concentration by industry for the components of the Statement of Financial Position.
As at 31 March 2021 - Company
Sector-wise Breakdown
Cash and Cash
Equivalents
Financial Assets Recognised
Through Profit or Loss
Loans and Receivables**
Lease Rentals Receivable and
Stock out on Hire**
Financial Assets Measured at Fair
Value Through OCI
Other Financial
Assets
Total Financial
Assets
Rs. '000 Rs. '000 Rs. '000 Rs. '000 Rs. '000 Rs. '000 Rs. '000
Agriculture - - 19,976,087 10,059,067 - - 30,035,154
Manufacturing - - 4,753,542 2,577,430 - - 7,330,972
Construction - - 786,401 806,707 - - 1,593,108
Financial Services 6,187,300 - 908,402 367,725 - 10,453,903 17,917,330
Trading - 10,862 9,765,924 8,667,853 77,789 - 18,522,428
Retail - - 62,602 - - - 62,602
Hotels - - 320,000 325,319 - - 645,319
Services - - 30,205,230 24,555,534 - - 54,760,764
Total 6,187,300 10,862 66,778,188 47,359,635 77,789 10,453,903 130,867,677
Notes to the Financial Statements

L B Finance PLC | Annual Report 2020/21 369
Stability Leadership Strength Agility Responsibility Sustainability Success Supplementary Information
5.2.4 (b) Province-wise Concentration
**Provincial breakdown for (01) Loans and receivable (02) Lease rentals receivable and Stock out on hire from customers within Sri Lanka is as follows;
As at 31 March 2021 - Company
Province Loans and Receivables
Lease Rentals Receivable and Stock out on Hire
Total
Rs. '000 Rs. '000 Rs. '000
Central 4,801,897 5,227,412 10,029,309
Eastern 3,851,440 1,637,653 5,489,093
North Central 2,310,614 2,473,851 4,784,465
North Western 4,618,716 5,497,555 10,116,271
Northern 4,480,713 304,099 4,784,812
Sabaragamuwa 1,334,843 603,998 1,938,841
Southern 6,003,133 8,157,549 14,160,682
Uva 2,227,308 1,920,384 4,147,692
Western 37,149,524 21,537,134 58,686,658
Total 66,778,188 47,359,635 114,137,823
5.2.4 (c) Industry-wise Concentration
The following table shows the risk concentration by industry for the components of the Statement of Financial Position.
As at 31 March 2020 - Company
Sector-wise Breakdown
Cash and Cash
Equivalents
Financial Assets Recognised
Through Profit or Loss
Loans and Receivables**
Lease Rentals Receivable and
Stock out on Hire**
Financial Assets Measured at Fair
Value Through OCI
Other Financial
Assets
Total Financial
Assets
Rs. '000 Rs. '000 Rs. '000 Rs. '000 Rs. '000 Rs. '000 Rs. '000
Agriculture - - 16,903,093 11,834,506 - - 28,737,599
Manufacturing - - 3,968,130 2,693,123 - - 6,661,253
Construction - - 634,244 802,636 - - 1,436,880
Financial Services 6,162,637 - 954,295 481,768 - 9,119,681 16,718,381
Trading - 4,648 8,148,338 10,843,427 59,141 - 19,055,554
Retail - - 373,638 - - - 373,638
Hotels - - 341,044 501,470 - - 842,514
Services - - 26,916,472 33,469,740 - - 60,386,212
Total 6,162,637 4,648 58,239,254 60,626,670 59,141 9,119,681 134,212,031

L B Finance PLC | Annual Report 2020/21370
5.2.4 (d) Province-wise Concentration
**Provincial breakdown for (01) Loans and receivable (02) Lease rentals receivable and Stock out on hire from customers within Sri Lanka is as follows;
As at 31 March 2020 - Company
Province Loans and Receivables
Lease Rentals Receivable and Stock out on Hire
Total
Rs. '000 Rs. '000 Rs. '000
Central 4,119,520 6,645,701 10,765,221
Eastern 3,494,145 2,054,973 5,549,118
North Central 1,611,875 2,799,504 4,411,379
North Western 3,904,801 6,673,848 10,578,649
Northern 3,892,228 339,678 4,231,906
Sabaragamuwa 1,108,111 1,041,532 2,149,643
Southern 4,921,042 9,373,772 14,294,814
Uva 1,827,884 2,292,002 4,119,886
Western 33,359,648 29,405,660 62,765,308
Total 58,239,254 60,626,670 118,865,924
5.2.4 (e) Industry-wise Concentration
The following table shows the risk concentration by industry for the components of the Statement of Financial Position.
As at 31 March 2021 - Group
Sector-wise Breakdown
Cash and Cash
Equivalents
Financial Assets Recognised
Through Profit or Loss
Loans and Receivables**
Lease Rentals Receivable and
Stock out on Hire**
Financial Assets Measured at Fair
Value Through OCI
Other Financial
Assets
Total Financial
Assets
Rs. '000 Rs. '000 Rs. '000 Rs. '000 Rs. '000 Rs. '000 Rs. '000
Agriculture - - 20,664,480 10,059,067 - - 30,723,547
Manufacturing - - 4,753,542 2,577,430 - - 7,330,972
Construction - - 786,401 806,707 - - 1,593,108
Financial Services 6,380,786 - 908,402 367,725 - 10,433,149 18,090,062
Trading - 10,862 9,765,924 8,667,853 77,789 - 18,522,428
Retail - - 62,602 - - - 62,602
Hotels - - 320,000 325,319 - - 645,319
Services - - 30,205,230 24,555,534 - - 54,760,764
Total 6,380,786 10,862 67,466,581 47,359,635 77,789 10,433,149 131,728,802
Notes to the Financial Statements

L B Finance PLC | Annual Report 2020/21 371
Stability Leadership Strength Agility Responsibility Sustainability Success Supplementary Information
5.2.4 (f) Geographical Concentration
**Geographical breakdown for (01) Loans and receivable (02) Lease rentals receivable and Stock out on hire from customers is as follows;
As at 31 March 2021 - Group
Province/Country Loans and Receivables
Lease Rentals Receivable and Stock out on Hire
Total
Rs. '000 Rs. '000 Rs. '000
Central 4,801,897 5,227,412 10,029,309
Eastern 3,851,440 1,637,653 5,489,093
North Central 2,310,614 2,473,851 4,784,465
North Western 4,618,716 5,497,555 10,116,271
Northern 4,480,713 304,099 4,784,812
Sabaragamuwa 1,334,843 603,998 1,938,841
Southern 6,003,133 8,157,549 14,160,682
Uva 2,227,308 1,920,384 4,147,692
Western 37,149,524 21,537,134 58,686,658
Myanmar 688,393 - 688,393
Total 67,466,581 47,359,635 114,826,216
5.2.4 (g) Industry-wise Concentration
The following table shows the risk concentration by industry for the components of the Statement of Financial Position.
As at 31 March 2020 - Group
Sector-wise Breakdown
Cash and Cash
Equivalents
Financial Assets Recognised
Through Profit or Loss
Loans and Receivables**
Lease Rentals Receivable and
Stock out on Hire**
Financial Assets Measured at Fair
Value Through OCI
Other Financial
Assets
Total Financial
Assets
Rs. '000 Rs. '000 Rs. '000 Rs. '000 Rs. '000 Rs. '000 Rs. '000
Agriculture - - 17,457,183 11,834,506 - - 29,291,689
Manufacturing - - 3,968,130 2,693,123 - - 6,661,253
Construction - - 634,244 802,636 - - 1,436,880
Financial Services 6,472,312 - 954,295 481,768 - 9,105,761 17,014,136
Trading - 4,648 8,148,338 10,843,427 59,141 - 19,055,554
Retail - - 373,638 - - - 373,638
Hotels - - 341,044 501,470 - - 842,514
Services - - 26,916,472 33,469,740 - - 60,386,212
Total 6,472,312 4,648 58,793,344 60,626,670 59,141 9,105,761 135,061,876

L B Finance PLC | Annual Report 2020/21372
5.2.4 (h) Geographical Concentration
**Geographical breakdown for (01) Loans and receivable (02) Lease rentals receivable and Stock out on hire from customers is as follows;
As at 31 March 2020 - Group
Province/Country Loans and Receivables
Lease Rentals Receivable and Stock out on Hire
Total
Rs. '000 Rs. '000 Rs. '000
Central 4,119,520 6,645,701 10,765,221 Eastern 3,494,145 2,054,973 5,549,118 North Central 1,611,875 2,799,504 4,411,379 North Western 3,904,801 6,673,848 10,578,649 Northern 3,892,228 339,678 4,231,906 Sabaragamuwa 1,108,111 1,041,532 2,149,643 Southern 4,921,042 9,373,772 14,294,814 Uva 1,827,884 2,292,002 4,119,886 Western 33,359,648 29,405,660 62,765,308 Myanmar 554,090 - 554,090 Total 58,793,344 60,626,670 119,420,014
5.3 LIQUIDITY RISK AND FUNDING MANAGEMENT
In the context of a financial institution, liquidity risk arises primarily due to mismatches in the maturity profile of assets and liabilities. Liquidity risk for a financial institution can take two forms; market liquidity and funding liquidity risk.
Market liquidity risk is the inability to easily exit a position. Group’s market liquidity risk is low if assets can be liquidated without moving the price too much.
Funding liquidity risk means the Group’s inability to finance assets continuously at an acceptable borrowing rate. Funding liquidity risk generally arises when creditors either withdraw credit or change the terms on which it is granted in such a way they are no longer profitable. Funding liquidity risk would increase if the Group’s credit quality is, or at least perceived to be, deteriorating, but also because financial conditions as a whole are deteriorating.
The Group’s primary objective in liquidity risk management is to ensure adequate funding for its businesses throughout market cycles, including periods of financial stress. To achieve this objective the Group regularly monitors liquidity position and maintain an adequate buffer of liquid assets. Group also maintains access to diverse funding sources to meet unforeseen liquidity requirements. All statutory and prudent liquidity ratios are monitored against tolerance limits and stress testing is carried out regularly to assess the effectiveness of liquidity management. With the onset of COVID-19 pandemic in late March and its second wave in October 2020, the Group introduced more rigour to the processes already in place to manage its liquid assets. While closely monitoring any developments related to the pandemic, it has continued to keep its risk management measures under review to readily respond to changing circumstances. Further, the group has taken prudent measures to increase its liquidity buffers and maintained a strong excess liquidity position throughout the year under review. The Group is comfortable with its existing buffer of liquid assets. The actions taken will help to maintain existing liquidity position while mitigating any disruptive effect on liquidity that may arise due to the continuously evolving nature of the pandemic.
Assets and Liability Management Committee (ALCO)
ALCO is chaired by the Managing Director and comprises of Deputy Managing Director, Executive Directors, representatives from Treasury Department, Fixed Deposits, the Assistant General Manager-Finance and the Head of Risk Management. The Committee meets regularly and make all policy decisions with regard to funding matters, duration management of assets and liabilities and investments, to keep the liquidity at healthy levels, whilst satisfying regulatory requirements. ALCO closely monitors any developments related to the COVID-19 pandemic and reviews measures undertaken by the Group in response to resulting risk. These actions has helped the Group maintain it’s existing liquidity position while mitigating any adverse effect on its asset liability position that may arise due to the continuously evolving nature of the pandemic.
Notes to the Financial Statements

L B Finance PLC | Annual Report 2020/21 373
Stability Leadership Strength Agility Responsibility Sustainability Success Supplementary Information
5.3.1 ANALYSIS OF LIQUIDITY RISK EXPOSURE
5.3.1 (a) The table below summarises the maturity profile of the undiscounted cash flows of the Company’s financial assets and liabilities as at 31 March 2021.
The table does not reflect the expected cash flows indicated by its deposit retention history and loan recovery patterns. The estimated maturity profiles of undiscounted cash flows may also differ, due to rollover of loans and advances and COVID-19 related events.
As at 31 March 2021 - Company On Demand Less than 3 Months
3 - 12 Months
1 - 5 Years
Over 5 Years
Total
Rs. '000 Rs. '000 Rs. '000 Rs. '000 Rs. '000 Rs. '000
Financial Assets
Cash and Cash Equivalents 2,787,635 3,399,665 - - - 6,187,300
Financial Assets Recognised Through Profit or Loss 10,862 - - - - 10,862
Loans and Receivables 8,606,882 31,370,459 16,373,255 23,314,658 2,459,566 82,124,820
Lease Rentals Receivable and Stock out on Hire 4,417,018 6,724,062 18,236,573 35,691,618 5,925 65,075,196
Financial Assets Measured at Fair Value Through Other Comprehensive Income 77,789 - - - - 77,789
Other Financial Assets 412,504 3,243,829 7,064,079 - - 10,720,412
Total Financial Assets 16,312,690 44,738,015 41,673,907 59,006,276 2,465,491 164,196,379
Financial Liabilities
Due to Banks 988,099 1,370,864 7,568,565 8,146,773 - 18,074,301
Due to Depositors 12,423,232 16,416,604 46,735,233 15,251,257 - 90,826,326
Debt Instruments Issued and Other Borrowed Funds - 195,651 196,788 3,392,500 - 3,784,939
Other Financial Liabilities 1,602,562 74,269 235,309 1,441,057 393,336 3,746,533
Total Financial Liabilities 15,013,893 18,057,388 54,735,895 28,231,587 393,336 116,432,099
Total Net Financial Assets/(Liabilities) 1,994,491 25,984,933 (13,061,988) 30,774,689 2,072,155 47,764,280

L B Finance PLC | Annual Report 2020/21374
5.3.1 (b) The table below summarises the maturity profile of the undiscounted cash flows of the Company’s financial assets and liabilities as at 31 March 2020.
The table does not reflect the expected cash flows indicated by its deposit retention history and loan recovery patterns.
As at 31 March 2020 - Company On Demand Less than 3 Months
3 - 12 Months
1 - 5 Years
Over 5 Years
Total
Rs. '000 Rs. '000 Rs. '000 Rs. '000 Rs. '000 Rs. '000
Financial Assets
Cash and Cash Equivalents 4,619,793 1,542,844 - - - 6,162,637
Financial Assets Recognised Through Profit or Loss 4,648 - - - - 4,648
Loans and Receivables 11,594,373 23,622,717 14,943,052 19,459,546 2,432,744 72,052,432
Lease Rentals Receivable and Stock out on Hire 5,629,677 8,541,583 22,927,722 46,402,437 29,862 83,531,281
Financial Assets Measured at Fair Value Through Other Comprehensive Income 59,141 - - - - 59,141
Other Financial Assets 230,017 1,205,999 8,179,481 - - 9,615,497
Total Financial Assets 22,137,649 34,913,143 46,050,255 65,861,983 2,462,606 171,425,636
Financial Liabilities
Due to Banks 720,411 1,997,670 6,598,117 18,711,345 149,444 28,176,987
Due to Depositors 3,484,076 26,520,127 49,434,932 16,890,892 - 96,330,027
Debt Instruments Issued and Other Borrowed Funds - 196,250 196,312 3,784,938 - 4,177,500
Other Financial Liabilities 1,444,956 65,777 205,228 1,074,051 686,448 3,476,460
Total Financial Liabilities 5,649,443 28,779,824 56,434,589 40,461,226 835,892 132,160,974
Total Net Financial Assets/(Liabilities) 16,488,206 6,133,319 (10,384,334) 25,400,757 1,626,714 39,264,662
Notes to the Financial Statements

L B Finance PLC | Annual Report 2020/21 375
Stability Leadership Strength Agility Responsibility Sustainability Success Supplementary Information
5.3.1 (c) The table below summarises the maturity profile of the undiscounted cash flows of the Group’s financial assets and liabilities as at 31 March 2021.
The table does not reflect the expected cash flows indicated by its deposit retention history and loan recovery patterns. The estimated maturity profiles of undiscounted cash flows may also differ, due to rollover of loans and advances and COVID-19 related events.
As at 31 March 2021 - Group On Demand Less than 3 Months
3 - 12 Months
1 - 5 Years
Over 5 Years
Total
Rs. '000 Rs. '000 Rs. '000 Rs. '000 Rs. '000 Rs. '000
Financial Assets
Cash and Cash Equivalents 2,981,121 3,399,665 - - - 6,380,786
Financial Assets Recognised Through Profit or Loss 10,862 - - - - 10,862
Loans and Receivables 8,895,653 31,587,748 16,663,261 23,335,362 2,459,566 82,941,590
Lease Rentals Receivable and Stock out on Hire 4,417,018 6,724,062 18,236,573 35,691,618 5,925 65,075,196
Financial Assets Measured at Fair Value Through Other Comprehensive Income 77,789 - - - - 77,789
Other Financial Assets 391,750 3,243,829 7,064,079 - - 10,699,658
Total Financial Assets 16,774,193 44,955,304 41,963,913 59,026,980 2,465,491 165,185,881
Financial Liabilities
Due to Banks 988,099 1,373,564 7,631,127 8,146,773 - 18,139,563
Due to Depositors 12,503,374 16,416,604 46,735,233 15,251,257 - 90,906,468
Debt Instruments Issued and Other Borrowed Funds - 195,651 196,788 3,392,500 - 3,784,939
Other Financial Liabilities 1,603,375 74,269 235,309 1,441,057 393,336 3,747,346
Total Financial Liabilities 15,094,848 18,060,088 54,798,457 28,231,587 393,336 116,578,316
Total Net Financial Assets/(Liabilities) 2,375,039 26,199,522 (12,834,544) 30,795,393 2,072,155 48,607,565

L B Finance PLC | Annual Report 2020/21376
5.3.1 (d) The table below summarises the maturity profile of the undiscounted cash flows of the Group’s financial assets and liabilities as at 31 March 2020.
The table does not reflect the expected cash flows indicated by its deposit retention history and loan recovery patterns.
As at 31 March 2020 - Group On Demand Less than 3 Months
3 - 12 Months
1 - 5 Years
Over 5 Years
Total
Rs. '000 Rs. '000 Rs. '000 Rs. '000 Rs. '000 Rs. '000
Financial Assets
Cash and Cash Equivalents 4,929,468 1,546,143 - - - 6,475,611
Financial Assets Recognised Through Profit or Loss 4,648 - - - - 4,648
Loans and Receivables 11,573,838 23,851,736 15,328,964 19,487,327 2,432,744 72,674,609
Lease Rentals Receivable and Stock out on Hire 5,629,677 8,541,583 22,927,722 46,402,437 29,862 83,531,281
Financial Assets Measured at Fair Value Through Other Comprehensive Income 59,141 - - - - 59,141
Other Financial Assets 216,097 1,205,999 8,179,481 - - 9,601,577
Total Financial Assets 22,412,869 35,145,461 46,436,167 65,889,764 2,462,606 172,346,867
Financial Liabilities
Due to Banks 832,267 2,001,146 6,660,604 18,773,445 149,444 28,416,906
Due to Depositors 3,542,738 26,520,127 49,434,932 16,890,892 - 96,388,689
Debt Instruments Issued and Other Borrowed Funds - 196,250 196,312 3,784,938 - 4,177,500
Other Financial Liabilities 1,445,321 65,777 205,228 1,074,051 686,448 3,476,825
Total Financial Liabilities 5,820,326 28,783,300 56,497,076 40,523,326 835,892 132,459,920
Total Net Financial Assets/(Liabilities) 16,592,543 6,362,161 (10,060,909) 25,366,438 1,626,714 39,886,947
Notes to the Financial Statements

L B Finance PLC | Annual Report 2020/21 377
Stability Leadership Strength Agility Responsibility Sustainability Success Supplementary Information
5.3.2 Contractual Maturities of Commitments and Contingencies
The table below shows the contractual expiry by maturity of the Company/Group’s contingent liabilities and commitments. Each undrawn loan commitment is included in the time band containing the earliest date it can be drawn down. For issued financial guarantee contracts, the maximum amount of the guarantee is allocated to the earliest period in which the guarantee could be called.
As at 31 March 2021 - Company On Demand Less than 3 Months
3 - 12 Months
1 - 5 Years
Over 5 Years
Total
Rs. '000 Rs. '000 Rs. '000 Rs. '000 Rs. '000 Rs. '000
Contingent Liabilities
Guarantees Issued to Banks and Other Institutions - 5,000 28,800 - - 33,800
Counter Indemnity Issued to Banks for Guarantees - - - 198,441 - 198,441
Total Contingent Liabilities - 5,000 28,800 198,441 - 232,241
Commitments
Commitment for Unutilised Facilities 671,312 - - - - 671,312
Total Commitments 671,312 - - - - 671,312
Total Commitments and Contingencies 671,312 5,000 28,800 198,441 - 903,553
As at 31 March 2020 - Company On Demand Less than 3 Months
3 - 12 Months
1 - 5 Years
Over 5 Years
Total
Rs. '000 Rs. '000 Rs. '000 Rs. '000 Rs. '000 Rs. '000
Contingent Liabilities
Guarantees Issued to Banks and Other Institutions - 4,000 8,570 - - 12,570
Counter Indemnity Issued to Banks for Guarantees - - - 188,058 - 188,058
Import LC and Ordinary Guarantees 83,753 - - - - 83,753
Total Contingent Liabilities 83,753 4,000 8,570 188,058 - 284,381
Commitments
Commitment for Unutilised Facilities 1,644,424 - - - - 1,644,424
Total Commitments 1,644,424 - - - - 1,644,424
Total Commitments and Contingencies 1,728,177 4,000 8,570 188,058 - 1,928,805
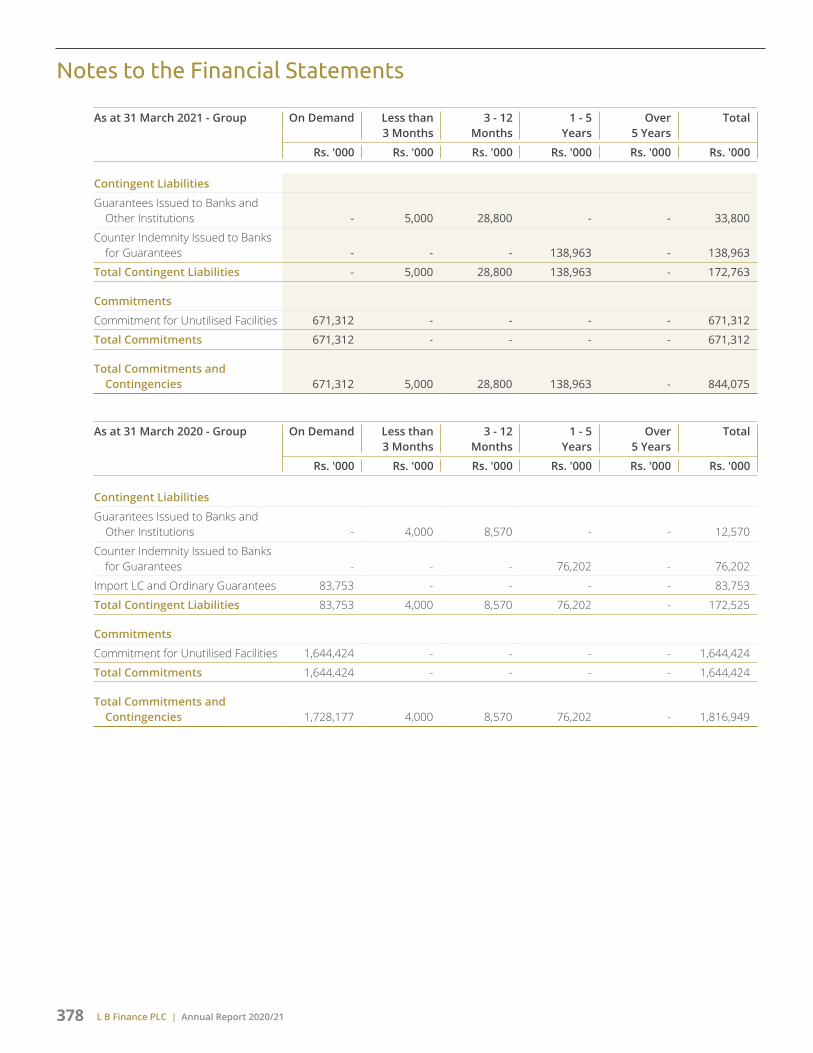
L B Finance PLC | Annual Report 2020/21378
As at 31 March 2021 - Group On Demand Less than 3 Months
3 - 12 Months
1 - 5 Years
Over 5 Years
Total
Rs. '000 Rs. '000 Rs. '000 Rs. '000 Rs. '000 Rs. '000
Contingent Liabilities
Guarantees Issued to Banks and Other Institutions - 5,000 28,800 - - 33,800
Counter Indemnity Issued to Banks for Guarantees - - - 138,963 - 138,963
Total Contingent Liabilities - 5,000 28,800 138,963 - 172,763
Commitments
Commitment for Unutilised Facilities 671,312 - - - - 671,312
Total Commitments 671,312 - - - - 671,312
Total Commitments and Contingencies 671,312 5,000 28,800 138,963 - 844,075
As at 31 March 2020 - Group On Demand Less than 3 Months
3 - 12 Months
1 - 5 Years
Over 5 Years
Total
Rs. '000 Rs. '000 Rs. '000 Rs. '000 Rs. '000 Rs. '000
Contingent Liabilities
Guarantees Issued to Banks and Other Institutions - 4,000 8,570 - - 12,570
Counter Indemnity Issued to Banks for Guarantees - - - 76,202 - 76,202
Import LC and Ordinary Guarantees 83,753 - - - - 83,753
Total Contingent Liabilities 83,753 4,000 8,570 76,202 - 172,525
Commitments
Commitment for Unutilised Facilities 1,644,424 - - - - 1,644,424
Total Commitments 1,644,424 - - - - 1,644,424
Total Commitments and Contingencies 1,728,177 4,000 8,570 76,202 - 1,816,949
Notes to the Financial Statements

L B Finance PLC | Annual Report 2020/21 379
Stability Leadership Strength Agility Responsibility Sustainability Success Supplementary Information
5.3.3 Liquidity Reserves
The table below sets out the components of the Company’s liquidity reserves;
As at 31 March 2021 2020
Carrying Amount
Fair Value
Carrying Amount
Fair Value
Rs. '000 Rs. '000 Rs. '000 Rs. '000
Notes and Coins Held 1,126,735 1,126,735 936,075 936,075 Balances with Banks 1,660,900 1,660,900 3,683,718 3,683,718 Treasury Bills Repurchase Agreements (Less than 03 Months) 3,399,665 3,399,665 1,542,844 1,542,844 Treasury Bills Repurchase Agreements (More than 03 Months) 3,537,745 3,537,745 5,462,735 5,462,735 Investment in Fixed Deposits 6,503,654 6,503,654 3,426,929 3,426,929 Total Liquidity Reserves 16,228,699 16,228,699 15,052,301 15,052,301
5.3.4 Financial Assets Available For Future Funding
The total financial assets recognised in the statement of financial position as at 31 March 2021 and 2020 that can be use for the future funding is shown in the following tables;
As at 31 March 2021 - Company Encumbered Unencumbered
Pledged as Collateral
Other Available as Collateral
Other Total
Rs. '000 Rs. '000 Rs. '000 Rs. '000 Rs. '000
Cash and Cash Equivalents - 3,406,500 2,780,800 - 6,187,300
Financial Assets Recognised Through Profit or Loss - Measured at Fair Value - - 10,862 - 10,862
Financial Assets at Amortised Cost - Loans and Receivables 4,339,514 - 62,438,673 - 66,778,188
Financial Assets at Amortised Cost - Lease Rentals Receivable and Stock out on Hire 15,035,388 - 32,324,247 - 47,359,635
Financial Assets Measured at Fair Value Through Other Comprehensive Income - - 77,789 - 77,789
Other Financial Assets - 3,756,500 6,284,898 412,504 10,453,903
Total 19,374,902 7,163,000 103,917,270 412,504 130,867,677

L B Finance PLC | Annual Report 2020/21380
As at 31 March 2020 - Company Encumbered Unencumbered
Pledged as Collateral
Other Available as Collateral
Other Total
Rs. '000 Rs. '000 Rs. '000 Rs. '000 Rs. '000
Cash and Cash Equivalents - 2,113,237 4,049,400 - 6,162,637
Financial Assets Recognised Through Profit or Loss - Measured at Fair Value - - 4,648 - 4,648
Financial Assets at Amortised Cost - Loans and Receivables - - 58,239,254 - 58,239,254
Financial Assets at Amortised Cost - Lease Rentals Receivable and Stock out on Hire 24,730,786 - 35,895,884 - 60,626,670
Financial Assets Measured at Fair Value Through Other Comprehensive Income - - 59,141 - 59,141
Other Financial Assets - 6,090,600 2,799,064 230,017 9,119,681
Total 24,730,786 8,203,837 101,047,391 230,017 134,212,031
5.4 MARKET RISK
Market risk refers to the possible losses to the Group that could arise from changes in market variables like interest rates, exchange rates, equity prices and commodity prices. Among them, interest rate risk has been identified as the most critical risk given Group’s nature of business.
5.4.1 Interest Rate Risk
Interest rate risk is a key constitute of the market risk exposure of the Group due to adverse and unanticipated movements in future interest rate which arises from core business activities; disbursing of credit facilities, accepting deposits and issuing debt instruments.
Due to the nature of operations of the Group, the impact of interest rate risk is mainly on the earnings of the Group rather than the market value of portfolios.
Excessive movements in market interest rate could result in severe volatility to Group’s net interest income and net interest margin. Group’s exposure to interest rate risk is primarily associated with factors such as;
Reprising risk arising from a fixed rate borrowing portfolio, where reprising frequency is different to that of the lending portfolio.
Yield curve risk arising from unanticipated shifts of the market yield curve.
Interest rate risk is managed principally through minimising interest rate sensitive asset liability gaps. In order to ensure interest rate margin and spreads are maintained, the Group conducts periodic reviews and reprices its assets accordingly.
The Management is closely scrutinising the impact on NII/NIMs resulting from interest rate related relief measures announced by CBSL to the COVID-19 affected groups.
5.4.2 Commodity Price Risk
Commodity price risk refers to the uncertainties of future market values and of the size of the future income, caused by the fluctuation in the prices of commodities. Given the significance of the Gold Loans business to Group’s overall loan book, sharp fluctuations to the gold prices could have an adverse impact to earnings. Gold price fluctuations lead to market risk which is the primary source of credit risk associated with this product.
Notes to the Financial Statements
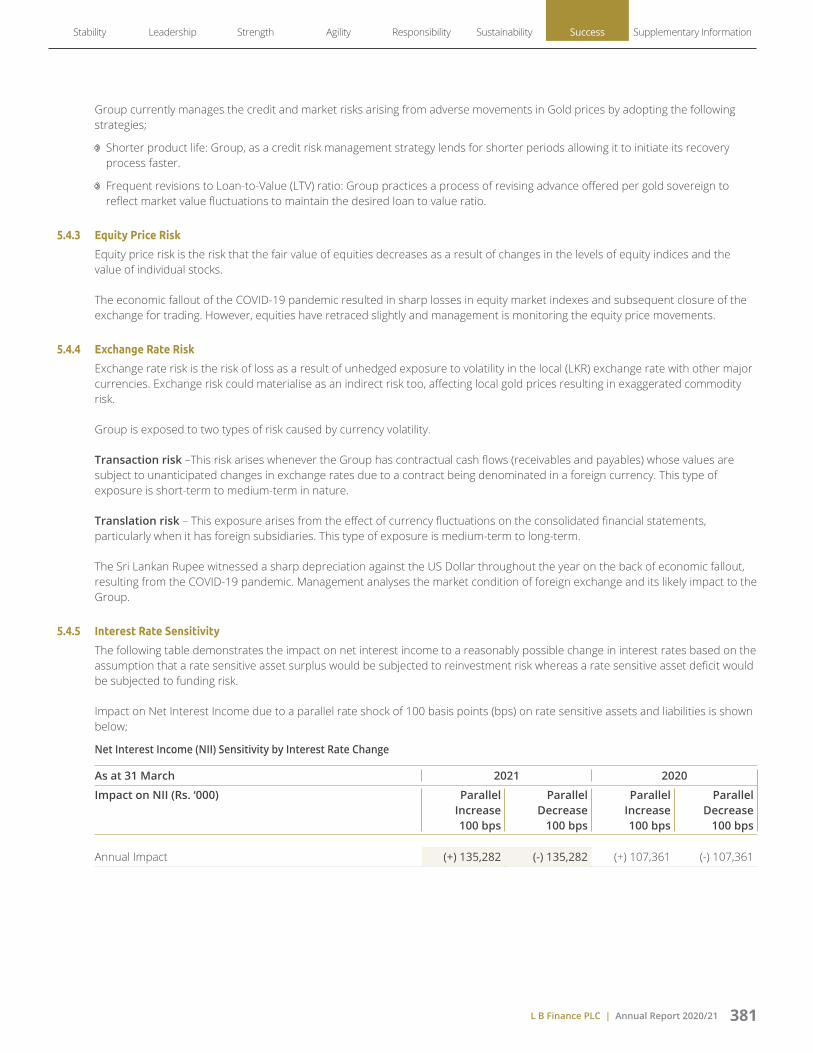
L B Finance PLC | Annual Report 2020/21 381
Stability Leadership Strength Agility Responsibility Sustainability Success Supplementary Information
Group currently manages the credit and market risks arising from adverse movements in Gold prices by adopting the following strategies;
Shorter product life: Group, as a credit risk management strategy lends for shorter periods allowing it to initiate its recovery process faster.
Frequent revisions to Loan-to-Value (LTV) ratio: Group practices a process of revising advance offered per gold sovereign to reflect market value fluctuations to maintain the desired loan to value ratio.
5.4.3 Equity Price Risk
Equity price risk is the risk that the fair value of equities decreases as a result of changes in the levels of equity indices and the value of individual stocks.
The economic fallout of the COVID-19 pandemic resulted in sharp losses in equity market indexes and subsequent closure of the exchange for trading. However, equities have retraced slightly and management is monitoring the equity price movements.
5.4.4 Exchange Rate Risk
Exchange rate risk is the risk of loss as a result of unhedged exposure to volatility in the local (LKR) exchange rate with other major currencies. Exchange risk could materialise as an indirect risk too, affecting local gold prices resulting in exaggerated commodity risk.
Group is exposed to two types of risk caused by currency volatility.
Transaction risk –This risk arises whenever the Group has contractual cash flows (receivables and payables) whose values are subject to unanticipated changes in exchange rates due to a contract being denominated in a foreign currency. This type of exposure is short-term to medium-term in nature.
Translation risk – This exposure arises from the effect of currency fluctuations on the consolidated financial statements, particularly when it has foreign subsidiaries. This type of exposure is medium-term to long-term.
The Sri Lankan Rupee witnessed a sharp depreciation against the US Dollar throughout the year on the back of economic fallout, resulting from the COVID-19 pandemic. Management analyses the market condition of foreign exchange and its likely impact to the Group.
5.4.5 Interest Rate Sensitivity
The following table demonstrates the impact on net interest income to a reasonably possible change in interest rates based on the assumption that a rate sensitive asset surplus would be subjected to reinvestment risk whereas a rate sensitive asset deficit would be subjected to funding risk.
Impact on Net Interest Income due to a parallel rate shock of 100 basis points (bps) on rate sensitive assets and liabilities is shown below;
Net Interest Income (NII) Sensitivity by Interest Rate Change
As at 31 March 2021 2020
Impact on NII (Rs. ‘000) Parallel Increase 100 bps
Parallel Decrease 100 bps
Parallel Increase 100 bps
Parallel Decrease
100 bps
Annual Impact (+) 135,282 (-) 135,282 (+) 107,361 (-) 107,361

L B Finance PLC | Annual Report 2020/21382
5.4.6 Interest Rate Risk Exposure on Financial Assets and Liabilities
5.4.6 (a) The table below analyses the Company’s interest rate risk exposure on financial assets and liabilities. The Company’s assets and liabilities are included at carrying amount and categorised by the earlier of contractual reprising or maturity dates.
As at 31 March 2021 - Company Up to 3 Months
3 - 12 Months
1 - 3 Years
3 - 5 Years
Over 5 Years
Non-Interest Sensitive
Total
Rs. '000 Rs. '000 Rs. '000 Rs. '000 Rs. '000 Rs. '000
Financial Assets
Cash and Cash Equivalents 5,060,565 - - - - 1,126,735 6,187,300
Financial Assets Recognised Through Profit or Loss - - - - - 10,862 10,862
Loans and Receivables 43,200,238 10,142,110 9,483,643 3,840,917 111,280 - 66,778,188
Lease Rentals Receivable and Stock out on Hire 8,218,232 12,025,759 21,964,625 5,145,759 5,260 - 47,359,635
Financial Assets Measured at Fair Value Through Other Comprehensive Income - - - - - 77,789 77,789
Other Financial Assets 3,210,631 6,830,767 - - - 412,505 10,453,903
59,689,666 28,998,636 31,448,268 8,986,676 116,540 1,627,891 130,867,677
Financial Liabilities
Due to Banks 7,742,186 4,645,189 4,079,804 - - - 16,467,179
Due to Depositors 28,084,670 44,238,780 12,034,344 1,502,276 - - 85,860,070
Debt Instruments Issued and Other Borrowed Funds - 116,224 2,997,692 - - - 3,113,916
Other Financial Liabilities 31,679 113,850 346,231 417,999 531,206 1,602,561 3,043,526
35,858,535 49,114,043 19,458,071 1,920,275 531,206 1,602,561 108,484,691
Interest Sensitivity Gap 23,831,131 (20,115,407) 11,990,197 7,066,401 (414,666) 25,330 22,382,986
Notes to the Financial Statements

L B Finance PLC | Annual Report 2020/21 383
Stability Leadership Strength Agility Responsibility Sustainability Success Supplementary Information
5.4.6 (b) The table below analyses the Company’s interest rate risk exposure on financial assets and liabilities. The Company’s assets and liabilities are included at carrying amount and categorised by the earlier of contractual repricing or maturity dates.
As at 31 March 2020 - Company Up to 3 Months
3 - 12 Months
1 - 3 Years
3 - 5 Years
Over 5 Years
Non-Interest Sensitive
Total
Rs. '000 Rs. '000 Rs. '000 Rs. '000 Rs. '000 Rs. '000
Financial Assets
Cash and Cash Equivalents 5,226,562 - - - - 936,075 6,162,637
Financial Assets Recognised Through Profit or Loss - - - - - 4,648 4,648
Loans and Receivables 39,056,629 8,522,903 7,321,665 3,153,889 184,168 - 58,239,254
Lease Rentals Receivable and Stock out on Hire 10,787,921 14,857,420 27,915,981 7,038,637 26,711 - 60,626,670
Financial Assets Measured at Fair Value Through Other Comprehensive Income - - - - - 59,141 59,141
Other Financial Assets 1,187,806 7,701,858 - - - 230,017 9,119,681
56,258,918 31,082,181 35,237,646 10,192,526 210,879 1,229,881 134,212,031
Financial Liabilities
Due to Banks 6,990,130 3,989,108 9,167,247 2,624,600 - - 22,771,085
Due to Depositors 29,052,814 45,672,223 13,210,448 1,320,950 - - 89,256,435
Debt Instruments Issued and Other Borrowed Funds 119,241 (2,630) 2,994,575 - - - 3,111,186
Other Financial Liabilities 26,236 91,757 295,632 341,287 566,542 1,444,956 2,766,410
36,188,421 49,750,458 25,667,902 4,286,837 566,542 1,444,956 117,905,116
Interest Sensitivity Gap 20,070,497 (18,668,277) 9,569,744 5,905,689 (355,663) (215,075) 16,306,915
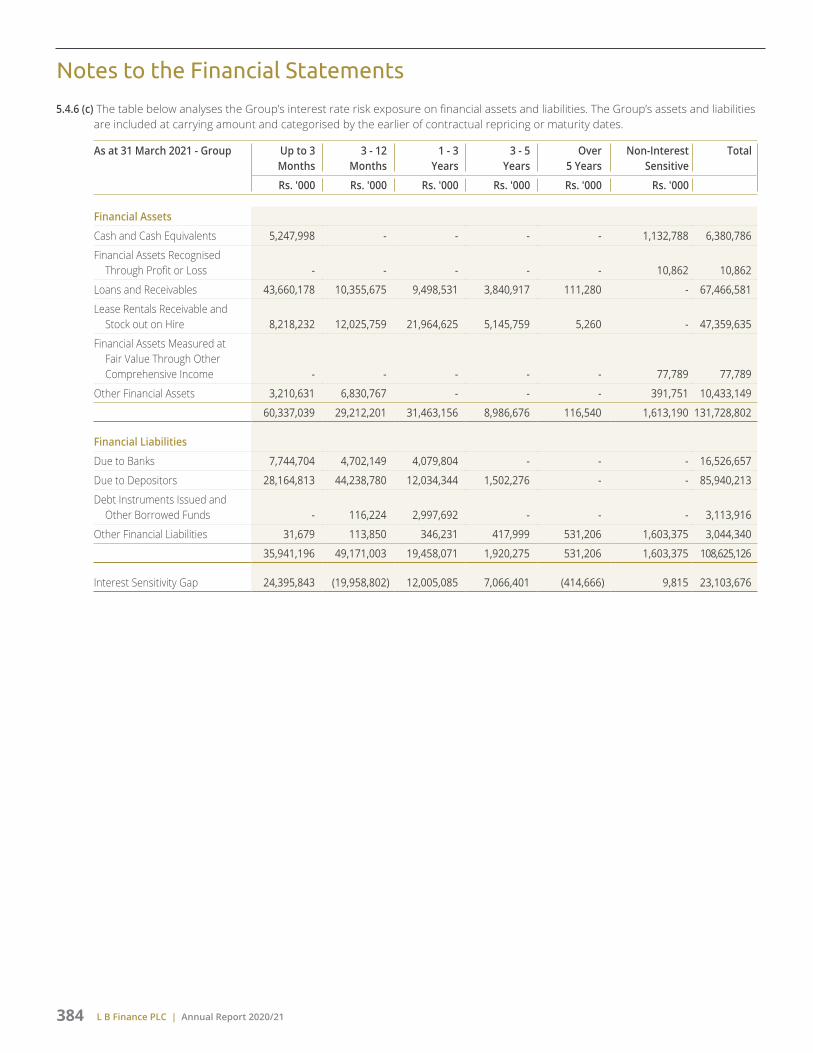
L B Finance PLC | Annual Report 2020/21384
5.4.6 (c) The table below analyses the Group’s interest rate risk exposure on financial assets and liabilities. The Group’s assets and liabilities are included at carrying amount and categorised by the earlier of contractual repricing or maturity dates.
As at 31 March 2021 - Group Up to 3 Months
3 - 12 Months
1 - 3 Years
3 - 5 Years
Over 5 Years
Non-Interest Sensitive
Total
Rs. '000 Rs. '000 Rs. '000 Rs. '000 Rs. '000 Rs. '000
Financial Assets
Cash and Cash Equivalents 5,247,998 - - - - 1,132,788 6,380,786
Financial Assets Recognised Through Profit or Loss - - - - - 10,862 10,862
Loans and Receivables 43,660,178 10,355,675 9,498,531 3,840,917 111,280 - 67,466,581
Lease Rentals Receivable and Stock out on Hire 8,218,232 12,025,759 21,964,625 5,145,759 5,260 - 47,359,635
Financial Assets Measured at Fair Value Through Other Comprehensive Income - - - - - 77,789 77,789
Other Financial Assets 3,210,631 6,830,767 - - - 391,751 10,433,149
60,337,039 29,212,201 31,463,156 8,986,676 116,540 1,613,190 131,728,802
Financial Liabilities
Due to Banks 7,744,704 4,702,149 4,079,804 - - - 16,526,657
Due to Depositors 28,164,813 44,238,780 12,034,344 1,502,276 - - 85,940,213
Debt Instruments Issued and Other Borrowed Funds - 116,224 2,997,692 - - - 3,113,916
Other Financial Liabilities 31,679 113,850 346,231 417,999 531,206 1,603,375 3,044,340
35,941,196 49,171,003 19,458,071 1,920,275 531,206 1,603,375 108,625,126
Interest Sensitivity Gap 24,395,843 (19,958,802) 12,005,085 7,066,401 (414,666) 9,815 23,103,676
Notes to the Financial Statements

L B Finance PLC | Annual Report 2020/21 385
Stability Leadership Strength Agility Responsibility Sustainability Success Supplementary Information
5.4.6 (d) The table below analyses the Group’s interest rate risk exposure on financial assets and liabilities. The Group’s assets and liabilities are included at carrying amount and categorised by the earlier of contractual repricing or maturity dates.
As at 31 March 2020 - Group Up to 3 Months
3 - 12 Months
1 - 3 Years
3 - 5 Years
Over 5 Years
Non-Interest Sensitive
Total
Rs. '000 Rs. '000 Rs. '000 Rs. '000 Rs. '000 Rs. '000
Financial Assets
Cash and Cash Equivalents 5,535,708 - - - - 936,604 6,472,312
Financial Assets Recognised Through Profit or Loss - - - - - 4,648 4,648
Loans and Receivables 39,260,020 8,865,439 7,329,828 3,153,889 184,168 - 58,793,344
Lease Rentals Receivable and Stock out on Hire 10,787,921 14,857,420 27,915,981 7,038,637 26,711 - 60,626,670
Financial Assets Measured at Fair Value Through Other Comprehensive Income - - - - - 59,141 59,141
Other Financial Assets 1,187,806 7,701,858 - - - 216,097 9,105,761
56,771,455 31,424,717 35,245,809 10,192,526 210,879 1,216,490 135,061,876
Financial Liabilities
Due to Banks 6,993,586 4,043,308 9,221,447 2,624,600 - - 22,882,941
Due to Depositors 29,111,476 45,672,223 13,210,448 1,320,950 - - 89,315,097
Debt Instruments Issued and Other Borrowed Funds 119,241 (2,630) 2,994,575 - - - 3,111,186
Other Financial Liabilities 26,236 91,757 295,632 341,287 566,542 1,445,321 2,766,775
36,250,539 49,804,658 25,722,102 4,286,837 566,542 1,445,321 118,075,999
Interest Sensitivity Gap 20,520,916 (18,379,941) 9,523,707 5,905,689 (355,663) (228,831) 16,985,877

L B Finance PLC | Annual Report 2020/21386
5.5 CAPITAL ADEQUACY
For a financial institution, capital is a buffer against insolvency. It is available to absorb unforeseen losses which will assure the sustainability of the Group’s operations so the Group can remain in business. The more capital the Group has relative to the risks it takes, the more confidence the stakeholders are that it will meet its obligations to them. Group’s capital management process is steered with the aim of holding sufficient capital to support the Group’s risk appetite whilst maintaining adequate capital to meet minimum regulatory capital requirements.
Regulatory Capital - Company
As per the Finance Business Act Direction No 3 of 2018, the Licensed Finance Companies (LFCs) with assets of Rs. 100 Bn and above required to maintain a minimum Capital Adequacy Ratio (CAR) of 12% and a Core Capital Ratio (Tier 1) of 8% by 1 July 2020. However, due to the stress on the Sri Lankan Financial System caused by the pandemic, the Central Bank of Sri Lanka (CBSL) has deferred the enhancements of these minimum capital adequacy requirements due by LFCs on 1 July 2020 and 1 July 2021, for a further period of one year until 1 July 2021 and 1 July 2022 respectively. Therefore, being a Domestic Systematically Important LFC, Company is required to maintain following minimum capital ratios within the stipulated time frames.
Components of Capital
1 July 2021 1 July 2022
Tier 1 Capital (%) 8% 10%
Total Capital (%) 12% 14%
As of 31 March 2021, the Company has maintained Risk Weighted Capital Adequacy Ratios above the CBSL’s minimum capital requirements.
5.6 PROBABLE IMPACT OF COVID-19 OUTBREAK ON BUSINESS OPERATIONS OF THE GROUP
Outbreak of third wave of COVID-19 pandemic in mid April 2021, has raised uncertainties in the business environment. Owing to the current situation, certain branches in lockdown areas have to be closed and Company had to tighten the safety measures to safeguard the health of the staff and also the customers. In order to ensure a smooth business operation, the development of the current situation and its impact to the business operations are being closely monitored by the Management.
Notes to the Financial Statements

L B Finance PLC | Annual Report 2020/21 387
Stability Leadership Strength Agility Responsibility Sustainability Success Supplementary Information
SECTION 06
Other Disclosures6.1 RELATED PARTY DISCLOSURES
The Group carried out transactions with key management and their related concerns and other related entities in the ordinary course of its business on an arms length basis at commercial rates except that the key management have availed facilities under the loan schemes uniformly applicable to all the staff.
The Company’s parent undertaking is Vallibel One PLC. The Company’s ultimate parent undertaking is Vallibel One PLC, which is incorporated in Sri Lanka. The Company’s ultimate controlling party is Mr. Dhammika Perera.
Details of related party transactions during the year are as follows;
6.1.1 Transactions with Key Management Personnel (KMPs)
Related party includes KMPs defined as those persons having authority and responsibility for planning, directing and controlling the activities of the entity directly or indirectly. Such KMPs include the Board of Directors of the Company (inclusive of executive and non-executive directors) and KMPs of the parent company.
Company Group
2021 2020 2021 2020
Rs. ‘000 Rs. ‘000 Rs. ‘000 Rs. ‘000
Short-Term Employment Benefits 413,856 409,376 413,856 409,376 Directors' Fees and Expenses 13,814 16,740 13,814 16,740 Post Employment Benefit Liability 63,608 58,710 63,608 58,710
491,278 484,826 491,278 484,826
In addition to the above, the Company has also paid non-cash benefits such as vehicles and fuel to Key Management Personnel in line with the approved employment benefits of the Company.
6.1.2 Transactions, Arrangements and Agreements Involving KMPs and Their Close Members of the Family (CMFs)
CMFs of KMPs are those family members who may be expected to influence, or be influenced by, those KMPs in their dealing with the entity.
Reported Under Company Group
2021 2020 2021 2020
Rs. ‘000 Rs. ‘000 Rs. ‘000 Rs. ‘000
Statement of Financial PositionAssetsLoans against Deposits Loans and Advances 8,484 - 8,484 - Advance and Prepayments Other Non Financial Assets 2,068 - 2,068 -
10,552 - 10,552 - LiabilitiesFixed Deposits Financial Liabilities at
Amortised Cost - Due to Depositors 686,354 523,210 686,354 523,210
Savings Deposits Financial Liabilities at Amortised Cost - Due to Depositors 18,957 7,125 18,957 7,125
705,311 530,335 705,311 530,335

L B Finance PLC | Annual Report 2020/21388
Reported Under Company Group
2021 2020 2021 2020
Rs. ‘000 Rs. ‘000 Rs. ‘000 Rs. ‘000
Income StatementInterest Income on Loans and
Receivables Interest Income 46 - 46 - Interest Expense on Customer
Deposits Interest Expenses 60,221 84,617 60,221 84,617 Administration and Establishment
Expenses Other Operating Expenses 6,425 91 6,425 91 66,692 84,708 66,692 84,708
Other TransactionsDeposits Accepted During the Year 297,910 134,215 297,910 134,215 Dividend Paid on Shareholdings 7,223 4,207 7,223 4,207 Supplier Payments - 5,500 - 5,500
305,133 143,922 305,133 143,922
6.1.3 Transaction, Arrangements and Agreements Involving Entities which are Controlled, and/or Jointly Controlled by the KMPs and Their CMFs
Reported Under Company Group
2021 2020 2021 2020
Rs. ‘000 Rs. ‘000 Rs. ‘000 Rs. ‘000
Statement of Financial PositionAssetsInvestment in Equity Securities Financial Assets Recognised
Through Profit or Loss - Measured at Fair Value 74 151 74 151
Leasehold Improvements Property, Plant and Equipment 22,585 50,293 22,585 50,293
22,659 50,444 22,659 50,444 LiabilitiesFixed Deposits Financial Liabilities at
Amortised Cost - Due to Depositors - 151,279 - 151,279
Income StatementIncome on Operating Lease Other Operating Income 26,540 26,540 26,540 26,540 Interest Expense on Customer
Deposits Interest Expenses 3,266 13,772 3,266 13,772 Administration and Establishment
Expenses Other Operating Expenses 4,998 6,507 4,998 6,507 34,804 46,819 34,804 46,819
Other TransactionsDeposits Accepted During the Year - 100,000 - 100,000 Supplier Payments 12,050 22,160 12,050 22,160
12,050 122,160 12,050 122,160
Notes to the Financial Statements

L B Finance PLC | Annual Report 2020/21 389
Stability Leadership Strength Agility Responsibility Sustainability Success Supplementary Information
6.1.4 Transactions with Group Entities
The Group entities include the Parent, Fellow Subsidiaries and Associate companies of the parent.
Transactions with Parent Company
Company Group
2021 2020 2021 2020
Rs. ‘000 Rs. ‘000 Rs. ‘000 Rs. ‘000
Other TransactionsDividend Paid on Shareholdings 860,189 573,459 860,189 573,459
860,189 573,459 860,189 573,459
Transactions with Subsidiary
Reported Under Company Group
2021 2020 2021 2020
Rs. ‘000 Rs. ‘000 Rs. ‘000 Rs. ‘000
Statement of Financial PositionAssetsInvestment in Equity Securities Investment in Subsidiary 521,162 521,162 - - Due from Subsidiary Other Financial Assets 21,848 16,278 - -
543,010 537,440 - -
Other TransactionsCounter Indemnity Issued to Banks for
Guarantees Contingent Liabilities 198,441 188,058 198,441 188,058 198,441 188,058 198,441 188,058
Transactions with Fellow Subsidiaries and Associate Companies of the Parent
Reported Under Company Group
2021 2020 2021 2020
Rs. ‘000 Rs. ‘000 Rs. ‘000 Rs. ‘000
Statement of Financial PositionAssetsLeasehold Improvements Property, Plant and
Equipment 7,914 6,180 7,914 6,180 Investment in Equity Securities Financial Assets
Recognised Through Profit or Loss - Measured at Fair Value 3,721 811 3,721 811
Investment in Equity Securities Financial Assets Measured at Fair Value Through Other Comprehensive Income 53,422 33,349 53,422 33,349
Due from Related Party 22 - 22 - 65,079 40,340 65,079 40,340
LiabilitiesFixed Deposits Financial Liabilities at
Amortised Cost - Due to Depositors 316,214 305,555 316,214 305,555
Due to Related Party Other Financial Liabilities - 128 - 128 316,214 305,683 316,214 305,683

L B Finance PLC | Annual Report 2020/21390
Reported Under Company Group
2021 2020 2021 2020
Rs. ‘000 Rs. ‘000 Rs. ‘000 Rs. ‘000
Income Statement
Dividend Income Other Operating Income - 4,098 - 4,098
Interest Expense on Customer Deposits Interest Expenses 34,621 15,180 34,621 15,180
Operating Expenses Other Operating Expenses 622 1,046 622 1,046
35,243 20,324 35,243 20,324
Other Transactions
Deposits Accepted During the Year 41,000 292,500 41,000 292,500
Dividend Paid on Shareholdings 433,479 288,986 433,479 288,986
474,479 581,486 474,479 581,486
6.2 CAPITAL
The Company maintains capital in order to cover risks inherent in the business and meet the capital adequacy requirements of Central Bank of Sri Lanka. The adequacy of the Company’s capital is monitored based on the measures, rules and ratios adopted by Central Bank of Sri Lanka.
Details of the regulatory capital requirements and compliance level are disclosed in Note 5.5 to these Financial Statements.
6.2.1 Capital Management
Objective
The primary objective of Company’s capital management policy is to ensure that the Company complies with externally imposed capital requirements and maintain healthy capital ratios in order to support its business and to maximise shareholders’ value.
Notes to the Financial Statements
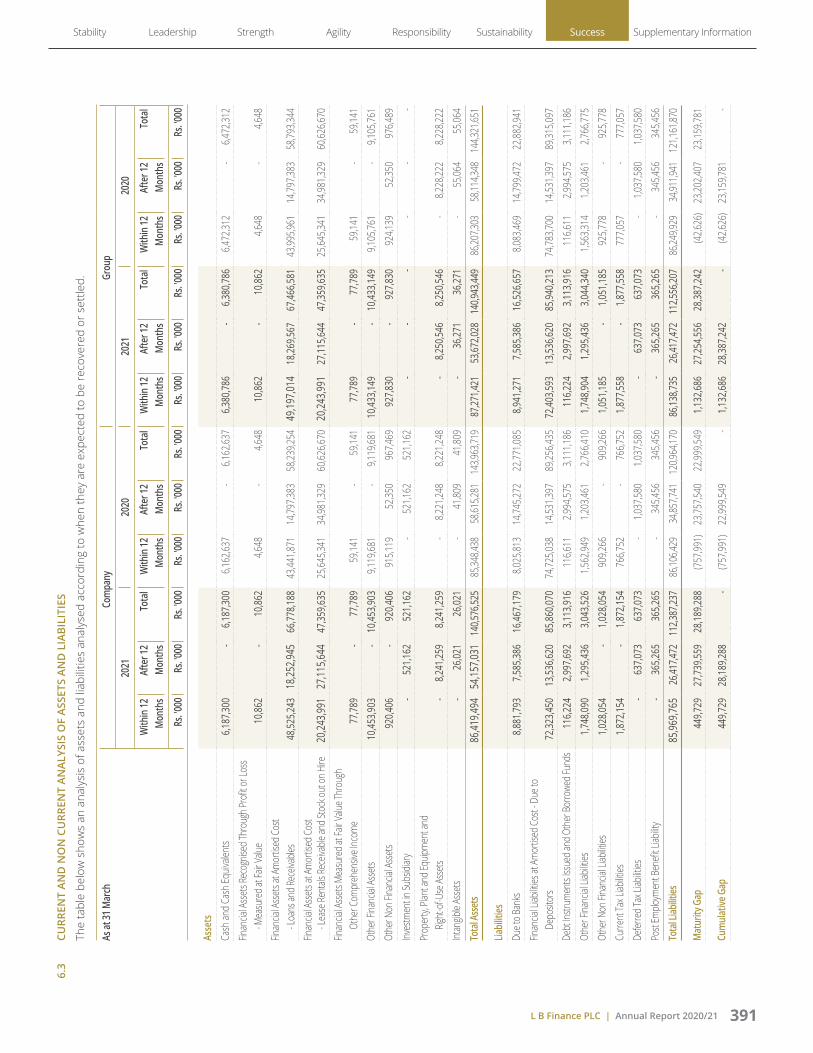
L B Finance PLC | Annual Report 2020/21 391
Stability Leadership Strength Agility Responsibility Sustainability Success Supplementary Information
6.3
CURR
ENT
AND
NO
N C
URR
ENT
ANAL
YSIS
OF
ASSE
TS A
ND
LIA
BILI
TIES
Th
e ta
ble
belo
w s
how
s an
ana
lysi
s of
ass
ets
and
liabi
litie
s an
alys
ed a
ccor
ding
to w
hen
they
are
exp
ecte
d to
be
reco
vere
d or
set
tled.
As at
31 M
arch
Com
pany
Grou
p
2021
2020
2021
2020
With
in 12
M
onth
sAf
ter 1
2 M
onth
sTo
tal
With
in 12
M
onth
sAf
ter 1
2 M
onth
sTo
tal
With
in 12
M
onth
sAf
ter 1
2 M
onth
sTo
tal
With
in 12
M
onth
sAf
ter 1
2 M
onth
sTo
tal
Rs. '0
00Rs
. '000
Rs. '0
00Rs
. '000
Rs. '0
00Rs
. '000
Rs. '0
00Rs
. '000
Rs. '0
00Rs
. '000
Rs. '0
00Rs
. '000
Asse
tsCa
sh an
d Ca
sh Eq
uivale
nts
6,18
7,300
-
6,18
7,300
6,
162,6
37
- 6,
162,6
37
6,38
0,786
-
6,38
0,786
6,
472,3
12
- 6,
472,3
12
Finan
cial A
ssets
Reco
gnise
d Thr
ough
Profi
t or L
oss
- Mea
sure
d at F
air Va
lue 10
,862
- 10
,862
4,64
8 -
4,64
8 10
,862
- 10
,862
4,64
8 -
4,64
8 Fin
ancia
l Ass
ets at
Amor
tised
Cost
- L
oans
and R
eceiv
ables
48,52
5,243
18
,252,9
45
66,77
8,188
43
,441,8
71
14,79
7,383
58
,239,2
54
49,19
7,014
18
,269,5
67
67,46
6,581
43
,995,9
61
14,79
7,383
58
,793,3
44
Finan
cial A
ssets
at Am
ortis
ed Co
st
- Lea
se Re
ntals
Rece
ivable
and S
tock
out o
n Hire
20,24
3,991
27
,115,6
44
47,35
9,635
25
,645,3
41
34,98
1,329
60
,626,6
70
20,24
3,991
27
,115,6
44
47,35
9,635
25
,645,3
41
34,98
1,329
60
,626,6
70
Finan
cial A
ssets
Mea
sure
d at F
air Va
lue Th
roug
h Ot
her C
ompr
ehen
sive I
ncom
e 77
,789
- 77
,789
59,14
1 -
59,14
1 77
,789
- 77
,789
59,14
1 -
59,14
1 Ot
her F
inanc
ial As
sets
10,45
3,903
-
10,45
3,903
9,
119,6
81
- 9,
119,6
81
10,43
3,149
-
10,43
3,149
9,
105,7
61
- 9,
105,7
61
Othe
r Non
Fina
ncial
Asse
ts 92
0,406
-
920,4
06
915,1
19
52,35
0 96
7,469
92
7,830
-
927,8
30
924,1
39
52,35
0 97
6,489
Inv
estm
ent in
Subs
idiar
y -
521,1
62
521,1
62
- 52
1,162
52
1,162
-
- -
- -
- Pr
oper
ty, Pl
ant a
nd Eq
uipm
ent a
nd
Right
-of-U
se As
sets
- 8,
241,2
59
8,24
1,259
-
8,22
1,248
8,
221,2
48
- 8,
250,5
46
8,25
0,546
-
8,22
8,222
8,
228,2
22
Intan
gible
Asse
ts -
26,02
1 26
,021
- 41
,809
41,80
9 -
36,27
1 36
,271
- 55
,064
55,06
4 To
tal A
sset
s 86
,419,4
94
54,15
7,031
14
0,576
,525
85,34
8,438
58
,615,2
81
143,9
63,71
9 87
,271,4
21
53,67
2,028
14
0,943
,449
86,20
7,303
58
,114,3
48
144,3
21,65
1
Liabi
lities
Du
e to B
anks
8,88
1,793
7,
585,3
86
16,46
7,179
8,
025,8
13
14,74
5,272
22
,771,0
85
8,94
1,271
7,
585,3
86
16,52
6,657
8,
083,4
69
14,79
9,472
22
,882,9
41
Finan
cial L
iabilit
ies at
Amor
tised
Cost
- Due
to
Depo
sitor
s 72
,323,4
50
13,53
6,620
85
,860,0
70
74,72
5,038
14
,531,3
97
89,25
6,435
72
,403,5
93
13,53
6,620
85
,940,2
13
74,78
3,700
14
,531,3
97
89,31
5,097
De
bt In
strum
ents
Issue
d and
Oth
er B
orro
wed F
unds
116,2
24
2,99
7,692
3,
113,9
16
116,6
11
2,99
4,575
3,
111,1
86
116,2
24
2,99
7,692
3,
113,9
16
116,6
11
2,99
4,575
3,
111,1
86
Othe
r Fina
ncial
Liab
ilities
1,74
8,090
1,
295,4
36
3,04
3,526
1,
562,9
49
1,20
3,461
2,
766,4
10
1,74
8,904
1,
295,4
36
3,04
4,340
1,
563,3
14
1,20
3,461
2,
766,7
75
Othe
r Non
Fina
ncial
Liab
ilities
1,02
8,054
-
1,02
8,054
90
9,266
-
909,2
66
1,05
1,185
-
1,05
1,185
92
5,778
-
925,7
78
Curre
nt Ta
x Liab
ilities
1,87
2,154
-
1,87
2,154
76
6,752
-
766,7
52
1,87
7,558
-
1,87
7,558
77
7,057
-
777,0
57
Defer
red T
ax Li
abilit
ies -
637,0
73
637,0
73
- 1,
037,5
80
1,03
7,580
-
637,0
73
637,0
73
- 1,
037,5
80
1,03
7,580
Po
st Em
ploym
ent B
enefi
t Liab
ility
- 36
5,265
36
5,265
-
345,4
56
345,4
56
- 36
5,265
36
5,265
-
345,4
56
345,4
56
Tota
l Liab
ilities
85,96
9,765
26
,417,4
72
112,3
87,23
7 86
,106,4
29
34,85
7,741
12
0,964
,170
86,13
8,735
26
,417,4
72
112,5
56,20
7 86
,249,9
29
34,91
1,941
12
1,161
,870
Mat
urity
Gap
449,7
29
27,73
9,559
28
,189,2
88
(757
,991)
23,75
7,540
22
,999,5
49
1,13
2,686
27
,254,5
56
28,38
7,242
(4
2,626
) 23
,202,4
07
23,15
9,781
Cum
ulat
ive G
ap 44
9,729
28
,189,2
88
- (7
57,99
1) 22
,999,5
49
- 1,
132,6
86
28,38
7,242
-
(42,6
26)
23,15
9,781
-
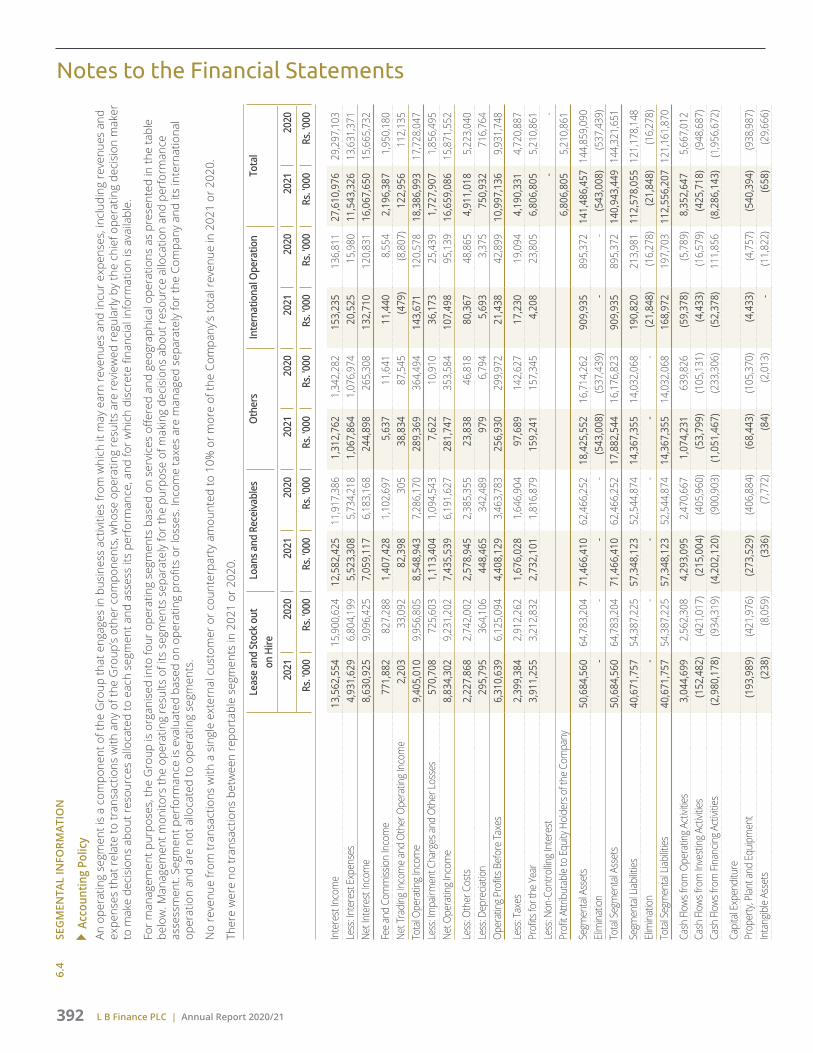
L B Finance PLC | Annual Report 2020/21392
6.4
SEG
MEN
TAL
INFO
RMAT
ION
Acc
ount
ing
Polic
y
An o
pera
ting
segm
ent i
s a
com
pone
nt o
f the
Gro
up th
at e
ngag
es in
bus
ines
s ac
tiviti
es fr
om w
hich
it m
ay e
arn
reve
nues
and
incu
r exp
ense
s, in
clud
ing
reve
nues
and
ex
pens
es th
at re
late
to tr
ansa
ctio
ns w
ith a
ny o
f the
Gro
up’s
othe
r com
pone
nts,
who
se o
pera
ting
resu
lts a
re re
view
ed re
gula
rly b
y th
e ch
ief o
pera
ting
deci
sion
mak
er
to m
ake
deci
sion
s ab
out r
esou
rces
allo
cate
d to
eac
h se
gmen
t and
ass
ess
its p
erfo
rman
ce, a
nd fo
r whi
ch d
iscr
ete
finan
cial
info
rmat
ion
is a
vaila
ble.
Fo
r man
agem
ent p
urpo
ses,
the
Gro
up is
org
anis
ed in
to fo
ur o
pera
ting
segm
ents
bas
ed o
n se
rvic
es o
ffere
d an
d ge
ogra
phic
al o
pera
tions
as
pres
ente
d in
the
tabl
e be
low
. Man
agem
ent m
onito
rs th
e op
erat
ing
resu
lts o
f its
seg
men
ts s
epar
atel
y fo
r the
pur
pose
of m
akin
g de
cisi
ons
abou
t res
ourc
e al
loca
tion
and
perf
orm
ance
as
sess
men
t. Se
gmen
t per
form
ance
is e
valu
ated
bas
ed o
n op
erat
ing
profi
ts o
r los
ses.
Inco
me
taxe
s ar
e m
anag
ed s
epar
atel
y fo
r the
Com
pany
and
its
inte
rnat
iona
l op
erat
ion
and
are
not a
lloca
ted
to o
pera
ting
segm
ents
.
N
o re
venu
e fr
om tr
ansa
ctio
ns w
ith a
sin
gle
exte
rnal
cus
tom
er o
r cou
nter
part
y am
ount
ed to
10%
or m
ore
of th
e Co
mpa
ny’s
tota
l rev
enue
in 2
021
or 2
020.
Th
ere
wer
e no
tran
sact
ions
bet
wee
n re
port
able
seg
men
ts in
202
1 or
202
0.
Leas
e an
d St
ock
out
on H
ireLo
ans a
nd R
ecei
vabl
esO
ther
sIn
tern
atio
nal O
pera
tion
Tota
l
2021
2020
2021
2020
2021
2020
2021
2020
2021
2020
Rs. '0
00Rs
. '000
Rs. '0
00Rs
. '000
Rs. '0
00Rs
. '000
Rs. '0
00Rs
. '000
Rs. '0
00Rs
. '000
Inte
rest
Inco
me
13,
562,
554
15,
900,
624
12,
582,
425
11,
917,
386
1,3
12,7
62
1,3
42,2
82
153
,235
1
36,8
11
27,
610,
976
29,
297,
103
Less
: Inte
rest
Exp
ense
s 4
,931
,629
6
,804
,199
5
,523
,308
5
,734
,218
1
,067
,864
1
,076
,974
2
0,52
5 1
5,98
0 1
1,54
3,32
6 1
3,63
1,37
1 Ne
t Int
eres
t Inc
ome
8,6
30,9
25
9,0
96,4
25
7,0
59,1
17
6,1
83,1
68
244
,898
2
65,3
08
132
,710
1
20,8
31
16,
067,
650
15,
665,
732
Fee
and
Com
miss
ion
Inco
me
771
,882
8
27,2
88
1,4
07,4
28
1,1
02,6
97
5,6
37
11,
641
11,
440
8,5
54
2,1
96,3
87
1,9
50,1
80
Net T
radi
ng In
com
e an
d O
ther
Ope
ratin
g Inc
ome
2,2
03
33,
092
82,
398
305
3
8,83
4 8
7,54
5 (4
79)
(8,8
07)
122
,956
1
12,1
35
Tota
l Ope
ratin
g Inc
ome
9,4
05,0
10
9,9
56,8
05
8,5
48,9
43
7,2
86,1
70
289
,369
3
64,4
94
143
,671
1
20,5
78
18,
386,
993
17,
728,
047
Less
: Impa
irmen
t Cha
rges
and
Oth
er Lo
sses
570
,708
7
25,6
03
1,1
13,4
04
1,0
94,5
43
7,6
22
10,
910
36,
173
25,
439
1,7
27,9
07
1,8
56,4
95
Net O
pera
ting I
ncom
e 8
,834
,302
9
,231
,202
7
,435
,539
6
,191
,627
2
81,7
47
353
,584
1
07,4
98
95,
139
16,
659,
086
15,
871,
552
Less
: Oth
er C
osts
2,2
27,8
68
2,7
42,0
02
2,5
78,9
45
2,3
85,3
55
23,
838
46,
818
80,
367
48,
865
4,9
11,0
18
5,2
23,0
40
Less
: Dep
recia
tion
295
,795
3
64,1
06
448
,465
3
42,4
89
979
6
,794
5
,693
3
,375
7
50,9
32
716
,764
O
pera
ting P
rofit
s Bef
ore
Taxe
s 6
,310
,639
6
,125
,094
4
,408
,129
3
,463
,783
2
56,9
30
299
,972
2
1,43
8 4
2,89
9 1
0,99
7,13
6 9
,931
,748
Less
: Tax
es 2
,399
,384
2
,912
,262
1
,676
,028
1
,646
,904
9
7,68
9 1
42,6
27
17,
230
19,
094
4,1
90,3
31
4,7
20,8
87
Profi
ts fo
r the
Year
3,9
11,2
55
3,2
12,8
32
2,7
32,1
01
1,8
16,8
79
159
,241
1
57,3
45
4,2
08
23,
805
6,8
06,8
05
5,2
10,8
61
Less
: Non
-Con
trollin
g Int
eres
t -
-
Pr
ofit A
ttrib
utab
le to
Equ
ity H
olde
rs o
f the
Com
pany
6,8
06,8
05
5,2
10,8
61
Segm
enta
l Ass
ets
50,
684,
560
64,
783,
204
71,
466,
410
62,
466,
252
18,
425,
552
16,
714,
262
909
,935
8
95,3
72
141
,486
,457
144
,859
,090
Eli
min
atio
n -
-
-
-
(5
43,0
08)
(537
,439
) -
-
(5
43,0
08)
(537
,439
)To
tal S
egm
enta
l Ass
ets
50,
684,
560
64,
783,
204
71,
466,
410
62,
466,
252
17,
882,
544
16,
176,
823
909
,935
8
95,3
72
140
,943
,449
144
,321
,651
Segm
enta
l Liab
ilities
40,
671,
757
54,
387,
225
57,
348,
123
52,
544,
874
14,
367,
355
14,
032,
068
190
,820
2
13,9
81
112
,578
,055
121
,178
,148
Eli
min
atio
n -
-
-
-
-
-
(2
1,84
8) (1
6,27
8) (2
1,84
8) (1
6,27
8)To
tal S
egm
enta
l Liab
ilities
40,
671,
757
54,
387,
225
57,
348,
123
52,
544,
874
14,
367,
355
14,
032,
068
168
,972
1
97,7
03
112
,556
,207
121
,161
,870
Cash
Flow
s fro
m O
pera
ting A
ctivi
ties
3,0
44,6
99
2,5
62,3
08
4,2
93,0
95
2,4
70,6
67
1,0
74,2
31
639
,826
(5
9,37
8) (5
,789
) 8
,352
,647
5
,667
,012
Ca
sh Fl
ows f
rom
Inve
stin
g Act
ivitie
s (1
52,4
82)
(421
,017
) (2
15,0
04)
(405
,960
) (5
3,79
9) (1
05,1
31)
(4,4
33)
(16,
579)
(425
,718
) (9
48,6
87)
Cash
Flow
s fro
m Fi
nanc
ing A
ctivi
ties
(2,9
80,1
78)
(934
,319
) (4
,202
,120
) (9
00,9
03)
(1,0
51,4
67)
(233
,306
) (5
2,37
8) 1
11,8
56
(8,2
86,1
43)
(1,9
56,6
72)
Capi
tal E
xpen
ditu
rePr
oper
ty, P
lant a
nd E
quip
men
t (1
93,9
89)
(421
,976
) (2
73,5
29)
(406
,884
) (6
8,44
3) (1
05,3
70)
(4,4
33)
(4,7
57)
(540
,394
) (9
38,9
87)
Inta
ngib
le As
sets
(238
) (8
,059
) (3
36)
(7,7
72)
(84)
(2,0
13)
-
(11,
822)
(658
) (2
9,66
6)
Notes to the Financial Statements

L B Finance PLC | Annual Report 2020/21 393
Stability Leadership Strength Agility Responsibility Sustainability Success Supplementary Information
6.5 COMMITMENTS AND CONTINGENCIES
Accounting PolicyAll discernible risks are accounted for in determining the amount of all known liabilities.
Contingent liabilities are possible obligations whose existence will be confirmed only by uncertain future events or present obligations where the transfer of economic benefit is not probable or cannot be reliably measured. Contingent liabilities are not recognised in the Statement of Financial Position but are disclosed unless they are remote.
6.5.1 Contingent Liabilities
As at 31 March Company Group
2021 2020 2021 2020
Rs. ‘000 Rs. ‘000 Rs. ‘000 Rs. ‘000
Guarantees Issued to Banks and Other Institutions 33,800 12,570 33,800 12,570
Counter Indemnity Issued to Banks for Guarantees* 198,441 188,058 138,963 76,202
Import LC and Ordinary Guarantees - 83,753 - 83,753
Total Contingent Liabilities 232,241 284,381 172,763 172,525
*Contingent liability as at 31 March 2021, on counter indemnity for letter of guarantee issued by Sampath Bank PLC on behalf of L B Microfinance Myanmar Company Limited favoring CB Bank Limited, Myanmar. Total of this sum relates to the term loan facility obtained by L B Microfinance Myanmar Company Limited.
6.5.2 Commitments
As at 31 March Company Group
2021 2020 2021 2020
Rs. ‘000 Rs. ‘000 Rs. ‘000 Rs. ‘000
Commitment for Unutilised Facilities 671,312 1,644,424 671,312 1,644,424
Total Commitments 671,312 1,644,424 671,312 1,644,424
6.5.3 Commitments and Contingencies
As at 31 March Company Group
2021 2020 2021 2020
Rs. ‘000 Rs. ‘000 Rs. ‘000 Rs. ‘000
Contingent Liabilities 232,241 284,381 172,763 172,525
Commitments 671,312 1,644,424 671,312 1,644,424
Total Commitments and Contingencies 903,553 1,928,805 844,075 1,816,949
Allowance for Impairment (4,375) (3,955) (4,375) (3,955)
Net of Impairment 899,178 1,924,850 839,700 1,812,994

L B Finance PLC | Annual Report 2020/21394
6.5.4 Litigation Against the Company and Group
The Company has contingent liabilities in respect of legal claims arising in the ordinary course of business. Based on the information currently available, the Board of Directors is of the opinion that the ultimate resolution of the litigations would not likely to have a material impact on the Group.
As at 31 March Company Group
2021 2020 2021 2020
Rs. ‘000 Rs. ‘000 Rs. ‘000 Rs. ‘000
Cases Pending Against the Company and Group (Values Claimed) 141,916 83,260 141,916 83,260
6.6 NET ASSET VALUE PER SHARE
As at 31 March Company Group
2021 2020 2020 2021 2020 2020
Rs. '000 Rs. '000 Rs. '000 Rs. '000 Rs. '000 Rs. '000
Restated Restated
Amounts Used as the Numerators:
Total Equity Attributable to Equity Holders 28,189,288 22,999,549 22,999,549 28,387,242 23,159,781 23,159,781
Number of Ordinary Shares Used as Denominators:
Total Number of Ordinary Shares in Issue 554,057,136 554,057,136 138,514,284 554,057,136 554,057,136 138,514,284
Net Asset Value per Share (Rs.) 50.88 41.51 166.04 51.24 41.80 167.20
Net Assets Value per Ordinary Share of 2020 have been restated based on the post sub-division weighted average number of ordinary shares as at 31 March 2021.
6.7 ASSETS PLEDGED
The following assets have been pledged as security for liabilities.
Nature of Assets Nature of Liability Included Under Carrying Amount Pledged
Company Group
2021 2020 2021 2020
Rs. ‘000 Rs. ‘000 Rs. ‘000 Rs. ‘000
Lease Rentals Receivable and Stock out on Hire/Loans and Receivables*
Debt Funding from Banks
Lease Rentals Receivable and Stock out on Hire/Loans and Receivables 19,374,902 24,730,786 19,374,902 24,730,786
Freehold Land and Building
Term Loans Property, Plant and Equipment 1,601,607 1,979,558 1,601,607 1,979,558
20,976,509 26,710,344 20,976,509 26,710,344
*The receivables and cash flows that have been included in bank loans, overdrafts, syndicated loans and securitisation loans are only available for payment of the debt and other obligations issued or arising in such transactions. However, the Group hold the right to the excess cash flows not needed to pay the debt and other obligations issued or arising in each of such transactions. Gross amount of lease rentals receivable, stock out on hire, loans and receivables which have been pledged as at reporting date is Rs. 25,272,925,414/- (2020 - Rs. 32,470,082,916/-).
Notes to the Financial Statements

L B Finance PLC | Annual Report 2020/21 395
Stability Leadership Strength Agility Responsibility Sustainability Success Supplementary Information
6.8 COMPARATIVE INFORMATION
Comparative information is reclassified wherever necessary to conform with the current year’s classification in order to provide better presentation.
6.8.1 Income Statement
There were no reclassifications during the financial year.
6.8.2 Statement of Financial Position
There were no reclassifications during the financial year.
6.9 EVENTS OCCURRING AFTER THE REPORTING DATE
As the third wave of COVID-19 pandemic evolves, governments are implementing additional measures to address the resulting public health issues and the economic impact. To meet the additional challenges, we supplemented our existing approach to risk management with additional tools and practices. We increased our focus on the quality and timeliness of the data used to inform management decisions, through measures such as early warning indicators, prudent active risk management of our risk appetite, and ensuring regular communication with our Board and other key stakeholders.
The Group will continues to monitor the COVID-19 situation and will take further action as necessary in response to the economic disruption.
Subsequent to the reporting date, the Board of Directors of the Company recommended the payment of a final dividend of Rs. 4.00 per share for the year ended 31 March 2021. This final dividend is yet to be approved at the Annual General Meeting to be held on 30 June 2021. In accordance with the Sri Lanka Accounting Standard – LKAS 10 (Events After the Reporting Period), this proposed final dividend has not been recognised as a liability as at 31 March 2021.
No circumstances have arisen subsequent to the reporting date which would require adjustment to or disclosure in the Financial Statements.
6.10 CHANGES IN LIABILITIES ARISING FROM FINANCING ACTIVITIES
Accounting PolicySri Lanka Accounting Standard - LKAS 07 (Statement of Cash Flows), requires an entity to disclose information that enables users of Financial Statements to evaluate changes in liabilities arising from financing activities, including both changes arising from cash flows and non-cash changes. Accordingly, changes in liabilities arising from financing activities for the year ended 31 March 2021 are disclosed below together with the comparative figures for the year ended 31 March 2020.
The funds borrowed by the Company and the Group are given in Note 4.26 and Note 4.28.
Company
Debt Funding from Banks Debt Instruments Issued and Other Borrowed Funds
2021 2020 2021 2020
Rs. ‘000 Rs. ‘000 Rs. ‘000 Rs. ‘000
Balance as at the Beginning of the Year 22,050,674 23,565,145 3,111,186 3,107,783
Net Cash Flows from Financing Activities (5,368,955) (2,575,836) - -
Non Cash Changes
Foreign Exchange Movements - - - -
Net Accrual for Interest Expense (1,202,639) 1,061,365 2,730 3,403
Balance as at the End of the Year 15,479,080 22,050,674 3,113,916 3,111,186
Within 12 Months 7,893,694 7,305,401 116,224 116,611
After 12 Months 7,585,386 14,745,273 2,997,692 2,994,575
Total 15,479,080 22,050,674 3,113,916 3,111,186
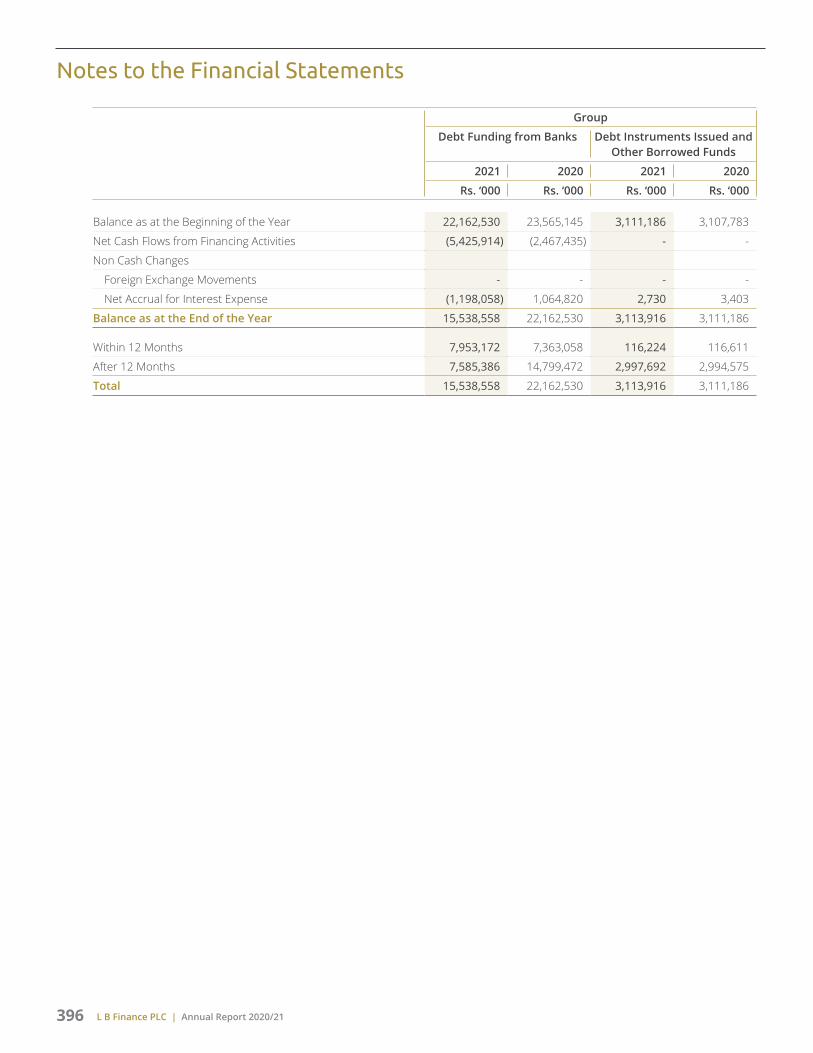
L B Finance PLC | Annual Report 2020/21396
Group
Debt Funding from Banks Debt Instruments Issued and Other Borrowed Funds
2021 2020 2021 2020
Rs. ‘000 Rs. ‘000 Rs. ‘000 Rs. ‘000
Balance as at the Beginning of the Year 22,162,530 23,565,145 3,111,186 3,107,783
Net Cash Flows from Financing Activities (5,425,914) (2,467,435) - -
Non Cash Changes
Foreign Exchange Movements - - - -
Net Accrual for Interest Expense (1,198,058) 1,064,820 2,730 3,403
Balance as at the End of the Year 15,538,558 22,162,530 3,113,916 3,111,186
Within 12 Months 7,953,172 7,363,058 116,224 116,611
After 12 Months 7,585,386 14,799,472 2,997,692 2,994,575
Total 15,538,558 22,162,530 3,113,916 3,111,186
Notes to the Financial Statements

L B Finance PLC | Annual Report 2020/21 397
Supplementary Information
Decade at a glance 398
Quarterly financial statements 2020/21 400
Income statement (US Dollars) 402
Statement of comprehensive income (US Dollars) 403
Statement of financial position (US Dollars) 404
Creating opportunities for gender equity 405
Independent assurance report on sustainability 410
List of abbreviations 411
Glossary of terms 412
Corporate information 416
Notice of annual general meeting 418
Form of proxy 419
Feedback form annual report 2020/21 421
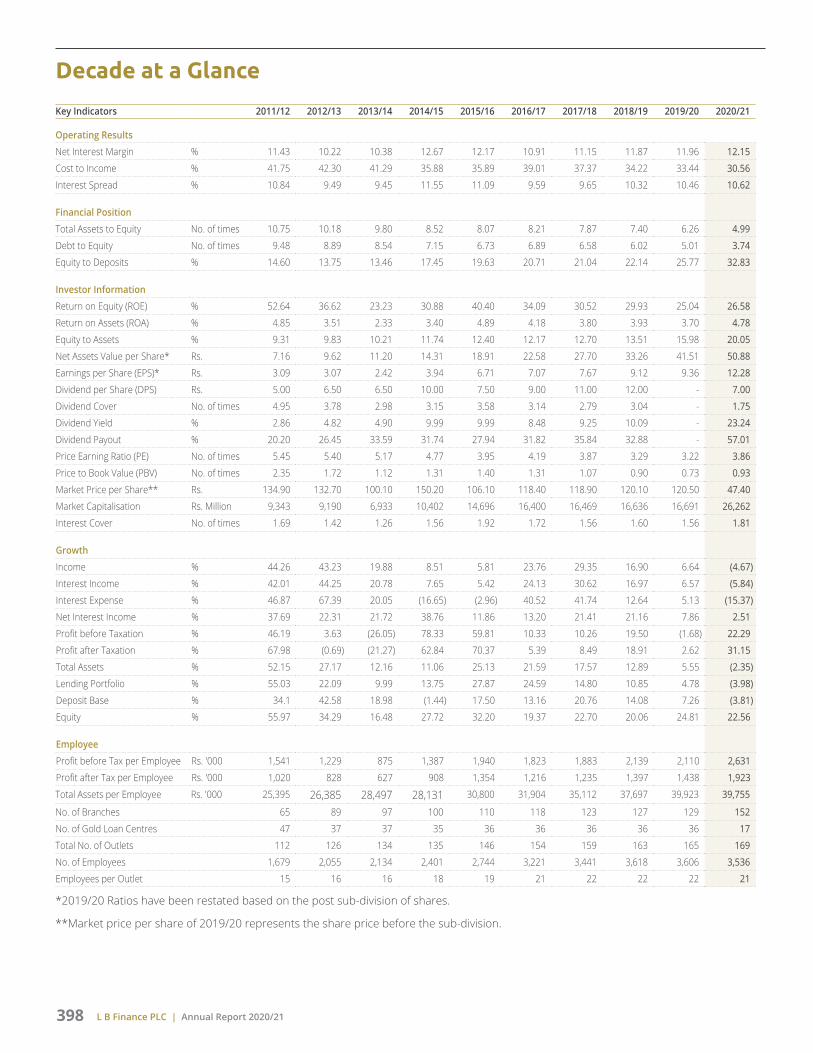
L B Finance PLC | Annual Report 2020/21398
Decade at a Glance
Key Indicators 2011/12 2012/13 2013/14 2014/15 2015/16 2016/17 2017/18 2018/19 2019/20 2020/21
Operating Results
Net Interest Margin % 11.43 10.22 10.38 12.67 12.17 10.91 11.15 11.87 11.96 12.15
Cost to Income % 41.75 42.30 41.29 35.88 35.89 39.01 37.37 34.22 33.44 30.56
Interest Spread % 10.84 9.49 9.45 11.55 11.09 9.59 9.65 10.32 10.46 10.62
Financial Position
Total Assets to Equity No. of times 10.75 10.18 9.80 8.52 8.07 8.21 7.87 7.40 6.26 4.99
Debt to Equity No. of times 9.48 8.89 8.54 7.15 6.73 6.89 6.58 6.02 5.01 3.74
Equity to Deposits % 14.60 13.75 13.46 17.45 19.63 20.71 21.04 22.14 25.77 32.83
Investor Information
Return on Equity (ROE) % 52.64 36.62 23.23 30.88 40.40 34.09 30.52 29.93 25.04 26.58
Return on Assets (ROA) % 4.85 3.51 2.33 3.40 4.89 4.18 3.80 3.93 3.70 4.78
Equity to Assets % 9.31 9.83 10.21 11.74 12.40 12.17 12.70 13.51 15.98 20.05
Net Assets Value per Share* Rs. 7.16 9.62 11.20 14.31 18.91 22.58 27.70 33.26 41.51 50.88
Earnings per Share (EPS)* Rs. 3.09 3.07 2.42 3.94 6.71 7.07 7.67 9.12 9.36 12.28
Dividend per Share (DPS) Rs. 5.00 6.50 6.50 10.00 7.50 9.00 11.00 12.00 - 7.00
Dividend Cover No. of times 4.95 3.78 2.98 3.15 3.58 3.14 2.79 3.04 - 1.75
Dividend Yield % 2.86 4.82 4.90 9.99 9.99 8.48 9.25 10.09 - 23.24
Dividend Payout % 20.20 26.45 33.59 31.74 27.94 31.82 35.84 32.88 - 57.01
Price Earning Ratio (PE) No. of times 5.45 5.40 5.17 4.77 3.95 4.19 3.87 3.29 3.22 3.86
Price to Book Value (PBV) No. of times 2.35 1.72 1.12 1.31 1.40 1.31 1.07 0.90 0.73 0.93
Market Price per Share** Rs. 134.90 132.70 100.10 150.20 106.10 118.40 118.90 120.10 120.50 47.40
Market Capitalisation Rs. Million 9,343 9,190 6,933 10,402 14,696 16,400 16,469 16,636 16,691 26,262
Interest Cover No. of times 1.69 1.42 1.26 1.56 1.92 1.72 1.56 1.60 1.56 1.81
Growth
Income % 44.26 43.23 19.88 8.51 5.81 23.76 29.35 16.90 6.64 (4.67)
Interest Income % 42.01 44.25 20.78 7.65 5.42 24.13 30.62 16.97 6.57 (5.84)
Interest Expense % 46.87 67.39 20.05 (16.65) (2.96) 40.52 41.74 12.64 5.13 (15.37)
Net Interest Income % 37.69 22.31 21.72 38.76 11.86 13.20 21.41 21.16 7.86 2.51
Profit before Taxation % 46.19 3.63 (26.05) 78.33 59.81 10.33 10.26 19.50 (1.68) 22.29
Profit after Taxation % 67.98 (0.69) (21.27) 62.84 70.37 5.39 8.49 18.91 2.62 31.15
Total Assets % 52.15 27.17 12.16 11.06 25.13 21.59 17.57 12.89 5.55 (2.35)
Lending Portfolio % 55.03 22.09 9.99 13.75 27.87 24.59 14.80 10.85 4.78 (3.98)
Deposit Base % 34.1 42.58 18.98 (1.44) 17.50 13.16 20.76 14.08 7.26 (3.81)
Equity % 55.97 34.29 16.48 27.72 32.20 19.37 22.70 20.06 24.81 22.56
Employee
Profit before Tax per Employee Rs. '000 1,541 1,229 875 1,387 1,940 1,823 1,883 2,139 2,110 2,631
Profit after Tax per Employee Rs. '000 1,020 828 627 908 1,354 1,216 1,235 1,397 1,438 1,923
Total Assets per Employee Rs. '000 25,395 26,385 28,497 28,131 30,800 31,904 35,112 37,697 39,923 39,755
No. of Branches 65 89 97 100 110 118 123 127 129 152
No. of Gold Loan Centres 47 37 37 35 36 36 36 36 36 17
Total No. of Outlets 112 126 134 135 146 154 159 163 165 169
No. of Employees 1,679 2,055 2,134 2,401 2,744 3,221 3,441 3,618 3,606 3,536
Employees per Outlet 15 16 16 18 19 21 22 22 22 21
*2019/20 Ratios have been restated based on the post sub-division of shares.
**Market price per share of 2019/20 represents the share price before the sub-division.
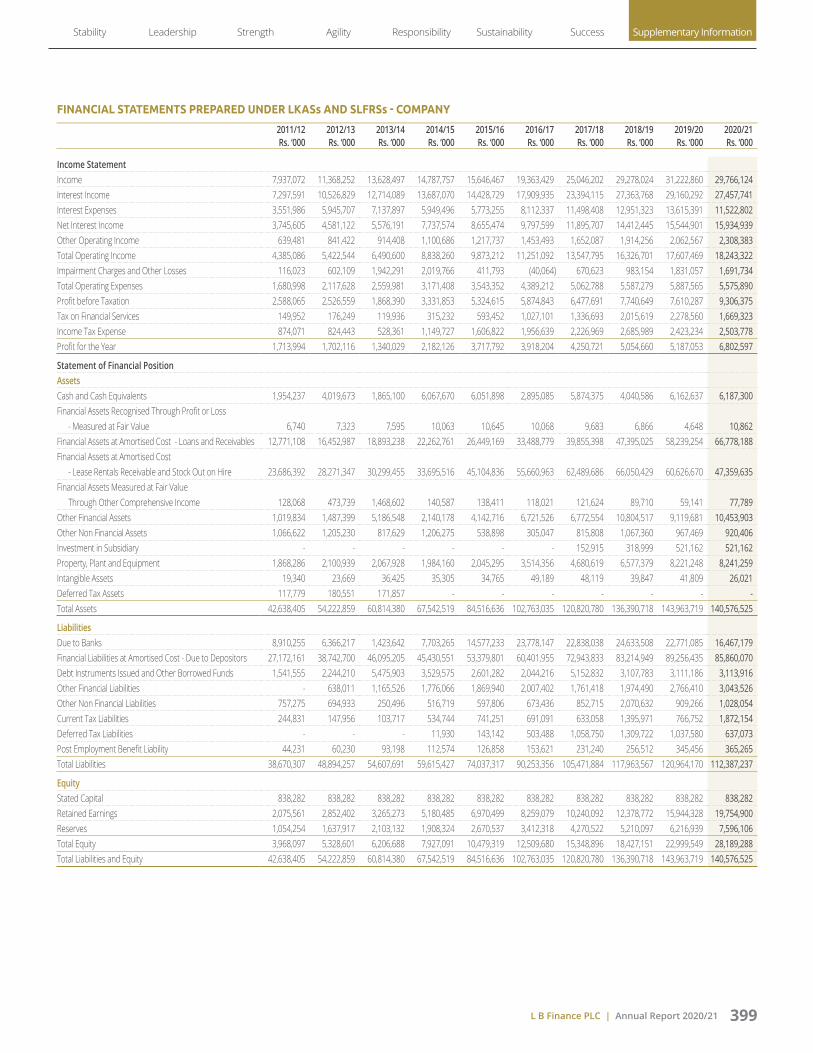
L B Finance PLC | Annual Report 2020/21 399
FINANCIAL STATEMENTS PREPARED UNDER LKASs AND SLFRSs - COMPANY
2011/12 2012/13 2013/14 2014/15 2015/16 2016/17 2017/18 2018/19 2019/20 2020/21 Rs. ‘000 Rs. ‘000 Rs. ‘000 Rs. ‘000 Rs. ‘000 Rs. ‘000 Rs. ‘000 Rs. ‘000 Rs. ‘000 Rs. ‘000
Income StatementIncome 7,937,072 11,368,252 13,628,497 14,787,757 15,646,467 19,363,429 25,046,202 29,278,024 31,222,860 29,766,124 Interest Income 7,297,591 10,526,829 12,714,089 13,687,070 14,428,729 17,909,935 23,394,115 27,363,768 29,160,292 27,457,741 Interest Expenses 3,551,986 5,945,707 7,137,897 5,949,496 5,773,255 8,112,337 11,498,408 12,951,323 13,615,391 11,522,802 Net Interest Income 3,745,605 4,581,122 5,576,191 7,737,574 8,655,474 9,797,599 11,895,707 14,412,445 15,544,901 15,934,939 Other Operating Income 639,481 841,422 914,408 1,100,686 1,217,737 1,453,493 1,652,087 1,914,256 2,062,567 2,308,383 Total Operating Income 4,385,086 5,422,544 6,490,600 8,838,260 9,873,212 11,251,092 13,547,795 16,326,701 17,607,469 18,243,322 Impairment Charges and Other Losses 116,023 602,109 1,942,291 2,019,766 411,793 (40,064) 670,623 983,154 1,831,057 1,691,734 Total Operating Expenses 1,680,998 2,117,628 2,559,981 3,171,408 3,543,352 4,389,212 5,062,788 5,587,279 5,887,565 5,575,890 Profit before Taxation 2,588,065 2,526,559 1,868,390 3,331,853 5,324,615 5,874,843 6,477,691 7,740,649 7,610,287 9,306,375 Tax on Financial Services 149,952 176,249 119,936 315,232 593,452 1,027,101 1,336,693 2,015,619 2,278,560 1,669,323 Income Tax Expense 874,071 824,443 528,361 1,149,727 1,606,822 1,956,639 2,226,969 2,685,989 2,423,234 2,503,778 Profit for the Year 1,713,994 1,702,116 1,340,029 2,182,126 3,717,792 3,918,204 4,250,721 5,054,660 5,187,053 6,802,597
Statement of Financial PositionAssetsCash and Cash Equivalents 1,954,237 4,019,673 1,865,100 6,067,670 6,051,898 2,895,085 5,874,375 4,040,586 6,162,637 6,187,300 Financial Assets Recognised Through Profit or Loss
- Measured at Fair Value 6,740 7,323 7,595 10,063 10,645 10,068 9,683 6,866 4,648 10,862 Financial Assets at Amortised Cost - Loans and Receivables 12,771,108 16,452,987 18,893,238 22,262,761 26,449,169 33,488,779 39,855,398 47,395,025 58,239,254 66,778,188 Financial Assets at Amortised Cost
- Lease Rentals Receivable and Stock Out on Hire 23,686,392 28,271,347 30,299,455 33,695,516 45,104,836 55,660,963 62,489,686 66,050,429 60,626,670 47,359,635 Financial Assets Measured at Fair Value
Through Other Comprehensive Income 128,068 473,739 1,468,602 140,587 138,411 118,021 121,624 89,710 59,141 77,789 Other Financial Assets 1,019,834 1,487,399 5,186,548 2,140,178 4,142,716 6,721,526 6,772,554 10,804,517 9,119,681 10,453,903 Other Non Financial Assets 1,066,622 1,205,230 817,629 1,206,275 538,898 305,047 815,808 1,067,360 967,469 920,406 Investment in Subsidiary - - - - - - 152,915 318,999 521,162 521,162 Property, Plant and Equipment 1,868,286 2,100,939 2,067,928 1,984,160 2,045,295 3,514,356 4,680,619 6,577,379 8,221,248 8,241,259 Intangible Assets 19,340 23,669 36,425 35,305 34,765 49,189 48,119 39,847 41,809 26,021 Deferred Tax Assets 117,779 180,551 171,857 - - - - - - - Total Assets 42,638,405 54,222,859 60,814,380 67,542,519 84,516,636 102,763,035 120,820,780 136,390,718 143,963,719 140,576,525
Liabilities Due to Banks 8,910,255 6,366,217 1,423,642 7,703,265 14,577,233 23,778,147 22,838,038 24,633,508 22,771,085 16,467,179 Financial Liabilities at Amortised Cost - Due to Depositors 27,172,161 38,742,700 46,095,205 45,430,551 53,379,801 60,401,955 72,943,833 83,214,949 89,256,435 85,860,070 Debt Instruments Issued and Other Borrowed Funds 1,541,555 2,244,210 5,475,903 3,529,575 2,601,282 2,044,216 5,152,832 3,107,783 3,111,186 3,113,916 Other Financial Liabilities - 638,011 1,165,526 1,776,066 1,869,940 2,007,402 1,761,418 1,974,490 2,766,410 3,043,526 Other Non Financial Liabilities 757,275 694,933 250,496 516,719 597,806 673,436 852,715 2,070,632 909,266 1,028,054 Current Tax Liabilities 244,831 147,956 103,717 534,744 741,251 691,091 633,058 1,395,971 766,752 1,872,154 Deferred Tax Liabilities - - - 11,930 143,142 503,488 1,058,750 1,309,722 1,037,580 637,073 Post Employment Benefit Liability 44,231 60,230 93,198 112,574 126,858 153,621 231,240 256,512 345,456 365,265 Total Liabilities 38,670,307 48,894,257 54,607,691 59,615,427 74,037,317 90,253,356 105,471,884 117,963,567 120,964,170 112,387,237
EquityStated Capital 838,282 838,282 838,282 838,282 838,282 838,282 838,282 838,282 838,282 838,282 Retained Earnings 2,075,561 2,852,402 3,265,273 5,180,485 6,970,499 8,259,079 10,240,092 12,378,772 15,944,328 19,754,900 Reserves 1,054,254 1,637,917 2,103,132 1,908,324 2,670,537 3,412,318 4,270,522 5,210,097 6,216,939 7,596,106 Total Equity 3,968,097 5,328,601 6,206,688 7,927,091 10,479,319 12,509,680 15,348,896 18,427,151 22,999,549 28,189,288 Total Liabilities and Equity 42,638,405 54,222,859 60,814,380 67,542,519 84,516,636 102,763,035 120,820,780 136,390,718 143,963,719 140,576,525
Stability Leadership Strength Agility Responsibility Sustainability Success Supplementary Information

L B Finance PLC | Annual Report 2020/21400
Quarterly Financial Statements 2020/21
INCOME STATEMENT - COMPANY
For the 3 months ended 1st Quarter 2nd Quarter 3rd Quarter 4th Quarter
30.06.2020 30.06.2019 30.09.2020 30.09.2019 31.12.2020 31.12.2019 31.03.2021 31.03.2020
Rs. '000 Rs. '000 Rs. '000 Rs. '000 Rs. '000 Rs. '000 Rs. '000 Rs. '000
Income 6,625,050 7,723,847 7,597,826 8,025,906 7,472,565 8,024,351 8,070,683 7,448,756
Interest Income 6,253,967 7,261,800 6,908,276 7,532,438 6,972,376 7,496,400 7,323,122 6,869,655
Less: Interest Expenses 3,240,614 3,439,702 3,235,783 3,445,264 2,690,143 3,325,576 2,356,263 3,404,850
Net Interest Income 3,013,353 3,822,098 3,672,493 4,087,174 4,282,233 4,170,824 4,966,859 3,464,805
Fee and Commission Income 354,366 432,995 649,448 452,567 446,631 496,259 734,501 559,806
Net Trading Income 1,426 (761) 1,473 52 1,967 978 1,458 (2,369)
Other Operating Income 15,291 29,813 38,629 40,849 51,591 30,714 11,602 21,664
Total Operating Income 3,384,436 4,284,145 4,362,043 4,580,642 4,782,422 4,698,775 5,714,420 4,043,906
Less: Impairment Charges and Other Losses 1,019,573 357,034 108,136 76,167 440,093 225,537 123,930 1,172,319
Net Operating Income 2,364,863 3,927,111 4,253,907 4,504,475 4,342,329 4,473,238 5,590,490 2,871,587
Less: Operating Expenses
Personnel Expenses 670,670 703,354 785,960 766,062 767,231 766,610 735,962 769,163
Depreciation of Property, Plant and Equipment 176,656 110,225 185,665 113,499 187,459 116,547 179,014 357,237
Amortisation of Intangible Assets 4,487 4,140 4,127 3,994 4,025 3,890 3,806 3,858
Other Operating Expenses 395,168 663,473 481,699 690,950 469,480 639,850 524,482 174,713
Operating Profit before Tax on Financial Services 1,117,882 2,445,919 2,796,456 2,929,970 2,914,134 2,946,341 4,147,226 1,566,616
Less: Tax on Financial Services 215,991 604,813 424,215 704,918 450,132 690,829 578,985 278,000
Profit before Taxation 901,891 1,841,106 2,372,241 2,225,052 2,464,002 2,255,512 3,568,241 1,288,616
Less: Income Tax Expense 263,197 705,907 730,818 853,069 766,091 842,415 743,672 21,843
Profit for the Year 638,694 1,135,199 1,641,423 1,371,983 1,697,911 1,413,097 2,824,569 1,266,773
Income
0
2,000
4,000
6,000
8,000
10,000
(Rs. Mn)
1st Q
uart
er
2nd
Qua
rter
3rd
Qua
rter
4th
Qua
rter
2019/20 2020/21
Profit After Tax
0
500
1,000
1,500
2,000
2,500
3,000
(Rs. Mn)
2019/20 2020/21
1st Q
uart
er
2nd
Qua
rter
3rd
Qua
rter
4th
Qua
rter
Operating Income
0
1,000
2,000
3,000
4,000
5,000
6,000
(Rs. Mn)
1st Q
uart
er
2nd
Qua
rter
3rd
Qua
rter
4th
Qua
rter
2019/20 2020/21
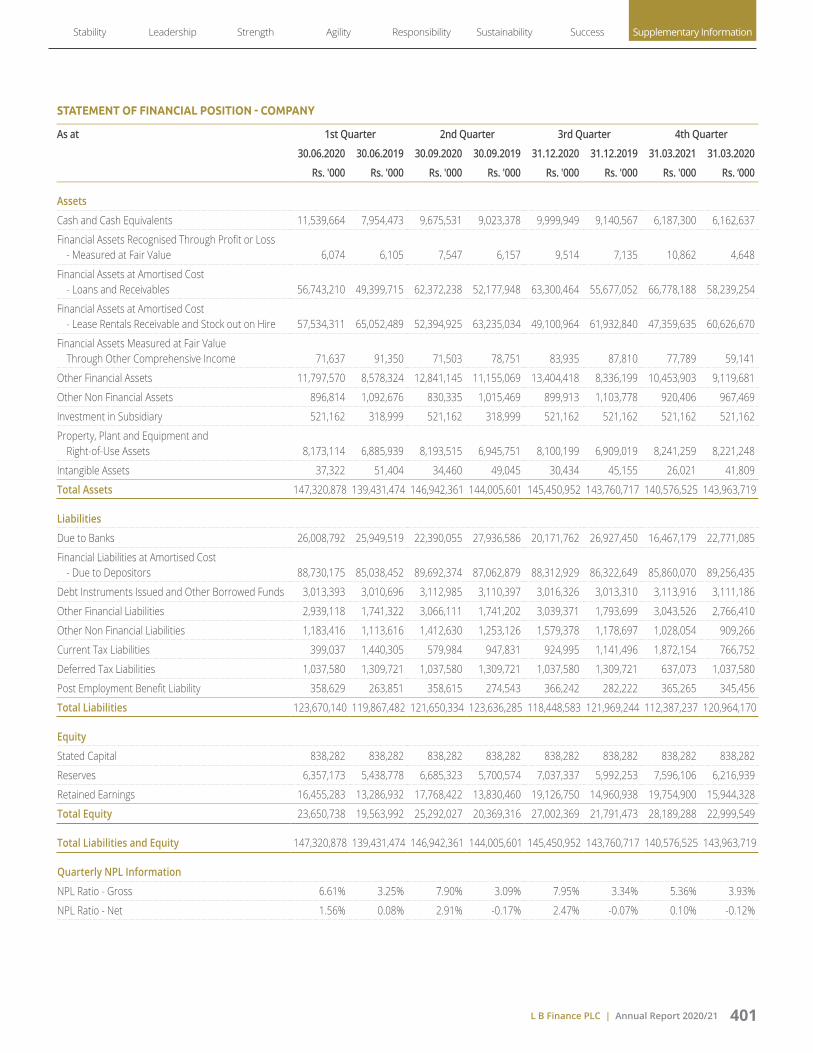
L B Finance PLC | Annual Report 2020/21 401
STATEMENT OF FINANCIAL POSITION - COMPANY
As at 1st Quarter 2nd Quarter 3rd Quarter 4th Quarter
30.06.2020 30.06.2019 30.09.2020 30.09.2019 31.12.2020 31.12.2019 31.03.2021 31.03.2020
Rs. '000 Rs. '000 Rs. '000 Rs. '000 Rs. '000 Rs. '000 Rs. '000 Rs. ‘000
Assets
Cash and Cash Equivalents 11,539,664 7,954,473 9,675,531 9,023,378 9,999,949 9,140,567 6,187,300 6,162,637
Financial Assets Recognised Through Profit or Loss - Measured at Fair Value 6,074 6,105 7,547 6,157 9,514 7,135 10,862 4,648
Financial Assets at Amortised Cost - Loans and Receivables 56,743,210 49,399,715 62,372,238 52,177,948 63,300,464 55,677,052 66,778,188 58,239,254
Financial Assets at Amortised Cost - Lease Rentals Receivable and Stock out on Hire 57,534,311 65,052,489 52,394,925 63,235,034 49,100,964 61,932,840 47,359,635 60,626,670
Financial Assets Measured at Fair Value Through Other Comprehensive Income 71,637 91,350 71,503 78,751 83,935 87,810 77,789 59,141
Other Financial Assets 11,797,570 8,578,324 12,841,145 11,155,069 13,404,418 8,336,199 10,453,903 9,119,681
Other Non Financial Assets 896,814 1,092,676 830,335 1,015,469 899,913 1,103,778 920,406 967,469
Investment in Subsidiary 521,162 318,999 521,162 318,999 521,162 521,162 521,162 521,162
Property, Plant and Equipment and Right-of-Use Assets 8,173,114 6,885,939 8,193,515 6,945,751 8,100,199 6,909,019 8,241,259 8,221,248
Intangible Assets 37,322 51,404 34,460 49,045 30,434 45,155 26,021 41,809
Total Assets 147,320,878 139,431,474 146,942,361 144,005,601 145,450,952 143,760,717 140,576,525 143,963,719
Liabilities
Due to Banks 26,008,792 25,949,519 22,390,055 27,936,586 20,171,762 26,927,450 16,467,179 22,771,085
Financial Liabilities at Amortised Cost - Due to Depositors 88,730,175 85,038,452 89,692,374 87,062,879 88,312,929 86,322,649 85,860,070 89,256,435
Debt Instruments Issued and Other Borrowed Funds 3,013,393 3,010,696 3,112,985 3,110,397 3,016,326 3,013,310 3,113,916 3,111,186
Other Financial Liabilities 2,939,118 1,741,322 3,066,111 1,741,202 3,039,371 1,793,699 3,043,526 2,766,410
Other Non Financial Liabilities 1,183,416 1,113,616 1,412,630 1,253,126 1,579,378 1,178,697 1,028,054 909,266
Current Tax Liabilities 399,037 1,440,305 579,984 947,831 924,995 1,141,496 1,872,154 766,752
Deferred Tax Liabilities 1,037,580 1,309,721 1,037,580 1,309,721 1,037,580 1,309,721 637,073 1,037,580
Post Employment Benefit Liability 358,629 263,851 358,615 274,543 366,242 282,222 365,265 345,456
Total Liabilities 123,670,140 119,867,482 121,650,334 123,636,285 118,448,583 121,969,244 112,387,237 120,964,170
Equity
Stated Capital 838,282 838,282 838,282 838,282 838,282 838,282 838,282 838,282
Reserves 6,357,173 5,438,778 6,685,323 5,700,574 7,037,337 5,992,253 7,596,106 6,216,939
Retained Earnings 16,455,283 13,286,932 17,768,422 13,830,460 19,126,750 14,960,938 19,754,900 15,944,328
Total Equity 23,650,738 19,563,992 25,292,027 20,369,316 27,002,369 21,791,473 28,189,288 22,999,549
Total Liabilities and Equity 147,320,878 139,431,474 146,942,361 144,005,601 145,450,952 143,760,717 140,576,525 143,963,719
Quarterly NPL Information
NPL Ratio - Gross 6.61% 3.25% 7.90% 3.09% 7.95% 3.34% 5.36% 3.93%
NPL Ratio - Net 1.56% 0.08% 2.91% -0.17% 2.47% -0.07% 0.10% -0.12%
Stability Leadership Strength Agility Responsibility Sustainability Success Supplementary Information

L B Finance PLC | Annual Report 2020/21402
Income Statement (Us Dollars)
Year ended 31 March Company Group
2021 2020 2021 2020
US$. '000 US$. '000 US$. '000 US$. '000
Income 148,831 164,331 149,653 165,050
Interest Income 137,289 153,475 138,055 154,195
Less: Interest Expenses 57,614 71,660 57,717 71,744
Net Interest Income 79,675 81,815 80,338 82,451
Fee and Commission Income 10,925 10,219 10,983 10,264
Net Trading Income 32 (11) 32 (11)
Other Operating Income 585 648 583 601
Total Operating Income 91,217 92,671 91,936 93,305
Less: Impairment Charges and Other Losses 8,459 9,637 8,640 9,771
Net Operating Income 82,758 83,034 83,296 83,533
Less: Operating Expenses
Personnel Expenses 14,799 15,817 15,040 15,969
Depreciation of Property, Plant and Equipment 3,644 3,671 3,655 3,677
Amortisation of Intangible Assets 82 84 100 95
Other Operating Expenses 9,354 11,416 9,515 11,520
Total Operating Expenses 27,879 30,986 28,310 31,261
Operating Profit before Tax on Financial Services 54,879 52,048 54,986 52,272
Less: Tax on Financial Services 8,347 11,992 8,347 11,992
Profit before Taxation 46,532 40,055 46,639 40,280
Less: Income Tax Expense 12,519 12,754 12,605 12,854
Profit for the Year 34,013 27,301 34,034 27,426
Profit Attributable to:
Equity Holders of the Company 34,013 27,301 34,034 27,426
Non-Controlling Interest - - - -
Profit for the Year 34,013 27,301 34,034 27,426
Earnings per Share: Basic/Diluted (US$) 0.06 0.05 0.06 0.05
Dividend per Share
Dividend per Share (US$) 0.04 -
Exchange rate of US$ was Rs. 200.00 as at 31 March 2021 (Rs. 190.00 as at 31 March 2020).
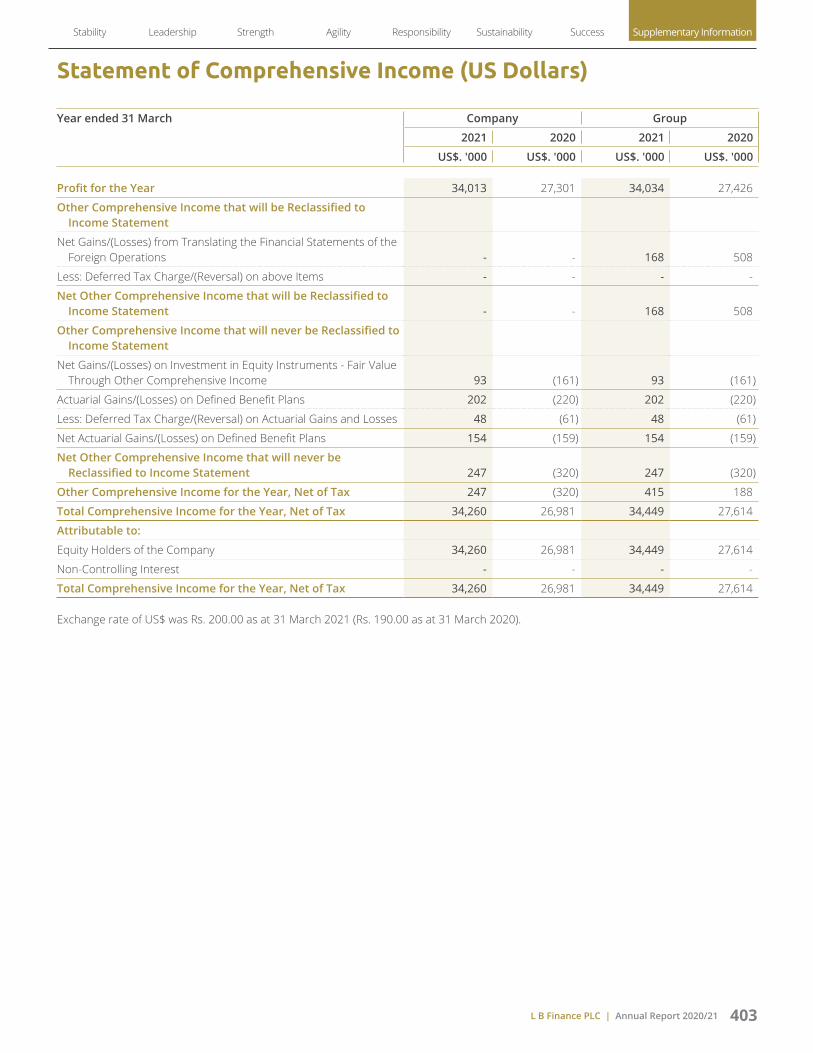
L B Finance PLC | Annual Report 2020/21 403
Statement of Comprehensive Income (US Dollars)
Year ended 31 March Company Group
2021 2020 2021 2020
US$. '000 US$. '000 US$. '000 US$. '000
Profit for the Year 34,013 27,301 34,034 27,426
Other Comprehensive Income that will be Reclassified to Income Statement
Net Gains/(Losses) from Translating the Financial Statements of the Foreign Operations - - 168 508
Less: Deferred Tax Charge/(Reversal) on above Items - - - -
Net Other Comprehensive Income that will be Reclassified to Income Statement - - 168 508
Other Comprehensive Income that will never be Reclassified to Income Statement
Net Gains/(Losses) on Investment in Equity Instruments - Fair Value Through Other Comprehensive Income 93 (161) 93 (161)
Actuarial Gains/(Losses) on Defined Benefit Plans 202 (220) 202 (220)
Less: Deferred Tax Charge/(Reversal) on Actuarial Gains and Losses 48 (61) 48 (61)
Net Actuarial Gains/(Losses) on Defined Benefit Plans 154 (159) 154 (159)
Net Other Comprehensive Income that will never be Reclassified to Income Statement 247 (320) 247 (320)
Other Comprehensive Income for the Year, Net of Tax 247 (320) 415 188
Total Comprehensive Income for the Year, Net of Tax 34,260 26,981 34,449 27,614
Attributable to:
Equity Holders of the Company 34,260 26,981 34,449 27,614
Non-Controlling Interest - - - -
Total Comprehensive Income for the Year, Net of Tax 34,260 26,981 34,449 27,614
Exchange rate of US$ was Rs. 200.00 as at 31 March 2021 (Rs. 190.00 as at 31 March 2020).
Stability Leadership Strength Agility Responsibility Sustainability Success Supplementary Information
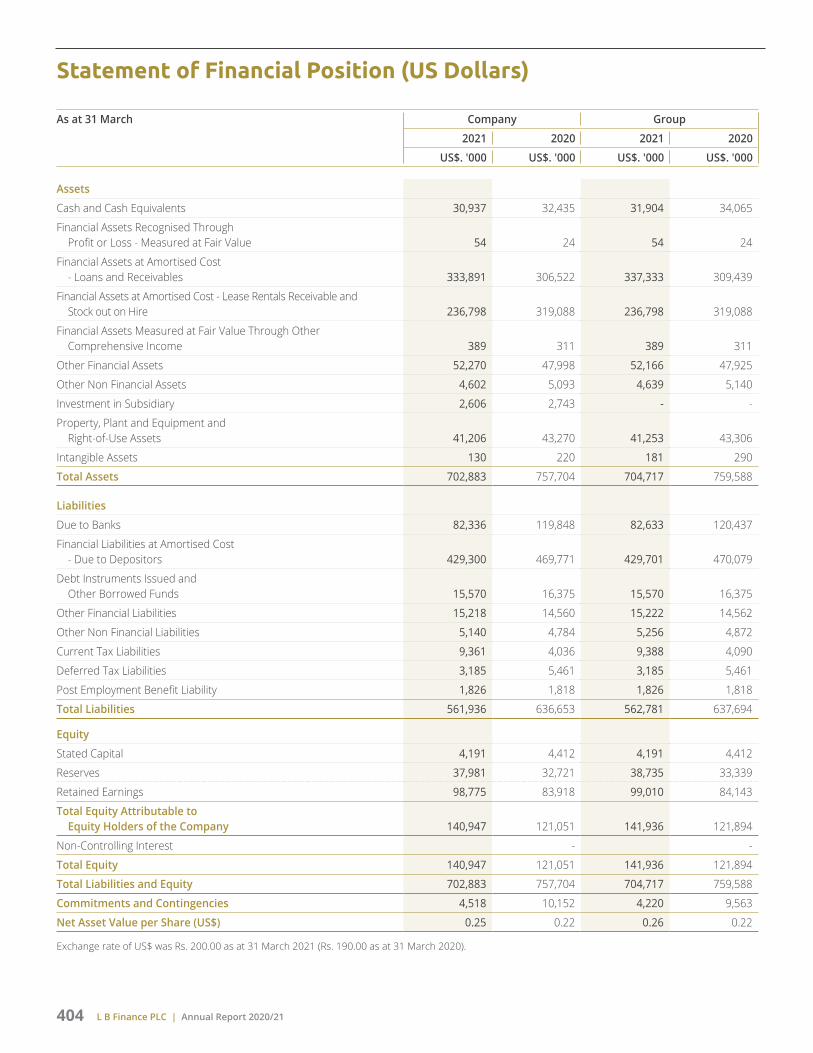
L B Finance PLC | Annual Report 2020/21404
Statement of Financial Position (US Dollars)
As at 31 March Company Group
2021 2020 2021 2020
US$. '000 US$. '000 US$. '000 US$. '000
Assets
Cash and Cash Equivalents 30,937 32,435 31,904 34,065
Financial Assets Recognised Through Profit or Loss - Measured at Fair Value 54 24 54 24
Financial Assets at Amortised Cost - Loans and Receivables 333,891 306,522 337,333 309,439
Financial Assets at Amortised Cost - Lease Rentals Receivable and Stock out on Hire 236,798 319,088 236,798 319,088
Financial Assets Measured at Fair Value Through Other Comprehensive Income 389 311 389 311
Other Financial Assets 52,270 47,998 52,166 47,925
Other Non Financial Assets 4,602 5,093 4,639 5,140
Investment in Subsidiary 2,606 2,743 - -
Property, Plant and Equipment and Right-of-Use Assets 41,206 43,270 41,253 43,306
Intangible Assets 130 220 181 290
Total Assets 702,883 757,704 704,717 759,588
Liabilities
Due to Banks 82,336 119,848 82,633 120,437
Financial Liabilities at Amortised Cost - Due to Depositors 429,300 469,771 429,701 470,079
Debt Instruments Issued and Other Borrowed Funds 15,570 16,375 15,570 16,375
Other Financial Liabilities 15,218 14,560 15,222 14,562
Other Non Financial Liabilities 5,140 4,784 5,256 4,872
Current Tax Liabilities 9,361 4,036 9,388 4,090
Deferred Tax Liabilities 3,185 5,461 3,185 5,461
Post Employment Benefit Liability 1,826 1,818 1,826 1,818
Total Liabilities 561,936 636,653 562,781 637,694
Equity
Stated Capital 4,191 4,412 4,191 4,412
Reserves 37,981 32,721 38,735 33,339
Retained Earnings 98,775 83,918 99,010 84,143
Total Equity Attributable to Equity Holders of the Company 140,947 121,051 141,936 121,894
Non-Controlling Interest - -
Total Equity 140,947 121,051 141,936 121,894
Total Liabilities and Equity 702,883 757,704 704,717 759,588
Commitments and Contingencies 4,518 10,152 4,220 9,563
Net Asset Value per Share (US$) 0.25 0.22 0.26 0.22
Exchange rate of US$ was Rs. 200.00 as at 31 March 2021 (Rs. 190.00 as at 31 March 2020).
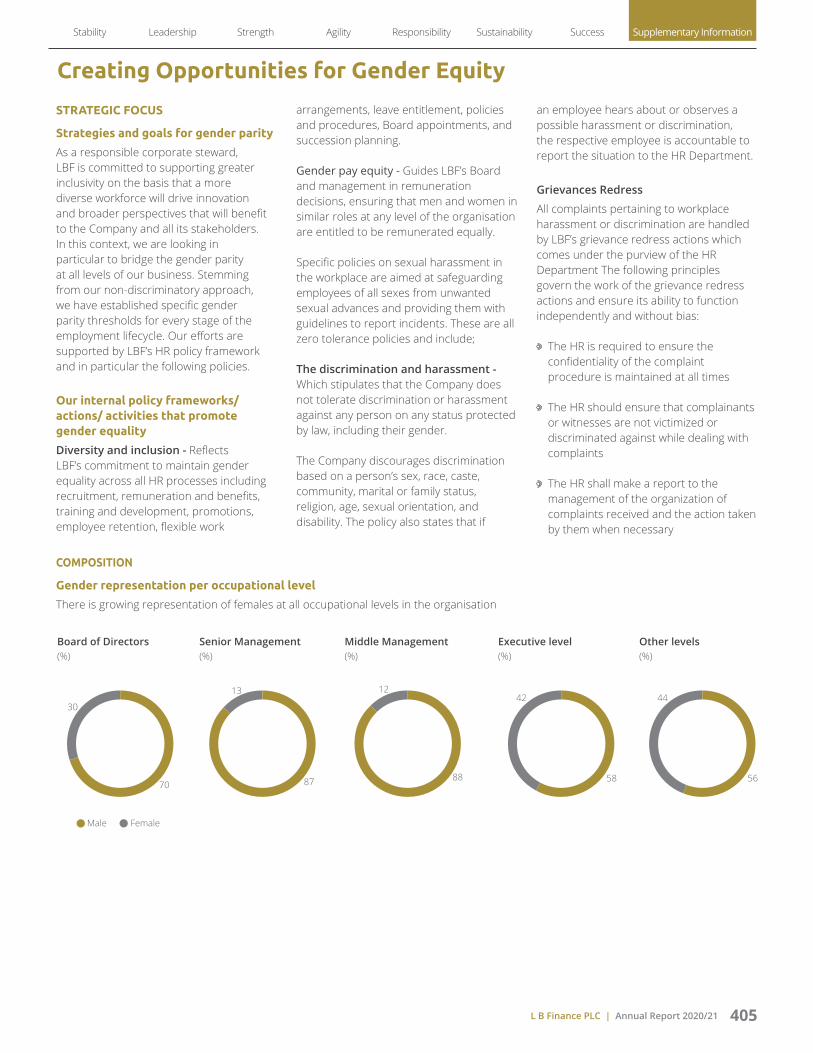
L B Finance PLC | Annual Report 2020/21 405
Creating Opportunities for Gender Equity
STRATEGIC FOCUS
Strategies and goals for gender parity
As a responsible corporate steward, LBF is committed to supporting greater inclusivity on the basis that a more diverse workforce will drive innovation and broader perspectives that will benefit to the Company and all its stakeholders. In this context, we are looking in particular to bridge the gender parity at all levels of our business. Stemming from our non-discriminatory approach, we have established specific gender parity thresholds for every stage of the employment lifecycle. Our efforts are supported by LBF’s HR policy framework and in particular the following policies.
Our internal policy frameworks/ actions/ activities that promote gender equality
Diversity and inclusion - Reflects LBF’s commitment to maintain gender equality across all HR processes including recruitment, remuneration and benefits, training and development, promotions, employee retention, flexible work
arrangements, leave entitlement, policies and procedures, Board appointments, and succession planning.
Gender pay equity - Guides LBF’s Board and management in remuneration decisions, ensuring that men and women in similar roles at any level of the organisation are entitled to be remunerated equally.
Specific policies on sexual harassment in the workplace are aimed at safeguarding employees of all sexes from unwanted sexual advances and providing them with guidelines to report incidents. These are all zero tolerance policies and include;
The discrimination and harassment - Which stipulates that the Company does not tolerate discrimination or harassment against any person on any status protected by law, including their gender.
The Company discourages discrimination based on a person’s sex, race, caste, community, marital or family status, religion, age, sexual orientation, and disability. The policy also states that if
an employee hears about or observes a possible harassment or discrimination, the respective employee is accountable to report the situation to the HR Department.
Grievances Redress
All complaints pertaining to workplace harassment or discrimination are handled by LBF’s grievance redress actions which comes under the purview of the HR Department The following principles govern the work of the grievance redress actions and ensure its ability to function independently and without bias:
The HR is required to ensure the confidentiality of the complaint procedure is maintained at all times
The HR should ensure that complainants or witnesses are not victimized or discriminated against while dealing with complaints
The HR shall make a report to the management of the organization of complaints received and the action taken by them when necessary
COMPOSITION
Gender representation per occupational level
There is growing representation of females at all occupational levels in the organisation
Board of Directors (%)
70
30
Male Female
Senior Management (%)
87
13
Middle Management (%)
88
12
Executive level (%)
58
42
Other levels (%)
56
44
Stability Leadership Strength Agility Responsibility Sustainability Success Supplementary Information

L B Finance PLC | Annual Report 2020/21406
Category 2020/21 2019/20
Gender Gender
Male Female Male Female
Board of Directors 4 - 4 -
Senior Management 27 4 25 4
Middle Management 352 47 317 45
Executive 986 725 971 721
Clerical 732 623 797 621
Minor 56 8 76 2
Total 2,157 1,407 2,190 1,393
Composition of male female representation
Recruitments
Province 2020/21 2019/20
No. of employees No. of employees
Male Female Total Male Female Total
Central 58 11 69 56 22 78
Eastern 50 33 83 60 20 80
Northern 33 29 62 36 15 51
North-central 11 10 21 30 13 43
North-western 25 10 35 54 27 81
Sabaragamuwa 21 9 30 50 7 57
Southern 41 5 46 63 14 77
Uva 28 8 36 28 9 37
Western 374 243 617 487 300 787
Total 641 358 999 864 427 1,291
Promotions
Category 2020/21
Male Female
Board of Directors 1 0
Senior Management 30 2
Middle Management 100 7
Executive 522 568
Clerical 2 2
Minor 3 0
Total 658 579
Creating Opportunities for Gender Equity

L B Finance PLC | Annual Report 2020/21 407
Major geographic location
Province 2020/21 2019/20
No. of employees No. of employees
Male Female Total Male Female Total
Central 203 90 293 192 95 287
Eastern 115 73 188 123 67 190
Northern 74 62 136 69 47 116
North-central 70 31 101 97 33 130
North-western 134 79 213 129 84 213
Sabaragamuwa 112 55 167 113 47 160
Southern 177 77 254 174 82 256
Uva 89 34 123 76 33 109
Western 1,183 906 2,089 1,217 905 2,122
Employee resignations
Reason 2020/21 2019/20
Male Female Total Male Female Total
Resignation 685 366 1,051 918 402 1,320
Retirement 2 - 2 - - -
Premature retirement - - - - - -
Deceased 2 - 2 1 - 1
Termination - 2 2 1 2 3
Total 689 368 1,057 920 404 1,324
GENDER GAP INDICATORS
Category Ratio of basic salary men to women
2020/21 2019/20
Male Female Male Female
Senior Management 1 0.32 1 0.31
Middle Management 1 0.95 1 0.93
Executive 1 0.91 1 0.91
Clerical 1 0.91 1 0.91
SOLUTION FOR THE GENDER GAP
Indicator Explanation of LBF Result
Gender inequality in the Jobs of the future
Economic gender gap from closing is women’s under-representation in emerging roles
03 women represent the LBF Board out of 10 Directors
Female work force participation number of women in leadership position 03 women represent the LBF senior management out of 29 Directors
Closing wage gaps and preparing women for jobs of the future
Benefit structure is based on the performance of the worker
Ther is no wage gap differences
Stability Leadership Strength Agility Responsibility Sustainability Success Supplementary Information

L B Finance PLC | Annual Report 2020/21408
Creating Opportunities for Gender Equity
PROPORTION OF WOMEN WHO RECEIVED TRAINING
Training hours analyzed by gender
Employee category and type of programme
2020/21
Training hours No. of employees
Male Female Total Male Female Total
Senior Management 34 - 34 20 - 20
Technical 12 - 12 10 - 10
Soft skills 22 - 22 10 - 10
Middle Management 505 17 522 216 29 245
Technical 128 12 140 68 18 86
Soft skills 377 5 382 148 11 159
Executives 1,617 1,493 3,164 449 434 883
Technical 609 461 1,071 172 154 326
Soft skills 1,062 1,032 2,093 277 280 557
Clerical 1,581 2,436 4,018 349 593 942
Technical 681 595 1,276 178 204 382
Soft skills 900 1,842 2,742 171 389 560
Minor
Technical - - - - - -
Soft skills - - - - - -
Total 3,791 3,946 7,737 1,034 1,056 4,180
RETENTION OF WOMEN AT WORK 12 MONTHS AFTER MATERNITY LEAVE
Description 2020/21 2019/20
Total number of female employees 1,773 1,833
Total number of employees that were entitled to parental leave, by gender 495 548
Total number of employees that took maternity leave 85 110
Number of employees who returned to work after maternity leave ended 83 104
Number of employees who returned to work after maternity leave ended and still employed twelve months after their return to work
75 73
Return to work rate 98 95
Retention rate 88 66
PROPORTION OF FEMALES WHO RECEIVED A PERFORMANCE BONUS
There is no difference between men and women for the bonus, it is depending on the individual performance.
Current economic models appear to have failed to generate progress and prosperity for all which has resulted in the economic opportunity gap widening this year compared to last year. However, there is statistics to suggest that corporations continue to work towards embedding diversity and inclusion into the heart of their businesses.

L B Finance PLC | Annual Report 2020/21 409
RESPONSIBLE BRAND
Evaluation of gender bias in advertising and communications
There is no evidence to suggest gender bias in LBF’s advertising and communications
Activities that support gender parity of the supply chain
In our supply chain activities we focus only on the quality, reliability and sustainability of suppliers. This ensures LBF’s supply chain decisions are free of any gender bias.
Stability Leadership Strength Agility Responsibility Sustainability Success Supplementary Information

L B Finance PLC | Annual Report 2020/21410
Independent Assurance Report on Sustainability
INDEPENDENT ASSURANCE REPORT TO LB FINANCE PLC ON THE SUSTAINABILITY REPORTING CRITERIA PRESENTED IN THE INTEGRATED ANNUAL REPORT- 2020/21
Introduction and scope of the engagement
The management of LB Finance PLC (“the Company”) engaged us to provide an independent assurance on the following elements of the sustainability reporting criteria presented in the annual report- 2020/21 (“the Report”).
Reasonable assurance on the information on financial performance as specified on page 18 of the Report.
Limited assurance on other information presented in the Report, prepared in accordance with the requirements of the Global Reporting Initiative GRI Standards: ‘In accordance’ – Comprehensive guidelines.
Basis of our work and level of assurance
We performed our procedures to provide limited assurance in accordance with Sri Lanka Standard on Assurance Engagements (SLSAE 3000): ‘Assurance Engagements Other than Audits or Reviews of Historical Financial Information’, issued by the Institute of Chartered Accountants of Sri Lanka (“ICASL”).
The evaluation criteria used for this limited assurance engagement are based on the Sustainability Reporting Guidelines (“GRI Guidelines”) and related information in particular, the requirements to achieve GRI Standards ‘In accordance’ - Comprehensive guideline publication, publicly available at GRI’s global website at “www.globalreporting.org”.
Our engagement provides limited assurance as well as reasonable assurance. A limited assurance engagement is substantially less in scope than a reasonable assurance engagement conducted in accordance with SLSAE-3000 and consequently does not enable to obtain assurance that we would become aware of all significant matters that might be identified in a reasonable assurance engagement. Accordingly,
we do not express an opinion providing reasonable assurance.
Management of the Company’s responsibility for the Report
The management of the Company is responsible for the preparation of the self-declaration, the information and statements contained within the Report, and for maintaining adequate records and internal controls that are designed to support the sustainability reporting process in line with the GRI Sustainability Reporting Guidelines.
Ernst & Young’s responsibility
Our responsibility is to express a conclusion as to whether we have become aware of any matter that causes us to believe that the Report is not prepared in accordance with the requirements of the Global Reporting Initiative, GRI Standards: ‘In accordance’ - Comprehensive guidelines. This report is made solely to the Company in accordance with our engagement letter dated 5 May 2021. We disclaim any assumption of responsibility for any reliance on this report to any person other than the Company or for any purpose other than that for which it was prepared. In conducting our engagement, we have complied with the independence requirements of the Code for Ethics for Professional Accountants issued by the ICASL.
Key assurance procedures
We planned and performed our procedures to obtain the information and explanations considered necessary to provide sufficient evidence to support our limited assurance conclusions. Key assurance procedures included:
Interviewing relevant company personnel to understand the process for collection, analysis, aggregation and presentation of data.
Reviewing and validation of the information contained in the Report.
Checking the calculations performed by the Company on a sample basis through recalculation.
Reconciling and agreeing the data on financial performance are properly derived from the Company’s audited financial statements for the year ended 31 March 2021.
Comparison of the content of the Report against the criteria for a Global Reporting Initiative, GRI Standards: ‘In accordance’ – Comprehensive guidelines.
Our procedures did not include testing electronic systems used to collect and aggregate the information.
Limitations and considerations
Environmental and social performance data are subject to inherent limitations given their nature and the methods used for determining, calculating and estimating such data.
Conclusion
Based on the procedures performed, as described above, we conclude that;
The information on financial performance as specified on page 18 of the Report are properly derived from the audited financial statements of the Company for the year ended 31 March 2021.
Nothing has come to our attention that causes us to believe that other information presented in the Report are not fairly presented, in all material respects, in accordance with the Company’s sustainability practices and policies some of which are derived from Sustainability Reporting Guideline, GRI Standards- ‘In accordance’ Comprehensive.
Ernst & Young
19 May 2021Colombo

L B Finance PLC | Annual Report 2020/21 411
List of Abbreviations
AFS Available for SaleAGM Annual General MeetingALCO Assets and Liabilities Management CommitteeAPSP Average Petroleum Spot PriceASPI All Share Price IndexATM Automated Teller MachineAWDR Average-Weighted Deposit RateAWFDR Average-Weighted Fixed Deposit RateAWPLR Average Weighted Prime Lending RateBFI Banking Finance InsuranceBN BillionBOD Board of DirectorsBPO Business Process OutsourceBPS Basis PointsCAR Capital Adequacy RatioCBSL Central Bank of Sri LankaCDS Central Depository SystemCDM Cash Deposit MachineCMU Customer Management UnitCEO Chief Executive OfficerCFO Chief Financial OfficerCGU Cash Generating UnitCRO Chief Risk OfficerCRM Customer Relationship ManagementCSE Colombo Stock ExchangeCSR Corporate Social ResponsibilityDR Disaster RecoveryEIR Effective Interest RateEPF Employees’ Provident FundEPS Earnings per ShareERP Enterprise Resource Planning SystemESC Economic Service ChargeETF Employees’ Trust FundFVtPL Fair Value through Profit or LossGDP Gross Domestic ProductGRI Global Reporting InitiativeHFT Held for TradingHODs Head of DepartmentsHP Hire PurchaseHTM Held to MaturityICASL The Institute of Chartered Accountants of Sri LankaIFA Investment Fund AccountIFRS International Financial Reporting StandardIIRC Inrernational Integrated Reporting CouncilIRMC Integrated Risk Management CommitteeIRMU Integrated Risk Management UnitISO International Standard OrganisationIT Information TechnologyKMP Key Management Personnel
KPIs Key Performance IndicatorsKRIs Key Risk IndicatorsL&R Loans and ReceivablesLRA Lanka Rating AgencyLBF L B Finance PLCLBMF LB Microfinance Myanmar Company LimitedLCB Licensed Commercial BankLFC Licensed Finance CompanyLKAS Lanka Accounting StandardsLKR Sri Lankan RupeesLTV Loan to ValueMN MillionM3 Cubic MeterMOU Memorandum of UnderstandingMSME Micro, Small and Medium EnterprisesMRMR Monthly Risk Management and ReportingNBFI Non-Bank Financial InstitutionsNBT Nation Building TaxNCRE Non-Conventional Renewable EnergyNPA Non-Performing AdvancesNII Net Interest IncomeNIM Net Interest MarginNPL Non-Performing LoansOCI Other Comprehensive IncomePAT Profit after TaxPAYE Pay As You EarnPDC Product Development CommitteePER Price Earnings RatioPLC Public Limited CompanyRMD Risk Management DepartmentROA Return on AssetsROCE Return on Capital EmployedROE Return on EquityRWA Risk-Weighted AssetsSBUs Strategic Business UnitsSEC Securities and Exchange CommissionSLC Specialised Leasing CompanySLA Statutory Liquid AssetsSLAR Statutory Liquid Asset RatioSLAS Sri Lanka Accounting StandardSLCF Sri Lanka Carbon FundSLFRS Sri Lanka Financial Reporting StandardSLIPS Sri Lanka Inter-Bank Payment SystemSME Small and Medium EnterprisesUOM Unit of MeasurementUSD US DollarVAR Value at RiskVAT Value Added TaxWHT Withholding Tax
Stability Leadership Strength Agility Responsibility Sustainability Success Supplementary Information

L B Finance PLC | Annual Report 2020/21412
Glossary of Terms
AACCOUNTING POLICIES
Accounting policies The specific principles, bases, conventions, rules and practices adopted by an entity in preparing and presenting Financial Statements.
ACCRUAL BASIS
The system of accounting wherein revenue is recognised at the time it is earned and expenses at the time they are incurred, regardless of whether cash has actually been received or paid out.
ALLOWANCE FOR IMPAIRMENT
A provision held on the Statement of Financial Position as a result of the raising of a charge against profit for the incurred loss.
AMORTISATION
The systematic allocation of the depreciable amount of an intangible asset over its useful life. Amortised cost Amount at which the financial asset or financial liability is measured at initial recognition, minus principal repayments, plus or minus the cumulative amortisation using the effective interest method of any difference between that initial amount and the maturity amount and minus any deduction for impairment or uncollectability.
ASSET AND LIABILITY COMMITTEE (ALCO)
The committee that is responsible for managing assets and liabilities of the Company.
AVERAGE WEIGHTED DEPOSIT RATE (AWDR)
AWDR is calculated by the Central Bank monthly based on the weighted average of all outstanding interest bearing deposits of commercial banks and the corresponding interest rates. Average weighted prime lending rate (AWPLR) AWPLR is calculated by the Central Bank weekly based on commercial bank’s lending rates offered to their prime customers during the week
BBASIS POINT (BP)
One hundred of a percentage point (0.01 per cent); 100 basis points is 1 percentage points: Used in quoting movements in interest rates or yields on securities.
CCAPITAL ADEQUACY RATIO
The relationship between capital and risk weighted assets as prescribed by the Central Bank of Sri Lanka.
CASH EQUIVALENTS
Short-term, highly liquid investments that are readily convertible to known amounts of cash and which are subject to an insignificant risk of changes in value.
CASH FLOWS
Cash equivalents are short-term, highly liquid investment that are readily convertible to know amount of cash and which are subject to an insignificant risk of changes in value.
COLLECTIVE IMPAIRMENT
Impairment is measured on a collective basis for homogeneous groups of lending facilities that are not considered as individually significant and to cover losses that have been incurred but has not yet been identified at the reporting date.
COMMERCIAL PAPER (CP)
An unsecured, debt instrument issued by a company, to finance short-term funding requirements. The debt is usually issued at a discount, reflecting prevailing market interest rate.
COMMITMENTS
Credit facilities approved but not yet utilised by the clients as at the reporting date. Compounded annual growth rate (CAGR) The rate at which it would have grown if it grew at an even rate compounded annually.
CONTINGENCIES
A condition or situation existing at reporting date where the ultimate outcome of which, gain or loss, will be confirmed only on the occurrence or non-occurrence of one or more uncertain future events.
COST METHOD
A method of accounting where by the investment is recorded at cost. The Income Statement reflects income from the investment only to the extent that the investor receives distributions from accumulated net profiles of the investee rising subsequent to the date of acquisition.
CORPORATE GOVERNANCE
The process by which corporate entities are governed. It is concerned with the way in which power is exercised over the management and direction of entity, the supervision of executive actions and accountability to owners and others.
CORPORATE SUSTAINABILITY
Business approach that creates long-term consumer and employee value by creating a ‘green’ strategy aimed toward the natural environment and taking into consideration every dimension of how a business operates in the social, cultural and economic environment.
COHORT METHOD
A study design where one or more samples (called Cohorts) are followed prospectively and subsequent status evaluation with or outcome are conducted to determine which initial participants exposure characteristics (risk factors) are associated with it.
COST TO INCOME RATIO
Operating expenses excluding impairment charge/gold loan auction losses as a percentage of total operating income (net of interest expenses).
CREDIT RATING
An evaluation of a corporate’s ability to repay its obligations or the likelihood of not defaulting, carried out by an independent rating agency.
CREDIT RISK
Risk of financial loss, if a customer or counterparty fails to meet an obligation under a contract.

L B Finance PLC | Annual Report 2020/21 413
CREDIT RISK MITIGATION
A technique to reduce the credit risk associated with an exposure by application of credit risk mitigants such as collateral, guarantee and credit protection.
CUSTOMER DEPOSITS
Money deposited by account holders. Such funds are recorded as liabilities.
DDEFERRED TAXATION
Sum set aside for income tax in the Financial Statements that may become payable/receivable in a financial year other than the current financial year.
DEPRECIATION
The systematic allocation of the depreciable amount of an asset over its useful life.
DERECOGNITION
Removal of a previously recognised financial asset or liability from an entity’s Statement of Financial Position.
DISCOUNT RATE
A rate used to place a current value on future cash flows. It is needed to reflect the fact that money has a time value.
DIVIDEND COVER
Profit attributable to ordinary shareholders as a percentage of gross dividends; indicates number of times dividend is covered by current year’s distributable profits.
DIVIDEND PAY-OUT RATIO
Dividend by profit after tax; indicates the percentage of earnings paid out to shareholders as dividends.
DIVIDEND PER SHARE (DPS)
Value of the total dividend paid out and proposed to ordinary shareholders divided by the number of ordinary shares in issue; indicates the proportion of current year’s dividend attributable to an ordinary share in issue.
DIVIDEND YIELD
Dividend expressed as a percentage of market value of a share. In absence of any capital gains, this shows the return on investing on a share relative to its market price.
EEARNINGS PER SHARE (EPS)
Profit attributable to ordinary shareholders divided by the number of ordinary shares in issue; indicates the proportion of current year’s earnings attributable to an ordinary share in issue.
ECONOMIC VALUE ADDED (EVA)
A measure of performance considering cost of total invested equity.
EFFECTIVE INTEREST RATE (EIR)
Rate that exactly discounts estimated future cash payments or receipts through the expected life of the financial asset or liability.
EFFECTIVE TAX RATE
Provision for taxation excluding deferred tax expressed as a percentage of the profit before taxation.
EQUITY METHOD
This is a method of accounting whereby the investment is initially recognised at cost and adjusted thereafter for the post-acquisition changes in the investor’s share of net assets of the investee. The profit or loss and other comprehensive income of the investor include the investor’s share of the profit or loss and other comprehensive income of the investee
EVENTS AFTER THE REPORTING PERIOD
Transactions that are not recognised as assets or liabilities in the Statement of Financial Position, but which give rise to the contingencies and commitments.
EXPOSURE
A claim, contingent claim or position which carries a risk of financial loss.
FFAIR VALUE
The amount for which an asset could be exchanged or a liability settled, between knowledgeable, willing parties in an arm’s length transaction.
FAIR VALUE THROUGH PROFIT OR LOSS
A financial asset or financial liability that is held-for trading or upon initial recognition designated by the entity as fair value through profit or loss.
FINANCE LEASE
A contract whereby a lessor conveys to the lessee the right to use an asset for rent over an agreed period of time which is sufficient to amortise the capital outlay of the lessor. The lessor retains ownership of the asset but transfers substantially all risks and rewards of ownership to the lessee.
FINANCIAL ASSETS
Any asset that is cash, equity instrument of another entity, a contractual right to receive cash or contractual right to receive another financial asset from another entity.
FINANCIAL GUARANTEE CONTRACT
A financial guarantee contract is a contract that requires the issuer to make specified payments to reimburse the holder for a loss it incurs because a specified debtor fails to make payment when due in accordance with the original or modified terms of a debt instrument.
FINANCIAL INSTRUMENT
A financial instrument is any contract that gives rise to both a financial asset in one entity and a financial liability or equity instrument in another entity.
FINANCIAL LIABILITIES
A contractual obligation to deliver cash or other financial asset to another entity or to exchange financial assets or financial liabilities with another entity under conditions that are potentially unfavourable to the entity.
Stability Leadership Strength Agility Responsibility Sustainability Success Supplementary Information
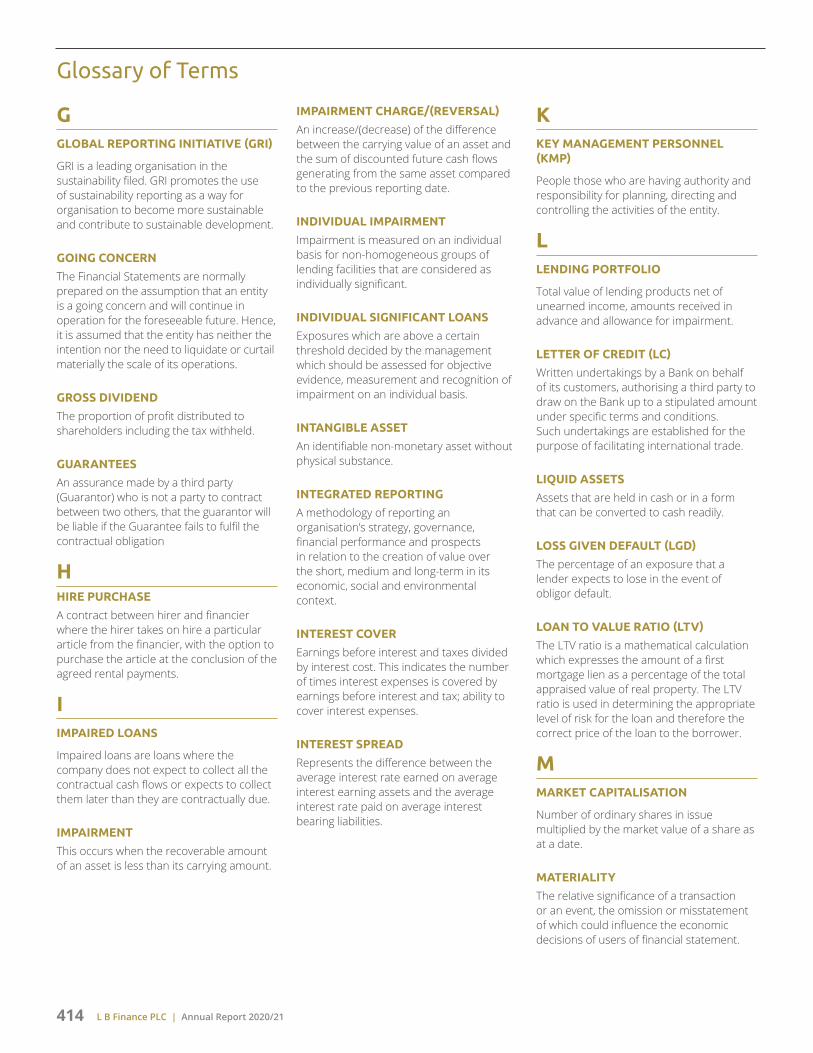
L B Finance PLC | Annual Report 2020/21414
Glossary of Terms
GGLOBAL REPORTING INITIATIVE (GRI)
GRI is a leading organisation in the sustainability filed. GRI promotes the use of sustainability reporting as a way for organisation to become more sustainable and contribute to sustainable development.
GOING CONCERN
The Financial Statements are normally prepared on the assumption that an entity is a going concern and will continue in operation for the foreseeable future. Hence, it is assumed that the entity has neither the intention nor the need to liquidate or curtail materially the scale of its operations.
GROSS DIVIDEND
The proportion of profit distributed to shareholders including the tax withheld.
GUARANTEES
An assurance made by a third party (Guarantor) who is not a party to contract between two others, that the guarantor will be liable if the Guarantee fails to fulfil the contractual obligation
HHIRE PURCHASE
A contract between hirer and financier where the hirer takes on hire a particular article from the financier, with the option to purchase the article at the conclusion of the agreed rental payments.
IIMPAIRED LOANS
Impaired loans are loans where the company does not expect to collect all the contractual cash flows or expects to collect them later than they are contractually due.
IMPAIRMENT
This occurs when the recoverable amount of an asset is less than its carrying amount.
IMPAIRMENT CHARGE/(REVERSAL)
An increase/(decrease) of the difference between the carrying value of an asset and the sum of discounted future cash flows generating from the same asset compared to the previous reporting date.
INDIVIDUAL IMPAIRMENT
Impairment is measured on an individual basis for non-homogeneous groups of lending facilities that are considered as individually significant.
INDIVIDUAL SIGNIFICANT LOANS
Exposures which are above a certain threshold decided by the management which should be assessed for objective evidence, measurement and recognition of impairment on an individual basis.
INTANGIBLE ASSET
An identifiable non-monetary asset without physical substance.
INTEGRATED REPORTING
A methodology of reporting an organisation’s strategy, governance, financial performance and prospects in relation to the creation of value over the short, medium and long-term in its economic, social and environmental context.
INTEREST COVER
Earnings before interest and taxes divided by interest cost. This indicates the number of times interest expenses is covered by earnings before interest and tax; ability to cover interest expenses.
INTEREST SPREAD
Represents the difference between the average interest rate earned on average interest earning assets and the average interest rate paid on average interest bearing liabilities.
KKEY MANAGEMENT PERSONNEL (KMP)
People those who are having authority and responsibility for planning, directing and controlling the activities of the entity.
LLENDING PORTFOLIO
Total value of lending products net of unearned income, amounts received in advance and allowance for impairment.
LETTER OF CREDIT (LC)
Written undertakings by a Bank on behalf of its customers, authorising a third party to draw on the Bank up to a stipulated amount under specific terms and conditions. Such undertakings are established for the purpose of facilitating international trade.
LIQUID ASSETS
Assets that are held in cash or in a form that can be converted to cash readily.
LOSS GIVEN DEFAULT (LGD)
The percentage of an exposure that a lender expects to lose in the event of obligor default.
LOAN TO VALUE RATIO (LTV)
The LTV ratio is a mathematical calculation which expresses the amount of a first mortgage lien as a percentage of the total appraised value of real property. The LTV ratio is used in determining the appropriate level of risk for the loan and therefore the correct price of the loan to the borrower.
MMARKET CAPITALISATION
Number of ordinary shares in issue multiplied by the market value of a share as at a date.
MATERIALITY
The relative significance of a transaction or an event, the omission or misstatement of which could influence the economic decisions of users of financial statement.
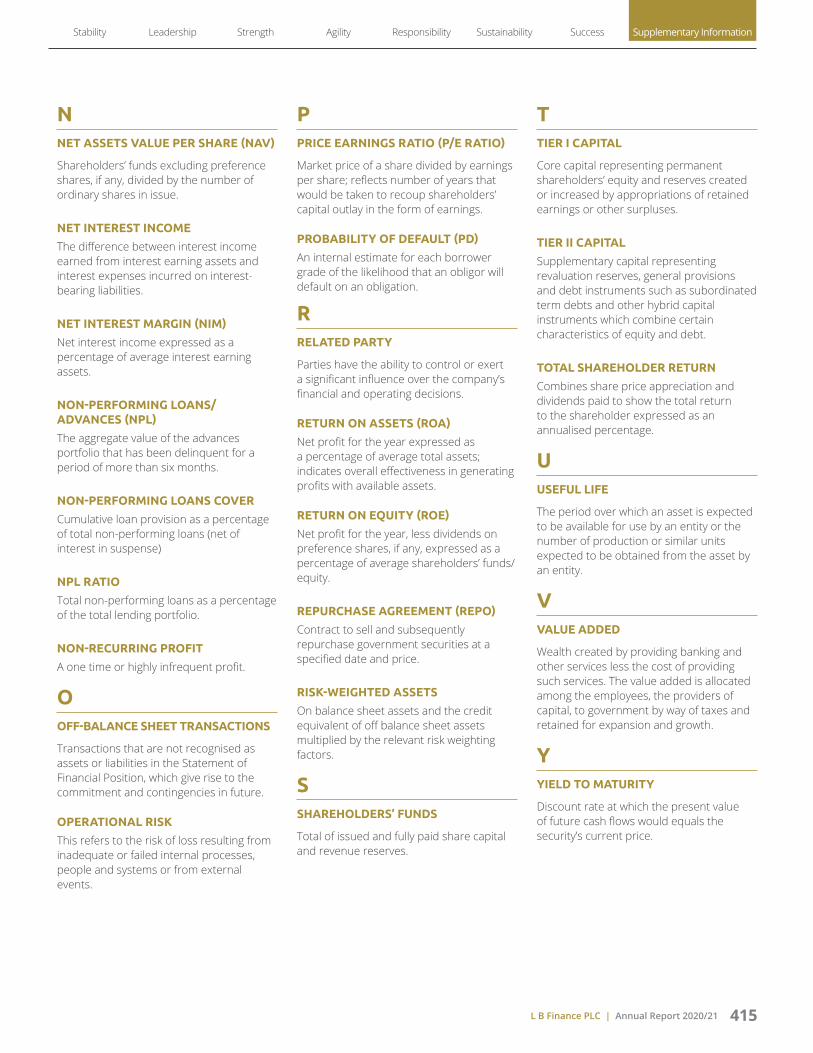
L B Finance PLC | Annual Report 2020/21 415
NNET ASSETS VALUE PER SHARE (NAV)
Shareholders’ funds excluding preference shares, if any, divided by the number of ordinary shares in issue.
NET INTEREST INCOME
The difference between interest income earned from interest earning assets and interest expenses incurred on interest-bearing liabilities.
NET INTEREST MARGIN (NIM)
Net interest income expressed as a percentage of average interest earning assets.
NON-PERFORMING LOANS/ADVANCES (NPL)
The aggregate value of the advances portfolio that has been delinquent for a period of more than six months.
NON-PERFORMING LOANS COVER
Cumulative loan provision as a percentage of total non-performing loans (net of interest in suspense)
NPL RATIO
Total non-performing loans as a percentage of the total lending portfolio.
NON-RECURRING PROFIT
A one time or highly infrequent profit.
OOFF-BALANCE SHEET TRANSACTIONS
Transactions that are not recognised as assets or liabilities in the Statement of Financial Position, which give rise to the commitment and contingencies in future.
OPERATIONAL RISK
This refers to the risk of loss resulting from inadequate or failed internal processes, people and systems or from external events.
PPRICE EARNINGS RATIO (P/E RATIO)
Market price of a share divided by earnings per share; reflects number of years that would be taken to recoup shareholders’ capital outlay in the form of earnings.
PROBABILITY OF DEFAULT (PD)
An internal estimate for each borrower grade of the likelihood that an obligor will default on an obligation.
RRELATED PARTY
Parties have the ability to control or exert a significant influence over the company’s financial and operating decisions.
RETURN ON ASSETS (ROA)
Net profit for the year expressed as a percentage of average total assets; indicates overall effectiveness in generating profits with available assets.
RETURN ON EQUITY (ROE)
Net profit for the year, less dividends on preference shares, if any, expressed as a percentage of average shareholders’ funds/equity.
REPURCHASE AGREEMENT (REPO)
Contract to sell and subsequently repurchase government securities at a specified date and price.
RISK-WEIGHTED ASSETS
On balance sheet assets and the credit equivalent of off balance sheet assets multiplied by the relevant risk weighting factors.
SSHAREHOLDERS’ FUNDS
Total of issued and fully paid share capital and revenue reserves.
TTIER I CAPITAL
Core capital representing permanent shareholders’ equity and reserves created or increased by appropriations of retained earnings or other surpluses.
TIER II CAPITAL
Supplementary capital representing revaluation reserves, general provisions and debt instruments such as subordinated term debts and other hybrid capital instruments which combine certain characteristics of equity and debt.
TOTAL SHAREHOLDER RETURN
Combines share price appreciation and dividends paid to show the total return to the shareholder expressed as an annualised percentage.
UUSEFUL LIFE
The period over which an asset is expected to be available for use by an entity or the number of production or similar units expected to be obtained from the asset by an entity.
VVALUE ADDED
Wealth created by providing banking and other services less the cost of providing such services. The value added is allocated among the employees, the providers of capital, to government by way of taxes and retained for expansion and growth.
YYIELD TO MATURITY
Discount rate at which the present value of future cash flows would equals the security’s current price.
Stability Leadership Strength Agility Responsibility Sustainability Success Supplementary Information

L B Finance PLC | Annual Report 2020/21416
Corporate Information
NAME OF COMPANY
L B Finance PLC
LEGAL FORM
Public Limited Liability Company Incorporated in Sri Lanka under the provisions of the Companies Ordinance No. 51 of 1938 (Cap 145) and reregistered as per the Companies Act No. 07 of 2007 on 6th June 2008.
A Licensed Finance Company under the Finance Business Act No. 42 of 2011.
A registered Financed Leasing Establishment in terms of Finance Leasing Act No. 56 of 2000.
STOCK EXCHANGE LISTING
The Company was admitted to the official List of the Colombo Stock Exchange on 30th December 1997. The ordinary shares and senior and subordinated unsecured, redeemable rated, debentures redeemable in 2022 of the Company are listed on the Colombo Stock Exchange.
DATE OF INCORPORATION
30th May 1971
COMPANY REGISTRATION NUMBER
PQ 156
TAX PAYER IDENTIFICATION NUMBER
104033431
VAT REGISTRATION NUMBER
104033431 7000
CENTRAL BANK REGISTRATION NUMBER
RFC 1003
PRINCIPAL ACTIVITIES
The Company provides a comprehensive range of financial services encompassing Acceptance of Fixed Deposits, Maintenance of Savings Accounts, Providing Finance Lease and operating leases, Hire Purchase, Mortgage Loans, Gold Loans, Personal Loans, Factoring, Other Credit Facilities, Digital Financial Services and Value-Added Services.
Company’s subsidiary, LB Microfinance Myanmar Company Limited carried on microfinance lending in Myanmar.
REGISTERED OFFICE
No. 275/75, Prof. Stanley Wijesundara Mawatha, Colombo 07.
Tel: 011- 2 200 000 Fax: 011-5 345 327
CORPORATE OFFICE
No. 20, Dharmapala Mawatha, Colombo 03.
Tel: 011-2 155 000 Fax: 011-2 575 098
OUTLETS
Branches - 152
Gold loan centres - 17
WEBSITE
www.lbfinance.com
FINANCIAL YEAR END
31 March
CREDIT RATING
The Company has been assigned A- (lka) stable outlook by Fitch Ratings Lanka Limited
BOARD OF DIRECTORS AND BOARD APPOINTED COMMITTEES
Board of Directors
Mrs. Anandhiy Gunawardhana (Chairperson)
Mr. Dhammika Perera (Executive Deputy Chairman)
Mr. Sumith Adhihetty (Managing Director)
Mr. Niroshan Udage (Deputy Managing Director)
Mr. B D A Perera (Executive Director)
Mr. Ravindra Yatawara (Executive Director)
Mrs. Yogadinusha Bhaskaran (Non-Executive Director)
Mr. Ashane Jayasekara(Independent Non-Executive Director)
Mrs. Ashwini Natesan(Independent Non-Executive Director)
Mr. Dharmadasa Rangalle (Non-Executive Director)
Audit Committee
Mrs. Yogadinusha Bhaskaran (Chairperson)
Mrs. Anandhiy Gunawardhana
Mr. Ashane Jayasekara
Remuneration Committee
Mr. Ashane Jayasekara (Chairman)
Mrs. Anandhiy Gunawardhana
Mrs. Yogadinusha Bhaskaran
Nomination Committee
Mr. Ashane Jayasekara (Chairman)
Mrs. Anandhiy Gunawardhana
Mr. Sumith Adhihetty

L B Finance PLC | Annual Report 2020/21 417
Related Party Transaction Review Committee
Mrs. Ashwini Natesan (Chairperson)
Mr. Ashane Jayasekara
Mr. Dharmadasa Rangalle
Integrated Risk Management Committee
Mr. Ashane Jayasekara (Chairman)
Mrs. Anandhiy Gunawardhana
Mrs. Ashwini Natesan
Mr. Sumith Adhihetty
Mr. Niroshan Udage
Mr. B D A Perera
Mr. Ravindra Yatawara
Mr. Bimal Perera
Mr. Malith Hewage
Mr. B S Pulle
Mrs. Deshika Yatawara
Mrs. Waruni Perera
SECRETARIES
P W Corporate Secretarial (Pvt) Ltd. No. 3/17, Kynsey Road, Colombo 08 Tel: 011- 4640360-3Fax: 011- 4740588Email: [email protected]
EXTERNAL AUDITORS
Ernst & Young
INTERNAL AUDITORS
KPMG
BANKERS
Bank of Ceylon
Commercial Bank of Ceylon PLC
DFCC Bank PLC
Hatton National Bank PLC
National Development Bank PLC
Nations Trust Bank PLC
Pan Asia Banking Corporation PLC
People’s Bank
Sampath Bank PLC
Seylan Bank PLC
Standard Chartered Bank
Union Bank of Colombo PLC
Habib Bank Limited
Public Bank Berhad
Deutsche Bank
CORPORATE MEMBERSHIPS AND ASSOCIATIONS
The Finance Houses Association of Sri Lanka
Leasing Association of Sri Lanka
The Ombudsman Sri Lanka (Guarantee) Limited
Mercantile Cricket Association Mercantile FootballAssociation
SUBSIDIARY COMPANY
LB Microfinance Myanmar Company Limited (Company incorporated in the Union of the Republic of Myanmar)
COMPANY REGISTRATION NUMBER OF SUBSIDIARY
844 FC of 2016-2017 (YGN)
REGISTERED OFFICE OF SUBSIDIARY
Myawaddy BankLuxury Complex, 4th Floor, Apt 401 Bo Gyoke Road cnr, W a Dan Street, Lanmadaw Township, Yangon, Myanmar
BOARD OF DIRECTORS OF SUBSIDIARY
Mr. Dhammika Perera
Mr. Sumith Adhihetty
Mr. Niroshan Udage
Mr. B D A Perera
Mr. Ravindra Yatawara
Mr. Dulan de Silva
Stability Leadership Strength Agility Responsibility Sustainability Success Supplementary Information

L B Finance PLC | Annual Report 2020/21418
Notice of Annual General Meeting
NOTICE IS HEREBY GIVEN that the Forty Eighth (48th) Annual General Meeting of L B Finance PLC will be held as a Hybrid Meeting (hybrid of physical and electronic means) centred at the Auditorium of the Corporate Office of the Company, No. 20, Dharmapala Mawatha, Colombo 3 on Wednesday, 30th June 2021 at 8.30 a.m to conduct the following businesses:
1 To receive and consider the Annual Report of the Board of Directors on the affairs of the Company and its subsidiary and the Financial Statements for the year ended 31st March 2021 and the Report of the Auditors thereon.
2. To declare a final dividend as recommended by the Directors.
3. To re-elect Mrs Ashwini Natesan as a Director in terms of Articles 85 and 86 of the Articles of Association of the Company.
4 To re-elect Mr Dharmadasa Rangalle as a Director in terms of Articles 85 and 86 of the Articles of Association of the Company
5. To pass the ordinary resolution set out below to re-appoint Mr John Anthony Sunil Sumith Adhihetty who attained the age of 70 years on 4th July 2020, as a Director of the Company
“IT IS HEREBY RESOLVED THAT the age limit stipulated in Section 210 of the Companies Act No.07 of 2007 shall not apply to Mr John Anthony Sunil Sumith Adhihetty who attained the age of 70 years on 4th July 2020 and that he be and is hereby re-appointed a Director of the Company.”
6. To re-appoint the retiring Auditors Messrs Ernst & Young, Chartered Accountants, as the Company’s Auditors and to authorize the Directors to determine their remuneration.
7. To authorize the Directors to determine donations for the year ending 31st March 2022 and up to the date of the next Annual General Meeting.
By Order of the BoardL B Finance PLC
P W Corporate Secretarial (Pvt) LtdSecretaries
7th June 2021
Notes:
1. A shareholder is entitled to appoint a Proxy to attend and vote at the meeting on his/her behalf, in accordance with the instructions in that regard as contained in the Circular to Shareholders, dated 7th June 2021.
2. A Proxy need not be a shareholder of the Company.
3. A Form of Proxy accompanies this Notice.
4. For more information on how to participate in the above Hybrid Meeting, please refer to the Circular to Shareholders dated 7th June 2021.

L B Finance PLC | Annual Report 2020/21 419
Form of Proxy
I/We* ………………………………………………………………….......................………………….......................…………………...................…………………...................…………………....
(holder of NIC No. ....................................) of …...........……………………………………………….......……............…….................……... shareholder/s of L B FINANCE
PLC hereby appoint ……………………………….......…….......…….......…….......……....…………………...................…………………...................……........……………...............
(holder of NIC No. ....................................) of ………………………………....………………………...............………………………………………………………...…………………………
or failing him*
Mrs. Anandhiy Krisnajina Gunawardhana or failing her *
Mr Dhammika Perera or failing him*
Mr John Anthony Sunil Sumith Adhihetty or failing him*
Mr. Niroshan Udage or failing him*
Mr. Biyanwilage Dudley Auburn Perera or failing him*
Mr. Ravindra Shanaka Yatawara or failing him*
Mrs. Yogadinusha Bhaskaran or failing her*
Mr. Moderage Ashane Joseph Wass Jayasekara or failing him*
Mrs Ashwini Natesan or failing her*
Mr. Dharmadasa Rangalle
as my/our* proxy to represent me/us* to speak and to vote as indicated hereunder for me/us* and on my/our* behalf at the Forty Eighth (48th) Annual General Meeting of the Company to be held on 30th June 2021 and at every poll which may be taken in consequence of the aforesaid meeting and at any adjournment thereof.
For Against
1. To declare a final dividend as recommended by the Directors
2. To re-elect Mrs Ashwini Natesan as a Director in terms of Articles 85 and 86 of the Articles of Association of the Company
3. To re-elect Mr. Dharmadasa Rangalle as a Director in terms of Articles 85 and 86 of the Articles of Association of the Company
4. To pass the ordinary resolution set out below to re-appoint Mr John Anthony Sunil Sumith Adhihetty who attained the age of 70 years on 4th July 2020 as a Director of the Company
“IT IS HEREBY RESOLVED THAT the age limit stipulated in Section 210 of the Companies Act No.07 of 2007 shall not apply to Mr John Anthony Sunil Sumith Adhihetty who attained the age of 70 years on 4th July 2020 and that he be and is hereby re-appointed a Director of the Company.”
5. To re-appoint the retiring Auditors Messrs Ernst & Young, Chartered Accountants as the Company’s Auditors and authorise the Directors to determine their remuneration
6. To authorize the Directors to determine donations for the year ending 31st March 2022 up to the date of the next Annual General Meeting
In witness my/our* hands this …………………………… day of …………………………. Two Thousand and Twenty one.
………………………………..............Signature of Shareholder/s
*Please delete what is inapplicable.

L B Finance PLC | Annual Report 2020/21420
Form of Proxy
INSTRUCTIONS FOR COMPLETION
1. The full name, National Identity Card number and the registered address of the shareholder appointing the Proxy and the relevant details of the Proxy should be legibly entered in the Form of Proxy which should be duly signed and dated.
2. ThecompletedProxyshouldbedepositedattheRegisteredOfficeoftheCompany,No.275/75,ProfessorStanleyWijesunderaMawatha,Colombo07orbeemailedtolfin.pwcs@gmail.comby8.30a.m.on28thJune2021.
3. TheProxyshall–
(a) Inthecaseofanindividualbesignedbytheshareholderorbyhis/herattorney,andifsignedbyanAttorney,anotariallycertifiedcopyofthePowerofAttorneyshouldbeattachedtothecompletedProxyifithasnotalreadybeenregisteredwiththeCompany.
(b) Inthecaseofacompanyorcorporate/statutorybodyeitherbeunderitsCommonSealorsignedbyitsAttorneyorbyanOfficeronbehalfofthecompanyorcorporate/statutorybodyinaccordancewithitsArticlesofAssociationortheConstitutionortheStatute(asapplicable).
4. Pleaseindicatewitha‘X’howtheProxyshouldvoteoneachresolution.Ifnoindicationisgiven,theProxyinhis/herdiscretionwillvoteashe/shethinksfit.
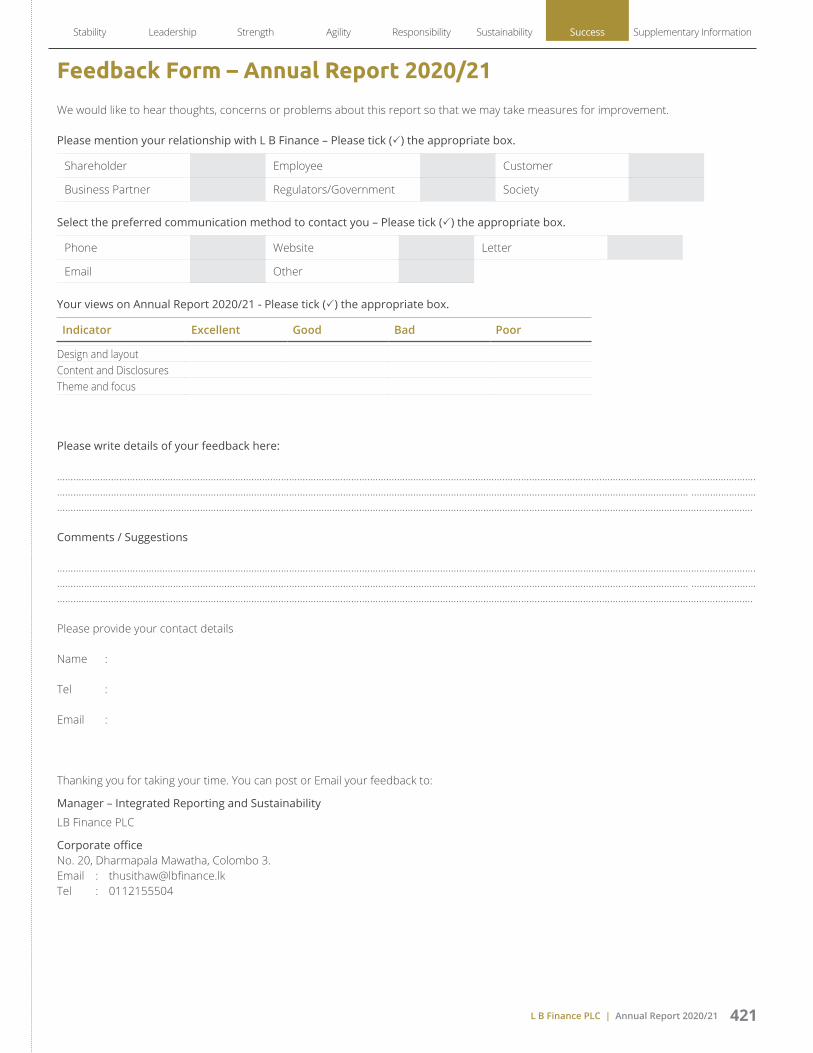
L B Finance PLC | Annual Report 2020/21 421
Stability Leadership Strength Agility Responsibility Sustainability Success Supplementary Information
Feedback Form – Annual Report 2020/21
We would like to hear thoughts, concerns or problems about this report so that we may take measures for improvement.
Please mention your relationship with L B Finance – Please tick () the appropriate box.
Shareholder Employee Customer
Business Partner Regulators/Government Society
Select the preferred communication method to contact you – Please tick () the appropriate box.
Phone Website Letter
Email Other
Your views on Annual Report 2020/21 - Please tick () the appropriate box.
Indicator Excellent Good Bad Poor
Design and layoutContent and DisclosuresTheme and focus
Please write details of your feedback here:
……………………………………………………………………………….…………………………………………….…………………………………..…………………………………………………………………………………………………………………………………………………………………………………………………………………………………………………………………….....………. …………………………………………………………………………………………………………………………………….....……….………………….....……….………………….....……….………………….....………..........
Comments / Suggestions
……………………………………………………………………………….…………………………………………….…………………………………..…………………………………………………………………………………………………………………………………………………………………………………………………………………………………………………………………….....………. …………………………………………………………………………………………………………………………………….....……….………………….....……….………………….....……….………………….....……….………
Please provide your contact details
Name :
Tel :
Email :
Thanking you for taking your time. You can post or Email your feedback to:
Manager – Integrated Reporting and Sustainability
LB Finance PLC
Corporate officeNo. 20, Dharmapala Mawatha, Colombo 3.Email : [email protected] : 0112155504


Designed & produced by
Printing by Gunaratne Offset (Pvt) Ltd