
Matter of - LB Finance PLC
452
L B Finance PLC | Annual Report 2017/18 Matter of F A C T Unmatched value creation Best-in-class products State-of-the-art digital technologies Talented, experienced people Customer-friendly approach
-
Upload
khangminh22 -
Category
Documents
-
view
0 -
download
0
Transcript of Matter of - LB Finance PLC

L B Finance PLC | Annual Report 2017/18
Matter of
FACTUnmatched value creation
Best-in-class products
State-of-the-art digital technologies
Talented, experienced people
Customer-friendly approach


These are some of the facts that matter in the analysis of any progressive company. They are also the reasons why we are now one of the nation’s most respected creators of value. We’ve spent the past 47 years expanding and fine-tuning our product and service portfolio, to create an unmatched financial service experience for the many stakeholders we serve. From corporate customers and small and medium industries to individual customers, we have served a diversity of Sri Lankans with real value. Today our portfolio includes everything from fixed deposits, savings accounts, leasing, loans and microfinance to factoring and trade finance; making us one of the most versatile non-banking financial institutions in Sri Lanka today.
This report records another year of excellence in service, performance and value creation for our many stakeholders. We also describe how we drove your company to a new level; the streamlining of our systems and processes and the improvements to customer convenience we made through our recent investments into state of the art digital technology, that will transform the speed and accessibility of the products and services we offer.
We’re changing the way people work and live and evolving our business model to be best in class financial institution.
And that’s a matter of fact.
Matter of
FACTUnmatched value creation
Best-in-class products
State-of-the-art digital technologies
Talented, experienced people
Customer-friendly approach

Contents4-28 118-177
202-290
419-447
308-324
34-114
ORGANISATIONAL OVERVIEW
About our integrated report .............4About us ........................................12Strategic journey ............................14Awards ..........................................16We are carbon neutral ...................17Managing structure .......................18Financial highlights ........................20Non-financial highlights ..................22Letter from the chairperson ...........24Managing director’s review ...........28
MANAGEMENT DISCUSSION AND ANALYSIS
Business model : Our value creation story ...........118Business model : our activities and their impacts ............................120Stakeholder engagement ............124Our material matters ...................133Strategic focus and resource allocation ...................143Sustainability context ...................148Corporate social responsibility review ................153Operating environment ................154Business review ..........................159Risk management ........................177
CAPITAL REPORTS
Capital reports Financial capital ........................202 Intellectual capital ....................228 Manufactured capital ...............238 Human capital ..........................246 Social and relationship capital ................264 Natural capital ..........................290
SUPPLEMENTARY INFORMATION
Decade at a glance ......................419Quarterly financial statements 2017 ......................422Branch network ...........................424Gold loan centres .........................428List of abbreviations ....................429Independent assurance report on sustainability .............430Sustainability committee review ....................432Consolidated set of GRI sustainability reporting standards ..................434Glossary of terms ........................440Corporate information ..................444Notice of Annual general meeting ...........445 Form of proxy ..............................447
GOVERNANCE
Board of directors ..........................34Senior management ......................40Chairperson’s message .................44Corporate governance ...................46Annual report of the board of directors on the affairs of the company ....................................98Remuneration committee report .......................................108Nomination committee report ...........................................109Audit committee report ...............110Integrated risk management committee report .....................112Report of the related party transactions review committee ....................114
FINANCIAL REPORTS
Financial statement highlights .....308Financial calendar ........................310Directors’ responsibility statement on internal control over financial reporting ...................................311Directors’ responsibility for financial reporting .....................312Independent auditors’ report .......313Financial statement table of content ........................316Income statement .......................317Statement of comprehensive income ............318Statement of financial position ....319Statement of changes in equity- company ...................320Statement of changes in equity- group ........................321Statement of cash flow ...............322Notes to the financial statements .................324

L B Finance PLC Annual Report 2017/18 3
To contribute to the quality of life experienced by our depositors,
customers, employees and the general public through partnerships
that fuel the growth of our Company and to create shareholder
value both in the short- and long-term.
Excellence
Ethics
Professionalism
Transparency
Innovation
Quality
To be a major player in the financial services sector in
Sri Lanka
To mobilise public funds by innovating investment products that
will enhance the value delivered to our depositors.
To engage in prudent lending to entrepreneurs to assist them in the
creation of wealth.
To embark on investments in which results can be clearly assessed
and seize new opportunities in the market.
To offer a caring and personalised service that will form
the foundation for developing lasting partnerships with our
stakeholders, employees and the general public.
To use training and career development to create an empowered
and committed group of employees who will drive the Company to
high levels of achievement.
Vision
Mission
Values
Goals

4 L B Finance PLC Annual Report 2017/18
About Our 2017/18 Integrated ReportOUR 6TH INTEGRATED REPORT
Our 2017/ 18 Annual Report has been presented as an ‘Integrated Report’ with the aim of articulating how L B Finance PLC (LBF), as an organisation, has effectively managed its business to deliver consistent value to its stakeholders. Accordingly, the report encompasses the efforts the Company has undertaken to contribute towards economic prosperity, environmental sustainability and social well-being for a brighter and more optimistic future.
Our 2016/17Annual Report
Our 2017/18Annual Report
OUR AUDIENCE
Our long-term providers of capital are the primary audience of our integrated report. However, our value creation activities benefit and impact a wider range of stakeholders whose interests are also specifically covered in this report, in line with our shared value creation principle.
BENCHMARKING
We benchmark our performance against our peers based on publicly available information. While consistent benchmarks are not always readily available, we have included these where relevant so that readers can measure LBF’s performance relative to peers.
SCOPE AND BOUNDARY
Our Integrated Report details our performance for the 2017/18 financial year, covering the period 1 April 2017 and 31 March 2018. Reflecting our integrated thinking, the report extends beyond financial reporting and includes non-financial performance, including opportunities and risks, which have a significant influence on our ability to create value along with the strategies adopted and stakeholder outcomes resulting from strategies. To demonstrate LBF’s performance in this context, this report has been prepared in accordance with the Global Reporting Initiatives (GRI) standards ‘Comprehensive Option’.
THE SIX CAPITALS AND MATERIALITY
This Integrated Annual Report is structured around the matters we consider to be most material to the sustainability of our Company and the strategies adopted during the year to address these matters, with special emphasis given to those matters which have or could have
the ability to influence our financial performance or our reputation, or impact on our operations. We report on our performance in managing these material matters through the International Integrated Reporting Council (IIRC) six capitals model of value creation.
While we have adopted the six capitals categorisation, based on our understanding of the IIRC’s guidance, our report explains our dependence and impact on the forms of capital that are fundamental to our ability to create value over the long-term. We have not structured this report using the capitals but have embedded them within each section to enable us to plot the interrelationships and trade-offs between them in relation to the Company and individual business unit strategies.
Financial Capital
Our shareholders’ equity and funding from investors and clients that are used to support our business and operational activities, including credit extension (advances). Pages 202 to 227
Human Capital
Our people, investing in their development and our collective knowledge, skills and experience to enable innovative and competitive solutions for our customers. Pages 246 to 263
GRI - 102 - 46, 50, 51, 52, 54

L B Finance PLC Annual Report 2017/18 5
STATEMENT BY THE BOARD
The Board acknowledges its responsibility to ensure the integrity of the annual Integrated Report and is of the opinion that the report addresses all material issues that it believes to have a bearing on the Company’s capacity to create value over the short- medium- and long-term. The report was unanimously approved by the Board and is signed on its behalf by
ChairpersonOn behalf of the Board of Directors
Manufactured Capital
Our business structure and operational processes, including our physical and digital infrastructure, our products, as well as our information technology that provides the framework and mechanics of how we do business and make money. Pages 238 to 245
Intellectual Capital
Our brand and franchise value, research and development, innovation capacity, reputation and strategic partnerships. Pages 228 to 237
Social and Relationship Capital
Our citizenship and strong stakeholder relationships, including the communities we operate in, as we recognise that the Company plays an important role in building a strong and thriving society. Pages 264 to 289
Natural Capital
Our positive and negative impact on natural resources through our operations and business activities. Pages 290 to 305
ASSURANCE
We used a combination of internal controls, management assurance and compliance, and internal reviews to ensure the accuracy of our Integrated Report. The content included in this Report has been approved by the respective business heads and financial information reviewed by the Audit committee reviewed prior to submission to the Board of Directors for approval. Our Report is consistent with the requirement of GRI standards and prepared in accordance with the said requirements. Messrs. Ernst & Young, Chartered Accountants have provided an independent assurance statement that further verifies LBF’s compliance with financial reporting and the GRI Standards. Page 434.
FORWARD-LOOKING STATEMENTS – FUTURE OUTLOOK
This announcement contains certain future outlook statements with respect to the financial condition and results of operations of L B Finance PLC’s that, by its nature, involve risk and uncertainty because we relate to events and depend on circumstances that may or may not occur in the future. Factors that could cause actual results to differ materially from those in the forward-looking statements include global, national and regional economic conditions; levels of securities markets; interest rates; exchange rates; credit or other risks of lending and investment activities; as well as competitive and regulatory factors. Consequently, all forward-looking statements have not been reviewed or reported by the company auditors.
FEEDBACK AND FURTHER INFORMATION AND SUGGESTIONS
We have strived to respond to your comments and suggestions received during the previous financial year. We welcome your comments and suggestions on this Report. (Feedback form – enclosed) You may contact:
Chief Financial OfficerL B Finance PLCCorporate OfficeNo. 20, Dharmapala MawathaColombo 03Tel: 011 2155 000 Fax: 011 2564488
GRI - 102 - 32, 53, 56
OR
GA
NIS
AT
ION
AL
OV
ER
VIE
W

6 L B Finance PLC Annual Report 2017/18
MANDATORY REPORTING FRAMEWORKS AND GUIDELINES
Financial reporting
» Sri Lanka Accounting Standards comprising of Sri Lanka Financial Reporting Standards (SLFRSs)
» Sri Lanka Accounting Standards (LKASs) promulgated by The Institute of Chartered Accountants of Sri Lanka
» Companies Act No. 07 of 2007
» Finance Business Act No. 42 of 2011
Corporate Governance reporting
» Corporate Governance Direction No. 03 of 2008 (as amended) issued by the Central Bank of Sri Lanka
» Listing Rules of the Colombo Stock Exchange
» The Code of Best Practice on Corporate Governance 2017 issued by The Institute of Chartered Accountants of Sri Lanka
» Securities and Exchange Commission of Sri Lanka Act No. 36 of 1987 (as amended)
Assurance
» Sri Lanka Auditing Standards
» Sri Lanka Standard on Assurance Engagements SLSAE 3000; Assurance Engagements other than Audits or Review of Historical Financial Information, issued by CA Sri Lanka
About Our 2017/18 Integrated ReportVOLUNTARY REPORTING FRAMEWORKS AND GUIDELINES
Integrated Reporting
» International Integrated Reporting Council’s (IIRC) Integrated Reporting <IR> Framework
» A Preparer’s Guide to Integrated Reporting by The Institute of Chartered Accountants of Sri Lanka
Sustainability Reporting
» GRI Standards
» UNGC Principles and Sustainable Development Goals
» AccountAbility – AA100SES
HOW TO READ THIS REPORT - NAVIGATING THROUGH THIS REPORT
The key objective of this report is to provide a comprehensive assessment of our Company and illustrate the strategies deployed to create value in the long run. It is centred around six capitals and our activities, held in place through the common thread of our focus on engaging with our stakeholders at a human level. Navigating through this report will require the reader to ask seven key questions:
Core questions to ask
Where to look
What you will find
Location
GRI - 102 - 12

L B Finance PLC Annual Report 2017/18 7
WHO GOVERNS THE COMPANY AND HOW DO THEY APPROACH THE EVOLVING MARKET DYNAMICS?
a. Letter from the Chairperson
b. Performance Analysis by the Managing Director
c. Committees of the Board and Management
d. Statement of Corporate Governance
» Broad overview of where the Company’s current position and future direction.
» LBF’s key success factors and incisive analysis of the existing business verticals.
» The experiences and competence of LBF’s leadership.
» In-depth review of the governance and control framework.
WHAT ARE THE BROAD RISKS FACING THE COMPANY AND HOW ARE THEY MANAGED?
a. Statement of Risk Management
» Risk identification and measuring techniques.
» Risk impacts and likelihoods, through heat maps.
» Risk mitigating tools and techniques.
» Breakdown of risk exposures in separate categories.
» Stress testing.
WHAT ROLE DOES THE COMPANY HAVE IN THE BIGGER PICTURE AND HOW DOES LBF STRUCTURE IT ACTIVITIES TO OPTIMIZE VALUE CREATION?
a. Value creation process
b. Business model
c. Operating structure
d. Organisational chart
» Bird’s eye view of the Company’s role in the big picture.
» Key components of the Business Model that make it possible to transform resources.
» The organisational structure designed to complement LBF’s Business Model.
WHAT ARE THE VARIOUS CHALLENGES WITHIN THE OPERATING ENVIRONMENT AND COMPETITIVE LANDSCAPE AFFECTING LBF’S BUSINESS?
a. Operating Environment and Strategic Response
» Macroeconomic aspects that shape the industry.
» Market forces and the competitive landscape that shape our business.
» LBF’s key competencies and scope of improvement.
a. PAGE 24 b. PAGE 28 c. PAGE 70 d. PAGE 44
a. PAGE 177
a. PAGE 154
a. PAGE 118 b. PAGE 120 c. PAGE 18 d. PAGE 13
OR
GA
NIS
AT
ION
AL
OV
ER
VIE
W

8 L B Finance PLC Annual Report 2017/18
HOW ARE STRATEGIES FORMULATED AND RESOURCES ALLOCATED?
a. Strategy and Resource Allocation
» Risks and opportunities identified through analysis of operating environment and stakeholder engagement.
» Business model adaptability and change requirements.
» Responses to issues raised through stakeholder engagement.
» Resource allocation strategies to meet growth objectives.
» Interdependencies, complexities and trade-offs between capitals.
» Measuring the efficiency of objectives.
HOW RESOURCES ARE TRANSFORMED THROUGH THE VARIOUS CAPITALS – IN ORDER TO CREATE VALUE FOR STAKEHOLDERS?
a. Financial Capital
b. Manufactured Capital
c. Intellectual Capital
d. Human Capital
e. Social and Relationship Capital
f. Natural Capital
» Financial resources.
» Tangible inputs.
» Knowledge-based intangibles.
» People.
» Key relationships and engagement with stakeholders.
» Environmental resources.
HOW DID THE DIFFERENT SEGMENTS OF THE BUSINESS CONTRIBUTE TOWARDS THE OVERALL RESULTS OF THE COMPANY?
a. Business Segment Review
» Performance reviews.
» Influential trends affecting business segments and subsidiaries.
» Risks and outlook.
About our 2017/18 Integrated Report
a. PAGE 143
a. PAGE 159
a. PAGE 202 b. PAGE 238 c. PAGE 228 d. PAGE 246 e. PAGE 264 F. PAGE 290

L B Finance PLC Annual Report 2017/18 9
ICON GUIDE
Throughout our Integrated Report, the following icons are used to show the connectivity between sections:
CAPITALS
MATERIAL MATTERS
STAKEHOLDERS
STRATEGIC FOCUS
TRIPLE BOTTOM LINE
Page references
Online version available
Link to online video
FINANCIAL CAPITAL
MANUFACTURED CAPITAL
HUMAN CAPITAL
SOCIAL AND RELATIONSHIP
CAPITAL
INTELLECTUAL CAPITAL
NATURAL CAPITAL
CUSTOMERS SHAREHOLDERS EMPLOYEES BUSINESS PARTNERS
REGULATORS SOCIETY/COMMUNITY
Understanding our customer
and placing clients at the
centre of everything we do
Technological advancement and increase competition
Demand for governance, regulation requirements and risk management
ECONOMIC SOCIAL
Managing business practices through uncertain socio economic factors
Customer understanding, Managing competitiveness and market positioning
Market outreach, presence and accessibility
Managing social and environmental inequalities
Manage evolving skill requirements of the talent pool
Sustainably growing,
revenue managing and
economic headwinds
Managing scarce
resources to optimise
economic outcomes
Embracing innovation
and leveraging our
investments on IT
Being operationally
excellent and global
expansion
ENVIRONMENT
OR
GA
NIS
AT
ION
AL
OV
ER
VIE
W

10 L B Finance PLC Annual Report 2017/18
About Our 2017/18 Integrated ReportSUMMARY OF OUR 2017/18 INTEGRATED REPORT
ECONOMIC
ENVIRONMEN
TAL
SOCIAL
ORGANISATIONALOVERVIEW
FINANCIALREPORTS
PAGE 03
PAGE 317
BUSINESS MODEL
PAGE 120
Strategy
Risk and Uncertainties
STEWARDSHIP
PAGE 34
Risk Management
Corporate Governance
MANAGEMENT DISCUSSION AND
ANALYSISPAGE 117
Financial Capital
Manufactured Capital
Intellectual Capital
Human Capital
Social & Relationship Capital
Natural Capital

L B Finance PLC Annual Report 2017/18 11
QUICK READERS TO UNDERSTAND OUR REPORT
If you are need have a quick snapshot or brief of our Annual Report, go through the following pages
Managing Director’s Review
Business Review
Financial Statements Highlights
Non-Financial Highlights
Financial Highlights
Letter from the Chairperson
PAGE 29
PAGE 159
PAGE 308 22 PAGE
20 PAGE
25 PAGE
We’ve introduced QR code links to information that is suitable to view on your smartphone. Take a picture of the barcode link and the relevant page will open in your browser window.
Read this report onlinehttps://sustainability./lbfinance.com
HTML mobile version
Dedicated website for Annual Report information
Hard copy PDF version on CD
OR
GA
NIS
AT
ION
AL
OV
ER
VIE
W

12 L B Finance PLC Annual Report 2017/18
About Us
As a leading financial solutions provider in Sri Lanka…
L B Finance PLC offers the full gamut of personal finance products and services as well as financial solutions for businesses. These offerings are delivered to the market through a network of 123 branches and 36 gold loan centres.
We have a clear vision for the future, which drives our passion to help people achieve their ambitions in the right way. This is brought to life through our mission to realise our values that define the way we think, work and act across the Company. Backed by our long-standing presence spanning 47 years coupled with our local expertise, we believe we have the right credentials to spearhead growth for the benefit of all those in Sri Lanka.
More recently L B Finance has strategically expanded its operations beyond the shores of Sri Lanka to Myanmar, where under the license issued by the Myanmar Government the Company has set up a micro finance operation aimed at bringing prosperity to the people of that country as well.
Incorporated in May 1971 as a private limited liability company and later converted to a public limited liability company in 1982, L B Finance PLC was listed in the Colombo Stock Exchange in 1997 and was re-registered in June 2008 under the new Companies Act No. 7 of 2007.
At the beginning, the majority shareholding was held by Lewis Brown & Company Limited and subsequently, in 1994, Vanik Incorporation Limited acquired the controlling interest of the Company. Mr. Dhammika Perera, a well-known iconic entrepreneur, took over the Company in 2003 and turned it around to be the vibrant and leading finance company that it is today. L B Finance PLC (LBF) is now part of the Vallibel One Group, which is a diversified holding company with strategic investments in financial services, tile and sanitary ware manufacturing and leisure.
In addition to its direct stake of 51.75% in LBF, Vallibel One also has an indirect holding of 14.59% through Royal Ceramics Lanka PLC, giving it an effective holding of 66.34%. The general public and other hold 22.18% of the shares and LBF has a fully-owned subsidiary company in Myanmar.
Backed by a strong financial tradition of over 47 years, LBF offers a portfolio of financial solutions trusted widely by corporates, SMEs and individuals alike. As of 31st March 2018, the Company was ranked as the third largest Licensed Finance Company (LFC) in terms of total assets.
We leverage our competitive advantage in the industry…
We are uniquely positioned as a leading financial institution in Sri Lanka, a status we have leveraged on to expand our reach to other markets in Asia, specifically Myanmar. In striving to enhance our credentials as a regional player, our strategy is to focus on the opportunity for growth by taking into account the matters we believe are material to our long-term sustainability and our ability to leverage the assets and expertise of the wider Vallibel One group. In doing so, our intention is to be the first to
GRI - 102 - 4, 6

L B Finance PLC Annual Report 2017/18 13
SUSBSIDIARY INFORMATION
The Company’s latest venture, L B Microfinance Myanmar Company Limited (LBMF) was set up in 2017, with 99.7% stake held by L B Finance PLC and the remaining 0.3% by Vallibel One PLC.
Board of Directors
Mr. Dhammika Perera Mr. J A S Sumith AdhihettyMr. Dulan de SilvaMr. Niroshan Udage Mr. B D A Perera Mr. Ravi Yatawara
Marking LBF’s entry to the regional financial market, the vision for LBFM is “To contribute to the development of sustainable and socially significant enterprises that improve the lives of the entire nation”.
Correspondingly, LBFM’s robust micro finance model is geared to support the growth and development of small-scale farmers in rural Myanmar through the provision of much-needed financial assistance and business development advice that would enable them to develop stable livelihoods, raise their living standards and overall quality of life. As part of a broader strategy, the Company has also undertaken to improve the level of financial literacy among community stakeholders through grass-root level training and knowledge-sharing workshops aimed at developing a strong a credit+ culture.
SHAREHOLDING STRUCTURE
response effectively and efficiently to the needs of our key stakeholders by aligning our strategy, in cognisance with the prevailing economic environment and prospective opportunities.
We measure our performance against our strategy and the matters we consider to be most material to our sustainability…
In an effort to serve our customers and help them to prosper, we are committed to simplifying our business processes to make them more sustainable through the efficient and cost effective use of resources. We do this by unlocking the power of a dynamic workforce and through investments in technology, information and innovation. At the same time, we will keep evolving and building new strategic capabilities that enable us to be relevant and competitive as we move into the future.
Guided and supported by our operating structure…
L B Finance is governed by a strong and effective Board of Directors, headed by a Chairperson who sits at the helm. The Board approves the strategy and ensures that the Company has a proper framework of controls and governance in place. The Managing Director (MD), reporting to the Board, is responsible for implementing the Company’s strategy and is assisted in this endevour by three Executive Directors, each responsible for the day-to-day operations of the core business lines.
Our three business segments contribute to our Company strategy…
Our business is built on three key pillars; investment activities, financing solutions and Value-Added Services, each consisting of a broad range of products and services geared to meet the diverse needs of our customers. Each business line is headed by a member of the senior management team.
Vallibel One PLC
Royal Ceramics Lanka PLC
General Public and Other
L B Finance PLC
51.75%
26.07%
22.18%
55.96%
GRI - 102 - 7, 45
OR
GA
NIS
AT
ION
AL
OV
ER
VIE
W

14 L B Finance PLC Annual Report 2017/18
Strategic Journey
1971 1982 1994 1997 2003 2005 2008 2010
Established as a private company on 30th May 1971 with its registration office at No. 101, Vinayalankara Mawatha, Colombo 10. Majority shareholding of 94.9% was held by Lewis Brown & Company Limited
Vanik Incorporation Limited’s shareholding increased to 83.26%
It has been a period of transition which added a new chapter. Mr. K D D Perera took over a stake of 58.74 percent to turn around the loss-making Company to a profitable venture
The Company re-registered under the new Companies Act No. 07 of 2007
Changed its status as a public company
Listed on the Colombo Stock Exchange
Registered in terms of Section 2 of the finance Companies Act No. 78 of 1988
Profits doubled and reached over Rs. 1 billion for the first time in the history
Introduced factoring product to the Company

L B Finance PLC Annual Report 2017/18 15
2011 2012 2013 2014 2015 2016 2017 2018
RAM Ratings Lanka Limited upgraded the Company rating as A-/P2 Stable
North and east market presence for the first time
Established Islamic Finance Unit for the Company
Became a part of Vallibel one umbrella which is a diversified company
Global Banking and Finance Review UK awarded us as the ‘Best Retail Finance in Sri Lanka for 2013’
Opened 1st Premier Branch in Mount Lavinia
Staff strength surpassed 2,000
Integrated with Common Electronic Fund Transfer Switch (CEFTS)
Launched of LB Gift store www.lbstore.lk
Exceeded Rs. 100 billion asset base
Opened the 100th branch in Jaffna
Introduced the VISA shopping card
Moved to our new corporate office located at Dharmapala Mawatha, Colombo 03
The Islamic Finance Unit awarded as the emerging Islamic Finance Unit of the year
Introduced LB Savings to customers
Largest expansion drive within the industry with 20 new outlets
Recorded the largest deposit base among the NBFI Sector
First overseas expansion of L B Finance to Myanmar
Going into cloud- based IT platform
Ranked 17th among the top 20 brands in Sri Lanka by Interbrand
Won the Gold Award in NBFI sector at CA Sri Lanka Annual Report Awards
Launching of Cash Deposit Machine facility
The Company was certified as a Carbon Conscious Company by the Sri Lankan Carbon Fund
Tied up with the Sri Lanka Interbank Payment System (SLIPS) which has direct links to the local clearing network in Sri Lanka
CSR re-branded as LB Sustainability
Successfully completed 45 years in the finance industry with a profit growth of 70% reaching the highest-ever profit of Rs. 3.7 billion (PAT)
OR
GA
NIS
AT
ION
AL
OV
ER
VIE
W

16 L B Finance PLC Annual Report 2017/18
Awards
National Business Excellence Awards 2017
Presented by the National Chamber of Commerce
Sri Lanka
Non Banking Financial Service Sector Runner-up
IFFSA Awards 2017
Bronze Award CSR Project of the
year.
Annual Report Awards 2017
Integrated Reporting Silver Award
CIMA Excellence in Integrated
Reporting Awards 2017
Award for the ten best Integrated
Reports
Annual Report Awards 2017
Finance Companies & Leasing Companies
Gold Award
Annual Report Awards 2017
Integrated Reporting Best Disclosure on
Capital Management Gold Award

L B Finance PLC Annual Report 2017/18 17
We areCarbon NeutralOur commitment to protect and preserve the environment by continuously refining our policies and procedures and improving our products and services through the use of technology has enabled L B Finance PLC to be certified as a Carbon Neutral Company. As further testimony to our ongoing efforts, this annual report too has been declared a Carbon Neutral product.
Company Annual Report
The certificate is issued in accordance with the procedure for voluntary cancellation in the CDM Registry. The reason for cancellation included in this certificate is provided by the canceller.
United NationsFramework Convention onClimate Change
Number and typeof units cancelled
Presented to:
Reason for cancellation:
LB Finance PLC
Date: 28 May 2018Reference: VC/191/2018
Start serial number: LK-5-940007-2-2-0-3531End serial number: LK-5-943229-2-2-0-3531
3,223 CERsEquivalent to 3,223 tonne(s) of CO2
To achieve the carbon neutrality of LB Finance PLC for the financial year 2017/18, assessed by Climate Smart Initiatives (Pvt) Ltd.
OR
GA
NIS
AT
ION
AL
OV
ER
VIE
W

18 L B Finance PLC Annual Report 2017/18
Managing Structure
EXECUTIVE DIRECTOR ASSETS FINANCE
DGM – Strategyand Risk
DGM – Fixed Deposits and
Savings
Chief Manager – Mortgage
Loans
DGM – Credit and
Branch Ops
Chief Manager – Credit and
Branch Ops
FinanceCFO
Senior Manager –
Administration
National Manager – Business Process
Development
Credit Controller –Factoring
Senior Manager– Finance
Regional Manager
– Credit andBranch Ops
Deputy AreaManager –
Creditand Branch
Ops
Manager – Head ofBranch
Credit Controller –Mortgage
Loans
AGM – Human
Resources
Senior Manager –Marketing
Senior Manager – Corporate Lend ing
DivisionalManager –
Savings
Area Manager
– FD
Senior Manager –
Compliance
Manager –Strategy and
Risk
Man ager – FD
Manager–Factoring (Rent a
Car)
Manager–Factoring(Personal
Loans)
Manager–Factoring(Dirimaga)
Manager–Mortgage
Loans
Strategic Business Units (SBUs) Support Service Units (SSUs)
Integrated Risk Management Committee
(IRMC)

L B Finance PLC Annual Report 2017/18 19
BOARD OF DIRECTORS
MANAGING DIRECTOR
EXECUTIVE DIRECTOR
National Manager
– Insurance
National Manager – Operations
National Manager – Recoveries
National Manager – Security
Affairs
National Manager – InformationTechnology
Senior Manager –
Credit
Manager – Credit
Manager –Internal Audit
Manager – Head ofBranch
Manager – MicroFinance
Manager – Legal
Manager - IslamicFinance
Unit
Manager – GoldLoan
Manager – Recoveries
Manager –Treasury
Manager - Recoveries
(Legal Followups)
Manager –InformationTechnology
Senior Manager –Treasury
Senior Manager –InformationTechnology
Senior Manager
– IS Audit &Compliance
AGM –Microfinance
AGM
AGM – Legal
AGM – Treasury & Corporate
Planning
AGM – In formation
Technology
Area Manager –Credit and
Branch Ops
DivisionalManager –
Microfinance
DivisionalManager – Recoveries
Senior Manager
– Gold Loan
Area Manager – Recoveries
EXECUTIVE DIRECTOR ASSETS MANAGEMENT
Strategic Business Units (SBUs) Support Service Units (SSUs)
Board Audit Committee
(BAC)
GRI - 102 - 18
OR
GA
NIS
AT
ION
AL
OV
ER
VIE
W

20 L B Finance PLC Annual Report 2017/18
FinancialHighlightsIndicator 2017/18 2016/17 Change (%)
Operating resultsIncome Rs. million 25,046.20 19,363.42 29.35 Interest income Rs. million 23,394.12 17,909.93 30.62 Net interest income Rs. million 11,895.71 9,797.59 21.41 Profit before taxation (PBT) Rs. million 6,477.69 5,874.84 10.26 Profit after taxation (PAT) Rs. million 4,250.72 3,918.20 8.49
Financial position Total assets Rs. million 120,820.78 102,763.03 17.57 Lending portfolio Rs. million 102,345.08 89,149.74 14.80 Deposits Rs. million 72,943.83 60,401.95 20.76 Borrowings Rs. million 27,990.87 25,822.36 8.40 Equity Rs. million 15,348.90 12,509.68 22.70
Share informationMarket price per share Rs. 118.90 118.40 0.42 Market capitalisation Rs. million 16,469.35 16,400.09 0.42 Net asset value per share Rs. 110.81 90.31 22.70 Earning per share (EPS) Rs. 30.69 28.29 8.48 Price earning ratio (PE) Times 3.87 4.19 (7.53)Dividend per share (DPS) Rs. 11.00* 9.00 22.22 Dividend yield % 9.25 8.48 9.10 Dividend payout ratio % 35.84 31.82 12.65
Statutory ratiosCore capital to risk weighted assets ratio (Tier 1) >5 % 17.33 16.12 7.51 Total risk weighted capital ratio (Tier I & II) >10 % 19.78 17.06 15.94 Equity to deposits >10 % 21.04 20.71 1.60 Liquidity ratio % 14.73 14.47 1.80
Other ratiosReturn on assets (ROA) % 3.80 4.18 (9.03)Return on equity (ROE) % 30.52 34.09 (10.48)Net interest margin (NIM) % 11.15 10.91 2.23 Loan to deposits Times 1.40 1.48 (5.20)Non-performing loans ratio (NPL) % 2.37 2.14 10.75
* Includes proposed final dividend of Rs. 4.00 per share.

L B Finance PLC Annual Report 2017/18 21
0
2
4
6
8
10
12
NET INTEREST INCOME
Rs. Bn 21%
2018 11,896 Mn2017 9,798 Mn
2013 4,379 Mn(5 years ago)
201820175 Years Ago
0
2
4
6
8
10
12
DIVIDEND PER SHARE (DPS)
Rs.
201820175 Years Ago
22%
2018 Rs. 11.00 2017 Rs. 9.00
2013 Rs. 3.25(5 years ago)
0
1
2
3
4
5
RETURN ON ASSETS (ROA)
%
201820175 Years Ago
-9%2018 3.80 %2017 4.18 %
2013 3.51 %(5 years ago)
0.00.51.01.52.02.53.03.5
NON-PERFORMING LOANS RATIO (NPL)
%
201820175 Years Ago
11%2018 2.37 %2017 2.14 %
2013 3.35 %(5 years ago)
012345678
PROFIT BEFORE TAX (PBT)
Rs. Bn
10%
2018 6,478 Mn2017 5,875 Mn
2013 2,527 Mn(5 years ago)
201820175 Years Ago
0
1
2
3
4
5
PROFIT AFTER TAX (PAT)
Rs. Bn
8%
2018 4,251 Mn2017 3,918 Mn
2013 1,703 Mn(5 years ago)
201820175 Years Ago
0
30
60
90
120
150
TOTAL ASSETS
Rs. Bn
18%
2018 120,821 Mn2017 102,763 Mn
2013 54,223 Mn(5 years ago)
201820175 Years Ago
0
20
40
60
80
100
120
LENDING TO CUSTOMERS
Rs. Bn
201820175 Years Ago
15%
2018 102,345 Mn2017 89,150 Mn
2013 44,724 Mn(5 years ago)
01020304050607080
DUE TO CUSTOMERS
Rs. Bn
201820175 Years Ago
21%
2018 72,944 Mn2017 60,402 Mn
2013 38,743 Mn(5 years ago)
0
5
10
15
20
EQUITY
Rs. Bn
201820175 Years Ago
23%2018 15,349 Mn2017 12,510 Mn
2013 5,329 Mn(5 years ago)
0
5
10
15
20
MARKET CAPITALISATION
Rs. Bn
201820175 Years Ago
0.4%
2018 16,469 Mn2017 16,400 Mn
2013 9,190 Mn(5 years ago)
0
5
10
15
20
25
30Rs. Bn
29%
2018 25,046 Mn2017 19,363 Mn
2013 11,166 Mn(5 years ago)
INCOME
201820175 Years Ago
OR
GA
NIS
AT
ION
AL
OV
ER
VIE
W

22 L B Finance PLC Annual Report 2017/18
Non-Financial HighlightsGRI Indicator 2017/18 2016/17
Intellectual Capital102-16 Brand value (LMD) Rs. million 4,236.00 3,853.00
Brand ranking - Most respected entitiy (LMD) Number 33 80Credit rating (fitch ratings) A- (lka) A- (lka)Online Transactions Number 1,738 44
203-1 Investment on ICT Rs. million 194.49 79.25
Manufactured Capital102 Total outlets Number 159 154
Total Branches Number 123 118Gold loan centres Number 36 36New outlets opened Number 5 8Investment in property plant and equipment Rs. million 1,537.34 1,809.00
Human Capital102-7 Employees hired Number 1,313 1,096 401-1 Employment opportunities created Number 220 477102-8 Employees completed 20 years of service Number 20 17
Profit per employee Rs. million 1.235 1.216404-2 Training programs carriedout Number 113 88 Investment in training and development Rs. million 8.56 8.04 404-1 Training hours Number 25,846 20,672 404-1 Average hours of training per employee Number 7.52 6.42
Staff remuneration & benefits Rs. million 2,306.00 2,254.00
Social and Relationship capital201-1 Economic value created Rs. million 3,090.42 2,341.15 201-1 Economic value Distributed to:
Depositors Rs. million 11,077.10 7,766.75 Employees Rs. million 2,389.35 2,324.85 Government Rs. million 3,038.17 2,660.77 Shareholders Rs. million 1,523.66 1,246.63
Community development programmes Number 26 17Staff volunteered hours Number 9,079 2,302
Natural CapitalEnvironment related projects Number 6 9
303-1 Water Consumption m3 29891.91 30,388.00 Water Consumption per Rs. million of revenue m3 1.19 1.56Trees planted/ Distributed Number 612 400Investment on green initiatives Rs. million 3.51 3.29Paper recycled kg 2,943 7,938
302-1 Energy Consumption GJ 18,231.87 23,720.00 Energy per Rs. million of revenue GJ 0.73 1.23
305 Total carbon footprint tCO2e 3,223 4,361

L B Finance PLC Annual Report 2017/18 23
3,441 159220 NEW EMPLOYMENT
OPPORTUNITIES
OVER
Rs.190Mn DISBURSED AS MSME
LOANS
Rs.3.04 BILLION REVENUE TO THE GOVERNMENT
Rs.23Mn INVESTED ON CSR INITIATIVES
OVER
Rs.3MnSPENT ON GREEN INITIATIVES
OVER
Rs.39MnE-CONNECT TRANSACTIONS
7,114 EMPLOYEE VOLUNTEERING HOURS
A Carbon Neutral CompanyFOR THE THIRD CONSECUTIVE YEAR
CLINCHED FINANCE AND LEASING SECTOR
Gold AwardAT THE CA SRI LANKA ANNUAL REPORT AWARDS 2017
LMD 2018123 FULLY FLEDGED BRANCHES36 GOLD LOAN CENTRES 4 STRATEGIC RELOCATIONS
RANKED
17th INTERBRAND BEST SRI LANKAN BRANDS 2017
1st subsidiary in Myanmar
EMPLOYEES BRAND VALUEOUTLETS
Rs.4,236Mn
126 Pre-Schools refurbished
Introduced CDMs
ISO 27001: 2013INFORMATION SECURITYSTANDARD RECERTIFIED
4,691 TRANSACTION VALUE DISTRIBUTION
27 INNOVATIVE FINANCIAL SOLUTIONS
OR
GA
NIS
AT
ION
AL
OV
ER
VIE
W

Letter from the Chairperson
MRS. SHIRANI JAYASEKARAChairperson
Consistently, for the past 47 years, our LBF employees have been bringing this vision to life through disciplined actions, and dynamic decision making to enhance the quality of life of the people we deal with.
24 L B Finance PLC Annual Report 2017/18

Dear Stakeholder,As I welcome you to the 45th Annual General Meeting of LBF Finance PLC, my first as Chairperson of this great Company, I take immense pride in stating that we are not merely paying lip service to our vision to contribute towards the growth of our country and its people – but are actually living it.
Consistently, for the past 47 years, our LBF employees have been bringing this vision to life through disciplined actions, and dynamic decision making to enhance the quality of life of the people we deal with.
For example our pioneering efforts to develop Sri Lanka’s Micro Small Medium Entrepreneurs (MSME) sector over the past four decades and in particular the last five years testifies to our commitment to fuel progress at a grass root level, while LBF’s first-ever offshore venture – LB Microfinance Myanmar was set up to assist the MSME sector in that country.
Meanwhile, our commitment to succeed, despite all odds, has enabled the Company to deliver a sustained performance on all fronts, even amidst challenging economic conditions and intense competitive pressures seen in recent years.
On an accelerated growth path, LBF has recorded year-on-year growth over the past five years and I am happy to announce that our performance for the year under review is no exception.
These results only serve to solidify LBF’s position as the chosen financial services partner for most Sri Lankans. And as a “Matter of fact” it is easy to see why.
To our Shareholders...We have continued to meet, and at times exceed, your expectations. In 2017/18, when the country’s economy was struggling to cope with the impact of adverse weather, reporting GDP growth at 16 year lows, LBF’s year-on-year asset growth was 17.57%, well ahead of the industry average. (Industry reported year-on-year growth of 9.8% as at Dec. 2017)
At the same time a strong emphasis on cost management has ensured our cost-to-income ratio reach an all-time low in the year under review. Strong asset growth coupled with prudent cost management has helped sustain ROA and ROE well above the industry in 2017/18, while our dividend payout ratio of 35.84% for the year continues to be the highest among peers.
OR
GA
NIS
AT
ION
AL
OV
ER
VIE
W
L B Finance PLC Annual Report 2017/18 25

Letter from the ChairpersonMoreover, we continued to pursue new opportunities whenever they became available both locally and overseas. In the year under review, we reacted swiftly to the revised legislative framework under the new Foreign Exchange Act and secured a license to set up a Greenfield micro finance operation in Myanmar. LBF Myanmar was opened in December 2017, marking our first step in taking the LB brand global.
Furthermore, working purposefully to ensure our capital position remains above par, LBF raised Rs. 3 billion by way of a debenture issue in December 2017 of which Rs. 2 billion was to strengthen Tier II capital. Buttressed by these initiatives, LBF has continued to maintain its A-(lka) rating with a Stable Outlook.
To our Customers...We want you to be our customers for life. As such we are continuously working to refine our products, services and outreach to ensure they are all geared to serve your every financial need. We continue to fine-tune our product basket in an effort to support wealth creation across a broader segment of the market. For example, ‘Mul Gala’, a new product launched in the year under review, aims to offer a more robust Mortgage Loan proposition for homeowners, while ‘LB Yasaisuru’ also launched in 2017 is a new term deposit proposition that gives the customer the flexibility of tailoring returns. We are also investing considerable resources to strengthen our Gold Loan footprint and in the year under review, increased our presence in the North and East regions of the country.
To our Depositors...We hold you in high esteem, for you have entrusted us to safeguard your valuable savings. And we are committed to doing just that. We engage prudent and calculated lending strategies and pro-actively manage risks to ensure a healthy deposit cover ratio is maintained at all times. We focus on maintaining the financial stability of the institution as a paramount need to enhance depositor confidence and our A- rating (by Fitch) bears testimony of that effort. Moreover, as a responsible financial institution, we strive to promote the savings habit among our nation’s people from a young age, for we firmly believe that saving is the key to long-term wealth creation. Premised on this, we re-branded our minor savings as ‘Little Heroes’ kids savings proposition to appeal to a new generation of young parents.
To our Employees...You are the backbone of our business and main champions of the LB brand. The commitment to our employees is therefore a continuous and ongoing process to keep improving. Our aim is to create an environment where our employees stay motivated, are empowered and feel recognised for their work enabling them to learn and grow with the Company. In the year under review, we invested Rs. 8.56 million on training and took the first steps towards implementing a digital workplace strategy through the launch of the Virtual Learning Academy to give employees the resources for continuous learning.
26 L B Finance PLC Annual Report 2017/18

To the broader Community...We are firm about caring for our island’s people and our planet and take our responsibilities very seriously. LBF’s code of ethics, values and governance structures are all designed to responsibly manage the broader impact of our actions at all times. This includes regularly engaging with the broader community to understand how best LBF as a leading financial services institution in Sri Lanka can assist in positive wealth creation for all Sri Lankans.
Equally important is the emphasis we place on complying with all applicable laws and regulatory frameworks governing the non-bank financial services sector, which LBF is a part of. At this point it is pertinent to mention a few of the new regulations introduced during the year. The proposed move by the CBSL to increase core capital requirements of Licensed Finance Companies is a welcome move which I believe will go a long way in strengthening the integrity of the sector. The new Financial Customer Protection Framework is also a step in the right direction for it will undoubtedly improve customer confidence in the country’s financial system.
Grateful ThanksI hereby wish to place on record my sincere gratitude to the Management and staff of L B Finance PLC for the commitment and passion they bring to their work, which has made it possible for LBF to scale greater heights with each successive year.
To my colleagues on the Board, I thank you for your guidance and leadership in steering LBF to where it stands today.
Moving Forward...I envision even greater things for LBF in the years ahead and look forward to seeing the entire LBF team working cohesively with one purpose in mind.
Let me conclude by echoing the words of my predecessor and urge all our valued stakeholders to also partner with us on this journey, as you have done in the past.
Mrs. Shirani JayasekaraChairperson
OR
GA
NIS
AT
ION
AL
OV
ER
VIE
W
L B Finance PLC Annual Report 2017/18 27

Managing Director's Review
SUMITH ADHIHETTYManaging Director
Net interest income, our main source of revenue, grew by a phenomenal 21.41%, while profit after tax was up by a commendable 8.49% year-on-year reaching Rs. 4.25 billion in 2017/18.
28 L B Finance PLC Annual Report 2017/18

L B Finance PLC Annual Report 2017/18 29
The 2017/18 financial year saw LBF once again making significant strides along the strategic path we have been on over the last few years. I am pleased to report that our financial performance, while consistent with our expectations continues to break records in the NBFI sector of which we are a significant part. Our total asset base is solid and at Rs. 120.82 billion as at 31 March 2018, continues to be one of the leading operators in the NBFI sector. Net interest income, our main source of revenue grew by a phenomenal 21.41%, while profit after tax was up by a commendable growth 8.49% year-on-year reaching Rs. 4.25 billion in 2017/18. We continue to maximise wealth for our shareholders recording and ROE of 30.52% and EPS improving Rs. 30.69 from Rs. 28.29. An Interim Dividend of Rs. 7.00 per share was paid and final dividend of Rs. 4.00 per share is proposed. The impressive numbers have helped the Company to retain its A- (lka) rating from Fitch Ratings Lanka Limited.
MORE INFORMATION PAGE 218
The LB brand also made notable headway. In the inaugural Inter-brand yearly brand ranking study, LBF was placed 17th of the top 20 Best Sri Lankan Brands for 2017 and also emerged as the only NBFI. Moving up the ranks from 80th position in 2016 to 33rd place in the LMD Most Respected Entities for 2017, LBF was also placed 26th among the top 100 Most Valuable Brands in Sri Lanka for 2017.
MORE INFORMATION PAGE 234
I believe these consistent results testify to our firm and unremitting commitment to continue to create value for all of our stakeholders against all odds. To fully appreciate the scale of our success, it is important to understand the immediate operating environment.
EXTERNAL ENVIRONMENT
While the global economy was on the rebound in 2017, the Sri Lankan economy faced some troubled times, with GDP growth slowing to multi-year lows as the impacts of adverse weather and its spillover effects continued to bring pressure on many key sectors of the economy for the second consecutive year.
In light of these developments credit growth remained subdued, causing the NBFI sector to underperform, marked by declining profitability and higher non-performing loans. The sector’s traditional lending model remained to be under stress amidst ongoing regulatory pressures. Most notable among them a move by the Government to curb vehicle imports, which led to the Budget 2017 directive issued by the CBSL to further tighten the LTV ratio for credit facilities in respect of unregistered vehicles.
SURPASS PROFIT AFTER TAX OF
Rs.4 billion
TOTAL ASSETS CROWNED
Rs.120 billion
MAINTAINING NPL AT
2.37%While industry at 5.9%
61.71%INCREASE IN CSR RELATED
INVESTMENT TO
Rs. 23.51 million CLINCHED
Sector Gold Award
at the CA Sri Lanka Annual Report Awards
GRI - 102 - 14
OR
GA
NIS
AT
ION
AL
OV
ER
VIE
W

30 L B Finance PLC Annual Report 2017/18
On a more positive note however the decision by the government to relax import duties and LTV rules for leasing of energy-efficient vehicles (hybrid and electric vehicles as well low-capacity automobiles below 1,000 CC) was a welcome one that helped boost the prospects of the sector from the latter part of 2017.
MORE INFORMATION PAGE 164
STRATEGY AND FOCUS
In light of the prevailing depressed economic conditions, NPL management was undertaken as a key priority, which I am happy to note has helped to keep NPLs under control.
Moreover, with the LTV restrictions severely affecting our core leasing business, we reviewed our game plan with the intention of realigning our business model in response to changes in the business environment.
As the demand for registered vehicle leasing virtually dried up, we began to look for alternative lending opportunities, prompting renewed efforts to explore the leasing market for energy-efficient vehicles (hybrid and electric vehicles as well low-capacity automobiles below 1,000CC). Leveraging on the duty concessions and the soft LTV rules for
these vehicle categories, we launched an aggressive branch-driven campaign across the country to promote these solutions, which I must say has met with considerable success.
We also engaged our market reach and our brand to deepen the penetration to the gold loan business. Taking swift action to capitalise on the upward trend in world gold prices, a new three-month proposition was rolled out and was coupled with flexible repayment plan to give customers the ability to tailor their repayment. In parallel the ‘apitama hariyana apema thane’ campaign was launched to spearhead our efforts to position the LB gold loan proposition as first choice in the market. As a result our growth in the gold loan portfolio was impressive at 23.63%. To improve service delivery to the customer, we looked to implement the ‘Customer First’ concept across our operational model, which saw the launch of a new call centre in Jaffna dedicated specifically to service the needs of customers in the north of the country, along with additional investments to strengthen the capacity of LBF’s gold loan call centre in Mount Lavinia. Ground work also commenced to set up a new integrated ERP system, which I believe would significantly enhance the capacity of the gold loan segment in the long-term.
The mortgage loan proposition was also revamped and re-launched to the market as ‘Mul Gala’ with the aim of tapping into the country’s flourishing construction sector. Again the move sparked considerable interest and seeing the response from the market, I am sure the product will gain considerable traction in the coming years.
MORE INFORMATION PAGE 166
Meanwhile, amidst rising interest rates, our deposit mobilisation strategies also came under scrutiny, with the focus shifting towards mobilising more savings deposits. We see the move as part of a broader risk rebalancing strategy to ensure we are able to optimise deposit mix in order to benefit from interest rate movements.
As part of our effort to operationalise these lending and deposit mobilization strategies we further widened our outreach, adding five new branches and relocating four branches and a VIP gold loan centre to our network within the year under review.
Aside from the focus on sharpening our business competencies, we were quick to seize the opportunity afforded by the new Exchange Control Regulations permitting local listed entities to invest upto USD 2,000,000 in offshore ventures.
Marking a historical milestone in our 47-year-old journey, we took the bold step to expand our footprint beyond Sri Lanka, by setting up LB Microfinance Myanmar (LBMF) in December 2017
Managing Director's Review

L B Finance PLC Annual Report 2017/18 31
Marking a historical milestone in our 47-year-old journey, we took the bold step to expand our footprint beyond Sri Lanka, by setting up L B Microfinance Myanmar (LBMF) in December 2017 as a Greenfield operation licensed to provide direct financial assistance to underserved farming communities in rural Myanmar to improve their livelihoods.
COMMITMENT TO BUILD A SUSTAINABLE BUSINESS
Our business philosophy is underpinned by the belief that conducting our business prudently, ethically and with integrity will enable the Company to remain sustainable and continue to achieve positive outcomes for all of our stakeholders in the long-term. Accordingly, we remain committed to continually strengthen our corporate governance framework in order to increase our capacity to remain sustainable in the long-term.
The Board remains firm in its belief that sound governance practices are the foundation for the long-term success and that it is only by upholding the highest standards of corporate governance that we can truly do justice to our strategy.
Critical to our long-term sustainability also is the ability to attract and retain the skills and capability required to deliver our ambitious growth strategy. Accordingly, we continued working on building our talent pool with a view to developing within and took the first steps in our digital workplace strategy as part of a long-term undertaking that aims to streamline business processes, promote employee collaboration and drive successful business outcomes that would deliver a definite edge over peers. The launch of the Virtual Learning Academy in 2017 underscores the commitment to this goal and signals our intention to embed a culture of continuous learning.
MORE INFORMATION PAGE 255
Having understood that technology adoption remains equally important to our sustainability journey, we had already embarked on a digital transformation strategy a few years ago. Our efforts for the year were focused on expediting the ERP roll-out to systematically automate all aspects of the business and facilitate seamless integration among all key business processes. Marking the first phase of the undertaking, we completed the cloud-ready information technology platform for the gold loan product within the year itself. We also invested a further to upgrade the capacity of our Disaster Recovery (DR) infrastructure, which will allow the Company to rely on the DR site for an extended period of time in the event of an incident.
Additionally, we are committed to addressing the broader social and environmental sustainability issues facing our country and its people. To integrate these concerns into our business activities, we have more recently adopted the United Nations’ Sustainable Development Goals (SDGs) as a benchmark for our actions. As such LBF’s Social Investment Framework now focuses on contributing towards five of the UN Sustainability Development Goals
MOVING FORWARD
While changes in the economy are beyond our control, we want to be prepared to always be at the forefront of change management. This means engaging a broad and forward-looking perspective in order to foresee our customers’ needs and actively seek opportunities to achieve a sustainable competitive advantage, enhance our corporate value, and continue to create wealth for all of our stakeholders: our shareholders and customers, our employees and their families as well as the local societies in which we operate.
IN CONCLUSION
I wish to express my sincere thanks to the Chairperson and the Board of Directors of L B Finance PLC for their unfailing support and guidance at all times. I also take the opportunity to extend my heartfelt gratitude to the management and staff for their commitment and dedication towards achieving a common goal. My heartfelt gratitude also goes to our shareholders. I am immense grateful for your continued support and confidence.
Thank you also to the Governor and officials of the Central Bank for their guidance and support throughout the year and to our external auditors for their valuable input. Finally, I wish to thank the customers and other stakeholders of the Company for their continued patronage. I rely on your continued support to explore the promising possibilities in the year ahead.
Last but not least I have to note with heartfelt gratitude the services rendered by Mrs. Kimarli Fernando, the past Chairperson, and Mr. Lalith de S Wijeratne, who retired after completing nine years as Directors of L B Finance. Their contributions in committees and in streamlining the Vision and strategies strengthened your Company by leaps and bounds. I wish them success in all their endeavours personally, on behalf of the employees and the shareholders!
SUMITH ADHIHETTYManaging Director
OR
GA
NIS
AT
ION
AL
OV
ER
VIE
W

32 L B Finance PLC Annual Report 2017/18

L B Finance PLC Annual Report 2017/18 33
GOVERNANCE
A Matter of Direction
Visionary LeadershipPrudent PoliciesOpenness and TransparencyGood GovernanceAccountability

34 L B Finance PLC Annual Report 2017/18
Board of Directors
Seated left to right:MR. J A S SUMITH ADHIHETTYManaging Director
MR. DHAMMIKA PERERAExecutive Deputy Chairman
MRS. SHIRANI JAYASEKARAIndependent Non-Executive Director

L B Finance PLC Annual Report 2017/18 35
MR. NIROSHAN UDAGEExecutive Director
MRS. ANANDHIY K GUNAWARDHANAIndependent Non-Executive Director
MR. ASHANE JAYASEKARAIndependent Non-Executive Director
MRS. YOGADINUSHA BHASKARANNon-Executive Director
MR. THOSAPALA HEWAGE Independent Non-Executive Director
Standing left to right:MR. RAVINDRA YATAWARAExecutive Director
MR. B D A PERERAExecutive Director
GO
VE
RN
AN
CE

36 L B Finance PLC Annual Report 2017/18
MRS. SHIRANI JAYASEKARA ChairpersonIndependent Non-Executive Director
Skills and experience
She has over 37 years of experience combining Finance and IT, Audit and Risk Management in Sri Lanka, Zambia and Bahrain.
She is a Fellow of the Institute of Chartered Accountants of Sri Lanka and a Fellow member of the Chartered Institute of Management Accountants UK.
Appointed to the Board
On 25 August 2010, appointed as the Chairperson on 18 September 2017.
Membership of Board Sub-Committees
Chairperson of the Related Party Transactions Review Committee.
Current appointments
Director of Asian Hotels and Properties PLC, a subsidiary of John Keells Holdings PLC.
Former appointments
She was the Head of Audit, British American Tobacco Sri Lanka and Bangladesh and Head of Group Internal Audit of Carsons Cumberbatch PLC.
MR. DHAMMIKA PERERA
Executive Deputy Chairman
Skills and experience
A quintessential business leader, with interests in a variety of key industries including hydropower generation, manufacturing, hospitality, entertainment, banking and finance. He enriches the Board with nearly
Board of DirectorsGRI - 102 - 22, 23
The LBF Board is made up of highly qualified directors from diverse backgrounds who are committed to the sustainable management of the business and affairs of the organisation with the goal of enhancing long-term stakeholder value.
COMPOSITION
50%
50%
ExecutiveDirectors
5
Non-ExecutiveDirectors
5
GENDER BALANCE
30%
70%
Male
7Female
3
COMPOSITION
GENDER BALANCE
GENDER BALANCE
EXPERIENCE AGE
0-5 Years 5-10 Years Above 10 Years
10-20 years20-30 yearsOver 30 years
1
63
30-40 years40-50 yearsOver 50 years
1
63

L B Finance PLC Annual Report 2017/18 37
Appointed to the Board
On 23 April 2013 and appointed the Chairman on the same day, which office he relinquished on 17 May 2016.
Membership of Board Sub-Committees
Chairman of the Nomination Committee.
Former appointments
Ambassador in Nepal from 2009 to 2012. He was Secretary to the Ministries of Ports and Aviation, Enterprise Development and Investment Promotion, Urban Development and Water Supply, Environment and Natural Resources. Additional Secretary to the Ministry of Forestry and Environment (Policy Planning), Additional Director General of Southern Development Authority (Ministry of Finance and Planning) and Director, Ministry of Lands, Irrigation and Mahaweli Development. Led Sri Lankan delegations in various fields from 2000 to 2008 to Mauritius, Los Angeles, New York, Europe, Middle East, Bangladesh, Senegal, Thailand, Philippines, India, Korea and Japan.
MR. NIROSHAN UDAGE
Executive Director
Skills and experience
Bachelor’s Degree in Science from the University of Colombo and possesses 27 years of experience in the field of leasing and finance, including 10 years at Lanka Orix Leasing Company PLC and 3 years at Mercantile Investments Limited prior to joining L B Finance PLC in 2004. Mr. Udage followed a course in 2007 conducted by International Development Ireland Ltd. in Dublin
30 years of experience in building formidable businesses through unmatched strategic foresight.
Appointed to the Board
On 22 October 2002, appointed as the Chairman on 26 October 2010 and Executive Deputy Chairman on 21 October 2011.
Current appointments
Chairman/Managing Director of Vallibel One PLC. Chairman of Royal Ceramics Lanka PLC, Lanka Ceramic PLC, Lanka Walltiles PLC, Lanka Tiles PLC, The Fortress Resorts PLC, Vallibel Power Erathna PLC, Delmege Limited and L B Microfinance Myanmar Company Limited. Co-Chairman of Hayleys PLC, The Kingsbury PLC and Singer (Sri Lanka) PLC. Deputy Chairman of Horana Plantations PLC. Executive Director of Vallibel Finance PLC. Director of Amaya Leisure PLC, Haycarb PLC, Hayleys Fabric PLC, Dipped Products PLC and Hayleys Global Beverages (Pvt) Limited.
Former appointments
Chairman of Sampath Bank PLC.
MR. J A S SUMITH ADHIHETTY
Managing Director
Skills and experience
A well-known professional in the marketing field, counts over 36 years of experience in the finance sector.
Appointed to the Board
On 10 December 2003.
Membership of Board Sub-Committees
Member of the Nomination Committee and Integrated Risk Management Committee.
Current appointments
Director of Vallibel One PLC, The Fortress Resorts PLC, Greener Water Ltd, Summer Season Ltd, Summer Season Mirissa (Pvt) Ltd, Summer Season Residencies Ltd, La Fortresse (Private) Limited and L B Microfinance Myanmar Company Limited
Former appointments
Deputy Managing Director of Mercantile Investments Limited and served as a Director of Nuwara Eliya Hotels Company Limited, Grand Hotel (Private) Limited, Royal Palm Beach Hotels Limited, Tangerine Tours Limited, Security Ceylon (Private) Limited, Vallibel Finance PLC and Pan Asia Banking Corporation PLC.
Also served as the Managing Director of The Fortress Resorts PLC, and the said Executive office was relinquished on 2 March 2018.
MR. THOSAPALA HEWAGE
Independent Non-Executive Director
Skills and experience
Holds a Bachelor’s Degree in Social Science from the University of Ceylon, Peradeniya and a Master of Philosophy (Policy Analysis) from the University of Wales, UK. He holds a Post Graduate Diploma in Development Studies from the University of Cambridge, UK. He served as the Ambassador of Sri Lanka in Nepal for four years. He counts 42 years of experience as a professional Development Administrator and Natural Resource Manager.
GO
VE
RN
AN
CE
38 L B Finance PLC Annual Report 2017/18
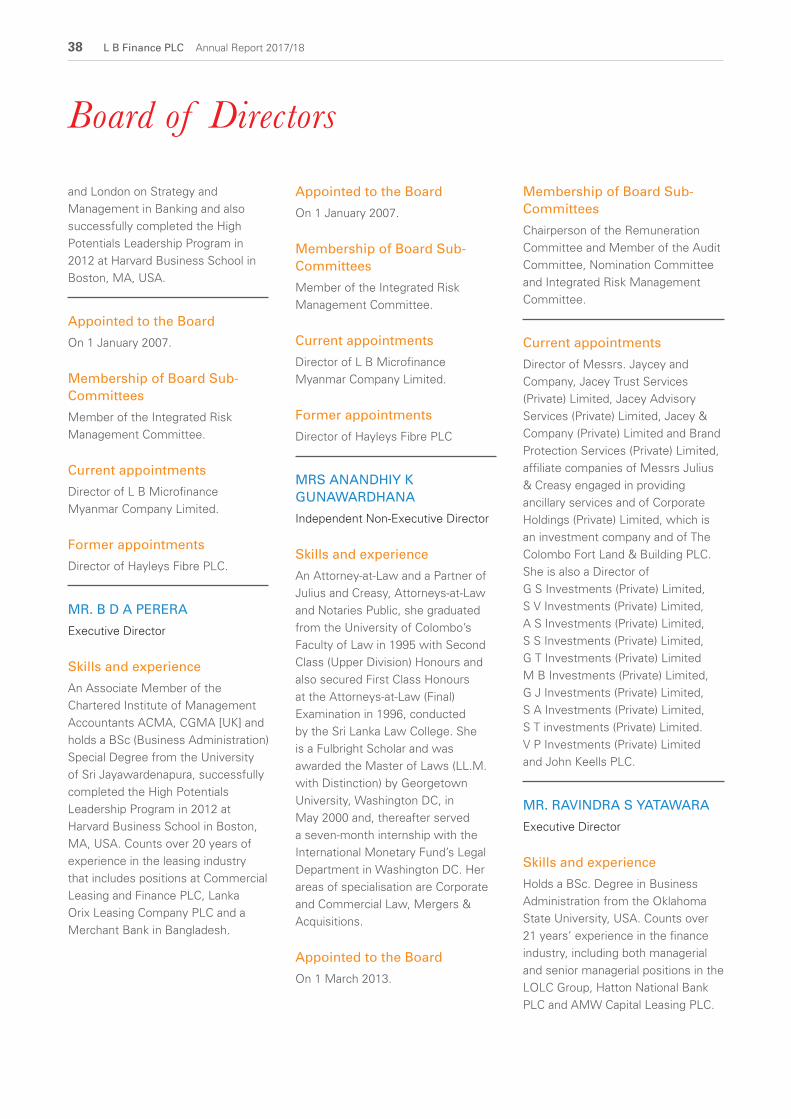
Appointed to the Board
On 1 January 2007.
Membership of Board Sub-Committees
Member of the Integrated Risk Management Committee.
Current appointments
Director of L B Microfinance Myanmar Company Limited.
Former appointments
Director of Hayleys Fibre PLC
MRS ANANDHIY K GUNAWARDHANA
Independent Non-Executive Director
Skills and experience
An Attorney-at-Law and a Partner of Julius and Creasy, Attorneys-at-Law and Notaries Public, she graduated from the University of Colombo’s Faculty of Law in 1995 with Second Class (Upper Division) Honours and also secured First Class Honours at the Attorneys-at-Law (Final) Examination in 1996, conducted by the Sri Lanka Law College. She is a Fulbright Scholar and was awarded the Master of Laws (LL.M. with Distinction) by Georgetown University, Washington DC, in May 2000 and, thereafter served a seven-month internship with the International Monetary Fund’s Legal Department in Washington DC. Her areas of specialisation are Corporate and Commercial Law, Mergers & Acquisitions.
Appointed to the Board
On 1 March 2013.
and London on Strategy and Management in Banking and also successfully completed the High Potentials Leadership Program in 2012 at Harvard Business School in Boston, MA, USA.
Appointed to the Board
On 1 January 2007.
Membership of Board Sub-Committees
Member of the Integrated Risk Management Committee.
Current appointments
Director of L B Microfinance Myanmar Company Limited.
Former appointments
Director of Hayleys Fibre PLC.
MR. B D A PERERA
Executive Director
Skills and experience
An Associate Member of the Chartered Institute of Management Accountants ACMA, CGMA [UK] and holds a BSc (Business Administration) Special Degree from the University of Sri Jayawardenapura, successfully completed the High Potentials Leadership Program in 2012 at Harvard Business School in Boston, MA, USA. Counts over 20 years of experience in the leasing industry that includes positions at Commercial Leasing and Finance PLC, Lanka Orix Leasing Company PLC and a Merchant Bank in Bangladesh.
Membership of Board Sub-Committees
Chairperson of the Remuneration Committee and Member of the Audit Committee, Nomination Committee and Integrated Risk Management Committee.
Current appointments
Director of Messrs. Jaycey and Company, Jacey Trust Services (Private) Limited, Jacey Advisory Services (Private) Limited, Jacey & Company (Private) Limited and Brand Protection Services (Private) Limited, affiliate companies of Messrs Julius & Creasy engaged in providing ancillary services and of Corporate Holdings (Private) Limited, which is an investment company and of The Colombo Fort Land & Building PLC. She is also a Director of G S Investments (Private) Limited, S V Investments (Private) Limited, A S Investments (Private) Limited, S S Investments (Private) Limited, G T Investments (Private) Limited M B Investments (Private) Limited, G J Investments (Private) Limited, S A Investments (Private) Limited, S T investments (Private) Limited. V P Investments (Private) Limited and John Keells PLC.
MR. RAVINDRA S YATAWARA
Executive Director
Skills and experience
Holds a BSc. Degree in Business Administration from the Oklahoma State University, USA. Counts over 21 years’ experience in the finance industry, including both managerial and senior managerial positions in the LOLC Group, Hatton National Bank PLC and AMW Capital Leasing PLC.
Board of Directors

L B Finance PLC Annual Report 2017/18 39
Current appointments
Chief Executive Officer of Vallibel One PLC. Director of Delmege Limited, Alternate Director to Mr. Dhammika Perera on the Boards of Dipped Products PLC, Hayleys Fabric PLC and Haycarb PLC.
Former appointments
Assistant General Manager (Finance & Planning) of Pan Asia Banking Corporation PLC, Financial Controller of several Australian companies in Melbourne.
MR. ASHANE JAYASEKARA
Independent Non-Executive Director*
Skills and experience
He is the Partner & Head of Risk, IT and Forensic Services for BDO Sri Lanka. He currently oversees BDO Maldives and BDO Outsourcing operations. He has over 16 years of experience in providing outsourced internal audit, corporate governance and risk management solutions to private, public listed companies, multinational and Government enterprises.
He has vast experience in managing the delivery of internal audits, forensic investigations and information system audits across a range of sectors. He has experience in forensic services which includes assisting clients by undertaking investigations into allegations of fraud and misconduct, the provision of fraud awareness training, developing of fraud control strategies and policies as well as undertaking fraud risk assessments.
Fellow Member of the Institute of Chartered Accountants of Sri Lanka, the Chartered Institute of Management Accountants [UK] and the British Computer Society [UK]. He holds a Bachelor of Science in Information Systems from the London Metropolitan University and a Masters Degree in Business Administration from the University of Southern Queensland. He is a Certified Internal Auditor, Certified Financial Services Auditor and a Certified Information Systems Auditor from the USA.
Appointed to the Board
On 30 October 2017.
Membership of Board Sub-Committees
Chairman of the Integrated Risk Management Committee, Member of the Audit Committee, Remuneration Committee and Related Party Transactions Review Committee.
Current appointments
Partner of Forensic, Risk and IT Advisory Services - BDO Sri Lanka, Director - B T Communications Lanka (Pvt) Ltd., Director - BDO BPO Services (Pvt) Ltd., Director - Sri Lanka Chapter of the Information Systems Audit and Control Association [USA].
Former appointments
Chairman - Information Technology Faculty of the Institute of Chartered Accountants of Sri Lanka, President/Governor - Sri Lanka Chapter of the Institute of Internal Auditors [USA], Director – BDO Consultants (Pvt) Ltd
*Non Executive Director as per the Finance Companies (Corporate Governance) Direction No.03 of 2008
Appointed to the Board
On 15 March 2016.
Membership of Board Sub-Committees
Member of the Integrated Risk Management Committee.
Current appointments
Director of L B Microfinance Myanmar Company Limited.
Vice Chairman, Leasing Association of Sri Lanka (LASL), Nominee of The Finance Houses Association of Sri Lanka (FHA) on the Board of the Credit Information Bureau of Sri Lanka (CRIB).
Former appointments
General Manager of L B Finance PLC, Chairman of The Finance Houses Association of Sri Lanka (FHA).
MRS. YOGADINUSHA BHASKARAN
Non-Executive Director
Skills and experience
Fellow of the Chartered Institute of Management Accountants UK (FCMA), Fellow of CPA Australia (FCPA) and an Associate Member of the Institute of Bankers, Sri Lanka.
Appointed to the Board
On 15 March 2016.
Membership of Board Sub-Committees
Chairperson of the Audit Committee and member of the Remuneration Committee.
GO
VE
RN
AN
CE

Senior Management
40 L B Finance PLC Annual Report 2017/18
Seated left to right:MR. ANIL BANDARA Senior Manager - IS Audit and Compliance, MR. DINUSHA MUDUNKOTUWA Senior Manager - Business Analysis, MRS. ZAIRAA KALEEL Compliance Officer
Standing left to rightMRS. NIROSHA AMANULLA Senior Manager-Kandy Branch, MR. KALPA SANJEEWA Chief Manager - Credit and Branch Operations, MR. KENNETH DANIEL Chief Manager - Credit and Branch Operations, MR. SHANAKA PERERA Senior Manager - Administration, MR. DINUDAYA ABEYWARDENA Senior Manager - Corporate Lending, MR.SURAJ KARUNANAYAKA Senior Manager - Gold Loan, MR. SUDEEP PERERA Senior Manager - Marketing, MR. GAYAN AYUWARDANE Chief Manager - Central Region, MR. MALITH HEWAGE Senior Manager - Finance

L B Finance PLC Annual Report 2017/18 41
Seated left to rightMR. CHINTHAKA CHANDRASENA Chief Manager - Credit and Branch Operations, MR. BIMAL PERERA Deputy General Manager - Strategy and Risk, MRS. DESHIKA YATAWARA Senior Manager - Treasury
Standing left to rightMR. HASITHA ATHAPATTU Chief Financial Officer, MR. PRASANNA KALINGA Assistant General Manager - Human Resources, MR. ROSHAN JAYAWARDENA Assistant General Manager - Microfinance, MR. HIRANTHA JAYASINGHE Chief Manager - Credit and Branch Operations, MR. UDUL CHANDRASENA Assistant General Manager - Treasury MR. WICKRAMA PUNCHIHEWA Head of Legal, MR. CHETHANA KAHANDUGODA Assistant General Manager - Information Technology, MR. AINSLEY MOTHA Deputy General Manager - Credit and Branch Operations, MR. MARLON PERERA Deputy General Manager - Deposits
GO
VE
RN
AN
CE

42 L B Finance PLC Annual Report 2017/18
MR. MARLON PERERA
Deputy General Manager – Deposits
Joined LBF in 1986, counts over 31 years of experience in the finance industry and has held many managerial positions.
MR. BIMAL PERERA
Deputy General Manager – Strategy and Risk
CFA Charterholder, Certified FRM
Joined LBF in 2013, counts over 15 years in fields of corporate treasury, strategic planning, investment finance and risk management both locally and overseas.
MR. AINSLEY MOTHA
Deputy General Manager – Credit and Branch Operations
MBA (Aus.), MABE (UK)
Joined LBF in 2013, counts over 27 years of experience in the banking, leasing and finance industry.
MR. CHETHANA KAHANDUGODA
Assistant General Manager – Information Technology
MSc Information Technology (University
Of Colombo), MIEEE
Joined LBF in 2010, counts over 19 years of experience in the field of information and communication technology, principally in the finance industry.
MR. HASITHA ATHAPATTU
Chief Financial Officer
CFA Charterholder, ME on Economics
(University of Colombo), BBA (Sp.)
(University of Colombo), ACA (Sri
Lanka), ACMA (Sri Lanka), Member of
Professional Risk Managers’ International
Association (PRM), holds ACI Dealing
certificate (Distinction) from ACI - The
Financial Markets Association)
Joined LBF in 2014, counts over 19 years of experience in fields of private banking, wealth management, debt and equity research, accounting and operations both locally and overseas.
MR. ROSHAN JAYAWARDENA
Assistant General Manager – Microfinance
DipM, MCIM (UK), MBA (University of
Sunderland, UK), FSSM (UK)
Joined LBF in 2007, counts over 28 years of experience in the fields of banking, leasing, finance, marketing and business development.
MR. PRASANNA KALINGA
Assistant General Manager – Human Resources
BA (MGM), KDA
Joined LBF in 2016, counts over 19 years of industry experience both locally and overseas.
MR. UDUL CHANDRASENA
Assistant General Manager- Treasury
ACMA, CGMA (UK), MA (Econ.)
Joined LBF in 2017, counts more than 31 years of experience in capital markets, commercial banking and financial management both locally and overseas.
MR. WICKRAMA PUNCHIHEWA
Head of Legal
LL.B, Attorney-at-Law (Hons), GDIBM
(UK), MBA, CIMA Adv Dip MA, PGDBM,
CCHRM, CPM, Notary Public
Joined LBF in 2017, counts over 16 years as an Attorney-at-Law, and experience in non-banking finance sector and commercial law sector.
MR. CHINTHAKA CHANDRASENA
Chief Manager – Credit and Branch Operations
MBA (UK)
Joined LBF in 1996, counts over 21 years of experience in the areas of credit, marketing, recovery and branch operations.
MR. HIRANTHA JAYASINGHE
Chief Manager – Credit and Branch Operations
MBA (UK)
Joined LBF in 1999, counts over 18 years of experience in the areas of credit, marketing, recovery and branch operations.
MR. KALPA SANJEEWA
Chief Manager – Credit and Branch Operations
MBA (UK)
Joined LBF in 2005, counts over 17 years of experience in the areas of credit, marketing, recovery and branch operations.
Senior Management

L B Finance PLC Annual Report 2017/18 43
MR. KENNETH DANIEL
Chief Manager – Credit and Branch Operations
Dip. in Bank Management (IBSL),
MBA (UK)
Joined LBF in 2011, counts over 23 years of experience in the leasing, finance and banking industry.
MR. GAYAN AYUWARDANE
Chief Manager – Central Region
MBA (UK)
Joined LBF in 2015, counts over 16 years of experience in the leasing, finance and banking industry.
MRS. NIROSHA AMANULLA
Senior Manager – Kandy Branch
Joined LBF in 1985, counts over 31 years of experience in the finance industry.
MR. DINUDAYA ABEYWARDENA
Senior Manager – Corporate Lending
MBA (PIM- USJ), ACMA (UK), CGMA, AIB
(SL)
Joined LBF in 2016, counts over 13 years of experience in the banking and finance industry.
MR. SHANAKA PERERA
Senior Manager – Administration
Joined LBF in 1998, counts over 20 years of experience in the fields of administration and procurement.
MR. MALITH HEWAGE
Senior Manager – Finance
Bsc Accounting (Sp) (University of
Sri Jayewardenepura), ACA (Sri Lanka)
Joined LBF 2013, counts more than 8 years of experience in the fields of financial reporting, accounting and auditing.
MR. ANIL BANDARA
Senior Manager – IS Audit and Compliance
Diploma in Information Aystem Audit
and Controls, Lead Auditor- ISO 27001-
Information Security, Lead Auditor- ISO
9001, Quality Assurance
Joined LBF in 2016, counts over 26 years of experience in information system and general audits experiences both locally and overseas.
MRS. ZAIRAA KALEEL
Compliance Officer
B. Com. (Hons) Sp. (Pera), MBA
(Kelaniya), ACMA (UK), CGMA, ACSI (UK),
AMBCS (UK), Dip in Compliance (IBSL)
Joined LBF in 2016, counts over 11 years of experience in the fields of banking, finance and capital markets.
MR. DINUSHA MUDUNKOTUWA
Senior Manager – Business Analysis
BICT (University of Colombo)/PMP (PMI
USA)
Joined LBF in 2017, counts over seven years of experience in the fields of information technology, accounting and auditing, specialising in banking and finance sector.
MR. SUDEEP PERERA
Senior Manager – Marketing
B.Sc. (Colombo), PG.Dip.M, MCIM
MSLIM, MBA Sp. Marketing (Colombo).
Joined LBF in 2017, counts over 14 years of experience in the fields of marketing, travelling and manufacturing.
MRS. DESHIKA YATAWARA
Senior Manager – Treasury
MBA (PIM-USJ), ACMA (UK), CGMA
Joined LBF in 2008, counts over 10 years of experience in the field of finance.
MR.SURAJ KARUNANAYAKA
Senior Manager – Gold Loan
BSc. Physical Sciences (University of
Kelaniya)
Joined LBF in 2016, counts over 10 years of experience in the banking and finance industry.
GO
VE
RN
AN
CE

44 L B Finance PLC Annual Report 2017/18
Corporate Governance
Strong governance is a vital ingredient in our successful, growing and dynamic business
better decisions. Board diversity facilitates effective governance by positioning the Board to be made up of highly-qualified Directors.
WE MAINTAIN A STRONG FOCUS ON ETHICAL CONDUCTOur culture is open, fair and transparent. We have a non-negotiable commitment to doing what’s right, supported by our Code of Conduct, a Board-approved set of principles that is based on our values of integrity, empathy, diversity and responsibility – and is applicable to our Board of Directors and everyone who works at L B Finance.
BOARD AND MANAGEMENT STAY CONNECTED WITH OUR SHAREHOLDERSTransparency is the key, and communication is essential. We
engage and inform our shareholders through our annual meeting of shareholders, Annual Report, management proxy circular, annual information form, Sustainability Report, Corporate Responsibility Report, quarterly reports, news releases, earnings, conference calls, industry conferences and other ad hoc meetings of shareholders with members of management and our Board of Directors. Our website provides extensive information about the Board, its mandate, the Board committees and their charters, and our Directors.
This section of the Report explains and demonstrates the framework of governance at L B Finance PLC and the level of compliance with the Finance Companies (Corporate Governance) Direction No. 03 of 2008 and amendments thereto, Listing Rules of the Colombo Stock Exchange on Corporate Governance and the Code of Best Practice on Corporate Governance issued by The Institute of Chartered Accountants of Sri Lanka.
We welcome engagement with our stakeholders and look forward to your valuable feedback to continue with our commitment to further improve on our corporate governance philosophy on a continuing basis.
Shirani JayasekaraChairperson
1 June 2018Colombo
Effective corporate governance practices are essential to achieve and maintaining public trust and confidence in the financial system which are critical to the proper functioning of the financial sector and economy as a whole.
When we measure L B Finance’s performance, shareholder return is an important metric – but only as it reflects a more fundamental commitment to earning the trust of all stakeholders. We have a responsibility not simply to meet regulatory requirements, but to act in accordance with our stated values. And the cornerstone of our efforts is sound corporate governance. We’ve changed successfully over the past 47 years because of good governance, keeping an eye on the long-term, and focusing on what is right for our customers.
YOUR BOARD OVERSEES YOUR BUSINESSYour Board of Directors provides stewardship, including direction-setting and general oversight of our management and operations. Its members have sophisticated expertise and a range of perspectives. The Board approves the Company’s overall strategy and makes decisions based on L B Finance’s values, emphasising long-term performance over short-term gain.
OUR FOCUS ON DIVERSITY REFLECTS OUR VALUESThe diverse backgrounds of your Board help us connect with our customers, our markets and our employees. A diverse Board also helps us make
CHAIRPERSON’S MESSAGE

L B Finance PLC Annual Report 2017/18 45
Strong risk cultureEffective internal
controls
Competent leadership
Accountability to shareholders
Corporate Governance Framework
CORPORATE GOVERNANCE PHILOSOPHY
At LBF, our corporate governance philosophy stems from our belief that corporate governance is a key element in improving efficiency, growth, enhancing investor confidence and return to the shareholders. This provides an overview of the corporate governance structures, principles, policies and practices of the Board of Directors of L B Finance PLC, which together enable LBF to meet governance expectations of all stakeholders.
To serve the interests of shareholders and other stakeholders, LBF’s corporate governance system is subject to ongoing review, assessment and improvement. The Board of Directors proactively adopts governance policies and practices designed to align the interests of the Board and management with those of shareholders and other stakeholders and to promote the
highest standards of ethical behaviour and risk management at every level of the organisation.
We have a clearly defined governance framework that promotes transparency, fairness and accountability.
The Board believes that corporate governance principles should be
embedded in our corporate culture. Our corporate culture is anchored on (a) competent leadership, (b) effective internal controls, (c) a strong risk culture and (d) accountability to shareholders. Our internal controls cover financial, operational, compliance and technology, as well as risk management policies and systems.
GO
VE
RN
AN
CE

46 L B Finance PLC Annual Report 2017/18
Principle Description
Ethical Culture Trust, integrity and good governance are hallmarks of the Board’s governance approach. By setting the tone from above, the Board champions the values of trust, integrity and good governance that are well entrenched in the culture of LBF, and reinforces the ethical principles on which LBF’s reputation and success are founded.
To maximise shareholder value on a sustainable basis, these values must extend into every segment of LBF operations and business activities.
Stewardship The members of the Board are the stewards of LBF, exercising independent judgment in overseeing management and safeguarding the interests of shareholders.
In fulfilling its stewardship role, the Board seeks to instil and foster a corporate environment founded on integrity and to provide management with sound guidance in pursuit of long-term shareholder value.
Strategic Oversight
The members of the Board are the key advisors to Management, advising on strategic direction, objectives and action plans, taking into account both the opportunities and LBF’s risk appetite.
In carrying out this oversight role, the Board actively engages in setting the long-term strategic goals for the organisation, reviews and approves business strategies, corporate financial objectives and financial and capital plans that are consistent with the strategic goals, and monitors LBF’s performance in executing strategies and meeting objectives.
Corporate Governance
Internal Benchmarks on Corporate Governance
• Articles of Association
https://cdn.cse.lk/cmt/ ssociationFiles/ 4571429845658_379.pdf
• All Board approved Policies on operational areas
• Organisational Structure
• Code of Ethics and Conduct for all employees
• Policies related to Corporate Governance
• Share Trading Policy
• Risk Management Policy
• Human Resources Policy and Manual
Regulatory Benchmarks On Corporate Governance
Companies Act No. 07 of 2007
Mandatory compliance
http://www.drc.gov.lk/?page_id=1933
Finance Business Act No. 42 of 2011 and all Directions/ Guidelines issued thereunder
Mandatory compliance
https://www.cbsl.gov.lk/sites/default/files/cbslweb_documents/laws/acts/en/finance_business_act_2011_42E.pdf
Corporate Governance Direction No. 03 of 2008 (as amended) issued by the Monetary board of Central bank of Sri Lanka
Mandatory compliance
https://www.cbsl.gov.lk/sites/default/files/cbslweb_documents/laws/cdg/ snbfi_LFCsDirectionBook_Nov2013-compressed_0.pdf
Listing Rules of the Colombo Stock Exchange (CSE)
Mandatory compliance
https://www.cse.lk/home/listingRules
The Code of Best Practice on Corporate Governance as published by the Institute of Chartered Accountants of Sri Lanka
Voluntary compliance
https://www.casrilanka.com/casl/images/stories/2017/2017_pdfs/code_of_best_practice_on_corporate_governance_2017_final_for_web.pdf
Continuing Listing Requirements of the Colombo Stock Exchange (CSE)
Mandatory compliance

L B Finance PLC Annual Report 2017/18 47
Principle Description
Risk Oversight The Board oversees the framework, policies and systems to identify and manage risks to the businesses and seeks to embed a strong risk management culture throughout LBF.
The Board actively monitors the organisation’s risk profile relative to risk appetite and seeks to ensure that Management’s plans and activities provide an appropriate balance of return for the risks assumed and are prudently focused on generating shareholder value.
Independence Independence from Management is fundamental to the Board’s effective oversight and mechanisms are in place to ensure its independence.
All direct and indirect material relationships with LBF are considered in determining whether a member of the Board is independent.
Accountability Transparency is a key component of good governance. The Board is committed to clear and comprehensive financial reporting and disclosure, and constructive shareholder engagement.
The Board has carefully defined the expectations and scope of duties of the Board, its committees and Management.
Continuous Improvement
The Board is committed to continuous improvement of its corporate governance principles, policies and practices, which are designed to align the interests of the Board and Management with those of shareholders, to support the stewardship role of the Board and to enhance the Board’s ability to safeguard the interests of shareholders through independent supervision of Management.
To ensure policies and practices meet or exceed evolving best practices and regulatory expectations, LBF’s corporate governance system is subject to ongoing review by the Board.
• Whistleblowing Policy
• Charters/Terms of Reference of Board Subcommittees and Management Committees
• Policy on Managing Conflicts of Interest
• Communication Policy
• Complaint Handling Policy
• Related Party Transactions Policy
• Anti-Money Laundering and Suppression of Terrorist Financing Policy
• Document Retention and Destruction Policy
• Information Systems Security Policy
• Board Charter
https://cdn.cse.lk/pdf/Section-7-17.01.2018.pdf
Related Party Transactions Section 9 of the Listing Rules of the CSE
Mandatory compliance
https://cdn.cse.lk/pdf/Section-9-17.01.2018.pdf
Securities and Exchange Commission of Sri Lanka Act No. 36 of 1987 (as amended)
Mandatory compliance
http://www.sec.gov.lk/wp-content/uploads/SEC-Act-Revised-Edition-2009.pdf
Inland Revenue Act No. 24 of 2017 and amendments thereto and other statutes
Mandatory compliance
http://www.ird.gov.lk/en/publications/Income%20Tax_Documents/IR_Act_No_10[E]_2006_(Consolidation_2015).pdf
Shop and Office Employees Act No. 19 of 1954 and amendments thereto
Mandatory compliance
http://www.ilo.org/dyn/travail/docs/1350/Shop%20and%20Office%20Employees%20Act.pdf
Sri Lanka Accounting and Auditing Standards Act No. 15 of 1995
Mandatory compliance
http://www.slaasc.lk/pdf/01.pdf
Anti-Money Laundering Laws and Regulations and Financial Transactions Reporting Act No. 6 of 2006
Mandatory compliance
http://fiusrilanka.gov.lk/docs/ACTs/FTRA/Financial_Transactions_Reporting_Act_2006-6_%28English%29.pdf
GO
VE
RN
AN
CE

48 L B Finance PLC Annual Report 2017/18
GOVERNANCE STRUCTURE
The fundamental relationships among the Board, its sub-committees, Management, shareholders, regulators and other stakeholders are guided by the LBF’s governance structure. Through this framework, the Company’s values and strategic and corporate objectives are set, and plans are determined for achieving those objectives and monitoring performance.
Audit Committee
Audit & IS Compliance
Risk
Internal Audit
Compliance
Assets and Liabilities
Management Committee
Credit Committee
IT Steering Committee
Business Continuity
Management Steering
Committee
Sustainability Committee
Integrated Risk Management Committee
Nomination Committee
Remuneration Committee
Related Party Transactions
Review Committee
BO
AR
D S
UB
-CO
MM
ITT
EE
S
M A N A G E M E N T C O M M I T T E E S
External Auditors Shareholders
Board of Directors
Executive Management
The duties and responsibilities imposed on Directors of a financial institution are expansive and demanding. LBF’s present governance structure therefore remains critical to ensuring strict compliance at all times, and is reviewed in response to matters arising, and at least on an annual basis.
Reports To
Appoint
Elect
Appoints
Appoints
GRI - 102 - 18
Corporate Governance

L B Finance PLC Annual Report 2017/18 49
CORPORATE GOVERNANCE INITIATIVES FOR THE YEAR 2017/2018
April 2017
» The whistleblower Policy was re-visited with a view to further strengthen the process by which employees raise concerns in confidence
» The Board and all Board sub-committees carried out self-assessments to critically evaluate the effectiveness of the Board and each of the sub-committees. The results of the self-evaluations were discussed in detail and areas for improvement together with an action plan were mandated
» The Company engaged the services of Messrs. Ernst & Young to seek their assessment of the Company’s compliance with the requirements of the Finance Business Act No. 42 of 2011 on ‘Corporate Governance Direction No. 03 of 2008 (as amended) issued by the Monetary Board of Central bank of Sri Lanka
May 2017
» Formation of the Strategy division headed by a Deputy General Manager
» Changes were made to the corporate management structure and reporting lines in pursuance of the Company’s Strategy
» Anti-Money Laundering, Countering the Financing of Terrorism and Know your Customer Policies were approved by the Board.
» Audit Committee Charter and Internal Audit Charter were reviewed and approved by the Board
» Policy for engaging external Auditors to provide Non-Audit Services was approved by the Board
June 2017
» Reviewed and assessed the strength of the Company’s cyber security capabilities and potential risks in light of the perpetually-changing nature of potential threats
July 2017
» Reviewed IT Governance Policies which were adopted by the Board with revisions.
August 2017
» Procedure for Anti Money Laundering and Combating of Financing of Terrorism was approved by the Board.
» Re-constitution of Nomination Committee and Related Party Transactions Review Committee.
October 2017
» Re-constitution of Board sub- committees to include newly- appointed Directors
» Reviewed the Terms of Reference of IRMC and KPIs developed and monitored by the IRMC
» Pledge of Secrecy to be signed by every Director was adopted by the Board
November 2017
» Share Trading Policy was approved by the Board, which applies to all Employees and Directors of the Company
January 2018
» Code of Conduct was revised based on the Code of Best Practice on Corporate Governance issued by the Institute of Chartered Accountants of Sri Lanka
» Audit Committee Charter was further reviewed and confirmed by the Board after incorporating one amendment
February 2018
» Carried out unannounced real-time testing on the comprehensive business continuity plan
March 2018
» The Board and all Board sub-committees carried out self-assessments to critically evaluate the effectiveness of the Board and each of the Subcommittees. The results of the self-evaluations were discussed in detail and areas for improvement together with an action plan were mandated in April 2018.
DIVERSITY IN THE BOARDROOM
The Board of Directors forms one of the pillars of a robust corporate governance framework. Your Board diversity aims to cultivate a broad spectrum of demographic attributes and characteristics in the Boardroom, with the benefits of more effective decision making, better utilisation of the talent pool and enhancement of corporate reputation and investor relations by establishing the Company as a responsible corporate citizen.
GO
VE
RN
AN
CE

50 L B Finance PLC Annual Report 2017/18
The Board has adopted a diversity policy, which recognises the importance of having an appropriate balance of industry knowledge, skills, experience, professional qualifications, gender and nationalities to build an effective and cohesive Board. In particular, the Board has set an objective of having female representation. Board members have a broad range of experience and deep industry expertise. LBF has a good balance between continuity and fresh perspectives on the Board.
Board composition
The board consists of 10 Directors as at 31st of March 2018
No Name of Director Board composition Date of appointment to Board
Period of serviceupto to 31.3.2018
1 Mrs. Shirani Jayasekara Chairperson – Independent Non-Executive Director
25.08.2010 (as a Director) 18.09.2017 (as the Chairperson)
7 years and 7 months
2 Mr. Dhammika Perera Executive Deputy Chairman 22.10.2002 – (as a Non-Executive Director) 21.10.2011 (as Executive Deputy Chairman)
9 years as a Non- Executive Director; - 6 years and 5 months as Executive Deputy Chairman
3 Mr J A S S Adhihetty Managing Director 10.12.2003 14 years and 3 months
4 Mr. Thosapala Hewage Independent Non-Executive Director
23.04.2013 4 years and 11 months
5 Mr. Niroshan Udage Executive Director 01.01.2007 11 years and 3 months
6 Mr. B D A Perera Executive Director 01.01.2007 11 years and 3 months
7 Mr. R S Yatawara Executive Director 15.03.2016 2 years
8 Mrs. Anandhiy K Gunawardhana Independent Non-Executive Director
01.03.2013 5 years and 1 month
9 Mrs. Yogadinusha Bhaskaran Non-Executive Director 15.03.2016 2 years
10 Mr. M A J W Jayasekara Independent Non-Executive Director *Non-Executive Director +
30.10.2017 5 months
* As per the Listing Rules+ As per the Finance Companies (Corporate Governance) Direction No. 3 of 2008 on Corporate Governance and amendments thereto
SKILLS, EXPERTISE AND EXPERIENCE
Your Board having the optimal mix of skills, expertise and experience, is paramount to ensure that the Board as a collective is equipped to guide the business and strategy of the Company.
Corporate Governance

L B Finance PLC Annual Report 2017/18 51
BOARD SKILL MATRIX
Skill Category Explanation No. of Directors
1 2 3 4 5 6 7 8 9 10
Business leadership and development
Successful career at senior executive level in a large and complex organisation
Strategy Development and oversight of execution of strategic objectives
Financial services experience
Retail, corporate and investment companying, wealth and superannuation, treasury, financial services advisory
Financial acumen Accounting, internal and external reporting, audit, capital markets and funding, able to assess the effectiveness of financial controls
Risk management Oversight of risk frameworks and practices which identify and manage key risks
Culture and conduct Promotion and demonstration of LBF’s Values as the basis of behaviour and decision-making
People and remuneration
Oversight of LBF’s remuneration policy and framework, including succession planning
Technology and digital
Development of and investment in IT infrastructure, adaptation to digital change and innovation
Corporate governance
Commitment to the highest standards and systems of governance
Legal and compliance
Oversight of operations and obligations in a highly-complex and regulated environment
GENDER AND AGE
These elements are some of the most emphasised forms of diversity in the Boardroom. Historically, corporate Boardrooms have largely been a
male consortium. In recent years, this practice has been challenged as many companies, the LBF Board and shareholders have recognised the
benefits of having a gender-balanced Boardroom. Age diversity is an often overlooked element in the LBF Boardroom.
Gender No. of Directors
1 2 3 4 5 6 7 8 9 10
Male
Female
Age No. of Directors
1 2 3 4 5 6 7 8 9 10
30-39
40-49
50-59
60-69
GRI - 102 - 27
GO
VE
RN
AN
CE

52 L B Finance PLC Annual Report 2017/18
INDEPENDENCE
To be independent of Management, a Director must be free of any business or other association that could materially interfere with his or her ability to act in the best interests of LBF. A register of Directors’ material interests is maintained and regularly reviewed by each Director. If a Director is involved with another company or firm that may have dealings with LBF, those dealings must be at arm’s length and on normal commercial terms.
To assist in determining independence, each Non-Executive Director is required to make an annual disclosure to the Board of all relevant information. The Board considers the independence of each Director, taking into account the factors outlined in the Corporate Governance Principles and Recommendations.
To further assist in ensuring that the Board operates independently of Management, Non-Executive Directors
meet in the absence of Management, where necessary at scheduled Board and Committee meeting.
The Board is satisfied that each Non-Executive Director who has served on the Board during 2017/2018 has retained independence of character and judgment and has not formed associations with Management or others that might compromise their ability to fulfil their role as an Independent Director.
No. of Directors
INDEPENDENCE 1 2 3 4 5 6 7 8 9 10
Independent Non-Executive Directors
Non-Independent and Non-Executive Director
Executive Directors
No. of Directors
NON-EXECUTIVE DIRECTOR TENURE 1 2 3 4 5
No of Years
Lesser than 3 years
3 - 6 Years
6 - 9 Years
BOARD’S KEY AREAS OF FOCUS
» Review LBF’s strategic and business plans
» Monitor the responsibilities delegated to the Board committees to ensure proper and effective oversight and control of LBF’s activities
» Establish a framework for risks to be assessed and managed
» Review management performance
» Determine LBF’s values and standards (including ethical standards) and ensure that obligations to its stakeholders are understood and met
» Develop succession plans for the Board and Key Management Personnel
» Consider sustainability issues (including environmental and social factors) as part of LBF’s strategy
BOARD MEETINGS AND ACTIVITIES
We have a highly Engaged Board with diverse perspectives. Board and Board committee meetings are held regularly to discuss key topics such as strategic, governance and operational issues.
Corporate Governance

L B Finance PLC Annual Report 2017/18 53
Before meeting
» To facilitate meaningful participation, all Board and Board committee meetings are planned and scheduled well in advance in consultation with the Directors
» The Chairperson oversees the setting of the agenda of Board meetings in consultation with the CEO/MD to ensure that there is sufficient information and time to address all agenda items
» The agenda of the Board meetings is carefully thought out and well-managed. At the same time, the agenda allows for flexibility when it is needed
» Directors are provided with complete information related to agenda items in a timely manner
» All materials for Board and Board committee meetings are uploaded onto a secure portal which can be readily accessed on tablet devices provided to the Board members
» When exigencies prevent a Director from attending a Board or Board committee meeting in person, that Director can participate by telephone or video-conference
» Directors have the discretion to engage external advisers
At every meeting
» The Chairperson promotes open and frank debates by all Directors at Board meetings
» The Board members come well prepared and engage in robust discussions on key matters pertaining to the Company
» If there are any situations where there is a conflict of interest, the Director in question will excuse him or herself from the discussions and abstain from participating in any Board decision
» Chairperson of each Board committee provides a thorough update on significant matters discussed at the Board committee meetings which are typically scheduled before the Board meeting
» The CEO/MD gives a complete and comprehensive update on the Company’s business and operations as well as a macro perspective on industry trends and developments
» The Chief Financial Officer (CFO) presents the financial performance and significant financial highlights on a monthly basis
» The Compliance Officer (CO) presents the status of compliance with regulations and significant regulation updates
» Certain business heads provide updates on their areas of business
» Key Management Personnel are present at all Board meetings, Directors have the opportunity to discuss specific areas with them and give constructive challenge to ideas
» Exposures of LBF to the individual Directors and their respective related concerns are tabled
» The Board holds a private session for Directors
» External professionals or in-house subject matter experts are also invited to present key topics identified by the Board as well as updates on corporate governance, risk management, capital, tax, accounting, listing and other regulations, which may have an impact on LBF’s affairs
Frequent and effective engagement with the Board
» The Board is regularly updated on the performance and prospects of LBF
» Outside of Board meetings, Board approvals for matters in the ordinary course of business can be obtained through the circulation of written resolutions
» Ad-hoc meetings are held when necessary
» Directors have direct access to Senior Management and may request from Management any additional information to make informed and timely decisions
» Throughout the year, the Directors also have various opportunities to interact with members of the Management Committees
» Directors have ongoing interactions across various levels, functions within LBF. This allows Directors to have a better understanding of the business and operations of LBF
» Directors have separate and independent access to the Company Secretary at all times. The Company Secretary attends all Board meetings and generally assists Directors in the discharge of their duties. The Company Secretary facilitates communication between the Board, its committees and Management. The Company Secretary helps with the induction of new Directors. The appointment and removal of the Company Secretary require the approval of the Board
GO
VE
RN
AN
CE

54 L B Finance PLC Annual Report 2017/18
Board Meeting Attendance from April 2017 to March 2018
Name of the Director Attendance at Board Meetings
25/4 28/4 Special Board
Meeting
23/5 20/6 28/7 22/8 17/10 28/11 4/1 30/1 14/3 14/3 Total
Mrs. Kimarli Fernando ü ü ü ü ü ü Ceased w.e.f. 25.8.2017 6/6
Mrs. Shirani Jayasekara ü ü ü ü ü ü ü ü ü ü ü ü 12/12
Mr. Dhammika Perera ü Ex ü ü ü ü ü ü ü ü ü ü 11/12
Mr. T Hewage ü ü ü ü ü ü ü ü ü ü ü ü 12/12
Mr. J A S S Adhihetty ü Ex ü ü ü ü ü ü ü ü ü ü 11/12
Mr. L N de S Wijeyeratne
ü ü ü ü ü ü ü Ceased w.e.f. 31.10.2017 7/7
Mr. W D N H Perera Ab Ex Resigned w.e.f. 30.4.2017 0/2
Mr. Niroshan Udage ü ü ü ü ü ü ü ü ü ü ü ü 12/12Mr. B D A Perera ü ü ü ü ü ü ü ü Ex ü ü ü 11/12Mr. Ravi S Yatawara ü Ex ü ü ü ü ü ü ü Ex ü ü 10/12Mrs. Anandhiy K Gunawardhana
ü ü ü ü ü ü ü ü ü Ex ü ü 11/12
Mrs. Yogadinusha Bhaskaran
ü ü ü ü ü ü ü ü ü ü ü ü 12/12
Mr. M A J W Jayasekara Appointed with effect from 30th October 2017 ü ü ü ü ü 5/5
Ex - Excused Ab - Absent
2017/2018 Highlights of Board Oversight Activities and Time Spends
Responsibility Activities Time Spent
Strategic Planning Approving LBF’s Strategic Plan 2017/2018 -2020/2021.
Overseeing the LBF’s strategic direction and formulation of priorities, ensuring alignment with the Company’s risk appetite.
Discussing aspects of strategy and, within the context of the Company’s enterprise-wide performance management framework, monitoring implementation of strategic initiatives.
Reviewing and approving LBF’s organisational structure.
Approving the Company’s financial objectives and operating plans, including significant capital allocations, expenditures and transactions that exceed delegated authorities.
Reviewing results of an annual assessment of business performance.
30%
30%
GRI - 102 - 26
Corporate Governance

L B Finance PLC Annual Report 2017/18 55
Responsibility Activities Time Spent
Governance Monitoring best practices in governance, developing corporate governance principles and guidelines, and establishing appropriate structures and procedures to allow the Board to function effectively and independently of Management.
The Board also conducted detailed annual reviews of the Company’s key Policies and Procedures.
15%
15%
Risk Management Updating the Company’s Risk Management Policy and Enterprise Wide Risk Management Framework to meet changing demands.
Overseeing and approving the Company’s Risk Appetite Framework.
Promoting a strong risk management culture and ensuring that conduct aligns with the Company’s Enterprise-Wide Risk Management Framework.
Meeting with Regulators on the Company’s risk appetite and control environment.
15%
15%
Financial Reporting
and Internal Controls
Overseeing compliance with applicable audit, accounting and financial reporting requirements.
Requiring Management to implement and maintain effective systems of internal control, including management information systems.
Through the Audit & Risk Management Committee, assessing the adequacy and effectiveness of systems of internal control.
Approving the annual audited financial reports, and quarterly financial reports
20%
20%
Culture of Integrity Championing the Company’s values, as set out in its Code of Business Conduct, and satisfying itself that a culture of integrity is maintained throughout the LBF.
10%
10%
Talent Managementand SuccessionPlanning
Reviewing strategies and programmes for assessment and development of talent.
Supervising succession planning processes.
Annually reviewing and approving the mandate of the CEO/MD and the Management Team.
10%
10%
GO
VE
RN
AN
CE

56 L B Finance PLC Annual Report 2017/18
HIGHLIGHTS OF BOARD OVERSIGHT ACTIVITIES AND TIME SPENDS
30%
15%
15%
20%
10%
10%
Strategic planningGovernanceRisk managementFinancial reporting and internal controlCulture of integritiyTalent management and succession planning
ROLES AND RESPONSIBILITIES
The Board
The Board is elected by the shareholders to supervise the management of the business and affairs of the Company. The prime stewardship responsibility of the Board is to ensure the viability of the LBF and to ensure that it is managed in the best interests of the shareholders as a whole while taking into account the interests of other stakeholders. LBF has a Board Charter approved by the Board. Broadly, the responsibilities of the Board include the following:
» reviewing and approving overall business strategy as well as organisation structure, as developed and recommended by management;
» ensuring that decisions and investments are consistent with long-term strategic goals;
» ensuring that the Company operates in such a way as to preserve its financial integrity and in accordance with policies approved by the Board;
» overseeing, through the Audit Committee, the quality and integrity
of the accounting and financial reporting systems, disclosure controls and procedures and internal controls; and, through the Risk Management Committee, the quality of the risk management processes and systems;
» providing oversight in ensuring that the Company’s risk appetite and activities are consistent with its strategic intent, the operating environment and effective internal controls, as well as capital sufficiency and regulatory standards;
» overseeing, through the Risk Management Committee, the establishment and operation of an independent risk management system for managing risks on an enterprise-wide basis, the adequacy of the risk management function (including ensuring that it is sufficiently resourced to monitor risk by the various risk categories and that it has appropriate independent reporting lines), and the quality of the risk management processes and systems;
» reviewing any transaction for the acquisition or disposal of assets that is material to the Company;
» ensuring that the necessary human resources are in place for the Company to meet its objectives;
» overseeing the related party transactions through the Related Party Transaction Review Committee;
» reviewing Management performance and ensuring that management formulates policies and processes to promote fair practices and high standards of business conduct by staff;
» establishing corporate values and standards, emphasising integrity, honesty and proper conduct at all times with respect to internal dealings and external transactions,
including situations where there are potential conflicts of interest;
» overseeing, through the Remuneration Committee, the design and operation of an appropriate remuneration framework, and ensuring that remuneration practices are aligned to and in accord with the remuneration framework;
» providing a balanced and understandable assessment of the Company’s performance, position and prospects, including interim and other price-sensitive public reports as well as reports to regulators;
» ensuring that obligations to shareholders and others are understood and met;
» maintaining records of all meetings of the Board and Board Committees, particularly records of discussion on key deliberations and decisions taken;
» identifying the key stakeholder groups, recognising that perceptions affect the Company’s reputation; and
» considering sustainability issues, e.g. environmental and social factors, as part of strategy formulation.
CHAIRPERSON
The role of Chairperson is distinct and separate from that of the Chief Executive and there is a clear division of responsibilities with the Chairperson leading the Board and the Chief Executive managing LBF business day-to-day.
The Chairperson’s key responsibilities are to:
» provide strong and effective leadership to the Board;
» ensure the Board is structured effectively, observes the highest standards of integrity and corporate governance, and sets the tone
Corporate Governance

L B Finance PLC Annual Report 2017/18 57
from the top in terms of culture and values;
» build an effective and complementary Board with an appropriate balance of skills and personalities;
» foster open and inclusive discussions at each Board/committee meeting which challenge executives, where appropriate;
» in conjunction with the Chief Executive and Company Secretary, ensure that members of the Board receive accurate, timely and clear information to enable the Board to lead LBF, take sound decisions and monitor effectively the performance of Executive Management;
» ensure that the performance of individual Directors and of the Board as a whole and its committees is evaluated regularly; and
» ensure LBF maintains effective communication with shareholders and other stakeholders.
CHIEF EXECUTIVE OFFICER/ MANAGING DIRECTOR
The Chief Executive Officer/Managing Director has responsibility for all of LBF’s business and acts in accordance with the authority delegated by the Board.
Key responsibilities of the Chief Executive Officer/Managing Director are to:
» exercise executive accountability for LBF businesses delivering operational management and oversee the full range of activities of the customer businesses and functions;
» develop, drive and deliver the strategy approved by the Board;
» drive and deliver performance against financial plans, acting in accordance with authority delegated by the Board;
» consult regularly with the Chairperson and Board on matters which may have a material impact on LBF;
» lead the culture and values of LBF, creating an environment where employees are engaged and committed to good customer outcomes;
» lead, manage and develop LBF’s senior leadership team, ensuring professional capability is developed and that succession coverage meets the needs of LBF;
» ensure LBF has effective frameworks and structures to identify, assess and mitigate risks; and
» in conjunction with the Chairperson and Company Secretary, ensure the Board receives accurate, timely and clear information.
Sub Committees Meeting Attendance From April 2017 to March 2018
Name of the Director Audit Committee Integrated Risk Management Committee
Remuneration Committee
Related Party Transactions Review Committee
Nominations Committee
Attendance Status Attendance Status Attendance Status Attendance Status Attendance Status
Mrs. Shirani Jayasekara 8/10 M 3/3 C - - 2/42/4
M*C**
- -
Mr. Dhammika Perera - - - - - - - - - -Mrs. Kimarli Fernando - - 1/2 M - M 2/2 C 1/1 MMr. T Hewage - - - - - - 1/1 M 3/3 CMr. J A S S Adhihetty - - 2/4 M - - - - 3/3 MMr. L N de S Wijeyeratne 10/10 C - - - M 3/3 M - -Mr. Niroshan Udage - - 4/4 M - - - - - -Mr. B D A Perera - - 4/4 M - - 4/4 M - -Mr. Ravi S Yatawara - - 2/2 M - - - - -Mrs. Anandhiy K Gunawardhana 14/16 M 2/2 M 2/2 C - - 2/2 MMrs. Yogadinusha Bhaskaran 6/6 C - - - - - - - -Mr. M A J W Jayasekara 6/6 M 1/2
1/2MC
2/2 M 1/1 M - -
*Till 25 August 2017
**From 26 August 2017
GO
VE
RN
AN
CE

58 L B Finance PLC Annual Report 2017/18
NON-EXECUTIVE DIRECTORS
Along with the Chairperson and Executive Directors, the Non-Executive Directors are responsible for ensuring that the Board fulfils its responsibilities under its terms of reference. The Non-Executive Directors combine broad business and commercial experience with independent and objective judgment and they provide independent challenge to the Executive Directors and the leadership team. The balance between Non-Executive and Executive Directors enables the Board to provide clear and effective leadership across LBF’s business activities. The standard terms and conditions of appointment of Non-Executive Directors are documented and approved by the Board.
The Non-Executive Directors on the Board constructively challenge and help develop proposals on strategy, review the performance of management in meeting agreed goals and objectives, and monitor the reporting of performance. They meet during the year, without the presence of Executive Directors, to discuss the effectiveness of management.
Separate sessions are also arranged for the Independent Directors to meet at least once a year to ensure effective corporate governance in managing the affairs of the Board and the Company.
BOARD COMMITTEES
In order to provide effective oversight and leadership, the Board has established a number of Board committees with particular responsibilities. Refer page 70 for the Committee Report for more details.
COMPANY SECRETARY
P W Corporate Secretarial (Pvt) Ltd. is the Company Secretary.
The key responsibilities of the Company Secretary include:
» working closely with the Chairperson to ensure effective functioning of the Board and appropriate alignment and information flows between the Board and its committees, including the Executive Committee. This includes Board succession planning, induction, and professional development;
» executive responsibility for Chairperson/Non-Executive Director search and appointment process;
» management of LBF’s profile with key stakeholders, including oversight of relations with key influencers and regulators;
» the provision of professional support to the Board and its committees and leading on implementation of recommendations from the annual Board evaluation.
DIRECTORS’ TRAINING AND DEVELOPMENT
The Nomination Committee oversees Director education, providing Directors with an ongoing programme to assist them in understanding their responsibilities, as well as keeping current their knowledge and understanding of the industry within which the Company operates. Directors identify their continuing education needs through Annual Board and Board sub-committee performance assessments and regular feedback to the Board Chairperson and sub- committee Chairs.
Members of the Board participated in Seminars and Conferences held throughout the financial year.
BOARD APPROVAL
The Company has documented internal guidelines for matters that require Board approval. Matters which are specifically reserved for Board approval, amongst others, are:
» Material acquisition and disposal of assets; financial reporting
» Corporate or financial restructuring; and
» Share issuance, dividends and other returns to shareholders.
The Board approves transactions exceeding certain threshold limits, while delegating authority for transactions below those limits to the Board Committees and management to optimise operational efficiency.
ACTING ETHICALLY AND RESPONSIBLY
Managing Conflicts of Interest
All Directors are guided by the provisions of the Conflict of Interest Policy. It is mandated that Directors should avoid any situation which might give rise to a conflict between their personal interests and those of the Company. During the nomination process, conflicts of interest (actual and potential) are disclosed and assessed to ensure that there are no matters which would prevent that person from offering himself for election to the Office of Director. Directors are responsible for disclosure as soon as they become aware of conflict situations. In instances where Directors have an interest in a material transaction or matter involving the Company that is being considered at the Board or a Board Sub – Committee level, they:
GRI - 102 - 25
Corporate Governance

L B Finance PLC Annual Report 2017/18 59
» Disclose that interest;
» As a general requirement, excuse themselves from the meeting during board or board-sub-committee discussions; and
» Do not cast a vote on the matter.
THE RELATED PARTY TRANSACTIONS
Company has established policies and procedures on related party transactions. These include definitions of relatedness, limits applied, terms of transactions, and the authorities and procedures for approving and monitoring the transactions. The Related Party Transaction Review Committee reviews non-recurrent related party and interested person transactions and keeps the Board informed of such transactions, if any. Measures are taken to ensure that terms and conditions for related party lendings are not more favourable than those granted to non-related obligors under similar circumstances.
SHARE TRADING
The Board has laid down the “Share Trading Policy“ as the Code of Internal Procedures and Conduct for Prevention of Insider Trading, with the objective of preventing purchase and/or sale of shares of the Company by an insider on the basis of unpublished price sensitive information. Under this policy, insiders (designated employees and their dependents) are prevented to deal in the Company’s shares during the closure of Trading Window.
To deal in securities beyond limits specified, permission is required. All Directors/designated employees are also required to disclose related information periodically as defined in the policy.
WHISTLEBLOWER PROTECTION
The Company places great importance on fostering a culture that encourages its people to speak up about issues and conduct that cause them concern. The Whistleblower Policy is designed to encourage and support individuals in reporting such matters, knowing that it is safe to do so, they will receive support and they will not be subject to retaliation or victimisation in response.
Further, the Company is in the process of developing the “Speak-Up Hotline” offering a trusted avenue for its people and external partners to report issues and concerns.
BOARD AND COMMITTEE PERFORMANCE
The Board has an annual performance evaluation process, to assess the effectiveness of the Board, Board Committees and each Director’s contribution. The purpose of the evaluation process is to increase the overall effectiveness of the Board.
The Directors participate in the evaluation. Each Director evaluates the performance of the Board and Board committees whilst the Chairperson and Nominating Committee Chairman evaluate the performance of each Director and meet to discuss the matter. The assessments are made against pre-established criteria which are derived from the Board’s charter and responsibilities. The results of the evaluation are used constructively to discuss improvements to the Board and ensure that each Director remains qualified for office. The Chairperson and/or Nominating Committee Chairman acts on the results of the evaluation, and if appropriate, proposes new Directors
or seeks the resignation of Directors, in consultation with the Nomination Committee.
Directors are expected to set aside adequate time for their oversight of matters relating to the Company. They must provide declarations of any changes in their other appointments, which are disseminated to all members. The Company has guidelines on meeting attendance and the extent of other appointments that a Director can assume. The Nominating Committee, based on the guidelines established, assesses annually each Director’s attendance record and degree of participation at meetings. In respect of other appointments, it takes into account – among various factors – the nature of an appointment (full-time or otherwise), number of meetings to attend, complexity of organisation and degree of participation in sub-committees.
IT GOVERNANCE
In the corporate world, Information Technology (IT) plays a vital role. Increasing complexities and criticalities in IT decision-making demands the Company to adopt an effective IT governance system. IT governance, which forms an integral part of the Company’s corporate governance, deals primarily with optimizing the linkage between strategic direction and information systems management of the Company. IT governance of the Company creates value that fits into the overall Corporate Governance strategy of the Company and is not a discipline on its own. IT governance of the Company ensures that the investments in IT generate value, avoid failure and mitigate IT associated risks.
GO
VE
RN
AN
CE

60 L B Finance PLC Annual Report 2017/18
The Company’s IT steering committee is headed by the Executive Director – Asset Management and meets monthly to discuss the following:
» To ensure that IT has sufficient resources to meet the Company’s demands.
» To assess and report IT-related risks and their organisational impact.
» Provide feedback about compliance of IT carrying out the system reviews according to CBSL requirements.
» Reviews are made to ensure that the objectives are achieved.
ACCOUNTABILITY TO OUR SHAREHOLDERS
SHAREHOLDER RIGHTS
LBF promotes fair and equitable treatment of all shareholders. All shareholders enjoy specific rights under the Companies’ Act. These rights include, among others, the right to participate in profit distributions and the right to attend and vote at general meetings.
Ordinary shareholders are entitled to attend and vote at the AGM in person or by proxy. LBF respects the equal information rights of all shareholders and is committed to the practice of fair, transparent and timely disclosure. All price-sensitive information is publicly released prior to any sessions with individual investors or analysts.
COMMUNICATION WITH SHAREHOLDERS
The Board welcomes engagement with shareholders and encourages them to express their views. To allow shareholders to provide timely and meaningful feedback, the Board has developed practices appropriate for the Company’s investor base to
facilitate constructive engagement. Examples of these practices include methods of hearing from shareholders and responding to their inquiries on an ongoing basis. The Board continues to proactively consider and adapt, as suitable to the circumstances of LBF, emerging practices of Board engagement with shareholders.
Procedures are in place to provide timely information to current and potential investors. The Board reviews and approves the contents of major disclosure documents, including the Annual Report, quarterly reports to shareholders and Management’s Discussion and Analysis.
CONDUCT OF SHAREHOLDER MEETINGS
The Annual General Meeting (AGM) provides shareholders with the opportunity to share their views and to meet the Board, including the chairpersons of the Board committees and members of Key Management Personnel. Our External Auditor is available to answer shareholders’ queries.
At the AGM, LBF’ financial performance for the preceding year is presented to shareholders. At general meetings, the Chairperson plays a pivotal role in fostering constructive dialogue between shareholders, Board members and the Management.
LBF encourages and values shareholder participation at its general meetings. In accordance with the recommendations contained in the Code and the Guidelines, resolutions requiring shareholder approval are tabled separately for adoption at the Company’s general meetings unless they are closely
related and are more appropriately tabled together.
COMPLIANCE STATEMENT
We are happy to confirm that throughout the year ended 31st March 2018 and as at the date of this Annual Report, the Company was compliant with the Listing Rules of the Colombo Stock Exchange and Finance Companies Direction No. 03 of 2008 on Corporate Governance and amendments thereto. In addition, tables set out in pages 82 to 94 depict the extent of adherence with the Code of Best Practice on Corporate Governance, issued by the ICASL. Further, the Company has complied with the provisions of the Companies Act No. 07 of 2007 and other statutes as applicable to the Company. All statutory payments due to Government, which have fallen due, have been made or where relevant provided for, except for certain assessments against which appeals have been lodged. Retirement gratuities have been provided for in accordance with LKAS 19 – ‘Employee Benefits’.
By order of the BoardL B Finance PLC
P W Corporate Secretarial (Pvt) LtdSecretaries
1 June 2018
Colombo
Corporate Governance

L B Finance PLC Annual Report 2017/18 61
FINANCE COMPANIES (CORPORATE GOVERNANCE) DIRECTION NO. 03 OF 2008 AND SUBSEQUENT AMENDMENTS THERETO) ON CORPORATE GOVERNANCE FOR LICENSED FINANCE COMPANIES IN SRI LANKA
The Central Bank of Sri Lanka has issued the Direction on Corporate Governance in order to improve and sustain the Corporate Governance processes and practices of the Licensed Finance Companies in Sri Lanka. This Direction is identified as the Finance Companies (Corporate Governance) Direction No. 03 of 2008 and the amendments are referred to as Finance Companies (Corporate Governance – Amendment) Direction No. 04 of 2008 and Finance Companies (Corporate Governance – Amendment) Direction No. 06 of 2013. The above Directions comprise of nine fundamental principles, namely
» The responsibilities of the Board
» Meetings of the Board
» Composition of the Board
» Criteria to assess the fitness and propriety of Directors
» Management functions delegated by the Board
» The Chairman and the Chief Executive Officer
» Board-appointed committees
» Related party transactions
» Disclosures
The Company’s level of compliance with the Corporate Governance Directions is tabulated below.
Section RuleCompliance/ non-compliance
Status of compliance
02 THE RESPONSIBILITIES OF THE BOARD OF DIRECTORS
2 (1) Strengthening the safety and soundness of the Company
(a) Approve, oversee and communicate the strategic objectives and corporate values
Complied The Board provided leadership, set strategic aims and ensures that the necessary financial and human resources are in place for the Company to meet its objectives; Board-approved strategic objectives and corporate values have been derived from the Company’s Vision and Mission and it has been communicated throughout the Company. The Board ensures that obligations to shareholders and others are understood and met.
(b) Approve the overall business strategy, including the overall risk policy and risk management
Complied The Board approved the ‘Strategic Plan’ of the Company and established a framework of prudent and effective controls which enables risk to be assessed and managed; The Board reviews Company management performance at monthly Board meetings.
The Risk Management Policy is with measurable goals, includes a well-developed risk appetite well-defined responsibilities for risk management in particular and control functions in general and was reviewed and recommended by the Integrated Risk Management Committee (IRMC) and approved by the Board.
GO
VE
RN
AN
CE

62 L B Finance PLC Annual Report 2017/18
Section RuleCompliance/ non-compliance
Status of compliance
(c) Identifying and managing risk
Complied The Board is responsible for overseeing a strong risk governance framework. The Board takes an active role in defining the risk appetite and ensuring its alignment with the Company’s strategic, capital and financial plans and compensation practices. Integrated Risk Management Committee identifies risks related to credit, market, liquidity and operations and ensures that appropriate actions are taken to manage risks. The Committee submits a Risk Assessment Report to the Board within seven days of each meeting. The Risk Management Report on pages 177 to 199 provides further insight in this regard.
(d) Communication policy with all stakeholders
Complied The Board-approved communication policy is available and ensures the effective internal and external communication of corporate information with all stakeholders including depositors, creditors, shareholders, borrowers and employees of the Company.
The Company discloses information on a timely basis. In disclosing information, Company ensures the descriptiveness, detailed and forthcoming as possible, and avoids boilerplate disclosures.
(e) Integrity of the internal control system and management information system.
Complied The Board-ensures that the Management maintains a sound system of internal controls to safeguard shareholders’ investments and the Company’s assets. Internal controls are designed, among other things, to ensure that, each key operation has a policy, process or other measures, as well as a control to ensure that such policy, process or other measure is being applied and works as intended. A Board-approved Information System Security Policy is in place. Internal Auditors reviewed the integrity of the Management Information System and Internal Control System and observations were monitored by the Board, which confirmed that the Internal Control System and the Management Information System provide a reasonable assurance over financial reporting.
(f) Identifying and designating Key Management Personnel.
Complied The Board-identified Key Management Personnel according to the Sri Lanka Accounting Standards and as per the Direction issued by the Central Bank of Sri Lanka on Corporate Governance and the latter includes the Board of Directors, Chief Financial Officer, Chief Risk Officer, Assistant General Managers Treasury & Legal, Compliance Officer and Senior Manager Finance as Key Management Personnel (KMP). The Directors have been identified as KMPs as per the Accounting Standards.
(g) Authority and responsibilities of the Board and Key Management Personnel.
Complied The Board sets out clearly the role, responsibilities, accountability and reporting relationships of Key Management Personnel, and has these properly documented. The delegation of authority from the Board to the Key Management Personnel is formal and clear.
Corporate Governance

L B Finance PLC Annual Report 2017/18 63
Section RuleCompliance/ non-compliance
Status of compliance
(h) Oversight of affairs of the Company by Key Management Personnel.
Complied Oversight of the affairs of the Company by its Key Managerial Persons takes place at the regular Board meetings and Subcommittee meetings and Key Management Personnel make regular presentations to the Board on matters under their preview.
(i) Periodically assess the effectiveness of its governance practices, including:
i) selection, nomination, and election of directors and appointment of KMP.
ii) management of conflicts of interests.
iii) Determination of weaknesses and implementation of changes where necessary.
Complied The Board has delegated the functions of selection and nomination of Directors to the Nomination Committee (NC).
Directors’ interests are disclosed to the Board at the start of every meeting. If a Director has an interest in a particular matter, he abstains from voting at such meeting and he is not counted in the quorum. The Board and the Board sub committees have a formal self-evaluation process annually in order to identify and rectify the weaknesses. A summary of these evaluation forms is submitted to the Board by the Company Secretaries for further recommendations.
(j) Succession plan for Key Management Personnel.
Complied The Company has a Board approved one-to-one succession plan in place for the Key Management Personnel.
(k) Regular meetings with the Key Management Personnel.
Complied The Key Managerial Persons regularly make presentations and participate in discussions on their areas of responsibility at the Board and its sub-committee meetings and progress towards corporate objectives is a regular agenda items for the Board where Key Management Personnel are involved regularly.
(l) Understanding Regulatory environment.
Complied The Board of Directors closely monitors regulatory compliances at monthly Board meetings by means of a regular monthly Board paper, presentations on compliance. Further, the Compliance Officer presents changes to the regulatory environment from time to time and any other necessary information to the Board. All Board members attend the Directors’ and CEOs’ forums arranged by the CBSL and the Management personnel of the Company maintain dialogues on an ongoing basis.
GO
VE
RN
AN
CE

64 L B Finance PLC Annual Report 2017/18
Section RuleCompliance/ non-compliance
Status of compliance
(m) Hiring and oversight of External Auditors.
Complied The Board Audit Committee is responsible for hiring and oversight of the External Auditors and on the recommendation of the Board. External Auditors are appointed by the shareholders of the Company at the AGM. External Auditors annually submit a statement confirming their independence as required by the regulatory authorities in connection with the external audit.
2 (2) Appointment of the Chairman and the Chief Executive Officer and define and approve functions and responsibilities.
Complied The Board has appointed the Chairman and the Chief Executive Officer (CEO) and there is a clear division of the documented functions and responsibilities of the Chairman, CEO and Board to ensure an appropriate balance of power, increased accountability and greater capacity of the Board for independent decision-making.
2 (3) Directors’ ability to seek independent professional advice.
Complied The Directors are able to obtain independent professional advice as and when necessary at Company expense and the Board-approved procedure is in place. However, no such instances have occurred during the year.
2 (4) Dealing with conflicts of interests.
Complied Article 97 of Articles of Association on ‘Restrictions on Voting’ evidences the procedure for a Director to abstain from voting on any Board resolution when there is conflict of interest and he/she is not to be counted in the quorum. The Company Secretaries obtained disclosure of interest from Directors at every Board meeting and conflict of interest (if any) is managed based on this statement. Directors abstain from voting in such a situation and they are not counted in the quorum.
2 (5) Formal schedule of matters specifically reserved for Board Decisions.
Complied The Board has adopted a policy for a formal schedule of matters specifically reserved for the Board. Present agenda of meeting ensures that the direction and the control of the Company is under the Board’s control and authority.
2 (6) Situation on insolvency Complied The Board is aware of the need to inform the Director of the Department of Supervision of Non-Bank Financial Institutions and no such situation arose during the year and we do not visualise such situations in the foreseeable future.
2 (7) Publish corporate governance report in the Annual Report.
Complied The Annual Corporate Governance Report has been published by the Company in the Annual Report 2017/18 on page 61.
2 (8) Annual self-assessment by the Directors and maintenance of such records.
Complied The Company has adopted a scheme of self-assessment to be undertaken by each Director annually.
Corporate Governance

L B Finance PLC Annual Report 2017/18 65
Section RuleCompliance/ non-compliance
Status of compliance
3. MEETINGS OF THE BOARD
3 (1) Regular Board meetings and circulation of written or electronic resolutions.
Complied The Board meets regularly approximately at monthly intervals and special Board meetings are convened whenever necessary. The Board met on 12 occasions during the year 2017/18. The consent of the Board is usually obtained at meetings with due notice given with Board papers. Consent obtained by circulation has been kept at minimal.
3 (2) Arrangements for Directors to include matters and proposals in the agenda.
Complied All the members were given equal opportunities to include matters and proposals in the agenda and the procedures are in place for this. Monthly meetings are scheduled and informed to the Board at the beginning of each calendar year to enable submission of proposals to the agenda.
3 (3) Notice of meetings. Complied Board meeting dates were agreed to by Board members in advance for the calendar year. Agenda and all Board papers are uploaded through a secure link to iPad for Directors to access seven days prior to the Board meetings.
3 (4) Directors’ attendance at Board meetings
Complied All Directors have attended at least two-thirds of the meetings held during the year and no Director has been absent from three consecutive regular Board meetings during the year 2017/18. Directors’ Attendance at Board and Subcommittee meetings, Refer pages 54 to 57 for details of individual Directors’ attendance at Board meetings.
3 (5) Appointment of a Company Secretary to handle the secretarial services to the Board
Complied P W Corporate Secretarial (Pvt) Ltd., a company registered with the Registrar of Companies as a qualified secretary, handles the secretarial services to the Board and shareholder meetings and carries out other functions specified in related laws and regulations.
3 (6) Responsibility of preparation of agenda for a Board meeting.
Complied Preparation of the agenda is delegated to the Company Secretary and is approved by the Chairperson.
3 (7 ) Directors’ access to advice and services of the Company Secretaries
Complied A Board-approved procedure is in place to enable all Directors to access the Company Secretary with a view to ensuring that Board procedures and all applicable laws, directions, rules and regulations are followed. Directors have separate and independent access to the Company Secretary.
3 (8) Maintenance of Board minutes.
Complied The Company Secretary maintains meeting minutes and circulates them to all Board members which shall be open for inspection at any reasonable time to any Director. Additionally, the Directors have access to past Board papers and minutes through a secure electronic link.
3 (9) Recording of Minutes of Board meetings in sufficient detail.
Complied The Company Secretary maintains detailed minutes of Board meetings to satisfy all requirements of this direction. Minutes are approved by the Chairperson and the other members of the Board after making required amendments, if necessary.
GO
VE
RN
AN
CE

66 L B Finance PLC Annual Report 2017/18
Section RuleCompliance/ non-compliance
Status of compliance
4 COMPOSITION OF THE BOARD
4 (1) The number of Directors
Complied The Company’s Board comprised of 12 Directors upto 30.04.2017 and then reduced to 11 which continued up to 25.08.2017. Thereafter this number has further reduced to 10 from 31.10.2017 which is within the statutory limit required by the direction during the year 2017/18. The objective of the Company is to maintain a healthy balance between Executive, Non-Executive and Independent Directors.
4 (2) Period of service of a Director
Complied The total period of service of all Non-Executive Directors does not exceed nine years. Details of their tenures of service are given on page 52.
4 (3) Board balance Complied Board balance was maintained throughout the year.
4 (4) Independent Non-Executive Directors and the criteria for independence.
Complied There is a strong and independent element on the Board, with Independent Directors making up a one-fourth of the Board. The Board has three Independent Non-Executive Directors as per the definition of this Direction which is 1/4th of the Board. The Board evaluates independence of the Directors annually based on the Directors’ self-declarations.
4 (5) Appointment of Alternate Directors.
Complied There were no Alternate Directors during the year 2017/18
4 (6) Skills and experience of Non-Executive Directors.
Complied Appointments are recommended by the Nomination Committee. The Directors including Non-Executive Directors are eminent persons with knowledge, expertise and experience to bring an independent judgment and their detailed profiles are on pages 36 to 39.
4 (7) More than half the quorum of Non-Executive Directors in Board meetings.
Complied All Board meetings held during the financial year were duly constituted with one-half of the number of Directors present and one half of the number of Directors constituting the quorum being Non-Executive Directors.
4 (8) Express identification of the Independent Non-Executive Directors in corporate communications and disclosing the details of Directors.
Complied The Independent Non-Executive Directors are expressly identified in all corporate communication that discloses the names of all Directors of the Company. Composition of the Board of Directors including the category of Directors has been disclosed on page in 50 addition to the disclosures on profiles of Directors on pages 36 to 39.
4 (9) Procedure for the appointment of new Directors and for the orderly succession of appointments to the Board.
Complied The new appointments to the Board are based on the recommendations made by the Nomination Committee and there is a procedure in place for the succession of appointments to the Board. After this procedure the names are referred to the CBSL for approval prior to appointment.
Corporate Governance

L B Finance PLC Annual Report 2017/18 67
Section RuleCompliance/ non-compliance
Status of compliance
4 (10) Directors appointed to fill a casual vacancy to be re-elected at the first general meeting after their appointment.
Complied All Directors appointed to the Board are subject to re-election by the shareholders at the first Annual General Meeting after their appointment and there were no casual vacancies during the year.
4 (11) Communication of reasons for removal or resignation of Directors.
Complied Resignation of Directors and their reasons are duly communicated to the Director of the Department of Supervision of Non-Bank Financial Institutions of the Central Bank of Sri Lanka and other regulatory authorities. Appointment, removal or resignations of Directors are informed to shareholders, with immediate notification to the Colombo Stock Exchange (CSE).
5 CRITERIA TO ASSESS THE FITNESS AND HE PROPRIETY OF DIRECTORS
5 (1) The age of a Director shall not exceed 70 years.
Complied All the Directors are below the age of 70 years as at 31st March 2018.
5 (2) Directors shall not hold office as a Director of more than 20 Companies / Societies / Corporate bodies including Associate and Subsidiary Companies.
Complied The total number of positions held as a Director or any other position in companies/entities/institutions inclusive of subsidiaries or associate companies of the Company is less than 20.
6 DELEGATION OF FUNCTIONS
6 (1) Delegation of work to the Management.
Complied As per the Articles of Association the Board may delegate any of their powers to the Board-appointed committees, Managing Director, Executive Directors and Key Management Personnel upon such terms and conditions. All delegations are made in a manner that it would not hinder the Board’s ability to discharge its functions.
6 (2) Periodical evaluations of the delegation process.
Complied Delegation arrangements are reviewed periodically to ensure that they remain relevant to the needs of the Company.
GO
VE
RN
AN
CE

68 L B Finance PLC Annual Report 2017/18
Section RuleCompliance/ non-compliance
Status of compliance
7 THE CHAIRMAN AND THE CHIEF EXECUTIVE OFFICER
7 (1) Division of responsibilities of the Chairman and CEO
Complied There exists a clear separation of duties between the roles of the Chairman and the CEO/Managing Director.
7 (2) Chairman preferably an Independent Non-Executive Director and if not appoint a Senior Director.
Complied Chairperson is a Non-Independent Non-Executive Director.
7 (3) Disclosure of the identity of the Chairman and the Chief Executive Officer and any relationship with the Board Members
Complied The Board has adopted a formal procedure to identify and disclose the relationships between the CEO and the Chairperson and among other Directors. Accordingly, the Board has declared that there are no material relationships [including financial, business, family or other material/relevant relationship(s)] between the Chairperson and Chief Executive Officer/Managing Director and among the members of the Board which will impair their respective roles. Details of the Chairperson and Chief Executive Officer are disclosed in the Annual Report on page 102.
7 (4) Chairman to;
(a) provide leadership to the Board;
(b) ensure that the Board works effectively and discharges its responsibilities; and
(c) ensure that all key and appropriate issues are discussed by the Board in a timely manner.
Complied Board-approved list of functions and responsibilities of Chairperson includes ‘Providing Leadership to the Board’ as a responsibility of the Chairperson. The Board as a body worked effectively and discharged its responsibility as set out in the Annual Report. The annual self-assessment of the Board includes a criterion that evaluates the effectiveness of the Chairman in facilitating the Board’s discharge of its responsibilities. All key and appropriate issues are discussed by the Board on a timely basis.
7 (5) Responsibility of the agenda lies with the Chairman or may be delegated to the Company Secretary.
Complied Preparation of the agenda has been delegated to the Company Secretary who circulates a formal agenda prior to the Board meeting which is approved by the Chairperson.
Corporate Governance

L B Finance PLC Annual Report 2017/18 69
Section RuleCompliance/ non-compliance
Status of compliance
7 (6) Ensure that all Directors are properly briefed on issues and receive adequate information in a timely manner.
Complied The Chairperson ensures that all Directors are properly briefed on issues arising at Board meetings through submission of agenda and Board papers with sufficient time prior to meeting.
7 (7) Encourage all Directors to actively contribute and ensure they act in the best interests of the Company.
Complied All Directors actively participate in Board affairs and the Board acts in the best interests of the Company.
7 (8) Facilitate effective contribution of Non-Executive Directors and relationships between Executive and Non-Executive Directors.
Complied Executive and Non-Executive Directors work together in the best interests of the Company. Non-Executive Directors participate in Board sub-committees. This process is further strengthened through the annual self-evaluation of the Board and Board Sub Committees where views of all Directors are canvassed in respect of the performance of the Board and Sub Committees as a whole.
7 (9) Refrain from direct supervision of Key Management Personnel or executive duties.
Complied Chairperson does not directly get involved in the supervision of Key Management Personnel or any other executive duties.
7 (10) Maintain effective communication with shareholders.
Complied The Annual General Meeting of the Company is the main forum where the Board maintains effective communication with shareholders and they are given the opportunity to take up matters for which clarification is needed and also their views are communicated to the Board. Further, the Board approved communication policy evidences the Company’s process in this regard.
GO
VE
RN
AN
CE

70 L B Finance PLC Annual Report 2017/18
Section RuleCompliance/ non-compliance
Status of compliance
7 (11) Chief Executive Officer functions as the apex executive-in-charge of the day-to-day operations and businesses.
Complied In terms of duties and responsibilities of the CEO, he is the apex executive of the Company who is responsible for day-to-day operations of the Company with the assistance of Executive Directors and members of the Corporate Management and is accountable to the Board to recommend the Company’s strategy implementation and ensure appropriate internal controls are in place to assess and manage risks.
8 BOARD APPOINTED COMMITTEES
8 (1) Establishing Board committees, their functions and reporting.
Complied The following committees have been appointed by the Board and each such committee is required to report to the Board:
1. Remuneration Committee
2. Integrated Risk Management Committee
3. Nomination Committee
4. Audit Committee
5. Related Party Transactions Review Committee
Recommendations of these committees are addressed directly to the Board and minutes of meetings are tabled and discussed at the main Board meetings. The Company has presented report on the performance, duties and functions of each committee in the Annual Report.
8 (2) Audit Committee
(a) The Chairman to be a Non-Executive Director with relevant qualifications and experience
Complied The Chairperson of the Audit Committee Mrs. Yogadinusha Bhaskaran is a Non-Executive Director and a fellow member of the Chartered Institute of Management Accountants (UK) of Sri Lanka. Qualifications and experience are disclosed on page 39 of this Annual Report.
(b) All members of the Committee to be Non-Executive Directors
Complied All the members of the Audit Committee are Non-Executive Directors.
Corporate Governance

L B Finance PLC Annual Report 2017/18 71
Section RuleCompliance/ non-compliance
Status of compliance
(c) Functions of the committee include;
(i) the appointment of the External Auditors
(ii) the implementation of the Central Bank Guidelines.
(iii) the application of the relevant accounting standards; and
(iv) the service period, audit fee and any resignation or dismissal of the Auditor;
Complied The Audit Committee has recommended;
The re-appointment of M/s. Ernst & Young, Chartered Accountants as External Auditors for audit services;
The implementation of guidelines issued by Central Bank of Sri Lanka to auditors from time to time.
The application of Accounting Standards in consultation with the Chief Financial Officer and External Auditors;
The service period, audit fees, resignation or dismissal of an auditor, re-engaging the audit partner in line with the regulatory requirements.
No resignation or dismissal of the Auditor has taken place during the year under review.
The Committee ensures that the requirement of rotation of External Audit Engagement Partner, once in every five (5) years, is met.
(d) Review and monitor the External Auditors’ independence, objectivity and effectiveness of the audit processes.
Complied The External Auditor has provided an independent confirmation in compliance with the guidelines for appointment of Auditors of Listed Companies. In order to safeguard the objectivity and independence of the External Auditor, the Audit Committee reviewed the nature and scope taking account of the regulations and guidelines.
(e) Develop and implement a policy on the engagement of an External Auditor to provide non-audit services while considering;
(i) skills and experience of the Auditor
(ii) threat to the independence
(iii) fee for the non-audit services and independence
Complied The Audit Committee with the approval of the Board of Directors developed and implemented a policy for engagement of Auditors to provide non-audit services in order to ensure that the non-audit services do not impair the independence and objectivity of the External Auditors. The said policy addresses the skills and experience of the Auditor, threat to the independence and fee for the non-audit services and independency.
GO
VE
RN
AN
CE

72 L B Finance PLC Annual Report 2017/18
Section RuleCompliance/ non-compliance
Status of compliance
(f) Determines the nature and the scope of the External Audit.
Complied The Auditors make a presentation at the Audit Committee meeting with details of the proposed audit plan and the scope. Members of the Audit Committee obtain clarifications in respect of the contents of the presentation, if deemed necessary.
(g) Review the financial information of the Company.
Complied Quarterly Financial Statements as well as year-end Financial Statements are circulated to the Audit Committee. A detailed discussion focused on major judgemental areas, changes in accounting policies, significant audit judgments in the Financial Statements, going concern assumption and compliance with Accounting Standards and other legal requirements takes place and required clarifications are obtained in respect of all areas before being recommended for Board approval.
(h) Meeting of External Auditors to discuss issues and problems of Interim and Final audits in the absence of Key Management Personnel (if necessary)
Complied The Committee met the External Auditors without the presence of the Executive Directors and Corporate Management twice during the financial year 2017/18.
(i) Reviewing of the External Auditors’ management letter and the response thereto.
Complied Upon receipt of the management letter, Auditors are invited to make a presentation at the Audit Committee with the responses of the corporate Management to discuss the significant findings which have arisen during the audit and instructions are given to Department Heads to take remedial actions, if necessary.
Corporate Governance

L B Finance PLC Annual Report 2017/18 73
Section RuleCompliance/ non-compliance
Status of compliance
(j) Review of the Internal Audit Function
- Review scope, function and resources
- Review of Internal Audit Program
- Review of Internal Audit Department
- Recommendations on Internal Audit functions
- Appraise the resignation of senior staff of Internal Audit and any outsourced service providers
- Independence of Internal Audit functions
Complied The Audit Committee has reviewed the information provided in the risk-based audit plan and concluded that scope, functions and resources of the Internal Audit Dept. are sufficient to carry out its functions. The Audit Committee has reviewed and approved the Internal Audit Program. The Company’s internal audit functions were outsourced and are carried out by two independent professional audit firms and the audit reports were discussed at the Audit Committee meetings. Internal Auditors (outsourced) reports directly to the Audit Committee. Hence, it is independent and the audits are performed with due care. The Audit Committee has carried out a performance appraisal of the Internal Audit.
(k) Consideration about the internal investigations and Management’s responses.
Complied Whenever a need arises, the Audit Committee assigns special internal investigations on certain matters and reviews major findings with the management responses and ensures that the recommendations are implemented. However, the need for an internal investigation on major findings has not arisen during the year.
(l) Attendees of Audit Committee meeting with corporate Management and External Auditors.
Complied The Committee met twice with the External Auditors without the presence of Executive Directors. The Managing Director/CEO, Executive Directors, Chief Financial Officer, Chief Risk Officer, Compliance Officer, AGM IT and AGM Treasury, Information System (IS) Auditor and the Internal Auditors normally attend all meetings. Where it is deemed necessary, members of the corporate management may also attend meetings by invitation.
(m) Explicit authority, adequate resources, access to information and obtain external professional advice wherever necessary.
Complied The Audit Committee is guided by a Board-approved terms of reference which sets out authority and responsibility of the said Committee. The Audit Committee is authorized to obtain external professional advice and to invite outsiders with relevant experience to attend if necessary. The Committee also has full access to information in order to investigate into matters relating to any matter within its terms of reference.
GO
VE
RN
AN
CE

74 L B Finance PLC Annual Report 2017/18
Section RuleCompliance/ non-compliance
Status of compliance
(n) Regular meetings Complied The Committee meets regularly and the audit reports were issued to its members in advance and the minutes of the meetings maintained by the Company Secretary. The Committee has met 16 times during the year and the attendance at those meetings is set out on page 110 in Audit Committee Report.
(o) Disclosures in the Annual Report.
Complied The Report of the Board Audit Committee is on page 110 and includes the detailed activities, meetings held during the year and the Directors attendance at the Audit Committee Meetings.
(p) Maintain minutes of meetings
Complied The Company Secretary acts as the Secretary of the Audit Committee and records and maintains all minutes of the meetings.
(q) Whistle blower Policy
Complied The Company has a Board-approved Whistle blowing Policy whereby employees of the Company are entitled to raise concerns in confidence about the malpractices in the Company.
8 (3) Integrated Risk Management
(a) The composition of IRMC
Complied Composition of the IRMC: Two Non-Executive Directors, three Executive Directors including Managing Director / CEO and other Key Management Personnel, namely Chief Financial Officer, AGM Treasury, Chief Risk Officer and Compliance Officer.
(b) Periodical risk assessment
Complied The Committee has a Board-approved Risk Management Policy which provides a framework for management and assessment of risk based on a rating linked to the risk score. According to that pre-established risk indicators are reviewed by the Committee on a quarterly basis. The Committee has a process to assess and evaluate the risk and the findings and reviews submitted to the Board quarterly.
(c) Review the adequacy and effectiveness of Management level committees to manage risk.
Complied The Committee reviews the adequacy and effectiveness in addressing specific risk and managing the same within the quantitative and qualitative risk limits set by such respective committees such as Asset and Liability Management Committee and Credit Committee.
(d) Corrective action to mitigate the risk
Complied The risk indicators introduced have been reviewed against the benchmark and prompt corrective actions are taken to mitigate the effects of such risks that are at level beyond the prudent levels decided by the committee. Review of this process is minuted at the IRMC for their review and action if deemed necessary.
Corporate Governance

L B Finance PLC Annual Report 2017/18 75
Section RuleCompliance/ non-compliance
Status of compliance
(e) Frequency of meetings
Complied The Committee has met four times during the year to assess the risks of the Company.
(f) Actions against the officers responsible for failure to identify risks and take prompt corrective actions.
Complied Committee refers such matters, if any, to the HR Department for necessary action. However, the specific risk and limits identified by the Risk Management Committee and such decisions are taken collectively.
(g) Risk assessment report to the Board
Complied The Committee had kept the Board informed of their risk assessment of the Company by forwarding a risk report.
(h) Establishment of a compliance function
Complied An independent compliance function is established as second line of defence. This function is responsible for, among other things, ensuring that the Company operates with integrity and in compliance with applicable, laws, regulations and internal policies. Dedicated compliance officer appointed with sufficient authority, stature, independence, resources and access to the Board.
9 RELATED PARTY TRANSACTIONS
9 (2) Avoid conflicts of interest that arise from transactions of the Company with related parties.
Complied The Related Party Transactions Policy is in place which describes the related parties, types of related party transactions and stipulates that no Director shall participate in any discussion of a proposed related party transaction for which he or she is a related party, provided however he or she may participate in discussion to express, propose and providing information concerning to Related Party Transaction to the committee. The Board appointed Related Party Transactions Review Committee ensures that the transactions with Related Parties are in accordance with best practices.
A system for monitoring and reporting of data pertaining to such transactions has been established by the Company during the year and through that system the Company ensures that no favourable transaction has been entered in to with such parties.
Transactions carried out with Related Parties in the ordinary course of business (Recurrent transactions) are disclosed in the Financial Statements on ‘Related Party Disclosures’ under Note 6.1 on page 406 in Financial Statements.
GO
VE
RN
AN
CE

76 L B Finance PLC Annual Report 2017/18
Section RuleCompliance/ non-compliance
Status of compliance
9 (3) Related party transactions.
Complied A Board-approved process is in place to identify the related party transactions and the Related Party Transactions Review Committee ensures that all the transactions with Related Parties are on arm’s length basis.
9 (4 ) Monitoring of related party transactions defined as more favourable treatment including,
(a) Granting accommodation in excess of prudent percentage of regulatory capital
(b) Charging lower rate than the best rate on accommodation and paying upper rate compared to unrelated counterparty
(c) Allowing preferential treatment compared to unrelated parties in the normal course of business
(d) Providing or obtaining services without proper evaluation
(f) Maintaining reporting lines and information flows that may give benefits to related parties other than performance of legitimate duties.
Complied The Board-approved Related Party Transactions Policy contains provisions to ensure compliance and the Related Party Transactions Review Committee ensures that all the transactions with Related Parties are on arm’s length basis. The Company has developed a separate system to monitor Related Party Transactions through the IT network, to ensure that related party transactions are not entered into on more favourable terms than those offered to others, and where applicable relevant approvals of the Related Party Transactions Review Committee/Board are obtained.
Corporate Governance

L B Finance PLC Annual Report 2017/18 77
Section RuleCompliance/ non-compliance
Status of compliance
10 DISCLOSURES
10 (1) Publish Interim and Annual Financial Statements based on applicable accounting standards and publish in Sinhala, Tamil and English newspapers.
Complied Relevant Financial Statements are prepared and published in accordance with the formats prescribed by the supervisory and regulatory authorities and applicable accounting standards, and that such statements are published in the newspapers, in all three languages.
10 (2) The Board shall ensure that at least the following disclosures are made in the Annual Report;
(a) A statement to the effect that the annual Audited Financial Statements have been prepared in line with applicable accounting standards and regulatory requirements, inclusive of specific disclosures.
(b) A report by the Board on the finance company’s internal control mechanism.
(c) The External Auditors’ certification on the effectiveness of the internal control mechanism.
Complied
Complied
Complied
Compliance with applicable accounting standards and regulatory requirements has been reported under the “Statement of Directors’ Responsibility for Financial Reporting” on page 100.
Directors’ Responsibility Statement on Internal Control Systems Over Financial Reporting is given on page 100.
The Company obtained a certification from the External Auditors on the effectiveness of the internal control mechanism.
GO
VE
RN
AN
CE

78 L B Finance PLC Annual Report 2017/18
Section RuleCompliance/ non-compliance
Status of compliance
(d) Details of Directors and the transactions with the finance company
(e) Fees/remuneration paid by the finance company to the Directors in aggregate.
(f) Total net accommodation and the net accommodation outstanding to the related parties as a percentage of the capital funds
Complied
Complied
Complied
Transaction with KMP
Compensation of KMP – Company
For the year ended 2016/2017 Rs.
2017/2018 Rs.
Short-term employment benefits
Directors 323,008,856.24 338,790,257.68
KMPs 36,839,743.68 43,165,396.90
Post-employment benefits
Directors
KMPs 866,250.00 1,904,243.25
Total 360,714,849.92 383,859,897.83
Transactions, arrangements and agreements involving KMP and their Close Family Members (CFM)
CFM of a KMP are those family members who may be expected to influence, or be influenced by, that KMP in their dealings with the entity. They may include KMP’s domestic partner and children, children of the KMP’s domestic partner and dependents of the KMP or the KMP’s domestic partner. CFM are related parties to the Company.
Statement of Financial Position – Company
Year-end balance
For the year ended 2016/2017 Rs.
2017/2018 Rs.
Assets
Loans and advances 426,478.12 3,257,723.87
Total 426,478.12 3,257,723.87
Liabilities
Deposits 654,477,140 762,510,780
Securities sold under repurchase agreements
0 0
Debentures 0 0
Total 654,477,140 762,510,780
Corporate Governance

L B Finance PLC Annual Report 2017/18 79
Section RuleCompliance/ non-compliance
Status of compliance
(g) The aggregate values of remuneration paid and the value of transactions with the Key Management Personnel.
Complied Commitments and contingencies – Company
Year-end balance
For the year ended 2016/2017 Rs.
2017/2018 Rs.
Undrawn facilities 0 0
Total 0 0
Share-based transactions of KMP and CFM
Average balance
For the year ended 2016/2017 Rs.
2017/2018 Rs.
Number of ordinary shares held 369,689.00 446,177.00
Dividends paid (in Rs. ’000) 4,024,134.00 4,232,306.00
GO
VE
RN
AN
CE

80 L B Finance PLC Annual Report 2017/18
Section RuleCompliance/ non-compliance
Status of compliance
Total accommodations granted to each category of related parties and as a percentage of the Company’s regulatory capital
Category of related party transactions
2016/2017 Rs. ’000
percentage of the regulatory capital
2017/2018 Rs. ’000
percentage of the regulatory capital
Directors 0 0% 0 0%
KMP
Non-Executive Directors and their close family members
0 0% 0 0%
Key Management Personnel and their close family members (includes the Executive Director)
426,478.12 0.003% 3,257,723.87 0.021%
Subsidiaries 0 0% 0 0%
Joint Venture 0 0% 0 0%
Entities which Directors and their close family members have a substantial interest
393,159.00 0.003% 8,105,281.02 0.053%
Government of Sri Lanka/Entities Controlled, Jointly Controlled, Significantly Influenced by the Government of Sri Lanka
0 0% 0 0%
Corporate Governance

L B Finance PLC Annual Report 2017/18 81
Section RuleCompliance/ non-compliance
Status of compliance
(h) A report confirming compliance with prudential requirements, regulations, laws and internal controls
(i) Non-Compliance reporting
(j) The External Auditors’ certification of compliance with the corporate governance direction.
Complied
Complied
Complied
This has been disclosed on page 107.
There were no significant lapses in the Company’s Risk Management or non-compliance with this Direction that have been pointed out by the Director of the Department of Supervision of Non-Bank Financial Institutions and/or directed to be disclosed to the public by the Monetary Board.
The Company has obtained a factual finding report from the External Auditors over the compliance with Corporate Governance Direction.
GO
VE
RN
AN
CE

82 L B Finance PLC Annual Report 2017/18
COMPLIANCE WITH THE CODE OF BEST PRACTICE ON CORPORATE GOVERNANCE 2017 ISSUED BY THE INSTITUTE OF CHARTERED ACCOUNTANTS OF SRI LANKA
Code Reference
Compliance and implementation
Status of compliance Complied
A DIRECTORS
A.1 The Board The Board comprised 10 Directors as at 31st March 2018, five of whom functioned in Non-Executive capacity, having the required professional competence, skills and experience in the fields of entrepreneurship, banking and finance, legal and marketing to lead and control the Company. The Board gives leadership in setting the strategic direction and implement sound control environment for the successful functioning of the Company. Directors are elected by shareholders at the AGMs with the exception of the Executive Directors who are appointed by the Board and remain as Executive Directors until retirement, resignation or termination of such appointment.
ü
A.1.1 Regular meetings The Board usually meets at monthly intervals and special Board meetings are convened whenever necessary. The Board met twelve (12) times during the year. Attendance at meetings is summarised on page 54.
ü
A.1.2 Role and responsibilities of the Board
Formulation and implementation of a sound business strategy.
The Board engages in providing direction in formulating a sound business strategy and closely monitors the implementation of the strategy effectively. A Strategic Plan has been developed covering five years from 2017-2021 and was approved by the Board.
ü
A.1.3 Act in accordance with laws
The Board collectively and Directors individually, recognise their duty to comply with laws of the country. The Board of Directors ensures that procedures and processes are in place to ensure that the Company complies with all applicable laws and regulations. In order to preserve the independence of the Board and to strengthen the decision-making, the Board seeks independent professional advice when deemed necessary.
ü
A.1.4 Access to advice and services of Company Secretary
All Directors have access to the Company Secretary, a company registered as a qualified Secretary. Their services are available to all Directors and they advise the Board on corporate governance matters, Board procedures and applicable rules and regulations.
ü
A.1.5 Independent judgment
All Directors are responsible for bringing independent judgment on issues of strategy, performance, resources and standard of business conduct. Non-Executive Directors are responsible for providing independent judgment on the proposals made by the Managing Director and Executive Directors.
ü
A.1.6 Dedicate adequate time and effort to matters of the Board and the Company
Every Director has dedicated adequate time and effort to the meetings of the Board and sub-committee meetings to ensure that the duties and responsibilities are satisfactorily discharged and all the Board papers are loaded through a secure link to the iPad at least seven days prior to the Board meetings for the Directors to access prior to the Board Meeting.
ü
Corporate Governance

L B Finance PLC Annual Report 2017/18 83
Code Reference
Compliance and implementation
Status of compliance Complied
A.1.7 If necessary in the best interest of the Company, one-third of the Directors can call for a resolution to be presented to the Board.
Necessity did not arise during the year
ü
A.1.8 Board induction and training
Every Director was given appropriate induction when first appointed to the Board with regard to the affairs of the Company and laws and regulations applicable to the Company. It is mandatory for the Directors to attend Director Forums organised by the CBSL. Further the Corporate Management and external experts make presentations with regard to the business environment to update the knowledge.
ü
A.2 Separating the business of the Board from the executive responsibilities for management of the Company
The positions of Chairperson and the Managing Director/CEO have been separated in line with best practices with a view to maintain the balance of power and authority. The Chairperson is an Independent Non-Executive Director. Managing Director/CEO is conferred with executive authority to manage the business.
ü
A.3 Chairman’s role in preserving good corporate governance
The Chairperson provides leadership to the Board, ensures that the Board works effectively and discharges its responsibilities and ensures that all key and appropriate issues are discussed by the Board in a timely manner. ü
A.4 Availability of financial acumen and knowledge to offer guidance on matters of finance
The Chairperson of the Audit Committee is a Fellow member of The Institute of Chartered Institute of Management Accountants of UK and the Chairman of the Integrated Risk Management Committee and is also a Fellow member of The Institute of Chartered Accountants of Sri Lanka and a Fellow member of the CIMA-UK. Further the Non-Executive Director and an Executive Director are qualified finance professionals with experience in finance and management. The remaining members of the Board also possess experience in finance and banking thus there is sufficient financial acumen and knowledge within the Board to offer guidance on matters of finance. The profiles of the Board of Directors are given on page 36 to 39.
üG
OV
ER
NA
NC
E

84 L B Finance PLC Annual Report 2017/18
Code Reference
Compliance and implementation
Status of compliance Complied
A.5 Board balance It is preferable for the Board to have a balance of Executive and Non-Executive Directors as such that no individual or small group can dominate the Board’s decision-taking.
The Board should include at least two Non-Executive Directors or one-third of total Directors whichever is higher.
During the financial year under review, the Board comprised Five (5) Non-Executive Directors and Five (5) Executive Directors facilitating the required balance within the Board.
Two or one-third of Non-Executive Directors whichever is higher should be independent.
The Board has determined four (4) out of five (5) Non-Executive Directors are Independent as per this Code.
Evaluation of independence of Non-Executive Directors.
The Board evaluates the Independence yearly using annual declarations submitted by the Directors according to the Code criteria.
Signed declaration of independence by the Non-Executive Directors
All Non-Executive Directors provided the signed declarations of independence for 2017/18 as per Schedule K of the Code.
ü
Corporate Governance

L B Finance PLC Annual Report 2017/18 85
Code Reference
Compliance and implementation
Status of compliance Complied
Determination of the Independence and Non-Independence of each Non-Executive Director annually.
The Board has reviewed the declarations submitted by the Non-Executive Directors, and determined their independence.
If an Alternate Director is appointed by a Non-Executive Director such Alternate Director should not be an Executive Director and if an Alternate Director is appointed by an Independent Director, the person who is appointed also should meet the criteria of independence.
No Alternate Directors were appointed during the year.
Senior Independent Director (SID). Confidential discussion with other Directors by the SID.
The requirement to appoint a ‘Senior Independent Director’ does not arise under the Code in view of the roles of the Chairman and the CEO being held by two different individuals. Hence, no ‘Senior Independent Director’ was appointed during the year 2017/2018.
Meetings held by the Chairman with Non-Executive Directors.
The Chairperson held meetings with Non-Executive Directors.
Recording of concerns of Directors in Board minutes where they cannot be unanimously resolved.
There were no instances where the Directors could not unanimously resolve matters and accordingly no such matters were recorded in the minutes.
ü
A.6 Provision of appropriate and timely information
The Board should be provided with timely information in a form and of quality appropriate to enable it to discharge its duties.
Management should provide timely information to the Board.
Timely and accurate information is provided by the Management to the Board generally seven days prior to the Board meetings. The members of Corporate Management make presentations to the Directors on important issues relating to the financial performance, strategy, risk, systems and procedures.
The minutes, agenda and papers required for a Board meeting should be provided before seven (7) days.
Board papers are uploaded through a secure link to the iPad for the Directors to access seven (7) days prior to the Board meeting.
ü
GO
VE
RN
AN
CE

86 L B Finance PLC Annual Report 2017/18
Code Reference
Compliance and implementation
Status of compliance Complied
A.7 Appointments to the Board and re-election
Nomination Committee.
The Nomination Committee makes recommendations to the Board on all new appointments to the Board. The Committee was set up pursuant to the Code of Best Practice on Corporate Governance.
The report of the Nomination Committee is given on page 109 of the Annual Report.
Assessment of Board composition by the Nomination Committee.
The Nomination Committee reviews the new appointments and re-elections to the Board with strategic direction of the Company to attract and retain Board members with relevant experience and qualifications.
Disclosure requirements when appointing of new Directors to the Board.
Details of new Directors are disclosed to the shareholders at the time of their appointment by way of announcements made to the Colombo Stock Exchange as well as in the Annual Report. Prior approval for appointment of new Directors is obtained from the Director of Department of Supervision of Non-Bank Financial Institutions and notification is sent to Colombo Stock Exchange. All new appointments are reviewed by the Nomination Committee.
ü
A.8 All Directors should submit themselves for re-election at regular intervals
All Directors should be required to submit themselves for re-election at regular intervals and at least once in every three years.
Re-election of Directors.
At each Annual General Meeting one-third of the Non-Executive Directors for the time being who are subject to retirement, or, if their number is not a multiple of three, the number nearest to (but not greater than) one-third, retire and seek re-election by the shareholders. The provisions of the Company’s Articles of Association also require Directors appointed by the Board to hold office until the next Annual General Meeting and seek appointment by the shareholders at that meeting.
ü
GRI - 102 - 24, 28
Corporate Governance

L B Finance PLC Annual Report 2017/18 87
Code Reference
Compliance and implementation
Status of compliance Complied
A.9 Appraisal of Board and committee performance
Appraisal of Board performance.
The Board annually appraises its own performance to ensure that it is discharging its responsibilities satisfactorily. This process requires each Director to fill Board Performance Evaluation Forms in line with this Section of the Code. The responses are reviewed by the Company Secretary who collates them and submits is to the Board for necessary action as appropriate as decided by the Board.
Annual self-evaluation by the Board of its sub-committees.
The appraisal of the performance of sub-committees is presented to the Board.
Disclosure in the Annual Report about the Board’s performance evaluation methodology.
Board approved procedure is in place.
ü
A.10 Annual Report to disclose specified information regarding Directors
Shareholders should be kept advised of relevant details in respect of Directors.
Annual Report disclosure in respect of Directors.
Profiles of the Board of Directors are given on pages 36 to 39 including other directorships held by the Directors and memberships of Board Committees. Directors attendance is disclosed on page 54.
ü
A.11 Appraisal of the CEO
The Board should require at least annually assessing the performance of the CEO.
Targets for CEO at the commencement of each financial year.
CEO/ Managing Director’s performance targets are aligned with business strategies of the Company. Targets are set at the beginning of every financial year by the Board which is in line with the short- medium- and long-term objectives of the Company.
Evaluation of the performance at the end of fiscal year.
At the end of each financial year the Board evaluates the set targets and the actual performance.
ü
GO
VE
RN
AN
CE

88 L B Finance PLC Annual Report 2017/18
Code Reference
Compliance and implementation
Status of compliance Complied
B DIRECTOR’S REMUNERATION
B.1 Directors’ and executive remuneration
The Company has a formal and transparent procedure for developing policy on executive remuneration and for fixing the remuneration packages of individual Directors. No Directors should be involved in deciding his/her own remuneration.
Setting up of Remuneration Committee.
The functions of the Committee include determination of compensation and benefits of the Managing Director/CEO and Executive Directors while ensuring that no Director is involved in setting his/her own remuneration.
Composition of Remuneration Committee
Composition of Remuneration Committee is in line with Listing Rules.
All are Independent Non-Executive Directors as per the Code and the Listing Rules of the CSE.
Disclosure in the Annual Report about the Remuneration Committee members.
Remuneration Committee report is given on page 108 of the Annual Report.
Remuneration of Non-Executive Directors.
The Non-Executive Directors receive a fee for being a Director of the Board and additional fee whenever they serve on Board sub-committees and their fee structure is decided by the Board
Remuneration Committee consults the Chairperson/ MD on matters relating to the Remuneration Committee, Executive Directors and access to the professional advice.
The Committee consults the Managing Director when recommending the remuneration of other Executive Directors and also has access to professional advice when deemed necessary.
ü
Corporate Governance

L B Finance PLC Annual Report 2017/18 89
Code Reference
Compliance and implementation
Status of compliance Complied
B.2 Level and make-up of remuneration
Level of remuneration of both the Executive and the Non-Executive Directors should be sufficient to attract and retain the Directors needed to run the Company successfully. A proportion of Executive Director’s remuneration should be structured to link rewards to corporate and individual performance.
Remuneration of Executive Directors.
Remuneration of Executive Directors consists of performance based incentive payment to attract, retain and motivate them.
Remuneration packages in line with industry practices.
The Remuneration Committee reviews the information relating to competitors of the Company and due care is taken to ensure that remuneration is on par with industry standards.
Remuneration packages in line with other companies in the Group.
Size and scale of the Company’s operations are not comparable with other Group Companies and therefore guidance could not be drawn from them.
Performance-related payments to Executive Directors.
There are performance-related elements of remuneration for Executive Directors with the objective of providing appropriate incentives to those Directors to perform at the highest level.
Executive Share Option.
There are no Share Option schemes offered by the Company
Designing schemes of performance related remuneration.
In deciding the remuneration of the Managing Director, Executive Directors and Senior Management, the Company takes note of the provisions set out in Schedule E.
Early termination of service of Directors.
Consideration of termination of service of the Executive Directors will be in accordance with their contract of service.
Remuneration of Non-Executive Directors.
Non-Executive Directors are remunerated by the Company considering the time commitment, responsibilities of the role and the market practices. The Company has not offered any Share Option plans to either Executive Directors or Non-Executive Directors.
ü
GO
VE
RN
AN
CE

90 L B Finance PLC Annual Report 2017/18
Code Reference
Compliance and implementation
Status of compliance Complied
B.3 Disclosures related to remuneration in Annual Report
Annual Report of the Company should contain a statement of Remuneration Policy and details of remuneration of the Board as a whole.
Disclosure in the Annual Report about the Remuneration Committee members, statement of Remuneration Policy and aggregate remuneration paid.
Remuneration Committee report is given on page 108 which sets out the details on the composition of Committee and the remuneration policy. The aggregate remuneration paid to the Board of Directors is disclosed in Note 6.1.1 to the Financial Statements on page 406.
ü
C RELATIONS WITH SHAREHOLDERS
C.1 Constructive use of the AGM and conduct of other general meetings
The Board should use the AGM to communicate with shareholders and should encourage their participation.
Use of proxy votes.
The Company has recorded all proxy votes for each resolution prior to the general meeting.
Separate resolutions for separate issues.
Separate resolutions are placed before shareholders for each substantial matters that require approval of shareholders at the Annual General Meetings (AGM).
Arrangement made by the Chairman of the Board that all Chairmen of Subcommittees make themselves available at the AGM.
The Board includes the Chairmen of the Audit, Remuneration, Integrated Risk Management and Nomination Committees, and they are available at the AGM to answer any questions.
Adequate notice for the AGM to the shareholders.
The Annual Report including Financial Statements and the Notice of the Meeting are sent to shareholders 15 working days prior to the date of the AGM as stipulated by the Companies Act.
Procedures of voting at general meetings.
Shareholders right to appoint a proxy for voting at AGM appears on Notice of Meeting and on the Form of Proxy. Voting procedures at general meetings appear on the Form of Proxy.
ü
Corporate Governance

L B Finance PLC Annual Report 2017/18 91
Code Reference
Compliance and implementation
Status of compliance Complied
C.2 Communication with shareholders
Channel to reach all shareholders to disseminate timely information.
There are many channels of communication for engaging with shareholders. These include press releases and notices and required disclosures to the CSE which are published on the CSE website. The quarterly Interim Financial Statements are disseminated to the CSE within 45 days, the exception being for the last quarter of the financial year where the Company has 60 days to publish those accounts. Half yearly Financial Statements are published in daily newspapers in all three languages as per the Finance Companies Guidelines No. 2 of 2006. Notice of Annual General Meeting is circulated together with the Annual Report and Accounts which includes any other special business (if any) to be transacted at the AGM. Where necessary Extra Ordinary General meetings are convened after giving statutory notice to all shareholders. Annual General Meeting provides a platform for shareholders to discuss and seek clarification on the activities of the Company.
Policy and methodology of communicating.
The Company provides fair disclosure with emphasis on the integrity, accuracy, timeliness and relevance of the information provided. Refer Stakeholder engagement on page 124 in the Annual Report.
Implementation of the communication policy and methodology.
Shareholders receive the Annual Report from the Company either by way of a CD or in hard copy form. Shareholders may at any time elect to receive the Annual Report from the Company in printed form without any charge.
Contact person.
Shareholders may, at any time, direct questions and request for publicly available information from the Directors or Management of the Company.
Awareness of Directors on major issues and concerns of shareholders.
The Company Secretary maintains a record of all correspondence received and will deliver as soon as practicable such correspondence, which require Board attention to the Board or individual Director/s as applicable.
Contact person for shareholders.
Company Secretary can be contacted for any queries of shareholders.
Process for responding to shareholders.
Company has a Board-approved communication policy addressing this.
ü
GRI - 102 - 34
GO
VE
RN
AN
CE

92 L B Finance PLC Annual Report 2017/18
Code Reference
Compliance and implementation
Status of compliance Complied
C.3 Disclosure of major and material transactions
Directors should disclose all proposed corporate transactions which would materially alter the net asset base of the Company.
Major transactions.
During the year, the Company did not engage in or commit any major transactions which materially affected the Company’s net asset base.
ü
D ACCOUNTABILITY AND AUDIT
D.1 Present a balanced and understandable assessment of the Company’s financial position, performance, business model, governance, structure, risk management, internal controls, and challenges, opportunities and prospects
The Board should present a balanced and an understandable assessment of the Company’s financial position and prospects.
Board should present interim and other price sensitive information to the public and reports to regulators.
The Company has reported a true and fair view of its financial position and performance for the year ended on 31st March 2018 and at the end of each quarter of the financial year and all price sensitive information has been disclosed in a timely manner.
Directors’ Report in the Annual Report.
Annual Report of the Board of Directors on the affairs of the Company is given on page 98 covering all areas of this section.
Annual Report disclosure stating Board’s and Auditors’ responsibility
Statement of Directors’ Responsibility for Financial Reporting is given on page 100 and Auditors responsibility given in the Auditors’ Report to the 313 Internal Control is given on page 100 respectively.
Management discussion and analysis.
Management discussion and analysis is given on page 118.
Information Required PageIndustry structure and developments ................................................ 156Opportunities and threats .................................................................... 205Risks and concerns .............................................................................. 188Internal control systems and their adequacy ...................................... 212Social and environmental protection activities carried out by the Company ............................................................ 153Financial performance ......................................................................... 208Material developments in human resource/industrial relations and .. 258Prospects for the future ...................................................................... 246
ü
Corporate Governance

L B Finance PLC Annual Report 2017/18 93
Code Reference
Compliance and implementation
Status of compliance Complied
Disclosure of Related Party Transactions.A detailed Board-approved documented process is available in the Company for monitoring and reporting of Related Party Transactions. The Company Secretary makes necessary disclosures of any Related Party Transactions which require disclosure as per the rules. All related party transactions as defined in Sri Lanka Accounting Standard – 24 (LKAS 24) on ‘Related Party Transactions’ are disclosed in Note 6.1 to the Financial Statements on pages 406.
Directors’ assumption on the going concern of the business.This is given in the Annual Report of the Board of Directors on the Affairs of the Company on page 107.
Serious loss of capital. No such circumstance occurred, and its likelihood of occurrence is also remote.
ü
D.2 Process of risk management and a sound system of internal control to safeguard shareholders’ investments and the company’s assets
The Board is responsible for formulating and implementing appropriate processes for risk management and internal control systems to safeguard shareholder investments and assets of the Company. The IRMC assists the Board in discharge of its duties with regard to risk management and the BAC assists the Board in discharge of its duties in relation to internal control. Their responsibilities are summarised in the respective Subcommittee reports and have been formulated with reference to the requirements of the Corporate Governance and business needs. The IRMC is supported by the Risk Management Department of the company and a comprehensive report of how the company manages risk is included on pages 177 to 199 and the Subcommittee Reports on page 112.
ü
D.3 Audit Committee The Board should establish formal and transparent arrangements for considering how they should select and apply accounting policies, financial reporting and internal control principles and maintaining an appropriate relationship with the company’s Auditors.
Composition of the Audit Committee.
The Audit Committee comprises the following Directors:
Mrs. Yogadinusha Bhaskaran Mr. M A J W JayasekaraMrs. Anandhiy K Gunawardhana
Reviewing the scope and results of the audit and its effectiveness and independence and objectivity of the Auditors.
The Audit Committee periodically reviews the scope and results of the audit and its effectiveness. Further independence and the objectivity of the Auditors are also reviewed periodically. The Committee would consider independence when providing non- audit engagements to the External Auditor. It is also responsible to make recommendations on the appointment, reappointment and removal of Auditors.
Disclosures made in the Annual Report about Audit Committee.
Audit Committee report is given on page 110 of the Annual Report
ü
GO
VE
RN
AN
CE

94 L B Finance PLC Annual Report 2017/18
Code Reference
Compliance and implementation
Status of compliance Complied
D.4 Code of Ethics Company must adopt a Code of Business Conduct and Ethics for Directors, and members of the Senior Management Team. Any non-compliance with the said Code should be promptly disclosed.
Code of Business Conduct and Ethics is in place. There were no violation for disclosure.
ü
D.5 Corporate governance disclosures
The Board should include this in the Annual Report setting out the manner and extent for it to be complied.
Disclosure of corporate Governance Compliance
The requirement is met with the presentation of this Corporate Governance Report from pages 82 to 94 of the Annual Report.
ü
E & F Encourage voting at AGM
The company has 2,006 ordinary voting shareholders of which 92.92% are institutional shareholders.
We have a regular structured dialogue with the large institutional shareholders and any concerns of these institutional shareholders expressed at the meetings is communicated to the Board as a whole.
All shareholders are encouraged to participate at AGM and cast their votes. Investor relations hotline/email is open for any investor to reach out to the CEO/Director if required. From the Company’s perspective, the AGM provides a forum for the Board to inform the shareholders what the Company does and how it has performed during the year. For investors, it provides a forum to learn more about the business and ask questions from the Directors and to use their votes responsibly.
ü
G Internet of things and cyber-security
Please refer page 198.ü
H Environment, Society and Governance (ESG)
Please refer page 290.
ü
H. 1 ESG reporting Please refer page 290. üH.1.2 Environmental
factorsPlease refer page 290.
ü
H.1.3 Social factors Please refer page 264. üH.1.4 Governance Please refer page 44. üH.1.5 Board’s role on
ESG factorsPlease refer page 290.
ü
Corporate Governance

L B Finance PLC Annual Report 2017/18 95
LISTING RULES CORPORATE GOVERNANCE FOR LISTED COMPANIES ISSUED BY THE COLOMBO STOCK EXCHANGE
Section Reference
Rule Status of Compliance Complied
7.6 (iv) The public holding percentage Please refer ‘Financial Capital’ on page 202 ü
7.6 (v)
Directors’ and Chief Executive Officer’s holding in shares at the Item 5.4 of the “Investor Relations” beginning and at the end of the financial year
Please refer ‘Financial Capital’ on page 224
ü
7.6 (vi) Information pertaining to material foreseeable risk factors
Please refer the ‘Risk Management’ section on page 177 ü
7.6 (vii) Details of material issues pertaining to employees and industrial relations
Please refer page 246ü
7.6 (viii) Extents, locations, and valuations of land holdings and Investment properties as at the end of the year
Please refer Note 4.23 Information on the freehold land and buildings of the Company in the Financial Reports on page 369
ü
7.6 (ix) Number of shares representing the stated capital as at the end of the year
Please refer Note 4.33 Stated Capital in the Financial Reports on page 388 ü
7.6 (x) A distribution schedule of the number of holders in each class of equity securities and the percentage of their total holdings as at the end of the year
Please refer ‘Financial Capital’ on page 224
ü
7.6 (xi) Ratios and market price information:
Equity – Dividend per share, dividend payout ratio, net asset value per share, market value per share
Debt – Interest rate of comparable Government Securities, debt/equity ratio, interest cover and quick asset ratio, market prices and yields during the year
Any changes in credit rating
Please refer ‘Financial Capital’ on page 224
Please refer ‘Ten year summary’ on page 419
ü
7.6 (xii) Significant changes in the Company or its Subsidiaries fixed assets and the market value of land, if the value differs substantially from the book value as at the end of the year
Please refer Note 4.23 - Property, Plant & Equipment in the
Financial Statements on page 369
ü
7.6 (xiii) Details of funds raised through Public Issues, Rights Issues and Private Placements during the year
There were no any share issues, rights issues or private placement during the year. ü
7.6 (xiv) Information in respect of Employee Share Option Schemes: Total number of shares allotted during the financial year, price at which shares were allotted and the details of funding granted to employees (if any)
Highest, lowest, and closing price of the share recorded during the financial year
The Company does not have any Employee Share Ownership or Stock Option Schemes at present.
Please refer page 106.ü
7.6 (xv) Disclosures pertaining to Corporate Governance practices in terms of Rules 7.10.3, 7.10.5 (c) and 7.10.6 (c) of Section 7 of the Listing Rules
Please refer “Report on compliance with the Rules on the Content of the Annual Report on page 95
ü
GO
VE
RN
AN
CE

96 L B Finance PLC Annual Report 2017/18
Section Reference
Rule Status of Compliance Complied
7.6 (xvi) Disclosures on Related Party Transactions exceeding 10% of the Equity or 5% of the total assets of the Entity as per Audited Financial Statements, whichever is lower
The Company did not have any Related Party Transactions exceeding this threshold during the year. ü
7.10.1 NON- EXECUTIVE DIRECTORS7.10.1 (a) Two or one-third of the Directors, whichever is
higher, should be Non-Executive DirectorsAs at 31st March 2018 The Board comprised five Non-Executive Directors out of total of 10 Directors which is 50 as a percentage.
ü
7.10.1 (b) The total number of Directors is to be calculated based on the number as at the conclusion of the immediately preceding Annual General Meeting.
The Board comprised of 11 Directors as at the conclusion of the immediately proceeding AGM.
ü
7.10.1 (c) Any change occurring to this ratio shall be rectified within ninety (90) days from the date of the change.
The cessation and the appointment of the Directors as disclosed in 7.10.1 (b) complied with the requirement.
ü
7.10.2 INDEPENDENT DIRECTORS7.10.2 (a) Two or one-third of Non-Executive Directors,
whichever is higher, should be independent.The Board has determined that four Directors out of Five Non-Executive Directors are Independent
ü
7.10.2 (b) Each Non-Executive Director should submit a declaration of independence/non-independence in the prescribed format.
All Directors have submitted annual declarations in respect of the year under review.
ü
7.10.3 DISCLOSURES RELATING TO DIRECTORS7.10.3 (a) The Board shall make determination of
Independence/Non-Independence annually and Names of Independent Directors should be disclosed in the Annual Report.
Please refer page 50 of the Annual Report
ü
7.10.3 (b) In the event a Director does not qualify as independent as per the rules on Corporate Governance but if the Board is of the opinion that the Director is nevertheless independent, it shall specify the basis of the determination in the Annual Report.
Not applicable
ü
7.10.3 (c) A brief resume of each Director should be published in the Annual Report including the areas of expertise.
Please refer page No. 50 in the Annual Report.ü
7.10.3 (d) A brief resume of any new Director appointed to the Board should be provided to the Exchange for Dissemination to the public.
Please refer pages No. 36 to 39 in the Annual Report. ü
7.10.4 CRITERIA FOR DETERMINATION OF INDEPENDENCE OF DIRECTORS7.10.4 (a-h)
Requirements for meeting criteria to be independent All Independent Directors of the Company met the criteria for independency specified in this Rule.
ü
Corporate Governance

L B Finance PLC Annual Report 2017/18 97
Section Reference
Rule Status of Compliance Complied
7.10.5 REMUNERATION COMMITTEE
7.10.5 (a) A listed Company shall have a Remuneration Committee. The remuneration committee shall comprise; of a minimum of two Independent Non-Executive Directors or of Non-Executive Directors a majority of whom shall be independent, whichever shall be higher.
Board appointed Remuneration Committee is in place. Please refer page 108 of the Annual Report. All the Directors in the Remuneration Committee comprised of independent Non-Executive Directors. Mrs. A. K Gunawardhana who is an Independent Non-Executive Director is the Chairperson of the Committee.
ü
7.10.5 (b) Functions of Remuneration Committee shall be to recommend the remuneration of the Chief Executive Officer and the Executive Directors.
Please refer the Report of the Remuneration Committee on page 108 to the Annual Report. ü
7.10.5 (c) The Annual Report shall set out; (i) The names of the Directors that comprise the Remuneration Committee; (ii) A statement of remuneration policy; (iii) Aggregate remuneration paid to Executive and Non-Executive Directors.
Please refer the page 108 of Remuneration Committee Report.
ü
7.10.6 AUDIT COMMITTEE7.10.6 (a) The Audit Committee shall comprise a minimum
of two Independent Non-Executive Directors or a majority of Independent Non-Executive Directors whichever is higher.
One Non-Executive Director shall be appointed as Chairman of the Audit Committee by the Board.
The Chief Executive Officer and Chief Financial Officer shall attend Audit Committee meetings.
The Chairman or one member of the Committee should be a member of a recognised professional accounting body.
All the members of the Audit Committee are Independent Non-Executive Directors. Mrs. Yogadinusha Bhaskaran is the Chairperson of the Committee who is an Non-Executive Director. Both the Managing Director and the Chief Financial Officer attend the meetings by invitation. The Chairperson of the Audit Committee is a fellow member of The Institute of Chartered Management Accountants of UK. Please refer page 36 to 39 of Directors profiles and Mr. A Jayasekara, a member of the Committee is also a Fellow Member of The Institute of Chartered Accountants of Sri Lanka.
ü
7.10.6 (b) The functions of the Audit Committee shall be as set out in section 7.10 of the Listing Rules.
Please refer Audit Committee Report on page 110 of the Annual Report. ü
7.10.6 (c) Annual Report shall set out;
(i) The names of the Directors who comprise the Audit Committee.
(ii) The Audit Committee shall make a determination of the independence of the Auditors and disclose the basis for such determination.
(iii) A report by the Audit Committee setting out the manner of compliance of the functions set out in section 7.10 of the Listing Rules.
Please refer the Audit Committee Report’ on page 110 for the required disclosure.
ü
GO
VE
RN
AN
CE

98 L B Finance PLC Annual Report 2017/18
Annual Report of the Board of Directors on the Affairs of the CompanyThe Directors of L B Finance PLC have pleasure in presenting their Annual Report together with the Consolidated Financial Statements of the Company and its subsidiary for the year ended 31st March 2018 and the Independent Auditors Report on those Financial Statements, conforming to the requirements of the Companies Act No. 07 of 2007, Finance Business Act No. 42 of 2011 and the Listing Rules of the Colombo Stock Exchange.
This Report includes the information as required by the Companies Act, Finance Companies (Corporate Governance) Direction No. 03 of 2008 (as amended) and the Listing Rules of the Colombo Stock Exchange. It is also guided by the Recommended Best Practices on Corporate Governance.
GENERAL
L B Finance PLC (the Company) is a Licensed Finance Company in terms of the Finance Business Act No. 42 of 2011.
It was incorporated under the Companies Ordinance No. 51 of 1938 as a private limited liability company on 30th May 1971, converted to a public limited liability company on 29th September 1982 and was admitted to the Official List of the Colombo Stock Exchange on 30th December 1997. The Company was re-registered as per the Companies Act No. 07 of 2007 on 6th June 2008 under Company Registration No. PQ 156 .
The Company is a registered finance leasing establishment in terms of the Finance Leasing Act No. 56 of 2000.
The ordinary shares of the Company and Debentures issued by the Company, namely 20,000,000 Unsecured, Subordinated, Redeemable, Rated, Debentures
(redeemable in 2018); and 10,000,00 Senior, Unsecured, Redeemable, Rated, Debentures (Redeemable in 2022) and 20,000,000 Subordinated, Unsecured, Redeemable, Rated Debentures (redeemable in 2022) are listed on the Main Board of the Colombo Stock Exchange.
The Company has been affirmed a national long-term rating at A-(lka) with a stable outlook by Fitch Ratings Lanka limited. The ratings in respect of the Debentures issued by the Company are 20,000,000 Subordinated Debentures redeemable in 2018 – national long term rating at BBB+(lka), 10,000,000 Senior Debentures redeemable in 2022 – national long term rating at A-(lka) and 20,000,000 Subordinated Debentures redeemable in 2022 - national long term rating at BBB+(lka).
Both the registered office of the Company and its head office are situated at No. 275/75, Prof. Stanley Wijesundera Mawatha, Colombo 07.
As per the requirements set out in Section 168 of the Companies Act No. 07 of 2007, the following information is disclosed in this Report for the year under review.
Information required to be disclosed as per the Companies Act No. 07 of 2007
Reference to theCompanies Act
Level of compliance
The nature of the business of the Company Section 168 (1) (a) Complied Page 324
Signed Group Financial Statements of the Company for the accounting period under review
Section 168 (1) (b) Complied Pages 317 to 413
Auditor’s Report on Group Financial Statements of the Company Section 168 (1) (c) Complied Pages 313 to 315

L B Finance PLC Annual Report 2017/18 99
Information required to be disclosed as per the Companies Act No. 07 of 2007
Reference to theCompanies Act
Level of compliance
Changes in Accounting Policies during the accounting period Section 168 (1) (d) Complied Page 329
Particulars of entries in the Interests Register made during the accounting period
Section 168 (1) (e) Complied Page 104
Remuneration and other benefits paid to the Directors during the accounting period
Section 168 (1) (f) Complied Page 406
Total amount of donations made by the Company during the accounting period Section 168 (1) (g) Complied Page 106
Information on Directorate of the Company at the end of the accounting period Section 168 (1) (h) Complied Page 50
Amounts payable to the Auditor as audit fees and fees for other services rendered during the accounting period as a separate disclosure
Section 168 (1) (i) Complied Page 338
Auditors’ relationship or any interest with the Company Section 168 (1) (j) Complied Page 106
Annual Report of the Board of Directors on the affairs of the Company to be signed on behalf of the Board by two Directors and the Company Secretary
Section 168 (1) (k) Complied Page 107
Information as per Section 168 (1)(b) to (j) in relation to the subsidiary Section 168 (2) Complied Page 324
VISION, MISSION AND VALUES
The Company’s vision, mission and values are given on page 3 of this Report.
PRINCIPAL ACTIVITIES
The Company’s principal activities during the year were acceptance of fixed deposits, maintenance of savings accounts, providing finance lease, hire purchase and vehicle loan facilities, mortgage loans, gold loans, margin trading facilities, personal loans, factoring and trade finance facilities, microfinance, other credit facilities and value added services.
The Company has an interest in the leisure sector through its investment in The Fortress Resorts PLC.
During the year, the Company extended its presence to the Republic of the Union of Myanmar through the investment in its subsidiary, L B Microfinance Myanmar Company Limited. The said subsidiary received its licence to engage in Microfinance business in the Bago Region of Myanmar on 10th October 2017, and consequently, commenced business in December 2017.
There were no significant changes in the nature of the principal activities of the Company during the year under review, except the investment made in the subsidiary in Myanmar and commencement of business by the said subsidiary.
REVIEW OF OPERATIONS
A review of the business of the Company and its subsidiary and their performance during the year with comments on financial results, future strategies and prospects are contained in the Managing Director’s Review on pages 28 to 30 which form an integral part of this Report.
GO
VE
RN
AN
CE

100 L B Finance PLC Annual Report 2017/18
FUTURE DEVELOPMENTS
An overview of the future developments of the Company is given in the Chairperson’s Message on page 24, Managing Director’s Review on page 28 and the Management Discussion and Analysis on page 117.
FINANCIAL STATEMENTS
The Consolidated Financial Statements of the Company and its subsidiary have been prepared in accordance with the Sri Lanka Accounting Standards comprising Sri Lanka Financial Reporting Standards (SLFRS) and Sri Lanka Accounting Standards (LKAS) laid down by The Institute of Chartered Accountants of Sri Lanka and in compliance with the requirements of the Companies Act No. 07 of 2007, Finance Business Act No.42 of 2011 the directions and guidelines issued under the said Finance Business Act and the Listing Rules of the Colombo Stock Exchange.
Consequent to the Audit Committee’s recommendations, the Financial Statements were reviewed and approved by the Board of Directors on 22nd May 2018.
The Consolidated Financial Statements of the Company and its subsidiary duly signed by the Chief Financial Officer and two Directors on behalf of the Board are given on pages 317 to 413, which form an integral part of the Annual Report of the Board of Directors on the affairs of the Company.
DIRECTORS’ RESPONSIBILITY FOR FINANCIAL REPORTING
The Directors are responsible for the preparation of the Financial Statements of the Company and the Group which reflect a true and fair view of its state of affairs and its subsidiary.
The Directors are of the view that the Income Statement, Statement of Financial
Position, Statement of Changes in Equity, Cash Flow Statement and Notes to Financial Statements appearing on pages 317 to 413 have been prepared in conformity with the requirements of the Sri Lanka Accounting Standards, Companies Act No. 07 of 2007, Sri Lanka Accounting and Auditing Standards Act No. 15 of 1995 and the amendments thereto, directions and guidelines issued under the Finance Business Act No. 42 of 2011 and the Listing Rules of the Colombo Stock Exchange.
The Statement of Directors’ Responsibility for Financial Reporting is given on page 100 and forms an integral part of the Annual Report of the Board of Directors on the Affairs of the Company
DIRECTORS’ STATEMENT ON INTERNAL CONTROLS OVER FINANCIAL REPORTING
The Board has issued a statement on the internal control mechanism of the Company as per Section 10 (2) (b) of Finance Companies (Corporate Governance) Direction No. 03 of 2008.
The said statement which forms an integral part of the Annual Report of the Board of Directors on the Affairs of the Company is given on pages 98 to 107.
The Board has obtained an Assurance Report from the Independent Auditors on the Directors’ Statement on Internal Control over Financial Reporting as referred to in page 311.
AUDITORS’ REPORT
The Report of the Independent Auditors on the Financial Statements of the Company and the Group is given on page 313.
ACCOUNTING POLICIES AND CHANGES DURING THE YEAR
The accounting policies adopted in the preparation of the Financial Statements are given on pages 330 to 389 There were no significant changes to the accounting policies used by the Company during the year under review vis-à-vis those used in the previous year.
INCOME
The income of the Company for the year ended 31st March 2018 was Rs. 25,046 million (in 2017 it was Rs. 19,363 million).
Group Income during the year was Rs. 25,046 million (2017 – N/A)
An analysis of the Income is given in Note 4.1.1 to the Financial Statements.
FINANCIAL RESULTS AND APPROPRIATIONS
The Company has recorded a growth in profit before tax of 10% and a growth in profit after tax of 8% in the year ended 31st March 2018 in comparison to those of the preceding year.
The growth in total Comprehensive Income was 8%.
Annual Report of the Board of Directors on the Affairs of the Company

L B Finance PLC Annual Report 2017/18 101
Details of appropriation of profit of the Company are given below:
2018 2017
Rs.’000 Rs.’000
Profit for the year after payment of all the expenses of management, provision for depreciation and amortisation, impairment of loans and other losses, gold loan auction losses and tax on financial services.
6,477,690 5,874,843
Less: Income tax expense 2,226,969 1,956,639
Profit after tax 4,250,721 3,918,204
Unappropriated balance brought forward from previous year
8,259,079 6,970,499
Actuarial gains/(losses) on defined benefit plans (34,421) (3,182)
Profit available for appropriation 12,475,379 10,885,521
Less: Appropriations
Dividend paid for previous financial year 415,543 1,038,857
Interim dividend paid for current financial year 969,600 831,086
Transfers during the year 850,144 756,499
Total appropriation 2,235,287 2,626,442
Unappropriated balance carried forward 10,240,092 8,259,079
Proposed dividend 554,057 415,543
RESERVES
The reserves of the Company and the Group with the movements during the year are given in Note 4.34 to the Financial Statements on page 388.
TAXATION
The Income Tax rate applicable to the Company’s operations is 28% (28% in 2016/17).
The Company was also liable for Value Added Tax (VAT) on Financial Services at 15% (2016/17: 15%) and Nation Building Tax (NBT) on Financial Services at 2% (2016/17: 2%).
THE BOARD OF DIRECTORS
The Board of Directors of the Company as at 31st March 2018 consisted of 10 Directors with a balance of skills, wide knowledge and experience in entrepreneurship, banking, finance, audit and assurance, legal and marketing which is appropriate for the business carried out by the Company.
The names of the Directors who held office as at the end of the accounting period are given below and their brief profiles appear on pages 36 to 39.
Executive Directors
Mr. Dhammika Perera Executive Deputy Chairman
Mr. J A S S Adhihetty Managing Director
Mr. Niroshan Udage
Mr. B D A Perera
Mr. R S Yatawara
Non-Executive Directors
Mrs. Shirani Jayasekara Chairperson*+
Mr. Thosapala Hewage*+
Mrs. Anandhiy K Gunawardhana*+
Mrs. Yogadinusha Bhaskaran
Mr. M A J W Jayasekara* (appointed on 30 October 2017)
* Independent Director as per the Listing Rules + Independent Director as per the Finance Companies (Corporate Governance) Direction No. 03 of 2008 (as amended)
New appointments during the year
Mr. M A J W Jayasekara was appointed on 30 October 2017. The relevant regulatory approval under Finance Companies (Assessment of Fitness and Propriety of Directors and Officers performing Executive Functions) Direction No. 03 of 2011 was obtained for the said appointment.
Resignations during the year
Mr. W D N H Perera resigned with effect from 30th April 2017. The relevant regulatory approval in terms of Finance Companies (Structural Changes) Direction No. 01 of 2013 was obtained for the said resignation.
Cessations during the year
Mrs Kimarli Fernando, Acting Chairperson and Mr. L N de S Wijeyeratne ceased to be Directors with effect from 25th August 2017 and 31 October 2017 respectively on completion of nine (9) years of service, in terms of Section 4(2) of the Finance Companies (Corporate Governance) Direction No. 03 of 2008.
GO
VE
RN
AN
CE
102 L B Finance PLC Annual Report 2017/18
Other structural changes in the directorate
Consequent to the cessation of office of Mrs. Kimarli Fernando, who was the Acting Chairperson, Mrs. Shirani Jayasekara was appointed the Chairperson of the Board of Directors with effect from 18th September 2017.
The relevant regulatory approval in terms of Finance Companies (Structural Changes) Direction No. 01 of 2013 was obtained for the aforesaid structural change.
Directors of the Subsidiary
The Directors of the subsidiary, L B Microfinance Myanmar Company Limited as at 31st March 2018 consisted of the following:
Mr. Dhammika Perera
Mr. J A S S Adhihetty
Mr. Dulan de Silva (appointed on 7 June 2017)
Mr. Niroshan Udage
Mr. B D A Perera
Mr. R S Yatawara (appointed on 7 June 2017)
There were no changes in the Directors of the subsidiary,during the year under review except the two appointments referred to above.
Retirement by rotation and re-election of directors
The names of the Directors who are
(i) subject to retirement by rotation in terms of Articles 85 and 86 of the Articles of Association and
(ii) who retire in terms of Article 92 of the Articles of Association
and the applicable provisions are set out in the undernoted Table:
The Nomination Committee and the Board have recommended the re-election of the said Directors.
Directors’ interests register and Directors’ interests in contracts or proposed contracts
The Company maintains the Directors’ Interests Register in terms of the Companies Act No. 07 of 2007.
Directors of the Company have made necessary declarations of their Interests in Contracts and Proposed Contracts in terms of Sections 192 (1) and 192 (2) of the Companies Act. These interests are entered in the Interests Register which is deemed to form part and parcel of this Annual Report and available for inspection upon request.
The particulars of the Directors Interests in Contracts with the Company are given in Note 6.1 to the Financial Statements on page 406 and form an integral part of this Annual Report.
The remuneration paid to the Directors during the year under review is entered in the Interests Register and the aggregate of such remuneration is disclosed in this Annual Report under “Directors’ Remuneration” on page 406.
The relevant interests of Directors in the shares of the Company as at 31st March 2018 as recorded in the Interests Register are given in this Report under Directors’ shareholding.
In accordance with the Myanmar Companies Law, Directors of the subsidiary have disclosed their interests in shares and securities in the said subsidiary and related companies and also their interests in contracts and other arrangements with the said company.
Directors’ Declarations in terms of paragraph 7(3) of the Finance Companies (Corporate Governance) Direction No. 03 of 2008
The Chairperson and the Directors of the Company have made declarations as per the requirements in Section 7 (3) of the Finance Companies (Corporate Governance) Direction No. 03 of 2008, that there is no financial, business, family or other material/relevant relationship(s) between the Chairperson and the Managing Director and/or amongst the members of the Board.
Annual Report of the Board of Directors on the Affairs of the Company

L B Finance PLC Annual Report 2017/18 103
Name of Director
Applicable Article of the Articles of Association
Other information
Mrs. Shirani Jayasekara
Articles 85 and 86 According to Articles 85 and 86, the Directors to retire by rotation at the Annual General meeting are those who (being subject to retirement by rotation) have been longest in office Since their last election or appointment.
If one-third of the Directors eligible for retirement by rotation is not a multiple of three, the number nearest to (but not greater than) one-third shall retire from office. As per the Articles, in calculating the said number, Executive Directors and Directors who were appointed to fill casual vacancies and as additional Directors are excluded.
Accordingly after excluding 5 Executive Directors and 1 Director who was appointed during the year, the number of Directors subject to
retirement by rotation is 4 and therefore, one Director (Mrs Shirani Jayasekara) is to retire at the forthcoming Annual General Meeting and is recommended by the Directors for re-election.
Mrs.Shirani Jayasekara was last re-elected as a Director at the Annual General Meeting held in 2014
Mr. M A J W Jayasekara
Article 92 According to Article 92 any Director appointed during the year, shall hold office only until the next Annual General Meeting and shall then be eligible for re-election. Mr. M A J W Jayasekera being a Director appointed during the year retires at the Annual General Meeting in terms of Article 92 and being eligible for re-election is recommended by the Directors for election by the shareholders.
Related parties’ transactions with the Company
The Directors have also disclosed transactions, if any, that could be classified as related party transactions in terms of LKAS 24.
With effect from 1 January 2016, all proposed non-recurrent related party transactions have been placed before the Related Party Transactions Review Committee formed under the Listing Rules of the Colombo Stock Exchange, for its review and recommendations.
The aggregate value of transactions of related parties (as defined in LKAS 24 – ‘Related Parties Disclosure’) with the Company is set out in Note 6.1 to the Financial Statements.
The Board confirms that the Company has not engaged in transactions with any related party in a manner that would grant such party ‘more favourable treatment’ than that accorded to other similar constituents of the Company.
The Directors declare that the Company is in compliance with Section 9 of the Listing Rules of the Colombo Stock Exchange pertaining to Related Party Transactions during the financial year ended 31st March 2018.
Directors’ remuneration
The remuneration of Directors of the Company and its subsidiary is disclosed under key management personnel compensation in Note 6.1.1 to the Financial Statements on page 406.
GO
VE
RN
AN
CE

104 L B Finance PLC Annual Report 2017/18
Relevant interests of directors’ in shares
The Directors’ shareholding and the relevant interests of Directors in the shares of the Company as at 31 March 2018 and 31 March 2017 are as follows:
Shareholdingas at
31 March 2018
Shareholdingas at
31 March 2017
Mrs. Shirani Jayasekara - -
Mr. Dhammika Perera* - -
Mr. J A S S Adhihetty 106,120 106,120
Mr. Thosapala Hewage - -
Mr. N Udage 250,325 173,837
Mr. B D A Perera - -
Mr. R S Yatawara - -
Mrs. Anandhiy K Gunawardhana - -
Mrs. Yogadinusha Bhaskaran - -
Mr. M A J W Jayasekara - -
*Mr. Dhammika Perera is the major shareholder of Vallibel One PLC, which holds 71,682,400 shares constituting 51.75% of the shares representing the stated capital of the Company.
Vallibel One PLC is also the holding company of Royal Ceramics Lanka PLC which holds 36,123,232 shares constituting 26.08% of the shares representing the stated capital of the Company.
Mr. Dhammika Perera and Mr. J A S S Adhihetty are Directors of Vallibel One PLC, where they serve as Chairman/Managing Director and Non-Executive Director respectively.
Mrs. Yogadinusha Bhaskaran is the Chief Executive Officer of Vallibel One PLC.
Mr. Dhammika Perera, also serves as Chairman of Royal Ceramics Lanka PLC.
Directors’ interests in debentures
Except, 15,000 Subordinated, Unsecured, Listed, Redeemable, Rated Debentures held by Mrs Anandhiy K Gunawardhana, no debentures were registered in the name of any Director at the beginning and at the end of the year under review.
Board sub-committees
The Board of Directors of the Company has formed five committees in compliance with the Finance Companies (Corporate Governance) Direction No. 03 of 2008, Listing Rules of the Colombo Stock Exchange and as per the recommended best practices on Corporate Governance.
They are the Audit Committee, Integrated Risk Management Committee, Remuneration Committee, Related Party Transactions Review Committee and the Nomination Committee.
The composition of the said Committees is as follows:
Audit CommitteeMrs. Yogadinusha Bhaskaran Chairperson (with effect from 1 November 2017)
Mr. L N De S WijeyeratneChairman (upto 31 October 2017)
Mrs. Shirani Jayasekara(upto 31 October 2017)
Mrs. Anandhiy Gunawardhana
Mr. M A J W Jayasekara (with effect from 31 October 2017)
The Report of the Audit Committee appears on page 110.
Integrated Risk Management Committee (IRMC)Mr. M A J W Jayasekara Chairman (from 2 November 2017)
Mrs. Shirani Jayasekara Chairperson (upto 1 November 2017)
Mrs. Kimarli Fernando (upto 25 August 2017)
Mrs. Anandhiy K Gunawardhana(from 17 October 2017)
Mr. J A S S Adhihetty Managing Director
Mr. Niroshan Udage Executive Director
Mr. B D A Perera Executive Director
Mr. R S Yatawara Executive Director
Mr. Bimal Perera DGM – Strategy & Risk
Mr. Hasitha Saman Athapattu Chief Financial Officer
Mr. Udul Chandrasena AGM Treasury
Mrs. Zairaa Kaleel Compliance Officer
The Report of the IRMC appears on page 112.
Annual Report of the Board of Directors on the Affairs of the Company

L B Finance PLC Annual Report 2017/18 105
Remuneration CommitteeMrs. Anandhiy GunawardhanaChairperson
Mrs. Kimarli Fernando (upto 25 August 2017)
Mr. L N de S Wijeyeratne (upto 31 October 2017)
Mr. M A J W Jayasekara (from 31 October 2017)
Mrs Yogadinusha Bhaskaran (from 17 October 2017)
The Report of the Remuneration Committee appears on page 108.
Related Party Transactions Review Committee (RPTRC)Mrs Shirani Jayasekara Chairperson (from 26 August 2017)
Mrs. Kimarli Fernando Chairperson – (upto 25 August 2017)
Mr. L N de S Wijeyeratne (upto 31 October 2017)
Mr. Thosapala Hewage (from 17 October 2017)
Mr. Ashane Jayasekara (from 31 October 2017)
Mr. B D A Perera (upto 24 April 2018 thereafter a Permanent Invitee)
The Report of the RPTRC appears on page 114.
Nomination CommitteeMr. Thosapala Hewage Chairman
Mrs. Kimarli Fernando (upto 25 August 2017)
Mrs. Anandhiy Gunawardhana (from 26 August 2017)
Mr. J A S S Adhihetty
The Report of the Nomination Committee appears on page 109.
STATED CAPITAL AND DEBENTURESThe stated capital of the Company as at 31 March 2018 was Rs. 838,282,159/- represented by
138,514,282 ordinary shares. There were no changes in the stated capital of the Company during the year. The details of the debentures in issue as at 31 March 2018 are set out in Note 4.33 to the Financial Statements on page 388 and on page 389 of this Report.
SHARE INFORMATION AND SUBSTANTIAL SHAREHOLDINGS
ShareholdersThere were 2,006 shareholders registered as at 31 March 2018 (2,102 shareholders as at 31 March 2017).
DISTRIBUTION SCHEDULE OF SHAREHOLDERS, MAJOR SHAREHOLDERS, PUBLIC HOLDING AND RATIOS AND MARKET PRICE INFORMATIONInformation as required by the Listing Rules on distribution of shareholding with the respective percentages, 20 largest shareholders, public holding and ratios and market price information are set out on page 224 under Financial Capital.
Ratios and market prices of debenturesInterest rate of comparable Government securities, ratios and market prices of the debentures issued by the Company, as required by the Listing Rules are set out on pages 226 to 227.
During the year under review, there were no changes in the credit rating for the Company and/or the Debentures issued by the Company in 2013.
During the year the Company issued 10,000,000 Senior, Unsecured Listed Redeemable, Rated Debentures and 20,000,000 Subordinated, Unsecured, Listed, Redeemable, Rated Debentures, which were assigned national long-term ratings at A-(lka) and BBB+(lka) respectively by Fitch Ratings
Lanka Limited by their Report dated 17 November 2017.
DIVIDENDSInformation on dividends paid by the Company is given in Note 4.11 to the Financial Statements.
The Company paid an interim dividend of Rs. 7/- per share for the year under review on 9 March 2018 out of the profits of the Company, which was subjected to a 10% withholding tax.
The Directors recommended a final dividend of Rs. 4/- per share for the year under review subject to obtaining a certificate of solvency from the Auditors and to be approved by the shareholders at the forthcoming Annual General Meeting. This dividend payment will be subject to 14% Withholding Tax.
As required by Section 56 of the Companies Act, the Directors have certified that they are satisfied that the Company will, immediately after the said distribution is made, satisfy the solvency test in accordance with the Companies Act. and subsequent to such declarations the Directors have obtained the Auditors’ certificate of solvency thereon.
In compliance with Finance Companies Guideline No. 01 of 2013, the Company has obtained the approval of the Director, Department of Supervision of Non-Bank Financial Institutions of the Central Bank of Sri Lanka for the proposed final dividend.
The said final dividend will, subject to approval by the shareholders, be payable on 10th July 2018.
GO
VE
RN
AN
CE

106 L B Finance PLC Annual Report 2017/18
PROPERTY, PLANT AND EQUIPMENT AND SIGNIFICANT CHANGES IN THE COMPANY’S AND ITS SUBSIDIARY’S FIXED ASSETS/MARKET VALUE OF LANDThe details of Property, Plant and Equipment are given in Notes 4.23 the Financial Statements. The land and buildings owned by the Company are recorded at cost and details of those properties and their market values as at 31st March 2018 as per valuations conducted by Mr. H V Manjula Basnayake an Independent Incorporated Valuer are set out in Note 4.23.9 to the Financial Statements on page 375.
Debenture Issue in December 2017By a Prospectus dated 28th November 2017, the Company invited subscription to raise a total of Rs. 3,000,000,000/- through the issue of Senior, Unsecured, Listed, Redeemable, Rated Debentures (Type A) and Subordinated, Unsecured, Listed, Redeemable, Rated Debentures (Type B).
Consequent thereto, the Company issued 10,000,000, Type “A” debentures of Rs. 100/- each [total consideration being Rs. 1,000,000,000/] and 20,000,000 Type “B” debentures of Rs. 100/- each [total consideration being Rs. 2,000,000,000/-].
The objective of the issue of the debentures was to finance expansion by increasing the lending portfolio of the Company within 12 months of the date of allotment and the totality of funds raised through the debenture issue of Rs. 3,000,000,000/- was utilised for the said purpose.
HUMAN RESOURCESThe Company’s employment policy is totally non-discriminatory which respects individuals and provides career opportunities irrespective of the gender race or religion.
As at 31 March 2018, the Company had 3,441 employees (3,221 employees as at 31 March 2017).
MATERIAL ISSUES PERTAINING TO EMPLOYEES AND INDUSTRIAL RELATIONS PERTAINING TO THE COMPANYNo material issues pertaining to employees or industrial relations of the Company occurred during the year under review which required disclosure under Rule 7.6 (vii) of the Listing Rules.
EMPLOYEE SHARE OPTION SCHEMES/EMPLOYEE SHARE PURCHASE SCHEMESThe Company has not implemented any Share Option/Share Purchase Schemes for its employees
DONATIONSNeither the Company nor its subsidiary made any donations during the year under review.
CORPORATE SOCIAL RESPONSIBILITY (CSR)The Company carries out CSR activities, annually details of which are set out in the section on Social and Relationship Capital on page 153.
AUDITORSMessrs Ernst & Young, Chartered Accountants served as the Auditors during the year under review and also provided audit related services and permitted non-audit/consultancy services.
The Auditor of the subsidiary company, L B Microfinance Myanmar Company Limited is Myanmar Rigour & Associates Limited.
As far as the Directors are aware, the Auditors do not have any other relationship or interest in the Company. The Auditors too have provided a declaration confirming that they are not aware of any relationship with or interest in the Company or, in their
professional judgment may reasonably be thought to have a bearing on their independence within the meaning of the Code of Conduct and Ethics of The Institute of Chartered Accountants of Sri Lanka applicable as at the date of their declaration.
A total amount of Rs. 6.59 million is payable by the Company to the Auditors for the year under review comprising Rs. 2.95 million as Audit Fees, and Rs. 2.6 million. as audit related fees and expenses and Rs. 1.04 million for non-audit services. A fee of USD 4,000 is payable to the Auditors of the subsidiary company as audit fees.
The Auditors of the Company, have expressed their willingness to continue in office. The Audit Committee at a meeting held on 9 May 2018 recommended that they be reappointed as Auditors. A resolution to reappoint the Auditors and to authorise the Directors to determine their remuneration will be proposed at the Annual General Meeting.
RISK MANAGEMENT AND INTERNAL CONTROLAn ongoing process is in place to identify and manage the risks that are associated with the business and operations of the Company. The Directors review this process through the Audit Committee and the Integrated Risk Management Committee. Specific steps taken by the Company to manage the Risks are detailed in the section on Risk Management on pages 177 to 199.
Directors’ Statement on Internal Controls over Financial Reporting is on page 100.
MATERIAL FORESEEABLE RISK FACTORSMaterial Foreseeable Risk Factors as applicable to the business operations of the Company and its subsidiary are set out in Notes 5.1 to 5.5 to the Financial Statements on pages 390 to 405.
Annual Report of the Board of Directors on the Affairs of the Company

L B Finance PLC Annual Report 2017/18 107
APPRAISAL OF BOARD PERFORMANCEA scheme of self-assessment is undertaken annually by each Director in conformity with the Section 2 (8) of the Finance Companies (Corporate Governance) Direction No. 03 of 2008 by answering a self-assessment questionnaire. The responses are collated by the Company Secretary, which are submitted to the Board and discussed and further evaluated at the Board Meeting.
The Board also carried out an annual self-evaluation of its own performance and that of the sub-committees to ensure that they discharge their duties and responsibilities satisfactorily, in terms of the Companies Act No. 07 of 2007, Finance Companies (Corporate Governance) Direction No. 03 of 2008, Listing Rules of the Colombo Stock Exchange and Best Practices on Corporate Governance.
Board and sub-committee evaluations for the year under review were discussed and further evaluated at the Board Meeting held in the month of April 2018.
CORPORATE GOVERNANCEThe Board of Directors is responsible for the governance of the Company.
The Board has placed considerable emphasis on developing rules, structures and processes to ensure integrity and transparency in all of Company’s dealings and on making the best effort in achieving performance and quality profits. The Board has continuously refined the structure and systems to ensure governance on the lines as defined, being aware all the time that it is accountable to the stakeholders and to the general public.
The Report on Corporate Governance on pages 61 to 97 describes the application of the Corporate Governance practices within the Company during the year under review.
COMPLIANCE WITH LAWS AND REGULATIONSThe Compliance Officer independently monitors adherence with all applicable laws, regulations and statutory requirements and reports to the Board and the Integrated Risk Management Committee.
The Compliance Officer also ensures that compliance reports are submitted to the Central Bank of Sri Lanka confirming the Company’s compliance with the directions, rules, determinations, notices and guidelines in terms of the Finance Business Act No. 42 of 2011.
STATUTORY PAYMENTSThe Directors confirm that to the best of their knowledge, all taxes, duties and levies payable by the Company, all contributions, levies and taxes payable on behalf of, and in respect of employees of the Company and all other known statutory dues as were due and payable by the Company as at the reporting date have been paid or, where relevant provided for, except for certain assessments where appeals have been lodged.
ENVIRONMENTAL PROTECTIONThe Company has not engaged in any activity that is harmful or hazardous to the environment. Measures taken by the Company on environmental protection are given in the report on Natural Capital on pages 290 to 305.
OUTSTANDING LITIGATIONIn the opinion of the Directors and Company’s lawyers, pending litigation by and against the Company will not have a material impact on the financial position of the Company or its future operations.
CONTINGENT LIABILITIESExcept as disclosed in Note 6.5 to the Financial Statements, there were no material contingent liabilities as at the reporting date.
EVENTS OCCURING AFTER THE REPORTING DATEExcept for the matters disclosed in Note 6.9 to the Financial Statements on page 413 there are no material events as at the date of the Auditor’s Report which require adjustment to or disclosure in the Financial Statements.
GOING CONCERNThe Board of Directors has reviewed the Company’s corporate/business plans and is satisfied that the Company has adequate resources to continue its operations in the foreseeable future. Accordingly, the Financial Statements of the Company are prepared based on the going concern concept.
ANNUAL GENERAL MEETINGThe Notice of the forty-fifth (45th) Annual General Meeting to be held on 29 June 2018 appears on Page 445.
ACKNOWLEDGEMENT OF THE CONTENT OF THE REPORTAs required by section 168 (1) (k) of the Companies Act, this report is signed on behalf of the Board of the Company by two Directors and the Secretaries of the Company in pursuance of the authority granted by the Board by a Resolution passed on 1 June 2018 having acknowledged the contents of this Annual Report.
Signed on behalf of the Board by
Mrs. Shirani Jayasekara Chairperson
Mr. J A S S Adhihetty Managing Director
P W Corporate Secretarial (Pvt) Ltd.
Secretaries
1 June 2018
GO
VE
RN
AN
CE

108 L B Finance PLC Annual Report 2017/18
Remuneration Committee ReportThe Remuneration Committee was formed by the Board in compliance with Rule 7.10.5 of the Listing Rules of the Colombo Stock Exchange and its composition and functions are in conformity with the provisions of the Listing Rules.
COMPOSITION OF THE COMMITTEE
The Remuneration Committee appointed by the Board of Directors comprises the following members:
Mrs. Anandhiy Gunawardhana Independent Non Executive Director – Chairperson of the Committee
Mrs. Yogadinusha Bhaskaran Non-Executive Director
Mr. M A J W Jayasekara Independent Non-Executive Director*
*Independent Non Executive Director as per the Listing Rules and Non Executive Director as per the Finance Companies (Corporate Governance) Direction No.03 of 2008
Mrs Kimarli Fernando and Mr L N de S Wijeyeratne, served as members of the Committee until their retirement from the Board on completion of 9 years of service on 25th August 2017 and 31st October 2017, respectively.
The Committee was reconstituted by the Board on 17th October 2017, whereby Mrs Yogadinusha Bhaskaran was appointed a member from that day and Mr M A J W Jayasekara became a member of the Committee, effective from 31st October 2017, following his appointment as a Director.
The Company Secretary functions as the Secretary to the Committee
MEETINGS
The Committee meets as often as necessary to make recommendations on compensation structures, bonuses and increments of Executive Directors, and also on matters pertaining to the remuneration of the Senior Management and in instances where the Board refers specific matters for review by the Committee.
The Managing Director and the Executive Directors attend meetings of the Committee by invitation and provide relevant information and their views to the Committee for its deliberations, except when the Executive Directors’ own remuneration packages and other matters relating to them are discussed.
The Committee met two (2) times during the year.
FUNCTIONS
The functions of the Committee include making recommendations to the Board on the compensation and benefits of the Managing Director, Executive Directors and the Senior Management of the Company, and on specific matters referred to the Committee by the Board.
REMUNERATION POLICY
A primary objective of the remuneration policy of the Company is to attract and retain a highly qualified and experienced workforce and reward their performance commensurate with each employee’s level of experience and contribution, bearing in mind the business performance and long term shareholder return.
DIRECTORS’ REMUNERATION
The total of the Directors’ remuneration paid during the year under review is set out in Note 6.1 to the Financial Statements.
Anandhiy GunawardhanaChairpersonRemuneration Committee
1 June 2018 Colombo

L B Finance PLC Annual Report 2017/18 109
Nomination Committee ReportThe Nomination Committee was formed in line with Best Practices on Corporate Governance.
COMPOSITION OF THE COMMITTEE
The Nomination Committee comprises two Non-Executive Directors and one Executive Director, whose names are set out below:
Mr. Thosapala Hewage Independent Non-Executive Director – Chairman of the Committee
Mrs. Anandhiy Gunawardhana Independent Non-Executive Director
Mr. Sumith Adhihetty Managing Director
Mrs Kimarli Fernando served as a member of the Committee until her retirement from the Board on completion of 9 years of service on 25 August 2017.
The Committee was reconstituted by the Board on 22 August 2017, whereby Mrs Anandhiy Gunawardhana was appointed a member following the retirement of Mrs Kimarli Fernando.
The Company Secretary functions as the Secretary to the Committee.
FUNCTIONS
The functions of the Nomination Committee are :
» To regularly review the structure, size, composition and competencies of the Board, the requirement of additional / new expertise and the succession arrangements for retiring Directors and make recommendations to the Board with regard to any changes;
» To consider the making of any appointments to the Board and to provide advice and recommendations to the Board on such appointments;
» To ensure that Directors are fit and proper persons to hold office as per the criteria set out in the Direction issued by the Central Bank of Sri Lanka and relevant Statutes;
» To make recommendations on other related matters referred it to by the Board of Directors.
MEETINGS
During the year the Committee had three (3) meetings.
ACTIVITIES DURING THE YEAR
The Committee met on 23 May 2017 when it recommended the re-election of Directors at the Annual General Meeting for the year 2016/17 after considering their performance and contribution made by them as members of the Board and their areas of expertise and experience that would assist the Board in the discharge of its responsibilities. At this meeting the Committee also considered the requirement of additional expertise on the Board, resulting from the retirement of two Directors on completion of nine years service on the Board as per the Finance Companies (Corporate Governance) Direction No.03 of 2008.
Following the Committee’s consideration of the requirement of additional expertise on the Board and the succession arrangements for the two Directors who were to
retire during the year on completion of nine years of service, the Committee met on 17 October 2017 for the selection of Directors and made its recommendations with regard to one Director, which was subsequently approved by the Board. The said nominee was appointed a Director after obtaining the requisite regulatory approval.
The Committee also met on 14th March 2018 to consider the re-election of Directors who are subject to retirement by rotation / appointed to fill a casual vacancy during the year under review, taking into consideration, the Declarations completed by the said Directors and after taking cognizance of the fit and proper criteria and their contribution as members of the Board, competencies, independence and whether there were any relationships which have potential to give rise to conflict vis-à-vis the business of the Company. Thereupon the Committee recommended the re-election of Mrs Shirani Jayasekara (under Articles 85 and 86) and Mr M A J W Jayasekara (under Article 92). During this meeting the Committee also reviewed the Key Management Succession Plan to ensure that the succession planning was in order.
Thosapala HewageChairmanNomination Committee
1 June 2018 Colombo
GO
VE
RN
AN
CE

110 L B Finance PLC Annual Report 2017/18
AuditCommittee ReportCOMPOSITION
The Board-appointed Audit Committee comprises of three non-executive Directors and is in line
with the composition requirements specified in the Finance Companies (Corporate Governance) CBSL Direction No. 03 of 2008 (as amended) issued by the Monetary
Board of the Central Bank of Sri Lanka and the Listing Rules of the Colombo Stock Exchange. The members of the Audit Committee are as follows:
Name of the Board Sub Committee Member Directorship Status Membership Status
Mrs. Yogadinusha Bhaskaran Non-Executive Director Chairperson
Mrs. Anandhiy K Gunawardhana Independent/Non-Executive Director Member
Mr. Ashane Jayasekara Independent/Non-Executive Director Member
The following changes took place during the year in the Audit Committee.
Mr. L N de S Wijeyeratne ceased to be a member on his retirement from the Board on 31 October 2017 and Mrs. Shirani Jayasekara ceased to be a member on 31 October 2017. Mrs. Yogadinusha Bhaskaran and Mr. Ashane Jayasekara were appointed to the Committee w.e.f. 1 November 2017 and 31 October 2017 respectively.
The profiles of the members are given on pages 36 to 39.
CHARTER OF THE AUDIT COMMITTEEThe Audit Committee Charter clearly defines the Terms of Reference of the Committee and is reviewed annually, to ensure new developments to the Committee’s functions and concerns are adequately addressed. The Audit Committee Charter was last reviewed and approved by the Board of Directors in January 2018.
The Audit Committee is setup primarily for the purpose of assisting the Board in carrying out its oversight functions in relation to the accuracy and integrity of the Financial Statements and compliance with Company policies, legal and regulatory requirements, with a view to safeguarding the interests of shareholders, depositors and other stakeholders. The Committee is responsible for the oversight of the effectiveness of the system of internal controls, risk management, and the independence and performance of the external auditors.
MEETINGSThe committee met on sixteen (16) occasions during the year under review and the attendance of the members at such meetings was:
Name of Director Attendance
Mrs. Yogadinusha Bhaskaran
6/6
Mrs. Anandhiy K Gunawardhana
14/16
Mr. Ashane Jayasekara
6/6
Name of Director Attendance
Mr. L N de S Wijeyeratne
10/10
Mrs. Shirani Jayasekara
8/10
The Managing Director, the Executive Directors and the Chief Financial Officer, DGM - Strategy and Risk, Compliance Officer, Audit Manager, Head of Treasury and Head of IT attended the meetings by invitation. The members of the management team and Company’s External Auditors, Messrs. Ernst & Young were invited to participate at the meetings as and when required.
P W Corporate Secretarial (Pvt) Ltd acted as Secretaries to the audit committee. The proceedings of the audit committee were reported regularly to the Board.
SUMMARY OF ACTIVITIES
Financial reporting system
The Committee reviewed the financial reporting system adopted by the Company with particular reference to the following:

L B Finance PLC Annual Report 2017/18 111
» The preparation, presentation and adequacy of the disclosures in the Company’s Annual and Interim Financial Statements in accordance with Sri Lanka Financial Reporting Standards and Sri Lanka Accounting Standards.
» The rationale and basis for the significant estimates and judgments underlying the financial statements
» The systems and procedures in place to ensure that all transactions are accurately recorded in the books of accounts.
» The effectiveness in the financial reporting systems including the management accounts to ensure the reliability of information provided to the Board and other stakeholders of the Company.
REGULATORY COMPLIANCEProcess owners comply with regulations as part of their standard operating procedure on a day to day basis.
The Compliance Officer checks on new regulations and adds any relevant new areas of compliance to policies and procedure manuals. She also reviews and reports on any gaps or areas of non compliance to the Audit Committee.
Thirdly, there is a review of regulatory compliance done by outsourced internal auditors in selected areas in line with their internal audit programs.
INTERNAL AUDITThe internal audit function is outsourced to Chartered Accountants, Messrs. KPMG Ford Rhodes Thornton & Company and BDO Partners and they report to the Audit Committee. The internal auditors are responsible to review and report on the efficacy of the internal control system and
compliance with statutory and other regulations and the Company’s accounting and operational policies. Prior to the commencement of audits, the audit scope is reviewed by the Committee and the Committee recommends amendments where necessary, prior to approving the scope. Control weaknesses highlighted in the Internal Audit reports are critically examined by the Committee and follow-up action taken by the management on the audit recommendations are also reviewed. The Committee had recommended re-audits of certain processes, to ensure effectiveness of controls. Internal Audit representatives are present at Audit Committee meetings during the discussion of their respective reports.
EXTERNAL AUDITThe Audit Committee reviewed and monitored the independence and objectivity of the External Auditors Messrs Ernst & Young, Chartered Accountants. The Committee reviewed the non-audit services provided by the Auditors to ensure that the provision of these services does not impair their independence. During the year, the Committee evaluated the performance of the External Auditors.
The Committee met the External Auditors to discuss the Management letter pertaining to the previous year’s audit and the management’s response thereto. Follow-up actions were taken to ensure that the recommendations contained in the management letter were implemented by the Management. Private meetings were held with the External Auditors, in the absence of Management, for the Auditors to freely discuss and express their opinions on any matter. One such meeting was held, prior to the finalisation of the Financial Statements.
The Audit Committee together with Management reviewed and discussed the audit scope, approach and audit plan with Messrs. Ernst & Young, prior to the commencement of the audit for 2017/18.
The Audit Committee has recommended to the Board of Directors that Messrs. Ernst & Young, Chartered Accountants, be reappointed as the External Auditors for the financial year ending 31st March 2019, subject to the approval of the shareholders at the next Annual General Meeting.
WHISTLEBLOWING POLICYThe Committee ensures the Whistleblowing Policy of the Company is a current, live document to which all employees have access. All employees are encouraged to practice whistleblowing if they suspect any wrongdoing. Senior Management, time to time conducts awareness programs to encourage staff to raise genuine concerns.
AUDIT COMMITTEE EFFECTIVENESSThe effectiveness of the Committee is self-evaluated annually by its members and the results presented to the Board.
APPRECIATIONThe Committee wishes to convey its gratitude to former Chairman Mr. L N de S Wijeyeratne and Mrs. Shirani Jayasekara for their valuable contribution
Yogadinusha BhaskaranChairpersonAudit Committee
1 June 2018 Colombo
GO
VE
RN
AN
CE

112 L B Finance PLC Annual Report 2017/18
Integrated Risk Managment Committee ReportThe Integrated Risk Management Committee (IRMC) is a Board-appointed committee chaired by a Non-Executive Director in compliance with the Finance Companies (Corporate Governance) Direction No. 3 of 2008 (as amended) issued by the Monetary Board of the Central Bank of Sri Lanka.
COMPOSITION OF THE COMMITTEE
The Board-appointed Integrated Risk Management Committee (IRMC), as at the end of the year, comprised the following members:
Mr. Ashane Jayasekara Chairman/Non-Executive Director*
Mrs. Anandhiy Gunawardhana Independent Non-Executive Director
Mr. J A S S Adhihetty Managing Director
Mr. Niroshan Udage Executive Director
Mr. B D A Perera Executive Director
Mr. R S Yatawara Executive Director
Mr. Bimal Perera DGM – Strategy and Risk
Mr. Hasitha Athapattu Chief Financial Officer
Mr. Udul Chandrasena AGM – Treasury
Mrs. Zairaa Kaleel Compliance Officer
*Non Executive Director as per the Finance Companies (Corporate Governance) Direction No.03 of 2008 and Independent Non Executive
Director as per the Listing Rules.
The Company Secretary functions as the Secretary to the Integrated Risk Management Committee.
COMMITTEE MEETINGS
The Committee held four meetings during the year under review to discuss the regular scope of work. Attendance at Committee Meetings is given on page 57. Key members of the staff participated at the meetings as appropriate.
TERMS OF REFERENCE
The responsibilities of the Integrated Risk Management Committee as mandated by the Board of Directors are as follows:
1. Assess all risks i.e. credit, market, liquidity, operational and strategic risk including business continuity plans of the Company on a quarterly basis through appropriate risk indicators and management information.
2. Review the adequacy and effectiveness of all management level committees such as credit committee and the asset-liability committee to address specific risk and to manage those risks within quantitative and qualitative risk limits as specified by the Committee. The Committee shall:
a. receive reports from management concerning capital adequacy, asset quality, credit, market, liquidity, operational, new and emerging risks etc in order to oversee these risks and assess their effect on capital levels.
b. receive reports from management concerning resolution of significant risk exposures and risk events, in order to monitor them and, if thought fit, approve them.
3. Take prompt corrective action to mitigate the effects of specific risk in case such risks are at levels beyond the prudent levels, decided by the Board on the basis of the Company’s policies and regulatory and supervisor’s requirements.
4. Take appropriate actions against the officers for failure to identify specific risks and take prompt corrective actions as recommended by the Committee.
5. Report and recommend to Board of Directors on Risk Management and Compliance related matters seeking the Board’s views, concurrence and /or specific directions.
ACTIVITIES IN FY 2017/18
Credit Risk
» Reviewed the credit quality of the micro leasing portfolio with special focus on motor cycles and registered three-wheelers.
» Reviewed the activities of Credit Committee through the assessment of the loan performance of significant exposures against the Company and internal credit rating.
Liquidity and Market Risk
» Reviewed and approved the Crisis Management Plan to be followed
GRI - 102 - 30

L B Finance PLC Annual Report 2017/18 113
Integrated Risk Managment Committee Report
during a deposit flight caused due to external factors
» Reviewed the adequacy and effectiveness of ALCO activities by assessing net/gross FD inflow, interest cost of new and renewed FDs, FD renewal ratio of the Company in terms of volume and number of FDs, etc.
» Reviewed asset and liability limits, including but not limited to single borrower exposure/single group exposure, single depositor exposure/bulk depositor exposure, duration of deposits and optimal funding mix
» Reviewed the liquidity position and liquidity management strategies of the Company
Operational Risk & Human Resources Risks
» Reviewed the adequacy and effectiveness of existing fraud detection and prevention mechanisms
» Reviewed the adequacy of existing control environment on protecting confidential/sensitive information of LBF customers and recommended further preventive measures to strengthen the process
» Reviewed the control environment of operational risks with special focus on external frauds and work place safety including;
- Adequacy of insurance in respect of cash in transit/cash in safe
- Adequacy of fire-fighting equipment and fire training
- Adequacy and effectiveness of CCTV network coverage and surveillance
- proposed mechanisms to strengthen the security arrangements at branches
» Assessed the cyber risks faced by the Company and the effectiveness of remedial actions in place
Compliance
» Assessed the Company’s compliance with laws, regulations and regulatory guidelines, internal policies in all areas of business operations
» Reviewed and recommended the Share Trading Policy of the Company, for approval of the Board
General
» Reviewed the KRIs used in FY2016/17 for their appropriateness for FY2017/18 in light of changing business, economic, industry and Company dynamics
» Reviewed and approved the the risk appetite statement of the Company for FY 2017/18
Ashane Jayasekara Chairman Integrated Risk Management Committee
1 June 2018 Colombo
GO
VE
RN
AN
CE

114 L B Finance PLC Annual Report 2017/18
Report of the Related Party Transactions Review CommitteeThe Related Party Transactions Review Committee (RPTRC) of the Company was established by the Board on 22 September 2015 in accordance with Section 9 of the Listing Rules of the Colombo Stock Exchange to ensure compliance with those Rules thereby enhancing the Company’s internal control mechanisms.
COMPOSITION OF THE COMMITTEE
The RPTRC comprises the following Directors :
Mrs. Shirani Jayasekara Independent Non-Executive Director Chairperson of the Committee
Mr. Thosapala Hewage Independent Non Executive Director
Mr. M A J W Jayasekara Non Executive Director*
*Independent Non Executive Director as per the Listing Rules and Non Executive Director as per the Finance Companies (Corporate Governance) Direction No.03 of 2008.
Mrs Kimarli Fernando and Mr L N de S Wijeyeratne, served as the Chairperson and a member of the Committee respectively until their retirement from the Board on completion of 9 years of service on 25 August 2017 and 31 October 2017, respectively.
The Committee was reconstituted by the Board on 22 August and 17th October 2017, whereby Mrs Shirani Jayasekara was appointed the Chairperson and Mr Thosapala Hewage was included as a member effective from 17 October 2017.
As per the said Board decision, Mr. M A J W Jayasekara became a member of the Committee, effective from 31 October 2017, following his appointment as a Director.
Mr B D A Perera, Executive Director was appointed to the Committee on 15 December 2015 to ensure a communication link between the Committee and the Management. In accordance with a Board decision made on 24 April 2018, Mr B D A Perera ceased to be a member and was made a Permanent Invitee with effect from 24 April 2018, in order that the composition of the Committee is in conformity with the provisions of the new Code of Best Practice on Corporate Governance issued by the Institute of Chartered Accountants of Sri Lanka.
Scope of the Committee includes:
» To manage relationships with related parties to uphold good governance and the best interests of the Company
» To provide an independent review, approval and oversight of Related Party Transactions (RPTs) (except those expressly exempted by the Charter) on terms set forth in greater detail in the Policy
» To review the Charter and Policy at least annually and recommend amendments to the Charter and the Policy to the Board as and when determined to be appropriate by the Committee
» Determining whether Related Party Transactions that are to be entered into by the Company require the approval of the Board or Shareholders of the Company;
» Establishing guidelines in respect of Recurrent Related Party Transactions, for senior management to follow in their ongoing dealings with the relevant related party.
» Ensuring that no Director of the Company shall participate in any discussion of a proposed Related Party Transaction for which he or she is a related party, unless such Director is requested to do so by the Committee for the express purpose of providing information concerning the Related Party Transaction to the Committee.
» Ensuring that immediate market disclosures and disclosures in the Annual Report as required by the applicable rules/regulations are made in a timely and detailed manner.
POLICIES AND PROCEDURES
» The Charter of the Committee was adopted by the Board on 22 September 2015. It includes a RPT Policy whereby the categories of persons/entities who shall be considered as ‘related parties’ have been identified.
» In accordance with the RPT Policy, self-declarations are obtained from each Director for the purpose of

L B Finance PLC Annual Report 2017/18 115
identifying parties related to them and such declarations are filed with the Company Secretary. The Company Secretary communicates any changes in the Related Parties to the officer responsible for collation of information on related parties.
» The Company uses a RPT System that enables the Company to retrieve data on RPTs throughout the Company’s network. Based on the information furnished in the declarations submitted by the Directors, the data base of related parties maintained in the RPT system is continuously updated and the system automatically generates a comprehensive report every quarter for Management’s review, which is also tabled at RPTRC meetings and where necessary, at Board Meetings held after the completion of the relevant quarter. The said report reflects all types of transactions with related parties including general payments, creditors, debtors, savings, fixed deposits and lending.
» In its review of RPTs, RPTRC considers the terms and conditions of the RPT, value, and the aggregate value of transactions with the said related party during the financial year, in order to determine whether they are carried out on an arms length basis, the disclosure requirements as per the Listing Rules of the CSE and the level of approval required for the respective RPTs are complied with
The RPTRC ensures that all transactions with related parties are in the best interests of all stakeholders, adequate transparency is maintained and are in compliance with the Listing Rules.
The Committee reviewed, non recurrent RPTs during the year and made recommendations and communicated its observations to the Board.
The Committee has established guidelines in respect of Recurrent RPTs to be followed by the Management of the Company, in the Company’s dealings with related parties.
During the year, the Committee reviewed the Charter and the Policy and made recommendations to the Board for approval of those revisions, which were duly adopted by the Board.
Reviewing and approval of RPTs are either at a meeting of a majority of the members who form the quorum or by circulation, approved by all the members.
RELATED PARTY TRANSACTIONS/ DISCLOSURES DURING THE YEAR
1. Information on all related parties, as extracted as at the end of each quarter, was presented to the RPTRC and the Board at their meetings held in the immediately following month.
2. All Directors made a monthly declaration, where any transactions entered/to be entered by the respective Directors and/or any related parties of the said Director were disclosed, which were tabled at the RPTRC.
3. The value of non-recurrent RPTs during the year was below the threshold for immediate disclosure in terms of Rule 9.3.1 of the Listing Rules or disclosure
in the Annual Report as per Rule 9.3.2 (a) of the Listing Rules.
4. The aggregate value of recurrent Related Party Transactions entered into during the year was below the threshold for disclosure in the Annual Report as per Rule 9.3.2(b) of the Listing Rules.
5. The aggregate value of all RPTs during the year is disclosed in Note 6.1 to the Financial Statements in terms of LKAS 24 – Related Party Disclosures.
MEETINGS
The Committee had four meetings during the year under review.
DECLARATION
A declaration by the Board of Directors as an affirmative statement of the compliance with the Listing Rules pertaining to related party transactions is given on page 60 of the Annual Report.
Shirani JayasekaraChairpersonRelated Party Transactions Review Committee
1 June 2018 Colombo
Report of the Related Party Transactions Review Committee
GO
VE
RN
AN
CE

116 L B Finance PLC Annual Report 2017/18

L B Finance PLC Annual Report 2017/18 117
MANAGEMENT DISCUSSION AND ANALYSIS
A Matter of Strategy
Integrated ThinkingExtensive Market KnowledgeTarget DrivenResponsive to ChangeContinuous Improvement

118 L B Finance PLC Annual Report 2017/18
OPERATING CONTEXT
INVESTING
Business Model:Our Value Creation Story
BUSIN
ESS
VISION • MISSION
OPERATING CONTEXT
We continuously analyse our immediate operating environment to identify the context that would underpin our operational focus as well as broader strategic direction
The main purpose of our business is to create value for our stakeholders. Doing so, calls for a proactive approach to understand how our business context is evolving, determine how these changes are impacting LBF’s value creation capacity and take action to safeguard the interests of our stakeholders.
RESOURCES WE RELY ON
FINANCIAL CAPITAL
The funds generated through equity, customer deposits and other funding sources that we invest in value creating activities
MANUFACTURED CAPITAL
The tangible and intangible infrastructure, branches, gold loan centres, call centres as well as key investments in technology and digital hardware that enables the Company to carry out its business and deliver the LBF brand promise to the market
HUMAN CAPITAL
Our employees who are the key custodians of our business, the driving force of our competitive advantage and the defining factor of our success.
SOCIAL AND RELATIONSHIP
CAPITAL
The strength of the relationships we have built with our key stakeholders – customers, investors, employees and the community that reflect LBF’s position as a responsible corporate steward
INTELLECTUAL CAPITAL
A range of interconnected components: knowledge, brand value, ethics and corporate culture, all of which serve as the foundation for the LB brand promise
NATURAL CAPITAL
The natural resources on which we depend to create value for all stakeholders of the Company
FINANCING
WE BELIEVE THAT OUR PEOPLE
ARE OUR KEY DIFFERENTIATOR

L B Finance PLC Annual Report 2017/18 119
VALUES • GOALS
ACTIVITIES
DELIVER SUSTAINED STAKEHOLDER VALUE
STRATEGY – WHAT MATTERS MOST
STAKEHOLDERS RELATIONSHIPS
PERFORMANCE
We continuously measure our performance based on a set of KPI’s to determine if actual outcomes are in line with targets
Material risks and opportunities are identified through the Enterprise Risk Management
(ERM) framework and the stakeholder engagement process, regular board and
management discussions as well as through the horizon scan, which provides a review of
our operating environment
LBF’s corporate governance model provides oversight for strategy
development and resource allocation as well as ensuring strategy execution that
delivers the desired outcomes
RISKS AND OPPORTUNITIES
CORPORATE GOVERNANCE
Material matters act as a compass that guides the strategy and decision-making processes, enabling
us to focus on what matters most
Through continuous engagement with all key stakeholders, we are able to identify their aspirations and thereby take
them into consideration when formulating business strategies, which ultimately circles back to add value to
these same relationships
OPERATING CONTEXT
VALUE ADDED SERVICES
CUSTOMER CENTER OF THE BUSINESS
MA
NA
GE
ME
NT
DIS
CU
SS
ION
AN
D A
NA
LYS
IS

120 L B Finance PLC Annual Report 2017/18
Business Model:Our Activities and their Impacts
INPUTS ACTIVITIES
INVESTING
FINANCING
VALUE ADDED SERVICES
Our strategy is to grow and
improve the quality of the
deposit portfolio through
a suitable investment mix
that would strengthen
the Company’s ability to
maximise investor returns.
Lend responsibly in order to
ensure customers become
financially better off and
in so doing improve LBF’s
competitive positioning in
the market.
Provide a range of value
added services that aim
to enhance the customer
experience with LBF.
» Return on Equity (ROE) 34.09%
» Total risk weighted capital ratio 17.06%
» Dividend per share Rs. 9.00
» Deposit base Rs. 60.4 billion
» Economic value retained Rs. 3.02 billion
» Brand value Rs. 3,853 million (LMD - 2016)
» Ongoing process of ISO 27001: 2013 certification
» Brand ranking 26 among top 100 companies (Most Respected Entity - 2017) (LMD)
» Reached 45,333 social media followers
» 154 total outlets network
» 456 no. of e-connect transaction
» Initiatives for the adoption of new technologies Rs. 31.00 million
» Investment in IT infrastructure development Rs. 47 million
» Total employees 3,221
» Profit per employee Rs. 1.21 million
» 477 new employment opportunities
» Investment in training and development Rs. 8.04 million
» 17 community engagement CSR activities
» Rs. 2.58 million invested in community projects
» 2,302 volunteer hours spent on community activities
» Carbon footprint of the Company 4,361tCo2e
» Invested Rs. 3.29 million in green initiatives
» 409 volunteer hours on green activities
» 9 environment conservation projects
FINANCIAL CAPITAL
MANUFACTURED CAPITAL
HUMAN CAPITAL
SOCIAL AND RELATIONSHIP
CAPITAL
INTELLECTUAL CAPITAL
NATURAL CAPITAL
What we had at the beginning of the year
VALUE ADDED BY LBF
PAGE 218
PAGE 268
PAGE 172

L B Finance PLC Annual Report 2017/18 121
FOCUSING ON WHATMATTERS MOST
FOCUSING ON STRATEGIES
AND RESOURCE ALLOCATION
OPERATION
FINANCIAL CAPITAL
» Issuance of Rs. 3 billion debenture to improve the capital adequacy of the Company and funding for operations
» Investment made on property, plant and equipment Rs. 1,537.34 million
» Spent Rs. 8.56 million on staff training and development
INTELLECTUAL CAPITAL
» Investment of Rs. 194.49 million on the digital transformation strategy to strengthen the Company’s IT infrastructure
» Expansion of IT workforce by absorbing technical specialists from the industry
» Stepping up to cloud-based technology to create an online financial platform
MANUFACTURED CAPITAL
» Opened 5 branches and relocated 3 branches and one gold loan centre to better serve customers
» Installation of 3 CDM machines to enhance efficiency of the processes
» Regional expansion by setting up a subsidiary in Myanmar
HUMAN CAPITAL
» 113 business-oriented training programmes conducted
» 698 promotions offering career development opportunities
» Introduction of e-learning system
SOCIAL AND RELATIONSHIP CAPITAL
» 26 community-oriented projects conducted
» Set up a new gold loan call centre in Jaffna
NATURAL CAPITAL
» Promoting green lending facilities
» 6 environment-related projects
» Invested Rs. 3.51 million in green initiatives
BU
SIN
ES
S O
PE
RA
TIO
N W
ITH
IN T
HE
CO
MPA
NY
PR
IMA
RY
OU
TP
UT
PAGE 133
PAGE 143
VALUE ADDED BY LBF
MA
NA
GE
ME
NT
DIS
CU
SS
ION
AN
D A
NA
LYS
IS

122 L B Finance PLC Annual Report 2017/18
OUTCOMESMANAGING TRADEOFF, POSITIVE
AND NEGATIVE OUTCOMES
WHILE MANAGING KEY RISKS
FINANCIAL CAPITAL
Market capitalisation Rs. 16.47 billion
Asset increased Rs. 18.06 billion
Interest paid Rs. 8.11 billion
Distributed Rs. 1.52 billion in dividends
MANUFACTURED CAPITAL
Property, plant and equipment Rs. 4.68 billion
(Increased by Rs. 1.17 billion)
Total outlets increased by 5 to 159
Investment in IT infrastructure increased by
Rs. 115.24 million to Rs. 194.49 million
Opened a microfinance subsidiary in Myanmar
HUMAN CAPITAL
Invested over Rs. 8.56 million in training and
development
Staff turnover up to 31.76% (2016/17 : 25.21%)
Rs. 2,398 million paid as the employment benefit
9 work-life balance activities (2016/17 : 6)
SOCIAL AND RELATIONSHIP CAPITAL
Rs. 23.51 million spent on CSR projects
(2016/17: Rs. 14.54 million)
220 new employment generated
INTELLECTUAL CAPITAL
Brand value increase by Rs. 383 million to 4,236
million (LMD – 2017)
Brand raking movement to 33 from 80 among top 100
companies (Most Respected Entity – 2017) (LMD)
Social media followers 81,474
NATURAL CAPITAL
6 environment engagement projects (2016/17 : 9)
Carbon footprint reduced from 4,361tCO2e to
3,223tCO2e
Green lending reduced by 43.75%
5 email campaigns on energy saving management
INVESTMENT DECISIONS
VALUE CREATION
REDUCTION OF EXPENSES
Where we allocate our money
Balancing short-term performance expectations and long-term expectations
Managing optional spend to ensure its effort
PAGE 152
PAGE 152
PAGE 152
» Credit risk
» Liquidity risk
» Market risk
» Operational risk
» Other related risk
PAGE 135
Business Model:Our Activities and their Impacts

L B Finance PLC Annual Report 2017/18 123
OUTPUT VALUE CREATION TO THE STAKEHOLDERS
FINANCIAL CAPITAL
» Return on Equity (ROE) 30.52%
» Total risk weighted capital ratio 14.14%
» Dividend per share 11
» Deposit base Rs. 72.94 billion
INTELLECTUAL CAPITAL
» Brand value Rs. 4,236 million (LMD – 2017)
» Completion of ISO 27001: 2013 certification
» 17th among the top 20 Best Sri Lankan Brands
MANUFACTURED CAPITAL
» 159 total branch network
» 2,978 no. of e-connect transactions
» Investment in IT infrastructure development Rs. 194.49 million
HUMAN CAPITAL
» Total no. of employees 3,441
» Profit per employee Rs. 1.24 million
» 220 new employment opportunities
SOCIAL AND RELATIONSHIP CAPITAL
» 26 no. of community engagement CSR activities
» 9,079 volunteer hours spent on community initiatives
NATURAL CAPITAL
» Carbon footprint of the Company
3,223tCO2e
» Investing Rs. 3.51 million in green initiatives
» 6 environmental conservation projects
» Created 220 new permanent job opportunities
» Paid Rs. 2.39 billion in salaries and benefits
» Invested Rs. 8.56 million in training and development
» 698 employees promoted to the next grade
» Distribution of Rs. 8.49 billion as interest to deposit holders
» Opened 5 new branches (Mannar, Dharga Town, Bambalapitiya, Wadduwa and Karapitiya)
» Rs. 969.60 million amount spent on interim dividend payment
» Dividend per share increase by 22%
» Maintained transparent, timely and relevant investor communication and reporting
» Share price increased from Rs. 118.40 to Rs. 118.90
» Dividend yield ratio 9.29%
» Made Rs. 3.38 billion tax contribution
» Strengthening the capital adequacy regulatory level
» System and process update in accordance with the customer protection framework
» Rs. 23.50 million invested in CSR projects
» Rs. 190.40 million facilities provided for MSME development
» More than 1,000 MSME facilities provided in Myanmar business operations
» Embarked on carbon-neutral operations
CUSTOMERS
SHAREHOLDERS
EMPLOYEES
BUSINESS PARTNERS
REGULATORS
SOCIETY/COMMUNITY
MA
NA
GE
ME
NT
DIS
CU
SS
ION
AN
D A
NA
LYS
IS

124 L B Finance PLC Annual Report 2017/18
STAKEHOLDER ENGAGEMENT
Stakeholders are the individuals, groups or entities that are affected by the products, services or operations of the Company or whose actions, decisions or attitudes affect the strategy, objectives and operations of the Company. LBF aims to build lasting relationships that add value to both parties, with its stakeholders. LBF has in place a rigorous process to identify its significant stakeholders. Through its process of engagement with the stakeholders, LBF is able to identify and understand their aspirations, concerns and also find ways and means of adding value to the stakeholder relationships in order to build lasting relationships.
Strategy formulation and amendments for next financial year
Direction and guidance coming from:
Our Vision
Our Mission
Our Values
Our Goals
PAGE 03
Stakeholder EngagementOUR STRATEGIC DIRECTION
STAKEHOLDER MAPPING
Scanning internal & external environment
Stakeholders’ power on our
activities
Stakeholders’ influence on what we do
Stakeholder groupsI Investor/
shareholder
C Customer
B Business partners
E Employees
R Regulatory
S Society
Stakeholder mapping exercise
Stakeholder assessment
Sta
keho
lder
pow
er
Stakeholder interest & influence
R
S
B
IE
C
Blockers
Keep satisfied
Advocate
Manage Closely
Keep informedCritically monitor
GRI - 102 - 40, 42

L B Finance PLC Annual Report 2017/18 125
Stakeholders’ expectations and management
Market forces and competitive landscape
Analysis of macro and micro trends
PAGE 126 PAGE 145 PAGE 144
Material matters derived through the process
» Managing business practices through uncertain socio economic factors
» Technological advancement and increased competition
» Demand for proper governance, regulatory compliance and risk management
» Customer understanding, managing competitiveness and market positioning
» Managing the talent pool in cognisance with evolving skill requirements
» Market outreach, presence and accessibility
» Contribution to minimise social and environmental inequalities
Strategic focus for the year » Understanding our clients and placing them the centre of everything we do
» Embracing innovation by leveraging on the latest developments in IT
» Sustainably growing revenue by managing economic headwinds
» Creating a great place to work for our people
» Nurturing nature by doing business the right way
» Working towards ensuring community well-being and promoting good corporate citizenship
Managing trends» Transformative impact of technology» Evolving worker and consumer expectations» Strict financial regulations» Cyber security and data privacy
Sustainability context and its direction towards the long term business targets
Sustainability impact assessment
1 2
3
4
5
6
7
PAGE 133
OUR STRATEGIC DIRECTION: INTEGRATED THINKING
MA
NA
GE
ME
NT
DIS
CU
SS
ION
AN
D A
NA
LYS
IS

126 L B Finance PLC Annual Report 2017/18
STAKEHOLDER EXPECTATION AND MANAGEMENT
Addressing stakeholder interests
Given the challenges brought about by rapid changes in industry dynamics and the impact resulting on our operations, the importance of engaging proactively with stakeholders has taken on added significance.
The main stakeholder groups identified by LBF are:
To protect our legitimacy, compete effectively and create value, we work hard to build and maintain relationships of trust with our stakeholders based on open and proactive engagement.
Through continuous engagement, we are able to identify and understand the aspirations of our stakeholders and thereby take them into consideration in formulating business strategies, ultimately adding value to the relationships.
CUSTOMERS SHAREHOLDERS
EMPLOYEESBUSINESS PARTNERS
REGULATORSSOCIETY/
COMMUNITY
Identifying our priority stakeholders
To facilitate targeted engagement, we have prioritised our stakeholders based on following criteria:
» The degree to which we depend on the stakeholder’s support in achieving our strategic goals;
» The degree to which the stakeholder can influence organisational performance;
PLANNING LEVEL
MANAGING LEVEL
IMPLEMENTATION LEVEL
Determine the stakeholder groups
StrategyCombine financial strength and identifying the value deliver mechanism to ensure the measurable changes to all stakeholders who associate with the business
Analysing the importance of the stakeholders
StrategyPromote clear and unbiased service to all stakeholders and mitigation of conflict of interest among key stakeholders of the business while at the same time ensuring the best possible performance of the Company
Implementing stakeholder management procedures
StrategyEnsure the value creation for stakeholders through sustainable financial services and work towards a more strategic approach that creates competitive advantage for all our stakeholders
» The relative importance of the stakeholder for the company as a whole;
» The significance of the issues linking the stakeholder to LBF; and
» The risks that we are exposed should not deliberately plan our engagement with the specific stakeholder.
Business process scanning
Track the level ofinfluence
Monitor the engagementmechanism
Identify the matters and concerns
Define the mode ofengagement
Review / improveand corrective actions
Profile the individuals basedon their similarities
Viewing the frequency ofengagement
Stakeholder Engagement

L B Finance PLC Annual Report 2017/18 127
ObjectiveSHAREHOLDERS
THE NEEDS AND EXPECTATIONS OF OUR STAKEHOLDERS
Responding to our stakeholdersOur stakeholders are those individuals or groups that have an interest in our success or failure and whose opinions and actions can impact on our ability to execute our strategy and conduct our business activities. Outlined below are the top issues raised by our key stakeholders and our strategic initiatives that respond to these concerns.
NEEDS AND EXPECTATIONS WHY THIS IS IMPORTANT TO LBF
» Appropriate financial returns to support above-average return on equity
» Sound balance sheet to safeguard against downside risk» Strong governance and compliance» Transparent reporting
The financial capital we source from our equity and debt investors and our retained earnings are key to grow the businesses
OUR STRATEGIC RESPONSE
Communicate our strategy and governance model, as well as the rationale for it, we build confidence in our leadership and further investment interest in LBF
KEY RISK / OPPORTUNITY IDENTIFIED IN STAKEHOLDER ENGAGEMENT PROCESS
RISK OPPORTUNITY
Lack of investor confidence due to market vulnerabilities in the NBFI sector
The extent to which we can leverage our financial strength, raise the necessary capital and funding at the best possible rates, and create shareholder value through stable ROE and fair retention of earnings.
Delivering appropriate shareholder returns while managing the risk arising
from the operating environment
ENGAGEMENT METHODS
LEVEL OF ENGAGEMENT ENGAGEMENT MODE FREQUENCY
Consult Shareholder meetings / Annual General Meetings Annual
Consult Extraordinary General Meetings Ad hoc
Inform Annual Report Annual
Inform Interim Financial Statements Quarterly
Inform Announcements to CSE Ad hoc as and when necessary
Remain passive Press conferences and media releases Ad hoc as and when necessary
Consult One-to-one meetings When necessary
Remain passive Website information updates On a regular basis
RELATED MATERIAL MATTERS
GRI - 102 - 15, 43, 44
MA
NA
GE
ME
NT
DIS
CU
SS
ION
AN
D A
NA
LYS
IS

128 L B Finance PLC Annual Report 2017/18
Objective
NEEDS AND EXPECTATIONS WHY THIS IS IMPORTANT TO LBF
» A safe, positive and inspiring work environment
» Challenging work, as well as career development and advancement opportunities
» A strong people brand that confirms our reputation as an employer of choice
Skilled, motivated and energised staff creates value by providing our customers with services and solutions, which differentiates LBF in an increasingly competitive market
OUR STRATEGIC RESPONSE
Continuously enhance the LBF employee value proposition by communicating strategy and performance, culture and sustainability as well as through training, development, rewards and recognition
KEY RISK / OPPORTUNITY IDENTIFIED IN STAKEHOLDER ENGAGEMENT PROCESS
RISK OPPORTUNITY
» Staff attrition
» Slow pace of transformation
Providing greater clarity on LBF’s training methodology and succession planning programme to attract and retain the best talent.
Maintaining a diverse workforce of capable, committed and motivated employees who are focused on, and feel
empowered to deliver LBF's strategic objectives.
ENGAGEMENT METHODS
LEVEL OF ENGAGEMENT ENGAGEMENT MODE FREQUENCY
Consult Review meetings Monthly
Consult Management meeting Monthly
Inform HR newsletter Annual
Collaborate Company social events Annual/Ad hoc
Inform Email updates On a regular basis
Involve HR portal On a regular basis
Inform Employee notice board On a regular basis
Consult Employee direct meetings When necessary
RELATED MATERIAL MATTERS
Stakeholder Engagement
EMPLOYEES

L B Finance PLC Annual Report 2017/18 129
Objective
NEEDS AND EXPECTATIONS WHY THIS IS IMPORTANT TO LBF
» Innovative products and services to ensure personalised customer care
» Promoting Island-wide accessibility
» Protecting customer privacy by adopting responsible business practices
The need for continuous improvement in our operational efficiency and fine-tuning our structures and processes to build strong relationships with our customers
OUR STRATEGIC RESPONSE
New product offerings to remain competitive, and state of art technology to bring the power of digital technology
KEY RISK / OPPORTUNITY IDENTIFIED IN STAKEHOLDER ENGAGEMENT PROCESS
RISK OPPORTUNITY
» Loss of customers due to dissatisfaction
» Breakdown of the existing relationships with customers
Further refine our internal processes using advanced technology and automation in order to enhance overall experience for existing customers and leverage on this to drive organic and inorganic
Understanding the needs of customers and providing timely and relevant value propositions through a
balanced distribution model.
ENGAGEMENT METHODS
LEVEL OF ENGAGEMENT ENGAGEMENT MODE FREQUENCY
Involve Customer hotline As necessary
Consult Customer surveys Annual
Consult One-to-one meetings As necessary
Consult Direct customer feedbacks On a regular basis
Remain passive Media campaigns/advertisements On a regular basis
Remain passive Website information updates On a regular basis
RELATED MATERIAL MATTERS
CUSTOMERS
MA
NA
GE
ME
NT
DIS
CU
SS
ION
AN
D A
NA
LYS
IS

130 L B Finance PLC Annual Report 2017/18
Objective
NEEDS AND EXPECTATIONS WHY THIS IS IMPORTANT TO LBF
» Fair procurement practice
» Supplier development programmes for small businesses, including access to financing, where relevant
» Ensure business continuity and minimize downtime caused by frequent changes of suppliers
» Cost optimisation through procurement practices
OUR STRATEGIC RESPONSE
Focus on supplier relationship management
KEY RISK / OPPORTUNITY IDENTIFIED IN STAKEHOLDER ENGAGEMENT PROCESS
RISK OPPORTUNITY
» Loss of potential negotiation power due to breakdown of relationships with business partners
» Suppliers lack of business continuity planning
Forward and backward supplier integration to profitable ventures
Building strong collaborative relationships with business partners for
business continuity.
ENGAGEMENT METHODS
LEVEL OF ENGAGEMENT ENGAGEMENT MODE FREQUENCY
Consult Supplier meetings As necessary
Involve Letters/emails/telephone conversations On a regular basis
Transact Suppliers’ get-together Annual
Consult One-to-one meetings As necessary
Consult Periodic visits On a regular basis
RELATED MATERIAL MATTERS
Stakeholder Engagement
BUSINESS PARTNERS

L B Finance PLC Annual Report 2017/18 131
Objective
NEEDS AND EXPECTATIONS WHY THIS IS IMPORTANT TO LBF
» Compliance with all legal and regulatory requirements
» Being a responsible taxpayer
» Active participation in and contributing to industry and regulatory working groups
Regulation ensures a sound and stable financial system, which reduces systemic risk and promotes healthy functioning of an economy in which all stakeholders prosper
OUR STRATEGIC RESPONSE
We have adopted a zero-tolerance approach towards non-compliance
KEY RISK/OPPORTUNITY IDENTIFIED IN STAKEHOLDER ENGAGEMENT PROCESS
RISK OPPORTUNITY
» Strict rules applicable to the NBFI sector The regulation looks to level the playing field, creating a single integrated NBFI sector
Driving ethical behaviour in the delivery of products and services, and in compliance with all applicable regulatory frameworks and globally accepted
best practices for responsible social and environmental stewardship.
ENGAGEMENT METHODS
LEVEL OF ENGAGEMENT ENGAGEMENT MODE FREQUENCY
Consult Directives and circulars As necessary
Consult On-site review by CBSL Annual
Remain passive Press releases As necessary
Consult Meetings and discussions with Board and Senior Management
As necessary
Inform Submission of necessary reports Periodic deadlines
Consult Training and workshops organised by regulators As necessary
RELATED MATERIAL MATTERS
REGULATORS
MA
NA
GE
ME
NT
DIS
CU
SS
ION
AN
D A
NA
LYS
IS

132 L B Finance PLC Annual Report 2017/18
Objective
NEEDS AND EXPECTATIONS WHY THIS IS IMPORTANT TO LBF
» Social well-being of the community
» Infrastructure development
» Community capacity building
» Environmental goals
» Actively participate in social and economic empowerment
» Mitigate the impact of climate change
OUR STRATEGIC RESPONSE
In striving to continuously improve our Corporate Social Investment (CSI) strategy, we adopt an integrated approach to engage with the communities and serve their needs by making timely and relevant investments that will deliver a consistent socio-economic impact
KEY RISK/OPPORTUNITY IDENTIFIED IN STAKEHOLDER ENGAGEMENT PROCESS
RISK OPPORTUNITY
» Reputational risk if the brand does is not properly portrayed as a responsible corporate citizen
Carefully-planned programmes that seek to add value to the local communities in areas where LBF has a presence. These efforts include local hiring, as well as structured community development programmes and environmental initiatives.
To make a positive impact on society by developing products, services and
partnerships that improve communities
ENGAGEMENT METHODS
LEVEL OF ENGAGEMENT ENGAGEMENT MODE FREQUENCY
Remain passive Media advertisements and press releases As necessary
Collaborate Public events On a regular basis
Collaborate Community projects As necessary
Consult Call centre conversations As necessary
Collaborate Interact through branch network As necessary
Remain passive Social media On a regular basis
Remain passive Sustainability website On a regular basis
RELATED MATERIAL MATTERS
Stakeholder Engagement
SOCIETY/COMMUNITY

L B Finance PLC Annual Report 2017/18 133
Prin
cipl
eP
roce
ssO
utco
me
IDENTIFY
We identify matters that may
impact the execution of our
strategy. This is a Company-wide
effort involving inputs from all
business and support units, and
takes into account feedback from
stakeholders.
PRIORITISE
From the list of identified matters, we prioritise those that most significantly impact our ability to successfully execute our strategy and deliver long-term value to our stakeholders.
Sustainability Context
» Stakeholder inclusiveness
Materiality
» Stakeholder inclusiveness
» Impact assessment » Materiality test
» Identified aspect & boundaries
» Identified aspect & boundaries
Our Material MattersWe view the materiality determination process as a business tool that facilitates integrated thinking. The process draws on our ongoing stakeholder engagements to consider the views of key stakeholders in determining the measures that underpin our strategic value drivers.
HOW WE DETERMINE OUR MATERIAL ISSUES – COMPREHENSIVE METHOD
GRI - 102 - 46
MA
NA
GE
ME
NT
DIS
CU
SS
ION
AN
D A
NA
LYS
IS

134 L B Finance PLC Annual Report 2017/18
Internal environment scanning External environment scanning
» Board and Management meetings
» Public events such as investor conferences and/or business meetings
» Internal events such as our annual leadership events
» The Company’s social and ethics practices
» Stakeholder engagement undertaken by the Company at various levels
» Risk reports
» Reports prepared as part of the Company’s investor relations framework
» The Company’s internal audit
» Employee engagement surveys
» Public events such as investor conference and / or business meetings
» Shareholders at the Annual General Meeting
» Requests, memos and complaints received from clients, political parties, civil society bodies and others
» Media coverage
» Reports issued by research institutions / rating institutions
» Reports and statements by trade associations, business organisations and think tanks
» Reports and articles by industry analysts and investors
» Regional development concerns such as the Sustainable Development Goals
Information gathering within the organisation:
Ongoing scanning of external sources of information to identify statements, concerns and perceptions raised by stakeholders in relation to the finance sector in general and the Company in particular:
VALIDATION
Matters that are most material to value creation are integrated into our balanced scorecard
» Completeness
» Stakeholder inclusiveness
» Validation test
» List of material aspects
» Management
» Reporting
Our Material Matters
KEY FOCUS AREAS OF THE RESEARCH
Impact of Integrated Marketing on L B Finance Customers
Owing to the aggressive marketing approach adopted by the company, every potential customer is aware of the LB brand name, LB logo and L B Finance Company
0 20 40 60 80 100
Awareness of L B Finance Comapny
Ability to recognise LB logo without tagline
Ability to recognise LB theme colours

L B Finance PLC Annual Report 2017/18 135
MATERIAL MATTERS RAISED FROM THE STAKEHOLDERS INCISIVENESS
Materiality for reporting is identified through the stakeholder engagement process. As per the GRI guidelines, the thresholds for identifying these reportable subjects are termed, as ‘materiality’ and the subjects identified are terms as the ‘aspects’. Based on the issues raised by stakeholders during the engagement process, the following material aspects have been identified and discussed throughout this report:
Why it matters most - Management approach
As a leading financial institution in Sri Lanka, we believe that focusing on socio economic factors helps us to ensure that we provide appropriate business outcomes to ensure LBF’s long-term sustainability, improve trust in the financial system and safeguard the Company against future uncertainties.
Sustainability dimension – Economic Key stakeholder – Shareholders
MATERIAL DRIVERS – FINANCIAL CAPITAL HOW WE RESPOND
1. Strategy and aligning employees to improve top-line
2. Disciplined cost management to improve cost-to-income ratio and thereby strengthen the bottom line
3. Ongoing liquidity management to maintain a healthy fund position
4. Delivering consistent shareholder returns
» Budgeting and strategic planning
» Participatory quality improvement and better ways of doing business.
» Continuous improvement to internal systems and controls by updating enterprise risk management framework.
» Continuous improvements in legacy systems and introduction of new systems.
KPI: Revenue growth Target for 2018/19: 20 % growth
Focus: Our ability to adopt an approach with continuous improvement is evidenced by the consistent revenue and profit growth over the last five years. Given the growing challenges, the focus for 2018 would be to drive innovation to ensure that our cost base remains proportionate to our revenue growth and our business processes remain relevant in an ever-changing business environment.
10,000,000
15,000,000
20,000,000
25,000,000
30,000,000
Five-year trend – Investment
Rs.
20182017201620152014
RELATED RISKS Credit risk, market risk
Opportunities for value creation
» Identify most appropriate financial products for underserved.
» Find the correct balance between business cycle, economic growth, interest rate, lending and key risk.
RELATED CAPITALS
RELATED GRI INDICATORS 201, 202
PAGE 202
1MATERIAL M AT T E R Managing business practices through uncertain socio economic factors
GRI - 102 - 47
MA
NA
GE
ME
NT
DIS
CU
SS
ION
AN
D A
NA
LYS
IS

136 L B Finance PLC Annual Report 2017/18
Our Material Matters
Why it matters most - Management approach
Technology is at the core of LBF’s business and defines our every action. In fact it is the glue that binds our business strategy. We seek to differentiate ourselves through a technology-driven approach to achieve business excellence in a fiercely-competitive market.
Sustainability dimension – Economic Key stakeholder – Customers
MATERIAL DRIVERS – INTELLECTUAL CAPITAL HOW WE RESPOND
5. Enhance knowledge base
6. Invest in information systems
7. Reinforce culture and ethics
8. Expedite process automation
» Implement new systems and technologies such as cloud-based architecture
» Process improvement through software development
» Recruitment of technical specialists
KPI: Investment in ITTarget for 2018/19: Implementing the paperless practices within the Company
Focus: IT strategy is to enhance our ability to deliver sustained value by leveraging on the latest digital technology. The focus for 2018 is to transform all front-end and back-end systems in order to position LBF as the most digitally-advanced financial services Company in the country
0
50,000,000
100,000,000
150,000,000
200,000,000
Five-year trend – Investment in IT
Rs.
20182017201620152014
RELATED RISKS Information security risk Opportunities for value creation
» Capitalise on digital technology to deliver first-to-market products and services that secure captive market share
» Use digital technology to create a parallel operating model to serve alongside the conventional brick and mortar branch
RELATED CAPITALS
RELATED GRI INDICATORS 202
PAGE 228
2MATERIAL M AT T E R Technological advancement and increase competition

L B Finance PLC Annual Report 2017/18 137
Why it matters most - Management approach
Maintaining high ethical standards, responsible lending, risk management, and fair treatment to customers in line with legislative changes applicable to the industry to enhance LBF’s reputation in the market.
Sustainability dimension – Economic Key stakeholder – Regulators
MATERIAL DRIVERS – CORPORATE GOVERNANCE AND RISK MANAGEMENT REPORTS
HOW WE RESPOND
9. Evolving regulatory and reporting landscape
10. Responding to industry-related regulations
11. Managing business-related risk
LBF remains proactive in addressing recent regulatory developments in capital adequacy and customer protection, through;
» The issue of a Rs. 3 billion debenture to strengthen Tier II capital and for funding operations
» Steps taken to comply with the Customer Protection Framework 2018/19
» Up to date knowledge with applicable rules and regulations
KPI: LTV ration against leasing business
Target for 2018/19: Strengthening the core business within the tight regulations
Focus: Regularly impact analysis (RIA) to assess negative and positive impact on current and proposed regulations
0
10
20
30
40
50
60
Five-year trend – Leasing portfolio growth (%)
%
20182017201620152014
RELATED RISKS Legal risk, reputational risk Opportunities for value creation
» Early adoption of new regulatory requirements to demonstrate compliance leadership
» Seamless integration of new regulatory requirements into the business framework to minimise customer downtime
RELATED CAPITALS
RELATED GRI INDICATORS 416, 418
PAGE 44
3MATERIAL M AT T E R Demand for governance, regulatory requirements and risk management
MA
NA
GE
ME
NT
DIS
CU
SS
ION
AN
D A
NA
LYS
IS

138 L B Finance PLC Annual Report 2017/18
Why it matters most - Management approach
Be first-to-market in the delivery of ground-breaking new products and services that will secure a competitive advantage. Enhance brand perception by managing customer complaints efficiently and acting responsibly to address the root cause and thereby eliminate the possibility of recurrence.
Sustainability dimension – Social Key stakeholder – Customers
MATERIAL DRIVERS – SOCIAL AND RELATIONSHIP CAPITAL
HOW WE RESPOND
12. Understanding customer needs
13. Positioning the LB brand
14. Product responsibility
15. Innovative products offerings
16. Unmatched service
» Improve digital functionality of the online channels
» Broaden mainstream channel accessibility eg: installation of Cash Deposit Machines at branches
» Simplify customer interactions through proactive customer on-boarding, continuously drive service excellence and deal with customer complaints efficiently
KPI: Customer base
Target for 2018/19: Increase customer base by 14.85%
Focus: Drive organic growth by increasing captive markets share, while pursuing inorganic growth through new customer acquisitions.
100
150
200
Five-year trend – Branch network
No.
20182017201620152014
RELATED RISKS Reputation risk, credit risk
Opportunities for value creation
» Trade off between customer retention marketing vs customer acquisition marketing.
RELATED CAPITALS
RELATED GRI INDICATORS 416, 418
PAGE 264
4MATERIAL M AT T E R Customer understanding, managing competitiveness and market positioning
Our Material Matters

L B Finance PLC Annual Report 2017/18 139
Why it matters most - Management approach
LBF’s Mission and Values guide our broader purpose and the role we play as a corporate citizen. Accordingly, we consider the impact of our operational decisions on society and work to create positive long-term outcomes for all our stakeholders through our everyday actions.
Sustainability dimension – Social and Environment Key stakeholder – Society
MATERIAL DRIVERS – SOCIAL AND RELATIONSHIP CAPITAL AND NATURAL CAPITAL
HOW WE RESPOND
17. Financial inclusion
18. Corporate citizenship
19. Knowledge and beyond
20. Empowering communities
21. Nurture the nature
22. Action taking towards environmental management system
23. Green business practices
» Ensure the way we do business reflects broader societal and environmental considerations
» Trigger broader socio-economic growth through programmes such as LB Dirimaga, that support the development of the country’s SME sector
» Enhance the quality of community education and health through LBF’s CSR fund
» Commitment towards environmental protection and conservation
KPI: Investment in CSR Target for 2018/19: Develop SMEs and budding entrepreneurs, with a special focus on women empowerment
Focus: Bridging the gap between education, health care and financial inclusion through the development, Small and Medium Entrepreneurs. Engaging in collaborative partnerships to invest in community capacity building efforts that would raise the standard of living of low-income and marginalised communities across the country.
The focus for 2018 will be centred on entrepreneur development and women empowerment programmes
5
10
15
20
25
30
Five-year trend – Investment in CSR
Rs.Mn
20182017201620152014
RELATED RISKS Reputation risk
Opportunities for value creation
» Provide financial assistance to promote investment in alternative energy and renewable energy projects in support of the country’s sustainable energy framework
RELATED CAPITALS
RELATED GRI INDICATORS 302, 305, 413
PAGE 264
5MATERIAL M AT T E R Managing social and environmental inequalities
MA
NA
GE
ME
NT
DIS
CU
SS
ION
AN
D A
NA
LYS
IS

140 L B Finance PLC Annual Report 2017/18
Why it matters most - Management approach
We depend on our employees’ skills and expertise to deliver our products and services and meet our strategic objectives. It is therefore critical that we attract and retain an engaged and talented workforce.
Sustainability dimension – Social Key stakeholders – Employees
MATERIAL DRIVERS – HUMAN CAPITAL HOW WE RESPOND
24. Reward high achievers
25. Provide relevant and progressive learning opportunities
26. Promote leaders as a source of value
27. Build a culture of engagement
» Putting our values and behaviours into practice though our training and development programmes
» Recognising and rewarding performance excellence
» Embedding transformation throughout the Company, while ensuring employees stay motivated through appropriate incentive schemes to reward them for the achieving business targets
» Improving employee engagement through LB Night, LB Got Talent, etc.
KPI: Investment on training
Target for 2018/19: Enhance employee soft-skills
Focus: Continue to create the right conditions for all employees remain committed to our goals and values, motivated to contribute to the Company’s success and feel empowered to strive for personal growth. Our focus for 2018 will be to create an environment where employees can fulfil their potential.
2
4
6
8
10
12
Five-year trend – Investment in training
Rs.Mn
20182017201620152014
RELATED RISKS Employee attrition
Opportunities for value creation
» Develop the LBF brand to be known as an employer of choice
» Branch expansion to create new employment opportunities
RELATED CAPITALS
RELATED GRI INDICATORS 401, 404, 405
PAGE 246
6MATERIAL M AT T E R Manage evolving skill requirements of the talent pool
Our Material Matters

L B Finance PLC Annual Report 2017/18 141
Why it matters most - Management approach
The need for a diverse range of distribution channels to reach out to as many customers as possible, with due consideration to customer convenience
Sustainability dimension – Social Key stakeholders – Customer and Society
MATERIAL DRIVERS – MANUFACTURED CAPITAL HOW ARE WE RESPOND
28. Strengthen local footprint
29. Unparalleled distribution
30. Effective communication
» Accelerating revenue growth by establishing new branches and relocations in high growth potential areas
» Communicating consistently across all platforms
» Regional expansion of the business such as starting the Myanmar business operations
KPI: Investment in property, plant and equipment Target for 2018/19: Regional expansion
Focus: The focus for 2018 would be to create an efficient and highly competitive business by investing in smarter business opportunities and better ways of doing business. In this context, we will continue to refine our business expansion approach in looking to establish another micro finance branch in Myanmar that would enable LBF to further expand its outreach.0
500,000,000
1,000,000,000
1,500,000,000
2,000,000,000
Five-year trend – Invest in property plant and equipment
Rs.
20182017201620152014
RELATED RISKS Market riskOpportunities for value creation
» Making inroads into untapped markets in Sri Lanka
» Expanding the micro finance business in the East Asian region
RELATED CAPITALS
RELATED GRI INDICATORS 201, 203
PAGE 238
7MATERIAL M AT T E R Market outreach, presence and accessibility
MA
NA
GE
ME
NT
DIS
CU
SS
ION
AN
D A
NA
LYS
IS
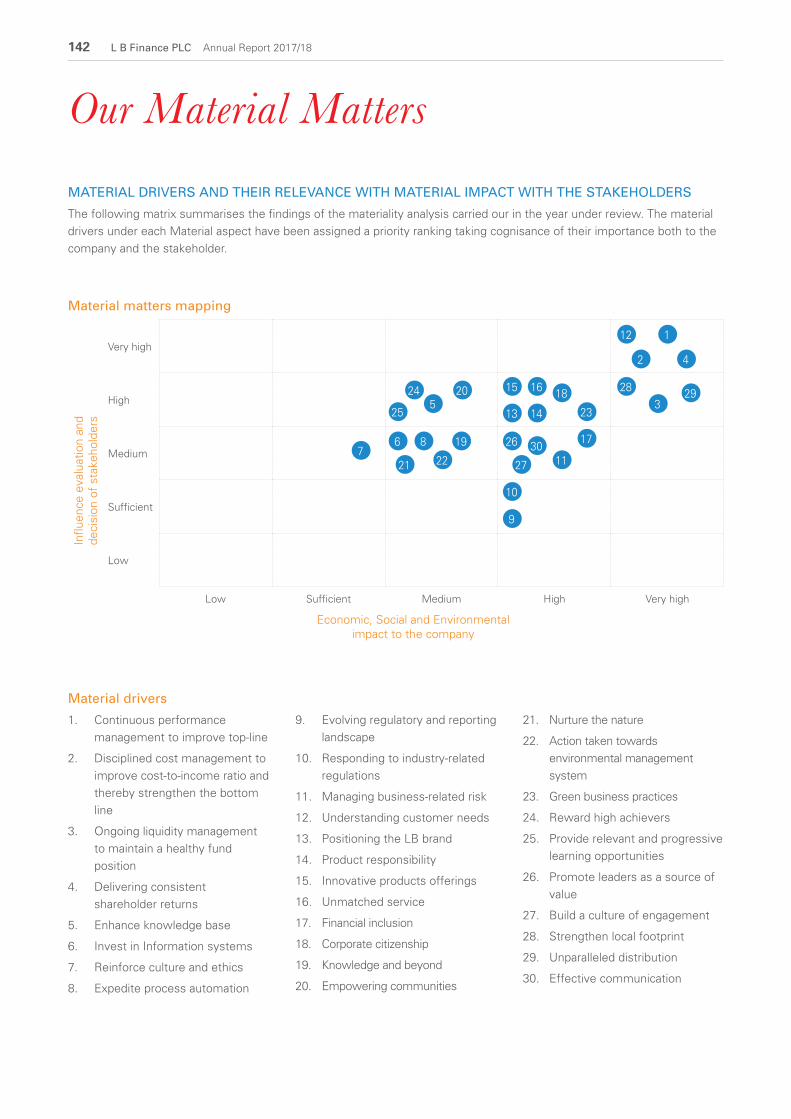
142 L B Finance PLC Annual Report 2017/18
Material matters mapping
Influ
ence
eva
luat
ion
and
de
cisi
on o
f st
akeh
olde
rs
Very high
High
Medium
Sufficient
Low
Low Sufficient Medium High Very high
Economic, Social and Environmental impact to the company
MATERIAL DRIVERS AND THEIR RELEVANCE WITH MATERIAL IMPACT WITH THE STAKEHOLDERS
The following matrix summarises the findings of the materiality analysis carried our in the year under review. The material drivers under each Material aspect have been assigned a priority ranking taking cognisance of their importance both to the company and the stakeholder.
Our Material Matters
Material drivers
1. Continuous performance management to improve top-line
2. Disciplined cost management to improve cost-to-income ratio and thereby strengthen the bottom line
3. Ongoing liquidity management to maintain a healthy fund position
4. Delivering consistent shareholder returns
5. Enhance knowledge base
6. Invest in Information systems
7. Reinforce culture and ethics
8. Expedite process automation
9. Evolving regulatory and reporting landscape
10. Responding to industry-related regulations
11. Managing business-related risk
12. Understanding customer needs
13. Positioning the LB brand
14. Product responsibility
15. Innovative products offerings
16. Unmatched service
17. Financial inclusion
18. Corporate citizenship
19. Knowledge and beyond
20. Empowering communities
21. Nurture the nature
22. Action taken towards environmental management system
23. Green business practices
24. Reward high achievers
25. Provide relevant and progressive learning opportunities
26. Promote leaders as a source of value
27. Build a culture of engagement
28. Strengthen local footprint
29. Unparalleled distribution
30. Effective communication
1
2 4
12
31524
25
67
21 22
8 19
520
13
26
27
10
9
1130
17
16
14
18
23
28 29

L B Finance PLC Annual Report 2017/18 143
Strategic Focus and Resource Allocation In order to create a shared future for our customers, our people and other stakeholders, we have adopted a formal approach that aligns our allocation of capital resources to our strategy.
The decision-making framework at the centre of this approach, which is outlined alongside, guides us to efficiently deploy resources and effectively direct the relationships required to create shared value.
Resources allocation takes place based on short, medium and long term focus areas that become relevant vis-à-vis LBF’s sustainability context.
Econ
omic
aspe
cts
Social aspects
Environmental aspect
Sustainability
Context of the
Business
Sho
rt-T
erm
Stra
tegi
c F
ocus
Medium-Term Strategic Focus
Long-Term Strategic Focus
Strategy identificationRole – Highest management level
Capability designing Role – Senior management level
Action taken Role – Executive level/Operational level
Performance measurement Role – Highest and senior management level
Decide the strategy focus for the period
Decide the importance and validity to the Company
Conducting and implementing the decisions
Performance measuring and corrective action taken
STRATEGIC FOCUS FOR THE YEAR
» Understanding our customer and placing clients at the centre of everything we do
» Managing scarce resources to optimise economic outcomes
» Being operationally excellent and global expansion
» Sustainably growing revenue managing economic headwinds
» Embracing innovation and leveraging our investments in IT
MA
NA
GE
ME
NT
DIS
CU
SS
ION
AN
D A
NA
LYS
IS

144 L B Finance PLC Annual Report 2017/18
We will realign our strategy to adopt customer-focused ways of working, by creating fit-for-purpose distribution channels and accelerating our digital journey to transform into a more agile and responsive financial services organisation.
How does it make us different?
Internally, innovation is increasing the efficiency and cost-effectiveness of our structures, systems and processes, which ultimately benefits our clients.
Performance
Indicator 2016 /17 2017 /18 YOY change Connection to the capital
How it links to value creation
Outlook/ Target
Digitally-active clients
1,024 2,978 Up
Self-service eliminates queuing time for the customer
Continued strong growth
Branch relocation
03 04 Up 10% of total outlets relocated by 2020
Brand ranking -Most Respected Entities
80 33 Up Top 10 brand by 2020
UNDERSTANDING OUR CUSTOMER AND PLACING THEM AT THE CENTRE OF EVERYTHING WE DO
With customer preferences evolving faster than ever before, it is imperative that we take action to deliver innovative first-to-market products that will exceed their expectations every single time. This would require a continuous and ongoing effort to build strong relationships based on mutual trust, which we can then use to understand and anticipate their expectations. We will realign our strategy to adopt customer-focused ways of working, by creating fit-for-purpose distribution channels and accelerating our digital journey to transform into a more agile and responsive financial services organisation.
MANAGING TRENDS - SUSTAINABILITY TRENDS
Trend Our response
» Transformative impact of technology
» Evolving worker and consumer expectations
» Stricter financial regulations
» Cyber security and data privacy
» Demand for high-quality space
» Demanding well-located, modern and efficient facilities
» Strategically capture the market share by providing optimised solutions
» Embrace online financial trends to improve relevance and communication channels under good governance and practices
» Use technology to enhance online experiences for both customers and the employees
» Upgrading, updating and investing in latest technology to face cyber threats
» Increase, relocate and upgrade the branches
Strategic Focus and Resource Allocation

L B Finance PLC Annual Report 2017/18 145
Managing scarce resources to optimise economic outcomes
Our aim is to optimise our ROE by strategically managing our portfolio and coupled with solid capital and liquidity management strategies to optimise financial outcomes. At the same time we will remain proactive in our efforts to identify opportunities and challenges that may impact our business and take necessary action to sustain profitability in the longer-term. In doing so we will look to leverage on the skills and competencies of our employees to optimise productivity in line with the available capacity. We will also look to capitalise on our technology-driven platforms to safeguard our competitive position in the market.
How does it make us different?
Pre-emptive action on our part ensures we are the first to tackle challenges and convert them into opportunities that would strengthen our business model and build resilience for the future. We are thus able to create a scalable platform from which to sustainably grow the business and become agents of change for the national progress.
PerformanceIndicator 2016 /17 2017 /18 YOY change Connection
to the capital
How it links to value creation
Outlook/ Target
Profit per employee
Rs. 1.22 million
Rs. 1.24 million
Up Leverage on the Company’s strong financial position to deliver cost efficiencies within the business
Maintain a strong balance sheet and required capital adequacy to build the resilience needed to withstand negative headwinds
12% increase year-on-year
Net asset value per share
Rs. 90.31 Rs. 110.81 Up 22% increase year-on-year
Dividend per share
Rs. 9.00 Rs. 11 Up Increased by 10%
MARKET FORCES AND COMPETITIVE LANDSCAPE
Customer power – High
Customers typically have a high power of bargaining since big corporates tend to be extremely rate sensitive.
MSME have traditionally been less rate sensitive; however, as they are beginning to enjoy more access to finance and coupled with excess liquidity and frequent price wars, they are becoming more price sensitive. Big ticket customer loans (mainly leasing) customers’ power is at the highest level currently with extreme price competition from industry participants.
Our strategy:
Focus on relationship building among existing client base and channel resources towards finding new opportunities.
MA
NA
GE
ME
NT
DIS
CU
SS
ION
AN
D A
NA
LYS
IS

146 L B Finance PLC Annual Report 2017/18
Being operationally excellent and global expansion
Operational excellence is one of LBF’s core values. It cascades through to all levels of the business and is reflected in everything we do. While we strive to operate in a manner that would meet and exceed the expectations of our stakeholders, we do so by continuously raising the bar by thinking and working differently to realign our operating model in tandem with our dynamic operating environment.
In recent times we have broadened our vision and are now looking to emulate our success on a regional scale through the expansion to Myanmar.
How does it make us different?
The consistent focus on operational excellence has enabled the ongoing reduction of LBF’s cost-to-income ratio. Moreover managed evolution of our strategy has reduced the risk relating to large-scale system implementation and has provided systems stability while enabling better credit evaluation, cost control, recovery and NPL management.
PerformanceIndicator 2016 /17 2017 /18 YOY change Connection
to the capital
How it links to value creation
Outlook/ Target
Expansion of the branch network
08 05 Down
Delivery of the best in-class service for the benefit of more and more customers
Expansion of the branch network to rural areas
Business expansion to regional markets
- 01 Started micro finance business in Myanmar
Start the second branch in Myanmar
Strategic Focus and Resource Allocation
MARKET FORCES AND COMPETITIVE LANDSCAPE
Business partner power – Low
As a financial institution, our major suppliers comprise of support services. These different service providers are elaborated in our business partners (page 276). A key factor in the determination of strategy is that the bargaining power of business partners are low.
Our strategy:
Focus on a diversified pool of support service providers to reduce risk of over-dependency on any specific group of service providers.

L B Finance PLC Annual Report 2017/18 147
Sustainably growing the company business faster than the industryThe key priority is to gain a competitive advantage from changing economic models to grow our transactional financial services through first-to-market products that will strengthen captive market share and facilitate entry to new segments of the market.
Embracing innovation and leveraging our investments in IT
With technology increasingly shaping consumer behaviour, LBF has adopted a broad-ranging IT strategy to underpin its investments to develop infrastructure, people and processes over the long term.
How does it make us different?
We leverage our strong position in wholesale lending to increase opportunities for cross-selling through the adoption of digital strategies to increase the outreach.
PerformanceIndicator 2016 /17 2017 /18 YOY change Connection
to the capital
How it links to value creation
Outlook/ Target
Introduction of CDMs
- 3 Up Providing access to the widest possible range of financial products and services to meet the diverse needs of customers
Increase upto 20 CDMs in 2018/19
Total financial solutions
27 27 - Further introduced innovative financial solutions
How does it make us different?
Ability to provide our customers with the best in-class digital experience by investing in the latest cutting edge systems that enable us to deliver simple, safe, fast and contextual financial services.
PerformanceIndicator 2016 /17 2017 /18 YOY change Connection
to the capital
How it links to value creation
Outlook/ Target
Invest in ICT development
Rs. 79.26 million
Rs. 194.49 million
Up Standardisation of the core financial platform to drive operational efficiencies at branch level, which would contribute towards enhancing the overall customer experience
Implementation oracle system for the core financial functions
MA
NA
GE
ME
NT
DIS
CU
SS
ION
AN
D A
NA
LYS
IS

148 L B Finance PLC Annual Report 2017/18
FOCUS OUR STAKEHOLDERS’ EXPECTATIONS
Our integrated planning takes into account who we are, our capabilities, our strategic ambitions and our operating environment.
Sustainability Context Leading the way as a responsible corporate citizen, LBF has embraced sustainability as a high priority item in its corporate agenda. Having understood the importance of being sustainable in all aspects of our operations, values of sustainability
are embedded in our strategy, product development process as well as across operations at all levels. We drive our sustainability values with commitment and dedication, and necessary board oversight to focus on creating value for stakeholders.
It is our firm belief that a sustainable business model is the key to ensure that the Company and its stakeholders continue to grow and thrive in the long-term.
INTEGRATED PLANNING TO CREATE SUSTAINABLE VALUE
1IDENTIFICATION LEVEL
CUSTOMERS SHAREHOLDERS EMPLOYEES
BUSINESS PARTNERS
REGULATORS SOCIETY/COMMUNITY
PAGE 247
PAGE 202 PAGE 44 PAGE 264
PAGE 218 PAGE 246
MARKET FORCES AND COMPETITIVE LANDSCAPE
Threat of new entrants – High
Finance industry is crowded with 32 banks and 46 NBFIs. The possibility of new entrants, intensifying competition further, cannot be ruled out.
Threat of new entrants is also largely dependent on decisions made by various wings of the government, be it in terms of granting new licenses or varying the scope of services provide and/or operating procedures of financial and non-financial institutions.
Our strategy:
Ensure product differentiation and brand awareness, while keeping rates competitive. Continue efforts in process improvement to ensure long run competitiveness through balancing between cost minimisation and service flexibility.

L B Finance PLC Annual Report 2017/18 149
2PLANNING LEVEL
DIRECTION COMING FROM MECHANISM COMING FROM
Our Purpose, our Goal, and our Values Our current strategy and business model
ECONOMIC
SOCIAL ENVIRONMENT
Potential market opportunities managing the risk appetite
Resource needs and its availability
Regulation driven
requirements
Current and anticipated
economic and socio political conditions
Stakeholders perception and
expectation
Company and its rivals
MARKET FORCES AND COMPETITIVE LANDSCAPE
Threat of substitute products Competitive rivalry – Moderate
Low threat within the NBFI Industry. However, if we consider loan and leasing products from banks and the leasing companies as substitute products, then the threat is high.
Additionally, for some segments, there exists a high threat of substitute products; for instance for vehicle loans where some of the vehicle suppliers themselves offer the vehicles in installments, removing the need to get a financier involved. There is a material threat in the medium- and long-run, with the potential for innovating alternative ways of creating value in meeting lending needs of businesses and individuals.
Our strategy:
Stay updated with industry best practices and new opportunities offered through technology and incentives.
MA
NA
GE
ME
NT
DIS
CU
SS
ION
AN
D A
NA
LYS
IS

150 L B Finance PLC Annual Report 2017/18
3MANAGING LEVEL
WE WILL CONTINUE TO DELIVER STRATEGIC FOCUS ACCORDING TO OUR VISION
WE HAVE SHAPED OUR BUSINESS ACCORDING TO OUR MISSION
Our strategy targets key areas for growth, and maintain sound controls combined with proactive risk management to deliver appropriate value for our stakeholders.
Our business model continues to evolve in tandem with the immediate operating environment and in response to customer demands, enabling the creation of a scalable platform for consistent growth.
4EXECUTION LEVEL
SHARED GROWTH IS OUR WAY OF DOING THINGS AND IT DEFINES WHO WE ARE
We have a responsibility to leave things in a better position than we found them, and our Shared Growth initiatives will accelerate over the coming years.
5LINKING LEVEL
LINKING THE SUSTAINABILITY FRAMEWORK TO CREATE VALUE FOR STAKEHOLDERS
Our key priority is to manage the business in a manner consistent with LBF’s strategic objective to create value for the stakeholders vis-à-vis the material matters that are relevant in short, medium and long term.
Time line Within a year - Short term, One year to three years - Medium term, Three to five years - Long term.
Sustainability Context
MARKET FORCES AND COMPETITIVE LANDSCAPE
Competitive rivalry – High
Number of competitors: the Sri Lankan financial services industry is marked by high levels of competition with 32 banks and 46 NBFIs operating in the space.
Switching cost: The switching cost is low due to a high concentration of service providers.
Customer loyalty: Traditionally, customers are reasonably loyal; however, the recent phenomenon of liquidity and rate concentration has reduced loyalty to a great deal, especially across big ticket loans for all segments.
Our strategy:
Improve product matrix, customer service and process efficiency to attract and retain customers. Explore new ways of delivering value and innovative means of utilising existing resources to extend our range of offerings.

L B Finance PLC Annual Report 2017/18 151
Long-term goals focus connection with universal practices
LBF has always followed universally- accepted guidelines. Analysing the emerging concepts of the global context, we develop our sustainability efforts in alignment with the Sustainable Development Goals (SDGs) put forward by the United Nations (UN), which was implemented as of January 2016. The SDGs are a call to action to end poverty, protect the planet and ensure that all people enjoy peace and prosperity. In order to support this sustainability agenda, we have taken steps to pivot our sustainability platform to address these SDGs and
integrated into the business model. Our track record of working towards multiple goals provides us with a valuable experience and proven policy expertise to ensure LBF makes a meaningful contribution towards the 2030 SDG targets.
Our focus 2030 strategy is designed to ensure that, over time, we use our financial expertise to contribute positively towards meeting the future growth and development needs of individuals, businesses and society. Going forward we will use the SDGs as the guiding framework for long term action, as depicted in the figure below:
Focus to achieve
Business Excellence Operation ExcellenceBusiness Collaboration & Partnership
Action taken for
Directions from company vision and mission
SUSTAINABILITY PHILOSOPHY
Aim for greater business success over the long term by working to integrate socioeconomic issues and the impact of climate change into the day-to-day operational format.
LONG TIME VISION FOR 2030
MA
NA
GE
ME
NT
DIS
CU
SS
ION
AN
D A
NA
LYS
IS

152 L B Finance PLC Annual Report 2017/18
Sustainability Context
FOCUS POTENTIAL IMPACT STRATEGIC DIRECTION
Economy
Macroeconomic factors impact our ability to sustain business and achieve market commitments
» Reduced revenue
» Increased impairments
Continue to respond to changes in leading indicators with definitive steps to mitigate risks and unlock opportunities
Social
Strategic changes impact our ability to execute our plans that support market commitments and community investments
» Delayed completion of projects
» Increased expenditure
Established a dedicated and integrated capability to address business-as-usual, transition and transformation change requirements
Biosphere
Technology impacting competitiveness and natural resource consumption
» Operational disruptions
» Operational losses
» Reputational damage
Maintain the coordinated, comprehensive and timely approach to identify, assess and respond to regulatory changes
Short-term aspirations
Within the year
Medium- to long- term aspirations2 - 5 years
Long-term aspirations
Over 5 years
MANAGING TRADEOFF, POSITIVE AND NEGATIVE OUTCOMES
Value creation
Balancing short-term performance expectations and long-term expectationsWe need to make decisions today that will often only bear fruit in the future. Our single most significant trade-off is managing a long-term strategy against short-term stakeholder performance expectations. At times, to ensure sustained value creation, we need to make decisions that are right for our lending portfolio in the long-term, but may have negative short-term consequences.
From a business perspective reactionary short-term lending facilities can either positively or negatively impact our bottom-line depending on the movement in interest rates, but, if not undertaken, can have a negative impact on the demand for our products in the medium- to long-term. Long-term lending on the other hand offers a consistent outcome for both the Company and the customer.
Green lending supports the preservation of natural capital and Micro lending contributes towards social upliftment of communities, in turn enabling sustained value creation for LBF in the long-term.
Investment Decisions
Where we allocate our money Our ability to raise financial capital is critical to our business and determines our ability to expand our asset base. However, we don’t have an unlimited supply of funding, forcing us to make difficult choices about where and how to invest.
This year we invested in expanding our business internationally (Myanmar). The investment proposition offers secure income returns and more favourable funding costs.
Reduction of expenses
Managing optional spend to ensure its effortIn challenging times, it can be easy to aggressively cut discretionary spend, bolstering profits in the short-term, with potential negative long-term consequences
Reducing our investment in our staff training, advertising and marketing may increase short-term profitability, but adversely impacts our employees’ productivity, contribution and engagement, as well as our brand reputation. To manage this, we continually review our expenses to optimize outcomes from a targeted investment; thereby ensuring our stakeholders and our business receive the maximum benefit from this investment.

L B Finance PLC Annual Report 2017/18 153
Corporate Social Responsibility ReviewOur business strategies are based on the fundamental conviction to build a sustainable business that integrates good governance, environmental issues and social concerns to create maximum value for our stakeholders. Translating this belief, our CSR (Corporate Social Responsibility) and sustainability model is pivoted on the 3P approach – People, Planet and Profit:
» People, our stakeholders with whom we engage for our business, and the community where we live in;
» Planet, our surrounding environment and
» Profit, our profit-generating capacity for long-term sustenance.
0
5,000
10,000
15,000
20,000
25,000
0
2,000
4,000
6,000
8,000
10,000
CSR EXPENDITURE VSVOLUNTEER HOURS
Rs.’000 Hours
20182017201620152014Volunteer hoursCSR expenditure
0
10
20
30
40
50
60
70
0
100
200
300
400
500
600
700
CSR PROJECTS VS EMPLOYEEENGAGEMENT
No. ofProjects Employees
20182017201620152014Employee EngagementCSR Projects
80%
20%
School leavers Others
OUR RECRUITMENT -BRIGHTER FUTURE FORSCHOOL LEAVERS
CSR COMPLIANCE
We always conduct our CSR practices in ethical way. Our aim to generate positive impacts and developing their livelihood in efficient way. We comply with the all social and environment rules and regulation of the country. In the reporting year, we are unable to find or none of negative impacts or grievances reported on the social and environmental aspects from the community.
In line with the Company’s environmental conservation agenda, L B Finance initiated and carried out a series of environmental campaigns
L B Finance has continued to remain a pioneer in addressing the socio-economic needs of Sri Lanka
Micro-, Small- and Medium- scale entrepreneurs are an emerging force of the Sri Lankan economy
The Company’s CSR model places a strong emphasis on education for the development of Sri Lanka
Environmental-friendly CSR - PAGE 303 Community-based CSR - PAGE 283 Developing MSME-based CSR - PAGE 281 Educational-based CSR - PAGE 285
MA
NA
GE
ME
NT
DIS
CU
SS
ION
AN
D A
NA
LYS
IS

154 L B Finance PLC Annual Report 2017/18
Operating EnvironmentGLOBAL ECONOMY
Economic Activity
The global economy continued to gain momentum in 2017 with a substantial majority of the world’s economies registering a pickup in growth. Two-thirds of the world economies – emerging aned developing as well as advanced economies registered higher growth rates in 2017, compared to 2016.
In the US growth picked up in 2017 supported by strengthening private investment, while growth in the EU region gained substantial momentum, reaching an estimated 2.4% in 2017, 0.7% higher than previously expected being the result of broad-based improvements across member countries.
Growth in the East Asian region is estimated to have reached 6.4% in 2017, amidst the expansion of global trade and a recovery in commodity prices. The region continues to be a major driver of global growth, accounting for more than a third in 2017, mostly due to China’s significant contribution. Growth in Myanmar also rebounded in 2017 notwithstanding policy uncertainty.
Growth in South Asia, while slowing down still remained at a robust 6.5% for 2017, marginally below the June 2017 forecast. The drop was mainly on account of the temporary disruptions from adverse weather conditions across the region.
Global Trade
Global trade recovered strongly and recorded substantially higher levels in 2017 compared to the past two years, notwithstanding moves by the US and China to impose retaliatory trade restrictions on each other.
Crude Oil Prices
During the year, oil prices escalated, particularly in the latter part of 2017 being the result of the strengthening global growth momentum, supply side disruptions in the US, geopolitical tensions in the Middle East and a unanimous decision by OPEC (Organization of the Petroleum Exporting Countries) to continue to curb oil production.
Gold Prices
Gold Bullion prices rose for a second year running in 2017, ending December at the highest annual close in US Dollar terms since the peak five years ago, prompting investors to continue to add gold to their portfolios.
SRI LANKAN ECONOMY
Economic Activity
With adverse weather conditions and their spillover effects continuing to affect broad-based economic activity, Sri Lanka tabled a disappointing economic performance with GDP growing by only 3.2%, short of projections and below 4.5% reported in 2016.
Among the sectors of the economy, agriculture related activities contracted against the backdrop of adverse weather conditions that continued from 2016, although estimates for quarter 4, 2017 appear to indicate a slight recovery in the sector.
0
1
2
3
4
5
6
GROWTH INGDP
%
20182017201620152014GDP
A slowdown in economic activity in both services and industrial sectors was also seen. Growth in industry related activities was the slowest in two years, reaching only 3.9% in 2017 amidst a notable deceleration

L B Finance PLC Annual Report 2017/18 155
in construction activities, which has been mainstay of the economy throughout the post-conflict period. The growth rate of services related activities, which accounts for over 56% of real GDP, also moderated during 2017. Consequently growth in the service sector, which stood 4.7% in 2016, decelerated to 3.2% in 2017.
External Sector Developments
Sri Lanka’s external sector improved gradually in 2017, as export earnings recorded a notable double digit growth in 2017, partly supported by the reinstatement of the EU’s GSP+ facility (European Union’s Generalised System of Preferences plus). Strong external demand especially for tea, increased commodity prices in the international market, conducive
external trade policies together with strong institutional support and the favourable impact of the flexible exchange rate policy maintained by the Central Bank were among the other factors that contributed towards the improvement in export earnings.
However, higher than expected expenditure on imports, particularly on fuel and rice imports, aimed at managing the impact of disruptive weather conditions, caused a widening of the trade deficit.
The trade deficit expanded to US dollars 9,619 million in 2017, compared to US dollars 8,873 million recorded in 2016. As a percentage of GDP, the trade deficit was at 11%
in 2017, marginally above the 10.9% recorded in the previous year
Exchange Rate
The Rupee remained broadly stable, depreciating by 2.% against the US dollar in 2017, supported by the market-based exchange rate policy implemented by the Central Bank during the year. The depreciation pressure on the rupee further eased from May onwards with the receipt of the proceeds from the International Sovereign Bonds, the foreign currency term financing facility and disbursements of two tranches of the International Monetary Fund-Exchange Fund Facility programme, which also helped improve investor confidence.
120
130
140
150
160
EXCHANGE RATE MOVEMENT - US DOLLAR
Rs.
Mar-
13
Jun-1
3Ju Sep
-13
Oct-1
3No
v-13
Dec-1
3Ja
n-14
Feb-1
4M
ar-14
Apr-1
4M
ay-14
Jun-1
4Ju
l-14
Aug-1
4Sep
-14
Oct-1
4No
v-14
Dec-1
4Ja
n-15
Feb-1
5M
ar-15
Apr-1
5M
ay-15
Jun-1
5Ju
l-15
Aug-1
5Sep
-15
Oct-1
5No
v-15
Dec-1
5Ja
n-16
Feb-1
6M
ar-16
Apr-1
6M
ay-16
Jun-1
6Ju
l-16
Aug-1
6Sep
-16
Oct-1
6No
v-16
Dec-1
6Ja
n-17
Feb-1
7M
ar-17
Apr-1
7M
ay-17
Jun-1
7Ju
l-17
Aug-1
7Sep
-17
Oct-1
7No
v-17
Dec-1
7Ja
n-18
Feb-1
8M
ar-18
Inflation
Headline inflation remained broadly above the target during 2017, as the CBSL’s tight monetary policy failed to control the sharp acceleration in food inflation caused by weather related supply disruptions. Revisions to Value Added Tax (VAT) and Nation Building Tax (NBT), and higher commodity prices in the global market also contributed to high levels of inflation.
2
4
6
8
10
INFLATION: CCPI AND NCPI YOY PERCENTAGE CHANGE
%
Apr-1
7
May-
17
Jun-1
7
Jul-1
7
Aug-1
7
Sep-17
Oct-1
7
Nov-1
7
Dec-1
7
Jan-18
Feb-18
Mar-
18
CCPI NCPI
MA
NA
GE
ME
NT
DIS
CU
SS
ION
AN
D A
NA
LYS
IS

156 L B Finance PLC Annual Report 2017/18
Interest Rates
The CBSL continued to maintain its tight monetary policy stance in 2017 in an attempt to curtail the possible acceleration of demand driven inflationary pressures due to excessive monetary and credit expansion.
Following the increase in inflation during early 2017, the CBSL raised policy interest rates with the Standing Deposit Facility Rate (SDFR) and the Standing Lending Facility Rate (SLFR) being increased by 25 basis points in March 2017 to 7.25% and 8.75%.
Deposit and lending interest rates of commercial banks continued to increase during most of 2017 raising the cost of funds in the economy. However, some moderation in deposit rates was observed towards the end of the year, while lending rates stabilised at elevated levels.
Source: CBSL
FINANCIAL SECTOR OVERVIEW
The financial sector showed improved performance as the supportive prudential measures continued to preserve stability of the financial system in 2017. The improved performance of the financial sector was broad-based and mainly contributed by the banks, other deposit taking financial institutions and contractual savings institutions.
The regulatory framework governing the financial system was further strengthened during the year with the CBSL introducing prudential measures with a view to enhancing the safety and resilience of the financial sector in Sri Lanka. Macro-prudential measures were
mainly focused on enhancing transparency, capital requirements, access to finance, liquidity and risk management frameworks.
NBFI SECTOR DEVELOPMENTS
Overview
The NBFI sector consists of Licensed Finance Company (LFC) and Specialised Leasing Companies (SLC). The sector performance moderated during the year with low credit growth, declining profitability and increase in non-performing loans, but nonetheless remained well capitalised and with adequate liquidity buffers to remain above the regulatory minimum levels.
The sector’s funding mix changed somewhat during the year, with asset growth mainly funded through deposits, and sector-wide borrowings declining compared to the previous year.
Further, the CBSL continued to take prudential measures to maintain the stability of the sector with much consideration on reviving the companies with weak financial positions.
Credit Growth
In 2017, the sector witnessed slower credit growth when compared to 2016, which can be attributed mainly to fiscal and macro-prudential policy measures taken to curtail the importation of motor vehicles and lending towards vehicles. Moderate economic growth and high interest rates were some of the other factors that had a bearing on the appetite for credit.
Assets
Affected by slow credit growth, the total asset base of the sector grew moderately by Rs. 143 billion during the year reaching Rs. 1,355 billion by end 2017, denoting year-on-year growth of 11.8% compared to 21.7% reported in 2016.
0
300
600
900
1,200
1,500
ASSETS OF THE NBFI SECTOR
Rs.Bn
20182017201620152014
Loans and advances accounted for 78% of total assets, with finance leases taking up nearly 50% of the loans and advances portfolio.
0
100
200
300
400
500
600
PRODUCT WISE LOANS AND ADVANCES IN NBFI SECTOR
Rs.Bn
2016 2017
Fina
nce l
easin
g
Hire
pur
chas
e
Secu
red lo
ans a
nd a
dvan
ces
Gold
back
ed lo
ans
Othe
rs
Loan
s aga
inst
real e
state
Loan
s aga
inst
depo
sits
Operating Environment

L B Finance PLC Annual Report 2017/18 157
Funding
Customer deposits accounted for the major portion of liabilities in 2017, indicating a shift in the funding mix compared to the previous year, which saw sector borrowings declining year-on-year. In tandem, total deposits grew by 29.4% year-on-year in 2017, compared to the growth of 10.4% in 2016, while borrowings showed a negative growth of 9.7% in contrast to the robust 39.6% reported in the previous year.
0
20
40
60
80
100
NBFI SECTOR FUNDING COMPOSITION
Rs.Bn
20182017201620152014
Deposits CapitalBorrowings Other
Asset Quality
Asset quality deteriorated in 2017 as NPLs increased, on the back of weak economic conditions and severe adverse weather brought pressure on all key sectors of the economy. Consequently, the sector-wide NPL ratio increased to 5.9% in 2017 from 5.3% in 2016
Profitability
Stressed by increased funding cost and higher loan loss provisions, the sector reported profit after tax of Rs. 25.8 billion, an 18% decline compared to the profit of Rs. 31.5 billion recorded in 2016.
0
5
10
15
20
25
PROFITABILITY INDICATORS NBFI SECTOR
%
20182017201620152014Net interest marginROAROE
Capital Position
The sector remained well capitalised, with capital adequacy ratios showing an increasing trend. Well above the minimum threshold level, the sector’s core capital and total capital ratios increased to 12.4% and 13.1%, respectively in 2017, from 11.3 % and 11.7 % recorded in 2016.
Regulatory Developments
Several prudential policy measures were introduced by the CBSL, aimed at strengthening the supervisory and regulatory framework of NBFI sector with the ultimate aim of enhancing the stability and soundness of the sector and building customer confidence in the sector.
The key development was the new direction issued to revise the LTV ratio for credit facilities in line with the National Budget proposal for year 2017.
New regulations to increase the minimum core capital requirement for LFCs, was also introduced in order to strengthen the capital position of the sector and augment the sector capacity to absorb unexpected internal and external shocks. The adoption process was staggered with LFCs requested to increase minimum core capital from Rs. 400 million to Rs. 1.0 billion by 01 January 2018, to Rs. 1.5 billion by 01 January 2019, Rs. 2.0 billion by 01 January 2020 and Rs. 2.5 billion by 01 January 2021. The changes are also aimed at implementing the BASEL compliance framework for LFCs.
Source: CBSL
MA
NA
GE
ME
NT
DIS
CU
SS
ION
AN
D A
NA
LYS
IS

158 L B Finance PLC Annual Report 2017/18
PESTEL (Political, Economic, Social, Technological, Environmental, Legal) Analysis
Impact to the sector Risks / Opportunities to the Company
Political Relaxing of LTV restrictions for hybrid, electric and commercial vehicles
Favourable impact on the leasing portfolio and demand for hybrid leasing facilities increased during the year
Opportunities to tap into new market segments
New regulations to increase core capital requirements of LFCs
Positive impact on the overall stability and credibility of the sector, with the weaker financial institutions that lack the capacity being rationalised or phased out
LBF remains well capitalised and has continued to maintain CAR above the stipulated minimum.
Financial Customer Protection Framework (to be implemented in 2018)
Enhances the integrity of the NBFI sector and builds consumer confidence and trust in NBFI markets
Upgrade IT systems and networks to maintain customer privacy and data security in order to improve transparency on par with the banking sector
Economic Interest rate volatility Causes uncertainty and diminished confidence in the financial system
Frequent changes in interest rates destabilise the Company’s deposit mobilisation strategies, bringing pressure on margins
Weak growth in key sectors of the economy
Loss of market share Restricted opportunities for lending leading to limited business growth and higher NPLs
Social Growing demand for more flexible and convenient financial solutions
Raises the overall standard of the industry on par with global benchmarks
Opportunity to be the first-to-market with innovative, tailor-made financial products and services
Technological Increasing trend towards digital technology and smart devices
Raises industry standards on par with global benchmarks
Opportunity for early adoption of technology that would strengthen brand position and provide a competitive edge
Environmental Growing importance of climate change on business
Minimal impact on the business Opportunity to increase the exposure to green projects
Legal New Exchange Control Regulations permitting Sri Lankan companies, partnerships and individuals (Resident Persons) to invest in shares, units, debt securities and sovereign bonds outside Sri Lanka subject to certain limits. (upto USD 2,000,000 for listed companies)
Well managed the rules and regulations are imposed by the governing entities. During the year there were no verbal or written incidents on violating the rules and regulations
Opportunity to invest to set up a micro finance operation in Myanmar
Operating Environment

L B Finance PLC Annual Report 2017/18 159
Business Review
INVESTING
OUR STRATEGY Our journey to reorientate the business to centre on our customers, while at the same time meeting the expectations of our other stakeholders, is well underway. We seek to achieve continuous improvement in the execution of our strategy, will set us apart from our competitors.
MANAGEMENT APPROACHWe focused on educating our customers to choose institutions with financial strength and stability. This was the selling proposition to increase our deposit base at a lower cost. Deposit products form the primary funding source of our Company. Fixed deposits and savings deposits constitute our deposit base. Mobilising and maintaining a healthy deposit base is critical for further expansion and growth. The strength of our brand and market confidence has enabled us to achieve one of the largest deposit bases among LFCs in Sri Lanka. Our diversified branch network and strong corporate image are key drivers of customer confidence in our Company. In addition to that a strategic decision was taken by us to change the deposit mix from fixed deposits to promote the savings base.
KEY FOCUS AREAS OF THE RESEARCH
What is the uniqueness you have seen in L B Finance?
Analysis of the key points that are unique to LBF
0
20
40
60
80
100
120
Excellentcustomerreviews
Efficient processing
Friendly service
Feel good
No idea
23%
27%14%
14%
23%
Research by University of Kelaniya
OUR PRODUCT OFFERINGSM
AN
AG
EM
EN
T D
ISC
US
SIO
N A
ND
AN
ALY
SIS

160 L B Finance PLC Annual Report 2017/18
Performance for the year
Fixed Deposits
Leveraging on its reputation, LBF has become the second largest fixed deposit base in the non-banking financial sector in the country.
In the 2017/18 financial year, the Company’s total deposit customer base grew by 18.25% to reach 296,377 customers as at 31st March 2018. In the year under review, the FD customer base reported a growth of 10.03% year-on-year, while renewal ratio remained well above at 75% throughout the year. The results for the year can be mainly attributed to a two-pronged approach to grow volumes, alongside efforts to retain existing customers.
In pursuing a volume-driven strategy, the main thrust for the year was centred on mobilising retail deposits, mainly FDs with a medium- to longer-tenure (six and 15 months). The move also serves as a risk rebalancing exercise to improve the fluidity of the deposit mix by gradually reducing the concentration on shorter-term (three month) FDs.
TENURE WISE FIXED DEPOSITMIX 2017/18
10%4%
3%5% 5%
14%
18%
3%16%
10%
12%
1 Month3 Months6 Months12 Months13 Months15 Months
18 Months24 Months36 Months48 Months60 Months
Our journey to re-orientate the business to centre on our clients, while at the same time meeting the expectations of our other stakeholders, is well underway. We seek to achieve continuous improvement in the execution of our strategy, understanding that it is not our intent but how we execute will set us apart from our competitors.
DEPOSITS
LBF’s deposit proposition offers investment solutions to individuals and corporate customers; ranging from customised fixed deposits (FDs) with varying tenures to savings products starting from birth through every stage of life. LBF has over the past four decades built a loyal customer base, many of whom have grown with the Company. The Company’s market share of 10% continues to grow amidst the ongoing commitment to attract more new customers across Sri Lanka.
DEPOSIT MIX 2017/18
4%
96%
FDSavings
AMOUNT WISE FIXED DEPOSIT MIX 2017/18
13%1%
16%
42%
28%
Rs. 5,000 - 100,000 Rs. 100,001 - 500,000 Rs. 500,001 - 1,000,000 Rs. 1,000,001 - 5,000,000 Above Rs. 5,000,000
A special mass media promotional campaign was rolled out from September 2016 to June 2017 to promote six and 15 month FDs. This was supported by a number of internal campaigns to motivate the branch sales force towards driving volumes by reaching out to untapped customer segments particularly in regions outside the Western Province. The momentum created by these campaigns generated good results throughout the remainder of the year as well, with total FD volumes for 2017/18 growing significantly by 20.73% to Rs. 69.88 billion from Rs. 57.88 billion reported in the previous financial year.
The approach on customer retention was another key priority, prompting extensive training to enhance the capacity of the sales force in areas such as product knowledge, customer service, rate management, etc. In addition, branches were appointed to regularly reach out to past customers who have left LB, and continue to build rapport to encourage them to renew ties with the Company.
Business Review

L B Finance PLC Annual Report 2017/18 161
60
80
100
FD RENEWALRATIO
%
Apr-1
7M
ay-1
7Ju
n-17
Jul-1
7Au
g-17
Sep-1
7Oc
t-17
Nov-1
7De
c-17
Jan-1
8Fe
b-18
Mar-
18
Meanwhile, the escalation in the cost of funds caused by the rapid growth in the portfolio was a cause for concern, leading to a review of the Company’s margin management methods. Consequently, a series of yield management strategies were
LBF’s savings base grew to Rs. 2.95 billion in 2017/18, up by a commendable 25.24% from the Rs. 2.35 billion reported at the end of the previous year.
SAVINGS DEPOSITS
A strategic decision was taken to increase the share of savings base. Efforts in this regard were focused offering multiple benefits to promote the savings option as an effective investment tool. As reflected by LBF’s tag line, the Company looked to promote the savings account proposition as a secure way to build a savings fund with a range of added benefits. Consequently, the kid’s savings product was redesigned and re-launched to the market in March 2018 with a new look and feel including a greatly enhanced reward programme to encourage children to aim for savings milestones.
Led by a series of highly-focused promotional campaigns along with technology-enabled service enhancements to facilitate greater customer convenience, LBF’s savings base grew to Rs. 2.95 billion in 2017/18, up by a commendable 25.24% from the Rs. 2.35 billion reported at the end of the previous year.
rolled out in the second half of the year mainly to curb the volume of low-yielding (high-cost) deposits through better management of the AER (annual effective rate) for each individual deposit. Accordingly, branches were assigned strict parameters to ensure they maintain AER within stipulated limits. This was coupled with target–driven KPI’s to motivate branches to focus on mobilising low-cost deposits. By reducing the interest cost on the current deposit base, LBF was able to cut interest costs of FDs compared to the previous year.
0
10,000
20,000
30,000
40,000
50,000
60,000
PROVINCE WISE FIXED DEPOSIT BASE
Rs.Mn
2017/18 2016/17
North
West
ern
North
ern
North
Cen
tral
Easte
rn
Centr
al
Uva
Saba
ragam
uwa
South
ern
West
ern
MA
NA
GE
ME
NT
DIS
CU
SS
ION
AN
D A
NA
LYS
IS

162 L B Finance PLC Annual Report 2017/18
0
1,000
2,000
3,000
4,000
5,000
6,000
7,000
8,000
ATM CARDS ISSUED
No.
20182017201620152014
In the 2017/18 financial year, the Company’s total deposit customer base grew by 18.25% to reach 296,377 customers as at 31st March 2018.
0
500
1,000
1,500
2,000
0
50,000
100,000
150,000
200,000
ATM TRANSACTIONS
Rs.Mn No.
20182017201620152014
Total valueNumber of transactions
Future goals and targets
» Fixed deposit and savings base growth of 25% and 30% respectively for 2018/19
» Conducting promotional campaigns at school-level
» Introduction of special gift schemes for kids and newborns savings accounts
» Develop and operationalise a daily savings collection model to tap into the daily savings of SMEs
0
5
10
15
20
25
30
35
40
0
500
1,000
1,500
2,000
2,500
3,000
E-CONNECT TRANSACTIONS
Rs.Mn No.
20182017
Value of transactionsNumber of Registered UsersNumber of transactions
Business Review

L B Finance PLC Annual Report 2017/18 163
FINANCING
OUR STRATEGY LBF’s financing strategy is aligned to the Company strategy. The consistent execution of our strategy is moving us closer to our long-term, medium-term and short-term aspiration to be the leading lending solution provider in Sri Lanka. We always focus our strategy to enhance lending portfolio targeting both personal and business segments. Our combined operations are delivering profits, and we believe that our focus on the larger high-growth markets and high-growth segments will continue to drive good revenue generation across our portfolio.
MANAGEMENT APPROACHOur lending expansion strategy was focused on increasing volumes while ensuring the quality of the portfolio through a risk-based pricing mechanism based on the credit-worthiness of customers. The lending strategy went beyond income generation for our Company to be an engine for developing and creating wealth for individuals and uplift the community. Several promotional campaigns were launched to promote our lending products and attract new customers. For the benefit of our lending customers we entered into strategic partnerships with motor vehicle agents and dealers as well. Internal structural changes were effected to offer an enhanced customer service by geographically segmenting our sales team and appointing new area managers. We have made our ‘responsible lending’ policy a cornerstone of our corporate strategy to support sustainable growth. Responsible lending practices are applied at each stage of the customer relationship, from making a loan offer to setting up and monitoring the loan. These practices are built on customer needs and customer satisfaction, which are measured regularly. Several training programs were conducted to hone the marketing skills of our marketing staff. This has helped us to reduce the lead times and improve customer service.
MA
NA
GE
ME
NT
DIS
CU
SS
ION
AN
D A
NA
LYS
IS

164 L B Finance PLC Annual Report 2017/18
LEASING AND AUTO FINANCE
Widely-renowned for its unmatched flexibility and competitive pricing terms LBF’s customised leasing and auto finance solutions have been serving the needs of customers across the country for over four decades now. Over the years, LBF’s leasing model has evolved in response to the demands of the market and is now predominantly focused on offering vehicle-leasing
OUR PRODUCT OFFERINGS
solutions. Working closely with all major vehicle dealers in the country, LBF’s vehicle-leasing solutions enable customers to benefit from the best possible deals for registered and unregistered vehicles. Today, ranked among the top leasing specialists in the country, LBF lays claim to approximately 8% share of Sri Lanka’s vehicle leasing market.
Performance for the year
A challenging year for the vehicle leasing business brought on by a series of regulatory changes in the immediate operating environment. Key among them, the Monetary Board decision to tighten the loan-to-value (LTV) ratio on unregistered three-wheelers, motorcars and vans with effect from 01 January 2017, aimed at restricting the allowable lease value. The immediate drop
Widely renowned for its unmatched flexibility and competitive pricing terms LBF’s customized leasing and auto finance solutions have been serving the needs of customers across the country for over four decades now.
Loan value during last 5 years (Rs.'000)
2017/18 2016/17 2015/16 2014/15 2013/14
Lease and auto finance 62,489,979 55,660,781 45,104,146 33,694,228 30,299,456
Gold loan 20,108,243 16,267,505 13,136,351 10,380,704 8,007,047
Mortgage loan 6,962,770 6,189,501 3,711,837 2,240,428 1,191,646
Vehicle loan 4,054,552 4,184,086 5,099,563 7,195,496 7,304,695
Power draft 2,658,607 2,117,675 1,455,258 563,910 341,405
FD loan 2,579,869 1,911,853 1,389,833 1,060,988 1,071,293
Power plus 992,195 1,576,682 696,623 31,065 -
Factoring 481,868 336,971 454,203 447,376 881,939
Margin trading 20,963 31,934 17,800 2,873 18,457
Daily loan 190,423 145,382 140,501 40,872 11,926
Other 1,805,617 727,372 347,890 300,338 64,830
Business Review

L B Finance PLC Annual Report 2017/18 165
in demand for unregistered vehicle leases following this new LTV ruling had a cascading impact on the vehicle leasing industry, causing the demand for vehicle leases to plummet. This was further exacerbated by the sharp increase in prices following the November 2016 budget decision to increase import duties on luxury vehicles, passenger cars and three-wheelers. Moreover, the higher interest rate environment that prevailed throughout 2017 proved to be a further deterrent for customers deciding to commit to new vehicle-leasing facilities. A culmination of these factors meant LBF was restricted in its ability to generate new business volumes through unregistered passenger cars and three-wheeler segments. To counteract the pressures brought on by the LTV, the Company moved to expand the coverage in the registered motor vehicle segment, where the impact of the LTV rule was lower.
In parallel the Company began pursuing alternative lending strategies, prompting renewed efforts to tap into the leasing market for energy-efficient vehicles (hybrid and electric vehicles as well low-capacity automobiles below 1,000CC). Leveraging on the duty concessions offered under these vehicle categories, aggressive branch-driven marketing campaigns were run targeting a wider audience in the Western Province and key
hub-towns across the country. The Company also began strengthening relationships with vehicle dealers across the country, as part of a broader strategy to position LBF as the preferred partner for vehicle
leasing. As these initiatives gathered momentum, significantly higher volumes of vehicle leases were seen under this category from June 2017 onwards. Meanwhile swift efforts to capitalise on the surge in construction activity also delivered good results, marked by a sharp increase in LBF’s construction vehicle portfolio.
Having pursued these alternative lending strategies, the Company was able to counteract to a large extent, the drop in unregistered vehicle volumes and consequently total vehicle-leasing volumes for 2017/18 reported a marginal decline of 1.08% compared to the previous year.
Notably, net interest margins remained on par with the previous year led by timely product re-pricing strategies to take account of market interest rate movements, while a cautious lending approach coupled with strict NPL management strategies were responsible for maintaining the quality of the portfolio throughout the year.
Summarised financial performance of leasing and hire purchase segment
2017/18 Rs.’000
2016/17 Rs.’000
2015/16 Rs.’000
Interest income 14,083,195 10,852,921 8,742,046
Operating profit before tax 5,041,272 4,235,148 2,144,938
Portfolio value 62,489,686 55,660,963 45,104,836
Portfolio growth (%) 12.3 23.4 11.2
Market share (%) 8.0 10.1 8.0
MA
NA
GE
ME
NT
DIS
CU
SS
ION
AN
D A
NA
LYS
IS

166 L B Finance PLC Annual Report 2017/18
Future goals and targets
» With the relaxation of the LTV ratio and environmentally-friendly relation such as hybrid and electric vehicles, the Company will put more focus on this segment.
» Favourable duty structure on small vehicles with engine capacity less than 1,000 cc will also be pursued by the Company, which will place more focus on this segment.
MORTGAGE LOAN
Mortgage loans are yet another personalised product under LBF’s lending portfolio. Mortgage loans help facilitate the customer’s need to purchase, refinance, effect improvements to properties, meet either business or personal needs,
STRATEGIC PRIORITIES FOR 2017/18
» Broad-base the lending portfolio to reduce the concentration on unregistered vehicle leasing
» Pursue alternative lending strategies as a counter measure for the LTV challenge
» Proactive NIM Management
» Strict NPL Management
or consolidate debts by mortgaging assets. This product caters to customer segments neglected by banks due to the small scale of facility requirement. Loans are granted to customers who have a confirmed income source and for businesses that have a potential to grow with additional financing.
Mortgage loans are further categorised into; fixed rate, variable rate and interest only options. Fixed rate mortgage loans come with a maximum tenure of up to seven years and mortgage loans under the variable rate category are associated with a long-term tenure up to 20 years and are offered mainly for personal and housing requirements.
The interest only loan scheme was introduced to customers who need to minimise the initial cash flow for a short period. The product terms are flexible and allow a grace period for the settlement of the lump-sum capital or the ability to convert that facility to a variable or fixed mortgage after the agreed period.
In order to differentiate from peers, LBF’s mortgage loan proposition focuses on speedy service, flexibility, convenience, along with tailor made solutions in line with the specific financial needs of customers based on their repayment capability.
Performance for the year
Focused efforts to tap into the country’s booming construction and property industries, especially in the apartment and hotel segments have helped to grow the mortgage loan portfolio, which as at 31st March 2018 stood at Rs. 6,962 million.
Given the strong demand evident in the housing market, the variable rate mortgage loan product was re-branded and re-launched to the market as “L B Mulgala” in January 2018. The move generated considerable interest, with a notable market uptake observed within the first few months of its launch.
The variable rate Mortgage Loan product was re-branded and re-launched to the market as “L B Mulgala”
Business Review

L B Finance PLC Annual Report 2017/18 167
Meanwhile, to increase the outreach for the mortgage loan product, considerable resources were invested to expand the field force, coupled with extensive training to sharpen the skills of the team in marketing, customer screening and credit evaluation.
Future goals and targets
» Emphasise on deploying credit officers to all branches to execute mortgage loans
» Providing mortgage business oriented training to existing business staff
» To become a market leader for housing loan in NBFI sector
MICRO LEASE
LBF’s micro leasing arm provides specialised leasing solutions for the lower income segments of the market, specifically focusing on assisting self-employed individuals and micro business through leasing of three-wheelers. The micro leasing arm also offers motorcycle-leasing facilities for salaried employees, offered at all LBF branches island-wide. Micro leasing has gained considerable traction in the past few years, enabling the Company to record a portfolio of Rs. 18,740 million.
Performance for the year
The year proved to be a challenging one for LBF’s micro leasing business amidst the January 2017 Government sanctioned 25% LTV (loan-to-value) ratio for unregistered three-wheelers, permitting only 25% of the asset value to be leased.
The ruling resulted in an immediate drop in the demand for unregistered three-wheelers as many customers
found themselves unable to meet the 75% self-financing condition. The situation was further exacerbated with the introduction of an additional import tariff in the 2017 budget, which led to a spike in the price of unregistered three-wheelers.
These two factors together had a significant impact on the appetite unregistered three-wheelers, with all in the industry experiencing volume loss. LBF too witnessed a 65% year-on-year decline in the unregistered three-wheeler volumes.
With the core micro leasing business model under pressure, the strategic focus for the year then shifted towards promoting registered three-wheelers and unregistered two-wheelers, prompting aggressive branch-led efforts to grow island-wide volumes in these segments. A series of above-the-line campaigns were conducted across multiple channels together with promotional gift items and add-ons being included to induce potential customers. These were coupled with a number of operational improvements in order to streamline efficiency and expedite service delivery to the customer.
As part of the ongoing effort to widen LBF’s reach in the three-wheeler leasing market, the scope of LB “Tuk Book” scheme was further expanded to enable owners of registered three-wheelers to obtain a facility of up to 70% against their vehicle value. The move delivered good results, as demonstrated by a strong uptake for the product witnessed in the year under review.
To grow the two-wheeler (motorcycle) volumes specific action was taken to deepen the penetration in the semi-urban market. A dedicated sales force was mobilised to promote the product by tapping into salaried employees attached to certain key sectors of the economy. Spearheaded by these measures, a surge in motorcycle leasing volumes were seen in the year under review, with the portfolio growing by 35.12% year-on-year to reach Rs. 3,330 million by end-March 2018 and increase of Rs. 865 million.
At the same time, extensive training was also conducted to encourage the sales force to undertake cross selling in order to drive volumes in both product segments.
MA
NA
GE
ME
NT
DIS
CU
SS
ION
AN
D A
NA
LYS
IS

168 L B Finance PLC Annual Report 2017/18
Meanwhile strict margin management strategies were employed to safeguard the bottom line, while the focus on asset quality was also intensified. Existing customer profiling mechanisms, background checks and credit evaluation systems were strengthened in a bid to ascertain credit quality of new customers, while close monitoring and continuous follow up on recoveries from existing customers ensured micro leasing NPLs stayed within accepted limits throughout the year.
Future goals and targets
» Targeted on fixed income earners
» Further strengthen the marketing campaign and individual focus marketing strategies
FACTORING
LBF offers flexible, tailor-made factoring solutions catering mainly to the SME sector. In addition to providing SMEs with access to finance, the key differentiator that sets apart LBF’s factoring solution is
the Company’s undertaking to follow up debtor collections, thereby freeing the customer to focus entirely on executing their business plans.
Despite stiff competition from the banking sector, LBF’s factoring solutions continue to experience a strong market uptake, especially in the Western Province.
Performance for the year
Continuing with the strategy adopted for the past few years, the main thrust for this year too was to improve the quality of the portfolio.
At the same time, ongoing efforts to rationalise the portfolio prompted the review of the current lending practices, with stricter protocols being introduced to control the lending ratio for high-risk customers. Despite these measures, however, a significant increase of 43% in lending volumes was seen for 2017/18 compared to the previous year, being the result of organic growth through increased exposure to existing customers.
Future goals and targets
» Maintain a quality portfolio
» Actively promote the product in other regions of the country
POWER PLUS
Power Plus is a unique tailor-made financial solution offered by LBF aimed at providing much-needed financial support to underserved communities, mainly self-employed individuals or existing SMEs who do not posses the credentials or are unable to provide necessary collateral to support their borrowing requirements.
Such customers can avail themselves of credit facilities under Power Plus by providing LBF with post-dated cheques covering the value of the facility. LBF will hold these post-dated cheques as security and extend financial assistance to SMEs to meet their short-term working capital requirements or to facilitate their business growth plans.
Performance for the year
In the year under review, the Power Plus portfolio recorded Rs. 992 million. Largely responsible for the results were the targeted lending initiatives to promote the Power Plus product to SMEs in commercial hub towns across the country. Additional efforts to leverage on prospective opportunities in fast-growing sectors of the economy, mainly manufacturing and construction sectors also contributed towards the growth reported in the year.
The focus on commercial hubs and fast-growing sectors was in line with the overall risk mitigation strategy adopted by the Company in order to control bad debts attributed to the product. Other steps taken in this regard included the imposition of sector-wise portfolio limits along with special emphasis on strengthening relationships with clients through LBF’s dedicated CRM strategy.
Future goals and targets
» Targeting the emerging commercial hubs in the Western Province
» Improve the business focus on the construction sector
» Taking a more calculated and cautious lending approach
STRATEGIC PRIORITIES FOR 2017/18
» Broad base the lending portfolio to reduce the concentration on unregistered there-wheeler leasing
» Pursue alternative lending strategies as a counter measure for the LTV challenge
» Proactive NIM management
» Strict NPL Management
Business Review
L B Finance PLC Annual Report 2017/18 169
POWER DRAFT
Power Draft was introduced in April 2011 to enable individuals and SMEs to obtain an overdraft (O/D) facility against asset-backed collateral, with the value of the facility being used to determine the duration, usually up to maximum 12 months.
Performance for the year
The Power Draft portfolio grew from Rs. 2,117 million in 2016/17 to Rs. 2,658 million in 2017/18.
Future goals and targets
» Portfolio growth of 30% in 2018/19
» Increase market share to achieve market leadership
GOLD LOAN
LBF’s flagship gold loan product is designed to satisfy the urgent financing needs of customers. The gold loan scheme is a one-month proposition that offers ultimate convenience, including the ability to settle and receive articles without prior notice. LBF’s gold loan product holds market share of 54%, approximately making it the undisputed leader among peers in the NBFI sector.
To retain its dominance in the market LBF has invested in dedicated gold loan infrastructure, including 36 dedicated gold loans centres across the country in addition to a VIP centre. For added convenience, selected LBF gold loan centres are open on Sundays from 8.30 a.m to 6.00 p.m. Customers can also access the gold loan scheme at any of LBF’s 123 branches island-wide, which stay open from Monday to Saturday till 6.00 p.m. including bank holidays. A specially trained gold loan officer is available to assist customers at each of these branches.
Additional benefits, including gift for gold loan transactions and SMS updates, are a few of the other special features that continue to draw more customers to the product.
Performance for the year
LBF’s gold loan product continued its strong growth momentum, with the portfolio reaching Rs. 20.1 billion by end-March 2018, up from Rs. 16.26 billion reported at the end of the previous year. The Super Mega Campaign and massive promotional initiatives aimed at building customer trust in LBF’s gold loan offering along with continuous localised promotional campaigns conducted at branch level were key drivers for the steady increase in volumes throughout the year under review.
Efforts to change the customer mindset and encourage them to migrate to the new scheme were spearheaded by the “Apitama Hariyana Apema Thanak” campaign launched in October 2017. Concurrently a number of internal processes were revamped to enhance efficiency and improve service delivery to the customer. Processing counters were increased at branches that were found to have long queues, while VIP counters
were introduced at branches reporting high gold loan volumes. In addition, a new scheme was also introduced to give customers the flexibility to opt for a structured repayment plans. In another notable development, a new call centre was set up in Jaffna, dedicated specifically to service the needs of customers in the north of the country. Additional resources were also invested to strengthen the capacity of LBF’s gold loan call centre in Mount Lavinia. To further enhance the capacity of the gold loan segment in the long-term, the Company commenced the groundwork to set up a new integrated ERP system due to be fully rolled out in the forthcoming year.
Meanwhile the ongoing focus on NPL management ensured that recoveries remained on track, with gold loan NPLs for 2017/18 at negligible levels due to tightened monitoring and follow-up mechanisms to minimise the numbers being transferred to the inactive customer base. Added emphasis on reducing the inactive customer base saw a special incentive scheme being offered to expedite recoveries from this segment, a move that led to reduction in the inactive customer base.
Training conducted specially for gold loan staff to improve the productivity
No. of in-house trainings 44
No. of external outbound training 1
Gold Loan Campaigns for the year
No. of promotional campaigns – On-site 496
No. of promotional campaigns – Mobile vehicle 196
Locations covered All Island
MA
NA
GE
ME
NT
DIS
CU
SS
ION
AN
D A
NA
LYS
IS

170 L B Finance PLC Annual Report 2017/18
Future goals and targets
» Market development activities targeting fixed and middle income segments (Government officials)
» Increase overall market share up to 8%
» Expand geographical footprint for gold loan facilities
PERSONAL LOANS
LBF’s personal loan scheme is a unique offering specially designed to meet the changing lifestyle needs of upwardly-mobile individuals with a stable monthly income. The product is not restricted to high-earners only and is extended to any salaried employee who can furnish proof of employment. In the case of low-income earners with a limited financial track record, LBF takes additional steps to negotiate with their respective employers and offer bulk loans, which are backed by the employer’s undertakings.
Given its flexibility and hassle-free documentation requirements, the product has proven to be immensely popular among all segments of the target market and continues to gather momentum across all regions in the country.
Performance for the year
For the personal loan division, the main strategic thrust for the year was to reach out to as many prospective customers as possible and thereby boost the number of loans granted. Efforts in this regard were led by a dedicated marketing team, set up specifically for the purpose of promoting the product to the various segments of the target market.
One of the key initiatives taken by the newly-set-up marketing team was a massive promotional campaign to canvass factory workers at the Katunayake and Koggala Industrial Zones. The team also conducted a series of localised pocket campaigns in collaboration with the branches to promote the personal loan product in their respective geographies. These efforts contributed towards achieving average volumes of Rs. 75 million per month.
In line with the commitment made in the previous year, the ‘Krutha Hastha’ senior citizens product was also launched in 2017. Designed exclusively for pensioners, the ‘Krutha Hastha’ loan scheme enables pensioners to obtain a loan of up to a maximum of Rs. 2 million by assigning their pension to the Company. As with the mainstream personal loan product, the ‘Krutha Hastha’ product too was well received, gaining considerable traction across the country and generating over Rs. 90 million in volumes within the first six months of its launch.
STRATEGIC PRIORITIES FOR 2017/18
» Increase captive market share through branch-led efforts to grow volumes
» Improve service delivery to the customer
» Strengthen asset quality
Summarised financial performance of loans and receivables segment
2017/18 Rs.’000
2016/17 Rs.’000
2015/16 Rs.’000
Interest income 8,253,343 6,349,685 5,179,323 Operating profit before tax 2,479,930 2,330,407 2,006,281 Portfolio value 39,855,105 33,488,779 26,449,169 Portfolio growth (%) 19 26.6 18.8
Market share (%) Gold loan 53.9 57.6 51.2 Other Loans and Receivables 4.0 3.6 3.9
Business Review

L B Finance PLC Annual Report 2017/18 171
Future goals and targets
» Introduce a loyalty card for ‘Krutha Hastha’ customers
MICRO LOAN
The micro loan segment through the ‘Dirimaga’ loan scheme offers snap loans to registered micro entrepreneurs to facilitate their short-term working capital commitments.
Performance for the year
Leveraging on the immense popularity of the product, LBF intensified efforts to grow volumes in the year under review. By pursuing an organic growth strategy to tap into potential new customers around the country LBF recorded a strong increase in ‘Dirimaga’ volumes, leading to a 31% year-on-year increase in the portfolio from Rs. 145 million in 2016/17 to Rs. 190 million in 2017/18.
Meanwhile, investments in advanced technology aimed at expediting the collection process were responsible for a considerable reduction in the ‘Dirimaga’ NPL’s reported for the year under review.
Future goals and targets
» Promoting budding entrepreneurs to the system
» Regularly monitoring micro entrepreneurs to develop to the next level
ISLAMIC FINANCING
In operation for the past eight years, LBF’s Islamic Finance Unit has been operating under its ‘Al-Salama’ brand linked with the parent LB brand. The unit operates through dedicated Islamic financial services officers stationed at each LBF branch tasked with mobilising business in the respective areas.
Offering both savings and financing solutions, LBF’s Islamic Financing has made its mark as a fully-fledged service provider geared to meet the needs of the market.
Performance for the year
The Islamic Finance Unit continued to make good progress throughout the year, with total Islamic Finance portfolio reaching Rs. 3,189 million at the close of the year, driven mainly by new volumes attributed to the Ijaarah - the core-lending product, which is in line with LBF’s auto lease offering.
Building on the success achieved on Ijaarah, initial groundwork began to develop two new products for businesses ‘Wakaala’, a lending product that supports the working capital requirements of the SME sector and ‘Musharaka’, a product similar to an overdraft facility.
The Islamic Finance Unit’s deposit book also grew significantly, with the portfolio growing by 102% year-on-year. The customer base increased by 27% compared to the previous year thanks to a robust increase in new customer acquisitions. The main deposit product ‘Mudharabaha’ reported fold growth bolstered by aggressive efforts to mobilise deposits in the first three quarters of the year by leveraging on positive market trends. Other steps taken in this regard included the deployment of additional branch staff at selected branches coupled with extensive training for the entire field sales force. Retention ratios of the ‘Mudharabaha’ one-year fixed deposit and Kids savings products remained stable, thanks to LBF’s ongoing commitment to service excellence.
Future goals and targets
» Open two stand-alone Islamic Finance Units in Kandy City and Valachennai
LBF recorded a strong increase in Dirimaga volumes, leading to a 31% year-on-year increase in the portfolio from Rs. 145 million in 2016/17 to Rs. 190 million in 2017/18.
MA
NA
GE
ME
NT
DIS
CU
SS
ION
AN
D A
NA
LYS
IS

172 L B Finance PLC Annual Report 2017/18
VALUE ADDED SERVICES
OUR STRATEGY The ultimate test of the Company’s strategy is whether it will enable us to deliver superior extra services and sustainable other business lines to be the major income source either immediately or in the very near future, and whether it will enable other services to reduce the risk of income generation from the main income source of lending. We refreshed our strategy during the year to express this goal more explicitly, and to provide a strategic construct to guide the execution of the Company strategy within our business units and enabling functions. Each of them are responsible for ensuring that their plans are aligned with the Company strategy and values.
MANAGEMENT APPROACHAs the busy work schedule transforms the way people think and act, we are providing our clients with simpler and more efficient payment systems through integrated channels, including value added services. We have introduced a range of utility bill payment solutions and value added financial services apart from the core business to provide customer with control of all aspects of their financial needs, and improved the speed and efficiency of delivery on our value added platforms. There has been steady growth in our customers’ adoption of LBF’s other services, with millions of transactions generating a significant amount processed on our value added service platforms.
This service was added to the product portfolio with the intention of making our customers’ lives easy. All utility bills, money exchanges and money transfers of customers are accepted through our widespread branch network, moving beyond traditional boundaries to satisfy all our customer requirements.
OUR PRODUCT OFFERINGS
Business Review

L B Finance PLC Annual Report 2017/18 173
PAYHUB
LBF’s Pay Hub was introduced with the primary intention of providing a value-added service to the Company’s customers. Launched in 2012, the Pay Hub facility enables customers to pay their utility bills either at any of the LBF branches island-wide. Pay Hub is also available on LB e-connect, the Company’s online financial tool, giving customers the added convenience of paying their utility bills at any time, from anywhere.
Pay Hub is connected to the full gamut of utility service providers including all mobile telecommunication companies, Sri Lanka Telecom, National Water Supply and Drainage Board, Ceylon Electricity Board and Lanka Electricity Company.
Performance for the year
Utility payments collected through the Pay Hub was of Rs. 389 million in the year under review, up by 14% from Rs. 341 million in the previous year.
Since its launch six years ago, the Pay Hub product has gained considerable traction among LBF’s customers with the increase in foot traffic at branches providing an opportunity to promote the Company’s products to these potential customers.
Future goals and targets
» Expand the Pay Hub service to cover credit card settlements and insurance payments
» Increase the utility payment income by 25% in 2018/19
WESTERN UNION
Western Union (WU) money transfer system was re-launched in May 2017, following LBF’s appointment as a sub-agent by WU’s country representative MMBL Money Transfer (Pvt) Ltd. LBF has previously operated as a WU sub-agent.
Performance for the year
Following its re-launch in May 2017, a number of direct promotional activities were conducted across the Island to create visibility regarding LBF’s WU service. Spearheaded by the branches, the main aim of the exercise was to reach out to potential customers at a grass root level and educate them on the level of convenience offered by LBF’s WU money transfer service. These efforts led to a strong market uptake allowing LBF to record average monthly volumes of Rs. 143 million within the first few months of the launch.
Meanwhile, ongoing efforts to improve the flexibility of the offering saw the roll out of a free Visa debit card to existing customers at their request. In addition a special gift promotion scheme was launched for walk-in WU customers.
Future goals and targets
» Launch of a customer loyalty programme offering special discounts and benefits
» Increase the business volume by 50% and strive to become the market leader in WU transactions
FOREIGN CURRENCY OPERATION
Licensed with the CBSL, LBF’s foreign currency operation differentiates itself by handling not only the main global currencies but also a range of lesser-known currencies. Unlike many peers who restrict their operations to only the main currencies, LBF’s foreign currency operation buys and sells a total of 19 currencies.
The fact that LBF offers competitive rates and does not charge the customer a handling fee for buying and selling of currencies are two of the key differentiators that give the Company a leading edge in this mainstream market.
LBF currently offers foreign currency operation services at 64 of the 159 total outlets, with a specially trained officer available to assist customers at each of these branches.
STRATEGIC PRIORITIES FOR 2017/18
» Growing core product volumes
» Improve service delivery to the customer
» Diversify the product portfolio
MA
NA
GE
ME
NT
DIS
CU
SS
ION
AN
D A
NA
LYS
IS

174 L B Finance PLC Annual Report 2017/18
Performance for the year
The key priority for LBF’s foreign currency operation is to grow volumes. To achieve growth target for the 2017/18 year, several marketing campaigns were carried out to create visibility among different customer segments, including SMS announcements, leaflets, email, awareness building through the mobile propaganda van, as well as social media advertising.
Bolstered by these efforts, foreign currency operation volumes grew by a staggering rate in the year under review. The contribution made by the branch network too showed a marked improvement, following extensive training and awareness sessions to strengthen the capacity of branch staff and ensure compliance with CBSL sanctioned procedures in buying and selling of currencies.
0
20
40
60
80
100
120
0
500
1,000
1,500
2,000
2,500
3,000
3,500
4,000
FOREIGN CURRENCYOPERATIONS
Rs.Mn Nos.
201820172016
Value of transactionsNumber of transactions
Future goals and targets
» Launch of the foreign currency operation business and personal account
» Extend the foreign currency operation to the entire branch network
RENT A CAR
While LBF’s rent-a-car business was initially launched as part of a broad-based diversification strategy aimed at expanding fee-based income, it is now maintained more as a value-added service for customers. The service is operationalised through fleet of vehicles, maintained by the Company, with customers being offered rent-a-car facilities at a special concessionary rate.
Performance for the year
During the year, income from the rent-a-car service increased to Rs. 13 million, from Rs. 8 million in the previous year.
Future goals and targets
» Stringent fleet management to optimize returns from existing vehicle fleet
KEY FOCUS AREAS OF THE RESEARCH
Do you recommend L B Finance to another friend/family member?
Identifying the likelihood of a customer recommendation indicates customer confidence and trust in the brand
60%20%
20%
RecommendedConditionally RecommendedNot recommended
Research by University of Kelaniya
KEY FOCUS AREAS OF THE RESEARCH
Which factor built your trust on L B Finance?
Maintaining trust in a finance company remains a very sensitive matter and therefore the aim is to measure key trust indicators
45%23%
9%
23%
Positive word-of-mouthFirst-hand experience with the CompanyStaff promotionDo not trust
Research by University of Kelaniya
Business Review

L B Finance PLC Annual Report 2017/18 175
SUPPORT SERVICES
INFORMATION TECHNOLOGY
LBF’s IT function is a key custodian of the Company’s competitive position in the market. IT plays a crucial role in LBF’s goal to become the number one technology-driven finance company in Sri Lanka, by contributing towards improving employee efficiency and focusing on transforming business operations towards a paperless environment. The main purpose of the IT function is to maintain and support the Company’s core business applications through the introduction of new systems and processes that would safeguard the integrity and confidentiality of LBF’s assets. In addition to providing and maintaining the Company’s network infrastructure, telecommunication, general office applications and equipment, and providing support for bespoke applications, the IT function also provides user support and training, information security, business continuity and disaster management.
ADMINISTRATION
The main task of the administration function is to facilitate the smooth functioning of operations with the highest priority given for safety and security for all assets whilst embedding green practices to
achieve operational efficiencies at all levels of the business. The responsibilities of the administration function include general office management and transportation, procurement, security, safety and janitorial services, insurance and branch infrastructure development.
GENERAL OFFICE MANAGEMENT AND RUNNING
The division is tasked with ensuring a clean and secure office environment, monitoring the availability of adequate utility facilities and setting of internal operating rules to ensure a safe and secure work environment. The division oversees general day-to-day maintenance activities including the installation of furniture and equipment, inventory management of office supplies and stationery, disposal of unserviceable items within the stipulated rules and the management of mail delivery. The function is also responsible for managing the Company’s daily travelling and transport requirements as well as repair and maintenance of all Company-owned vehicles and management of outsourced travelling and transport services.
PROCUREMENT HANDLING
The duties of the procurement handling division include conducting regular evaluation of asset requirements and overseeing the acquisition and management assets such as vehicles, furniture and fittings, IT equipment and stationery.
PROPERTY MANAGEMENT
The division manages all LBF properties including building installations, maintenance of freehold and leasehold property, maintenance of the vehicle fleet and repossessed assets.
MARKETING
The marketing function of the Company plays an integral role in the development and delivery of all lending, deposit and value added products and services whilst enhancing stakeholder relationships. The scope of activities covered by the marketing function include; ensuring customer satisfaction, supporting business objectives, building and maintaining the brand image, discovering new opportunities and analysing the operating environment to strength the future decision-making process.
MA
NA
GE
ME
NT
DIS
CU
SS
ION
AN
D A
NA
LYS
IS

176 L B Finance PLC Annual Report 2017/18
ADVERTISING
LBF’s advertising model seeks to increase brand visibility and promote the Company’s products and services. LBF’s advertising model relies on both Above the Line (ATL) and Below the Line (BTL) to enhance the brand and reach target customers. All advertising and promotions related to products complied with the Central Bank mandated requirements and are monitored by the senior management of the Company. Accordingly the Company’s advertisements, leaflets and promotional activities contain information pertaining to all our products in English, Sinhala and Tamil. Further, we have not been notified of any significant cases of non-compliance with any regulations or voluntary codes.
RECOVERIES
The recoveries function plays an important role in contributing towards the achievement of the Company’s objectives. Working in collaboration with the regional and branch network as well as the credit and legal divisions the recovery function oversees the collection of customer dues. With the higher credit growth seen in recent years, the role of the recoveries function has been assigned the responsibility of building a good rapport with customers and ensuring customer retention, throughout the recovery effort. As such the current recovery model seeks to increase debt recovery through a more focused collection process supported by continuous monitoring of the portfolio while analysing industry trends.
TREASURY
The Treasury function is responsible for five interlinked areas: funding, liquidity management, investments, compliance and investor relations. Within the scope of these activities, the Treasury function undertakes a range of tasks to ensure the business functions smoothly and continues to generate value for stakeholders. Accordingly, the key responsibilities of the Treasury function are; the cost-effective management cash flows order to facilitate the Company’s funding requirements, maintaining the optimum funding mix and managing LBF’s investment portfolio taking cognisance of relevant risk.
.
Business Review

L B Finance PLC Annual Report 2017/18 177
Risk Management
RISK ENVIRONMENTAs a financial institution regulated by the Central Bank of Sri Lanka (CBSL), the Company is operating in an extremely competitive and volatile environment. Therefore it is imperative to be proactive in our business strategies in order to adopt quickly to changing risk dynamics. During the year under review, demand for new vehicle financing continued to be dampened by the lending restrictions imposed during FY 2016/17 on certain vehicle
classes. Adverse weather conditions that prevailed in most parts of the country hindered agricultural production causing a considerable negative impact to economic activities. Lower GDP growth naturally led to reducing demand for credit growth, poor loan recoveries and overall deterioration in asset quality in the industry.
FY 2017/18 was characterised by changes proposed to the existing capital adequacy framework which if introduced would require
a considerable capital charge for operational risks. Adoption of SLFRS 9 and connected higher provisioning requirements for expected loss will further challenge the industry profitability.
Recent negative public perception towards NBFIs following the collapse of a couple of LFCs has thrown extra challenges to the sector as a whole.
Worldwide spread of ransomware and cyber-attacks specially targeting financial institutions has emerged as a top risk.
GLOBAL & LOCAL LANDSCAPE
Event Impact on the Company Risk mitigation strategies
GLO
BA
L
US Federal Reserve’s approach towards key policy rates to increase the volatility in USD/LKR exchange rate
Low risk
» Limited due to insignificant exposure to USD denominated borrowings
» Use dynamic risk mitigation techniques such as currency swaps to manage volatility
Increasing trends in cyber attacks
Moderate risk
» Possibility of breaking down of critical information infrastructure and misuse of Company’s customer database
» Possible reputational, legal and financial consequences and loss of customer confidence
» Heavy investments in preventive and detective cyber security systems increasing the cost to : income ratio
» Development of a prevention mechanism by actively engaging with FINCSIRT
» Engaging an external CERT for continuous assessment of cyber risk
» Increase awareness among employees
» Streamlining mechanism for early detection, response, recovery to mitigate and better manage consequences limiting the damage and ensuring business continuity
Increase in rupee interest rates to match up the US interest rates
Moderate Risk
» Increased cost of funds
» Diversify funding sources
» Regular review of rate sensitive assets and liabilities
Decline in precious metal (gold) prices
Low Risk
» Increased defaults from gold loans
» Loan to value ratio is revised promptly in response to changes in market price
» Stress tests are carried out regularly to assess the impact of a further decline in gold prices
GRI - 102 - 15, 30
MA
NA
GE
ME
NT
DIS
CU
SS
ION
AN
D A
NA
LYS
IS

178 L B Finance PLC Annual Report 2017/18
Event Impact on the Company Risk mitigation strategies
LOC
AL
Increase in Government taxes and direction on lowering LTV
Moderate risk
» Increase in corporate tax rates reduces the profitability of the Company and discourage investments
» Reduced volumes from key revenue generating products
» Maintaining diversified lending portfolio to mitigate impact on lost opportunities in leasing/vehicle financing
Tight liquidity Moderate risk
» Increased cost of funds
» Having to rely on external borrowings
» Regular review of rate sensitive assets and liabilities of the Company
» Attractive interest rates offered to encourage savings deposits
Low economic growth than expected
Low Risk
» Lower disposable income resulting in low savings
» Increase in credit default risk
» Proactive credit risk management practices such as strengthening of loan review mechanism
RISK MANAGEMENT AT LB
Risk is inherent in all business activities of a financial institution engaged in a varied offering of financial services. Sound risk management enables us to protect our depositors and investors whilst delivering an adequate risk adjusted return to our shareholders. At LBF we believe in aligning corporate strategy closely with risk strategy. Risk management efforts are aimed at risk steering, as opposed to mere risk prevention or minimisation. The Company takes a comprehensive approach to risk management with a defined Risk Framework and a clearly articulated Risk Appetite Statement sanctioned by the Board of Directors. Company’s risk management process is steered by the Board appointed
Integrated Risk Management Committee (IRMC).
An appropriate and effective risk management system ensures that risks and their impacts are identified and evaluated at an early stage and contingency plans and measures are in place where necessary to handle risks and to prevent their accumulation.
Through proper implementation of an enterprise risk management system, the Company strives to achieve the following goals:
» Development of a risk culture that fosters awareness of risks and a common understanding of risks across functions and departments
» Capital protection, both for internal as well as regulatory purposes
» Limitation of earnings volatility
» Risk-based performance measurement and decision making
» Ability to act proactively or to respond quickly and effectively to adverse events
» Better understanding of risks for competitive advantage
» Increase transparency and optimise information flows between business functions, control functions, the management committee and the Board of Directors
Risk Management

L B Finance PLC Annual Report 2017/18 179
KEY INITIATIVES IN FY 2017/18
» Conducted a 100% reliability testing of the enhanced Disaster Recovery (DR) site and successfully executed the Business Continuity Plan (BCP)
» Further improved the independent portfolio quality review by sharing the learnings with the Credit Committee for making necessary policy revisions
» Developed the Liquidity Crisis Management Plan to be followed during a deposit flight caused due to external factors and recommended minimum liquidity buffer to be maintained
» Broadened the scope of fraud detection and prevention mechanisms using exception reports and data analytics
» Evaluated the adequacy and effectiveness of the existing control environment on protecting
confidential/sensitive information of LBF customers and recommended further preventive measures to strengthen the process
» Setting up and applying prudent limits in VaR model to control market risks related to gold loans portfolio
» Spearheaded the efforts in formulating a digitisation strategy for the Company to counter the emerging threats from FinTechs
» Centralised the customer complaints handling function to deliver a more efficient dispute management to minimise reputational risk
» Overseas expansion by incorporating a fully-owned subsidiary for microfinance lending in Myanmar which will help geographical diversification of risk further
PRIORITIES FOR FY 2018/2019
» Lead and guide the business units in making necessary arrangements to increase the readiness for the proposed new capital adequacy framework
» Regular review of credit portfolio performance in order to validate the assumptions used in expected loss model
» Comprehensive assessment of the credit, operational and other risks arising from the proposed digitisation strategy of the Company
» In-depth analysis of the maturity profile of liabilities (deposits and borrowings) to assess the accumulation of repayments in order to guide the liability sales function
Con
tinuo
us a
nd ti
mely controlling Detecting new
risks and
Risk m
itigation decisions and Q
uantita
tive
and
and
reco
rding vulnerabilities
Risk
Monitoring
and Reporting
Risk
Management
Decision
Risk
Identification
Risk
Analysis and
Measurement
RISK MANAGEMENT PROCESS
Management of risks within the Company takes place in several steps. These apply in principle to all risk categories. The risk management process at its broadest level can be broken down into the following generic steps;
Risk Identification
In the context of risk identification, all existing risk categories, their sub-risks as well as their risk sources within the Company’s business are determined and clearly distinguished from each other on an ongoing basis.
New risks can occur, given that the business environment is constantly changing and new products are being developed and brought into the market. Early and comprehensive identification of risk is an essential element for the early warning system.
Before commencing business with new products, types of business and in new markets, the risks inherent in them and the resultant effects on risk management must be identified.
MA
NA
GE
ME
NT
DIS
CU
SS
ION
AN
D A
NA
LYS
IS
prom
pt execution
qualitativ
e eva
luat
ion

180 L B Finance PLC Annual Report 2017/18
Risk Analysis and Measurement
Following on from risk identification, risks are analysed and measured using quantitative as well as qualitative risk-appropriate methods and procedures. The methods used are verified continuously using sensitivity analysis, stress tests, gap analysis, risk rating, risk scoring and VaR analysis.
Interdependencies are to be taken into account, and risk concentrations or accumulation risks are to be continuously analysed and evaluated.
Risk Management Decision and Execution
The risk management function initiates suitable strategies and concepts aimed at the prevention, reduction, mitigation, transfer or diversification of all identified and analysed risks in accordance with defined objectives.
Risk Monitoring and Reporting
The quantifiable risks are restricted by risk limits. The development of risk limits for controlling and monitoring risk positions, risk exposure in particular to avoid risk concentrations for sectors, customers and security types form an essential part of the Company’s risk approach.
All non-quantifiable risks are managed via appropriate methods or approaches that involve process improvement, modifications or re-engineering.
Monitoring ensures that the risk management decision is implemented appropriately and in a timely manner. It includes both monitoring of deviations from the
prescribed risk limits and monitoring of methods, procedures and processes used for quantifiable and non-quantifiable risks.
RISK MANAGEMENT AND REPORTING PROCEDURE (RMR)
RMR procedure is the practical manifestation of the Company’s risk management process. In line with the Risk Management Process, this
mechanism is designed for managing and reporting risks within the entire organisation.
RMR procedure allows the Risk Management Department (RMD) and the Chief Risk Officer (CRO) to identify and assess risks affecting the entire business on a continuous basis.
Risk identification
Assessment of qualitative/quantitative risks and defining KRIs
Formulation of risk mitigation plans for qualitative and quantitative risk
Risk communication and escalation to executive leadership
Risk monitoring
Risk reporting to the IRMC & BOD
A
A
B
B
C
C
D/E
RMR procedure starts with the initial identification of key risks concerning each business unit/function. Risk identification is a collective exercise carried out with the active participation and contribution of the respective Heads of Departments (Risk Owners) where RMD’s role primarily is to facilitate the process.
For quantifiable risks, Key Risk Indicators (KRIs) are defined and tolerance levels are set for monitoring purposes. KRIs should be evaluated on a regular basis for appropriateness and relevance. Any new identified KRIs should be added to enhance effective risk monitoring.
Formulation of risk mitigation plans for qualitative and quantitative risk, RMD should initiate and formulate risk mitigation plans together with the respective business divisions. For agreed mitigation actions clear timelines should be set for completion and responsibilities should be assigned.
F
G
Risk Management

L B Finance PLC Annual Report 2017/18 181
RISK APPETITE
Risk appetite is the types of risks and the aggregate amount of risks that the Company is prepared to be exposed to at any given point in time which is approved by the Board of Directors. After a careful consideration of the regulatory requirements, capital, funding and liquidity position, strategic objectives and the risk management framework, the Company has formulated a risk appetite statement which clearly defines the Company’s risk appetite and strategic risk objectives.
Risk Appetite Criteria Appetite Regulatory Limit
Actual as at 31 March
2017
Actual as at 31 March
2018
Credit RiskLoans and Advances
Non-Performing loans ratio - Gross < 2.5% 2.1% 2.4%
Non-Performing loans ratio - Net < 1.0% -0.1% -0.1%
Minimum safety margin for gold loans 15.0% 19.6% 19.3%
Maximum exposure to single borrower-secured - Individual 5.0%15% of
capital funds2.7% 2.3%
Maximum exposure to single borrower-secured - Group 10.0%20% of
capital funds2.7% 2.3%
Maximum exposure to aggregate unsecured financing 4.0%5% of
capital funds3.3% 2.1%
Maximum exposure to single borrower-unsecured - Individual 0.5%1% of Core
capital0.3% 0.2%
Liquidity RiskLiquid assets ratio 12.0% 10.2% 14.5% 14.7%
Deposits renewal ratio 75.0% 73.7% 74.4%
Maximum single depositor/group exposure5.0% of Total
Deposits2.2% 1.0%
Maximum exposure to bulk deposits (Over Rs.50 million)20.0% of
Total Deposits16.7% 14.9%
D
E
F
G
RMD is responsible for risk communication and escalation to the executive leadership of the Company (Managing Director and the Executive Directors) by providing an updated Corporate Risk Profile on a regular basis. The communication should include a status of compliance with the KRI tolerance levels and progress of the agreed mitigation plans for overcoming key vulnerabilities.
CRO is also responsible for escalating any proposed mitigation strategy beyond the scope/authority of the business units/HODs or the RMD to the executive leadership and seek necessary approvals for the implementation.
RMD should regularly communicate with the risk owners for the purpose of monitoring KRIs and ensuring the implementation of agreed mitigation strategies. Risk owners are responsible for providing all necessary information to the RMD and the CRO to facilitate independent supervision.
CRO is responsible for submitting summarised version of the Corporate Risk Profile to the IRMC and to the Board of Directors at least on a quarterly basis.
MA
NA
GE
ME
NT
DIS
CU
SS
ION
AN
D A
NA
LYS
IS

182 L B Finance PLC Annual Report 2017/18
Risk Appetite Criteria Appetite Regulatory Limit
Actual as at 31 March
2017
Actual as at 31 March
2018
Capital AdequacyCore capital ratio 8.0% 5.0% 16.1% 17.3%
Total risk weighted capital ratio 12.0% 10.0% 17.1% 19.8%
Capital funds to deposits ratio 12.0% 10.0% 21.9% 24.0%
Market Risk% Impact on Net Interest Income from 100 bps shock 5.0% 4.2% 4.4%
% Impact on Net Interest Income from 200 bps shock 10.0% 8.5% 8.7%
% Impact on Net Interest Income from 300 bps shock 15.0% 12.7% 13.1%
% Impact on Net Interest Income from 400 bps shock 20.0% 17.0% 17.5%
RISK GOVERNANCE FRAMEWORK
The risk governance framework of the Company adopts the ‘three lines of defence’ approach in managing the risk within the defined framework. The three lines of defence framework operates as follows:
Day-to-Day Management of Risks
» First and direct responsibility for the assessment and control of the Company’s risks
» Embeds risk management framework and sound risk management practices into standard operation procedures
» Monitors risk management performance in operation
» Accountable for effectiveness of risk management in operation
Oversight of Risk Policies and Framework
» Develops and implements the framework, policies, systems, procedures and tools
» Providing support to the business units, review and report key risks to the IRMC
Independent Review & Assurance
» Reviews effectiveness of risk management practices
» Confirms level of compliance
» Recommends improvements and enforces corrective actions where necessary
HODs Management committees
IRMCAudit Committee
RMD
Internal auditExternal audit
Compliance function
B O A R D O F D I R E C T O R S
1st Line of Defence
2nd Line of Defence
3rd Line of Defence
Risk Management

L B Finance PLC Annual Report 2017/18 183
1ST LINE OF DEFENCE
Asset and Liability Committee
Asset and Liability Committee (ALCO) is chaired by the Managing Director and comprises the Executive Directors, Head of Treasury, Head of Deposits, the Chief Financial Officer and the Chief Risk Officer. The Committee meets regularly to monitor and manage the assets and liabilities of the Company and also overall liquidity position to keep the Company’s liquidity at healthy levels, whilst satisfying regulatory requirements.
Credit Committee
The Credit Committee comprises the Managing Director, Executive Directors, Chief Financial Officer and the Chief Risk Officer. Sanctioning of large exposures is primarily handled by the Credit Committee. The Committee meets regularly to monitor and manage the Company’s lending portfolio, asset quality and recovery actions. The Committee also periodically reviews the Company’s credit policy and lending guidelines to different business segments, in line with prevailing market conditions and industry dynamics.
Information Technology Steering Committee
The Information Technology Steering Committee (ITSC) is headed by the Executive Director – Asset Management and comprises heads of IT and representatives from relevant
departments. The Committee is responsible for providing leadership for the planning and management of IT investments on a company-wide basis.
It is the responsibility of the ITSC to ensure that the Company’s Information Technology needs and objectives are being adequately addressed. The Committee helps to ensure that IT strategy is aligned with the strategic goals of the Company whilst its top most mandate is to find and align business solutions that may leverage technology. ITSC also looks into information security related matters on a regular basis.
Sustainability Committee
The Sustainability Committee is responsible for the formulation and the review of the Company’s CSR policy and ensuring that CSR activities are integrated into the Company’s operations. Keeping in line with the Company’s triple bottom line focus, the Committee is tasked with the responsibility of steering the Company’s CSR activities aimed at uplifting the communities we work with and preserving the environment. The Committee is headed by the Head of Marketing, reflecting the close links of our social and environmental initiatives and brand visibility which demonstrates how the CSR strategy is integrated in to our business strategy.
2ND LINE OF DEFENCE
Integrated Risk Management Committee (IRMC) - Board Sub- Committee
The Board has delegated its authority to the Integrated Risk Management Committee which is responsible for developing and monitoring the Company’s risk management policies. The Committee is headed by an Independent Non-Executive Director and comprises Executive and Non-Executive Directors, Chief Financial Officer, Chief Risk Officer, Head of Treasury and the Compliance Officer. Meetings of IRMC are held quarterly, Board of Directors is duly updated of its activities.
Audit Committee - Board Sub- Committee
The Audit Committee is a formally constituted sub-committee of the main Board, and comprises three Board members who are Non-Executive Directors. The members of the Committee are appointed by the Board. The primary function of the Committee is to assist the Board to fulfil its stewardship responsibilities with regard to financial reporting requirements and information requirements of the Companies Act and other relevant financial reporting regulations and requirements. It also has oversight responsibility for reviewing the effectiveness of internal control and risk management systems. The Committee assesses the independence and performance of the Company’s Auditors, both Internal and External.
MA
NA
GE
ME
NT
DIS
CU
SS
ION
AN
D A
NA
LYS
IS

184 L B Finance PLC Annual Report 2017/18
Risk Management Department (RMD)
The Risk Management Department provides an independent oversight function, acting as a second line of defence within the organisation. RMD is tasked with the responsibility of assisting the business units and functional departments in identifying and managing the risks related to their respective operations and processes and independently monitoring the status and effectiveness of the mitigation action plans. RMD is headed by the CRO who directly reports to the Managing Director and has a functional reporting to the Board of Directors and the IRMC.
3RD LINE OF DEFENCE
Internal Audit
Internal Audit provides an independent, objective assurance designed to add value and improve an organisation’s operations. The Company’s internal audit function helps to bring a systematic, disciplined approach to evaluate and improve the effectiveness of operational controls, governance processes and risk management.
Compliance Function
Compliance function is responsible for ensuring that the Company is in compliance with all applicable laws, regulations and supervisory directions. It complements the RMD by providing necessary risk related information on legal and regulatory risk areas.
External Audit
External Audit is responsible for adding credibility and reliability to Company’s financial reports by giving an independent opinion on the report. In addition, as part of their annual audit exercise, External Auditors also perform an audit on the Company’s adequacy of risk management controls, corporate governance and compliance.
Audit Committee Managing Director
Chief Risk Officer
Risk Management Department
Compliance Department
IRMC
Internal Audit
Credit CommitteeAsset and Liability
CommitteeIT Steering Committee
SustainabilityCommittee
Operational Risk
Credit RiskLiquidity
RiskIT Risk
Reputational
Risk
Market
Risk
B O A R D O F D I R E C T O R S
RISK GOVERNANCE FRAMEWORK
Risk Management

L B Finance PLC Annual Report 2017/18 185
RISK HEAT MAP
CREDIT RISK
Objective
Safeguard the asset quality and reduce exposures to high risk
segments
Trend
Credit Risk
Conc
entra
tion
Risk
Def
ault
Risk
Settl
emen
t Ris
k
Liquidity Risk
Fund
ing
Risk
Mar
ket L
iqui
dity
Ris
k
Market Risk
Com
mod
ity ri
sk
Inte
rest
Rat
e Ri
sk
Curre
ncy
Risk
Operational Risk
Inte
rnal
Fra
ud
Exte
rnal
Fra
ud
Wor
k pl
ace
safe
ty
Busi
ness
dis
rupt
ions
Proc
ess
Risk
Dam
age
to p
hysi
cal a
sset
s
Other Risks
Stra
tegi
c Ri
sk
Repu
tatio
nal R
isk
Capi
tal a
dequ
acy
risk
IS R
isk
Lega
l Ris
k
HR
Risk
2017/18 2016/17
Credit risk constitutes the Company’s largest risk exposure category. This can be broadly categorised into three types; default, concentration and settlement risk.
Default risk is the risk of potential financial loss resulting from the failure of customer or counterparty to meet its debt or contractual obligations. The Company’s default risk arises principally from loans to customers and fixed income investments with the counterparties.
Concentration risk is the credit or counterparty exposure being concentrated as a result of excessive build up exposure to a single counterparty, industry, product, geographical location or insufficient diversification.
Settlement risk is the risk of loss arising from trading/investment activities when there is a mutual undertaking to deliver on a progressive basis.
The Company has a well-structured credit process that spells out the guidelines and parameters within which the Company’s credit decision process takes place. For managing risks arising from counterparty investments, the Company has formulated a comprehensive policy for treasury investments.
The Company’s credit approval process plays the most vital role in credit risk management on a day-to-day basis. The process defines the principles about delegation of lending authority, client selection, due diligence in line with the Company’s risk appetite.
The Company uses various credit indicators to identify the emerging credit risks and analytical tools to manage such risks.
MA
NA
GE
ME
NT
DIS
CU
SS
ION
AN
D A
NA
LYS
IS

186 L B Finance PLC Annual Report 2017/18
CREDIT PROCESS
Credit Department & Credit Committee
Loan Origination
Loan Documentation & Disbursement
Post Disbursement Review
Credit Operations Department
Credit Department Recoveries Department Risk Management Department
Finance Department
Credit Approval
Risk Measurement
Disbursement
Credit Risk Assessment
Risk Monitoring
Security Documentation
Credit Evaluation
Collection & Recoveries
Preliminary Screening
Monitoring & Follow-up
Loan Origination
The credit process starts with the preliminary screening and credit appraisal. The objective of this process is to assess the borrower’s ability to meet its obligations in an objective manner. An investigation procedure takes place to assess physical verification of moveable and immovable assets, documentary evidence, references, income sources and the past payment history. This enables the Company to assess the default risk of the borrower.
The Company has clearly defined guidelines for credit approvals. Approving authority has been delegated based on seniority and experience. Approval limits have been set taking into consideration factors such as maximum counterparty exposures, loan to value ratio and forced sale value of the collaterised asset.
Loan Documentation and Disbursement
Credit Operations Department is responsible for facilitating an efficient disbursement process by ensuring that approved procedures are adhered to.
Post Disbursement Review
Initial monitoring and follow up activities are carried out by the Credit Department. Once a loan is overdue for more than the tolerance period, responsibility for recovery and collections is transferred to Recoveries Department. RMD reviews asset quality performance regularly. Delinquencies are handled early with effective follow ups and reminders. Swift recovery actions are taken against critical exposures.
Risk Management

L B Finance PLC Annual Report 2017/18 187
Management of Large Exposures
RMD takes an extra effort in closely monitoring large borrower exposures and aggregate exposure limits to manage the concentration risk whilst ensuring compliance to regulatory thresholds. RMD conducts an internal rating of significant exposures measured across five criteria listed below.
1. Individual/group exposure against capital funds
2. Loan to value (LTV) ratio
3. Repayment history and performance
4. Liquidity and recoverability of pledged collaterals
5. Length of relationship with the Company
CREDIT RISK MANAGEMENT
Default Risk – Moderate
Risk of the potential financial loss resulting from the failure of customer or counterparty to meet its debt or contractual obligations and arises principally from the Company’s loans and advances to customers.
Assessment
Non-performing loans ratio is monitored on a regular basis at branch level, regional level and company level for different product categories. The Company’s NPL ratio is also compared with similar sized peers and the industry for benchmarking.
2
3
4
5
6
7
8
NPL RATIO
%
20182017201620152014NPL Ratio (Gross)Industry*
*Industry is comprised of LFCs and SLCsas at 31 December 2017 Source: CBSL
The asset quality of the industry as a whole deteriorated during the year under review. Company has maintained its outperformance against the industry in terms of maintaining a much stronger overall asset quality. Company’s NPA ratio, expressed as a percentage of Industry NPA declined to 40% from 44% the year before.
0
20,000
40,000
60,000
800,00
100,000
120,000
0.0
0.5
1.0
1.5
2.0
2.5
3.0
3.5
4.0
4.5
5.0
GROSS LOANS & IMPAIRMENT PROVISION
Rs.Mn %
Gross Loans & AdvancesImpairment ProvisionImpairment ratio
20182017201620152014
The provision for impairment as a percentage of gross loans and receivables has increased as a result of the marginal increase in the NPL ratio.
-500
0
500
1,000
1,500
2,000
IMPAIRMENT CHARGE
Rs.Mn
20182017201620152014
40
60
80
100
120
PROVISION COVERAGE RATIO
%
20182017201620152014
0
20
40
60
80
100
AGE ANALYSIS OF PAST DUE LOANS
%
49.88% 44.39%
31.06% 32.03%
12.9% 14.94%
6.16% 8.64%
20182017
More than 90 days61 to 90 days31 to 60 daysLess than 31 days
MA
NA
GE
ME
NT
DIS
CU
SS
ION
AN
D A
NA
LYS
IS

188 L B Finance PLC Annual Report 2017/18
MAIN TYPES OFCOLLATERALS 2017/18
71%
7%
19%
3%
VehiclesGoldPropertyFinancial assets
70%
7%
20%
3%
VehiclesGoldPropertyFinancial assets
MAIN TYPES OFCOLLATERALS 2016/17
From total loans and advances 97.1 percent is secured by either physical or financial collaterals as at 31st March 2018.
Impairment Stress Test
Stressed scenario - Impairment charge increasing by stressed amounts impacting the Company’s capital adequacy ratio.
Current Total Capital Adequacy Ratio – 19.8%
Scenario 1 2 3
Magnitude of Shock
10.0% 25.0% 50.0%
Capital Adequacy Ratio
19.5% 19.1% 18.5%
Top 20 Customers Stress Test
Stressed Scenario - Top 20 customers falling into NPL category impacting the capital adequacy ratio
Current Total Capital Adequacy Ratio – 19.8%
Scenario 1 2 3
Magnitude of Shock
Top 5 Top 10 Top 20
Capital Adequacy Ratio
18.8% 18.4% 17.7%
0
10
20
30
40
50
60
70
80
LTV OF MAIN VEHICLE TYPES
%
Thr
eeW
heele
r
Small
Truc
k
Moto
rLo
rry
Moto
rCa
r
Dua
l Pur
pose
Vehic
le
20172018
During FY 2017/18 the Loan to Value ratio (LTV) of main vehicle classes decreased due to LTV caps imposed by the CBSL. The above classes of equipment represent 88.4% of vehicle backed portfolio.
Mitigation Strategies
Risk Management Strategy
Risk Management Objective
Adherence to clearly defined credit procedures and guidelines
Prevention
Thorough investigation of the customers’ background to assess creditworthiness
Prevention
Effective and timely recovery actions against delinquent borrowers
Reduction
Adherence to limits and guidelines defined in the Treasury Policy for Investments and Counterparty Limits
Prevention
Concentration Risk – Low
Concentration risk arises from uneven distribution of counterparties, business sectors or geographical regions.
Assessment
CREDIT EXPOSURE TO TOP 20 CUSTOMERS - 2017/18
97.9%
2.1%
Top 20 Customers Other Customers
Risk Management

L B Finance PLC Annual Report 2017/18 189
CREDIT EXPOSURE TO TOP 20 CUSTOMERS - 2016/17
97.9%
2.1%
Top 20 Customers Other Customers
Size wise exposure
The graph below depicts an analysis of exposure by customer size (consolidated exposure) based on net outstanding before impairment. This excludes gold loans customers; represents 80.9% percent of the total portfolio.
EXPOSURE BY CUSTOMER SIZE
19.3%
40.8%
13.0%
5.8%7.8%
8.7%4.4%
Rs. 0 - Rs.200,000Rs. 200,000 - Rs.500,000Rs. 500,000 - Rs.1,000,000Rs. 1,000,000 - Rs.5,000,000Rs. 5,000,000 - Rs.10,000,000Rs. 10,000,000 - Rs.25,000,000Above Rs. 25,000,000
PRODUCT CONCENTRATION - 2017/18
19.3%61%
20%
7%
5%4% 3%1% 0%
Lease Gold loans Mortgage loans Term loans Vehicle loans Power drafts
HP Factoring receivable Margin trading Quick loans
PRODUCT CONCENTRATION - 2016/17
19.3%62%
18%
7%
5%5% 2%1% 0%
Lease Gold loans Mortgage loans Term loans Vehicle loans Power drafts
HP Factoring receivable Margin trading Quick loans
INDUSTRY CONCENTRATION - 2017/18
19.3%46%
28%
17%
3%2%2%1%1%
ServicesAgricultureTradingManufacturing
RetailConstructionFinancial ServicesHotels
INDUSTRY CONCENTRATION - 2016/17
19.3%48%
23%
19%
4%2%2%1%1%
ServicesAgricultureTradingManufacturing
RetailConstructionFinancial ServicesHotels
GEOGRAPHICAL CONCENTRATION - 2017/18
19.3%52%
10%
9%
8%
4%4%
5%
5%
3%
WesternCentralNorth WesternSouthernEastern
SabaragamuwaNorth CentralUvaNorthern
GEOGRAPHICAL CONCENTRATION - 2016/17
19.3%52%
10%
9%
8%
4%4%
5%
5%
3%
WesternCentralNorth WesternSouthernEastern
SabaragamuwaNorth CentralUvaNorthern
MA
NA
GE
ME
NT
DIS
CU
SS
ION
AN
D A
NA
LYS
IS

190 L B Finance PLC Annual Report 2017/18
Mitigation Strategies
Risk Management Strategy
Risk Management Objective
Setting of prudential limits on maximum exposures which are reviewed periodically
Diversification
Strict adherence to single borrower limits defined by Finance Companies Direction No. 4 of 2006 issued by the Central Bank of Sri Lanka
Diversification
Board approved limits for maximum accommodations for a single counterparty
Diversification
Regular monitoring of exposure to single counterparty, single collateral type, industry and geographic area
Mitigation
LIQUIDITY RISK
Objective
Safeguard against funding constraints that prevent
growth and meet demands of depositors/investors
Trend
In the context of a financial institution, liquidity risk arises primarily due to the mismatches in the maturity profile of assets and liabilities. Liquidity risk for a financial institution can take two forms; market liquidity and funding liquidity.
Market liquidity risk is the inability to easily exit a position. The Company’s market liquidity risk is low if assets can be liquidated without moving the price too much.
Funding liquidity risk means the Company’s inability to finance assets continuously at an acceptable borrowing rate. Funding liquidity risk generally arises when creditors either withdraw credit or change the terms on which it is granted in such a way they are no longer profitable. Funding liquidity risk would increase if the Company’s credit quality is, or at least perceived to be, deteriorating, but also due to financial conditions as a whole are deteriorating.
The Company’s primary objective in liquidity risk management is to ensure adequate funding for its businesses throughout market cycles, including periods of financial stress. To achieve this objective the Company regularly monitors liquidity position and maintains an adequate buffer of liquid assets. The Company also maintains access to diverse funding sources to meet unforeseen liquidity requirements. All statutory and prudent liquidity ratios are monitored against tolerance limits and stress testing is carried out regularly to assess the effectiveness of liquidity management.
Assessment
-5,000
0
5,000
10,000
15,000
20,000
25,000
30,000
0
5,000
10,000
15,000
20,000
25,000
30,000
35,000
NET LIQUIDITY GAP BASED ON CONTRACTUAL MATURITIES
Rs.Mn Rs.Mn
Over 5
Y
On D
eman
d
0-3M
3-12
M
1-5Y
Net Liquidity Gap - 2018Net Liquidity Gap - 2017Cumulative Gap - 2018Cumulative Gap - 2017
60
65
70
75
80
85
90
DEPOSIT RENEWAL RATIO
%
Apr-1
7M
ay-17
Jun-1
7Ju
l-17
Aug-1
7Se
p-17
Oct-1
7No
v-17
Dec-1
7Ja
n-18
Feb-1
8M
ar-18
0
20
40
60
80
100
120
140
160
LOANS TO DEPOSIT RATIO
%
20182017201620152014
Risk Management

L B Finance PLC Annual Report 2017/18 191
The Company’s loan book is predominantly financed by deposits from customers. Loans to deposit ratio over 100% indicates that the Company is making the optimum use of deposit financing by transforming them into interest earning assets.
50
55
60
65
70
75
80
85
90
95
100
NET LOANS TO TOTAL ASSETS RATIO
%
20182017201620152014
The consistency in the net loans to total assets ratio of the Company reflects that the Company has maintained the share of loans and advances in total asset base reflecting its focus on growing core business, i.e., loans and advances.
Liquid Asset Ratio
The Company strives to maintain an adequate liquid asset buffer to mitigate risk arising from a sudden liquidity shortage.
0
2
4
6
8
10
12
14
16
18
20
LIQUID ASSETS TO DEPOSITS
%
20182017201620152014
The statutory liquid assets ratio has been maintained above the regulatory requirement at all times.
Stress Test on Liquid Asset Ratio
Stressed Scenario - Sudden fall in deposit base impacting liquid asset ratio.
Current Statutory Liquid Asset Ratio – 14.7%
Scenario 1 2 3
Magnitude of Shock
2.5% 5.0% 10.0%
Statutory Liquid Asset Ratio
12.2% 10.4% 6.5%
TOTAL FUNDING MIX - 2017/18
19.3%
60%
23%
13%4%
DepositsBorrowingsEquityOther
TOTAL FUNDING MIX - 2016/17
19.3%
59%
25%
12%4%
DepositsBorrowingsEquityOther
The previous graph depicts as at 31 March 2018, 83.5% of the Company’s total assets are funded by either borrowings or public deposits as opposed to 83.9% as at 31 March 2017.
INTEREST BEARING LIABILITIES MIX 2017/18
19.3%
72.3%
22.6%5.1%
DepositsDue to banksOther Borrowed Funds
INTEREST BEARING LIABILITIES MIX 2016/17
19.3%
70.1%
27.6%2.4%
DepositsDue to banksOther Borrowed Funds
Mitigation Strategies
Risk Management Strategy
Risk Management Objective
Proper coordination of funding activities between the Treasury and the deposit mobilisation units for optimum liquidity management
Diversification
MA
NA
GE
ME
NT
DIS
CU
SS
ION
AN
D A
NA
LYS
IS

192 L B Finance PLC Annual Report 2017/18
Risk Management Strategy
Risk Management Objective
Strengthening the contingency funding arrangements using standby facilities
Mitigation
Increasing the exposure to shorter duration assets to minimise maturity mismatches. Eg. Gold backed loans, factoring, daily loans, power drafts
Mitigation
Maintaining deposit renewal ratio above the internal threshold of 75%
Prevention
Promoting long-term deposits to improve asset liability matching
Diversification
Continuous analysis and monitoring of liquidity positions and, maintaining an adequate buffer of liquid assets
Prevention
MARKET RISK
Objective
Safeguard against adverse movement of market factors
arising out of price sensitivities of funding sources, investments,
commodity prices
Trend
Market risk refers to the possible losses to the Company that could arise from changes in market variables like interest rates, exchange rates, equity prices and commodity prices. Among them, interest rate risk and commodity risk have been identified as the most critical risks given the Company’s business profile.
In managing the market risk, Company uses a variety of quantitative methods to assess the Company’s market risk exposures, portfolio performance and impact on earnings. RMD in particular is responsible for quantifying the impact, advising the top management on acceptable tolerance levels and monitoring the set levels regularly.
Interest Rate Risk - Medium
Interest rate risk is a key component of the market risk exposure of the Company arising from adverse and unanticipated movements in future interest rates that could impact core business activities; granting of credit facilities, accepting deposits and issuing debt instruments, leading to fluctuations in earnings.
Due to the nature of operations of the Company, the impact of interest rate risk is mainly on the earnings of the Company rather than the market value of portfolios.
Excessive movements in market interest rate could bring severe volatility to Company’s net interest income and net interest margin. Company’s exposure to interest rate risk is primarily associated with factors such as;
» Re-pricing risk arising from a fixed rate borrowing portfolio where re-pricing frequency is different to that of the lending portfolio.
» Yield curve risk arising from unanticipated shifts of the market yield curve.
Interest rate risk is managed principally through minimising interest rate sensitive asset and liability gaps. In order to ensure interest rate margin and spreads are maintained, the Company conducts periodic reviews and re-prices its assets accordingly.
Assessment
Impact on the Company’s net interest income due to fluctuations in market interest rates is closely monitored on an ongoing basis. The Company uses the interest rate sensitivity of its assets and liabilities for modelling the financial impact. The table below illustrates the impact on net interest income from different interest rate scenarios.
Stress test on NII from parallel interest rate shocks
Annual Impact on NII
2018 2017
as at 31 March
Parallel Increase
‘000
Parallel Decrease ‘000
Parallel Increase ‘000
Parallel Decrease ‘000
1% (15,114) 15,114 (8,696) 8,696
2% (30,227) 30,227 (17,393) 17,391
3% (45,341) 45,341 (26,089) 26,089
Risk Management

L B Finance PLC Annual Report 2017/18 193
BORROWINGS - FIXED TO FLOATING MIX 2017/18
19.3%24.4%
75.6%
FloatingFixed
Mitigation Strategies
BORROWINGS - FIXED TO FLOATING MIX 2016/17
19.3%13.9%
86.1%
FloatingFixed
Risk Management Strategy
Risk Management Objective
ALCO closely monitors the interest rate movements, and issues directions to lending and borrowing units on interest rate strategies
Prevention
Making timely adjustment to the proportion of fixed rate borrowings in the funding mix
Diversification
Risk Management Strategy
Risk Management Objective
Promoting lending products with shorter re-pricing cycle to reduce interest rate sensitive gaps
Mitigation
Exploring opportunities to hedge the interest rate risk synthetically using interest rate swaps
Transfer
Negotiating interest rate caps on new borrowings
Mitigation
Commodity Price Risk - Low
Commodity price risk refers to the uncertainties of future market values and of the size of the future income, caused by the fluctuation in the prices of commodities. Given the significance of gold loans business to the Company’s overall lending operation, fluctuations in the gold prices could have an adverse impact on earnings. Gold price risk could arise from either of adverse movements in the world prices, exchange rates, basis risk between local and world prices. Gold price fluctuations lead to market risk which is the primary source of credit risk associated with this product.
Assessment
The Company has adopted a dynamic lending strategy to determine the Loan to Value ratio based on the global gold prices. Advance offered per gold sovereign is constantly adjusted in line with the gold market prices.
30,000
35,000
40,000
45,000
50,000
GOLD MARKET PRICE VS. MAXIMUM ADVANCED VALUE
LKR per22k Sov.
1M 22k AdvanceMarket Price 22k
Apr-1
7M
ay-17
Jun-1
7Ju
l-17
Aug-1
7Se
p-17
Oct-1
7No
v-17
Dec-1
7Ja
n-18
Feb-1
8M
ar-18
During the year under review, the Company managed to maintain a prudent loan to value ratio on new disbursements by dynamically adjusting the advanced value.
60
65
70
75
80
85
90
LOAN TO VALUE RATIO OF GOLD BACKED LOANS - NEW DISBURSEMENTS
LTV Ratio %
LTV Ratio
Apr-1
7M
ay-17
Jun-1
7Ju
l-17
Aug-1
7Se
p-17
Oct-1
7No
v-17
Dec-1
7Ja
n-18
Feb-1
8M
ar-18
Value at Risk (VaR) Analysis
The Company uses the VaR statistical model approach to estimate the potential loss/impairment provision arising from adverse price movements of gold under global market conditions. VaR is calculated based on Exponentially Weighted
MA
NA
GE
ME
NT
DIS
CU
SS
ION
AN
D A
NA
LYS
IS

194 L B Finance PLC Annual Report 2017/18
Moving Average (EWMA) method by assigning greater weight on the historical gold price data in the last 12 months. This method is used to place greater weight on recent price changes while diminishing the weight on older price changes.
VaR arising from global gold price fluctuations is calculated for both one day and one month periods, at a 99% confidence level and the increase in impairment charge over and above current impairment is shown below.
Stress test on impairment charge from scenarios of gold price shocks derived from VaR model
EWMA VaR at Price USD 1,323 per Troy Ounce (as at 31 March 2018)
Time Horizon Confidence Level
Price at 99% VaR
Impairment Impairment Increase
USD ‘000 ‘000
Daily 99% 1,301 2,795 801
Monthly 99% 1,219 6,651 4,657
Mitigation Strategies
Risk Management Strategy
Risk Management Objective
Shorter product life: The Company, as a credit risk management strategy, lends for shorter periods allowing it to initiate its recovery process faster.
Mitigation
Frequent revisions to the advance offered per gold sovereign: The Company practices a process of revising advance offered per sovereign to reflect market value fluctuations to maintain the desired loan to value ratio
Mitigation
The Company is in the process of exploring opportunities available for hedging the commodity price risk
Transfer
Exchange Rate Risk – Low
Exchange rate risk is the risk of loss as a result of unhedged exposure to volatility in the local (LKR) exchange rate with other major currencies. Exchange risk could materialise as an indirect risk too, affecting local gold prices resulting in exaggerated commodity risk. Company is exposed to two types of risk caused by currency volatility.
Transaction risk – This risk arises whenever the Company has contractual cash flows (receivables and payables) whose values are subject to unanticipated changes in exchange rates due to a contract being denominated in a foreign currency. This type of exposure is short-term to medium-term in nature.
Translation risk – This exposure arises from the effect of currency fluctuations on a company’s Consolidated Financial Statements, particularly when it has foreign subsidiaries. This type of exposure is medium-term to long-term.
Assessment
Indirect impact intensifying the commodity price risk due to changes in local gold prices as a result of the fluctuations in the USD/LKR exchange rate even as global gold prices remain steady.
Mitigation Strategies
Risk Management Strategy
Risk Management Objective
Managing the risk arising from the USD/LKR exchange rate volatility through maintaining an adequate safety margin on gold advances
Mitigation
Equity Price Risk – Low
This is the risk of loss based on market changes in the value equity investments. Although the Company’s exposure to equity price risk is negligible, mark-to-market calculations are conducted monthly on HFT and AFS portfolios.
OPERATIONAL RISK
Objective
Improve the reliability and effectiveness of business operations and enhance
organisational capability in ensuring safety of staff.
Trend
Risk Management

L B Finance PLC Annual Report 2017/18 195
Operational risk is defined as the risk of loss resulting from inadequate or failed internal processes, people and systems or from external events (Basel II definition). Operational risk may result in a financial loss and a reputation risk to the Company. Company broadly identifies, assesses and aims to mitigate the following operational risk categories.
1. Internal fraud
2. External fraud
3. Work place safety
4. Business disruptions
5. Process risk
6. Damage to physical assets
Assessment
» Operational process reviews are conducted regularly to identify loopholes in the operation
» Collating internal and external fraud event report
» Independent IT system audits on all core applications and system security
» Analysing the number of system break downs, telecommunication failures, malfunctions and hacking events
Mitigation Strategies
Risk Management Strategy
Risk Management Objective
Segregation of duties, well-defined demarcated responsibilities for employees, use of procedural manuals, dual controls
Prevention
Risk Management Strategy
Risk Management Objective
Periodic internal audits are conducted covering the entire branch network. The scope of the audit includes the review of adequacy and application of accounting, financial and operational controls
Prevention
Transferring insurable risk by obtaining insurance policies
Transfer
Installing access control to identified high impact areas
Prevention
Staff training on technical aspects to comply with security regulations
Prevention
Conducting post completion audits after a successful implementation of system change/modification
Mitigation
Disaster recovery planning and business continuity planning
Mitigation
Obtaining ISO 27001 certification to ensure information system security
Prevention
Use of exception reports and data analytics for detecting trends and unusual transactions
Prevention
Risk Management Strategy
Risk Management Objective
Accessing the adequacy and effectiveness of the insurance coverage periodically
Prevention
OTHER RISKS
STRATEGIC RISK
Objective
To minimise risks associated with Company’s business strategy,
strategic objectives and strategy execution
Trend
Strategic risk can be seen as the impact on the Company’s earnings or capital, due to poor business policy decisions, improper implementation of business strategies or lack of responsiveness to industry changes. Hence, strategic risk could arise due to internal or external factors.
Assessment
Conducting reviews of pre and post implementation financial performance for every product, project and investment.
MA
NA
GE
ME
NT
DIS
CU
SS
ION
AN
D A
NA
LYS
IS

196 L B Finance PLC Annual Report 2017/18
Mitigation Strategies
Risk Management Strategy
Risk Management Objective
Quarterly budget reviews
Mitigation
Monthly variance analysis on key income and expense items
Mitigation
REPUTATIONAL RISK
Objective
Safeguard the Company’s brand value/goodwill against adverse
internal and external events
Trend
Reputational risk arises from an event or behaviour that could adversely impact market ‘perception’ of the Company’s goodwill. As reputation itself is a valuable business asset, the Company takes great care in the management of reputation risk. The exponential growth in channels of communication especially social media increases the risk of exposure to Reputational risk given the extent of freedom allowed to a wider spectrum of stakeholders directly and indirectly associated with the Company’s business. As all other types of risks impact reputation risk, efficient management of other risks also forms part of our management of reputational risk.
Assessment
» Evaluation of the effectiveness of CSR projects against the stated objectives
» 32 CSR events were carried out during the year incurring a cost of Rs. 23.5 million
» Evaluation of the number of customer complaints and types of complaints
Mitigation Strategies
Risk Management Strategy
Risk Management Objective
Sustainability Committee to play a key role in conceptualising and monitoring CSR initiatives
Mitigation
Close monitoring of any events which could lead to reputational risk by adopting an early warning system including media reports, social media content, inputs from front-line staff and market survey results
Mitigation
Training employees on work place professionalism, behaviour and educate them on business ethics
Prevention
Swift and efficient process of resolving customer complaints.
Prevention
CAPITAL ADEQUACY
Objective
Maintain adequate capital buffers to withstand unexpected losses
Trend
For a financial institution capital is a buffer against insolvency. It is available to absorb unforeseen losses which asserts the Company’s ability to continue operations in to the foreseeable future. The more capital the Company has relative to the risks it takes, the more confident the stakeholders are that it will meet its obligations to them. the Company’s capital management process is steered with the aim of holding sufficient capital to support the Company’s risk appetite whilst maintaining adequate capital to meet minimum regulatory capital requirements.
As of 31 March 2018, the Company reported a Tier 1 ratio of 17.3% and a total of Tier I & II of 19.8% which remain comfortably above the CBSL’s minimum capital requirements.
Risk Management

L B Finance PLC Annual Report 2017/18 197
Mitigation Strategies
Risk Management Strategy
Risk Management Objective
Periodic review of the impact from different lending products on the Risk Weighted Assets and in turn on the capital adequacy ratio for necessary remedial actions using projected balance sheet scenarios
Mitigation
READINESS TO THE PROPOSED CAPITAL ADEQUACY FRAMEWORK
CBSL issued the first consultation paper on the new capital adequacy framework on 9 Aug 2017 and the second consultation paper was issued on 13 Oct 2017, further revising the capital adequacy framework.
From 1 Jan 2019 onwards LFCs/SLCs are required to maintain a Tier 1 ratio of 6% and a Total Capital ratio of 12% at all times. Following key amendments have been proposed under the new framework.
» Introduction of operational risk charge
» Revised definition for retail claims (Residential Mortgages and Gold Loans)
» Amendments to risk weights and credit risk categories
» Introduction of Credit Risk Mitigation techniques
The table below demonstrates a comparison between the existing and proposed capital adequacy frameworks.
As at 31 March 2018 (‘000) Existing CAR New CAR
Risk Weighted Amount for Credit Risk 88,549,681 87,515,016
Risk Weighted Amount for Operational Risk
- 17,944,483
Total Risk Weighted Amount 88,549,681 105,459,498
Tier I Capital 15,348,896 15,233,171
Tier II Capital 2,168,550 3,183,838
Total Capital 17,517,446 18,417,009
Regulatory Minimum Tier I Ratio % 5.0% 6.0%
Company’s Tier I Ratio % 17.3% 14.4%
Regulatory Minimum Total Capital Ratio % 10.0% 12.0%
Total Capital Ratio % 19.8% 17.5%
INFORMATION SECURITY RISK
Objective
Safeguard information asset and ensure business continuity
Trend
Company has identified information as a vital business resource and a key asset to the organization. Hence, any threat exploiting the vulnerabilities of this valuable and important asset can cause adverse impact to the business operation ranging from simple inconvenience to catastrophic in scale. This includes but not limited to events such as cyber-attacks, breakdowns, failures or interruptions which result in a system down time, frauds and malpractices through errors and manipulations, technological obsolescence and insufficient or ineffective infrastructure to support evolving business needs, falling behind the competitors in terms of the information technology.
Since every aspect of business relies heavily on Information Technology, it has emerged as the backbone of and the live wire of the organizations operations and innovations. As a result Information Security risk is recognized as a significant portion of the potential operational risk.
In this context, Company has recognized information, information systems and technical infrastructure as assets of paramount importance and value to the organization. Therefore, with the objective of identifying and managing all IT-related risks effectively and efficiently in a consistent manner across the organization, Company has rolled out a comprehensive Information Technology Risk Management Framework.
IT risk mitigation methodology involves prioritizing, evaluating and implementing the appropriate risk treatment techniques such as technical, operational and management controls to prevent identified risks exploiting the vulnerabilities. This process is strengthened by the implementation of the Company’s Information Security Management System
MA
NA
GE
ME
NT
DIS
CU
SS
ION
AN
D A
NA
LYS
IS

198 L B Finance PLC Annual Report 2017/18
(ISMS), which was established according to the ISO/IEC 27001:2013 standard. With the implementation of ISMS, following information security objectives have been identified:
ISMS Objectives
» Establish safeguards to protect Company’s information/information systems from theft, abuse, misuse and any form of damages.
» Assess and evaluate the established control mechanism and implement corrective and preventive actions.
» Maintain the confidentiality, integrity and availability of information.
Company first obtained the ISO/IEC 27001 Information Security Standard in 2014 and received recertification in 2017, Company has continued to demonstrate its commitment towards information security by maintaining certification throughout the years.
As a part of IS Risk assessment and mitigation methodology, IS Audit & Compliance Division conducts independent IS risk reviews and audits of new IS developments/modifications whilst carrying out regular system and security audits for each system related functions.
Cyber Risk Management is key focus areas of IS Risk Management function in light of heightening threats of cyber-attacks which are continuously escalating in scale and sophistication. The Company obtains the service from an independent service provider to conduct cyber security related vulnerability
assessments and surveys periodically. In addition, as a proactive measure to combat growing external threats, the Company obtains Information Security Operations Centre service from an external service provider with Online Monitoring System capability.
At present the Company’s Cyber Security strategies include but not limited to evaluating vulnerabilities by conducting regular network vulnerability assessments covering external and internal security vulnerabilities, comprehensive web application security vulnerability assessment, comprehensive firewall security assessment and wireless network security assessment.
Assessment
» Conducting information security review meeting with key functional heads.
» Monitoring of system audit trails to identify patterns and anomalies.
» Preforming systems audit for every core system module before deploying into production environment.
» Thorough post implementation review following the changes to IT systems or technical infrastructure, to ensure no unintended repercussions have occurred.
» Analysis of information security related incidents to identify the gaps and loopholes in the information system and infrastructure.
Mitigation Strategies
Risk Management Strategy
Risk Management Objective
Regular company wide awareness of Information Security risk management measures currently in pace
Prevention
Strict adherence to documented IT change management process
Prevention
Strengthening of NDAs with vendors by inclusion of information security clause
Prevention
Implementation of disciplinary action procedure for information security violations
Prevention
Promoting clear desk and clear screen policy
Prevention
LEGAL / REGULATORY RISK
Objective
To minimize the cost of non-compliance and litigation
Trend
Risk Management

L B Finance PLC Annual Report 2017/18 199
Legal/Regulatory risk is the risk of loss caused by non-compliance with existing or new legislation or supervisory regulations, disadvantageous changes to existing laws or supervisory regulations. Furthermore, legal risk includes losses due to ambiguity of laws or unfavourable contract clauses and loose contracts.
The Company conducts its business in accordance with the Company’s code of conduct, laws and regulations imposed by the regulatory authorities with zero tolerance for failure or breach of such obligations.
Assessment
» Internal audit reviews are carried out to assess the extent of compliance at branch and departmental level.
» Regular monitoring of compliance with the directions issued by the regulator.
Mitigation Strategies
Risk Management Strategy
Risk Management Objective
Compliance function regularly reviews the Company’s compliance with rules, directions and determinations of regulatory bodies
Prevention
HUMAN RESOURCE RISK
Objective
To ensure the availability of skilled and competent human
resources to successfully conduct business operations.
Trend
Human Resource risks are events that prevent employees from fulfilling their responsibilities and thus keep the business from operating at full efficiency. Human resource risks include but are not limited to;
» High employee turnover
» Poor employee management practices
» Unexpected temporary leave
» Management error/incompetence
» Disability (temporary or permanent) death of employees/s
Assessment
» Conducting employee engagement surveys to assess the level of motivation, engagement and loyalty
» Analysis of employee turnover ratios across different employee job categories
» Analysis of skill gaps among operational and front office staff
» Review of causes for resignations through exit interview data
Mitigation Strategies
Risk Management Strategy
Risk Management Objective
Training and development to help employees to improve their skills to be better at their current job and prepare for future challenges
Mitigation
Strengthen the process for grievance handling and offer work place counselling
Prevention
MA
NA
GE
ME
NT
DIS
CU
SS
ION
AN
D A
NA
LYS
IS

200 L B Finance PLC Annual Report 2017/18

L B Finance PLC Annual Report 2017/18 201
CAPITAL REPORTS
A Matter of Execution
Process ExcellenceCustomer-centricityDriving InnovationThe Right ExpertiseHolistic Value Creation

Financial CapitalWHY FINANCIAL CAPITAL VITAL TO LBF
Financial capital is important because it’s that part of an assets which can be uses to repay it’s depositors, customers and other claims as well as absorb “economic” shocks at troublesome time.
MATERIAL DRIVERS
Continuous performance management to improve top-line
Disciplined cost management to improve cost to income ratio and thereby strengthen the bottom line
Ongoing liquidity management to maintain a healthy fund position
Delivering consistent shareholder return
ACTION PLANS & OBJECTIVES STATUS PAGE
Focus more on non-traditional financial product
Loan and advances grew by 14.80%
212
Bring the NIM to the historical average level
NIM recorded at 11.15%
208
Structural cost transformation mechanism focus on physical, fiscal and funding level
Cost to income ratio recorded at 37.48%
209
Diversification of funding sources Borrowings 23.84% of the funding base
212
Achieved
In progress
Not achieved
SNAPSHOT OF CAPITAL OUTCOMES
IMPACT AREA WHAT YOU WILL FIND WHERE TO FIND
Profit maximisationROE30.52%
Overview of financial results
Risk capitalCapital adequacy (Tier I+II) 19.80%
Credit riskNPL 2.37%
Credit quality
PAGE 207
PAGE 211
202 L B Finance PLC Annual Report 2017/18

L B Finance PLC Annual Report 2017/18 203
Rs.72.9 billion
Rs.120 billion
A-(lka) rating
2.37%
Rs.6.48 billion
DEPOSIT BASE REACHED
ASSET BASE SURPASSED
FITCH RATINGS REAFFIRMED
(YOY 20.76%)
(YOY 17.57%)
WITH STABLE OUTLOOK
NPL MAINTAINED BELOW THE INDUSTRY AVERAGE
HIGHEST-EVER PBT
Online version available
IN A NUTSHELL
Accomplish financial excellence and generate year-on-year improvements in all key financial indicators
Cost optimisation
Readiness for the new Inland Revenue Act
Implementation of SLFRS 9 Expected Credit Loss
OUR NEXT STEPS
Objectives for 2018/19
» Re-engineering and resizing the Company Balance Sheet to optimise the risk and return equation
Objectives for 2020 & beyond
» Upgrade the credit rating to next level
» Shareholders value creation through minimum volatility of earnings
PAGE 205 PAGE 205 PAGE 205
CHALLENGES
CA
PIT
AL
RE
PO
RT
S

204 L B Finance PLC Annual Report 2017/18
Financial Capital
VALUE CREATION AMONG CAPITALS
How we manage and utilise our financial capital is fundamental to our ability to create sustained value for our stakeholders, particularly the financial stakeholders. Our ability to access cost-effective funding either through equity or debt is a key determinant of our commercial success. Our debt metrics have been further strengthened, and the Group’s ability to manage its total cost of capital makes a significant contribution to sustainability and the ability to fund expansion of its distributable income.
BENEFIT TO
CUSTOMERS
SOCIETY/COMMUNITY
INTELLECTUAL CAPITAL
» Rs 8.56 million worth of investment in training
FINANCIAL CAPITAL
» Return on Equity (ROE) 30.52%
» Return on average assets (ROA) 3.80%
» Earning per share (EPS) Rs 30.69
HUMAN CAPITAL
» Profit per employee Rs. 1.24 million
» Asset per employee Rs 35.11 million
NATURAL CAPITAL
» Rs 3.51 million on environment conservation projects
MANUFACTURED CAPITAL
» Invested Rs. 194.49 million in IT infrastructure
SOCIAL & RELATIONSHIP CAPITAL
» Growth in deposit base 20.76%
» Growth in lending portfolio 14.80%
» Rs. 11.08 billion economic value generated to depositors and lenders
EMPLOYEES
BUSINESS PARTNERS
SHAREHOLDERS

L B Finance PLC Annual Report 2017/18 205
HOW WE FACE THE CHALLENGES
Implementation of SLFRS 9 Expected Credit Loss
The work process started during 2016 and did the impact assessment for the financial year 2016/17 and 2017/18.
Cost Optimisation
Process improvements and organisation design to reduce complexity and improve productivity.
Readiness for the new Inland Revenue Act
Conduct impact analysis
SWOTANALYSIS
Strengths
Opportunities
Weaknesses
Threats
Strong operational ratios and NPL far better than industry
Strong and transparent balance sheet
Diversified business model across lending, including all varieties of lending products
Low saving account base Causing cost of funds to be high
Share prices does not reflect the true value
Untapped micro finance industry locally and globally
CBSL’s new capital rules will strengthen NBFI sector
Can increase the market share in the corporate sector
Monetary polices focus on curtailing credit growth
Unstable players create NBFI market turbulence and low public confidence
L B Microfinance Myanmar
CA
PIT
AL
RE
PO
RT
S

206 L B Finance PLC Annual Report 2017/18
OUR PHILOSOPHYStrive to accomplish financial excellence and generate year-on-year improvements in all key financial indicators that enable LBF to fulfil the expectations of the providers of capital.
MANAGEMENT APPROACHLBF’s approach to Financial Capital management seeks to establish guidelines for the administration and control of the Company’s funds in accordance with our goals and objectives and to make sound financial decisions to safeguard assets. The policies and procedures governing our financial management approach broadly include; risk management, strategic planning, budgeting, revenue management, cost control, internal control, treasury and liquidity management as well as asset quality management.
Our commitment to financial excellence encompasses accurate financial disclosures and reporting in line with the methodologies prescribed by all relevant financial reporting standards applicable to publicly listed companies in Sri Lanka. Over and above this, we also comply with additional requirements stipulated by the CBSL for financial services institutions. Please refer the Notes to the Financial Statements on page 324 for complete details of all applicable standards.
LBF’s Financial Capital refers to the financial resources available to the Company, mainly the equity debt capital, retained earnings and short-term and long-term debt capital, including bank borrowings and deposits mobilised from the general public.
Financial Capital

L B Finance PLC Annual Report 2017/18 207
OVERVIEW OF FINANCIAL RESULTS LBF recorded 8.50% year-on-year (YoY) increase in its net profit attributable to common shareholders to Rs. 4.25 billion in 2017/18. Net interest income reported a higher YoY growth of 21.41 percent to Rs. 11.90 billion in the period due to decreased cost on servicing deposits at the latter part of the financial year. The Company continued to maximise shareholder wealth during the year with earnings per share improving to Rs. 30.69. L B announced an interim dividend of Rs. 7 per share in March 2018 and expects to increase its payout to Rs. 11.00 per share for the financial year
as against Rs. 9.00 per share distributed in 2017/18.
0
2
4
6
8
10
12
25
30
35
40
DIVIDEND PER SHARE AND DIVIDEND PAYOUT RATIO
Rs. %
20182017201620152014DPS Dividend Payout Ratio (%)
Financial highlights 31 March 2018 Rs. ’000
31 March 2017 Rs. ’000
Total assets 120,820,780 102,763,035
Investments 8,294,898 7,658,682
Loans (net of impairment) 102,345,084 89,149,743
Deposits by the public 72,943,833 60,401,955
Interest bearing liabilities 27,990,870 25,822,363
Net profit after tax 4,250,721 3,918,204
Total comprehensive income 4,224,360 3,900,303
Return on equity 30.52% 34.09%
Cost to income ratio 37.48% 39.01%
Earnings per share (Rs.) 30.69 28.29
Dividend per share (Rs.) 11.00 9.00
As we continue to develop sustainable revenue streams while exercising prudent risk management, our core business is performing well with a strong growth in loan volumes. Cost to income ratio (i.e. total operating expenses excluding impairment as a percentage of total operating income excluding impairment) decreased from 39.01% in 2016/17 to
37.48% in 2017/18 due to higher net interest margins and operating income has grown at a faster rate than operating expense. Operating expenses grew by 15.35% YoY to Rs. 5.06 billion and total operating income grew by 20.41% YoY to Rs. 13.55 billion in 2017/18.
We are one of the largest non-banking financial institutions in Sri Lanka with a total asset base of Rs. 120.82 billion. Our total loan book expanded by Rs. 13.73 billion to Rs. 105.21billion and customer deposits increased by Rs. 12.54 billion to Rs. 72.94 billion in 2017/18. Growth was mainly derived from gold loan and leasing products. Non-performing loans as a percentage of gross loans increased slightly by 0.23% from 2.14% last year.
Capital base grew by Rs. 2.84 billion during the year and remained well above the minimum capital requirement by the regulator. This further solidified our resilience to the anticipated increase in capital adequacy requirements.
STRUCTURAL COST TRANSFORMATIONWe are optimising our operations to be able to better serve our customers and lower costs. To build more efficient, agile, and better company we are investing in levers such as technology, process improvements and organisational design to reduce complexity and improve productivity. We also maintain our thrust of identifying synergies and leverage opportunities for partnerships to improve our structure. Over the long- term our intention is to lower operating costs while we deliver a superior experience to customers and generate good shareholder value. System and process revamping, transformation from legacy systems to modern systems, digital transformation and infrastructure investments are some leads for the structural cost transformation. These will be discussed in detail in other capital sections.
CA
PIT
AL
RE
PO
RT
S

208 L B Finance PLC Annual Report 2017/18
FINANCIAL PERFORMANCE
INTEREST INCOME
Total Interest Income grew by 30.62% YoY to Rs. 23.40 billion in 2017/18 with improved business volumes and increasing rates. All the major business segments such as loans, leases and Treasury contributed to the growth. L B managed its risk and return at both product level and business levels.
0
5,000
10,000
15,000
20,000
25,000
GROSS INTEREST INCOME
Rs.Mn
201820172016Leasing and Stock out on HireLoans and ReceivablesOthers (including Treasury)
NET INTEREST INCOME
Net interest income grew by 21.41% to Rs. 11.90 billion in 2017/18 with increased loan volumes coupled with reduction in the deposit rates latter part of the year.
Total interest earning assets increased by 14.50% YoY to Rs. 113.50 billion while net interest margin (net interest income as a percentage of average earning assets) or NIM increased by 41 basis points as of March 2018. Year-on-year yields on lending assets increased by 145 basis points caused by gradual increase in lending rates. However rapid pace of re-pricing in the short-term deposit base as against loans, especially leases
with longer-term tenure and fixed rates, impacted negatively on net interest margin. Though in the latter part of the year deposit had been repriced at a lower rate, in the early part of the year deposits had been repriced at a higher margin.
0
3,000
6,000
9,000
12,000
15,000
NET INTEREST INCOME
Rs.Mn
201820172016Leasing and Stock out on HireLoans and ReceivablesOthers (including Treasury)
OTHER OPERATING INCOME
Other operating income (i.e. total income other than interest income) decreased 39.34% YoY to Rs. 148.20 million during the year. The reduction was mainly driven by a non-recurring profit from sale of land held for trading amounting to Rs. 185 million during 2016/2017. Meanwhile fees and commissions grew by 24.38% YoY to Rs. 1.50 billion directly as a result of higher transaction volumes.
Income from documentation charges increased by 25.57% YoY to Rs. 924.44 million during the period. All other fees have increased along with transaction volumes.
0
600
1,200
1,800
OTHER OPERATINGINCOME
Rs.Mn
20182017201620152014
NON-INTEREST EXPENSES
Non-interest expenses increased by 15.35% YoY to Rs. 5.06 billion in 2017/18 consistent with the business growth. Salaries and employee benefits increased 13.62% to Rs. 2.40 billion and represented 47.36% of the total operating expenses in 2017/18 (48.08% in 2016/17).
Office administration and establishment expenses mainly include rent on premises, electricity, insurance (both general and health), security, printing and stationery, postage and telecommunication. The growth of office administration and establishment expenses was driven by higher transaction volumes, opening new branches and growth in employment. During the year the Company added five new branches to its island-wide network.
The Company managed to maintain its cost per employee and administration and establishment expenses per branch within the budgeted levels for the last five years consecutively.
Advertising and business promotion expenses increased 17.34% YoY to Rs. 579.03 million. We firmly believe that the continuous reminders and awareness will generate solid business
Financial Capital

L B Finance PLC Annual Report 2017/18 209
growth. Business volume is one of the Key Performance Indicators (KPI) and the Company achieved a continuous volume growth even under stiff competition and in a highly-regulated environment. Our cost to income ratio has been improved by 1.53% during the year.
0
10
20
30
40
50
COST TOINCOME RATIO
%
20182017201620152014
0
1,000
2,000
3,000
4,000
5,000
6,000
EXPENSESCOMPOSITION
Rs.Mn
Personnel ExpensesAdministration ExpensesAdvertising and Business Promotion expense
20182017201620152014
TAXES
Taxation includes both direct taxes such as income tax and financial service taxes and indirect taxes include Value Added Tax (VAT), Withholding Tax, PAYE Tax and Stamp Duty. The effective tax rate increased slightly by 1.07% from 33.31% to 34.38%.
The Company has a responsibility as a taxpayer. The Company has a tax strategy that outlines the framework by which the Company’s tax obligations are met from an operational and risk management perspective. We adopt an overarching risk philosophy in relation to tax matters which aims to mitigate any adverse or unexpected financial consequences and protect our reputation. Total tax actually paid by our financial operations amounted to Rs. 2.93 billion (2017: Rs. 2.73 billion) and tax collected from third parties and employees amounted to Rs. 1.08 billion (2017: Rs. 1.06 billion).
TAX INCURRED2018
52%
37%
5%4%
2%
Income TaxValue Added Tax on Financial ServicesNation Building Tax on Financial ServicesCrop Insurance LevyEconomic Service Charge
Tax incurred - 2018
Tax incurred Rs. million
Income tax 1,638
Value added tax on financial services
1,179
Nation building tax on financial services
157
Crop insurance levy 54
Economic service charge
118
TAX COLLECTED2018
31%
29%
30%
7%3%
Income TaxValue Added Tax on Financial ServicesNation Building Tax on Financial ServicesCrop Insurance LevyEconomic Service Charge
Tax collected and paid - 2018
Tax collected and paid
Rs. million
Value added tax 330
Stamp duty 316
Withholding tax on dividend and interest
329
PAYE tax 78
Nation building tax 32
CA
PIT
AL
RE
PO
RT
S

210 L B Finance PLC Annual Report 2017/18
Financial highlights 2018 Rs. ‘000
2017 Rs. ‘000
2016 Rs. ‘000
Profit before taxes 7,814,383 6,901,944 5,918,067
VAT on financial services 1,336,693 1,027,101 593,452
Profit after VAT on financial services
6,477,690 5,874,843 5,324,616
Current income tax 1,658,320 1,595,055 1,479,084
Deferred income tax 568,648 361,584 127,739
Taxation charge 2,226,969 1,956,639 1,606,823
Effective tax rate (taxation charge/profit after VAT on FS)
34.38% 33.31% 30.18%
Total tax expense including VAT on financial services, NBT and income tax increased by 19.44% YoY to Rs. 3.56 billion in 2017/18. Income tax expense increased by 13.82% YoY to Rs. 2.23 billion while VAT on financial services increased by 30.14% YoY to Rs. 1.34 billion during the year. Increased VAT on financial services was mainly caused by increased taxable income subjected to VAT on financial services. This is related to the leasing portfolio, where new leases with no direct VAT,
gradually replacing the old leases that were subjected to direct VAT. Income related to old leases was not subjected to VAT on financial services; however income related to new leases is liable to VAT on financial services. Taxable income component subjected to VAT on financial services in the total income from the leasing portfolio increased to 92% in 2017/18 from 85% in 2016/17. We believe that the current ratio of 92% is at its maximum level.
Deferred tax liability mainly arises due to the exponential growth in lease portfolio during the last three years. The lower tax base due to the higher amount of capital allowance claimed and the higher accounting base due to the lower amount of amortisation (EIR method) have created a temporary liability gap between tax base and accounting base. However, the new Inland Revenue Act No. 24 of 2017 has discontinued the current method of computation for taxes on finance leases. In future for new lease disbursements capital allowance will not be available and the net interest income will be taxed. Hence temporary differences between the accounting lease base and tax lease base will not arise in the future (only for disbursements effective from 01-04-2018, current temporary difference will reverse over gradually).
Current deferred tax liability is Rs. 1.06 billion and deferred tax liability due to leases is Rs. 922.21 million which will be reversed within a six-year period.
Current Rs. million
2019 Rs. million
2020 Rs. million
2021 Rs. million
2022 Rs. million
2023 and above Rs. million
Deferred tax liabilities (at the FY end)
922.21 227.56 -4.91 307.46 577.94 13.53
LOANS AND RECEIVABLES SEGMENT (+19.72 PERCENT)
Gross loans and receivables grew by 19.72% or Rs. 6.71 billion to Rs. 40.72 billion in 2017/18 mainly driven by key loan segments – gold loans, and medium- and short-term loans, mortgages and power drafts. At present the Company does not promote vehicle loans due to the undifferentiated nature of Value Added Tax (VAT) implications when compared to leasing product after the
removal of direct VAT from finance leases. Factoring portfolio in the loans and receivables increased by 58.88% on gross basis due to increase in the new client acquisition. Company is gradually withdrawing from the real estate business; hence the real estate loan portfolio continues to decline.
LEASE RENTALS RECEIVABLE AND STOCK OUT ON HIRE SEGMENT (+12.23 PERCENT)
Lease rentals receivable and stock out on hire grew by 12.23% or Rs. 7.03 billion to Rs. 64.50 billion, mainly driven by increased leasing volumes. Hire purchases are not aggressively promoted by the Company due to the undifferentiating nature of Value Added Tax (VAT) implications compared to leases.
Financial Capital
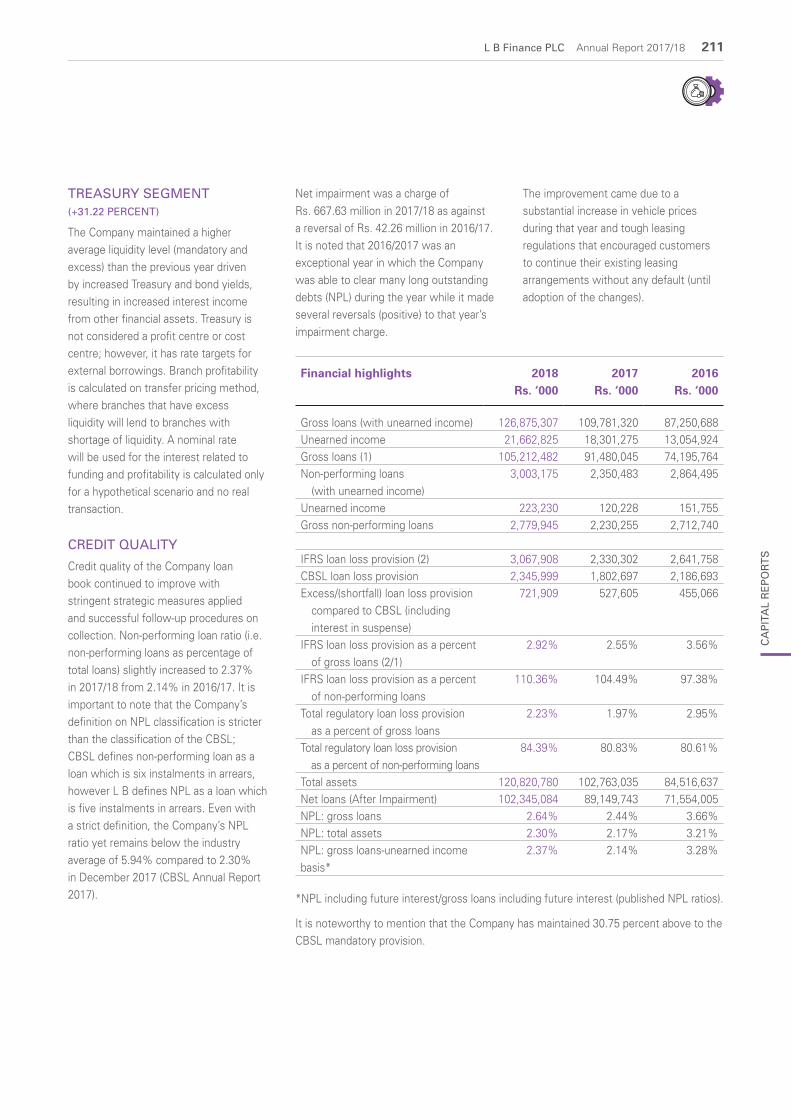
L B Finance PLC Annual Report 2017/18 211
TREASURY SEGMENT (+31.22 PERCENT)
The Company maintained a higher average liquidity level (mandatory and excess) than the previous year driven by increased Treasury and bond yields, resulting in increased interest income from other financial assets. Treasury is not considered a profit centre or cost centre; however, it has rate targets for external borrowings. Branch profitability is calculated on transfer pricing method, where branches that have excess liquidity will lend to branches with shortage of liquidity. A nominal rate will be used for the interest related to funding and profitability is calculated only for a hypothetical scenario and no real transaction.
CREDIT QUALITY
Credit quality of the Company loan book continued to improve with stringent strategic measures applied and successful follow-up procedures on collection. Non-performing loan ratio (i.e. non-performing loans as percentage of total loans) slightly increased to 2.37% in 2017/18 from 2.14% in 2016/17. It is important to note that the Company’s definition on NPL classification is stricter than the classification of the CBSL; CBSL defines non-performing loan as a loan which is six instalments in arrears, however L B defines NPL as a loan which is five instalments in arrears. Even with a strict definition, the Company’s NPL ratio yet remains below the industry average of 5.94% compared to 2.30% in December 2017 (CBSL Annual Report 2017).
Net impairment was a charge of Rs. 667.63 million in 2017/18 as against a reversal of Rs. 42.26 million in 2016/17. It is noted that 2016/2017 was an exceptional year in which the Company was able to clear many long outstanding debts (NPL) during the year while it made several reversals (positive) to that year’s impairment charge.
The improvement came due to a substantial increase in vehicle prices during that year and tough leasing regulations that encouraged customers to continue their existing leasing arrangements without any default (until adoption of the changes).
Financial highlights 2018 Rs. ‘000
2017 Rs. ‘000
2016 Rs. ‘000
Gross loans (with unearned income) 126,875,307 109,781,320 87,250,688Unearned income 21,662,825 18,301,275 13,054,924Gross loans (1) 105,212,482 91,480,045 74,195,764Non-performing loans (with unearned income)
3,003,175 2,350,483 2,864,495
Unearned income 223,230 120,228 151,755 Gross non-performing loans 2,779,945 2,230,255 2,712,740
IFRS loan loss provision (2) 3,067,908 2,330,302 2,641,758 CBSL loan loss provision 2,345,999 1,802,697 2,186,693 Excess/(shortfall) loan loss provision compared to CBSL (including interest in suspense)
721,909 527,605 455,066
IFRS loan loss provision as a percent of gross loans (2/1)
2.92% 2.55% 3.56%
IFRS loan loss provision as a percent of non-performing loans
110.36% 104.49% 97.38%
Total regulatory loan loss provision as a percent of gross loans
2.23% 1.97% 2.95%
Total regulatory loan loss provision as a percent of non-performing loans
84.39% 80.83% 80.61%
Total assets 120,820,780 102,763,035 84,516,637 Net loans (After Impairment) 102,345,084 89,149,743 71,554,005 NPL: gross loans 2.64% 2.44% 3.66%NPL: total assets 2.30% 2.17% 3.21%NPL: gross loans-unearned income basis*
2.37% 2.14% 3.28%
*NPL including future interest/gross loans including future interest (published NPL ratios).
It is noteworthy to mention that the Company has maintained 30.75 percent above to the CBSL mandatory provision.
CA
PIT
AL
RE
PO
RT
S

212 L B Finance PLC Annual Report 2017/18
201820172016201520140
500
1,000
1,500
2,000
2,500
3,000
3,500
4,000
2
3
4
5
6
NPL(UNEARNED INCOME BASIS)
Rs.Mn %
NPL NPL Ratio
0
500
1,000
1,500
2,000
2,500
3,000
AGGREGATEIMPAIRMENT
Rs.Mn
20182017201620152014
ASSETS
Total assets increased by 17.57% YoY to Rs. 120.82 billion while on a gross basis, loans, leases and stock out on hire grew by 15.01% YoY to Rs. 105.21 billion during the year.
Cash and Cash Equivalents and Other Financial Assets
Our cash resources held to meet statutory reserves and the prudential liquidity targets stood at Rs. 11.39 billion, which is also well above the statutory liquidity requirement of Rs. 7.88 billion. We continued to maintain adequate liquidity levels to enable us to respond effectively to changes in cash flow requirements.
Total asset mix
2018 Rs. ‘000
2017 Rs. ‘000
Cash resources
5,874,375 2,895,085
Loans 102,345,084 89,149,743
Securities 6,411,831 6,467,838
Other assets 6,189,490 4,250,369
120,820,780 102,763,035
0
1
2
3
4
5
RETURN ONAVERAGE ASSETS
%
20182017201620152014
Property, Plant and Equipment
During the year the Company acquired properties in three strategic locations in line with its future expansion plans. This was financed through a long-term bank borrowing.
LIABILITIES
Total liabilities increased by 16.86% YoY to Rs. 105.47 billion in 2017/18, driven by increases in customer deposits.
Due to Customers
Customer deposits increased by 20.76% YoY to Rs. 72.94 billion in 2017/18 with a higher share of deposits from individual customers as a result of close relationships. Our objective is to ease the concentration on larger value deposits to minimise the liquidity risk in the total deposit base.
Due to Banks
During the year, we have borrowed Rs. 7.01 billion in long-term loans from the banking sector with an average tenure of four years. This will reduce the maturity gap of assets and liabilities and mitigate the risk related to withdrawal of larger value deposits.
Debt Instruments Issued and other Borrowed Funds (Subordinated Debentures)
During the year the Company issued Rs. 2.00 billion worth of subordinated and Rs. 1.00 billion worth of unsubordinated debentures, resulting in increasing total subordinated debentures to Rs. 4.00 billion. Subordinated debentures also help strengthening Tier 2 capital and 100 percent of the new subordinated debenture and 20% of the old subordinated debenture has been taken into Tier 2 capital computation (Total Rs. 2.4 billion).
SHAREHOLDERS’ EQUITY
Total shareholders’ equity rose to Rs. 15.35 billion in 2017/18 from Rs. 12.51 billion in the previous year. During the year the Company paid an interim dividend of Rs. 969.60 million.
CAPITAL MANAGEMENT
We are committed to maintain a strong capital base to support business expansion, provide a cushion against unforeseen risks, safeguard shareholder wealth and foster investor confidence. The policy allows taking advantage of emerging opportunities and invests further in the core business to enhance shareholder returns. The Company’s capital management framework includes a capital adequacy assessment process to ensure that the Company can mitigate current and future risks and achieve its strategic objectives.
Financial Capital

L B Finance PLC Annual Report 2017/18 213
Capital Adequacy
For the year ended
Capital adequacy 2018
Capital adequacy 2017
Regulatory requirement (Current)
Excess over regulatory requirement
Tier 1 17.30% 16.12% 5% 9.69%
Tier 1+2 19.80% 17.06% 10% 7.14%
Regulatory Capital
Our core capital remained well in excess of the regulatory capital requirement in 2017/18. The CBSL has issued
consultation papers (discussion stage) to change the minimum capital requirement and capital adequacy requirement for Licensed Finance Companies. The proposed change includes the inclusion
of Operational Risk Capital (ORC) into the capital adequacy computation. The key highlights of the consultation papers as follows:
Capital Adequacy and Minimum Capital
For the year ended
Regulatory requirement (MAX 2019)
LBF Current Capital adequacy adjusted to the ORC
Regulatory Core Capital (MAX 2021)
Excess over regulatory requirement
Excess Regulatory Core Capital
Excess Capital Adequacy
Tier 1 7.00% 12.23% 2.50 billion 12.85 billion 10.30%
Tier 1+2 12.00% 15.23% N/A N/A 7.80%
It is noteworthy to mentioned that Company has adequate capital and capital adequacy even at the maximum regulatory level.
OFF-BALANCE SHEET ITEMS AND OTHER MATTERS
During the year the Company reported a 26.94% YoY increase in its total commitments and contingencies to Rs. 1.26 billion mainly due to increase in commitment for unutilised facilities on Power Drafts.
Further, operating leases (SLFRS 16) which are accounted for as an off-balance sheet item mainly consist of rented buildings of the Company.
The Western Province Provincial Council, the Central Province Provincial Council and the Southern Province Provincial Council have communicated with LBF, requiring it to register as pawnbrokers in terms of their respective Provincial Council Statutes, in view of the gold loan business carried out by LBF within such provinces. Pursuant to receipt of such notices, LBF has challenged the right of such Provincial Councils to require registration by LBF. The basis for LBF’s position that registration is not necessary is that its gold loan business is being carried out in terms of the Mortgage Act as mortgages of movables, and that LBF is in fact not engaged in pawnbroking business, and thus need not register in terms of such Statutes. LBF has filed
three Writ Applications in the Court of Appeal, challenging the requirement to register under the said Provincial Council Statutes, and such Writ Applications are pending adjudication at present.
L B MICROFINANCE MYANMAR COMPANY LIMITED (LBMM)
During the year the Company has started its Myanmar operations with an initial capital of Rs.153.37 million. LBMM recorded net loss of Rs. 5.70 million during the year and built a loans and advances portfolio of Rs. 38.88 million. Cash and cash equivalents at the end of the year was Rs. 115.92 million.
CA
PIT
AL
RE
PO
RT
S

214 L B Finance PLC Annual Report 2017/18
FUTURE ACCOUNTING DEVELOPMENTSSLFRS – 09
FINANCIAL INSTRUMENTS
ImpairmentThe adoption of SLFRS 9 will have a significant impact on the Company’s impairment methodology. The SLFRS 9 expected credit loss (ECL) model is forward-looking compared to the current incurred loss approach. Expected credit losses under SLFRS 9 are the present value of all cash shortfalls related to default events either:
I. Over the following 12 months or
II. over the expected life of a financial instrument depending on credit deterioration from inception. ECL should reflect an unbiased, probability weighted outcome as opposed to the single best estimate allowed under the current approach. The probability weighted outcome considers multiple scenarios based on reasonable and supportable forecasts. SLFRS 9 considers the calculation of ECL by multiplying the Probability of Default (PD), Loss Given Default (LGD) and Exposure at Default (EAD).
SLFRS 9 impairment model uses a three stage approach based on the extent of credit deterioration since origination:
Stage 1A loss allowance at an amount equal to at least 12-month expected credit losses will be recognised through the life of the financial assets. The ECL will be computed using a 12-month PD that represents the probability of default occurring over the next 12 months or less in line with the maturity profile of the asset.
Stage 2 When a financial asset experiences significant increases in credit risk since origination but is not credit impaired, it is considered to be in Stage 2. This requires the computation of ECL based on lifetime PD that represents the probability of default occurring over the remaining lifetime of the financial asset.
Stage 3Under the incurred loss method the Company identified the loan as impaired if a payment on a loan is contractually 5 months/rentals in arrears or objectively identified as credit deteriorated even if the rental in arrears even less than 5 (see Note 4.17 Allowance for Impairment Losses). Losses expected as a result of future events are not recognised. As the Company’s definition of default is not likely to change materially and will align with the regulatory definition, the treatment of loans in stage 3 remains substantially the same as the current treatment of impaired loans under LKS 39.
Some of the key concepts in SLFRS 9 that have the most significant impact and require a high level of judgment are:
» Assessment of significant increase in credit risk
» Macroeconomic factors, forward looking information and multiple scenarios. SLFRS 9 requires an unbiased and probability-weighted estimate of credit losses by evaluating a range of possible outcomes that incorporate forecasts of future economic conditions.
DEFINITION OF DEFAULT We have rebutted the following presumption in SLFRS 9 and proved qualitatively and statistically the reasons for repudiation:
Rebut the presumption of 30 days and considers 90 days (three months) past due as the point of significant increase in credit risk.
» Up to 90 days of past due of a customer is generally only an administrative oversight and specifically it does not result due to the financial difficulties of the borrower. Hence the Company is of the view that the customers’ credit risk does not significantly increase up to 90 days past due.
» Further we have evaluated the historical behaviour patterns of leasing customer portfolio to assess the reasonability of the rebutting the presumption.
» Rebut the presumption of 90 days and consider 150 days (five months) past due as the definition of default, which will align with the regulatory (CBSL) definition of default.
» Further, we have evaluated the historical behaviour patterns of our leasing customer portfolio to assess the reasonability of rebutting the presumption.
Probability of Default (PD) Estimation We used internal information to estimate the PDs our loans, lease receivables, loan commitments and financial guarantees. The client has two credit statuses identified as default or not default. We used Cohort method (CM) to compute the PDs. Cohort method (CM) is applied where the number of obligors at the end of each month and the number of obligors that have defaulted during next month are counted respectively. The resulting PD estimate is arrived at by dividing the overall number of defaults (during the month) by the overall number of obligors (previous month end). At each stage of the loan PDs are computed. Average PDs are computed and used forward looking information to adjust those average PDs. The Multiple Economic Factor Model was developed to forecast the forward-looking information. The model predicts the one-year forward industry NPL levels and has been used to adjust the Company PD curve using statistically quantified variance. The economic factor model is
Financial Capital

L B Finance PLC Annual Report 2017/18 215
developed by the University of Colombo, Science and Technology Cell and subject to an annual review. The economic factor model predicts the industry NPL as an output and use some key economic factors as an input to the model.
The published global financial sector credit rating migration matrix is (S&P Ratings 2016/2017) used for fixed deposits with banks expected credit loss calculation and we do not expect credit losses for LKR denominated Government securities.
Multiplication of Value at Risk (VaR) and PDs at each value risk levels (i.e. Maturities) are used to calculate the expected credit loss for gold loans. Statistically quantified sensitivity analysis has been conducted using past price history and apply it to the current exposure. Given a quantified movement in commodity prices (LGD) and PDs in each drawdown the expected credit loss is computed.
Any Financial Asset which is fully secured through a cash collateral has not been taken into the expected credit loss calculation. Other than the above mentioned no other financial asset expected to be credit impaired.
Expected Life All contractual terms had been considered when determining the expected life, including prepayment/early termination options and extension and roll over options.
Model ValidationNew models and systems for expected loss computation are being developed to meet the requirements of SLFRS 9. The impairment model and computation was reviewed by the EY Assurance/ Tax Transactions Advisory Division of Sri Lanka and agreed with the model. Currently we are in the stage of automating the full process.
Transition And ImpactThe impact of SLFRS 9 on the Company’s financial results at the time of adoption is dependent upon prevailing market factors and economic conditions at that time of actual implementation. We have estimated the gross and net impact as at 31st March 2018. Following asset types are taken for the expected loss estimation
» Loans and lease receivables including gold loans
» Fixed Income Securities (bank deposits)
» At fair value through other comprehensive income
» Loan commitments
» Financial guarantees
At transition, we expect the existing collective allowances against performing loans to contribute a significant component of allowance levels required for Stage 1 and Stage 2 assets under SLFRS 9 at transition. The existing Specific Allowances against impaired loans should not change significantly for Stage 3 assets under SLFRS 9 at transition. Under the existing accounting practice, the change in allowances on performing loans (collective) will now be recorded in the Stage 1 and Stage 2 as impairment for expected losses.
The Colombo Stock Exchange has directed all Listed Companies to conduct an impact analysis under new implementation of SLFRS 9. We have complied with requirement and the impact is as follows:
Rs. ’000
Total expected loss as at 31st March 2018 for all products
990,757
(Minus) Collective provision for unimpaired loans
(763,030)
(Under)/Over provision as at 31st March 2018
(227,727)
SLFRS – 15
Revenue from Contracts with Customers The standard scopes out contracts that are considered to be lease contracts, insurance contracts and financial instruments, and as such will impact the businesses that earn fee and commission revenues. The new standard is a control based model as compared to the existing revenue standard which is primarily focused on risks and rewards. Majority of our revenue generating instruments meet the definition of financial instruments and remain out of scope. The areas of focus for the assessment will be fees and commission revenues from financial services. The new standard will require entities to capitalise the fees as well as contract cost and amortised on a systematic basis that is consistent with the pattern of transfer of the associated services, which will have an impact on operating profits. We do not see a significant impact on our current operating profit due to the new standard. Colombo Stock Exchange has instructed all Listed Companies to conduct an impact analysis under new implementation of SLFRS 15. We have complied with requirements and do not see significant impact on operating profits.
SLFRS – 16
LeasesThe standard requires a lessee to recognise an asset for the right to use the leased item and a liability for the present value of its future lease payments. SLFRS 16 will result in leases being recorded on the Company’s Balance Sheet, including those currently classified as operating leases except for short-term leases and leases with low value of the underlying asset. If we capitalised all our long-term operating leases as finance leases it will create land and building assets and long-term lease creditor liability. Currently the Company in the process of identifying the impact from the implementation.
CA
PIT
AL
RE
PO
RT
S

216 L B Finance PLC Annual Report 2017/18
ECONOMIC CONTRIBUTIONThe Company’s approach to value creation is armed with strategies focusing on operational excellence and sustainability. This is not merely short-term but long-term, with more value focused on triple bottom line, based on sustainable business practices.
ECONOMIC VALUE ADDED STATEMENT (EVA)
EVA is the incremental change in the rate of return over a company’s cost of capital. Essentially, it is used to measure the value a company generates from funds invested and a positive EVA denotes the company is generating value.
For the year ended 31 March 2018Rs. million
2017Rs. million
2016Rs. million
Invested Equity
Shareholders’ funds 15,348.90 12,509.68 10,479.31
Add: Cumulative loan loss provision/provision for impairment
2,867.40 2,330.30 2,641.75
Total 18,216.30 14,839.98 13,121.06
Earnings
Profit attributable to shareholders 4,224.36 3,900.30 3,729.02
Add: Loan losses and provisions/impairment provision
667.63 (42.27) 382.43
Total 4,891.99 3,858.04 4,111.45
Economic cost % (Average Treasury Bill rate plus 2% risk premium)
10.90 10.85 8.36
Economic cost 1,801.57 1,516.89 881.26
Economic value added 3,090.42 2,341.15 3,230.19
MARKET VALUE ADDED (MVA)
MVA is the difference between the market value of the Company and the capital contributed by investors; In other words, it is the sum of all Company capital claims held against the market value of debt and equity.
For the year ended 31 March 2018Rs. million
2017Rs. million
2016Rs. million
Market capitalisation
Market value of equity 16,469.35 16,400.09 14,696.36
Less: Equity owners' funds
Shareholders' funds 15,348.90 12,509.68 10,479.31
Total equity owners' funds 15,348.90 12,509.68 10,479.31
Market value added 1,120.45 3,890.41 4,217.05
0
500
1,000
1,500
2,000
2,500
3,000
3,500
ECONOMICVALUE ADDED
Rs.Mn
201820172016
0
1,000
2,000
3,000
4,000
5,000
MARKETVALUE ADDED
Rs.Mn
201820172016
VALUE GENERATED AND DISTRIBUTED
Information on the generated and distributed value provides a basic indication of how the Company has created wealth for the stakeholders. Components of the economic value generated and distributed provides an economic profile of the Company, which may be useful for controlling other performance indicators. Economic value generated and distributed portrays the direct monetary value added to local economy.
GRI - 201 - 1
Financial Capital

L B Finance PLC Annual Report 2017/18 217
DIRECT ECONOMIC VALUE GENERATED AND DISTRIBUTED
For the year ended 31 March 2018Rs. million
% 2017Rs. million
% 2016Rs. million
%
Direct economic value generatedInterest income 23,394.12 17,909.94 14,428.72 Fee commission income 1,504.19 1,209.34 1,168.68 Net gain/(loss) from trading (0.30) (0.15) 0.96 Other operating income 148.20 244.30 48.09 Economic value generated 25,046.20 19,363.43 15,646.46
Economic value distributed to employeesEmployees salaries & benefits 2,389.35 2,102.36 1,826.37 2,389.35 9.54 2,102.36 10.86 1,826.37 11.67
To depositors and lendersInterest expenses 11,077.10 7,766.75 5,409.62 11,077.10 44.23 7,766.75 40.11 5,409.62 34.57
Payments to providers of capitalDividend to shareholders 1,523.66 1,246.63 1,038.86 Interest to debenture holders 421.31 345.59 363.63 1,944.96 7.77 1,592.21 8.22 1,402.49 8.96
Payment to governmentIncome tax expenses 1,658.32 1,595.06 1,479.08 Super gain tax (SGT) - - 484.23 VAT & NBT on financial services 1,336.69 1,027.10 593.45 Crop insurance & levy 43.15 38.61 36.52 3,038.17 12.13 2,660.77 13.74 2,593.28 16.57
To communitySocial responsibility projects 23.51 14.54 17.27 Donations - 0.16 0.10 23.51 0.09 14.70 0.08 17.37 0.11
Operating costsDepreciation & amortisation set aside 384.23 343.22 332.42 Impairment charge for loans and other losses 667.63 (42.27) 382.43 Training cost 8.57 8.05 11.18 Other operating expenses 2,213.96 1,882.3 1,319.48 3,274.39 13.07 2,191.25 11.32 2,045.51 13.07Economic value retained 3,298.71 13.17 3,035.39 15.68 2,351.82 15.03Economic value distributed 25,046.20 100.00 19,363.43 100.00 15,646.46 100.00
VALUEDISTRIBUTED - 2016/17
10.86%
15.68%
8.22%
40.11%13.74%
11.32%
To EmployeesTo Depositors and LendersPayments to Providers of CapitalPayment to GovernmentOperating costs
VALUEDISTRIBUTED - 2017/18
9.54%
44.23%12.13%
13.07%
13.17%
7.77%
To employeesTo depositors and lendersPayment to governmentOperating costsEconomic value retained within the businessPayments to providers of capital
VALUEDISTRIBUTED - 2017/18
9.54%
44.23%12.13%
13.07%
13.17%
7.77%
To employeesTo depositors and lendersPayment to governmentOperating costsEconomic value retained within the businessPayments to providers of capital
CA
PIT
AL
RE
PO
RT
S

218 L B Finance PLC Annual Report 2017/18
INVESTORLBF has crafted its business strategies in the best interest of its shareholders while carefully balancing its risk and return to maximise shareholder wealth. Investors are LBF’s lifeblood. Therefore, LBF constantly keeps them posted on the Company’s strategies, plans and performance, thereby gaining their trust and confidence in the Company.
In the year under review total shareholders’ equity extended by 23% to Rs. 15.35 billion from Rs. 12.51 billion in the previous year. The Company paid an interim dividend of Rs. 969.6 million for the year 2017/18 it has also proposed of final dividend of Rs. 4.00 per share in May 2018. This resulted in a total payout of Rs. 11.00 per share in 2017/18 financial year. Above average growth in the profitability helped LBF’s share to
outperform the market and sector indices during the financial period.
In order to maintain professionalism and good governance, some of the channels LBF uses to keep the investors informed are the Annual General Meeting, investor meetings, Annual Report, Interim Financial Statements and announcements at the Colombo Stock Exchange (CSE), press conferences, and media releases. The Company makes use of electronic media for communication where appropriate.
The Colombo Stock Exchange
The Colombo Bourse remained subdued during the financial year 2017/18, due to uncertainties in the policy environment in the country and external shocks.All Share Price Index closed almost flat at 6,476.78 points compared to 2016/17.
Standard and Poor (S&PSL 20) which tracks the performance of larger blue chip companies increased by 6.14% YoY to 3,650.1 points at the end of the financial year. The market has also continued to attract foreign investment throughout 2017/18, with Rs. 117 billion in foreign buying contributing to a net foreign inflow of Rs. 10. billion. An attractive market valuation (P/E), encouraging performance among listed entities, dividend payments, and Capital Gains Tax exemptions offered to share transactions are considered to be defining factors in attracting the level of foreign investor interest the market has witnessed in 2017. The daily average turnover of CSE increased by 42.24% YoY to Rs. 1,035.59 million in 2017/18, while daily share volume increased by 31.37% YoY to 36.8 million shares. Market capitalisation of listed companies expanded by 14% to Rs. 3.03 trillion at the end of the period.
ASPI & S&P SL 20 INDEX AND MARKET TURNOVER
ASPI andS&P
SL 20 Index Rs.Mn
3,000
3,500
4,000
4,500
5,000
5,500
6,000
6,500
7,000
200
400
600
800
1,000
1,200
1,400
1,600
1,800
2,000
ASPI Turnover (LKR ‘000) ASPI (SL 20 Index) S&P (SL 20 Index)
Apr 2
017
May
2017
Jun 2
017
Jul 2
017
Aug 2
017
Sep 2
017
Oct 2
017
Nov 2
017
Dec 2
017
Jan 2
018
Feb 2
018
Mar
2018
Banking, Finance And Insurance Sector (BFI)Banking, Finance and Insurance sector index increased by 15.31% YoY to 17,006.38 points during 2017/18. In the sector, average monthly turnover increased by 66.69% YoY to Rs. 7.9 billion, while average monthly volume increased by 50.65% YoY to 227.4 million shares in 2017/18. Investors valued the sector high with forecasted increase in earnings growth. Sector P/E increase from 6.17 times in 2016/17 to 6.87 times in 2017/18, while sector P/B increase from 1.03 times in 2016/17 to 1.07 times in 2017/18.
Financial Capital

L B Finance PLC Annual Report 2017/18 219
LBF SHARE
GENERAL INFORMATION
Total number of shares in issue as at 31 March 2018 138,514,284
Public shareholding as at 31 March 2018 21.89%
Beta value against ASPI as at 31 March 2018 0.78
Stock symbol LFIN : N0000
Newswire codes of LBF share:
Bloomberg LBFIN : SL
Dow Jones LFINN
Reuters LFIN. CM
ANNUAL PERFORMANCE
2017/18 2016/17
Share Price
Highest (Rs.) 145.00 134.00
Lowest (Rs.) 118.00 105.10
Closing (Rs.) 118.90 118.40
Number of transactions 2,766 5,616
Number of share traded 4,602,929 11,098,533
Value of shares traded (Rs. billion) 0.60 1.41
Number of days traded 217 240
Average daily turnover (Rs. million) 2.54 5.87
Market capitalisation (Rs. billion) 16.46 16.40
QUARTERLY PERFORMANCE 2017/18
Quarter 1 Quarter 2 Quarter 3 Quarter 4
Share Price
Highest (Rs.) 145.00 139.80 134.00 132.00
Lowest (Rs.) 118.20 128.50 121.20 118.00
Closing (Rs.) 135.10 129.70 122.10 118.90
Number of transactions 1,095 500 404 767
Number of share traded 2,006,221 1,495,804 658,563 442,341
Value of shares traded (Rs. million) 264.10 199.19 83.33 56.00
Number of days traded 56 59 51 51
Average daily turnover (Rs. million) 4.63 3.21 1.39 0.90
CA
PIT
AL
RE
PO
RT
S

220 L B Finance PLC Annual Report 2017/18
STATED CAPITAL
The stated capital of the Company as at 31 March 2018 was Rs. 838 million represented by 138.5 million fully paid ordinary shares. The share capital comprised a single class in which every share has the same voting power and the same entitlement to dividends.
FINANCIAL CAPITAL ANALYSIS
Dupont analysis
0
5
10
15
20
25
INCOME/AVERAGE ASSETS
%
201820172016
0.0
0.5
1.0
1.5
2.0
NON-INTEREST INCOME/AVERAGE ASSETS
%
201820172016
0
10
20
30
40
50
ROE
%
201820172016
ROE0
1
2
3
4
5
PROFIT AFTER TAX/AVERAGE ASSETS
%
2018201720160
2
4
6
8
10
AVERAGE ASSETS/AVERAGE SHAREHOLDERS’ FUNDS
Times
201820172016
0
5
10
15
20
25
INTEREST INCOME/AVERAGE ASSETS
%
201820172016
0
5
10
15
20
25
PROFIT/ INCOME
%
201820172016
3.80%
30.52%
20.93%
22.40%
8.0 Times
1.48%
16.97%
Financial Capital

L B Finance PLC Annual Report 2017/18 221
EARNINGS PER SHARE (EPS)
The earnings per share (EPS) for the period increased to Rs. 30.69 in 2017/18 from Rs. 28.29 in 2016/17, as a result of increased profit attributable to shareholders.
0
5
10
15
20
25
30
35
MOVEMENT OFEPS
Rs.
20182017201620152014
NET ASSET VALUE PER SHARE
As at the financial year ended 31st March 2018, the net assets value per share of the Company stood at Rs. 110.81, which reflected an increase of 22.7% compared to Rs. 90.31 the previous year.
PRICE EARNINGS RATIO (P/E)
The P/E ratio as at 31 March 2018 decreased to 3.87 times from 4.19 times as at 31st March 2017.
P/E MULTIPLE BAND CHART Rs.
30
60
90
120
150
180
Mar
2013
Jul 2
013
Nov 2
013
Mar
2014
Jul 2
014
Nov 2
014
Mar
2015
Jul 2
015
Nov 2
015
Mar
2015
July 2
015
Nov 2
015
Mar
2016
Jul 2
016
Nov 2
016
Mar
2017
Jul 2
017
Nov 2
017
Mar
2018
Price 4.0x 5.2x 6.8x 10.6x
PRICE TO BOOK VALUE (P/B)
The P/B ratio as at 31 March 2018 marginally decreased to 1.07 times from 1.31 times compared to the previous financial year due to increased shareholder wealth outpacing the share price growth
P/B MULTIPLE BAND CHART Rs.
30
60
90
120
150
180
Mar
2013
Jul 2
013
Nov 2
013
Mar
2014
Jul 2
014
Nov 2
014
Mar
2015
Jul 2
015
Nov 2
015
Mar
2015
July 2
015
Nov 2
015
Mar
2016
Jul 2
016
Nov 2
016
Mar
2017
Jul 2
017
Nov 2
017
Mar
2018
Price 1.3x 1.7x 2.0x 2.5x
TOTAL SHAREHOLDER RETURN
Total shareholder return (including both dividends and change in share price of the common share), recorded a 9.69% for the accounting period 2017/18 including gross dividend per share of Rs. 11. Return was lower than the previous year of 20.07% due to poor market performance. Share market index return was improved to 6.84% in 2017/18 from -0.16% in 2016/17. Our consistent dividend policy continues to be a key component of shareholders’ return while above average growth in the business helped share price appreciation. Share price appreciated 0.42% in 2017/18. We remain focused on achieving sustainable, long-term earnings growth and maintaining stable dividend income streams to our shareholders.
CA
PIT
AL
RE
PO
RT
S

222 L B Finance PLC Annual Report 2017/18
SHAREHOLDERS’ RETURN
Year ended 31 march 2018 2017 2016
Closing market price (Rs.) 118.90 118.40 106.10
Dividends paid/ proposed (Rs.) 11.00 9.00 7.50
Dividend Yield 9.29% 8.48% 9.99%
Dividend Cover 2.79 3.77 3.58
Change in share price 0.4% 11.59% 41.28%
Total annual shareholder return 9.69% 20.07% 51.26%
0
30
60
90
120
150
-6
-3
0
3
6
9
12
15
SHAREHOLDERS’RETURNS
% %
Over 5 YearsOver 3 YearsOver 1 Year
LBF Shareholder Capital gain
LBF
Sha
reho
lder
Cap
ital g
ain
AS
PI
Inde
x
ASPI Index
0
5
10
15
20
SHAREHOLDER EQUITY
Rs.Bn
20182017201620152014
0
10
20
30
40
50
4
6
8
10
RETURNON EQUITY
% %
20182017201620152014Return on Equity
Ret
urn
on E
quity
Dividend Yield
Dividend Y
eild
DIVIDENDS
LBF’s investor-friendly dividend policy balances the immediate returns to investors, whilst retaining funds for future investments. This ensures growth in the medium and long term which grows shareholder wealth in these time frames. The Board has proposed a final dividend of Rs. 4.00 per share (Interim dividend of Rs. 7.00 per share paid on 9 March 2017). The dividend payout ratio was increased to 35.84% in 2017/18 from 31.82% in 2016/17.
4
6
8
10
DIVIDEND YIELD
%
20182017201620152014
In 2017/18, the dividend yield of L B Finance PLC has increased to 9.29% which was 8.48% in 2016/17. The value states that the annual payment of dividends to shareholders of L B Finance PLC is 9.29% of the market price of its share. The dividend payout ratio which is 35.84% in 2017/18 (31.82% - 2016/17) shows out that the Company pays 35.84% of current earnings to its shareholders in the form of dividends and 64.16% of earnings is plugged back in the business for future growth.
0
2
4
6
8
10
12
25
30
35
40
DIVIDEND PER SHARE AND DIVIDEND PAYOUT RATIO
Rs. %
20182017201620152014DPS Dividend Payout Ratio (%)
Financial Capital

L B Finance PLC Annual Report 2017/18 223
LIQUIDITYAverage daily shares traded during the year decreased to 19,422 in 2017/18 from 46,243 shares in 2016/17. Total shares that changed hands during the year decreased to 4.6 million in 2017/18 from 11.10 million in 2016/17.
ANALYSIS OF SHAREHOLDERSWith reference to the distribution of shareholding, approximately 90.80% of the shares amounted to shareholding of over one million shares whilst it was 90.22% in the previous year. The total number of shareholders decreased to 2,006 in the year under review from 2,102 in the previous year. Local investors constituted to 97.06% of the investor base (97.94% in 2016/17).
Out of the total shareholder base 6.08% was individual shareholders (6.51% in 2016/17).
PUBLIC HOLDINGPublic holding as at 31 March 2018 was 21.89% comprising 1,997 shareholders. This is a decrease when compared to the previous year’s 21.94% public holding comprising 2,094 shareholders.
DISTRIBUTION OF SHAREHOLDINGS
As at 31 March 2018 As at 31 March 2017Number of
shareholders% Number of
shares held% Number of
shareholders% Number of
shares held%
1 to 1,000 1,237 61.67 319,598 0.23 1,277 60.75 346,474 0.251,001 to 10,000 589 29.36 2,121,168 1.53 634 30.16 2,225,833 1.61100,001 to 100,000 152 7.58 4,383,696 3.16 160 7.61 4,606,349 3.32100,001 to 1,000,000 22 1.10 5,931,655 4.28 25 1.19 6,367,596 4.60Over 1,000,000 6 0.30 125,758,167 90.80 6 0.29 124,968,032 90.22Total 2,006 100 138,514,284 100.00 2,102 100.00 138,514,284 100
COMPOSITION OF SHAREHOLDINGS
As at 31 March 2018 As at 31 March 2017Category Number of
shareholders Number of shares held
% Number of shareholders
Number of shares held
%
Local - Individual 1,862 8,285,590 5.98 1,949 8,571,568 6.19Local - Institutional 120 126,156,613 91.08 123 127,083,242 91.75Foreign - Individual 21 144,946 0.10 24 450,622 0.32Foreign - Institutional 3 3,927,135 2.84 6 2,408,852 1.74Total 2,006 138,514,284 100.00 2,102 138,514,284 100.00
MARKET CAPITALISATION
Shareholders’ funds Rs Mn
LFIN Market capitalisation Rs Mn
CSE Market capitalisation Rs Mn
LFIN Market capitalisation as % of CSE market capitalisation
2013 5,329 9,190 2,199,960 0.42%
2014 6,207 6,933 2,498,000 0.28%
2015 7,927 10,402 2,891,170 0.36%
2016 10,479 14,696 2,586,150 0.57%
2017 12,510 16,400 2,662,860 0.62%
2018 15,349 16,469 3,032,710 0.54%
Rs.Mn
Shareholders’ Fund (LFIN)
Market Capitalisation (LFIN)
0
5,000
10,000
15,000
20,000
SHAREHOLDER FUND ANDMARKET CAPITALISATION
20182017201620152014
CA
PIT
AL
RE
PO
RT
S

224 L B Finance PLC Annual Report 2017/18
DIRECTORS’ SHAREHOLDINGS
Names of Directors No. of shares as at 31 March 2018
As a % of total shares
No. of shares as at 31 March 2017
As a % of total shares
Mrs. Shirani Jayasekara - - - -Mr. K D D Perera - - - -Mr. J A S S Adhihetty 106,120 0.077 106,120 0.077Mr. Thosapala Hewage - - - -Mr. N Udage 250,325 0.181 173,837 0.126Mr. B D A Perera - - - -Mr. R S Yatawara - - - -Mrs. A K Gunawardhana - - - -Mrs. Y Bhaskaran - - - -Mr. M A J W Jayasekara - - - -
LARGEST SHAREHOLDERS OF THE COMPANY
Shareholders As at 31 March 2018 As at 31 March 2017 Number of shares
Percentage holding (%)
Cumulative percentage holding (%)
Number of shares
Percentage of holding (%)
1. Vallibel One PLC 71,682,400 51.751 51.751 71,682,400 51.7512. Royal Ceramics Lanka PLC
Commercial Bank of Ceylon PLC / Royal Ceramics Lanka PLC 36,123,232 26.079 77.830 36,123,232 26.0793. Esna Holdings (Pvt) Ltd 14,062,400 10.152 87.982 14,062,400 10.1524. Bnymsanv Re-Frontaura Global Frontier Fund LLC 2,290,135 1.653 89.635 393,821 0.2845. SBI Ven Holdings Pte Ltd 1,600,000 1.155 90.790 1,600,000 1.1556. AIA Insurance Lanka PLC A/C No.07 777,843 0.562 91.352 777,843 0.5627. Sterling Holdings (Private) Limited 502,826 0.363 91.715 1,500,000 1.0838. Janashakthi Insurance PLC (Policy Holders) 500,000 0.361 92.076 500,000 0.3619. Mr. H A Van Starrex 465,601 0.336 92.412 573,408 0.41410. Mr. K D A Perera 373,776 0.270 92.682 373,776 0.270
11. Hatton National Bank PLC / Mr. Karuna Ranaraja Ekanayaka Mudiyanselage Dharshan Maduranga Bandara Jayasundara 344,297 0.249 92.931 - -
12. Mr. A A Page 314,800 0.227 93,158 314,800 0.22713. Mr. N P De A Samaranayake 300,000 0.217 93.375 350,000 0.25314. Mr. N Udage 250,325 0.181 93.556 173,837 0.12615. People’s Leasing & Finance PLC / Dr. H S D Soysa &
Mrs G Soysa 230,816 0.167 93.723 - -16. J B Cocoshell (Pvt) Ltd 224,100 0.162 93.885 150,000 0.10817. Mrs. P C Cooray 208,632 0.151 94.036 208,632 0.15118. Guardian Fund Management Limited / The Aitken Spence and
Associated Companies Executive Staff Provident Fund 180,000 0.130 94.166 - -19. Commercial Credit and Finance PLC 161,297 0.116 94.282 161,297 0.11620. Mr. T Jeremiah 155,164 0.112 94.394 155,164 0.112
130,747,644 94.394Others 7,766,640 5.606Total 138,514,284 100.00
Financial Capital

L B Finance PLC Annual Report 2017/18 225
SUBMISSION OF INFORMATION TO COLOMBO STOCK EXCHANGE
Date of disclosure Details of disclosure
16 February 2018 Interim Dividend Announcement
1 February 2018 Uploaded Interim Financial Statements as at 31-12-2017
11 December 2017 Debenture Issue 2017 allotment basis
07 December 2017 Debenture Issue 2017 subscription details
04 December 2017 Debenture Issue 2017 Open and over-subscribed
28 November 2017 Debenture Issue 2017 issue announcement
07 November 2017 Appointment of new director
31 October 2017 Appointment of new director
25 October 2017 Uploaded Interim Financial Statements as at 30-09-2017
20 October 2017 Setting up the subsidiary in Myanmar
22 September 2017 Appointment of Chairperson
29 August 2017 Dealings by Directors
28 August 2017 Change in Directorate
22 August 2017 Dealings by Directors
18 August 2017 Dealings by Directors
11 August 2017 Uploaded Interim Financial Statements as at 30th June 2017
3 July 2017 Annual General Meeting - dividend approved by shareholders
6 June 2017 Uploaded Annual Report - 2016/2017
31 May 2017 Dividend Announcement
28 April 2017 Change in Directorate
CA
PIT
AL
RE
PO
RT
S

226 L B Finance PLC Annual Report 2017/18
DEBENTURESIn December 2017, LBF raised Rs. 3 billion (through Rs.1 billion on senior debenture and Rs. 2 billion on subordinated debenture) to boost business growth opportunity, reducing the mismatch of maturity period, to improve the capital adequacy of the Company and to strengthen Tier II capital position and in November 2013, LBF raised Rs. 2 billion by the issue of subordinated, unsecured debentures to boost Tier II capital position.
Year 2017/18 2016/17
Issued date 11-Dec-17 11-Dec-17 29-Nov-13 29-Nov-13 29-Nov-13 29-Nov-13 29-Nov-13 29-Nov-13
Type of Debenture Type A Type B Type A Type B Type C Type A Type B Type C
Maturity date 11-Dec-22 11-Dec-22 29-Nov-18 29-Nov-18 29-Nov-18 29-Nov-18 29-Nov-18 29-Nov-18
CSE listing Listed Listed Listed Listed Listed Listed Listed Listed
Code LFIN/11/ 12/22-C2387 -A -12.75
LFIN/11/ 12/22 -C2388-B -13.5
LFIN/BC/28/11/ 18A14
LFIN/BC/28/11/ 18B14.5
LFIN/BC/28/11/ 18C15 LFIN/BC/28/11/ 18A14 LFIN/BC/28/11/ 18B14.5
LFIN/BC/ 28/11/ 18C15
Interest payment frequency Bi-Annually Bi-Annually Monthly Bi-Annually Annually Monthly Bi-Annually Annually
Coupon Interest rate 12.75% p.a 13.25% p.a 14.00% p.a 14.50% p.a 15.00% p.a 14.00% p.a 14.50% p.a 15.00% p.a
Effective annual Yield (%) 13.16% 13.69% 14.93% 15.03% 15.00% 14.93% 15.03% 15.00%
No. of Debentures 10,000,000 20,000,000 6,401,400 7,570,100 6,028,500 6,401,400 7,570,100 6,028,500
Amount (Rs. Mn) 1,000 2,000 640.14 757.01 602.85 640.14 757.01 602.85
Interest rate of comparable government security 10.06% 10.06% 10.06% 10.06% 10.06% 12.60% 12.60% 12.60%
Market Price
Highest (Rs)Did not trade
during the yearDid not trade
during the yearDid not trade
during the yearDid not trade
during the year
100.50Did not trade
during the yearDid not trade
during the yearDid not trade
during the yearLowest (Rs) 100.50
Close (Rs) 100.50
Yield to Maturity % NA NA NA NA 13.52 NA NA NA
CREDIT RATING – COMPANY
» The Company’s credit rating A- (lka) was confirmed by Fitch Ratings Lanka Ltd in April 2017.
CREDIT RATINGS – DEBENTURES
» The credit ratings of the Company’s Senior and Subordinated were A-(lka) and BBB+ (lka) respectively as per the 17 November 2017 of Fitch Ratings Lanka Ltd.
» The credit rating issued in respect of the debenture issued in 2013 at BBB+ (lka) remained unchanged during the year.
Financial Capital

L B Finance PLC Annual Report 2017/18 227
FUTU
RE
AC
TIO
N
We are confident that our ability to improve the financial performance in 2018/19 and Beyond. Investment in technology to drive efficiency, manage evolving risks and benefit from growth opportunities will be critical for sustainable success. New regulatory requirements will make NBIF sector more resilient and improve the public confidence in financial system.
DEBENTURESIn December 2017, LBF raised Rs. 3 billion (through Rs.1 billion on senior debenture and Rs. 2 billion on subordinated debenture) to boost business growth opportunity, reducing the mismatch of maturity period, to improve the capital adequacy of the Company and to strengthen Tier II capital position and in November 2013, LBF raised Rs. 2 billion by the issue of subordinated, unsecured debentures to boost Tier II capital position.
Year 2017/18 2016/17
Issued date 11-Dec-17 11-Dec-17 29-Nov-13 29-Nov-13 29-Nov-13 29-Nov-13 29-Nov-13 29-Nov-13
Type of Debenture Type A Type B Type A Type B Type C Type A Type B Type C
Maturity date 11-Dec-22 11-Dec-22 29-Nov-18 29-Nov-18 29-Nov-18 29-Nov-18 29-Nov-18 29-Nov-18
CSE listing Listed Listed Listed Listed Listed Listed Listed Listed
Code LFIN/11/ 12/22-C2387 -A -12.75
LFIN/11/ 12/22 -C2388-B -13.5
LFIN/BC/28/11/ 18A14
LFIN/BC/28/11/ 18B14.5
LFIN/BC/28/11/ 18C15 LFIN/BC/28/11/ 18A14 LFIN/BC/28/11/ 18B14.5
LFIN/BC/ 28/11/ 18C15
Interest payment frequency Bi-Annually Bi-Annually Monthly Bi-Annually Annually Monthly Bi-Annually Annually
Coupon Interest rate 12.75% p.a 13.25% p.a 14.00% p.a 14.50% p.a 15.00% p.a 14.00% p.a 14.50% p.a 15.00% p.a
Effective annual Yield (%) 13.16% 13.69% 14.93% 15.03% 15.00% 14.93% 15.03% 15.00%
No. of Debentures 10,000,000 20,000,000 6,401,400 7,570,100 6,028,500 6,401,400 7,570,100 6,028,500
Amount (Rs. Mn) 1,000 2,000 640.14 757.01 602.85 640.14 757.01 602.85
Interest rate of comparable government security 10.06% 10.06% 10.06% 10.06% 10.06% 12.60% 12.60% 12.60%
Market Price
Highest (Rs)Did not trade
during the yearDid not trade
during the yearDid not trade
during the yearDid not trade
during the year
100.50Did not trade
during the yearDid not trade
during the yearDid not trade
during the yearLowest (Rs) 100.50
Close (Rs) 100.50
Yield to Maturity % NA NA NA NA 13.52 NA NA NA
CREDIT RATING – COMPANYC
AP
ITA
L R
EP
OR
TS

Intellectual CapitalWHAT INTELLECTUAL CAPITAL MEANS TO LBF
Our Intellectual Capital encompasses our culture, our governance frameworks, leadership structures, our processes, management philosophy and approach to risk management, as well as our brand and relationships with all stakeholders. In short, Intellectual Capital is our DNA – the unique characteristics that sets us apart.
MATERIAL DRIVERS
Enhance knowledge base
Position in the LB brand
Invest in information system
Reinforce culture and ethics
ACTION PLANS & OBJECTIVES STATUS PAGE
Revamp core business modules with latest technology
10% Revamp completed
235
ISO 27001: 2013 Information Security Management Standards certification
100% Completed 234
Recruited industry technical specialists 22 Specialist recruited
233
Strengthening brand equity Ranked 17th interbrand best
Sri Lankan brands 2017
234
Achieved
In progress
Not achieved
SNAPSHOT OF CAPITAL OUTCOMES
IMPACT AREA WHAT YOU WILL FIND WHERE TO FIND
Corporate branding
17th among the top-twenty Best Sri Lankan Brands in 2017
Positioning the L B Brand
Disaster recovery system (DR)
Fully fledged DR system
Invest in information system
PAGE 234
PAGE 235
228 L B Finance PLC Annual Report 2017/18

L B Finance PLC Annual Report 2017/18 229
IN A NUTSHELL
Preserve and strengthen the symbiotic relationship between Knowledge, Brand value, Information power, Ethics and Corporate culture, in order to derive greater synergy for the business.
ISO 27001: 2013
17th
81,474
e-Learning
Rs.4.24 billion
INFORMATION SECURITY STANDARD RECERTIFIED
AMONG THE TOP 20 BRANDS IN SRI LANKA - INTERBRAND 2017
FOLLOWERS ON SOCIAL MEDIA
INTRODUCTION OF A CLOUD BASED E-LEARNING PLATFORM
REACHED BRAND VALUE - LMD BRAND 2018
OUR NEXT STEPS
Objectives for 2018/19
» Use of cloud technology for business applications
» Enhance the technical and soft skills of employees
Objectives for 2020 and beyond
» Positioning among top 10 brands in Sri Lanka
» Introduce virtual financial solutions
Sustaining brand value
Information security threat
Retention of knowledge
PAGE 231 PAGE 231 PAGE 231
CHALLENGES
Online version available
CA
PIT
AL
RE
PO
RT
S

230 L B Finance PLC Annual Report 2017/18
Intellectual Capital
VALUE CREATION AMONG CAPITALS
In an economy where there is an increasing reliance on intellectual capabilities, LBF is of the view that the source of our economic value no longer depends only on our 'bricks and mortar' distribution model, but equally on how we manage and use these assets to optimise outcomes. In a fiercely-competitive environment leveraging our intellectual capital therefore enables us to implement our strategy in the most effective and efficient way.
BENEFIT TO
CUSTOMERS
SOCIETY/COMMUNITY
INTELLECTUAL CAPITAL
» 47 years of industry experience
» Complied with ISO 27001:2013 Standard
» Upgraded existing HR/ERP systems
FINANCIAL CAPITAL
» Rs. 8.56 million invested on training and development
» Rs. 194.49 million spent on IT investments
HUMAN CAPITAL
» 220 new opportunities for employee career growth
» 25,845 training hours on technical and soft skills development
NATURAL CAPITAL
» 6 new ideas were generated from environment conservation projects
MANUFACTURED CAPITAL
» Fully-fledged IT equipment to support customer services
SOCIAL & RELATIONSHIP CAPITAL
» Installed automated cash deposit machines
» Loyal customer base
EMPLOYEES
BUSINESS PARTNERS

L B Finance PLC Annual Report 2017/18 231
HOW WE FACE THE CHALLENGES
Retention of knowledge
The knowledge and expertise of our people is at the heart of our business and underpins LBF’s competitive position in the market. To ensure that we do not loose these valuable resources to our competitors, we remain proactive in our efforts to motivate employees and engage them to take ownership of the Company’s future progress.
Sustaining the brand value
Sustaining brand value in an increasingly competitive market continues to be a challenge. To overcome these challenges, our brand strategy seeks to target the right positioning in the market. In addition, we look to build trust in our brand by conducting our operations in line with the highest ethical standards and in full compliance with all applicable regulations in the NBFI sector.
Information security threat
Information security is increasingly becoming a major concern for the Company, given the large volumes of sensitive information in our possession. To safeguard customer privacy we are in the process of evaluating suitable systems to invest in. In the meantime, we continue to train our employees and increase their awareness on how to manage customer privacy.
SWOTANALYSIS
Strengths
Opportunities
Weaknesses
Threats
Knowledge and expertise of employees
Updated to latest information systems and platforms
Strong brand reputation
Legacy IT systems
Lack of integration between support systems
Customer attraction and retention through the latest technology
Introduce innovative financial products and services
Attract skilled employees to the company
Information security
Rapidly-changing technological development
Brain drain to competitors
MD receiving Interbrand Award 2017
CA
PIT
AL
RE
PO
RT
S

232 L B Finance PLC Annual Report 2017/18
OUR PHILOSOPHYSystematically transform the Company’s intellectual capital in order to retain brand leadership in the NBFI sector and thereby position LBF among the top 10 brands in Sri Lanka.
MANAGEMENT APPROACHThe main thrust in LBF’s Intellectual Capital strategy is to preserve and strengthen the symbiotic relationship between each component, in order to derive greater synergy for the business.
To protect the strength of our brand, we have put in place brand guidelines that spell out how different elements of the brand should be used. The goal of our brand guidelines is to properly manage the perceptions of the Company by setting out clear directives to ensure that all parties (employees, channel partners, designers and marketing agencies) using the LB brand elements, do so consistently and in line with the core values represented by our brand.
Ensuring that our product knowledge, information systems and culture, continues to evolve in response to the growing demand of the market, is also one of our foremost priorities. Ongoing product research to determine the appropriateness of each product to the customer in the current market context as well as specific research to augment our knowledge on market intricacies, changing customer perceptions and identify emerging trends, all play a vital role in enabling LBF to stay ahead of peers by being first-to-market through the release groundbreaking new products. Our commitment is further extended by the application of stringent protocols to ensure responsible development of new products along with clear marketing guidelines that provide the necessary framework for the responsible promotion of our products to the market.
Moreover a formal Business Continuity Management System (BCMS) establishes the necessary framework to ensure continuous and reliable delivery of key products and services to customers in the event of a significant business disruption. The BCMS increases LBF’s operational resiliency and enables the Company to effectively reduce business impact, respond and recover from
Our Intellectual Capital consists primarily of a range of interconnected components – knowledge, brand value, information power, ethics and corporate culture, all of which serve as the foundation for the LB brand promise.
Intellectual Capital

L B Finance PLC Annual Report 2017/18 233
disruption and resume and return to business as usual in the event of a disruption. In this context, a Crisis Management Plan serves as a baseline for operationalising unit-wise business continuity management plans and provides the necessary direction for LBF’s response, recovery and restoration of operations during a crisis, in turn safeguarding the interests of key stakeholders LBF’s brand reputation.
Recent efforts to strengthen our competitive position saw the roll out of a new digitalisation strategy to transform LBF into a fully-fledged digitally enabled financial institution. Encompassing all mission-critical aspects of the business, the digital transformation agenda is a long-term undertaking that would further reinforce LBF’s leadership position in the NBFI sector, paving the way for the Company to advance its national brand ranking.
PROGRESS REPORT 2017/18
In the year under review, LBF followed an inclusive approach towards strengthening brand leadership, with special emphasis on three strategic themes that would boost the Company’s Intellectual Capital.
Enhance Knowledge Base
The Company firmly believes that knowledge is power and continues to work towards strengthening LBF’s knowledge base. In doing so, it considers ongoing research
The other key area of focus for 2017/18 was the introduction of the cloud-based applications to add value to the gold loan product.
Runner-up - National Business Excellence Award
Re-launch of L B sustainability website
CA
PIT
AL
RE
PO
RT
S

234 L B Finance PLC Annual Report 2017/18
investments in branch infrastructure and staff training. The main focus of the 2017/18, mystery shopper programme was to assess the degree of convenience offered by branch facilities and gauge the customer service offered by front-line branch staff.
In the year under review, LBF also commissioned a brand perception study to measure the public sensitivity to the LB brand. Conducted by an independent third party research specialist, the main objective of the study was to test brand awareness levels among the wider public and thereby establish
LBF’s positioning within the NBFI sector from the standpoint of existing and potential customers. Accordingly, the research sample included a mix of salaries employees (retail customers) and SME’s.
Positioning the L B Brand
Brand management is recognized as a vital aspect of the Company’s strategic focus, as it is a key value driver that underpins LBF’s competitive position in the NBFI sector as well as stakeholder value creation capacity. Safeguarding the LBF’s unique brand proposition is therefore is an absolute priority.
2011 20132012 2014
Fully-fledged end-to-end core financial application
Paperless Boardroom initiative
Savings accounts with ATM integration and SMS alert on trasactions
SLIPS integration
SMS alerts on transactions of Savings Accounts with ATM integration
Introduction of VISA Debit Card with added security features
ISO 27001:2013 Certification
LBF’S DIGITAL JOURNEY
as a crucial aspect of the business strategy, especially given the growing competitive pressures in the NBFI industry in the recent years.
While LBF’s strategic planning and risk departments conduct regular research internally, the Company also engages the services of independent experts to commission specific need-based market research as needed by various business segments from time-to-time.
Among the ongoing research efforts is the mystery shopper programme through which we seek to determine the effectiveness of our
Intellectual Capital
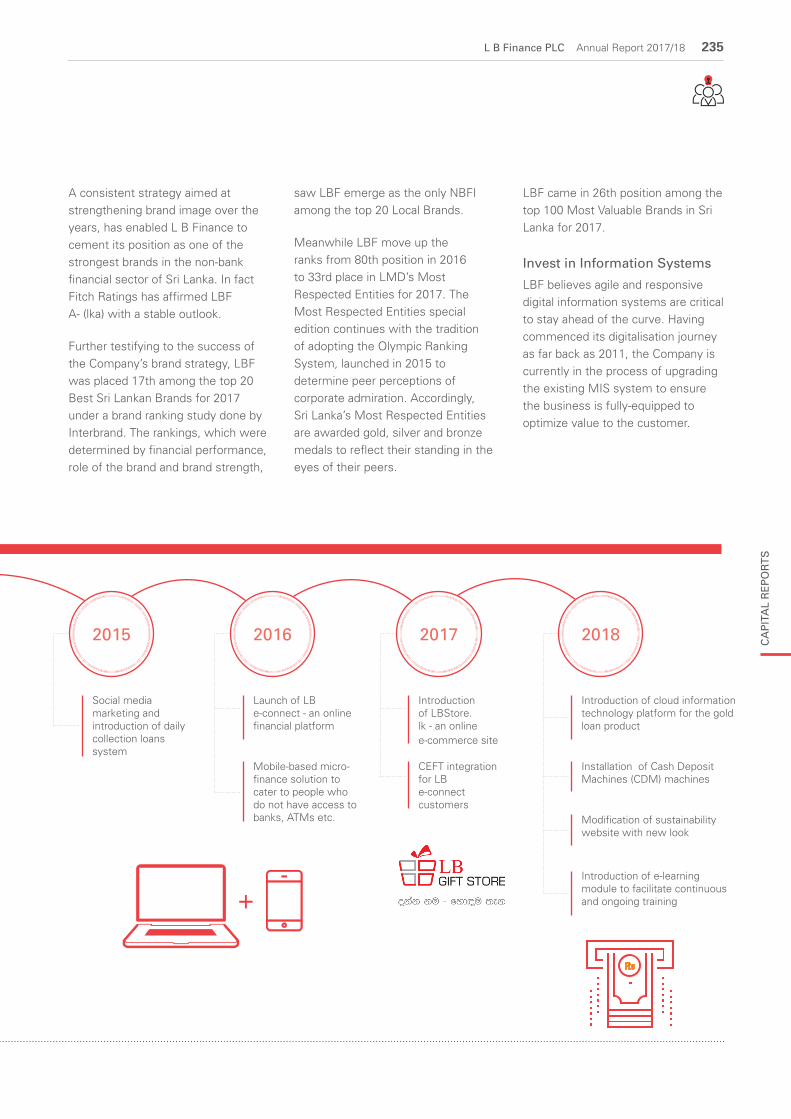
L B Finance PLC Annual Report 2017/18 235
A consistent strategy aimed at strengthening brand image over the years, has enabled L B Finance to cement its position as one of the strongest brands in the non-bank financial sector of Sri Lanka. In fact Fitch Ratings has affirmed LBF A- (lka) with a stable outlook.
Further testifying to the success of the Company’s brand strategy, LBF was placed 17th among the top 20 Best Sri Lankan Brands for 2017 under a brand ranking study done by Interbrand. The rankings, which were determined by financial performance, role of the brand and brand strength,
saw LBF emerge as the only NBFI among the top 20 Local Brands.
Meanwhile LBF move up the ranks from 80th position in 2016 to 33rd place in LMD’s Most Respected Entities for 2017. The Most Respected Entities special edition continues with the tradition of adopting the Olympic Ranking System, launched in 2015 to determine peer perceptions of corporate admiration. Accordingly, Sri Lanka’s Most Respected Entities are awarded gold, silver and bronze medals to reflect their standing in the eyes of their peers.
2016 2017 20182015
Launch of LB e-connect - an online financial platform
Introduction of LBStore.lk - an online e-commerce site
Introduction of cloud information technology platform for the gold loan product
Modification of sustainability website with new look
Social media marketing and introduction of daily collection loans system
Mobile-based micro-finance solution to cater to people who do not have access to banks, ATMs etc.
CEFT integration for LB e-connect customers
Installation of Cash Deposit Machines (CDM) machines
Introduction of e-learning module to facilitate continuous and ongoing training
LBF came in 26th position among the top 100 Most Valuable Brands in Sri Lanka for 2017.
Invest in Information Systems
LBF believes agile and responsive digital information systems are critical to stay ahead of the curve. Having commenced its digitalisation journey as far back as 2011, the Company is currently in the process of upgrading the existing MIS system to ensure the business is fully-equipped to optimize value to the customer.
CA
PIT
AL
RE
PO
RT
S

236 L B Finance PLC Annual Report 2017/18
Making steady progress on its digital transformation strategy in the year under review, LBF ambitiously undertook to revamp the core financial system. The move, will see the roll out of new ERP modules that would systematically automate all aspects of the business and facilitate the seamless integration among all key business processes. Having already made significant investments to get the project off the ground, the focus for the year was mainly centred on improving the scalability of each module as well as sharpening the correlation between modules. To further strengthen capacity in this regard, a dedicated new software development team was set up to fine-tune key aspects of the project.
The other key area of focus for 2017/18 was the introduction of cloud-based applications to add value to the gold loan product. Being one of the Company’s core lending products, the move is aimed at bringing improvements in customer delivery times and cementing LB gold loans as the #1 choice in the market.
Meanwhile having identified the need for strong Disaster Recovery (DR) infrastructure in order to support our growing operations, LBF took a decisive step to expand the capacity of the current Company’s DR architecture in the year under review. The new upgrade greatly enhances the capability of the Company’s DR infrastructure and enabling the DR site to support the business for an extended period of time in the event of an incident.
This was followed by a comprehensive business continuity drill to ascertain the effectiveness of the new DR infrastructure by testing the downtimes under each core component of the Business Continuity Management System. Conducted at the start of the workday on 20th February 2018, the results of the Business Continuity Plan (BCP) drill revealed that the Disaster Recovery site was live within a 10-minute window, critical systems within 15 minutes, and that support systems were engaged under 30 minutes. These minimal downtimes meant no drop in business volumes were reported during the DR drill, a fact that further underscores LBF’s ability to promptly re-engage in the event of business disruption.
Key highlights of LBF’s capacity upgrade
Initiative Objective
ERP system Process re-engineering to increase efficiency and reduce costs
DR architecture
Strengthen DR infrastructure to facilitate better business continuity planning and disaster recovery systems
Reinforce Culture and Ethics
LBF’s unique corporate culture is based on six key elements, namely; excellence, ethics, professionalism, transparency, innovation and quality. These values permeate through the Company’s culture and underpin every action and strategy relating to the delivery of the LB value proposition to the customer. In reinforcing the culture of service excellence, special emphasis is placed on training activities aimed at imbuing the right behaviour and attitudes among employees. Strict action to measure service quality, on an ongoing basis helps to determine service gaps and in turn reorient employee mindset and strengthen their commitment to the service excellence culture.
Being one of the Company’s core lending products, the move is aimed at bringing improvements in customer delivery times and cementing LB Gold Loans as the #1 choice in the market.
GRI - 102 - 16, 17
Intellectual Capital

L B Finance PLC Annual Report 2017/18 237
FUTU
RE
AC
TIO
N
Improve LBF’s brand ranking
Target position by 2020
Best Sri Lankan Brands 10th
LMD Most Respected Entities 20th
100 Most Valuable Brands in Sri Lanka (LMD)
Among the top 20
Ethical conduct is an integral part of LBF’s corporate culture. In fact the commitment to ethical conduct has been the cornerstone of the Company’s success – delivering strong returns and attracting and retaining customers, business partners and talented employees. Guided by its ethics policy, the Company is committed to operate all activities in full compliance laws and regulations affecting its businesses and employees. All employees have a duty to act in the best interest of the Company at all times and in doing so are expected to exercise the highest level of integrity, ethics and objectivity in their actions and relationships which may affect the Company. These principles are reinforced through the Employee Code of Conduct, while regular training is conducted to raise awareness and ensure employees do not misuse their authority or influence of their positions when representing the Company. LBF’s whistleblowing policy encourages all employees to raise concerns, expose irregularities, uncover financial malpractices and prevent frauds without any fear of reprisal or adverse consequences. More details pertaining to ethical practices are contained under ‘Corporate Governance’ on page 46 and sustainability information on page 148.
CA
PIT
AL
RE
PO
RT
S

ManufacturedCapitalOur Manufactured Capital represent product and services deliverables and way of reaching customers within and beyond boundaries. We are tasked with allocating our Manufactured Capital to ensuring the highest and best use to sustain long-term value creation.
MATERIAL DRIVERS
Strengthening local footprint
Unparalleled distribution channels
Penetrate regional markets
Expedite process automation
ACTION PLANS & OBJECTIVES STATUS PAGE
Expanding the customer access points Opened 5 new branches
243
Business expansion to regional markets Started Myanmar operation
245
Business process automation Installed Cash Deposit Machines
245
Upgrading customer touch-points 4 outlets upgraded and relocated
243
Achieved
In progress
Not achieved
SNAPSHOT OF CAPITAL OUTCOMES
IMPACT AREA WHAT YOU WILL FIND WHERE TO FIND
Transaction processing time
Reduce transaction processing time by 200%
Expedited process automation
Regional expansion
Started microfinance business operation in Myanmar
Penetrate regional market
PAGE 245
PAGE 245
238 L B Finance PLC Annual Report 2017/18
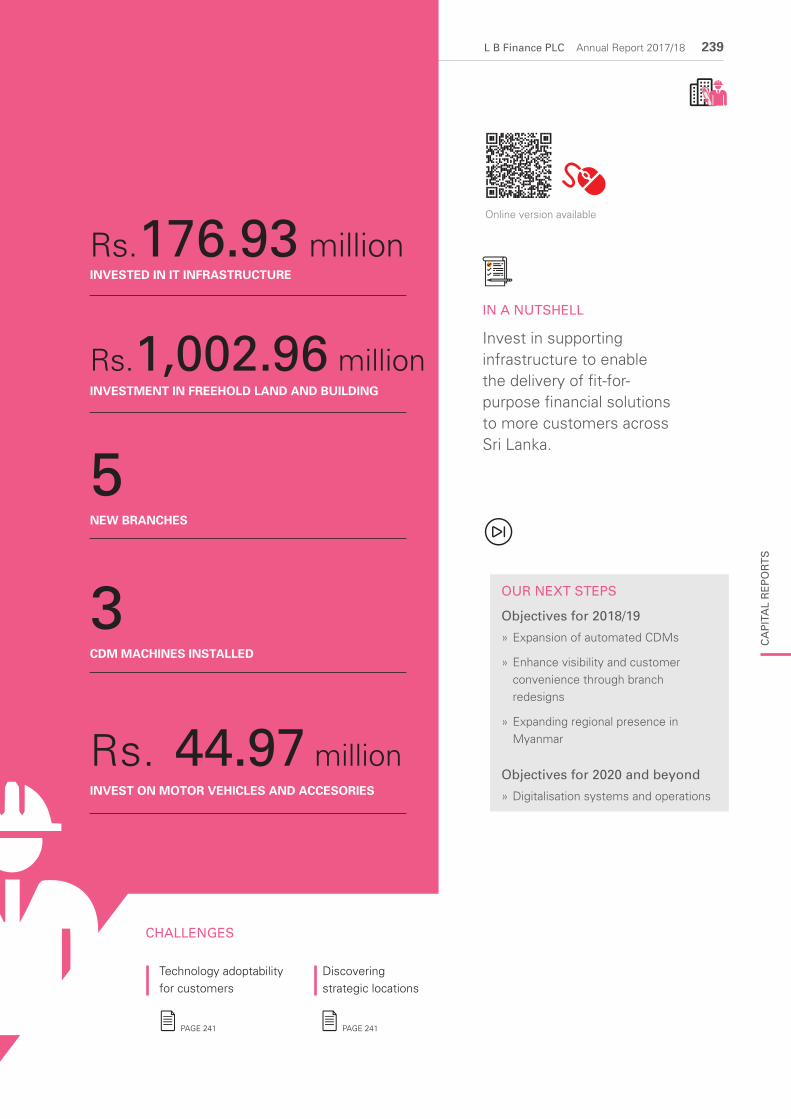
L B Finance PLC Annual Report 2017/18 239
Rs.1,002.96 million
3
5
Rs. 44.97 million
Rs.176.93 million
INVESTMENT IN FREEHOLD LAND AND BUILDING
CDM MACHINES INSTALLED
NEW BRANCHES
INVEST ON MOTOR VEHICLES AND ACCESORIES
INVESTED IN IT INFRASTRUCTURE
IN A NUTSHELL
Invest in supporting infrastructure to enable the delivery of fit-for-purpose financial solutions to more customers across Sri Lanka.
OUR NEXT STEPS
Objectives for 2018/19
» Expansion of automated CDMs
» Enhance visibility and customer convenience through branch redesigns
» Expanding regional presence in Myanmar
Objectives for 2020 and beyond
» Digitalisation systems and operations
Online version available
Technology adoptability for customers
PAGE 241
CHALLENGES
Discovering strategic locations
PAGE 241
CA
PIT
AL
RE
PO
RT
S

240 L B Finance PLC Annual Report 2017/18
Manufactured Capital
VALUE CREATION AMONG CAPITALS
Through the disciplined application of our business model – the active management of our service platform, including investing, financing and value added services– we optimise our manufactured capital, enabling us to provide sustained income and capital growth for all our stakeholders.
BENEFIT TO
CUSTOMERS
EMPLOYEES
SOCIETY/COMMUNITY
INTELLECTUAL CAPITAL
» Enhanced brand loyalty via reaching the customer's doorstep
» Further enhanced customer privacy and assets security
FINANCIAL CAPITAL
» Built-up strong assets base
» Increased profitability
NATURAL CAPITAL
» Used natural lighting as much as possible to reduce the cost and carbon emission
» Energy efficient equipments utilisation led to a reduction in energy consumption
MANUFACTURED CAPITAL
» Opened 5 new branches
» Acquired property in Colombo 03
» Strategic relocation of 3 branches and gold loan centre
» Regional expansion to Myanmar
HUMAN CAPITAL
» We provided 220 new employment opportunities
SOCIAL & RELATIONSHIP CAPITAL
» Customer base increased by 14.85%
» 159 customer service centres
» Livelihood development through micro financing

L B Finance PLC Annual Report 2017/18 241
HOW WE FACE THE CHALLENGES
Technology adoptability for customers
Customers are resistant to change from their existing practices.
At LBF we introduce customer- friendly technologies and encourage and teach them to be with technology and get the full benefits of its convenience. In order to do these, the understanding of customer behaviour and habits is key.
Discovering Strategic locations
Geographical outreach within the country is essential for our business growth. Identifying growth opportunities in competitive landscape is essential. We have recruited people with local experience and invest in knowledge and experienced corporate consultants.
Evaluation of global market trends, market opportunities and in-depth screening will help us to climb to a better position regionally.
SWOTANALYSIS
Strengths
Opportunities
Weaknesses
Threats
Island-wide customer touch points
Strengthen the regional presence
Automated business processes
Inadequate parking facilities in city branches
Space limitation in branch premises
Reaching untouched markets
Introduce innovative products
Reduce operational expenses
Customer inadaptability for new technology
Competitive landscape in regional markets
Rapidly-changing technology
Launching of cash deposit machines
CA
PIT
AL
RE
PO
RT
S

242 L B Finance PLC Annual Report 2017/18
OUR PHILOSOPHYContinuous investment to develop and upgrade Manufactured Capital in line with customer expectations to enable LBF to deliver fit-for-purpose financial solutions to more and more people across Sri Lanka.
MANAGEMENT APPROACHWe strive to maintain ‘make the branch visit a brand experience’ culture. Outlets are the Company’s main customer touch-points, much of our investments are centred on expanding branch network and layout in order to create measurable value to a broader customer base by facilitating enhanced accessibility and greater convenience. As a policy, we ensure that LBF branches are located strategically in cities and townships across the country so that they may serve as key touch-points for a wider geographical audience. An extension of this strategy includes setting up hub-centers in key cities to function as fit-for-purpose branches catering to the specific needs of the customers in a particular region.
To demonstrate our commitment to deliver a superior customer experience, we continue to review our existing branch layout in order to understand the need for change or improvement. Based on these findings, each year we invest in relocating / upgrading facilities at our branches. At the same time we have begun modernising the internal layout and external façade of our branches to reflect greater uniformity and clarity across the network. Alongside these efforts, we have launched a widespread digitalisation strategy to transform selected branches into fully equipped digital hubs. This also connects to our overall IT strategy, where we look to leverage on the latest digital technology to enhance the efficiency and effectiveness of internal processes in order to deliver a seamless customer experience every time.
Our strategy for the gold loan centres is to establish hub-units, in larger cities and with all other gold loan centres in that region to be anchored to the hub-unit. The call centres will play an increasingly important roll to LBF’s service model, Company now allocates a significant capital expenditure each year to upgrade gold loan centre and branches.
LBF’s Manufactured Capital is essentially the core infrastructure or touch-points comprising the network of LBF’s own branches and gold loan centres, and the Company’s call centres as well as key investments in technology and digital hardware that enable the Company to carry out its business and deliver the LBF brand promise to the market.
Manufactured Capital

L B Finance PLC Annual Report 2017/18 243
In the year under review, LBF adopted a three-pronged strategy to develop Manufactured Capital.
INCREASE LOCAL FOOTPRINT
In line with our strategy to widen LBF’s island-wide reach, a total of five new branches were opened in the year under review. The new branches set up in Mannar, Dharga Town, Bambalapitiya, Wadduwa and Karapitiya, are aimed at widening the reach in the Mannar, Kalutara, Colombo and Galle Districts, where the local economy has shown encouraging signs of development in the past few years. Capturing a modern look and feel and equipped with a range of advanced facilities, these latest branches are the first in a series of strategic hubs/super branches intended to reinforce LBF’s position as the premier financial services institution in the country.
Meanwhile four of LBF’s existing outlets in Kochchikade, Samanthurai, Gampola and Ragama were relocated to more customer-friendly localities that also offer greater visibility to LBF. Continuing with the ongoing facility upgrade programme.
To complement the aggressive efforts to promote the gold loan product, steps were taken to strengthen related infrastructure. The first phase of our project was to introduce VIP gold loan centre at Corporate Office.
Further emphasis on the gold loan product prompted the setting up of a new dedicated call centre in Jaffna specifically to cater to the Tamil speaking customers in the North and East regions of the country. This is the Company’s fourth call centre, in addition to the call centres in Mount Lavinia, Delkanda and at City office.
Wadduwa branch opening
New document archive facility in Maradana
In the year under review, the Company invested in the branch network Rs. 1,492.36 million while the investment in IT infrastructure totalled Rs. 176.93 million. A further Rs. 44.97 million was invested in motor vehicles to accommodate the Company’s expansion agenda. LBF also acquired a premium property within the Colombo city limits, a move that further strengthened the Company’s strategic asset base during the year.
Since these investments amount to significant outflow of funds, it is imperative that we properly evaluate the expected outcomes so that the benefits can be reaped within the expected time frame. At the same time, we are also mindful of controlling the expenditure associated with the capital cost in order to maintain the overall cost efficiency of the Company.
CA
PIT
AL
RE
PO
RT
S

244 L B Finance PLC Annual Report 2017/18
123Branches
36Gold loan centres
3,441Employees
CENTRAL PROVINCE
15 303
WESTERN PROVINCE
40 1,881
SOUTHERN PROVINCE
12 254SABARAGAMUWA PROVINCE
6 155
HEAD OFFICE
Branches Gold loan centres Employees Population (‘000)
GDP (Rs. billion) LBF distribution of Loans (Rs. billion)
OUR PRESENCE
159Locations
LB SUBSIDIARY
Myanmar
2,690
6,028
2,5852,009
10
5336
85
1,254
4,723
1,196897
UVA PROVINCE
6 105
1,333
4
691
EASTERN PROVINCE
15 232
1,645
6
684
NORTH WESTERN PROVINCE
9 225
2,477
9
1,269
NORTH CENTRAL PROVINCE
7 120
1,330
4
690
NORTHERN PROVINCE
12 166
1,107
3
497
Manufactured Capital

L B Finance PLC Annual Report 2017/18 245
PENETRATE REGIONAL MARKETS
Marking a significant milestone in its 47 year history, LBF expanded its footprint beyond Sri Lanka by setting up L B Microfinance Myanmar Company Limited (LBMF) in December 2017 as a Greenfield operation licensed to provide direct financial assistance to underserved farming communities in rural Myanmar to improve their livelihoods.
The inaugural LBMF branch was set up in Pyay, with plans underway to set up a second branch in the early part of the next financial year.
EXPEDITE PROCESS AUTOMATION
Having understood that digitalisation remains an urgent need if LBF is to sustain its competitive edge. In 2011 the Company embarked on an ambitious all-encompassing digital transformation strategy that would ultimately automate all aspects of the business for the benefit of all LBF
City office Colombo 03
KEY FOCUS AREAS OF THE RESEARCH
How you learn about L B Finance PLC as Financial Partner?
Understanding how customers hear about the Company, helps in determining LBF’s main marketing thrust.
27%
50%
23%
Word-of-mouthConnection with L B StaffAdvertisements
» Increasing the number of strategic hubs / super branches to anchor the Company’s presence in key cities in Sri Lanka
» Expanding the number of gold loan centres in high-potential areas
» Open more branches in Myanmar to consolidate the regional presence
» Ongoing investment to upgrade IT infrastructure
FUTU
RE
AC
TIO
N
customers. The investment in CDMs marks the latest development in LBF’s digital journey.
CA
PIT
AL
RE
PO
RT
S

HumanCapitalHuman Capital refers to our employees – our key resource and strategic differentiator. Their knowledge, skills, attitude and innovation enable us to realise our vision of being the best Sri Lankan financial company.
MATERIAL DRIVERS
Recognised and reward high achievers
Provide relevant and progressive learning opportunities
Promote leader as a source of value
Build a culture of engagement
ACTION PLANS & OBJECTIVES STATUS PAGE
Reward high achievers 698 employees promoted
260
Enhance employee engagement 9,079 employee voluntary hours spent on CSR
activities
263
Strengthen learning and development opportunities
25,845 Training hours
261
Generated new employment opportunities
1,313 new employees recruited
259
Achieved
In progress
Not achieved
SNAPSHOT OF CAPITAL OUTCOMES
IMPACT AREA WHAT YOU WILL FIND WHERE TO FIND
Employee recognition
698 employees promoted
Review of employee benefits and remuneration
Employee development
Average training per employees increased by 17%
Review of employee training
PAGE 252
PAGE 261
246 L B Finance PLC Annual Report 2017/18

L B Finance PLC Annual Report 2017/18 247
25,845
Rs.8.56 million
698
220
3,441
EMPLOYEES TRAINING HOURS
TOTAL COST OF TRAINING
EMPLOYEES WERE PROMOTED
NEW EMPLOYMENT OPPORTUNITIES
EMPLOYEES
OUR NEXT STEPS
Objectives for 2018/19
» Introducing flexi hours for selected employee sections
» Continuation of soft skill development programmes
Objectives for 2020 and beyond
» To be the best place to work in Sri Lanka
IN A NUTSHELL
Ensure our employees align their growth journey with that of the Company, and develop a sense of ownership and pride in being part of the LBF team.
Online version available
Employee Attrition
Developing soft skills of employees
Training design and suitability
PAGE 249 PAGE 249 PAGE 249
CHALLENGES
CA
PIT
AL
RE
PO
RT
S

248 L B Finance PLC Annual Report 2017/18
Human Capital
VALUE CREATION AMONG CAPITALS
Our employee value proposition, which deepens staff engagement, strives to cultivate and harness the power of our employees’ passion and commitment. In this way, we always believe that investing in our employees creates unquantified values to LBF to go above and beyond.
BENEFIT TO
CUSTOMERS
EMPLOYEES
SOCIETY/COMMUNITY
INTELLECTUAL CAPITAL
» 23,279 soft skill development training hours
» Upgraded the front-end and back-end HR system
FINANCIAL CAPITAL
» Rs. 2.03 billion financial benefits distribute to the employees
» Rs. 78.81 million staff welfare
» Rs. 8.56 million worth investment on training
HUMAN CAPITAL
» 220 new employment opportunities
» 6 leadership development programmes
NATURAL CAPITAL
» 1,965 volunteering hour for environmental conservation projects
» 6 employee awareness programmes for energy conservation
MANUFACTURED CAPITAL
» Average number of employees per outlet increased to 21
SOCIAL & RELATIONSHIP CAPITAL
» 7,114 dedicated volunteers for community empowerment projects
» Loyal customer service via well trained customer representatives.
» Dedicated gold loan call centre for Jaffna region

L B Finance PLC Annual Report 2017/18 249
HOW WE FACE THE CHALLENGES
Training design and suitabilityWe always try to provide the best industry training experience. In the sense of training, the Company cannot provide or design a common training for all. In order to ensure that proper training is delivered to staff, the company conducts a TNA department- wise, and designs/facilitates and monitors training respectively.
Employee attritionTalent audition and retention part is a major part of the HR process, therefore employee attrition is a big challenge for the company. To face these challenges LBF seeks to promote cross-divisional moves to enable employees to expand their skills and experience in order to have more rounded careers. Furthermore, this ‘internal mobility’ contributes to savings on redundancy and recruitment costs. Our continuous focus is to eliminate brain drain through our talent retention strategy where we build and engage colleagues with carefully drawn personal development plans (PDPs), recognition and rewards schemes.
LBF’s approach to performance management comprises of three main steps: 1. defining expectations and setting objectives at the beginning of the year, 2. holding regular feedback conversations throughout, 3. reviewing performance at the end. The focus is on continuous and constructive conversations between employees and their managers.
Developing soft skillsEmployees of the Company totally focus on the business growth. They work hard to ensure success of the Company. Therefore they encounter time constraints to develop their soft skills. By identifying this challenges the Company has taken many initiatives to enhance the soft skills of employees.
SWOTANALYSIS
Strengths
Opportunities
Weaknesses
Threats
Multi-talented and experienced workforce
Diversified ethnic groups with equal opportunities to be successful and achieve their potential
Skillful and well-qualified management team
Being one of the top brands in Sri Lanka with a positive conduct and value based environment
Millennial workforce commonly low employee engagement
High internal competition turn to employee dis-satisfaction is not properly managed
Aging workforce
Ability to attract skilled workforce locally and overseas
Availability of enough sources to attract
Cater to new market segments
Brain drain to rivals
Changes in employee regulations and governance
Reduction in newer generation willingness to perform sales jobs
Employee training
CA
PIT
AL
RE
PO
RT
S

250 L B Finance PLC Annual Report 2017/18
OUR PHILOSOPHYMaximise the value of Human Capital by grooming employees as long-term strategic business partners equipped with the capacity to deliver on LBF’s mission, values, and strategies and fulfill the expectations of customers, shareholders and all other stakeholders.
Simply put, our goal is to ensure our employees align their growth journey with that of the Company, and develop a sense of ownership and pride in being part of the LBF team.
MANAGEMENT APPROACHStemming from this philosophy, LBF’s overarching priority is to create an environment where employees remain committed, stay motivated, are consistently satisfied with the work they do and have realistic prospects for career advancement and fulfilling personal growth.
The dynamic environment in which the Company operates requires employees to be adaptable, results-driven, self-motivated, decisive and responsive team players. It is why we are continuously evolving our workforce management approach in an effort to gain access to the right people with the right capabilities to achieve our business objectives.
In order to attract and retain the best in-class talent pool, LBF’s salary structures are benchmarked against industry standards and include a range of benefits (medical insurance, housing loan and vehicle loan entitlements) in addition to the basic salary. Over the years the Company has been attracting and hiring the top talent in the industry. Using a proven selection process that measures character, leadership and aptitude, applicants are identified and hired based on how well they fit our Company culture and envision their role in the Company’s growth aspirations.
At LBF, we recognise Human Capital (Our people) to be the key custodians of our business – the driving force of our competitive advantage and the defining factor of our success.
Human Capital

L B Finance PLC Annual Report 2017/18 251
In line with globally-accepted best practices, LBF has adopted the labour principles outlined by the UN Global Compact to create a work environment that is free from any form of prejudice, bias, harassment and violation.
Our equality goals seek to ensure that all employees are provided with equal opportunities for development, advancement and promotion on merit and without prejudice. Moreover, in meeting the staffing needs of the branches, LBF has voluntarily committed to maintain a local hiring ratio of more than 90%.
In line with globally-accepted best practices, LBF has adopted the labour principles outlined by the UN Global Compact to create a work environment that is free from any form of prejudice, bias, harassment and violation.
Our Code of Conduct entrenches the right of all employees to be treated with fairness, equality and respect. Further, under LBF’s inclusion strategy the discrimination of employees on the basis of gender, race, physical health, sexual orientation, individual belief systems and any other prejudicial
grounds is prohibited. Employees are protected by local labour legislation and internal policies and practices ensure appropriate hours of work and statutory leave entitlements for permanent employees, while formal grievance procedures are in place to enable employees to lodge complaints. These compliance frameworks are monitored frequently to ensure compliance with labour legislation is up-to-date.
All LBF employees are entitled to a safe and healthy working environment, for we believe that health, wellness and fitness are fundamental for employees to effectively execute of their designated responsibilities. It is what inspires our commitment to ensuring the safety and security of our employees at all times. Our health and safety management systems are aligned to global standards, with a formal system in place to ensure that incidents are recorded, investigated and analysed in a structured and timely manner in order to identify root causes and prevent the recurrence of incidents.
KEY FOCUS AREAS OF THE RESEARCH
Overall Employee satisfaction with L B Finance PLC
Provides an insight into the Company’s position as an employer of choice
83%
17%
Totally satisfiedConditionally satisfied
Toastmasters Club
CA
PIT
AL
RE
PO
RT
S

252 L B Finance PLC Annual Report 2017/18
“TRIPLE E“ APPROACH
EDUCATION
Develop the Company’s employees’ skills through learning experience
EXPERIENCE
Move employees across divisions and jobs enriching their work experience
EXPOSURE
Give them opportunities to interact with Senior Management and provide them with mentoring and training to prepare them for the positions they will hold
PROGRESS REPORT 2017/18In the year under review, the Company focused on strategic themes in seeking to create a fit-for-purpose Human Capital model that will accelerate LBF’s long-term strategic agenda.
Talent acquisition and retention
LBF has a professional, well-thought- out and flexible recruitment process that ensures the Company recruits people for the jobs that suit their talents and capabilities. To preserve employee morale and ensure career growth, vacancies are filled through internal promotions wherever possible, while the Company maintains links to universities and professional bodies to facilitate entry-level recruitment. A strategic and professional approach to recruitment and selection enables LBF to attract, appoint and retain employees with the necessary skills and attributes to fulfil strategic aims and support the Company’s values. The Company remains committed to ensuring that the recruitment and selection is conducted in a manner that is systematic, efficient and effective, and is also consistent with globally- accepted best practices equality and diversity.
REWARD HIGH ACHIEVERS
Remuneration and benefits
LBF’s well-developed compensation structure rewards employees (full time) fairly according to their contribution to the Company. In addition to basic pay, LBF provides numerous other benefits such as performance-related bonuses, fuel and travelling allowances, vehicle allowances, loans and lease facilities below market interest rates, medical and insurance benefits, gratuity and reimbursement of membership of professional bodies.
OUR WINNING TEAM
Tale
nt a
cqui
sitio
n an
d re
tent
ion
Trai
ning
and
dev
elop
men
t
Em
ploy
ee p
rodu
ctiv
ity
Eva
luat
ion
and
rew
ards
Em
ploy
ee e
ngag
emen
t
Wor
k lif
e ba
lanc
e
Res
pect
and
pro
tect
ion
HR governance
Material HR aspects
HR policies and procedures
OUR WINNING TEAM
The remuneration offered by LBF is either on par or above the sector and higher than the minimum wage rates prevailing in the country. Sharing success with LBF’s employees has become a part of the Company culture, which has led to creating a strong bond between the Company and its employees. LBF’s reward scheme provides compensation and benefits that are competitive within the market and the industry.
Employee benefit
2017/18 Rs. Mn
2016/17 Rs. Mn
Salaries and other related expenses
2,034.81 1,798.76
Employer’s contribution to EPF
188.58 162.96
Employer’s contribution to ETF
37.71 32.59
Gratuity 44.68 37.10
GRI - 202 - 1, 401 - 2
Human Capital

L B Finance PLC Annual Report 2017/18 253
Key value-adding initiatives for the year
» Performance appraisals were completed for 95% of LBF’s permanent employees through formal one-on-one meetings between employees and their respective managers
» ‘Most Available Employee’ under the ‘Customer First’ campaign
» ‘Best Marketing Officer’ campaign
» ‘Best Starter’ programme to capture the achievements of new recruits
Evaluation and rewards
Recognition of exceptional performance is a key component of LBF’s result-oriented focus. A performance management process is in place across the business, driven by a bi-annual performance review mechanism. The mid-year review conducted in October each year aims to highlight performance gaps and determine any also immediate training needs for the first six months of the year. Poor performers, especially those in marketing identified through this process, are supported through coaching and mentoring programmes in an effort to urge them to improve their performance outcomes in preparation for the year-end appraisal.
The year-end performance appraisal conducted in April each year assesses the employee’s annual performance vis-à-vis pre-agreed divisional/business unit-level targets and objectives set at the start of the previous financial year. Performance incentives and annual salary increases are determined through this appraisal process.
Currently the Company does not seek or take into account stakeholder views regarding remuneration, including the results of votes on remuneration policies and proposals.
In addition, LBF employees benefit from a range of incentives and rewards programmes that recognise specific achievements.
PROVIDE RELEVANT AND PROGRESSIVE LEARNING OPPORTUNITIES
LBF is committed to ensuring that all staff have access to learning and development opportunities, which enable them to be suitably knowledgeable and skilled to carry out their role within the Company, and to develop their talents in ways that fit with the Company’s long-term strategic objectives.
Training and development
To give the Company a competitive advantage, LBF’s training focus is mainly three-fold;
1. Training relating to the enhancement of skills for a staff member’s current role, including internal and external courses providing technical or specialist training relating to the skills that enhance their capacity to perform their existing job role
KEY FOCUS AREAS OF THE RESEARCH
Satisfaction with Growth Opportunities
Helps to establish the success of the Company’s leadership development strategy
97%
3%
Totally satisfiedConditionally satisfied
0
2
4
6
8
10
0
10
20
30
40
AVERAGE TRAINING HOURS BY EMPLOYEE CATEGORY
Rs.Mn Traininghours
2014 2015 2016 2017 2018
Senior Management Middle Management Executive Clerical Minor Total Training hours
GRI - 404 - 3
CA
PIT
AL
RE
PO
RT
S
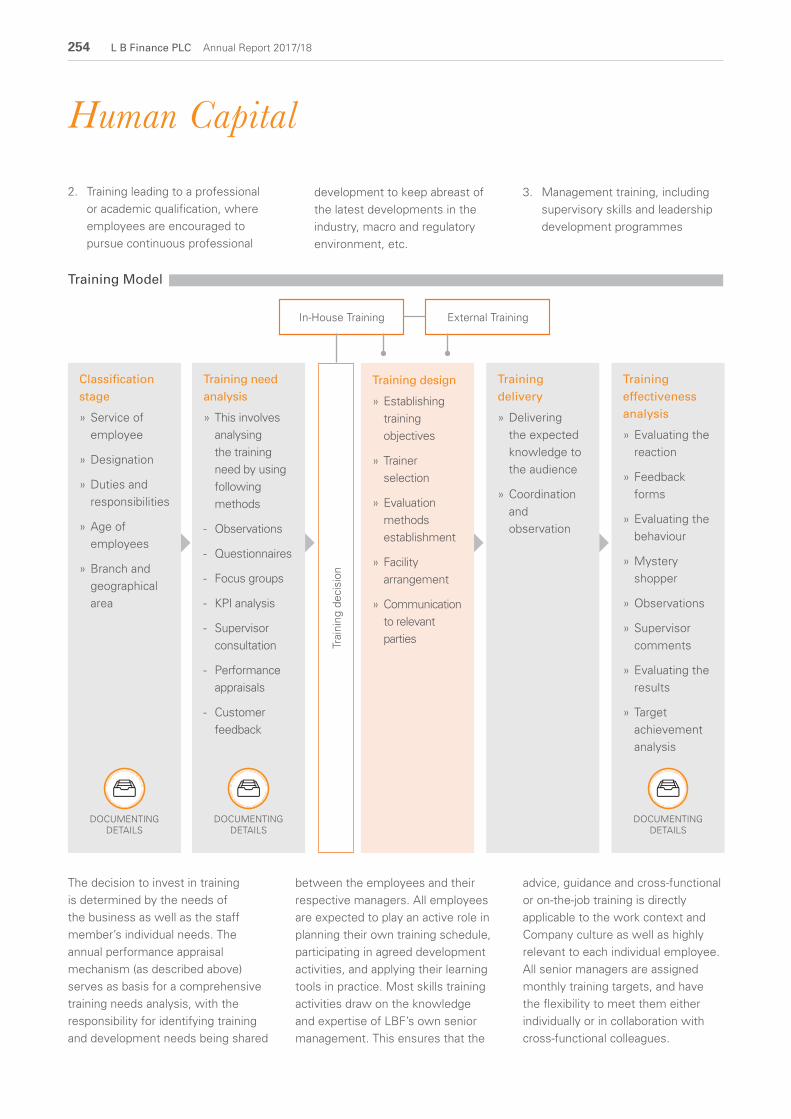
254 L B Finance PLC Annual Report 2017/18
Classification stage
» Service of employee
» Designation
» Duties and responsibilities
» Age of employees
» Branch and geographical area
Training need analysis
» This involves analysing the training need by using following methods
- Observations
- Questionnaires
- Focus groups
- KPI analysis
- Supervisor consultation
- Performance appraisals
- Customer feedback
Training design
» Establishing training objectives
» Trainer selection
» Evaluation methods establishment
» Facility arrangement
» Communication to relevant parties
Training delivery
» Delivering the expected knowledge to the audience
» Coordination and observation
Training effectiveness analysis
» Evaluating the reaction
» Feedback forms
» Evaluating the behaviour
» Mystery shopper
» Observations
» Supervisor comments
» Evaluating the results
» Target achievement analysis
Trai
ning
dec
isio
n
In-House Training External Training
DOCUMENTING DETAILS
DOCUMENTING DETAILS
DOCUMENTING DETAILS
Training Model
2. Training leading to a professional or academic qualification, where employees are encouraged to pursue continuous professional
between the employees and their respective managers. All employees are expected to play an active role in planning their own training schedule, participating in agreed development activities, and applying their learning tools in practice. Most skills training activities draw on the knowledge and expertise of LBF’s own senior management. This ensures that the
advice, guidance and cross-functional or on-the-job training is directly applicable to the work context and Company culture as well as highly relevant to each individual employee. All senior managers are assigned monthly training targets, and have the flexibility to meet them either individually or in collaboration with cross-functional colleagues.
development to keep abreast of the latest developments in the industry, macro and regulatory environment, etc.
3. Management training, including supervisory skills and leadership development programmes
The decision to invest in training is determined by the needs of the business as well as the staff member’s individual needs. The annual performance appraisal mechanism (as described above) serves as basis for a comprehensive training needs analysis, with the responsibility for identifying training and development needs being shared
Human Capital

L B Finance PLC Annual Report 2017/18 255
LBF strongly believes in identifying and developing leadership within the Company. For employees who demonstrate the necessary capabilities and drive, special development plans are drawn up, enabling each of them to access meaningful growth opportunities by matching their personal strengths and interests with business needs.
TOWARDS A NEW LEARNING DIMENSION – THE CASE FOR INVESTING IN A DIGITAL WORKPLACE
Given the rapid pace at which LBF’s business is growing and evolving, we believe that a digital workplace can materially change the way our employees work. In this fast-paced era, a digital workplace offers a simple, fast and effective solution. It operates as a single-source of information capable of servicing the critical need for speed, enabling employees to connect faster, communicate better, and collaborate for more effective results.
While the immediate benefit would be an improvement in work efficiency, the real value of a digital workplace is the competitive advantage to the Company.
LBF’s digital workplace strategy is a long-term undertaking that aims to streamline business processes, promote employee collaboration and drive successful business outcomes to give the Company a definite edge over peers.
Taking the first steps towards implementing a digital workplace strategy, LBF launched a new e-learning platform – the Virtual Learning Academy in 2017 – as a part of an ongoing effort to encourage users to migrate from physical learning channels to a virtual learning environment.
Meanwhile, to counter the initial resistance to the new e-learning tool, the Company continued raising awareness among employees, with additional incentives being offered to motivate employees to use the e-learning tools offered through the Virtual Learning Academy.
Given our strong emphasis on result-oriented training, all investments in training and development are regularly reviewed to ensure not only that adequate resources are being provided but also that training and development activities are delivering the desired benefits to both the employee and the business. LBF’s managers have a responsibility to monitor and evaluate the effectiveness of learning by encouraging formal feedback from employees under their supervision who have undergone training. As a follow-up to the formal feedback form, managers and employees meet separately to further discuss the qualitative aspects and cost effectiveness of most recent training programmes.
The effectiveness of specific initiatives, such as customer service training is assessed through our
mystery shopper surveys conducted monthly by an independent third party service provider. The effectiveness of sales and marketing training are measured against individual achievement or surpassing of individual revenue targets.
PROMOTE LEADERS AS A SOURCE OF VALUE
LBF strongly believes in identifying and developing leadership within the Company. For employees who demonstrate the necessary capabilities and drive, special development plans are drawn up, enabling each of them to access meaningful growth opportunities by
matching their personal strengths and interests with business needs. Employees are groomed through combination of on-the-job training, job-rotations and cross-functional assignments along with technical, functional and leadership skills training, to prepare them for future roles and leadership responsibilities.
LBF’s senior management remains actively involved in the development of the Company’s leadership pipeline, contributing through knowledge sharing and mentoring to help budding young managers acquire the rights skills and behavioural attitudes needed to take the Company to the next level.
CA
PIT
AL
RE
PO
RT
S

256 L B Finance PLC Annual Report 2017/18
BUILD A CULTURE OF ENGAGEMENT
Employee Engagement
We believe there is a direct link between employee engagement and business performance and our ability to serve customers. We believe that reinforces LBF’s commitment to promote a culture of engagement across the Company.
The responsibility for maintaining strong and ongoing dialogue with employees lies with the managers of each division or business unit. This process of listening to and learning from our employees builds mutual trust, and also provides the management with the opportunity to solicit new ideas, or identify solutions improvements that would pave the way for a more effective and productive working environment. The Company has also put in place a number of other formal and informal channels to keep employees abreast of new business strategies and directives issued by the Company’s leadership.
LBF’s employees also benefit from a range of activities designed to promote camaraderie and foster team spirit away from the formal work setting.
Employee volunteerism
Employee volunteerism is a key component of LBF’s employment proposition. The Company encourages its employees to spare their personal time and effort to work towards the greater good of society. LBF’s volunteer programme is geared to making a sustainable social impact in the longer term and also increasing employee job satisfaction. The sustainability projects carried
out by volunteers bears testament to the enthusiastic involvement of employees. LBF focuses and reports annually on the Company’s volunteering and sustainability activities. This makes it easier for LBF as a Company to reach beyond business.
Equal opportunities and diversity
Diversity is recognised and valued within LBF’s culture. The Company has always believed that best diversity practices contribute to the positive results in the work environment.
Respect and protection
Labour practice and decent work practices
LBF respects the rights of workers and believes in providing them a safe and conducive working environment. The Company endeavours to provide satisfaction with working conditions and remuneration, physical safety, opportunities to contribute to society as well as giving them
Volunteering policy
Attract volunteers Volunteer training
Personality development
Reward and recognition
Building LBF’s volunteers
Approach to sustainability
Positive community impact
LBF VOLUNTEERING
KEY FOCUS AREAS OF THE RESEARCH
Satisfaction with Working Environment
Helps to determine the success of the Company’s commitment to create an inclusive work environment
90%
7% 3%
Very happyHappyUnhappy
GRI - 102 - 41
Human Capital

L B Finance PLC Annual Report 2017/18 257
opportunities to come forward with their suggestions and express their opinions.
Freedom of association and collective bargaining
Due to the values, practices and policies that the Company upholds it has been able to eliminate the need for trade unions and collective bargaining agreements. During the year under review, the Company has not faced any type of industrial disputes.
Health and safety
LBF follows a Zero accident work practices. To facilitate the creation of a hazard-free environment the Company has introduced policies and procedures for all branches across the Island. These procedures range from simple precautions to situations that demand more complex applications. Basic safety instructions are prominently displayed at all locations, while a specialised Business Continuity Plan is in place for potential emergencies.
FUTU
RE
AC
TIO
N
» Build a digitally-enabled workforce
» Focus on competency-based/work-related training modules
» Enhance employee engagement activities
» Position LBF as an employer of choice
» Increase investment in e-learning modules
Further, as a service sector organisation, LBF’s employees are not exposed to the risk of occupational diseases.
Career management and succession planning
LBF believes in business partnerships, more than employment developing and supporting employees in their careers. The Company’s employee development and succession planning programme seeks to ensure the right talent is in place at the key positions. LBF’s succession planning model is based on the identification of ‘choke points’, (things that can stop the business from running), and determining the critical/key positions associated with these “choke points”. Different tools are used to earmark for training, potential employees with capabilities to take over these critical positions should the need arise.
Individual development plans are formulated for selected candidates, who are then rigorously trained in order to prepare them for their future roles.
Employee volunteering
CA
PIT
AL
RE
PO
RT
S

258 L B Finance PLC Annual Report 2017/18
GRAPHICAL REVIEW OF TOTAL EMPLOYEES
Total employees by region and gender T - 1
2017/18 2016/17
Province Male Female total Male Female total
Central 209 94 303 178 76 254 Eastern 153 79 232 157 78 235 Northern 95 71 166 77 47 124 North-Central 93 27 120 103 31 134 North-Western 145 80 225 128 65 193 Sabaragamuwa 111 44 155 123 42 165 Southern 178 76 254 158 76 234 Uva 76 29 105 70 26 96 Western 1119 762 1,881 1,082 704 1,786 Total 2,179 1262 3,441 2,076 1,145 3,221
Employees by employment category (Including governance body) and gender
T - 2
2017/18 2016/17
Male Female Male Female
Board of Directors 7 3 7 4Senior Management and above
21 3 19 3
Middle Management 259 30 217 27Executive 819 557 732 469Clerical 985 670 1,013 645Minor 91 2 92 - Total 2,182 1,265 2,070 1,148
Analysis of employees by contract type and gender T - 3
2017/18 2016/17
Employee type Male Female Male Female
Full-time employees (Permanent)
2,167 1,261 2,069 1,144
Employees on contract basis
12 1 7 1
Total 2,179 1,262 2,076 1,145
64%
36%
MaleFemale
EMPLOYEE ANALYSIS BY GENDER 2017
63%
37%
MaleFemale
EMPLOYEE ANALYSIS BY GENDER 2018
G - 1
G - 2
0
500
1,000
1,500
2,000
TOTAL NUMBER OF EMPLOYEES BY AGE GROUP AND CATEGROY - 2017/18
No. ofemployees
Seni
orma
nagem
ent
and
abov
e
Midd
lema
negem
ent
Execu
tive
Cleri
cal
Min
or
Below 30 years 30-50 years Over 50 years
GRI - 102 - 8, 405 - 1
Human Capital

L B Finance PLC Annual Report 2017/18 259
GRAPHICAL REVIEW OF NEW EMPLOYEES HIRED
GRAPHICAL REVIEW OF EMPLOYEES TURNOVER
New employee hired by region and gender T - 4
2017/18 % %Province Male Female total Male Female
Central 86 32 118 7% 2%Eastern 80 28 108 6% 2%Northern 40 32 72 3% 2%North-Central 36 13 49 3% 1%North-Western 52 26 78 4% 2%Sabaragamuwa 42 12 54 3% 1%Southern 65 13 78 5% 1%Uva 29 12 41 2% 1%Western 470 245 715 36% 19%Total 900 413 1,313 69% 31%
69%
31%
MaleFemale
NEW EMPLOYEESHIRED BY GENDER 2018
G - 3
G - 4
0
200
400
600
800
1,000
NEW EMPLOYEE HIRED BY AGE CATEGORY AND GENDER
Rs.Mn
201820172016Male Female Male Female Male Female
Below 30 years30-50 yearsOver 50 years
Employee turnover by region and gender T - 5
2017/18 % %Province Male Female total Male Female
Central 59 14 73 5% 1%Eastern 96 28 124 9% 3%Northern 26 14 40 2% 1%North-Central 27 12 39 2% 1%North-Western 47 10 57 4% 1%Sabaragamuwa 52 10 62 5% 1%Southern 51 11 62 5% 1%Uva 22 8 30 2% 1%Western 414 192 606 38% 18%Total 794 299 1,093 73% 27%
G - 5
0
100
200
300
400
500
600
700
800
EMPLOYEE TURNOVER BY AGE CATEGORY AND GENDER
201820172016Male Female Male Female Male Female
Below 30 years30-50 yearsOver 50 years
No. ofemployees
67%
33%
MaleFemale
NEW EMPLOYEESHIRED BY GENDER 2017
GRI - 401 - 1
CA
PIT
AL
RE
PO
RT
S

260 L B Finance PLC Annual Report 2017/18
G - 6
201820172016201520140.0
0.3
0.6
0.9
1.2
1.5
2,000
2,500
3,000
3,500
PROFIT PER EMPLOYEE
Rs.Mn %
Profit per employeeNo. of employees
Employee turnover by reason T - 6
2017/18
Reason Male Female
Resignation 787 299Retirement 5 - Premature retirement - - Deceased - - Termination 2 - Total 794 299
GRAPHICAL REVIEW OF EMPLOYEE BENEFITS AND REMUNERATION
Category wise promotions T - 7
Category 2017/18 2016/17 2015/2016
Board of Directors - - 1Senior Management 2 2 2Middle Management 86 52 60Executive 606 512 256Clerical 4 5 2Total 698 571 321
Standard benefits for full-time employees T - 8
Employee benefits 2017/18 2016/17 2015/2016
Salaries and other related expenses 2,034.88 2,021.25 1,573.92 Employer's contribution to EPF 188.58 162.96 129.98 Employer's contribution to ETF 37.71 32.59 25.99 Gratuity 44.68 37.10 33.03 Total 2,305.85 2,253.90 1,762.92
Ratio of basic salary of women to men by employee category T - 9
2017/18 2016/17 2015/16
Category Female Male Female Male Female Male
Senior Management 1 3.03 1 2.41 1 2.42Middle Management 1 0.94 1 0.93 1 0.91Executive 1 1.03 1 1.03 1 1.05Clerical 1 1.07 1 1.03 1 1.01
GRI - 201 - 3, 405 - 2
Human Capital

L B Finance PLC Annual Report 2017/18 261
GRAPHICAL REVIEW OF EMPLOYEE TRAINING
Trainings carried out T - 10
2017/18 2016/17
Type of training No of employees
Direct cost (Rs.)
No of employees
Direct cost (Rs.)
Employee motivation 548 114,712 536 526,246 Marketing skills 455 448,279 - - First aid training 115 24,955 17 - Grooming session 122 175,004 5 30,000 Internal customer service 44 - - - Service excellence 430 426,751 510 960,139 Microsoft office packages - - - - Internally-held technical training programmes 402 217,938 139 - Outbound 61 472,191 113 529,689 Toastmasters (Speechcraft) 28 200,000 26 200,000 Soft skill training (internal/external programmes) 1,008 983,378 815 2,026,326 Managerial skills 319 268,814 - - Orientation 1,037 - 983 - Information communication technology 76 530,943 - - Performance-oriented training - - 191 260,969 Training for security officers 80 - - - Telephonic etiquette 110 49,973 - - Total 4,835 3,915,437 3,335 4,533,369
Average hours of training per employee by gender T - 11
2017/18
Training Hours No. of employees
Employee category and type of programme
Male Female Total Male Female Total
Senior ManagementTechnical 77.5 2.5 80 19 1 20Soft skills 304.25 20.5 324.75 66 7 73
Middle ManagementTechnical 596 10 606 128 1 129Soft skills 2,102.55 362 2,464.55 514 78 592ExecutiveTechnical 401.5 446 847.5 69 62 131Soft skills 4,014.8 1,836.25 5,851.05 741 381 1,122
ClericalTechnical 544.5 488 1032.5 105 91 196Soft skills 8,975.45 5,471.65 14,447.1 1,569 917 2,486
MinorTechnical 0 0 0 0 0 0Soft skills 192 0 192 86 0 86Total 17,209 8,637 25,845 3,297 1,538 4,835Avg training hours per employee 7.9 6.8
GRI - 404 - 1, 2
CA
PIT
AL
RE
PO
RT
S

262 L B Finance PLC Annual Report 2017/18
Return to work and retention rates after parental leave T - 14
Description 2017/18 2016/17 2015/16
Total number of female employees 1,262 1,145 953 Total number of employees that took maternity leave 74 91 49 Number of employees who returned to work after maternity leave ended 58 57 44 Number of employees who returned to work after maternity leave ended and still employed twelve months after their return to work
49 53 19
Return to work rate 87.88 62.63 89.80 Retention rate 65.33 92.98 61.29
10%
90%
TechnicalSoft skills
TRAINING HOURS BYTYPE OF TRAINING 2018
G - 1 G - 5
201820172016201520140
5,000
10,000
15,000
20,000
25,000
30,000
35,000
2
4
6
8
10
TRAINING HOURS BY GENDER ANDINVESTMENT IN TRAINING
Hours Rs.Mn
Training hours - Male
Investment
Training hours - Female
Total number of employees by age group and employee category
T - 12
Employee type Below 30 years
30-50 years
Over 50 years
Senior management and above
1 26 8
Middle Management 21 256 12Executive 854 515 6Clerical 1578 66 5Minor 38 47 8
Category-wise promotions T - 13
Category 2017/18 2016/17 2015/2016
Board of Directors
- - 1
Senior Management
2 2 2
Middle Management
86 52 60
Executive 606 512 256 Clerical 4 5 2 Total 698 571 321
GRAPHICAL REVIEW OF EMPLOYEE – AGE GROUP AND GENDER
GRAPHICAL REVIEW OF EMPLOYEE – OTHER INFORMATION
GRI - 401 - 3
Human Capital

L B Finance PLC Annual Report 2017/18 263
CLUB AND SOCIETIES
LBF Volunteering
Objective
To encourage and guide volunteering at LBF and to impact not only communities but also employee well-being
Key initiative
Rewarding and recognition of key performers surpassed the set target of 2,000 volunteering hours for this year
Date formed
11th November 2014
Number of members
182
Walking club
Objective
Promoting health and fitness among the employees
Key initiative
BMI monitoring and rewarding health screening
Date formed
7th February 2014
Number of members
122
Readers club
Objective
Providing a platform for expanding the scope of knowledge and innovative thinking
Key initiative
Launching the library with a wide collection of books
Date formed
8th March 2016
Number of members
83
Photographic Society
Objective
Make an enjoyment of photography accessible to all staff for stress management and promoting good mental health
Key initiative
Conduct a photography exhibition
Date formed
6th February 2014
Number of members
146
LB Night 2017
Vesak lantern competition
WORK-LIFE BALANCE
LB Got Talent 2017
CA
PIT
AL
RE
PO
RT
S

Financial services is embedded in the community and as a consequence LBF sees Social and Relationship Capital as the link between our business and society. By managing this capital, we are able to create and identify new opportunities to deliver enduring value and mutual benefit to the societies in which we operate.
MATERIAL DRIVERS
Financial inclusion Knowledge and beyond Health and nutrition Empowering communities Understanding the customer needs Innovative product offerings Unparalleled distribution Effective communication Unmatched service
ACTION PLANS & OBJECTIVES STATUS PAGE
Empowering entrepreneurs Encouraging and developing women
entreprenurs
280
Engage in outcome-based community investment
Rs. 20.00 million community investments
280
Improving community outreach through employee volunteerism.
7,114 voluntary hours on
community project
280
Improving customer experience Innovative product offerings
270
Achieved
In progress
Not achieved
Social and RelationshipCapital
SNAPSHOT OF CAPITAL OUTCOMES
IMPACT AREA WHAT YOU WILL FIND WHERE TO FIND
Loyal customer base
Customer base increased by 14.85%
Customers
Community development
Investment in sustainable initiatives increased by 62%
Community progress report
PAGE 268
PAGE 280
264 L B Finance PLC Annual Report 2017/18

L B Finance PLC Annual Report 2017/18 265
27
9,079
Rs.23.51 million
Rs.3,038.17million
Rs.3,090.42 million
TOTAL FINANCIAL SOLUTIONS
VOLUNTEER HOURS ON CSR PROJECTS
INVESTED ON SUSTAINABLE DEVELOPMENT PROJECTS
PAID TO THE GOVERNMENT
ECONOMIC VALUE GENERATED TO COMMUNITY
OUR NEXT STEPS
Objectives for 2018/19
» SME with special emphasis on youth and women entrepreneurs
» Appointing CSR ambassador in every region to execute CSR vision on LBF
» Enhancing customer experience through latest technology advancement
Objectives for 2020 & beyond
» Offering tailor made financial solutions for untouched markets within and beyond the country.
Online version available
IN A NUTSHELL
Responsible management of business operations to maximize value created for customers, suppliers and the community.
Intense market competition
Customer satisfaction
Volatility in macroeconomic factors
PAGE 267 PAGE 267 PAGE 267
CHALLENGES
CA
PIT
AL
RE
PO
RT
S
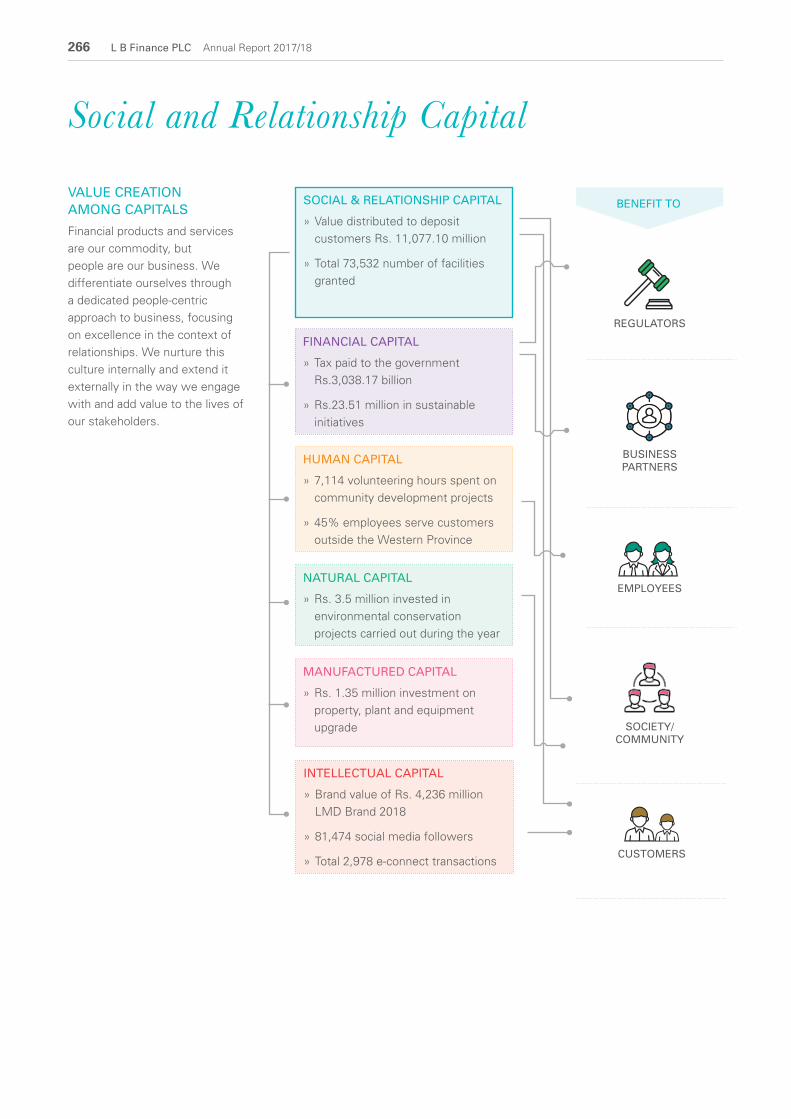
266 L B Finance PLC Annual Report 2017/18
VALUE CREATION AMONG CAPITALS
Financial products and services are our commodity, but people are our business. We differentiate ourselves through a dedicated people-centric approach to business, focusing on excellence in the context of relationships. We nurture this culture internally and extend it externally in the way we engage with and add value to the lives of our stakeholders.
BENEFIT TO
INTELLECTUAL CAPITAL
» Brand value of Rs. 4,236 million LMD Brand 2018
» 81,474 social media followers
» Total 2,978 e-connect transactions
FINANCIAL CAPITAL
» Tax paid to the government Rs.3,038.17 billion
» Rs.23.51 million in sustainable initiatives
HUMAN CAPITAL
» 7,114 volunteering hours spent on community development projects
» 45% employees serve customers outside the Western Province
NATURAL CAPITAL
» Rs. 3.5 million invested in environmental conservation projects carried out during the year
MANUFACTURED CAPITAL
» Rs. 1.35 million investment on property, plant and equipment upgrade
SOCIAL & RELATIONSHIP CAPITAL
» Value distributed to deposit customers Rs. 11,077.10 million
» Total 73,532 number of facilities granted
Social and Relationship Capital
CUSTOMERS
EMPLOYEES
SOCIETY/COMMUNITY
BUSINESS PARTNERS
REGULATORS

L B Finance PLC Annual Report 2017/18 267
HOW WE FACE THE CHALLENGES
Volatility in macroeconomic factors
With a volatile local socioeconomic environment in the prevailing climate of uncertainty, we need to think more systemically, embrace the complexity of the forces shaping our macro environment and influencing our business and, in doing so, gain a fresh perspective. The 2017/18 year challenged us to rethink the way we operate, taking the opportunity to thoroughly examine our external environment and then look inward, assessing how much organisational muscle we can muster, not only to weather the complexity around us, but to ensure that we’re positioned to create and capture opportunities.
Intense market competition
We believe that customers want destinations that provide more than just financial experience. Our strategy is to focus on creating outstanding places for modern consumer lifestyles that differentiate us from our competitors, and at the same time our strategic drive to grow our brand is a means of setting us apart. This drive will encourage us to solidify the LBF brand promise in an increasingly competitive marketplace.
Customer satisfaction
Spaces that deliver on their customers’ needs and keep up with the latest trends at market-related technologies to satisfy the customer are essential. Due to competition in the market and industry, our customer satisfaction strategy leads with customer retention procedures. Therefore customer satisfaction is major challenge. At LBF we have sought to modernise the traditional work experience, creating a space that meets operational efficiency and client expectations to deliver the optimum finance solution wherever needed.
SWOTANALYSIS
Strengths
Opportunities
Weaknesses
Threats
Strong and loyal customer base
Long-term business relationship with business partners
Strong brand perception among the community
Insufficient information on social development needs
Inadequate market survey information.
Branch expansion in remote areas
Encourage and empower women and youth entrepreneurs
Enhancing community welfare benefit at needy areas
Market share-oriented competition
Similar products are introduced by rivals
Government policy changes
Stock Market Challenge 2017
CA
PIT
AL
RE
PO
RT
S

268 L B Finance PLC Annual Report 2017/18
OUR PHILOSOPHYEnsure consistently high customer satisfaction through the delivery of best-in-class products and services that will delight the customer every single time, leading to higher uptake of our products and enabling LBF to increase market share.
MANAGEMENT APPROACHCustomers are at the heart of LBF’s business strategy and a central part of our brand promise. To develop strong relationships with our customers, we are committed to fulfilling their every financial need via a broad range products made accessible through a variety of channels and coupled with the ‘best-in-class’ customer service.
Each year we make significant investments to enhance the customer experience by leveraging on opportunities to provide simple, fast and easy financial solutions for our customers. Led by our product responsibility framework, we make sure that all LBF products go through a rigorous evaluation process prior to their release to the market. We use this process mainly to establish the appropriateness of our products in meeting the financial needs of the customer and to implement strict guidelines and follow-up procedures to prevent the misuse of our products in a manner that could compromise customers’ health and safety.
At the same time, we are focused on leading the way in the digital age and in recent years have introduced innovations that offer ‘best-in-class’ digital customer service. Our aim is to create a seamless experience for customers, whether they are visiting a branch, using a computer or a mobile device on the go.
Each year we make significant investments to enhance the customer experience by leveraging on opportunities to provide simple, fast and easy financial solutions for our customers.
Social and Relationship Capital

L B Finance PLC Annual Report 2017/18 269
CUSTOMER RESEARCH
Each year LBF commissions an independent perception study to measure the Company’s positioning within Sri Lanka’s financial services industry. Using a combination of qualitative and quantitative research tools the annual study serves as a comparative indicator to identify changes in customer perceptions and behaviour patterns.
Objective of the research
1. Consumer awareness on L B Finance and its product
2. Perception of existing customers of L B Finance and its service
3. Perception of non-L B Finance customers of their banks and L B Finance
4. General public satisfaction/perception over banks and finance Companies
5. Perception of L B Finance employees on the Company
Methodology
Preliminary Qualitative Study; a questionnaire structured to obtain detailed information relating to the objectives of the study.
Quantitative Survey Study:
The second part of the study is designed based on the findings of the preliminary findings of the qualitative study.
Research Conducted by:
University of Kelaniya
We continue to engage in proactive efforts to reorient our business model and ensure that all operations become more customer-centric, which has prompted the adoption of a service culture that puts the customer at the focal point of everything we do.
We continue to engage in proactive efforts to reorient our business model and ensure that all operations become more customer-centric, which has prompted the adoption of a service culture that puts the customer at the focal point of everything we do. Renewing our commitment to the customer, January 2018 was declared as the “Customer-First” month with extensive training along with a series of workshops being held throughout the month to enhance service levels of front-line customer contact staff. As a follow-up to this initiative, we commissioned a study to assess how satisfied our customers are with LBF’s products, service and outreach, vis-à-vis industry peers and the banking sector. The study, conducted by the University of Kelaniya through a structured questionnaire coupled with follow-up phone interviews saw 22 customers and 20 non-customers in several areas across the country being surveyed. C
AP
ITA
L R
EP
OR
TS

270 L B Finance PLC Annual Report 2017/18
Being privy to large volumes of sensitive customer information, we fully understand the need to safeguard customer information. As a leading financial institution we strongly believe in the responsible use of such information collected from individuals and businesses. Accordingly, we have put in place policies and procedures designed to safeguard customer privacy and protect the confidentiality of personal information. In this regard we have adopted the ISO 27001:2013 Information Security Management System and comply with the CBSL confidentiality requirements. To prevent a potential data breach, we have also established additional checks and balances to allow access to information only to personnel who are authorised to do so. Further we provide employees with privacy training, promote privacy awareness, and have implemented ongoing monitoring and testing of privacy risk and compliance with applicable privacy laws. In this regard there were no substantiated complaints concerning breaches of customer privacy and loss of customer data.
Fair dealing is integral to our culture and underpins LBF’s efforts towards becoming more open and transparent with our customers. We are committed to conducting our business in an honest and
In the year under review, LBF followed a broader strategic approach to optimise the customer experience vis-à-vis four strategic themes.
ethical manner and therefore do not engage any form of anti-competitive behaviour, and maintain a zero-tolerance approach towards bribery and corruption. We expect all employees to adhere to these principles when representing the Company and offer regular training to reinforce these tenets. Company also adopted a gift policy.
In the year under review, LBF followed a broader strategic approach to optimise the customer experience vis-à-vis four strategic themes.
Social and Relationship Capital - Customers
INNOVATIVE PRODUCTS OFFERINGS
LBF’s leadership position in the NBFI sector is the result of the Company’s vibrant product portfolio that is geared to service the needs of individual (retail) customers and support the growth of small businesses across the country. Ranging from simple financial products to complex tailor-made solutions, LBF products are structured responsibly in order to provide customers with right solutions, at the right time and at the right price.
GRI - 418 - 1

L B Finance PLC Annual Report 2017/18 271
SEGMENT PROFILE OF PRODUCT PORTFOLIO
KIDS GENERAL SENIOR CITIZEN
A safe place to save, invest and manage funds » Accepting customers’
deposits, and raising funds
» Investment management products
Kids’ Savings A unique savings account that enables parents to save for their children and offer attractive rates of interest and gift schemes.
Fixed depositsFixed deposits yield the highest return on investment with an array of attractive benefits
Regular savingsA rewarding way to get into the habit of saving and be rewarded with multiple benefits.
Salary planA perfect savings scheme for the salaried, self-employed and professionals.
Fixed deposits
Senior citizen savingsA savings product with a relatively high yield and privileged services and benefits for the deserving senior citizens.
Provide funds for purchases and growth» Financing through leasing & hire purchase
» Fulfilling individual financial requirements
» Arrangements of funds for day-to-day business requirements
Individual needs» Micro financial requirements
Leasing and Hire purchaseFlexible financial solutions provided by convenient leasing and hire purchase services.
Auto leaseOffering the Ijara contracts for vehicles
Mortgage loansConvenient and flexible financing with longer tenures of repayment to build/own your dream house.
Vehicle loansHelp to finance your dream vehicle with flexible terms.
Micro leaseBecame more popular with three wheeler leasing and motor cycle leasing, which includes a total hassle free leasing service to finance a vehicle of the customer’s choice.
FactoringAllows a smooth cash flow facilitating the customer to innovate and develop his business.
Power plusImproves the daily funding requirements for smooth operation.
GRI - 102 - 2
CA
PIT
AL
RE
PO
RT
S

272 L B Finance PLC Annual Report 2017/18
LBF’s leadership position in the NBFI sector is the result of the Company’s vibrant product portfolio that is geared to service the needs of individual (retail) customers and support the growth of small businesses across the country.
KIDS GENERAL SENIOR CITIZEN
Power draftA solution for working capital requirement.
Gold loansProvide best value for gold at competitive interest rates for urgent cash requirements.
Margin tradingService is a flexible financial tool, which provides leverage for stock market investors, to grow the share portfolio.
Personal loansUniquely designed product to suit various requirements for upgrading lifestyles.
DirimagaMicro loan for all entrepreneurs to take their business to the next level.
Providing value addition services to the customer
PayHubCustomers can pay utility bills anytime with convenience, with real time payment updates.
Money transferCustomers can pay utility bills anytime with convenience, with real time payment updates. Web-based remittance product supported by the latest technology.
Rent a carA quick and easy way to satisfy customers’ travelling needs.
Social and Relationship Capital - Customers

L B Finance PLC Annual Report 2017/18 273
Ongoing enhancements to the product suite saw the children’s savings product being redesigned in the year under review, to appeal to a new generation of parents keen to begin savings for their children’s future. Renamed as ‘Little Heroes’, the product was re-launched to the market in March 2018, with a new look and feel including a greatly enhanced reward programme to encourage children to aim for savings milestones. Other developments included the rebranding of the L B Housing loan scheme and re-launched to the market as ‘L B Mulgala’ and the re-launch of ‘L B Yasaisuru’ FD product.
To enjoy our product and services visit www.lbfinance.com
UNPARALLELED DISTRIBUTION
LBF’s customers have access to the Company’s products through a range of channels foremost among them is our network of 123 fully-fledged branches. Located strategically across the island, LBF branches are easily accessible and offer customers the full gamut of the Company’s products. In the year under review, the Company installed cash deposit machines at 3 branches across the network, enabling customers to make direct deposits without the hassle of queuing up at the branch counter.
Meanwhile LBF’s partnership with Sampath Bank gives the Company’s savings customer’s ready access to accounts through 391-strong Sampath Bank ATM network as
well as through Visa-enabled ATM’s across the country.
As part of a broad-based strategy to keep pace with the rapidly-changing customer dynamic, we have more recently begun leveraging on technology in a deliberate push towards mobile and internet banking to present our customers a whole new level of convenience that gives them the option to move away from the traditional brick-and-mortar branch model.
Signalling our commitment to this, in 2016 we launched LB e-Connect, an innovative and secure online financial platform that gives the customer the ability to transact in real-time.
In the year under review, the Company set up a Greenfield micro finance operation in Myanmar in an effort to assist small-scale agricultural farmers in rural Myanmar.
EFFECTIVE COMMUNICATION
Being more accessible and transparent to our customers remains a key part of LBF’s value proposition. Our communication strategy seeks to provide customers with comprehensive product information that enables them to make informed financial decisions that will positively impact their lives.
All our advertisements and promotional material adhere to the regulations stipulated by the Central Bank of Sri Lanka and are subject to monitoring by the Senior Management. The stipulated guidelines and ethical considerations govern all branding and advertising. All required information is contained in the advertisements enabling customers to make informed decisions about our products and
services while designated customer relationship officers are available for clarifications and customer support.
LBF’s recent decision to eliminate clutter from all promotional activities prompted a revamp of the marketing strategy to focus on sending a clear and concise message to the target audience.
This was coupled with efforts to deepen the public relations exposure by optimising LBF’s media coverage across all print and electronic channels. Other efforts to increase ground-level visibility included the introduction of a mobile promotional vehicle to conduct localised pocket campaigns across the island. Additionally we leveraged on social media platforms such as Facebook, Twitter, and Linkedin to expand our digital presence and increase engagement with our customers.
CA
PIT
AL
RE
PO
RT
S

274 L B Finance PLC Annual Report 2017/18
As part of our communication strategy, we have put in place various channels to urge our customers to reach out to us. Ongoing improvements to these channels saw the commissioning of dedicated call centre in Jaffna in 2017/18, mainly for gold loan customers in the north and east regions of the country.
Meanwhile resources at LBF’s main call centre in Mount Lavinia were also strengthened during the year, with the roll-out of a new CRM system to improve the traceability of inbound calls. The system is equipped to promptly redirect the call to relevant authorities, resulting in a vast improvement in response times. With over 95% of inbound calls being inquiries, the call centre logged in a total of 962 inquiries for the year under review.
For customers to report complaints, we have established a dedicated complaint hotline that connects directly to the Complaint Management Unit (CMU). The CMU records and analyses all complaints
to determine and correct service gaps in order to minimise recurring complaints and ultimately enhance the customer experience. The CMU presents a monthly report to the Managing Director at the end of each month summarising the nature of complaints received, action taken towards complaint resolution as well as the steps taken to prevent recurrence in the future.
LBF’s in-house market research unit conducts regular post-complaint surveys to determine if customers are satisfied with the way in which their complaint was managed. In the year under review, post-complaint surveys were conducted, with the findings indicating that over 90% of the customers were satisfied with LBF’s complaint management process.
UNMATCHED SERVICE
At LBF, it is customary to put our customers at the forefront of everything we do. Underpinned by this premise, the Company strives to maintain the highest standards
of customer service at all times, at each of our customer touch-points. Our aim is to provide customers with a positive experience every time, paving the way for LBF to be perceived as the financial institution with the best and most consistent in-class customer service in Sri Lanka’s NBFI sector.
With customer service considered to be of paramount importance to LBF, we regularly ask our customers to rate our service levels. The feedback we received from our customers in 2017/18, indicate that more than 90% of them are satisfied with our service. Nonetheless, we remain committed to improve the service we offer and the consistency with which we offer it relative to our peers. Furthermore, LBF differentiates itself from peers by offering a range of value added services to customers. These include rent-a-car services at concessionary rates and the pay hub system, where customers can pay utility bills at any LBF branch. The pay hub is a service that has been introduced purely for the benefit of the customer. Since its introduction, the popularity of the pay hub concept has steadily and in the year under review, the pay hub service tabled an average of 26,000 transactions per month, up from the monthly average of 22,000 tabled in the previous year.
PRODUCT RESPONSIBILITY
All our advertisements and promotional material adhere to the regulations stipulated by the Central Bank of Sri Lanka and are subject to monitoring by the Senior Management. The stipulated guidelines and ethical considerations govern all branding and advertising. All information required is contained in the advertisements enabling
Social and Relationship Capital - Customers

L B Finance PLC Annual Report 2017/18 275
Ensuring industry-leading customer service standards - The Mystery Shopper Programme
As part of a proactive approach to continuously enhancing service levels, LBF has taken steps to implement an ongoing mystery shopper programme with the intention of;
1. Determining the effectiveness of the branch facilities and identifying the need for improvements
2. Rating the customer service levels offered by LBF’s frontline staff comparative to peers
Topics covered
• Product knowledge & customer service
• Customer handling & follow-up
• Branch branding
Executed by an independent third party, 156 mystery shopper programmes were conducted in 2017/18 covering more than 50% of the branch network.
customers to make informed decisions about our products and services while a designated customer relationship officer is available for clarifications and customer support. All advertising and promotions related to deposit products adhere to the Central Bank- mandated requirements and are subject to monitoring by the Senior Management. The given guidelines and ethical considerations govern all LBF’s branding and advertising. All necessary and requested information is provided to the customers while a designated customer relationship officer is available for clarifications and customer support. In the year under review, the marketing communications, including advertising, labelling and promotions undertaken were compliant with regulations and voluntary codes concerning advertising. During the year the Company has not promoted or advertised banned or disputed products or services which are not included under the product portfolio.
KEY FOCUS AREAS OF THE RESEARCH
Why do customers select L B Finance over the commercial banks?
Understanding why customers would select LBF over a bank, which provides similar products and services, helps to strengthen the Company’s commitment to create a differentiated value proposition
59%
9%
32%Quality of the serviceGood ratesThird party influence
FUTU
RE
AC
TIO
N
» Invest to expand the digital product portfolio
» Increase the number of touch-points through geographical expansion of the LBF footprint in Sri Lanka and Myanmar.
» Strengthen relationship with customers with the introduction of customer loyalty programmes
» Enhance direct customer engagement activities
KEY FOCUS AREAS OF THE RESEARCH
What are the specific reasons you selected L B Finance as your finance company?
The reason for selection would provide an indication of LBF’s competitive advantage as a retail-driven financial services institution.
0 5 10 15 20 25 30 35 %
Impression of Company name
Reputation of customer service
Attractive rates
Personal contact with LB staff
Easy access
Hassle-free service
GRI - 102 - 2
CA
PIT
AL
RE
PO
RT
S

276 L B Finance PLC Annual Report 2017/18
Social and Relationship Capital - Business PartnersCREATE VALUE
Our business partners are a key component of LBF’s value chain. Their contribution to the business covers the provision of various products and services required for the day-to-day functioning of our business as a financial services institution.
Given their role as part of our value chain, we remain committed to maintain professional, transparent, and fair relationships with all our business partners. Wherever possible and practical, we engage the services of locally based suppliers and services providers on the condition that they qualify with the Company’s supplier standards.
Potential suppliers are required to fulfill certain criteria to become eligible as a LBF business partner. As a priority all are first vetted to ensure they meet LBF’s high standards for quality and reliability along with timely and efficient delivery. Suppliers are further required to complete a self-assessment form to indicate their track record for social and environmental compliance.
SUPPLY CHAIN
Calling application from outside to register suppliers for the business: Selection of suppliers
» New suppliers
» Existing suppliers
Evaluation done by the administrative department based on their set of criteria Administrative
departmentCentrally handle the;
» Service request from branches
» Services decided by the administrative department
Managing Director or Executive Director
» Assessing supplier
» Evaluating supplier
Selection
Evaluation
Approval
DatabaseRegistered suppliers
GRI - 102 - 9, 10

L B Finance PLC Annual Report 2017/18 277
TYPES OF BUSINESS PARTNERS & THEIR INFLUENCE
Assets and materials IT EquipmentVehicles Furniture
StationeryOffice equipment
Banking and financial institutions
» Security» Food and drinking water» Sanitary services» Travelling and Transport» Waste Management» Courier Services
» Security» Food and drinking water» Sanitary services» Travelling and Transport» Waste Management» Courier Services
AuditorsFinancial Service providers
Outsourced services
Other Services
Businesspartners
BUSINESS PARTNER ENGAGEMENT
To facilitate greater engagement with business partners, LBF provides sponsorships for promotional events organised by them. In addition, we also participate in mutually beneficial initiatives, for instance the promotion of products of business partners.
We request regular feedback from our business partners to assess the overall business partner experience and identify areas for further improvement.
Type of suppliers No. of new suppliers
registered during the
year
Asset and material 26,609
Outsourced services
1,917
Financial services providers
17
Total 28,543
Outlook
We strive to continuously maintain and improve relationships with business partners as part of the overall commitment to shared growth.
Going forward, we will look to invest in new technology to further increase the level of engagement with business partners. We will also work towards establishing a more structured knowledge sharing mechanism to encourage business partners to align with LBF’s ethics and governance framework.
CA
PIT
AL
RE
PO
RT
S

278 L B Finance PLC Annual Report 2017/18
OUR PHILOSOPHYAs a responsible corporate citizen, LBF is committed to making a clear and positive contribution that can make a real difference to the community.
MANAGEMENT APPROACHLBF’s values guide our broader conduct and the role we play as a corporate citizen. We look to address community priorities that align with our business objectives and consider the impact of our day-to-day decisions on society, thereby driving the shared benefit concept to create positive long-term outcomes for all our stakeholders.
Through our branches, LBF receives numerous appeals for community assistance and for years has been responding to these requests by investing in projects and initiatives that improve the quality of life for the communities across Sri Lanka. In recent times however, we have adopted a more structured approach and begun investing in projects that are capable of delivering real results to the community as measured in terms of the country’s economic and social sustainability goals. As such LBF’s Social Investment Framework now focuses on contributing towards five of the UN Sustainability Development Goals (SDGs);
GOAL 1No Poverty
GOAL 2No Hunger
GOAL 3Good Health
and Well-being
GOAL 4Quality
Education
GOAL 11Sustainable Cities and
Communities
Providing our employees with the opportunity to volunteer in the community is an important part of our community investment approach, for it is through employee volunteerism that many of our programmes are brought to life.
Social and Relationship Capital - Community

L B Finance PLC Annual Report 2017/18 279
The Company’s CSR and Sustainability Committee overseas all LBF’s community investment programmes and is tasked with identifying, evaluating, planning and executing activities in line with the LBF’s Social Investment Framework.
Providing our employees with the opportunity to volunteer in the community is an important part of our community investment approach, for it is through employee volunteerism that many our programmes are brought to life. In fact we consider our community programmes to be a tripartite agreement between the Company, employee and the community. We encourage all LBF employees to participate in the Company’s community projects and offer them guidance to ensure proper conduct in line with LBF’s values when in carrying out such projects.
Knowledge and beyond
EDUCATION AND SPORTS
Promote education, sport and support programs to build a talent pipeline while improving team spirit.
Share expertise
ECONOMIC EMPOWERMENT
Promote skills development, job creation, entrepreneurship, and financial inclusion in underserved communities.
Build partnerships
GOOD HEALTH AND CARE
Use outlets and people to make a positive impact to good health and care in work place and society and enable health professionals to share expertise.
Financial assistance
HUMAN NEEDS AND DISASTER RESPONSE
Help first culture is natural extension of everyone. LBF supports communities affected by disasters and support relief efforts by way of providing basic necessities.
SOCIETY
SOCIAL INVESTMENT FRAMEWORK
O/L seminar programme
We encourage all LBF employees to participate in the Company’s community projects and offer them guidance to ensure proper conduct in line with LBF’s values when in carrying out such projects.
CA
PIT
AL
RE
PO
RT
S

280 L B Finance PLC Annual Report 2017/18
Our commitment Our action 2017/18 Priorities for 2018/19
Contribute to grass-root level economic growth through increased access to financial services that support Small- and Medium-scale Enterprises, with a specific focus on empowering women and youth entrepreneurs and small farmers in Sri Lanka and Myanmar.
We supported over 200 Small- and Medium- scale Entrepreneurs across Sri Lanka and Myanmar through guiding and developing mechanisms. These efforts were indirectly responsible for the creation of 250 jobs to the nation.
Established collaborative partnerships to test new financing models to support the growth and development of small farmers and retailers in Sri Lanka and Myanmar.
SME-supporting priorities allocated to women and youth entrepreneurs.
Conducting MSME training and workshop for budding entrepreneurs.
Engage in outcome-based community investment.
A year-on-year increase of over 140% in community investment programmes focusing on capacity building, education, health and general well-being of communities across Sri Lanka.
Partnering community-based social organisation to extend community investment.
Engage with media/Government organisations to uphold education infrastructure in Sri Lanka.
Improving community outreach through employee volunteerism.
We reached almost 28,000 beneficiaries exceeding the target set for the year, led by a 294% increase in employee volunteer hours compared to the previous year.
Enhance employee engagement for CSR activities by appointing a CSR ambassador in every region to execute the CSR vision.
PROGRESS REPORT 2017/18Stemming from the focus on the SDGs, the table below illustrates LBF’s community investment programmes for 2017/18.
Focus area Total investment No. of beneficiaries Employee voluntary hours
Financial inclusion
92,175 5 44
Knowledge and beyond 6,262,896 12,100 5,650
Healthcare and nutrition 6,307,621 6,324 793
Empowering communities
6,291,080 10,154 562
PROJECT IMPACT ASSESSMENT KEY
Very good Good Below expected level Poor results Project in vain
GRI - 203 - 1, 2
Social and Relationship Capital - Community

L B Finance PLC Annual Report 2017/18 281
FINANCIAL INCLUSION
With financial inclusion being declared a critical national priority for Sri Lanka to achieve middle-income economy status by 2020, LBF as a leading financial services institution has been actively involved in broadening access to financial services and empowering individuals and small businesses across Sri Lanka to reach their full economic potential. Our ‘Dirimaga’ micro loan scheme and micro leasing programme are targeted outreach initiatives aimed at assisting individuals and SMEs in underserved communities around the country to secure their livelihoods and improve their quality of life. We conducted CSR initiatives within the country to upkeep the social standards of the community with the aim of minimising poverty and hunger in Sri Lanka.
PROJECT | 01
Providing aid to build a house in Vallipunam
PROJECT SCOPE OBJECTIVES
Assist in the construction of a house for an underprivileged family in the Puthukkudirippu area.
» Uplifting the standard of living of the community.
» Provide a helping hand to lower income community as a responsible corporate citizen.
BENEFICIARIESEMPLOYEE VOLUNTEERISM
Family in Puthukkudirippu area
03 employees and 84 volunteer hours
IMPACT ASSESSMENT (Derived through Community Feedback)
PROJECT | 02
Financial aid for a needy family Ranala
PROJECT SCOPE OBJECTIVES
Financial assistance to an underprivileged family
» Uplifting the lives of low-income communities.
BENEFICIARIESEMPLOYEE VOLUNTEERISM
Family in Ranala 05 employees and 44 volunteer hours
IMPACT ASSESSMENT (Derived through Community Feedback)
CA
PIT
AL
RE
PO
RT
S

282 L B Finance PLC Annual Report 2017/18
KNOWLEDGE AND BEYOND
At LBF, we are of the view that education is the only way to ensure lasting social change. As such we focus on enhancing the knowledge base of underserved youth through the provision of vocational skills training programmes that enable them to remain gainfully employed and contribute towards growth and development of their local economies. Further, we also provide targeted financial assistance from time to time, to improve the infrastructure facilities at underserved rural schools across Sri Lanka.
PROJECT | 01
Helping Ruth Children’s Home
PROJECT SCOPE OBJECTIVES
An ongoing project to support the needs of the Ruth Children’s home Athtidiya, in Colombo. Efforts for the year included the provision of a fully equipped air-conditioned Computer Lab. The Company has further undertaken to pay for a teacher and also for the monthly Electricity bill.
» Increasing IT literacy level of under-privileged children who do not have access to technology.
» Improving facilities of children’s homes available in the country, which do not have Government Aid.
BENEFICIARIESEMPLOYEE VOLUNTEERISM
Students of Children home
10 employees and 112 volunteer hours
IMPACT ASSESSMENT (Derived through Community Feedback)
PROJECT | 02
Sponsoring for CPS boys development Centre
PROJECT SCOPE OBJECTIVES
The Company has undertaken to bear the cost of the annual tuition fees for children residing in two child development centres run by the Child Protection Society (CPS) in Maharagama and Kottawa. The Company has agreed to meet the cost of tuition fees.
» Increasing standards of education of underprivileged children.
» Partnering with social welfare organisations to overcome social inequalities
BENEFICIARIESEMPLOYEE VOLUNTEERISM
Society at large 06 employees and 34 volunteer hours
IMPACT ASSESSMENT (Derived through Community Feedback)
Social and Relationship Capital - Community

L B Finance PLC Annual Report 2017/18 283
PROJECT | 03
Stock Market Challenge 2017-Islandwide quiz competition
PROJECT SCOPE OBJECTIVES
LB finance sponsored for ‘Stock Market Challenge-2017’ quiz competition Event, which was organised by the University of Kelaniya. Schools from all over the country attended the competition. The competition was conducted to test the participants’ knowledge on national and international stock markets. Awards, cash prizes and scholarship opportunities were provided for students.
» Improving knowledge of the stock market among school students
» Encouraging greater participation in the stock market in the future
BENEFICIARIESEMPLOYEE VOLUNTEERISM
School students all over the country
07 employees and 84 volunteer hours
IMPACT ASSESSMENT (Derived through Community Feedback)
PROJECT | 04
Contributing enhance education quality and uplift the education standard
PROJECT SCOPE OBJECTIVES
» Sponsorship for University of Kelaniya Annual General Convocation
» Distribution of school materials for needy students
» Helping talented youth to achieve their educational goals.
» Helping children of poor families to pursue their education.
» Motivating students to pursue education
BENEFICIARIESEMPLOYEE VOLUNTEERISM
» School students
» Families of low income
04 employees and 24 volunteer hours
IMPACT ASSESSMENT (Derived through Community Feedback)
CA
PIT
AL
RE
PO
RT
S

284 L B Finance PLC Annual Report 2017/18
PROJECT | 05
School equipment for visually impaired students
PROJECT SCOPE OBJECTIVES
Contributing towards the project by the Sri Lanka Federation of the Visually Handicapped to help visually impaired children in state schools and special schools to purchase school equipment.
» Provide access to better quality education for differently-abled persons.
» Improve infrastructure facilities of specialised schools for differently abled.
BENEFICIARIESEMPLOYEE VOLUNTEERISM
Visually impaired community
08 employees and 63 volunteer hours
IMPACT ASSESSMENT (Derived through Community Feedback)
PROJECT | 06
Project for 150 Pre Schools
PROJECT SCOPE OBJECTIVES
An ongoing project to distribute stationery items, furniture and financial assistance to underprivileged primary schools across the country.
» Provide support to the development of preschools around the country that are hardly maintained due to lack of resources
» Increase the quality of education provided by preschools of the country in every region.
» Increase the literacy and primary education of community.
BENEFICIARIESEMPLOYEE VOLUNTEERISM
Preschool students all over the country
20 employees and 3,840 volunteer hours
IMPACT ASSESSMENT (Derived through Community Feedback)
Social and Relationship Capital - Community

L B Finance PLC Annual Report 2017/18 285
PROJECT | 07
O/L Seminar programme
PROJECT SCOPE OBJECTIVES
An ongoing effort, the project involves conducting workshops and training sessions for CGE O/L students in underprivileged schools across the country. The project is conducted in partnership with the University of Colombo.
» Providing subject knowledge for ordinary level exam sitting students
» Providing required motivation and guidance for school students to successfully complete their secondary education
BENEFICIARIESEMPLOYEE VOLUNTEERISM
Ordinary Level Examination-facing students all over the country
28 employees and 686 volunteer hours
IMPACT ASSESSMENT (Derived through Community Feedback)
HEALTH AND NUTRITION
In support of the country’s ambition to become a healthier nation, LBF commits considerable resources each year towards raising the standard of community health. Our projects are targeted initiatives for the benefit of specific segments of the community. LBF’s role is mainly that of a funding partner, with all healthcare projects being carried out in collaboration with ministry-approved healthcare specialists to ensure optimum results.
PROJECT | 01
Gift of Life
PROJECT SCOPE OBJECTIVES
Providing financial assistance for children requiring congenital heart surgeries and are on the hospital waiting lists due to lack of funds. Patients are selected by the hospital authority based on their waiting list.
» Providing aid to lower income families to overcome their financial difficulties.
» Ensure the healthy living of the community
BENEFICIARIESEMPLOYEE VOLUNTEERISM
» Heart patients of lower income families
» Society at large
03 employees and 28 volunteer hours
IMPACT ASSESSMENT (Derived through Community Feedback)
CA
PIT
AL
RE
PO
RT
S

286 L B Finance PLC Annual Report 2017/18
PROJECT | 02
Annual Blood Donation
PROJECT SCOPE OBJECTIVES
An annual commitment by LBF for the past 06 years, where employees voluntarily donate blood.
» Contribute towards the country’s healthcare resources
» Increase and motivate employee engagement in CSR activities.
BENEFICIARIESEMPLOYEE VOLUNTEERISM
Society at large 152 employees and 384 volunteer hours
IMPACT ASSESSMENT (Derived through Community Feedback)
PROJECT | 03
Helping Colombo East Base Hospital
PROJECT SCOPE OBJECTIVES
» The upgrade of the Paediatric Unit of Colombo East Base Hospital under this project through the provision of furniture for the hospital including desks and chairs.
» Improve the infrastructure facilities of the hospital to improve the quality of service provided to the community
BENEFICIARIESEMPLOYEE VOLUNTEERISM
Society at large 06 employees and 142 volunteer hours
IMPACT ASSESSMENT (Derived through Community Feedback)
PROJECT | 05
Helping Lady Ridgeway Hospital
PROJECT SCOPE OBJECTIVES
Providing support to upgrade the administrative infrastructure at the Lady Ridgeway Hospital.
» Improve the infrastructure facilities of the hospital to improve the quality of service provided to the community
BENEFICIARIESEMPLOYEE VOLUNTEERISM
Society at large 12 employees and 93 volunteer hours
IMPACT ASSESSMENT (Derived through Community Feedback)
Social and Relationship Capital - Community

L B Finance PLC Annual Report 2017/18 287
PROJECT | 04
Sponsoring Commando Basketball Team
PROJECT SCOPE OBJECTIVES
An ongoing project to sponsor the sports gear and coach fee for the Army Commando Force Basketball team
» Assist the government in safeguarding the tri-forces.
» Motivation of sports activities lead to a healthy living
BENEFICIARIESEMPLOYEE VOLUNTEERISM
Commando Basketball team members
04 employees and 56 volunteer hours
IMPACT ASSESSMENT (Derived through Community Feedback)
PROJECT | 06
Purchase of Wheel Chairs and Clutches for disabled soldiers
PROJECT SCOPE OBJECTIVES
Financial assistance for the supply of wheelchairs and crutches for army soldiers who have lost their legs during the war.
» Improving the quality of life for differently-abled persons by reducing the limitations faced by them
» Ensuring healthy living within the community
BENEFICIARIESEMPLOYEE VOLUNTEERISM
Soldiers from the three forces
03 employees and 27 volunteer hours
IMPACT ASSESSMENT (Derived through Community Feedback)
PROJECT | 07
Helping Armor Ladies Club
PROJECT SCOPE OBJECTIVES
Financial assistance for the supply prosthetics to army soldiers who lost their legs during the war
» Improving the quality of life for differently-abled persons by reducing the limitations faced by them
» Ensuring healthy living within the community
BENEFICIARIESEMPLOYEE VOLUNTEERISM
Disabled army soldiers/army soldiers’ families
03 employees and 31 volunteer hours
IMPACT ASSESSMENT (Derived through Community Feedback)
CA
PIT
AL
RE
PO
RT
S

288 L B Finance PLC Annual Report 2017/18
EMPOWERING COMMUNITIES
We believe in making a meaningful contribution to society beyond our financial performance. In this context we look to empower communities by investing in capacity building initiatives that bridge social disparities and create an equitable platform for a sustainable societal progress.
PROJECT | 01
First aid training for three-wheel drivers
PROJECT SCOPE OBJECTIVES
A project to provide first aid training to three-wheeler drivers to minimise accidental deaths from casualties while transporting victims after road accident situations. The training was conducted by Red Cross Society; Matara traffic police also provided a great contribution. Participants were provided with special first aid kit and a sticker to create awareness about the drivers’ training.
» Reduce the mortality rate resulting from road accidents.
» Raise general awareness regarding the importance of practicing road safety regulations
BENEFICIARIES EMPLOYEE VOLUNTEERISM
Society at large 20 employees and 162 volunteer hours
IMPACT ASSESSMENT (Derived through Community Feedback)
Social and Relationship Capital - Community

L B Finance PLC Annual Report 2017/18 289
PROJECT | 02
CSR Project of Building Rehabilitation Centre
PROJECT SCOPE OBJECTIVES
A project to build a drug rehabilitation centre in Rumassala in the Galle district, the project is ongoing.
» Provide assistance and guidance to rehabilitate drug users to become productive members of society.
» Minimising the negative impact caused by drug addiction to the general public
BENEFICIARIESEMPLOYEE VOLUNTEERISM
Society at large 06 employees and 315 volunteer hours
IMPACT ASSESSMENT (Derived through Community Feedback)
KEY FOCUS AREAS OF THE RESEARCH
Awareness about L B Finance – Non L B Customers
Helps to determine the effectiveness of the Company’s brand visibility strategy
90%
7% 3%
Know about LBKnow a little about LBDon’t know about LB
Needs identification
Feed
back
Team
sus
tain
abili
ty in
volv
emen
t
Soc
ial i
mpa
ctIm
plem
enta
tion
Stakeholders’ ideas
Evaluation
Selection
Resource allocation
Prioritised pillars of sustainability
Idea generation
Project Manager
Project Coordinator Volunteers
S TA K E H O L D E R S
CORPORATE SOCIALRESPONSIBILITY (CSR) ANDSUSTAINABILITY GOVERNANCE
GRI - 413 - 1
CA
PIT
AL
RE
PO
RT
S

NaturalCapital
RS.
We operate in an environment where there are immediate constraints on the availability of resources, such as electricity, and growing concerns about future supply constraints of other natural resources, such as clean air and water. In this context, the case for more sustainable business practices is clear; driving our business to reduce our consumption or impact on our natural resources is our logical strategy.
MATERIAL DRIVERS
Energy management
Water management
Material management
Waste management
Emission measurement
Green lending
Environmental awareness and CSR
ACTION PLANS & OBJECTIVES STATUS PAGE
Reduction of carbon footprint of the company
Reduced carbon footprint by 26.09%
301
Maintain the carbon neutrality status 3,223 tCO2e tons set-off
301
Moving to paperless working environment
2,978 online transactions
233
Encourage green lending 450 green facilities granted
302
Achieved
In progress
Not achieved
SNAPSHOT OF CAPITAL OUTCOMES
IMPACT AREA WHAT YOU WILL FIND WHERE TO FIND
Energy Management
Total energy consumption reduced by 23%
Energy consumption
Waste management
Paper waste disposal reduced by 49%
Waste management
PAGE 297
PAGE 299
290 L B Finance PLC Annual Report 2017/18

L B Finance PLC Annual Report 2017/18 291
126,421 Litres
3,978 Kg
15,912 KWh
68
WATER SAVED
PAPERS RECYCLED
SAVED ELECTRICITY
FIRST CARBON NEUTRAL COMPANY AMONGST FINANCIAL INSTITUTIONS IN SRI LANKA
SAVED FULLY GROWN TREES
OUR NEXT STEPS
Objectives for 2018/19
» Promote paperless e-solutions amongst customers
» Maintain carbon neutrality status
Objectives for 2020 and beyond
» Introduce green branch concept
» Focus of self-carbon credit generating project
Online version available
IN A NUTSHELL
Reduce our direct impact on the environment by promoting responsible environmental management activities across all of our operations.
Encouraging customers into green lending
Restructuring of operations in an eco-friendly manner.
Reduction of carbon footprint against the growth of the company
PAGE 293 PAGE 293 PAGE 293
CHALLENGES
CA
PIT
AL
RE
PO
RT
S

292 L B Finance PLC Annual Report 2017/18
VALUE CREATION AMONG CAPITALS
Our environmental strategy, therefore, focuses on facilitating the reduction of the Company’s environmental footprint. We also wish to share positive practices and influence over all stakeholders towards greater environment focus and sustainable activities.
BENEFIT TO
INTELLECTUAL CAPITAL
» Reached 2,978 e-connect online customers
FINANCIAL CAPITAL
» Rs. 3.51 million spent on green initiatives
HUMAN CAPITAL
» 1,965 volunteering hours on green activities
» Implemented an e-learning platform
» Introduced environmental CSR practices for employees and their families
NATURAL CAPITAL
» 6 environmental projects
» 450 green financing facilities
MANUFACTURED CAPITAL
» Replaced energy inefficient computers
» Enhance usage of digital hoardings
SOCIAL & RELATIONSHIP CAPITAL
» Expansion of social media presence
» Usage of digital media for advertising and promotions
CUSTOMERS
BUSINESS PARTNERS
Natural Capital
SOCIETY/COMMUNITY

L B Finance PLC Annual Report 2017/18 293
HOW WE FACE THE CHALLENGES
Reduction of carbon footprint against the growth of the Company
We always try to reduce our carbon footprint of the Company, but when we expand our business we have to set up new branches island-wide. This leads to enhancing the carbon footprint. However we always conduct awareness campaigns, employee encouragement, ecofriendly business practices and energy management procedures in the organisation to reduce the carbon footprint.
Encourage customers towards green lending
As a financial institution our main income source is generated from leasing facilities, therefore per month we grant higher leasing facilities, which makes a harmless influence to society. Having identified this challenge to the environment, we encourage customers to go for hybrid vehicles and electric vehicles and we offer concessionary rates for such loan facilities.
Restructuring the operations in an eco-friendly way
We always try go for the digital work and office environment, therefore we shift manual systems to automated systems. However when we follow through with the procedure, a few systems cannot be converted to automation (eg; legal documentation).
SWOTANALYSIS
Strengths
Opportunities
Weaknesses
Threats
First carbon neutral company amongst financial institutions in Sri Lanka
Properly placed environmental management system and environmental pledge
Long-term collaboration and partnership with environmental conservation institutions/partners
Continuation of the paper based business processes
Introduced innovative green lending products
Reduce the wastage through process automation
Mutual benefit by partnering with environmental conservation institutions
High competition in the industry for green financial solutions
Changes in the environmental regulations for the business
Plant distribution programme
CA
PIT
AL
RE
PO
RT
S

294 L B Finance PLC Annual Report 2017/18
OUR PHILOSOPHYWe remain committed to reduce our direct impact on the environment by promoting responsible environmental management activities across all of our operations. At the same time, by using our position as a leading financial institution in the country, we seek to positively influence society to work towards generating favourable environmental outcomes.
MANAGEMENT APPROACHWe are aware that LBF operates in an environment where there are immediate constraints on the availability of resources, such as electricity, alongside growing concerns about sustenance of other natural resources, namely clean air and water. It is what inspires LBF to promote the responsible use of energy, water and other materials such as paper, with due regard to the scarcity of natural resources and the environmental impact resulting from the utilisation and application of such resources in conducting our business activities.
Our efforts in this regard are operationalised through a holistic Environment Management System (EMS), which has been designed to support global initiatives aimed at protecting the environment and conserving natural resources. Our EMS is pivoted on two key pillars;
1) an Input Management strategy to control the direct impact of our business activities through the management of energy, water, and materials,
2) an Output Monitoring Plan to gauge the effectiveness of our efforts through the measurement of emissions and the carbon footprint calculation process.
Natural Capital

L B Finance PLC Annual Report 2017/18 295
Emphasising our commitment, October 2017 was declared Environmental Awareness Month, with a series of events organised to raise environmental awareness among employees
The sustainability team provides oversight for the effective management of the EMS across the Company. Part of this responsibility includes monitoring the adequacy of the EMS vis-à-vis relevant legislature that may become applicable from time to time.
In recent years we have also come to realise that as a financial institution, we are in a position to play a broader role in bringing about social change that would result in favourable outcomes for the environment. Spearheaded by the Company’s green financial initiative, we strive to enhance LBF’s credentials as a truly green organisation.
Emphasising our commitment, October 2017 was declared Environmental Awareness Month, with a series of events organised to raise environmental awareness among employees, improve employee engagement in environmental activities and encourage green practices among employees and their families.
Environment Management System
Red
uce
Reu
se
Rec
ycle
Trai
ning
Pol
icie
s an
d P
ract
ices
Em
ploy
ee E
ngag
emen
t
Material
GreenBusiness
Conserved Environment
Green Employee
Water Energy CA
PIT
AL
RE
PO
RT
S

296 L B Finance PLC Annual Report 2017/18
In the year under review, LBF focused on specific target-driven activities in line with the Company’s Input and Output Management model, to minimise the impact on the environment and thereby reduce the loss of Natural Capital caused by the business.
INPUT MANAGEMENT
Energy Management
LBF’s total direct energy requirements are met through electricity purchased from the national grid. Over the years, LBF’s
consumption and usage of electricity has increased considerably in line with the growth in the business and expansion of LBF’s island-wide footprint. Energy management has therefore become a critical priority under our EMS, with energy efficiency and the measurement of carbon output for each operation being the key metrics of our energy management programme. Moreover, we believe that for our energy management programme to be a success, it requires the commitment and active participation of all employees.
Energy Consumption
Energy type 2018/17 2016/17 Change %
Diesel 1,982.80 GJ 2,339.57 GJ (15)
Petrol 4622.90 GJ 6,200.48 GJ (25)
Electricity 15,786.79 GJ 15,180.55 GJ 4
LP Gas - – -
Total 18,231.87 GJ 23,720.60 GJ (36)
The energy consumption ratios for 2017/18 show an decreasing trend compared to last year, being the result of the tight management of energy usage of the Company.
Over the years our projects have involved partnerships with Biodiversity Sri Lanka, the Department of Wild Life, the Central Environmental Authority, Sri Lanka Climate Fund, Climate Smart Initiatives (Pvt) Limited and the Young Zoologists’ Association of Sri Lanka.
Being a service organisation, LBF is not directly exposed to the adverse effects of climate change. Nonetheless as a responsible corporate citizen, we feel it is important to take necessary action to mitigate the impacts of climate change eventhough our product portfolio does not have any harmful impact towards the environment. In this regard, we carry out specific environmental conservation activities to raise awareness among the general public and also invest in specific initiatives designed to address pressing environmental issues that require attention from time to time. Given our limited expertise on environmental matters, we rely on the knowledge and expertise of specialised environmental bodies to ensure that our efforts achieve the desired results. Over the years our projects have involved partnerships with Biodiversity Sri Lanka, the Department of Wild Life, the Central Environmental Authority, Sri Lanka Climate Fund, Climate Smart Initiatives (Pvt) Limited and the Young Zoologists’ Association of Sri Lanka.
GRI - 102 - 11, 302 - 1
Natural Capital

L B Finance PLC Annual Report 2017/18 297
LBF’s ongoing actions on Energy Management
Main Focus Action taken
Reduce consumption Use of high-tech energy efficient equipment
Energy reduction methodologies
Electronic data collection and analysis
Energy audits
Installation of solar water heating systems to save electricity
Energy efficient lighting for sign boards at outlets
Maximum usage of natural light
Awareness Display of energy saving tips
Email campaign on the benefits of energy saving
Employee engagement Use of energy reduction methods at office and home
Policies and practices Commitment of employees to the Sustainability Pledge
Regulate the operating time of equipment
Energy Consumption Indicator
2017/18 2016/17
Total energy consumption 18,231.87 GJ 23,720 GJ
Per Employee 5.29 GJ 7.36 GJ
Per Working Day 61.80 GJ 96.43 GJ
Per Outlet 114.66 GJ 154.03 GJ
We believe that for our energy management programme to be a success, it requires the commitment and active participation of all employees.
Total Energy Consumption 2017/18
18,231.87 GJ23,720.60 GJ (2016/17)
Per Working Day61.80 GJ
80.40 GJ (2016/17)
Per Outlet114.66 GJ
154.02GJ (2016/17)
Per Employee5.29 GJ
7.36GJ (2016/17)
Water Management
Being a service organisation, water is used primarily for utility and sanitation needs of LBF’s employees as well as customers, suppliers and contractors who patronise our branches. Municipal water is the primary source of water used by LBF, although the Company has in recent times taken steps to ease the burden on the Municipal supply by tapping into ground water sources, where possible and practical. LBF has invested to install on-site tube wells at 16 branches on the network.
As a scarce resource, we recognise that initiatives aimed at conserving water will undoubtedly contribute to more sustainable water availability in the long-term. Hence our EMS includes a comprehensive Water Management Plan to encourage all employees to commit towards responsible water management and usage as part of their day-to-day work routines.
CA
PIT
AL
RE
PO
RT
S

298 L B Finance PLC Annual Report 2017/18
Water Consumption
Water source 2017/18 2016/17
Municipal water supplies 29,891,91m3 30,273 m3
Other sources - 615 m3
Total 29,891,91m3 30,888 m3
LBF’s ongoing actions on Water Management
Main focus Action taken
Reduce Consumption Use of high-intensity pressure pumps for vehicle washing
Usage of pressure reducing valves to maintain consistent water pressure
Taps with spray attachment to regulate water flow
Awareness Display of energy saving tips
Reuse Usage of rain water for air conditioner cooling
Policies and Procedures Commitment of employees to sustainability pledge
Total Water Consumption 2017/18
29,891.91 m3
30,388 m3 (2016/17)
Per Working Day
101.32 m3
103.01 m3 (2016/17)
Per Outlet
187.99 m3
197.32m3 (2016/17)
Per Employee
8.69m3
9.43 m3 (2016/17)
Material Management
Given the nature of LBF’s business operations as a financial services organisation, the Company does not use large quantities of materials, except for the use of paper as part of the day-to-day operations. However this too is not significant, compared to the scale of the business. Nonetheless LBF accepts its responsibility for even the small environmental impact resulting from the use of paper and has taken all possible steps through the EMS to manage the effective usage of paper. At present the Company does not use any recycled material as input.
As a scarce resource, we recognise that initiatives aimed at conserving water will undoubtedly contribute to more sustainable water availability in the long-term.
Natural Capital

L B Finance PLC Annual Report 2017/18 299
Material Consumption
2017/18 2016/17 2015/16
Unit Quantity Value (Rs.) Quantity Value (Rs.) Quantity Value (Rs.)
Stationery Materials
Paper Kgs 176,302.3 48,440,553 173,639 47,708,803 137,255 42,284,121
Files Kgs 6,330 1,820,901 4,786 1,376,545 4,759 1,325,810
Toners Pieces 2,775 21,495,050 1,923 14,464,88 1,320 9,583,010
Ribbon Pieces 2,132 2,375,934 1,660 1,838,056 1,379 1,679,895
Other Pieces 354,643 7,987,065 289,560 6,521,307 274,945 5,324,540
OUTPUT MANAGEMENT
Waste Management
Given the nature of our business as a financial services institution, the Company does not use large quantities of materials. As such it is only the use of paper and limited e-waste that have direct environmental impact. While the usage of paper is not significant compared to the scale of the
business, our EMS nonetheless provides strict guidelines for the effective usage of paper. The responsible disposal of waste forms an important part of our commitment to the environment. Accordingly we work with registered waste disposal partners to ensure all waste (paper and e-waste) generated as a result of our day-to-day operations, are disposed of in line with Central
Environment Authority (CEA) guidelines. Accordingly we partner with, Think Green (Pvt) Limited, Neptune Papers (Pvt) Limited and Asia Recycling (Pvt) Limited, all licensed recyclers registered with the CEA.
At present the Company does not use any recycled material as an input for the day-to-day operations.
Saved (equivalent)
Year Recycled paper (Kgs)
No. of fully grown trees
Litres of oil KWh of electricity
Litres of water Cubic metres of land fill
2017/18 3,978 68 6,981 15,912 126,421 12
2016/17 7,938 135 13,931 31,752 252,270 24
2015/16 32,065 545 56,274 128,260 1,019,026 96
2014/15 9,336 160 16,385 37,344 296,698 28
2013/14 2,378 40 4,173 9,512 75,573 7C
AP
ITA
L R
EP
OR
TS

300 L B Finance PLC Annual Report 2017/18
Main focus Our actions
Refuse Create a paperless environment through a digitalised document management system to store documents
The centralized web portal has significantly contributed in creating a paperless work environment which contains organisational policies, procedures, news, photo gallery and other downloadable documents
Introduce the Paperless Boardroom concept
Usage of paperless fax machines for day-to-day operations
Reduce To monitor and control the inventory consumption using inventory management system
Reuse Reuse of paper and envelopes as much as possible
Recycle Paper items directed for recycling are directed to a designated area within each office
All paper waste is recycled through Neptune Recyclers
Recycle all e-waste through an authorised e-waste recycle partner
Awareness Regular e-mails notifications to build awareness
Sticker campaigns to promote the effective usage of material
Policies and Practices Policies on material usage
The Company enforces a dual side printing policy, with all default settings on printers adjusted accordingly
Emission Measurement
Being a financial institution, LBF’s direct emissions (Scope 1) resulting from business activities are minimal. The Company does however share in the indirect responsibility for emissions (Scope 2) due to electricity purchased in the course of business as well as for emissions caused by employees commuting to and from work (Scope 3). As part of its Carbon Footprint Calculation process (outlined below), the Company tracks, measures and analyses the year-on-year progress made with regard to Scope 1, Scope 2 and Scope 3 greenhouse gas (GHG) emissions. Through this process we have been able to determine performance gaps and identify weak points, qualifying necessary corrective action to be implemented via the EMS.
In the year under review, there were no significant air emissions or emission of ozone depleting substances, pollutants and other hazardous compounds that were attributed to LBF’s operations. As a result, no detailed measurement of emissions was carried out for LBF, except for what was computed under the Carbon Footprint Calculation process.
Carbon Footprint Calculation
Underpinning the commitment towards becoming a carbon neutral organisation, LBF embarked on its Carbon Footprint Calculation journey in 2013. The process aims to establish an accurate measurement of our GHG emissions based on the energy, water and paper consumption in the day-to-day operations of the business. In this way, the process
serves as a mechanism for the identification of new opportunities for emission reduction; in turn enabling the Company to continuously fine-tune its carbon management strategy by establishing KPIs that would accelerate the journey towards achieving Carbon Neutral status. The Carbon footprint calculation process also gives us a good understanding of the impacts of climate change, enabling LBF to stay ahead of the curve through the deployment of a pre-emptive climate action strategy. The calculation methodology followed is that of the internationally accepted GHG protocol. Accordingly LBF has reported on GHG emissions against three WBCSD/WRI scopes; which offer technical guidance for ISO 14064 - 1:2006, standards for the verification of organisational level GHG assertion.
GRI - 305 - 6
Natural Capital

L B Finance PLC Annual Report 2017/18 301
Scope Tonnes of CO2 equivalent 2017/18
Tonnes of CO2 equivalent 2016/17
Tonnes of CO2 equivalent 2015/16
Scope 1 - Direct GHG emissions 182 808.23 838.36
Scope 2 - Indirect GHG emissions 2,251 2,150.58 920.74
Scope 3 – Other indirect GHG emissions 790 1,391.28 958.27
Total carbon footprint 3,223 4,360.72 2,717.38
Scope CO2 N2O CH4
Scope 1 179 0.02 0.009
Scope 2 2,239 0.04 0.04
Scope 3 771 0.2 0.03
Scope 1 Scope 2 Scope 30
500
1,000
1,500
2,000
2,500
GHG EMISSIONS YEAR WISE COMPARISON
tCO2e
2015/16 2016/17 2017/18
LBF’s total GHG emissions for 2015/16, 2016/17 and 2017/18 was 2,717.38, 4,360.72 and 3,223tCO2e respectively. Overall GHG emissions in 2017/18 decreased by 26% against 2016/17.
Action on carbon emission management during the year
The Company took the following actions within the year and followed the existing practices in a tight manner.
Main focus LBF’s ongoing actions on controlling emissions
Reduce Moving away from high-energy consuming equipment in favour of energy saving equipment
Promote the use the common transport as opposed to private transport
Regulating usage during peak times
Providing integrated transport solutions for business duties
Awareness Email campaign on energy saving mechanisms in the office
Encourage all customers, corporate entities and the general public to contribute in shifting Sri Lanka to a low-carbon economy through the adoption of eco-friendly practices
Leadership Lead by example to encourage peers to strive for carbon neutrality by adopting the Carbon Footprint Calculation process
Policies and Procedures Secure the commitment of employees to the EMS
GRI - 302 - 3, 4, 305 - 1, 2, 3, 4, 5, 7
Energy consumption
0.94tCO2eper employee
Energy consumption
20.27tCO2eper outlet
CA
PIT
AL
RE
PO
RT
S

302 L B Finance PLC Annual Report 2017/18
Green Lending
Efforts by the Company to support a more environmentally-conscious society is led by the LBF Green Lending initiative, a dedicated leasing facility for the promotion of hybrid vehicles. With their fuel efficient, low emission profile, hybrid vehicles help customers to reduce their own personal carbon footprint.
Year No. of green financing facilities
Amount granted (Rs. million)
2017/18 450 1,159.00
2016/17 800 2,471.36
2015/16 368 1,081.61
2014/15 443 1,260.95
2013/14 146 396.75
No. of greenfinancing facilities
Amount granted (Rs. Million)
450
1,159.00
ENVIRONMENTAL AWARENESS AND CSR
Focus area Total Investment
No. of beneficiaries
Employee voluntary
Preserving nature 3,497,500.00 Not quantifiable 27 employees
Mitigation of environmental impacts
487,005 Not quantifiable 207
Natural Capital

L B Finance PLC Annual Report 2017/18 303
PROJECT | 01
Tree Planting Programme (ongoing project)
PROJECT SCOPE OBJECTIVES
Distribution of tree saplings among customers and the community
» Encourage stakeholders to align with the Company’s environmental goals
» Inspire good behaviour and green ethics
» Conserving flora and fauna and protection of biodiversity within identified areas
BENEFICIARIESEMPLOYEE VOLUNTEERISM
612 school students and customers in Rathnapura, Panadura and Kegalle areas
8 employees (56 volunteer hours)
IMPACT ASSESSMENT (Derived through Community Feedback)
PROJECT | 02
Environmental Preservation
PROJECT SCOPE OBJECTIVES
Commissioning of a gantry near the corporate office depicting “Don’t leave them to fade away”
Create awareness and emphasise on the importance of environmental conservation
BENEFICIARIESEMPLOYEE VOLUNTEERISM
Society at large 12 employees (44 volunteer hours)
IMPACT ASSESSMENT (Derived through Community Feedback)
LIFE ON LAND PROJECTS
CA
PIT
AL
RE
PO
RT
S

304 L B Finance PLC Annual Report 2017/18
PROJECT | 04
Distribution of outfits to forest rangers (ongoing project)
PROJECT SCOPE OBJECTIVES
Distribution of protective jackets to wildlife officers stationed at the 7 wildlife parks.
» Motivate forest rangers to ensure they work towards protection of animals at the wild life park
» Support environment protection activities
Year Project location
2017/18 Padawiya, Chundikulam, Madu, Ampara, Anuradhapura, Galoya, Nilgala
2016/17 Horton Plains, Kaudulla, Wasgamuwa, Angamadilla, Horagolla
2015/16 Ritigala2014/15 Yala2013/14 Minneriya2012/13 Wilpattu
BENEFICIARIESEMPLOYEE VOLUNTEERISM
Society at large 15 employees (265 volunteer hours)
IMPACT ASSESSMENT (Derived through Community Feedback)
PROJECT | 03
Internal competition on environmental conservation and protection
PROJECT SCOPE OBJECTIVES
Organised for the children of LBF employees, where competitors were allowed to present any artwork (painting, artwork, poems etc.) on environmental conservation and protection. Submissions were judged on multiple age categories as well as an open category to encourage employees also to compete. Winners under each category were awarded cash prices.
» Creating awareness among the employees and their families
» Inculcate green practices to develop employees and their families as the green partners of the Company
» Motivate the environmental friendly attitudes among employees and their families
BENEFICIARIESEMPLOYEE VOLUNTEERISM
50 Employees and their families
90 employees (215 volunteer hours)
IMPACT ASSESSMENT (Derived through Community Feedback)
Natural Capital
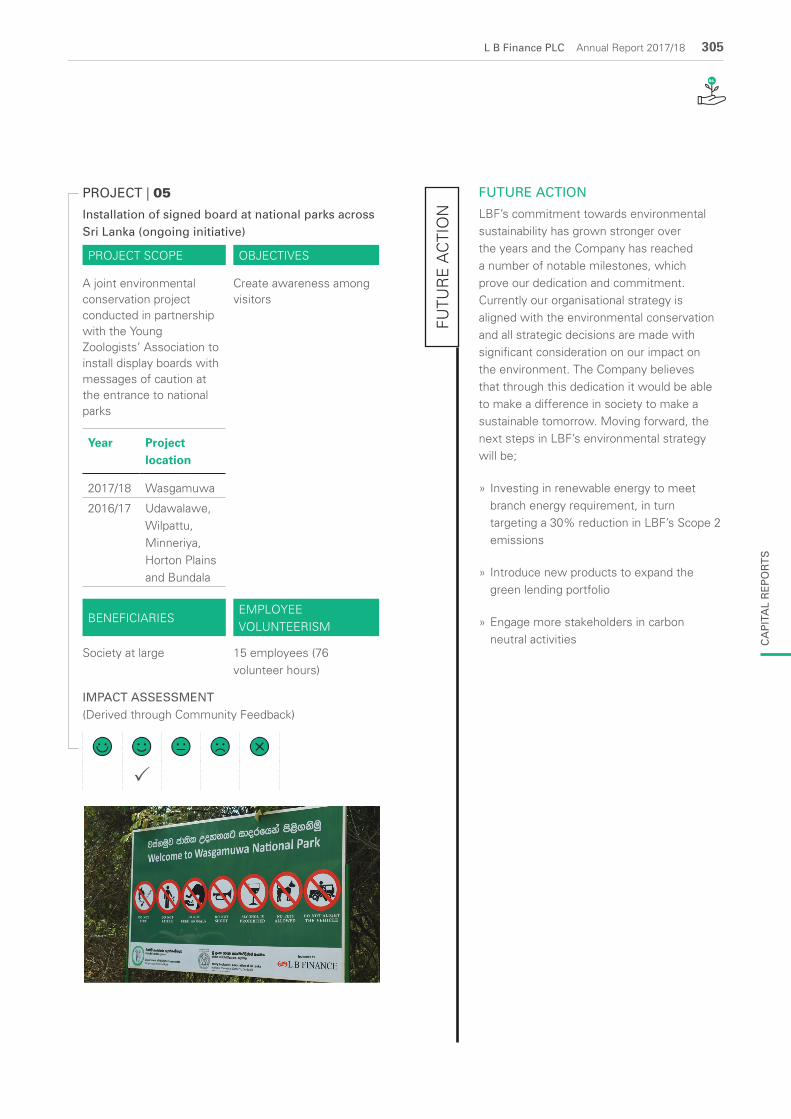
L B Finance PLC Annual Report 2017/18 305
PROJECT | 05
Installation of signed board at national parks across Sri Lanka (ongoing initiative)
PROJECT SCOPE OBJECTIVES
A joint environmental conservation project conducted in partnership with the Young Zoologists’ Association to install display boards with messages of caution at the entrance to national parks
Year Project location
2017/18 Wasgamuwa
2016/17 Udawalawe, Wilpattu, Minneriya, Horton Plains and Bundala
Create awareness among visitors
BENEFICIARIESEMPLOYEE VOLUNTEERISM
Society at large 15 employees (76 volunteer hours)
IMPACT ASSESSMENT (Derived through Community Feedback)
FUTU
RE
AC
TIO
N
FUTURE ACTION
LBF’s commitment towards environmental sustainability has grown stronger over the years and the Company has reached a number of notable milestones, which prove our dedication and commitment. Currently our organisational strategy is aligned with the environmental conservation and all strategic decisions are made with significant consideration on our impact on the environment. The Company believes that through this dedication it would be able to make a difference in society to make a sustainable tomorrow. Moving forward, the next steps in LBF’s environmental strategy will be;
» Investing in renewable energy to meet branch energy requirement, in turn targeting a 30% reduction in LBF’s Scope 2 emissions
» Introduce new products to expand the green lending portfolio
» Engage more stakeholders in carbon neutral activities C
AP
ITA
L R
EP
OR
TS

306 L B Finance PLC Annual Report 2017/18

L B Finance PLC . Annual Report 2017/18 307
CONTENTSFinancial Statement Highlights .................................................... 308Financial Calendar ........................................................................ 310Directors' Responsibility Statement on Internal
Control Over Financial Reporting ............................................. 311Directors' Responsibility for Financial Reporting ......................... 312Independent Auditors' Report ..................................................... 313Financial Statements - Table of Contents .................................... 316Income Statement ....................................................................... 317Statement of Comprehensive Income ........................................ 318Statement of Financial Position ................................................... 319Statement of Changes in Equity - Company ................................ 320Statement of Changes in Equity - Group ..................................... 321Statement of Cash Flows ............................................................ 322Notes to the Financial Statements .............................................. 324
FINANCIAL REPORTS
A Matter of Performance
Delivering ResultsA Reputed BrandDistributing WealthA Strong Asset BaseGreater Profitability

308 L B Finance PLC . Annual Report 2017/18
Financial Statement HighlightsOperating Results
Profitability Ratios
0
5
10
15
20
25
30Rs. Bn
INCOME
2017 2018
201825Bn
201719Bn
0
2
4
6
8
10
12Rs. Bn
NET INTEREST INCOME
2017 2018
201812Bn
201710Bn
0
2
4
6
8Rs. Bn
PROFIT BEFORE TAX (PBT)
2017 2018
20186.4Bn
20175.8Bn
0
20
40
60
80
100%
DIVIDEND PAYMENT VS RETAINED PROFIT
2017 2018
2018*35.84%
2017*31.82%
Retained profitDividend payout
*Dividend payout ratio
0
1
2
3
4
5Rs. Bn
PROFIT AFTER TAX (PAT)
2017 2018
20184.2Bn
20173.9Bn
0
1
2
3
4
5%
RETURN ON ASSETS (ROA)
2017 2018
2018 3.80%
20174.18%
0
10
20
30
40
50
60%
GROSS PROFIT MARGIN*
2017 2018
201847.5%
201750.6%
*Net interest income as a % of Income
05
10152025303540
%
OPERATING PROFIT MARGIN*
2017 2018
201831.20%
201735.64%
*Operating profit before tax as a % of Income
0
5
10
15
20
25%
NET PROFIT MARGIN*
2017 2018
201816.97%
201720.24%
*Profit after tax as a % of Income
05
101520253035
%
RETURN ON EQUITY (ROE)
2017 2018
2018 30.52%
2017 34.09%
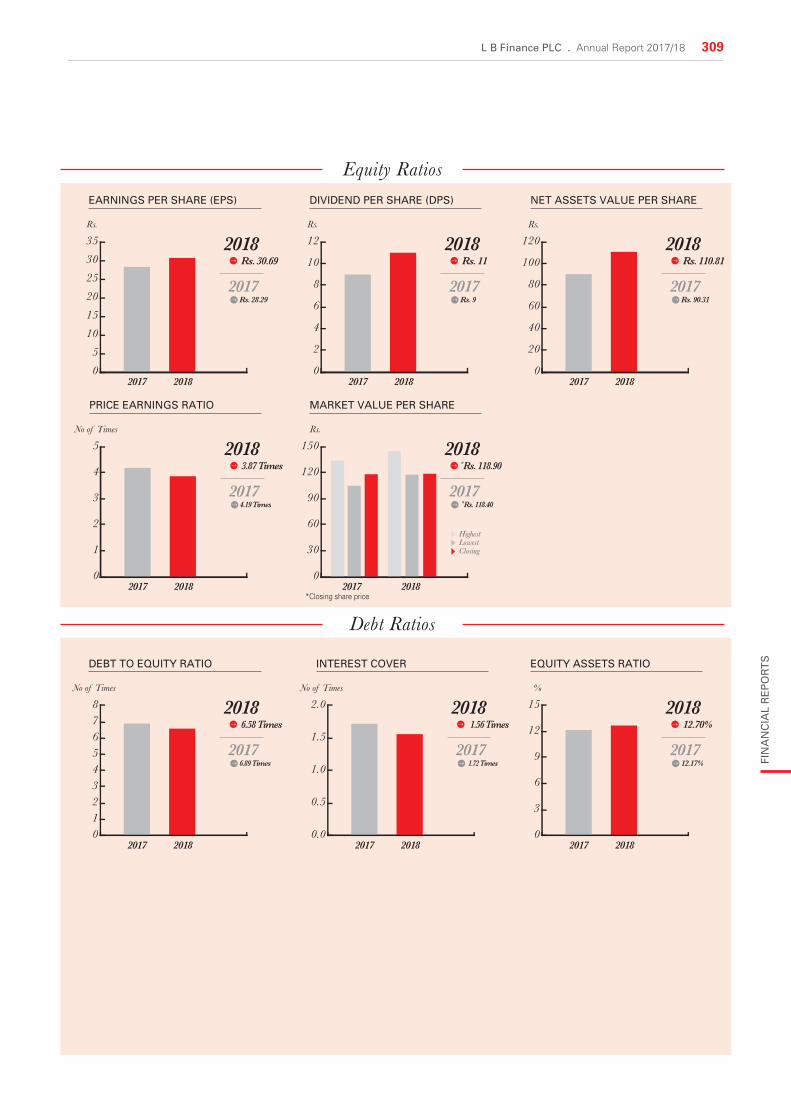
L B Finance PLC . Annual Report 2017/18 309
Equity Ratios
Debt Ratios
012345678
DEBT TO EQUITY RATIO
2017 2018
20186.58 Times
20176.89 Times
No of Times
0
3
6
9
12
15%
EQUITY ASSETS RATIO
2017 2018
201812.70%
201712.17%
0.0
0.5
1.0
1.5
2.0No of Times
INTEREST COVER
2017 2018
2018 1.56 Times
2017 1.72 Times
0
20
40
60
80
100
120Rs.
NET ASSETS VALUE PER SHARE
2017 2018
2018Rs. 110.81
2017Rs. 90.31
05
101520253035Rs.
EARNINGS PER SHARE (EPS)
2017 2018
2018Rs. 30.69
2017Rs. 28.29
0
2
4
6
8
10
12Rs.
DIVIDEND PER SHARE (DPS)
2017 2018
2018Rs. 11
2017Rs. 9
0
1
2
3
4
5No of Times
PRICE EARNINGS RATIO
2017 2018
20183.87 Times
20174.19 Times
0
30
60
90
120
150Rs.
MARKET VALUE PER SHARE
2017 2018
2018 *Rs. 118.90
2017 *Rs. 118.40
HighestLowestClosing
*Closing share price
FIN
AN
CIA
L R
EP
OR
TS

310 L B Finance PLC . Annual Report 2017/18
Financial Calendar
2017/18
Publication of interim Financial Statements for the quarter ended 31 March 2017 25 April 2017
Authorisation for issue of audited Financial Statements for 2016/17 23 May 2017
Publication of Annual Report for the financial year ended 31 March 2017 6 June 2017
Held 44th Annual General Meeting of the Company 30 June 2017
Payment of final dividend of Rs. 3.00 per share for the financial year ended 31 March 2017 11 July 2017
Publication of interim Financial Statements for the quarter ended 30 June 2017 28 July 2017
Publication of interim Financial Statements for the quarter ended 30 September 2017 24 October 2017
Publication of interim Financial Statements for the quarter ended 31 December 2017 30 January 2018
Payment of interim dividend of Rs. 7.00 per share for the financial year ended 31 March 2018 9 March 2018
2018/19
Publication of interim Financial Statements for the quarter ended 31 March 2018 11 May 2018
Authorisation for issue of audited Financial Statements for 2017/18 22 May 2018
Publication of Annual Report for the financial year ended 31 March 2018 5 June 2018
45th Annual General Meeting of the Company 29 June 2018
Payment of final dividend of Rs.4.00 per share for the financial year ended 31 March 2018 10 July 2018*
Submission of the interim Financial Statements in terms of the rule 7.4 of the CSE
2017/18 submitted on 2018/19 to be submitted on or before
For the 3 months ended 30 June, (unaudited) 28 July 2017 15 August 2018
For the 3 and 6 months ended 30 September, (unaudited) 24 October 2017 15 November 2018
For the 3 and 9 months ended 31 December, (unaudited) 30 January 2018 15 February 2019
For the 3 months and year ended 31 March, (unaudited) 11 May 2018 30 May 2019
Publication of the six month Financial Statements as per requirements of the Central Bank of Sri Lanka
2017/18 published in newspapers on 2018/19 to be published on or beforeEnglish Sinhala Tamil
For the year ended 31 March, (audited) 27 June 2017 27 June 2017 28 June 2017 30 June 2018
For the 6 months ended 30 September, (unaudited) 14 November 2017
14 November 2017
14 November 2017
30 November 2018
*Subject to confirmation by Shareholders

L B Finance PLC . Annual Report 2017/18 311
Directors' Responsibility Statement on Internal Control Over Financial ReportingRESPONSIBILITY
In line with the section 10 (2) (b) of the Finance Companies Direction No. 03 of 2008 as amended by the Direction No. 06 of 2013, the Board of Directors presents this report on internal control over financial reporting.
The Board of Directors (‘Board’) has overall responsibility for L B Finance PLC’s (‘Company’) internal control over financial reporting and for reviewing its adequacy and effectiveness.
The Board has established an ongoing process for identifying, evaluating and managing the significant risks faced by the Company and this process includes enhancing the system of internal control over financial reporting as and when there are changes to business environment or regulatory guidelines. This process is regularly reviewed by the Board.
The Board is of the view that the system of internal control over financial reporting in place is adequate to provide reasonable assurance regarding the reliability of financial reporting that the preparation of the Financial Statements for external purposes is in accordance with relevant accounting principles and regulatory requirements.
The management assists the Board in the implementation of the policies and procedures on risk and control, by
identifying and assessing the risks faced, and in design, operation and monitoring of suitable internal controls over financial reporting to mitigate and control these risks.
Internal controls over financial reporting are checked by the Internal Auditors of the Company for suitability of design and effectiveness on an ongoing basis. The scope, quality and reports of internal audits are reviewed by the Board Audit Committee at its monthly meetings and improvements recommended wherever necessary.
The Company adopts the improvements in Sri Lanka Accounting Standards and continuously improves the Financial Statement closure process, investments and borrowing procedures, disclosures with regard to financial risk management, fair value and management information.
CONFIRMATION
Based on the above processes, the Board confirms that the financial reporting system of the Company has been designed to provide reasonable assurance regarding the reliability of financial reporting and the preparation of Financial Statements for external purposes and has been done in accordance with Sri Lanka Accounting Standards and regulatory requirements of the Central Bank of Sri Lanka.
REVIEW OF THE STATEMENT BY EXTERNAL AUDITORS
The External Auditors have submitted a certification on the process adopted by the Directors on the system of internal controls over financial reporting.
By order of the Board,
Mrs. Yogadinusha BhaskaranNon-Executive Director
Sumith AdhihettyManaging Director
1 June 2018
FIN
AN
CIA
L R
EP
OR
TS

312 L B Finance PLC . Annual Report 2017/18
Directors' Responsibility for Financial Reporting
The following statement sets out responsibility of the Directors in relation to the Financial Statements of the Company and its Subsidiary prepared in accordance with the provisions of the Companies Act No. 7 of 2007.
The responsibility of the Independent Auditor in relation to the Financial Statements is set out in the Report of the Auditors given on pages 313 to 315 of the Annual Report.
As per the provisions of sections 151, 152(1) and (2), 153(1) and (2) and 150 (1) of the Companies Act No. 7 of 2007, the Directors are required to prepare Financial Statements for each financial year, which should give a true and fair view of the state of affairs of the Company and its Subsidiary as at the reporting date and its profit or loss for the financial year then ended, ensure that they are completed within six months or such extended period as may be determined by the Registrar General of Companies, certified by the person responsible for the preparation of the Financial Statements that it is in compliance with the said Companies Act and dated and signed on behalf of the Board by two Directors of the Company.
In terms of section 166(1) read together with sections 168(1)(b) and (c) and section 167(1) of the Companies Act, the Directors shall cause a copy of the aforesaid Financial Statements together with the annual report of the Board of Directors of the Company prepared as per section 166(1) of the Companies Act to be sent to every shareholder not less than fifteen working days before the date fixed for holding the Annual General Meeting.
In preparing the Financial Statements, the Directors are responsible to ensure that appropriate accounting policies have been selected and applied consistently, reasonable and prudent judgments
and estimates have been made and all applicable accounting standards have been complied with.
The Directors are also required to ensure that the Company and its Subsidiary have adequate resources to continue in operation to justify applying the going concern basis in preparing these Financial Statements.
Further, the Directors have a responsibility to ensure that the Companies within the Group maintains sufficient accounting records to disclose with reasonable accuracy, the financial position of the Company and the Subsidiary.
Financial Statements prepared and presented in this report have been prepared based on Sri Lanka Accounting Standards (SLFRS/LKAS) and are consistent with the underlying books of accounts and are in conformity with the requirements of Sri Lanka Accounting Standards, Companies Act No. 7 of 2007, Sri Lanka Accounting and Auditing Standards Act No. 15 of 1995 and the Listing Rules of the Colombo Stock Exchange.
The Directors have also instituted effective and comprehensive systems of internal control for identifying, recording, evaluating and managing the significant risks faced by the Company throughout the year, which is primarily handled through the Audit Committee and the Integrated Risk Management Committee as set out in their Reports that appear on pages 110 and 112 respectively.
The Directors have taken appropriate steps to ensure that the Company and its Subsidiary maintain proper books of accounts and the financial reporting system is directly reviewed by the Directors at their regular meetings and also through the Board Audit Committee.
The Board of Directors also approves the interim Financial Statements prior to their release following a review and recommendation by the Board Audit Committee.
The Board of Directors accepts responsibility for te integrity and objectivity of the Financial Statements presented in this Annual Report.
The Financial Statements of the Company and the Subsidiary have been certified by the Chief Financial Officer of the Company, the officer responsible for their preparation as required by section 152(1)(b) and they have also been signed by two Directors of the Company as required by section 152(1)(c) of the Companies Act.
The Directors to the best of their knowledge and belief, are satisfied that all statutory payments in relation to all relevant regulatory and statutory authorities, which were due and payable by the Company and the Subsidiary as at the reporting date have been paid or where relevant, provided for.
The Directors are of the view that they have discharged their responsibilities as set out in this statement.
By Order of the BoardL B Finance PLC
P W Corporate Secretarial (Pvt) LtdCompany Secretaries
1 June 2018

L B Finance PLC . Annual Report 2017/18 313
Independent Auditors' Report
INDEPENDENT AUDITORS’ REPORT TO THE SHAREHOLDERS OF L B FINANCE PLC
Report on the audit of the Consolidated Financial Statements
Opinion
We have audited the Financial Statements of L B Finance PLC (‘the Company’) and the Consolidated Financial Statements of the Company and its Subsidiary (‘the Group’), which comprise the Statement of Financial Position as at 31 March 2018, Income Statement and the Statement of Comprehensive Income, Statement of Changes in Equity and Statement of Cash Flows for the year then ended, and Notes to the Financial Statements, including a summary of significant accounting policies.
In our opinion, the accompanying Financial Statements of the Company and the Group give a true and fair view of the financial position of the Company and the Group as at 31 March 2018, and of their financial performance and cash flows for the year then ended in accordance with Sri Lanka Accounting Standards.
Basis for opinion
We conducted our audit in accordance with Sri Lanka Auditing Standards (SLAuSs). Our responsibilities under those standards are further described in the Auditor’s responsibilities for the audit of the Financial Statements section of our report. We are independent of the Group in accordance with the Code of Ethics issued by CA Sri Lanka (Code of Ethics) and we have fulfilled our other ethical responsibilities in accordance with the Code of Ethics. We believe that the audit evidence we have obtained is sufficient and appropriate to provide a basis for our opinion.
Key audit matters
Key audit matters are those matters that, in our professional judgment, were of most significance in our audit of the Financial Statements of the current period. These matters were addressed in the context of our audit of the Financial Statements as a whole, and in forming
our opinion thereon, and we do not provide a separate opinion on these matters. For each matter below, our description of how our audit addressed the matter is provided in that context.
We have fulfilled the responsibilities described in the Auditor’s responsibilities for the audit of the Financial Statements section of our report, including in relation to these matters. Accordingly, our audit included the performance of procedures designed to respond to our assessment of the risks of material misstatement of the Financial Statements. The results of our audit procedures, including the procedures performed to address the matters below, provide the basis for our audit opinion on the accompanying Financial Statements.
FIN
AN
CIA
L R
EP
OR
TS

314 L B Finance PLC . Annual Report 2017/18
Key audit matter How our audit addressed the key audit matter
Impairment of loans and receivables and lease rentals receivable and stock out on hire
As at 31 March 2018, loans and receivables and lease rentals receivable and stock out on hire (net of impairment) amounted to Rs. 39,894,276 (Rs.‘000) and Rs. 62,489,686 (Rs.‘000) respectively. These collectively contributed 85% to the Group’s total assets.
The allowance for impairment (both individual and collective) of these financial assets is estimated by management. The estimation involves a complex calculation. Assumptions used by management in this calculation are inherently judgmental. Note 4.18 to the Financial Statements more fully describes the assumptions to which this estimate is most sensitive.
We considered the estimation of allowance for impairment as a Key Audit Matter due to sensitivity of reported results (on financial performance) to this allowance and the inherent uncertainty involved in its estimation.
To assess the reasonableness of the allowance for impairment, we performed the following procedures, among others:
» We understood & evaluated the key internal controls over estimation of the allowance for impairment including those over identifying occurrence of loss events;
» We test - checked the underlying calculations and data used in such calculations;
» In addition to the above, focused procedures were performed as follows:
Individual allowance for impairment: For a sample of loans & leases, checked the management’s assessment of
effectiveness of controls over the identification of customers for whom an impairment event has occurred. Further, for such customers, we test – checked the appropriateness of management’s calculation over the estimation of recoverable amount.
Collective allowance for impairment: For loss rates used by management, we assessed the appropriateness of the loss
emergence period and the observation period including consistency with historical loss experience; assessed the reasonableness of the assumptions on effects arising from macro – economic factors;
» We assessed the adequacy of the related financial statement disclosures as set out in note(s) 4.16, 4.17, 4.18 and 5.1 to 5.4.
Other information included in the Group’s 2018 Annual Report
Other information consists of the information included in the Annual Report, other than the Financial Statements and our auditor’s report thereon. Management is responsible for the other information.
Our opinion on the Financial Statements does not cover the other information and we do not express any form of assurance conclusion thereon.
In connection with our audit of the Financial Statements, our responsibility is to read the other information and, in doing so, consider whether the other information is materially inconsistent with the Financial Statements or our knowledge obtained in the audit or otherwise appears to be materially misstated. If, based on the work we have performed, we conclude that there is a material misstatement of this other
information, we are required to report that fact. We have nothing to report in this regard.
Responsibilities of management and those charged with governance
Management is responsible for the preparation of Financial Statements that give a true and fair view in accordance with Sri Lanka Accounting Standards, and for such internal control as management determines is necessary to enable the preparation of Financial Statements that are free from material misstatement, whether due to fraud or error.
In preparing the Financial Statements, management is responsible for assessing the Group’s ability to continue as a going concern, disclosing, as applicable, matters related to going concern and using the going concern basis of accounting unless management either intends to liquidate the Group or to cease
operations, or has no realistic alternative but to do so.
Those charged with governance are responsible for overseeing the Company’s and the Group’s financial reporting process.
Auditor’s responsibilities for the audit of the Financial Statements
Our objectives are to obtain reasonable assurance about whether the Financial Statements as a whole are free from material misstatement, whether due to fraud or error, and to issue an auditor’s report that includes our opinion. Reasonable assurance is a high level of assurance, but is not a guarantee that an audit conducted in accordance with SLAuSs will always detect a material misstatement when it exists. Misstatements can arise from fraud or error and are considered material if, individually or in the aggregate, they could
Independent Auditors' Report

L B Finance PLC . Annual Report 2017/18 315
reasonably be expected to influence the economic decisions of users taken on the basis of these Financial Statements.
As part of an audit in accordance with SLAuSs, we exercise professional judgment and maintain professional skepticism throughout the audit. We also:
» Identify and assess the risks of material misstatement of the Financial Statements, whether due to fraud or error, design and perform audit procedures responsive to those risks, and obtain audit evidence that is sufficient and appropriate to provide a basis for our opinion. The risk of not detecting a material misstatement resulting from fraud is higher than for one resulting from error, as fraud may involve collusion, forgery, intentional omissions, misrepresentations, or the override of internal control.
» Obtain an understanding of internal control relevant to the audit in order to design audit procedures that are appropriate in the circumstances, but not for the purpose of expressing an opinion on the effectiveness of the internal controls of the Company and the Group.
» Evaluate the appropriateness of accounting policies used and the reasonableness of accounting estimates and related disclosures made by management.
» Conclude on the appropriateness of management’s use of the going concern basis of accounting and, based on the audit evidence obtained, whether a material uncertainty exists related to events or conditions that may cast significant doubt on the Group’s ability to continue as
a going concern. If we conclude that a material uncertainty exists, we are required to draw attention in our auditor’s report to the related disclosures in the Financial Statements or, if such disclosures are inadequate, to modify our opinion. Our conclusions are based on the audit evidence obtained up to the date of our auditor’s report. However, future events or conditions may cause the Group to cease to continue as a going concern.
» Evaluate the overall presentation, structure and content of the Financial Statements, including the disclosures, and whether the Financial Statements represent the underlying transactions and events in a manner that achieves fair presentation.
» Obtain sufficient appropriate audit evidence regarding the financial information of the entities or business activities within the Group to express an opinion on the Consolidated Financial Statements. We are responsible for the direction, supervision and performance of the Group audit. We remain solely responsible for our audit opinion.
We communicate with those charged with governance regarding, among other matters, the planned scope and timing of the audit and significant audit findings, including any significant deficiencies in internal control that we identify during our audit.
We also provide those charged with governance with a statement that we have complied with ethical requirements in accordance with the Code of Ethics regarding independence, and to
communicate with them all relationships and other matters that may reasonably be thought to bear on our independence, and where applicable, related safeguards.
From the matters communicated with those charged with governance, we determine those matters that were of most significance in the audit of the Financial Statements of the current period and are therefore the key audit matters. We describe these matters in our auditor’s report unless law or regulation precludes public disclosure about the matter or when, in extremely rare circumstances, we determine that a matter should not be communicated in our report because the adverse consequences of doing so would reasonably be expected to outweigh the public interest benefits of such communication.
Report on other legal and regulatory requirements
As required by section 163 (2) of the Companies Act No. 07 of 2007, we have obtained all the information and explanations that were required for the audit and, as far as appears from our examination, proper accounting records have been kept by the Company.
CA Sri Lanka membership number of the engagement partner responsible for signing this independent auditor’s report is 1884.
22 May 2018Colombo
FIN
AN
CIA
L R
EP
OR
TS

316 L B Finance PLC . Annual Report 2017/18
Financial Statements - Table of Contents
Note No. Page No.
Section 01 - Primary Financial StatementsIncome Statement 317Statement of Comprehensive Income 318Statement of Financial Position 319Statement of Changes in Equity - Company 320Statement of Changes in Equity - Group 321Statement of Cash Flows 322
Section 02 - Reporting entityReporting entity 2.1 324Consolidated Financial Statements 2.2 324Principal business activities, nature of operations of the Group and ownership by the Company in its Subsidiary 2.3 324Approval of Financial Statements by Directors 2.4 324Statement of compliance 2.5 325Responsibilities for the Financial Statements 2.6 325Basis of measurement 2.7 325Going concern 2.8 325Functional and presentation currency 2.9 325Presentation of Financial Statements 2.10 325Use of materiality, aggregation, offsetting and rounding 2.11 325Comparative information 2.12 326Sri Lanka Accounting Standards issued but not yet effective as at 31 March 2018 2.13 326Changes in Accounting Policies 2.14 329Significant accounting assumptions, judgments and estimation uncertainties 2.15 329
Section 03 - General accounting policies and notesBasis of consolidation 3.1 330Foreign currency 3.2 330Provisions 3.3 330Operational risk events 3.4 331Other taxes 3.5 331Borrowing costs 3.6 331Financial guarantees and loan commitments 3.7 331Impairment of non–financial assets 3.8 331
Section 04 - Specific accounting policies and notesNet interest income 4.1 332Fee and commission income 4.2 334Net trading income 4.3 335Other operating income 4.4 335Impairment charge/(reversal) for loans and other losses 4.5 336Personnel expenses 4.6 337Other operating expenses 4.7 338Tax on financial services 4.8 339
Note No. Page No.
Taxation 4.9 340Earnings per ordinary share 4.10 342Dividend paid and proposed 4.11 343Financial instruments 4.12 343Fair value measurement 4.13 346Cash and cash equivalents 4.14 356Financial investments - held for trading 4.15 357Loans and receivables 4.16 358Lease rentals receivable and stock out on hire 4.17 360Allowance for impairment losses 4.18 362Financial investments - available for sale 4.19 364Other financial assets 4.20 367Other non-financial assets 4.21 368Investment in Subsidiary 4.22 369Property, plant and equipment 4.23 369Intangible assets 4.24 376Due to banks 4.25 378Due to customers 4.26 380Debt instruments issued and other borrowed funds 4.27 381Other financial liabilities 4.28 382Other non-financial liabilities 4.29 383Current tax liabilities 4.30 383Deferred taxation 4.31 384Post employment benefit liability 4.32 385Stated capital 4.33 388Reserves 4.34 388Retained earnings 4.35 389Non-controlling interest 4.36 389
Section 05 - Risk management disclosuresIntroduction 5.1 390Credit risk 5.2 391Liquidity risk and funding management 5.3 397Market risk 5.4 402Capital adequacy 5.5 405
Section 06 - Other disclosuresRelated party disclosures 6.1 406Capital 6.2 409Current and non current analysis of assets and liabilities 6.3 409Segmental information 6.4 410Commitments and contingencies 6.5 411Net asset value per share 6.6 412Assets pledged 6.7 412Comparative information 6.8 412Events occurring after the reporting date 6.9 413Changes in liabilities arising from financing activities 6.10 413

L B Finance PLC . Annual Report 2017/18 317
Income Statement
Company Group
Year ended 31 March 2018 2017 Change 2018
Note Page No. Rs. ‘000 Rs. ‘000 % Rs. ‘000
Income 4.1.1 332 25,046,202 19,363,428 29 25,046,339
Interest income 4.1.2 332 23,394,115 17,909,935 31 23,395,887
Less: Interest expenses 4.1.6 333 11,498,408 8,112,337 42 11,498,460
Net interest income 4.1.8 334 11,895,707 9,797,598 21 11,897,427
Fee and commission income 4.2 334 1,504,188 1,209,340 24 1,504,599
Net trading income 4.3 335 (299) (148) >(100) (299)
Other operating income 4.4 335 148,198 244,301 (39) 146,152
Total operating income 13,547,794 11,251,091 20 13,547,879
Less: Impairment charge/(reversal) for loans and other losses 4.5 336 667,628 (42,265) >100 668,005
Less: Gold loan auction losses 2,995 2,200 36 2,995
Net operating income 12,877,171 11,291,156 14 12,876,879
Less: operating expenses
Personnel expenses 4.6 337 2,397,919 2,110,405 14 2,400,735
Depreciation of property, plant and equipment 4.23 369 365,599 326,128 12 365,684
Amortisation of intangible assets 4.24 376 18,636 17,090 9 19,053
Other operating expenses 4.7 338 2,280,634 1,935,589 18 2,282,693
Total operating expenses 5,062,788 4,389,212 15 5,068,165
Operating profit before tax on financial services 7,814,383 6,901,944 13 7,808,714
Less: Tax on financial services 4.8 339 1,336,693 1,027,101 30 1,336,693
Profit before taxation 6,477,690 5,874,843 10 6,472,021
Less: income tax expense 4.9.1 (a) 340 2,226,969 1,956,639 14 2,226,969
Profit for the year 4,250,721 3,918,204 8 4,245,052
Profit attributable to:
Equity holders of the Company 4,250,721 3,918,204 8 4,245,069
Non-controlling interest - - - (17)
Profit for the year 4,250,721 3,918,204 8 4,245,052
Earnings per share: Basic/diluted (Rs.) 4.10 342 30.69 28.29 8 30.65
Dividend per share 4.11 343
Dividend per share: Gross (Rs.) 11.00* 9.00 22
Dividend per share: Net (Rs.) 9.74* 8.10 20
*Calculated based on interim dividend paid and proposed final dividend, which is to be approved at the Annual General Meeting.
Accounting policies and notes from pages 324 to 413 form an integral part of these Financial Statements.
SECTION 01
FIN
AN
CIA
L R
EP
OR
TS

318 L B Finance PLC . Annual Report 2017/18
Statement of Comprehensive Income
Company Group
Year ended 31 March 2018 2017 Change 2018
Note Page No. Rs. ‘000 Rs. ‘000 % Rs. ‘000
Profit for the year 4,250,721 3,918,204 8 4,245,052
Other Comprehensive Income that will be reclassified to Income Statement
Net gains/(losses) from translating the Financial Statements of the foreign operations - - - 5,247
Fair value gains and losses arising on re-measuring available for sale financial assets
Equity securities
Fair value gains/(losses) on re-measuring equity securities 3,604 (20,391) >100 3,604
Reclassification adjustment for impairment on equity securities 4,456 5,672 (21) 4,456
Net fair value gains/(losses) on re-measuring equity securities 8,060 (14,719) >100 8,060
Other Comprehensive Income that will be reclassified to Income Statement 8,060 (14,719) >100 13,307
Less: deferred tax charge/(reversal) on above items - - - -
Net Other Comprehensive Income that will be reclassified to the Income Statement 8,060 (14,719) >100 13,307
Other Comprehensive Income that will never be reclassified to Income Statement
Actuarial gains and losses on defined benefit plans 4.32.3 386 (47,807) (4,420) >(100) (47,807)
Less: deferred tax charge/(reversal) on actuarial gains and losses 4.9.1 (b) 341 (13,386) (1,238) >(100) (13,386)
Net Other Comprehensive Income that will never be reclassified to Income Statement (34,421) (3,182) >(100) (34,421)
Other Comprehensive Income for the year, net of tax (26,361) (17,901) (47) (21,114)
Total Comprehensive Income for the year, net of tax 4,224,360 3,900,303 8 4,223,938
Attributable to:
Equity holders of the Company 4,224,360 3,900,303 8 4,223,939
Non-controlling interest - - - (1)
Total Comprehensive Income for the year, net of tax 4,224,360 3,900,303 8 4,223,938
Accounting policies and notes from pages 324 to 413 form an integral part of these Financial Statements.

L B Finance PLC . Annual Report 2017/18 319
Statement of Financial Position
Company GroupAs at 31 March 2018 2017 Change 2018
Note Page No. Rs. ‘000 Rs. ‘000 % Rs. ‘000
AssetsCash and cash equivalents 4.14 356 5,874,375 2,895,085 >100 5,990,295 Financial investments - held for trading 4.15 357 9,682 10,068 (4) 9,682 Loans and receivables 4.16 358 39,855,398 33,488,779 19 39,894,276 Lease rentals receivable and stock out on hire 4.17 360 62,489,686 55,660,963 12 62,489,686 Financial investments - available for sale 4.19 364 121,624 118,021 3 121,624 Other financial assets 4.20 367 6,772,554 6,721,526 1 6,766,710 Other non-financial assets 4.21 368 815,808 305,048 >100 816,463 Investment in Subsidiary 4.22 369 152,915 - 100 - Property, plant and equipment 4.23 369 4,680,619 3,514,356 33 4,681,849 Intangible assets 4.24 376 48,119 49,189 (2) 52,861 Total assets 120,820,780 102,763,035 18 120,823,446
Liabilities Due to banks 4.25 378 22,838,038 23,778,147 (4) 22,838,038 Due to customers 4.26 380 72,943,833 60,401,955 21 72,946,011 Debt instruments issued and other borrowed funds 4.27 381 5,152,832 2,044,216 >100 5,152,832 Other financial liabilities 4.28 382 1,761,418 2,007,402 (12) 1,761,418 Other non-financial liabilities 4.29 383 852,715 673,436 27 853,165 Current tax liabilities 4.30 383 633,058 691,091 (8) 633,058 Deferred tax liabilities 4.31 384 1,058,750 503,488 >100 1,058,750 Post employment benefit liability 4.32 385 231,240 153,621 51 231,240 Total liabilities 105,471,884 90,253,356 17 105,474,512
EquityStated capital 4.33 388 838,282 838,282 - 838,282 Reserves 4.34 388 4,270,522 3,412,318 25 4,275,753 Retained earnings 4.35 389 10,240,092 8,259,079 24 10,234,440 Total equity attributable to equity holders of the Company 15,348,896 12,509,679 23 15,348,475 Non-controlling interest 4.36 389 - - - 459Total equity 15,348,896 12,509,679 23 15,348,934Total liabilities and equity 120,820,780 102,763,035 18 120,823,446
Commitments and contingencies 6.5 411 1,261,981 994,135 27 1,261,981 Net asset value per share (Rs.) 6.6 412 110.81 90.31 23 110.81
I certify that these Financial Statements are in compliance with the requirements of the Companies Act No. 07 of 2007.
T Hasitha Athapattu Chief Financial Officer
The Board of Directors is responsible for these Financial Statements. Approved and signed for and on behalf of the Board of Directors by,
J A S Sumith Adhihetty Mrs. Yogadinusha BhaskaranManaging Director Director
Accounting policies and notes from pages 324 to 413 form an integral part of these Financial Statements.
22 May 2018 Colombo
FIN
AN
CIA
L R
EP
OR
TS

320 L B Finance PLC . Annual Report 2017/18
Statement of Changes in Equity - Company
Stated capital
Retainedearnings
Statutory reserve
Available for sale reserve
Totalequity
Note Page No. Rs. '000 Rs. '000 Rs. '000 Rs. '000 Rs. '000
Balance as at 1 April 2016 838,282 6,970,499 2,641,042 29,496 10,479,319
Net profit for the year - 3,918,204 - - 3,918,204
Other Comprehensive Income, net of tax - (3,182) - (14,719) (17,901)
Total Comprehensive Income for the year, net of tax - 3,915,022 - (14,719) 3,900,303
Transactions with owners, recognised directly in equity, contributions and distributions to owners
Transfers during the year - (756,499) 783,641 (27,142) -
Final dividend for 2015/16 4.11 343 - (1,038,857) - - (1,038,857)
Interim dividend for 2016/17 4.11 343 - (831,086) - - (831,086)
Total transactions with equity holders - (2,626,442) 783,641 (27,142) (1,869,943)
Balance as at 31 March 2017 838,282 8,259,079 3,424,683 (12,365) 12,509,679
Net profit for the year - 4,250,721 - - 4,250,721
Other Comprehensive Income, net of tax - (34,421) - 8,060 (26,361)
Total Comprehensive Income for the year, net of tax - 4,216,300 - 8,060 4,224,360
Transactions with owners, recognised directly in equity, contributions and distributions to owners
Transfers during the year 4.34 388 - (850,144) 850,144 - -
Final dividend for 2016/17 4.11 343 - (415,543) - - (415,543)
Interim dividend for 2017/18 4.11 343 - (969,600) - - (969,600)
Total transactions with equity holders - (2,235,287) 850,144 - (1,385,143)
Balance as at 31 March 2018 838,282 10,240,092 4,274,827 (4,305) 15,348,896
Figures in brackets indicate deductions.
Accounting policies and notes from pages 324 to 413 form an integral part of these Financial Statements.

L B Finance PLC . Annual Report 2017/18 321
Statement of Changes in Equity - Group
Stat
ed
ca
pita
lRe
tain
edea
rnin
gs
Stat
utor
y
re
serv
e A
vaila
ble
for
sa
le re
serv
e
Fore
ign
curr
ency
tran
slat
ion
rese
rve
To
tal e
quity
attr
ibut
able
to
equi
ty h
olde
rs
of th
e co
mpa
ny
N
on-
co
ntro
lling
inte
rest
To
tal
eq
uity
Not
e P
age
No.
Rs
. '00
0Rs
. '00
0Rs
. '00
0Rs
. '000
Rs. '
000
Rs. '
000
Rs. '
000
Rs. '
000
Balan
ce a
s at
1 A
pril 2
017
838
,282
8
,259
,079
3
,424
,683
(1
2,36
5) -
1
2,50
9,67
9 -
12,5
09,6
79
Net p
rofit
for t
he y
ear
-
4,2
45,0
69
-
- -
4
,245
,069
(1
7) 4
,245
,052
O
ther
Com
preh
ensiv
e In
com
e, n
et o
f tax
-
(34,
421)
-
8,0
60
5,2
31
(21,
130)
16
(21,
114)
Tota
l Com
preh
ensiv
e In
com
e
fo
r the
yea
r, ne
t of t
ax -
4
,210
,648
-
8
,060
5
,231
4
,223
,939
(1
) 4
,223
,938
Tr
ansa
ctio
ns w
ith o
wne
rs, r
ecog
nise
d
di
rect
ly in
equ
ity, c
ontri
butio
ns a
nd
di
strib
utio
ns to
ow
ners
Tran
sfer
s du
ring
the
year
4.34
388
-
(850
,144
) 8
50,1
44
- -
-
-
-
Fi
nal d
ivide
nd fo
r 201
6/17
4.11
343
-
(415
,543
) -
-
-
(415
,543
) -
(4
15,5
43)
Inte
rim d
ivide
nd fo
r 201
7/18
4.11
343
-
(969
,600
) -
-
-
(969
,600
) -
(9
69,6
00)
Non-
cont
rollin
g in
tere
st c
ontri
butio
n
for S
ubsid
iary
shar
e iss
ues
4.36
389
-
-
-
- -
-
4
60
460
To
tal t
rans
actio
ns w
ith e
quity
hol
ders
-
(2
,235
,287
) 8
50,1
44
- -
(1
,385
,143
) 4
60
(1,3
84,6
83)
Balan
ce a
s at
31
Mar
ch 2
018
838
,282
1
0,23
4,44
0 4
,274
,827
(4
,305
) 5
,231
1
5,34
8,47
5 45
915
,348
,934
Figu
res
in b
rack
ets
indi
cate
ded
uctio
ns.
Acco
untin
g po
licie
s an
d no
tes
from
pag
es 3
24 to
413
form
an
inte
gral
par
t of t
hese
Fin
anci
al S
tate
men
ts.
FIN
AN
CIA
L R
EP
OR
TS

322 L B Finance PLC . Annual Report 2017/18
Statement of Cash Flows
Accounting Policy
The cash flow statement has been prepared by using ‘The Indirect Method’ in accordance with the Sri Lanka Accounting Standard - LKAS 7 (Statement of cash flows), whereby operating activities, financing activities and investing activities have been recognised. Cash and cash equivalents comprise short term, highly liquid investments that are readily convertible to known amounts of cash and are subject to an insignificant risk of changes in value. The cash and cash equivalents consist of cash in hand, balances with banks, placements with banks, money at call and short notice.
Company Group
Year ended 31 March 2018 2017 2018
Note Page No. Rs. ‘000 Rs. ‘000 Rs. ‘000
Cash flows from/(used in) operating activitiesProfit and Other Comprehensive Income before taxation 6,437,944 5,855,704 6,437,522
Adjustments for - Depreciation of property, plant and equipment 4.23 369 365,599 326,128 365,684 Amortisation of intangible assets 4.24 376 18,636 17,090 19,053 Impairment charges/(reversal) for loans and other losses 4.5 336 667,628 (42,265) 668,005 Gold loan auction losses 2,995 2,200 2,995 Diminution/(appreciation) in value of investments (3,219) 20,968 (3,219)Loss/(profit) on disposal of property, plant and equipment 4.4 335 (4,334) (11,191) (4,334)Provision/(reversal) for defined benefit plans 4.32.1 385 92,496 41,550 92,496 Foreign currency exchange (gain)/loss - - 2,046 Dividend received (1,972) (3,666) (1,972)Interest income on investing activities (955,142) (637,386) (955,142)Notional tax credit on interest on treasury bills and bonds 4.1.9 334 (56,809) (50,263) (56,809)Withholding tax attributed to fixed deposits (47,398) (19,282) (47,398)Net unrealised gains/(losses) arising from translating the Financial Statements of foreign operations - - (5,247)
Operating profit before changes in operating assets and liabilities 6,516,424 5,499,588 6,513,680 (Increase)/decrease in operating assets
(Increase)/decrease in loans and receivables (6,768,837) (7,040,802) (6,808,092)(Increase)/decrease in lease rentals receivable and stock out on hire (7,094,809) (10,523,719) (7,094,809)(Increase)/decrease in other financial assets 131,507 (2,510,968) 137,351 (Increase)/decrease in other non-financial assets (724,702) 354,969 (722,153)
(14,456,841) (19,720,520) (14,487,703)Increase/(decrease) in operating liabilities
Increase/(decrease) in due to customers 12,541,878 7,022,153 12,544,056 Increase/(decrease) in other financial liabilities (245,984) 137,461 (245,984)Increase/(decrease) in other non-financial liabilities 179,279 75,629 179,743
12,475,173 7,235,243 12,477,815 Cash generated from operations 4,534,756 (6,985,689) 4,503,792
Retirement benefit liabilities paid 4.32.1 385 (14,877) (14,788) (14,877)Income tax paid (1,400,524) (1,687,940) (1,400,524)
Net cash from/(used in) operating activities 3,119,355 (8,688,417) 3,088,391
Figures in brackets indicate deductions.
Accounting policies and notes from pages 324 to 413 form an integral part of these Financial Statements.

L B Finance PLC . Annual Report 2017/18 323
Statement of Cash Flows
Company Group
Year ended 31 March 2018 2017 2018
Note Page No. Rs. ‘000 Rs. ‘000 Rs. ‘000
Cash flows from/(used in) investing activitiesAcquisition of property, plant and equipment 4.23 369 (1,537,335) (1,809,158) (1,538,653)Acquisition of intangible assets 4.24 376 (17,566) (31,513) (22,739)
Proceeds from sale of property, plant and equipment 9,807 25,159 9,807
Sale/(purchase) of financial investments - available for sale 2 - 2
Investment in Subsidiary 4.22 369 (152,915) - -
Interest received 772,607 569,545 772,607
Dividend received 1,972 3,666 1,972
Net cash flows from/(used in) investing activities (923,428) (1,242,301) (777,004)
Cash flows from/(used in) financing activities
Net cash flow from syndicated loans and other bank facilities (1,190,197) 8,864,917 (1,190,197)
Net cash flow from debt issued and other borrowings 3,108,615 (557,066) 3,108,615
Capital contribution from non-controlling interest of a newly incorporated Subsidiary 4.36 389 - - 460
Dividends paid 4.11.1 343 (1,385,143) (1,869,943) (1,385,143)
Net cash flows from/(used in) financing activities 533,275 6,437,908 533,735
Net increase/(decrease) in cash and cash equivalents 2,729,202 (3,492,810) 2,845,122
Cash and cash equivalents at the beginning of the year 1,859,817 5,352,627 1,859,817
Cash and cash equivalents at the end of the year 4.14.3 356 4,589,019 1,859,817 4,704,939
Operational cash flows from interest
Interest received 23,211,581 17,842,094 23,213,352
Interest paid 10,454,626 7,910,612 10,454,677
Figures in brackets indicate deductions.
Accounting policies and notes from pages 324 to 413 form an integral part of these Financial Statements.
FIN
AN
CIA
L R
EP
OR
TS

324 L B Finance PLC . Annual Report 2017/18
Notes to the Financial StatementsSECTION 02Corporate Information
2.1 REPORTING ENTITY
L B Finance PLC, is a domiciled, public limited liability Company incorporated in Sri Lanka on 30 May 1971 under the Companies Act No 51 of 1938. The Company was re-registered under the Companies Act No 07 of 2007. It is a Licensed Finance Company registered under the Finance Business Act No 42 of 2011 and amendments thereto. The registered office of the Company is located at No 275/75, Prof. Stanley Wijesundara Mawatha, Colombo 07. The shares of the Company have a primary listing on the Colombo Stock Exchange. The staff strength of the Company as at 31 March 2018 was 3,441 (2017 : 3,221).
Corporate information is presented on page 444 of this Annual Report.
For purposes of this report, ‘L B Finance’, the ‘Company’, ‘we’, ‘our’, ‘us’ or similar references mean L B Finance PLC.
2.2 CONSOLIDATED FINANCIAL STATEMENTS
The Consolidated Financial Statements as at and for the year ended 31 March 2018, comprise the L B Finance PLC (Parent Company) and its Subsidiary (together referred to as the ‘Group’ and individually as ‘Group entities’).
The Company’s parent undertaking is Vallibel One PLC. The Company’s ultimate parent undertaking is Vallibel One PLC, which is incorporated in Sri Lanka. The Company’s ultimate controlling party is Mr. Dhammika Perera.
2.3 PRINCIPAL BUSINESS ACTIVITIES, NATURE OF OPERATIONS OF THE GROUP AND OWNERSHIP BY THE COMPANY IN ITS SUBSIDIARY
L B FINANCE PLC
99.70%
L B MICROFINANCE MYANMAR COMPANY
LIMITED
L B Finance PLC
The Company provides a comprehensive range of financial services encompassing Acceptance of Fixed Deposits, Maintenance of Savings Accounts, Providing Finance Lease, Hire Purchase, Mortgage Loans, Gold Loans, Margin Trading Facilities, Personnel Loans, Factoring and Trade Finance Loans, Micro Finance, Other Credit Facilities and Value Added Services.
There were no significant changes in the nature of the principal activities of the Company during the financial year under review.
L B Microfinance Myanmar Company Limited
L B Microfinance Myanmar Company Limited was incorporated in Myanmar on 22 May 2017 as a 99% (31 March 2018 - 99.70%) owned Subsidiary of L B Finance PLC. The principal business activities include engaging in microfinance lending. A licence was issued by the Myanmar Microfinance Supervisory Committee to operate as a microfinance organisation during the financial year. L B Microfinance Myanmar Company Limited commenced its commercial operations in December 2017.
2.4 APPROVAL OF FINANCIAL STATEMENTS BY DIRECTORS
The Financial Statements of the Group and the Company for the year ended 31 March 2018 (including comparatives for 31 March 2017) were approved and authorized for issue by the Board of Directors in accordance with the resolution of the Directors on 22 May 2018.

L B Finance PLC . Annual Report 2017/18 325
Basis of Preparation
2.5 STATEMENT OF COMPLIANCE
Financial Statements of the Group and the separate Financial Statements of the Company which comprise the Statement of Financial Position, Income Statement, Statement of Comprehensive Income, Statement of Changes in Equity, Statement of Cash Flow, Accounting Policies and Notes, have been prepared and presented in accordance with Sri Lanka Accounting Standards (SLFRSs and LKASs) laid down by the Institute of Chartered Accountants of Sri Lanka (CA Sri Lanka) and in compliance with the requirements of the Companies Act No 07 of 2007. The presentation of these Financial Statements is also in compliance with the requirements of Finance Business Act No 42 of 2011, Listing Rules of the Colombo Stock Exchange and the CBSL guidelines.
These Financial Statements, except for information on cash flows have been prepared following the accrual basis of accounting.
The Group did not adopt any inappropriate accounting treatments, which are not in compliance with the requirements of the SLFRSs and LKASs, regulations governing the preparation and presentation of the Financial Statements.
2.6 RESPONSIBILITIES FOR THE FINANCIAL STATEMENTS
The Board of Directors of the Company is responsible for these Financial Statements of the Group and the Company as per the provisions of the Companies Act No 07 of 2007 and Sri Lanka Accounting Standards.
The Board of Directors acknowledges the responsibility in relation to the Financial Statements, as set out in the ‘Directors’ Responsibility for Financial Reporting’, ‘Annual Report of the Board of Directors’ and in the statement appearing with the
Statement of Financial Position of the Annual Report.
2.7 BASIS OF MEASUREMENT
The Financial Statements of the Group have been prepared on the historical cost basis, except for the following material items in the Statement of Financial Position:
» Financial assets held at fair value through profit or loss (FVTPL) and available for sale (AFS).
» Liabilities for defined benefit obligations are recognized at the present value of the defined benefit obligation.
2.8 GOING CONCERN
The Directors have made an assessment of its ability to continue as a going concern and are satisfied that it has the resources to continue in business for the foreseeable future. Furthermore, Board is not aware of any material uncertainties that may cast significant doubt upon the Group’s ability to continue as a going concern and they do not intend either to liquidate or to cease operations of the Group. Therefore, the Financial Statements continue to be prepared on the going concern basis.
2.9 FUNCTIONAL AND PRESENTATION CURRENCY
The Financial Statements of the Company are presented in Sri Lankan Rupees, which is the currency of the primary economic environment in which L B Finance PLC operates.
Each entity in the Group determines its own functional currency and items included in the Financial Statements of these entities are measured using that Functional Currency. These Financial Statements are presented in Sri Lankan Rupees, the Group’s Functional and Presentation Currency.
The information presented in US Dollars on pages from 416 to 418 does not form part of the Financial Statements and is made available solely for the information of stakeholders.
2.10 PRESENTATION OF FINANCIAL STATEMENTS
Assets and Liabilities of the Group presented in their Statements of Financial Position are grouped by nature and listed in an order that reflects their relative liquidity and maturity pattern. No adjustments have been made for inflationary factors affecting the Financial Statements. An analysis on recovery or settlement within 12 months after the reporting date (current) and more than 12 months after the reporting date (non current) is presented in Note 6.3 on ‘Current and Non Current Analysis of Assets and Liabilities’ to these Financial Statements.
2.11 USE OF MATERIALITY, AGGREGATION, OFFSETTING AND ROUNDING
Materiality and aggregation
In compliance with Sri Lanka Accounting Standard - LKAS 01 (Presentation of Financial Statements), each material class of similar items is presented separately in the Financial Statements. Items of dissimilar nature or functions too are presented separately unless they are immaterial.
Offsetting
Financial assets and financial liabilities are offset and the net amount reported in the Statement of Financial Position only when there is a legally enforceable right to offset the recognized amounts and there is an intention to settle on a net basis, or to realize the assets and settle the liability simultaneously. Income and expenses are not offset in the Income
FIN
AN
CIA
L R
EP
OR
TS

326 L B Finance PLC . Annual Report 2017/18
Statement unless required or permitted by an Accounting Standard.
Rounding
The amounts in the Financial Statements have been rounded off to the nearest Rupees thousands, except where otherwise indicated as permitted by the Sri Lanka Accounting Standard - LKAS 01 (Presentation of Financial Statements).
2.12 COMPARATIVE INFORMATION
The comparative information is reclassified wherever necessary to conform to the current year’s presentation. The details of such reclassification have been provided in Note 6.8.
2.13 SRI LANKA ACCOUNTING STANDARDS ISSUED BUT NOT YET EFFECTIVE AS AT 31 MARCH 2018
The following new accounting standards/amendments have been issued by the Institute of Chartered Accountants of Sri Lanka that have an effective date in the future and have not been applied in preparing these Financial Statements. Those accounting standards will have an effect on the accounting policies currently adopted by the Group and may have an impact on the future Financial Statements. None of those have been adopted by the Group yet.
Sri Lanka Accounting Standard – SLFRS 9 (Financial Instruments)
Sri Lanka Accounting Standard - SLFRS 9 (Financial Instruments) will replace Sri Lanka Accounting Standard - LKAS 39 (Financial Instruments - Recognition and Measurement) for annual periods beginning on or after 1 January 2018 with early adoption permitted. In 2016 the Company set up a multidisciplinary implementation team with members from its Risk, Finance and Operations
teams to prepare for Sri Lanka Accounting Standard - SLFRS 9 (Financial Instruments) implementation. The Project is jointly sponsored by the Chief Financial Officer and Chief Risk Officer.
Classification and measurement
From a classification and measurement perspective, Sri Lanka Accounting Standard - SLFRS 9 (Financial Instruments) requires all financial assets, except equity instruments and derivatives, to be assessed based on a combination of the Company’s business model for managing the assets and the instruments’ contractual cash flow characteristics.
(a) Business model assessment
Company determines its business model at the level that best reflects how it manages the financial assets to achieve its objectives. The Company’s business model is not assessed on an instrument by instrument basis, but at a higher level of aggregated portfolios and is based on observable factors such as;
» How the performance of the business model and the financial asset held within that business model are evaluated and reported to the entity’s key management personnel
» The risks that affect the performance of the business model (and the financial assets held within that business model) and, in particular, the way those risks are managed
» How managers of the business are compensated (for example, whether the compensation is based on the fair value of the assets managed or on the contractual cash flow collected)
» The expected frequency, value and timing of sales
The business model assessment is based on reasonably expected scenarios without taking ‘worst case’ or ‘stress case’ scenarios into account. If cash flows after initial recognition are realized in a way that is different from the Company’s original expectation, the Company does not change the classification of the remaining financial assets held in that business model, but incorporates such information when assessing newly originated or newly purchased financial assets.
(b) Contractual cash flow characteristic test
As the second test of the classification process the Company assesses the contractual terms of the financial asset to identify whether those meet ‘Solely the Payment of Principle and Interest’ (SPPI) criteria.
Principle for the purpose of this test is defined as the fair value of the financial asset at initial recognition which may change over the life of the financial asset (for example, if there are repayments of principle or amortization of the premium/discount).
The most significant elements of interest within a lending arrangement are typically the consideration for the time value of money and credit risk. To make SPPI assessment, the Company applies judgment and considers relevant factors such as currency in which the financial asset is denominated and the period for which the interest rate is set.
In contrast to contractual exposures that introduce a more than deminimis exposure to risk or volatility in the contractual cash flows that are unrelated to a basic lending arrangement do not give rise to contractual cash flows that
Notes to the Financial Statements

L B Finance PLC . Annual Report 2017/18 327
are solely the payment of principle and interest on the amount outstanding. In such cases the financial asset is required to be measured at ‘Fair Value through Profit or Loss’.
Impairment of financial assets
Overview of Expected Credit Loss principle (ECL)
Sri Lanka Accounting Standard - SLFRS 9 (Financial Instruments) principally changes the Company’s loan loss provision method by replacing the incurred loss approach as per Sri Lanka Accounting Standard - LKAS 39 (Financial Instruments - Recognition and Measurment) with a forward looking ECL Approach. ECL allowance is based on credit losses expected to arise over the life of the asset (Lifetime expected credit loss or LTECL), unless there has been no significant increase in credit risk since origination in which case the loss allowance will be 12 month expected credit loss (12mECL).
12mECL is the portion of LTECL that represents the ECL which results from default events of a financial instrument which may arise within 12 months after the reporting date.
The Company has established a policy to perform an assessment, at the end of each reporting period to identify whether a financial instrument’s credit risk has increased significantly since initial recognition. Based on such process Company groups loans into Stage 1, Stage 2, Stage 3 as described below;
Stage 1 : When loans are first recognised, the Company recognises an allowance based on 12mECL. Stage 1 loans also include the facilities which are reclassified from Stage 2 since the credit risk has improved. Assessment of Stage 1 is performed collectively.
Stage 2 : When a loan has shown a significant increase in credit risk since origination, the Company records an allowance for the LTECL. Stage 2 loans also include facilities, which are reclassified from stage 2 since the credit risk has improved. Assessment of stage 2 is performed collectively.
Stage 3 : When a loan is considered to be credit impaired/contain objective evidences of incurred loss, the Company records an allowance for the LTECL. Stage 3 assessment will be performed individually.
Significant increase in credit risk
The Company continuously monitors all assets subject to ECL, in order to determine whether there has been a significant increase in credit risk since initial recognition and whether the instrument or a portfolio of instruments is subject to 12mECL or LTECL. The Company considers an exposure to have a significant increase in credit risk by rebutting the presumption of 30 days and considers 90 days (three months) pass due as the point of significant increase in credit risk.
Individually significant impairment assessment and loans which are not impaired individually
Company will individually assess all significant customer exposures to identify whether there are any indicators of impairment. Loans with objective evidence of incurred losses are classified as Stage 3. Loans which are individually significant but not impaired will be assessed collectively for impairment under either Stage 1 or Stage 2, based on the above specified criteria to identify whether there has been a significant credit deterioration since origination.
While establishing significant credit deterioration, Company will consider the following criteria;
» Other changes in the rates or terms of an existing financial instrument that would be significantly different if the instrument was newly originated
» Significant changes in external market indicators of credit risk for a particular financial instrument or similar financial instrument
» Other information related to the borrower, such as changes in the price of a borrower’s debt/equity instrument
» An actual/expected internal credit rating downgrade for the borrower or decrease in behavioural score used to assess credit risk internally
» Existing or forecast adverse changes in business, financial or economic conditions that are expected to cause a significant change in the borrower’s ability to meet its obligation
» An actual or expected significant change in the operating results of the borrower in relation to actual/expected decline in revenue, increase in operating risk, working capital deficiency, decrease in asset quality, increase in gearing and liquidity management problems
» Significant increase in credit risk on other financial instruments of the same borrower
» An actual or expected significant adverse change in the regulatory, economic or technological environment of the borrower that results in a significant change in the borrower’s ability to meet the debt obligation
Grouping financial assets measured on a collective basis
As explained above, Company calculates ECL either on a collective or individual basis. Asset classes where Company calculates ECL on an individual basis includes all individually significant assets
FIN
AN
CIA
L R
EP
OR
TS

328 L B Finance PLC . Annual Report 2017/18
which belong to Stage 3. All assets which belong to Stage 1 and 2 will be assessed collectively for impairment.
Company groups smaller homogeneous exposures based on a combination of internal and external characteristics such as product type, customer type, days past due etc.
Calculation of ECL
The expected cash shortfalls are calculated by multiplying respective loan level PDs, EADs and LGDs. The cash shortfall is discounted to the Effective Interest Rate (EIR). A cash shortfall is the difference between the cash flows that are due to an entity in accordance with the contract and the cash flows that the entity expects to receive.
PDs and LGDs are adjusted to the forward looking information using statistically quantified variance.
The mechanics of the ECL calculation are outlined below and the key elements are as follows;
» Probability of Default (PD) : PD is an estimate of the likelihood of default over a given time horizon. Hence majority of our client base being retail; we use internal information to estimate the PDs. The client has two credit statuses which can be identified as default or non default (Rebut the presumption of 90 days and consider 150 days (five months) past due as the definition of default). We used Cohort method (CM) to compute the PDs.
» Exposure at Default (EAD) : EAD is the estimate of the exposure at a future default date, taking into account expected changes in the exposure after the reporting date, including repayments of the principle and interest, whether scheduled by contract or otherwise and expected draw downs on committed facilities.
» Loss Given Default (LGD) : LGD is an estimate of the loss arising, where a default occurs at a given time calculated based on historical recovery data. It is usually expressed as a percentage of the EAD.
For all products, Company considers the maximum period over which the credit losses are determined is the contractual life of a financial instrument.
Forward looking information
Company relies on broad range of qualitative/quantitative forward looking information as economic inputs in the Multiple economic factor model developed to forecast the expected Non-Performing Loans.
Compared to existing accounting requirements, Sri Lanka Accounting Standard – SLFRS 9 (Financial Instruments) is expected to require higher impairments earlier in a debt asset’s life and the recognition of losses on off-balance sheet facilities. Together this will result in a higher overall balance sheet impairment requirement. This difference is expected, on transition to Sri Lanka Accounting Standard – SLFRS 9 (Financial Instruments), to be recognised at the time of the implementation. It is anticipated that the impact will be significant to the Company. We have calculated the potential impact of the new requirement based on 31 March 2018 figures. The increase in total balance sheet impairment provision is as follows;
As at 31 March 2018 Rs. ‘000
Total expected loss (SLFRS 9) 990,757
Less - Collective provision for unimpaired loans (LKAS 39) 763,029
Increase in total balance sheet impairment provision 227,728
Amendments to Sri Lanka Accounting Standard - LKAS 28 (Investments in Associates and Joint Ventures)
The amendments address the conflict between Sri Lanka Accounting Standard - SLFRS 10 (Consolidated Financial Statements) and Sri Lanka Accounting Standard - LKAS 28 (Investments in Associates and Joint Ventures) in dealing with the loss of control of a Subsidiary that is sold or contributed to an associate or joint venture. The amendments clarify that the gain or loss resulting from the sale or contribution of assets that constitute a business, as defined in IFRS 3, between an investor and its associate or joint venture, is recognised in full. Any gain or loss resulting from the sale or contribution of assets that do not constitute a business, however, is recognised only to the extent of unrelated investors’ interests in the associate or joint venture. The IASB has deferred the effective date of these amendments indefinitely, but an entity that early adopts the amendments must apply them prospectively. The Group will apply these amendments when they become effective.
Sri Lanka Accounting Standard – SLFRS 15 (Revenue from Contracts with Customers)
Sri Lanka Accounting Standard – SLFRS 15 (Revenue from Contracts with Customers) is effective for periods beginning on or after 1 January 2018 with early adoption permitted. Sri Lanka Accounting Standard – SLFRS 15 (Revenue from Contracts with Customers) defines principles for recognising revenue and will be applicable to all contracts with customers. However, interest and fee income integral to financial instruments and leases will continue to fall outside the scope of Sri Lanka Accounting Standard – SLFRS 15 (Revenue from Contracts with Customers) and will be regulated by the other applicable standards (e.g., SLFRS 9 and SLFRS 16).
Revenue under Sri Lanka Accounting Standard – SLFRS 15 (Revenue from Contracts with Customers) will need to
Notes to the Financial Statements

L B Finance PLC . Annual Report 2017/18 329
be recognised as goods and services are transferred, to the extent that the transferor anticipates entitlement to goods and services. The standard will also specify a comprehensive set of disclosure requirements regarding the nature, extent and timing, as well as any uncertainty of revenue and corresponding cash flows with customers. The Company does not anticipate early adoption of Sri Lanka Accounting Standard – SLFRS 15 (Revenue from Contracts with Customers).
Implementation of the Sri Lanka Accounting Standard – SLFRS 15 (Revenue from Contracts with Customers) is not expected to have an impact on the Financial Statements since majority of our revenue generating instruments meet the definition of financial instruments under Sri Lanka Accounting Standard - SLFRS 9 (Financial Instruments).
Sri Lanka Accounting Standard – SLFRS 16 (Leases)
Sri Lanka Accounting Standard – SLFRS 16 (Leases) provides a single lessee accounting model, requiring leases to recognise assets and liabilities for all leases unless the lease term is 12 months or less or the underlying asset has a low value even though lessor accounting remains similar to current practice. Those currently classified as operating leases will create on balance sheet long term asset and lease creditor. This supersedes: Sri Lanka Accounting Standard – LKAS 17 (Leases), IFRIC 4 (Determining Whether an Arrangement Contains a Lease), SIC 15 (Operating Leases - Incentives) and SIC 27 (Evaluating the Substance of Transactions Involving the Legal form of a Lease). Earlier application is permitted for entities that apply Sri Lanka Accounting Standard – SLFRS 15 (Revenue from Contracts with Customers).
Sri Lanka Accounting Standard – SLFRS 16 (Leases) is effective for annual reporting periods beginning on or after 1 January 2019.
The Group and the Company are assessing the potential financial impact on its Financial Statements from Sri Lanka Accounting Standard – SLFRS 16 (Leases). We expect to have the main impact from the properties which has taken (as a lessee) on long term rent basis.
IFRIC Interpretation 23 : Uncertainty over income tax treatment
This interpretation addresses the accounting for income taxes when tax treatments involve uncertainty that affects the application of Sri Lanka Accounting Standard - LKAS 12 (Income tax) and does not apply to taxes or levies outside the scope of Sri Lanka Accounting Standard - LKAS 12 (Income tax), nor does it specifically include requirements relating to interest and penalties associated with uncertain tax treatments. The interpretation specifically addresses the following;
» Whether an entity considers uncertain tax treatments separately
» The assumptions an entity makes about the examination of tax treatments by taxation authorities
» How an entity determines taxable profit (tax loss), tax bases, unused tax losses, unused tax credits and tax rates
» How an entity considers changes in facts and circumstances. An entity must determine whether to consider each uncertain tax treatment separately or together with one or more other uncertain tax treatments. The approach that better predicts the resolution of the uncertainty should be followed. The interpretation is effective for annual reporting periods beginning on or after 1 January 2019, the Group may need to establish processes and procedures to obtain information that is necessary to apply the interpretation on a timely basis.
2.14 CHANGES IN ACCOUNTING POLICIES
The accounting policies adopted by the Group are consistent with those used in the previous financial year.
2.15 SIGNIFICANT ACCOUNTING ASSUMPTIONS, JUDGEMENTS AND ESTIMATION UNCERTAINTIES
The preparation of Financial Statements of the Group in conformity with Sri Lanka Accounting Standards requires the management to make assumptions, judgements and estimates that affect the application of accounting policies and the reported amounts of assets, liabilities, income and expenses. Due to the inherent uncertainty involved with estimates, actual results may differ from these estimates.
Estimates and underlying assumptions are reviewed on an ongoing basis. Revisions to accounting estimates are recognised in the period in which the estimate is revised and in any future periods affected.
The most significant areas of estimation uncertainties, critical judgments and assumptions in applying accounting policies that have most significant effect on the amounts recognised in the Financial Statements of the Group are as follows;
3.8 Impairment of Non–Financial Assets
4.9 Taxation
4.18 Allowance for Impairment Losses
4.19 Impairment of Financial Investments - Available for Sale
4.22 Investment in Subsidiary
4.23 Useful life time of the Property, Plant and Equipment
4.24 Useful life time of the Intangible Assets
4.31 Deferred Taxation
4.32 Post Employment Benefit Liability
6.5 Commitments and Contingencies
6.9 Events Occuring after the Reporting Date
FIN
AN
CIA
L R
EP
OR
TS

330 L B Finance PLC . Annual Report 2017/18
SECTION 03General Accounting Policies and Notes
Accounting policy relating to each accounting topic is given along with the relevant Note to the Financial Statements. The other significant accounting policies are described below;
3.1 BASIS OF CONSOLIDATION
The Group’s Financial Statements comprise, Consolidated Financial Statements of the Company and its Subsidiary in terms of the Sri Lanka Accounting Standard – SLFRS 10 (Consolidated Financial Statements).
3.1.2 Non-controlling interest
Details of Non-Controlling Interest are given in Note 4.36 to these Financial Statements.
3.1.3 Subsidiary
Details of the Company’s Subsidiary are set out in Note 4.22 to these Financial Statements.
3.1.4 Loss of control
When the Group loses control over a Subsidiary, it derecognises the assets and liabilities of the Subsidiary, and any related Non-Controlling Interest and other components of equity. Any resulting gain or loss is recognised in the Income Statement. Any interest retained in the former Subsidiary is measured at fair value when control is lost. Subsequently, it is accounted for as an Associate or in accordance with the Group’s Accounting Policy for financial instruments depending on the level of influence retained.
3.1.5 Transactions eliminated on consolidation
Intra-group balances, transactions and any unrealised income and expenses (except for foreign currency transaction gains or losses) arising from intra-group transactions are eliminated in preparing the Consolidated Financial Statements. Unrealised gains arising from transactions with equity accounted investees are eliminated against the investment to the extent of the Group’s interest in the investee. Unrealised losses are eliminated in the same way as unrealised gains, but only to the extent that there is no evidence of impairment.
3.2 FOREIGN CURRENCY
3.2.1 Foreign currency transactions and balances
Foreign currency transactions are translated into the functional currency, which is Sri Lankan Rupees, using the exchange rates prevailing at the dates of the transactions. In this regard, the Company’s practice is to use the middle rate of exchange ruling at the date of the transaction.
Monetary assets and liabilities denominated in foreign currencies as at the Reporting date are translated into the functional currency at the middle exchange rate of the functional currency ruling as at the Reporting date. The foreign currency gain or loss on monetary items is the difference between amortised cost in the functional currency as at the beginning of the year adjusted for effective interest and payments during the year and the amortised cost in foreign currency translated at the exchange rate as at the Reporting date.
Non-monetary assets and liabilities denominated in foreign currencies that are measured at fair value are translated into the functional currency at the spot exchange rate at the date that the fair value was determined. Non-monetary items that are measured in terms of historical cost in a foreign currency are translated using the exchange rate as at the date of the transaction.
Foreign currency differences arising on translation are generally recognised in Income Statement. However, foreign currency differences arising from the translation of Available-for-sale equity instruments are recognised in Other Comprehensive Income.
3.2.2 Foreign currency translations
The Group’s Consolidated Financial Statements are presented in Sri Lankan Rupees, which is also the Company’s functional currency. The Financial Statements of the foreign operations of the Company have been translated into the Group’s presentation currency as explained under Note 3.2.3 below.
3.2.3 Foreign operations
The results and financial position of overseas operations that have a functional currency different from the Company’s presentation currency are translated into the Company’s presentation currency as follows;
Assets and liabilities, including goodwill and fair value adjustments arising on acquisition, are translated at the rates of exchange ruling as at the Reporting date.
Income and expenses are translated at the average exchange rate for the period, unless this average rate is not a reasonable approximation of the rate prevailing at the transaction date, in which case income and expenses are translated at the exchange rates ruling at the transaction date.
All resulting exchange differences are recognised in the OCI and accumulated in the Foreign Currency Translation Reserve (Translation Reserve), which is a separate component of Equity, except to the extent that the translation difference is allocated to the Non-Controlling Interest.
When a foreign operation is disposed of such that the control is lost, the cumulative amount in the translation reserve related to that foreign operation is reclassified to the Income Statement as part of the gain or loss on disposal. If the Group disposes of only part of its interest in a Subsidiary that includes a foreign operation while retaining control, then the relevant proportion of the cumulative amount of the translation reserve is reattributed to Non-Controlling Interest.
3.3 PROVISIONS
A provision is recognised if, as a result of a past event, the Group has a present legal or constructive obligation that can be estimated reliably, and it is probable that an outflow of economic benefits will be required to settle the obligation.
The amount recognised is the best estimate of the consideration required to settle the present obligation at the reporting date, taking into account the risks and
Notes to the Financial Statements

L B Finance PLC . Annual Report 2017/18 331
uncertainties surrounding the obligation at that date. Where a provision is measured using the cash flows estimated to settle the present obligation, its carrying amount is determined based on the present value of those cash flows. A provision for onerous contracts is recognised when the expected benefits to be derived by the Group from a contract are lower than the unavoidable cost of meeting its obligations under the contract. The provision is measured as the present value of the lower of the expected cost of terminating the contract and the expected net cost of continuing with the contract.
Before a provision is established, the Group recognises any impairment loss on the assets associated with that contract. The expense relating to any provision is presented in the Income Statement net of any reimbursement.
3.4 OPERATIONAL RISK EVENTS
Provisions for operational risk events are recognised for losses incurred by the Company which do not relate directly to amounts of principal outstanding for loans and advances. The amount recognised as a provision is the best estimate of the expenditure required to settle the present obligation as at the reporting date, taking into account the risks and uncertainties that surround the events and circumstances that affect the provision.
3.5 OTHER TAXES
3.5.1 Economic Service Charge (ESC)
As per provisions of the Economic Service Charge (ESC) Act No 13 of 2006 and subsequent amendments thereto, ESC was payable on Company’s liable turnover at 0.5% and was deductible from income tax payable.
3.5.2 Withholding Tax on Dividends (WHT)
Withholding Tax arises from the distribution of dividends by the Company and is recognised at the time the liability to pay the related dividend is recognised.
3.6 BORROWING COSTS
As per the Sri Lanka Accounting Standard – LKAS 23 (Borrowing Costs), the Group capitalises borrowing costs that are directly attributable to the acquisition, construction or production of a qualifying asset as part of the cost of the asset. A qualifying asset is an asset which takes a substantial period of time to get ready for its intended use or sale. Other borrowing costs are recognised in the Income Statement in the period in which they occur.
3.7 FINANCIAL GUARANTEES AND LOAN COMMITMENTS
Financial Guarantees are contracts that require the Group to make specified payments to reimburse the holder for a loss that it incurs because a specified debtor fails to make payment when it is due in accordance with the terms of a debt instrument. Loan commitments are firm commitments to provide credit under pre-specified terms and conditions.
Liabilities arising from financial guarantees or commitments to provide a loan at a below-market interest rate are initially measured at fair value and the initial fair value is amortised over the life of the guarantee or the commitment. The liability is subsequently carried at the higher of this amortised amount and the present value of any expected payment to settle the liability when a payment under the contract has become probable.
The Group has issued no loan commitment that are measured at FVTPL. The Group recognises a provision in accordance with the Sri Lanka Accounting Standard – LKAS 37 (Provisions, Contingent Liabilities and Contingent Assets), if the contract was considered to be onerous. Liabilities arising from financial guarantees and loan commitments are included within provisions.
Details of Commitments and Contingencies are presented in Note 6.5 to these Financial Statements.
3.8 IMPAIRMENT OF NON–FINANCIAL ASSETS
The Company assess at each reporting date whether there is an indication that an asset may be impaired. If any indication exists, or when annual impairment testing for an asset is required, the Company estimates the asset’s recoverable amount. An asset’s recoverable amount is the higher of an asset’s or Cash Generating Unit’s (CGU’s) fair value less costs to sell and its value in use. Where the carrying amount of an asset or CGU exceeds its recoverable amount, the asset is considered impaired and is written down to its recoverable amount.
In assessing value in use, the estimated future cash flows are discounted to their present value using a pre–tax discount rate that reflects current market assessments of the time value of money and the risks specific to the asset. In determining fair value less costs to sell, an appropriate valuation model is used. These calculations are corroborated by valuation multiples, quoted share prices for publicly traded subsidiaries or other available fair value indicators.
For assets excluding goodwill, an assessment is made at each reporting date as to whether there is any indication that previously recognised impairment losses may no longer exist or may have decreased. If such indication exists, the Company estimates the asset’s or CGU’s recoverable amount. A previously recognised impairment loss is reversed only if there has been a change in the assumptions used to determine the asset’s recoverable amount since the last impairment loss was recognised. The reversal is limited so that the carrying amount of the asset does not exceed its recoverable amount, nor exceeds the carrying amount that would have been determined, net of depreciation, had no impairment loss been recognised for the asset in prior years. Such reversal is recognised in the Income Statement.
FIN
AN
CIA
L R
EP
OR
TS

332 L B Finance PLC . Annual Report 2017/18
SECTION 04Specific Accounting Policies and Notes
4.1 NET INTEREST INCOME
Accounting policy
Revenue is recognised to the extent that it is probable that the economic benefits will flow to the Group and the revenue can be reliably measured. The following specific recognition criteria must also be met before revenue is recognised.
For all financial instruments measured at amortised cost, interest bearing financial assets classified as available for sale and financial instruments designated at fair value through profit or loss, interest income or expense is recorded using the effective interest rate (EIR method). EIR is the rate that exactly discounts estimated future cash payments or receipts through the expected life of the financial instrument or a shorter period, where appropriate, to the net carrying amount of the financial asset or financial liability.
The calculation of EIR takes into account all contractual terms of the financial instrument and includes any fees or incremental costs that are directly attributable to the instrument and are an integral part of the EIR, but not future credit losses.
The carrying amount of the financial asset or financial liability is adjusted if the Group revises its estimates of payments or receipts. The adjusted carrying amount is calculated based on the original EIR and the change in carrying amount is recorded as an impairment charge or reversal to the Income Statement.
Interest income on impaired financial instruments continues to be recognised at original EIR to the unadjusted carrying amount until the financial asset has been classified as fully impaired. Until such the accrued interest added to the unadjusted carrying amount has been impaired to the estimated Loss Given Default (LGD). Discontinuation of interest accrual is discussed in Note 4.18.5 to these Financial Statements. Interest from overdue rentals have been accounted for on a cash received basis.
4.1.1 Income
Company Group
2018 2017 2018
Rs. ‘000 Rs. ‘000 Rs. ‘000
Interest income 23,394,115 17,909,935 23,395,887
Fee and commission income 1,504,188 1,209,340 1,504,599
Net trading income (299) (148) (299)
Other operating income 148,198 244,301 146,152
25,046,202 19,363,428 25,046,339
4.1.2 Interest Income
Company Group
2018 2017 2018
Rs. ‘000 Rs. ‘000 Rs. ‘000
Loans and receivables (Note 4.1.3) 8,251,407 6,349,685 8,253,179
Lease rentals receivable and stock out on hire (Note 4.1.4) 14,083,358 10,853,318 14,083,358
Other financial assets 1,059,350 706,932 1,059,350
23,394,115 17,909,935 23,395,887
Notes to the Financial Statements

L B Finance PLC . Annual Report 2017/18 333
4.1.3 Interest income - loans and receivables
Company Group
2018 2017 2018
Rs. ‘000 Rs. ‘000 Rs. ‘000
Gold loans 4,319,109 3,365,389 4,319,109
Vehicle loans 909,041 966,816 909,041
Medium and short-term loans 989,088 639,946 990,860
Mortgage loans 1,376,270 952,613 1,376,270
Quick loans 6,113 7,620 6,113
Power drafts 540,318 349,279 540,318
Margin trading 4,518 3,490 4,518
Factoring receivable 106,411 64,440 106,411
Real estate loans 539 92 539
8,251,407 6,349,685 8,253,179
4.1.4 Interest income - lease rentals receivable and stock out on hire
Company Group
2018 2017 2018
Rs. ‘000 Rs. ‘000 Rs. ‘000
Lease rentals receivable 13,953,681 10,406,296 13,953,681
Stock out on hire 129,677 447,022 129,677
14,083,358 10,853,318 14,083,358
Company Group
2018 2017 2018
Rs. ‘000 Rs. ‘000 Rs. ‘000
4.1.5 Interest income from Sri Lanka Government Securities 568,092 502,635 568,092
4.1.6 Interest expenses
Company Group
2018 2017 2018
Rs. ‘000 Rs. ‘000 Rs. ‘000
Due to banks 2,589,652 1,888,152 2,589,652
Due to customers 8,487,449 5,878,599 8,487,501
Debt issued and other borrowed funds 421,307 345,586 421,307
11,498,408 8,112,337 11,498,460
FIN
AN
CIA
L R
EP
OR
TS

334 L B Finance PLC . Annual Report 2017/18
4.1.7 Interest expenses (Product-wise breakdown)
Company Group
2018 2017 2018
Rs. ‘000 Rs. ‘000 Rs. ‘000
Bank overdrafts 663 4,532 663
Syndicated loans and other bank facilities 2,588,989 1,883,619 2,588,989
Fixed deposits 8,268,964 5,674,988 8,268,964
Certificates of deposit 10,990 15,373 10,990
Savings deposits 207,495 188,239 207,547
Unsecured debentures 421,307 345,586 421,307
11,498,408 8,112,337 11,498,460
Company Group
2018 2017 2018
Rs. ‘000 Rs. ‘000 Rs. ‘000
4.1.8 Net interest income 11,895,707 9,797,598 11,897,427
4.1.9 Notional tax credit for withholding tax on Government Securities on secondary market transactions - Company
The Inland Revenue Act No 10 of 2006 and the amendments thereto, provided that a Company which derives interest income from the secondary market transactions in Government Securities would be entitled to a notional tax credit (being one-ninth of the net interest income) provided such interest income forms part of the statutory income of the Company for that year of assessment.
Accordingly, the net interest income earned from the secondary market transactions in Government Securities for the year, has been grossed up in these Financial Statements with the resulting notional tax credit amounted to Rs. 56,809,154/- (2017 - Rs. 50,263,497/-).
4.2 FEE AND COMMISSION INCOME
Accounting policy
The Group earns fee and commission income from a diverse range of services it provides to its customers. These fees include credit-related fees and commission income. All fees and commissions are recognised to the Income Statement on an accrual basis. Fee and commission income that are integral to the EIR of a financial asset or financial liability are capitalised and included in the measurement of the EIR and recognised in the Income Statement over the expected life of the instrument.
Company Group
2018 2017 2018
Rs. ‘000 Rs. ‘000 Rs. ‘000
Credit-related fees and commissions 924,436 736,196 924,847
Service charge 579,752 473,144 579,752
1,504,188 1,209,340 1,504,599
Notes to the Financial Statements

L B Finance PLC . Annual Report 2017/18 335
4.3 NET TRADING INCOME
Accounting policy
Net trading income includes all gains and losses from changes in fair value and related dividends for financial assets and financial liabilities ‘held for trading’ other than interest income.
Dividend income received from financial investments - held for trading is recognised when the Group’s right to receive the payment is established.
Company Group
2018 2017 2018
Rs. ‘000 Rs. ‘000 Rs. ‘000
Dividend income from financial investments - held for trading 86 430 86
Appreciation/(depreciation) in market value of financial investments - held for trading (385) (578) (385)
(299) (148) (299)
4.4 OTHER OPERATING INCOME
Accounting policy
Income earned on other sources, which are not directly related to the normal operations of the Group is recognised as Other Operating Income on an accrual basis.
Dividend income received from financial investments - available for sale is recognised when the Group’s right to receive the payment is established.
The profit/(loss) on disposal of property, plant and equipment is determined as the difference between the carrying amount of the assets at the time of disposal and the proceeds of disposal, net of incremental disposal costs. This is recognised as an item of ‘Other Operating Income’ in the year in which significant risks and rewards of ownership are transferred to the buyer.
Income on operating leases are accounted for on a straight-line basis over the periods of the leases.
Company Group
2018 2017 2018
Rs. ‘000 Rs. ‘000 Rs. ‘000
Dividend income from financial investments - available for sale 1,886 3,236 1,886
Reclassification adjustment for impairment on equity securities (4,456) (5,672) (4,456)
Profit/(loss) on disposal of property, plant and equipment 4,334 11,191 4,334
Real estate income (net of cost) 3,291 200,103 3,291
Income on operating lease 122,422 16,889 122,422
Sundry income 20,721 18,554 18,675
148,198 244,301 146,152
FIN
AN
CIA
L R
EP
OR
TS

336 L B Finance PLC . Annual Report 2017/18
4.5 IMPAIRMENT CHARGE/(REVERSAL) FOR LOANS AND OTHER LOSSES
Accounting policy
The Group recognises the changes to the impairment provision for loans and other losses which are assessed as per the Sri Lanka Accounting Standard - LKAS 39 (Financial Instruments: Recognition and Measurement). The methodology adopted by the Group is explained in the Note 4.18 to these Financial Statements. Recovery of amounts written-off as bad and doubtful debts is recognised on a cash basis.
Company Group
2018 2017 2018
Rs. ‘000 Rs. ‘000 Rs. ‘000
Loans and receivables (Note 4.18.1) 415,476 6,290 415,853
Lease rentals receivable and stock out on hire (Note 4.18.1) 364,809 94,016 364,809
Other losses 2,318 (8,848) 2,318
Recovery of written-off debts (114,975) (133,723) (114,975)
667,628 (42,265) 668,005
4.5.1 Impairment charge/(reversal) for loans and other losses (Detailed breakdown) - Company
2018
Direct write offs
Charge for the year
Reversal for the year
Net amount
Rs. '000 Rs. '000 Rs. '000 Rs. '000
Loans and receivables 19,947 527,229 (131,700) 415,476
Lease rentals receivable and stock out on hire 5,124 729,999 (370,314) 364,809
Other losses - 5,271 (2,953) 2,318
25,071 1,262,499 (504,967) 782,603
Recovery of written-off debts (114,975)
667,628
2017
Direct write offs
Charge for the year
Reversal for the year
Net amount
Rs. '000 Rs. '000 Rs. '000 Rs. '000
Loans and receivables 12,090 194,234 (200,034) 6,290
Lease rentals receivable and stock out on hire 7,546 501,664 (415,194) 94,016
Other losses - - (8,848) (8,848)
19,636 695,898 (624,076) 91,458
Recovery of written-off debts (133,723)
(42,265)
Notes to the Financial Statements

L B Finance PLC . Annual Report 2017/18 337
4.5.2 Impairment charge/(reversal) for loans and other losses (Detailed breakdown) - Group
2018
Direct Write Offs
Charge for the Year
Reversal for the Year
Net amount
Rs. '000 Rs. '000 Rs. '000 Rs. '000
Loans and receivables 19,947 527,606 (131,700) 415,853 Lease rentals receivable and stock out on hire 5,124 729,999 (370,314) 364,809 Other losses - 5,271 (2,953) 2,318
25,071 1,262,876 (504,967) 782,980 Recovery of written-off debts (114,975)
668,005
4.6 PERSONNEL EXPENSES
Accounting policy
Personnel expenses include salaries and bonus, terminal benefits and other staff-related expenses. The provision for bonus is recognised when it is probable that an outflow of resource embodying economic benefits will be required to settle the obligation and a reliable estimate can be made on the amount of the obligation.
Defined contribution plans - Employees’ Provident Fund and Employees’ Trust Fund - Company
A defined contribution plan is a post-employment benefit plan under which an entity pays fixed contributions into a separate entity (a fund) and will have no legal or constructive obligation to pay further contributions if the fund does not hold sufficient assets to pay all employee benefits relating to employee services in the current and prior periods as defined in the Sri Lanka Accounting Standard - LKAS 19 (Employee Benefits).
The contribution payable to a defined contribution plan is in proportion to the services rendered to the Company by the employees and is recorded as an expense when they become due. Unpaid contributions are recorded as a liability.
The Company and the employees contribute 15% and 10% respectively on the salary of each employee to the Employees’ Provident Fund.
The Company contributes 3% of the salary of each employee to the Employees’ Trust Fund.
Defined benefit plans - Company
A defined benefit plan is a post employment benefit plan other than a defined contribution plan. Accordingly, staff gratuity was considered as Defined Benefit Plan as per Sri Lanka Accounting Standard - LKAS 19 (Employee Benefits).
Company Group2018 2017 2018
Rs. ‘000 Rs. ‘000 Rs. ‘000
Salaries and other related expenses 2,034,887 1,798,757 2,037,703 Employer’s contribution to Employees' Provident Fund 188,583 162,964 188,583 Employer’s contribution to Employees' Trust Fund 37,717 32,593 37,717 Gratuity charge/(reversal) for the year 44,689 37,130 44,689 Staff training 8,565 8,046 8,565 Staff welfare expenses 78,817 68,625 78,817 Amortisation of staff loan day 01 difference 4,661 2,290 4,661
2,397,919 2,110,405 2,400,735
FIN
AN
CIA
L R
EP
OR
TS

338 L B Finance PLC . Annual Report 2017/18
4.7 OTHER OPERATING EXPENSES
Accounting policy
Other operating expenses are recognised in the Income Statement on the basis of a direct association between the cost incurred and the earnings of the specific items of the income. All the expenditure incurred in the running of the business and in maintaining the property, plant and equipment in a state of efficiency has been charged to the Income Statement in arriving at the profit for the year.
Company Group2018 2017 2018
Rs. ‘000 Rs. ‘000 Rs. ‘000
Directors' emoluments 16,399 17,738 16,399 Auditors' remuneration 2,950 2,750 2,950 Audit-related expenses 2,597 2,461 2,597 Non-audit fees to auditors 1,045 790 1,045 Professional and legal expenses 46,025 48,057 46,025 Deposit insurance premium 93,017 74,336 93,017 General insurance expenses 152,248 118,501 152,248 Office administration and establishment expenses 1,344,162 1,138,865 1,346,221 Advertising and business promotional expenses 579,039 493,479 579,039 Crop insurance levy expenses 43,152 38,612 43,152
2,280,634 1,935,589 2,282,693
Crop insurance levy
As per provisions of the section 14 of the Finance Act No 12 of 2013, the crop insurance levy was introduced with effect from 1 April 2013 and was payable to the National Insurance Trust Fund. Currently, the crop insurance levy is payable at 1% of profit after tax.
Directors’ emoluments
Directors’ emoluments include fees paid to Non-Executive Directors. Remunerations paid to Executive Directors are included under Salaries and other related expenses in Note 4.6.
Notes to the Financial Statements

L B Finance PLC . Annual Report 2017/18 339
4.8 TAX ON FINANCIAL SERVICES
Accounting policy
Tax on Financial Services include Value Added Tax on Financial Services and Nation Building Tax on Financial Services.
Value Added Tax (VAT) on financial services
VAT on Financial Services is calculated in accordance with Value Added Tax Act No 14 of 2002 and subsequent amendments thereto. The base for the computation of Value Added Tax on Financial Services is the accounting profit before VAT and NBT on Financial Services and income tax adjusted for the economic depreciation and emoluments payable to employees including cash benefits, non-cash benefits and provisions relating to terminal benefits.
VAT rate applied for the financial year ended 31 March 2018 was 15%.
VAT rates applied during the financial year ended 31 March 2017 were as follows;
Period Rate
1 April 2016 - 1 May 2016 11%
2 May 2016 - 11 July 2016 15%
12 July 2016 - 31 October 2016 11%
1 November 2016 - 31 March 2017 15%
Nation Building Tax (NBT) on financial services
As per provisions of the Nation Building Tax Act (NBT) No 9 of 2009 and amendments thereto, NBT on Financial Services was payable at 2% on Company’s value additions attributable to Financial Services with effect from 1 January 2014. The value addition attributable to Financial Service is same as the value using to calculate VAT on Financial Services.
Company Group2018 2017 2018
Rs. ‘000 Rs. ‘000 Rs. ‘000
Value Added Tax on financial services 1,179,435 896,389 1,179,435 Nation Building Tax on financial services 157,258 130,712 157,258
1,336,693 1,027,101 1,336,693
FIN
AN
CIA
L R
EP
OR
TS

340 L B Finance PLC . Annual Report 2017/18
4.9 TAXATION
Accounting policy
As per Sri Lanka Accounting Standard - LKAS 12 (Income Taxes), tax expense is the aggregate amount included in determination of profit or loss for the period in respect of current and deferred taxation. Income tax expense is recognised in the Income Statement except to the extent it relates to items recognised directly in ‘Equity’ or ‘Other Comprehensive Income (OCI)’, in which case it is recognised in Equity or in OCI.
Current taxation
Current tax assets and liabilities consist of amounts expected to be recovered from or paid to the Commissioner General of Inland Revenue in respect of the current year and any adjustment to tax payable in respect of prior years. The tax rates and tax laws used to compute the amount are those that are enacted or substantially enacted by the reporting date. Accordingly, provision for taxation is based on the profit for the year adjusted for taxation purposes in accordance with the provisions of the Inland Revenue Act No 10 of 2006 and the amendments thereto at the rates specified in Note 4.9.2 to the Financial Statements.
Accounting estimates
The Group is subject to income taxes and other taxes. Significant judgment was required to determine the total provision for current, deferred and other taxes. Uncertainties exist, with respect to the interpretation of the applicability of tax laws, at the time of the preparation of these Financial Statements. The Company recognized assets and liabilities for current, deferred and other taxes based on estimates of whether additional taxes will be due. Where the final tax outcome of these matters is different from the amounts that were initially recorded, such differences will impact the income, deferred and other tax amounts in the period in which the determination is made.
Deferred taxation
Detailed disclosure of accounting policies and estimate of deferred tax is available in Note 4.31 to the Financial Statements.
4.9.1 The major components of income tax expenses for the years ended 31 March are as follows;
Company Group
2018 2017 2018
Rs. ‘000 Rs. ‘000 Rs. ‘000
4.9.1 (a) Income Statement
Current income tax
Income tax for the year 1,633,990 1,563,183 1,633,990
Under/(over) provision of current taxes in respect of previous years 24,331 31,872 24,331
Deferred tax
Deferred taxation charge/(reversal) (Note 4.31) 568,648 361,584 568,648
2,226,969 1,956,639 2,226,969
Notes to the Financial Statements

L B Finance PLC . Annual Report 2017/18 341
Company Group
2018 2017 2018
Rs. ‘000 Rs. ‘000 Rs. ‘000
4.9.1 (b) Other Comprehensive Income
Deferred tax
Deferred taxation charge/(reversal) (Note 4.31) (13,386) (1,238) (13,386)
(13,386) (1,238) (13,386)
4.9.1 (c) Total tax expense for the financial year 2,213,583 1,955,401 2,213,583
4.9.2 Reconciliation of accounting profit and taxable income
A reconciliation between the tax expense and the accounting profit multiplied by relevant tax rate for the years ended 31 March is as follows;
Company Group
2018 2017 2018
Rs. ‘000 Rs. ‘000 Rs. ‘000
Accounting profit before income taxation Tax rate 6,477,690 5,874,843 6,472,021
Income tax expense at the statutory income
L B Finance PLC 28% 1,813,753 1,644,956 1,813,753
L B Microfinance Myanmar Company Limited 25% - - -
Tax effect of non-deductible expenses 391,012 283,972 391,012
Tax effect of allowable credits (1,575) (3,134) (1,575)
Tax effect of exempt income (552) (1,027) (552)
Adjustments of taxes in respect of prior years 24,331 31,872 24,331
2,226,969 1,956,639 2,226,969
Charge/(reversal) for deferred tax 568,648 361,584 568,648
Effective tax rate 34.38% 33.31% 34.41%
Effective tax rate (excluding deferred tax ) 25.60% 27.15% 25.62%
Accounting profit before tax on financial services 7,814,383 6,901,944 7,808,714
Effective tax rate (excluding tax on financial services) 28.50% 28.35% 28.52%
4.9.3 income tax expense/refund of the Company and its subsidiary have been recorded for on the taxable income at rates shown below;
2018 2017
L B Finance PLC 28% 28%
L B Microfinance Myanmar Company Limited 25% -
FIN
AN
CIA
L R
EP
OR
TS

342 L B Finance PLC . Annual Report 2017/18
4.9.4 Summary of the taxes paid during the year
Company Group
2018 2017 2018
Rs. ‘000 Rs. ‘000 Rs. ‘000
Direct taxes
Income tax 1,400,524 1,687,940 1,400,524
Value added tax on financial services 1,199,539 803,195 1,199,539
Nation building tax on financial services 156,343 125,598 156,343
Crop insurance levy 53,570 40,681 53,570
Economic service charge 118,364 69,956 118,364
2,928,340 2,727,370 2,928,340
Indirect taxes (collected and paid)
Value added tax 330,323 413,938 330,323
Nation building tax 32,017 27,469 32,017
Stamp duty 315,992 291,797 315,992
Withholding tax on dividend and interest 329,024 261,726 329,024
Paye tax 77,908 66,169 77,908
1,085,264 1,061,099 1,085,264
Total taxes paid during the financial year 4,013,604 3,788,469 4,013,604
4.10 EARNINGS PER ORDINARY SHARE
Accounting policy
The Group presents Basic and Diluted Earnings Per Share (EPS) data for its ordinary shares. Basic earnings per share is calculated by dividing the net profit for the year attributable to ordinary shareholders by weighted average number of ordinary shares outstanding during the year, as per the Sri Lanka Accounting Standard - LKAS 33 (Earnings Per Share).
Diluted EPS is determined by adjusting the profit or loss attributable to the ordinary shareholders and the weighted average number of ordinary shares outstanding for the effects of all potentially dilutive ordinary shares, which comprise share options granted to employees. The Group does not have any potentially dilutive shares.
4.10.1 Income and share details used in the basic earning per share computation
Company Group
2018 2017 2018
Amounts used as the numerators:
Profit after tax for the year attributable to equity holders (Rs. ‘000) 4,250,721 3,918,204 4,245,069
Number of ordinary shares used as denominators for basic earnings per share
Weighted average number of ordinary shares in issue 138,514,284 138,514,284 138,514,284
Basic/diluted earnings per ordinary share (Rs.) 30.69 28.29 30.65
Notes to the Financial Statements

L B Finance PLC . Annual Report 2017/18 343
4.10.2 The Diluted earnings per ordinary share is equal to the basic earnings per ordinary share since the Company and the Group does not have any convertible securities as at the reporting date.
4.10.3 There have been no transactions involving ordinary shares or potential ordinary shares between the reporting date and the date of the completion of these Financial Statements which would require the restatement of EPS.
4.11 DIVIDEND PAID AND PROPOSED
Accounting policy
Provision for final dividends is recognized at the time the dividend recommended and declared by the Board of Directors, is approved by the shareholders. Interim dividends payable is recognised when the Board approves such dividend in accordance with the Companies Act No 7 of 2007.
Dividends for the year that are declared after the reporting date are disclosed in Note 6.9 to the Financial Statements as an event after the reporting period in accordance with the Sri Lanka Accounting Standard - LKAS 10 (Events Occurring after the Reporting Period).
Company
2018 2017
Rs. ‘000 Rs. ‘000
4.11.1 Declared and paid during the year
Dividends on ordinary shares:
Final dividend for 2017 - Rs. 3.00 per share (First and final dividend for 2016 - Rs. 7.50 per share) 415,543 1,038,857
Interim dividend for 2018 - Rs. 7.00 Per share (Interim dividend for 2017 - Rs. 6.00 per share) 969,600 831,086
1,385,143 1,869,943
4.11.2 Proposed for approval at Annual General Meeting
(not recognised as a liability as at 31 March)
Dividends on ordinary shares:
Final dividend for 2018 - Rs. 4.00 per share (Final dividend for 2017 - Rs. 3.00 per share) 554,057 415,543
4.12 FINANCIAL INSTRUMENTS
Accounting policy
Date of recognition
All financial assets and liabilities are initially recognized on the trade date, i.e., the date that the Group becomes a party to the contractual provisions of the instrument. This includes ’regular way trades’. Regular way trades means purchases or sales of financial assets that require delivery of assets within the time frame generally established by regulation or convention in the market place.
Classification and initial measurement of financial instruments
The classification of financial instruments at the initial recognition depends on their purpose and characteristics and the management’s intention in acquiring them. All financial instruments are measured initially at their fair value plus transaction costs that are directly attributable to acquisition or issue of such financial instruments except in the case of financial assets and financial liabilities at fair value through profit and loss as per the Sri Lanka Accounting Standard - LKAS 39 (Financial Instruments: Recognition and Measurement). Transaction costs in relation to financial assets and financial liabilities at fair value through profit and loss are dealt with through Income Statement.
FIN
AN
CIA
L R
EP
OR
TS

344 L B Finance PLC . Annual Report 2017/18
‘Day 1’ profit or loss
When the transaction price differs from the fair value of other observable current market transactions in the same instrument, or based on a valuation technique whose variables include only data from observable markets, the Group immediately recognises the difference between the transaction price and fair value (a ‘Day 1’ profit or loss) in ‘net trading income’.
Classification and subsequent measurement of financial assets
Financial assets held for trading and available for sale financial investments are subsequently measured at fair value. Changes in fair value of financial assets held for trading are recognized in ‘net trading income’. Unrealised gains and losses from available for sale financial investments are recognised directly in equity through ‘Other Comprehensive Income’ in the ‘available for sale reserve’. When the investment is disposed of, the cumulative gain or loss previously recognised in equity is recognised in the Income Statement in ‘other operating income’. Where the Group holds more than one investment in the same security, they are deemed to be disposed of on a weighted average basis. Interest earned whilst holding ‘available for sale financial investments’ is reported as ‘interest income’ using the effective interest rate (EIR).
Financial assets classified under loans and advances are substantially measured at amortised cost using the EIR method. Amortised cost is calculated by taking into account any discount or premium on the issue and costs that are an integral part of the EIR. The EIR amortisation is included in ‘interest income’ in the Income Statement.
Classification and subsequent measurement of financial liabilities
At the inception the Group determines the classification of its financial liabilities. Accordingly, all financial liabilities are classified as financial liabilities at amortised cost.
Financial Instruments issued by the Group that are not designated at fair value through profit or loss, are classified as liabilities under ‘due to banks’, ‘due to customers’, ‘debt issued and other borrowed funds’ and other financial liabilities as appropriate, where the substance of the contractual arrangement results in the Group having an obligation either to deliver cash or another financial asset to the holder, or to satisfy the obligation other than by the exchange of a fixed amount of cash or another financial asset for a fixed number of own equity shares at amortised cost using the EIR method.
After initial recognition, such financial liabilities are substantially measured at amortised cost using the EIR method. Amortised cost is calculated by taking into account any discount or premium on the issue and costs that are an integral part of the EIR. The EIR amortisation is included in ‘interest expenses’ in the Income Statement. Gains and losses are recognised in the Income Statement when the liabilities are derecognised as well as through the EIR amortisation process.
Reclassification of financial instruments
The Group does not reclassify any financial instrument into the ‘fair value through profit or loss’ category after initial recognition. Also the Group does not reclassify any financial instrument out of the ‘fair value through profit or loss’ category if upon initial recognition it was designated as at fair value through profit or loss.
The Group reclassifies non-derivative financial assets out of the ‘held for trading’ category and into the ‘available for sale’, ‘loans and receivables’, or ’held-to-maturity’ categories as permitted by the Sri Lanka Accounting Standard - LKAS 39 (Financial Instruments: Recognition and Measurement). In certain circumstances the Group is also permitted to reclassify financial assets out of the ‘available for sale’ category and into the ’loans and receivables’, ‘held for trading’ or ‘held-to-maturity’ category. Reclassifications are recorded at fair value at the date of reclassification, which becomes the new amortised cost.
For a financial asset reclassified out of the ’available for sale’ category, any previous gain or loss on that asset that has been recognised in equity is amortised to profit or loss over the remaining life of the investment using the effective interest rate (EIR). Any difference between the new amortised cost and the expected cash flows is also amortised over the remaining life of the asset using the EIR. If the asset is subsequently determined to be impaired, then the amount recorded in equity is recycled to the Income Statement.
Reclassification is at the election of management, and is determined on an instrument by instrument basis. The Group has not reclassified any financial assets during the year.
Notes to the Financial Statements

L B Finance PLC . Annual Report 2017/18 345
Derecognition of financial instruments
A financial asset (or, where applicable a part of a financial asset or part of a group of similar financial assets) is derecognised when the rights to receive cash flows from the asset have expired. A financial liability is derecognised when the obligation under the liability is discharged, cancelled or expires.
Where an existing financial liability is replaced by another from the same lender on substantially different terms, or the terms of an existing liability are substantially modified, such an exchange or modification is treated as a derecognition of the original liability and the recognition of a new liability. The difference between the carrying value of the original financial liability and the consideration paid is recognised in the Income Statement.
Offsetting of financial instruments
Financial assets and financial liabilities are offset and the net amount presented in the Statement of Financial Position when, and only when, the Group has a legal right to set off the recognised amounts and it intends either to settle on a net basis or to realise the asset and settle the liability simultaneously.
Income and expenses are presented on a net basis only when permitted under LKASs/SLFRSs, or for gains and losses arising from a group of similar transactions such as in the Group’s trading activity.
During the year Group has not offset any financial assets and financial liabilities in the Statement of Financial Position.
Offsetting of financial instruments based on the rights of set off relating to the financial instruments and cash collateral is as follows;
Company & Group
As at 31 March 2018 Gross amounts
Gross amounts set off on the statement of financial position
Net amounts presented on the statement of financial position
Cash collateral
Financial instrument collateral
Net amount
Rs. ‘000 Rs. ‘000 Rs. ‘000 Rs. ‘000 Rs. ‘000 Rs. ‘000
Financial assets
Lease rentals receivable and stock out on hire 62,489,686 - 62,489,686 - 26,511,882 35,977,804
Financial liabilities
Due to customers 72,943,833 - 72,943,833 - 2,579,869 70,363,964
Company
As at 31 March 2017 Gross amounts
Gross amounts set off on the statement of financial position
Net amounts presented on the statement of financial position
Cash collateral
Financial instrument collateral
Net amount
Rs. ‘000 Rs. ‘000 Rs. ‘000 Rs. ‘000 Rs. ‘000 Rs. ‘000
Financial assets
Lease rentals receivable and stock out on hire 55,660,963 - 55,660,963 - 28,007,463 27,653,500
Financial liabilities
Due to customers 60,401,955 - 60,401,955 - 1,911,853 58,490,102
The financial instruments and cash collateral amounts have been recorded at amortised cost. The rights of set off relating to the financial instruments and cash collateral are conditional upon the default of the counterparty.
FIN
AN
CIA
L R
EP
OR
TS

346 L B Finance PLC . Annual Report 2017/18
4.13 FAIR VALUE MEASUREMENT
Accounting policy
Fair value is the price that would be received to sell an asset or paid to transfer a liability in an orderly transaction between market participants at the measurement date. The fair value measurement is based on the presumption that the transaction to sell the asset or transfer the liability takes place either:
01. In the principal market for the asset or liability; or
02. In the absence of a principal market, in the most advantageous market for the asset or liability.
The principal or the most advantageous market must be accessible by the Group.
The fair value of an asset or a liability is measured using the assumptions that market participants would use when pricing the asset or liability, assuming that market participants act in their economic best interest. A fair value measurement of a non-financial asset takes into account a market participant’s ability to generate economic benefits by using the asset in its highest and best use or by selling it to another market participant that would use the asset in its highest and best use. The Group uses various valuation methodologies that are appropriate in the circumstances and for which sufficient data is available to measure fair value, maximising the use of relevant observable inputs and minimising the use of unobservable inputs. The use of observable and unobservable inputs and their significance in measuring fair value are reflected in our fair value hierarchy assessment.
Level 1 : Inputs include quoted prices for identical instruments.
Level 2 : Inputs include quoted prices for similar instruments and observable inputs such as interest rates, currency exchange rates and yield curves.
Level 3 : Inputs include data not observable in the market and reflect management judgment about the assumptions market participants would use in pricing the instruments.
Valuation framework
The Company has an established control framework for the measurement of fair values. The Finance Department is responsible for the valuation of financial instruments. Obtaining input data, valuing of financial instruments and verifying the valuation models are being segregated within the finance department.
We review the inputs to the fair value measurements to ensure they are appropriately categorized within the fair value hierarchy. Transfers into and transfers out of the hierarchy levels are recognized as if they had taken place at the end of the reporting period.
Notes to the Financial Statements

L B Finance PLC . Annual Report 2017/18 347
4.13.1 Fair value measurement hierarchy - financial assets measured at fair value - Company & Group
As at 31 March 2018 2017
Fair value measurement using Fair value measurement using
Quoted prices in active markets
Significant observable inputs
Significant unobservable inputs
Total fair value
Quoted prices in active markets
Significant observable inputs
Significant unobservable inputs
Total fair value
Note Level 1 Level 2 Level 3 Level 1 Level 2 Level 3
Rs. ‘000 Rs. ‘000 Rs. ‘000 Rs. ‘000 Rs. ‘000 Rs. ‘000 Rs. ‘000 Rs. ‘000
Financial investments held for trading 4.15
Quoted equities 9,682 - - 9,682 10,068 - - 10,068
Financial investments available for sale 4.19
Quoted equities 121,319 - - 121,319 117,716 - - 117,716
Unquoted equities - - 305 305 - - 305 305
121,319 - 305 121,624 117,716 - 305 118,021
There were no transfers into and transfers out of the hierarchy levels during 2017 and 2018.
Details of valuation methodologies and assumptions are disclosed in the relevant Note to the Financial Statements.
FIN
AN
CIA
L R
EP
OR
TS

348 L B Finance PLC . Annual Report 2017/18
4.13.2 Fair value measurement hierarchy - financial assets and liabilities measured at amortised cost
4.13.2 (a) Financial assets measured at amortised cost - Company
As at 31 March 2018 2017
Fair value measurement using Fair value measurement using
Quoted prices in active markets
Significant observable inputs
Significant unobservable inputs
Total fair value
Carrying value at amortised cost
Quoted prices in active markets
Significant observable inputs
Significant unobservable inputs
Total fair value
Carrying value at amortised cost
Note Level 1 Level 2 Level 3 Level 1 Level 2 Level 3
Rs. ‘000 Rs. ‘000 Rs. ‘000 Rs. ‘000 Rs. ‘000 Rs. ‘000 Rs. ‘000 Rs. ‘000 Rs. ‘000 Rs. ‘000
Cash and cash equivalents 4.14
Notes and coins held 793,796 - - 793,796 793,796 740,728 - - 740,728 740,728
Balances with banks 1,861,273 - - 1,861,273 1,861,273 1,091,593 - - 1,091,593 1,091,593
Treasury bills repurchase agreements - 3,219,306 - 3,219,306 3,219,306 - 1,062,764 - 1,062,764 1,062,764
2,655,069 3,219,306 - 5,874,375 5,874,375 1,832,321 1,062,764 - 2,895,085 2,895,085
Loans and receivables (net of allowance for impairment losses)
4.16
Gold loans - - 20,108,243 20,108,243 20,108,243 - - 16,267,505 16,267,505 16,267,505
Vehicle loans - - 4,017,216 4,017,216 4,054,552 - - 4,189,209 4,189,209 4,184,086
Medium and short-term loans - - 5,522,094 5,522,094 5,558,771 - - 4,309,221 4,309,221 4,343,401
Mortgage loans - - 7,004,345 7,004,345 6,962,770 - - 5,986,998 5,986,998 6,189,501
Quick loans - - 7,673 7,673 9,624 - - 17,714 17,714 17,706
Power drafts - - 2,599,730 2,599,730 2,658,607 - - 2,096,227 2,096,227 2,117,675
Margin trading - - 20,963 20,963 20,963 - - 31,934 31,934 31,934
Real estate loans - - - - - - - - - -
Factoring receivable - - 481,868 481,868 481,868 - - 326,388 326,388 336,971
- - 39,762,132 39,762,132 39,855,398 - - 33,225,196 33,225,196 33,488,779
Lease rentals receivable and stock out on hire (net of allowance for impairment losses)
4.17
Lease rentals receivable - - 63,287,175 63,287,175 62,279,090 - - 55,318,502 55,318,502 54,815,791
Stock out on hire - - 211,085 211,085 210,596 - - 874,780 874,780 845,172
- - 63,498,260 63,498,260 62,489,686 - - 56,193,282 56,193,282 55,660,963
Other financial assets 4.20
Treasury bills repurchase agreements - 3,532,441 - 3,532,441 3,532,441 - 3,787,538 - 3,787,538 3,787,538
Investment in fixed deposits - 2,879,390 - 2,879,390 2,879,390 - 2,680,300 - 2,680,300 2,680,300
Insurance premium receivable - 326,628 - 326,628 326,628 - 244,385 - 244,385 244,385
Due from Subsidiary - 5,844 - 5,844 5,844 - - - - -
Sundry debtors - 28,251 - 28,251 28,251 - 9,303 - 9,303 9,303
- 6,772,554 - 6,772,554 6,772,554 - 6,721,526 - 6,721,526 6,721,526
Notes to the Financial Statements

L B Finance PLC . Annual Report 2017/18 349
4.13.2 Fair value measurement hierarchy - financial assets and liabilities measured at amortised cost
4.13.2 (a) Financial assets measured at amortised cost - Company
As at 31 March 2018 2017
Fair value measurement using Fair value measurement using
Quoted prices in active markets
Significant observable inputs
Significant unobservable inputs
Total fair value
Carrying value at amortised cost
Quoted prices in active markets
Significant observable inputs
Significant unobservable inputs
Total fair value
Carrying value at amortised cost
Note Level 1 Level 2 Level 3 Level 1 Level 2 Level 3
Rs. ‘000 Rs. ‘000 Rs. ‘000 Rs. ‘000 Rs. ‘000 Rs. ‘000 Rs. ‘000 Rs. ‘000 Rs. ‘000 Rs. ‘000
Cash and cash equivalents 4.14
Notes and coins held 793,796 - - 793,796 793,796 740,728 - - 740,728 740,728
Balances with banks 1,861,273 - - 1,861,273 1,861,273 1,091,593 - - 1,091,593 1,091,593
Treasury bills repurchase agreements - 3,219,306 - 3,219,306 3,219,306 - 1,062,764 - 1,062,764 1,062,764
2,655,069 3,219,306 - 5,874,375 5,874,375 1,832,321 1,062,764 - 2,895,085 2,895,085
Loans and receivables (net of allowance for impairment losses)
4.16
Gold loans - - 20,108,243 20,108,243 20,108,243 - - 16,267,505 16,267,505 16,267,505
Vehicle loans - - 4,017,216 4,017,216 4,054,552 - - 4,189,209 4,189,209 4,184,086
Medium and short-term loans - - 5,522,094 5,522,094 5,558,771 - - 4,309,221 4,309,221 4,343,401
Mortgage loans - - 7,004,345 7,004,345 6,962,770 - - 5,986,998 5,986,998 6,189,501
Quick loans - - 7,673 7,673 9,624 - - 17,714 17,714 17,706
Power drafts - - 2,599,730 2,599,730 2,658,607 - - 2,096,227 2,096,227 2,117,675
Margin trading - - 20,963 20,963 20,963 - - 31,934 31,934 31,934
Real estate loans - - - - - - - - - -
Factoring receivable - - 481,868 481,868 481,868 - - 326,388 326,388 336,971
- - 39,762,132 39,762,132 39,855,398 - - 33,225,196 33,225,196 33,488,779
Lease rentals receivable and stock out on hire (net of allowance for impairment losses)
4.17
Lease rentals receivable - - 63,287,175 63,287,175 62,279,090 - - 55,318,502 55,318,502 54,815,791
Stock out on hire - - 211,085 211,085 210,596 - - 874,780 874,780 845,172
- - 63,498,260 63,498,260 62,489,686 - - 56,193,282 56,193,282 55,660,963
Other financial assets 4.20
Treasury bills repurchase agreements - 3,532,441 - 3,532,441 3,532,441 - 3,787,538 - 3,787,538 3,787,538
Investment in fixed deposits - 2,879,390 - 2,879,390 2,879,390 - 2,680,300 - 2,680,300 2,680,300
Insurance premium receivable - 326,628 - 326,628 326,628 - 244,385 - 244,385 244,385
Due from Subsidiary - 5,844 - 5,844 5,844 - - - - -
Sundry debtors - 28,251 - 28,251 28,251 - 9,303 - 9,303 9,303
- 6,772,554 - 6,772,554 6,772,554 - 6,721,526 - 6,721,526 6,721,526
FIN
AN
CIA
L R
EP
OR
TS

350 L B Finance PLC . Annual Report 2017/18
4.13.2 (b) Financial assets measured at amortised cost - Group
As at 31 March 2018
Fair value measurement using
Quoted prices in active markets
Significant observable inputs
Significant unobservable inputs
Total fair value
Carrying value at amortised cost
Note Level 1 Level 2 Level 3
Rs. ‘000 Rs. ‘000 Rs. ‘000 Rs. ‘000 Rs. ‘000
Cash and cash equivalents 4.14Notes and coins held 793,847 - - 793,847 793,847 Balances with banks 1,977,142 - - 1,977,142 1,977,142 Treasury bills repurchase agreements - 3,219,306 - 3,219,306 3,219,306
2,770,989 3,219,306 - 5,990,295 5,990,295 Loans and receivables (net of allowance for impairment losses)
4.16
Gold loans - - 20,108,243 20,108,243 20,108,243 Vehicle loans - - 4,017,216 4,017,216 4,054,552 Medium and short-term loans - - 5,560,972 5,560,972 5,597,649 Mortgage loans - - 7,004,345 7,004,345 6,962,770 Quick loans - - 7,673 7,673 9,624 Power drafts - - 2,599,730 2,599,730 2,658,607 Margin trading - - 20,963 20,963 20,963 Real estate loans - - - - - Factoring receivable - - 481,868 481,868 481,868
- - 39,801,010 39,801,010 39,894,276 Lease rentals receivable and stock out on hire (net of allowance for impairment losses)
4.17
Lease rentals receivable - - 63,287,175 63,287,175 62,279,090 Stock out on hire - - 211,085 211,085 210,596
- - 63,498,260 63,498,260 62,489,686 Other financial assets 4.20Treasury bills repurchase agreements - 3,532,441 - 3,532,441 3,532,441 Investment in fixed deposits - 2,879,390 - 2,879,390 2,879,390 Insurance premium receivable - 326,628 - 326,628 326,628 Due from Subsidiary - - - - - Sundry debtors - 28,251 - 28,251 28,251
- 6,766,710 - 6,766,710 6,766,710
Sensitivity analysis of financial assets measured at amortised cost under level 3 category
Company Group
2018 2017 2018
Rs. ‘000 Rs. ‘000 Rs. ‘000
Increase/(decrease) in interest rate
1bp up (9,119) (7,651) (9,119)
1bp down 9,120 7,652 9,120
Notes to the Financial Statements

L B Finance PLC . Annual Report 2017/18 351
Unobservable inputs used in measuring fair value under level 3 category
The following table sets out information about significant unobservable inputs used as at 31 March 2018 and 2017 in measuring financial instruments categorised as Level 3 in the fair value hierarchy.
Company Group
Type of financial instrument
Fair values as at 31 March 2018
Rs. ‘000
Fair values as at 31 March 2018
Rs. ‘000
Valuation technique
Significant unobservable
input
Range of estimates for unobservable input
Fair value measurement sensitivity to unobservable inputs
Loans and receivables*
39,762,132(2017) 33,225,196
39,801,010 Discounted cash
flow
Spread 2-13% (2017 : 2-11%) A significant increase in the spread would result in a lower fair value.
Probability of default
2-6% (2017 : 2-5%) Significant increases in probability of default isolation would result in lower fair values.
Loss severity 25-100% (2017 : 25-100%)
A significant reduction would result in higher fair values.
Expected prepayment
rate
0.03-3.4% (2017 : 0.03-3.4%)
Correlates with the current interest rates.
Lease rentals receivable and stock out on hire*
63,498,260 (2017) 56,193,282
63,498,260 Discounted cash
flow
Spread 7.5-10.5% (2017 : 7-9%)
A significant increase in the spread would result in a lower fair value.
Probability of default
2-6% (2017 : 2-5%) Significant increases in probability of default isolation would result in lower fair values.
Loss severity 25-100% (2017 : 25-100%)
A significant reduction would result in higher fair values.
Expected prepayment
rate
0.5-3.85% (2017 : 0.5-3.85%)
Correlates with the current interest rates.
*Net of allowance for impairment losses
There were no transfers into and transfers out of the hierarchy levels during 2017 and 2018.
Valuation methodologies and assumptions
Cash and cash equivalents
Included in cash and cash equivalents are highly liquid investments that are readily convertible to known amounts of cash, and which are subject to an insignificant risk of change in value due to interest rate, quoted price, or penalty on withdrawal. A debt security is classified as a cash equivalent if it meets these criteria and if it has a remaining time to maturity of three months or less from the date of acquisition. Amounts on deposit and available upon demand, or negotiated to provide for daily liquidity without penalty, are classified as cash and cash equivalents. Time deposits, certificates of deposit and money market accounts that meet the above criteria are reported at par value in our Statement of Financial Position.
Finance receivables (Loans, lease rentals receivable and stock out on hire)
We measure performing finance receivables at fair value for purposes of disclosure using internal valuation models. These models project future cash flows of financing contracts based on scheduled contract payments (including principal and interest). The projected cash flows are discounted to present value based on assumptions regarding credit losses, pre-payment speed, and applicable spreads to approximate current rates. Our assumptions regarding pre-payment speed and credit losses are based on historical performance. We use the fair value of collateral to determine the fair value of non-performing finance receivables. The collateral for finance receivable is the vehicle financed, real estate, gold or other property. The fair value of finance receivables is categorized within Level 3 of the fair value measurement hierarchy. Loans and advances granted to customers with a variable rate are considered to be carried at fair value in the books net of credit losses.
Other financial assets
Since all the balances which are under other financial assets have short-term maturities, it is assumed that the carrying amounts of those balances approximate their fair values.
FIN
AN
CIA
L R
EP
OR
TS

352 L B Finance PLC . Annual Report 2017/18
4.13.2 (c) Financial liabilities measured at amortised cost - Company
As at 31 March 2018 2017
Fair value measurement using Fair value measurement using
Quoted prices in active markets
Significant observable inputs
Significant unobservable inputs
Total fair value
Carrying value at amortised cost
Quoted prices in active markets
Significant observable inputs
Significant unobservable inputs
Total fair value
Carrying value at amortised cost
Note Level 1 Level 2 Level 3 Level 1 Level 2 Level 3
Rs. ‘000 Rs. ‘000 Rs. ‘000 Rs. ‘000 Rs. ‘000 Rs. ‘000 Rs. ‘000 Rs. ‘000 Rs. ‘000 Rs. ‘000
Due to banks 4.25
Bank overdrafts - 1,285,356 - 1,285,356 1,285,356 - 1,035,268 - 1,035,268 1,035,268
Syndicated loans and other bank facilities - 21,520,515 - 21,520,515 21,552,682 - 21,681,004 - 21,681,004 22,742,879
- 22,805,871 - 22,805,871 22,838,038 - 22,716,272 - 22,716,272 23,778,147
Due to customers 4.26
Fixed deposits - - 70,561,713 70,561,713 69,888,343 - - 57,754,227 57,754,227 57,888,811
Certificates of deposit - - 100,772 100,772 100,772 - - 153,987 153,987 153,987
Savings deposits - - 2,954,718 2,954,718 2,954,718 - - 2,359,157 2,359,157 2,359,157
- - 73,617,203 73,617,203 72,943,833 - - 60,267,371 60,267,371 60,401,955
Debt instruments issued and other borrowed funds
4.27
Unsecured debentures - 5,270,741 - 5,270,741 5,152,832 - 2,095,361 - 2,095,361 2,044,216
- 5,270,741 - 5,270,741 5,152,832 - 2,095,361 - 2,095,361 2,044,216
Other financial liabilities 4.28
Trade payables - 462,654 - 462,654 462,654 - 743,139 - 743,139 743,139
Insurance premium payable - 632,727 - 632,727 632,727 - 555,153 - 555,153 555,153
Unclaimed balances - 529,475 - 529,475 529,475 - 549,243 - 549,243 549,243
Advances collected from customers - 38,889 - 38,889 38,889 - 81,440 - 81,440 81,440
Sundry creditors - 97,673 - 97,673 97,673 - 78,427 - 78,427 78,427
- 1,761,418 - 1,761,418 1,761,418 - 2,007,402 - 2,007,402 2,007,402
Notes to the Financial Statements

L B Finance PLC . Annual Report 2017/18 353
4.13.2 (c) Financial liabilities measured at amortised cost - Company
As at 31 March 2018 2017
Fair value measurement using Fair value measurement using
Quoted prices in active markets
Significant observable inputs
Significant unobservable inputs
Total fair value
Carrying value at amortised cost
Quoted prices in active markets
Significant observable inputs
Significant unobservable inputs
Total fair value
Carrying value at amortised cost
Note Level 1 Level 2 Level 3 Level 1 Level 2 Level 3
Rs. ‘000 Rs. ‘000 Rs. ‘000 Rs. ‘000 Rs. ‘000 Rs. ‘000 Rs. ‘000 Rs. ‘000 Rs. ‘000 Rs. ‘000
Due to banks 4.25
Bank overdrafts - 1,285,356 - 1,285,356 1,285,356 - 1,035,268 - 1,035,268 1,035,268
Syndicated loans and other bank facilities - 21,520,515 - 21,520,515 21,552,682 - 21,681,004 - 21,681,004 22,742,879
- 22,805,871 - 22,805,871 22,838,038 - 22,716,272 - 22,716,272 23,778,147
Due to customers 4.26
Fixed deposits - - 70,561,713 70,561,713 69,888,343 - - 57,754,227 57,754,227 57,888,811
Certificates of deposit - - 100,772 100,772 100,772 - - 153,987 153,987 153,987
Savings deposits - - 2,954,718 2,954,718 2,954,718 - - 2,359,157 2,359,157 2,359,157
- - 73,617,203 73,617,203 72,943,833 - - 60,267,371 60,267,371 60,401,955
Debt instruments issued and other borrowed funds
4.27
Unsecured debentures - 5,270,741 - 5,270,741 5,152,832 - 2,095,361 - 2,095,361 2,044,216
- 5,270,741 - 5,270,741 5,152,832 - 2,095,361 - 2,095,361 2,044,216
Other financial liabilities 4.28
Trade payables - 462,654 - 462,654 462,654 - 743,139 - 743,139 743,139
Insurance premium payable - 632,727 - 632,727 632,727 - 555,153 - 555,153 555,153
Unclaimed balances - 529,475 - 529,475 529,475 - 549,243 - 549,243 549,243
Advances collected from customers - 38,889 - 38,889 38,889 - 81,440 - 81,440 81,440
Sundry creditors - 97,673 - 97,673 97,673 - 78,427 - 78,427 78,427
- 1,761,418 - 1,761,418 1,761,418 - 2,007,402 - 2,007,402 2,007,402
FIN
AN
CIA
L R
EP
OR
TS
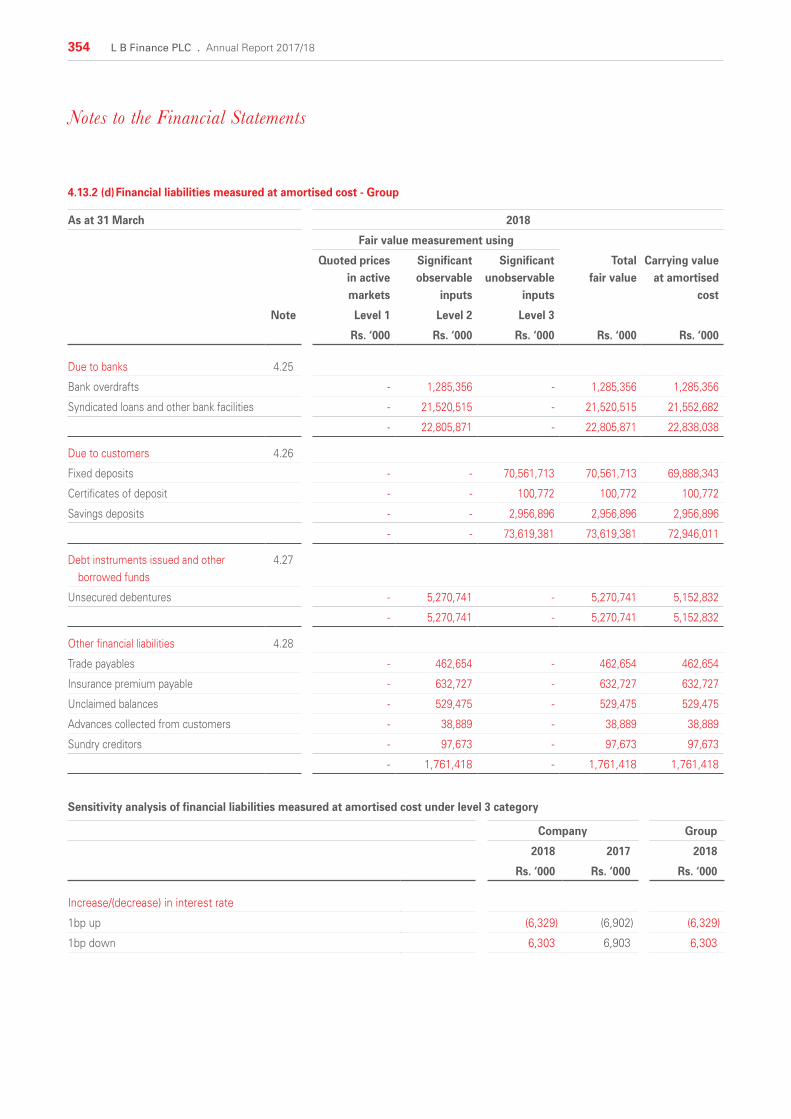
354 L B Finance PLC . Annual Report 2017/18
4.13.2 (d) Financial liabilities measured at amortised cost - Group
As at 31 March 2018
Fair value measurement using
Quoted prices in active markets
Significant observable inputs
Significant unobservable inputs
Total fair value
Carrying value at amortised cost
Note Level 1 Level 2 Level 3
Rs. ‘000 Rs. ‘000 Rs. ‘000 Rs. ‘000 Rs. ‘000
Due to banks 4.25
Bank overdrafts - 1,285,356 - 1,285,356 1,285,356
Syndicated loans and other bank facilities - 21,520,515 - 21,520,515 21,552,682
- 22,805,871 - 22,805,871 22,838,038
Due to customers 4.26
Fixed deposits - - 70,561,713 70,561,713 69,888,343
Certificates of deposit - - 100,772 100,772 100,772
Savings deposits - - 2,956,896 2,956,896 2,956,896
- - 73,619,381 73,619,381 72,946,011
Debt instruments issued and other borrowed funds
4.27
Unsecured debentures - 5,270,741 - 5,270,741 5,152,832
- 5,270,741 - 5,270,741 5,152,832
Other financial liabilities 4.28
Trade payables - 462,654 - 462,654 462,654
Insurance premium payable - 632,727 - 632,727 632,727
Unclaimed balances - 529,475 - 529,475 529,475
Advances collected from customers - 38,889 - 38,889 38,889
Sundry creditors - 97,673 - 97,673 97,673
- 1,761,418 - 1,761,418 1,761,418
Sensitivity analysis of financial liabilities measured at amortised cost under level 3 category
Company Group
2018 2017 2018
Rs. ‘000 Rs. ‘000 Rs. ‘000
Increase/(decrease) in interest rate
1bp up (6,329) (6,902) (6,329)
1bp down 6,303 6,903 6,303
Notes to the Financial Statements

L B Finance PLC . Annual Report 2017/18 355
Unobservable inputs used in measuring fair value under level 3 category
The following table sets out information about significant unobservable inputs used as at 31 March 2018 and 2017 in measuring financial instruments categorised as Level 3 in the fair value hierarchy.
Company Group
Type of financial instrument
Fair values as at 31 March 2018 rs. ‘000
Fair values as at 31 March 2018 rs. ‘000
Valuation technique
Significant unobservable input
Range of estimates for unobservable
input
Fair value measurement sensitivity to unobservable inputs
Due to Customers
73,617,202 (2017) 60,267,371
73,619,380 Discounted cash flow
Spread 0-2.8% (2017 : 2.6-2.7%)
A significant increase in the spread would result in a lower fair value
Expected premature rate
0.13-0.52% (2017 : 0.13-0.52%)
Correlates with the current interest rates
There were no financial liabilities recorded at fair value as at 31 March 2017 and 2018.
There were no transfers into and transfers out of the hierarchy levels during 2017 and 2018.
Valuation methodologies and assumptions
Due to customers
We measure the fair value using internal valuation models. These models project future cash flows of fixed deposits based on scheduled maturities (including principal and interest) and pre-maturities of deposits. The projected cash flows are discounted to present value based on applicable spreads to approximate current deposit rates for each tenor. Our assumptions regarding pre-maturity speed and spreads are based on historical performance. Certificate of deposits that have a maturity of less than one year and savings deposits without a specific maturity are assumed that the carrying amounts approximate their fair values. The fair value of Due to Customers is categorized within Level 3 of the hierarchy.
Listed and unlisted debentures, bank borrowings, securitised notes and debt instruments
We measure fair value for listed debentures using quoted prices for our own debentures with approximately the same remaining maturities, where possible. If the particular debenture is off the run, we estimate the fair value using discounted cash flows and market-based expectations for interest rates, credit risk and the contractual terms of the debenture. Comparable on the run debenture yield to maturity (YTM) assumed to be a good approximation for the fair value estimation of off the run debentures. We estimate the fair value of bank borrowings and debt instruments using discounted cash flows and use the most recent transacted rate and/or unexpired offered rate of a similar instrument or borrowing. Debt instrument and bank borrowing do not carry prepayment or embedded options. The fair value of debt is categorised within Level 2 of the hierarchy.
Other financial liabilities
Since all the liabilities which are under other financial liabilities have short-term maturities, it is assumed that the carrying amounts of those liabilities approximate their fair values.
FIN
AN
CIA
L R
EP
OR
TS

356 L B Finance PLC . Annual Report 2017/18
4.14 CASH AND CASH EQUIVALENTS
Accounting policy
Cash and cash equivalents includes cash and bank balances and money at call and short notice. Cash and cash equivalents are carried at amortized cost in the Statement of Financial Position.
Company Group
2018 2017 2018
Rs. ‘000 Rs. ‘000 Rs. ‘000
Notes and coins held 793,796 740,728 793,847
Balances with banks 1,861,273 1,091,593 1,977,142
Treasury bills repurchase agreements (less than 03 months) 3,219,306 1,062,764 3,219,306
5,874,375 2,895,085 5,990,295
Fair value 5,874,375 2,895,085 5,990,295
4.14.1 The collateral value of repurchase agreements reflected on the Statement of Financial Position under cash and cash equivalents as at 31 March 2018 and 31 March 2017 was Rs. 3,538,494,000/- and Rs. 1,222,642,000/- respectively.
4.14.2 Cash and cash equivalents allocated for the liquidity requirement
Accounting policy
Our cash and cash equivalents allocated for the liquidity requirement primarily include cash held to meet certain local governmental and regulatory reserve requirement and cash held under the terms of certain contractual agreements. This does not include required minimum balances or cash securing debt issued through securitization transactions. Cash and cash equivalents allocated for the liquidity requirement were as follows;
Company Group
2018 2017 2018
Rs. ‘000 Rs. ‘000 Rs. ‘000
Cash and cash equivalents allocated for the liquidity requirement 1,467,546 - 1,467,546
4.14.3 Net cash and cash equivalents for the purpose of the cash flow statement
Accounting policy
For the purpose of cash flow statement, cash and cash equivalents consist of cash in hand and deposits in banks net of outstanding bank overdrafts. Investments with short maturities i.e. three months or less from the date of acquisition are also treated as cash equivalents.
Company Group
2018 2017 2018
Rs. ‘000 Rs. ‘000 Rs. ‘000
Cash and cash equivalents 5,874,375 2,895,085 5,990,295
Bank overdrafts (Note 4.25) (1,285,356) (1,035,268) (1,285,356)
Net cash and cash equivalents 4,589,019 1,859,817 4,704,939
Notes to the Financial Statements

L B Finance PLC . Annual Report 2017/18 357
4.15 FINANCIAL INVESTMENTS - HELD FOR TRADING
Accounting policy
Financial investments are classified as held for trading if they are acquired principally for the purpose of selling or repurchasing in the near term or holds as a part of a portfolio that is managed together for short-term profit or position taking. Financial investments held for trading are recorded in the Statement of Financial Position at fair value. Changes in fair value are recognized in ‘Net trading income’. Interest and dividend income is recorded in ‘Net trading income’ according to the terms of the contract, or when the right to receive the payment has been established.
The Group evaluates its held for trading asset portfolio, to determine whether the intention to sell them in the near future is still appropriate. When the Group is unable to trade these financial assets due to inactive markets and management’s intention to sell them in the foreseeable future significantly changes, the Group may select to reclassify these financial assets. Financial assets held for trading include equity instruments that have been acquired principally for the purpose of selling or repurchasing in the near term. We generally measure fair value using prices obtained from pricing services, Stock Exchanges, the Central Bank and other authenticated public sources. We use the last traded price to value our quoted equities.
Company Group2018 2017 2018
Rs. ‘000 Rs. ‘000 Rs. ‘000
Equity securities - quoted (Note 4.15.1) 9,682 10,068 9,682
4.15.1 Equity securities - Quoted
As at 31 MarchCompany & Group
2018Company
2017Number of Cost Market value Number of Cost Market value
shares shares Rs. '000 Rs. '000 Rs. '000 Rs. '000
Bank, finance and insuranceSeylan Bank PLC (Non-Voting) 93,032 1,685 5,126 93,032 1,685 5,089
1,685 5,126 1,685 5,089 Beverages, food and tobaccoBairaha Farms PLC 17,600 425 2,369 17,600 425 2,819
425 2,369 425 2,819 ManufacturingLanka Walltiles PLC* 19,740 790 1,942 19,740 790 1,836
790 1,942 790 1,836 TradingHayleys PLC* 1,222 207 245 1,222 207 324
207 245 207 324 Total 3,107 9,682 3,107 10,068
*Investments made in related parties
FIN
AN
CIA
L R
EP
OR
TS

358 L B Finance PLC . Annual Report 2017/18
4.16 LOANS AND RECEIVABLES
Accounting policy
Loans and receivables include financial assets with fixed or determinable payments that are not quoted in an active market, other than:
» Those that the Group intends to sell immediately or in the near term and those that the Group, upon initial recognition, designates as at fair value through profit or loss.
» Those that the Group, upon initial recognition, designates as available for sale.
» Those for which the Group may not recover substantially all of its initial investment, other than because of credit deterioration.
After initial measurement loans and receivables are subsequently measured at amortised cost using the effective interest rate (EIR), less allowance for impairment. Amortised cost is calculated by taking into account any discount or premium on acquisition and fees and costs that are an integral part of the EIR. The amortisation is included in ‘interest income’ in the Income Statement. The losses arising from impairment are recognised in ‘impairment (charge)/reversal on loans and other losses’ in the Income Statement.
Company Group
2018 2017 2018
Rs. ‘000 Rs. ‘000 Rs. ‘000
Gold loans 20,139,332 16,289,996 20,139,332
Vehicle loans 4,208,804 4,391,058 4,208,804
Medium and short-term loans 5,703,635 4,393,290 5,742,903
Mortgage loans 7,365,157 6,410,140 7,365,157
Quick loans 11,336 18,015 11,336
Power drafts 2,734,171 2,139,041 2,734,171
Margin trading 20,964 31,934 20,964
Factoring receivable 537,288 338,455 537,288
Real estate loans 976 1,850 976
Gross loans and receivables 40,721,663 34,013,779 40,760,931
Allowance for impairment losses (Note 4.18) (866,265) (525,000) (866,655)
Net loans and receivables subject to fair value (Note 4.16.2) 39,855,398 33,488,779 39,894,276
Fair value 39,762,132 33,225,196 39,801,010
4.16.1 Loans and receivables include loans granted to employees, the movement of which is as follows;
Company & Group Company
2018 2017
Rs. ‘000 Rs. ‘000
As at the beginning of the year 324,475 278,028
Loans granted during the year 244,225 234,944
Repayments during the year (211,758) (188,497)
As at the end of the year 356,942 324,475
Notes to the Financial Statements

L B Finance PLC . Annual Report 2017/18 359
4.16.2 Contractual maturity analysis of loans and receivables
As at 31 March 2018 - Company Within one year 1 - 5 Years Over 5 years TotalRs. '000 Rs. '000 Rs. '000 Rs. '000
Gold loans 20,139,332 - - 20,139,332 Vehicle loans 1,826,854 2,332,233 49,717 4,208,804 Medium and short-term loans 3,910,717 1,792,919 - 5,703,636 Mortgage loans 1,903,820 4,471,593 989,744 7,365,157 Quick loans 11,310 25 - 11,335 Power drafts 1,619,246 1,114,925 - 2,734,171 Margin trading 20,964 - - 20,964 Factoring receivable 537,288 - - 537,288 Real estate loans 976 - - 976 Gross loans and receivables 29,970,507 9,711,695 1,039,461 40,721,663 Allowance for impairment losses (Note 4.18) (866,265)Net loans and receivables 39,855,398
As at 31 March 2017 - Company Within one year 1 - 5 Years Over 5 years TotalRs. '000 Rs. '000 Rs. '000 Rs. '000
Gold loans 16,289,996 - - 16,289,996 Vehicle loans 1,958,357 2,390,736 41,965 4,391,058 Medium and short-term loans 3,477,833 915,457 - 4,393,290 Mortgage loans 1,537,482 3,717,090 1,155,568 6,410,140 Quick loans 17,355 660 - 18,015 Power drafts 1,252,114 886,927 - 2,139,041 Margin trading 31,934 - - 31,934 Factoring receivable 318,247 20,208 - 338,455 Real estate loans 1,850 - - 1,850 Gross loans and receivables 24,885,168 7,931,078 1,197,533 34,013,779 Allowance for impairment losses (Note 4.18) (525,000)Net loans and receivables 33,488,779
As at 31 March 2018 - Group Within one year 1 - 5 Years Over 5 years TotalRs. '000 Rs. '000 Rs. '000 Rs. '000
Gold loans 20,139,332 - - 20,139,332 Vehicle loans 1,826,854 2,332,233 49,717 4,208,804 Medium and short-term loans 3,940,453 1,802,451 - 5,742,904 Mortgage loans 1,903,820 4,471,593 989,744 7,365,157 Quick loans 11,310 25 - 11,335 Power drafts 1,619,246 1,114,925 - 2,734,171 Margin trading 20,964 - - 20,964 Factoring receivable 537,288 - - 537,288 Real estate loans 976 - - 976 Gross loans and receivables 30,000,243 9,721,227 1,039,461 40,760,931 Allowance for impairment losses (Note 4.18) (866,655)Net loans and receivables 39,894,276
Our loans and receivables are prepayable, so prepayments may cause actual maturities to differ from contractual maturities.
FIN
AN
CIA
L R
EP
OR
TS

360 L B Finance PLC . Annual Report 2017/18
4.17 LEASE RENTALS RECEIVABLE AND STOCK OUT ON HIRE
Accounting policy
Agreements which transfer to counterparties substantially all the risks and rewards incidental to the ownership of assets, but not necessarily legal title, are classified as finance leases. When the Group is the lessor under finance leases the amounts due under the leases, after deduction of unearned charges, are recognised on the Statement of Financial Position. The finance income receivable is recognised in ‘interest income’ over the periods of the leases so as to give a constant rate of return on the net investment in the leases.
Lease and stock out on hire include financial assets with fixed or determinable payments that are not quoted in an active market, other than;
» Those that the Group intends to sell immediately or in the near term and those that the Group, upon initial recognition, designates as at fair value through profit or loss.
» Those that the Group, upon initial recognition, designates as available for sale.
» Those for which the Group may not recover substantially all its initial investment, other than because of credit deterioration.
After initial measurement, lease receivable and stock out on hire are subsequently measured at amortised cost using the effective interest rate (EIR), less allowance for impairment. Amortised cost is calculated by taking into account any discount or premium on acquisition and fees and costs that are an integral part of the EIR. The amortisation is included in ‘interest income’ in the Income Statement. The losses arising from impairment are recognised in ‘impairment (charge)/reversal on loans and other losses’ in the Income Statement.
Company & Group2018
Company2017
Lease Hire purchase Total Lease Hire purchase Total
Rs. '000 Rs. '000 Rs. '000 Rs. '000 Rs. '000 Rs. '000
Gross rentals receivables 85,706,799 455,939 86,162,738 74,523,266 1,251,200 75,774,466
Unearned income (21,644,208) (18,617) (21,662,825) (18,177,121) (124,155) (18,301,276)
Net rentals receivables 64,062,591 437,322 64,499,913 56,346,145 1,127,045 57,473,190
Rentals received in advance (9,094) - (9,094) (6,925) - (6,925)
Allowance for impairment losses (Note 4.18) (1,774,407) (226,726) (2,001,133) (1,523,429) (281,873) (1,805,302)
Total net rentals receivable subject to fair value (Note 4.17.2) 62,279,090 210,596 62,489,686 54,815,791 845,172 55,660,963
Fair value 63,498,260 56,193,282
Operating lease
All other leases are classified as operating leases. When acting as lessor, the Group includes the assets subject to operating leases in ‘property, plant and equipment’ and accounts for them accordingly. Impairment losses are recognised to the extent that residual values are not fully recoverable and the carrying value of the assets is thereby impaired.
When the Group is the lessee, leased assets are not recognised on the Statement of Financial Position. Rentals receivable under operating leases are accounted for on a straight-line basis over the periods of the leases to reduce the asset to its estimated residual value and are included in ‘other operating income’. Estimated residual values are based on assumptions for used vehicle prices at lease termination and the number of vehicles that are expected to be returned.
Notes to the Financial Statements

L B Finance PLC . Annual Report 2017/18 361
4.17.1 Lease and hire purchase facilities granted to employees, the movement of which is as follows;
Company & Group Company
2018 2017
Rs. ‘000 Rs. ‘000
As at the beginning of the year 70,833 94,925
Lease and hire purchase facilities granted during the year 47,754 38,187
Repayments during the year (54,415) (62,279)
As at the end of the year 64,172 70,833
4.17.2 Contractual maturity analysis of lease rentals receivable and stock out on hire
As at 31 March 2018 - Company & Group
Lease Hire purchase Within one year
1 - 5 Years
Over 5 years
Total Within one year
1 - 5 Years
Over 5 years
Total
Rs. '000 Rs. '000 Rs. '000 Rs. '000 Rs. '000 Rs. '000 Rs. '000 Rs. '000
Gross rentals receivable 35,693,565 49,960,849 52,385 85,706,799 415,441 40,498 - 455,939 Unearned income (10,956,306) (10,683,825) (4,077) (21,644,208) (16,643) (1,974) - (18,617)Net rentals receivable 24,737,259 39,277,024 48,308 64,062,591 398,798 38,524 - 437,322 Rentals received in advance - - - (9,094) - - - - Allowance for impairment losses - - - (1,774,407) - - - (226,726)Total net rentals receivable - - - 62,279,090 - - - 210,596
As at 31 March 2017 - Company
Lease Hire purchase Within one year
1 - 5 Years
Over 5 years
Total Within one year
1 - 5 Years
Over 5 years
Total
Rs. '000 Rs. '000 Rs. '000 Rs. '000 Rs. '000 Rs. '000 Rs. '000 Rs. '000
Gross rentals receivable 29,472,322 45,033,659 17,285 74,523,266 910,754 340,283 163 1,251,200 Unearned income (8,820,103) (9,355,719) (1,299) (18,177,121) (93,574) (30,580) (1) (124,155)Net rentals receivable 20,652,219 35,677,940 15,986 56,346,145 817,180 309,703 162 1,127,045 Rentals received in advance - - - (6,925) - - - - Allowance for impairment losses - - - (1,523,429) - - - (281,873)Total net rentals receivable - - - 54,815,791 - - - 845,172
Our lease rentals receivable and stock out on hire are prepayable, so prepayments may cause actual maturities to differ from contractual maturities.
FIN
AN
CIA
L R
EP
OR
TS

362 L B Finance PLC . Annual Report 2017/18
4.18 ALLOWANCE FOR IMPAIRMENT LOSSES
Accounting estimates
The allowance for credit losses represents our estimate of the probable loss on the collection of finance receivables from customers as of the reporting date. The adequacy of the allowance for credit losses is assessed monthly and the assumptions and models used in establishing the allowance are evaluated regularly. Because credit losses may vary substantially over time, estimating credit losses requires a number of assumptions about matters that are uncertain. The credit losses are attributable to lease, hire purchase, loans and receivables portfolio.
The uncollectible portion of finance receivables are charged to the provision for impairment when an account is deemed to be uncollectible taking into consideration the financial condition of the customer, borrower, or lessee, the value of the collateral, recourse to guarantors, and other factors. Recoveries on finance receivables previously taken as impaired are debited to the allowance for credit losses.
Individually impaired receivables
Finance receivables that are more than five months in arrears, related to repossessed collaterals, subjected to legal action/ongoing legal action, untraceable or unattainable collaterals, or are determined to be uncollectible, are identified as individually impaired. Impairment is estimated based on the present value of the expected future cash flows of the receivable discounted at the loan’s original effective interest rate or the fair value of any collateral adjusted for estimated costs to sell. Loss severity/Loss Given Default (LGD) of each category of impaired receivable is assumed to be a vital factor for the allowance for impairment.
The LGD assumptions are based on historical information and may not fully reflect losses inherent in the present portfolio. Therefore, we may adjust the estimate to reflect management judgment regarding observable changes in recent economic trends and conditions, portfolio composition, and other relevant factors.
Collectively impaired receivables
The collective impairment is evaluated primarily using rating migration matrixes and Loss severity models that based on historical experience, indicates credit losses have been incurred in the portfolio even though the particular accounts that are uncollectible cannot be specifically identified. In addition to the Loss Given Default (LGD), we make projections for Probability of Default (PD) to estimate the collective impairment for receivables. We have used the rating migration matrixes to compute the PD.
The rating migrating matrix models are based on the most recent years of history. Each PD is calculated by dividing default contracts of each age category by beginning-of-period total contacts of each age category (Cohort method). The loss emergence period is a key assumption within our models and represents the average amount of time between when a loss event first occurs and when it is incurred. This time period starts when the consumer begins to experience financial difficulty. It is evidenced, typically through observable data for above average company NPL, historically low collection ratio, historically high rental arrears, and unacceptable low level of business volumes which may result in a portfolio level impairment.
Accounting policy
Reversals of impairment
If the amount of an impairment loss decreases in a subsequent period, and the decrease can be related objectively to an event occurring after the impairment was recognised, the excess is written back by reducing the financial asset impairment allowance account accordingly. The write-back is recognised in the Income Statement.
Write-off of loans and receivables
Financial assets and the related impairment allowance accounts are normally written off, either partially or in full, when there is no realistic prospect of recovery. Where financial assets are secured, this is generally after receipt of any proceeds from the realisation of security.
Notes to the Financial Statements

L B Finance PLC . Annual Report 2017/18 363
Collateral valuation
The Group seeks to use collateral, where possible, to mitigate its risks on financial assets. The collateral comes in various forms such as cash, vehicles, gold, securities, letters of guarantees, real estate, receivables, inventories, other non-financial assets .The fair value of collateral is generally assessed, at a minimum, at inception and based on the guidelines issued by the Central Bank of Sri Lanka.
To the extent possible, the Group uses active market data for valuing financial assets, held as collateral. Non-financial collateral, such as real estate, is valued based on data provided by third parties such as independent valuers.
Collateral repossessed
Repossessed collateral will not be taken into books of accounts unless the Group has taken those collaterals into its business operations. However such additions from the repossessed collaterals to the business operations are not significant.
Loans and receivables
Lease rentals receivable and
stock out on hire Total
Company Group Company Group Company Group
2018 2017 2018 2018 2017 2018 2018 2017 2018
Rs. ‘000 Rs. ‘000 Rs. ‘000 Rs. ‘000 Rs. ‘000 Rs. ‘000 Rs. ‘000 Rs. ‘000 Rs. ‘000
4.18.1 As at 1 April 525,000 723,963 525,000 1,805,302 1,917,795 1,805,302 2,330,302 2,641,758 2,330,302
Charge/(reversal) for
the year 415,476 6,290 415,853 364,809 94,016 364,809 780,285 100,306 780,662
Amounts written off (74,211) (205,253) (74,211) (168,978) (206,509) (168,978) (243,189) (411,762) (243,189)
Exchange rate variance
on foreign currency
provisions - - 13 - - - - - 13
As at 31 March 866,265 525,000 866,655 2,001,133 1,805,302 2,001,133 2,867,398 2,330,302 2,867,788
4.18.2 Individual impairment 697,505 414,698 697,505 1,406,864 1,347,445 1,406,864 2,104,369 1,762,143 2,104,369
Collective impairment 168,760 110,302 169,150 594,269 457,857 594,269 763,029 568,159 763,419
Total 866,265 525,000 866,655 2,001,133 1,805,302 2,001,133 2,867,398 2,330,302 2,867,788
4.18.3 Gross amount of loans
individually determined
to be impaired, before
deducting the
individually assessed
impairment allowance 1,546,030 711,404 1,546,030 3,771,230 1,771,225 3,771,230 5,317,260 2,482,629 5,317,260
Gross amount of loans
collectively assessed
for the impairment 39,175,633 33,302,376 39,214,901 60,728,683 55,701,965 60,728,683 99,904,316 89,004,341 99,943,584
Gross receivables 40,721,663 34,013,780 40,760,931 64,499,913 57,473,190 64,499,913 105,221,576 91,486,970 105,260,844
The recorded loans and receivables that were impaired at 31 March 2018 and 2017 were 3.80% of receivables, and 2.09% of receivables, respectively. Lease rentals receivable and stock out on hire that were impaired at 31 March 2018 and 2017 were 5.85% of receivables, and 3.08% of receivables, respectively.
FIN
AN
CIA
L R
EP
OR
TS

364 L B Finance PLC . Annual Report 2017/18
4.18.4 Product-wise analysis of the allowance for impairment losses
Company Group
2018 2017 2018
Rs. ‘000 Rs. ‘000 Rs. ‘000
Gold loans 31,089 22,490 31,089
Vehicle loans 154,252 206,972 154,252
Medium and short term-loans 144,864 51,741 145,254
Mortgage loans 402,387 220,639 402,387
Quick loans 1,711 309 1,711
Power drafts 75,564 21,366 75,564
Margin trading 1 - 1
Factoring receivable 55,421 1,483 55,421
Real estate loans 976 - 976
Loans and receivables 866,265 525,000 866,655
Leases 1,774,407 1,523,429 1,774,407
Hire purchase 226,726 281,873 226,726
Lease rentals receivable and stock out on hire 2,001,133 1,805,302 2,001,133
Total allowance for impairment losses 2,867,398 2,330,302 2,867,788
4.18.5 Non-accrual receivables
The accrual of revenue is discontinued at the time of receivable is determined to be fully impaired. Fully impairment point is triggered out when the receivables are more than eleven months in arrears, receivables are subject to legal action/ongoing legal action, receivables are subject to untraceable or unattainable collaterals, or receivables are determined to be uncollectible. For receivables in non-accrual status, subsequent financing revenue is recognized only to the extent a payment is received. Payments are generally applied first to outstanding interest and then to the unpaid principal balance.
4.19 FINANCIAL INVESTMENTS - AVAILABLE FOR SALE
Accounting policy
Financial investments available for sale are recorded in the Statement of Financial Position at fair value. These include debt and equity securities. Debt and equity securities in this category are intended to be held for an indefinite period of time and may be sold in response to needs for liquidity or in response to changes in the market conditions. The Group has not designated any loans or receivables as available for sale. We generally measure fair value using prices obtained from pricing services, Stock Exchanges, the Central Bank and other authenticated public sources. We use the last traded price to value our quoted equities. Government debt securities are valued using discounted cash flows using same series Yield To Maturity (YTM) or interpolated (on the run and off the run) YTM adjusted for market based expectations for interest rates.
Notes to the Financial Statements

L B Finance PLC . Annual Report 2017/18 365
Accounting estimates
The Group reviews their debt securities classified as available for sale investments at each reporting date to assess whether they are impaired. This requires similar judgments as applied on the individual assessment of loans and advances.
The Group also records impairment charges on available for sale equity investments when there has been a significant or prolonged decline in the fair value below their cost. The determination of what is ‘significant’ or ‘prolonged’ requires judgment. The Group generally treats ‘significant’ as 20% or more and ‘prolonged’ as greater than six months. In addition the Group evaluates, among other factors, historical share price movements, duration and extent up to which the fair value of an investment is less than its cost.
Company & Group Company
2018 2017
Rs. ‘000 Rs. ‘000
Equity securities- quoted (Note 4.19.1) 121,319 117,716
Equity securities- unquoted (Note 4.19.2) 305 305
121,624 118,021
4.19.1 Equity securities- quoted
As at 31 March 2018 2017
Number of Cost Market Number of Cost Market
shares value shares value
Rs. '000 Rs. '000 Rs. '000 Rs. '000
Manufacturing
Blue Diamonds Jewellery Worldwide PLC - - - 74 1 -
Central Industries PLC 8,184 150 322 8,184 150 360
Ceylon Grain Elevators PLC 44 5 3 44 5 3
Dankotuwa Porcelain PLC 32,512 1,012 224 32,512 1,012 195
Royal Ceramics Lanka PLC* 31,320 843 3,301 31,320 843 3,727
Samson International PLC 5,899 930 519 5,899 930 583
2,940 4,369 2,941 4,868
Hotels and travels
The Fortress Resorts PLC* 4,051,100 81,990 42,537 4,051,100 81,990 46,993
Aitken Spence Hotel Holdings PLC 308 6 10 308 6 11
Hotel Sigiriya PLC 700 30 44 700 30 68
Palm Garden Hotels PLC - - - 36 3 1
82,026 42,591 82,029 47,073
FIN
AN
CIA
L R
EP
OR
TS

366 L B Finance PLC . Annual Report 2017/18
4.19.1 Equity securities- quoted (contd.)
As at 31 March 2018 2017 Number of Cost Market Number of Cost Market
shares value shares value Rs. '000 Rs. '000 Rs. '000 Rs. '000
Stores and suppliesHunters & Company PLC 10 3 5 10 3 4
3 5 3 4 Bank, finance and insuranceCommercial Bank of Ceylon PLC 275 15 37 275 15 36 Merchant Bank of Sri Lanka & Finance PLC - - - 61 6 1 Seylan Bank PLC 2,538 155 220 2,538 155 221 Sampath Bank PLC 5 - 2 5 - 1 Softlogic Finance PLC 2,090,000 79,656 73,150 2,090,000 79,656 64,788
79,826 73,409 79,832 65,047 Beverages, food and tobaccoKeells Food Products PLC 500 21 65 500 21 73 Lanka Milk Foods PLC 5,500 250 870 5,500 250 644 Convenience Foods (Lanka) PLC 22 1 10 22 1 7
272 945 272 724 Total 165,067 121,319 165,078 117,716
*Investments made in related parties
4.19.2 Equity securities - unquoted
As at 31 March 2018 2017Number of Cost Fair value Number of Cost Fair value
shares shares Rs. '000 Rs. '000 Rs. '000 Rs. '000
Credit Information Bureau of Sri Lanka 1,047 105 105 1,047 105 105 Finance House Association of Sri Lanka 20,000 200 200 20,000 200 200 Total 305 305 305 305
Cost is assumed to be the best approximation for the fair value of unquoted equity shares due to the absence of most recent exit prices.
Reconciliation of fair value measurement for unquoted equity securities under level 3 hierarchy
Company & Group Company2018 2017
Rs. ‘000 Rs. ‘000
As at 1 April 305 305 Remeasurement recognised in OCI - - Purchases - - Sales - - Transfers into or out of level 3 hierarchy - -Remeasurement recognised in Income Statement - -As at 31 March 305 305
Notes to the Financial Statements

L B Finance PLC . Annual Report 2017/18 367
4.20 OTHER FINANCIAL ASSETS
Accounting policy
These include treasury bills repurchase agreements, where we are the transferee and investments in fixed deposits with banks and other financial institutions. Treasury bills repurchase agreements allow us to offset our entire gross exposure in the event of default or breach of contract. Other financial assets are initially recognised at fair value net of transactions cost. Subsequently, they are stated at amortised cost; any difference between the proceeds (Net of transaction cost) and the receivable amount (including interest income) is recognised in the Income Statement over the period of the assets using effective interest method.
Company Group
2018 2017 2018
Rs. ‘000 Rs. ‘000 Rs. ‘000
Treasury bills repurchase agreements (Note 4.20.1) 3,532,441 3,787,538 3,532,441
Investment in fixed deposits (Note 4.20.2) 2,879,390 2,680,300 2,879,390
Insurance premium receivable 326,628 244,385 326,628
Due from Subsidiary 5,844 - -
Sundry debtors 28,251 9,303 28,251
6,772,554 6,721,526 6,766,710
Fair value 6,772,554 6,721,526 6,772,554
4.20.1 The collateral value of repurchase agreements reflected on the Statement of Financial Position under Other Financial Assets as at 31 March 2018 and 31 March 2017 was Rs. 4,116,121,000/- and Rs. 4,571,900,000/- respectively.
4.20.2 Investment in fixed deposits
Company Group
2018 2017 2018
Rs. ‘000 Rs. ‘000 Rs. ‘000
Counterparty External Credit Rating*
AA+ - 200,065 -
AA - 201,923 -
AA- 1,974,473 1,135,635 1,974,473
A+ 164,849 535,935 164,849
A- 576,337 - 576,337
BBB - 444,791 -
BB+ 163,731 161,951 163,731
2,879,390 2,680,300 2,879,390
*Fitch Ratings Lanka Ltd.
FIN
AN
CIA
L R
EP
OR
TS

368 L B Finance PLC . Annual Report 2017/18
4.21 OTHER NON-FINANCIAL ASSETS
Accounting policy
Group classifies all other non-financial assets other than intangible assets and property, plant and equipment under other non-financial assets. Other non-financial assets include real estate stock, vehicle stock, gold stock, deposits, advances and prepayments, etc. These assets are non-interest earning and recorded at the amounts that are expected to be received.
Company Group
2018 2017 2018
Rs. ‘000 Rs. ‘000 Rs. ‘000
Real estate stock - 581 -
Vehicle stock 18,574 - 18,574
Deposits, advances and prepayments 744,466 263,663 745,121
Gold stock 1,514 5,805 1,514
Stationery stock 8,769 9,145 8,769
Withholding tax receivable 16,599 7,589 16,599
Sundry debtors 6,151 6,069 6,151
Pre-paid staff cost (Note 4.21.1) 19,735 12,196 19,735
815,808 305,048 816,463
Gold stock
The gold inventory is valued at lower of cost and net realizable value. Cost includes all costs of purchase, costs of conversion and other costs incurred in bringing the inventory to its present location and condition. Net realizable value is the estimated selling price in the ordinary course of business less the estimated cost necessary to make the sale.
4.21.1 The movement in the pre-paid staff cost
Company Group
2018 2017 2018
Rs. ‘000 Rs. ‘000 Rs. ‘000
As at the beginning of the year 12,196 3,497 12,196
Adjustment for new grants and settlements 12,200 10,989 12,200
Charge to personnel expenses (4,661) (2,290) (4,661)
As at the end of the year 19,735 12,196 19,735
Notes to the Financial Statements

L B Finance PLC . Annual Report 2017/18 369
4.22 INVESTMENT IN SUBSIDIARY
Subsidiary is an investee controlled by the Group. The Group ‘controls’ an investee if it is exposed to, or has rights to, variable returns from its involvement with the investee and has the ability to affect those returns through its power over the investee. The Group re-assesses whether it has control if there are changes to one or more of the elements of control. This includes circumstances in which protective rights are held (e.g. those resulting from a lending relationship) become substantive and lead to the Group having power over an investee.
The cost of an acquisition is measured at fair value of the consideration, including contingent consideration. The acquired identifiable assets, liabilities and contingent liabilities are measured at their fair values at the date of acquisition. Subsequent to the initial measurement, the Company continues to recognise the investments in Subsidiaries at cost.
The Financial Statements of Subsidiaries are included in the Consolidated Financial Statements from the date on which control commences until the date when control ceases.
The Financial Statements of the Subsidiary in the Group has a common financial year which ends on 31 March. The Financial Statements of the Company’s Subsidiary are prepared using consistent accounting policies.
All intra-group balances, transactions, unrealised gains and losses resulting from intra-group transactions, income and expenses are eliminated in full.
There are no significant restrictions on the ability of the Subsidiary to transfer funds to the Parent (the Company) in the form of cash dividend or repayment of loans and advances.
As at 31 MarchCompany
2018Company
2017
Holding Cost Market value Cost Market value
% Rs. '000 Rs. '000 Rs. '000 Rs. '000
L B Microfinance Myanmar Company Limited 99.7 152,915 152,915 - -
The L B Microfinance Myanmar Company Limited was incorporated as a 99% (99.7% - 31 March 2018) owned Subsidiary in Myanmar. The Company obtained a licence from the Myanmar Microfinance Supervisory Enterprise to operate as a microfinance organisation.
Cost is assumed to be the best approximation for the market value of the investment due to the absence of most recent exit prices.
4.23 PROPERTY, PLANT AND EQUIPMENT
Property, plant and equipment are tangible items that are held for use in the production or supply of goods or services, for rental to others or for administrative purposes and are expected to be used during more than one period. The Group applies the requirements of the Sri Lanka Accounting Standard - LKAS 16 (Property, Plant and Equipment) in accounting for these assets.
Accounting policy
Basis of recognition
Property, plant and equipment are recognised if it is probable that future economic benefits associated with the asset will flow to the Group and the cost of the asset can be reliably measured.
Measurement
An item of property, plant and equipment that qualifies for recognition as an asset is initially measured at its cost. Cost includes expenditure that is directly attributable to the acquisition of the asset and cost incurred subsequently to add to, replace part of, or service it. The cost of self constructed assets includes the cost of materials and direct labour, any other costs directly attributable to bringing the asset to a working condition for its intended use and the costs of dismantling and removing the items and restoring the site on which they are located. Purchased software that is integral to the functionality of the related equipment is capitalised as part of computer equipment.
FIN
AN
CIA
L R
EP
OR
TS

370 L B Finance PLC . Annual Report 2017/18
4.23 PROPERTY, PLANT AND EQUIPMENT (Contd..)
Cost model
The Group applies cost model to property, plant and equipment and records at cost of purchase or construction together with any incidental expenses thereon less accumulated depreciation and any accumulated impairment losses. Such cost includes the cost of replacing part of the equipment when that cost is incurred, if the recognition criteria are met.
Subsequent cost
The subsequent cost of replacing a component of an item of property, plant and equipment is recognised in the carrying amount of the item if it is probable that the future economic benefits embodied within that part will flow to the Group and its cost can be reliably measured. The costs of day-to-day servicing of property, plant and equipment are charged to the Income Statement as incurred. Costs incurred in using or redeploying an item is not included under the carrying amount of an item.
Derecognition
The carrying amount of an item of property, plant and equipment is derecognised on disposal or when no future economic benefits are expected from its use or disposal. The gain or loss arising from derecognition of an item of property, plant and equipment is included in the Income Statement when the item is derecognised.
When replacement costs are recognised in the carrying amount of an item of property, plant and equipment, the remaining carrying amount of the replaced part is derecognised. Major inspection costs are capitalised. At each such capitalisation, the remaining carrying amount of the previous cost of inspections is derecognised.
Depreciation
The Group provides depreciation from the date the assets are available for use up to the date of disposal, at the following rates on a straight line basis over the periods appropriate to the estimated useful lives, based on the pattern in which the asset’s future economic benefits are expected to be consumed by the Group. Depreciation of an asset ceases at the earlier of the date that the asset is classified as held for sale or the date that the asset is derecognised. Depreciation does not cease when the assets become idle or is retired from active use unless the asset is fully depreciated. Freehold land is not depreciated.
The estimated useful lives of the property, plant and equipment of the Company as at 31 March 2018 are as follows;
Asset category Period (years) Depreciation % per annum
Freehold buildings 50 2%Leasehold properties and improvements 6.67 15%Computer equipment 5 20%Motor vehicles 5 - 8 12.50 - 20%Office equipment 5 20%Furniture and fittings 5 - 6.67 15 - 20%Air conditioning equipment 5 20%Telephone system 5 20%Fire protection equipment 5 20%Fixtures and fittings 3 33.33%
The above rates are compatible with the rates used by all Group entities.
Accounting estimates
Useful life-time of the property, plant and equipment
The Group reviews the residual values, useful lives and methods of depreciation of property, plant and equipment at each reporting date. Judgment of the management is exercised in the estimation of these values, rates, methods and hence they are subject to uncertainty.
Notes to the Financial Statements

L B Finance PLC . Annual Report 2017/18 371
4.23
.1 C
ompa
ny -
2018
Fr
eeho
ld
la
nd
Free
hold
build
ing
Fu
rnitu
re
an
d fit
tings
Of
fice
eq
uipm
ent
M
otor
vehi
cles a
nd
ac
cess
ories
Co
mpu
ter
eq
uipm
ent
Ai
r
cond
itioni
ng
eq
uipm
ent
Te
leph
one
sy
stem
Fi
re
pr
otec
tion
equi
pmen
t
Le
aseh
old
impr
ovem
ents
Fi
xtur
es
an
d fit
tings
To
tal
Rs. ‘0
00Rs
. ‘000
Rs. ‘0
00Rs
. ‘000
Rs. ‘0
00Rs
. ‘000
Rs. ‘0
00Rs
. ‘000
Rs. ‘0
00Rs
. ‘000
Rs. ‘0
00Rs
. ‘000
Cost
Balan
ce as
at 1
April
2017
1,73
3,299
77
8,527
26
4,230
40
8,095
36
9,446
38
2,763
22
2,543
78
,647
17,44
7 83
8,684
47
,297
5,14
0,978
Addit
ions
1,00
1,672
1,
294
25,76
7 10
0,331
44
,975
176,9
26
38,59
2 2,
707
7,04
4 10
0,960
37
,067
1,53
7,335
Trans
fers
- 8,
560
- (1
58)
- -
- -
158
(8,56
0) -
-
Disp
osals
/writ
e-offs
- -
(1,70
9) -
(10,0
44)
(467
) (4
,163)
(196
) -
(276
) -
(16,8
55)
Balan
ce as
at 31
Marc
h 201
8 2,
734,9
71
788,3
81
288,2
88
508,2
68
404,3
77
559,2
22
256,9
72
81,15
8 24
,649
930,8
08
84,36
4 6,
661,4
58
Accu
mula
ted d
epre
ciatio
n
and i
mpa
irmen
t loss
es
Balan
ce as
at 1
April
2017
- 67
,075
151,6
49
291,3
16
140,2
92
274,4
49
131,8
60
72,71
6 14
,229
451,9
38
31,09
8 1,
626,6
22
Charg
e for
the y
ear
- 15
,746
35,06
3 50
,088
46,30
3 61
,522
31,35
8 2,
502
1,78
1 10
7,602
13
,634
365,5
99
Impa
irmen
t loss
--
--
--
--
--
--
Trans
fers
- 14
-
(5)
- -
- -
5
(14)
- -
Disp
osals
/writ
e-offs
- -
(1,52
5) -
(5,03
1) (3
43)
(4,15
5) (5
2) -
(276
) -
(11,3
82)
Balan
ce as
at 31
Marc
h 201
8 -
82,83
5 18
5,187
34
1,399
18
1,564
33
5,628
15
9,063
75
,166
16,01
5 55
9,250
44
,732
1,98
0,839
Net b
ook v
alue
as
at 31
Marc
h 201
8 2,
734,9
71
705,5
46
103,1
01
166,8
69
222,8
13
223,5
94
97,90
9 5,
992
8,63
4 37
1,558
39
,632
4,68
0,619
FIN
AN
CIA
L R
EP
OR
TS

372 L B Finance PLC . Annual Report 2017/18
4.23
.2
Com
pany
- 20
17
Fr
eeho
ld
la
nd
Free
hold
build
ing
Fu
rnitu
re
an
d fit
tings
Of
fice
eq
uipm
ent
Mot
or
ve
hicle
s and
acce
ssor
ies
Co
mpu
ter
eq
uipm
ent
Air
co
nditio
ning
equi
pmen
t Te
leph
one
sy
stem
Fi
re
pr
otec
tion
equi
pmen
t Le
aseh
old
im
prov
emen
ts
Fixt
ures
and
fittin
gs
Tota
l
Rs. ‘0
00Rs
. ‘000
Rs. ‘0
00Rs
. ‘000
Rs. ‘0
00Rs
. ‘000
Rs. ‘0
00Rs
. ‘000
Rs. ‘0
00Rs
. ‘000
Rs. ‘0
00Rs
. ‘000
Cost
Balan
ce as
at 1
April
2016
495,2
26
630,6
27
228,5
68
349,6
94
309,0
15
335,0
18
169,5
59
75,64
1 15
,978
727,5
40
33,26
9 3,
370,1
35
Addit
ions
1,23
8,073
14
7,900
36
,617
58,51
0 94
,047
47,74
5 54
,281
3,00
6 1,
469
113,4
82
14,02
8 1,
809,1
58
Trans
fers
- -
- -
- -
- -
- -
- -
Disp
osals
/writ
e-offs
- -
(955
) (1
09)
(33,6
16)
- (1
,297)
- -
(2,33
8) -
(38,3
15)
Balan
ce as
at 31
Marc
h 201
7 1,
733,2
99
778,5
27
264,2
30
408,0
95
369,4
46
382,7
63
222,5
43
78,64
7 17
,447
838,6
84
47,29
7 5,
140,9
78
Accu
mula
ted d
epre
ciatio
n
and i
mpa
irmen
t loss
es
Balan
ce as
at 1
April
2016
- 53
,723
120,7
33
243,5
78
121,5
79
230,4
04
100,7
93
64,70
7 11
,588
351,4
75
26,26
1 1,
324,8
41
Charg
e for
the y
ear
- 13
,352
31,72
4 47
,738
41,26
4 44
,045
32,05
5 8,
009
2,64
1 10
0,463
4,
837
326,1
28
Impa
irmen
t loss
--
--
--
--
--
--
Trans
fers
- -
- -
- -
- -
- -
- -
Disp
osals
/writ
e-offs
- -
(808
) -
(22,5
51)
- (9
88)
- -
- -
(24,3
47)
Balan
ce as
at 31
Marc
h 201
7 -
67,07
5 15
1,649
29
1,316
14
0,292
27
4,449
13
1,860
72
,716
14,22
9 45
1,938
31
,098
1,62
6,622
Net b
ook v
alue
as
at 31
Marc
h 201
7 1,
733,2
99
711,4
52
112,5
81
116,7
79
229,1
54
108,3
14
90,68
3 5,
931
3,21
8 38
6,746
16
,199
3,51
4,356
Notes to the Financial Statements

L B Finance PLC . Annual Report 2017/18 373
4.23
.3
Gro
up -
2018
Fr
eeho
ld
la
nd
Free
hold
build
ing
Fu
rnitu
re
an
d fit
tings
Of
fice
eq
uipm
ent
M
otor
v
ehicl
es an
d
ac
cess
ories
Co
mpu
ter
eq
uipm
ent
Ai
r c
ondi
tioni
ng
eq
uipm
ent
Te
leph
one
syst
em
Fire
prot
ectio
n
eq
uipm
ent
Le
aseh
old
im
prov
emen
ts
Fixt
ures
and
fittin
gs
Tota
l
Rs. ‘0
00Rs
. ‘000
Rs. ‘0
00Rs
. ‘000
Rs. ‘0
00Rs
. ‘000
Rs. ‘0
00Rs
. ‘000
Rs. ‘0
00Rs
. ‘000
Rs. ‘0
00Rs
. ‘000
Cost
Balan
ce as
at 1
April
2017
1,73
3,299
77
8,527
26
4,230
40
8,095
36
9,446
38
2,763
22
2,543
78
,647
17,44
7 83
8,684
47
,297
5,14
0,978
Addit
ions
1,00
1,672
1,
294
26,08
6 10
0,644
45
,063
177,5
24
38,59
2 2,
707
7,04
4 10
0,960
37
,067
1,53
8,653
Trans
fers
-
8,56
0 -
(1
58)
-
-
-
-
158
(8,56
0) -
-
Exch
ange
rate
varia
nce
-
-
-
-
-
-
-
-
-
- -
-
Disp
osals
/writ
e-offs
-
-
(1,70
9) -
(1
0,044
) (4
67)
(4,16
3) (1
96)
-
(276
) -
(1
6,855
)
Balan
ce as
at 31
Marc
h 201
8 2,
734,9
71
788,3
81
288,6
07
508,5
81
404,4
65
559,8
20
256,9
72
81,15
8 24
,649
930,8
08
84,36
4 6,
662,7
76
Accu
mula
ted d
epre
ciatio
n
and i
mpa
irmen
t loss
es
Balan
ce as
at 1
April
2017
-
67,07
5 15
1,649
29
1,316
14
0,292
27
4,449
13
1,860
72
,716
14,22
9 45
1,938
31
,098
1,62
6,622
Charg
e for
the y
ear
-
15,74
6 35
,082
50,10
3 46
,308
61,56
8 31
,358
2,50
2 1,
781
107,6
02
13,63
4 36
5,684
Impa
irmen
t loss
--
--
--
--
--
--
Trans
fers
-
14
-
(5)
-
-
-
-
5
(14)
-
-
Exch
ange
rate
varia
nce
-
-
1
- -
2
-
-
-
-
-
3
Disp
osals
/writ
e-offs
-
-
(1,52
5) -
(5
,031)
(343
) (4
,155)
(52)
-
(276
) -
(1
1,382
)
Balan
ce as
at 31
Marc
h 201
8 -
82
,835
185,2
07
341,4
14
181,5
69
335,6
76
159,0
63
75,16
6 16
,015
559,2
50
44,73
2 1,
980,9
27
Net b
ook v
alue
as at
31
Mar
ch 2
018
2,7
34,9
71
705
,546
1
03,4
00
167
,167
2
22,8
96
224
,144
9
7,90
9 5
,992
8
,634
3
71,5
58
39,
632
4,68
1,849
FIN
AN
CIA
L R
EP
OR
TS

374 L B Finance PLC . Annual Report 2017/18
4.23.4 Property, plant and equipment acquired during the financial year - Company
During the financial year, the Company acquired property, plant and equipment to the aggregate value of Rs.1,537,334,911/- (2017 - Rs.1,809,158,235/-). Cash payments amounting to Rs.1,537,334,911/- (2017 - Rs.1,809,158,235/-) was paid during the year for purchases of property, plant and equipment.
4.23.5 Property, plant and equipment subjected to operating lease - Company
Included in property, plant and equipment are assets subject to operating lease where the Company is a lessor. At 31 March 2018, the net carrying value amount of those assets was Rs. 76,777,437/- (2017 - Rs. 2,136,680/-), on which the accumulated depreciation as at 31 March 2018 was Rs. 12,666,606/- (2017 - Rs. 2,794,120/-).
Summary of future operating lease receivable was as follows;
As at 31 March 2018 Within one year 1 - 5 Years Over 5 years TotalRs. '000 Rs. '000 Rs. '000 Rs. '000
Future operating lease receivable 28,176 89,283 - 117,459
As at 31 March 2017 Within one year 1 - 5 Years Over 5 years TotalRs. '000 Rs. '000 Rs. '000 Rs. '000
Future operating lease receivable 2,822 3,292 - 6,114
4.23.6 Borrowing costs - Company
There were no capitalised borrowing costs related to the acquisition of property, plant and equipment during the financial year 2018 (2017 – Nil).
4.23.7 Fully-depreciated property, plant and equipment - Company
The initial cost of fully-depreciated property, plant and equipment, which are still in use as at reporting date is Rs. 990,384,154/- (2017 - Rs. 663,751,092/-).
4.23.8 Lease commitments - Company
The Company leases land, buildings, and equipment under agreements that expire over various contractual periods. Minimum operating lease commitments as follows;
As at 31 March 2018 Within one year 1 - 5 Years Over 5 years TotalRs. '000 Rs. '000 Rs. '000 Rs. '000
Minimum operating lease commitments 234,267 822,087 574,458 1,630,812
As at 31 March 2017 Within one year 1 - 5 Years Over 5 years TotalRs. '000 Rs. '000 Rs. '000 Rs. '000
Minimum operating lease commitments 188,404 650,787 393,572 1,232,763
Operating lease expense for the years ended 31 March was as follows;
2018 2017Rs. '000 Rs. '000
Operating lease expense 220,074 192,102
Notes to the Financial Statements

L B Finance PLC . Annual Report 2017/18 375
4.23.9 Information on the freehold land and buildings - Company
As at 31 March 2018 2017Extent
(perches)Buildings
(square feets)
Revalued amount
Net book value
Revalued amount as a % of net book value
Net book value
Location Rs. '000 Rs. ‘000 Rs. '000
KollupitiyaNo 20, Dharmapala Mawatha, Colombo 03. 52.82 65,000 1,525,000 906,946 168 919,496
KollupitiyaNo 676, Galle Road,Colombo 03. 149.35 51,410 3,733,750 1,964,097 190 1,351,260
KandyNo 226, D S Senanayaka Street,Kandy. 7.05 3,674 61,000 10,466 583 10,527
KandyMoragaspitiyawatta Road,Balagolla, Kengalla. 110.00 - 43,800 29,919 146 21,544
KandyNo 47/10A, Luwiss Pieris Mawatha, Buwelikada, Kandy. 42.40 - 35,000 34,085 103 33,974
MaradanaNo 104/1, Vipulasena Mawatha,Colombo 10. 50.60 - 320,850 44,768 717 43,044
Nuwara EliyaNo 35/4, Upper Lake Road,Nuwara Eliya. 359.00 - 245,000 64,906 377 64,906
WellawattaNo 51A, W A Silva Mawatha,Colombo 06. 14.23 - 156,107 156,107 100 N/A*
PanaduraNo 37, Jayathilake Mawatha,Panadura. 42.00 - 104,224 104,224 100 N/A*
Valuation of freehold land and buildings of the Company was carried out as at 31 March 2018 by H.B. Manjula Basnayaka. AIV (Sri Lanka), N.C.T., QS, (COT), incorporated valuer. Investment method, Contractor’s Test method and Comparison method have been used for the valuation.
Freehold land and buildings of the Company are considered under Level 3 of fair value hierarchy.
*Freehold land and buildings purchased during the financial year ended 31 March 2018.
FIN
AN
CIA
L R
EP
OR
TS

376 L B Finance PLC . Annual Report 2017/18
4.23.10 Title restriction on property, plant and equipment - Company
There were no restrictions existing on the title of the property, plant and equipment of the Company as at the reporting date.
4.23.11 Property, plant and equipment pledged as security for liabilities - Company
There were no items of property, plant and equipment pledged as securities for liabilities as at the reporting date.
4.23.12 Compensation from third parties for items of property, plant and equipment - Company
There were no compensation receivable from third parties for items of property, plant and equipment that were impaired, lost or given up as at the reporting date.
4.23.13 Temporarily idle property, plant and equipment - Company
There were no temporarily idle property, plant and equipment as at the reporting date.
4.23.14 Property, plant and equipment retired from active use - Company
There were no property, plant and equipment retired from active use as at the reporting date.
4.24 INTANGIBLE ASSETS
An intangible asset is an identifiable monetary asset without physical substance held for use in the production or supply of goods or services, for rental to others or for administrative purposes.
Accounting policy
Basis of recognition
An intangible asset is recognised if it is probable that the future economic benefits that are attributable to the asset will flow to the entity and the cost of the assets can be measured reliably. An intangible asset is initially measured at cost.
Computer software
Cost of all computer software licensed for use by the Group, which are not integrally related to associated hardware, which can be clearly identified, reliably measured and it’s probable that they will lead to future economic benefits, are included in the Statement of Financial Position under the category of intangible assets and carried at cost less accumulated amortisation and any accumulated impairment losses.
Subsequent expenditure
Expenditure incurred on software is capitalised only when it is probable that this expenditure will enable the asset to generate future economic benefits in excess of its originally assessed standard of performance and this expenditure can be measured and attributed to the asset reliably. All other expenditure is expensed as incurred.
Derecognition of intangible assets
The carrying amount of an item of intangible asset is derecognised on disposal or when no future economic benefits are expected from its use. The gain or loss arising from derecognition of an item of intangible asset is included in the Income Statement when the item is derecognised.
Amortisation of intangible assets
Intangible assets, except for goodwill, are amortised on a straight line basis in the Income Statement from the date when the asset is available for use, over the best estimate of its useful economic life based on a pattern in which the asset’s economic benefits are consumed by the Group. Indefinite-lived intangible assets are not amortized, but are tested for impairment annually or more frequently if events or circumstances indicate the asset may be impaired. The only finite-lived intangible asset is the computer software of the Group. There is no indefinite-lived intangibles assets which are subject to annual impairment test. Amortisation methods, useful lives and residual values are reviewed at each reporting date and adjusted if appropriate. The Group assumes that there is no residual value for its intangible assets.
Notes to the Financial Statements

L B Finance PLC . Annual Report 2017/18 377
4.24 INTANGIBLE ASSETS (Contd.)
Intangible assets mainly represent the cost of computer software and the useful life time is as follows;
Intangible asset category Period
Computer software 5 years
Computer software
Company Group
2018 2017 2018
Rs. ‘000 Rs. ‘000 Rs. ‘000
Cost
Cost as at the beginning of the year 146,647 115,134 146,647
Additions and improvements 17,566 31,513 22,739
Exchange rate variance - - -
Cost as at the end of the year 164,213 146,647 169,386
Amortisation and impairment losses
Amortisation as at the beginning of the year 97,458 80,368 97,458
Charge for the year 18,636 17,090 19,053
Impairment loss - - -
Exchange rate variance - - 14
Accumulated amortisation as at the end of the year 116,094 97,458 116,525
Net book value as at 31 March 48,119 49,189 52,861
Amortisation for intangible assets is forecasted to be Rs.17 million for the Company and Rs.18 million for the Group in 2019 and each year thereafter.
4.24.1 There were no restrictions on the title of the intangible assets as at the reporting date. Further there were no items pledged as securities for liabilities. FI
NA
NC
IAL
RE
PO
RT
S

378 L B Finance PLC . Annual Report 2017/18
4.25 DUE TO BANKS
Accounting policy
These include bank overdrafts, finance leases, syndicated loans and other bank facilities. Due to bank balances are initially recognised at fair value net of transactions cost. Subsequently, they are stated at amortised cost; any difference between the proceeds (Net of transaction cost) and the repayable amount (including interest) is recognised in the Income Statement over the period of the loan using effective interest rate method.
Under finance leases, the leased assets are capitalised and included in ‘property, plant and equipment’ and the corresponding liability to the lessor is included in ‘Due to Banks’. A finance lease and its corresponding liability are recognised initially at the fair value of the asset or, if lower, the present value of the minimum lease payments. Finance charges payable are recognised in ‘Interest Expense’ over the period of the lease based on the interest rate implicit in the lease so as to give a constant rate of interest on the remaining period of the liability.
Company & Group Company2018 2017
Rs. ‘000 Rs. ‘000
Bank overdrafts 1,285,356 1,035,268 Syndicated loans and other bank facilities (Note 4.25.1) 21,552,682 22,742,879
22,838,038 23,778,147 Fair value 22,805,871 22,716,272
Notes to the Financial Statements

L B Finance PLC . Annual Report 2017/18 379
4.25.1 (a) Syndicated loans and other bank facilities
As at *Loans Interest Repayments As at
1 April 2017 obtained recognised Capital Interest 31 March 2018
Rs. ‘000 Rs. ‘000 Rs. ‘000 Rs. ‘000 Rs. ‘000 Rs. ‘000
Syndicated loansSyndication 1 201,312 - 21,468 (70,313) (22,268) 130,199 Syndication 2 2,035,087 - 167,223 (675,000) (168,157) 1,359,153 Syndication 3 2,883,201 - 281,060 (660,000) (281,990) 2,222,271 Syndication 4 2,260,744 - 300,806 (341,250) (295,097) 1,925,203 Syndication 5 - 1,491,938 171,970 (100,000) (105,472) 1,458,436 Syndication 6 - 1,984,408 3,614 - - 1,988,022
7,380,344 3,476,346 946,141 (1,846,563) (872,984) 9,083,284
Term loansBank of Ceylon 1 873,949 - 63,495 (500,000) (61,246) 376,198 Bank of Ceylon 2 4,161,370 - 387,217 (1,250,000) (378,288) 2,920,299 Commercial Bank 1 1,780,043 - 128,480 (666,000) (129,032) 1,113,491 Commercial Bank 2 813,721 - 75,252 (250,000) (75,532) 563,441 Commercial Bank 3 2,003,419 - 283,425 (333,000) (283,517) 1,670,327 Commercial Bank 4 - 500,000 4,411 (500,000) (4,411) - Commercial Bank 5 - 1,000,000 4,997 - - 1,004,997 Nations Trust Bank 1 402,293 - 10,572 (400,000) (12,865) - Nations Trust Bank 2 1,001,151 - 131,430 (210,000) (131,160) 791,421 Hatton National Bank 1 1,174,211 - 81,282 (399,960) (83,689) 771,844
Hatton National Bank 2 1,124,089 - 141,405 (300,000) (140,821) 824,673
Hatton National Bank 3 - 800,000 64,909 (140,000) (61,302) 663,607
Union Bank 301,979 - 23,947 (125,000) (23,766) 177,160
Habib Bank 300,107 - 20,217 (300,000) (20,324) -
Public Bank 1 180,286 - 18,565 (40,000) (18,608) 140,243
Public Bank 2 99,950 - 10,659 (20,000) (10,607) 80,002
Seylan Bank 945,686 - 121,563 (250,008) (123,544) 693,697
Standard Chartered Bank 1 200,281 - 6,247 (200,000) (6,528) -
Standard Chartered Bank 2 - 250,000 15,966 (250,000) (15,966) -
Standard Chartered Bank 3 - 300,000 2,959 (300,000) (2,959) -
DFCC Bank - 748,750 45,852 (78,125) (38,479) 677,998
15,362,535 3,598,750 1,642,850 (6,512,093) (1,622,644) 12,469,398
22,742,879 7,075,096 2,588,991 (8,358,656) (2,495,628) 21,552,682
*Net of transaction cost The Group has unutilised borrowing facilities of Rs. 2,407,119,207/- as at 31 March 2018 (2017 - Rs. 2,194,629,312/-).Details of the assets pledged as security for liabilities are disclosed in Note 6.7 to these Financial Statements.
FIN
AN
CIA
L R
EP
OR
TS

380 L B Finance PLC . Annual Report 2017/18
4.25.1(b) Contractual maturity analysis of syndicated loans and other bank facilities - Company & Group
As at 31 March 2018 Within one year 1 - 5 Years Over 5 years TotalRs. '000 Rs. '000 Rs. '000 Rs. '000
Syndicated loans 2,631,708 6,451,576 - 9,083,284 Term loans 6,097,049 6,372,349 - 12,469,398
8,728,757 12,823,925 - 21,552,682
Contractual maturity analysis of syndicated loans and other bank facilities - Company
As at 31 March 2017 Within one year 1 - 5 Years Over 5 years TotalRs. '000 Rs. '000 Rs. '000 Rs. '000
Syndicated loans 1,787,033 5,593,311 - 7,380,344 Term loans 5,285,015 10,077,520 - 15,362,535
7,072,048 15,670,831 - 22,742,879
We do not have pre-termination options for syndicated loans and other bank facilities.
4.26 DUE TO CUSTOMERS
Accounting policy
Due to customers comprise of interest-bearing savings deposits and term deposits. Customer deposits are initially recognised at fair value net of transactions cost. Subsequent to the initial recognition they are measured at their amortised cost using the effective interest rate method. Interest expense on these deposits is recognised in the Income Statement.
Company Group
2018 2017 2018
Rs. ‘000 Rs. ‘000 Rs. ‘000
Fixed deposits 69,888,343 57,888,811 69,888,343
Certificates of deposit 100,772 153,987 100,772
Savings deposits 2,954,718 2,359,157 2,956,896
72,943,833 60,401,955 72,946,011
Fair value 73,617,203 60,267,371 73,619,381
4.26.1 Sri Lanka Deposit Insurance and Liquidity Support Scheme - Company
Under the Direction No 2 of 2010 [Finance Companies (Insurance of Deposit Liabilities)] issued by the Central Bank of Sri Lanka and subsequent amendments thereto, all the eligible deposit liabilities have been insured with the Sri Lanka Deposit Insurance and Liquidity Support Scheme implemented by the Monetary Board for compensation up to a maximum of Rs. 600,000/- for each depositor. The Company has paid Rs. 93,016,500/- as the premium of the said Insurance scheme during the current financial year (2017 - Rs. 74,336,024/-).
Notes to the Financial Statements
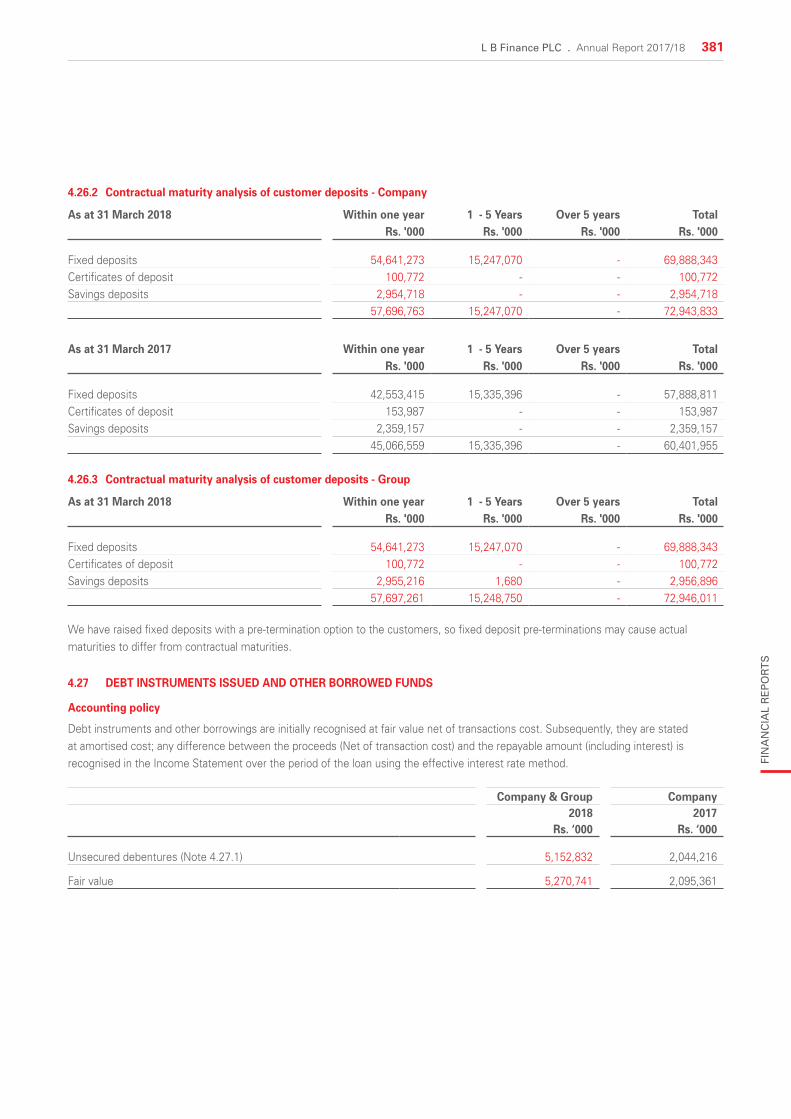
L B Finance PLC . Annual Report 2017/18 381
4.26.2 Contractual maturity analysis of customer deposits - Company
As at 31 March 2018 Within one year 1 - 5 Years Over 5 years TotalRs. '000 Rs. '000 Rs. '000 Rs. '000
Fixed deposits 54,641,273 15,247,070 - 69,888,343 Certificates of deposit 100,772 - - 100,772 Savings deposits 2,954,718 - - 2,954,718
57,696,763 15,247,070 - 72,943,833
As at 31 March 2017 Within one year 1 - 5 Years Over 5 years TotalRs. '000 Rs. '000 Rs. '000 Rs. '000
Fixed deposits 42,553,415 15,335,396 - 57,888,811 Certificates of deposit 153,987 - - 153,987 Savings deposits 2,359,157 - - 2,359,157
45,066,559 15,335,396 - 60,401,955
4.26.3 Contractual maturity analysis of customer deposits - Group
As at 31 March 2018 Within one year 1 - 5 Years Over 5 years TotalRs. '000 Rs. '000 Rs. '000 Rs. '000
Fixed deposits 54,641,273 15,247,070 - 69,888,343 Certificates of deposit 100,772 - - 100,772 Savings deposits 2,955,216 1,680 - 2,956,896
57,697,261 15,248,750 - 72,946,011
We have raised fixed deposits with a pre-termination option to the customers, so fixed deposit pre-terminations may cause actual maturities to differ from contractual maturities.
4.27 DEBT INSTRUMENTS ISSUED AND OTHER BORROWED FUNDS
Accounting policy
Debt instruments and other borrowings are initially recognised at fair value net of transactions cost. Subsequently, they are stated at amortised cost; any difference between the proceeds (Net of transaction cost) and the repayable amount (including interest) is recognised in the Income Statement over the period of the loan using the effective interest rate method.
Company & Group Company2018 2017
Rs. ‘000 Rs. ‘000
Unsecured debentures (Note 4.27.1) 5,152,832 2,044,216
Fair value 5,270,741 2,095,361
FIN
AN
CIA
L R
EP
OR
TS

382 L B Finance PLC . Annual Report 2017/18
4.27.1 Unsecured debentures
The terms and features of unsecured redeemable subordinated debentures are as follows;
Category Interest payable Features Amortised cost Rs. ‘000
Face value Rs. ‘000
Interest rate Issued date Redemption date
Type A Monthly Listed 639,497 640,140 14.00% p.a 29 November 2013 29 November 2018
Type B Biannually Listed 783,288 757,010 14.50% p.a 29 November 2013 29 November 2018
Type C Annually Listed 624,519 602,850 15.00% p.a 29 November 2013 29 November 2018
Type A Biannually Listed 1,034,167 1,000,000 12.75% p.a 11 December 2017 11 December 2022
Type B Biannually Listed 2,071,361 2,000,000 13.25% p.a 11 December 2017 11 December 2022
5,152,832 5,000,000
4.27.2 Contractual maturity analysis of debt instruments issued and other borrowed funds - Company & Group
As at 31 March 2018 Within one year 1 - 5 Years Over 5 years TotalRs. '000 Rs. '000 Rs. '000 Rs. '000
Unsecured debentures 2,163,729 2,989,103 - 5,152,832
Contractual maturity analysis of debt instruments issued and other borrowed funds - Company
As at 31 March 2017 Within one year 1 - 5 Years Over 5 years TotalRs. '000 Rs. '000 Rs. '000 Rs. '000
Unsecured debentures 46,275 1,997,941 - 2,044,216
We do not have pre-termination options for debt instruments issued and other borrowed funds.
4.28 OTHER FINANCIAL LIABILITIES
Accounting policy
Other financial liabilities are recognised initially at fair value and subsequently measured at amortised cost using the effective interest rate method. Trade payables are obligations to pay for vehicle suppliers in the ordinary course of business.
Company Group
2018 2017 2018
Rs. ‘000 Rs. ‘000 Rs. ‘000
Trade payables 462,654 743,139 462,654
Insurance premium payable 632,727 555,153 632,727
Unclaimed balances 529,475 549,243 529,475
Advances collected from customers 38,889 81,440 38,889
Sundry creditors 97,673 78,427 97,673
1,761,418 2,007,402 1,761,418
Fair value 1,761,418 2,007,402 1,761,418
Notes to the Financial Statements

L B Finance PLC . Annual Report 2017/18 383
4.29 OTHER NON-FINANCIAL LIABILITIES
Accounting policy
Group classifies all non-financial liabilities other than post employment benefit liability, deferred tax liabilities and current tax liabilities under other non-financial liabilities. Other non-financial liabilities include accruals, advances and provisions. These liabilities are non-interest bearing and recorded at the amounts that are expected to be paid.
Provisions
Provisions are recognised when the Group has a present obligation (legal or constructive) as a result of a past event, and it is probable that an outflow of resources embodying economic benefits will be required to settle the obligation and a reliable estimate can be made of the amount of the obligation. The expense relating to any provision is presented in the Income Statement net of any reimbursement.
Company Group
2018 2017 2018
Rs. ‘000 Rs. ‘000 Rs. ‘000
Accrued expenses 667,097 516,348 667,097
Stamp duty payable 101,434 75,317 101,434
EPF/ETF payable 36,127 33,468 36,127
Withholding tax payable 9,257 15,360 9,257
Crop insurance levy payable 12,202 9,667 12,202
Sundry creditors 26,598 23,276 27,048
852,715 673,436 853,165
4.30 CURRENT TAX LIABILITIES
Company Group
2018 2017 2018
Rs. ‘000 Rs. ‘000 Rs. ‘000
Income tax 468,362 508,963 468,362
Value Added Tax (VAT) 146,024 167,529 146,024
Nation Building Tax (NBT) 18,672 14,599 18,672
633,058 691,091 633,058
FIN
AN
CIA
L R
EP
OR
TS

384 L B Finance PLC . Annual Report 2017/18
4.31 DEFERRED TAXATION
Accounting policy
Deferred tax is provided on temporary differences at the reporting date between the tax bases of assets and liabilities and their carrying amounts for financial reporting purposes. Deferred tax liabilities are recognised for all taxable temporary differences.
Deferred tax assets are recognised for all deductible temporary differences, carry forward of unused tax credits and unused tax losses (if any), to the extent that it is probable that taxable profit will be available against which the deductible temporary differences and the unused tax credits and unused tax losses carried forward can be utilized.
The carrying amount of deferred tax assets is reviewed at each reporting date and reduced to the extent that it is no longer probable that sufficient taxable profit will be available to allow all or part of the deferred tax asset to be utilised. Unrecognised deferred tax assets are reassessed at each reporting date and are recognised to the extent that it has become probable that future taxable profit will allow the deferred tax asset to be recovered.
Deferred tax assets and liabilities are measured at the tax rates that are expected to apply in the year when the asset is realised or the liability is settled, based on tax rates (and tax laws) that have been enacted or substantively enacted at the reporting date. Deferred tax assets and deferred tax liabilities are offset if a legally enforceable right exists to set off current tax assets against current tax liabilities and the deferred taxes relate to the same taxable entity and the same taxation authority.
Accounting estimates
Deferred tax assets are recognised in respect of tax losses to the extent that it is probable that future taxable profits will be available against which such tax losses can be utilised. Judgment is required to determine the amount of deferred tax assets that can be recognised, based upon the likely timing and level of future taxable profits, together with the future tax planning strategies.
Deferred tax assets, liabilities and income tax relates to the followings ;
Reflected inStatement of financial position
Reflected inIncome statement
Reflected inStatement of comprehensive income
Company Group Company Group Company Group
2018 2017 2018 2018 2017 2018 2018 2017 2018
Rs. '000 Rs. '000 Rs. '000 Rs. '000 Rs. '000 Rs. '000 Rs. '000 Rs. '000 Rs. '000
Deferred tax liability
Depreciation of leased assets 922,285 354,983 922,285 567,302 341,254 567,302 - - -
Depreciation of property, plant and equipment 221,934 191,519 221,934 30,415 26,586 30,415 - - -
1,144,219 546,502 1,144,219 597,717 367,840 597,717 - - -
Deferred tax assets
Defined benefit obligation - income statement (47,238) (38,891) (47,238) (8,347) (6,256) (8,347) - - -
Defined benefit obligation - other comprehensive income (OCI) (17,509) (4,123) (17,509) - - - (13,386) (1,238) (13,386)
Carried forward impairment provision (20,722) - (20,722) (20,722) - (20,722)
(85,469) (43,014) (85,469) (29,069) (6,256) (29,069) (13,386) (1,238) (13,386)
Deferred income tax charge/ (reversal) - - - 568,648 361,584 568,648 (13,386) (1,238) (13,386)
Net deferred tax liability/(asset) 1,058,750 503,488 1,058,750
4.31.1 Deferred tax has been determined based on the enacted tax rate of 28% for the Company.
Notes to the Financial Statements

L B Finance PLC . Annual Report 2017/18 385
4.32 POST EMPLOYEMENT BENEFIT LIABILITY
Accounting estimates
Our end of service benefit obligations are measured based on the present value of projected future benefit payments for all participants for services rendered to date. The measurement of projected future benefits is dependent on the stipulated formula, salary assumptions, demographics of the group covered by the plan, and other key measurement assumptions. The net periodic benefit costs associated with the Company’s defined benefit plans are determined using assumptions regarding the benefit obligations. Due to the long-term nature of these plans, such estimates are subject to significant uncertainty. All assumptions are reviewed at each reporting date.
In determining the appropriate discount rate, management considers the interest rates of Sri Lanka Government Bonds with extrapolated maturities corresponding to the expected duration of the defined benefit obligation. The mortality rate is based on publicly available mortality tables. Future salary increases are based on expected future inflation rates and expected future salary increase rate of the Company.
Recognition of actuarial gains and losses
The Company recognises the total actuarial gains and losses that arise in calculating the Company’s obligation in respect of the plan in Other Comprehensive Income during the period in which it occurs.
Expected return on assets
Expected return on assets is zero as the plan is not pre-funded.
Funding arrangements
The gratuity liability is not externally funded.
4.32.1 Post employment benefit liability
Company Group
2018 2017 2018
Rs. ‘000 Rs. ‘000 Rs. ‘000
Balance at the beginning of the year 153,621 126,859 153,621
Amount charged/(reversed) for the year 92,496 41,550 92,496
Payments made during the year (14,877) (14,788) (14,877)
Balance at the end of the year 231,240 153,621 231,240
4.32.2 Amounts recognised in the Income Statement
Company Group
2018 2017 2018
Rs. ‘000 Rs. ‘000 Rs. ‘000
Current service cost for the year 25,932 21,907 25,932
Interest cost on the net defined benefit liability for the year 18,757 15,223 18,757
44,689 37,130 44,689
FIN
AN
CIA
L R
EP
OR
TS
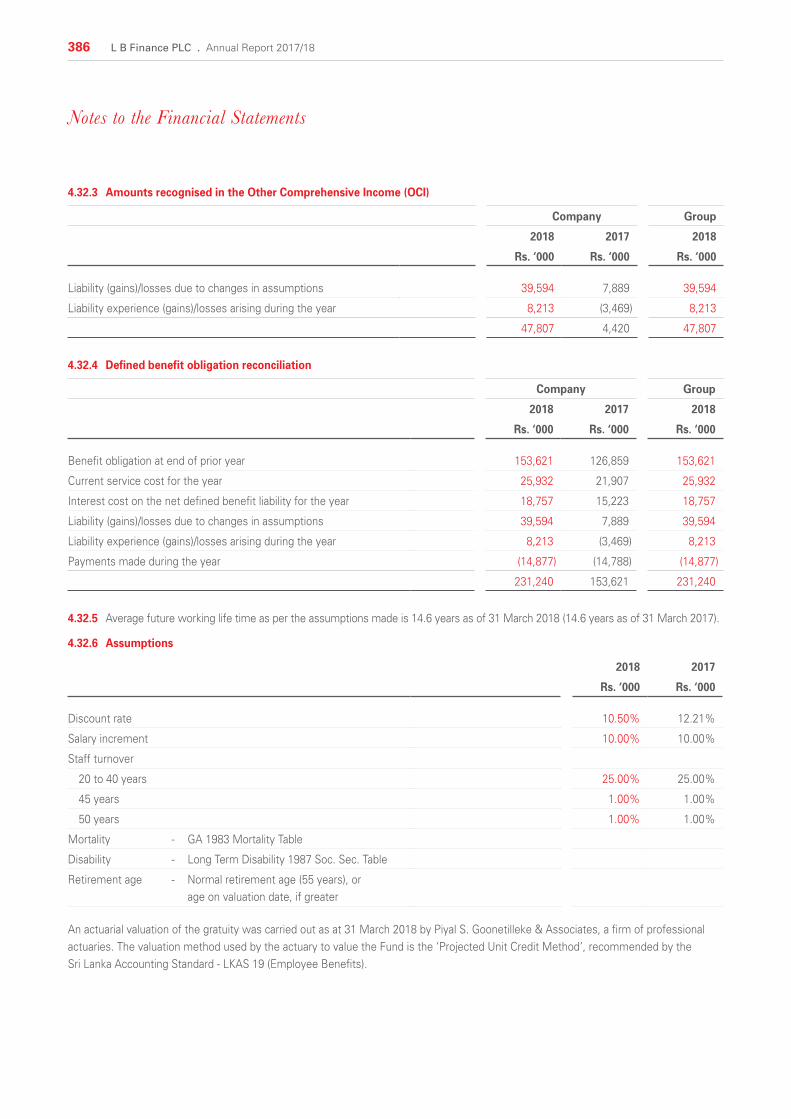
386 L B Finance PLC . Annual Report 2017/18
4.32.3 Amounts recognised in the Other Comprehensive Income (OCI)
Company Group
2018 2017 2018
Rs. ‘000 Rs. ‘000 Rs. ‘000
Liability (gains)/losses due to changes in assumptions 39,594 7,889 39,594
Liability experience (gains)/losses arising during the year 8,213 (3,469) 8,213
47,807 4,420 47,807
4.32.4 Defined benefit obligation reconciliation
Company Group
2018 2017 2018
Rs. ‘000 Rs. ‘000 Rs. ‘000
Benefit obligation at end of prior year 153,621 126,859 153,621
Current service cost for the year 25,932 21,907 25,932
Interest cost on the net defined benefit liability for the year 18,757 15,223 18,757
Liability (gains)/losses due to changes in assumptions 39,594 7,889 39,594
Liability experience (gains)/losses arising during the year 8,213 (3,469) 8,213
Payments made during the year (14,877) (14,788) (14,877)
231,240 153,621 231,240
4.32.5 Average future working life time as per the assumptions made is 14.6 years as of 31 March 2018 (14.6 years as of 31 March 2017).
4.32.6 Assumptions
2018 2017
Rs. ‘000 Rs. ‘000
Discount rate 10.50% 12.21%
Salary increment 10.00% 10.00%
Staff turnover
20 to 40 years 25.00% 25.00%
45 years 1.00% 1.00%
50 years 1.00% 1.00%
Mortality - GA 1983 Mortality Table
Disability - Long Term Disability 1987 Soc. Sec. Table
Retirement age - Normal retirement age (55 years), or age on valuation date, if greater
An actuarial valuation of the gratuity was carried out as at 31 March 2018 by Piyal S. Goonetilleke & Associates, a firm of professional actuaries. The valuation method used by the actuary to value the Fund is the ‘Projected Unit Credit Method’, recommended by the Sri Lanka Accounting Standard - LKAS 19 (Employee Benefits).
Notes to the Financial Statements

L B Finance PLC . Annual Report 2017/18 387
4.32.7 Sensitivity of assumptions employed in actuarial valuation
The following table demonstrates the sensitivity to a reasonably possible change in the key assumptions employed with all other variables held constant in the retirement benefit liability measurement.
The sensitivity of the Statement of Comprehensive Income and Statement of Financial Position is the effect of the assumed changes in discount rate and salary increment on the profit or loss and retirement benefit obligation for the year.
2018 2017
Increase/ (decrease) in discount rate
Increase/ (decrease) in salary increment
Sensitivity effect on Statement of Comprehensive income - increase/
(reduction) in results for the year
Sensitivity effect on retirement benefit obligation
- increase/(reduction) in the liability
Sensitivity effect on Statement of
Comprehensive Income - increase/
(reduction) in results for the year
Sensitivity effect on retirement benefit obligation - increase/ (reduction) in the liability
Rs. ‘000 Rs. ‘000 Rs. ‘000 Rs. ‘000
1% 24,619 (24,619) 14,886 (14,886)
-1% (29,641) 29,641 (17,744) 17,744
1% (28,788) 28,788 (17,498) 17,498
-1% 24,385 (24,385) 14,931 (14,931)
4.32.8 The expected benefit payout in the future years for retirement gratuity
Company Group
2018 2017 2018
Rs. ‘000 Rs. ‘000 Rs. ‘000
Within the next 12 months 16,847 7,674 16,847
Between 2 and 5 years 106,747 100,490 106,747
Beyond 5 years 207,961 188,341 207,961
331,555 296,505 331,555
The expected benefits are estimated based on the same assumptions used to measure the benefit obligation of the Company at the end of the financial year and include benefits attributable to estimated future employee service.
FIN
AN
CIA
L R
EP
OR
TS

388 L B Finance PLC . Annual Report 2017/18
4.33 STATED CAPITAL
4.33.1 Issued and fully paid-ordinary shares
Company & Group Company2018 2017
No. of shares
Rs. '000 No. of shares
Rs. '000
At the beginning of the year 138,514,284 838,282 138,514,284 838,282 At the end of the year 138,514,284 838,282 138,514,284 838,282
4.33.2 Rights of shareholders
The holders of ordinary shares have the right to receive dividends as declared from time to time and are entitled to one vote per share at meetings. All shares rank equally with regard to the Company’s residual assets.
4.34 RESERVES
Company Group As at 1 April 2017
Movement/ transfers
As at 31 March 2018
As at 1 April 2017
Movement/ transfers
As at 31 March 2018
Rs. ‘000 Rs. '000 Rs. '000 Rs. ‘000 Rs. '000 Rs. '000
Statutory reserve 3,424,683 850,144 4,274,827 3,424,683 850,144 4,274,827 Available for sale reserve (12,365) 8,060 (4,305) (12,365) 8,060 (4,305)Foreign currency translation reserve - - - - 5,231 5,231
3,412,318 858,204 4,270,522 3,412,318 863,435 4,275,753
4.34.1 Statutory reserve
Company & Group Company2018 2017
Rs. ‘000 Rs. ‘000
Balance as at 1 April 3,424,683 2,641,042 Transfers made during the financial year 850,144 783,641 Balance as at 31 March 4,274,827 3,424,683
Statutory reserve is a capital reserve which contains profits transferred as required by Section 3(b)(ii) of Central Bank Direction No 1 of 2003.
4.34.2 Available for sale reserve
Company & Group Company2018 2017
Rs. ‘000 Rs. ‘000
Balance as at 1 April (12,365) 29,496 Fair value gains and losses arising on re-measuring available for sale financial assets/transfers made during the financial year 8,060 (41,861)Balance as at 31 March (4,305) (12,365)
The available-for-sale reserve comprises the cumulative net change in fair value of financial investments available for sale until such investments are derecognised or impaired.
Notes to the Financial Statements

L B Finance PLC . Annual Report 2017/18 389
4.34.3 Foreign currency translation reserve
Company Group
2018 2017 2018
Rs. ‘000 Rs. ‘000 Rs. ‘000
Balance as at 1 April - - -
Net gains/(losses) from translating the Financial Statements of the foreign operations - - 5,231
Balance as at 31 March - - 5,231
The foreign currency translation reserve comprises of all foreign currency differences arising from the translation of the Financial Statements of foreign operations. As at the reporting date, the assets and liabilities of the L B Microfinance Myanmar Company Limited a Subsidiary of the Company were translated into the presentation currency (Sri Lankan Rupee) at the exchange rate ruling at the reporting date and the Income Statement and Comprehensive Income was translated at the average exchange rate for the period. The exchange differences arising on the translation are taken to foreign currency translation reserve through Other Comprehensive Income.
4.35 RETAINED EARNINGS
Company Group
2018 2017 2018
Rs. ‘000 Rs. ‘000 Rs. ‘000
Balance as at 1 April 8,259,079 6,970,499 8,259,079
Dividend paid (1,385,143) (1,869,943) (1,385,143)
Profit for the year 4,250,721 3,918,204 4,245,069
Other Comprehensive Income not to be reclassified to Income Statement (34,421) (3,182) (34,421)
Transfers during the year (Note 4.34) (850,144) (756,499) (850,144)
Balance as at 31 March 10,240,092 8,259,079 10,234,440
Retained earnings represents the undistributed earnings held by the Company to be used in the Company’s operations. This could be used to absorb future losses or dividends payable.
4.36 NON-CONTROLLING INTEREST
Non-Controlling Interest (NCI) are measured at their proportionate share of the acquiree’s identifiable net assets at the date of acquisition. Changes in the Group’s interest in a Subsidiary that do not result in a loss of control are accounted for as equity transactions. Accordingly, the Company has non-controlling interest of the L B Microfinance Myanmar Company Limited (NCI of 0.30%) as at the reporting date as follows;
Group2018 2017
Rs. ‘000 Rs. ‘000
Balance as at 1 April - - Non-controlling interest contribution for Subsidiary share issues 460 - Profit for the year (17) - Other Comprehensive Income net of tax 16 - Balance as at 31 March 459 -
FIN
AN
CIA
L R
EP
OR
TS

390 L B Finance PLC . Annual Report 2017/18
SECTION 05Risk Management Disclosures
5.1 INTRODUCTION
Risk is inherent in the Group’s activities but is managed through a process of ongoing identification, measurement and monitoring, subject to risk limits and other controls. This process of risk management is critical to the Group’s continuing profitability and each individual within the Group is accountable for managing the risk exposures relating to his/her functional areas.
The Group identifies the following key financial risks in its business operations.
» Credit Risk
» Liquidity Risk
» Market Risk
» Capital Adequacy
Risk management framework
The Risk Management Framework of the Group has been optimized through the application and the embedment of the risk management process including risk identification, risk analysis, risk measurement, risk management decision and execution, risk monitoring and reporting.
The overall responsibility and oversight of the Risk Management framework of the Group is vested with the Board of Directors. The Integrated Risk Management Committee (IRMC), a sub-committee appointed by the Board, is responsible for developing and monitoring that the Group’s risk management policies are practiced.
The following management committees, each with a defined responsibility, support the IRMC by executing their respective risk management mandates.
» Asset and Liability Committee
» Credit Committee
» IT Steering Committee
Risk management department (RMD)
Whilst the Business units have primary responsibility for Risk Management, the RMD provides an independent oversight function acting as a second line of defence. RMD is headed by the CRO who directly reports to the Managing Director and also has a functional reporting to the IRMC. The RMD co-exists with other control functions in the Group that might uncover risk management issues, most notably Internal Audit, Compliance and Finance. Each of the control functions has a different focus and potential overlap between them is kept at a minimum, while ensuring that the approaches taken are complementary and lead to consistent, effective and timely escalation of risks.
Notes to the Financial Statements

L B Finance PLC . Annual Report 2017/18 391
5.2 CREDIT RISK
Credit risk is the risk of financial loss to the Group if a borrower or counterparty to a financial instrument, fails to meet its contractual obligations, and arises principally from the Group’s loans and advances to customers/other companies and investments in debt securities. Credit risk constitutes the Group’s largest risk exposure category. This can be broadly categorized into three types; default, concentration and settlement risk.
» Default risk is the risk of the potential financial loss resulting from the failure of customer or counterparty to meet its debt or contractual obligations and arises principally from the Group’s loans and advances to customers.
» Concentration risk is the credit exposure being concentrated as a result of excessive build-up of exposure to a single counterparty, industry, product, geographical location or insufficient diversification.
» Settlement risk is the risk of loss arising from trading/investment activities when there is a mutual undertaking to deliver on a progressive basis.
Group manages credit risk by focusing on the following steps;
The loan origination stage comprises preliminary screening and credit appraisal. The objective of this process is to assess the borrower’s ability to meet its obligations in an objective manner. The Company/Group has clearly defined guidelines for credit approvals where the limits have been set taking into consideration the factors such as maximum counterparty exposures, loan to value ratio and forced sale value. These steps enables the Company/Group in assessing the default risk of the borrower.
A comprehensive set of credit risk indicators are monitored monthly to review credit concentrations, status of loan recoveries and compliance with regulatory and prudent exposure limits.
Post disbursement review
Initial monitoring and follow up activities are carried out by the Credit Department. Once a loan is overdue for a period exceeding the tolerance period, responsibility for recovery and collections is transferred to Recoveries Department. Risk Management Department (RMD) reviews asset quality performance regularly. Delinquencies are handled early with effective follow ups and reminders. Swift recovery actions are taken against critical exposures.
Management of large exposures
Credit committee
The Credit Committee consists of the Managing Director, Executive Directors, Chief Financial Officer and Chief Risk Officer. Sanctioning of large exposures are primarily handled by the Credit Committee. RMD independently monitors post sanctioning performance of large exposures.
Impairment assessment
The methodology of the impairment assessment has been explained in the Note 4.18 to these Financial Statements.
Collateral and other credit enhancements
The Group uses collateral, where possible, to mitigate its risks on financial assets. The collateral comes in various forms such as cash, vehicles, gold, letters of guarantees, real estate, receivables, inventories and other non-financial assets .The fair value of collateral is generally assessed at the inception based on the guidelines issued by the Central Bank of Sri Lanka and the Central Bank of Myanmar.
To the extent possible, the Group uses active market data for valuing financial assets, held as collateral. Non-financial collateral, such as real estate, is valued based on data provided by third parties such as independent valuers.
Repossession of collaterals is resorted to in extreme situations where action is necessitated to recover the dues. The repossessed assets are disposed, in an orderly and transparent manner through public auctions and the proceeds are used to reduce or recover the outstanding claims and the amount recovered in excess of the dues is refunded to the customer.
FIN
AN
CIA
L R
EP
OR
TS

392 L B Finance PLC . Annual Report 2017/18
5.2.1 Analysis of credit risk exposure
The following table shows the maximum exposure to credit risk by class of financial asset. It further shows the net exposure to credit risk.
Company GroupAs at 31 March 2018 2017 2018
Maximum exposure to credit risk
Net exposure
Maximum exposure to credit risk
Net exposure
Maximum exposure to credit risk
Net exposure
Rs. ‘000 Rs. ‘000 Rs. ‘000 Rs. ‘000 Rs. ‘000 Rs. '000
Cash and cash equivalents 5,874,375 - 2,895,085 - 5,990,295 - Financial investments - held for trading 9,682 9,682 10,068 10,068 9,682 9,682 Loans and receivables (gross)* 40,721,663 4,491,173 34,013,780 3,482,632 40,760,931 4,530,441 Lease rentals receivable and stock out on hire (gross) 64,499,913 2,771,264 57,473,190 2,487,179 64,499,913 2,771,264 Financial investments - available for sale 121,624 121,624 118,021 118,021 121,624 121,624 Other financial assets** 6,772,554 3,240,113 6,721,526 2,933,988 6,766,710 3,234,269 Total financial assets 117,999,811 10,633,856 101,231,670 9,031,888 118,149,155 10,667,280
The fair value of collateral for finance receivables is calculated based on the number of contracts multiplied by the loss severity and the probability of default (‘POD’) percentage or the outstanding receivable balances multiplied by the average recovery value (‘ARV’) percentage to determine the fair value adjustment.
*At 31 March 2018, the net credit risk exposure of Gold Loans was Rs. 2,438,259/- (2017 - Rs. 26,755,013/-)
**Net exposure of the Other Financial Assets mainly includes investment in fixed deposits in banks and other financial institutions. As at 31 March 2018, the net carrying value amount of those investments was Rs. 2,879,390,261/- (2017 - Rs. 2,680,299,656/-).
5.2.2 Credit quality by class of financial assets
As at 31 March 2018 - Company Neither past due nor impaired *
Past due but not impaired *
Individually impaired
Total
Rs. ‘000 Rs. ‘000 Rs. ‘000 Rs. ‘000
AssetsCash and cash equivalents 5,874,375 - - 5,874,375 Financial investments - held for trading 9,682 - - 9,682 Loans and receivables (gross) 24,422,248 14,753,385 1,546,030 40,721,663 Lease rentals receivable and stock out on hire (gross) 27,215,418 33,513,265 3,771,230 64,499,913 Financial investments - available for sale 79,087 - 42,537 121,624 Other financial assets 6,772,554 - - 6,772,554 Total financial assets 64,373,364 48,266,650 5,359,797 117,999,811
*Collectively assessed for the impairment
Notes to the Financial Statements

L B Finance PLC . Annual Report 2017/18 393
Aging analysis of past due (i.e. Facilities in arrears of 1 day and above) but not impaired loans, by class of financial assets
Past due but not impaired Less than 31 days
31 - 60 days 61 - 90 days More than 90 days
Total
Rs. '000 Rs. '000 Rs. '000 Rs. '000 Rs. '000
Loans and receivables (gross) 7,076,320 4,029,457 1,830,083 1,817,525 14,753,385 Lease rentals receivable and stock out on hire (gross) 14,350,222 11,430,372 5,379,292 2,353,379 33,513,265
21,426,542 15,459,829 7,209,375 4,170,904 48,266,650
44.39% 32.03% 14.94% 8.64% 100.00%
Past due but not impaired loans
Past due but not impaired loans are those for which contractual interest or principal payments are past due, however as per the Company’s assessment they do not need to be individually impaired.
As at 31 March 2017 - Company Neither past due nor impaired*
Past due but not impaired*
Individually impaired
Total
Rs. ‘000 Rs. ‘000 Rs. ‘000 Rs. ‘000
AssetsCash and cash equivalents 2,895,085 - - 2,895,085 Financial investments - held for trading 10,068 - - 10,068 Loans and receivables (gross) 24,488,771 8,813,605 711,404 34,013,780 Lease rentals receivable and stock out on hire (gross) 28,097,326 27,604,638 1,771,226 57,473,190 Financial investments - available for sale 71,028 - 46,993 118,021 Other financial assets 6,721,526 - - 6,721,526 Total financial assets 62,283,804 36,418,243 2,529,623 101,231,670
*Collectively assessed for the impairment
Aging analysis of past due (i.e. Facilities in arrears of 1 day and above) but not impaired loans, by class of financial assets
Past due but not impaired Less than 31 days
31 - 60 days 61 - 90 days More than 90 days
Total
Rs. '000 Rs. '000 Rs. '000 Rs. '000 Rs. '000
Loans and receivables (gross) 4,909,714 2,281,769 907,507 714,615 8,813,605 Lease rentals receivable and stock out on hire (gross) 13,255,637 9,031,058 3,790,098 1,527,845 27,604,638
18,165,351 11,312,827 4,697,605 2,242,460 36,418,243
49.88% 31.06% 12.90% 6.16% 100.00%
Past due but not impaired loans
Past due but not impaired loans are those for which contractual interest or principal payments are past due, however as per the Company’s assessment they do not need to be individually impaired.
FIN
AN
CIA
L R
EP
OR
TS

394 L B Finance PLC . Annual Report 2017/18
As at 31 March 2018 - Group Neither past due nor impaired *
Past due but not impaired *
Individually impaired
Total
Rs. ‘000 Rs. ‘000 Rs. ‘000 Rs. ‘000
AssetsCash and cash equivalents 5,990,295 - - 5,990,295Financial investments - held for trading 9,682 - - 9,682 Loans and receivables (gross) 24,461,516 14,753,385 1,546,030 40,760,931Lease rentals receivable and stock out on hire (gross) 27,215,418 33,513,265 3,771,230 64,499,913 Financial investments - available for sale 79,087 - 42,537 121,624 Other financial assets 6,766,710 - - 6,766,710Total financial assets 64,522,708 48,266,650 5,359,797 118,149,155
*Collectively assessed for the impairment
Aging analysis of past due (i.e. Facilities in arrears of 1 day and above) but not impaired loans, by class of financial assets
Past due but not impaired Less than 31 days
31 - 60 days 61 - 90 days More than 90 days
Total
Rs. '000 Rs. '000 Rs. '000 Rs. '000 Rs. '000
Loans and receivables (gross) 7,076,320 4,029,457 1,830,083 1,817,525 14,753,385 Lease rentals receivable and stock out on hire (gross) 14,350,222 11,430,372 5,379,292 2,353,379 33,513,265
21,426,542 15,459,829 7,209,375 4,170,904 48,266,650
44.39% 32.03% 14.94% 8.64% 100.00%
Past due but not impaired loans
Past due but not impaired loans are those for which contractual interest or principal payments are past due, however as per the Group’s assessment they do not need to be individually impaired.
5.2.3 Concentration of credit risk
By setting various concentration limits under different criteria within the established risk appetite framework, the Group ensures that an acceptable level of risk diversification is maintained on an ongoing basis. These limits are monitored and reviewed by the Credit Committee, Risk Management Department and Integrated Risk Management Committee on a regular basis to capture the developments in market, regulatory and economic environments to strengthen the dynamic portfolio management practices and to provide an early warning on possible credit concentrations.
Notes to the Financial Statements

L B Finance PLC . Annual Report 2017/18 395
The Group monitors concentration of credit risk by sector and by geographic location. An analysis of risk concentration of financial assets based on the industry sector and geographical location is given below.
Industry-wise concentration
The following table shows the risk concentration by industry for the components of the Statement of Financial Position.
As at 31 March 2018 - Company
Sector-wise breakdown
Cash and bank balances
Financial investments - held for trading
Loans and receivables**
Lease rentals receivable and stock out on hire**
Financial investments - available for sale
Other financial assets
Total financial assets
Rs. ‘000 Rs. ‘000 Rs. ‘000 Rs. ‘000 Rs. ‘000 Rs. ‘000 Rs. ‘000
Agriculture - - 14,270,034 14,349,850 - - 28,619,884
Manufacturing - - 1,888,521 1,830,137 - - 3,718,658
Construction - - 810,943 1,108,874 - - 1,919,817
Financial services 5,874,375 - 637,761 379,084 - 6,772,554 13,663,774
Trading - 9,682 5,527,811 11,795,115 121,624 - 17,454,232
Retail - - 1,903,437 - - - 1,903,437
Government - - - - - - -
Hotels - - 604,263 481,567 - - 1,085,830
Services - - 14,212,628 32,545,059 - - 46,757,687
Total 5,874,375 9,682 39,855,398 62,489,686 121,624 6,772,554 115,123,319
Province-wise concentration
**Provincial breakdown for (01) Loans and receivable (02) Lease rentals receivable and Stock out on hire from customers within Sri Lanka is as follows;
As at 31 March 2018 - Company
Province Loans and receivables
Lease rentals receivable and stock out on hire
Total
Rs. ‘000 Rs. ‘000 Rs. ‘000
Central 3,156,668 6,922,955 10,079,623 Eastern 2,217,036 3,207,308 5,424,344 North Central 1,012,548 3,331,064 4,343,612 North Western 2,528,814 6,845,408 9,374,222 Northern 2,759,874 582,872 3,342,746 Sabaragamuwa 1,003,430 4,037,745 5,041,175 Southern 2,030,121 6,292,184 8,322,305 Uva 795,252 2,640,024 3,435,276 Western 24,351,655 28,630,126 52,981,781 Total 39,855,398 62,489,686 102,345,084
FIN
AN
CIA
L R
EP
OR
TS

396 L B Finance PLC . Annual Report 2017/18
Industry-wise concentration
The following table shows the risk concentration by industry for the components of the Statement of Financial Position.
As at 31 March 2017 - Company
Sector-wise breakdown
Cash and bank balances
Financial investments - held for trading
Loans and receivables **
Lease rentals receivable and stock out on hire **
Financial investments - available for sale
Other financial assets
Total financial assets
Rs. ‘000 Rs. ‘000 Rs. ‘000 Rs. ‘000 Rs. ‘000 Rs. ‘000 Rs. ‘000
Agriculture - - 9,925,535 10,331,041 - - 20,256,576
Manufacturing - - 1,796,166 1,666,701 - - 3,462,867
Construction - - 557,711 1,190,251 - - 1,747,962
Financial services 2,895,085 - 653,822 355,608 - 6,721,526 10,626,041
Trading - 10,068 5,684,954 11,669,019 118,021 - 17,482,062
Retail - - 2,191,593 - - - 2,191,593
Government - - - - - - -
Hotels - - 251,975 491,977 - - 743,952
Services - - 12,427,023 29,956,366 - - 42,383,389
Total 2,895,085 10,068 33,488,779 55,660,963 118,021 6,721,526 98,894,442
Province-wise concentration
**Provincial breakdown for (01) Loans and receivable (02) Lease rentals receivable and Stock out on hire from customers within Sri Lanka is as follows;
As at 31 March 2017 - Company
Province Loans and receivables
Lease rentals receivable and stock out on hire
Total
Rs. ‘000 Rs. ‘000 Rs. ‘000
Central 2,665,387 5,807,452 8,472,839 Eastern 1,765,429 3,123,383 4,888,812 North Central 713,031 3,110,343 3,823,374 North Western 2,172,545 5,726,921 7,899,466 Northern 2,379,071 493,903 2,872,974 Sabaragamuwa 946,872 3,806,386 4,753,258 Southern 1,636,204 5,842,761 7,478,965 Uva 537,616 2,512,212 3,049,828 Western 20,672,624 25,237,602 45,910,226 Total 33,488,779 55,660,963 89,149,742
Notes to the Financial Statements

L B Finance PLC . Annual Report 2017/18 397
Industry-wise concentration
The following table shows the risk concentration by industry for the components of the Statement of Financial Position.
As at 31 March 2018 - Group
Sector-wise breakdown
Cash and bank balances
Financial investments - held for trading
Loans and receivables **
Lease rentals receivable and stock out on hire **
Financial investments - available for sale
Other financial assets
Total financial assets
Rs. ‘000 Rs. ‘000 Rs. ‘000 Rs. ‘000 Rs. ‘000 Rs. ‘000 Rs. ‘000
Agriculture - - 14,308,912 14,349,850 - - 28,658,762
Manufacturing - - 1,888,521 1,830,137 - - 3,718,658
Construction - - 810,943 1,108,874 - - 1,919,817
Financial services 5,990,295 - 637,761 379,084 - 6,766,710 13,773,850
Trading - 9,682 5,527,811 11,795,115 121,624 - 17,454,232
Retail - - 1,903,437 - - - 1,903,437
Government - - - - - - -
Hotels - - 604,263 481,567 - - 1,085,830
Services - - 14,212,628 32,545,059 - - 46,757,687
Total 5,990,295 9,682 39,894,276 62,489,686 121,624 6,766,710 115,272,273
Geographical concentration
**Geographical breakdown for (01) Loans and receivable (02) Lease rentals receivable and Stock out on hire from customers is as follows;
As at 31 March 2018 - Group
Province/country Loans and receivables
Lease rentals receivable and stock out on hire
Total
Rs. ‘000 Rs. ‘000 Rs. ‘000
Central 3,156,668 6,922,955 10,079,623 Eastern 2,217,036 3,207,308 5,424,344 North Central 1,012,548 3,331,064 4,343,612 North Western 2,528,814 6,845,408 9,374,222 Northern 2,759,874 582,872 3,342,746 Sabaragamuwa 1,003,430 4,037,745 5,041,175 Southern 2,030,121 6,292,184 8,322,305 Uva 795,252 2,640,024 3,435,276 Western 24,351,655 28,630,126 52,981,781 Myanmar 38,878 - 38,878 Total 39,894,276 62,489,686 102,383,962
FIN
AN
CIA
L R
EP
OR
TS

398 L B Finance PLC . Annual Report 2017/18
5.3 LIQUIDITY RISK AND FUNDING MANAGEMENT
In the context of a financial institution liquidity risk arises primarily due to mismatches in the maturity profile of assets and liabilities. Liquidity risk for a financial institution can take two forms; market liquidity risk and funding liquidity risk.
Market liquidity risk is the inability to easily exit a position. Group’s market liquidity risk is low if assets can be liquidated without moving the price too much.
Funding liquidity risk means the Group’s inability to finance assets continuously at an acceptable borrowing rate. Funding liquidity risk generally arises when creditors either withdraw credit or change the terms on which it is granted in such a way they are no longer profitable. Funding liquidity risk would increase if the Group’s credit quality is, or at least perceived to be, deteriorating, but also because financial conditions as a whole are deteriorating.
The Group’s primary objective in liquidity risk management is to ensure adequate funding for its businesses throughout market cycles, including periods of financial stress. To achieve this objective the Group regularly monitors the liquidity position and maintain an adequate buffer of liquid assets. Group also maintains access to diverse funding sources to meet unforeseen liquidity requirements. All statutory and prudent liquidity ratios are monitored against tolerance limits and stress testing is carried out regularly to assess the effectiveness of liquidity management.
Assets and Liability Management Committee (ALCO)
ALCO is chaired by the Managing Director and comprises of Executive Directors, representatives from the Treasury Department, Fixed Deposits, the Chief Financial Officer and the Chief Risk Officer. The Committee meets regularly and makes all policy decisions with regard to funding matters, duration management of assets and liabilities and investments, to keep the liquidity at healthy levels, whilst satisfying regulatory requirements.
5.3.1 Analysis of liquidity risk exposure
5.3.1 (a) The table below summarizes the maturity profile of the undiscounted cash flows of the Company’s financial assets and liabilities as at 31 March 2018.
The table does not reflect the expected cash flows indicated by its deposit retention history and loan recovery patterns.
As at 31 March 2018 - Company On demand Less than 3 months
3-12 Months 1-5 Years Over 5 years Total
Rs. ‘000 Rs. '000 Rs. '000 Rs. ‘000 Rs. '000 Rs. '000
Financial assetsCash and bank balances 2,655,069 3,236,437 - - - 5,891,506 Financial investments - held for trading 9,682 - - - - 9,682 Loans and receivables 7,217,140 15,526,674 10,268,927 13,909,808 1,421,371 48,343,920 Lease rentals receivable and stock out on hire 3,378,193 8,714,343 23,994,138 50,284,196 52,464 86,423,334 Financial investments - available for sale 121,624 - - - - 121,624 Other financial assets 360,723 1,154,025 5,550,806 - - 7,065,554 Total financial assets 13,742,431 28,631,479 39,813,871 64,194,004 1,473,835 147,855,620 Financial liabilities Due to banks 1,285,356 3,291,949 7,149,075 15,652,842 - 27,379,222 Due to customers 2,958,302 25,467,832 33,215,379 18,675,363 - 80,316,876 Debt instruments issued and other borrowed funds - 272,488 2,362,319 4,570,000 - 7,204,807 Other financial liabilities 1,761,418 - - - - 1,761,418 Total financial liabilities 6,005,076 29,032,269 42,726,773 38,898,205 - 116,662,323 Total net financial assets/(liabilities) 7,737,355 (400,790) (2,912,902) 25,295,799 1,473,835 31,193,297
Notes to the Financial Statements

L B Finance PLC . Annual Report 2017/18 399
5.3.1 (b) The table below summarizes the maturity profile of the undiscounted cash flows of the Company’s financial assets and liabilities as at 31 March 2017.
The table does not reflect the expected cash flows indicated by its deposit retention history and loan recovery patterns.
As at 31 March 2017 - Company On demand Less than 3 months
3-12 Months 1-5 Years Over 5 years Total
Rs. ‘000 Rs. '000 Rs. '000 Rs. ‘000 Rs. '000 Rs. '000
Financial assets
Cash and bank balances 1,832,321 1,068,480 - - - 2,900,801
Financial investments - held for trading 10,068 - - - - 10,068
Loans and receivables 5,181,951 12,278,167 10,179,661 11,291,205 1,672,490 40,603,474
Lease rentals receivable and stock out on hire 2,747,306 7,368,090 20,393,168 45,372,840 17,450 75,898,854
Financial investments - available for sale 118,021 - - - - 118,021
Other financial assets 253,688 1,271,163 5,539,367 - - 7,064,218
Total financial assets 10,143,355 21,985,900 36,112,196 56,664,045 1,689,940 126,595,436
Financial liabilities
Due to banks 1,035,268 2,014,722 7,261,927 18,159,846 - 28,471,763
Due to customers 2,364,447 20,222,029 25,526,034 18,152,979 - 66,265,489
Debt instruments issued and other borrowed funds - 77,288 212,525 2,259,940 - 2,549,753
Other financial liabilities 2,007,402 - - - - 2,007,402
Total financial liabilities 5,407,117 22,314,039 33,000,486 38,572,765 - 99,294,407
Total net financial assets/(liabilities) 4,736,238 (328,139) 3,111,710 18,091,280 1,689,940 27,301,029
FIN
AN
CIA
L R
EP
OR
TS

400 L B Finance PLC . Annual Report 2017/18
5.3.1 (c) The table below summarises the maturity profile of the undiscounted cash flows of the Group’s financial assets and liabilities as at 31 March 2018.
The table does not reflect the expected cash flows indicated by its deposit retention history and loan recovery patterns.
As at 31 March 2018 - Group On demand Less than 3 months
3-12 Months 1-5 Years Over 5 years Total
Rs. ‘000 Rs. '000 Rs. '000 Rs. ‘000 Rs. '000 Rs. '000
Financial assets
Cash and bank balances 2,770,989 3,236,437 - - - 6,007,426
Financial investments - held for trading 9,682 - - - - 9,682
Loans and receivables 7,217,140 15,536,486 10,296,151 13,920,058 1,421,371 48,391,206
Lease rentals receivable and stock out on hire 3,378,193 8,714,343 23,994,138 50,284,196 52,464 86,423,334
Financial investments - available for sale 121,624 - - - - 121,624
Other financial assets 354,879 1,154,025 5,550,806 - - 7,059,710
Total financial assets 13,852,507 28,641,291 39,841,095 64,204,254 1,473,835 148,012,982
Financial liabilities
Due to banks 1,285,356 3,291,949 7,149,075 15,652,842 - 27,379,222
Due to customers 2,958,302 25,467,832 33,215,877 18,677,043 - 80,319,054
Debt instruments issued and other borrowed funds - 272,488 2,362,319 4,570,000 - 7,204,807
Other financial liabilities 1,761,418 - - - - 1,761,418
Total financial liabilities 6,005,076 29,032,269 42,727,271 38,899,885 - 116,664,501
Total net financial assets/(liabilities) 7,847,431 (390,978) (2,886,176) 25,304,369 1,473,835 31,348,481
Notes to the Financial Statements

L B Finance PLC . Annual Report 2017/18 401
5.3.2 Contractual maturities of commitments and contingencies
The table below shows the contractual expiry by maturity of the Company/Group’s contingent liabilities and commitments. Each undrawn loan commitment is included in the time band containing the earliest date it can be drawn down. For issued financial guarantee contracts, the maximum amount of the guarantee is allocated to the earliest period in which the guarantee could be called.
As at 31 March 2018 - Company & Group
On demand Less than 3 months
3-12 Months 1-5 Years Over 5 years Total
Rs. ‘000 Rs. '000 Rs. '000 Rs. ‘000 Rs. '000 Rs. '000
Contingent liabilities
Guarantees issued to banks and other institutions - 1,460 5,040 - - 6,500
Import LC and ordinary guarantees 38,069 - - - - 38,069
Total contingent liabilities 38,069 1,460 5,040 - - 44,569
Commitments
Commitment for unutilised facilities 1,217,412 - - - - 1,217,412
Total commitments 1,217,412 - - - - 1,217,412
Total commitments and contingencies 1,255,481 1,460 5,040 - - 1,261,981
As at 31 March 2017 - Company
On demand Less than 3 months
3-12 Months 1-5 Years Over 5 years Total
Rs. ‘000 Rs. '000 Rs. '000 Rs. ‘000 Rs. '000 Rs. '000
Contingent liabilities
Guarantees issued to banks and other institutions - 4,460 13,000 - - 17,460
Import LC and ordinary guarantees 58,370 - - - - 58,370
Total contingent liabilities 58,370 4,460 13,000 - - 75,830
Commitments
Commitment for unutilised facilities 918,305 - - - - 918,305
Total commitments 918,305 - - - - 918,305
Total commitments and contingencies 976,675 4,460 13,000 - - 994,135
FIN
AN
CIA
L R
EP
OR
TS

402 L B Finance PLC . Annual Report 2017/18
5.4 MARKET RISK
Market risk refers to the possible losses to the Group that could arise from changes in market variables like interest rates, exchange rates, equity prices and commodity prices. Among them, interest rate risk has been identified as the most critical risk given the Group’s nature of business.
5.4.1 Interest rate risk
Interest rate risk is a key constitute of the market risk exposure of the Group due to adverse and unanticipated movements in future interest rate which arises from core business activities; disbursing of credit facilities, accepting deposits and issuing debt instruments. Due to the nature of operations of the Group, the impact of interest rate risk is mainly on the earnings of the Group rather than the market value of portfolios.
Excessive movements in market interest rate could result in severe volatility to the Group’s net interest income and net interest margin. Group’s exposure to interest rate risk is primarily associated with factors such as;
» Reprising risk arising from a fixed rate borrowing portfolio, where reprising frequency is different to that of the lending portfolio.
» Yield curve risk arising from unanticipated shifts of the market yield curve.
Interest rate risk is managed principally through minimizing interest rate sensitive asset liability gaps. In order to ensure interest rate margin and spreads are maintained, the Group conducts periodic reviews and re-prices its assets accordingly.
5.4.2 Commodity price risk
Commodity price risk refers to the uncertainties of future market values and of the size of the future income, caused by the fluctuation in the prices of commodities. Given the significance of the Gold Loans business to Group’s overall loan book, sharp fluctuations to the gold prices could have an adverse impact to earnings. Gold price fluctuations lead to market risk which is the primary source of credit risk associated with this product.
Group currently manages the credit and market risks arising from adverse movements in Gold prices by adopting the following strategies;
» Shorter product life: Group, as a credit risk management strategy lends for shorter periods allowing it to initiate its recovery process faster.
» Frequent revisions to Loan-to-Value (LTV) ratio: Group practices a process of revising advance offered per gold sovereign to reflect market value fluctuations to maintain the desired loan to value ratio.
5.4.3 Equity price risk
This is the risk of loss based on market changes in the value of equity or a participation portfolio.
5.4.4 Exchange rate risk
Exchange rate risk is the risk of loss as a result of unhedged exposure to volatility in the local (LKR) exchange rate with other major currencies. Exchange risk could materialize as an indirect risk too, affecting local gold prices resulting in exaggerated commodity risk. Group is exposed to two types of risk caused by currency volatility.
Transaction risk – This risk arises whenever the Group has contractual cash flows (receivables and payables) whose values are subject to unanticipated changes in exchange rates due to a contract being denominated in a foreign currency. This type of exposure is short-term to medium-term in nature.
Translation risk – This exposure arises from the effect of currency fluctuations on the Consolidated Financial Statements, particularly when it has foreign subsidiaries. This type of exposure is medium-term to long-term.
Notes to the Financial Statements

L B Finance PLC . Annual Report 2017/18 403
5.4.5 Interest rate sensitivity
The following table demonstrates the impact on net interest income to a reasonably possible change in interest rates based on the assumption that a rate sensitive asset surplus would be subjected to reinvestment risk whereas a rate sensitive asset deficit would be subjected to funding risk.
Impact on net interest income due to a parallel rate shock of 100 basis points (bps) on rate sensitive assets and liabilities is shown below.
Net interest income (NII) sensitivity by interest rate change As at 31 March 2018 2017
Impact on NII (Rs.)
Parallel increase 100 bps
Parallel decrease 100 bps
Parallel increase 100 bps
Parallel decrease 100 bps
Annual impact (-) 15,113,659 (+) 15,113,659 (-) 8,696,490 (+) 8,696,490
5.4.6 Interest rate risk exposure on financial assets and liabilities
5.4.6 (a) The table below analyses the Company’s interest rate risk exposure on financial assets & liabilities. The Company’s assets and liabilities are included at carrying amount and categorized by the earlier of contractual reprising or maturity dates.
As at 31 March 2018 - Company
Up to 3 months
3-12 Months
1-3 Years
3-5 Years
Over 5 years
Non-interest bearing
Total
Rs. ‘000 Rs. ‘000 Rs. ‘000 Rs. ‘000 Rs. ‘000 Rs. ‘000 Rs. ‘000
Financial assets
Cash and bank balances 5,080,579 - - - - 793,796 5,874,375
Financial investments - held for trading - - - - - 9,682 9,682
Loans and receivables 24,408,615 7,683,892 5,367,931 2,343,782 51,178 - 39,855,398
Lease rentals receivable and stock out on hire 8,864,049 15,464,800 29,962,900 8,151,043 46,894 - 62,489,686
Financial investments - available for sale - - - - - 121,624 121,624
Other financial assets 1,144,827 5,267,004 - - - 360,723 6,772,554
39,498,070 28,415,696 35,330,831 10,494,825 98,072 1,285,825 115,123,319
Financial liabilities
Due to banks 10,331,073 3,687,074 6,566,270 2,253,621 - - 22,838,038
Due to customers 27,529,747 30,167,015 10,939,297 4,307,774 - - 72,943,833
Debt instruments issued and other borrowed funds 144,922 2,018,807 (5,877) 2,994,980 - - 5,152,832
Other financial liabilities - - - - - 1,761,418 1,761,418
38,005,742 35,872,896 17,499,690 9,556,375 - 1,761,418 102,696,121
Interest sensitivity gap 1,492,328 (7,457,200) 17,831,141 938,450 98,072 (475,593) 12,427,198
FIN
AN
CIA
L R
EP
OR
TS

404 L B Finance PLC . Annual Report 2017/18
5.4.6 (b) The table below analyses the Company’s interest rate risk exposure on financial assets and liabilities. The Company’s assets and liabilities are included at carrying amount and categorised by the earlier of contractual reprising or maturity dates.
As at 31 March 2017 - Company
Up to 3 months
3-12 Months
1-3 Years
3-5 Years
Over 5 years
Non-interest bearing
Total
Rs. ‘000 Rs. ‘000 Rs. ‘000 Rs. ‘000 Rs. ‘000 Rs. ‘000 Rs. ‘000
Financial assets
Cash and bank balances 2,154,357 - - - - 740,728 2,895,085
Financial investments - held for trading - - - - - 10,068 10,068
Loans and receivables 19,394,409 7,849,872 4,449,085 1,754,476 40,937 - 33,488,779
Lease rentals receivable and stock out on hire 7,454,751 13,327,015 26,974,534 7,889,024 15,639 - 55,660,963
Financial investments - available for sale - - - - - 118,021 118,021
Other financial assets 1,253,721 5,214,117 - - - 253,688 6,721,526
30,257,238 26,391,004 31,423,619 9,643,500 56,576 1,122,505 98,894,442
Financial liabilities
Due to banks 8,912,848 4,113,681 9,081,695 1,669,923 - - 23,778,147
Due to customers 21,912,580 23,153,979 12,630,928 2,704,468 - - 60,401,955
Debt instruments issued and other borrowed funds 26,294 19,981 1,997,941 - - - 2,044,216
Other financial liabilities - - - - - 2,007,402 2,007,402
30,851,722 27,287,641 23,710,564 4,374,391 - 2,007,402 88,231,720
Interest sensitivity gap (594,484) (896,637) 7,713,055 5,269,109 56,576 (884,897) 10,662,722
Notes to the Financial Statements

L B Finance PLC . Annual Report 2017/18 405
5.4.6 (c) The table below analyses the Group’s interest rate risk exposure on financial assets and liabilities. The Group’s assets and liabilities are included at carrying amount and categorized by the earlier of contractual reprising or maturity dates.
As at 31 March 2018 - Group
Up to 3 months
3-12 Months
1-3 Years
3-5 Years
Over 5 years
Non-interest bearing
Total
Rs. ‘000 Rs. ‘000 Rs. ‘000 Rs. ‘000 Rs. ‘000 Rs. ‘000 Rs. ‘000
Financial assets
Cash and bank balances 5,080,579 - - - - 909,716 5,990,295
Financial investments - held for trading - - - - - 9,682 9,682
Loans and receivables 24,415,595 7,706,258 5,377,463 2,343,782 51,178 - 39,894,276
Lease rentals receivable and stock out on hire 8,864,049 15,464,800 29,962,900 8,151,043 46,894 - 62,489,686
Financial investments available for sale - - - - - 121,624 121,624
Other financial assets 1,138,983 5,267,004 - - - 360,723 6,766,710
39,499,206 28,438,062 35,340,363 10,494,825 98,072 1,401,745 115,272,273
Financial liabilities
Due to banks 10,331,073 3,687,074 6,566,270 2,253,621 - - 22,838,038
Due to customers 27,529,747 30,167,513 10,940,977 4,307,774 - - 72,946,011
Debt instruments issued and other borrowed funds 144,922 2,018,807 (5,877) 2,994,980 - - 5,152,832
Other financial liabilities - - - - - 1,761,418 1,761,418
38,005,742 35,873,394 17,501,370 9,556,375 - 1,761,418 102,698,299
Interest sensitivity gap 1,493,464 (7,435,332) 17,838,993 938,450 98,072 (359,673) 12,573,974
5.5 CAPITAL ADEQUACY
For a financial institution, capital is a buffer against insolvency. It is available to absorb unforeseen losses which will assure the sustainability of the Group’s operations so the Group can remain in business. The more capital the Group has relative to the risks it takes, the more confidence the stakeholders are that it will meet its obligations to them. Group’s capital management process is steered with the aim of holding sufficient capital to support the Group’s risk appetite whilst maintaining adequate capital to meet minimum regulatory capital requirements.
Regulatory capital - Company
The Company manages its capital considering regulatory capital requirements. The Central Bank of Sri Lanka (CBSL) sets and monitors capital requirements for licensed finance companies in Sri Lanka. Thus the Company’s operations are directly supervised by the CBSL and the Company is required to comply with Directions on Risk Weighted Capital Adequacy Ratio issued by the CBSL. Licensed Finance Companies in Sri Lanka need to maintain a minimum Capital Adequacy Ratio (CAR) of 10% and a Core Capital Ratio (Tier 1) of at least 5%.
As of 31 March 2018, the Company has maintained Risk Weighted Capital Adequacy Ratio above the CBSL’s capital requirements.
FIN
AN
CIA
L R
EP
OR
TS

406 L B Finance PLC . Annual Report 2017/18
SECTION 06Other Disclosures
6.1 RELATED PARTY DISCLOSURES
The Group carried out transactions with key management and their related concerns and other related entities in the ordinary course of its business on an arms length basis at commercial rates except that the key management have availed facilities under the loan schemes uniformly applicable to all the staff.
Details of related party transactions during the year are as follows;
6.1.1 Transactions with Key Management Personnel (KMPs)
Related party includes KMPs defined as those persons having authority and responsibility for planning, directing and controlling the activities of the entity directly or indirectly. Such KMPs include the Board of Directors of the Company (inclusive of Executive and Non-Executive Directors), KMPs of the Subsidiary and KMPs of the Parent Company.
Company Group
2018 2017 2018
Rs. ‘000 Rs. ‘000 Rs. ‘000
Short-term employment benefits 322,391 305,271 322,391
Directors' fees and expenses 16,399 17,738 16,399
Post employment benefits - - -
338,790 323,009 338,790
In addition to the above, the Company has also paid non-cash benefits such as vehicles and fuel to Key Management Personnel inline with the approved employment benefits of the Company.
6.1.2 Transactions, arrangements and agreements involving KMPs and their close members of the family (CMFs)
CMFs of KMPs are those family members who may be expected to influence, or be influenced by, those KMPs in their dealing with the entity.
Company Group
2018 2017 2018
Reported under Rs. ‘000 Rs. ‘000 Rs. ‘000
Statement of financial position
Liabilities
Fixed deposits Due to customers 732,312 637,021 732,312
Savings deposits Due to customers 5,097 8,046 5,097
737,409 645,067 737,409
Income statement
Interest expense on customer deposits Interest expenses 53,643 46,475 53,643
53,643 46,475 53,643
Other transactions
Deposits accepted during the year 221,261 518,401 221,261
Dividend paid on shareholdings 4,232 4,024 4,232
225,493 522,425 225,493
Notes to the Financial Statements

L B Finance PLC . Annual Report 2017/18 407
6.1.3 Transaction, arrangements and agreements involving entities which are controlled, and/or jointly controlled by the KMPs and their CMFs
Company Group
2018 2017 2018
Reported under Rs. ‘000 Rs. ‘000 Rs. ‘000
Statement of financial position
Assets
Investment in equity securities Financial investments - held for trading 245 324 245
Lease rentals receivable Lease rentals receivable and stock out on hire 8,150 393 8,150
Leasehold improvements Property, plant and equipment 19,936 - 19,936
28,331 717 28,331
Liabilities
Fixed deposits Due to customers 9,361 1,814 9,361
Income statement
Interest income on lease and vehicle loans Interest income 113 - 113
Income on operating lease Other operating income 19,866 4,212 19,866
Interest expense on customer deposits Interest expenses 622 23,911 622
Dividend income Other operating income - - -
20,601 28,123 20,601
Other transactions
Deposits accepted during the year 900 800 900
900 800 900
6.1.4 Transactions with group entities
The Group entities include the Parent, Fellow Subsidiaries and Associate Companies of the Parent.
Transactions with Parent Company
Company Group
2018 2017 2018
Reported under Rs. ‘000 Rs. ‘000 Rs. ‘000
Income statement
Interest expense on customer deposits Interest expense - 13,317 -
Other transactions
Dividend paid on shareholdings 716,824 967,712 716,824
716,824 967,712 716,824
FIN
AN
CIA
L R
EP
OR
TS

408 L B Finance PLC . Annual Report 2017/18
Transactions with Subsidiary
Company Group
2018 2017 2018
Reported under Rs. ‘000 Rs. ‘000 Rs. ‘000
Statement of financial position
Assets
Investment in equity securities Investment in Subsidiary 152,915 - -
Due from Subsidiary Other financial assets 5,844 - -
158,759 - -
Transactions with Fellow Subsidiaries and Associate Companies of the Parent
Company Group
2018 2017 2018
Reported under Rs. ‘000 Rs. ‘000 Rs. ‘000
Statement of financial position
Assets
Leasehold improvements Property, plant and equipment 8,972 3,456 8,972
Investment in equity securities Financial investments - held for trading 1,942 1,836 1,942
Investment in equity securities Financial investments - available for sale 45,838 50,720 45,838
56,752 56,012 56,752
Liabilities
Fixed deposits Due to customers 67,473 87,709 67,473
67,473 87,709 67,473
Company Group
2018 2017 2018
Reported Under Rs. ‘000 Rs. ‘000 Rs. ‘000
Statement of Comprehensive Income
Interest income on lease and saving deposits Interest income - 888 -
Dividend income Other operating income - 356 -
Real estate income (net of cost) Other operating income - 184,629 -
Interest expense on customer deposits Interest expenses 7,540 5,455 7,540
Bank charges Other operating expenses - 228 -
7,540 191,556 7,540
Other transactions
Deposits accepted during the year - 65,000 -
Dividend paid on shareholdings 314,272 424,268 314,272
Sale of real estate land - 345,800 -
314,272 835,068 314,272
Notes to the Financial Statements

L B Finance PLC . Annual Report 2017/18 409
6.2 CAPITAL
The Company maintains capital in order to cover risks inherent in the business and meet the capital adequacy requirements of the Central Bank of Sri Lanka. The adequacy of the Company’s capital is monitored based on the measures, rules and ratios adopted by the Central Bank of Sri Lanka.
Details of the regulatory capital requirements and compliance level are disclosed in Note 5.5 to the Financial Statements.
6.2.1 Capital management
Objective
The primary objective of the Company’s capital management policy is to ensure that the Company complies with externally imposed capital requirements and maintains healthy capital ratios in order to support its business and to maximize shareholders’ value.
6.3 CURRENT AND NON CURRENT ANALYSIS OF ASSETS AND LIABILITIES
The table below shows an analysis of assets and liabilities analysed according to when they are expected to be recovered or settled.
Company GroupAs at 31 March 2018 2017 2018
Within 12 months
After 12 months
Total Within 12 months
After 12 months
Total Within 12 months
After 12 months
Total
Rs. '000 Rs. '000 Rs. '000 Rs. '000 Rs. '000 Rs. '000 Rs. '000 Rs. '000 Rs. '000
AssetsCash and bank balances 5,874,375 - 5,874,375 2,895,085 - 2,895,085 5,990,295 - 5,990,295 Financial investments - held for trading 9,682 - 9,682 10,068 - 10,068 9,682 - 9,682 Loans and receivables 29,573,537 10,281,861 39,855,398 24,673,547 8,815,232 33,488,779 29,602,883 10,291,393 39,894,276 Lease rentals receivable and stock out on hire 24,328,849 38,160,837 62,489,686 20,781,767 34,879,196 55,660,963 24,328,849 38,160,837 62,489,686 Financial investments - available for sale 121,624 - 121,624 118,021 - 118,021 121,624 - 121,624 Other financial assets 6,772,554 - 6,772,554 6,721,526 - 6,721,526 6,766,710 - 6,766,710 Other non-financial assets 706,126 109,682 815,808 262,973 42,075 305,048 706,781 109,682 816,463 Investment in Subsidiary - 152,915 152,915 - - - - - - Property, plant and equipment - 4,680,619 4,680,619 - 3,514,356 3,514,356 - 4,681,849 4,681,849 Intangible assets - 48,119 48,119 - 49,189 49,189 - 52,861 52,861 Total assets 67,386,747 53,434,033 120,820,780 55,462,987 47,300,048 102,763,035 67,526,824 53,296,622 120,823,446
Liabilities Due to banks 10,014,113 12,823,925 22,838,038 8,107,315 15,670,832 23,778,147 10,014,113 12,823,925 22,838,038 Due to customers 57,696,763 15,247,070 72,943,833 45,066,559 15,335,396 60,401,955 57,697,261 15,248,750 72,946,011 Debt instruments issued and other borrowed funds 2,163,729 2,989,103 5,152,832 46,275 1,997,941 2,044,216 2,163,729 2,989,103 5,152,832 Other financial liabilities 1,761,418 - 1,761,418 2,007,402 - 2,007,402 1,761,418 - 1,761,418 Other non-financial liabilities 852,715 - 852,715 673,436 - 673,436 853,165 - 853,165 Current tax liabilities 633,058 - 633,058 691,091 - 691,091 633,058 - 633,058 Deferred tax liabilities - 1,058,750 1,058,750 - 503,488 503,488 - 1,058,750 1,058,750 Retirement benefit liability - 231,240 231,240 - 153,621 153,621 - 231,240 231,240 Total liabilities 73,121,796 32,350,088 105,471,884 56,592,078 33,661,278 90,253,356 73,122,744 32,351,768 105,474,512 Maturity gap (5,735,049) 21,083,945 15,348,896 (1,129,091) 13,638,770 12,509,679 (5,595,920) 20,944,854 15,348,934 Cumulative gap (5,735,049) 15,348,896 - (1,129,091) 12,509,679 - (5,595,920) 15,348,934 -
FIN
AN
CIA
L R
EP
OR
TS

410 L B Finance PLC . Annual Report 2017/18
6.4 SEGMENTAL INFORMATION
Accounting policy
An operating segment is a component of the Group that engages in business activities from which it may earn revenues and incur expenses, including revenues and expenses that relate to transactions with any of the Group’s other components, whose operating results are reviewed regularly by the chief operating decision maker to make decisions about resources allocated to each segment and assess its performance and for which discrete financial information is available.
For management purposes the Company has identified operating segments based on products and services. Management monitors the operating results of its business units separately for the purpose of making decisions about resource allocation and performance assessment. Segment performance is evaluated based on operating profits or losses. Income taxes are managed on a Group basis and are not allocated to operating segments.
No revenue from transactions with a single external customer or counterparty amounted to 10% or more of the Company’s total revenue in 2017 or 2018.
There were no transactions between reportable segments in 2017 or 2018.
Leasing and stock out on hire
Loans and receivables Others Total
2018 2017 2018 2017 2018 2017 2018 2017Rs. '000 Rs. '000 Rs. '000 Rs. '000 Rs. '000 Rs. '000 Rs. '000 Rs. '000
Interest income 14,083,194 10,852,921 8,253,343 6,349,685 1,059,350 707,329 23,395,887 17,909,935 Less: interest expenses 6,323,456 4,520,043 3,925,159 2,704,706 1,249,845 887,588 11,498,460 8,112,337 Net interest income/(expenses) 7,759,738 6,332,878 4,328,184 3,644,979 (190,495) (180,259) 11,897,427 9,797,598
Fee and commission income 372,877 312,817 671,928 529,260 459,794 367,263 1,504,599 1,209,340 Net trading income and other operating income 36,338 21,955 (534) 632 110,049 221,566 145,853 244,153 Total operating income 8,168,953 6,667,650 4,999,578 4,174,871 379,348 408,570 13,547,879 11,251,091 Less: impairment (charge)/reversal on loans and losses 266,087 (32,411) 399,600 (1,009) 2,318 (8,845) 668,005 (42,265)Less: gold loan auction losses - - 2,995 2,200 - - 2,995 2,200 Net operating income 7,902,866 6,700,061 4,596,983 4,173,680 377,030 417,415 12,876,879 11,291,156
Less: other costs 2,658,552 2,285,180 1,942,640 1,687,008 82,236 73,806 4,683,428 4,045,994 Less: depreciation 203,041 179,733 174,413 156,265 7,283 7,220 384,737 343,218 Operating profits before taxes 5,041,273 4,235,148 2,479,930 2,330,407 287,511 336,389 7,808,714 6,901,944 Less: taxes 3,563,662 2,983,740 Profits for the year 4,245,052 3,918,204 Less: non controlling interest (17) - Profit attributable to equity holders of the company 4,245,069 3,918,204
Segmental assets 65,499,301 57,838,331 41,930,487 34,798,806 13,393,658 10,125,898 120,823,446 102,763,035 Segmental liabilities 57,250,824 50,797,482 36,669,639 30,562,635 11,554,049 8,893,239 105,474,512 90,253,356
Cash flows from operating activities 1,674,240 (4,890,120) 1,071,793 (2,942,172) 342,358 (856,125) 3,088,391 (8,688,417)Cash flows from investing activities 5,316 14,160 3,403 8,520 775,669 575,690 784,388 598,370 Cash flows from financing activities 289,342 3,623,461 185,227 2,180,079 59,166 634,368 533,735 6,437,908 Capital expenditureProperty, plant and equipment (834,115) (1,018,252) (533,973) (612,638) (170,565) (178,268) (1,538,653) (1,809,158)Intangible assets (12,326) (17,737) (7,892) (10,671) (2,521) (3,105) (22,739) (31,513)
Notes to the Financial Statements

L B Finance PLC . Annual Report 2017/18 411
6.5 COMMITMENTS AND CONTINGENCIES
Accounting policy
All discernible risks are accounted for in determining the amount of all known liabilities.
Contingent liabilities are possible obligations whose existence will be confirmed only by uncertain future events or present obligations where the transfer of economic benefit is not probable or cannot be reliably measured. Contingent liabilities are not recognised in the Statement of Financial Position but are disclosed unless they are remote.
6.5.1 Contingent liabilities
Company Group
2018 2017 2018
Rs. ‘000 Rs. ‘000 Rs. ‘000
Guarantees issued to banks and other institutions 6,500 17,460 6,500
Import LC and ordinary guarantees 38,069 58,370 38,069
Total contingent liabilities 44,569 75,830 44,569
6.5.2 Commitments
Company Group
2018 2017 2018
Rs. ‘000 Rs. ‘000 Rs. ‘000
Commitment for unutilised facilities 1,217,412 918,305 1,217,412
Total commitments 1,217,412 918,305 1,217,412
Total commitments and contingencies 1,261,981 994,135 1,261,981
6.5.3 Litigation against the Company
The Company has contingent liabilities in respect of legal claims arising in the ordinary course of business. Based on the information currently available, the Board of Directors is of the opinion that the ultimate resolution of the litigations would not likely to have a material impact on the Group.
Company Group
2018 2017 2018
Rs. ‘000 Rs. ‘000 Rs. ‘000
Cases pending against the company (Values claimed) 89,518 139,324 89,518
FIN
AN
CIA
L R
EP
OR
TS

412 L B Finance PLC . Annual Report 2017/18
6.6 NET ASSET VALUE PER SHARE
Company Group
2018 2017 2018
Rs. ‘000 Rs. ‘000 Rs. ‘000
Amounts used as the numerators:
Total equity attributable to equity holders 15,348,896 12,509,679 15,348,475
Number of ordinary shares used as denominators:
Total number of ordinary shares in issue 138,514,284 138,514,284 138,514,284
Net asset value per share (Rs.) 110.81 90.31 110.81
6.7 ASSETS PLEDGED
The following assets have been pledged as security for liabilities.
Nature of assets Nature of liability Carrying amount pledged Included under
Company Group
2018 2017 2018
Rs. ‘000 Rs. ‘000 Rs. ‘000
Lease rentals receivable and stock out on hire*
Bank loans, overdrafts and syndicated loans
26,511,882 28,007,463 26,511,882 Lease rentals receivable and stock out on hire
Freehold land and building Syndicated loans 130,199 201,312 130,199 Property, plant and
equipment
26,642,081 28,208,775 26,642,081
*The receivables and cash flows that have been included in bank loans, overdrafts and syndicated loans are only available for payment of the debt and other obligations issued or arising in such transactions. However, the Group hold the right to the excess cash flows not needed to pay the debt and other obligations issued or arising in each of such transactions. Gross amount of Lease Rentals Receivable and Stock out on Hire which have been pledged as at reporting date is Rs. 34,938,094,911/- ( 2017 - Rs. 36,631,551,282/- ).
6.8 COMPARATIVE INFORMATION
Comparative information is reclassified wherever necessary to conform with the current year’s classification in order to provide better presentation.
6.8.1 Income Statement
There were no reclassifications during the financial year.
6.8.2 Statement of Financial Position
There were no reclassifications during the financial year.
Notes to the Financial Statements

L B Finance PLC . Annual Report 2017/18 413
6.9 EVENTS OCCURRING AFTER THE REPORTING DATE
6.9.1 Final dividend - 2017/18
Subsequent to the reporting date, the Board of Directors of the Company recommended the payment of a final dividend of Rs. 4/- per share for the year ended 31 March 2018. This final dividend is yet to be approved at the Annual General Meeting to be held on 28 June 2018. In accordance with the Sri Lanka Accounting Standard LKAS 10 - (Events After the Reporting Period), this proposed final dividend has not been recognised as a liability as at 31 March 2018. Under the Inland Revenue Act No 24 of 2017, a withholding tax of 14% has been imposed on dividends declared.
No other circumstances have arisen subsequent to the reporting date which would require adjustment to or disclosure in the Financial Statements.
6.10 CHANGES IN LIABILITIES ARISING FROM FINANCING ACTIVITIES
Accounting policy
Sri Lanka Accounting Standard LKAS 7 - (Statement of Cash Flows), requires an entity to disclose information that enables users of Financial Statements to evaluate changes in liabilities arising from financing activities, including both changes arising from cash flows and non-cash changes. Accordingly, changes in liabilities arising from financing activities for the year ended 31 March 2018 are disclosed below together with the comparative figures for the year ended 31 March 2017.
The funds borrowed by the Company and the Group are given in Note 4.25 and Note 4.27.
Company & Group
Syndicated loans and other bank facilities
Debt instruments issued and other borrowed funds
Rs. ‘000 Rs. ‘000
Balance as at 1 April 2017 22,742,879 2,044,216
Net cash flows from financing activities (1,283,559) 3,000,000
Non cash changes
Foreign exchange movements - -
Net accrual for interest expense 93,362 108,616
Balance as at 31 March 2018 21,552,682 5,152,832
Company
Syndicated loans and other bank facilities
Debt instruments issued and other borrowed funds
Rs. ‘000 Rs. ‘000
Balance as at 1 April 2016 13,877,962 2,601,282
Net cash flows from financing activities 8,811,722 -
Non cash changes
Foreign exchange movements - -
Net accrual for interest expense 53,195 (557,066)
Balance as at 31 March 2017 22,742,879 2,044,216
FIN
AN
CIA
L R
EP
OR
TS

414 L B Finance PLC . Annual Report 2017/18
Supplementary Information

L B Finance PLC . Annual Report 2017/18 415
Supplementary Information

416 L B Finance PLC . Annual Report 2017/18
Income Statement in USS
Company Group
Year ended 31 March 2018 2017 2018
US$. '000 US$. '000 US$. '000
Income 160,553 127,643 160,553
Interest income 149,962 118,062 149,974
Less: Interest expenses 73,708 53,476 73,708
Net interest income 76,254 64,586 76,265
Fee and commission income 9,642 7,972 9,645
Net trading income (2) (1) (2)
Other operating income 950 1,610 937
Total operating income 86,844 74,167 86,844
Less: impairment charge/(reversal) for loans and other losses 4,280 (279) 4,282
Less: gold loan auction losses 19 15 19
Net operating income 82,545 74,431 82,543
Less: operating expenses
Personnel expenses 15,371 13,912 15,389
Depreciation of property, plant and equipment 2,344 2,150 2,344
Amortisation of intangible assets 119 113 122
Other operating expenses 14,619 12,759 14,633
Total operating expenses 32,453 28,934 32,488
Operating profit before tax on financial services 50,092 45,497 50,055
Less: Tax on financial services 8,569 6,771 8,569
Profit before taxation 41,523 38,726 41,486
Less: Income tax expense 14,275 12,898 14,275
Profit for the year 27,248 25,828 27,211
Profit attributable to:
Equity holders of the company 27,248 25,828 27,211
Non-controlling interest - - (0)
Profit for the year 27,248 25,828 27,211
Earnings per share: basic/diluted (US$) 0.20 0.19 0.20
Dividend per share
Dividend per share: Gross (US$) 0.07* 0.06
Dividend per share: Net (US$) 0.06* 0.05
Exchange rate of US$ was Rs. 156.00 as at 31 March 2018 (Rs. 151.70 as at 31 March 2017)
* Calculated based on interim dividend paid and proposed final dividend, which is to be approved at the Annual General Meeting.

L B Finance PLC . Annual Report 2017/18 417
Statement of Comprehensive Income in USS
Company Group
Year ended 31 March 2018 2017 2018
US$. '000 US$. '000 US$. '000
Profit for the year 27,248 25,828 27,211
Other Comprehensive Income that will be reclassified to Income Statement
Net gains/(losses) from translating the Financial Statements of the foreign operations - - 34
Fair value gains and losses arising on re-measuring available for sale financial assets
Equity securities
Fair value gains/(losses) on re-measuring equity securities 23 (134) 23
Reclassification adjustment for impairment on equity securities 29 37 29
Net fair value gains/(losses) on re-measuring equity securities 52 (97) 52
Other Comprehensive Income that will be reclassified to Income Statement 52 (97) 86
Less: Deferred tax charge/(reversal) on above items - - -
Net Other Comprehensive Income that will be reclassified to Income Statement 52 (97) 86
Other Comprehensive Income that will never be reclassified to Income Statement
Actuarial gains and losses on defined benefit plans (306) (29) (306)
Less: Deferred tax charge/(reversal) on actuarial gains and losses (86) (8) (86)
Net Other Comprehensive Income that will never be reclassified to Income Statement (220) (21) (220)
Other Comprehensive Income for the year, net of tax (168) (118) (134)
Total Comprehensive Income for the year, net of tax 27,080 25,710 27,077
Attributable to:
Equity holders of the company 27,080 25,710 27,077
Non-controlling interest - - (0)
Total Comprehensive Income for the year, net of tax 27,080 25,710 27,077
Exchange rate of US$ was Rs. 156.00 as at 31 March 2018 (Rs. 151.70 as at 31 March 2017)
SU
PP
LEM
EN
TAR
Y IN
FOR
MA
TIO
N

418 L B Finance PLC . Annual Report 2017/18
Statement of Financial Position in USS
Company Group
Year ended 31 March 2018 2017 2018
US$. '000 US$. '000 US$. '000
Assets
Cash and cash equivalents 37,656 19,084 38,399
Financial investments - held for trading 62 66 62
Loans and receivables 255,483 220,757 255,733
Lease rentals receivable and stock out on hire 400,575 366,915 400,575
Financial investments - available for sale 780 778 780
Other financial assets 43,414 44,308 43,376
Other non-financial assets 5,230 2,011 5,234
Investment in Subsidiary 980 - -
Property, plant and equipment 30,004 23,166 30,012
Intangible assets 308 324 339
Total assets 774,492 677,410 774,510
Liabilities
Due to banks 146,398 156,745 146,398
Due to customers 467,589 398,167 467,603
Debt instruments issued and other borrowed funds 33,031 13,475 33,031
Other financial liabilities 11,291 13,233 11,291
Other non-financial liabilities 5,466 4,439 5,469
Current tax liabilities 4,058 4,556 4,058
Deferred tax liabilities 6,787 3,319 6,787
Post employment benefit liability 1,482 1,013 1,482
Total liabilities 676,102 594,947 676,119
Equity
Stated capital 5,374 5,526 5,374
Reserves 27,375 22,494 27,409
Retained earnings 65,641 54,443 65,605
Total equity attributable to equity holders of the Company 98,390 82,463 98,388
Non controlling interest - - 3
Total equity 98,390 82,463 98,391
Total liabilities and equity 774,492 677,410 774,510
Commitments and contingencies 8,090 6,553 8,090
Net asset value per share (US$) 0.71 0.60 0.71
Exchange rate of US$ was Rs. 156.00 as at 31 March 2018 (Rs. 151.70 as at 31 March 2017)

L B Finance PLC . Annual Report 2017/18 419
Decade at a Glance
Key Indicators 2008/09 2009/10 2010/11 2011/12 2012/13 2013/14 2014/15 2015/16 2016/ 17 2017/ 18
Operating results
Net interest margin % 10.31 11.60 12.87 11.43 10.22 10.38 12.67 12.17 10.91 11.15
Cost to income % 51.72 42.87 41.27 41.75 42.30 41.29 35.88 35.89 39.01 37.37
Interest spread % 7.92 9.32 11.77 10.84 9.49 9.45 11.55 11.09 9.59 9.65
Financial position
Total assets to equity No.of times 10.38 9.79 10.81 10.75 10.18 9.80 8.52 8.07 8.21 7.87
Debt to equity No.of times 8.54 7.97 9.64 9.48 8.89 8.54 7.15 6.73 6.89 6.58
Equity to deposits % 14.12 14.06 13.32 14.60 13.75 13.46 17.45 19.63 20.71 21.04
Investor information
Return on equity (ROE) % 30.93 32.20 47.45 52.64 36.62 23.23 30.88 40.40 34.09 30.52
Return on average assets (ROA) % 2.91 3.21 4.51 4.85 3.51 2.33 3.40 4.89 4.18 3.80
Equity to assets % 9.64 10.21 9.08 9.31 9.83 10.21 11.74 12.40 12.17 12.70
Net assets value per share Rs. 10.28 12.68 18.37 28.65 38.47 44.81 57.23 75.66 90.31 110.81
Earnings per share (EPS) Rs. 2.74 3.61 7.37 12.37 12.29 9.67 15.75 26.84 28.29 30.69
Dividend per share (DPS) Rs. 3.00 5.00 3.50 5.00 6.50 6.50 10.00 7.50 9.00 11.00*
Dividend cover No.of times 3.46 2.89 4.21 4.95 3.78 2.98 3.15 3.58 3.14 2.79
Dividend yield % 13.33 26.32 11.29 2.86 4.82 4.90 9.99 9.99 8.48 9.25
Dividend payout % 28.89 34.62 23.76 20.20 26.45 33.59 31.74 27.94 31.82 35.84
Price earning ratio (PE) No.of times 1.73 4.29 5.94 5.45 5.40 5.17 4.77 3.95 4.19 3.87
Price to book value (PBV) No.of times 0.46 1.22 4.77 2.35 1.72 1.12 1.31 1.40 1.31 1.07
Market price per share Rs. 19.00 62.00 175.10 134.90 132.70 100.10 150.20 106.10 118.40 118.90
Market capitalisation Rs. million 624 2,147 12,127 9,343 9,190 6,933 10,402 14,696 16,400 16,469
Interest cover No.of times 1.25 1.39 1.69 1.66 1.42 1.26 1.56 1.92 1.72 1.56
Growth
Income % 28.84 15.39 33.19 44.26 43.23 19.88 8.51 5.81 23.76 29.35
Interest income % 64.81 15.18 29.99 42.01 44.25 20.78 7.65 5.42 24.13 30.62
Interest expense % 69.86 0.49 7.5 46.87 67.39 20.05 (16.65) (2.96) 40.52 41.74
Net interest income % 56.09 42.76 59.71 37.69 22.31 21.72 38.76 11.86 13.20 21.41
Profit before tax % 56.33 58.16 89.89 46.19 3.63 (26.05) 78.33 59.81 10.33 10.26
Profit after tax % 74.71 39.09 104.01 67.98 (0.69) (21.27) 62.84 70.37 5.39 8.49
Total assets % 30.39 22.77 62.93 52.15 27.17 12.16 11.06 25.13 21.59 17.57
Lending portfolio % 30.67 23.58 61.46 55.03 22.09 9.99 13.75 27.87 24.59 14.80
Deposit base % 30.77 30.67 62.23 34.10 42.58 18.98 (1.44) 17.50 13.16 20.76
Equity % 38.47 30.1 44.85 55.97 34.29 16.48 27.72 32.20 19.37 22.70
Employee
Profit before tax per employee Rs.'000 802 986 1319 1541 1229 875 1,387 1,940 1,823 1,883
Profit after tax per employee Rs.'000 519 561 807 1020 828 627 908 1,354 1,216 1,235
Total assets per employee Rs.'000 20,244 19,325 22,359 25,395 26,385 28,497 28,131 30,800 31,904 35,112
No. of branches 21 27 34 65 89 97 100 110 118 123
No. of gold loan centres 36 48 58 47 37 37 35 36 36 36
Total no. of outlets 57 75 92 112 126 134 135 146 154 159
No. of employees 692 890 1,264 1,679 2,055 2,134 2,401 2,744 3,221 3,441
Employees per outlet 12 12 14 15 16 16 18 19 21 22
* Includes proposed final dividend of Rs. 4.00 per share.
SU
PP
LEM
EN
TAR
Y IN
FOR
MA
TIO
N

420 L B Finance PLC . Annual Report 2017/18
Financial statements prepared under SLASs - Company
2008/09 2009/10 2010/11
Rs. ‘000 Rs. ‘000 Rs. ‘000
Income statement
Gross income 3,580,173 4,130,993 5,501,885
Interest income 3,431,950 3,953,032 5,138,718
Interest expenditure 2,238,847 2,249,805 2,418,480
Net interest income 1,193,103 1,703,227 2,720,239
Other operating income 122,326 174,285 353,647
Operating expenditure 647,561 839,479 1,171,025
Profits before taxation 555,315 878,290 1,667,820
Tax on financial services 112,552 159,744 235,040
Provision for taxation 195,707 378,129 647,452
Net profits 359,608 500,161 1,020,368
Balance sheet
Assets
Cash and amounts due from banks 217,642 277,083 347,446
Placements with other banks 550,496 364,918 302,584
Treasury bills and other bills eligible for re-discounting with Central Bank 799,698 1,165,157 1,622,158
Real estate stock 211,241 246,928 237,520
Loans and advances 2,834,414 4,193,815 7,543,231
Lease rentals receivable and stock out on hire 9,006,955 10,440,329 16,332,007
Investment securities 6,226 5,994 28,594
Trading portfolio - - 211,818
Other debtors, deposits and prepayments 141,619 104,271 675,235
Vehicle stock 41,939 156,502 519,706
Intangible assets 9,311 7,333 9,682
Property, plant and equipment 189,920 237,613 432,359
Total assets 14,009,461 17,199,943 28,262,340
Liabilities
Deposits from customers 9,558,370 12,489,789 19,619,681
Borrowings 1,527,997 1,065,377 3,526,374
Debentures 450,000 450,000 450,000
Trade payables and accrued charges 846,978 916,729 1,529,035
Tax payable 67,751 352,626 396,413
Deferred taxation 186,703 141,728 93,249
Provision and other liabilities 21,565 27,262 33,870
Total liabilities 12,659,364 15,443,511 25,648,622
Shareholders' funds
Share capital 491,996 491,996 838,282
Reserves 858,101 1,264,436 1,775,436
Total shareholders’ funds 1,350,097 1,756,433 2,613,718
Total liabilities and shareholders’ funds 14,009,461 17,199,944 28,262,340
Financial Statements
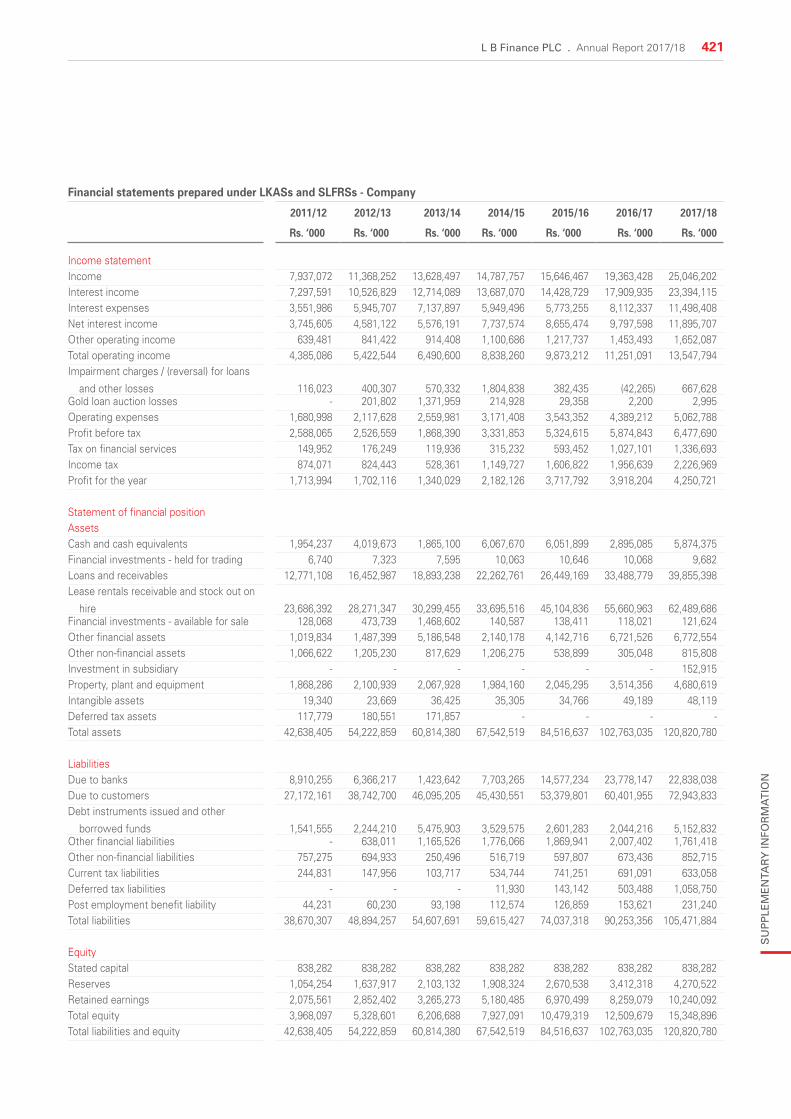
L B Finance PLC . Annual Report 2017/18 421
Financial statements prepared under LKASs and SLFRSs - Company
2011/12 2012/13 2013/14 2014/15 2015/16 2016/17 2017/18
Rs. ‘000 Rs. ‘000 Rs. ‘000 Rs. ‘000 Rs. ‘000 Rs. ‘000 Rs. ‘000
Income statementIncome 7,937,072 11,368,252 13,628,497 14,787,757 15,646,467 19,363,428 25,046,202 Interest income 7,297,591 10,526,829 12,714,089 13,687,070 14,428,729 17,909,935 23,394,115 Interest expenses 3,551,986 5,945,707 7,137,897 5,949,496 5,773,255 8,112,337 11,498,408 Net interest income 3,745,605 4,581,122 5,576,191 7,737,574 8,655,474 9,797,598 11,895,707 Other operating income 639,481 841,422 914,408 1,100,686 1,217,737 1,453,493 1,652,087 Total operating income 4,385,086 5,422,544 6,490,600 8,838,260 9,873,212 11,251,091 13,547,794 Impairment charges / (reversal) for loans
and other losses 116,023 400,307 570,332 1,804,838 382,435 (42,265) 667,628 Gold loan auction losses - 201,802 1,371,959 214,928 29,358 2,200 2,995 Operating expenses 1,680,998 2,117,628 2,559,981 3,171,408 3,543,352 4,389,212 5,062,788 Profit before tax 2,588,065 2,526,559 1,868,390 3,331,853 5,324,615 5,874,843 6,477,690 Tax on financial services 149,952 176,249 119,936 315,232 593,452 1,027,101 1,336,693 Income tax 874,071 824,443 528,361 1,149,727 1,606,822 1,956,639 2,226,969 Profit for the year 1,713,994 1,702,116 1,340,029 2,182,126 3,717,792 3,918,204 4,250,721
Statement of financial positionAssetsCash and cash equivalents 1,954,237 4,019,673 1,865,100 6,067,670 6,051,899 2,895,085 5,874,375 Financial investments - held for trading 6,740 7,323 7,595 10,063 10,646 10,068 9,682 Loans and receivables 12,771,108 16,452,987 18,893,238 22,262,761 26,449,169 33,488,779 39,855,398 Lease rentals receivable and stock out on
hire 23,686,392 28,271,347 30,299,455 33,695,516 45,104,836 55,660,963 62,489,686 Financial investments - available for sale 128,068 473,739 1,468,602 140,587 138,411 118,021 121,624 Other financial assets 1,019,834 1,487,399 5,186,548 2,140,178 4,142,716 6,721,526 6,772,554 Other non-financial assets 1,066,622 1,205,230 817,629 1,206,275 538,899 305,048 815,808 Investment in subsidiary - - - - - - 152,915 Property, plant and equipment 1,868,286 2,100,939 2,067,928 1,984,160 2,045,295 3,514,356 4,680,619 Intangible assets 19,340 23,669 36,425 35,305 34,766 49,189 48,119 Deferred tax assets 117,779 180,551 171,857 - - - - Total assets 42,638,405 54,222,859 60,814,380 67,542,519 84,516,637 102,763,035 120,820,780
Liabilities Due to banks 8,910,255 6,366,217 1,423,642 7,703,265 14,577,234 23,778,147 22,838,038 Due to customers 27,172,161 38,742,700 46,095,205 45,430,551 53,379,801 60,401,955 72,943,833 Debt instruments issued and other
borrowed funds 1,541,555 2,244,210 5,475,903 3,529,575 2,601,283 2,044,216 5,152,832 Other financial liabilities - 638,011 1,165,526 1,776,066 1,869,941 2,007,402 1,761,418 Other non-financial liabilities 757,275 694,933 250,496 516,719 597,807 673,436 852,715 Current tax liabilities 244,831 147,956 103,717 534,744 741,251 691,091 633,058 Deferred tax liabilities - - - 11,930 143,142 503,488 1,058,750 Post employment benefit liability 44,231 60,230 93,198 112,574 126,859 153,621 231,240 Total liabilities 38,670,307 48,894,257 54,607,691 59,615,427 74,037,318 90,253,356 105,471,884
EquityStated capital 838,282 838,282 838,282 838,282 838,282 838,282 838,282 Reserves 1,054,254 1,637,917 2,103,132 1,908,324 2,670,538 3,412,318 4,270,522 Retained earnings 2,075,561 2,852,402 3,265,273 5,180,485 6,970,499 8,259,079 10,240,092 Total equity 3,968,097 5,328,601 6,206,688 7,927,091 10,479,319 12,509,679 15,348,896 Total liabilities and equity 42,638,405 54,222,859 60,814,380 67,542,519 84,516,637 102,763,035 120,820,780
SU
PP
LEM
EN
TAR
Y IN
FOR
MA
TIO
N

422 L B Finance PLC . Annual Report 2017/18
Quarterly Financial Statements 2017/18
Income statement - Company
1st Quarter 2nd Quarter 3rd Quarter 4th Quarter
For the 3 months ended 30.06.2017 30.06.2016 30.09.2017 30.09.2016 31.12.2017 31.12.2016 31.03.2018 31.03.2017
Rs.'000 Rs.000' Rs.'000 Rs.000' Rs.'000 Rs.000' Rs.'000 Rs.000'
Income 5,534,727 4,315,838 6,021,459 4,628,282 6,586,588 5,051,635 6,903,428 5,367,674 Interest income 5,213,003 4,040,714 5,628,373 4,312,261 6,155,619 4,580,983 6,397,120 4,975,977 Less: interest expenses 2,639,958 1,709,411 2,863,516 1,894,195 2,984,383 2,102,448 3,010,551 2,406,282 Net interest income 2,573,045 2,331,303 2,764,857 2,418,066 3,171,236 2,478,534 3,386,569 2,569,695
Fee and commission income 299,759 265,166 347,067 303,387 391,661 291,769 465,701 349,017 Net trading income 920 786 (444) 752 (399) (811) (376) (876)Other operating income 21,045 9,171 46,463 11,881 39,707 179,694 40,982 43,555 Total operating income 2,894,769 2,606,426 3,157,943 2,734,087 3,602,205 2,949,187 3,892,877 2,961,392
Less: impairment charge/(reversal) for
loans and other losses 68,625 22,462 127,628 (7,453) 184,011 51,309 287,365 (108,583)Less: gold loan auction losses 470 2,122 (40) (272) (298) 302 2,862 48 Net operating income 2,825,675 2,581,843 3,030,355 2,741,812 3,418,492 2,897,575 3,602,649 3,069,927
Less: operating expensesPersonnel expenses 546,305 517,332 601,436 552,593 625,483 589,205 624,696 673,769 Depreciation of property, plant and
equipment 81,599 81,315 91,625 81,064 94,925 82,243 97,449 81,506 Amortisation of intangible assets 4,373 3,914 4,479 4,166 4,940 4,495 4,844 4,515 Other operating expenses 511,075 371,318 582,344 443,980 610,911 427,024 576,304 470,772
Operating profit before tax on financial
services 1,682,323 1,607,964 1,750,472 1,660,008 2,082,232 1,794,607 2,299,356 1,839,366 Less: tax on financial services 295,579 227,304 311,740 206,408 352,962 244,494 376,412 348,895
Profit before taxation 1,386,744 1,380,660 1,438,731 1,453,600 1,729,271 1,550,113 1,922,944 1,490,470 Less: income tax expense 446,749 468,952 487,741 505,493 600,248 525,664 692,230 456,530 Profit for the year 939,995 911,708 950,990 948,107 1,129,023 1,024,449 1,230,714 1,033,940
Rs.Mn
0
1,000
2,000
3,000
4,000
5,000
6,000
7,000
8,000
INCOME
1st Quarter
2ndQuarter
3rdQuarter
4thQuarter
2016/172017/18
Rs.Mn
0
500
1,000
1,500
2,000
2,500
3,000
3,500
4,000
OPERATING INCOME
1st Quarter
2ndQuarter
3rdQuarter
4thQuarter
2016/172017/18
Rs.Mn
2016/172017/18
0
300
600
900
1,200
1,500
PROFIT AFTER TAX
1st Quarter
2ndQuarter
3rdQuarter
4thQuarter

L B Finance PLC . Annual Report 2017/18 423
Statement of financial position - Company
1st Quarter 2nd Quarter 3rd Quarter 4th Quarter As at 30.06.2017 30.06.2016 30.09.2017 30.09.2016 31.12.2017 31.12.2016 31.03.2018 31.03.2017
Rs.'000 Rs.000' Rs.'000 Rs.000' Rs.'000 Rs.000' Rs.'000 Rs.000'
AssetsCash and cash equivalents 4,016,316 4,444,893 3,627,591 3,948,940 3,873,610 4,146,304 5,874,375 2,895,085 Financial investments - held for trading 10,901 11,039 10,458 11,792 10,059 10,981 9,682 10,068 Loans and receivables 35,036,991 27,250,245 35,588,604 29,231,097 37,768,494 31,738,491 39,855,398 33,488,779
Lease rentals receivable and stock out on hire 57,442,718 47,536,011 59,441,436 49,814,379 60,370,034 53,663,953 62,489,686 55,660,963 Financial investments - available for sale 135,242 145,956 130,521 154,588 120,037 132,354 121,624 118,021 Other financial assets 7,374,184 3,344,681 8,361,245 3,929,722 9,438,190 3,413,322 6,772,554 6,721,526 Other non-financial assets 468,618 703,526 427,203 746,987 887,524 399,535 815,808 305,048 Investment in Subsidiary - - - - - - 152,915 - Property, plant and equipment 4,096,220 2,056,096 4,297,421 2,071,008 4,292,290 2,126,963 4,680,619 3,514,356 Intangible assets 44,816 49,785 54,333 46,319 51,163 51,298 48,119 49,189
Total assets 108,626,006 85,542,232 111,938,812 89,954,832 116,811,401 95,683,201 120,820,780 102,763,035
Liabilities Due to banks 23,732,886 15,404,312 22,921,831 19,285,942 21,636,232 21,358,100 22,838,038 23,778,147 Due to customers 65,197,424 52,456,537 68,555,172 53,081,542 70,839,702 55,617,980 72,943,833 60,401,955 Debt instruments issued and other borrowed
funds 2,040,468 2,608,089 2,091,699 2,662,155 5,007,711 2,233,511 5,152,832 2,044,216 Other financial liabilities 1,948,207 1,858,478 2,201,118 2,074,938 1,881,450 2,423,439 1,761,418 2,007,402 Other non-financial liabilities 884,676 713,554 867,118 645,292 731,044 574,915 852,715 673,436 Current tax liabilities 689,539 826,210 631,275 608,068 914,854 867,951 633,058 691,091 Deferred tax liabilities 503,488 143,142 503,488 143,142 503,488 143,142 1,058,750 503,488 Post employment benefit liability 162,424 133,338 169,488 137,300 180,759 145,494 231,240 153,621
Total liabilities 95,159,112 74,143,660 97,941,189 78,638,379 101,695,240 83,364,532 105,471,884 90,253,356
EquityStated capital 838,282 838,282 838,282 838,282 838,282 838,282 838,282 838,282 Reserves 3,617,537 2,853,034 3,803,017 3,051,287 4,018,337 3,233,943 4,270,522 3,412,318 Retained earnings 9,011,075 7,707,256 9,356,324 7,426,884 10,259,542 8,246,444 10,240,092 8,259,079
Total equity 13,466,894 11,398,572 13,997,623 11,316,453 15,116,161 12,318,669 15,348,896 12,509,679
Total liabilities and equity 108,626,006 85,542,232 111,938,812 89,954,832 116,811,401 95,683,201 120,820,780 102,763,035
Quarterly NPL informationNPL ratio - gross 2.14% 3.14% 2.14% 2.64% 2.36% 2.43% 2.37% 2.14%NPL ratio - net -0.14% 0.06% -0.13% -0.06% -0.02% -0.13% -0.06% -0.11%
Rs.Mn
0
30,000
60,000
90,000
120,000
150,000
TOTAL ASSETS
1st Quarter
2ndQuarter
3rdQuarter
4thQuarter
2016/172017/18
Rs.Mn
0
20,000
40,000
60,000
80,000
100,000
120,000
TOTAL LIABILITIES
1st Quarter
2ndQuarter
3rdQuarter
4thQuarter
2016/172017/18
Rs.Mn
0
5,000
10,000
15,000
20,000
TOTAL EQUITY
1st Quarter
2ndQuarter
3rdQuarter
4thQuarter
2016/172017/18
SU
PP
LEM
EN
TAR
Y IN
FOR
MA
TIO
N

424 L B Finance PLC . Annual Report 2017/18
Branch Network
Branch Province Address Telephone Fax
Akkaraipattu Eastern 28, Sagama Road, Akkaripattu -08. 067-2279155/067-2057536 067-2279655
Akuressa Southern 83, Deniyaya Road, Akuressa. 041-2283559/041-2283388 041-2283560
Aluthgama Western 185, Galle Road, Aluthgama. 034-2271161/034-2271162 034-2271155
Ambalangoda Southern 96/2, Galle Road, Ambalangoda. 091-2256107/091-2255722 091-2256650
Ampara Eastern 04, Opposite Clock Tower, Ampara. 063-2224254/063-2222882 063-2223504
Anamaduwa North Western 24, Chilaw Road, Anamaduwa. 0322-263090/0322-263091 0322-263092
Anuradhapura North Central 137, Main Street, Anuradhapura. 025-2234885/025-2225526 025-2237155
Anuradhapura 11 North Central 514A New Town, Anuradhapura. 025-2234455/025-2225660 025-2226759
Atchchuvely Northern 69, Main Street, Atchchuvely. 0212-232215/0212-232216 0212-232217
Avissawella Western 25, Yatiyanthota Road, Avissawella. 036-2222155/036-2233833 036-2234222
Badulla Uva 26, Anagarika Dharmapala Mawatha, Badulla. 055-2228055/055-2231965 055-2231964
Badulla 11 Uva 55, Lower Street, Badulla. 055-2224255/055-2222125
Balangoda Sabaragamuwa 19, Rest House Approach Road, Balangoda. 045-2289255/045-2288374 045-2288216
Bambalapitiya Western 670 & 676, Galle Road, Bambalapitiya 0112-155380/0112-155497 0112-508658
Bandarawela Uva 167, Main Street, Bandarawela. 057-2231155/057-2221235 057-2225424
Battaramulla Western 755/1 , Pannipitiya Road, Battaramulla. 011-2885331/011-2887565 011-2885332
Batticaloa Eastern 175A, Trinco Road , Batticaloa. 065-2229270/065-2229280 065-2229280
Boralesgamuwa Western 28, Dehiwala Road, Boralesgamuwa. 011-2509159/011-2545504 011-2518389
Chavakachcheri Northern 136, Kandy Road, Chavakachcheri. 021-2271545/021-2271565 021-2270623
Chenkalady Eastern Opposite Market Complex, Main Road, Chenkalady.
065-2054263/065-2054264 065-2054265
Chilaw North Western 40/1, Colombo Road, Chilaw. 032-2224229/032-2224235 032-2224725
Chunnakkam Northern 55, K.K.S. Road, Chunnakkam. 021-2242055/021-2241525 021-2241334
Head office Western 275/75, Prof. Stanley Wijesundara Mawatha, Colombo 07.
011-2200000/011-2200200 011-2508507
Corporate office Western 20, Dharmapala Mawatha, Colombo 03. 011-2155000 011-2574777
Dam Street Western 371/1, Dam Street, Colombo 12. 011-2335445 011-2435259
Dambulla Central 38, Kurunegala Junction, Dambulla. 066-2283155/066-2283740 066-2284990
Dehiattakandiya Eastern 10/2, Opposite BOC, New Town, Dehiattakandiya.
027-2250071/027-2250072 027-2250073
Dehiwala Western 84A, Galle Road, Dehiwala. 011-2722446/011-2732802 011-2722446
Delgoda Western 350/16, Colombo Road, Delgoda. 0112-403556/0112-403557 0112-403629
Delkanda Western 595, High Level Road, Gangodawila, Nugegoda.
011-2802333/011-2802828 011-2804343
GRI - 102-4

L B Finance PLC . Annual Report 2017/18 425
Branch Province Address Telephone Fax
Deniyaya Southern 149, Main Street, Deniyaya. 041-2273196/041-2273197 041-2273195
Dharga Town Western 358/D, Mathugama Road,Dharga Town 0342-293470/0342-293472 0342-293471
Divulapitiya Western 69, Giriulla Road, Divulapitiya. 0312-248083/0312-248073 0312-248043
Eheliyagoda Sabaragamuwa 25A, Main Street, Eheliyagoda. 0362-256142/0362-256143 0362-256141
Elpitiya Southern 14, Main Street, Elpitiya. 091-2291990/091-2291980 091-2291958
Embilipitiya Sabaragamuwa 43, Main Street, Embilipitiya. 047-2262767/047-2262766 047-2261990
Galle Southern 150, Main Street ,(Old Sathosa Building) Galle. 091-2227446/091-2232347 091-2233155
Gampaha Western 01, Bauddhaloka Mawatha, Gampaha. 033-2234810/033-2225380 033-2227955
Gampola Central 22, Nuwara Eliya Road, Gampola. 081-2354855/081-2075655 081-2351455
Gampola City Central 66, Nawalapitiya Road, Gampola. 081-2353609/081-2353610 081-2353611
Gelioya Central 13A, Kandy Road , Gelioya. 081-2067740/081-2067242 081-2067241
Hatton Central 52 A, Dunbar Road, Hatton. 051-2225355/051-2224725 051-2225736
Homagama Western 76, High Level Road, Homagama. 011-2748155/011-2182220 011-2894380
Horana Western 103, Panadura Road, Horana. 034-2265297/034-2265223 034-2265316
Ja Ela Western 6/1/1, Old Negombo Road , Ja Ela. 011-2229820/011-2229613 011-2244155
Jaffna Northern 442-440, Hospital Road, Jaffna. 021-2215949/021-2215959 021-2220249
Jaffna -City Northern 111, 113, Stanley Road , Jaffna. 021-2217912/021-2217911 021-2217910
Jaffna -Premier Northern 406, Hospital Road , Jaffna. 021-2217810/021-2217812 021-2217811
Kadawatha Western 139/6, Kandy Road, Kadawatha. 011-2926713/011-2926714 011-2926917
Kaduwela Western 484, Avissawella Road, Kaduwela. 011-2548955/011-2538110 011-2538222
Kalawanchikudy Eastern Opposite Hospital, Hospital Road, Kalawanchikudy
065-2251626/065-2251636 065-2251646
Kalmunei Eastern Main Street, Batticaloa Road, Kalmunai. 067-2225355/067-2056436 067-2220418
Kalutara Western 334, Main Street, Kalutara. 034-2222217/034-2222290 034-2223343
Kandana Western 06, Station Road, Kandana. 011-2231925/011-2240171 011-2239155
Kandy Central Milton House, Kotugodalla Veediya, Kandy. 081-2238932/081-2225765 081-2200155
Kandy City Central 226, D S Senanayaka Street, Kandy. 081-2054626/081-2054627 081-2204155
Karapitiya Southern 598 E, Hiribura Road, Karapitiya 0912-228360/0912-228362 0912-228361
Katthankudy Eastern 801, Mohomed Aiyar Building, Main Street, 065-2247007/065-2247006 065-2248655
Katugastota Central 19, Madawala Road, Katugastota. 081-2064868 081-2500562
Katugastota City Central 179, Katugastota Road , Kandy. 081-2213886/081-2213888 081-2213887
Kegalle Sabaragamuwa 19, Main Street, Kegalle. 035-2223633/035-2223634 035-2221755
Kekirawa North Central 15, Thalawa Road, Kekirawa. 0252-265245/0252-265246 025-2265248
SU
PP
LEM
EN
TAR
Y IN
FOR
MA
TIO
N

426 L B Finance PLC . Annual Report 2017/18
Branch Network
Branch Province Address Telephone Fax
Kilinochchi Northern Opposite Kandhasamy Kovil, Kandy Road, Kilinochchi.
021-2283955/021-2283270 021-2285349
Kinniya Eastern 50/2, Main Street, Kinniya. 026-2237443/026-2237444 026-2237445
Kiribathgoda Western 02, Kandy Road, Kiribathgoda. 011-2911788/011-2906440 011-2906155
Kochchikade Western 110, Chilaw Road, Kochchikade. 031-2274555/031-2272774 031-2274205
Kokkadicholi Eastern Main Street, Division 10, Kokkadicholi. 065-2056900/065-2056901 065-2056915
Kotahena Western 03, St. Lucias Street, Kotahena. 011-2382155/011-2335808 011-2424795
Kottawa Western 365, High Level Road, Kottawa. 011-2745722/011-2745488 011-2745449
Kotte Western 429, Kotte Road, Pitakotte. 011-2818155/011-2818011 011-2820967
Kuliyapitiya North Western 12, Main Street, Kuliyapitiya. 037-2284155/037-2283802 037-2283802
Kurunegala North Western 21, Dambulla Road, Kurunegala. 037-2231172 037-2231175
Kurunegala City North Western 118A, Kadurugas Junction,Colombo Road, Kurunegala.
037-2227155/037-2231171 037-2233550
Kurunegala Premier
North Western 103A, Colombo Road, Kurunegala. 037-2222411/037-2223411 037-2229696
Maharagama Western 227A, High Level Road, Maharagama 011-2838311/011-2841100 011-2848222
Mahiyanganaya Uva 56&57, Edwin Wickramarathne Shopping Complex, Mahiyanganaya.
055-2257622/055-2257623 055-2258455
Malabe Western 834/7, Kaduwela Road, Malabe. 011-2561815/011-2156855 011-2742970
Manipay Northern 110, Jaffna Road, Manipai. 021-2255955/021-2556777 021-2255523
Mannar Northern 187, Main Street, Mannar. 0232-251825/0232-251826 0232-251827
Maradana Western 538,538A, Maradana Road, Colombo 10. 011-2670155/011-2685425 011-2685359
Maskeliya Central 175, Main Street, Maskeliya. 052-2277032 052-2277088
Matale Central 251, Main Street, Matale. 066-2231902/066-2223740 066-2222266
Matara Southern 13, Station Road, Matara. 041-2225454/041-2232710 041-2231155
Matara City Southern 282, Anagarika Dharmapala Mawatha, Matara. 041-2224496/041-2224497 041-2228666
Matugama Western 34, Aluthgama Road, Matugama. 034-2241811/034-2241812 034-2249343
Medawachchiya North Central 26, Kandy Road, Medawachchiya. 025-2245304/025-2245302 025-2245303
Medirigiriya North Central D T C Fashion, Main Street, Medirigiriya. 0272-248858/0272-248859 027-2248860
Monaragala Uva 44, New Bus Stand, Monaragala. 055-2055445/055-2055446 055-2276905
Moratumulla Western 227 & 327A, De Soyza Road, Moratumulla, Moratuwa.
011-2654154/011-2654380 011-2653365
Moratuwa Western 10, Station Road, Moratuwa. 011-2642288/011-2648120 011-2642255
Mount Lavinia Premier
Western 66, 66 1/1 & 66 1/2 , Galle Road, Mount Lavinia.
0112-710124/0112-710125 011-2710126
Narammala North Western 35, Sarasavi Building , Kuliyapitiya Road, Narammala.
0372-249313/0372-249312 0372-249314

L B Finance PLC . Annual Report 2017/18 427
Branch Province Address Telephone Fax
Nawalapitiya Central No.3A, UC Road, Nawalapitiya. 054-2223850/054-2223110 054-2224050
Negombo Western 80, Greens Road , Negombo. 031-2231265/031-2239155 031-2231266
Nelliadi Northern 10, Jaffna Road, Nelliady. 021-2264655/021-2263111 021-2262923
Neluwa Southern 2, H V Building, Dellawa Road, Neluwa. 091-2285180/091-3096960 091-3096950
Nugegoda Western 92, Stanley Thilakarathna Mawatha, Nugegoda.
011-2890681/011-2890680 011-2814335
Nuwara Eliya Central 71, City Light Building, Queen Elizabeth Drive, Nuwara Eliya
052-2233407/052-3050332 052-2234155
Panadura Western 508, Galle Road, Panadura. 038-2238371/038-2244799 038-2243525
Pilimathalawa Central 298, Colombo Road, Pilimathalawa. 081-2579940/081-2579941 081-2579942
Piliyandala Western 68 , Horana Road, Piliyandala. 011-2618816/011-2609013 011-2608895
Pitigala Southern 87, Main Street, Pitigala. 091-2291155/091-2291155 091-2291941
Polonnaruwa North Central Rajarata Building,Main Street, Kaduruwela, Polonnaruwa.
027-2052080/027-2052081 027-2052083
Pottuvil Eastern Main Street, Pothuvill. 063-2248148/063-2248149 063-2050855
Pussellawa Central 473, Nuwara Eliya Road, Pussellawa. 081-2478138/081-2478128 081-2478148
Puthukkudiyiruppu Northern Ward No. 1, Puthukkudiyiruppu, Mullaitivu. 0212-290411/0212-290412 0212-290413
Puttlam North Western 10, Kurunegala Road, Puttlam. 032-2267755/032-2267051 032-2266939
Rajagiriya Western 347A, Kotte Road, Rajagiriya. 011-2885378/011-2885379 011-2885551
Rathnapura Sabaragamuwa 49, Senanayake Mawatha, Rathnapura. 045-2233871/045-2233872 045-2225864
Saindamarudu Eastern MPCS Building, Main Street, Sainthamaruthu -09
067-2221655 067-2225366
Samanthurai Eastern 25, Hijra Junction, Samanthurai. 067-2260955/067-2058394 067-2261394
Sea Street Western 197, Sea Street, Colombo 11. 011-2385155/011-2334404 011-2434597
Tangalle Southern 66, Thissa Road, Tangalle. 047-2241750/047-2244501 047-2241751
Thambuttegama North Central 256, New Town, Thambuttegama. 025-2275146/025-2275147 025-2275567
Thissamaharama Southern 34, Main Street, Thissamaharama. 047-2237942/047-4931676 047-2237360
Trincomalee Eastern 275, Central Road, Trincomalee. 026-2222155/026-2060010 026-2226737
Valachchenai Eastern Opposite Market, Main Street, Valachchenai. 065-2059626/065-2059628 065-2059627
Vauniya Northern 32/B, 2nd Cross Street, Vauniya. 024-2228175/024-2228176 024-2226955
Wadduwa Western 534, Galle Road, Wadduwa 0382-282120/0382-282121 0382-282122
Warakapola Sabaragamuwa 81, Kandy Road ,Warakapola. 035-2267267/035-2268268 035-2267788
Wattala Western 17, Station Road , Hendala Junction, Wattala. 011-2933198/011-2982264 011-2933218
Welimada Uva 51A, Nuwara Eliya Road, Welimada. 057-2246455/057-2244504 057-2244828
Wennappuwa North Western 134, Colombo Putlam Road, Wennappuwa. 031-2245155/031-2252130 031-2253553
SU
PP
LEM
EN
TAR
Y IN
FOR
MA
TIO
N

428 L B Finance PLC . Annual Report 2017/18
Gold Loan Centres
Centres Province Address Telephone Fax
Aluth Mawatha Western No.367/1, Aluth Mawatha, Colombo 15. 011-2528472 011-2528471Attidiya Western 269, 269/1, Main Street, Attidiya. 011-2732905/011-2732906 011-2736625Baduraliya Western 48, Rathnapura Road, Baduraliya. 034-2240851/034-2240852 034-2240853Bandaragama Western No.04, Panadura Road, Bandaragama. 038-2289425/038-2289426 038-2289427Beruwala Western 175/A, Galle Road, Beruwala. 034-2298024/034-2298124 034-2298126Borella Western 54, D S Senanayake Mawatha, Colombo 08. 011-2669155/011-2678129Deans Road Western 133, Deans Road, Maradana. 011-2694295/011-2682155Dehiwala 2 Western 124, Galle Road, Dehiwala. 011-2726078/011-2715448 011-2710156Dematagoda Western 551, Sri Wajiragnana Mawatha ,Colombo 09. 011-2675194/011-2675193Elakanda Western 18, Elakanda Road, Hendala, Wattala. 011-2941166/011-2940243Ganemulla Western 229, Kadawatha Road, Ganemulla. 033-2265866/033-2260042 033-2265766Golumadama Western 05, Kaldemulla Road, Moratuwa. 011-2623999/011-3010944Gothatuwa (IDH) Western 52/17, Gothatuwa, New Town. 011-2411990/011-2411991Grandpass -Sulaiman
Western 47, Grandpass Road, Colombo 14. 011-2390155/011-2473522
GrandPass-Kosgashandiya
Western 21, St. Joseph Street, Grandpass, Colombo 14.
011-4345368/011-2334416 011-2333892
Grandpass-Stadium
Western 395, Grandpass Road, Colombo 14. 011-2391155/011-2422610
Hanwella Western 24A, Main Street, Hanwella. 036-2252080/036-2252027 036-2252047Jampattah Western 66, Jampattah Street, Colombo 13. 011-2388155/011-2437270Kelaniya Western 722, Waragoda Road, Vihara Junction,
Kelaniya.011-2908155/011-2911781
Keselwatte Western 18, Galle Road , Keselwatte, Panadura. 038-2299210/038-4281885 038-2297849Kiribathgoda -Makola
Western 44, Makola Road, Kiribathgoda. 011-2914955 011-2914838
Kirulapana Western 91, High Level Road, Colombo 06. 011-2512088/011-2512099Kolonnawa Western 141A, Kolonnawa Road, Kolonnawa. 011-2572355/011-2026750Maharagama 2 Western 67 , Dehiwala Road, Maharagama. 011-2841455/011-2840137 011-2840136Maligawatte Western 157D, New Pradeepa Road, Maligawatte,
Colombo 10011-2698913/011-2698915
Mattakkuliya Western 7D/2, Sri Wickrama Mawatha, Mattakkuliya, Colombo 15
011-2527155/011-2520930
Modera Western 81, Modera Street, Colombo 15. 011-2526155/011-2520940Narahenpita Western 239, Kirula Road, Narahenpita. 011-2369108 011-2369107Negombo 2 Western 356, Main Street, Negombo. 011-2885378/011-2885379 011-2885551Nittambuwa Western 594/3, Kandy Road, Nittambuwa. 033-2294355/033-4934108 033-2297971Ragama Western 661/A, Thewatte Road, Ragama. 011-2953155/011-2960803Slave Island Western 135, Malay Street, Colombo 02. 011-2300530/011-2303155Sri Sangaraja Mawatha
Western 259, Sri Sangaraja Mawatha, Colombo 10. 011-2334078/011-2334592
Thihariya Western 61/2, Kandy Road, Thihariya. 033-2293655/033-4678082 033-4678141Thotalanga Western 282, Nagalagam Street, Colombo 14. 011-2540155/011-2520885Wellawatte Western 224, Galle Road, Wellawatte, Colombo 06. 011-2362115/011-2506951 011-2362745

L B Finance PLC . Annual Report 2017/18 429
AFS Available for SaleAGM Annual General MeetingALCO Assets and Liabilities Management CommitteeAPSP Average Petroleum Spot PriceASPI All Share Price IndexATM Automated Teller MachineAWDR Average-Weighted Deposit RateAWFDR Average-Weighted Fixed Deposit RateAWPLR Average Weighted Prime Lending RateBFI Banking Finance InsuranceBN BillionBOD Board of DirectorsBPO Business Process OutsourceBPS Basis PointsCAR Capital Adequacy RatioCBSL Central Bank of Sri LankaCDS Central Depository SystemCDM Cash Deposit MechineCMU Customer Management UnitCEO Chief Executive OfficerCFO Chief Financial OfficerCGU Cash Generating UnitCRO Chief Risk OfficerCRM Customer Replationship ManagementCSE Colombo Stock ExchangeCSR Corporate Social ResponsibilityDR Disaster RecoveryEIR Effective Interest RateEPF Employees’ Provident FundEPS Earnings per ShareERP Enterprise Resource Planning SystemESC Economic Service ChargeETF Employees’ Trust FundFVtPL Fair Value through Profit or LossGDP Gross Domestic ProductGRI Global Reporting InitiativeHFT Held for TradingHODs Head of DepartmentsHP Hire PurchaseHTM Held to MaturityICASL The Institute of Chartered Accountants of Sri
LankaIFA Investment Fund AccountIFRS International Financial Reporting StandardIIRC Inrernational Integrated Reporting CouncilIRMC Integrated Risk Management CommitteeIRMU Integrated Risk Management UnitISO International Standard OrganisationIT Information Technology
KMP Key Management PersonnelKPIs Key Performance IndicatorsKRIs Key Risk IndicatorsL&R Loans and ReceivablesLRA Lanka Rating AgencyLBF L B Finance PLCLBMF LB Microfinance Myanmar Company LimitedLCB Licensed Commercial BankLFC Licensed Finance CompanyLKAS Lanka Accounting StandardsLKR Sri Lankan RupeesLTV Loan to ValueMN MillionM3 Cubic MeterMOU Memorandum of UnderstandingMSME Micro, Small and Medium EnterprisesMRMR Monthly Risk Management and ReportingNBFI Non-Bank Financial InstitutionsNBT Nation Building TaxNCRE Non-Conventional Renewable EnergyNPA Non-Performing AdvancesNII Net Interest IncomeNIM Net Interest MarginNPL Non-Performing LoansOCI Other Comprehensive IncomePAT Profit after TaxPAYE Pay As You EarnPDC Product Development CommitteePER Price Earnings RatioPLC Public Limited CompanyRMD Risk Management DepartmentROA Return on AssetsROCE Return on Capital EmployedROE Return on EquityRWA Risk-Weighted AssetsSBUs Strategic Business UnitsSEC Securities and Exchange CommissionSLC Specialised Leasing CompanySLA Statutory Liquid AssetsSLAR Statutory Liquid Asset RatioSLAS Sri Lanka Accounting StandardSLCF Sri Lanka Carbon FundSLFRS Sri Lanka Financial Reporting StandardSLIPS Sri Lanka Inter-Bank Payment SystemSME Small and Medium EnterprisesUOM Unit of MeasurementUSD US DollarVAR Value at RiskVAT Value Added TaxWHT Withholding Tax
List of Abbreviations
SU
PP
LEM
EN
TAR
Y IN
FOR
MA
TIO
N

430 L B Finance PLC . Annual Report 2017/18
Independent Assurance Report on Sustainability
INDEPENDENT ASSURANCE REPORT TO LB FINANCE PLC ON THE SUSTAINABILITY REPORTING CRITERIA PRESENTED IN THE INTEGRATED ANNUAL REPORT- 2017/18
Introduction and scope of the engagement
The management of LB Finance PLC (“the Company”) engaged us to provide an independent assurance on the following elements of the sustainability reporting criteria presented in the annual report- 2017/18 (“the Report”).
» Reasonable assurance on the information on financial performance as specified on page 216 of the Report.
» Limited assurance on other information presented in the Report, prepared in accordance with the requirements of the Global Reporting Initiative GRI Standards: ‘In accordance’ - Comprehensive guidelines.
Basis of our work and level of assurance
We performed our procedures to provide limited assurance in accordance with Sri Lanka Standard on Assurance Engagements (SLSAE 3000): ‘Assurance Engagements Other than Audits or Reviews of Historical Financial Information’, issued by the Institute of Chartered Accountants of Sri Lanka (“CASL”).
The evaluation criteria used for this limited assurance engagement are based on the Sustainability Reporting Guidelines (“GRI Guidelines”) and related information in particular, the requirements to achieve GRI Standards ‘In accordance’ - Comprehensive guideline publication, publicly available at GRI’s global website at “www.globalreporting.org”.
Our engagement provides limited assurance as well as reasonable assurance. A limited assurance engagement is substantially less in scope than a reasonable assurance engagement conducted in accordance with SLSAE-3000 and consequently does not enable to obtain assurance that we would become aware of all significant matters that might be identified in a reasonable assurance engagement. Accordingly, we do not express an opinion providing reasonable assurance.
Management of the Company’s responsibility for the Report
The management of the Company is responsible for the preparation of the self-declaration, the information and statements contained within the Report, and for maintaining adequate records and internal controls that are designed to support the sustainability reporting process in line with the GRI Sustainability Reporting Guidelines.
Ernst & Young’s responsibility
Our responsibility is to express a conclusion as to whether we have become aware of any matter that causes us to believe that the Report is not prepared in accordance with the requirements of the Global Reporting Initiative, GRI Standards: ‘In accordance’ - Comprehensive guidelines. This report is made solely to the Company in accordance with our engagement letter dated 19 March 2018. We disclaim any assumption of responsibility for any reliance on this report to any person other than the Company or for any purpose other than that for which it was prepared. In conducting our engagement, we have complied with the independence requirements of the Code for Ethics for Professional Accountants issued by the CASL.
Key assurance procedures
We planned and performed our procedures to obtain the information and explanations considered necessary to provide sufficient evidence to support our limited assurance conclusions. Key assurance procedures included:
» Interviewing relevant the company’s personnel to understand the process for collection, analysis, aggregation and presentation of data.
» Reviewing and validation of the information contained in the Report.
» Checking the calculations performed by the Company on a sample basis through recalculation.
GRI - 102-56

L B Finance PLC . Annual Report 2017/18 431
» Reconciling and agreeing the data on financial performance which is properly derived from the Company’s audited Financial Statements for the year ended 31 March 2018.
» Comparison of the content of the Report against the criteria for a Global Reporting Initiative, GRI Standards: In accordance’ - Comprehensive guidelines.
Our procedures did not include testing electronic systems used to collect and aggregate the information.
Limitations and considerations
Environmental and social performance data are subject to inherent limitations given their nature and the methods used for determining, calculating and estimating such data.
Conclusion
Based on the procedures performed, as described above, we conclude that;
» The information on financial performance as specified on page 216 of the Report are properly derived from the audited Financial Statements of the Company for the year ended 31 March 2018.
» Nothing has come to our attention that causes us to believe that other information presented in the Report are not fairly presented, in all material respects, in accordance with the Company’s sustainability practices and policies some of which are derived from Sustainability Reporting Guideline, GRI Standards- ‘In accordance’ Comprehensive.
Ernst & Young
Chartered Accountants
22 May 2018Colombo
SU
PP
LEM
EN
TAR
Y IN
FOR
MA
TIO
N

432 L B Finance PLC . Annual Report 2017/18
Sustainability Committee Review
Inputs taken within the Company
Inputs taken from the stakeholders
Management Committees and its governance
Critical
Linking to the Corporate Governance structure
Non critical
Linking to the business lines
Operation structure
Preparation economic strategies
Preparation social strategies
Preparation environment
strategies
Sustainability Committee
CORPORATE GOVERNANCE - SUSTAINABILITY TOPICS
Commitment towards sustainability
We strongly believe that responsible stewardship is the key to creating a
sustainable future for all communities associated with the business. We have always remained true to our fundamental values. We continue to uphold the promise to deliver consistent value to all stakeholders as we believe that our success is measured not only in terms
of our ability to produce shareholder value, but also our accountability to all stakeholders associated with our business. We have embraced the triple bottom line model as a template to convey tangible value to all those impacted by our work.
Input InputFeedback Feedback
Composition of Sustainability Committee Chaired by : Executive Director Assets Management
Responsibilities and reporting on sustainability impacts, challenges, risk and opportunities
Risk assessment Monitoring, controlling the due diligence aspects
Representatives from:
» Risk department
» Treasury department
» Marketing department
» Credit department
» Finance department
» HR department
» Economic context
Financial capital
» Social context
Social and relationship capital
» Environment context
Natural capital
Assessing and taking action against the risk arise based on their impact to the business, covering all the economic, social and environment aspects as whole.
Assess, validate, report and review the sustainability aspects with compliance and due diligence
» Monthly
» Quarterly
» Annually
submiting a report to the Board of Directors
Concern about
sustainability topics
PAGE 48PAGE 124
PAGE 18
PAGE 12
PAGE 202
PAGE 264
PAGE 290
PAGE 177
GRI - 102-18, 19,20 ,21, 29,
31, 33,

L B Finance PLC . Annual Report 2017/18 433
Values
Principles
StandardIntergrity
Norms of
behavior
Customer privacy
IT quality assurence
Business continuity plan
Responsible delegation of the frameworkPreparation : HR departmentManagement : Senior ManagementApproving : Board of DirectorsCovering : All the employees of the Company
Practice and evaluation framework- All employees should signed including highest
governance body of the Company
- Conducting the training at the induction level and when required
HR policy frameworks
Risk management
Guideline issued by governing entities
Sustainable business
Company code of conduct
Sustainability protection – Precautionary principles
Sustainability governance
Ethics and integrity framework of the Company
GRI - 102-16, 17
SU
PP
LEM
EN
TAR
Y IN
FOR
MA
TIO
N

434 L B Finance PLC . Annual Report 2017/18
Consolidated Set of GRI SustainabilityReporting StandardsConsolidated set of GRI Sustainability Reporting Standards
GRI Content Index – ‘In Accordance’ – Comprehensive
GRI standard
Disclosure External assurance provided
Page number
Remarks
Organisational profiles102-1 Name of the organistion 444102-2 Activities, brands, products and services 271, 275102-3 Location of headquarters 444102-4 Location of operations 12, 424-
428102-5 Ownership and legal form 13, 444102-6 Markets served 12, 244,
424-428102-7 Scale of the organization 13, 21, 22102-8 Information on employees and other workers 258102-9 Supply chain 276-277102-10 Significant changes to the organization and its supply chain 276-277102-11 Precautionary principle or approach 296102-12 External initiatives 6102-13 Membership of associations 444Strategy102-14 Statement from senior decision-maker 29-31102-15 Key impacts, risks and opportunities 127, 178-
199Ethics and integrity102-16 Values, principles, standards and norms of behavior 236, 433102-17 Mechanisms for advice and concerns about ethics 236,433Governance102-18 Governance structure 18, 19, 48,
432102-19 Delegating authority 432102-20 Executive –level responsibility for economic, environmental
and social topics 432
102-21 Consulting stakeholders on economic, environmental and social topics
432
102-22 Composition of the highest governance body and its committeees
36-39, 444
102-23 Chair of the highest governance body 36102-24 Nominating and selecting the highest governance body 86, 109102-25 Conflicts of interest Partially,
58, 59102-26 Role of highest governance body in setting purpose, values
and strategy 54-55
102-27 Collective knowledge of highest governance body 51102-28 Evaluating the highest governance body’s performance 87102-29 Identifying and managing economic, environmental and
social impacts 432
GRI - 102-55

L B Finance PLC . Annual Report 2017/18 435
GRI standard
Disclosure External assurance provided
Page number
Remarks
102-30 Effectiveness of risk management processes 112, 178-199
102-31 Review of economic, environmental and social topics 432102-32 Highest governance body’s role in sustainability reporting 5102-33 Communicating critical concerns 432102-34 Nature and total number of critical concerns Partially, 91102-35 Remuneration policies *102-36 Process for determining remuneration *102-37 Stakeholders’ involvement in remuneration *102-38 Annual total compensation ration *102-39 Percentage increase in annual total compensation ratio *Stakeholder engagement102-40 List of stakeholder groups 124102-41 Collective bargaining agreements 256, 258102-42 Identifying and selecting stakeholders 124102-43 Approach to stakeholder engagement 127-132102-44 Key topics and concerns raised 127-132Reporting practice102-45 Entities included in the Consolidated Financial Statements 13, 324102-46 Defining report content and topic boundaries 133, 134102-47 List of material topics 135-141102-48 Restatements of information None102-49 Changes in reporting Material topics are changed
during the year102-50 Reporting period 4102-51 Date of most recent report 4102-52 Reporting cycle 4102-53 Contact point for questions regarding the report 5102-54 Claims of reporting in accordance with the GRI Standards 4102-55 GRI content index 434-439102-56 External assurance 5, 430
SU
PP
LEM
EN
TAR
Y IN
FOR
MA
TIO
N

436 L B Finance PLC . Annual Report 2017/18
GRI standard
Disclosure External assurance provided
Page number
Remarks
GRI 201: Economic performance103-1 MANAGEMENT APPROACH
Wealth creation for all stakeholders of LB Finance PLC by implementing forward looking corporate strategies, while assessing the risk of the market
135, 141
103-2 Implementation 135, 141103-3 Performance 135, 141201-1 Direct economic value generated and distributed 216-217201-2 Financial implications and other risks and opportunities due
to climate change Considering the nature of the
business we are not reporting on climate changes.
201-3 Defined benefit plan obligations and other retirement plans 260, 337201-4 Financial assistance received from government There is no direct or indirect
financial assistance received from the government.
GRI 202: Market Presence103-1 MANAGEMENT APPROACH
Create a stable and progressive financial environment, which renders high quality solutions, backed by superior technology and a customer-friendly service platform
135
103-2 Implementation 135103-3 Performance 135202-1 Ratios of standard entry level wage by gender compared to
local minimum 252*
202-2 Proportion of senior management hired from the local community
Senior Management refers to the designated authority in charge of a key business
department. All senior managers of the Company are local hires.
GRI 203: Indirect economic impacts103-1 MANAGEMENT APPROACH
Initiate responsible stewardship and strategies that would transmit change through the social and economic parameters of the business operations
141
103-2 Implementation 141103-3 Performance 141203-1 Infrastructure investments and services supported 280-289203-2 Significant indirect economic impacts 280-289
Consolidated Set of GRI SustainabilityReporting Standards

L B Finance PLC . Annual Report 2017/18 437
GRI standard
Disclosure External assurance provided
Page number
Remarks
GRI 300: EnvironmentGRI 302: Energy103-1 MANAGEMENT APPROACH
Adopt lean resource consumption practices across our operations, to reduce the use of paper, energy, non bio-degradable material, greater degree of renewable energy project financing and energy saving projects
139
103-2 Implementation 139103-3 Performance 139302-1 Energy consumption within the organization 296302-2 Energy consumption outside of the organisation We are not consuming energy
outside of the organization302-3 Energy intensity 297302-4 Reduction of energy consumption 296302-5 Reductions in energy requirements of products and services Considering the nature of the
business, this is not relevant for the organization
GRI 305: Emissions103-1 MANAGEMENT APPROACH
Ensure proactive steps to mitigate the impact on the emission caused by day-to-day business and adhere to all mandatory environmental parameters applicable to business operations and transactions
139
103-2 Implementation 139103-3 Performance 139305-1 Direct (Scope 1) GHG emissions 301305-2 Energy indirect (Scope 2) GHG emissions 301305-3 Other indirect (Scope 3) GHG emissions 301305-4 GHG emissions intensity 301305-5 Reduction of GHG emissions 301305-6 Emissions of ozone-depleting substances (ODS) 300305-7 Nitrogen oxides (NOX) sulfur oxides (SOX) and other
significant air emissions 300
GRI 400: SocialGRI 401: Employment103-1 MANAGEMENT APPROACH
Commitment to create an environment conducive for employees to develop and reach their full potential, both professionally and personally
140
103-2 Implementation 140103-3 Performance 140401-1 New employee hires and employee turnover 259401-2 Benefits provided to full-time employees that are not
provided to temporary or part-time employees 252
401-3 Parental leave 262
SU
PP
LEM
EN
TAR
Y IN
FOR
MA
TIO
N

438 L B Finance PLC . Annual Report 2017/18
GRI standard
Disclosure External assurance provided
Page number
Remarks
GRI: 404: Training and education103-1 MANAGEMENT APPROACH
Develop a culture where people can make a difference both as individuals and as a team and ensure employee’s readiness to take up responsibilities and challenges in our growth process
140
103-2 Implementation 140103-3 Performance 140404-1 Average hours of training per year per employee 261404-2 Programmes for upgrading employee skills and transition
assistance programmes 261
404-3 Percentage of employees receiving regular performance and career development reviews
253
GRI 405: Diversity and equal opportunity103-1 MANAGEMENT APPROACH
Striving to achieve HR excellence in our business, we continue to pursue an inclusive strategy to develop a work place where equality and diversity feature prominently in the people development agenda
140
103-2 Implementation 140103-3 Performance 140405-1 Diversity of governance bodies and employees 258405-2 Ratio of basic salary and remuneration of women to men 260GRI 413: Local communities103-1 MANAGEMENT APPROACH
Working in tandem with global and local mandates that safeguard social responsibility and uphold community empowerment
139
103-2 Implementation 139103-3 Performance 139413-1 Operations with local community engagement, impact
assessments and development programmes 289
413-2 Operations with significant actual and potential negative impacts on local communities
There are no operations with significant actual and potential
negative impacts on local communities.
Consolidated Set of GRI SustainabilityReporting Standards

L B Finance PLC . Annual Report 2017/18 439
GRI standard
Disclosure External assurance provided
Page number
Remarks
GRI 416: Customer health and safety103-1 MANAGEMENT APPROACH
Determination to ensure customer well-being has led us to formulate products and services that do not in any way impair or harm the health and safety of our customers
138
103-2 Implementation 138103-3 Performance 138416-1 Assessment of the health and safety impacts of product and
service categories A health and safety assessment
of our products & services was not carried out during the
reporting period.416-2 Incidents of non-compliance concerning the health and
safety impacts of products and services There were no incidents
reported regarding health and safety impacts of product and
servicesGRI 418: Customer privacy103-1 MANAGEMENT APPROACH
Seeking to demonstrate accountability and responsible stewardship towards all customers, which provides unwavering commitment to safeguard customer privacy
138
103-2 Implementation 138103-3 Performance 138418-1 Substantiated complaints concerning breaches of customer
privacy and losses of customer data 270
* Information cannot be disclosed - confidential information
SU
PP
LEM
EN
TAR
Y IN
FOR
MA
TIO
N

440 L B Finance PLC . Annual Report 2017/18
Glossary of Terms
A
Accounting policies
Accounting policies The specific principles, bases, conventions, rules and practices adopted by an entity in preparing and presenting Financial Statements.
Accrual basis
The system of accounting wherein revenue is recognised at the time it is earned and expenses at the time they are incurred, regardless of whether cash has actually been received or paid out.
Allowance for impairment
A provision held on the Statement of Financial Position as a result of the raising of a charge against profit for the incurred loss.
Amortisation
The systematic allocation of the depreciable amount of an intangible asset over its useful life. Amortised cost Amount at which the financial asset or financial liability is measured at initial recognition, minus principal repayments, plus or minus the cumulative amortisation using the effective interest method of any difference between that initial amount and the maturity amount and minus any deduction for impairment or uncollectability.
Asset and Liability Committee (ALCO)
The committee that is responsible for managing assets and liabilities of the Company.
Available for sale financial investments
Non-derivative financial assets that are not classified as loans and receivables, held to maturity investments or financial assets at fair value through profit or loss.
Average weighted deposit rate (AWDR)
AWDR is calculated by the Central Bank monthly based on the weighted average of all outstanding interest bearing deposits of commercial banks and the corresponding interest rates. Average weighted prime lending rate (AWPLR) AWPLR is calculated by the Central Bank weekly based on commercial bank’s lending rates offered to their prime customers during the week
B
Basis Point (BP)
One hundred of a percentage point (0.01 per cent); 100 basis points is 1 percentage points: Used in quoting movements in interest rates or yields on securities.
Brexit
The United Kingdom’s withdrawal from the European Union.
C
Capital adequacy ratio
The relationship between capital and risk weighted assets as prescribed by the Central Bank of Sri Lanka.
Cash equivalents
Short-term, highly liquid investments that are readily convertible to known amounts of cash and which are subject to an insignificant risk of changes in value.
Cash Flows
Cash equivalents are short-term, highly liquid investment that are readily convertible to know amount of cash and which are subject to an insignificant risk of changes in value.
Collective impairment
Impairment is measured on a collective basis for homogeneous groups of lending facilities that are not considered as individually significant and to cover losses that have been incurred but has not yet been identified at the reporting date.
Commercial paper (CP)
An unsecured, debt instrument issued by a company, to finance short-term funding requirements. The debt is usually issued at a discount, reflecting prevailing market interest rate.
Commitments
Credit facilities approved but not yet utilised by the clients as at the reporting date. Compounded annual growth rate (CAGR) The rate at which it would have grown if it grew at an even rate compounded annually.
Contingencies
A condition or situation existing at reporting date where the ultimate outcome of which,
gain or loss, will be confirmed only on the occurrence or non-occurrence of one or more uncertain future events.
Cost method
A method of accounting where by the investment is recorded at cost. The Income Statement reflects income from the investment only to the extent that the investor receives distributions from accumulated net profiles of the investee rising subsequent to the date of acquisition.
Corporate governance
The process by which corporate entities are governed. It is concerned with the way in which power is exercised over the management and direction of entity, the supervision of executive actions and accountability to owners and others.
Corporate Sustainability
Business approach that creates long-term consumer and employee value by creating a ‘green’ strategy aimed toward the natural environment and taking into consideration every dimension of how a business operates in the social, cultural and economic environment.
Cohort Method
A study design where one or more samples (called Cohorts) are followed prospectively and subsequent status evaluation with or outcome are conducted to determine which initial participants exposure characteristics (risk factors) are associated with it.
Cost to income ratio
Operating expenses excluding impairment charge/gold loan auction losses as a percentage of total operating income (net of interest expenses).
Credit rating
An evaluation of a corporate’s ability to repay its obligations or the likelihood of not defaulting, carried out by an independent rating agency.
Credit risk
Risk of financial loss, if a customer or counterparty fails to meet an obligation under a contract.
Credit risk mitigation
A technique to reduce the credit risk associated with an exposure by application

L B Finance PLC . Annual Report 2017/18 441
of credit risk mitigants such as collateral, guarantee and credit protection.
Customer Deposits
Money deposited by account holders. Such funds are recorded as liabilities.
D
Deferred taxation
Sum set aside for income tax in the Financial Statements that may become payable/receivable in a financial year other than the current financial year.
Depreciation
The systematic allocation of the depreciable amount of an asset over its useful life.
Derecognition
Removal of a previously recognised financial asset or liability from an entity’s Statement of Financial Position.
Discount rate
A rate used to place a current value on future cash flows. It is needed to reflect the fact that money has a time value.
Dividend cover
Profit attributable to ordinary shareholders as a percentage of gross dividends; indicates number of times dividend is covered by current year’s distributable profits.
Dividend pay-out ratio
Dividend by profit after tax; indicates the percentage of earnings paid out to shareholders as dividends.
Dividend per share (DPS)
Value of the total dividend paid out and proposed to ordinary shareholders divided by the number of ordinary shares in issue; indicates the proportion of current year’s dividend attributable to an ordinary share in issue.
Dividend yield
Dividend expressed as a percentage of market value of a share. In absence of any capital gains, this shows the return on investing on a share relative to its market price.
E
Earnings per share (EPS)
Profit attributable to ordinary shareholders divided by the number of ordinary shares in issue; indicates the proportion of current year’s earnings attributable to an ordinary share in issue.
Economic value added (EVA)
A measure of performance considering cost of total invested equity.
Effective interest rate (EIR)
Rate that exactly discounts estimated future cash payments or receipts through the expected life of the financial asset or liability.
Effective tax rate
Provision for taxation excluding deferred tax expressed as a percentage of the profit before taxation.
Equity method
This is a method of accounting whereby the investment is initially recognised at cost and adjusted thereafter for the post-acquisition changes in the investor’s share of net assets of the investee. The profit or loss and other comprehensive income of the investor include the investor’s share of the profit or loss and other comprehensive income of the investee
Events after the reporting period
Transactions that are not recognised as assets or liabilities in the Statement of Financial Position, but which give rise to the contingencies and commitments.
Exposure
A claim, contingent claim or position which carries a risk of financial loss.
FFair value
The amount for which an asset could be exchanged or a liability settled, between knowledgeable, willing parties in an arm’s length transaction.
Fair value through profit or loss
A financial asset or financial liability that is held-for trading or upon initial recognition designated by the entity as fair value through profit or loss.
Finance lease
A contract whereby a lessor conveys to the lessee the right to use an asset for rent over an agreed period of time which is sufficient to amortise the capital outlay of the lessor. The lessor retains ownership of the asset but transfers substantially all risks and rewards of ownership to the lessee.
Financial assets
Any asset that is cash, equity instrument of another entity, a contractual right to receive cash or contractual right to receive another financial asset from another entity.
Financial guarantee contract
A financial guarantee contract is a contract that requires the issuer to make specified payments to reimburse the holder for a loss it incurs because a specified debtor fails to make payment when due in accordance with the original or modified terms of a debt instrument.
Financial instrument
A financial instrument is any contract that gives rise to both a financial asset in one entity and a financial liability or equity instrument in another entity.
Financial liabilities
A contractual obligation to deliver cash or other financial asset to another entity or to exchange financial assets or financial liabilities with another entity under conditions that are potentially unfavourable to the entity.
G
Global reporting initiative (GRI)
GRI is a leading organisation in the sustainability filed. GRI promotes the use of sustainability reporting as a way for organisation to become more sustainable and contribute to sustainable development.
Going Concern
The Financial Statements are normally prepared on the assumption that an entity is a going concern and will continue in operation for the foreseeable future. Hence, it is assumed that the entity has neither the intention nor the need to liquidate or curtail materially the scale of its operations.
SU
PP
LEM
EN
TAR
Y IN
FOR
MA
TIO
N
442 L B Finance PLC . Annual Report 2017/18
Gross dividend
The proportion of profit distributed to shareholders including the tax withheld.
Guarantees
An assurance made by a third party (Guarantor) who is not a party to contract between two others, that the guarantor will be liable if the Guarantee fails to fulfil the contractual obligation
H
Held for trading
Debt and equity investments that are purchased with the intent of selling them within a short period of time.
Held to maturity investments
Non-derivative financial assets with fixed or determinable payments and fixed maturity that an entity has the positive intention and ability to hold to maturity.
Hire purchase
A contract between hirer and financier where the hirer takes on hire a particular article from the financier, with the option to purchase the article at the conclusion of the agreed rental payments.
I
Impaired loans
Impaired loans are loans where the company does not expect to collect all the contractual cash flows or expects to collect them later than they are contractually due.
Impairment
This occurs when the recoverable amount of an asset is less than its carrying amount.
Impairment charge/(reversal)
An increase/(decrease) of the difference between the carrying value of an asset and the sum of discounted future cash flows generating from the same asset compared to the previous reporting date.
Individual impairment
Impairment is measured on an individual basis for non-homogeneous groups of lending facilities that are considered as individually significant.
Individual significant loans
Exposures which are above a certain threshold decided by the management which should be assessed for objective evidence, measurement and recognition of impairment on an individual basis.
Intangible asset
An identifiable non-monetary asset without physical substance.
Integrated reporting
A methodology of reporting an organisation’s strategy, governance, financial performance and prospects in relation to the creation of value over the short, medium and long-term in its economic, social and environmental context.
Interest cover
Earnings before interest and taxes divided by interest cost. This indicates the number of times interest expenses is covered by earnings before interest and tax; ability to cover interest expenses.
Interest spread
Represents the difference between the average interest rate earned on average interest earning assets and the average interest rate paid on average interest bearing liabilities.
K
Key management personnel (KMP)
People those who are having authority and responsibility for planning, directing and controlling the activities of the entity.
L
Lending portfolio
Total value of lending products net of unearned income, amounts received in advance and allowance for impairment.
Letter of credit (LC)
Written undertakings by a Bank on behalf of its customers, authorising a third party to draw on the Bank up to a stipulated amount under specific terms and conditions. Such undertakings are established for the purpose of facilitating international trade.
Liquid assets
Assets that are held in cash or in a form that can be converted to cash readily.
Loss given default (LGD)
The percentage of an exposure that a lender expects to lose in the event of obligor default.
Loan to value ratio (LTV)
The LTV ratio is a mathematical calculation which expresses the amount of a first mortgage lien as a percentage of the total appraised value of real property. The LTV ratio is used in determining the appropriate level of risk for the loan and therefore the correct price of the loan to the borrower.
M
Market capitalisation
Number of ordinary shares in issue multiplied by the market value of a share as at a date.
Materiality
The relative significance of a transaction or an event, the omission or misstatement of which could influence the economic decisions of users of financial statement.
Millennials
Demographic cohort following generation X, also known as generation Y.
N
Net assets value per share (NAV)
Shareholders’ funds excluding preference shares, if any, divided by the number of ordinary shares in issue.
Net interest income
The difference between interest income earned from interest earning assets and interest expenses incurred on interest-bearing liabilities.
Net interest margin (NIM)
Net interest income expressed as a percentage of average interest earning assets.
Glossary of Terms

L B Finance PLC . Annual Report 2017/18 443
Non-performing loans/advances (NPL)
The aggregate value of the advances portfolio that has been delinquent for a period of more than six months.
Non-Performing Loans Cover
Cumulative loan provision as a percentage of total non-performing loans (net of interest in suspense)
NPL ratio
Total non-performing loans as a percentage of the total lending portfolio.
Non-recurring profit
A one time or highly infrequent profit.
O
Off-balance sheet transactions
Transactions that are not recognised as assets or liabilities in the Statement of Financial Position, which give rise to the commitment and contingencies in future.
Operational Risk
This refers to the risk of loss resulting from inadequate or failed internal processes, people and systems or from external events.
P
Price earnings ratio (P/E ratio)
Market price of a share divided by earnings per share; reflects number of years that would be taken to recoup shareholders’ capital outlay in the form of earnings.
Probability of default (PD)
An internal estimate for each borrower grade of the likelihood that an obligor will default on an obligation.
R
Related party
Parties have the ability to control or exert a significant influence over the company’s financial and operating decisions.
Return on assets (ROA)
Net profit for the year expressed as a percentage of average total assets; indicates overall effectiveness in generating profits with available assets.
Return on equity (ROE)
Net profit for the year, less dividends on preference shares, if any, expressed as a percentage of average shareholders’ funds/equity.
Repurchase agreement (Repo)
Contract to sell and subsequently repurchase government securities at a specified date and price.
Risk-weighted assets
On balance sheet assets and the credit equivalent of off balance sheet assets multiplied by the relevant risk weighting factors.
S
Shareholders’ funds
Total of issued and fully paid share capital and revenue reserves.
T
Tier I capital
Core capital representing permanent shareholders’ equity and reserves created or increased by appropriations of retained earnings or other surpluses.
Tier II capital
Supplementary capital representing revaluation reserves, general provisions and debt instruments such as subordinated term debts and other hybrid capital instruments which combine certain characteristics of equity and debt.
Total shareholder return
Combines share price appreciation and dividends paid to show the total return to the shareholder expressed as an annualised percentage.
U
Useful life
The period over which an asset is expected to be available for use by an entity or the number of production or similar units expected to be obtained from the asset by an entity.
V
Value added
Wealth created by providing banking and other services less the cost of providing such services. The value added is allocated among the employees, the providers of capital, to government by way of taxes and retained for expansion and growth.
Y
Yield to maturity
Discount rate at which the present value of future cash flows would equals the security’s current price.
SU
PP
LEM
EN
TAR
Y IN
FOR
MA
TIO
N

444 L B Finance PLC . Annual Report 2017/18
Corporate Information
NAME OF COMPANYL B Finance PLC
LEGAL FORMPublic Limited Liability Company Incorporated in Sri Lanka under the provisions of the Companies Ordinance No. 51 of 1938 (Cap 145) and re-registered as per the Companies Act No. 07 of 2007 on 6th June 2008.
A Licensed Finance Company under the Finance Business Act No. 42 of 2011.
A registered Financed Leasing Establishment in terms of Finance Leasing Act No. 56 of 2000.
STOCK EXCHANGE LISTINGThe Company was admitted to the official List of the Colombo Stock Exchange on 30th December 1997. The ordinary shares and unsecured subordinated redeemable debentures redeemable in 2018 senior and subordinated unsecured, redeemable rated, debenture redeemable in 2022 of the Company are listed on the Colombo Stock Exchange.
DATE OF INCORPORATION30th May 1971
COMPANY REGISTRATION NUMBERPQ 156
TAX PAYER IDENTIFICATION NUMBER104033431
VAT REGISTRATION NUMBER104033431 7000
CENTRAL BANK REGISTRATION NUMBERRFC 1003
PRINCIPAL ACTIVITIESAcceptance of fixed deposits, maintenance of savings accounts, providing finance lease, hire purchase and vehicle loan facilities, mortgage loans, gold loans, margin trading facilities, factoring and trade finance facilities, micro finance, other credit facilities and value added services.
REGISTERED OFFICENo. 275/75, OPA Building, Prof. Stanley Wijesundara Mawatha, Colombo 07. Tel: 011-2200000 Fax: 011-5345327
CORPORATE OFFICENo. 20, Dharmapala Mawatha, Colombo 03 Tel: 011-2155000 Fax: 011-2575098
OUTLETSBranches - 123Gold loan centres - 36
WEBSITEwww.lbfinance.com
FINANCIAL YEAR END31 March
CREDIT RATINGThe Company has been assigned A- (lka) stable by Fitch Ratings Lanka Limited
BOARD OF DIRECTORS AND BOARD APPOINTED COMMITTEES
BOARD OF DIRECTORSMrs. Shirani Jayasekara (Chairperson)Mr. Dhammika Perera(Executive Deputy Chairman)Mr. J A S Sumith Adhihetty (Managing Director)Mr. Thosapala Hewage(Independent Non-Executive Director)Mr. Niroshan Udage (Executive Director)Mr. B D A Perera (Executive Director)Mr. Ravindra Shanaka Yatawara (Executive Director)Mrs. Anandhiy K. Gunawardhana(Independent Non-Executive Director)Mrs. Yogadinusha Bhaskaran(Non-Executive Director)Mr. M A J W Jayasekara (Independent Non-Executive Director)*
AUDIT COMMITTEEMrs. Yogadinusha Bhaskaran (Chairperson)Mrs. Anandhiy K GunawardhanaMr. M A J W Jayasekara
REMUNERATION COMMITTEEMrs. Anandhiy K Gunawardhana (Chairperson)Mrs. Yogadinusha BhaskaranMr. M A J W Jayasekara
NOMINATION COMMITTEEMr. Thosapala Hewage (Chairman)Mrs. Anandhiy K. GunawardhanaMr. J A S Sumith Adhihetty
INTEGRATED RISK MANAGEMENT COMMITTEEMr. M A J W Jayasekara (Chairman)Mrs. Anandhiy K GunawardhanaMr. J A S Sumith AdhihettyMr. Niroshan UdageMr. B D A PereraMr. Ravindra Shanaka YatawaraMr. Bimal PereraMr. Hasitha AthapattuMr. Udul ChandrasenaMs. Zairaa Kaleel
SECRETARIESP W Corporate Secretarial (Pvt) Ltd.No. 3/17, Kynsey Road, Colombo 08Tel: 011- 4640360-3Fax: 011- 4740588
Email: [email protected]
EXTERNAL AUDITORSErnst & Young
INTERNAL AUDITORSBDO PartnersKPMG
BANKERSBank of CeylonCommercial Bank of Ceylon PLCDFCC Bank PLCHatton National Bank PLCIndian Overseas BankIndian BankNDB Bank PLCNations Trust Bank PLCPan Asia Banking Corporation PLCPeople’s BankSampath Bank PLCSeylan Bank PLCStandard Chartered BankUnion Bank of Colombo PLCHabib Bank LimitedPublic Bank
CORPORATE MEMBERSHIPS AND ASSOCIATIONS
The Finance Houses Association of Sri LankaLeasing Association of Sri LankaCSR Lanka (Guarantee) LimitedLanka Business Coalition on HIV and AidsSri Lanka Business and BiodiversityThe Ombudsman Sri Lanka (Guarantee) LimitedMercantile Cricket AssociationMercantile Football Association
SUBSIDIARY COMPANYLB Microfinance Myanmar Company Ltd (Company incorporated in the Union of the Republic of Myanmar)
COMPANY REGISTRATION NUMBER844 FC of 2016-2017 (YGN)
REGISTERED OFFICEMyawaddy Bank
Luxury Complex, 4th Floor, Apt 401 Bo Gyoke
Road cnr, W a Dan Street, Lanmadaw Township, Yangon, Myanmar
BOARD OF DIRECTORSMr K D D PereraMr J A S S AdhihettyMr N UdageMr B D A PereraMr R S YatawaraMr Dulan R G de Silva
*Non Executive Director as per the Finance Companies (Corporate Governance) Direction No.03 of 2008
GRI - 102-1, 3, 5, 13, 22
L B Finance PLC . Annual Report 2017/18 445
Notice of Annual General Meeting
NOTICE IS HEREBY GIVEN that the Forty Fifth (45th) Annual General Meeting of L B Finance PLC will be held at the Corporate Office of the Company, No. 20, Dharmapala Mawatha, Colombo 3 on 29th June 2018 at 8.30 a.m. for the following purposes:
1 To receive and consider the Annual Report of the Board of Directors on the affairs of the Company and the Financial Statements for the year ended 31 March 2018 and the Report of the Auditors thereon.
2. To declare a Dividend as recommended by the Directors.
3. To re-elect Mrs. Shriani Jayasekara as a Director in terms of Articles 85 and 86 of the Articles of Association of the Company.
4. To re-elect Mr. Moderage Ashane Joseph Waas Jayasekara as a Director in terms of Article 92 of the Articles of Association of the Company.
5. To re-appoint the retiring Auditors Messrs Ernst & Young, Chartered Accountants, as the Company’s Auditors and authorize the Directors to determine their remuneration.
6. To authorize the Directors to determine donations for the year ending 31 March 2019 and up to the date of the next Annual General Meeting.
By Order of the BoardL B Finance PLC
P W Corporate Secretarial (Pvt) LtdDirector / Secretaries
01 June 2018
Notes:
1. A shareholder is entitled to appoint a Proxy to attend and vote at the meeting on his/her behalf.
2. A Proxy need not be a shareholder of the Company.
3. A Form of Proxy accompanies this Notice.
4. The completed Form of Proxy should be deposited at the Registered Office of the Company No. 275/75, Professor Stanley Wijesundera Mawatha, Colombo 7, by 8.30 a.m. on 27th June 2016.
SU
PP
LEM
EN
TAR
Y IN
FOR
MA
TIO
N

446 L B Finance PLC . Annual Report 2017/18
Notes

L B Finance PLC . Annual Report 2017/18 447
Form of Proxy
I/We* ………………………………………………………………….......................…..........…..........… (holder of NIC No. ............................) of
…………………………………………………………..........…..........…..........…..........…..........…..........…..........…..........….............…..........…
shareholder/s of L B FINANCE PLC hereby appoint ..........…..........…..........…..........…..........…..........…..........…..........…..........…..........…
(holder of NIC No. ..........................) of .........…..........….........…............….........…..........….........…..........….........…..........… or failing him*
Mrs. Shirani Jayasekara or failing her *
Mr. Dhammika Perera or failing him*
Mr. John Anthony Sunil Sumith Adhihetty or failing him*
Mr. Thosapala Hewage or failing him*
Mr. Niroshan Udage or failing him*
Mr. Biyawalage Dudley Auburn Perera or failing him*
Mr. Ravindra Shanaka Yatawara or failing him*
Mrs. Anandhiy Krisnajina Gunawardhana or failing her *
Mrs. Yogadinusha Bhaskaran or failing her*
Mr. Moderage Ashane Joseph Wass Jayasekara
as my/our* proxy to represent me/us* and to vote as indicated hereunder for me/us* and on my/our* behalf at the Forty Fifth (45th) Annual General Meeting of the Company to be held on 29th June 2018 and at every poll which may be taken in consequence of the aforesaid meeting and at any adjournment thereof.
For Against
1. To declare a dividend as recommended by the Directors.
2. To re-elect Mrs. Shirani Jayasekara as a Director in terms of Articles 85 and 86 of the Articles of Association of the Company.
3. To re-elect Mr. Moderage Ashane Joseph Wass Jayasekara as a Director in terms of Article 92 of the Articles of Association of the Company.
4. To re-appoint the retiring Auditors Messrs Ernst & Young, Chartered Accountants as the Company’s Auditors and authorize the Directors to determine their remuneration
5. To authorize the Directors to determine donations for the year ending 31 March 2019 up to the date of the next Annual General Meeting.
In witness my/our* hand this ……………… day of …………………. Two Thousand and Eighteen.
……………………………….Signature of Shareholder/s
*Please delete what is inapplicable.

448 L B Finance PLC . Annual Report 2017/18
Form of Proxy
Instructions for completion
1. The full name, National Identity Card number and the registered address of the shareholder appointing the Proxy and the relevant details of the Proxy should be legibly entered in the Form of Proxy which should be duly signed and dated.
2. The completed Proxy should be deposited at the Registered Office of the Company, No.275/75, Professor Stanley Wijesundera Mawatha, Colombo 07, by 8.30 a.m. on 27th June 2018.
3. The Proxy shall –
(a) In the case of an individual be signed by the shareholder or by his/her attorney, and if signed by an Attorney, a notarially certified copy of the Power of Attorney should be attached to the completed Proxy if it has not already been registered with the Company.
(b) In the case of a company or corporate / statutory body either be under its Common Seal or signed by its Attorney or by an Officer on behalf of the Company or corporate / statutory body in accordance with its Articles of Association or the Constitution or the Statute (as applicable).
4. Please indicate with a ‘X’ how the Proxy should vote on each resolution. If no indication is given, the Proxy in his/her discretion will vote as he/she thinks fit.
5. Articles 59 to 62 of the Articles of Association of the Company dealing with voting are quoted below for information of the shareholders.
59 METHOD OF VOTING
At any General Meeting a resolution put to the vote of the meeting shall be decided on a show of hands unless a poll is (before or on the declaration of the result of the show of hands) demanded by-
i. the Chairman of the meeting; or
ii. not less than three persons present in person or by Attorney or representative or by proxy and entitled to vote; or
iii. a Member or Members present in person or by Attorney or representative or by proxy and representing not less than one tenth of the total voting rights of all the Members having the right to vote at the meeting; or
iv. a Member or Members present in person or by attorney or representative or by proxy and holding shares in the Company conferring a right to vote at the meeting being shares on which an aggregate sum has been paid up equal to not less than one tenth of the total sum paid up on all the shares conferring that right.
A demand for a poll may be withdrawn, unless a poll be demanded (and the demand be not withdrawn) a declaration by the Chairman of the meeting that a resolution has been carried, or carried unanimously, or by a particular majority, or lost, and an entry to that effect in the minute book, shall be conclusive evidence of the fact without proof of the number or proportion of the votes recorded for or against such resolution.
60. HOW A POLL IS TO BE TAKEN
If a poll is duly demanded (and the demand be not withdrawn), it shall be taken in such manner (including the use of ballot or voting papers or tickets) as the Chairman of the meeting may direct, and the results of a poll shall be deemed to be the resolution of the meeting at which the poll was demanded. The Chairman may (and if so requested shall) appoint scrutinizers and may adjourn the meeting to some place and time fixed by him for the purpose of declaring the result of the poll.
61 In the case of an equality of votes, whether on a show of hands or on a poll, the Chairman of the meeting at which the show of hands takes place or at which the poll is demanded shall be entitled to a second or casting vote.
62 A poll demanded on the election of a Chairman of the meeting or on a question of a adjournment shall be taken forthwith. A poll demanded on any other question shall be taken either immediately or at such subsequent time (not being more than thirty days from the date of the meeting) and place as the Chairman may direct. No notice need be given of a poll not taken immediately.

Designed & produced by
Printing by Gunaratne Offset (Pvt) Ltd

www.lbfinance.com