Singer (Sri L ank a) PLC Annual Report 2019/20 Singer ... - CSE
Upload
khangminh22Category
view
0download
0
Company Journal | Annual Report 2019/2020Commercial Credit and Finance PLC


Commercial Credit and Finance PLC Annual Report 2019/2020 001
As a Company, whose purpose is to build leaders who uplift the lives of people by simple acts of love, we endeavor to maintain our determination to achieve this goal.
We train our family to cultivate a win-win attitude that inspires synergy and teamwork with love and caring instilled within a culture of continuous learning and development that enhances the essence of integrity and trust.
Driven by this strong purpose, we have managed to put a brave front irrespective of the numerous adversities faced and have continued to uplift lives of all our stakeholders.

The challenges of today cannot be resolved individually. That is why we, Commercial Credit appreciate the differences of others and work together to achieve a common purpose.
Best is AchievedTogether.

Commercial Credit and Finance PLC Annual Report 2019/2020 003
PurposeTo build leaders who uplift thelives of people by simple acts of love.
VisionTo be the most liberated Company admired for its people,partnerships and performance.
MissionTo be a dynamic finance Company which develops and nurtures leaders at every level of the organisation to serve society with passion.

004
PurposeTo build leaders who uplift thelives of people by simple acts of love.
VisionTo be the most liberated Company admired for its people,partnerships and performance.
MissionTo be a dynamic finance Company which develops and nurtures leaders at every level of the organisation to serve society with passion.
15 19Chairman’sStatement
Review of theChief Executive Officer
62 68Risk Management Corporate Governance
32 52Management Discussion
SustainabilityReport
008. Company Highlights
022. Profiles of the Board of Directors
029. Executive Management Team
Risk Management & Corporate Governance
100. Report of the Board of Directors on the Affairs of the Company
102. Report of the Board Audit Committee
103. Report of the Remuneration Committee
104. Report of the Related Party Transactions Review Committee
105. Report of the Board Intergrated Risk Management Committee
Board of Directors & Executive Management

114 118IndependentAuditors’ Report
Statement ofFinancial Position
119Statement ofProfit or Loss
120 121Statement ofComprehensive Income
Statement ofChanges in Equity
123Cash FlowStatement
106. Group Chief Executive Officer’s and Group Chief Financial Officer’s Responsibility Statement
107. Statement of Director’s Responsibilities for Financial Reporting
108. Directors Statement on Internal Control over Financial Reporting
110. Independent Assurance Report
124. Notes to the Financial Statement
226. Ten Year Summary
228. Investor Information
232. Glossary
237. Notice of Meeting
239. Form of Proxy
Financial Information

Commercial Credit and Finance PLC Annual Report 2019/2020006
Loving & CaringCommercial Credit defines love as the silent sacrifices made or the extra miles travelled to make others happy and thereby help to uplift their lives. Those who seek to love feel happy and satisfied. Love energises everyone and benefits of uncondional love and appreciation are immeasurable; sincere appreciation is one of the deepest needs of human existence, and making someone feel good, releases reservoirs of positive energy. At Commercial Credit, love plays an immeasurable role in the day-to-day life of our team members. Those who embrace love, love themselves, love others and also love life. By demonstrating a simple act of loving and caring, they would go out of their way to help out a team member or a customer. This radiates positivity and reinforces the feeling of love in the recipient who in turn would more often than not reciprocate the feeling with a caring gesture of his or her own to another. This creates a ripple effect of loving and caring and is one of the key elements of our corporate culture.
Shared Values
Integrity & TrustWe believe that trust is the key to every relationship. It determines how relationships begin and grow; and swiftly establishes positivism. Intergrity means that our lives are intergrated around principles and that our security comes from within, nor from outside. Being a person of integrity is of utmost importance to all team members at Commercial Credit. A trustworthy individual has the gift of lifting others and making them do great deeds, sometimes even impossible ones. Therefore, we place great emphasis on creating a culture of true integrity where an individual does the right thing even when no one is watching.

Commercial Credit and Finance PLC Annual Report 2019/2020 007
Synergy & TeamworkCommercial Credit believes that Synergy creates better alternatives by valuing the mental,emotional and psychological differences between people; recognising that strength lies not in similarities but in differences. A team combines individual strengths with a shared commitment to perform towards a common goal or a vision.
Think Win-WinWin-Win is one paradigm of human interaction and it arises from a character of integrity, maturity and the abundance mentality, Life is a co-opera-tive arena where human interactions are based on mutual benefits, mutual respect and supportive systems. Additionally, a culture of Think Win-Win is embodied in agreements that effectively clarify and manage expectations as well asaccomplishments. We believe the intense focus on winning at all costs do not bring greater good to the individual, the Company, the society or the country. Our focus is always on creating a win-win situation, one where all parties concerned are pleased with the outcome and where no party is left feeling short-changed. It is an attitude that has been readily embraced by our team members and one that has created countless happy customers.
Learning &DevelopmentLearning at Commercial Credit is characterised as the process of renewing and enhancing the physical, emotional, mental and spiritual dimensions of our lives, which would facilitate personal growth. Learning and development is the single most powerful investment that one can make and is a continuous process in the achievement of effective, efficient and sustainable results. By encouraging an environment which strongly believes in learning and development, Commercial Credit strives to do the best in every single activity that it engages in.

Commercial Credit and Finance PLC Annual Report 2019/2020008
2019/20Rs. ‘000
2018/19Rs. ‘000
Per centChange
Financial PerformanceGross IncomeNet Interest IncomeProfit Before TaxationProfit After TaxationFinancial PositionLeases, Hire Purchases, Loans and Advances Total AssetsTotal Deposit Base Borrowings Shareholders’ Funds Key Indicators per Ordinary ShareEarnings per Share( Rs.)Net Assets per Share ( Rs.)Year end Market Price per Share Key Performance IndicatorsReturn on Average Assets (%)Interest Cover (times) Equity / Assets (%) Gross Non Performing Accommodations (%) Net Non Performing Accommodations (%) Return on Average Shareholders’ Funds (%) Statutory RatiosCapital Funds to Deposits (%) Core Capital Ratio (%) (Minimum Required 6.5%) Total Risk Weighted Capital Ratio (%) (Minimum Required 10.5%)
19,885,682
9,372,982
1,797,487
1,663,899
61,615,324
80,360,309
47,394,522
16,011,511
13,316,658
5.23
41.43
18.30
2.24
1.20
16.57
9.85
2.72
13.15
27.80
14.14
14.95
21,883,626
10,856,187
2,841,772
2,078,679
60,854,563
80,110,747
51,908,367
12,253,007
11,986,997
6.54
37.69
27.30
3.47
1.32
14.96
6.51
-1.08
17.14
23.67
11.38
12.87
-9.1%
-13.7%
-36.7%
-20.0%
1.3%
0.2%
0.3%
30.7%
11.1%
Net Interest Income Profit After Taxation
3,000
2,500
2,000
1,500
1,000
500
0
2015/16 2016/17 2017/18 2018/19 2019/20
2,15
2
2,90
3
2,35
1
2,07
9
1,66
4
Rs. Mn
2015/16 2016/17 2017/18 2018/19 2019/20
9,66
7 11,2
37
10,8
35
10,8
56
9,37
3
Year Year
12,000
10,000
8,000
6,000
4,000
2,000
0
Rs. Mn
Company Financial Highlights
Source : Company Data Source : Company Data

Risk
Man
agem
ent &
Corp
orat
e Go
vern
ance
Sust
aina
bilit
yRe
port
Man
agem
ent D
iscus
sion
and
Anal
ysis
Boa
rd o
f Dire
ctor
s &Ex
ecut
ive M
anag
emen
tHi
ghlig
hts
Fina
ncia
lIn
form
atio
n
Commercial Credit and Finance PLC Annual Report 2019/20 009
Shareholders Funds Total Deposit Base
14,000
12,000
10,000
8,000
6,000
4,000
2,000
0
2015/16 2016/17 2017/18 2018/19 2019/20
7,78
2
10,2
48 12,2
63
11,9
87 13,3
17
Rs. Mn
Lease, Hire Purchase, Loan and Advances
2015/16 2016/17 2017/18 2018/19 2019/20
RS. Mn
49,2
97
53,7
37
54,2
24
51,9
08
47,3
95
2015/16 2016/17 2017/18 2018/19 2019/20
Rs. MnRs. Mn
58,7
64 68
,242
66,9
05
60,8
55
61,6
15
Total Assets
2015/16 2016/17 2017/18 2018/19 2019/20
70,7
08 82,8
55
83,7
92
80,1
11
80,3
60
Net Interest Margin
16.00%
14.00%
12.00%
10.00%
8.00%
6.00%
4.00%
2.00%
02015/16 2016/17 2017/18 2018/19 2019/20
Lending Composition
15.0
6%
14.6
4%
13.1
5%
13.3
7%
11.6
8%
2019
/20
2018
/19
0% 40% 60% 80% 100%20%
Secured Unsecured
Year Year
Source : Company Data
Year
Year
Source : Company Data
Source : Company Data
Year
Year
%
Source : Company Data
Source : Company Data
Source : Company Data
60,000
50,000
40,000
30,000
20,000
10,000
0
70,000
60,000
50,000
40,000
30,000
20,000
10,000
0
90,000
80,000
70,000
60,000
50,000
40,000
30,000
20,000
10,000
0
91.82%
84.70% 15.30%
8.18%

Commercial Credit and Finance PLC Annual Report 2019/2020010
Non Financial Highlights
12
34
Number of Locations:Number of ATMs:
2019/20 2018/19
2019/20 2018/19
2019/20 2018/19
2019/20 2018/19
11913
11913
481,892,077 496,702,312
Investments in IT Developments (Rs.)
Manufactured Capital
Intellectual Capital
Human Capital
Total Customers (Number)Total Employees (Number)Total Employees Training HoursInvestments in Traning (Rs.) Industrial Disputes
943,2842863
107,58339,250,167
Nill
1,499,7133227
107,769 104,452,653
Nil
Social & CSR CapitalManagement Trainees &Intern opportunities (Number)Total Taxes Paid (Rs.)
41,425,826,160
78 2,030,719,690

—kula" .ula okafk kï kE¡yenehs ukqiaifhla˜


Board of Directors &Executive Management

Your Company demonstrated noteworthy resilience in the face of adversity, continuing to consolidate its business activities, with an uncompromising commitment towards improving its systems & procedures, and theknowledge & skill development of its employees.
Chairman’s Statement

Risk
Man
agem
ent &
Corp
orat
e Go
vern
ance
Sust
aina
bilit
yRe
port
Man
agem
ent D
iscus
sion
and
Anal
ysis
Boa
rd o
f Dire
ctor
s &Ex
ecut
ive M
anag
emen
tHi
ghlig
hts
Fina
ncia
lIn
form
atio
n
Commercial Credit and Finance PLC Annual Report 2019/20 015
On behalf of the Board of Directors, I extend a warm welcome to you to the 37th Annual General Meeting of Commercial Credit and Finance PLC. It gives me great pleasure to present to you, on behalf of your Board of Directors, the Annual Report of the Company for the financial year ended 31st March 2020. It has been with the shareholders for the prescribed period of time, and I shall, with your permission, take it as read.
The Company proved more than equal to the task in a turbulent year marked more by events of disruption in numerous macroeconomic fronts which tested the resilience of the Company throughout the year. As a Company that has stood the test of time, I’m optimistic that the Company will take it in its stride demonstrating the versatility and adaptability which is inherent to us as an organization.
We ended the year on a moderately successful note although it must be added, with dampened enthusiasm and dented optimism for the year ahead. In the last quarter of the year, the effects of the Covid 19 crisis began to manifest itself in the local and global business environment, with deteriorating customer revenues creating severe liquidity and plummeting confidence levels adversely affecting the general business sentiment.
Economic performance
During the year 2019, Sri Lanka’s real economic growth was less than desired. The Easter Sunday attacks had a severe impact on the tourism sector, and their adverse spillover effects were felt across the economy, worsening the sluggish growth of the economy and further dampening business confidence.
As a result the Sri Lankan economy recorded a subdued growth of 2.3% in 2019, compared to the growth of 3.3% in 2018. All major sectors of the economy recorded positive, but modest growth rates with the service sector being the main contributor. Wholesale and retail trade mainly contributed to the growth of the services sector, while telecommunication and Information Technology programming consultancy & related activities continued to record a double digit growth. Accommodation, food and beverage services recorded a contraction during 2019 in the aftermath of the Easter Sunday attacks.
Operating environment
The Non-Bank Financial sector performance deteriorated during the year, with negative credit growth, decliningprofitability and an increase in Non-Performing Accommodation (NPA). The slowdown in the sector was driven by subdued economic conditions, prevalent political uncertainty, lack of investor confidence and security concerns created by the Easter Sunday attacks.
The industry’s asset base stood at Rs. 1,432.7 Bn at the end of 2019 expanding a marginal 0.1% during the year. Lending activity slowed down in 2019 in response to macro prudential policy measures to curtail the importation of motor vehicles, prevalent higher market interest rates on lending and sluggish economic conditions.
The gross NPA ratio increased to 10.6% at end-December 2019, from 7.7% reported at end December 2018, reflecting a deterioration in the asset quality of the sector.
Deposits dominated the funding mix, as increased assets were mainly funded through deposits, while borrowings of the sector largely declined compared to the previous year.
Business performance
Your Company demonstrated noteworthy resilience in the face of adversity, continuing to consolidate its business activities, with an uncompromising commitment towards improving its systems & procedures and the knowledge & skill development of its employees.
Holding its asset base virtually flat against last year, the Company generated a Net Interest Margin (NIM) of 11.7% against the industry NIM of 7.7% driven by its high yielding asset backed products. The Company’s Profit after Tax declined by 20% to Rs. 1.66 Bn owing to the reduction in interest income and the high impairment charge typical of today’s challenging economic conditions.

Chairman’s Statement [Cont.]
Commercial Credit and Finance PLC Annual Report 2019/2020016
Even though there was a 23.9% drop in group profitability, the group maintained a Return of Assets (ROA) of 2.4% compared to the industry ratio of 2.2%.The group’s Return on Equity (ROE)of 14.7% also compared well with the industry’s 7.5%.
Trade Finance and Investments PLC (TFI) the subsidiary of Commercial Credit was also negatively impacted by the macroeconomic adversity and reversing its trend of strong growth. TFI’s Profit after Tax declined by 42.5% to Rs. 358.42 Mn during the year. TFI’s total assets grew by 2.6% during the financial year to Rs. 10.63 Bn. This resulted in a group profit after tax of Rs. 2.0 Bn compared to Rs.2.62 Bn recorded in the previous year.
Commercial Credit and Finance PLC advanced its ranking from No.27 to No.21 among the best performing corporates in the Business Today’s Top 30 Companies, retaining its position for the third consecutive year. This reaffirms the competences of our management and the commitment and dedication of our team in driving the Company towards greater heights.
Consolidating our Strengths
The Company has consistently maintained its commitment to complying with the highest ethical and governance standards thereby ensuring the delivery of its long-term value to its various stakeholders. Consequently, several positive steps were taken at regular intervals to ensure that the Company meets and exceed such standards. Of these, a significant measure taken was the continuous improvement and revisions made to the Company’s Code of Ethics and Internal Controls.
Moreover, during the year, all Board Sub-Committees and operational Sub-Committees played an active role by conduct-ing regular meetings to discuss operational matters in detail, make assessments of changing situations and to recommend necessary actions. These constructive steps were considered vital in ensuring the effortless continuity of the business processes of the Company and its competency to face challenges while seizing new business opportunities in the market.
We, at Commercial Credit, strongly believe that a value-based culture is crucial to the continuing success of our Company, as it provides us with a solid foundation to operationalise an effective corporate governance framework. In this sense, we are constantly aiming for higher standards of credibility and public trust in our effort to increase our footprint in today’s fast-evolving financial services landscape of Sri Lanka. Employee engagement and satisfaction remained at the heart
of our activities and all our employees are inculcated with the importance of carrying out day-to-day operations in line with such Shared Values and delivering unique value propositions to our customers as Brand Ambassadors of Commercial Credit.
We, at Commercial Credit, strongly believe that a value-based culture iscrucial to the continuing success of our Company, as it provides us with a solid foundation tooperationalise an effective corporate governance framework. In this sense, we are constantly aiming for higher standards of credibility and public trust in our effort to increase our footprint in today’s fast-evolving financial services landscape of Sri Lanka.

Risk
Man
agem
ent &
Corp
orat
e Go
vern
ance
Sust
aina
bilit
yRe
port
Man
agem
ent D
iscus
sion
and
Anal
ysis
Boa
rd o
f Dire
ctor
s &Ex
ecut
ive M
anag
emen
tHi
ghlig
hts
Fina
ncia
lIn
form
atio
n
Commercial Credit and Finance PLC Annual Report 2019/20 017
Defining the future
For some organizations, near-term survival is the only agenda item. Others are peering through the fog of uncertainty, thinking about how to position themselves once the crisis has passed and things return to normal. Whilst the question of what will the new normal look like, is beyond the grasp of many, even less can predict how long the Covid 19 crisis will last, and what we will discover on the other side.
Covid-19 is not a one-off challenge. We should expect additional phases to the current epidemic and additional epidemics in the future. Research on the effectiveness of organizational responses to dynamic crises indicates that there is one variable which is most predictive of eventual success – preparation and pre-emption. Preparing for the next crisis, the next phase of the current crisis, is now likely to be much more effective than an ad hoc, reactive response when the crisis actually hits. The past five months have shown us that, if nothing else.
The COVID 19 outbreak has upended the way corporates function in an unprecedented shift away from what was before the crisis, forcing them to reimagine an entire business paradigm. The global demand chain destruction has severely impacted key export and foreign exchange earning industries, such as agriculture, garments & textile and tourism. The lockdown imposed and the continuing compliance with a raft of new Public Health regulations to curtail the spread has led to widespread impact in the domestic economy, resulting in a marked slowdown. Consequently, the GDP growth forecast for 2020 has been revised down to 1%.
In this backdrop, as a purpose driven corporate, our focus will be on reviving the livelihoods of our customers by providing them with financial assistance while adhering to the govern-ment imposed debt moratorium scheme.
Appreciation
The Board of Directors and I extend our heartfelt gratitude to our loyal customers who have demonstrated their confidence in the Company’s offerings and services for yet another year. Without their trust and loyalty, we would not have been able to scale the lofty heights that we have reached today.
I also take this opportunity to express my sincere appreciation to my colleagues on the Board for being a source of discerning guidance, inestimable support & sincere encouragement to me in a challenging year. It is this outstanding group of professionals who have tapped into their wealth of knowledge & experience and steered our path to progress. I also thank our Chief Executive Officer and Board Member Mr. Roshan Egodage for the inspiration he provides consistently and his inspiring leadership over the years which has enabled us to reach higher and in navigating the Company to where it is today.
No amount of appreciation is complete without a special word of thanks to the dynamic employees of the Company. It is their drive, hard work, determination and discipline that has enabled us to achieve so much and there is no doubt that we are well-positioned to reach greater heights together in the coming years.
I also place on record our collective thanks and appreciation to our Directors, Mr. Cecil Perera, my predecessor andMr. Susantha Pinto for their contribution to the Company over the years and who stepped down from the board this year on completion of their tenures.
I thank CBSL who provided support and guidance throughout the year and to all our stakeholders for their confidence in us and look forward to their continued support into the future.
I envision that we will make use of this moment to make Commercial Credit much stronger in the years to come.
E. D. P. SoosaipillaiChairman
22 July 2020
004

As a new decade dawns upon us with challenging business conditions underfoot, our focus remains fixated upon the purpose of the organization. We envisage that our purpose and shared values will provide us with guidance and direction to navigate through these headwinds.
Review of theChief Executive Officer

Risk
Man
agem
ent &
Corp
orat
e Go
vern
ance
Sust
aina
bilit
yRe
port
Man
agem
ent D
iscus
sion
and
Anal
ysis
Boa
rd o
f Dire
ctor
s &Ex
ecut
ive M
anag
emen
tHi
ghlig
hts
Fina
ncia
lIn
form
atio
n
Commercial Credit and Finance PLC Annual Report 2019/20 019
As the financial year 2019/20 draws to a close, it gives me immense pleasure to present the performance review of Commercial Credit and Finance PLC for the period ending 31st March 2020.
This gives me the opportunity to share some of the main highlights and key achievements of the Company during the period of review. A detailed analysis and information of all relevant areas are presented under the ManagementDiscussion & Analysis and other sections of this Annual Report.
Importance of Shared Values
As a new decade dawns upon us with challenging business conditions underfoot, our focus remains fixated upon the purpose of the organization. We envisage that our purpose and shared values will provide us with guidance and direction to navigate through these headwinds.
The long and eventful journey which lays claim to the resounding success of the Company can be primarily attributed to the passion, dedication and the drive of all members of the Commercial Credit team. Nevertheless, a key element which has attributed towards our continuous success through the years is our Shared Values and the unique principle-based culture. These trail blazing standards which are nurtured within the organization has set us apart from our competitors and ensured an ever-growing customer base. It is these Shared Values that has transformed Commercial Credit and Finance PLC into an innovative and formidable corporate entity within the Sri Lankan financial services sector. In addition to this unique culture that exists within the Company, we have also instilled a sense of self confidence in all our employees –encouraging them to serve our customers with empathy and understanding while retaining their loyalty. Thus, their goal is to enrich and uplift the lives of all our customers by supporting them to attain their dreams and aspirations.
We constantly emphasize the importance of these Shared Values and Principles to all our employees at every level through a comprehensive set of initiatives. These are a prerequisite in convincing all members of the Commercial Credit family that meaningful progression towards the Company’s purpose “to build leaders who uplift the lives of people by simple acts of love” is only possible through the promotion of our unique corporate culture within the organization.
Subsequently, we have instigated activities towards this effort; such as conducting continuous training sessions, singing of the Theme Song prior to the commencement of each working day at all locations and at corporate events of the Company, wearing Value Badges and holding events such as Value Day. This is also to inculcate a sense of camaraderie and bonhomie among our employees as they face each day with positivity and reflect this attitude in every sphere of their lives.
Additionally, the value badge earned by the employee based on their practice of Shared Values within the interior and exterior of the Company plays a pivotal role in employee’s remunerations and promotions. Therefore, employeeperformance is monitored and measured by a 360 Degree Evaluation conducted quarterly by the Company’s Enterprise Resource Planning system.
Furthermore, the Company finds inspiration through “The 7 Habits of Highly Effective People” authored by the late Dr. Stephen Covey, the Founder of the World-renowned personal development organization- Franklin Covey. Thereby, the Company has initiated effective measures incommunicating these ‘7 habits’ to the employees through comprehensive residential workshops and training programs which are conducted across the Company at all locations with the participation of a significant number of employees at each level. This has enabled our employees, who participate with unbridled enthusiasm and zeal to experience a holistic and integrated approach to achieving success in their professional and personal lives, which in turn has a positive impact on all our internal and external stakeholders as its influence is reflected in every aspect of our business operations.
Performance
The Company was faced with yet another year ofmacro-economic adversity which took a toll on the financial system domestically as well as globally. With continued volatility in the micro finance industry the Company continued to rely on high yielding asset backed products. The year ended on a sour note with the island wide lock down imposed towards the end of the financial year due to the COVID 19 pandemic.

Commercial Credit and Finance PLC Annual Report 2019/2020020
The Company’s asset base increased marginally by 0.3%, finishing the financial year at Rs.80.4Bn. This is incorrespondence to the 1.3% increase in the loan portfolio which accounted for 76.7% of the total asset base. In line with the Company’s overall strategy to promote asset backed products, the leasing & hire purchase portfolio and the gold loan portfolio grew by 18.5% & 10.2% gross of impairment allowance respectively.
The lending activities were mainly funded through the mobilization of public deposits with a composition of 74.7% against the total funding base. However the deposit base declined by 8.7% during the year owing to adversity created in the market following the cancellation of several NBFI licenses during the year. In response the Company increased its borrowing base by 37.0% which is in line with the Company’s overall funding strategy.
With major events of disruption scattered throughout the financial year, the Company’s Gross Non Performing Accommodation (NPA) worsened to 9.9% from 6.5%. The sector gross NPA also deteriorated sharply demonstrating a 290 basis point increase, finishing the year at 10.6%. The Company’s Net NPA was at 2.7% compared to -1.1% last year.
The Company NIM dropped to 11.7% from 13.4% the previous year, owing to the 8.5% reduction in the interest income. This was caused by the Company’s decisions to further downsize the non-asset backed products which yield more. The profit after tax for the year was at Rs.1.66Bn, a 20.0% decline against last year. Further to the reduction in the NIM, the cost to income ratio which increased to 55.3% from 54.3% also contributed to the contraction in profitability.
Despite operating in a challenging environment for business, Commercial Credit and Finance PLC was ranked No 21 in the Business Today Top 30 Awards for 2018/19. This is the third consecutive year the group was recognized among the elite group of corporates, speaking volumes about our service delivery and accountability.
The inclusion of sports benefits every aspect of our lives and that has been recognized by the Company, which has resulted in the constant encouragement given to the employees who
are keen to pursue their affinity towards a sport, be it an individual or team oriented. The extensive support network set in motion for our sportsmen/ sportswomen include the granting of freedom and resources to achieve their goals by participating in both local and international events. These supportive measures have paved the way for remarkable sports achieve-ments by our employees over the past years.
Review of the Chief Executive Officer [Cont.]
Despite operating in a challenging environment for business, Commercial Credit and Finance PLC was ranked No 21 in the Business Today Top 30 Awards for 2018/19. This is the third consecutive year the group was recognized among the elite group of corporates, speaking volumes about our service delivery and accountability.

Risk
Man
agem
ent &
Corp
orat
e Go
vern
ance
Sust
aina
bilit
yRe
port
Man
agem
ent D
iscus
sion
and
Anal
ysis
Boa
rd o
f Dire
ctor
s &Ex
ecut
ive M
anag
emen
tHi
ghlig
hts
Fina
ncia
lIn
form
atio
n
Commercial Credit and Finance PLC Annual Report 2019/20 021
Corporate Governance, Compliance and Risk Management
At Commercial Credit, we strongly believe that the path to excellence is embedded within the Shared Values of the Company. Therefore, we steadfastly go beyond the standard rules and regulations and predominantly invest in inculcating the concept of Shared Values in our employees. It is these Shared Values that has laid a strong foundation within the structure of the Company and is effectively intertwined with our processes, instilling passion and determination amongst all our team members in adhering to high ethical standards.
Our Risk Management Committee conducts meetings both at Board level as well as at an Operational level on a regular basis throughout the year, thereby ensuring that the Company is well informed of both internal and external factors that may impact the business operations.
Future Focus
The COVID 19 outbreak has changed the outlook of corporates globally in an unprecedented manner, forcing them to restrategise and restructure its business operation. The impact of the pandemic is felt across the key export and foreign exchange earning industries, such as export of agriculture, garments & textile and tourism. The lock down imposed to curtail the spread has led to a widespread impact in the domestic economy resulting in a marked slowdown. As a customer centric organization our recurring focus will be aimed at assessing the damage the pandemic has caused to our customer base and collectively finding avenues to overcome this predicament together. We are sincerely grateful to the Central Bank of Sri Lanka who have introduced a debt moratorium scheme for COVID 19 affected businesses and individuals and pledge to extend our fullest support.
We strongly believe that our people of Commercial Credit will realise the Company’s future potential towards progression amid the inevitable challenges that we are bound to encounter in the years to come. Therefore, we have taken necessary steps to invest in the personal and professional development of all our employees in preparation to face the perplexities of life and achieve success.
Further, the Company will continue to invest in providing an effective learning infrastructure for all our employees island-wide in obtaining further knowledge on the ‘7 habits’ teachings, Company’s Shared Values and job-related technical trainings.
Appreciation
I am honoured to acknowledge the fact that Commercial Credit has endured immense success during the past several years, becoming one of the leading companies in the Non-Bank Financial Institutions (NBFI) sector of the country. In this regard, I wish to express my heartfelt gratitude towards our valued customers and shareholders for the trust placed in us. You have given us the strength to make our goals a reality and strive towards achieving unprecedented heights.
I take this opportunity to warmly welcome our newly appointed Chairman Mr. D. Soosaipillai. His wealth of knowledge and expertise will surely provide guidance and leadership in navigating through these times. I would also extend my sincere gratitude to the outgoing Chairman, Mr. Cecil Perera for his tremendous contribution during his tenure. I’m also pleased to welcome Mrs. Tamara Paktsun who will be replacingMr. M. S. D. Pinto as an independent Non-Executive Director.
Finally and most importantly, I would like to pay tribute to the incredible team at Commercial Credit. They continuously amaze me with their exemplary work ethics, professionalism and innovation and it is understood that their determination and hard work have made Commercial Credit illuminate brightly since its inception. With such amazing individuals at the helm driving us forward, Commercial Credit will continue to attain remarkable achievements in the financial services sector of Sri Lanka, while setting the benchmark for many other entities who extend a helping hand in terms of financial support to those who wish to make their dreams a reality.
R.S. EgodageChief Executive Officer
22 July 2020

Commercial Credit and Finance PLC Annual Report 2019/2020022
Profiles of the Board of Directors
Mr. E.D.P SoosaipillaiChairman,
Independent Non-Executive Director
Mr. D. Soosaipillai is a fellow of both the Institute of Chartered Accountants of Sri Lanka and the Institute of Certified Management Accountants of Sri Lanka and is considered a pioneer in the leasing and financial services industry both in Sri Lanka and the Maldives. He has served on the boards of several leading specialized leasing companies in the capacity of Finance Director, Chief Executive Officer and Managing Director.
He was appointed a Director of Commercial Credit and Finance PLC in January 2014. He chairs the Board Audit Committee and is a member of the Board Integrated Risk Management Committee. He chaired the Board Audit Committee of Trade Finance and Investments PLC, the subsidiary of Commercial Credit and Finance PLC during the period January to October 2015.
He is an Independent Non-Executive Director on the Board of Hatton National Bank PLC and chairs the Board Integrated Risk Management Committee of the Bank and is a member of the Board Strategy & Investment Review Committee, the Board Procurement and Assets Disposal Committee, the Board HR and Remuneration Committee and the Board Recoveries Committee of the Bank. He is an Independent Non-Executive Director on the Boards of Udapussellawa Plantations PLC and Hapugastenne Plantations PLC and chairs the Board Audit Committees of both these Plantation Companies. He is also a member of the Related Party Transaction Review Committee and the Remuneration Committee of these two Plantation Companies.
Mr. Soosaipillai is a member of the Sri Lanka Institute of Directors and is an active member of the Audit Committee Forum and the INED Forum of SLID.
Mr. Soosaipillai has over 30 years of experience in Financial Services and in Risk Management and Compliance, both at the operational and strategic levels. He was engaged by the World Bank as a Short Term Consultant on a Payables Assessment assignment in the Maldives as part of a wider Public Finance Management project in 2012. Mr. Soosaipillai also served as the Managing Director of the Maldives Finance Leasing Company (Private) Limited for more than 7 years and as the Chief Executive Officer of Ceylease Financial Services Limited, a subsidiary of the Bank of Ceylon.

Commercial Credit and Finance PLC Annual Report 2019/20 023
Mr. Egodage took over the reins of Commercial Credit in October 2009 following the takeover of the Company by BG Investments (Private) Limited and joined the Board of Commercial Credit in March 2011. As Chief Executive Officer, he has been the driving force behind the Company’s stellar success, charting a visionary course of leadership and growth.
Prior to taking over the stewardship of Commercial Credit, Mr. Egodage held several senior management positions in the finance industry including the Deputy Chief Executive Director of The Finance Company PLC in 2006, while serving on the Boards of several group of companies at the same time.
Mr. Egodage has previously been General Manager – Finance, Planning and Administration at Kotagala Plantations PLC and General Manager – Projects and Planning at Agalawatte Plantations PLC. He currently serves on the boards of privately held companies registered in Sri Lanka, Philippines and Singapore. Having earned a BSc. Eng. degree from the University ofPeradeniya and initially embarking on a career in engineering, he then set his sights on a career in business management, earning an MBA from the University of Colombo.He is a fellow member of the Chartered Institute of Management Accountants, UK (FCMA), an Associate Member of the Chartered Institute of Marketing, UK (ACIM) and an Associate Member of the Institute of Certified Management Accountants, Sri Lanka (ASCMA).
Mr. R.S EgodageChief Executive Officer
Executive Director
Mihindakulasuriya Susantha Devapriya Pinto started his career as a Trainee Planter in 1996 with Balangoda Estate, Sri Lanka State Plantation Corporation and later functioned as Assistant Superintendent and Superintendent in leading plantation companies in Sri Lanka. He served at Solar Electric Light Company (USA) as the Director – Operations during which he contributed in many ways towards the improvement of operations such as financing, after sales service of Renewable Energy- Solar Photovoltaic etc, in countries such as Sri Lanka, India and Vietnam. He was the Director/Chief Executive Officer of Ceylinco Renewables (Pvt) Limited.
Dr. M.S.D.Pinto also served as the Chairman at Green Earth Group,Independent Director of Commercial Credit PLC, Group Chief Executive Officer of KDU Group a diversified group into tea production (largest black tea manufacturer in Sri Lanka), Director KDU Exports ( Pvt) Ltd, Double Tree by Hilton Weerawila and many hospitality entities. An old boy of St. Anthony's College, Kandy, he holds a PhD in Business Administration.
Dr. M.S.D. PintoIndependent Non-Executive Director
Risk
Man
agem
ent &
Corp
orat
e Go
vern
ance
Sust
aina
bilit
yRe
port
Man
agem
ent D
iscus
sion
and
Anal
ysis
Boa
rd o
f Dire
ctor
s &Ex
ecut
ive M
anag
emen
tHi
ghlig
hts
Fina
ncia
lIn
form
atio
n

Commercial Credit and Finance PLC Annual Report 2019/2020024
Profiles of the Board of Directors [Cont.]
Mr. Kenneth D Vander Weele is a co-founder and partner in Creation Invest-ments Capital Management, LLC, an impact investment fund manager and transaction advisory group. He is also the founder and managing partner of Creation Investments Sri Lanka, LLC, a Delaware Company. He joined the Board of Commercial Credit and Finance PLC in March 2014.
From 2000 until 2009, Mr Vander Weele served as the President of the Investment Services Division at Opportunity International, a major microfi-nance network, during which time he was involved in forming three microfi-nance banks in Eastern Europe (Forus Bank-Russia, Opportunity Bank-Monte-negro and Opportunity Bank-Serbia) and served as the Board chair of each bank. Between 1991 and 2000, Mr Vander Weele held various positions with the Opportunity International Network, including Global COO, Regional Vice President for Eastern Europe and Interim CEO. From 1975 to 1981, Mr Vander Weele held various positions at Grant Thornton, CPAs, in their Madison, Boston, Chicago and US National Office. From 1981 to 1991, he was the Senior Vice President, CFO and a founding shareholder of Graphisphere Corporation, a graphic arts holding Company with private equity shareholders, until it was sold to a strategic buyer. Mr Vander Weele has a PhD in international economics from Oxford University and a BBA in Accounting from the Universi-ty of Wisconsin. He is also a Certified Public Accountant (CPA, USA). He currently serves in the Boards of NOA Holdings NV - Holland, Sonata Finance Private Limited - India, Fusion Microfinance Private Limited - India, Creation Investments Social Venture Funds I, II, III and IV - USA, and Vivriti Capital-India.
Mrs. Egodage joined Commercial Credit as an Executive Director following the takeover of the management by BG Investments (Private) Limited in Decem-ber 2009. Presently, she serves as a Director of BG Investments (Private) Limited and BG Capital (Private) Limited.
Mrs. Egodage began her career as an Assistant Lecturer at the Department of Chemistry, University of Peradeniya. She served for a period of four years as a Process Chemist at Ansell Lanka. From 1996 to 2005 she held the post of Assistant Director for Quality Control and Quality Assurance at the Coconut Development Authority.
She brings the experience and dedication to her role as an Executive Director of Commercial Credit and is an integral component of the success story of the Company. She holds a BSc. (Hons) Degree in Chemistry from the University of Peradeniya and a Post Graduate Diploma in Business Administration from the Open University of Sri Lanka.
Mrs. G.R. EgodageExecutive Director
Mr. K.D Vander WeeleNon-Executive Director

Risk
Man
agem
ent &
Corp
orat
e Go
vern
ance
Sust
aina
bilit
yRe
port
Man
agem
ent D
iscus
sion
and
Anal
ysis
Boa
rd o
f Dire
ctor
s &Ex
ecut
ive M
anag
emen
tHi
ghlig
hts
Fina
ncia
lIn
form
atio
n
Commercial Credit and Finance PLC Annual Report 2019/20 025
Mr. Dufes started his career as a Tennis coach in 1985 in France, then he moved to the field of Financial Advisory in 1999. From 2000 to 2011 he served as portfolio and asset manager at French Securities Company (Dubus SA).
He worked to develop IT solutions for financial markets while he was Managing Director of Dubus Lao IT from 2011 to 2014.He served as General Manager and Chief Financial Officer in GL Lao leasing from 2014 to 2016.
He served as Deputy Managing Director and Chief Financial Officer of BG Microfinance and of GL-AMMK in Myanmar.He joined the board of Group Lease PCL in 2016 in Thailand and currently serving as Group CFO of Group Lease PCL. Mr. Dufes joined the Board of Commercial Credit and Finance PLC in May 2019.
Mr Rajiv Casie Chitty is a Fellow member of the Association of Chartered Certified Accountants (ACCA), UK and Associate Member of the Chartered Institute of Management Accountants (ACMA), UK and a Chartered Financial Analyst, USA. He obtained his Masters in Economics from the University of Colombo and won the Janashakthi Gold at the 2006 CIMA Pinnacle Awards. Mr. Casie Chitty is an Independent Non-Executive Director of ACL Cables PLC, Tangerine Beach Hotels PLC, Royal Palms Beach Hotels PLC, Ceylon Printers PLC and Office Equipment PLC. He is the former President of the ACCA Sri Lanka panel. Mr. Casie Chitty has over thirty years’ experience in the private sector of which over fifteen years has been at senior management level.
Mr. R.C ChittyChief Operating Officer
Executive Director
Mr. A. J. P. DufesNon-Executive Director

Profiles of the Board of Directors [Cont.]
Commercial Credit and Finance PLC Annual Report 2019/2020026
Mr. Lasantha Wickremasinghe, is a fellow member and a past President of the Institute of Chartered Accountants of Sri Lanka (CA Sri Lanka) and a fellow member of the Association of Accounting Technicians of Sri Lanka (AAT). He is a partner at B R DE SILVA & Company Chartered Accountants since 1997 and specialized in Audit, Assurance Services. Member of Board of Management and the Audit Committee Chairman of the Postgraduate Institute of Management, University of Sri Jayewardenepura (PIM) and Board of Management Member of the Api Wenuwen Api Fund. He serves as the Treasurer of Sri Lanka Cricket.
Mr.Boris Zschorsch is the Group Deputy CFO of Group Lease Public Company Limited,one of the leading finance companies in ASEAN providing leasing and microfinance services targeting rural and unbanked population in emerging markets. With a presence in Thailand, Cambodia, Laos, Myanmar and Indonesia, the Company is listed on the Stock Exchange of Thailand. Group Lease PCL acquired a 29.99% stake of Commercial Credit and Finance PLC through its holding subsidiary.
Mr.Zschorsch joined Group Lease PCL in 2015 as a Financial Analyst working on Due Diligence assignments as well as financial analysis on the multi-national group level. He was then promoted to Group Deputy CFO in charge of the Group Consolidation in Thailand as well as involved in the operations of the subsidiary holding Company. He took part in the rapid expansion of cross-country operations in the last few years.
Mr. Zschorsch has been working in Southeast Asia since January 2015 when he joined PricewaterhouseCoopers Singapore after having worked for the Professional Service Company in Luxembourg as an Audit Senior for more than 4years.
He is a graduate of J.W.Goethe University at in Frankfurt, Germany , where he received the title Diploma - Kaufmann as well as of University Paris Dauphine IX, France where he received a Master in Finance and Accounting.
Mr. B.B. ZschorschNon-Executive Director
Mr. Lasantha WickremasingheIndependent Non-Executive Director

Risk
Man
agem
ent &
Corp
orat
e Go
vern
ance
Sust
aina
bilit
yRe
port
Man
agem
ent D
iscus
sion
and
Anal
ysis
Boa
rd o
f Dire
ctor
s &Ex
ecut
ive M
anag
emen
tHi
ghlig
hts
Fina
ncia
lIn
form
atio
n
Commercial Credit and Finance PLC Annual Report 2019/20 027
Mr. P.T. FisherNon-Executive Direcror
Mr. Patrick T Fisher is the Founder and Managing Partner of CreationInvestments Capital Management, LLC, an Impact Investment Fund Manager and transaction advisory group. With over $700 Mn in assets undermanagement, Creation Investments focuses on private equity investments in financial services and microfinance, serving the Bottom of the Economic Pyramid (BOP). He is also the Founder and Managing Partner of Creation Investments Sri Lanka, LLC, a Delaware Company.
Mr. Fisher has led investments or provided advisory services on transactions in over 25 countries in other industry verticals, including health care, affordable housing, agriculture, clean energy and technology, as well as evaluating social ventures and impact investments in many others.
Mr. Fisher serves on the Boards of CAME Sofipo De CV–Mexico, NOA Holdings-Netherlands, Capital Float Private Limited-India, Caja Rural Los Andes-Peru, Creation Investments Social Venture Fund I - USA, Creation Investments Social Venture Fund II – USA, Creation Investments Social Venture Fund III – USA, Creation Investments Social Venture Fund IV - USA, Promus Holdings, LLC - USA, KVPF, LLC - USA, Vitruvian Corporation - USA and Creation Investments Capital Management, LLC - USA. He joined the Board of Commercial Credit and Finance PLC in March 2014. Prior to founding Creation Investments, Mr Fisher spent the majority of his career working for J.P Morgan Chase.
His relevant work experience includes years of service in international banking and global treasury and trade services, primarily covering Asia and Latin America. Mr Fisher worked for Banks in China, specifically in Hong Kong and Beijing. In addition, Mr Fisher has trading experience, working on Bank One’s Chicago trading floor, marketing interest rate, commodity and foreign exchange derivatives. He received his credit training from American National Bank in Chicago.
He has started numerous businesses and established three previous investment funds in real estate and private equity. He has served on the Boards of several domestic and international for-profit and not for-profit organizations. Mr. Fisher is a graduate of the J.L. Kellogg School ofManagement at Northwestern University, where he received a Master of Business Administration degree. He earned his Bachelor of Arts, magna cum laude, at the University of Notre Dame. He is a member of Mensa and continues his studies in Spanish, Mandarin and Koine Greek.

Profiles of the Board of Directors [Cont.]
Commercial Credit and Finance PLC Annual Report 2019/2020028
During a career spanning almost thirty eight years as an Attorney-at- Law of the Supreme Court, Mr. Perera has gained a high degree of expertise in Corporate Banking, Leasing & Finance, Capital Market & Fund Management Services, Corporate Debt Financing Services and Intellectual Property Advisory Services.
Mr. Perera joined the Board of Commercial Credit and Finance PLC in March 2011. A well-respected figure within corporate circles, Mr Perera is currently a partner of Legal Inc., Attorneys-at-Law & Notaries Public. Prior to joining Legal Inc., he served as Head of the Legal Department at Merchant Bank of Sri Lanka PLC for a period of 10 years, as well as at LB Finance PLC and The Finance Company PLC as a Legal Officer. Presently he serves as a Director of Thilanka Hotels (Private) Limited, Legal Inc. Secretarial & Management Services (Private) Limited, Legal Inc Trustee Services (Private) Limited, Thilanka Resort & Spa (Private) Limited and 99X Technology Limited.
Mr. K.J.C. Perera(Former Chairman)
(Retired w.e.f. 14 March 2020)Independent Non-Executive Director
Tamara Paktsun is a Fellow of the Institute of Chartered Accountants of Sri Lanka (FCA Sri Lanka), a Fellow of the Chartered Association of Certified Accountants (FCCA UK) and is a senior finance professional with wide experience in the private sector, both in Sri Lanka and overseas.
She was appointed to the Board of Commercial Credit and Finance PLC in February 2020 and is a member of the Board Audit Committee, she is also a member of the Board Integrated Risk Management Committee.
Ms. Paktsun was the Director Finance & Operations ofPricewaterhouseCoopers Sri Lanka and Maldives for over 13 years and previously functioned as the Chief Financial Officer of Ceylease Financial Services Limited, the leasing subsidiary of the Bank of Ceylon until 2004.
Ms.T. M. L. PaktsunIndependent Non-Executive Director

Risk
Man
agem
ent &
Corp
orat
e Go
vern
ance
Sust
aina
bilit
yRe
port
Man
agem
ent D
iscus
sion
and
Anal
ysis
Boa
rd o
f Dire
ctor
s &Ex
ecut
ive M
anag
emen
tHi
ghlig
hts
Fina
ncia
lIn
form
atio
n
Commercial Credit and Finance PLC Annual Report 2019/20 029
Executive Management Team
Roshan Egodage Geya Egodage Rajiv Casie Chitty
K.L.A. Senaviratne Janaka Deshapriya Prasanna Wickramasinghe
Lawrence Fernando Lalith Karunarathna Anuradha Ranaweera
D.G. Jayaratne Nirosh Madawala Sisira Attanayake
Ayesh Pitigala Shammi Jayathilake


Management Discussion& Analysis

Commercial Credit and Finance PLC Annual Report 2019/2020032
Management Discussion & Analysis
GLOBAL ECONOMY
The global economic growth for the year 2019 was estimated at 2.9%, which reflects a significant decline from 3.7% in 2018. This drop is a result of the trade war between China and the United States of America escalating and culminating into a global effect across the European continent and the stronger Asian economic powers inclusive of Singapore, Korea and Hong Kong.
Further, significant cuts in interest rates thrice in the four month duration ending October 2019 was made by the US Federal Reserve. This accommodative strategy has served to cushion the negative impacts of the US-China trade tensions, while the United States and a host of advanced and emerging market economies made a significant transition from the 2018 trend towards tightening to an increased monetary easing.
SRI LANKAN ECONOMY
While the economic growth in 2019 was below par, the Easter Sunday attacks further compounded the crisis. The aftermath of the tragedy significantly affected the economic landscape of the country, bringing the economic functions of the Tourism sector to an abrupt halt and adversely affecting all other business spheres.
This resulted in a subdued growth of 2.3% in 2019, in compari-son to the growth of 3.3% in 2018. Yet the ensuing months, following the attack all the major sectors recorded a positive growth with modest growth in the service sector which was seen as a major contributor with the wholesale and retail trade contributing a largely towards the growth of the aforementioned sector. A record, double-digit growth spurt was duly noted in the IT programming consultancy and related activities, while a contraction was seen in the food and beverage services and accommodation sectors.
The unemployment rate saw an increase from 4.4% in 2018 to 4.8% in 2019, reflecting subdued economic activity. The headline and core inflation moved simultaneously in a broader capacity in the desired range of 4%-6% during 2019 in spite of changes which occurred in supply side disturbances. This was predominantly due to subdued demand conditions and well anchored inflation expectations. The Central Bank of Sri Lanka addressed the persistent liquidity deficit in the domestic money market by adopting anaccommodative monetary policy stance in 2019. This was solely for the purpose of reviving the economic activity and addressing the slow progress in terms of credit extended to the private sector. Within a neutral monetary policy stance, the Central Bank reduced the Statutory Reserve Ratio (SRR) which was applicable on all rupee deposit liabilities of Licensed Commercial Banks (LCB) by a total of 250 basis points in November 2018 and March 2019 respectively.
FINANCIAL SECTOR
Resilience in the face of adversity was witnessed in the financial system as it retained its status quo without causing major macro prudential concerns, though the performance of the sector, in terms of expansion, credit quality and profitability was moderated during the year. Yet the uncertainty that prevailed and the added strains caused by subdued economic activity resulted in the slowing down of the financial sector expansion and performance during 2019 in comparison to 2018.
Real GDP Growth Rate
5.0%
4.0%
3.0%
2.0%
1.0%
0.0%2015 2016 2017 2018 2019
5.0%
4.5%
3.4%
3.3%
2.3%
Year
Source : Central Bank of Sri Lanka Annual Report
4.0%
3.0%
2.0%
1.0%
0.0%2015 2016 2017 2018 2019
3.4%
3.1%
3.7%
3.7%
2.9%
Year
World Economic Growth
Source : International Monetery Fund

The total assets of the banking sector recorded a lower growth in 2019 compared to 2018 which was in the context of subdued economic activities of the country. This was largely due to low demand for loans and advances and tightened credit screening by banks due to increasing Non-Performing Accommodation (NPA). Meanwhile, the profitability of the banking sector, as reflected by the Return on Assets (ROA) ratio and Return on Equity (ROE) ratio saw a significant decline during thestipulated time frame due to various factors such as the increase in taxes, rise in operating costs and the deterioration in assets quality.
LICENSED FINANCE COMPANIES & SPECIALISED LEASING COMPANIES (LFC and SLC) SECTOR
The LFCs and SLCs sector performance deteriorated during the year, with negative credit growth, declining profitability and increase in NPLs. The slowdown in the sector was mainly due to subdued economic activities, the political uncertainty which prevailed, lack of investor confidence and security concerns in the aftermath of the Easter Sunday attacks. The total assets of the sector stood at Rs.1,432.7 Bn by end-December 2019, representing 7.6% of Sri Lanka’s financial system. The sector as a whole remained stable, with capital maintained at healthy levels along with adequate liquidity buffers well above the regulatory minimum levels. Deposits dominated the funding mix, as increased assets were mainly funded through deposits, while borrowings of the sector largely declined compared to the previous year. The Central Bank continued to take prudential measures to maintain the stability of the sector with much consideration on reviving LFCs with supervisory concerns.
Assets
The total asset base of the sector stood at Rs.1,432.7 Bn, which expanded marginally by 0.1% (Rs.1.3 Bn) during the stipulated year, compared to 5.6% growth reported in 2018. The asset base of the sector mainly consisted of loans and advances which accounted for 77.0% of the total assets. Finance leases accounted for the major part, representing 52.9% of the gross loans and advances, followed by other secured loans, representing 37.0%.
Lending Activities of the sector showed signs of slowing down during 2019. This has been in response to macro-prudential policy measures to curtail importation of motor vehicles, higher market interest rates on lending, sluggish economic & commercial activities due to loss of business confidence which resulted from political instability in the run up to the presidential election and negative sentiments caused by the Easter Sunday attacks. Credit provided by the LFCs and SLCs sector declined by 3.0 per cent (Rs.34.3 Bn) to Rs.1,102.7 Bn, compared to the growth of 7.6 per cent in the corresponding period of 2018. Loans and advances portfolio of product categories such as finance leases (Rs.3.9 Bn), secured loans and advances (Rs.20.8 Bn) and hire purchases (Rs.4.3 Bn) contracted, while pawning advances increased by Rs.15.5 Bn and loans against deposits increased by Rs.0.6 Bn.
Composition of the Total Assets in the FinancialSystem
72%
8%
1%
19%
Specialised Financial Institutions Contractual Savings Institutions
Banking Sector Other Deposits taking Financial Institutions
0 100 200 300 400 500 600 700
2018 2019
Loans againstDeposits
Loans agains Real Estates
Others
Pawning Advances
Secured Loans& Advances
Hire Purchase
Finance Leasing
2223
33
1821
4459
463442
1915
636632
Source : Central Bank of Sri Lanka Annual Report
Rs. Mn
Source : Central Bank of Sri Lanka Annual Report
Commercial Credit and Finance PLC Annual Report 2019/20 033
Productwise Loans & Advances
Risk
Man
agem
ent &
Corp
orat
e Go
vern
ance
Sust
aina
bilit
yRe
port
Man
agem
ent D
iscus
sion
and
Anal
ysis
Boa
rd o
f Dire
ctor
s &Ex
ecut
ive M
anag
emen
tHi
ghlig
hts
Fina
ncia
lIn
form
atio
n

Commercial Credit and Finance PLC Annual Report 2019/2020034
Liabilities & Capital
Customer deposits continued to dominate the major portion of liabilities with increased assets being mainly funded through deposits, which accounted for 52.8% of the total liabilities of the sector. The deposit growth accelerated to 5.6% (Rs.39.9 Bn), while borrowings declined by 12.6% (Rs.58.2 Bn) in 2019.
Capital position improved due to the enhancement ofregulatory capital requirements. The equity capital of the sector increased by 10.6% (Rs.19.5 Bn), which stood at Rs.203.2 Bn by end 2019, mainly on account of the increase in capital due to the steps taken by LFCs to enhance the minimum core capital to meet requirement of Rs.2.0 Bn by 1 January 2020. The sector’s core capital and total Risk Weighted Capital Adequacy Ratio (RWCAR) stood at 11.1% and 12.5%, respectively, by endDecember 2019, compared to the reported levels of 9.8% and 11.1% in the corresponding period of 2018.
Credit Quality
The gross NPA ratio increased to 10.6% at end-December 2019, from 7.7% reported at the end of December 2018, reflecting deterioration in the asset quality of the sector. This is mainly due to the slowing down in economic activities due to the Easter Sunday attacks, declined lending activities of the sector and spillover effects of the Debt Relief Program. The provision coverage ratio slightly deteriorated to 56.6% by end December 2019, compared to 57.0% reported at end December 2018. With the implementation of SLFRS 9, NPA will rise further which would highlight the significant credit risk of the sector.
Profitability
Net interest income of the sector during the year was Rs.117.4 Bn, which increased by 7.9% (Rs.8.6 Bn). This was due to the combined effects of increased interest income by 7.6% (Rs.18.3 Bn) and increased interest expenses by 7.4% (Rs.9.8 Bn). Net interest margin of the sector (net interest income as apercentage of average assets) increased to 7.7% in 2019 from 7.4% in 2018, due to the combined effects of increased net interest income (7.9%) and increased (gross) averageassets (4.3%).
Non-interest income increased by 3.4% (Rs.1.3 Bn) mainly due to increase in default charges and other service charges, while non-interest expenses increased by 15.5% (Rs.12.6 Bn) affecting sector profitability in an adverse manner. Non-interest expenses increased mainly due to increased administrative expenses (Rs.4.1 Bn), loss on valuation/ disposal of repossessed items (Rs.2.7 Bn), staff costs (Rs.2.5 Bn) and other expenses (Rs.1.3 Bn). The loan loss provisions made against NPAs during the year was Rs.30.2 Bn, which increased by 16.2% (Rs.4.2 Bn), in comparison to the provision made in 2018.
The sector posted a profit after tax of Rs.14.5 Bn, a decline of 31.9% compared to the profit recorded in year 2018, mainly due to increased non-interest expenses and higher loan loss provisions. ROA also decreased by 56 basis points during the year, reporting a ratio of 2.2%, and ROE decreased by 463 basis points, reporting a ratio of 7.5% which shows signs of stress in the sector profitability.
2015 2016 2017 2018 2019
12.0%
10.0%
8.0%
6.0%
4.0%
2.0%
0.0%
Management Discussion & Analysis [Cont.]
Source : Central Bank of Sri Lanka Annual Report
5.7%
1.6%
1.2% 1.
6% 2.4% 3.
4%
5.3% 5.9%
7.7%
10.6
%
Year2015 2016 2017 2018 2019
4.5% 5.1% 4.2% 3.5% 2.2%
8.7% 7.9% 7.7% 7.4%
12.4%
23.1%
16.1%12.1%
7.7%
7.5%
25.0%
20.0%
15.0%
10.0%
5.0%
0.0%
NIM ROA ROE
Source : Central Bank of Sri Lanka Annual Report
Gross NPA and Net NPA
Gross NPA Net NPA
Key Industry Performance Indicators

Risk
Man
agem
ent &
Corp
orat
e Go
vern
ance
Sust
aina
bilit
yRe
port
Man
agem
ent D
iscus
sion
and
Anal
ysis
Boa
rd o
f Dire
ctor
s &Ex
ecut
ive M
anag
emen
tHi
ghlig
hts
Fina
ncia
lIn
form
atio
n
Commercial Credit and Finance PLC Annual Report 2019/20 035
Commercial Credit and Finance PLC was established on the 4th of October 1982 following its incorporation under the Companies Act No. 17 of 1982 as a Private Limited Liability Company in Sri Lanka’s hill capital, Kandy, as Commercial Credit (Pvt) Ltd. Subsequently, it was registered as a Public Limited Liability Company under the provisions of the above Act on the 16th of December 1989 as Commercial Credit Ltd. The Company was then re-registered under the Companies Act No. 07 of 2007 on the 8th of April 2008 and under the Finance Business Act No. 42 of 2011 on the 6th of August 2012. When the shares of the Company were listed on the Dirisavi Board of the Colombo Stock Exchange on the 1st of June 2011, the Company’s name underwent another change and became Commercial Credit PLC. In compliance with the provisions of the Finance Business Act No. 42 of 2011, the Company changed its name to Commercial Credit and Finance PLC with effect from 17th May 2012
The Company was originally established with the prime focus on agricultural lending. From its inception, the Company inculcated a strong process and system driven culture reaping numerous benefits over the years. However, the Company underwent a change in its majority shareholdings in October 2009 resulting in a new management team. This dynamic team brought with it a new philosophy; a value driven culture that drives the Company towards greater success in the longer term thereby contributing to the meaningful development of the overall society.
About the Company

Management Discussion & Analysis [Cont.]
Commercial Credit and Finance PLC Annual Report 2019/2020036
Company Financial Review
Assets
The total asset base recorded a marginal growth of 0.3% finishing the financial year at Rs.80.4Bn. This was mainly aided by the 1.3% growth in the net lending portfolio which accounted for 76.7% of the total asset base. This marginal growth is justified through the disruption in new investments during the first and fourth quarter of the financial year, caused by the Easter Sunday attacks and the lockdown imposed to curtail the spreading of the Covid 19 virus respectively. The LFC and SLC sector asset base also grew by 0.1% with a 3% drop in the lending portfolio.
Lending Portfolio
The net lending portfolio was at Rs.61.6 Bn witnessing a 1.3% growth YOY. The main contributor of growth was the leasing and hire purchase portfolio which expanded by 16.8% accounting for 70.4% of the net lending portfolio. In contrast loans and advances dropped by 23.1% owing to reduction in the micro finance and revolving business loan portfolio which dropped by 49.6% and 27.3% respectively on a gross basis. However the gold loan portfolio grew by 10.2% going by the management’s decision to promote asset backed products.
With strong growth in the leasing, hire purchase and gold loan products, the Company’s asset backed portfolio grew by 9.5% tipping the asset backed composition to 91.8% from 84.7%. On the other hand, the non-asset backed portfolio contracted by 46.0% sending the composition down to 8.2%.
Loans & Advances Leasing & Hire Purchase
24.5
34.2
30.2
38.1
30.9 33
.1 37.2
23.7
43.4
18.2
2015/16 2016/17 2017/18 2018/19 2019/20
70.7
82.9
82.0
80.1
80.4
Rs .Bn.
Total Assets
50.0
45.0
40.0
35.0
30.0
25.0
20.0
15.0
1 0.0
5.0
0.0
Source : Company Data
Rs .Bn.
Net Lending Portfolio
Secured and Unsecured Portfolio
Year
Source : Company Data
84.0
82.0
80.0
78.0
76.0
74.0
72.0
70.0
68.0
66.0
64.0
0
Year
Year
Source : Company Data
2019
/20
2018
/19
0% 40% 60% 80% 100%20%
Secured Unsecured
90.8%
84.7% 15.3%
8.2%2015/16 2016/17 2017/18 2018/19 2019/20

Risk
Man
agem
ent &
Corp
orat
e Go
vern
ance
Sust
aina
bilit
yRe
port
Man
agem
ent D
iscus
sion
and
Anal
ysis
Boa
rd o
f Dire
ctor
s &Ex
ecut
ive M
anag
emen
tHi
ghlig
hts
Fina
ncia
lIn
form
atio
n
Commercial Credit and Finance PLC Annual Report 2019/20 037
10.0%
8.0%
6.0%
4.0%
2.0%
0.0%
4.2% 4.4%
7.0% 6.5%
9.9%
Asset Quality
Asset quality deteriorated further during the year with events of disruption and periods of uncertainty curtailing the recovery efforts of the Company, resulting in a Gross Non Performing Accommodation (NPA) ratio of 9.85% compared to 6.51% last year. This deterioration is consistent with the LFC and SLC sector Gross NPA which increase by 290 basis points finishing the year at 10.6%. The Company’s net NPA stood at 2.7% compared to -1.1% last year. The NBFI sector Net NPA deteriorat-ed to 3.4% from 2.4% in the previous year.
Deposits
The Company deposit base dropped by 8.7% during the year to Rs.47.4Bn. This drop was caused by the lingering uncertainty that prevailed in the market due to the cancellation of several NBFI licenses during the year, stifling the opportunity for mobilizing public deposits. In this backdrop the Company decided to shift its funding mix towards bank borrowings. As a result bank borrowing grew by 37.0% with the overall funding composition increasing to 20% from 14.4%.
Net Interest Income
The net interest income dropped by 13.7% mainly due to the 8.5% drop in interest income. This was caused by the reduction in new investments during the year especially in high yielding products such as micro finance and revolving business loans. Interest expense dropped by 2.0% in line with the reduction in fixed deposit rates during the year.
Net Interest Margin
The Company Net Interest Margin (NIM) dropped to 11.7% from 13.4% the previous year due to the 13.7% drop in net Interest Income during the year while the average asset base remained stagnant. The NBFI sector NIM improved marginally to 7.7% from 7.4% on the back of a 7.9% growth in net interest income.
15.1%
14.6
%
13.2
%
13.4
%
11.7%
Gross NPA
Total Deposits
Net Interest Income
Net Interest Margin
Year
Source : Company Data
2015/16 2016/17 2017/18 2018/19 2019/20
11.5
11.0
10.5
10.0
9.5
9.0
8.5
8.0
0
9.7
11.2
10.8
10.9
9.4
2015/16 2016/17 2017/18 2018/19 2019/20
Rs. Bn
Year
Source : Company Data
16.0%
14.0%
12.0%
10.0%
8.0%
6.0%
4.0%
2.0%
0.0%2015/16 2016/17 2017/18 2018/19 2019/20
Year
Source : Company Data
%
56.0
54.0
52.0
50.0
48.0
46.0
44.0
42.0
0
49.3
53.7 54
.2
51.9
47.4
Rs. Bn
Year
Source : Company Data
2015/16 2016/17 2017/18 2018/19 2019/20

Commercial Credit and Finance PLC Annual Report 2019/2020038
Profitability
The Company recorded a profit after tax of Rs.1.66 Bn during the year a 20% drop compared to the previous financial year. The main cause for the drop was the 8.5% reduction in interest income and high impairment charge. The cost to income ratio was sufficiently managed despite the loss in interest income, finishing the year at 55.3% compared to the 53.9% the previous year.
The NBFI sector profitability dropped by 31.9% during the year, mainly due to high interest expense and impairment charge. The Company’s subsidiary, Trade Finance & Investment PLC recorded profit after tax of Rs. 358.4 Mn which accounted to a consolidated profit after tax of Rs. 2.0 Bn.
Following a 20% drop in profitability during the year, the Company’s ROA dropped to 2.2% from 3.5% the previous year. The NBFI sector ROA also stood at 2.2%. Similarly the Company ROE also plunged to 13.2% from 18.8% while the NBFI sector ROE stood at 7.5% compared to 12.1% the previous year.
The core capital ratio was affected by lackluster profitability, dispite increasing to 14.1% from 11.4% while the tier 02 capital ratio came up to 15.0% from 12.9%. These ratios were well above the minimum regulatory requirement of 6% and 10.5% respectively.
Management Discussion & Analysis [Cont.]
Company Profitability
ROE and ROA
2.2
2.9
2.4
2.1
1.7
2015/16 2016/17 2017/18 2018/19 2019/20
Rs. Bn
Year
Source : Company Data
3.5
3.0
2.5
2.0
1.5
1.0
05
0.0
4.5% 5.1% 4.2% 3.5% 2.2%
2015/16 2016/17 2017/18 2018/19 2019/20
31.5% 32.2%
18.8%
23.0%
13.2%
ROE ROA Source : Company Data

Risk
Man
agem
ent &
Corp
orat
e Go
vern
ance
Sust
aina
bilit
yRe
port
Man
agem
ent D
iscus
sion
and
Anal
ysis
Boa
rd o
f Dire
ctor
s &Ex
ecut
ive M
anag
emen
tHi
ghlig
hts
Fina
ncia
lIn
form
atio
n
Commercial Credit and Finance PLC Annual Report 2019/20 039
We strongly believe that, our customer is the most important stakeholder who drives the business forward. The main interface with our customer base is carried out through our product portfolio. Accordingly, the products we offer and their various features and benefits are carefully thought out to ensure that they address the unique financial needs of our customers while uplifting their lives.
Product Portfolio
RevolvingBusiness Loans
EducationalLoans
Deposits & Savings
Leasing and HirePurchase Products
Microfinance &Abhiwurdhi SME Loans
Gold Loans
Term Loans

Commercial Credit and Finance PLC Annual Report 2019/2020040
Leasing & Hire Purchase ProductsOverview
Commercial Credit offers a wide array of Leasing and Hire Purchase products that are tailored to meet the diverse needs of our multi-faceted customers seeking to acquire their dream vehicle. The Company has always endeavoured to introduce pioneering Auto products that have been well-received by our customer base, resulting in continued success for the organisation. These innovative products help uplift the lives of every market segment of the country by enabling customers from all across the island to acquire registered and unregistered vehicles through the Company’s network.
The key features of the Leasing and Hire Purchase products are that they demonstrate the customer-oriented approach of the Company. Prospective customers are always provided an efficient service through a friendly, professional agent who will visit the customer, communicate clearly and transparently, understand his or her needs and provide a flexible leasing or hire purchase solution that meets the customer’s requirements.
Highlights of the year
The leasing & hire purchase portfolio grew by 18.5% gross of impairment on the back of strong investments made in three wheeler and motor bike segments. Investing in these high yielding asset backed products contributed to the retention of the NIM which dropped marginally during the year. The Company utilized the micro finance work force and its network to good effect during the year, penetrating into the rural areas of the island through the Company’s registered motor bike and three wheeler products. Relationship with the motor bike and three wheeler dealer network also strengthened during the year, resulting in an increase in motor bikes and three wheeler investments . Further the rural and suburban parts of the island were exploited with mini truck products.
Gold LoansOverview
In line with the Company’s Purpose, Commercial Credit pays a significant role in the lives of many customers who are in urgent need of cash. This is made possible by the various products made available under the Company’s Gold Loan business. The Gold Loan business provides customers with a variety of products including Pawn Broking, Gold Loans, Gold Investments, and Ran Sahana Loans to meet the varied needs of the customer.
Highlights of the year
The gold loan portfolio expanded by 10.2% during the year ending at Rs.6.12 Bn. Fueled by multiple events causing disruption to economic activities and strong gold prices the demand for gold loans remained strong during the year. The gold loan network expanded within the existing branch network of the Company from 105 locations to 110 locations during the year. While demand for shorter cycles remained strong throughout the year, the management introduced a new six month product to maintain a balance.
Microfinance & Abhiwurdhi SME LoansOverview
Microfinance is a financial assistance concept where small loans are given to individuals or communities who have no access to banking facilities, for the purpose of establishing or developing an enterprise of their own. For several years, by leveraging the efficient client servicing process of the Company, Commercial Credit has successfully provided Microfinance services to customers, thereby paving the way for them to uplift their lives. The products are offered through an efficient service, minimum documentation and convenient repayment methods and is backed by effective use of technology.
We strongly believe that, our customer is the most important stakeholder who drives the business forward. The main interface with our customer base is carried out through our product portfolio. Accordingly, the products we offer and their various features and benefits are carefully thought out to ensure that they address the unique financial needs of our customers while uplifting their lives.
Product Portfolio [Cont.]

Risk
Man
agem
ent &
Corp
orat
e Go
vern
ance
Sust
aina
bilit
yRe
port
Man
agem
ent D
iscus
sion
and
Anal
ysis
Boa
rd o
f Dire
ctor
s &Ex
ecut
ive M
anag
emen
tHi
ghlig
hts
Fina
ncia
lIn
form
atio
n
Commercial Credit and Finance PLC Annual Report 2019/20 041
Highlights of the year
On the back of the rate cap imposed on the micro enterprises and SMEs during the previous financial year and inconsistent policy stances, opportunity for sustainable growth in the segment remained skeptical during the year. This resulted in curtailing new investments with strong dependence on existing customers with a proven track record with the Company. As a result the micro finance and Abhiwurdhi SME loan portfolio shrunk by 49.6% during the year. Alternatively theMicrofinance staff members were provided with training to promote leasing and hire purchase products. Their contribution was strongly felt during the year as they promoted motor bike and three-wheeler products through their already established Customer Service Units (CSU) network.
Term LoansOverview
The Term Loan product is a type of Cash Loan specifically designed to provide financial assistance to customers who can demonstrate a repayment capacity via their existing earnings. Granted for a maximum period of 60 months, Term Loans have been a popular product amongst business people and a wide range of fixed income earners such as Professionals and Executives.
The Term Loans Division works towards understanding the customer’s loan requests and provide them the best available service to fulfil their financial needs on time. This process is in line with the Company’s Purpose of uplifting the lives of the customer by identifying the requirements accurately, providing sound, unbiased advice and a timely service. The Division has the ability to provide a quick evaluation of a loan request, helping the customer get access to the loan and providing them peace of mind. With multiple security features and a hassle-free documentation process, customers are provided a comprehensive solution for their loan requirements.
Highlights of the year
With unfavorable economic conditions underfoot the term loan department curtailed its investment during the year, focusing solely on mortgage loans which is in line with the Company’s drive to grow the asset backed portfolio. This resulted in a 31.4% drop in the term loan portfolio during the year.
Revolving Busines Loans (RBL)Overview
Commercial Credit’s Revolving Business Loan (RBL) is a product that has been introduced to provide a boost to the Small and Medium-scale Enterprise (SME) sector of Sri Lanka by providing much-needed funds without any collateral.
During the past several years, there has been a significant growth in the SME sector of the country with key economic indicators portraying an upward trend. This has resulted in a positive outlook for the Company as businesses have turned to innovative products such as RBL to find the necessary funding.The RBL customer base includes a wide array of small and medium-sized businesses such as retail shops, small-scale supermarkets, hardware shops, pharmacies, retail garments stores and motor spare parts shops, among many others. Collections are done on a daily basis by a large team of agents who visit each and every customer and use their Point of Sale (POS) machines for collection.
Highlights of the year
The Company continued to cater to its customer base which is above the “micro business” threshold of annual revenue being greater than Rs.15 Mn. or employing more than 10 employees. This threshold limited the market size significantly while economic conditions curtailed opportunities for growth. As a result the RBL portfolio declined by 27.3% during the year.

Product Portfolio [Cont.]
Commercial Credit and Finance PLC Annual Report 2019/2020042
Educational LoansOverview
The Educational Loan product is aimed at providing financial support for students who intend to pursue higher education in Sri Lanka and abroad. The loan scheme is built upon the concept that a student, irrespective of financial standing, must be provided with an opportunity to pursue higher studies through a sound financial support package that consists of reasonable, affordable terms and conditions.
Over time, it has come to light that Educational Loans are one of the most important products offered by the Company as they provide the students with a vital resource in their journey to achieve knowledge and skill. This, in turn, will hold them in good stead as they prepare to face the challenges of the future. This particular loan product allows the employees of the Company to engage with young customers and their guardians and show them the loving and caring nature of the Company. As a result, the Company views these loans as the initial and most vital process in building a long-term relationship with the customer. All loans are provided in a speedy and flexible manner with minimum documentation and hassle.
Highlights of the year
The education loan portfolio dropped by 23.4% owing to the drop in student numbers from key markets such as Australia and New Zealand. This is due to the new immigration restric-tions being imposed, limiting opportunities to study in Australia and New Zealand. The management also took a conservative stance on new investments due to the economic and political uncertainty which clouded the year and the emergence of the Covid 19 pandemic which restricted academic activities during the final quarter of the year.
Deposits & SavingsOverview
Public Deposits was the main source of funding to carry out business operations at Commercial Credit with the Company’s wide range of deposit products helping it to expand the customer base across the island. The product range includes Fixed Deposits, General Savings and Minor Savings - all of which provide numerous benefits to the customer. Fixed deposits are accepted for periods ranging from one (01) month to five (05) years with interest being paid either monthly or at maturity.
In keeping with the culture of the Company, customers’ deposits are handled with utmost care and managed by means of a framework of ethical fund management. All funds received are re-invested into the various lending products offered by the Company, thereby adding value to all stakeholders.
Highlights of the year
Marginal credit growth and Company’s increased focus on bank borrowing in a low interest rate environment saw the deposits & savings base drop by 8.7% during the year. Cancellation of a few NBFI licenses during the year created doubts in the minds of depositors making the task of mobilizing public funds arduous.

NorthernProvince
North CentralProvince
EasternProvince
CentralProvince
UvaProvince
SabaragamuwaProvince
SouthernProvince
WesternProvince
North WesternProvince
Branch Network
12
09
08
09
12
14
14
27
14
Commercial Credit and Finance PLC Annual Report 2019/20 043

Commercial Credit and Finance PLC Annual Report 2019/2020044
Central ProvinceProvince Count: 12
: Gampola: Kandy City Centre: kandy: Nawalapitiya: Pilimathalawa: Pussellawa: Rikillagaskada: Theldeniya
12KANDY - 8
: Hatton: Nuwara Eliya
NUWARA ELIYA - 2: Dambulla: Matale
MATALE - 2
Southern ProvinceProvince Count: 12
: Ambalangoda: Galle: Baddegama: Elpitiya: Neluwa: Udugama
14GALLE - 6
: Tissamaharama: Angunakolapelessa: Tangalle: Ambalantota
HAMBANTOTA - 4: Akuressa: Matara: Deniyaya: Waligama
MATARA - 4
Western ProvinceProvince Count: 12
: Avissawella: Battaramulla: City Office: Homagama: Kotahena: Kaduwela: Maharagama: Mount Lavinia: Moratuwa: Nugegoda: Piliyandala: Wellawatte: Borella
27
COLOMBO - 13: Gampaha: Ja-Ela: Negambo: Wattala: Divulapitiya: Kiribathgoda: Kirindiwela: Nittambuwa
GAMPAHA - 8: Horana: Kalutara: Panadura: Aluthgama: Beruwala: Matugama
KALUTARA - 6
North Western ProvinceProvince Count: 14
: Kuliyapitiya: Kurunegala: Nikaweratiya: Kurunegala: Giriulla: Melsiripura: Polpithigama: Wariyapola
14KURUNEGALA - 8
: Chilaw: Puttalam: Wennappuwa : Anamaduwa: Kalpitiya: Nattandiya
PUTTALAM - 6
Branch Network [Cont.]

Risk
Man
agem
ent &
Corp
orat
e Go
vern
ance
Sust
aina
bilit
yRe
port
Man
agem
ent D
iscus
sion
and
Anal
ysis
Boa
rd o
f Dire
ctor
s &Ex
ecut
ive M
anag
emen
tHi
ghlig
hts
Fina
ncia
lIn
form
atio
n
Commercial Credit and Finance PLC Annual Report 2019/20 045
Eastern ProvinceProvince Count: 12
: Ampara: Dehiattakandiya: Akkaraipattu: Kalmunai: Mahaoya: Pottuvil
12AMPARA - 6
: Batticaloa: Kalavanchikudy: Valaichenai
BATTICALOA - 3: Kanthale: Trincomalee: Muthur
TRINCOMALEE - 2
North Central ProvinceProvince Count: 12
: Anuradhapura: Galnewa: Galenbindunuwewa: Thambutthegama: Horowpathana: Kekirawa: Medawachchiya: Nochchiyagama: Padaviya
14ANURADHAPURA - 9
: Hingurakgoda: Polonnaruwa: Aralaganwila : Bakamuna: Welikanda
POLONNARUWA - 5
Sabaragamuwa ProvinceProvince Count: 12
: Kegalle: Warakapola: Deraniyagala
8KEGALLE - 3
: Balangoda: Embilipitiya: Ratnapura : Godakawela: Kalawana
RATNAPURA - 5
Uva ProvinceProvince Count: 12
: Badulla: Bandarawela: Mahiyanganaya: Welimada
9BADULLA - 4
: Monaragala: Bibile: Siyambalanduwa: Thanamalwila: Wellawaya
MONARAGALA - 5

Branch Network [Cont.]
Commercial Credit and Finance PLC Annual Report 2019/2020046
Nothern ProvinceProvince Count: 12
: Jaffna: Nelliady: Chunnakam: Chavakchcheri: Velanai
9JAFFNA - 5
: MannarMANNAR - 1
: VavuniyaVAVUNIYA - 1
: MullaitivuMULLAITIVU - 1
: KilinochchiKILINOCHCHI - 1
CENTRAL 12Kandy 8Matale 2Nuwara Eliya 2
EASTERN 12Ampara 6Batticaloa 3Trincomalee 3
NORTHERN 9Jaffna 5Kilinochchi 1Mannar 1Mullaitiva 1Vavuniya 1
NORTH WESTERN 14Kurunegala 8Puttalam 6
NORTH CENTRAL 14Anuradhapura 9Polonnaruwa 5
SABARAGAMUWA 8Kegalle 3Ratnapura 5
UVA 9Badulla 4Monaragala 5
GRAND TOTAL 119
SOUTHERN 14Galle 6Hambantota 4Matara 4
WESTERN 27Colombo 13Gampaha 8Kalutara 6
Summary

Never forget that your greatest dutyIs to your loved ones

Commercial Credit and Finance PLC Annual Report 2019/2020048
Sports Achievements
Athletic
Commercial Credit athletes had an outstanding year demonstrating their prowess in the event they took part. In Masters Athletics Open Championships held in Colombo and Gampaha, Commercial Credit athlete bagged a total tally of three Gold Medals, four Silver Medals and two Bronze Medals. The 36th Annual Mercantile Athletic Meet also saw Commercial Credit athlete bagging two Silver Medals and one Bronze Medal.
One male and three female basketball players of Commercial Credit were part of the Sri Lankan National Basketball team which took part in the 2019 South Asian Games held in Kathmandu, Nepal.
Football
Commercial Credit Football team became champions in theMercantile Football League Tournament (B Division).
Basketball
The Commercial Credit weightlifter continued to achieve impressive heights during the year with several international victories during the year. He won eight Gold medals at the Asian Pacific Championship held in Australia. He was also placed 8th in the World Championship held in Sweden. The outstanding weightlifter won seven Gold medals and one silver medal at the Commonwealth Championships held in Canada.
Weightlifting

Business Today Top 30 Award is a well recognised standard in the business fraternity of Sri Lanka since 1997. It’s recognition of Corporate Excellence and contribution of the Private Sector to the
Nation’s Economy is a much valued and sought after standard of value by all business entities. It is with great pleasure that Commercial Credit and Finance PLC is able to report its ranking at number
21 for year 2018/19.
2124 272018/20192017/2018 2016/2017
Business Today Top 30


Sustainability Report

Commercial Credit and Finance PLC Annual Report 2019/2020052
Sustainability Report
Commercial Credit and Finance PLC believes that genuine sustainability requires engaging closely with stakeholders in mutually beneficial relationships. As a Value-driven organisation, the Company has formed valuable relationships with its stakeholders and maintains a routine of checks and balances to ensure these relationships are sustained.
Much of our interactions take place in conducting our daily operations, while structured activities are also conducted to bring stakeholders closer. This association helps us gain vital feedback on our products and services in a bid to exceed the expectations of our stakeholders.
Stakeholder Engagement
StakeholderEngagement
Customers
Employees
Government Institutions & Regulators
Society & Environment
Business Partners
Investors

Commercial Credit and Finance PLC Annual Report 2019/20 053
Stakeholder aspirations� Financial performance� Governance� Transparency and disclosure� Business expansion plans� Risk management� Sustainable growth
Mode and frequencyEngagement mechanism FrequencyAnnual Reports and AGMs AnnuallyExtraordinary General Meetings As requiredInterim financial statements QuarterlyPress conferences and releases As requiredAnnouncements to CSE As requiredCorporate website ContinuousInvestor feedback forms Annually
Investors
Stakeholder aspirations� Customer security and privacy� Service quality� Financial inclusion� Affordability of services and convenience� Grievance handling mechanism� Financial education and literacy� Financial support for revival of business
Mode and frequencyEngagement mechanism FrequencyCustomer visits and meetings As requiredBranch network and call centre ContinuousMedia advertisements As requiredCorporate website ContinuousCustomer workshops As required
Stakeholder aspirations� Performance and reward management� Training and development� Career advancement opportunities� Work-life balance� Retirement benefit plans� Value driven corporate culture� Diversity and inclusion� Perception of a prosperous future for the Company
Mode and frequencyEngagement mechanism FrequencySocial events: value day, family day etc Continuous360 degree staff appraisal QuarterlyTraining programmes As requiredOpen door policy ContinuousIntranet ContinuousSpecial staff events AnnuallyEmployee satisfaction survey Bi-annuallyCode of conduct and whistle blower policy Continuous
Customers
EmployeesRi
sk M
anag
emen
t &Co
rpor
ate
Gove
rnan
ce
Sust
aina
bilit
yRe
port
Man
agem
ent D
iscus
sion
and
Anal
ysis
Boa
rd o
f Dire
ctor
s &Ex
ecut
ive M
anag
emen
tHi
ghlig
hts
Fina
ncia
lIn
form
atio
n

Commercial Credit and Finance PLC Annual Report 2019/2020054
Stakeholder aspirations� Compliance with directives and codes� Microfinance and SME development� Supporting economic growth
� Responsible financing� Commitment to community� Financial inclusion, recruitment� Microfinance and SME� Ethics and business conduct� Environmental performance� Employment opportunities
Mode and frequencyEngagement mechanism FrequencyOn-site surveillance AnnuallyDirectives and circulars As requiredMeetings and consultations As requiredPress releases As requiredPeriodic returns As specifiedSubmissions to policymakers As required
Government Institutions & Regulators
Mode and frequencyEngagement mechanism FrequencyMedia advertising campaigns As required Press releases, conferences andmedia briefings As requiredInformal briefings andcommunications As requiredPublic events and Gatherings As requiredCorporate website ContinuousSponsorships for social events As required
Stakeholder aspirations
Stakeholder aspirations� Contractual performance� Future business opportunities� Maintaining healthy relationships� Timely settlement of dues� Ease of working� Growth potential� Collaboration for new technological� advances in the financial sector
Mode and frequencyEngagement mechanism FrequencySupplier relationship management As requiredOn-site visits and meetings As required
Society & Environment
Business Partners

Risk
Man
agem
ent &
Corp
orat
e Go
vern
ance
Sust
aina
bilit
yRe
port
Man
agem
ent D
iscus
sion
and
Anal
ysis
Boa
rd o
f Dire
ctor
s &Ex
ecut
ive M
anag
emen
tHi
ghlig
hts
Fina
ncia
lIn
form
atio
n
Marketing & BrandingOverview
The Marketing division primarily focusses on carrying out strategies to build the corporate image and create brand awareness while promoting the value-driven culture of the Company and assisting those associated with the Company to uplift their lives.
The main focus of the Marketing & Branding campaigns of the Company is to showcase the inherently good-natured qualities in all human beings by reflecting their compassionate and magnanimous traits. This invariably has an impact in the viewer as it shows how qualities such as kindness and compassion can be a prerequisite to uplifting the life of a fellow human being. The division is aware that any message that is disseminated through the multiple media platforms will be scrutinized. Therefore every process is meticulously planned prior to communicating it to the general public who are viewed and valued as our own customers or potential clients, who we are eager to serve.
Highlights of the year
The marketing team launched a new advertising campaign during the year, emphasising on the Company’s purpose driven theme. This advertisement titled “Namak Gamak Nam Danne Ne Habai Manussayek” was nominated at the SLIM Nielsen Awards 2020 for Peoples Advertisement of the Year. The advertisement was also awarded for Direction and Cinematography at the EPICA Silver awards for its depiction of humanity. The “loved ones” advertisement was awarded the People’s Advertisement of the year for the fifth year at the SLIM Nielsen Awards 2020. ‘Below the line’ marketing activates leveraged key products such as leasing, hire purchase and pawning connecting the customer base with the Company’s product offerings at a grass root level.
Delivering Technology-backed Products And Services
Overview
The Information & Communication Technology (ICT)Department of Commercial Credit has been formed to provide state-of-the-art, innovative IT solutions for the variousdepartments within the Company. The main objective of the ICT Department is providing its large internal customer based modern ICT solutions together with a professional service so that they can carry out their day-to-day tasks and responsibili-ties efficiently and effectively at all times.
Highlights of the year
During the year the finance module of the Enterprise Resource Planning (ERP) system was introduced to the users marking the completion of the core modules of the ERP. A mobile based recovery app was introduced to the recovery officers which enabled the Company to streamline the recovery process. Further the Human Resource Information System (HRIS) was completed during the year, automating the HR functions of the Company. Progress was made in the information security front which included creating awareness through staff training.
EmployeesThe human capital of Commercial Credit is its most prized asset. It is clear that the exceptional levels of talent, discipline, and passion of these individuals of the Company have taken it to new heights during the past several years. The Human Resources Department (HRD) is responsible for nurturing and developing the key attribute of the Company – its unique culture. The Company strongly believes that this culture plays a pivotal role in creating and grooming effective, fair-minded leaders who significantly contribute towards the progress of the Company and actively contribute to the betterment of society. Therefore, the Company is intentional about making every possible attempt to continuously enhance the capabilities of the HR Department and fine-tune the HR practices in order to create a positive environment for all concerned.
Commercial Credit and Finance PLC Annual Report 2019/20 055
SLIM Nielson People’s Awards - 2020People’s Advertisement of the year

Maintaining Compliance
The Company has put in place a range of policies and proce-dures related to employees, their rights and privileges as well as their duties and responsibilities. They are useful in making employees aware about conducting themselves in day-to-day situations and during unexpected occurrences. The Company adheres to the Shop and Office Employees Act No. 15 of 1954 in practicing its HR activities. Additionally, the Company has also introduced its own operating procedure manuals covering a wide array of key HR-related topics including handling of grievances, attendance and leave, disciplinary action, perfor-mance evaluation, recruitment, resignation, termination and retirement, staff facilities, staff planning, training & competen-cies, transfers and promotion and user registration. As a progressive organisation, the Company has also introduced its Anti-Sexual Harassment Policy and Ethical Working Framework in order to establish a conducive working environment through developing self-disciplined individuals.
Maintaining effective infrastructure for people
The health and well-being of the Company’s employees are of utmost importance and numerous facilities and enhancements have been incorporated to maximize its effects within the framework of the Company. Fitness Centre (Gymnasium) memberships have been offered to employees atconcessionary rates and they are encouraged to make use of these facilities regularly to improve their physical fitness. The Company also offers medical insurance schemes to all employees and their dependents.
The Company practices an “open door policy” across all levels of the organization, paving the way for any employee irrespective of their designation, to converse directly and allay their concerns with the Chief Executive Officer and Executive Directors at any given time. This approach has beenwellreceived by the employees and resulted in a consistently high level of employee satisfaction as shown in the bi-annual employee satisfaction surveys carried out by the Company. Such levels of employee satisfaction have translated into a high degree of commitment and motivation, which in turn has led to extraordinary results for the Company. Further, the removal of traditional hierarchical designations has had a positive impact on the development of the unique culture based on Shared Values.
Managing and Assessing Employee Satisfaction
The Company has a clear understanding of the many advantages of having a satisfied workforce. A satisfiedemployee often equates to a happy and productive employee which in turn means that the greater output and improved results generated by him or her will reflect in a better end result for the Company. Keeping this in mind, the Company’s Human Resource Department proactively works towards creating the best possible workplace environment for all employees. Employee satisfactory surveys are carried out periodically to extract views from the employees about their job satisfaction levels. This keeps the Company on the right track toappropriately respond to workplace concerns in a timely manner. This also helps the Company to get a betterunderstanding of the varying motivations of the employees and enables it to identify future growth opportunities and plan accordingly.
Two satisfactory surveys, the On-Board Satisfactory Survey and the Employee Satisfactory Survey, are utilized toeffectively measure employee satisfaction based on the relevant employee category. The On-Board Satisfaction Survey has been primarily created to obtain feedback from employees who are new to the Company and are yet to complete their probationary period. It is carried out at the end of the third month from the date of joining and consists of 20 questions covering employee working conditions, peer and supervisor conditions, Company culture and learning environment.
The General Employee Satisfaction Survey is conducted twice a year in the months of June and December and focuses on obtaining feedback from confirmed employees to get an understanding of their perception on employee conditions at the workplace. It consists of 15 key questions to employees in the form of a questionnaire. The duly-filled questionnaires are used as a source of a primary survey data. The Company uses a 360 Degree Appraisal system as its performance appraisal system which further enhances employee satisfaction since the employee gets the opportunity to rate his/her superior, peer and subordinate.
Commercial Credit and Finance PLC Annual Report 2019/2020056
Sustainability Report [Cont.]

Risk
Man
agem
ent &
Corp
orat
e Go
vern
ance
Sust
aina
bilit
yRe
port
Man
agem
ent D
iscus
sion
and
Anal
ysis
Boa
rd o
f Dire
ctor
s &Ex
ecut
ive M
anag
emen
tHi
ghlig
hts
Fina
ncia
lIn
form
atio
n
Commercial Credit and Finance PLC Annual Report 2019/20 057
Shared ValuesThe Launch of Our Shared Values
The Shared Values of Commercial Credit were launched during the Value Day held on 4th March 2012 at the BMICH with the participation of the entire staff. The highlight of the Value Day included the introduction of a Value Policy together with the unveiling of the Company’s Theme Song, Value Oath and the Value Badge. These initiatives were established to promote a Value-driven culture within the Company with continuous efforts being made through the years to ensure that the Company’s unique culture is steeped in the Shared Values that we advocate.
Instilling Our Shared Values
With the intention of instilling our Shared Values among the Commercial Credit team, including the significant number of newcomers, various programmes were conducted during the year. While some of these programmes were continuations of previous ones –several new initiatives were additionally introduced which broadened the scope of our training.The 360 Degree Value Appraisal System is such an initiative that has been in existence since the year 2015. As this system has been based on the Company’s Shared Values, it is more compatible with the Company’s Purpose “To build leaders who uplift the life of people by simple acts of love”. Moreover, this system also plays a key role in nurturing the desired Value-based culture and to identify the various Value Champi-ons of the Company who are instrumental in driving the desired culture.
The Commercial Credit ERP system is utilised to evaluate every member of the Company practicing the 360 Degree Value Appraisal on a quarterly basis. As a Value-driven Company, Commercial Credit has given a higher weightage for this appraisal in determining a particular individual’s performance. The subjective appraisal evaluates the extent to which an individual possesses the key talents required by him or her in engaging with daily work processes.
Theme Song and Value Badges
The tri-lingual Theme Song is aired at all Company offices at 8.30 a.m. before the commencement of each working day and at all Commercial Credit events. Each employee wears a Bronze Value Badge being the entry level badge. Over time, the bronze Value Badge would be upgraded to silver, gold andsubsequently platinum in recognition of the degree ofcommitment the employee demonstrates towards practicing Shared Values.
Value Day
It is the Company’s practice to hold a Value Day once in every two (02) years to recognize and reward the employees who have sincerely and effectively practiced the Company’s Shared Values. This presents another opportunity for the organisation to highlight and appreciate the staff members who have reflected the Company’s Shared Values. It portrays them as role models and encourages others to follow suit. The mechanism for recognising such employees involves a detailed process where each staff member is given an opportunity to nominate colleagues to be considered for upgrading of Value Badges. Subsequently, based on the 360 Degree Value Appraisal results and number of votes received, selected staff members are recognized for excellence by upgrading their Value Badges from bronze to silver, gold and platinum respectively.
Value Policy
The commitment of Commercial Credit towards its Shared Values is captured in the Value Policy which provides guidelines and procedures on the development and implementation of a Value-based culture. The policy, which applies to all employees and all activities, contains a detailed framework and course of action to ensure the adherence of employees, by embedding the Values into the performance evaluation process.
Value Register
The Value Register is a record of good conduct and excellence in reflecting the Shared Values by employees, be it work related or otherwise. When a noteworthy action of an individual is observed by a team member, the Value Register will be used as the platform to communicate and highlight this actionthroughout the Company. Employees post their comments of appreciation about their colleagues anonymously in the Value Register, which is considered the most effective internal social networking system of the Company. A Value profile is created for each employee which is based upon the wordedappreciation received by their colleagues.

Commercial Credit and Finance PLC Annual Report 2019/2020058
Learning and DevelopmentA large number of training programmes were held on culture development as well as on technical aspects throughout the year in order to build character and competencies of all the employees of the Company. The “7 Habits of Highly Effective People” authored by the late Dr. Stephen Covey, the sole inspiration behind the world-renowned personal development organisation Franklin Covey, continues to be a major source of inspiration at the Company. The Company believes that the blend of fundamental principles and practical experience, and the wisdom and compassion contained in the 7 Habits teachings, are a powerful force enabling personal change. The employees were encouraged to practice the 7 Habits as this would enable them to have a holistic and integrated approach to achieve effectiveness in each role they play in both their professional and personal lives.
The Company believes that the practice of the 7 Habits by employees will allow the internalization of the Shared Values. Value Mentors, working together with the location heads, are expected to conduct Value Hours in each location on a monthly basis. This will provide staff members to have regular opportu-nities to clarify matters regarding the issues they encounter in living the Shared Values on a day-to-day basis.
Sustainability Report [Cont.]

Let’s take the time toAppreciate one another


Risk Management &Corporate Governance

Commercial Credit and Finance PLC Annual Report 2019/2020062
Risk Management
Risk Management involves identifying, assessing, avoiding or reducing the negative impacts arising from current or future hazards. The ability to manage multiple risk factors arising across multiple locations, product categories, asset classes, customer segments and functional departments is one of the key factors that determines the degree of success and sustainability of a financial institution. Commercial Credit has enhanced its risk management capabilities and insights to facilitate more robust and better risk based decision making processes to ensure that the Company continues to create value to its stakeholders.
The Board of Directors are responsible to ensure that the risks are appropriately managed within the Company and the Corporate Management take proactive measures to instill the principles of responsible risk management among employees at all levels. The Company has invested in establishing strong risk management architecture, which includes an independent Risk Management Department, Board-approved risk appetite and risk tolerance levels along with well-defined procedures to support the effective management of risk.
Business decisions are made in a manner that the safeguarding of stakeholders’ interest of the Company and profitability arising from various sources of risk contribute towards our strategic objectives. Underlying systems and processes permit the creation of risk awareness across the entire Company and identify, measure, analyze and evaluate risks. Processes are also in place to develop and implement appropriate response
strategies according to the set risk appetite in order to manage such identified risks. As in the case of all activities of the Company, it could be said that the efforts made to develop a culture based on the Shared Values of the Company form a very fundamental aspect of Risk Management at Commercial Credit.
2019/2020- Key Achievements
• Strengthening of risk and compliance activities
• Increase in secured portfolio
• Revision of procedure manuals
• Revision of risk subcommittee policies
• Monitor risk parameters according to Board approved risk appetite limits

Risk
Man
agem
ent &
Corp
orat
e Go
vern
ance
Sust
aina
bilit
yRe
port
Man
agem
ent D
iscus
sion
and
Anal
ysis
Boa
rd o
f Dire
ctor
s &Ex
ecut
ive M
anag
emen
tHi
ghlig
hts
Fina
ncia
lIn
form
atio
n
Board of Directors
Integrated RiskManagement Committee
OperationalStaff
Strategic level Management Level Operational Level
MiddleManagers
Risk ManagementSub-Committee
FunctionalHeads
The activities of Commercial Credit’s Risk Management system takes place at three broad levels as follows:
Operational level personnel give valuable inputs to continuously improve risk related activities undertaken in day-to-day operationsaccording to the approved policies, procedures and controls.
Commercial Credit and Finance PLC Annual Report 2019/20 063
Strategic Level
At the strategic level, Risk Management functions are performed by the Board of Directors and the Integrated Risk Management Committee (IRMC). Tasks include defining risks, ascertaining risk appetite, formulating strategies and policies for managing risks and establishing adequate systems and controls to ensure that overall risk remains within the risk appetite.
Management Level
At the management level, Risk Management within business areas or across business lines ensures that strategies, policies and directives approved at the strategic level are operationalized. Development and implementation of underlying procedures, processes and controls are ensured at the management level. Assuring the compliance with laid down policies, procedures and controls, and reviewing the outcome of operations, and measuring and analyzing risk related information are also performed at this level.
Operational Level
At the operational level, Risk Management activities are performed by individuals who take risks on behalf of the Company, which includes front, middle and back office personnel. They are required to comply with approved policies, procedures and controls. Operational level personnel give valuable inputs to continuously improve risk related activities undertaken in day-to-day operations.

Commercial Credit and Finance PLC Annual Report 2019/2020064
A comprehensive Risk Management process has been developed and is continuously reviewed by the Integrated Risk Management Committee (IRMC) together with the Operational Management.
The Company has established risk subcommittees in the areas of Fixed Deposits, investments, Human Resources, Information Technology and Credit, in addition to the Assets and Liabilities Committee (ALCO). The effectiveness of these sub-committees are assessed by the IRMC annually.
The risk sub-committees comprise of selected representatives from Operational Management, Middle Management and Operational Staff from respective disciplines. These sub-com-mittees meet regularly and are responsible for identifying and analyzing risks. The identified risks are taken up for discussion at risk sub-committee meetings where issues are discussed in detail. The minutes of the sub-committee meetings are submitted for approval of the IRMC and the ALCO meeting minutes are circulated to the board through IRMC. The decisions and directives of the IRMC are communicated to the Operational Management through sub-committees for operationalization of such decisions and directives. The IRMC meets on a regular basis to review and discuss various reports related to Risk Management presented to the Committee by the Management and the findings of the risk sub-committees.Risks related to areas under each sub-committee have been
identified and Risk Registers have been developed and maintained. Each identified risk has been categorized based on the probability of occurrence and expected impact. The impact has been categorized as critical, high, medium and low. The frequency has been categorized as certain, likely, possible and remote. Control activities including the following strategies have been developed and adopted for all risks and the appropriate risk treatment identified and actioned.
Types of Risks
In pursuing the Company’s desired strategic objectives, Commercial Credit is exposed to several risks which have been categorized as follows.
Credit Risk
Credit risk is the risk of financial loss if a customer or counterparty fails to meet a payment obligation under a contract. The Company’s credit risk arises mainly from various accommodations granted and could be identified as the most significant risk faced by the Company. The credit riskmanagement objective is to minimize credit risk while ensuring optimal risk rewards pay off for the finance institution while maximizing the return and maintaining the quality of the portfolio by minimizing the non-performing loans and probable losses.
Risk ManagementProcessRisk Control
Risk Analyzing
Risk Review Risk Identification
Risk Management Process
Risk Management [Cont.]

Risk
Man
agem
ent &
Corp
orat
e Go
vern
ance
Sust
aina
bilit
yRe
port
Man
agem
ent D
iscus
sion
and
Anal
ysis
Boa
rd o
f Dire
ctor
s &Ex
ecut
ive M
anag
emen
tHi
ghlig
hts
Fina
ncia
lIn
form
atio
n
Commercial Credit and Finance PLC Annual Report 2019/20 065
The Credit Policy plays a central role in managing daily business activities. The policy is reviewed at least once in two years and approved by the Board of Directors ensuring consistency with the Company’s business strategy. Credit committee meetings drive policy decisions and implementation plans. Credit is required to be granted according to the approved policies and procedures of the Company. Special attention is given to Credit Risk Management in terms of analyzing customer credit worthiness through thorough customer investigations before and after credit facilities are provided. Repayment of accommodations granted is closely monitored by those responsible for granting various facilities as well as those directly responsible for recovery activities. Indicators have been developed to measure risks associated with credit which are reviewed on a continuous basis for the entire organization as well as for each product and operational location.
The credit facility origination process comprises of initial screening and credit appraisal. The evaluation focuses on the borrower’s ability to meet his/her obligations in a timely manner. Efforts are made to ensure that consistent standards are maintained in credit approval. Collateral and guarantees form an important part of the credit risk mitigation process.
To safeguard the Company against possible losses and problems that may arise in granting credit facilities need to be identified early. The Credit Risk sub-committee measures and tracks the status of the credit portfolio. Credit reports need to be prepared monthly without failing to review high level credit portfolio concentration and assess performance of the facilities granted.
Default loans are managed by the Recoveries and Credit Division. This unit is responsible for all aspects of an overdue facility, restructuring of the credit, scrutiny of legal documents and liaising with the customer until all recovery matters are
finalized. Regular meetings are held in order to ensure the smooth functioning of the recoveries function.
Market Risk
Market risk is the risk arising from fluctuations in market variables such as interest rates, foreign currencies, equity prices and gold prices. This is the risk that the fair value or future cash flows of financial instruments will fluctuate due to changes in the market variables. As the Company’s operations involve granting accommodations, accepting deposits and obtaining funding facilities, the movements in interest rates constitute the most important market risk for the Company. The Company’s market risk management is operationalized through ALCO Policy, Investment Policy, Treasury Policy and Board-approved Risk appetite limits.
Marketing Risk Management Approach
Movements in interest rates are closely monitored. Further, the Company maintains an adequate Net Interest Margin (NIM) so that increases in interest expenses can be absorbed. Although the mismatch in assets and liabilities in terms of maturity is widely prevalent in the industry, in view of the composition of the portfolio of the Company, this mismatch has been mitigated to a significant extent.Gold prices are monitored continuously and LTV rates for pawning and gold loan advances are set on a regular basis taking the tenure of each product into account.
Liquidity Risk
Liquidity risk is the risk of only being able to meet liquidity obligations at increased cost or, ultimately, being unable to meet obligations as they fall due. In the case of the Company, this relates mainly to the ability to meet refund of deposits obtained from the public as they fall due and the settlement of installments on bank and other borrowings.
Credit Risk Management Structure and Approach Credit Risk Management Process
Credit risk Appetite
Credit risk Policy and Procedures
Credit Approval
Credit Approval Limits
Customer BackgroundChecking
Credit Recovery
Special RecoveryTeam
Legal RecoveryTeam
Credit Monitoring
Monitoring of Non-Performing Loans
Monitoring ofPerforming Loans

Risk Management [Cont.]
Commercial Credit and Finance PLC Annual Report 2019/2020066
ALCO Policy and Investment Policy
Liquidity Risk Appetite
First Line Review
Treasury Department
Third Line Review
ALCO and InvestmentCommittee
Second Line Review
Finance Department
Liquidity Risk Management Approach
Special attention is given on the liquidity of the Company as it provides critical defense against this and several other risks such as reputation, compliance, and financial risks. The Company maintains a conservative outlook towards managing Liquidity Risk, which is governed by the Board-approved ALCO Policy, investment Policy and appropriate Risk Appetite Limits. The Company works to ensure adequate resources are maintained at all times to meet obligations and prevent a potential liquidity shocks. From the governance perspective, the responsibility for managing the Company’s Liquidity risk lies with ALCO while clear defined responsibilities ensure its management at operational level.
The Treasury Department is responsible for maintaining the Liquid Asset Ratio above the Central Bank stipulated levels, while the ALCO is responsible for monitoring the liquid asset ratio. The assets and liability mismatch of the Company is monitored on a monthly basis at the ALCO and reported to the IRMC if there is any deviation from the Board approved risk appetite limits.
The Company’s projected liquidity requirements are assessed on a continuous basis to ensure that they can be met as and when such requirements arise. The Company also strives to ensure that the liquidity ratios required to be maintained by the applicable Central Bank regulations are complied with as per the requirements of Finance Companies (Liquid Assets) Direction No. 04 of 2013.
Operational risk
Operational risk is the probability of loss occurring from the internal inadequacies of a firm or a breakdown in its controls, operations, or procedures.
Operational Risk Management Approach
Sound operational policies, processes and controls have been put in place to be followed by staff to mitigate operational risks and the effectiveness of the same is assessed on a continuous basis.
The degree of compliance of staff with such operational policies, processes and controls is regularly reviewed. The Company maintains risk registers which include possible operational risks and appropriate controls. Awareness building and comprehensive training sessions are undertaken to educate staff on the significance of the compliance with operational policies, processes and controls. In this context, the value driven culture which is rigorously promoted across all levels of Commercial Credit in ensuring that employees are self-disciplined, plays a key role.
Reputational Risk
Reputation risk is the risk of loss resulting from damages to a firm’s reputation, in lost revenue; increased operating, capital or regulatory costs; or destruction of shareholder value,consequent to an adverse or potentially criminal event even if the Company is not found guilty. For Commercial Credit, this relates to the borrowers’ negative perception about the Company and a loss of confidence on the part of depositors. Further, with the emergence of the Company as a major player among non-banking financial institutions, it is criticalthat due attention is given to safeguard the high reputation the Company has earned among all stakeholders. In today’s highly interconnected world with the capability to communication rapidly, an excellent reputation carefully built over a long period could be at risk instantly.

Risk
Man
agem
ent &
Corp
orat
e Go
vern
ance
Sust
aina
bilit
yRe
port
Man
agem
ent D
iscus
sion
and
Anal
ysis
Boa
rd o
f Dire
ctor
s &Ex
ecut
ive M
anag
emen
tHi
ghlig
hts
Fina
ncia
lIn
form
atio
n
Commercial Credit and Finance PLC Annual Report 2019/20 067
Reputational Risk Management Approach
Strong Corporate Governance and Risk Management practices are promoted across all levels of the Company while significant investments have been made in enhancing the Company’s brand image through well thought out marketing strategies which are in keeping with the Company’s Shared Values. Further, promotion of the Value driven culture within the organization and customer confidence building initiatives employed, enhance the reputation of the Company. The Company pays close attention to ensure that there is no reputation-reality gap for any stakeholder group of Commercial Credit.
Information Technology (IT) Risk
IT Risk Management is the risk of disruption associated with the use, ownership, operation and adoption of IT in relation to customer data, business processes and critical systems. With the growing needs of the business, the focus on managing IT risks is intensified in recent years with an ever-increasing emphasis on strengthening IT governance to align with CBSL directives as well as globally accepted best practices.
Information Technology Risk Management Approach
The Company has strengthened the governance ofinformation security and Information Security riskmanagement, by establishing an Information security unit which is headed by the Chief Information Security Officer (CISO) and an IT Risk Committee which reports to the IRMC and is responsible for managing risks relating to information security. The IS function is supported by an out-sourced Security Operation Center which monitors systems round the clock. The Information Security Risk Management Program focuses on identifying risks and addressing all levels of IT risk, conducting vulnerability assessments for all critical systems, ensuring strict compliance with all regulations and best practices and raising awareness among employees and customers.
A comprehensive Disaster Recovery Plan is in place inpreparation of contingent risk incidents. As a result of our continuous efforts in managing ICT risk, minimal system disruptions, with no significant impact on operations, were experienced.
Strategic Risk
Strategic risk can be defined as risks that affect or are created by the Company’s business strategy and strategic objectives. Strategic risk could also arise due to changes in the competitive landscape or regulatory framework or ineffective positioning in the microeconomic environment. The failure to execute strategy or failure to take effective actions to address under-performance could also increase the exposure to Strategic Risk.
Strategic Risk Management Approach
The primary means of managing strategic risk is through a Board-approved Strategic Plan prepared annually to outline the future direction of the Company through a set of long-term goals, objectives and priorities along with the actions needed to achieve them in line with the Company’s purpose. It is the key document used by the leadership to prioritize the allocation of resources, to strengthen the Company’s competitive position.
Risk Appetite
Risk Appetite is defined as the quantum of risk the Company is willing to assume in different areas of business in achieving its strategic objectives and ensuring the stringent maintenance of the desired risk profile. The Risk Appetite framework and Risk Tolerance limits have been defined by the Board in consultation with the Senior Management of the Commercial Credit in-line with the Commercial Credit’s overall business strategy, providing clear direction to the business units for ongoing operations and risk management. The Risk Appetite framework and Risk Tolerance limits are reviewed and adjusted by the Board when required, based on developments in the operating environment. In the event the risk appetite threshold has been breached, risk management and business controls are implemented to bring the exposure level back within the accepted range. Risk appetite, therefore, translates into operational measures such as limits or qualitative checkpoints for the dimensions of capital, earnings volatility andconcentration risk etc. In order to effectively implement Risk appetite, Commercial Credit has defined quantitative indicators (e.g., capital adequacy level and risk limits) or qualitatively embedded same in the policies and procedures.
Commercial Credit and Finance PLC Annual Report 2019/2020068
Corporate Governance is about promoting transparency and accountability, and it defines systems and structures in relation to decision making and their execution through whichCommercial Credit and Finance PLC (Company) is managed in the best interest of our stakeholders. It has been designed and developed so that it will influence the behaviour of everyone assigned with the responsibility of managing the affairs of the Company ensuring that the interests of all stakeholders are effectively served on a consistent basis.
Good Corporate Governance helps in moving the Company towards performance excellence while complying with external and internal regulations, guidelines and ethical standards.
We recognize that controls and procedures play an integral part in maintaining high standards and that transparency,disclosure, financial controls and accountability are essential components of any good system of Corporate Governance.The Company is committed to high standards of Corporate Governance and we are constantly seeking ways to making our Corporate Governance even more effective and reliable. We believe that the emphasis the Company consistently makes in instilling the Shared Values of the Company among all members of the Commercial Credit team will play a critical role in this regard.
The Company’s Corporate Governance model has been built and enhanced based on the following requirements and guidelines.
1. The Companies Act No. 07 of 2007.2. The Listing Rules of Colombo Stock Exchange (CSE).3. Code of Best Practice on Corporate Governance jointly issued by the Institute of Chartered Accountants of SriLanka (ICASL) and Securities and Exchange Commission of Sri Lanka(SEC).4. The Finance Companies (Corporate Governance) Direction No. 03 of 2008 issued by the Central Bank of Sri Lanka.
Board of Directors
The Board of Directors of the Company comprised of eleven (11) members as at the end of the financial year under review. The Company’s Board of Directors consists of professionals in varied fields who collectively possess a vast wealth ofknowledge and experience and are thus eminently suitable to provide the leadership and direction required.
One third of the Directors retire by rotation at each Annual General Meeting and those eligible are recommended for re-election.The Board meets approximately once a month or as and when the need arises to discuss any prevailing issues and
to take appropriate action as required. There were total of twelve Board meetings during the financial year under review.The Board of Directors jointly provides strategic leadership and direction to the Company. The Board ensures that strategies are formulated and implemented so that consistent progress is made by the Company towards its approved Purpose, Vision and Mission in keeping with our Shared Values. The Board issues directions and guidelines to the Chief Executive Officer (CEO) and the Executive Management of the Company as it deems necessary.
The Chairman has no financial or any other relationship with any other member of the Board. One Executive Director of the Company is the spouse of the CEO.
The policies and guidelines required are approved by the Board and periodically reviewed to ensure that they remain relevant and meet the requirements of the Company. Further, members of the Board are appointed to the Sub-Committees covering specified areas and its Terms of Reference have been approved by the Board of Directors.
The Board of Directors through their regular meetings and operation of Board Sub-Committees reviews the performance of the Company in the context of the interests of allstakeholders. The financial performance, compliance with rules and regulations and risk management receive close attentionof the Board. The financial budget and other plans and indicators together with related resource requirements are reviewed and approved by the Board for the ensuing financial period. The Board’s attention is also given to the proper functioning and effectiveness of the Company’s System of Internal Controls, Management Information System (MIS) and corporate governance practices. In reviewing the performance of the Company, the Board meets the CEO and ExecutiveManagement.
A Statement of Directors’ Responsibilities for Financial Reporting is set out in this Annual Report.
Corporate Governance

Risk
Man
agem
ent &
Corp
orat
e Go
vern
ance
Sust
aina
bilit
yRe
port
Man
agem
ent D
iscus
sion
and
Anal
ysis
Boa
rd o
f Dire
ctor
s &Ex
ecut
ive M
anag
emen
tHi
ghlig
hts
Fina
ncia
lIn
form
atio
n
Credit ApprovalShareholdersExternal Auditors
Company Secretary
Chief Executive OfficerBoard Sub-Committees:Audit Committee:Remuneration Committee:Integrated Risk Management Committee(IRMC):Related Party Transaction Review Committee
Operational/RiskSub-Committee:Assests and Liability Committee(ALCO):Human Resource:Credit, Legal and Recoveries:Information Technology:Fixed Deposits
Executive Directors
Operational Management
Middle Management
Operational Staff
Internal Auditor
Responsibility flow Appointment flow
Commercial Credit and Finance PLC Annual Report 2019/20 069
Board of Directors

Corporate Governance [Cont.]
Board Sub-Committees
In accordance with the requirements of the Listing Rules of the Colombo Stock Exchange (CSE) and the related Directives of the Central Bank of Sri Lanka the Board has constituted four Sub-Committees, namely, Board Audit Committee (BAC), Remuneration Committee, Related Party Transaction Review Committee and Integrated Risk Management Committee (IRMC). These Committees are made up of members of the Board and the Operational Management of the Company.The Board Sub-Committees scrutinize and analyse the areas under their purview and assist and advise the Board of Directors. The Board Sub-Committees obtain information and explanations and any other assistance required from the
Management and staff of the Company.The composition of the Board during the period under review is set out below together with a record of the attendance of every Director at Board and Sub-Committee meetings.
Credit Approval
Mr Mr E D P Soosaipillai
Mr K J C Perera
Mr R S EgodageMrs G R EgodageMr M S D Pinto
Mr P T FisherMr K D Vander WeeleMr P.S.R. C ChittyMr. B. Zschorsch Mr. A J P DufesMr. L.L.S. WickremasingheMs. T.M.L. Paktsun
Independent Non-ExecutiveIndependent Non-ExecutiveExecutiveExecutive Independent Non-ExecutiveNon-ExecutiveNon-ExecutiveExecutiveNon-ExecutiveNon-ExecutiveIndependent Non-ExecutiveIndependent Non-Executive
12
12
1212
12
1212121211
9
2
12
12
1212
11
119
121110
8
2
13
13
Name of theDirector
Category
1 1
4 4
4 4
11
Commercial Credit and Finance PLC Annual Report 2019/2020070
Elig
ible
toat
tend
Elig
ible
toat
tend
Elig
ible
toat
tend
Elig
ible
toat
tend
Elig
ible
toat
tend
atte
nd
atte
nd
atte
nd
atte
nd
atte
nd
Board AuditCommittee
RemunerationCommitee
Intergrated RiskManagement
CommiteeRPT ReviewCommitee
N/A
(Retired w.e.f. 14th March 2020)
(Appointed w.e.f. 13th February 2020)
N/A
1 1
3
2
3
2
13
13
12 12
13 11
13 12
7 6
1 1
11 11
12 9
12 11
12 12
N/AN/A
N/A N/AN/AN/AN/AN/A
N/AN/A
N/AN/A
N/AN/A
N/A
N/A
N/AN/A
N/A
N/A
N/A
N/AN/A
N/AN/A N/A
N/AN/A

Risk
Man
agem
ent &
Corp
orat
e Go
vern
ance
Sust
aina
bilit
yRe
port
Man
agem
ent D
iscus
sion
and
Anal
ysis
Boa
rd o
f Dire
ctor
s &Ex
ecut
ive M
anag
emen
tHi
ghlig
hts
Fina
ncia
lIn
form
atio
n
Company Secretaries
Jacey & Company provides corporate secretarial services to the Company. The Company Secretaries play a key role incompliance matters by ensuring that the Company complies with the requirements of the Companies Act No. 07 of 2007, the Rules of the Colombo Stock Exchange and other regulatory bodies. The Secretaries also ensure that Board procedures are followed and information is provided to shareholders on a timely basis. Jacey & Company has also been appointed by the Board to function as Secretaries for the Board Sub-Committees.
Operational and Risk Sub-Committees
In order to facilitate the implementation of the policies and various operational decisions made by the Board and the Executive Management, regular meetings are held with the Operational Management team, functional heads and heads of the various branches and service centers of the Company. These meetings focus on achievement of operational targets, resource requirements and, underlying processes and risks. Assets and Liabilities Committee (ALCO) and RiskSub-Committees covering the areas of Fixed Deposits, Human Resources, Information Technology and Credit, Legal and Recoveries have been formed with the intention of identifying and reviewing the related risk aspects of the operations of the Company and actions required to deal with such risks. These Sub-Committees are represented by risk management and operational personnel and meet approximately once in three months. Matters discussed and decisions made arecommunicated to the Integrated Risk Management Committee (IRMC).Operational Structure
In order to effectively execute the strategies and plans approved by the Board, Company has an operational structure which manages its product portfolio and the geographical locations at which it is present. Members of the Executive Management are assigned with responsibilities to manage the specific products and functions of the Company. The next level of management is responsible for delivering of results at regional and at the level of individual locations. Formal lines of communication and reporting flow from the CEO and Executive Director to the Executive Management and from them to the regional and branch management and then to the operational staff are in place. However, in keeping with the open culture of the Company all employees have open lines of communication across the organisation where even the most junior staff have direct access to the CEO and the Executive Directors.
Compliance with Legal Requirements
All Directors have access to the advice and services of the Company Secretaries as well as to the financial information of the Company. The Directors make every endeavour to ensure that the Company complies with applicable laws and regulations.
Commercial Credit and Finance PLC Annual Report 2019/20 071

Highlights For 2019/20
1. Directors’ Retirement/Re-appointment at the Annual General Meeting
Mr.Kalugamage John Cecil Perera, Non-Executive Director & Chairman of the Company who was first appointed to the Board on 15 March 2011, retired after completion of 9 years of service on 14 March 2020
Mr. B.B. Zschorch, Non-Executive Director of the Company who was first appointed to the Board on 25 May 2018, was re-elected at the Annual General Meeting held on 23 August 2019.
Mr. A.J.P. Dufes, Non-Executive Director of the Company who was first appointed to the Board on 18 April 2019, was re-elected at the Annual General Meeting held on 23 August 2019.
Mr. L.L.S. Wickremasinghe, Independent Non-Executive Director of the Company who was first appointed to the Board on 26 June 2019, was re-elected at the Annual General Meeting held on 23 August 2019.
Mr. P.T. Fisher, Non-Executive Director of the Company who was first appointed to the Board on 27 March 2019, was re-elected at the Annual General Meeting held on 23 August 2019.
Mr. M.S.D. Pinto, Non-Executive Director of theCompany who was first appointed to the Board on 19 May 2011, was re-elected at the Annual General Meeting held on 23 August 2019.
2. Re-appointment of Auditors
Messrs. Ernst & Young, Chartered Accountants were re-appointed as the Auditors of the Company at the AGM held on 23 August 2019.
3. Re-appointment of Messrs. Ernst & Young, Chartered Accountants for assessment of Corporate Governance and Compliance
The Company engaged the services of Messrs. Ernst & Young, Chartered Accountants to seek their assessment of the Company’s compliance with the requirements of the Finance Business Act Direction No. 03 of 2008 on Corporate Governance for Licensed Finance Companies issued by the Central Bank of Sri Lanka and subsequent amendments thereto.
4. Re-appointment of Messrs. Ernst & Young, Chartered Accountants for certification on the process adapted by the Directors on the system of Internal Controls over Financial Reporting
The Company also engaged the services of Messrs. Ernst & Young, Chartered Accountants to seek an assurance on the process adopted by the Directors on the system of internal control over financial reporting.
Commercial Credit and Finance PLC Annual Report 2019/2020072
Corporate Governance [Cont.]

Risk
Man
agem
ent &
Corp
orat
e Go
vern
ance
Sust
aina
bilit
yRe
port
Man
agem
ent D
iscus
sion
and
Anal
ysis
Boa
rd o
f Dire
ctor
s &Ex
ecut
ive M
anag
emen
tHi
ghlig
hts
Fina
ncia
lIn
form
atio
n
Commercial Credit and Finance PLC Annual Report 2019/20 073
Credit Approval
The following table indicate the status of compliance on the contents of Annual Report in terms of the listing rules of theCSE Rule No. 7.6
7.6 (i)
7.6 (ii)
7.6 (iii)
7.6 (iv)7.6 (v)
7.6 (vi)
7.6 (vii)
7.6 (viii)
7.6 (ix)7.6 (x)
7.6 (xi)
7.6 (xii)
7.6 (xiii)
Names of the Directors who held duties duringthe financial yearPrincipal activities of the Company and itssubsidiaries during the year and any changesthere inThe names and the number of shares held by the20 largest holders of voting and non-voting sharesand the percentage of such shares heldThe public holding percentageDirectors’ and Chief Executive Officer’s holding in shares of the Company at the beginning and endof the financial yearInformation pertaining to material foreseeablerisk factorsDetails of material issues pertaining to employeesand industrial relationsExtents, locations, valuations and the number ofbuildings of the Company's land holdingsand investment propertiesNumber of shares representing the stated capitalA distribution schedule of the number of holdersin each class of equity securities, and thepercentage of their total holdingsRatios and market price information:• Equity1. Dividend per share2. Dividend pay out3. Net asset value per share4. Market value per share (highest and lowestvalues recorded during the financial yearand value as at the end of financial year)• Debt (only if listed)1. Interest rate of comparable government security2. Debt/equity ratio3. Interest cover4. Quick asset ratio5. The market prices and yield during the year6. Any changes in credit ratingSignificant changes in the Company’s orits subsidiaries’ fixed assets and the marketvalue of land, if the value differs substantiallyfrom the book valueDetails of funds raised through a Initial Publicissue, Rights Issue and private Placement
Refer Report of the Board of Directors on theAffairs of the Company in this Annual Report.Refer Report of the Board of Directors on theAffairs of the Company in this Annual Report.
Refer Investor Information in this Annual Report
Refer Investor Information in this Annual ReportRefer Investor Information in this Annual Report
Refer Risk Management section in this Annual Report
There were no material issues pertaining toemployees and industrial relations.Refer Note 19 and 20 of the Audited FinancialStatements in this Annual Report.
Refer Investor Information in this Annual ReportRefer Investor Information in this Annual Report
Refer Investor Information in this Annual Report
Refer Investor Information in this Annual Report
Not Applicable
Not Applicable
Rule No Disclosure Requirement Section/Reference

Corporate Governance [Cont.]
Commercial Credit and Finance PLC Annual Report 2019/2020074
Credit Approval
7.6 (xiv)
7.6 (xv)
7.6 (xvi)
Information in respect of Employee ShareOwnership or Stock Option Scheme• Total number of shares allotted during the financial year• Price at which shares were allotted• Highest, lowest & closing price of the• share recorded during the financial year• Details of funding granted to employees (if any)
Disclosures pertaining to Corporate Governancepractices in terms of Rules 7.10.3, 7.10.5 c.and7.10.6 c. of Section 7 of the Rules
Related Party transactions exceeding 10 per centof the Equity or 5 per cent of the total assets ofthe Entity as per Audited Financial Statements,whichever is lower
Not Applicable
Refer Report of the Board of Directors on the Affairsof the Company, Report of the Board Audit Committee,Report of the Remuneration Committee and CorporateGovernance section in this Annual Report.Not applicable as it has not exceeded the stipulated limit.

Risk
Man
agem
ent &
Corp
orat
e Go
vern
ance
Sust
aina
bilit
yRe
port
Man
agem
ent D
iscus
sion
and
Anal
ysis
Boa
rd o
f Dire
ctor
s &Ex
ecut
ive M
anag
emen
tHi
ghlig
hts
Fina
ncia
lIn
form
atio
n
Commercial Credit and Finance PLC Annual Report 2019/20 075
Credit Approval
Company’s compliance with Direction No. 3 of 2008 on Corporate Governance issued by the Central Bank of Sri Lanka
2. The Responsibilities of the Board of Directors2.(1).a)
b)
c)
d)
e)
f)
g)
h)
Approving and overseeing the Finance Company’sstrategic objectives and corporate values andensuring that such objectives and values arecommunicated throughout the Finance Company;
Approving the overall Business Strategy of theFinance Company, including the overall risk policyand risk management procedures and mechanismswith measurable goals, for at least immediatenext three years;Identifying risks and ensuring implementation ofappropriate systems to manage the risks prudently;
Approving a policy of Communication with allstakeholders, including Depositors, Creditors,Share-Holders and Borrowers;
Reviewing the adequacy and the integrity of theFinance Company’s Internal Control Systems andManagement Information Systems;
Identifying and designating key managementpersonnel, who are in a position to: (i) significantly influence policy;(ii) direct activities; and(iii) exercise control over business activities,operations and risk management;defining the areas of authority and keyresponsibilities for the Board and for the keymanagement personnel;ensuring that there is appropriate oversight of theaffairs of the finance Company by keymanagement personnel, that is consistent withthe finance Company’s policy;
A three year strategic plan covering financial years2020 – 2022 that encompasses the strategic objectivesand corporate values of the Company prepared by theManagement was approved by the Board of Directors(Board)Company’s three year strategic plan is based on the overallrisk policy and risk management procedures andmechanism approved by the Board of Directors
The Board has appointed an Integrated Risk ManagementCommittee (IRMC), which met twelve (12) times during thefinancial year 2019/2020. The IRMC has appointed Sub-Committees to identify therisks in the areas of Assets and Liabilities Management,Fixed Deposits, Information Technology and HumanResourcesA Board approved detailed policy on communication withthe relevant stakeholders is in place. The Company hasassigned a designated person to handle communicationwith all stakeholders, including Depositors, Creditors,Shareholders and BorrowersThe Board Audit Committee (BAC) reviews the adequacyand the integrity of the Company’s Internal Control Systems.Minutes of such meetings circulated to the Board ofDirectors.Various reviews have been carried out in relation tothe Management Information System (MIS) of the Companyby internal and external parties which has been presentedto the BAC. Based on the BAC review and recommendationBoard has reviewed the adequacy and integrity of MISBoard of Directors (including Chief Executive Officer (CEO)and Chief Operating Officer (COO)) and selected GeniusOperations have been designated by the board as “KeyManagement Personnel”
Board approved areas of key responsibilities of Board ofDirectors and Key Management Personnel are in place
The affairs of the Company are reviewed and monitoredby the Board of Directors through the CEO and it ensuresthat the Key Management Personnel and other membersof the Executive Management exercise appropriateoversight on the activities of the Company
RuleReference Rule Description Compliance Status

Corporate Governance [Cont.]
Commercial Credit and Finance PLC Annual Report 2019/2020076
Credit Approval
i)
j)
k)
l)
m)
2.(2)
2.(3)
2.(4)
2.(5)
2.(6)
periodically assessing the effectiveness of itsgovernance practices, including: (i) the selection, nomination and electionof Directors and appointment of key managementpersonnel;(ii) the management of conflicts of interests and (iii) the determination of weaknesses andimplementation of changes where necessary;Ensuring that the finance Company has anappropriate succession plan for Key ManagementPersonnel;Meeting regularly with the Key ManagementPersonnel to review policies, establish lines ofcommunication and monitor progress towardscorporate objectives;Understanding the regulatory environment;
Exercising due diligence in the hiring and oversightof external auditors
The Board shall appoint the Chairman and the ChiefExecutive Officer and define and approve thefunctions and responsibilities of the chairman andthe chief executive officer in line with paragraph7 of this Direction.There shall be a procedure determined by theBoard to enable Directors, upon reasonablerequest, to seek independent professional advicein appropriate circumstances, at the financeCompany’s expense. The Board shall resolve toprovide separate independent professional adviceto Directors to assist the relevant director(s) todischarge the duties to the Finance Company.A director shall abstain from voting on any Boardresolution in relation to a matter in which he or anyof his relatives or a concern in which he hassubstantial interest, is interested, and he shall notbe counted in the quorum for the relevant agendaitem at the Board meeting.The Board shall have a formal schedule of mattersspecifically reserved to it for decision to ensure thatthe direction and control of the Finance Company isfirmly under its authority.The Board shall, if it considers that the FinanceCompany is, or is likely to be, unable to meet itsobligations or is about to become insolvent or isabout to suspend payments due to depositors andother creditors, forthwith inform the Director of theDepartment of Supervision of Non-Bank FinancialInstitutions of the situation of the Finance Companyprior to taking any decision or action.
The Board ensures that it periodically assesses its owngovernance practices including selection, nomination andelection of Directors and appointment of Key ManagementPersonnel, management of conflicts of interests and thedetermination of weaknesses and implement changeswhere necessary
Board approved succession plan for Key ManagementPersonnel is in place
Members of the Executive Management are invited toBoard meetings where they are required to explain mattersrelating to their areas of responsibility and to assist theBoard in reviewing related policiesThe Directors and Key Management Personal are informedof all changes to the regulatory environmentThe Board exercised due diligence in hiring and oversightof External Auditors with the assistance of the BAC. TheExternal Auditors are appointed by the Shareholders at theAnnual General MeetingThe Chairman and the CEO are appointed by the Board andtheir functions and responsibilities are separated and furtherdefined and approved by the Board of Directors
A procedure approved by The Board of Directors to obtainindependent professional advice where necessary at theCompany’s expense is in place
A procedure has been put in place to avoid conflicts ofinterest and Directors abstain from voting when matters inwhich he or any of his/her relatives or a concern in whichhe/she has substantial interest is discussed
A formal schedule of matters specifically reserved for theBoard is in place
No such situation has arisen in the past or nor is oneforeseen in the foreseeable future

Risk
Man
agem
ent &
Corp
orat
e Go
vern
ance
Sust
aina
bilit
yRe
port
Man
agem
ent D
iscus
sion
and
Anal
ysis
Boa
rd o
f Dire
ctor
s &Ex
ecut
ive M
anag
emen
tHi
ghlig
hts
Fina
ncia
lIn
form
atio
n
Commercial Credit and Finance PLC Annual Report 2019/20 077
Credit Approval
2.(7)
2.(8)
3. Meetings of the Board3.(1)
3.(2)
3.(3)
3.(4)
3.(5)
3.(6)
The Board shall include in the finance Company’sannual report, an annual corporate governancereport setting out the compliance with this DirectionThe Board shall adopt a scheme of self-assessmentto be undertaken by each director annually, andmaintain records of such assessments
The Board shall meet at least twelve times afinancial year at approximately monthly intervals.Obtaining the Board’s consent through thecirculation of written or electronic resolutions/papers shall be avoided as far as possible
The Board shall ensure that arrangements are inplace to enable all Directors to include matters andproposals in the agenda for regular Board meetingswhere such matters and proposals relate to thepromotion of business and the management of risksof the Finance Company.
A notice of at least 7 days shall be given of a regularBoard meeting to provide all Directors anopportunity to attend. For all other Board meetings,a reasonable notice shall be given.
A director who has not attended at least two-thirdsof the meetings in the period of 12 monthsimmediately preceding or has not attended theimmediately preceding three consecutive meetingsheld, shall cease to be a director. Provided thatparticipation at the Directors’ meetings through analternate director shall, however, be acceptable asattendance.The Board shall appoint a Company Secretarywhose primary responsibilities shall be to handlethe secretarial services to the Board and shareholdermeetings and to carry out other functions specifiedin the statutes and other regulations.If the chairman has delegated to the CompanySecretary the function of preparing the agenda fora Board meeting, the Company Secretary shall beresponsible for carrying out such function.
An Annual Corporate Governance Report setting out thecompliance with this direction is included in this AnnualReportA scheme of self-assessment of Directors is in place to beundertaken by each Director annually and the records ofsuch assessments are maintained by the CompanySecretary
Twelve (12) Board meetings were held during the year 2019/20 at approximately monthly intervals and detailsof Directors’ individual attendance are provided under“Corporate Governance” in this Annual Report. There wereseveral instances where the Board’s consent has beenobtained through circulation of resolutions/papers duringthe financial year under review, which were subsequently ratified by the Board at their meetingsAgenda of regular meetings are included with matters andproposals from all Directors with regard to promotion ofbusiness and management of risk and other relevant areasof the business of the Company. Further, a Board approvedprocedure is in place in this regard
Meaningful discussions are facilitated at both Boardmeetings and other meetings where adequate time and atleast 7 days of notice is given to Directors prior to the BoardMeeting.Further, sufficient time period is offered in studying therelevant papers and proposalsNo such situation has arisen in financial year 2019/2020.Details of Directors’ individual attendance are providedunder the “Corporate Governance” in this Annual Report
For carrying out the secretarial functions and other functionsrequired by the statutes, the Board has appointed aprofessional Secretarial Company as the Board Secretary
Company Secretary prepares the agenda for the boardmeeting and the chairman approves the same

Corporate Governance [Cont.]
Commercial Credit and Finance PLC Annual Report 2019/2020078
Credit Approval
3.(7)
3.(8)
3.(9)
4.(1)
4.(2)
4.(3)
All Directors shall have access to advice and services of the Company Secretary with a view to ensuring that Board procedures and all applicable laws, directions, rules and regulations arefollowed.The Company Secretary shall maintain the minutes of Board meetings and such minutes shall be open for inspection at any reasonable time, on reasonable notice by any Director.Minutes of Board meetings shall be recorded in sufficient detail so that it is possible to gather from the minutes, as to whether the Board acted with due care and prudence in performing its duties. The minutes of a Board meeting shall clearly contain or refer to the following:(a) a summary of data and information used by the Board in its deliberations;(b) the matters considered by the Board; (c) the fact-finding discussions and the issues of contention or dissent which may illustrate whether the Board was carrying out its duties with due care and prudence;(d) the explanations and confirmations of relevant executives which indicate compliance with the Board’s strategies and policies and adherence to relevant laws and regulations; (e) the Board’s knowledge and understanding of the risks to which the Finance Company is exposed and an overview of the risk management measures adopted; and(f) the decisions and Board resolutions.
Subject to the transitional provisions contained herein, the number of Directors on the Board shall not be less than 5 and not more than 13.Subject to the transitional provisions contained herein and subject to paragraph 5(1) of this Direction the total period of service of a director other than a director who holds the position of chief executive officer or executive director shall not exceed nine years. The total period in office of a non-executive director shall be inclusive of the total period of service served by such director up to the date of this Direction.Subject to the transitional provisions contained herein, an employee of a Finance Company may be appointed, elected or nominated as a Director of the Finance Company (hereinafter referred to as an “Executive Director”) provided that the number of Executive Directors shall not exceed one-half of the number of Directors of the Board. In such an event, one of the Executive Directors shall be the Chief Executive Officer of the Company.
Such advice and services of Company Secretary are available to all Directors and a Board approved process is in place in this regard
Board minutes are maintained by the Company Secretary and the same is available for Directors’ Inspection
Minutes of the Board meetings are recorded in sufficient details including the requirements mentioned in this section
The Board consists of eleven (11) Directors as at 31 March 2020
None of the Non-Executive Directors have held office for over nine years
There are eight (08) Non-Executive Directors and three (03) Executive Directors (including CEO)
4. Composition of the Board

Risk
Man
agem
ent &
Corp
orat
e Go
vern
ance
Sust
aina
bilit
yRe
port
Man
agem
ent D
iscus
sion
and
Anal
ysis
Boa
rd o
f Dire
ctor
s &Ex
ecut
ive M
anag
emen
tHi
ghlig
hts
Fina
ncia
lIn
form
atio
n
Commercial Credit and Finance PLC Annual Report 2019/20 079
Credit Approval
4.(4)
4.(5)
4.(6)
4.(7)
4.(8)
4.(9)
4.(10)
4.(11)
With effect from three years commencing 01.01.2009, the number of independent Non-execu-tive Directors of the Board shall be at least one fourth of the total number of Directors. In the event an alternate director is appointed to represent an independent non-executive director, the person so appointed shall also meet the criteria that apply to the independent non-executive director.Non-Executive Directors shall have necessary skills and experience to bring an objective judgment to bear on issues of strategy, performance and resources.With effect from three years from the date of this Direction, a meeting of the Board shall not be duly constituted, although the number of Directors required to constitute the quorum at such meeting is present, unless at least one half of the number of Directors that constitute the quorum at such meeting are non-executive Directors.The independent non-executive Directors shall be expressly identified as such in all corporate communications that disclose the names of Directors of the finance Company. The finance Company shall disclose the composition of the Board, by category of Directors, including the names of the chairman, executive Directors, non-executive Directors and independentnon-executive Directors in the annual corporate governance report which shall be an integral part of its Annual Report.There shall be a formal, considered and transparent procedure for the appointment of new Directors to the Board. There shall also be procedures in place for the orderly succession of appointments to the Board.All Directors appointed to fill a casual vacancy shall be subject to election by shareholders at the first general meeting after their appointment.If a director resigns or is removed from office, the Board shall announce to the shareholders and notify the Director of the Department of Supervision of Non-Bank Financial Institutions of the Central Bank of Sri Lanka, regarding the resignation of the director or removal and the reasons for such resignation or removal, including but not limited to information relating to the relevant director’s disagreement with the Board, if any.
Four (4) out of a total of eleven (11) Directors are Indepen-dent Non-Executive Directors
No such situation has arisen during the financial year 2019/20
A brief profile of each Director is disclosed in this Annual Report
Details of Directors’ individual attendance are provided in the “Corporate Governance” section in this Annual Report. The Board meeting attendance was prepared by the Company Secretary for the financial year 2019/20 evidence the required quorum has been complied with at all Board meetings
The Independent Non –Executive Directors have expressly identified in all corporate communications
The required procedure for appointment of Directors is in place
One (1) Director was appointed to the Board of Directors to fill a casual vacancy since last AGM
No such situation has arisen during the financial year 2019/20

Corporate Governance [Cont.]
Commercial Credit and Finance PLC Annual Report 2019/2020080
Credit Approval
5.(1)
5.(2)
6.(1)
6.(2)
7.(1)
7.(2)
7.(3)
7.(4)
Subject to the transitional provisions contained herein, a person over the age of 70 years shall not serve as a Director of a finance Company.A Director of a Finance Company shall not hold office as a Director or any other equivalent position in more than 20 companies/societies/bodies corporate, including associate companies and subsidiaries of the Finance Company. Provided that such Director shall not hold office of a Director or any other equivalent position in more than 10 companies that are classified as Specified Business Entities in terms of the Sri Lanka Accounting and Auditing Standards Act, No. 15 of 1995.
The Board shall not delegate any matters to a Board committee, Chief Executive Officer, Executive Directors or Key Management Personnel, to an extent that such delegation would significantly hinder or reduce the ability of the Board as a whole to discharge its functions.The Board shall review the delegation processes in place on a periodic basis to ensure that they remain relevant to the needs of the Finance Company.
The roles of Chairman and Chief Executive Officer shall be separated and shall not be performed by the one and the same person after 3 years commencing from January 1, 2009.The Chairman shall be a non-executive director. In the case where the Chairman is not an independent Non-Executive Director, the Board shall designate an Independent Non-Executive Director as the Senior Director with suitably documented terms of reference to ensure a greater independent element. The designation of the Senior Director shall be disclosed in the Finance Company’s Annual Report.The Board shall disclose in its corporategovernance report, which shall be an integral part of its Annual Report, the name of the Chairman and the Chief Executive Officer and the nature of any relationship [including financial, business, family or other material/relevant relationship(s)], if any, between the Chairman and the Chief Executive Officer and the relationships among members of the Board.The Chairman shall: (a) provide leadership to the Board; (b) ensure that the Board works effectively and discharges its responsibilities; and (c) ensure that all key issues are discussed by the Board in a timely manner.
No Director currently serving on the Board is above the age of seventy (70)
No Director holds directorship in more than 20 Compa-nies/Societies/Bodies/Corporates Including Associate Companies and Subsidiaries of the Finance Company.No Director holds Directorship in more than 10 Companies that are classified as Specified Business Entities
The Board does not delegate matters to an extent that such delegation would significantly hinder or reduce the ability of the Board as a whole to discharge its functions
The delegation process is periodically reviewed
The roles of Chairman and CEO are separated and held by two different individuals appointed by the Board
Chairman is an Independent Non-Executive Director
The Chairman has no financial or any other relationship with any other member of the board.One Executive Director of the Company is the spouse of CEO. The names of the Chairman and the CEO are given in this Annual Report
The requirements specified are adhered to by the Chairman in discharging his duties. The self-evaluation process of the Company ensures that the said requirements are fulfilled
5. Criteria to assess the fitness and propriety of Directors
6. Delegation of Functions
7. Chairman and Chief Executive Officer

Risk
Man
agem
ent &
Corp
orat
e Go
vern
ance
Sust
aina
bilit
yRe
port
Man
agem
ent D
iscus
sion
and
Anal
ysis
Boa
rd o
f Dire
ctor
s &Ex
ecut
ive M
anag
emen
tHi
ghlig
hts
Fina
ncia
lIn
form
atio
n
Commercial Credit and Finance PLC Annual Report 2019/20 081
Credit Approval
7.(5)
7.(6)
7.(7)
7.(8)
7.(9)
7.(10)
7.(11)
(1)
(2) a)
b)
The Chairman shall be primarily responsible for the preparation of the agenda for each Board meeting. The Chairman may delegate the function of preparing the agenda to the Company Secretary.The Chairman shall ensure that all Directors are informed adequately and in a timely manner of the issues arising at each Board meeting.The Chairman shall encourage each director to make a full and active contribution to the Board’s affairs and take the lead to ensure that the Board acts in the best interests of the Finance Company.The Chairman shall facilitate the effective contribution of non-executive Directors in particular and ensure constructive relationships between executive and non-executive Directors.The Chairman, shall not engage in activities involving direct supervision of Key Management Personnel or any other executive duties whatsoever.
The Chairman shall ensure that appropriate steps are taken to maintain effective communication with shareholders and that the views of shareholders are communicated to the Board.The Chief Executive Officer shall function as the apex executive-in-charge of the day-to-day-man-agement of the Finance Company’s operations and business.
Every Finance Company shall have at least the two Board committees set out in paragraphs 8(2) and 8(3) hereof. Each committee shall report directly to the Board. Each committee shall appoint a secretary to arrange its meetings, maintain minutes, records and carry out such othersecretarial functions under the supervision of the Chairman of the committee. The Board shall present a report on the performance, duties and functions of each committee, at the annual general meeting of the Company.
The Chairman of the committee shall be aNon-Executive Director who possessesqualifications and experience in accountancy and/or audit.The Board members appointed to the committee shall be Non-Executive Directors.
Company Secretary prepares the agenda for the board meeting and the Chairman approves the same
The requirement specified are adhered to by the Chairman in discharging his duties
The requirement specified are adhered to by the Chairman in discharging his duties
The requirement specified are adhered to by the Chairman in discharging his duties
The requirement specified are adhered to by the Chairman in discharging his duties
Shareholders are given the opportunity to express their views on matters of interest to them at annual general meetings
CEO functions as the apex executive of the Company supported by the Executive Management
The BAC and IRMC have been established and directly report to the Board. The Company Secretary has been appointed to arrange meetings, maintain minutes, records and carry out such other secretarial functions under the supervision of the Chairmen of the said committees. The performance, duties and functions of each committee are included in this annual report
The name, qualifications and experience of the Chairman of BAC who is an Independent Non-Executive Director, are given in the profiles of the Board of Directors in this Annual ReportThe Board members appointed to the Committee are Non-Executive Directors
8. Board Appointed Committees
8. Audit Committee

Corporate Governance [Cont.]
Commercial Credit and Finance PLC Annual Report 2019/2020082
Credit Approval
c)
d)
e)
The committee shall make recommendations on matters in connection with:(i) the appointment of the external auditor for audit services to be provided in compliance with the relevant statutes;(ii) the implementation of the Central Bank guidelines issued to auditors from time to time;(iii) the application of the relevant accounting standards; and (iv) the service period, audit fee and any resignation or dismissal of the auditor, provided that the engagement of an audit partner shall not exceed five years, and that the particular audit partner is not re-engaged for the audit before the expiry of three years from the date of the completion of the previous term.The committee shall review and monitor the external auditor’s independence and objectivity and the effectiveness of the audit processes in accordance with applicable standards and best practices.The committee shall develop and implement a policy with the approval of the Board on the engagement of an external auditor to provide non-audit services that are permitted under the relevant statutes, regulations, requirements and guidelines. In doing so, the committee shall ensure that the provision by an external auditor of non-audit services does not impair the external auditor’s independence or objectivity. When assessing the external auditor’s independence or objectivity in relation to the provision of non-audit services, the committee shall consider: (i) whether the skills and experience of the auditor make it a suitable provider of the non-audit services; (ii) whether there are safeguards in place to ensure that there is no threat to the objectivity and/or independence in the conduct of the audit resulting from the provision of such services by the external auditor; and(iii) Whether the nature of the non-audit services, the related fee levels and the fee levels individually and in aggregate relative to the auditor, pose any threat to the objectivity and/or independence of the external auditor.
The Committee makes recommendations to the board on:• the appointment of the external auditor for audit services provided in compliance with the relevant statutes;• the implementation of the Central Bank guidelines issued to auditors from time to time;• the application of the relevant accounting standards; and• the service period, audit fee and any resignation or dismissal of the auditor
The engagement of the audit partner has not exceeded five years
The required functions are performed by the committee. Refer “Report of the Board Audit Committee” in this Annual Report
A Board approved policy on the engagement of an external auditor to provide non-audit services is in place. The committee ensures that the external auditors are able to maintain objectivity and independence and are suitable to perform the required non-audit services and theirindependence is not impaired what so ever

Risk
Man
agem
ent &
Corp
orat
e Go
vern
ance
Sust
aina
bilit
yRe
port
Man
agem
ent D
iscus
sion
and
Anal
ysis
Boa
rd o
f Dire
ctor
s &Ex
ecut
ive M
anag
emen
tHi
ghlig
hts
Fina
ncia
lIn
form
atio
n
Commercial Credit and Finance PLC Annual Report 2019/20 083
Credit Approval
f)
g)
h)
i)
j)
The committee shall, before the audit commences, discuss and finalize with the external auditors the nature and scope of the audit, including:
(i) an assessment of the finance Company’s compliance with Directions issued under the Act and the management’s internal controls over financial reporting;(ii) the preparation of financial statements in accordance with relevant accounting principles and reporting obligations; and(iii) The co-ordination between auditors where more than one auditor is involved.
The committee shall review the financial information of the finance Company, in order to monitor the integrity of the financial statements of the finance Company, its annual report, accounts and periodical reports prepared for disclosure, and the significant financial reporting judgments contained therein. In reviewing the finance Company’s annual report and accounts and periodical reports before submission to the Board, the committee shall focus particularly on:
(i) major judgmental areas; (ii) any changes in accounting policies and practices; (iii) significant adjustments arising from the audit;(iv) the going concern assumption; and(v) the compliance with relevant accounting standards and other legal requirements.
The committee shall discuss issues, problems and reservations arising from the interim and final audits, and any matters the auditor may wish to discuss including those matters that may need to be discussed in the absence of key management personnel, if necessary.
The committee shall review the external auditor’s management letter and the management’s response thereto.The committee shall take the following steps with regard to the internal audit function of the finance Company: (i) Review the adequacy of the scope, functions and resources of the internal audit department, and satisfy itself that the department has the necessary authority to carry out its work; (ii) Review the internal audit programme and results of the internal audit process and, where necessary, ensure that appropriate actions are taken on the recommendations of the internal audit department;
The committee has discussed the nature and scope of the external audit with the external auditor including the matters referred to herein
The committee reviews all Financial information published by the Company with a focus on the areas required under the direction
The committee met with external auditors twice (2) during the the financial year under review in theabsence of Key Management Personnel
The management letter and the management’s response is reviewed and oversight given to any corrective actions
The committee reviews and appraises the performance and functions of the internal audit department.
The internal audit scope and the procedures are reviewed by the BAC.Internal audit findings of audits carried out during the year were reviewed by the BAC.
The appraisal of the head of the internal audit functions is reviewed and approved by the BAC

Corporate Governance [Cont.]
Commercial Credit and Finance PLC Annual Report 2019/2020084
Credit Approval
k)
l)
m)
n)
o)
(iii) Review any appraisal or assessment of the performance of the head and senior staff members of the internal audit department;(iv) Recommend any appointment or termination of the head, senior staff members and outsourced service providers to the internal audit function; (v) Ensure that the committee is apprised of resignations of senior staff members of the internal audit department including the chief internal auditor and any outsourced service providers, and to provide an opportunity to the resigning senior staff members and outsourced service providers to submit reasons for resigning;(vi) Ensure that the internal audit function is independent of the activities it audits and that it is performed with impartiality, proficiency and due professional care;The committee shall consider the major findings of internal investigations and management’s responses thereto;The Chief Finance Officer, the Chief Internal Auditor and a representative of the External Auditors may normally attend meetings. Other Board members and the Chief Executive Officer may also attend meetings upon the invitation of the committee. However, at least once in six months, the committee shall meet with the External Auditors without the Executive Directors being present.The committee shall have: (i) explicit authority to investigate into any matter within its terms of reference; (ii) the resources which it needs to do so; (iii) full access to information; and (iv) Authority to obtain external professional advice and to invite outsiders with relevant experience to attend, if necessary.The committee shall meet regularly, with due notice of issues to be discussed and shall record its conclusions in discharging its duties and responsibilities.The Board shall, in the Annual Report, disclose in an informative way,(i) details of the activities of the audit committee;(ii) the number of audit committee meetings held in the year; and(iii) details of attendance of each individual member at such meetings.
On the recommendation of the BAC, the Board of Directors approved the Senior Manager – internal audit, to act as the head of internal audit function. Senior Manager – internal audit reports directly to the BAC and is Independent and the audits are performed with impartiality and professional due care
The committee considers the major findings of the internal audit department and the management’s responses theretoThe meetings of the committee are held as required including meeting with the external auditors without the executive directors
Two (2) meetings were held with the external auditors without the Executive Directors being present
The required authority and resources are available to the committee
There were thirteen (13) meetings held by the committee during the financial year 2019/20 and comprehensive minutes recorded. Refer the “Report of the Board Audit Committee” in this annual reportSuch information is discussed in the “Report of the Board Audit Committee” and “Corporate Governance report” in this annual report of the Company.

Risk
Man
agem
ent &
Corp
orat
e Go
vern
ance
Sust
aina
bilit
yRe
port
Man
agem
ent D
iscus
sion
and
Anal
ysis
Boa
rd o
f Dire
ctor
s &Ex
ecut
ive M
anag
emen
tHi
ghlig
hts
Fina
ncia
lIn
form
atio
n
Commercial Credit and Finance PLC Annual Report 2019/20 085
8. Integrated Risk Management Committee
Credit Approval
p)
q)
(3) a)
b)
c)
d)
e)
The secretary to the committee (who may be the Company secretary or the head of the internal audit function) shall record and keep detailed minutes of the committee meetings.The committee shall review arrangements by which employees of the finance Company may, in confidence, raise concerns about possible improprieties in financial reporting, internal control or other matters. Accordingly, the committee shall ensure that proper arrangements are in place for the fair and independent investigation of such matters and for appropriate follow-up action and to act as the key representative body for overseeing the finance Company’s relations with the external auditor.
The committee shall consist of at least one Non-Executive Director, CEO and Key Management Personnel supervising broad risk categories,i.e., credit, market, liquidity, operational and strategic risks. The committee shall work with Key Management Personnel closely and make decisions on behalf of the Board within the frame work of the authority and responsibility assigned to the committeeThe committee shall assess all risks, i.e., credit, market, liquidity, operational and strategic risks to the Finance Company on a monthly basis through appropriate risk indicators and management information. In the case of subsidiary companies and associate companies, Risk Management shall be done, both on the Finance Company basis and group basisThe committee shall review the adequacy and effectiveness of all management level committees such as the credit committee and the asset-liability committee to address specific risks and to manage those risks within quantitative and qualitative risk limits as specified by the committeeThe committee shall take prompt corrective action to mitigate the effects of specific risks in the case such risks are at levels beyond the prudent levels decided by the committee on the basis of the Finance Company’s policies and regulatory and supervisory requirementsThe committee shall meet at least quarterly to assess all aspects of Risk Management including updated business continuity plans
Detailed minutes of the meetings are maintained by the Company secretary who is the secretary to the committee
The committee has in place a procedure by which employees of the Company may raise concerns
A Board-approved whistle blower policy and a code of ethics are also in place
Refer the “Report of the Board Integrated Risk Management Committee” in this annual report of the Company
Risk sub committees such as assets and liability committee, human resource, fixed deposits and IT have been formed under the purview of IRMC to assess the risks of the Company. Company will assess the subsidiary Company risk.
The committee reviews the adequacy and effectiveness of all management level committees
Establishing specific quantitative and qualitative risk limits is in progress. Once established, the committee reviews the actual risk indicators which have gone beyond the said limits
The committee has met twelve (12) times during the financial year 2019/20.Refer the “Report of the Integrated Risk Management Committee”

Corporate Governance [Cont.]
Commercial Credit and Finance PLC Annual Report 2019/2020086
9. Related Party Transactions
Credit Approval
f)
g)
h)
(2)
(3)
The committee shall take appropriate actions against the officers responsible for failure to identify specific risks and take prompt corrective actions as recommended by the committee, and/or as directed by the Director of the Department of Supervision of Non-Banking Financial Institutions of the Central Bank of Sri LankaThe committee shall submit a risk assessment report within a week of each meeting to the Board seeking the Board’s views, concurrence and/or specific directionsThe committee shall establish a compliance function to assess the Finance Company’s compli-ance with laws, regulations, directions, rules, regulatory guidelines, internal controls and approved policies on all areas of business operations. A dedicated compliance officer selected from Key Management Personnel shall carry out the compliance function and report to the committee periodically
The Board shall take the necessary steps to avoid any conflicts of interest that may arise from any transaction of the Finance Company with any person, and particularly with the following categories of persons who shall be considered as“related parties” for the purposes of this Direction:(a) A subsidiary of the Finance Company;(b) Any associate Company of the Finance Compa-ny;(c) Director of the Finance Company;(d) A Key Management Personnel of the Finance Company;(e) A relative of a Director or a Key Management Personnel of the Finance Company;(f) A shareholder who owns shares exceeding 10% of the paid up capital of the Finance Company;(g) A concern in which a Director of the Finance Company or a relative of a Director or a shareholder who owns shares exceeding 10% of the paid up capital of the Finance Company, has substantial interestThe transactions with a related party that arecovered in this Direction shall be the following:(a)Granting accommodation,(b)Creating liabilities to the Finance Company in the form of deposits, borrowings and investments,(c)Providing financial or non-financial services to the Finance Company or obtaining those services from the Finance Company,
Specific risks are identified by relevant committees such as assets and liability, human resources, fixed deposits, Information Technology.
Minutes of the meetings or Risk assessment reports have been tabled at the Board meetings
The Committee is in the process of further strengthening the monitoring of compliance covering internal controls and approved policies on all areas of business operations through a compliance officer who has been appointed by the Company and approved by the Board of Directors.
A board approved policies and procedures in relation to related party transactions are in place.
A board approved policies and procedures in relation to related party transactions are in place

Risk
Man
agem
ent &
Corp
orat
e Go
vern
ance
Sust
aina
bilit
yRe
port
Man
agem
ent D
iscus
sion
and
Anal
ysis
Boa
rd o
f Dire
ctor
s &Ex
ecut
ive M
anag
emen
tHi
ghlig
hts
Fina
ncia
lIn
form
atio
n
Commercial Credit and Finance PLC Annual Report 2019/20 087
10. Disclosures
Credit Approval
(4)
10. (1)
a)
(d) Creating or maintaining reporting lines and information flows between the Finance Company and any related party which may lead to share proprietary, confidential orotherwise sensitive information that may give benefits to such related partyThe Board shall ensure that the Finance Company does not engage in transactions with a related party in a manner that would grant such party “more favorable treatment” than that is accorded to other similar constituents of the Finance Company. For the purpose of this paragraph, “more favorable treatment” shall mean(a) Granting of “total net accommodation” to a related party, exceeding a prudent percentage of the Finance Company’s regulatory capital, as determined by the Board. The “total net accommodation” shall be computed by deducting from the total accommodation, the cash collateral and investments made by such related party in the Finance Company’s share capital and debt instruments with a remaining maturity of 5 years or more.(b) Charging of a lower rate of interest than the Finance Company’s best lending rate or paying a rate of interest exceeding the rate paid for a comparable transaction with an unrelated comparable counter party;(c) Providing preferential treatment, such as Favorable terms, covering trade losses and/or waiving fees/commissions, that extends beyond the terms granted in the normal course of business with un related parties;(d) Providing or obtaining services to or from a related party without a proper evaluation procedure;(e) Maintaining reporting lines and information flows between the Finance Company and any related party which may lead to share proprietary, confidential or otherwise sensitive information that may give benefits to such related party, except as required for the performance of legitimate duties and functions
The Board shall ensure that:
Annual audited Financial Statements and periodical Financial Statements are prepared and published in accordance with the formats prescribed by the regulatory and supervisory authorities and applicable accounting standards
A detective monitoring system is in place at the Company where the Company extracts quarterly reports on all RPT transactions which has been verified by the compliance officer to ensure that the Company does not engage in transactions with related parties that are deemed as more favourable treatments. The monitoring mechanism will be further strengthened
The prescribed formats are used in the preparation and publication of Financial Statements

Corporate Governance [Cont.]
Commercial Credit and Finance PLC Annual Report 2019/2020088
10. Disclosures made in the Annual Report
b)
(2) a)
b)
c)
d)
e)
f)
g)
h)
Such statements are published in the newspapers in an abridged form, in Sinhala, Tamil and English
A statement to the effect that the annual auditedFinancial Statements have been prepared in line with applicable accounting standards and regulatory requirements, inclusive of specific disclosuresA report by the Board on the Finance Company’s internal control mechanism that confirms that the financial reporting system has been designed to provide a reasonable assurance regarding the reliability of financial reporting, and that the preparation of Financial Statements has been done in accordance with relevant accounting principles and regulatory requirementsThe External Auditor’s certification on theeffectiveness of the internal control mechanism inrespect of any statements prepared or publishedafter 31.03.2010Details of Directors, including names,transactions with the Finance Company
Fees/remuneration paid by the Finance Companyto the Directors in aggregate, in the AnnualReports published after 01.01.2010
Total net accommodation as defined in paragraph9(4) outstanding in respect of each categoryof related parties and the net accommodationoutstanding in respect of each category of relatedparties as a percentage of the Finance Company’scapital fundsThe aggregate values of remuneration paid by the Finance Company to its Key Management Personnel and the aggregate values of the transactions of the Finance Company with its Key Management Personnel during the financial year, set out by broad categories such as remuneration paid, accommodation granted and deposits or investments made in the Finance CompanyA report setting out details of the compliance withprudential requirements, regulations, laws andinternal controls and measures taken to rectifyany non-compliances
Annual audited financial statements and semi annual unaudited financial statements are published in the newspapers as required
Refer the “Report of the Board of Directors on the Affairs of the Company” in this annual report of the Company
Refer the “Assurance Report of External Auditors” in this annual report of the Company
Refer the “Assurance Report of External Auditors” in this annual report of the Company
Refer the “Report of the Board of Directors’ on the Affairs of the Company” and notes to the financial statements on related party transactions in this annual report of the CompanyRefer the “Report of the Board of Directors’ on the Affairs of the Company” and notes to the financial statements on related party transactions in this annual report of the CompanyAccommodations outstanding as a percentage of the Company’s capital funds;Directors: NILOther KMPs: Rs. 23.8 Mn. (0.17%)
Remuneration paid to Key Management Personnel (including Executive Directors) : Rs.319 Mn. Accommodations to Key Management Personnel (including Executive Directors) : Rs. 23.8 Mn.Deposits made by Key management Personnel (including Executive Directors : Rs. 7.2 Mn.
Refer the “Report of the Board of Directors’ on the affairs of the Company” and “Risk Management” in this annual report of the Company

Commercial Credit and Finance PLC Annual Report 2019/20 089
Credit Approval
i)
j)
A statement of the regulatory and supervisoryconcerns on lapses in the finance Company’s riskmanagement, or non-compliance with the act, andrules and directions that have been communicatedby the director of the department of supervision ofnon-banking financial institutions, if so directed by the monetary Board to be disclosed to the public, together with the measures taken by the finance Company to address such concerns
The external auditor’s certification of thecompliance with the act and rules and directionsissued by the monetary Board in the annualcorporate governance reports published after01.01.2011
In view of the non-compliances and violations with the directions issued under the finance business act no.42 of 2011, the Company has been requested to submit quarterly reports on the progress of rectification to the regulatory authority. the CBSL has not directed the Company to disclose any violations during the period.
The external auditors have carried out an agreed upon procedure engagement on corporate governance and have issued the factual findings report in this regard

Corporate Governance [Cont.]
Commercial Credit and Finance PLC Annual Report 2019/2020090
The Company’s compliance with Code of Best Practice on Corporate Governance issued jointly by the Institute ofChartered Accountants of Sri Lanka (CASL) and the Securities and Exchange Commission (SEC).
A.1
A.1.1
A.1.2
A.1.2
A.1.2
A.1.2
A.1.2
A.1.2
CASL CodeReference Corporate Governance Principle Status
A 1 THE BOARDEffective Board As at 31 March 2020 the Board of Directors comprised
of 11 members, 8 of whom including the Chairmanfunction as a Non-Executive Director. The membersof the Board of Directors consists of professionals inthe fields of banking and finance, Management andLaw and possess the skills, experience and leadershiprequired to direct, lead and control the company. TheBoard has appointed several Sub Committees to assistin the discharging of their collective responsibilities.
Regular Board Meetings Refer description given in 3.1 of compliancereport on Finance Companies Direction No.03 of 2008 on Corporate Governance of this section
Ensure formulation and implementation of asound strategy and effective systems
The Board is responsible to Stakeholdersfor creating and delivering sustainableshareholder value through management ofthe company’s business.
Appointing the Chairman and the Seniorindependent Director if relevant
The Board has appointed the Chairman of thecompany who is an independent non-executivedirector.
The CEO and Management team possessthe skills, Experience and Knowledge toimplement the strategy
The Executive Management consists of competentmembers who have skills, knowledge and experienceto carry out their respective functions effectively. TheCEO is responsible in effective implementation of thepolicies approved by the Board with the assistance ofthe Executive Management.
Effective Succession Planning for the CEOand Executive Management
Refer description given in 2.1 (j) of compliancereport on Finance Companies Direction No.03 of 2008 on Corporate Governance of thissection
Approving budgets and major capitalexpenditure
Annual budget is approved along with the strategicplan of the Company. Major capital expenditurerequires the approval of the Board.
Refer description given in 2.1 (a) and 2.1 (b) of compliancereport on Finance Companies Direction No. 03 of 2008on Corporate Governance of this section

Commercial Credit and Finance PLC Annual Report 2019/20 091
A.1.2
A.1.2
A.1.2
A.1.2
A.1.2
A.1.2
A.1.2
A.1.2
A.1.2
A.1.3
CASL CodeReference Corporate Governance Principle Status
Determining the matters expressly reservedto the Board and those delegated to themanagement including limits of the authorityand financial delegations.
Refer description given in 2.5 of compliancereport on Finance Companies Direction No.03 of 2008 on Corporate Governance of thissection
Ensuring effective systems to secure Integrityof Information, Internal Controls, BusinessContinuity and Risk management
BAC reviews internal audit reports submitted by theinternal audit department and monitors the follow upactions. Further, based on the assessment of internalcontrol over financial reporting, Directors concludethat the Company’s internal control over financialreporting is effective.
Compliance with laws, regulations and ethicalstandards
The Company has appointed a dedicated ComplianceOfficer who is a Key Management Personnel tohead the compliance function of the Company. TheCompliance Officer submits to the IRMC a report onthe compliance status of the Company on quarterlybasis.
Ensuring all Stakeholder interests areconsidered in corporate decisions
The Board of Directors consider views/impact on allStakeholders of the Company when decisions aremade at board meetings
Recognising sustainable businessdevelopment in Corporate Strategy,decisions and activities
Sustainable business development is one of the keyareas of focus considered by the Board when takingdecisions. Please refer to the Company’s sustainabilityreport on page 52 of the annual report.
Ensuring that the Company’s value andstandards are set with emphasis on adoptingappropriate accounting standards
The BAC and the Board review accounting policiesannually to ensure that the financial reporting modelof the Company is in line with such policies, financialregulations, evolving international and local accountingstandards and industry best practices.
Establishing a process of monitoringand evaluation of progress on strategyimplementation, budgets, plans and relatedrisks
The Management monitors budgets on frequencyintervals (daily/monthly/quarterly) and is reviewed bythe Board of Directors on a monthly basis.
Ensuring that a process is established forcorporate reporting on annual and quarterlybasis or more regularly as relevant to theCompany
Annual audited financial statements and quarterlyfinancial statements are prepared and publishedin accordance with the formats prescribed by thesupervisory and regulatory authorities and applicableaccounting standards.
Fulfilling such other board functions as arevital. Given the scale, nature and complexityof the business concerned
The Board is committed to fulfill its functions in linewith the laws, regulation and good governancepractices adopted by the company.
Procedure for Directors to obtainindependent professional advice at thecompany’s expense
Refer description given in 2.3 of compliancereport on Finance Companies Direction No.03 of 2008 on Corporate Governance of thissection
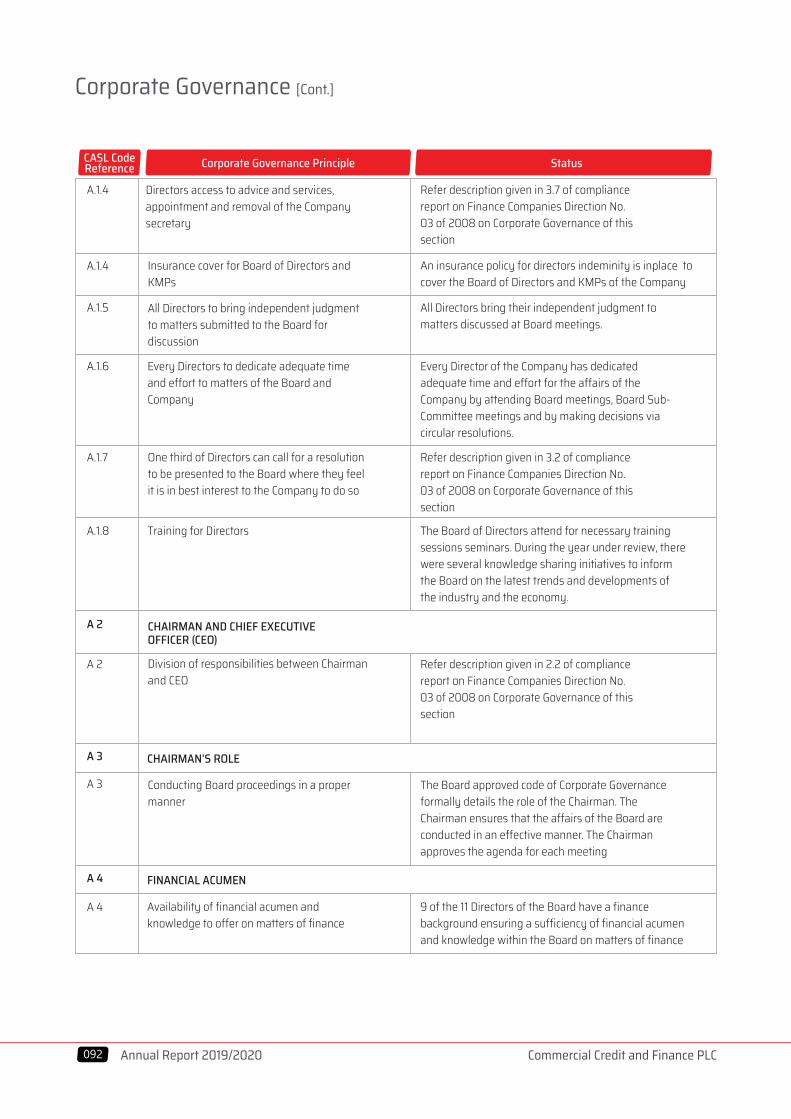
Corporate Governance [Cont.]
Commercial Credit and Finance PLC Annual Report 2019/2020092
A.1.5
A.1.6
A.1.7
A.1.8
A.1.4
A.1.4
A 2
A 2
A 3
A 4
A 3
A 4
CASL CodeReference Corporate Governance Principle Status
Directors access to advice and services,appointment and removal of the Companysecretary
Insurance cover for Board of Directors andKMPs
All Directors to bring independent judgmentto matters submitted to the Board fordiscussion
Every Directors to dedicate adequate timeand effort to matters of the Board andCompany
One third of Directors can call for a resolutionto be presented to the Board where they feelit is in best interest to the Company to do so
Training for Directors
CHAIRMAN AND CHIEF EXECUTIVEOFFICER (CEO)
Division of responsibilities between Chairmanand CEO
Refer description given in 3.7 of compliancereport on Finance Companies Direction No.03 of 2008 on Corporate Governance of thissection
An insurance policy for directors indeminity is inplace to cover the Board of Directors and KMPs of the Company
All Directors bring their independent judgment tomatters discussed at Board meetings.
Every Director of the Company has dedicatedadequate time and effort for the affairs of theCompany by attending Board meetings, Board Sub-Committee meetings and by making decisions viacircular resolutions.
Refer description given in 3.2 of compliancereport on Finance Companies Direction No.03 of 2008 on Corporate Governance of thissection
The Board of Directors attend for necessary trainingsessions seminars. During the year under review, therewere several knowledge sharing initiatives to informthe Board on the latest trends and developments ofthe industry and the economy.
Refer description given in 2.2 of compliancereport on Finance Companies Direction No.03 of 2008 on Corporate Governance of thissection
CHAIRMAN’S ROLE
Conducting Board proceedings in a propermanner
The Board approved code of Corporate Governanceformally details the role of the Chairman. TheChairman ensures that the affairs of the Board areconducted in an effective manner. The Chairmanapproves the agenda for each meeting
FINANCIAL ACUMEN
Availability of financial acumen andknowledge to offer on matters of finance
9 of the 11 Directors of the Board have a financebackground ensuring a sufficiency of financial acumenand knowledge within the Board on matters of finance

Commercial Credit and Finance PLC Annual Report 2019/20 093
A.5.3
A 5.4/A 5.5
A 5.6
A 5.7/A 5.8
A 5
A.5.1
A 5.9
A 5.10
A 6
A 7
A 6.1/A 6.2
A 7.1/A 7.2
A 7.3
CASL CodeReference Corporate Governance Principle Status
BOARD BALANCE
Non-Executive Directors of sufficient caliberand number
Independence of Non Executive Directors
Annual declaration of independence or nonindependence of Non-Executive Directors
Executives of the Company shall not beappointed as Alternate Directors of Non-Executive Directors of the Company. Anyalternate of an Independent Director shouldalso meet the criteria of independence.
Appointment of Senior Independent Director
Chairman to meet only with Non- ExecutiveDirectors as necessary and at least once eachyear.
Directors concerns regarding the matters ofthe Company, which cannot be unanimouslyresolved, they should ensure their concernsare recorded in the Board minutes cording ofa dissenting view.
Refer description given in 4.3 of compliancereport on Finance Companies Direction No.03 of 2008 on Corporate Governance of thissection
Refer description given in 4.4 of compliancereport on Finance Companies Direction No.03 of 2008 on Corporate Governance of thissection
Annual declaration have been obtained from eachNon Executive Director as to the status
Refer description given in 4.5 of compliancereport on Finance Companies Direction No.03 of 2008 on Corporate Governance of thissection
Refer description given in 7.1 of compliance report onFinance Companies Direction No. 03 of 2008 on Corporate Governance of this section
As and when needed the Chairman discusses mattersrelated to the Executive Director only in the presenceof Non-Executive Directors.
Directors’ concerns regarding matters which are notresolved unanimously are recorded in the minutes.
SUPPLY OF INFORMATIONThe Board to be provided appropriate andtimely information by management. Agenda,Board Papers and Minutes of previousmeetings to be circulated 7 days in advanceof a meeting. The minutes of the meetingshould ordinarily be provided to Directors atleast two weeks after the meeting date.
The management provides comprehensiveinformation including both quantitative and qualitativeinformation for the monthly Board meetings generally7 days prior to the Board meetings. The Directorsalso have access to management to obtain furtherinformation or clarify any concerns they may have.
APPOINTMENTS TO THE BOARD
A Nominations Committee to be establishedto make recommendations on newappointments and should annually assessBoard composition against pre-definedcriteria of skills and knowledge to ensure thatBoard appointees are fit and proper.Disclosure to Shareholders on newappointments to the Board
The Board has established a Nominations Committeeto make recommendations on new appointments tothe Board.
Disclosures made to Shareholders in terms of theListing Rules issued by the Colombo Stock Exchange(CSE).

Corporate Governance [Cont.]
Commercial Credit and Finance PLC Annual Report 2019/2020094
A 8.2
A 8.3
A 9
A 8
A 8.1
A.9.1 –A 9.4
A 10
A.11
A 10.1
A. 11.1-A.11.2
B1.1
CASL CodeReference Corporate Governance Principle Status
RE-ELECTION
Non-Executive Directors should beappointed for specified terms and reelectionshould not be automatic.
All the Directors including Chairman shouldbe subject to election by Shareholders at thefirst opportunity after their appointment, andto re-election thereafter at intervals of nomore than three years. The names of Directorssubmitted for election or three-election sholud beaccompanied by a resume minimally as set outin paragraph A.7.3 above, to enable shareholdersto make and informed desicion on their election.
Resignation of a Director prior to completionof his appointed term, the Director shouldprovide a written communication to theBoard with the reasons for resignation.
APPRAISAL OF BOARD AND COMMITTEEPERFORMANCE
The Board should have a formal process toannually appraise itself on its performanceand that of its Sub-Committees and shouldaddress any matters that may arise from suchreviews.
As per the article of the Company,1/3 of the Directorsshould retire at each AGM and be subject to reelection.
Refer description given in 4.10 of compliancereport on Finance Companies Direction No.03 of 2008 on Corporate Governance of this section
No such situation has arisen during the financial year.
The Board carried out its self-evaluation processin respect of the year ended 31st March 2020. Theprocess was led by the Chairman. All Directors wererequired to complete a detailed questionnaire. Asummary of results of the evaluation was tabled at theBoard meeting for the consideration of the Board ofDirectors.
DISCLOSURE OF INFORMATION INRESPECT OF DIRECTORS
The Annual Report of the Company shouldset out the information in relation to eachDirector.
The Annual Report contains the required informationto be disclosed in relation to the Directors.
APPRAISAL OF THE CEO
B DIRECTORS’ REMUNERATION
Setting Annual Targets and the appraisal ofperformance of the CEO
Establishment of a Remuneration Committee
The Board sets financial targets at the commencementof each financial year in consultation with CEO. TheRemuneration Committee reviews the performance ofthe CEO against the set targets.
The Board has established a Remuneration Committeeto develop a policy to determine remuneration of theDirectors
B1.2 – B1.3 Composition and disclosures related to theRemuneration Committee
The Remuneration Committee consists exclusively ofNon-Executive Directors. Please refer page 103 ofthe report of the Remuneration Committee for moredetails on the composition and activities carried outby the Committee.

Commercial Credit and Finance PLC Annual Report 2019/20 095
B1.5
C
B1.4
C 1.1
C 2
C.2.1
C.2.2 - C.2.3
C.2.4 – C.2.7
CASL CodeReference Corporate Governance Principle Status
Determination of remuneration for Non-Executive Directors
Ability to consult the Chairman and/ orCEO and to seek professional advice by theCommittee
RELATIONSHIP WITH SHAREHOLDERS
Notice of the AGM
The Remuneration Committee determines theremuneration for Non-Executive Directors.
The Remuneration Committee has access toprofessional advice from within and externalconsultants.
Notice of the AGM is circulated 15 working days inadvance with the Annual Report and Accounts.
C.1.2. Separate resolutions to be obtained forsubstantially separate issues and adoption ofAnnual Report and Accounts
Separate resolutions are obtained for substantiallyseparate matters to provide Shareholders with anopportunity to deal with each significant matterseparately.
C.1.4. Chairpersons of all Board Sub-Committees tobe available to respond to questions of anyShareholder at AGM.
The Chairman ensures that the Chairpersons of theother Board Committees are present at the AGM toanswer all queries that may be raised
C.1.5 Adequate notice of all meetings toShareholders together with the summaryof the procedure to be adopted byShareholders
The notice of meeting and related documents arecirculated to the Shareholders 15 working days prior tothe AGM.
COMMUNICATION WITHSHAREHOLDERS
Communication with Shareholders Refer description given in 2.1 (a) (d) of compliancereport on Finance Companies Direction No.03 of 2008 on Corporate Governance of this section
Disclosure of the policy and methodologyfor communication with Shareholders andimplementation.
The Company to disclose to Shareholdersthe contact person for communication withShareholders matters and process of makingall Directors aware of Shareholders majorconcerns/issues.
The Company has in place a communication policy,which sets out many channels of communication toreach all Shareholders of the Company in order todisseminate timely information.
Details of the contact personnel are provided in the“Corporate Information” section of this report. Inaddition, Shareholders are encouraged to providetheir feedback to the Chairman and/or the BoardSecretary.

Corporate Governance [Cont.]
Commercial Credit and Finance PLC Annual Report 2019/2020096
C.3.2
D.1.1
C.3
C 3.1
D.1.2.
D
D.1.3
D.1.4
D.1.5
CASL CodeReference Corporate Governance Principle Status
MAJOR AND MATERIAL TRANSACTIONS
Disclosure of major and material transactions
Disclosure requirements and Shareholderapproval by special resolution
Present an Annual Report including FinancialStatements that is true and fair, balanced andunderstandable and prepared in accordancewith the relevant laws and regulations
The Board’s responsibility to present abalanced and understandable assessmentextends to interim and other price-sensitivepublic reports and reports to regulators,as well as to information required to bepresented by statutory requirements.
During the period of 2019/20, there were no majortransactions as defined by Section 185 of theCompanies Act No 07 of 2007 which materiallyaffected the Company’s net asset base. Further,all material transactions will be disclosed in thequarterly /annual Financial Statements as well as thedisclosure made to the CSE.
The Company being a public listed Companycomplies with the disclosure requirements andShareholder approval by special resolution as requiredby the rules and regulation of the Securities ExchangeCommission and by the Colombo Stock Exchange aswell as the Companies Act and the Company’s articlesof association.
Declarations by the Directors as required by theCode of Best Practice on Corporate Governance areprovided in the ‘Report of the Board of Directors onthe Affairs of the Company’.
The Board is aware of its responsibility to presentregulatory and statutory reports in a balanced andunderstandable manner.Please refer “Statement of Directors Responsibilitiesfor Financial Reporting in this Annual Report.
ACCOUNTABILITY AND AUDIT
Declarations by the CEO, Chief FinancialOfficer (CFO) and the Board that the financialstatements comply with the appropriateaccounting standards and give a true and fairview and that the system of risk managementand internal control was operating effectively
Please refer the Chief Executive Officer’s and ChiefFinancial Officer’s Responsibility Statement on page106 and the Directors’ Statement on InternalControl Over Financial Reporting on pages 108 and 109.
Declarations by the Directors’ in theDirectors’ Report,Responsibilities of the Board for preparationof Financial Statements and reportingresponsibilities of auditors
Please refer “Report of the Board of Directors on theAffairs of the Company”Please refer, “Directors Statement of Internal ControlOver Financial Reporting”
D. 1.6. Inclusion of a “Management Discussion andAnalysis” report in the Annual Report
Please refer,” Management Discussion and Analysis”in this annual report.

Commercial Credit and Finance PLC Annual Report 2019/20 097
D.2
D.1.7
D.2.4
D.2.5
CASL CodeReference Corporate Governance Principle Status
Requirement to summon an ExtraordinaryGeneral Meeting (EGM) to notify serious lossin Net Assets and periodically reporting toShareholders of the progress and remedialactions taken
RISK MANAGEMENT AND INTERNALCONTROL
This situation has not arisen
D.1.8 Disclosure of Related Party Transactions A detailed Board approved documented process isavailable and has been circulated to all staffRefer “Related Party Transaction Review CommitteeReport” in this annual report
D.2.1 The Board should conduct an annual reviewof Risk Management and Internal Controlssystems
The Board is responsible for formulating andimplementing appropriate and adequate internalcontrol systems. The BAC has responsibility to theBoard to ensure that the system of internal controlsare sufficient and effective
D.2.3 The Company should have an internal auditfunction
Refer description given in 8.2. (a) (j) of compliancereport on Finance Companies Direction No.03 of 2008 on Corporate Governance of this section
The Board should require the AuditCommittee to carry out reviews ofthe process and effectiveness of riskmanagement and internal controls, and todocument to the Board
The BAC reviewed the internal controls andprocedures at thirteen (13) meetings held during the year
The Schedule to this Code containsguidance on the responsibilities of Directorsin maintaining a sound system of internalcontrol and the contents of the Statement ofInternal Control
Please refer “Directors’ Statement of Internal ControlOver Financial Reporting” in this annual report.

Corporate Governance [Cont.]
Commercial Credit and Finance PLC Annual Report 2019/2020098
D.3
D.3.3
D.4
CASL CodeReference Corporate Governance Principle Status
AUDIT COMMITTEED.3.1 Composition of Audit Committee The Board Audit Committee consists of three
Independent Non-Executive Directors including theChairman of the Committee.Members are selected to provide a broad set offinancial, commercial and other relevant experience tomeet the Committee’s objectives.The Chairman has relevant experience in financialreporting and control
D.3.2 Terms of reference of the Audit Committee Board approved terms of reference is in place. Thisclearly explains the purpose of the Committee, itsduties and responsibilities together with the scopeand functions of the Committee. The Committeemainly deals with matters pertaining to statutory andregulatory compliance in financial reporting, andmatters with regard to the External Auditors andInternal Audit.
Disclosures regarding Audit Committee. Please refer the Report of Board Audit Committee inthis annual report
D.4.1 Related Party and Related PartyTransactions will be as defined in LKAS 24.
Board approved related party policy which ensuresthat necessary processes are implemented by theCompany to identify, approve, monitor and discloserelated party transactions as required under• Corporate Governance Direction No. 3 of 2008 (asamended)• Section 9 of the Listing Rules of the Colombo StockExchange on Related Party Transactions.• Identification and disclosure requirements inaccordance with LKAS 24• Companies Act No 7 of 2007
RELATED PARTY TRANSACTIONS REVIEWCOMMITTEE

Commercial Credit and Finance PLC Annual Report 2019/20 099
D.5
D.4.2
D.6.1
E.
CASL CodeReference Corporate Governance Principle Status
Composition of the Related PartyTransactions Review Committee
CODE OF BUSINESS CONDUCT ANDETHICS
D 6. CORPORATE GOVERNANCEDISCLOSURES
In terms of Section 9 of the Listing Rules issuedby Colombo Stock Exchange (CSE) the Companyhas constituted a Board appointed Related PartyTransactions Review (RPTR) Committee. The RPTRCommittee consists two Independent Non-ExecutiveDirectors and one Executive Director
D.4.3 Terms of Reference of the Related PartyTransactions Review Committee
A Board approved terms of reference for Related PartyTransaction Review Committee is in place
D.5.1 Code of Conduct to be developed forDirectors and Senior Management
A Board approved ethical working framework is in place
D.5.2 Process to ensure that material and pricesensitive information is promptly identifiedand reported
The Company Secretary identify and report pricesensitive information to CSE
Disclosure of Corporate Governance Please refer Report of Corporate Governance in thisannual report
E. 1.1 Regular and structured dialogue withShareholders
All Shareholders are encouraged to participate atGeneral Meetings and cast their votes. The AGMis used as an effective channel to create a dialoguebetween the Shareholders and the Board of Directors.
E.2 Evaluating of governance disclosures Institutional investors are encouraged to give dueweight to all relevant factors in Board structure andcomposition.
F.1 Encourage the Individual Shareholders,to carry out adequate analysis or seekindependent advice for decisions makingwhen investing or divesting directly in sharesof the company.
The Annual Report contains sufficient information for apotential investor to carry out his/her own analysis.
F.2 Encourage Voting by Individual Shareholdersin General Meetings
Individual Shareholders are encouraged to participateat the Annual General Meetings of the Company andexercise their voting rights.
INSTITUTIONAL INVESTORS
F. OTHER INVESTORS

The Directors have pleasure in presenting to the shareholders the Annual Report of the Board of Directors for the Year Ended 31st March, 2020.This Report contains information required by the Companies Act No. 7 of 2007 and other information required by the Listing Rules of Colombo Stock Exchange.
Principal Activities
The principal activities of the company were acceptance of deposits and the granting of leasing facilities, hire purchase facilities, personal loans, micro loans and other credit facilities and engaging in pawning and other related services.
Changes to the Nature of Business
There were no significant changes to the principle activities of the company during the financial year ended 31st March, 2020.
Financial Statements
The Financial Statements for the year ended 31st March, 2020 are set out in this Annual Report. Auditors’ Report
The Auditors of the company Messrs. Ernst& Young, Chartered Accountants have carried out an audit on the Financial Statements prepared for the year ended 31st March, 2020 the report of which is set out in this Annual Report.
Director’s Responsibility for the Financial Statements
The Directors are responsible for preparing and presenting the Financial Statements, asset-out in this Annual Report. The Financial Statements have been prepared in conformity with the Sri Lanka Accounting Standards as laid down by the Institute of Chartered Accountants of Sri Lanka and the Companies Act No.7 of 2007.
The Directors are of the view that the Financial Statements give a true and fair view of the state of affairs of the company and of the profit for the year then ended.
Significant Accounting Policies
The significant accounting policies adopted in the preparation of the financial statements are given on pages 124 to 225The accounting policies adopted in the preparation of the Financial Statements are given in this Annual Report under Notes to the Financial Statements. The Directors consider that, in preparing these Financial Statements, suitable accounting
policies have been used which are applied consistently and supported by reasonable and prudent judgment and that all applicable accounting standards have been followed. The Financial Statements are prepared on a Going Concern basis.
Corporate Governance
A description of the Company’s Corporate Governance practices is set out in this Annual Report.
Board Of Directors
The names of the Directors as at date are indicated under Corporate Governance Page 70
The changes to the Directorate during the year under review are
: Ms.Tamara Mu-Lin Lam Paktsun (Appointed w.e.f. 13th February, 2020): Mr. Kalugamage John Cecil Perera (Retirement w.e.f. 10th March, 2020): In terms of Article 24 (2) of the Articles of Association of the Company Ms. Tamara Mu-Lin Lam Paktsun, retires and being eligible is recommended by the Board of Directors for election by the Members at the Annual General Meeting for the year 2020.: In terms of Article 24 (6) of the Articles of Association of the company Mr. Roshan Sanjaya Egodage, Director, retires by rotation and being eligible is recommended by the Board of Directors for re-election by the Members at the Annual General Meeting for the year 2020.: In terms of Article 24 (6) of the Articles of Association of the company Mrs. Geya Rasi Egodage, Director, retires by rotation and being eligible is recommended by the Board of Directors for re-election by the Members at the Annual General Meeting for the year 2020.: In terms of Article 24 (6) of the Articles of Association of the company Mr. Patrick Thomas Fisher, Director, retires by rotation and being eligible is recommended by the Board of Directors for re-election by the Members at the Annual General Meeting for the year 2020.
Commercial Credit and Finance PLC Annual Report 2019/2020100
Report of the Board of Directors on theAffairs of the Company
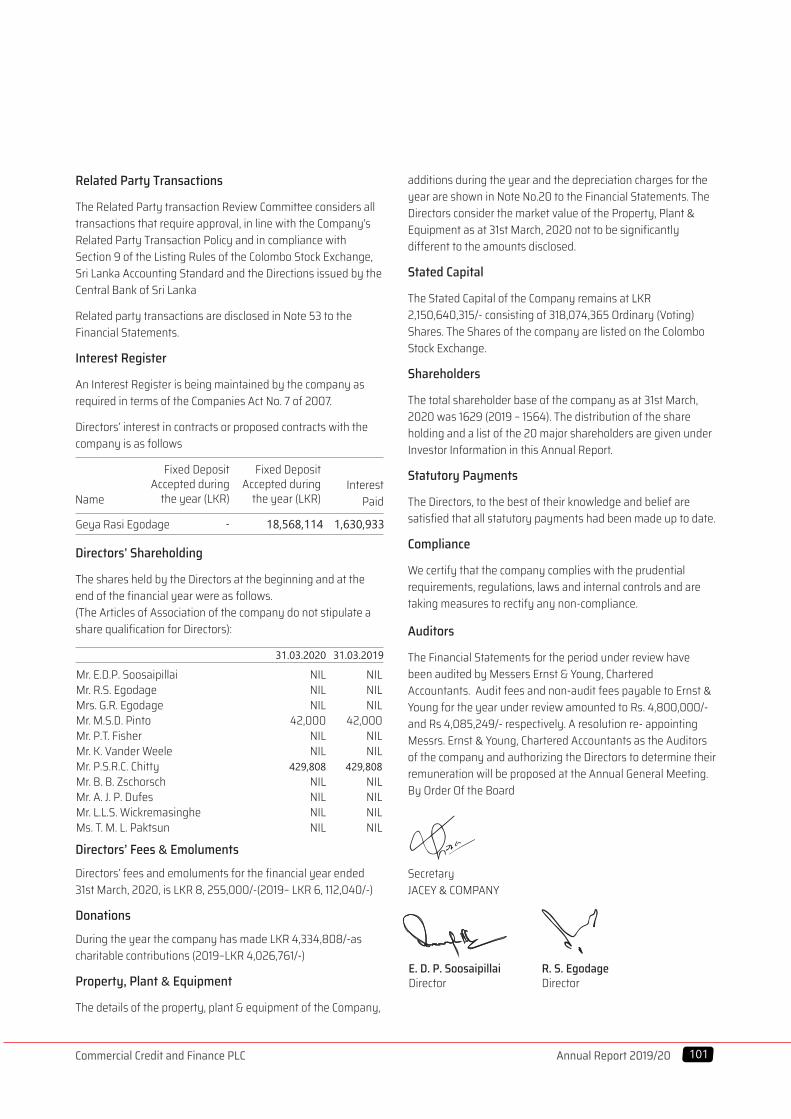
Related Party Transactions The Related Party transaction Review Committee considers all transactions that require approval, in line with the Company’s Related Party Transaction Policy and in compliance with Section 9 of the Listing Rules of the Colombo Stock Exchange, Sri Lanka Accounting Standard and the Directions issued by the Central Bank of Sri Lanka
Related party transactions are disclosed in Note 53 to the Financial Statements.
Interest Register
An Interest Register is being maintained by the company as required in terms of the Companies Act No. 7 of 2007.
Directors’ interest in contracts or proposed contracts with the company is as follows
Directors’ Shareholding
The shares held by the Directors at the beginning and at the end of the financial year were as follows. (The Articles of Association of the company do not stipulate a share qualification for Directors):
Directors’ Fees & Emoluments
Directors’ fees and emoluments for the financial year ended 31st March, 2020, is LKR 8, 255,000/-(2019– LKR 6, 112,040/-)
Donations
During the year the company has made LKR 4,334,808/-as charitable contributions (2019–LKR 4,026,761/-)
Property, Plant & Equipment
The details of the property, plant & equipment of the Company,
additions during the year and the depreciation charges for the year are shown in Note No.20 to the Financial Statements. The Directors consider the market value of the Property, Plant & Equipment as at 31st March, 2020 not to be significantly different to the amounts disclosed.
Stated Capital
The Stated Capital of the Company remains at LKR 2,150,640,315/- consisting of 318,074,365 Ordinary (Voting) Shares. The Shares of the company are listed on the Colombo Stock Exchange.
Shareholders
The total shareholder base of the company as at 31st March, 2020 was 1629 (2019 – 1564). The distribution of the shareholding and a list of the 20 major shareholders are given under Investor Information in this Annual Report. Statutory Payments
The Directors, to the best of their knowledge and belief are satisfied that all statutory payments had been made up to date.
Compliance
We certify that the company complies with the prudential requirements, regulations, laws and internal controls and are taking measures to rectify any non-compliance.
Auditors
The Financial Statements for the period under review have been audited by Messers Ernst & Young, CharteredAccountants. Audit fees and non-audit fees payable to Ernst & Young for the year under review amounted to Rs. 4,800,000/- and Rs 4,085,249/- respectively. A resolution re- appointing Messrs. Ernst & Young, Chartered Accountants as the Auditors of the company and authorizing the Directors to determine their remuneration will be proposed at the Annual General Meeting.By Order Of the Board
Secretary JACEY & COMPANY
Commercial Credit and Finance PLC Annual Report 2019/20 101
Fixed DepositAccepted during
the year (LKR)
Fixed DepositAccepted during
the year (LKR)NameInterest
Paid
Geya Rasi Egodage - 18,568,114 1,630,933
Mr. E.D.P. SoosaipillaiMr. R.S. EgodageMrs. G.R. EgodageMr. M.S.D. PintoMr. P.T. Fisher Mr. K. Vander Weele Mr. P.S.R.C. Chitty Mr. B. B. ZschorschMr. A. J. P. DufesMr. L.L.S. WickremasingheMs. T. M. L. Paktsun
NILNILNIL
42,000NILNIL
429,808NILNILNILNIL
NILNILNIL
42,000NILNIL
429,808NILNILNILNIL
31.03.2020 31.03.2019
E. D. P. SoosaipillaiDirector
R. S. EgodageDirector

Commercial Credit and Finance PLC Annual Report 2019/2020102
The Board Audit Committee comprising of four Independent Non-Executive Directors and assists the Board of Directors in fulfilling its responsibilities in relation to the oversight of the Company’s Accounting and Financial Reporting, and in ensuring that the Company’s processes related to Internal Control is adequate. The Committee also reviews the independence of External Auditors, and the scope, results and effectiveness of their engagement. The Management is responsible for the preparation, presentation and integrity of the Financial Statements of the Company, the design and implementation of Internal Controls and procedures to assure compliance with accounting standards, applicable laws, regulations and best practice.In discharging its responsibilities, the Audit Committee:
• Makes recommendations on matters connected with the appointment of the External Auditors, implementation of Central Bank’s guidelines issued to Auditors, application of relevant accounting standards and other matters connected with the Auditors of the Company such as audit fees, limitation on service period of the Audit Partner and resignation or dismissal of Auditors.
• Monitors the External Auditor’s independence and objectivity and the effectiveness of the audit process in accordance with applicable standards and best practices. The Committee is also required to discuss and agree with the External Auditors on the nature and the scope of the audit before its commencement.
• Develops and implements a policy with the approval of the Board of Directors on the engagement of an External Auditor to provide non-audit services in accordance with the applicable regulations, guidelines and best practice.
• Reviews the financial information of the Company in order to monitor the integrity of the Financial Statements and other reports issued by the Company in terms of various disclosure requirements
• Reviews the adequacy of the scope, functions, resources and authority of the Internal Audit function of the Company.
The Audit Committee had an aggregate of five members during the year, all of whom were Independent Non-Executive Directors of the Company, namely, Mr E. D. P. Soosaipillai – Chairman, Mr K. J. C. Perera, Mr M.S.D. PintoMr. L.S. Wickramasinghe and, Ms. T.M.L. Paktsun.Mr K. J. C. Perera stepped down from the committee on 15th March 2020, on completing his regulatory tenure on the board.
The Company has an Internal Audit Function that reports to the Audit Committee on matters of Internal Control. The charter of the Internal Audit Department is approved by the Board Audit Committee. The Head of Internal Audit together with his senior staff are invited to participate at Board Audit Committee Meetings together with the Company’s External Auditors,
Chief Operating Officer, Chief Financial Officer and Compliance Officer. Members of the Operational Management are also invited to participate as deemed necessary.
The Internal Audit Department presents a summary of the findings of all Internal Audits and investigations carried out to the Board Audit Committee periodically. Internal Audit findings are reviewed by the Committee and where necessary corrective action is recommended, the implementation by the manage-ment of which, is monitored by the Committee.
The Audit Committee also discusses reports of internal and external audits carried out and the findings of such reviews and advice Management where applicable to monitor and control such issues to prevent repeat findings. The Company’s quarterly and annual Financial Statements are also reviewed and discussed at these Meetings with the Management and the External Auditors prior to publication thereof. The Committee reviewed the Management Letters issued by the External Auditor, the Management responses thereto and attended to matters specifically addressed to them.
The Committee meets with the External Auditors and discusses issues arising from the audit and corrective action taken. Minutes of the Board Audit Committee Meetings are circulated to the Board of Directors and any matters arising therein are discussed at Board Meetings. Thirteen (13) Meetings of the Committee were held during the period under review and attendance of these Meetings are given on page 70 of the Annual Report.
The Board Audit Committee reviewed and discussed the Audited Financial Statements of the Company for the year ended 31 March 2020, with the Management and the External Auditors to the Company, and has recommended the same to the Board for approval for inclusion in the Company’s Annual Report.
The Committee reviews the other services provided by the External Auditor to the Company, to ensure their independence is not impaired. The Board Audit Committee has recommended to the Board of Directors that Messrs. Ernst &Young, Chartered Accountants be re-appointed as Auditors to the Company for the financial year ending 31 March 2021 subject to the approval of the Shareholders at the forthcoming Annual General Meeting.
E. D. P. SoosaipillaiChairman – Board Audit Committee
21 August 2020
Report of the Board Audit Commitee

Commercial Credit and Finance PLC Annual Report 2019/20 103
The Remuneration Committee (“Committee”) appointed by the Board, comprisesof two Independent Non-Executive Directors, Mr. M. S. D. Pinto (Chairman of the Committee) andMr. K. J. C. Perera are responsible for reviewing the performance of the Chief Executive Officer and Executive Directors and to recommend appropriate remuneration benefits and other payments within the existing approved framework.
The primary objective of the committee is to ensurethat the remuneration policy attracts, retains and motivates the executive directors and links rewards to corporate performance. In setting remuneration levels, the committee takes into consideration the market rates and practices of other quoted and industry peer companies of similar size and scope.The committee considers that it is important that significant proportion of the Executive Directors’ total remuneration package is linked to corporate performance. The minutes of the committee meetings are circulated to members of the board. The recommendations made by the committee are discussed at board meetings and the final determination based on such recommendations is made by the board of directors.
One (1) meeting of the Committee held during theperiod under review.
The aggregate remuneration paid to the Directors during the period under review is set out as a note to the financialstatements, contained in this annual report.
M. S. D PintoChairman- Remuneration Committee
15 May, 2020
Report of the Remuneration Committee

Commercial Credit and Finance PLC Annual Report 2019/2020104
Report of the Related Party Transactions Review CommitteeThe Board Related Party Transactions Review Committee (the Committee) of the Company was established by the board of directors on 22nd September 2015 in accordance with Section 9 of the listing rules of the Colombo stock exchange to ensure compliance with those rules thereby enhancing the Company’s internal control mechanisms.
Composition of The Committee
The Committee was appointed by the Board of Directors of the Company. As at 31st March2020, it comprised the following directors:
Mr. M.S.D. Pinto – Independent Non-Executive Director - ChairmanMr. P.S.R.C. Chitty – Executive Director/Chief Operating officer
PURPOSE OF THE COMMITTEE
The purpose of the Committee isto provide independent review, approval and oversight of allproposed Related Party Transac-tions.
Scope of The Committee Includes:
• To manage relationships with related parties to uphold goodgovernance and the best interests of the Company• To provide an independent review, approval and oversight ofRelated Party Transactions (except those expressly exemptedby the Charter) on terms set forth in greater detail in the Policy• To review the Charter and Policy at least annually and recommend amendments to the Charter and the Policyto the Board as and when determined to be appropriate bythe Committee• Determining whether Related Party Transactions that are to beentered into by the Company require the approval of the Boardor Shareholders of the Company• Ensuring that no Director of the Company shall participatein any discussion of a proposed Related Party Transactionfor which he or she is a related party, unless such Directoris requested to do so by the Committee for the expresspurpose of providing information concerning the Related PartyTransaction to the Committee• Ensuring that immediate market disclosures and disclosuresin the Annual Report as required by the applicable rules/regulations are made in a timely and detailed manner.
Policies and Procedures
The Company has in place a Related Party Transaction (RPT)Policy whereby the categories of persons/entities who shall beconsidered as ‘related parties’ has been identified. In accordancewith the RPT Policy, self-declarations are obtained from eachKey Management Personnel (KMP)for the purpose of identifying parties related to them.
Based on the information furnished in these declarations, theCompany has developed a system that enableto retrieve data on related party transactions throughout theCompany’s network and committee is working with the management to continuously improve such system to identify and report related party transactions.
Related Party Transactions During the Period
During the financial year,the Committee reviewed possible related party transactions andcommunicated its comments/ob-servations to the Boardof Directors. There were no non-recur-rent related party transactions that required to communicate to Colombo Stock Exchange. All the recurrent related party transactions that exceeded respective thresholds were disclosed under Note No. 53 “Related Party Transactions” in the Audited Financial Statements of this annual report.
MeetingsDuring the financial year, the committee met four (4) times.
M.S.D. PintoChairmanRelated Party Transaction Review Committee
15 May 2020

Commercial Credit and Finance PLC Annual Report 2019/20 105
Report of the Board IntegratedRisk Management CommitteeThe Board’s Integrated Risk Management Committee (IRMC) is responsible for determining the Company’s Risk Management policy and overall strategies and ensuring that procedures at Board and Management Level are in place to identify, monitor and mitigate internal and external risks to safeguard the Company’s assets and interests by clearly communicating that policy and those strategies to the Management. The Corporate Management is responsible for identifying relevant risks and notifying the IRMC who will in turn make decisions on behalf of the Board within the framework of the authority and responsibility assigned by the Board. The IRMC is made up of three Non-Executive Directors, Executive Directors, Chief Executive Officer and Members of the Corporate Management supervising broad risk categories.
During the year under review the IRMC was made up of the following:
• Mr. Lasantha Wickremasinghe Independent Non-Executive Director - Chairman (Appointed as the chairman of the committee w.e.f 10 March 2019)
• Mr. K.J.C Perera Non-Executive Director -Former Chairman (Retired w.e.f 14 March 2020)
• Mr. E.D.P. Soosaipillai Independent Non-Executive Director
• Mr. M.S.D. Pinto Independent Non-Executive Director
• Ms.Tamara Mu Lin Lam Paktsun Independent Non-Executive Director (Appointed w.e.f 13 Feb 2020)
• Mr. R.S. Egodage Executive Director/Chief Executive officer
• Mr. P.S.R.C. Chitty Executive Director / Chief Operating officer
Twelve (12) Meetings of the IRMC were held during the period under review and attendance of the Directors at these meetings is given in this Annual Report. The IRMC mainly discusses matters related to Risk Management of the Company and matters arising from minutes of the meetings of Sub Commit-tees formed under its purview (i.e Asset and Liability, Fixed Deposits, Human Resources and IT). The Board is briefed on matters discussed at IRMC Meetings. The role of the IRMC covers the following areas:
• Assess all risks, i.e, credit, market, liquidity, operational and reputational on a continuous basis through risk indicators and management information.
• Review the adequacy and effectiveness of all Management Level Committees in addressing specific risks and the management of those risks within qualitative and quantitative risk limits as required by the IRMC.
• Take prompt corrective action to mitigate the effects of
specific risks in case such risks are at a level beyond the prudent levels as viewed by the Committee.
• Assess all aspects of Risk Management including business continuity plans on a timely basis.
• Take appropriate actions against the officers responsible for failure to identify specific risks and take prompt corrective actions.
• The Board is briefed on matters discussed at the IRMC seeking the Board’s views, concurrence and specific directions.
• Assess the compliance function to ascertain the Company’s compliance with laws, regulations, directions, rules, regulatory guidelines, internal controls and approved policies on all areas of business Operations.
Mr. Lasantha WickremasingheChairman – Integrated Risk Management Committee
21 August 2020

Commercial Credit and Finance PLC Annual Report 2019/2020106
The Financial Statements of the Commercial Credit and Finance PLC (Company) and the Consolidated Financial Statements of the Company and its Group Companies (the Group) as at 31 March 2020 are prepared and presented in compliance with the following regulatory requirements:
I. Sri Lanka Accounting Standards (SLFRS/ LKAS) issued by The Institute of Chartered Accountants of Sri LankaII. Sri Lanka Accounting and Auditing Standards Act No. 15 of 1995III. Companies Act No. 07 of2007IV. Finance Business act no 42 of 2011V. Directions, circulars and guidelines issued to Licensed Finance Companies by the Central Bank of Sri LankaVI. Listing Rules of the Colombo Stock ExchangeVII. The Code of Best Practice on Corporate Governance issued jointly by The Institute of Chartered Accountants of SriLanka and the Securities and Exchange Commission of Sri Lanka (2017)
The Accounting Policies of the Company and the Group are in compliance with Sri Lanka Accounting Standards (SLFRS’s and LKAS’s) issued by The Institute of Chartered Accountants of Sri Lanka. The annual Financial Statements of the Company and the Group have been prepared based on the new accounting policies and methods.
All significant items have been disclosed and explained by way of Notes to the Financial Statements. We confirm to the best of our knowledge, that the Financial Statements presented herewith give a true and fair view of the financial position, Statement of Profit or Loss and the cash flows of the Company and the Group for the year. We also believe that the Company and the Group have adequate resources to continue its operations in the foreseeable future and accordingly adopt the going concern basis for the preparation of the Financial Statements.
Significant Accounting Policies and estimates that involve a high degree of judgment and complexity were discussed with the Board Audit Committee and the External Auditors.
The Board of Directors and the management of the Company and the Group accept responsibility for the integrity and the objectivity of the Financial Statements. The estimates and judgments relating to the Financial Statements were made on a reasonable and prudent basis; in order that the Financial Statements reflect a true and fair view; the form and the substance of transactions and that the state of affairs of the Company and the Group is reasonably presented. To ensure this, the Company and the Group have taken proper and sufficient care in implementing internal control systems, for safeguarding assets and for preventing and detecting fraud as well as other irregularities, which is reviewed, evaluated and
updated on an ongoing basis. The Internal Auditor of the Company and the Group has conducted periodic audits to provide reasonable assurance that the established policies and procedures of the Company and the Group are consistently followed. However, there are inherent limitations that should be recognized in weighing the assurance provided by any system of internal control and accounting.
The Financial Statements of the Company and the Consolidated Financial Statements of the Company and its group companies were audited by Messrs Ernst & Young, Chartered Accountants. The Report issued by them is available on page 114 to 117 of this Report. The audit and non-audit services provided by Messrs Ernst & Young are approved by the Board Audit Committee, to ensure that the provision of such services does not contravene with the guidelines issued by the Central Bank of Sri Lanka or impair Messrs Ernst & Young’s independence.
The Board Audit Committee reviews the adequacy and effectiveness of the Internal Control Systems including the effectiveness of the internal controls over financial reporting to provide reasonable assurance that all transactions are accurately and completely recorded in the books of account and the processes by which compliance with Sri Lanka Accounting Standards including SLFRS/LKAS and other regulatory provisions relating to financial reporting and disclosuresare ensured. The Board Audit Committee Report is available on page 102 to ensure complete independence, the External Auditors and the Internal Auditors have full and free access to the members of the Board Audit Committee to discuss any matter of substance.
We confirm to the best of our knowledge that• The Company and the Group have complied with all applicable laws, rules, regulations and guidelines;• There is no material non-compliance;• There is no material litigation against the Company and the Group other than those disclosed in Note 51.1 of the Financial Statements section of this Report;• All taxes, duties, levies and all statutory payments by the Company and the Group and all contributions, levies and taxes payable on behalf of and in respect of the employees of the Company and the Group as at the reporting date have been paid, or where relevant provided for.
Group Chief Executive Officer’s andGroup Chief Financial Officer’s Responsibility Statement
Janaka DeshapriyaChief Financial Officer
R.S. EgodageDirector/Chief Executive officer
21 August 2020

Commercial Credit and Finance PLC Annual Report 2019/20 107
The following statement sets out responsibility of the Directors in relation to the Financial Statements of the Company and its Subsidiary prepared in accordance with the provisions of the Companies Act No. 07 of 2007.
The responsibility of the IndependentAuditor in relation to the financial statements is set out in the report of the Auditors given on pages 114 to 117 of the Annual report.
As per the provisions of section 151, 152 (1) and (2) and 153 (1) and (2), 150 (1) of the Companies act No. 07 of 2007, the Directors are required to prepare Financial statements for each financial year, which should give a true and fair view of the state of affairs of the Company and its subsidiary as at the reporting date and its profit or loss for the financial year then ended, ensure that they are completed within six months or such extended period as may be determined by the Registrar General of Companies, certified by the person responsible for the preparation of the financial statements that it is incompliance with the said Companies Act and dated and signed on behalf of the Board by two directors of the Company.
In terms of section 166(1) read together with sections 168(1)(b) and (c) and section 167(1) of the companies act, the Directors shall cause a copy of the aforesaid Financial Statements together with the annual report of the Board of Directorsof the Company prepared as per section 166(1) of the Companies Act to be sent to every shareholder not less than fifteen working days before the date fixed for holding the Annual General Meeting.
In preparing the Financial Statements, the Directors are responsible to ensure that appropriate accounting policies have been selected and applied consistently, reasonable and prudent judgments and estimates have been made and all applicable accounting standards have been complied with.
The Directors are also required to ensurethat the Company and its Subsidiary have adequate resources to continue in operation to justify applying the going concern basis in preparing these financial statements.
Further, the Directors have a responsibility to ensure that the Companies within the Group maintains sufficient accounting records to disclose with reasonable accuracy, the financial position of the Company and subsidiary.
Financial Statements prepared and presented in this report have been prepared based on Sri Lanka Accounting standards (SLFRSs/LKASs) and are consistent with the underlying books of accounts and are in conformity with the requirements of Sri Lanka Accounting standards, companies act No. 7 of 2007, Sri Lanka Accounting and Auditing Standards Act No. 15 of 1995,
directions and guidelines issued under the Finance Business Act No. 42 of 2011 and the listing rules of the Colombo Stock Exchange.
The directors have also instituted effective and comprehensive systems of internal control for identifying, recording, evaluating and managing the significant risks faced by the Company throughout the year, which is primarily handled through the audit committee and the integrated risk management committee as set out in their reports that appear on page 102 and 105 respectively.
The directors have taken appropriate steps to ensure that the Company andits Subsidiary maintain proper books of accounts and the financial reporting system is directly reviewed by the Directors at their regular meetings and also through the Board Audit Committee.
The Board of Directors also approves the interim Financial Statements prior to their release following a review and recommendation by the Board Audit Committee.The Board of Directors accepts responsibility for the integrity and objectivity of the financial statements presented in this annual report.
The Financial Statements of the Company and the Subsidiary have been certified by the Chief Financial Officer of the Company, the officer responsible for their preparation as required by section 152(1)(b) and they have also been signed by two directors of the Company as required by section 152(1) (c) of the Companies act.
The Directors to the best of their knowledge and belief, are satisfied that all statutory payments in relation to all relevant regulatory and statutory authorities, which were due and payable by the Company and the subsidiary as at the reporting date have been paid or where relevant provided for.
The Directors are of the view that they have discharged their responsibilities as set out in this statement
By order of the Board
JACEY & CompanySecretaries
21 August 2020
Statement of Directors responsibilityfor financial reporting

In compliance with the section 10 (2) (b), of the Finance Companies direction no. 3 of 2008, as amended by Finance Companies (Corporate Governance amendment) Direction no. 6 of 2013, the Board of Directors (“Board”) present this report on internal control over financial reporting.
The Board is responsible for ensuring the adequacy and effectiveness of the system of internal control at Commercial Credit and Finance PLCs (“the Company”). Such system is designed however, to manage the Company’s key areas of risk within an acceptable risk profile and risk appetite, rather than to eliminate the risk of failure to achievethe business objectives of the Company. Consequently, the system of internal controls can only provide reasonablebut not absolute assurance against material misstatement of management and financial informa-tion and records or against financial losses or fraud.
The Board has established a continuing process for identifying, evaluating and managing significant risks faced by the company and this process includes enhancing the system of internal controls in response to changes to the Company’s enabling business environment or regulatory guidelines. The process is regularly reviewed by the Board.
The Board is of the view that the system of internal controls in place over financial reporting is sound and adequate to provide reasonable assurance regarding the reliability of financial reporting, and that the preparation of financial statements for external purposes is in accordance with applicable and relevant accounting principles and regulatory requirements.
The Management assists the Board in the implementation of the Board’s policies and procedures on risk and control by identifying and assessing the risksencountered with and in the design, operation and monitoring of suitable internal controls to mitigate these risks and their impact on the Company. The Board Audit Committee exercises this oversight role on behalf of the Board of Directors.
Key features of the processes adopted in applying and reviewing the design and effectiveness of the internal control system on financial reporting
The key metrics established in monitoring the adequacy and integrity of the system of internal controls with respect to financial reporting include the following,
• Board Sub Committees are established by the Board to assist t he Board in ensuring the effectiveness of the Company’s operational verticals in ensuring that the company’s operations are conducted in accordance with the corporate objectives, board risk appetite, stated strategies and the annual budget as well as the policies and business directions that have been approved.
• Board Sub Committees regularly develop, review and recommend to the Board the Company’s Policies and procedures covering all functional areas of the Company and recommend these to the Board for approval for adoption.
The BAC of the Company reviews internal control issues identified by the Internal Audit Function, External Auditor, Regulatory authority and the management and evaluates the adequacy of specific rectifications, detective controls and preventive controls in ensuring the underlying systemic effectiveness of the risk management and internal control systems are continually enhanced. The BAC also carries out a review of the effectiveness of the internal audit function with particular emphasis on the scope and quality of internal audits. The minutes of the BAC meetings are tabled at the meetings of the Board of Directors on a periodic basis. Further details of the activities undertaken by the BAC are set out in the “Board Audit Committee Report which appears onpage 102.
The internal audit function of the company checks for compliance with policies and procedures and theeffectiveness of the internal control systems on an ongoing basis using samples and rotational procedures and highlights significant findings in respect of any non-compliance. Audits are carried out on all departments, branches and units inaccordance with the annual audit planreviewed and approved by the BAC The frequency of audits at branches is determined by the level of risk assessed, to provide an independent and objective report. Findings of Internal Audit are submitted to the BAC for their review at their periodic meetings.
In assessing the internal control systems over the financial reporting identified officers of the Company continue to review and update all procedures and controls that are connected with significant accounts and disclosures of the Financial Statements of the Company. The Internal audit Department of the company continued to verify the suitability of design and effectiveness of these procedures and controls on an ongoing basis. The company adopts Sri Lanka Accounting Standards comprising of SLRFS’s and LKAS’s and progressive improve-ments to processes to comply with the new requirements of recognition, measurements, classification and disclosure are implemented. Financial reporting and management informa-tion processes will be further strengthened by continuous monitoring and steps are being taken to make improvements to the process where required to enhance effectiveness and efficiency. The Company adopted Sri Lanka Accounting standards SLFRS ‘16 Leases’ which become effective for financial reporting period beginning on or after 1 January 2019.
Commercial Credit and Finance PLC Annual Report 2019/2020108
Directors Statement onInternal Control over Financial Reporting

Risk
Man
agem
ent &
Corp
orat
e Go
vern
ance
Sust
aina
bilit
yRe
port
Man
agem
ent D
iscus
sion
and
Anal
ysis
Boa
rd o
f Dire
ctor
s &Ex
ecut
ive M
anag
emen
tHi
ghlig
hts
Fina
ncia
lIn
form
atio
n
Commercial Credit and Finance PLC Annual Report 2019/20 109
• The recommendations made by the external auditors in connection with the internal control system in the previous year were taken into consideration and appropriate steps have been taken to implement them where appropriate.
Confirmation
Based on the above processes, the Board confirms that the financial reporting system of the company has been designed to provide reasonable assurance regarding the reliability of financial reporting and the preparation of financial statements for external purposes and has been done in accordance with Sri Lanka Accounting Standards and regulatory requirements of the Central Bank of Sri Lanka.
Review of the statement by external auditors
The external auditors have reviewed the above Directors Statement on Internal Control over Financial Reporting for the year and reported to the Board that nothing has come to their attention that causes them to believe that the statement is inconsistent with their understanding of the process adopted by the Board in the review of the design of the effectiveness of the internal control system of the Company. Their Report on the Statement of Internal Control is given on page 110
By order of the Board,
E. D. P. SoosaipillaiChairman
R. S. EgodageDirector / Chief Executive Officer
T. M. L. PaktsunDirector / Member of Board Audit Committee
29 June 2020

Commercial Credit and Finance PLC Annual Report 2019/2020110
BW/WDPL/JMDJ
INDEPENDENT ASSURANCE REPORT
TO THE BOARD OF DIRECTORS OF COMMERCIAL CREDIT AND FINANCE PLC
Report on the Directors’ Statement on Internal Control
We were engaged by the Board of Directors of Commercial Credit & Finance PLC(“the Company”) to provide assurance on the Directors’ Statement on Internal Control over Financial Reporting (“the Statement”) included in the annual report for the year ended March 2020.
Management’s responsibility
Management is responsible for the preparation and presenta-tion of the Statement in accordance with the “Guidance for Directors of License Finance Company/ Finance Leasing Company on the Directors’ Statement on Internal Control” issued in compliance with the section 10 (2) (b) of the Finance Companies (Corporate Governance) Direction no. 3 of 2008/ section 10 (2) (b) of the Finance Leasing (Corporate Governance) Direction no. 4 of 2009, by the Institute of Chartered Accoun-tants of Sri Lanka.
Our Independence and Quality Control
We have complied with the independence and other ethical requirement of the Code of Ethics for Professional Accountants issued by the Institute of Chartered Accountants of Sri Lanka, which is founded on fundamental principles of integrity, objectivity, professional competence and due care, confidential-ity and professional behavior.
The firm applies Sri Lanka Standard on Quality Control 1 and accordingly maintains a comprehensive system of quality control including documented policies and procedures regard-ing compliance with ethical requirements, professional standards and applicable legal and regulatory requirements.
Our responsibilities and compliance with SLSAE 3051
Our responsibility is to assess whether the Statement is both supported by the documentation prepared by or for directors and appropriately reflects the process the directors have adopted in reviewing the design and effectiveness of the internal control of the Company.
We conducted our engagement in accordance with Sri Lanka Standard on Assurance Engagements (SLSAE) 3051, Assurance Report for License Finance Company/ Finance Leasing Company on Directors’ Statement on Internal Control, issued by the Institute of Chartered Accountants of Sri Lanka.
This Standard required that we plan and perform procedures to obtain limited assurance about whether Management has prepared, in all material respects, the Statement on Internal Control.
For purpose of this engagement, we are not responsible for updating or reissuing any reports, nor have we, in the course of this engagement, performed an audit or review of the financial information.
Summary of work performed
We conducted our engagement to assess whether the Statement is supported by the documentation prepared by or for directors; and appropriately reflected the process the directors have adopted in reviewing the system of internal control over financial reporting of the Company.
The procedures performed were limited primarily to inquiries of the Company personnel and the existence of documentation on a sample basis that supported the process adopted by the Board of Directors.
SLSAE 3051 does not require us to consider whether the Statement covers all risks and controls or to form an opinion on the effectiveness of the Company’s risk and control procedures. SLSAE 3051 also does not require us to consider whether the processes described to deal with material internal control aspects of any significant problems disclosed in the annual report will, in fact, remedy the problems.
The procedures selected depend on our judgment, having regard to our understanding of the nature of the Company, the event or transaction in respect of which the Statement has been prepared.
We believe that the evidence we have obtained is sufficient and appropriate to provide a basis for our conclusion.
Our conclusion
Based on the procedures performed, nothing has come to our attention that causes us to believe that the Statement included in the annual report is inconsistent with our understanding of the process the Board of Directors has adopted in the review of the design and effectiveness of internal control over financial reporting of the Company.
29 June 2020Colombo
Partners: W R H Fernando FCA FCMA R N de Saram ACA FCMA Ms. N A De Silva FCA Ms. Y A De Silva FCA W R H De Silva ACA ACMA W K B S P Fernando FCA FCMA Ms. K R M Fernando FCA ACMA Ms.L K H L Fonseka FCA A P A Gunasekara FCA FCMA A Herath FCA D K Hulangamuwa FCA FCMA LLB (Lond) H M A Jayasinghe FCA FCMA Ms. A A Ludowyke FCA FCMA Ms. G G S Manatunga FCA Ms. P V K N Sanjeewani FCA N M Sulaiman ACA ACMA B E Wijesuriya FCA FCMAPrincipals: G B Goudian ACMA A A J R Perera ACA ACMA T P M Ruberu FCCA

Let’s take the time toAppreciate one another


FinancialInformation

Commercial Credit and Finance PLC Annual Report 2019/2020114
Independent Auditor’s Report
TO THE SHAREHOLDERS OF COMMERCIAL CREDIT AND FINANCE PLCReport on the audit of the financial statementsOpinion
We have audited the financial statements of Commercial Credit and Finance PLC (“the Company”) and the consolidated financial statements of the Company and its subsidiaries (“the Group”), which comprise the statement of financial position as at 31 March 2020, and the statement of profit or loss andcomprehensive income, statement of changes in equity and statement of cash flows for the year then ended, and notes to the financial statements, including a summary of significant accounting policies.
In our opinion, the accompanying financial statements of the Company and the Group give a true and fair view of the financial position of the Company and the Group as at 31 March 2020 , and of their financial performance and cash flows for the year then ended in accordance with Sri Lanka Accounting Standards.
Basis for opinion
We conducted our audit in accordance with Sri Lanka Auditing Standards (SLAuSs). Our responsibilities under those standards are further described in the Auditor’s responsibilities for the
audit of the financial statements section of our report. We are independent of the Group in accordance with the Code of Ethics issued by CA Sri Lanka (Code of Ethics) and we have fulfilled our other ethical responsibilities in accordance with the Code of Ethics. We believe that the audit evidence we have obtained is sufficient and appropriate to provide a basis for our opinion.
Key audit matters
Key audit matters are those matters that, in our professional judgment, were of most significance in our audit of the financial statements of the current period. These matters were addressed in the context of our audit of the financial statements as a whole, and in forming our opinion thereon, and we do not provide a separate opinion on these matters. For each matter below, our description of how our audit addressed the matter is provided in that context.
We have fulfilled the responsibilities described in the Auditor’s responsibilities for the audit of the financial statements section of our report, including in relation to these matters. Accordingly, our audit included the performance of procedures designed to respond to our assessment of the risks of materialmisstatement of the financial statements. The results of our audit procedures, including the procedures performed to address the matters below, provide the basis for our audit opinion on the accompanying financial statements.
Key Audit Matter1. Allowance for impairment of loans, leases and stock out on hire including Group’s Transition to SLFRS 9We considered the impairment allowance for loans &receivables and lease rentals receivable & stock out on hire as a key audit matter. Significant judgments and assumptions were used by the management to determine the impairment allowance and complex calculations were involved in its estimation. Probable impacts of COVID -19 outbreak on the economically impacted customers and related government relief measures on the key assumptions, the higher level of estimation uncertainty involved, and materiality of the amounts reported in the Group’s financial statements, underpinned our basis for considering it as a Key Audit Matter.
As at 31 March 2020, 77% of its total assets of the Group consisted of loans & advances and receivable from lease & stock out on hire amounting to LKR. 20.7 Bn and LKR. 56 Bnrespectively (Note 10 and 11), net of impairment allowance of LKR. 18.3Bn and LKR.52.6 Bn (Note 10 and 11).
How our audit addressed the KAM
To assess the reasonableness of the allowance for impairment, our audit procedures focused on assessing the reasonability of allowance for impairment, included the following procedures;• we evaluated the design effectiveness of key internal controls over estimation of impairment for Lease, Loan and other receivable, which included assessing the level of oversight, review and approval of impairment policies by the Board Audit Committee and management.• we test-checked the underlying calculations and data used in such calculations. • in addition to the above, following focused procedures were performed:
Key audit matters common to both Group and Company

Commercial Credit and Finance PLC Annual Report 2019/20 115
Key Audit Matter
The Note 5.5.5 of the financial statements describes the basis of impairment allowance and assumptions used by the management in its calculation.
How our audi t addressed the KAM
For those individually assessed for impairment:- we assessed the main criteria used by the management for determining whether an impairment event had occurred- where impairment indicators existed, we assessed the reasonableness of management’s estimated future recoveries including the expected future cash flows, discount rates and the valuation of collateral held. - we compared the actual recoveries against previously estimated amounts of future recoveries.- we also assessed the impact of overarching economic condition in Sri Lanka and government relief package on future cash flows For those collectively assessed for impairment: - we tested the completeness of the underlying information used in the impairment calculations by agreeing details to the source documents and information in IT systems. - We also considered the reasonableness of macro-economic factors used by comparing them with publicly available data and information sources. Our considerations included assessing the appropriateness of the weightages assigned to possible economic scenarios.- we also assessed the management application of temporary practical expedients issued by CA Sri Lanka in relation to ECL computation. - we assessed the adequacy of the related financial statement disclosures as set out in note(s) 10 and 11 of the financial statements
2. Management’Assessment of probable impacts of the COVID19 Outbreak on the operation of the Group.
Management has assessed the probable impacts of COVID – 19 outbreak on the operations of the group, focusing on the cash flow projections for the period not less than 12 months as more fully disclosed in Note 49.2 to the financial statements.
The cash flow projections were based on significant manage-ment’s assumptions and estimations of future cash inflows and outflows taking into consideration of the probable impacts of COVID -19 outbreak on the economically impacted customers and probable impacts of relief measure offered by the government.
Due to the use of significant management judgments, estimates and assumptions in cash flow projections referred to above, this was considered as key audit matter.
Our procedures included among other included the following;
• We obtained the revised group forecast and discussed with the management the key changers to assumptions that had been reflected and their impact on forecast performance. • We assessed the reasonableness of the management singnifcant judgements, estimates and assumptions relating to new lending’s, collection ratio, additional funding lines, deposit renewal ratio, cost restructuring initiatives, government relief measures used in cashflow estimations.• We evaluated the sensitivity by considering different scenarios together with reasonable changes to the key assumptions.• We inspected the borrowings agreements for the Group’s interest-bearing liabilities and assessed the Group’s compliance with the covenants in understanding the availability of adequate funding lines.• We assessed the adequacy of the disclosures made in notes 49.2,49.3& 49.4 in in the financial statements in relation to the probable impacts of the COVID – 19 outbreak on the operations of the group and risk management disclosures respectively.
Risk
Man
agem
ent &
Corp
orat
e Go
vern
ance
Sust
aina
bilit
yRe
port
Man
agem
ent D
iscus
sion
and
Anal
ysis
Boa
rd o
f Dire
ctor
s &Ex
ecut
ive M
anag
emen
tHi
ghlig
hts
Fina
ncia
lIn
form
atio
n

Commercial Credit and Finance PLC Annual Report 2019/2020116
Other Information included in the 2020 Annual Report
Other information consists of the information included in the Annual Report, other than the financial statements and our auditor’s report thereon. Management is responsible for the other information.
Our opinion on the financial statements does not cover the other information and we do not express any form of assurance conclusion thereon.
In connection with our audit of the financial statements, our responsibility is to read the other information and, in doing so, consider whether the other information is materiallyinconsistent with the financial statements or our knowledge obtained in the audit or otherwise appears to be materially misstated. If, based on the work we have performed, we conclude that there is a material misstatement of this other information, we are required to report that fact. We have nothing to report in this regard
Responsibilities of the management and those charged with governance
Management is responsible for the preparation of financial statements that give a true and fair view in accordance withSri Lanka Accounting Standards, and for such internal control as management determines is necessary to enable thepreparation of financial statements that are free from material misstatement, whether due to fraud or error.
In preparing the financial statements, management is responsi-ble for assessing the Group’s ability to continue as a going concern, disclosing, as applicable, matters related to going concern and using the going concern basis of accounting unless management either intends to liquidate the Group or to cease operations, or has no realistic alternative but to do so.
Those charged with governance are responsible for overseeing the Company’s and the Group’s financial reporting process.
3. Valuation of Investment Properties
As at reporting date 31 March 2020, Investment Properties carried at fair value, amounted to LKR 1698 Mn. The fair value of such property was determined by external valuers engaged by the Group. The valuation of Investment Properties was significant to our audit due to the use of significant estimates which require significant judgement. Details of the valuation methodology and key inputs used in the valuation are disclosed in note 19 to the consolidated financial statements.
Our audit procedures focused on the valuations performed by external valuers engaged by the Group, and included the following;
• We assessed the competency, capability and objectivity of the external valuer engaged by the Group; • We read the external valuer’s report and understood the key estimates made and the approach taken by the valuers in determining the valuation of each property• Engaged our internal specialised resources to assess the reasonableness of the valuation technique, per perch price and value per square foot
We also assessed the adequacy of the disclosures made in note 19 to the financial statements relating to the valuation technique and estimates used by the external valuers.

Risk
Man
agem
ent &
Corp
orat
e Go
vern
ance
Sust
aina
bilit
yRe
port
Man
agem
ent D
iscus
sion
and
Anal
ysis
Boa
rd o
f Dire
ctor
s &Ex
ecut
ive M
anag
emen
tHi
ghlig
hts
Fina
ncia
lIn
form
atio
n
Commercial Credit and Finance PLC Annual Report 2019/20 117
Auditor’s responsibilities for the audit of the financial statements
Our objectives are to obtain reasonable assurance about whether the financial statements as a whole are free from material misstatement, whether due to fraud or error, and to issue an auditor’s report that includes our opinion. Reasonable assurance is a high level of assurance, but is not a guarantee that an audit conducted in accordance with SLAuSs will always detect a material misstatement when it exists. Misstatements can arise from fraud or error and are considered material if, individually or in the aggregate, they could reasonably be expected to influence the economic decisions of users taken on the basis of these financial statements.
As part of an audit in accordance with SLAuSs, we exercise professional judgment and maintain professional skepticism throughout the audit. We also:
• Identify and assess the risks of material misstatement of the financial statements, whether due to fraud or error, design and perform audit procedures responsive to those risks, and obtain audit evidence that is sufficient and appropriate to provide a basis for our opinion. The risk of not detecting a material misstatement resulting from fraud is higher than for one resulting from error, as fraud may involve collusion, forgery, intentional omissions, misrepresentations, or the override of internal control.
• Obtain an understanding of internal control relevant to the audit in order to design audit procedures that are appropriate in the circumstances, but not for the purpose of expressing an opinion on the effectiveness of the internal controls of the Company and the Group.
• Evaluate the appropriateness of accounting policies used and the reasonableness of accounting estimates and related disclosures made by management.
• Conclude on the appropriateness of management’s use of the going concern basis of accounting and, based on the audit evidence obtained, whether a material uncertainty exists related to events or conditions that may cast significant doubt on the Group’s ability to continue as a going concern. If we conclude that a material uncertainty exists, we are required to draw attention in our auditor’s report to the related disclosures in the financial statements or, if such disclosures areinadequate, to modify our opinion. Our conclusions are based on the audit evidence obtained up to the date of our auditor’s report. However, future events or conditions may cause the Groupto cease to continue as a going concern.
• Evaluate the overall presentation, structure and content of
the financial statements, including the disclosures, and whether the financial statements represent the underlying transactions and events in a manner that achieves fair presentation. • Obtain sufficient appropriate audit evidence regarding the financial information of the entities or business activities within the Group to express an opinion on the consolidated financial statements.
We are responsible for the direction, supervision andperformance of the group audit. We remain solely responsible for our audit opinion.
We communicate with those charged with governance regarding, among other matters, the planned scope and timing of the audit and significant audit findings, including any significant deficiencies in internal control that we identify during our audit.
We also provide those charged with governance with a statement that we have complied with ethical requirements in accordance with the Code of Ethics regarding independence, and to communicate with them all relationships and other matters that may reasonably be thought to bear on our independence, and where applicable, related safeguards.
From the matters communicated with those charged with governance, we determine those matters that were of most significance in the audit of the financial statements of the current period and are therefore the key audit matters. We describe these matters in our auditor’s report unless law or regulation precludes public disclosure about the matter or when, in extremely rare circumstances, we determine that a matter should not be communicated in our report because the adverse consequences of doing so would reasonably be expected to outweigh the public interest benefits of such communication.
Report on other legal and regulatory requirements
As required by section 163 (2) of the Companies Act No. 07 of 2007, we have obtained all the information and explanations that were required for the audit and, as far as appears from our examination, proper accounting records have been kept by the Company.
CA Sri Lanka membership number of the engagement partner responsible for signing this independent auditor’s report is 2440.
29 June 2020Colombo
Partners: W R H Fernando FCA FCMA R N de Saram ACA FCMA Ms. N A De Silva FCA Ms. Y A De Silva FCA W R H De Silva ACA ACMA W K B S P Fernando FCA FCMA Ms. K R M Fernando FCA ACMA Ms.L K H L Fonseka FCA A P A Gunasekara FCA FCMA A Herath FCA D K Hulangamuwa FCA FCMA LLB (Lond) H M A Jayasinghe FCA FCMA Ms. A A Ludowyke FCA FCMA Ms. G G S Manatunga FCA Ms. P V K N Sanjeewani FCA N M Sulaiman ACA ACMA B E Wijesuriya FCA FCMAPrincipals: G B Goudian ACMA A A J R Perera ACA ACMA T P M Ruberu FCCA

Commercial Credit and Finance PLC Annual Report 2019/20 118
Chairman Director/Chief Executive Officer
Statement of Financial PositionAs at 31st March 2020
AssetsCash and bank balancesReverse repurchase agreementsPlacements with banksFinancial assets recognised throughprofit or loss - measured at fair valueFinancial assets at amortised cost Loans and receivables Lease Rentals Receivable & Stocks out on hire Debt & other instrumentsFinancial assets at fair value throughother comprehensive incomeOther financial assetsInventoriesOther assetsInvestments in subsidiaryInvestments in associateInvestment propertyProperty, plant and equipment Right of use assetsIntangible assets & goodwillCurrent tax assetsTotal assets
Liabilities Due to banksDue to customersDebt instruments issuedOther financial liabilitiesOther liabilitiesDeferred tax liabilities Post employment benefit obligationsTotal Liabilities
Shareholders' FundsStated capitalRetained earningsReservesTotal equity attributable to equity holders of the companyNon Controlling InterestsTotal EquityTotal Liabilities and Shareholders' Funds
Commitments and Contingencies
854,570,071 3,004,279,491 3,812,279,883 2,072,291,864
18,219,942,284 43,395,382,046
114,822,765 4,310,479
743,285,925 65,910,298
173,199,518 1,599,288,321
390,000,000 1,698,461,370 3,051,877,367
649,825,707 199,319,998 311,261,563
80,360,308,948
12,661,616,855 47,394,521,877 3,349,894,465 1,753,986,571 1,319,578,082
265,361,284 298,691,827
67,043,650,962
2,150,640,315 7,570,420,764 3,595,596,907
13,316,657,986
- 13,316,657,986 80,360,308,948
297,435,063
7
89
10111213
141516171819202122
23242526272928
303132
51
1,748,596,904 3,662,522,772 3,603,184,738 2,112,157,240
23,704,115,396 37,150,447,901
187,244,522 4,310,479
630,157,553 77,133,325
322,860,475 1,599,288,321
390,000,000 1,448,351,320 3,059,953,319
- 176,116,081 234,306,485
80,110,746,831
9,241,472,974 51,908,367,338 3,011,533,608 2,162,248,713 1,239,960,092
384,558,207 175,608,858
68,123,749,792
2,150,640,315 6,612,084,610 3,224,272,114
11,986,997,039
- 11,986,997,039 80,110,746,831
964,694,781
1,208,461,539 3,141,542,623 3,826,996,141 2,228,854,997
18,377,266,075 52,689,500,344
114,822,765 67,223,703
725,285,925 65,910,298
257,986,659 -
364,203,089 1,698,461,370 3,126,825,486
672,158,910 959,881,318 336,796,145
89,862,177,386
19,214,209,118 48,948,641,777 3,349,894,465 1,987,798,983 1,462,995,410
80,761,132 321,699,082
75,365,999,968
2,150,640,315 8,636,374,058 3,701,973,390
14,488,987,763
7,189,655 14,496,177,418 89,862,177,386
297,435,063
2,340,080,214 3,787,893,629 3,513,125,045 2,116,671,777
24,000,337,936 46,081,967,198
187,244,522 63,107,921
630,157,553 77,133,325
389,870,741 -
379,914,143 1,448,351,320 3,131,138,603
- 941,044,854 54,594,333
89,142,633,114
15,027,515,792 53,936,319,168 3,011,533,608 2,546,086,231 1,398,867,679
207,060,291 189,283,759
76,316,666,528
2,150,640,315 7,356,688,195 3,312,496,424
12,819,824,934
6,141,652 12,825,966,586 89,142,633,114
964,694,781
The Board of Directors is responsible for these financial statements.
Accounting policies and notes from pages 124 to 225 form an integral part of these Financial Statements.29 June 2020 Colombo
Chief Financial Officer
2020LKR
2019LKR
2020LKR 2019
LKR
Company Group
Notes
I certify that these financial statements are in compliance with the requirements of the companies Act No. 07 of 2007.

Risk
Man
agem
ent &
Corp
orat
e Go
vern
ance
Sust
aina
bilit
yRe
port
Man
agem
ent D
iscus
sion
and
Anal
ysis
Boa
rd o
f Dire
ctor
s &Ex
ecut
ive M
anag
emen
tHi
ghlig
hts
Fina
ncia
lIn
form
atio
n
Commercial Credit and Finance PLC Annual Report 2019/20 119
19,885,681,797
17,966,128,159
(8,593,146,453)
9,372,981,706
1,267,296,634
6,929,903
(10,350,171)
600,849,246
54,828,026
11,292,535,344
(2,713,980,811)
-
8,578,554,533
(2,511,368,853)
(541,158,028)
(2,865,048,634)
2,660,979,018
(594,028,190)
(269,463,668)1,797,487,160
- 1,797,487,160
(133,588,085)
1,663,899,075
1,663,899,075
-
1,663,899,075
5.23
5.23
1.00
21,883,625,959
19,626,812,489
(8,770,625,499)
10,856,186,990
1,336,533,359
24,023,559
(35,984,919)
723,444,622
208,796,848
13,113,000,460
(2,878,363,710)
-
10,234,636,750
(3,127,611,455)
(326,295,068)
(2,949,711,222)
3,831,019,006
(767,693,905)
(221,553,566)
2,841,771,535
-
2,841,771,535
(763,092,956)
2,078,678,579
2,078,678,579
-
2,078,678,579
6.54
6.54
0.75
22,958,817,657
20,835,015,310
(9,922,872,530)
10,912,142,782
1,319,142,520
6,929,903
(10,350,171)
753,252,066
54,828,026
13,035,945,126
(3,404,582,022)
17,895,675
9,649,258,780
(2,705,526,210)
(580,608,111)
(3,180,842,243)
3,182,282,215
(676,610,427)
(304,892,097)
2,200,779,691
(15,711,053)
2,185,068,637
(178,452,933)
2,006,615,705
2,005,362,994
1,252,711
2,006,615,705
6.30
6.30
-
24,439,351,531
22,125,265,906
(9,659,742,709)
12,465,523,198
1,432,368,091
24,023,559
(35,984,919)
684,882,045
208,796,848
14,779,608,823
(3,070,193,910)
(1,512,603)
11,707,902,310
(3,406,725,185)
(356,129,159)
(3,196,148,835)
4,748,899,132
(913,235,428)
(262,719,550)
3,572,944,154
(10,085,857)
3,562,858,297
(927,272,453)
2,635,585,844
2,633,406,656
2,179,188
2,635,585,844
8.28
8.28
-
2020LKR
2019LKR
2020LKR
2019LKR
Statement of Profit Or LossAs at 31st March 2020
Company Group
Gross IncomeInterest income Interest expensesNet interest incomeFee and commission incomeNet income from Real estate salesNet (loss)/gain from tradingOther operating incomeChange in fair value of Investment propertyTotal operating incomeImpairment Charges of financial assetsNet fair value gains/(losses) from financialinstruments at fair value through profit or lossNet operating incomeOperating expensesPersonnel expensesDepreciation & amortizationOther operating expensesOperating profit before Tax on financial servicesValue added taxDebt repayment levyOperating profit after Value Added Taxon financial servicesShare of loss of associateProfit before TaxationIncome TaxationProfit for the yearProfit attributable to: Equity holders of the company Non - controlling interests
Basic earnings per shareDiluted earnings per shareDividend per share
33
33.1
33.2
34
35
36
37
19
38
39
19,20,21
40
41
41
42
43
44.1
44.2
45
Notes
Accounting policies and notes from pages 124 to 225 form an integral part of these Financial Statements.

Commercial Credit and Finance PLC Annual Report 2019/2020120
1,663,899,075
-
-
53,534,692
(14,989,714)
38,544,978
(75,984,355)
21,275,619
(54,708,736)
-
(16,163,757)
(16,163,757)
1,647,735,318
1,647,735,318
-
1,647,735,318
2,078,678,579
(19,601,987)
(19,601,987)
-
-
-
17,043,754
(4,772,251)
12,271,503
-
12,271,503
(7,330,484)
2,071,348,095
2,071,348,095
-
2,071,348,095
2,006,615,705
112,255
112,255
53,534,692
(14,989,714)
38,544,978
(79,040,628)
22,131,376
(56,789,912)
119,340
(18,244,934)
(18,132,679)
1,988,483,026
1,987,237,197
1,245,830
1,988,483,026
2,635,585,844
(18,292,527)
(18,292,527)
-
-
17,139,305
(4,799,005)
12,340,299
-
12,340,299
(5,952,227)
2,629,633,616
2,627,449,612
2,184,005
2,629,633,616
2020LKR
2019LKR
2020LKR
2019LKR
Statement of Comprehensive IncomeAs at 31st March 2020
Company Group
Profit for the yearNet gains/(losses) on remeasuring financials assets at fair value through other comprehensive incomeTotal other comprehensive income to be reclassified to Statement of profit or lossRevaluation gain on land and buildingsDeferred tax charge relating to revaluation gain on buildings
Actuarial gains/(losses) on defined benefit plansDeferred tax charge/(reversal) relating to actuarial gain on defined benefit plans
Net gains/(losses) on remeasuring financials assets at fair value through other comprehensive incomeTotal other comprehensive income not to be reclassified to Statement of profit or lossOther Comprehensive Income for the year, net of taxesTotal Comprehensive Income for the YearTotal Comprehensive income attributable to: Equity holders of the company Non- controlling interestsTotal Comprehensive Income for the year
Notes
Accounting policies and notes from pages 124 to 225 form an integral part of these Financial Statements.
29
28
29

Risk
Man
agem
ent &
Corp
orat
e Go
vern
ance
Sust
aina
bilit
yRe
port
Man
agem
ent D
iscus
sion
and
Anal
ysis
Boa
rd o
f Dire
ctor
s &Ex
ecut
ive M
anag
emen
tHi
ghlig
hts
Fina
ncia
lIn
form
atio
n
Commercial Credit and Finance PLC Annual Report 2019/20 121
Statement of Changes in EquityAs at 31st March 2020
Bala
nce
as a
t 1 A
pril 2
018
Impa
ct o
f ado
ptin
g SL
FRS
-9
Net p
rofit
for t
he y
ear
Othe
r com
preh
ensiv
e in
com
e ne
t of t
ax
Tota
l com
preh
ensiv
e in
com
e Tr
ansf
erre
d to
Sta
tuto
ry R
eser
ve
Divi
dend
pai
d Ba
lanc
e as
at 3
1 Mar
ch 2
019
Bala
nce
as a
t 1 A
pril 2
019
Net p
rofit
for t
he y
ear
Othe
r com
preh
ensiv
e in
com
e ne
t of t
ax
Tota
l com
preh
ensiv
e in
com
e Tr
ansf
erre
d to
Sta
tuto
ry R
eser
ve
Divi
dend
pai
d Ba
lanc
e as
at 3
1 Mar
ch 2
020
Stat
edCa
pita
lLK
R
Reva
luat
ion
Rese
rve
LKR
Gene
ral
Rese
rve
LKR
Reta
ined
Earn
ings LKR
Avai
labl
e fo
rSa
les R
eser
ve LKR
FVOC
IRe
serv
eLK
RTo
tal
LKR
Stat
utor
yRe
serv
eLK
RCo
mpa
nyNo
tes
Acco
untin
g po
licie
s and
not
es fr
om p
ages
124
to 2
25 fo
rm a
n in
tegr
al p
art o
f the
se F
inan
cial S
tate
men
ts.
31
31/3
2
31/3
2 45 31
31/3
2
31/3
2 45
2,15
0,64
0,31
5 -
2,15
0,64
0,31
5 -
-
-
-
-
2,15
0,64
0,31
5
2,15
0,64
0,31
5 -
-
-
-
-
2,15
0,64
0,31
5
181
,972
,474
-
181
,972
,474
-
-
-
-
-
181
,972
,474
181
,972
,474
-
38,
544,
978
38,
544,
978 -
-
220
,517
,452
58,
751,
125 -
58,
751,
125 -
-
-
-
-
58,
751,
125
58,
751,
125 -
-
-
-
-
58,
751,
125
7,28
4,65
8,28
3
(2,1
09,2
32,2
65)
5,1
75,4
26,0
18
2,07
8,67
8,57
9
12,2
71,5
03
2,0
90,9
50,0
81
(415
,735
,716
)
(238
,555
,774
)
6,6
12,0
84,6
10
6,6
12,0
84,6
10
1,6
63,8
99,0
75
(54,
708,
736)
1,6
09,1
90,3
39
(332
,779
,815
)
(318
,074
,370
)
7,5
70,4
20,7
64
2,5
74,0
74,9
57
-
2,5
74,0
74,9
57
-
-
-
415
,735
,716
-
2,9
89,8
10,6
73
2,98
9,81
0,67
3 -
-
-
332
,779
,815
-
3,3
32,5
90,4
88
13,
339,
829
(13,
339,
829) -
-
-
-
-
-
-
-
-
-
-
-
-
-
-
13,
339,
829
13,
339,
829 -
(19,
601,
987)
(19,
601,
987) -
-
(6,2
62,1
58)
(6,2
62,1
58) -
-
-
-
-
(6,2
62,1
58)
12,2
63,4
36,9
83
(2,1
09,2
32,2
65)
10,
154,
204,
718
2,0
78,6
78,5
79
(7,3
30,4
84)
2,0
71,3
48,0
95
-
(238
,555
,774
)
11,
986,
997,
039
11,
986,
997,
039
1,6
63,8
99,0
75
(16,
163,
757)
1,6
47,7
35,3
17
-
(318
,074
,370
)
13,3
16,6
57,9
86

Commercial Credit and Finance PLC Annual Report 2019/2020122
Bala
nce
as a
t 1 A
pril 2
018
Impa
ct o
f ado
ptin
g SL
FRS
-9
Net p
rofit
for t
he y
ear
Othe
r com
preh
ensiv
e in
com
e ne
t of t
axTo
tal c
ompr
ehen
sive
inco
me
Tran
sfer
red
to S
tatu
tory
Res
erve
Divi
dend
Pai
dBa
lanc
e as
at 3
1 Mar
ch 2
019
Bala
nce
as a
t 1 A
pril 2
019
Net p
rofit
for t
he y
ear
Othe
r com
preh
ensiv
e in
com
e ne
t of t
axTo
tal c
ompr
ehen
sive
inco
me
Tran
sfer
red
to S
tatu
tory
Res
erve
Effec
t of c
hang
e in
equ
ity
inte
rest
in su
bsid
iary
Divi
dend
Pai
dBa
lanc
e as
at 3
1 Mar
ch 2
020
Stat
edCa
pita
lLK
R
Reva
luat
ion
Rese
rve
LKR
Gene
ral
Rese
rve
LKR
Reta
ined
Earn
ings LKR
Avai
labl
e fo
rSa
les R
eser
ve LKR
FVOC
IRe
serv
eLK
RTo
tal
LKR
Stat
utor
yRe
serv
eLK
RGr
oup
Note
s
Acco
untin
g po
licie
s and
not
es fr
om p
ages
124
to 2
25 fo
rm a
n in
tegr
al p
art o
f the
se F
inan
cial S
tate
men
ts.
31
31/3
2
31/3
2 45 31
31/3
2
31/3
2
28/2
9 45
2,15
0,64
0,31
5
2,15
0,64
0,31
5 -
-
-
- -
2,15
0,64
0,31
5
2,15
0,64
0,31
5 -
-
-
-
- - -
2,15
0,64
0,31
5
181
,972
,474
181
,972
,474
-
-
-
- -
181,
972,
474
181,
972,
474 -
38,5
44,9
78
38,
544,
978 -
-
-
220
,517
,452
58,
751,
125
58,
751,
125 -
-
-
-
-
58,
751,
125
58,7
51,1
25
- -
-
- -
-
58,
751,
125
7,8
59,2
93,5
95
(2,4
65,9
63,3
89)
5,3
93,3
30,2
06
2,6
33,4
06,6
56
12,3
40,0
59
2,6
45,7
46,7
14
(443
,832
,952
)
(238
,555
,774
)
7,3
56,6
88,1
95
7,35
6,68
8,19
5
2,00
5,36
2,99
4
(56,
901,
561)
1,9
48,4
61,4
33
(350
,701
,199
) -
(318
,074
,370
)
8,6
36,3
74,0
59
2,6
35,2
34,4
29
2,6
35,2
34,4
29
-
-
-
443
,832
,952
-
3,0
79,0
67,3
81
3,07
9,06
7,38
1 -
-
-
350
,701
,199
-
-
3,4
29,7
68,5
80
12,
505,
786
(12,
505,
786) -
-
-
-
-
-
- -
- -
-
-
-
-
-
-
11,
002,
546
11,
002,
546 -
(18,
297,
103)
(18,
297,
103) -
-
(7,2
94,5
57)
(7,2
94,5
57) -
230,
785
230
,785
-
- -
(7,0
63,7
72)
Non
Cont
rollin
g In
tere
stLK
R
5,4
07,5
10
(1,2
52,0
36)
4,1
55,4
74
2,1
79,1
88
4,81
7
2,1
84,0
05
-
(197
,827
)
6,1
41,6
52
6,14
1,65
2
1,2
52,7
11
(6,8
81)
1,2
45,8
30
- -
(197
,827
)
7,1
89,6
55
12,
903,
805,
235
(2,4
68,7
18,6
65)
10,
435,
086,
570
2,6
35,5
85,8
44
(5,9
52,2
26)
2,6
29,6
33,6
16
-
(238
,753
,601
)
12,
825,
966,
586
12,8
25,9
66,5
86
2,0
06,6
15,7
05
(18,
132,
678)
1,9
88,4
83,0
26
- -
(318
,272
,197
)
14,
496,
177,
418
Statement of Changes in EquityAs at 31st March 2020

Risk
Man
agem
ent &
Corp
orat
e Go
vern
ance
Sust
aina
bilit
yRe
port
Man
agem
ent D
iscus
sion
and
Anal
ysis
Boa
rd o
f Dire
ctor
s &Ex
ecut
ive M
anag
emen
tHi
ghlig
hts
Fina
ncia
lIn
form
atio
n
Cash Flow StatementAs at 31st March 2020
2020LKRCash flows from / (used in) operating activities
2019LKR
2020LKR
2019LKR
Company Group
Notes
Accounting policies and notes from pages 124 to 225 form an integral part of these Financial Statements.
Profit before Income Tax Expense Adjustments for Depreciation and amortisationAmortisation of Leasehold propertyAmortisation of Right of use assetsProfit on disposal of property, plant & equipmentsShare of loss of associateImpairment charge of loans and advances, lease,hire purchasePawning auction gainNet fair value adjustment of Investment propertyDisposal gain on Investment propertyFair value gain on compensation receivableNet foreign exchange lossAmortisation of prepaid debenture issue costProvision for defined benefit plansOperating profit before working capital changes Decrease in InventoriesDecrease in Loans and AdvancesIncrease in Lease Rentals Receivable & Stock out on hire(Increase)/Decrease in Other Financial Assets(Increase)/Decrease in Debt & other instruments(Increase)/Decrease in Other Assets(Increase)/Decrease in Placements and Reverse repurchase agreementsDecrease in Amounts Due to Customers(Decrease) in Other Financial LiabilitiesIncrease/(Decrease) in Other LiabilitiesCash generated from Operations Post employment benefit obligationTaxes paidNet cash flows (used in)/from Operating activities Cash flows from / (used in) Investing activities Acquisition of Investment PropertyDisposal Proceeds from Investment PropertyAcquisition of Property, plant and equipmentsInvestments in associate Net investment in placements with banks Acquisition of Intangible assetsNet investment in Financial assets recognised through profit or loss - measured at fair valueFinancial assets at fair value through other comprehensive incomeNet cash flows used in Investing activities Cash flows from / (used in) Financing activities Net cash flow from/(used in) Debt Instruments issuedProceeds from Loans obtainedLease PaymentsRepayment of Bank LoansDividend paidNet cash flows from Financing activities Net increase in Cash and Cash equivalents Net foreign exchange difference Cash and Cash equivalents at the beginning of the year Cash and Cash equivalents at the end of the year Cash and Cash Equivalents For the Purpose of Cash Flow Statement Cash in HandReverse repurchase agreements (less than three months)Placements with Banks (less than three months)Bank OverdraftsTotal Cash and Cash Equivalents For the Purpose of Cash Flow Statement
19/20/21
21
4238
191913
2528
28
19
20
22
23
2345
7
23
Commercial Credit and Finance PLC Annual Report 2019/20 123
1,797,487,160
363,049,427 -
249,488,768 - -
2,713,980,811 (44,937,034) (54,828,026)
(289,505) (23,678,810)
- 18,643,202 65,625,989
5,131,899,602 11,223,026
4,730,513,182 (8,131,406,868)
(157,913,749) 72,421,757
149,660,958 (1,160,131,423) (4,513,845,460)
(408,262,142) (715,444,717)
(4,991,285,835) 57,456,980
(329,740,086) (5,263,568,941)
(229,784,208) 34,502,183
(332,724,988) -
(445,495,339) (45,452,403)
39,865,376
(23,678,810) (1,002,768,189)
319,717,655 11,124,762,433
(106,881,206) (7,453,620,652)
(315,444,932) 3,568,533,298
(2,697,803,832) -
6,521,496,140 3,823,692,308
854,570,071 1,844,148,068 1,381,723,890 (256,749,719) 3,823,692,308
2,841,771,535
326,049,458 122,805
1,752,000 -
2,878,363,710 -
(208,796,848) (1,628,500)
(23,678,810) (8,274,727) 61,799,566 61,438,143
5,928,918,331 51,194,237
8,284,111,810 (8,048,412,865)
106,236,228 (187,244,522) (72,291,895)
1,386,407,526 (2,315,717,645)
(237,309,754) 717,726,973
5,613,618,425 (41,662,945)
(1,207,935,913) 4,364,019,567
745,505,522 -
(1,622,244,105) (390,000,000)
(1,503,752,320) (9,688,420)
534,702,423 178,200,000
(2,067,276,901)
(22,487,668) 12,594,101,385
- (12,068,502,835)
(236,644,997) 266,465,885
2,563,208,551 8,274,727
3,950,012,861 6,521,496,139
1,748,596,904 3,662,522,771 1,618,124,084 (507,747,620) 6,521,496,139
2,185,068,637
1,252,767,021 -
259,350,410 -
15,711,053 3,404,582,022
(44,937,034) (54,828,026)
(289,505) (23,678,810)
- 18,643,202 72,459,570
7,132,206,161 11,223,026
4,878,223,155 (9,195,585,051)
(163,592,560) 72,421,757
131,884,081 (1,297,394,555) (4,987,677,391)
(558,287,248) (742,737,478)
(4,719,316,103)59,955,753
(586,953,905) (5,246,314,255)
(229,784,208) 34,502,183
(1,226,205,418) -
(550,271,289) (41,084,948)
(112,183,220)
(4,115,782) (2,129,142,682)
319,717,655 14,915,570,800
(126,554,883) (10,332,477,494)
(316,163,593) 4,460,092,485
(2,915,364,453) -
7,092,948,228 4,177,583,775
1,208,461,539 1,844,148,068 1,381,723,890 (256,749,719) 4,177,583,775
3,562,858,297
356,006,354 122,805
1,752,000 10,085,857
3,070,193,910 -
(208,796,848) (1,628,500)
(23,678,810) (8,274,727) 61,799,566 65,155,629
6,885,595,533 51,194,237
8,562,097,557 (10,986,611,923)
106,236,228 (187,244,522) (82,324,709)
1,386,407,526 (1,922,407,917)
(493,747,426) 863,060,472
4,182,255,059 (42,267,394)
(1,451,749,034) 2,688,238,631
745,505,522 -
(1,676,801,726) (390,000,000)
(1,400,070,657) (17,577,950)
530,187,886 182,598,638
(2,026,158,287)
(22,487,668) 18,192,821,806
- (15,068,838,325)
(236,644,997) 2,864,850,816 3,526,931,159
8,274,727 3,557,742,340 7,092,948,226
2,340,080,214 3,787,893,629 1,618,124,084 (653,149,700) 7,092,948,226

Commercial Credit and Finance PLC Annual Report 2019/2020124
Notes to the Financial StatementsAs at 31st March 2020
1. CORPORATE INFORMATION
1.1 General Commercial Credit and Finance PLC (“Company”)is a Limited Liability Company incorporated in Sri Lanka on 4 October 1982 under the Companies Act no 17 of 1982 and domiciled in Sri Lanka. It is a Licensed Finance Company registered under the Finance Business Act No. 42 of 2011. The Company was re-registered with the Registrar General of Companies as per the requirements of the Companies Act No.7 of 2007(Companies Act) on 8 April 2008. The registered office of the Company and the principal place of business is located at No.106, Yatinuwara Veediya, Kandy. The shares of the company have a primary listing on the Colombo Stock Exchange (CSE).
1.2 Principal Activities and Nature of OperationsCompanyDuring the year, the principal activities of the Company were acceptance of deposits, granting lease facilities, hire purchase, term loans, personal loans, micro loans,pawning and other credit facilities, real estate development and related services.
SubsidiaryTrade Finance & Investments PLCDuring the year, the principal activities of the Trade Finance & Investment PLC were providing finance leases, hire purchase assets financing, granting of loans, mobilisation of deposits, pawning & other financial services. Company holds 99.65% (2019- 99.65%) of the equity of Trade Finance & Investment PLC.
Associate
TVS Lanka (Pvt) LtdThe principle activity of TVS Lanka (Pvt) Ltd. during the year was importation and sale of two wheelers and spare parts.
1.3 Parent Enterprise and Ultimate Parent EnterpriseThe Company’s immediate parent is BG Investment (Private) Limited. In the opinion of the directors, the Company’s ultimate parent entity is BG Capital (Private) Limited, which isincorporated in Sri Lanka while Mr. R.S. Egodage is the Company’s ultimate controlling party.
1.4 Approval of financial statements by DirectorsThe Financial Statements of Commercial Credit and Finance PLC for the year ended 31 March 2020 was authorized for issue by the Board of Directors on 29 June 2020.
1.5 Responsibility for Financial Statements The Board of Directors of the company is responsible for these Financial Statements of the Group and the Company as per the provisions of the Companies Act No.07 of 2007 and the Sri Lanka Accounting Standards.
2. BASIS OF PREPARATION
2.1 Statement of complianceThe consolidated financial statements of the group and separate financial statements of the company have been prepared and presented in accordance with Sri LankaAccounting Standards (SLFRSs and LKAS), laid down by the Institute of Chartered Accountants of Sri Lanka and incompliance with the requirements of the Companies Act no. 07 of 2007, the finance business act no 42 of 2011.
These Financial Statements include the following components. • A Statement of Profit or Loss and Statement ofComprehensive Income providing the information of the financial performance of the Company and the Group for the year under review.• A Statement of Financial Position providing the information on the financial position of the Company and the Group as at the year end.• A Statement of Changes in Equity depicting all changes in shareholder’s equity during the year under review of the Company and the Group• A Statement of Cash Flows providing the information to the users, on the ability of the Company and Group to generate cash and cash equivalents and the needs of entity to utilize those cash flows• Notes to the Financial Statements comprising accounting policies & other explanatory information 2.2 Basis of MeasurementThe Financial Statements of the Group and the Company have been prepared on a historical cost basis, except for the following items stated in the Statement of FinancialPosition which have been measured at fair value.• Financial assets recognized through Profit or Loss (FVPL)• Financial investments – Held for trading• Financial assets held at fair value through other comprehensive income (FVOCI)• Investment Property• Financial investments – Available for Sale• Freehold Land & Buildings classified as Property, Plant & Equipment• Defined Benefit Obligation

Risk
Man
agem
ent &
Corp
orat
e Go
vern
ance
Sust
aina
bilit
yRe
port
Man
agem
ent D
iscus
sion
and
Anal
ysis
Boa
rd o
f Dire
ctor
s &Ex
ecut
ive M
anag
emen
tHi
ghlig
hts
Fina
ncia
lIn
form
atio
n
Commercial Credit and Finance PLC Annual Report 2019/20 125
2.3 Functional and presentation currencyThe Financial Statements of the Group and the Company have been prepared in Sri Lanka Rupees (LKR), except when otherwise indicated.
2.4 Comparative InformationThe comparative information is re-classified wherever neces-sary to conform to the current year’s presentation.
2.5 Presentation of Financial StatementsThe assets and liabilities of the Group and the Company presented in the Statement of Financial Position are grouped by nature and listed in order that reflects their relative liquidity and maturity pattern. No adjustments have been made for inflationary factors affecting the financial statements.
An analysis on recovery or settlement within 12 months after the reporting date (current) and more than 12 months after the reporting date (non-current) is presented in Note 50 (Current & Non-Current analysis of Assets & Liabilities). 2.6 Materiality & AggregationIn compliance with Sri Lanka Accounting Standards - LKAS 01 on “Presentation of Financial Statements”, each material class of similar items are presented separately in these Financial Statements. Items of dissimilar nature or functions are presented separately unless they are immaterial.
Financial assets and financial liabilities are offset and the net amount reported in the Statements of Financial Position of the Company and Group only when there is a legally enforceable right to offset the recognised amounts and there is an intention to settle on a net basis, or to realize the assets and settle the liability simultaneously. Income and expenses are not offset in the Statement of Profit or Loss of the Company and Group unless required or permitted by any accounting standard or interpretation thereon.
2.7 The Impact on COVID 19The outbreak of the COVID - 19 globally since January 2020 caused massive economic disruption leading to uncertainty in the whole world. Sri Lanka as a country was exposed to this risk in March 2020 and as an immediate precautionary measure the Government imposed an island wide curfew. Since no access to office was feasible the group immediately planned to "work from home' and facilitated key management personnel and other personnel to work from home. To ensure the timely payment of Fixed Deposit Interest, the management sought assistance from the group’s bankers and provided anuninterrupted service during the period of curfew.
Liquidity was a major concern for many of the small and medium scale companies and daily monitoring of cash flow
requirement was immediately started. All possible cost reduction measures were initiated to secure available liquid assets. The group temporarily halted the new lending and focused on recovery of rentals. The Recovery staff as well as the Marketing staff were assigned with a recovery target to ensure a smooth inflow of cash flows.
Meantime the Central bank of Sri Lanka issued circular No.04 and 05 of 2020 on debt moratorium which caused direct impact on rental collection of the Group. The Company established procedures to ensure all moratorium requests are properly collected and attended individually to ensure the Covid – 19 impacted customers are given the required relief. A separate communication channel via mail was established and a team was set up to support the customers to send the requests. The impact of the moratorium on the company’s key performance matrix is unknown at this stage.
The Company has assessed the probable impact stemming from Covid – 19 outbreak and the key assessments are listed below.
• Based on the available information and management’s best judgement, it is determined the appropriateness of the Going concern assumptions in preparing Financial Statements for the year ended 31 March 2020.• Despite the challenging environment of having difficulties in collecting the company dues and the difficulties in getting funding lines from banks and other financial institutions, the Company was able to maintain a stable liquidity position and safeguard the interest of the stakeholders.• The unutilized Overdraft facilities, the available excess investment and already negotiated funding lines were used as a cushion to absorb any sudden liquidity shocks.• A more prudent cost control mechanism was in place which ensured an effective cost structure in the Company.
There is a considerable degree of judgement involved in making the above assessments. The underline assumptions are also subject to certain level of uncertainty and are beyond the control of the Company. Hence the actual economic conditions are likely to be different from the anticipated events. The effect of those differences may have significant impact on accounting judgements and estimates included in these Financial Statements.

Commercial Credit and Finance PLC Annual Report 2019/2020126
The Management evaluated the key assumptions used in the above estimates and judgements under probable stress scenarios such as, retention ratio of Fixed Deposits, Ratio of Rental Collection and Re-imposing of CBSL liquid asset requirement.
After evaluating the above, and after due consideration of the range and likelihood of outcomes, the Management is satisfied that the Company has adequate resources to continue in operational existence for the foreseeable future and continue to adopt the going concern basis in preparing and presenting these financial statements.
3.SIGNIFICANT ACCOUNTING JUDGEMENT, ESTIMATES AND ASSUMPTIONSThe preparation of Financial Statements of the group in conformity with Sri Lanka Accounting Standards requires the Management to make judgements, estimates and assumptions that affect the application of accounting policies and the reported amounts of assets, liabilities, income and expenses. Further, Management is also required to consider keyassumptions concerning the future and other key sources of estimation uncertainty at the reporting date that havesignificant risk of causing a material adjustment to the carrying amounts of assets and liabilities within the next financial year. Actual results may differ from these estimates.
Accounting judgements, estimates and underlyingassumptions are reviewed on an ongoing basis. Revision to accounting estimates are recognised prospectively.
The key significant accounting judgements, estimates and assumptions involving uncertainty are discussed below, whereas the respective carrying amounts of such assets and liabilities are as given in respective notes.
3.1 Going ConcernThe Directors have made and assessment of the group’s ability to continue as a going concern and are satisfied that it has the resources to continue in business for a foreseeable future. Furthermore the Board is not aware of any material uncertain-ties that may cast significant doubt upon the Group’s ability to continue as a going concern. Therefore, the Financial Statements continue to be prepared on the going concern basis.
3.2 Impairment Losses on Lease Receivable, Hire Purchase Receivable and Loans and Advances to Customers The measurement of impairment losses under SLFRS 9 across all categories of financial assets requires judgement. These estimatesare driven by a number of factors, changes in which can result in different levels of allowances.
The group reviews its individually significant Leases, Hire Purchase, Loans and Advances at each reporting date to assess whether an impairment loss should be recorded in the Statement of Profit or Loss. In particular, management judgement is required in the estimation of the amount and timing of future cash flow when determining the impairment loss. These estimates are based on assumptions about a number of factors and actual results may differ from the estimate, resulting in future changes to the allowance.
Leases, Hire Purchase, Loans and Advances that have been assessed individually and found not to be impaired and all insignificant Leases, Hire Purchase, Loans and Advances are then assessed collectively, by categorising them in to groups of assets with similar risk characteristics, to determine the expected credit loss on such loans and advances.
The collective assessment take account of data from the Leases, Hire Purchase, Loans and Advances portfolio (such as level of arrears, characteristics of assets, etc.) and judgements on the effect of concentration of risk and economic data (including levels of unemployment, inflation and interest rate).
In addition to the above, The Expected Credit Loss (ECL) under SLFRS 9 requires management to make additional judgements and estimates with regard to the following,
• The Group’s criteria for assessing if there has been a significant increase in credit and so impairment for financial assets should be measured on a Long Term Expected Credit Loss (LTECL) basis.• Development of ECL models, including various formulas and the choice of inputs• Selection of forward-looking macroeconomic scenarios and their probability weightings, to derive the economic inputs into the ECL model
It has been the Group’s policy to regularly review its models in the context of actual loss experience and adjust when neces-sary. The above assumptions and judgments are discussed in detail in Note 5.5.5 of the Financial Statements.
Certain accounting estimates and assumptions relating to impairment applied by the subsidiary of the company differ from those applied by the company due to the differing risk management practices of the subsidiary.
Notes to the Financial Statements [Cont.]As at 31st March 2020

Risk
Man
agem
ent &
Corp
orat
e Go
vern
ance
Sust
aina
bilit
yRe
port
Man
agem
ent D
iscus
sion
and
Anal
ysis
Boa
rd o
f Dire
ctor
s &Ex
ecut
ive M
anag
emen
tHi
ghlig
hts
Fina
ncia
lIn
form
atio
n
Commercial Credit and Finance PLC Annual Report 2019/20 127
3.3 Impairment of other financial assets The Group reviews its debt securities classified as FVOCI/amortised cost, at each reporting date to assess whether they are impaired. Objective evidence that a debt security held at FVOCI/amortised cost is impaired includes among other things significant financial difficulty of the issuer, a breach of contract such asa default or delinquency in interest or principal payments etc.
3.4 Impairment of Investments in SubsidiaryThe group follow the guidance of Sri Lanka Accounting Standard (LKAS 36) - “Impairment of Assets” and Sri Lanka Accounting Standard (LKAS 39) - “Financial instruments Recognition and Measurement” in determining whether an investment or a financial asset is impaired. This determination requires significant judgment.
The group evaluate, among other factors, the duration and extent to which the fair value of an investment or a financial asset is less than its cost and the financial health of the near-term business outlook for the investment or a financial asset, including factors such as industry and sectorperformance, changes in technology and operational and financing cash flows.
3.5 Impairment of GoodwillThe Group estimates the value in use of the Cash-Generating Units (CGU) to which goodwill has been allocated in order to determine whether goodwill is impaired. The value-in use calculation requires the entity to estimate the future cash flows expected to arise from the CGU and a suitable discount rate in order to calculate present value. (Refer Note 22).
3.6 Taxation including Deferred Tax AssetsThe Group is subject to Income taxes and other taxes including VAT on financial services. Uncertainty exists, with respect to the interpretation of the applicability of tax laws, at the time of the preparation of these financial statements.
3.7 Fair Value of Property Plant and EquipmentThe freehold land and buildings of the group are reflected at fair value at the date of revaluation less any accumulateddepreciation and impairment losses. The group engages independent valuation specialists to determine fair value of freehold land and buildings, including the methods of valuation are given in note 20 to the financial statements.
3.8 Useful lifetime of Property Plant and EquipmentThe group reviews the residual values, useful lives and methods of depreciation of property, plant and equipment at each reporting date. Judgement of the management is exercised in the estimation of these values, rates, methods and hence they are subject to uncertainty.
3.9 Classification of Investment PropertiesManagement requires using its judgment to determine whether a property qualifies as an investment property. The group has developed criteria so it can exercise its judgment consistently. A property that is held to earn rentals or for capital appreciation or both and which generates cash flows largely independently of the other assets held by the group are accounted for as investment properties. On the other hand, a property that is used for operations or in the process of providing services or for administrative purposes and which do not directly generate cash flows as a stand alone asset are accounted for as property, plant and equipment. The group assesses on an annual basis the accounting classification of its properties taking into consideration the current use of such properties. (Refer Note 19)
3.10 Fair value of Investment PropertiesThe group carries its Investment Properties at fair value, with changes in fair values being recognised in the Statement of Profit or Loss. The group engaged an independent valuer to determine the fair value as at 31 March 2020.
The best evidence of fair value is usually the current price in an active market for similar lease and other contracts. In the absence of such information, the group determines the amount within a range of reasonable fair value estimates. In making such estimates, the group considers information from a variety of sources including:
• Current prices in an active market for properties of different nature, condition or location (or subject to different lease or other contracts), adjusted to reflect those differences;• Recent prices of similar properties in less active markets, with adjustments to reflect any changes in economic conditions since the date of the transactions that occurred at those prices; and• Discounted cash flow projections based on reliable estimates of future cash flows, derived from the terms of any existing lease and other contracts and (where possible) from external evidence such as current market rents for similar properties in the same location and condition, and using capitalization rates that reflect current market assessments of the returns and yields, an uncertainty in the amount and timing of the cash flows.

Notes to the Financial Statements [Cont.]As at 31st March 2020
Commercial Credit and Finance PLC Annual Report 2019/2020128
3.11 Principal assumptions for management’s estimation of fair valueIf information on current or recent prices of assumptions underlying the discounted cash flow approach of Investment Properties is not available, the fair values of Investment Properties are determined using discounted cash flow valuation techniques. The Group uses assumptions that are mainly based on market conditions existing at each reporting date.
The principal assumptions underlying management’s estimation of fair value are those related to: the future rentals, maintenance requirements, and appropriate capitalization rates / yields and voids. These valuations are regularly compared to actual market yield data and actual transactions by the group and those reported by the market.
3.12 Fair value of financial instrumentsWhere the fair values of financial assets and financial liabilities recorded on the statement of financial position cannot be derived from active markets, they are determining using a variety of valuation techniques that include the use ofmathematical models. The inputs of these models are derived from observable market data where possible, but if this is not available, judgements such as discount rates, default rate assumptions, etc. is required to establish fair values.The valuation of financial instruments is described in more in Note 48 to these financial statements.
The Group measures fair value using the fair value hierarchy that reflects the significance of input used in making measure-ments.
3.13 Defined Benefit PlansThe cost of the defined benefit plans and the present value of their obligations are determined using actuarial valuations. The actuarial valuation involves making assumptions about discount rates, future salary increases, mortality rates and possible future pension increases if any. Due to the long term nature of these plans, such estimates are subject to significant uncertainity. All assumptions are reviewed at each reporting date.
In determining the appropriate discount rate, management considers the interest rates of Sri Lanka government bonds with maturities corresponding to the expected duration of the defined benefit obligations. The mortality rate is based on publicly available mortality tables. Future salary increases and pension increases are based on expected future inflation rate and expected future salary increase rates of the group.
3.14 Right-of-Use Assets and Operating Lease LiabilityThe Group uses its judgment to determine whether an operating lease contract qualifies for recognition of right-of-use assets. The Group applies judgements in evaluating whether it is reasonably certain whether or not to exercise the option to
renew or terminate the lease. That is, it considers all relevant factors that create economic benefits for it to exercise either the renewal or termination. Further, the Group can not readily determine the interest rate implicit in the lease. Therefore, it uses its incremental borrowing rate to measure operating lease liability. The incremental borrowing rate is the rate of interest that the Group would have to pay to borrow over a similar term and with similar security, the funds necessary to obtain an asset of a similar value to the right-of-use asset in similar economic environment
3.15 Commitments and ContingenciesAll discernible risks are accounted for in determining the amount of all known liabilities.
Contingent liabilities are possible obligations whose existence will be confirmed only by uncertain future events or present obligations where the transfer of economic benefit is not probable or cannot be reliably measured. Unless the probability of occurrence is remote, contingent liabilities are not recognized in the statement of financial position but are disclosed in the statement of financial position.(Refer Note 51).
4. NEW AMENDMENTS TO ACCOUNTING STANDARDS EFFECTIVE FROM 1 APRIL 2020The Group has adopted SLFRS16 - Leases, effective for annual periods beginning on or after 01 January 2019, for the first time. The nature and effect of the changes as a result of adoption of this new accounting standard are described below. The Company has not adopted early any other standard, interpreta-tion or amendment that has been issued but is not yet effective.
4.1 SLFRS 16 –LeasesSLFRS 16 supersedes LKAS 17 Leases. The standard sets out the principles for the recognition, measurement, presentation and disclosure of leases and requires lessees to recognise most leases on the statement of financial position.
Lessor accounting under SLFRS 16 is substantially unchanged from LKAS 17. Lessors will continue to classify leases as either operating or finance leases using similar principles as in LKAS 17. Therefore, SLFRS 16 did not have an impact for leases where the Company is the lessor.

Risk
Man
agem
ent &
Corp
orat
e Go
vern
ance
Sust
aina
bilit
yRe
port
Man
agem
ent D
iscus
sion
and
Anal
ysis
Boa
rd o
f Dire
ctor
s &Ex
ecut
ive M
anag
emen
tHi
ghlig
hts
Fina
ncia
lIn
form
atio
n
Commercial Credit and Finance PLC Annual Report 2019/20 129
The Company adopted SLFRS 16 using the modifiedretrospective method of adoption with the date of initial application of 1 April 2019. Under this method, the standard is applied retrospectively with the cumulative effect of initially applying the standard recognised at the date of initialapplication. The Company elected to use the transition practical expedient to not reassess whether a contract is or contains a lease at 1 April 2019. Instead, the Company applied the standard only to contracts that were previously identified as leases applying LKAS 17 and IFRIC 4 at the date of initial application.
The Company has lease contracts for various branches. Before the adoption of SLFRS 16, the Company classified each of its leases (as lessee) at the inception date as either a finance lease or an operating lease. Refer to Note 21 for the accounting policy prior to 1 April 2019.
Upon adoption of SLFRS 16, the Company applied a single recognition and measurement approach for all leases except for short-term leases and leases of low-value assets. Refer to Note 21 for the accounting policy beginning 1 April 2019. The standard provides specific transition requirements and practical expedients, which have been applied by the Group.
Leases previously classified as finance leases For leases that were classified as finance leases applying LKAS 17, the carrying amount of the right of use asset and the lease liability at the date of initial application shall be the carrying amount of the lease asset and lease liability immediately before that date measured applying LKAS 17.For those leases, the Company accounted for the right of use asset and the lease liability applying this Standard from the date of initial application.
Leases previously accounted for as operating leases The Company recognised right-of-use assets and lease liabilities for those leases previously classified as operating leases, except for short-term leases and leases of low-value assets. The right-of-use assets for most leases were recognised based on the carrying amount as if the standard had always been applied, apart from the use of incremental borrowing rate at the date of initial application. In some leases, the right-of-use assets were recognised based on the amount equal to the lease liabilities, adjusted for any related prepaid and accrued lease payments, discounted using the incremental borrowing rate at the date of initial application.The Company also applied the available practical expedients where in it: • Used a single discount rate to a portfolio of leases with reasonably similar characteristics • Relied on its assessment of whether leases are onerous immediately before the date of initial application
• Applied the short-term leases exemptions to leases with lease term that ends within 12 months of the date of initial application • Excluded the initial direct costs from the measurement of the right-of-use asset at the date of initial application• Used hindsight in determining the lease term where the contract contained options to extend or terminate the lease
4.2 IFRIC Interpretation 23- Uncertinity Over Income Tax TreatmentThe Interpretation addresses the accounting for income taxes when tax treatments involve uncertainty that affects the application of LKAS 12 Income Taxes. It does not apply to taxes or levies outside the scope of LKAS 12, nor does it specifically include requirements relating to interest and penalties associated within certain tax treatments. The Interpretation specifically addresses the following:
• Whether an entity considers uncertain tax treatments separately• The assumptions an entity makes about the examination of tax treatments by taxation authorities• How an entity determines taxable profit (tax loss), tax bases, unused tax losses, unused tax credits and tax rates• How an entity considers changes in facts and circumstances
The Company determines whether to consider each uncertain tax treatment separately or together with one or more other uncertain tax treatments and uses the approach that better predicts the resolution of the uncertainty.
The Company applies significant judgement in identifying uncertainties over income tax treatments. Since the Company operates in a complex environment, it assessed whether the interpretation had an impact on its Financial Statements. Upon adoption of the interpretation, the Company considered whether it has any uncertain tax positions, particularly those relating to transfer pricing. The tax filings of the Company in different jurisdictions include deductions related to transfer pricing and the taxation authorities may challenge those tax treatments. The Company determined, based on its tax compliance and transfer pricing study, that it is probable that its tax treatments will be statements of the accepted by the taxation authorities. The interpretation did not have an impact on the Financial Statements of the Company.
Except for the changes mentioned above, the Company has consistently applied the accounting policies for all periods presented in these Financial Statements.

Notes to the Financial Statements [Cont.]As at 31st March 2020
Commercial Credit and Finance PLC Annual Report 2019/2020130
5. SIGNIFICANT ACCOUNTING POLICIESThe significant accounting policies set out below have been applied consistently to all periods presented in these financial statements of the Company and Group, unless otherwise indicated. The accounting policies have been consistently applied by the Group and the Company where applicable.
5.1 Basis of Consolidation The Group’s financial statements comprise consolidation of the financial statements of the Company, its subsidiaries in terms of the Sri Lanka Accounting Standard (SLFRS 10) “Consolidated Financial Statements” and its associate accounted under “Equity method of accounting” In terms of Sri Lanka Accounting Standard (LKAS 28) “Investments in Associates & Joint Ventures”.
5.2 Business Combination and GoodwillBusiness combinations are accounted for using the Acquisition method as per the requirements of Sri Lanka Accounting Standard (SLFRS 3) - “Business Combinations”. When the Group acquires a business, it assesses the financial assets and liabilities assumed for appropriate classification anddesignation in accordance with the contractual terms, economic circumstances and pertinent conditions as at the acquisition date.
The Group measures goodwill as the fair value of theconsideration transferred including the recognized amount of any non-controlling interest in the acquiree, less the net recognized amount (generally fair value) of the identifiable assets acquired and liabilities assumed, all measured as of the acquisition date. When the excess is negative, a bargain purchase gain is recognized immediately in profit or loss. Acquisition related costs are expensed as incurred and included in other expenses. Goodwill is initially recorded at cost and subsequently at cost less any accumulated impairment losses in accordance with the Sri Lanka Accounting Standard (SLFRS 3) - “Business Combinations”.
Goodwill has to be reviewed for impairment annually or more frequently if events or circumstances indicate that the carrying value may be impaired.
The Group elects on a transaction by transaction basis whether to measure non-controlling interest at its fair value, or at its proportionate share of the recognized amount ofthe identifi-able net assets, at the acquisition date.
5.3 SubsidiariesSubsidiaries are entities that are controlled by the Group. Control is achieved when the Group is exposed, or has rights, to variable returns from its involvement with the investee and has the ability to affect those returns through its power over the investee.
Specifically, the Group controls an investee if, and only if, the Group has:
• Power over the investee• Exposure or rights to variable returns from its involvement with the investee• The ability to use its power over the investee to affect its returns
Generally, there is a presumption that a majority of voting rights results in control. To support this presumption and when the Group has less than a majority of the voting or similar rights of an investee, the Group considers all relevant facts and circumstances in assessing whether it has power over an investee, including:
• The contractual arrangement with the other vote holders of the investee• Rights arising from other contractual arrangements• The Group’s voting rights and potential voting rights
The Group reassesses whether or not it controls an investee if facts and circumstances indicate that there are changes to one or more of the above.
The financial statements of subsidiaries are included in the consolidated financial statements from the date that control commences until the date that control ceases.
When necessary, adjustments are made to the financial statements of subsidiaries to bring their accounting policies in line with the Group’s accounting policies. All intra-group assets and liabilities, equity, income, expenses and cash flows relating to transactions between members of Group are eliminated in full on consolidation.
Non-controlling interests represent the portion of profit or loss and net assets of the subsidiaries not owned directly or indirectly by the Company. The non-controlling interest is presented in the consolidated statement of financial position within equity, separately from the equity attributable to the equity holders of the Company. Non-controlling interest in the profit or loss of the Group is disclosed separately in the consolidated statement of comprehensive income.

Risk
Man
agem
ent &
Corp
orat
e Go
vern
ance
Sust
aina
bilit
yRe
port
Man
agem
ent D
iscus
sion
and
Anal
ysis
Boa
rd o
f Dire
ctor
s &Ex
ecut
ive M
anag
emen
tHi
ghlig
hts
Fina
ncia
lIn
form
atio
n
Commercial Credit and Finance PLC Annual Report 2019/20 131
2,841,771,535
326,049,458 122,805
1,752,000 -
2,878,363,710 -
(208,796,848) (1,628,500)
(23,678,810) (8,274,727) 61,799,566 61,438,143
5,928,918,331 51,194,237
8,284,111,810 (8,048,412,865)
106,236,228 (187,244,522) (72,291,895)
1,386,407,526 (2,315,717,645)
(237,309,754) 717,726,973
5,613,618,425 (41,662,945)
(1,207,935,913) 4,364,019,567
745,505,522 -
(1,622,244,105) (390,000,000)
(1,503,752,320) (9,688,420)
534,702,423 178,200,000
(2,067,276,901)
(22,487,668) 12,594,101,385
- (12,068,502,835)
(236,644,997) 266,465,885
2,563,208,551 8,274,727
3,950,012,861 6,521,496,139
1,748,596,904 3,662,522,771 1,618,124,084 (507,747,620) 6,521,496,139
2,185,068,637
1,252,767,021 -
259,350,410 -
15,711,053 3,404,582,022
(44,937,034) (54,828,026)
(289,505) (23,678,810)
- 18,643,202 72,459,570
7,132,206,161 11,223,026
4,878,223,155 (9,195,585,051)
(163,592,560) 72,421,757
131,884,081 (1,297,394,555) (4,987,677,391)
(558,287,248) (742,737,478)
(4,719,316,103)59,955,753
(586,953,905) (5,246,314,255)
(229,784,208) 34,502,183
(1,226,205,418) -
(550,271,289) (41,084,948)
(112,183,220)
(4,115,782) (2,129,142,682)
319,717,655 14,915,570,800
(126,554,883) (10,332,477,494)
(316,163,593) 4,460,092,485
(2,915,364,453) -
7,092,948,228 4,177,583,775
1,208,461,539 1,844,148,068 1,381,723,890 (256,749,719) 4,177,583,775
3,562,858,297
356,006,354 122,805
1,752,000 10,085,857
3,070,193,910 -
(208,796,848) (1,628,500)
(23,678,810) (8,274,727) 61,799,566 65,155,629
6,885,595,533 51,194,237
8,562,097,557 (10,986,611,923)
106,236,228 (187,244,522) (82,324,709)
1,386,407,526 (1,922,407,917)
(493,747,426) 863,060,472
4,182,255,059 (42,267,394)
(1,451,749,034) 2,688,238,631
745,505,522 -
(1,676,801,726) (390,000,000)
(1,400,070,657) (17,577,950)
530,187,886 182,598,638
(2,026,158,287)
(22,487,668) 18,192,821,806
- (15,068,838,325)
(236,644,997) 2,864,850,816 3,526,931,159
8,274,727 3,557,742,340 7,092,948,226
2,340,080,214 3,787,893,629 1,618,124,084 (653,149,700) 7,092,948,226
Any losses applicable to the non-controlling interest are allocated against the interests of the non-controlling interest.
A change in the ownership interest of a subsidiary without a loss of control is accounted for as an equity transaction. Upon the loss of control, the Group derecognizes the assets (including goodwill) and liabilities of the subsidiary, any non-controlling interests and the other components of equity related to the subsidiary. Any surplus or deficit arising on the loss of control is recognized in the profit or loss.
There are no significant restrictions on the ability of the subsidiary to transfer funds to the Company in the form of cash dividends or repayment of loans and advances. Thesubsidiary of the Company as at the reporting date have been incorporated in Sri Lanka.
5.3.1 Transactions Eliminated on ConsolidationIntra-group balances, transactions and income and expenses arising from intra-group transactions are eliminated in preparing the consolidated financial statements. Unrealized gains arising from transactions with equity accounted investees are eliminated to the extent of the Group’s interest in the investee. Unrealized losses are eliminated in the same way as unrealized gains, except that they are only eliminated to the extent that there is no evidence of impairment.
5.4 Foreign Currency Transactions and BalancesAll foreign currency transactions are translated into the functional currency which is Sri Lankan Rupees (LKR) at the spot exchange rate at the date of the transactions were affected. In this regard, the Group’s practice is to use the middle rate of exchange ruling at the date of the transaction.
Monetary assets and liabilities denominated in foreign currencies at the reporting date are retranslated to the functional currency at the spot rate of exchange at the reporting date. The foreign currency gain or loss on monetary items is the difference between amortised cost in the functional currency at the beginning of the year adjusted for effective interest and payments during the year and the amortised cost in foreign currency translated at the exchange rate at the reporting date.
Non- monetary items that are measured in terms of historical cost in a foreign currency are translated using the spot exchange rates as at the date of recognition. Non-monetary items measured at fair value in a foreign currency aretranslated using the spot exchange rates at the date when the fair value was determined.
5.5 Financial instruments – initial recognition and subsequent measurement
5.5.1 Date of recognitionFinancial assets and liabilities, with the exception of loans and advances to customers and balances due to customers, are initially recognized on the trade date, i.e., the date that the Group becomes a party to the contractual provisions of the instrument. This includes regular way trades: purchases or sales of financial assets that require delivery or assets within the time frame generally established by regulation or conven-tion in the market place. Loans and advances to customers are recognized when funds are transferred to the customers’ accounts. The Group recognizes balances due to customers when funds are transferred to the Group.
5.5.2 Initial measurement of financial instrumentsThe classification of financial instruments at initial recognition depends on their contractual terms and the business model for managing the instruments, as described in Notes 4.4.3.1(a) and 4.4.3.1(b). Financial instruments are initially measured at their fair value except in the case of financial assets and financial liabilities recorded at FVPL, transaction costs are added to, or subtracted from, this amount. Trade receivables are measured at the transaction price. When the fair value of financial instruments at initial recognition differs from the transaction price, the group accounts for the day 1 profit or loss. As described below,
Day 1 profit or loss
When the transaction price differs from the fair value of other observable current market transactions in the same instrument, or based on a valuation technique whose variables include only data form observable markets, the group recognizes the difference between the transaction price and fair value (a day 1 profit or loss) in the statement of profit or loss over the tenor of the financial instrument using the Effective Interest Rate (EIR) method. In cases where fair value is determined using data which is not observable, the difference between the transaction price and model value is only recognized in the statement of profit or loss when the inputs become observable, or when the instrument is derecognized.

Notes to the Financial Statements [Cont.]As at 31st March 2020
Commercial Credit and Finance PLC Annual Report 2019/2020132
5.5.3 Measurement categories of Financial Assets and LiabilitiesThe Group classifies of its financial assets based on the business model for managing the assets and the asset’s contractual terms, measured at either:
• Amortized cost, as explained in note 5.5.3.1• Fair value through Profit or loss5.5.3.2• FVOCI, as explained in note 5.5.3
The subsequent measurement of financial assets depends on their classification.
Financial liabilities, other than loan commitments and financial guarantees, are measured at amortised cost or at FVPL when they are held for trading..5.5.3.1 Loans and advances, Lease rental receivablesThe group only measures loans and receivables, Lease rentals receivable and stock out on hire and debt & other financial instruments at amortised cost if both of the following conditions are met,• The financial asset is held within a business model with the objective of collecting contractual cash flows• The contractual terms of the financial asset give rise, on specified dates, to cash flows that are solely payments of principal and interest (SPPI) on the principal amountoutstanding.
The details of these conditions are outlined below,
(a) Business model assessment The Group determines its business model at the level that best reflects how it manages groups of financial assets to achieve its business objectives.
The Group's business model is not assessed on aninstrument-by instrument basis, but at a higher level of aggregated portfolios and is based on observable factors such as:
• How the performance of the business model and the financial assets held within that business model are evaluated and reported to the entity's key management personnel• The risk that affect the performance of the business model (and the financial assets held within that business model) and, in particular, the way those risks are managed• How managers of the business are compensated (for example, whether the compensation is based on the fair value of the assets managed or on the contractual cash flows collected. • The expected frequency, value and timing of sales are also important aspects of the Group’s assessment
The business model assessment is based on reasonably expected scenarios without taking 'worst case' or 'stress case’
scenarios in to account. If cash flows after initial recognition are realised in a way that is different from the Group's original expectations, the Group does not change the classification of the remaining financial assets held in that business model, but incorporates such information when assessing newlyoriginated or newly purchased financial assets going forward.
(b) The SPPI test As a second step of its classification process, the group assesses the contractual terms of financial instruments to identify whether they meet the SPPI test. Principal for the purpose of this test is defined as the fair value of the financial asset at initial recognition and may change over the life of the financial assets (for example, if there are repayments of principal or amortization of the premium/discount).
The most significant elements of interest within alending arrangement are typically the consideration for the time value of money and credit risk. To make the SPPIassessment, the Group applies judgement and considers relevant factors such as the currency in which the financial assets is denominated and the period for which the interest rate is set. In contrast, contractual terms that introduce a more than de-Minimis exposure to risks or volatility in the contractual cash flows that are unrelated to a basic lending arrangement, do not give rise to contractual cash flows that are solely payments of principal and interest on the amount outstanding. In such cases, the financial asset is required to be measured at FVPL.
5.5.3.2 Financial assets or financial liabilities at Fair Value through Profit or Loss (FVPL)The group classified financial assets or financial liabilities as held for trading when they have been purchased or issued primarily for short term profit making through trading activities or form part of a portfolio of financial instruments that are managed together, for which there is evidence of a recent patterns of short term profit taking .Held for trading assets and liabilities are recorded and measured in the statement of financial position at fair value. Changes in fair valueare recognized in net trading income. Interest income from financial assets held for trading is recorded under net interest income while dividend income is recorded in net trading income when the right to payment has been established. Included in this classification are debt securities and equity investments that have been acquired principally for the purpose of selling or repurchasing in the near term.

Risk
Man
agem
ent &
Corp
orat
e Go
vern
ance
Sust
aina
bilit
yRe
port
Man
agem
ent D
iscus
sion
and
Anal
ysis
Boa
rd o
f Dire
ctor
s &Ex
ecut
ive M
anag
emen
tHi
ghlig
hts
Fina
ncia
lIn
form
atio
n
Commercial Credit and Finance PLC Annual Report 2019/20 133
5.5.3.3 Equity instruments at FVOCIUpon initial recognition, the Group occasionally elects to classify irrevocably some of its equity investments at FVOCI when they meet the definition of equity under LKAS 32 Financial Instruments: Presentation and are not held for trading. Such classification is determined on an instrument-by instru-ment basis.
Gains and losses on these equity instruments are never recycled to profit. Dividends are recognised in profit or loss as other operating income when the right of the payment has been established, except when the group benefits from such proceeds as a recovery of part of the cost of the instrument, in which case, such gains are recorded in OCI equity instruments are not subject to an impairment assessment.
5.5.3.4 Debt issued and other borrowed fundsAfter initial measurement, debt issued and other borrowed funds are subsequently measured at amortised cost. Amortised cost is calculated by taking into account any discount or premium on issue of funds and costs that are an integral part of the EIR. The Group does not have compound financialinstruments that contains both liability and equity components and require separation as at the date of the issue.
5.5.3.5 Financial guarantees and undrawn loan commitments The group issues financial guarantees and loan commitments. Financial guarantees are initially recognized in the financial statements at fair value, being the premium received.Subsequent to initial recognition, the Group’s liability under each guarantee is measured at the higher of the amount initially recognized less cumulative amortization recognised in the income statement, and the ECL provision.
The premium received is recognised in the income statement under Net fees and commission income on a straight-line basis over the life of the guarantee.
Undrawn loan commitments and letters of credits are commit-ments under which, over the duration of the commitment, the Group is required to provide a loan with pre-specified terms to the customer
The nominal contractual value of financial guarantees and undrawn loan commitments where the loan agreed to be provided is on market terms, are not recorded in the statement of financial position. The nominal values of these instruments together with the corresponding ECLs are disclosed in Note 51.
5.5.3. 6Reclassification of financial assets and liabilitiesThe Group does not reclassify its financial assets subsequent to their initial recognition, apart from the exceptionalcircumstances in which the Group may acquire, dispose of, or terminates a business line (change in business model). When the group reclassifies its financial assets it applies the reclassi-fication prospectively from the reclassification date without
restating any previously recognised gains, losses (including impairment gains or losses) or interest. Financial liabilities are never reclassified when a financial asset is reclassified out of the amortised cost measurement category and into the fair value through profit or loss measurement category, its fair value is measure at the reclassification date. Any gain or loss arising from a difference between the previous amortized cost of the financial asset and fair value is recognised in profit or loss.
When a financial asset is reclassified out of the fair value through profit or loss measurement category and into the amortised cost measurement category, its fair value at the reclassified date becomes its new gross carrying amount.
When a financial asset is reclassified out of the amortized cost measurement category and into the fair value through other comprehensive income measurement category, its fair value is measured at the reclassification date. Any gain or loss arising from a difference between the previous amortised cost of the financial asset and fair value is recognised in othercomprehensive income. The effective interest rate and the measurement of expected credit losses are not adjusted as a result of reclassification.
When a financial asset is reclassified out of the fair value through other comprehensive income measurement category and into the amortised cost measurement category, the financial asset is reclassified at its fair value at thereclassification date. However, the cumulative gain or loss previously recognised in other comprehensive income is removed from equity and adjusted against the fair value of the financial asset at the reclassification date. As a result, the financial asset is measured at the reclassification date as if it had always been measured at amortised cost. The effective interest rate and measurement of expected rate and the measurement of expected credit losses are not adjusted as a result of the reclassification.
When a financial asset is reclassified out of the fair value through profit or loss measurement category and into the fair value through other comprehensive income measurement category, the financial asset continues to be measured at fair value.

Notes to the Financial Statements [Cont.]As at 31st March 2020
Commercial Credit and Finance PLC Annual Report 2019/2020134
When a financial asset is reclassified out of the fair value through other comprehensive income measurement category and into the fair value through profit or loss measurement category. The financial asset continues to be measured at fair value. The cumulative gain or loss previously recognized in other comprehensive income is reclassified from equity to profit or loss as a reclassification adjustment at the reclassification date.
5.5.4 Derecognition of financial assets and liabilities
5.5.4.1 Derecognition due to substantial modification of terms and conditions The group de-recognizes a financial asset, such as a loan to a customer, when the terms and conditions have been renegoti-ated to the extent that, substantially, it becomes a new loan, with the difference recognized as a derecognition gain or loss, to the extent that an impairment loss has not already been recorded. The newly recognized loans are classified as Stage 1 for ECL measurement purposes, unless the new loan is deemed to be credit impaired at the date of inception.
When assessing whether or not to de-recognize a loan to a customer, amongst others, the Group considers the following factors:
• Introduction of an equity feature• Change in counterparty• If the modification is such that the instrument would no longer meet the SPPI criteriaIf the modification does not result in cash flows that are substantially different, the modification does not result in derecognition. Based on the change in cash flows discounted at the original EIR, the group records a modification gain or loss, to the extent that an impairment loss has not already been recorded.
5.5.4.2 De-recognition other than for substantial modification (a) Financial assetsA financial asset (or, where applicable, a part of a financial asset or part of a group of similar financial assets) is derecognized when the rights to receive cash flows from the financial asset have expired. The Group also derecognizes the financial asset if it has both transferred the financial asset and the transfer qualifies for derecognition.
The Group has transferred the financial asset if and only if, either:
• The Group has transferred its contractual rights to receive cash flows from the financial assetOr• It retains the rights to the cash flows, but has assumed an obligation to pay the received cash flow in full without material delay to a third party under a ‘pass–through’ arrangement
Pass-through arrangements are transactions whereby the Group retains the contractual rights to receive the cash flows of a financial asset (the 'original asset'), but assumes a contractual obligation to pay those cash flows to one or more entities (the 'eventual recipients'), when all of the following three conditions are met:
• The Group has no obligation to pay amounts to the eventual recipients unless it has collected equivalent amounts from the original asset, excluding short term advances with the right to full recovery of the amount lent plus accrued interest at market rates• The Group cannot sell or pledge the original asset other than as security to the eventual recipients• The Group has to remit any cash flows it collects on behalf of the eventual recipients without material delay. In addition, the Group is not entitled to re invest such cash flows, except for investments in cash or cash equivalents including interest earned, during the period between the collection date and the date of required remittance to the eventual recipients.A transfer only qualifies for derecognition if either,• The Group has transferred substantially all the risks and rewards of the asset.Or • The Group has neither transferred nor retained substantially all the risks and rewards of the asset, but has transferred control of the asset.
The Group considers control to be transferred if and only if, the transferee has the practical ability to sell the asset in its entirety to an unrelated third party and is able to exercise that ability unilaterally and without imposing additional restrictions on the transfer.
When the Group has neither transferred nor retained substantially all the risks and rewards and has retained control of the asset, the asset continues to be recognized only to the extent of the Group’s continuing involvement, in which case, the Group also recognizes an associated liability. The transferred asset and the associated liability are measured on a basis that reflects the rights and obligations that the group has retained.
Continuing involvement that takes the form of a guarantee over the transferred asset is measured at the lower of the original carrying amount of the asset and the maximum amount of consideration the Group could be required to pay.

Risk
Man
agem
ent &
Corp
orat
e Go
vern
ance
Sust
aina
bilit
yRe
port
Man
agem
ent D
iscus
sion
and
Anal
ysis
Boa
rd o
f Dire
ctor
s &Ex
ecut
ive M
anag
emen
tHi
ghlig
hts
Fina
ncia
lIn
form
atio
n
Commercial Credit and Finance PLC Annual Report 2019/20 135
(b) Financial liabilitiesA financial liability is derecognised when the obligation under the liability is discharged, cancelled or expired. Where an existing financial liability is replaced by another from the same lender on substantially different terms, or the terms of an existing liability are substantially modified, such an exchange or modification is treated as a derecognition of the original liability and the recognition of a new liability. The difference between the carrying value of the original financial liability and the consideration paid is recognised in profit or loss.
5.5.5 Impairment allowance for financial assets
5.5.5.1 Overview of the ECL principles The Group has been recording the impairment for expected credit losses for all loans and debt & other financial instruments not held at FVPL, together with loan commitments and financial guarantee contracts. Equity instruments are not subject to impairment under SLFRS 9.
The ECL impairment is based on the credit losses expected to arise over the life of the asset (the lifetime Expected Credit Loss or (LTECL)], unless there has been no significant increase in credit risk since origination, in which case, the impairment is based on the 12 months’ Expected Credit Loss (12mECL). The Group’s policies for determining if there has been a significant increase in credit risk are set out in note 5.5.5.1(a)
The 12mECL is the portion of LTECLs that represent the ECLs that result from default events on financial instruments that are possible within the 12 months after the reporting date.
Both LTECLs and 12mECLs are calculated on either an individual basis or a collective basis, depending on the nature of the underlying portfolio of financial instruments. The policy for grouping financial assets measured on a collective basis is explained in Note 5.5.5.4.The details of individual assessment of ECLs are given in Note 5.5.5.3.
The Group has established a policy to perform an assessment, at the end of each reporting period, of whether a financial instrument’s credit risk has increased significantly since initial recognition, by considering the change in the risk of default occurring over the remaining life of the financial instrument. This is further explained in Note5.5.5.1.(a). Based on the above process, the Group categorize its loans into ‘Stage 1’, ‘Stage 2’, ‘Stage 3’ and ‘originated credit impaired’, as described below:
• Stage 1When loans are first recognized, the group recognizes an impairment based on 12mECLs. Stage 1 loans also include facilities where the credit risk has improved and the loan has been reclassified from stage 2.
• Stage 2When a loan has shown a significant increase in credit risk since origination, the Group records an impairment for the LTECLs. Stage 2 loans also include facilities, where the credit risk has improved and the loan has been reclassified from stage 3.
• Stage 3Loans considered credit impaired (as outlined in Note 5.5.5]. The Group records an impairment for the LTECLs.
• Originated credit impairedOriginated credit impaired assets are financial assets that are credit impaired on initial recognition. They are recorded at fair value at original recognition and interest income is subsequent-ly recognized based on a credit-adjusted EIR. ECLs are only recognized or released to the extent that there is a subsequent change in the expected credit losses.
For financial assets for which the Group has no reasonable expectations of recovering either the entire outstanding amount, or a proportion thereof, the gross carrying amount of the financial asset is reduced. This is considered a (partial) derecognition of the financial asset.
5.5.5.1 (a) Definition of default and cure The group consider a financial instrument as defaulted and therefore Stage 3 (credit-impaired) for ECL calculations in all cases when the borrower becomes 90 days past due on its contractual payments.
As a part of a qualitative assessment of whether an individually significant customer is in default, the Group also considers a variety of instances that may indicate unlikeliness to pay. When such events occur, the Group carefully considers whether the event should result in treating the customer as defaulted and therefore assessed as Stage 3 for ECL calculations or whether Stage 2 is appropriate.
Such events include:• Internal rating of the borrower indicating default or near-de-fault• The borrower requesting emergency funding• The borrower having past due liabilities to public creditors or employees• The borrower is deceased• A material decrease in the underlying collateral value where the recovery of the loan is expected from the sale of the collateral

Notes to the Financial Statements [Cont.]As at 31st March 2020
Commercial Credit and Finance PLC Annual Report 2019/2020136
• A material decrease in the borrower’s turnover or the loss of a major customer• A covenant breach not waived by the Group• The debtor (or any legal entity within the debtor’s group) filing for bankruptcy application/ protection• Debtor’s listed debt or equity suspended at the primary exchange because of rumours or facts about the financial difficulties It is the Group’s policy to consider a financial instrument as “cured” and therefore re-classified out of Stage 3 when none of the default criteria has been present. Once cured, the decision whether to classify an asset as Stage 2 or Stage 1 largely depends on the days past due, at the time of the cure.The Group’s criterion for ‘cure’ for rescheduled / restructured loans is more stringent than ordinary loans and is explained in Note 5.5.5.10.
5.5.5.1 (b) Significant increase in credit risk The Group continuously monitors all assets subject to ECLs. In order to determine whether an instrument or a portfolio of instruments is subject to 12mECL or LTECL, the Group assesses whether there has been a significant increase in credit risk. Since initial recognition. The Group considers an exposure to have a significantly increased credit risk when it is past due for more than 30 days.
The Group also applies a secondary qualitative method for triggering a significant increase in credit risk, such asrestructuring or rescheduling of an assets while the asset is less than 30 days past due. In certain cases, the Group may also consider that events explained in note 5.5.5.1(a) are significant increase in credit risk as opposed to a default, for customers who are considered as individually significant.
5.5.5.2 The calculation of ECL The Group calculates ECL based on three probability-weighted scenarios to measure the expected cash shortfall (the base case, best case and the worst case), discounted at an approxi-mation to the EIR. Each of these is associated with different loss rates. The assessment of multiple scenarios incorporates how defaulted loans are expected to be recovered, including the probability that the loans will cure and the value of collateral or the amount that might be received for selling the asset.
Key elements of the ECL calculations are outlined below:• Probability of Default (PD) The PD is an estimate of the likelihood of default over a given time horizon. A default may only happen at a certain time over the assessed period, if the facility has not been previously derecognized and is still in the portfolio. The concept of PDs is further explained in Note 5.5.5.4(a).
• Exposure at default (EAD) The EAD is an estimate of the exposure at a future default date, taking into account expected changes in the exposure after the reporting date, including repayments of principal and interest, whether scheduled by contract or otherwise, expected draw downs on committed facilities, and accrued interest from missed payments. The EAD is further explained in Note 5.5.5.4(b).
• Loss Given Default (LGD) The LGD is an estimate of the loss arising in the case where a default occurs at a given time. It is based on the difference between the contractual cash flows due and those that the lender would expect to receive, including from the realisation of any collateral. It is usually expressed as a percentage of the EAD. The LGD is further explained in Note 5.5.5.4.(c).
With the exception of revolving facilities, for which the treatment is separately set out in Note 5.5.5.5, the maximum period for which the credit losses are determined is the contractual life of a financial instrument unless the Group has the legal right to call it earlier.
5.5.5.3 Calculation of Expected Credit Losses for Individually significant loans The Group first assess ECLs individually for financial assets that are individually significant. In the event the Group determines that such assets are not impaired (Not in stage 3), it includes the asset in a group of financial assets with similar credit risk characteristics and collectively assesses them for impair-ment.However, assets that are individually assessed for impairment and for which an impairment loss is or continues to be recognized are not included in a collective assessment of impairment. The criteria used to determine whether individually significant customer is in default is discussed in Note 5.5.5.1(a).
If the asset is impaired, the amount of the loss is measured by discounting the expected future cash flows of a financial assets at its original effective interest rate and comparing the resultant present value with the Financial asset’s current carrying amount. The impairment on individually significant accounts are reviewed more regularly when circumstances require. This normally encompasses re-assessment of the enforceability of any collateral held and the timing and amount of actual and anticipated receipts.Individually assessed impairment is only released when there is reasonable and objective evidence of a reduction in the established loss estimate. Interest onimpaired assets continues to be recognized through the unwinding of the discount.

Risk
Man
agem
ent &
Corp
orat
e Go
vern
ance
Sust
aina
bilit
yRe
port
Man
agem
ent D
iscus
sion
and
Anal
ysis
Boa
rd o
f Dire
ctor
s &Ex
ecut
ive M
anag
emen
tHi
ghlig
hts
Fina
ncia
lIn
form
atio
n
Commercial Credit and Finance PLC Annual Report 2019/20 137
When ECLs are determined for individually significant financial assets, following factors are considered:
• Aggregate exposure to the customer including any undrawn exposures;• The viability of the customer’s business model and their capacity to trade successfully out of financial difficulties and generate sufficient cash flow to service debt obligations• The amount and timing of expected receipts and recoveries• The extent of other creditors’ commitments ranking ahead of, or pari-passu with the Company and the likelihood of other creditors continuing to support the Company;
5.5.5.4 Grouping of financial assets measured on a collective basisThe Group calculates ECLs either on a collective or an individual basis. Asset classes where the Group calculates ECL on an individual basis include all customers whose exposure is more than or equal to the internal threshold for classifying them as individually significant. However, if the customer is determined to be in stage I or stage II, such customers are moved back to collective ECL calculation.
For all other asset classes, the Group calculates ECL on a collective basis. The Group categorizes these exposures into smaller homogeneous portfolios, based on a combination of internal and external characteristics of the loans, as described below:
• Product type• Type of collateral• Whether the loan is restructured /rescheduled
5.5.5.4 (a) PD Estimation processPD estimation for loans and advances to other customers under SLFRS 9 is largely based on the Days Past Due (DPD) of the customers which is common for most Financial Institutions in the country at present.
Accordingly, exposures are categorised among 5 groups based on the DPD as follows,
• Zero days past due• 1 – 30 days past due• 31 - 60 days past due• 61 – 90 days past due• Above 90 days past due
The Company is in the process of developing its internal risk rating system to suit the requirements of SLFRS 9 with the support of external consultants.
The movement of the customers in to bad DPD categories are tracked at each account level over the periods and it is used to estimate the amount of loans that will eventually be written off.
5.5.5.4 (b) Exposure at defaultThe exposure at default (EAD) represents the gross carrying amount of the financial instruments subject to the impairment calculation, addressing both the client’s ability to increase its exposure while approaching default and potential early repayments too.
To calculate the EAD for a Stage 1 loan, the Group assesses the possible default events within 12 months. However, if a Stage 1 loan that is expected to default within the 12 months from the balance sheet date is also expected to cure and subsequently default again, then all linked default events are taken into account. For Stage 2 and stage 3 financial assets and credit impaired financial assets at origination, events over the lifetime of the instruments are considered. The Group determines EADs by modelling the range of possible exposure outcomes at various points in time, corresponding the multiple scenarios. The SLFRS 9 PDs are then assigned to each economic scenario based on the outcome of Group’s models.
5.5.5.4 (c) Loss Given DefaultLGD values are assessed at least annually for each material collateral type. The Group segregates it’s customer loan book based on following major types of collaterals when calculating the LGD.
• Secured against motor vehicles and other movable properties• Secured against immovable property• Secured against cash / deposits held within the company• Secured against gold
These LGD rates take into account the expected EAD in comparison to the amount expected to be recovered or realized from any collateral held. Historically collected loss data is used for LGD calculation and involves a wider set of transaction characteristics (e.g., product type, collateral type) as well as borrower characteristics. Further recent data andforward-looking economic scenarios are used in order to determine the LGD for each collateral type. The LGD rates, where possible, are calibrated through back testing against recent recoveries.

Notes to the Financial Statements [Cont.]As at 31st March 2020
Commercial Credit and Finance PLC Annual Report 2019/2020138
5.5.5.5 Other revolving facilities The Company’s product offering includes Factoring and draft facilities in which the company has the right to cancel and/or reduce the facilities with a very short notice. The Company does not limit its exposure to credit losses to the contractual notice period, but instead calculates ECL over a period of 12 months to reflect the Company’s expectations of the customer behavior, its likelihood of default and the Company’s future risk mitigation procedures, which could include reducing or cancelling the facilities.
5.5.5.6 Forward looking information In its ECL models, the Company relies on a broad range of forward looking information as economic inputs, such as:• GDP growth• Unemployment rates• Interest rates• Exchange rate• Inflation rate• World GDP growth
The inputs and models used for calculating ECLs may not always capture all characteristics of the market at the date of the financial statements. To reflect this, qualitative adjustments or overlays are occasionally made as temporary completeness and accuracy, the Group obtains the above data from third party sources (Central Bank, World Bank and International Monetary Fund etc).
5.5.5.7 Collateral valuation To mitigate its credit risks on financial assets, the group seeks to use collateral, where possible. The collateral comes in various forms, such as motor vehicles, cash, guarantees, real estate, receivables, inventories and other non-financial assets.
To the extent possible, the Group uses active market data for valuing financial assets held as collateral. Other financial assets which do not have readily determinable market values are valued using models. Non financial collateral, such as real estate, is valued based on data provided by third parties such as independent valuation specialists.
5.5.5.8 Collateral repossessed The Group’s policy is to sell the repossessed assetsimmediately through public auctions
5.5.5.9 Write-offs Financial assets are written off either partly or in their entirety only when the Group has stopped pursuing the recovery. If the amount to be written off is greater than the accumulated impairment, the difference is first treated as an addition to the impairment that is then applied against the gross carrying amount. Any subsequent recoveries are credited to the statement of profit or loss.
5.5.5.10 Rescheduled and restructured loans The Group sometimes makes concessions or modifications to the original terms of loans in response to the borrower’s financial difficulties, taking possession of the collateral. The Company considers a loan as rescheduled / restructured, when such concessions or modifications are provided as a result of the borrower’s present or expected financial difficulties and the company would not have agreed to them if the borrower had been financially healthy. Indicators of financial difficulties include defaults on covenants, or significant concerns raised by the Credit Risk Department. Reschedulement /restructure may involve extending the payment arrangements and the agreement of new loan conditions. Once the terms have been renegotiated, any impairment is measured using the original EIR as calculated before the modification of terms. It is the Company’s policy to monitor rescheduled / restructured loans to ensure that future payments are likely to occur.
Rescheduled /restructured loans are at a minimum classified as stage 2 at the date of the modification of the loan. The Company also consider whether such assets should be classified as Stage 3. Once an asset has been classified as stage 3, it will remain in stage 3 until it becomes performing (less than 30 days past due) but still be subjective for LTECL.
5.6 Lease The group applied Sri Lanka Accounting standard – SLFRS 16 Leases which is effective for annual periods beginning on or after 1st January 2019. Accordingly, the Group changed its accounting policy for lease contracts as detailed below.
5.6.1 Identification of a LeasePreviously, the Group determined, at contract inception, whether an arrangement is or contains a lease under LKAS 17/IFRIC 4. Under SLFRS 16, the group assess whether a contract is or contains a lease based on the definition of lease as explained in Note 21

Risk
Man
agem
ent &
Corp
orat
e Go
vern
ance
Sust
aina
bilit
yRe
port
Man
agem
ent D
iscus
sion
and
Anal
ysis
Boa
rd o
f Dire
ctor
s &Ex
ecut
ive M
anag
emen
tHi
ghlig
hts
Fina
ncia
lIn
form
atio
n
Commercial Credit and Finance PLC Annual Report 2019/20 139
On transition, the group elected to apply SLFRS 16, only to contracts that were previously identified as leases. Contracts that were not identified as leases under LKAS 17/IFRIC 4 were not reassessed to ascertain whether there is a lease. Therefore, the definition of a lease under SLFRS 16, was applied only to contracts entered in to or changed on or after 1st January 2019.
The group applied SLFRS 16 using the modified retrospective approach and thereby the comparative figures were not restated and continues to be reported under LKAS 17.
5.6.2 As a LessorLessor accounting under SLFRS 16 is substantially unchanged from LKAS 17. Lessor will continue to classify leases as either operating leases or finance leases using similar principles as in LKAS 17. Therefore, SLFRS 16 does not have an impact for leases where the group is the lessor.
5.6.3 As a LesseeAs a lessee, the group previously classified leases as operating or finance leases based on its assessment of whether the lease transferred significantly all of the risks and rewards incidental to ownership of the underlying assets to the group. Under SLFRS 16, the group recognises right of the use of assets and lease liabilities for most leases except for short term leases to which the group applied recognition exemptions in SLFRS 16.
5.6.3.1 Leases classified as operating leases under LKAS 17 At transition, lease liabilities were measured at the present value of the remaining lease payments discounted at the incremental borrowing rates as at 1st April 2019. Rights of use of assets are measured at an amount equal to the lease liability, adjusted by the amount of any pre-paid or accrued lease payments.
In addition, the group applied following practical expedients permitted by SLFRS 16, to Leases previously classified as operating leases under LKAS 17.
• Applied a Single discount rate to a portfolio of leases with similar characteristics• Applied the exemption not to recognize right of use assets and liabilities for leases with less than 12 months of lease term.• Exclude initial direct costs, from the measurement of the right of use asset for leases previously accounted for as operating leases at the date of initial application. • Used hindsight when determining the lease term of the contact contains options to extend or terminate the lease.
5.7 Impairment of non-financial assetsThe Group assesses at each reporting date whether there is an indication that an asset may be impaired. If any indication exists, or when annual impairment testing for an asset is required, the Group estimates the asset’s recoverable amount. An asset’s recoverable amount is the higher of an asset’s or CGU’s (Cash Generating Unit) fair value less costs to sell and its value in use. Where the carrying amount of an asset or CGU exceeds its recoverable amount, the asset is considered impaired and is written down to its recoverable amount. In assessing value in use, the estimated future cash flows are discounted to their present value using a pre–tax discount rate that reflects current market assessments of the time value of money and the risks specific to the asset. In determining fair value less costs to sell, an appropriate valuation model is used.
For assets, an assessment is made at each reporting date as to whether there is any indication that previously recognised impairment losses may no longer exist or may have decreased. If such indication exists, the Group estimate the asset’s or CGU’s recoverable amount. A previously recognised impairment loss is reversed only if there has been a change in the assumptions used to determine the asset’s recoverable amount since the last impairment loss was recognised. The reversal is limited so that the carrying amount of the asset does not exceed itsrecoverable amount, nor exceeds the carrying amount that would have been determined, net of depreciation, had no impairment loss been recognised for the asset in prior years. Such reversal is recognised in the Statement of profit or loss.
5.8 ProvisionsProvisions are recognized when the Company has a present obligation (legal or constructive) as a result of a past event, where it is probable that an outflow of resources embodying economic benefits will be required to settle the obligation and a reliable estimate can be made of the amount of the obligation. The expense relating to any provision is presented in the Statement of profit or loss net of any reimbursement.

Notes to the Financial Statements [Cont.]As at 31st March 2020
Commercial Credit and Finance PLC Annual Report 2019/2020140
5.9 Taxation
5.9.1 Current TaxesCurrent income tax assets and liabilities for the current period are measured at the amount expected to be recovered from or paid to the taxation authorities. The tax rates and tax laws used to compute the amount are those that are enacted orsubstantively enacted, at the reporting date.
Current income tax relating to items recognized directly in equity is recognized in equity and not in the Statement of profit or loss. Management periodically evaluates positions taken in the tax returns with respect to situations in which applicable tax regulations are subject to interpretation and establishes provisions where appropriate.
5.9.1.1 Changes proposed to Income Tax from Government Tax Proposals As per the Notice to tax payers and withholding agents on “Implementation of Proposed Changes to the Inland Revenue Act No. 24 of 2017” dated February 12, 2020 issued by the Department of Inland Revenue, Income Tax rates of Corporates has been revised to 24% from 28% effective from January 1, 2020, pending formal amendments to be made to the Inland Revenue Act .
5.9.2 VAT on Financial ServicesVAT on financial services is calculated in accordance with VAT Act No.14 of 2002 and subsequent amendments thereto.
5.10 Recognition of Income and ExpenseRevenue is recognized to the extent that it is probable that the economic benefits will flow to the Company and the revenue can be reliably measured. The following recognition criteria must also be met before revenue is recognized.
(i) Interest Income and Interest ExpenseFor all financial instruments measured at amortized cost, interest bearing financial assets classified as available for sale and financial instruments designated at fair value through profit or loss, interest income or expense is recorded using the EIR. EIR is the rate exactly discounts estimated future cash payment or receipt through the expected life of the financial instrument or a shorter period, where appropriate, to the net carrying amount of the financial assets and financial liability. The calculation takes into account all contractual terms of the financial instrument (for example, prepayment options) and includes any fees or incremental costs that are directly attributable to the instrument and are an integral part of the EIR, but not future credit losses.
The carrying amount of the financial assets and liability is adjusted if the Company revises its estimates of payment and receipts. The adjusted carrying amount is calculated based on the original EIR and the change in carrying amount is recorded
as ‘Interest and similar income’ for the financial assets and ‘Interest and similar expense’ for financial liabilities.
Once the recorded value of a financial asset or a group of similar financial assets has been reduced due to an impairment loss, interest income continue to be recognized using the rate of interest used to discount the future cash flows for the purpose of measuring the impairment loss.
(ii) Fee and commission incomeThe Company earns fee and commission income from a diverse range of services it provides to its customers. Fee income can be divided into the following two categories:
a) Fee income earned from services that are provided over a certain period of time
Fees earned for the provision of services over a period of time are accrued over that period. These fees include commission income and etc.
b) Fee income from providing transaction services
Fees arising from negotiating or participating in the negotiation of a transaction for a third party, such as the purchase or sale of business is recognized on completion of the underlying transaction. Fees or components of fees that are linked to a certain performance are recognized after fulfilling the corresponding criteria.
c) Dividend IncomeDividend income is recognized when the right to receive the payment is established.
d) Real Estate SalesRevenue from the real estate sale is recognised when the significant risks and rewards of ownership of the goods have passed to the buyer.

Risk
Man
agem
ent &
Corp
orat
e Go
vern
ance
Sust
aina
bilit
yRe
port
Man
agem
ent D
iscus
sion
and
Anal
ysis
Boa
rd o
f Dire
ctor
s &Ex
ecut
ive M
anag
emen
tHi
ghlig
hts
Fina
ncia
lIn
form
atio
n
Commercial Credit and Finance PLC Annual Report 2019/20 141
6 Effect of Sri Lanka Accounting Standards issued but not yet effectiveThere are no Accounting Standards which have been issued by the Institute of Chartered Accountants of Sri Lanka but not yet effective as at 31st March 2020, having a material impact on the group’s financial statements. The group has applied all relevant accounting standards which has been issued up to 31st March 2020 in the preparation of the financial statements for the year ended 31 March 2020.
The following Sri Lanka Accounting Standards and interpreta-tions have been issued by the Institute of CharteredAccountants of Sri Lanka which are not yet effective as at 31st March 2020, and earlier application is permitted. However, the Company has not early adopted the following amendments to Accounting Standards in preparing these Financial Statements as they are not expected to have a significant impact on the Company’s Financial Statements.
SLFRS 17 is effective for reporting periods beginning on or after 1 January 2021. Early application permitted, if the entity is applying SLFRS 16 and SLFRS 15 on or before the date in which it first apply SLFRS 17.This standard is not applicable to the Company.
6.1 Amendments to LKAS 1 and LKAS 8: Definition of MaterialIn November 2018, the CA Sri Lanka issued amendments to LKAS 1 and Sri Lanka Accounting Standard – LKAS 8 on “Accounting Policies, Changes in Accounting Estimates and Errors” to align the definition of ‘material’ across the standards and to clarify certain aspects of the term ‘definition’. The new definition states that, ’Information is material if omitting, misstating or obscuring it could reasonably be expected to influence decisions that the primary users of general purpose Financial Statements make on the basis of those Financial Statements, which provide financial information about a specific reporting entity.’ The Company shall apply those amendments prospectively for annual financial periods beginning on or after April 1, 2020.
6.2 Amendments to SLFRS 3: Definition of a BusinessAmendments to the definition of a business in SLFRS 3 Business Combinations are made to help the entities determine whether an acquired set of activities and assets is a business or not. They clarify the minimum requirements for a business, remove the assessment of whether market participants are capable of replacing any missing elements, add guidance to help entities assess whether an acquired process is substan-tive, narrow the definition of a business and of outputs, and introduce an optional fair value concentration test.
Since the amendments are applied prospectively to all business combinations and asset acquisitions for which the acquisition date is on or after the first annual reporting period beginning on or after 1 January 2020 with early application permitted.
6.3 Amendments to references to the conceptual framework in SLFRS standardsCA Sri Lanka has issued a revised Conceptual Framework which will be used in standard setting decisions with immediate effect. Key changes include:
• increasing the prominence of stewardship in the objective of financial reporting reinstating prudence as a component of neutrality• defining a reporting entity, which may be a legal entity, or a portion of an entity revising the definitions of an asset and a liability • removing the probability threshold for recognition and adding guidance on derecognition adding guidance on different measurement basis, and• stating that profit or loss is the primary performance indicator and that, in principle, income and expenses in other comprehensive income should be recycled where this enhances the relevance or faithful representation of the financial statements
Since the amendments are effective for annual periods beginning on or after 1 January 2020, the Company will not be affected by these amendments as at the reporting date. Further, the amendments to the references to the conceptual framework in SLFRS standards are not expected to have a significant impact on the Company’s Financial Statements.

Notes to the Financial Statements [Cont.]As at 31st March 2020
Commercial Credit and Finance PLC Annual Report 2019/2020142
151,807,501 702,762,570 854,570,071
685,290,915 1,063,305,989 1,748,596,904
161,734,254 1,046,727,284 1,208,461,539
693,020,974 1,647,059,240 2,340,080,214
2020LKR
2019LKR
2020LKR
2019LKR
Company Group
Cash in Hand Balances with banks
ACCOUNTING POLICY
7. CASH AND BANK BALANCES
3,782,330,697 29,949,186
3,812,279,883
3,577,171,569 26,013,169
3,603,184,738
3,797,046,955 29,949,186
3,826,996,141
3,487,111,876 26,013,169
3,513,125,045
2020LKR
2019LKR
2020LKR
2019LKR
Company Group
Time deposits Savings deposits
8. PLACEMENTS WITH BANKS
2,034,739,361 37,552,503
- 2,072,291,864
2,054,937,004 57,220,236
- 2,112,157,240
2,034,739,361 39,202,052
154,913,584 2,228,854,997
2,054,937,004 60,256,805 1,477,968
2,116,671,777
2020LKR
2019LKR
2020LKR
2019LKR
Company Group
Government of Sri Lanka Treasury bills Quoted equity investments (Note 9.1)Investments in unit trusts (Note 9.2)
9. FINANCIAL ASSETES RECOGNISED THROUGH PROFIT OR LOSS - MEASRED AT FAIR VALUE
Cash and cash equivalents are defined as cash in hand, demand deposits and investments with short maturities i.e. three months or less from the date of acquisition For the purpose of cash flow statement, cash and cash equivalents consist of cash in hand, deposits in banks net of outstanding bank overdrafts and reverse repurchase agreements. Investments with short maturities i.e. those having original maturities of three months or less from the date of acquisition are also treated as cash equivalents.

Risk
Man
agem
ent &
Corp
orat
e Go
vern
ance
Sust
aina
bilit
yRe
port
Man
agem
ent D
iscus
sion
and
Anal
ysis
Boa
rd o
f Dire
ctor
s &Ex
ecut
ive M
anag
emen
tHi
ghlig
hts
Fina
ncia
lIn
form
atio
n
Commercial Credit and Finance PLC Annual Report 2019/20 143
9.1 Quoted Equity Investments
464,790
36,000
9,000
107,500
25,451
55,440
5,926
10,000
10,224
912,525
-
152,251
3,917
24,888
132,000
8,385
22,658
330,000
61,816
-
-
20,602
-
-
-
17,520
80,028
55,000
48,353
9,742,783
1,619,855
292,500
491,500
2,282,816
7,695,374
518,180
240,000
2,500,000
15,119,199
-
5,204,103
598,787
2,460,594
5,744,058
593,600
2,999,284
4,290,000
1,023,948
-
-
360,535
-
-
-
2,135,000
4,984,942
913,000
71,810,059
4,545,062
76,355,121
6,135,228
1,119,600
68,400
204,250
2,061,531
2,966,040
337,782
240,000
1,025,467
7,938,968
-
3,456,098
452,022
1,022,897
1,953,600
628,875
1,499,960
2,013,000
754,155
-
-
226,622
-
-
-
1,401,600
1,600,560
445,850
37,552,503
1,649,549
39,202,052
300,000
36,000
9,000
25,000
93,068
5,926
10,000
10,000
4,549
1,000
291,500
3,917
30,000
132,000
8,207
22,244
330,000
60,000
55,000
45,417
20,602
28,000
25,000
390
-
14,800
55,000
48,353
6,240,000
1,816,200
292,500
2,282,816
12,918,345
518,180
240,000
2,500,000
81,882
116,000
8,779,447
532,547
2,966,000
5,744,058
593,600
2,999,284
4,290,000
1,023,948
11,893,391
5,594,507
360,535
7,417,770
1,840,980
15,581
-
803,985
913,000
82,774,558
4,545,062
87,319,620
3,900,000
1,162,800
104,400
2,112,500
5,826,057
462,228
240,000
1,750,000
38,667
75,000
7,753,897
611,052
1,800,000
1,953,600
737,809
2,095,385
4,290,000
804,000
11,660,000
2,679,603
327,572
5,042,800
870,000
11,856
-
306,360
605,000
57,220,236
3,036,568
60,256,805
Cost ofInvestment
LKR
No ofShares
MarketValue
LKR
Cost ofInvestment
LKR
No ofShares
MarketValue
LKR
Company/Group
2020 2019
Access Engineering PLCACL Cables PLCBrowns Beach Hotels PLCBrowns Investment PLCCentral Finance Company PLCChevron Lubricants Lanka PLCDipped Products PLCEntrust Securities PLCHatton National Bank PLCHayleys Fabric PLCHemas Holdings PLCJanashakthi Insurance Company PLCJohn Keells Holdings PLCLanka Walltile PLCMTD Walkers PLCNations Trust Bank PLCNDB Bank PLCOrient Finance PLCPeople's Leasing & Finance PLCRichard Peiris Exports PLCRoyal Ceramics Lanka PLCSerandib Hotels PLCSampath Bank PLCSwisstek (Ceylon) PLCTeejay Lanka PLCThree Acre Farms PLCTokyo Cement Company (Lanka) PLCUnion Bank of Colombo PLCTotal for Company
Trade Finance Investment PLCSeylan Bank PLCTotal for Group

Notes to the Financial Statements [Cont.]As at 31st March 2020
Commercial Credit and Finance PLC Annual Report 2019/2020144
No. ofUnits
Market ValueLKR
No. ofUnits
Market ValueLKR
Company/Group
2020 2019
National Equity Fund First Capital Money Market Fund
9.2 Investment in unit trusts
60,000
87,783
1,534,248
153,379,336
154,913,584
60,000
-
1,477,968
-
1,477,968
1,873,833,832
1,403,552,072
3,087,992,242
464,935,439
533,163,461
6,060,074,457
55,689,875
68,739,503
1,822,322,093
3,319,857,190
398,171,866
474,438,801
974,778,107
20,537,548,938
(2,317,606,656)
18,219,942,284
2,179,592,095
2,046,068,641
5,821,368,694
1,228,145,800
733,860,076
5,471,912,877
80,018,784
485,544,415
3,050,798,311
3,945,049,236
295,488,323
619,041,419
1,075,622,805
27,032,511,475
(3,328,396,080)
23,704,115,396
1,885,063,212
1,403,552,072
3,124,596,894
464,935,439
537,021,294
6,060,074,457
186,593,685
68,739,503
1,822,322,093
3,323,067,183
405,731,875
474,438,801
979,162,754
20,735,299,263
(2,358,033,189)
18,377,266,075
2,189,940,766
2,049,467,960
5,981,722,182
1,228,145,800
752,370,095
5,471,912,877
223,681,003
485,544,415
3,050,798,311
3,945,049,236
300,689,171
619,041,419
1,081,775,285
27,380,138,520
(3,379,800,584)
24,000,337,936
2020LKR
2019LKR
2020LKR
2019LKR
Company Group
Short term loansCash loans Microfinance loansAbhivurdhi SME loansBusiness loansGold LoansPawning advancesFactoring receivablesTerm draft loansAuto LoansStaff LoansEducation LoansOther Loans
Less : Allowance for impairment losses (Note 10.1)
Net loans and advances
10. Loans and Receivable
3,328,396,080
-
3,328,396,080
782,722,709
(1,793,512,134)
2,317,606,655
2,163,290,880
2,081,389,745
4,244,680,625
1,817,059,672
(2,733,344,217)
3,328,396,080
3,379,800,584
-
3,379,800,584
771,744,738
(1,793,512,133)
2,358,033,189
2,171,532,015
2,100,433,703
4,271,965,718
1,884,317,983
(2,776,483,116)
3,379,800,584
2020LKR
2019LKR
2020LKR
2019LKR
Company Group
Balance as at 31st March Impact on adoption of SLFRS 9 as at 1st April Balance as at 1st April Charge / (Reversal) for the year Amounts written off As at 31 March
10.1 Allowance for impairment Losses

Risk
Man
agem
ent &
Corp
orat
e Go
vern
ance
Sust
aina
bilit
yRe
port
Man
agem
ent D
iscus
sion
and
Anal
ysis
Boa
rd o
f Dire
ctor
s &Ex
ecut
ive M
anag
emen
tHi
ghlig
hts
Fina
ncia
lIn
form
atio
n
Commercial Credit and Finance PLC Annual Report 2019/20 145
10.2 Gross Loans and Receivables
Company 2020
1,873,827,139
311,050,656
2,184,744,497
145,740,682
127,336,550
3,558,160,277
38,999,845
351,344,239
1,479,621,024
338,836,851
256,039,991
225,319,784
10,891,021,534
-
235,352,819
95,345,982
35,193,743
609,785
1,478,565,031
706,018
873,477,162
981,517,661
33,588,668
104,425,993
196,217,746
4,035,000,609
6,693
857,148,597
807,901,763
284,001,015
405,217,125
1,079,039,024
29,033,640
597,500,692
858,718,504
25,746,347
113,972,817
553,240,577
5,611,526,794
1,873,833,832
1,403,552,072
3,087,992,242
464,935,439
533,163,461
6,115,764,332
68,739,503
1,822,322,093
3,319,857,189
398,171,865
474,438,801
974,778,107
20,537,548,938
Stage 1 Stage 2 Stage 3 Total
Short term loansCash loans Microfinance loansAbhivurdhi SME loansBusiness loansGold Loans / Pawning advancesFactoring receivablesTerm draft loansAuto LoansStaff LoansEducation LoansOther Loans
Less: Impairment allowance
3,329,404
28,899,511
91,493,122
27,356,198
15,842,541
46,019,143
3,241,280
6,070,472
14,067,087
21,116,005
10,800,326
41,041,964
309,277,052
10,581,744,482
-
73,635,469
21,564,288
7,306,946
79,588
70,889,427
498,624
19,693,848
32,462,271
10,378,397
11,213,175
47,797,476
295,519,510
3,739,481,100
-
328,056,987
445,283,836
148,814,542
135,642,737
130,840,064
64,659,804
108,998,589
144,825,382
20,194,258
24,352,926
161,140,969
1,712,810,094
3,898,716,701
3,329,404
430,591,967
558,341,246
183,477,686
151,564,867
247,748,633
68,399,708
134,762,909
191,354,740
51,688,661
46,366,426
249,980,409
2,317,606,655
18,219,942,284
Short term loansCash loans Microfinance loansAbhivurdhi SME loansBusiness loansGold Loan / Pawning advancesFactoring receivablesTerm draft loansAuto LoansStaff LoansEducation LoansOther Loans
Net Loans and Receivables
The Company's allowance for impairment losses consists of collective impairment amounting to LKR 2,150,213,027/- ( 2019 - LKR 3,170,255,645/) and individual impairement amounting to LKR 167,393,628/- ( 2019 - LKR 158,140,435/-). The Group's allowance for impairment losses consists of collective impairment amounting LKR 2,182,528,026/- (2019- LKR 3,215,288,668/-) and individual impairement amounting to LKR 175,505,161/- ( 2019 - LKR 164,511,918/- ).

Notes to the Financial Statements [Cont.]As at 31st March 2020
Commercial Credit and Finance PLC Annual Report 2019/2020146
Group 2020
1,885,056,519
311,050,656
2,221,349,149
145,740,682
131,194,383
3,689,064,087
38,999,845
351,344,239
1,479,621,024
338,836,851
256,039,991
239,759,157
11,088,056,583
-
235,352,819
95,345,982
35,193,743
609,785
1,478,565,031
706,018
873,477,162
981,517,661
33,588,668
104,425,993
196,217,746
4,035,000,609
6,693
857,148,597
807,901,763
284,001,015
405,217,125
1,079,039,024
29,033,640
597,500,692
861,928,497
33,306,356
113,972,817
543,185,851
5,612,242,070
1,885,063,212
1,403,552,072
3,124,596,894
464,935,439
537,021,294
6,246,668,142
68,739,503
1,822,322,093
3,323,067,182
405,731,874
474,438,801
979,162,754
20,735,299,263
Stage 1 Stage 2 Stage 3 Total
Short term loansCash loans Microfinance loansAbhivurdhi SME loansBusiness loansGold Loan / Pawning advancesFactoring receivablesTerm draft loansAuto LoansStaff LoansEducation LoansOther Loans
Less: Impairment allowance
28,899,511
122,873,475
27,356,198
17,206,558
46,460,966
3,241,280
6,070,472
14,067,087
21,116,005
10,800,326
41,041,964
339,133,841
10,748,922,742
73,635,469
21,564,288
7,306,946
79,588
70,889,427
498,624
19,693,848
32,462,271
10,378,397
11,213,175
47,797,476
295,519,510
3,739,481,100
328,056,987
445,283,836
148,814,542
135,642,737
130,840,064
64,659,804
108,998,589
144,825,382
20,194,258
24,352,926
171,710,714
1,723,379,839
3,888,862,232
430,591,967
589,721,599
183,477,686
152,928,884
248,190,456
68,399,708
134,762,909
191,354,740
51,688,661
46,366,426
260,550,154
2,358,033,189
18,377,266,075
Cash loans Microfinance loansAbhivurdhi SME loansBusiness loansGold Loan / Pawning advancesFactoring receivablesTerm draft loansAuto LoansStaff LoansEducation LoansOther Loans
Net Loans and Receivables

Risk
Man
agem
ent &
Corp
orat
e Go
vern
ance
Sust
aina
bilit
yRe
port
Man
agem
ent D
iscus
sion
and
Anal
ysis
Boa
rd o
f Dire
ctor
s &Ex
ecut
ive M
anag
emen
tHi
ghlig
hts
Fina
ncia
lIn
form
atio
n
Commercial Credit and Finance PLC Annual Report 2019/20 147
10.3 Gross Loans and ReceivablesCompany 2019
2,179,592,095
992,753,919
3,655,229,488
951,347,902
285,448,601
3,895,395,171
440,595,189
1,680,091,959
2,247,558,979
457,721,006
651,757,722
17,437,492,030
-
420,132,768
480,411,215
106,528,820
84,557,221
1,009,904,536
1,622,062
1,151,453,308
1,333,935,176
95,227,322
219,700,016
4,903,472,445
-
633,181,953
1,685,727,990
170,269,078
363,854,254
646,631,954
43,327,164
219,253,045
363,555,082
66,093,090
499,653,391
4,691,547,000
2,179,592,095
2,046,068,640
5,821,368,694
1,228,145,800
733,860,076
5,551,931,660
485,544,415
3,050,798,311
3,945,049,237
619,041,419
1,371,111,129
27,032,511,475
Stage 1 Stage 2 Stage 3 Stage 4
Short term loansCash loans Microfinance loansAbhivurdhi SME loansBusiness loansGold Loans / Pawning advancesFactoring receivablesTerm draft loansAuto LoansEducation LoansOther Loans
Less: Impairment allowance
158,931,643
90,411,487
96,943,185
37,245,036
161,088,302
63,649,860
81,479,583
30,122,987
15,830,980
227,562,876
963,265,937
16,474,226,094
73,907,900
94,700,498
20,503,760
13,605,661
105,317,279
1,620,845
78,032,371
53,160,392
8,167,959
70,838,707
519,855,371
4,383,617,073
230,858,140
902,033,115
102,348,743
157,949,132
64,663,195
43,327,164
75,466,898
63,419,587
10,072,587
195,136,212
1,845,274,772
2,846,272,228
463,697,683
1,087,145,099
219,795,687
208,799,828
331,068,776
108,597,868
234,978,851
146,702,966
34,071,526
493,537,795
3,328,396,080
23,704,115,396
Cash loans Microfinance loansAbhivurdhi SME loansBusiness loansGold Loans / Pawning advancesFactoring receivablesTerm draft loansAuto LoansEducation LoansOther Loans
Net Loan and Receivable

Notes to the Financial Statements [Cont.]As at 31st March 2020
Commercial Credit and Finance PLC Annual Report 2019/2020148
11 LEASE RENTALS RECEIVABLE AND STOCKS OUT ON HIRE
51,842,699,758
11,221,195,864
63,063,895,622
(17,115,122,635)
45,948,772,987
(2,553,390,942)
43,395,382,046
43,104,892,087
10,438,632,800
53,543,524,887
(14,777,886,830)
38,765,638,057
(1,615,190,155)
37,150,447,901
64,436,711,680
11,221,410,413
75,658,122,093
(19,639,240,283)
56,018,881,810
(3,329,381,466)
52,689,500,344
52,388,217,616
10,439,581,743
62,827,799,359
(14,777,886,830)
48,049,912,529
(1,967,945,330)
46,081,967,198
2020LKR
2019LKR
2020LKR
2019LKR
Company Group
Gross rentals receivable - Lease rentals - Amounts receivable from hirers Less: Unearned income Net rentals receivable Less : Allowance for impairment losses (Note 11.1) Total net rentals receivable (Note 11.2 & 11.3)
Group 2019
2,179,592,095
992,753,919
3,784,532,536
951,347,902
296,531,508
3,895,395,171
440,595,189
1,680,091,959
2,247,558,979
457,721,006
651,757,722
17,577,877,986
-
420,132,768
480,411,111
106,528,820
91,984,333
1,009,904,536
1,622,062
1,151,453,308
1,333,935,176
95,227,322
219,700,016
4,910,899,453
-
633,181,953
1,685,727,990
201,319,623
363,854,254
790,294,173
43,327,164
219,253,045
363,555,082
66,093,090
524,754,708
4,891,361,081
2,179,592,095
2,046,068,640
5,950,671,637
1,259,196,345
752,370,096
5,695,593,879
485,544,415
3,050,798,311
3,945,049,237
619,041,419
1,396,212,446
27,380,138,520
Stage 1 Stage 2 Stage 3 Total
Short term loansCash loans Microfinance loansAbhivurdhi SME loansBusiness loansGold Loans / Pawning advancesFactoring receivablesTerm draft loansAuto LoansEducation LoansOther Loans
Less: Impairment allowance
158,931,643
104,685,597
96,943,185
37,374,385
161,088,302
63,649,860
81,479,583
30,122,987
15,830,980
227,562,876
977,669,396
16,600,208,589
73,907,900
94,700,498
20,503,760
14,871,977
105,317,279
1,620,845
78,032,371
53,160,392
8,167,959
70,838,707
521,121,688
4,389,777,765
230,858,140
928,788,490
102,348,743
157,949,132
67,271,063
43,327,164
75,466,898
63,419,587
10,072,587
201,507,695
1,881,009,499
3,010,351,582
463,697,683
1,128,174,586
219,795,687
210,195,494
333,676,644
108,597,868
234,978,851
146,702,966
34,071,526
499,909,278
3,379,800,584
24,000,337,936
Cash loans Microfinance loansAbhivurdhi SME loansBusiness loansGold Loans / Pawning advancesFactoring receivablesTerm draft loansAuto LoansEducation LoansOther Loans
Net Loan and Receivable

Risk
Man
agem
ent &
Corp
orat
e Go
vern
ance
Sust
aina
bilit
yRe
port
Man
agem
ent D
iscus
sion
and
Anal
ysis
Boa
rd o
f Dire
ctor
s &Ex
ecut
ive M
anag
emen
tHi
ghlig
hts
Fina
ncia
lIn
form
atio
n
Commercial Credit and Finance PLC Annual Report 2019/20 149
11.2 Gross rentals receivable
11.1 Allowance for impairment losses
1,615,190,155
-
1,615,190,155
1,886,472,724
(948,271,938)
2,553,390,942
1,708,380,873
848,099,441
2,556,480,314
1,061,304,038
(2,002,594,197)
1,615,190,155
1,967,945,330
-
1,967,945,330
2,588,051,906
(1,226,615,770)
3,329,381,466
1,824,657,891
1,196,181,891
3,020,839,782
1,185,525,725
(2,238,420,177)
1,967,945,330
2020LKR
2019LKR
2020LKR
2019LKR
Company Group
As at 01 April Impact on adoption of SLFRS 9 as at 1st April Balance as at 1st April Charge / (Reversal) for the year Amounts written off As at 31 March
13,706,584,590
2,854,701,610
16,561,286,200
454,678,203
71,590,892
526,269,095
16,035,017,105
16,018,842,130
2,854,701,610
18,873,543,740
722,072,134
71,590,892
793,663,026
18,079,880,714
9,772,316,648
2,167,294,809
11,939,611,457
1,198,130,381
210,237,102
1,408,367,483
10,531,243,974
13,158,844,314
2,167,294,809
15,326,139,123
1,591,953,429
211,108,295
1,803,061,724
13,523,077,399
(14,744,793,301)
(2,370,329,334)
(17,115,122,635)
-
-
-
(17,115,122,635)
(17,268,910,948)
(2,370,329,334)
(19,639,240,283)
-
-
-
(19,639,240,283)
37,097,906,457
8,850,866,530
45,948,772,987
2,158,882,973
394,507,969
2,553,390,942
43,395,382,045
47,167,800,731
8,851,081,079
56,018,881,810
2,934,002,305
395,379,162
3,329,381,466
52,689,500,343
Stage 2
28,363,798,520
6,199,199,445
34,562,997,965
506,074,389
112,679,974
618,754,363
33,944,243,601
35,259,025,235
6,199,413,994
41,458,439,229
619,976,741
112,679,974
732,656,716
40,725,782,513
Stage 1 Stage 3 UnearnedIncome
Total
Stage 2Stage 1 Stage 3 UnearnedIncome
Total
LeaseAmounts receivable from hirers
Less: Impairment allowance LeaseAmounts receivable from hirers
Net Loans and Receivables
Group 2020
LeaseAmounts receivable from hirers
Less: Impairment allowance LeaseAmounts receivable from hirers
Net Loans and Receivables
The Company's allowance for impairment losses consists of collective impairment amounting to LKR 2,540,042,040/- ( 2019 collective impairment -LKR 1,585,830,407/-) and individual impairment amounting Rs.13,348,901/- (2019 - LKR 29,359,479/-)
The Group's allowance for impairment losses consists of collective impairment amounting LKR 3,263,203,476/- (2019 - LKR 1,880,175,910/-) and individual impairment amounting to LKR 66,177,991/- ( 2019 - LKR 87,769,420/-).
Company 2020

Notes to the Financial Statements [Cont.]As at 31st March 2020
7,815,526,628
2,099,995,150
9,915,521,778
389,694,043
59,103,754
448,797,797
9,466,723,981
9,676,607,756
2,099,995,150
11,776,602,906
512,666,727
59,103,754
571,770,481
11,204,832,425
3,752,641,922
855,022,927
4,607,664,849
639,877,897
98,572,879
738,450,775
3,869,214,074
4,212,452,929
855,022,927
5,067,475,856
791,106,213
98,572,879
889,679,091
4,177,796,765
(12,267,417,335)
(2,510,469,495)
(14,777,886,830)
-
-
-
(14,777,886,830)
(12,267,417,335)
(2,510,469,495)
(14,777,886,830)
-
-
-
(14,777,886,830)
30,837,474,752
7,928,163,305
38,765,638,057
1,395,388,185
219,801,971
1,615,190,156
37,150,447,901
40,120,800,281
7,929,112,248
48,049,912,529
1,748,143,359
219,801,971
1,967,945,330
46,081,967,199
Stage 2
31,536,723,537
7,483,614,722
39,020,338,260
365,816,245
62,125,338
427,941,583
38,592,396,676
38,499,156,931
7,484,563,665
45,983,720,596
444,370,419
62,125,338
506,495,757
45,477,224,893
Stage 1 Stage 3 UnearnedIncome
Total
Stage 2Stage 1 Stage 3 UnearnedIncome
Total
LeaseAmounts receivable from hirers
Less: Impairment allowance LeaseAmounts receivable from hirers
Net Loans and Receivables
Group 2019
LeaseAmounts receivable from hirers
Less: Impairment allowance LeaseAmounts receivable from hirers
Net Loans and Receivables
Company 2019
Commercial Credit and Finance PLC Annual Report 2019/2020150
11.3 Maturity of lease rentals receivables and stock out on hire - Company
23,437,852,319
7,437,047,230
30,874,899,548
(8,709,317,696)
22,165,581,852
28,388,697,882
3,784,043,313
32,172,741,195
(8,405,131,082)
23,767,610,113
16,149,557
105,321
16,254,878
(673,856)
15,581,022
51,842,699,758
11,221,195,864
63,063,895,622
(17,115,122,635)
45,948,772,987
(2,553,390,942)
43,395,382,046
Within 0ne year
LKR
1-5 YearsLKR
Over 5 YearsLKR
TotalLKR
Gross rentals receivable- Lease rentals- Amounts receivable from hirers
Less: Unearned incomeNet rentals receivable
Less : Allowance for impairment lossesTotal net rentals receivable
As at 31 March 2020
17,302,079,041
5,491,159,021
22,793,238,062
(8,128,453,853)
14,664,784,209
22,314,661,945
4,231,608,655
26,546,270,600
(6,649,214,660)
19,897,055,940
3,488,151,101
715,865,123
4,204,016,224
(218,317)
4,203,797,908
43,104,892,087
10,438,632,800
53,543,524,887
(14,777,886,830)
38,765,638,057
(1,615,190,155)
37,150,447,902
Within 0ne year
LKR
1-5 YearsLKR
Over 5 YearsLKR
TotalLKR
Gross rentals receivable - Lease rentals - Amounts receivable from hirers Less: Unearned income Net rentals receivable Less : Allowance for impairment Losses Total net rentals receivable
As at 31 March 2019

Risk
Man
agem
ent &
Corp
orat
e Go
vern
ance
Sust
aina
bilit
yRe
port
Man
agem
ent D
iscus
sion
and
Anal
ysis
Boa
rd o
f Dire
ctor
s &Ex
ecut
ive M
anag
emen
tHi
ghlig
hts
Fina
ncia
lIn
form
atio
n
Commercial Credit and Finance PLC Annual Report 2019/20 151
11.4 Maturity of lease rentals receivables and stock out on hire - Group
35,672,360,017 7,437,261,779
43,109,621,795 (11,213,053,425) 31,896,568,370
28,748,202,105
3,784,043,313
32,532,245,418 (8,425,513,001)
24,106,732,416
16,149,557
105,321
16,254,878 (673,856)
15,581,022
64,436,711,678
11,221,410,413
75,658,122,091 (19,639,240,282)
56,018,881,809
(3,329,381,466)
52,689,500,344
Within 0ne year
LKR
1-5 YearsLKR
Over 5 YearsLKR
TotalLKR
Gross rentals receivable- Lease rentals- Amounts receivable from hirers
Less: Unearned incomeNet rentals receivable
Less : Allowance for impairment lossesTotal net rentals receivable
As at 31 March 2020
29,128,403,173
5,492,255,345
34,620,658,519
(10,721,895,333)
23,898,763,186
19,771,663,341
4,231,461,274
24,003,124,615
(4,055,773,181)
19,947,351,435
3,488,151,101
715,865,123
4,204,016,224
(218,317)
4,203,797,908
52,388,217,616
10,439,581,743
62,827,799,358
(14,777,886,830)
48,049,912,528
(1,967,945,330)
46,081,967,198
Within 0ne year
LKR
1-5 YearsLKR
Over 5 YearsLKR
TotalLKR
Gross rentals receivable - Lease rentals - Amounts receivable from hirers Less: Unearned income Net rentals receivable Less : Allowance for impairment Losses Total net rentals receivable
As at 31 March 2019

Notes to the Financial Statements [Cont.]As at 31st March 2020
Commercial Credit and Finance PLC Annual Report 2019/2020152
200
40,000
555,556
700,504
400,000
10,000,000
2,354,019
200,000
3,737,842
6,291,861
200
40,000
555,556
700,504
400,000
10,000,000
2,241,764
400,000
3,737,842
6,179,606
CarryingValue
LKR
No ofShares
Fair Value
LKR
Carryingt Valu
LKR
No ofShares
FairValue
LKR
2020 2019
Credit Information BureauFinance House Consortium (Pvt) LtdCeylon Asset Management Company LimitedTotal
10,000,000
6,262,158
3,737,842
10,000,000
6,262,158
3,737,842
Ceylon Asset Management Company Limited Cost of Investment Gain/(losses) from market value as at 31 March Market Value
100
20,000
555,556
372,637
200,000
10,000,000
10,572,637
372,637
200,000
3,737,842
4,310,479
100
20,000
555,556
372,637
200,000
10,000,000
10,572,637
372,637
200,000
3,737,842
4,310,479
CarryingValue
LKR
No ofShares
Fair Value
LKR
Carryingt Valu
LKR
No ofShares
FairValue
LKR
Company/Group
2020 2019
2020 2019
2020 2019
Credit Information BureauFinance House Consortium (Pvt) LtdCeylon Asset Management Company Limited Total
10,000,000
(6,262,158)
3,737,842
10,000,000
(6,262,158)
3,737,842
Ceylon Asset Management Company Limited Cost of Investment Gain/(losses) from market value as at 31 March Market Value
12 DEBT AND OTHER INSTUMENTS
104,822,765
10,000,000
114,822,765
177,244,522
10,000,000
187,244,522
104,822,765
10,000,000
114,822,765
177,244,522
10,000,000
187,244,522
2020LKR
2019LKR
2020LKR
2019LKR
Company Group
Investment in Commercial PapersInvestment in debentures
13 FINANCIAL ASSETS AT FAIR VALUE THROUGH OTHER COMPREHENSIVE INCOME
-
4,310,479
4,310,479
-
4,310,479
4,310,479
60,931,842
6,291,861
67,223,703
56,928,315
6,179,606
63,107,921
2020LKR
2019LKR
2020LKR
2019LKR
Company Group
Financial assets at fair value through other comprehensive incomeGovernment of Sri Lanka Treasury BillsUnquoted equity investments (Note 13.1)
13.1 Unquoted Equity Investments
Company
Group

Risk
Man
agem
ent &
Corp
orat
e Go
vern
ance
Sust
aina
bilit
yRe
port
Man
agem
ent D
iscus
sion
and
Anal
ysis
Boa
rd o
f Dire
ctor
s &Ex
ecut
ive M
anag
emen
tHi
ghlig
hts
Fina
ncia
lIn
form
atio
n
Commercial Credit and Finance PLC Annual Report 2019/20 153
14 OTHER FINANCIAL ASSETS
64,360,392
367,956,719
167,296,620
143,672,195
743,285,925
45,021,547
394,160,576
190,975,430
-
630,157,553
64,360,392
349,956,719
167,296,620
143,672,195
725,285,925
45,021,547
394,160,576
190,975,430
-
630,157,553
2020LKR
2019LKR
2020LKR
2019LKR
Company Group
Refundable deposits Other receivables Compensation receivable from Government over acquisition of investment property ( Note 14.1) Debt Relief Obligation receivable from Government
14.1 Compensation receivable from government over acquisition of investment property
214,654,240
(47,357,620)
167,296,620
214,654,240
(23,678,810)
190,975,430
214,654,240
(47,357,620)
167,296,620
214,654,240
(23,678,810)
190,975,430
2020LKR
2019LKR
2020LKR
2019LKR
Company Group
Government Compensation receivable (Note 19.2)Less : Allowance for impairment losses
15 INVENTORIES
65,910,298
65,910,298
77,133,325
77,133,325
65,910,298
65,910,298
77,133,325
77,133,325
2020LKR
2019LKR
2020LKR
2019LKR
Company Group
Real estate stocks
16 OTHER ASSETS
34,977,106
-
138,222,412
173,199,518
269,760,265
17,264,204
35,836,006
322,860,475
52,582,519
-
205,404,140
257,986,659
295,743,176
17,264,204
76,863,359
389,870,741
2020LKR
2019LKR
2020LKR
2019LKR
Company Group
Pre-paid expensesTax receivableSundry assets
As of 31 March 2020 , provision for inventories amounting to Rs.10,344,697/- ( 2019-Rs.41,392,028/-) was recognised and the invento-ry balances are carried at net realisable value.
Inventories are valued at the lower of cost and net realizable value. Company evaluates the net realizable value considering the current market prices at which such stocks can be sold in the ordinary course of business.

Notes to the Financial Statements [Cont.]As at 31st March 2020
Commercial Credit and Finance PLC Annual Report 2019/2020154
Company/Group
19 INVESTMENT PROPERTY
1,448,351,320
229,784,208
(18,902,183)
(15,600,000)
-
54,828,026
1,698,461,370
1,983,431,494
516,705,670
(19,307,500)
-
(1,241,275,192)
208,796,848
1,448,351,320
2020LKR
2019LKR
Balance at 1 AprilAcquired during the yearDisposal During the yearTransferred to Other financial assets( Note 19.1)Transferred to Property Plant & Equipments Net fair value adjustmentBalance at 31 March
17 INVESTMENT IN SUBSIDIARY
99.65% 99.65% 1,599,288,321
1,599,288,321
1,599,288,321
1,599,288,321
2020LKR
2019LKR
2020LKR
2019LKR
Effective Holding % Group
Trade Finance and Investments PLCTotal
18 INVESTMENT IN ASSOCIATES
390,000,000
390,000,000
390,000,000
390,000,000
364,203,089
364,203,089
379,914,143
379,914,143
2020LKR
2019LKR
2020LKR
2019LKR
Company Group
TVS Lanka (Private) Ltd(Note 18.1)
18.1 TVS Lanka (Private) Limited 390,000,000
-
-
390,000,000
-
-
390,000,000
390,000,000
379,914,143
(15,711,053)
-
364,203,089
-
(10,085,857)
390,000,000
379,914,143
As at 1 AprilShare of profit/(loss) for the yearInvestments in equity during the yearAs at 31 March
18.2 The financial information of the TVS Lanka (Private) Limited is as follows,
11,986,848,957
12,067,418,462
(80,569,505)
334,153,965
6,938,367,525
7,272,521,490
5,499,488,948
5,499,488,948
11,784,610,883
11,768,285,616
16,325,267
358,832,227
6,103,508,083
6,462,340,310
4,237,383,358
4,237,383,358
Group
RevenueExpensesNet Profit/(Loss) after tax for the year/periodAs at 31 MarchNon Current AssetsCurrent AssetsTotal assetsCurrent LiabilitiesTotal liabilities
2020LKR
2019LKR

Risk
Man
agem
ent &
Corp
orat
e Go
vern
ance
Sust
aina
bilit
yRe
port
Man
agem
ent D
iscus
sion
and
Anal
ysis
Boa
rd o
f Dire
ctor
s &Ex
ecut
ive M
anag
emen
tHi
ghlig
hts
Fina
ncia
lIn
form
atio
n
Commercial Credit and Finance PLC Annual Report 2019/20 155
19.3 Fair value of the investment property is ascertained by independent valuations carried out by Chartered valuation surveyors, who have recent experience in valuing properties of akin location and category. Investment property is appraised in accordance with SLFRS 13, International Valuation Standards published by the International Valuation Standards Committee (IVSC) and Sri Lankan Valuation Standrads by the independent valuers.
In determining the fair value, the current condition of the properties, future usability and associated redevelopment requirements have been considered. Also, the valuers have made reference to market evidence of transaction prices for similar properties, with appropriate adjustments for size and location. The appraised fair values are rounded within the range of values.
Company/Group
1,017,472
-
1,017,472
4,703,123
-
4,703,123
2020LKR
2019LKR
Rental income derived from investment propertiesDirect operating expensesProfit arising from investment properties carried at fair value
240,660,000
Property Method ofvaluation
Effective dateof valuation
Significant unobservableinputs ( Level 3)
Sensitivity of fair valueto un-observable inputs
ValueLKR
Lot numbers 1 to 77 in plan No. 87/2010 dated 14/07/2010, Rassandeniya, Matara
Residual Method of valuation
31-Mar-20 "Estimated price per perch LKR 280,000/- (Land Extent - 955 perches)"
Positively correlated sensitivity
19.2 During the financial year 2014/2015, The government of Sri Lanka, under the provisions of section 38 of the land acquisition Act No.28 of 1964, has acquired the Lot numbers 1 to 77 in plan No. 87/2010 dated 14/07/2010 of the investment property located at Rassandeniya, Matara. Such land extent acquired was 955 perches out of the total of 1,511 perches.
By a letter dated 9th August 2019 by "Divisional Secretariat of Matara Four Gravets", it has been informed that the initiatives are in progress to pay the compensation. Further on 25 May 2016, the government of Sri Lanka, under the provisions of section 7 of the land acquisition Act No.28 of 1964, has issued the gazette notice detailing lands that is intended to be acquired and has requested the persons interested to calim for compensations through acquiring officer.
Accordingly, an amount corresponding to such compensation receivable was transferred to other financial assets. Value of such compensation was decided based on the valuation performed by M/S. Sunil Fernando Associates (Pvt) Ltd, a firm of chartered valuation surveyors based on the residual method of valuation as at 31 March 2020. ( Note 14)

Notes to the Financial Statements [Cont.]As at 31st March 2020
Commercial Credit and Finance PLC Annual Report 2019/2020156
Property Method ofvaluation
Effective dateof valuation
Significantunobservableinputs ( Level 3)
Sensitivity offair value to un-observable inputs
Value 2019LKR
Value 2020LKR
No ofBuildings
Comparison Method of valuation
Comparison Method of valuationComparison Method of valuationComparison Method of valuation
Comparison Method of valuation
31-Mar-20
31-Mar-20
31-Mar-20
31-Mar-20
31-Mar-20
Estimated price per perch LKR 210,000/- (Land Extent -350.1 perches)
Estimated price per perch LKR 16,000,000/- (Land Extent -22.5perches) Estimated price per perch LKR 3,500,000/-(Land Extent - 29.34 perches) Estimated price per perch LKR 225,000/- (Land Extent - 45 perches) Estimated current cost of construction per square feet LKR 3,250/-( 8,2254/- square feet)"Estimated price per perch LKR 5,600,000/- (Land Extent - 18.5 perches)" Estimated current cost of construction per square foot LKR 6,650/- ( 12267 square feet)
-
-
-
1
1
Positively correlated sensitivity
Positively correlated sensitivityPositively correlated sensitivityPositively correlated sensitivity
Positively correlated sensitivity
47,788,650
360,000,000
102,700,000
36,950,000
185,000,000
47,788,650
360,000,000
95,350,000
36,950,000
183,000,000
Lot No. 5A,5B & 6A in plan No. 88/2010 at Rassandeniya, MataraLot 4A in Survey Plan No.519,Thurstan Road,Colombo 03.Lot No. 1,2 & 3 in Plan No.9327/2014 at Main Street,NegomboLot No. 1 in Plan No.0082 at Magammana, Dehiowita
Lot no.01 in Plan No.1351 at Kandy Road, Nuwaraeliya
Description of valuation techniques used and key inputs to valuation on investment properties:
1. Mr. Sunil Fernando2. Mr.A.B.M.Gunadasa3. Mr. H M N Herath 4. Mr.R M Gunarathna5. Mr. L.K.D.A.Kulathunga6. Mr. L P Wijeweera7. Mrs.W.A.C.Wikramarachchi8. Mr.M.A.A.Sarath9. Mr.K.G.A.Shantha10. Mr.T.M.B.Thennakoon11. Mr.KUM Dissanayake
12. Mrs.G.Wanigathunga 13. Mr.M.M.S.Manathunga 14. Mr Nilantha Jayawardane 15. Mr.KRN Jayawardana 16. Mr GMG Senavirathne 17. Mr WDA Welikalage 18. Mrs. H.M.U. Ranasinghe Kumarapeliya 19. Mrs.K.P.Iresha Udayangani 20. Mr.D Jayawardena 21. Mr.HD Wickramasinghe
19.4 Investment properties are stated at fair value, which have been determined based on valuations performed by following independent chartered valuation surveyors, as at 31 March 2020.

Risk
Man
agem
ent &
Corp
orat
e Go
vern
ance
Sust
aina
bilit
yRe
port
Man
agem
ent D
iscus
sion
and
Anal
ysis
Boa
rd o
f Dire
ctor
s &Ex
ecut
ive M
anag
emen
tHi
ghlig
hts
Fina
ncia
lIn
form
atio
n
Property Method ofvaluation
Effective dateof valuation
Significantunobservableinputs ( Level 3)
Sensitivity offair value to un-observable inputs
Value 2019LKR
Value 2020LKR
No ofBuildings
Commercial Credit and Finance PLC Annual Report 2019/20 157
Comparison Method of valuation
Comparison Method of valuation
Comparison Method of valuation
Comparison Method of valuation
Comparison Method of valuation
Comparison Method of valuationComparison Method of valuation
Comparison Method of valuation
Comparison Method of valuation
31-Mar-20
31-Mar-20
31-Mar-18
31-Mar-20
31-Mar-20
31-Mar-20
31-Mar-20
23-Jul-18
27-Jan-18
"Estimated price per perch LKR 775,000/- (Land Extent - 13.5 perches)" Estimated current cost of construction per square foot LKR 3,500/- ( 2832 square feet) "Estimated price per perch LKR 475,000/- (Land Extent - 383.45 perches)" "Estimated price per perch LKR 150,000/- (Land Extent - 32.2 perches)" Estimated current cost of construction per square foot LKR 3,000/- ( 1000 square feet)"Estimated price per perch LKR 700,000/- (Land Extent - 263.39 perches)"
"Estimated price per perch LKR 675,000/- (Land Extent - 20 perches)"
"Estimated price per perch LKR 230,000/-(Land Extent - 171.5perches)""Estimated price per perch LKR 1,500,000/- (Land Extent - 15.70 perches)" Estimated current cost of construction per square foot LKR 3,000/- ( 809 square feet)"Estimated price per perch LKR 80,000/- (Land Extent - 1A )"
"Estimated price per perch LKR 45,000/- (Land Extent - 1R-10P)"
1
-
1
-
1
-
1
-
Positively correlated sensitivity
Positively correlated sensitivity
Positively correlated sensitivity
Positively correlated sensitivity
Positively correlated sensitivity
Positively correlated sensitivityPositively correlated sensitivity
Positively correlated sensitivity
Positively correlated sensitivity
18,989,000
172,500,000
8,050,000
181,700,000
16,640,000
20,670,000
24,800,000
2,500,000
1,000,000
18,900,000
182,100,000
8,050,000
184,400,000
13,500,000
21,100,000
26,000,000
2,500,000
1,016,640
Lot No. 3 in Plan No.1143 at Kuda-Pay-agala,Payagala
Lot No 283 in Plan No 520004 at Moragahahena Road,HomagamaLot No. 2A In Plan No.1280A/2008 at Gonnagahawatta
Lot No.01 in Plan No.5258 at Athurugiriya Road, HomagamaLot No.15A in Olan No.7177 at 4th Lane,Gadabuwana Road, KesbawaLot No.1 in Plan No.802 at NawagamuwaLot No. 2B in Plan No.477 at Bangalawatta Road, Kottawa
Lot No.2 in Plan No.3047 Bunnehepola, Udubaddawa, KurunegalaLot No. 01 Plan No.1801 Demataluwa, Kurunegala

Notes to the Financial Statements [Cont.]As at 31st March 2020
Property Method ofvaluation
Effective dateof valuation
Significantunobservableinputs ( Level 3)
Sensitivity offair value to un-observable inputs
Value 2019LKR
Value 2020LKR
No ofBuildings
Commercial Credit and Finance PLC Annual Report 2019/2020158
Comparison Method of valuation
Comparison Method of valuationComparison Method of valuation
Comparison Method of valuation
Comparison Method of valuation
Comparison Method of valuation
Comparison Method of valuation
Comparison Method of valuation
Positively correlated sensitivity
26-Sep-18
23-Aug-18
12-Nov-18
29-Dec-18
7-Mar-19
8-Feb-18
27-Feb-19
31-Mar-20
"Estimated price per perch LKR 325,0000/- (Land Extent - 40 perches)"
"Estimated price per perch LKR 325,0000/- (Land Extent - 40 perches)""Estimated price per perch LKR 400,00/- (Land Extent - 192 perches)" "Estimated price per perch LKR 600,000/- (Land Extent - 10.6 perches)"
"Estimated price per perch LKR 3,500,000/- (Land Extent - 9.3 perches)"
Estimated current cost of construction per square foot LKR 3,500/- ( 809 square feet)
"Estimated price per perch LKR 700,000/- (Land Extent - 11.7 perches)"
"Estimated price per perch LKR 3,100,000/- (Land Extent - 18.15 perches)" Estimated current cost of construction per square foot LKR 4,500/- ( 4956 square feet)"Estimated price per perch LKR 150,000/- (Land Extent - 21.5 perches)"
-
Positively correlated sensitivity
Positively correlated sensitivityPositively correlated sensitivity
Positively correlated sensitivity
Positively correlated sensitivity
Positively correlated sensitivity
Positively correlated sensitivity
Positively correlated sensitivity
Positively correlated sensitivity
8,813,000
7,360,495
4,159,000
3,639,000
10,087,000
24,439,000
4,900,000
60,000,000
13,506,000
8,813,000
-
4,159,000
3,639,000
10,087,000
30,400,000
4,900,000
80,400,000
10,332,740
Lot no.1 in Plan no.08/2007 Wickramarachchi Mawatah ,YakkalaLot no - A Plan no 6894, Mawela South, KalutharaLot no 01 Plan no 20,Hakamuna village,Pelmadulla,RathnapuraLot no 01 Plan no 2151,Katumuna Land, Seethaeliya,NuwaraeliyaLot no 5594 plan no 126/2010,Apothecarayawatta Wndsor Avanue, DehiwalaLot no 01 Plan no 7011, Delgahawaththa,Hunupitiya New road, KelaniyaLot no 99 Plan no 520022, Kahatagahaovitapilla-wa, Siyambalagoda, HomagamaLot no X Plan no 4069,Maradana Ward no 2,Mattakkuliya,Colombo
Lot no.A3,B,C1,D1 & E, Plan no. 1105, Dalaviyagodawatta, Kalawila Village, Beruwala

Risk
Man
agem
ent &
Corp
orat
e Go
vern
ance
Sust
aina
bilit
yRe
port
Man
agem
ent D
iscus
sion
and
Anal
ysis
Boa
rd o
f Dire
ctor
s &Ex
ecut
ive M
anag
emen
tHi
ghlig
hts
Fina
ncia
lIn
form
atio
n
Property Method ofvaluation
Effective dateof valuation
Significantunobservableinputs ( Level 3)
Sensitivity offair value to un-observable inputs
Value 2019LKR
Value 2020LKR
No ofBuildings
Commercial Credit and Finance PLC Annual Report 2019/20 159
Comparison Method of valuation
Comparison Method of valuation
Comparison Method of valuation
Comparison Method of valuation
Comparison Method of valuation
Comparison Method of valuationComparison Method of valuationComparison Method of valuation
Comparison Method of valuation
28-Aug-12
28-Mar-19
27-Mar-19
5-Mar-19
28-Mar-18
28-Mar-18
28-Sep-18
18-Mar-18
22-Sep-16
"Estimated price per perch LKR 150,000/- (Land Extent - 11 perches)" Estimated current cost of construction per square foot LKR 3,000/- ( 2625 square feet) "Estimated price per perch LKR 600,000/- (Land Extent - 10.8 perches)" "Estimated price per perch LKR 600,000/- (Land Extent - 10.8 perches)" "Estimated price per perch LKR 2,600,000/- (Land Extent - 23.3625 acres)" Estimated current cost of construction per square foot LKR 2,000/- ( 1167 square feet)"Estimated price per perch LKR 180,000/- (Land Extent - 12.5 perches)"
"Estimated price per perch LKR 400,000/- (Land Extent - 24.94 perches)"Estimated current cost of construction per square foot LKR 3,000/- ( 3986 square feet)"Estimated price per perch LKR 50,000/- (Land Extent -0A-2R-10 perches)""Estimated price per perch LKR 175,000/- (Land Extent - 19 perches)" "Estimated price per perch LKR 125,000/- (Land Extent - 15 perches)"
"Estimated price per perch LKR 1755,000/- (Land Extent - 9.1 perches)" Estimated current cost of construction per square foot LKR 2,500/- ( 1284 square feet)
1
1
1
1
Positively correlated sensitivity
Positively correlated sensitivity
Positively correlated sensitivity
Positively correlated sensitivity
Positively correlated sensitivity
Positively correlated sensitivityPositively correlated sensitivityPositively correlated sensitivity
Positively correlated sensitivity
5,332,654
10,000,000
55,500,000
2,250,000
13,639,161
2,992,182
3,135,000
3,450,000
25,559,535
5,691,962
10,399,000
63,000,000
-
13,639,161
2,992,182
2,935,000
3,794,000
2,557,080
Lot no 26 Plan no 2447, Welihena,Siyambalagoda, Homagama
Lot no X2 Plan no 7739, Gonapolakum-bura Kattiya, Palannaruwa,Horana
Lot no X1, Plan no -4390, Diyambalako-tuwa Estate,Ran-gama,Wellawa, Kurunegala
Lot no 17 in Plan no 2060, Batalandehena,LiyangahawattaLot No.3896 Plan No.195 , Buddhagaya Mawatha, Anuradhapura
Lot E Plan no.147 Kirineliya, urugamuwaLot No 5 Plan No.1133,Walpita village, HomamgamaLot No.5 Plan No.1738 & Lot No. 6 Plan No 1738 , Weerambuwa village, KurunegalaLot no 3765 Plan no F.T.P.9,Girithale,Paranagama,Hingurakkgoda

Notes to the Financial Statements [Cont.]As at 31st March 2020
Commercial Credit and Finance PLC Annual Report 2019/2020160
Property Method ofvaluation
Effective dateof valuation
Significantunobservableinputs ( Level 3)
Sensitivity offair value to un-observable inputs
Value 2019LKR
Value 2020LKR
No ofBuildings
Comparison Method of valuation
Comparison Method of valuation
Comparison Method of valuationComparison Method of valuationComparison Method of valuationComparison Method of valuationComparison Method of valuationComparison
Method of valuationComparison
Comparison Method of valuation
31-Mar-20
31-Mar-20
30-Apr-19
13-Jun-19
23-Dec-19
18-Feb-18
30-Jan-20
16-Jan-20
3-Aug-18
"Estimated price per perch LKR 850,000/- (Land Extent - 145 perches)" "Estimated price per perch LKR 5,100,000/- (Land Extent - 16.83 perches)"
"Estimated price per perch LKR 147,558/- (Land Extent - 11.5 perches)" "Estimated price per perch LKR 115,000/- (Land Extent -00A-01R- 10.25 perches)""Estimated price per perch LKR 180,000/- (Land Extent - 12.5 perches)""Estimated price per perch LKR 150,000/- (Land Extent - 32.2 perches)"
"Estimated price per perch LKR 155,000/- (Land Extent - 10 perches)"
"Estimated price per perch LKR 350,000/- (Land Extent - 10 perches)" Estimated current cost of construction per square foot LKR 4,500/- ( 2688 square feet)"Estimated price per perch LKR 325,000/- (Land Extent - 4 perches)"
-
-
-
-
-
-
-
-
-
Positively correlated sensitivity
Positively correlated sensitivity
Positively correlated sensitivityPositively correlated sensitivityPositively correlated sensitivityPositively correlated sensitivity
Positively correlated sensitivity
Positively correlated sensitivity
Positively correlated sensitivity
-
-
-
-
-
-
-
-
-
123,250,000
85,800,000
1,696,926
2,287,000
1,900,000
20,122,430
3,800,000
10,500,000
1,247,000
Lot no A in Plan no 5431,Malabe- Kottawa Road,KottawaLot no 01 Plan no 8002 at Nupe AnagarikaDharmapala MawathaLot No. 11 in Plan No.225, Gorakamulla KumburaLot No.02 in Plan No.1032,Attalawattha, RathnapuraLot No.25 in Plan No.2060 Kirikitta Road, WeliweriyaLot No.A2, in Plan No. 280A, Meegahawatta,BiyagamaLot No. 32 in Plan No.3180 Kottegoda Road, Maswila, BandaragamaLot No.01, Plan No.5093 ,Pallanchena Estste, Kochchikade
Lot No.01 Plan No.6894 Mawela South, Kaluthara

Risk
Man
agem
ent &
Corp
orat
e Go
vern
ance
Sust
aina
bilit
yRe
port
Man
agem
ent D
iscus
sion
and
Anal
ysis
Boa
rd o
f Dire
ctor
s &Ex
ecut
ive M
anag
emen
tHi
ghlig
hts
Fina
ncia
lIn
form
atio
n
338,931,778
319,147,394
144,824,433
40,391,670
1,133,032,205
108,473,303
15,044,564
2,099,845,347
1,757,351,884
409,406,149
2,166,758,033
4,266,603,380
15,250,379
198,987,283
17,798,058
-
38,220,890
4,063,500
7,301,400
281,621,510
-
-
-
281,621,510
-
-
-
-
-
-
-
-
25,926,600
27,608,092
53,534,692
53,534,692
354,182,157
518,134,677
162,622,491
40,391,670
1,171,253,095
112,536,803
22,345,964
2,381,466,857
1,783,278,484
437,014,241
2,220,292,725
4,601,759,582
BalanceAs at
01.04.2019LKR
Additions/Transfers
LKR
ValuationLKR
BalanceAs at
31.03.2020LKR
At CostFreehold assets Furniture & fittings Leasehold improvements Office equipment Motor vehicles Computer equipments Air conditioning system Generators
At valuation Freehold Land Building and building integrals
Total value of depreciable assets
20.1 Gross carrying amounts
20 PROPERTY, PLANT AND EQUIPMENT
5%
-5%
83,911,267
(83,911,267)
Cost of constructionper square feet
Value of the land Fair value gain/(loss)on Investment property
LKR
5%
-5%
19.5 The table below presents the sensitivity of the valuation to changes in the most significant assumptions underlying the valuation of investment property of the year ended 31 March 2020.
ACCOUNTING POLICYInvestment properties are measured initially at cost, including transaction costs. The carrying amounts includes the cost of replacing part of an existing investment property at the time that cost is incurred if the recognition criteria are met; and exclude the costs of day to day servicing of an investment property. Subsequent to initial recognition, investment properties are stated at fair value, which reflects market conditions at the reporting date. Gains or losses arising from changes in the fair values of investment properties are included in the Statement of profit or loss in the year in which they arise.
The sensitivity of the investment property valuation is the effect of the assumed changes in land price per perch and cost of construc-tion per square feet (while other variables are held constant) on the profit or loss for the year and carrying value of investment proper-ty as at 31 March 2020.
Company
Commercial Credit and Finance PLC Annual Report 2019/20 161
Property Value 2020LKR

Notes to the Financial Statements [Cont.]As at 31st March 2020
354,149,959
319,147,394
179,599,804
89,288,350
1,179,605,234
108,473,303
15,044,564
2,245,308,608
1,757,351,884
409,406,149
2,166,758,033
4,412,066,641
16,100,581
198,987,283
26,640,707
19,860,000
45,196,444
4,063,500
7,301,400
318,149,914
-
-
-
318,149,914
(7,875)
-
(918,998)
(15,360,000)
(229,036)
-
-
(16,515,909)
25,926,600
27,608,092
53,534,692
37,018,783
370,242,665
518,134,677
205,321,513
93,788,350
1,224,572,642
112,536,803
22,345,964
2,546,942,613
1,783,278,484
437,014,241
2,220,292,725
4,767,235,339
BalanceAs at
01.04.2019LKR
Additions/Transfers
LKR
ValuationLKR
BalanceAs at
31.03.2020LKR
At costFreehold assets Furniture & fittings Leasehold improvements Office equipment Motor vehicles Computer equipments Air conditioning system Generators
At Valuation Freehold Land Building and building integrals
Total Value of Depreciable Assets
20.3 Gross carrying amounts Group
196,916,246
178,512,498
85,407,321
28,103,033
651,708,169
54,597,045
6,282,493
1,201,526,805
7,554,470
7,554,470
1,209,081,275
37,913,611
83,570,156
17,952,681
7,290,272
171,252,277
12,642,128
2,099,591
332,720,716
8,080,225
8,080,225
340,800,941
-
-
-
-
-
-
-
-
-
-
234,829,857
262,082,654
103,360,002
35,393,305
822,960,446
67,239,173
8,382,084
1,534,247,520
15,634,695
15,634,695
1,549,882,216
BalanceAs at
01.04.2019LKR
Additions/Transfers
LKR
ValuationLKR
BalanceAs at
31.03.2020LKR
At Cost Freehold assets Furniture & fittings Leasehold improvements Office equipments Motor vehicles Computer equipments Air conditioning system Generators
At valuation Building and building integrals
Total Depreciation
20.2 Depreciation Company
Commercial Credit and Finance PLC Annual Report 2019/2020162

Risk
Man
agem
ent &
Corp
orat
e Go
vern
ance
Sust
aina
bilit
yRe
port
Man
agem
ent D
iscus
sion
and
Anal
ysis
Boa
rd o
f Dire
ctor
s &Ex
ecut
ive M
anag
emen
tHi
ghlig
hts
Fina
ncia
lIn
form
atio
n
2020LKR
2019LKR
2020LKR
2019LKR
Company Group
20.6 During the financial year, the Company acquired property, plant & equipment to the aggregate value of LKR 281,621,510 /- (2019 - LKR 425,878,49 /-). Cash payments amounting to LKR 281,621,510/- ( 2019- LKR 425,878,149 /-) was paid during the year for purchases of Property, Plant & Equipment.
During the financial year, the Group acquired property, plant & equipment to the aggregate value of LKR 318,149,914/-( 2019 - LKR 477,058,132/-). Cash payments amounting to LKR 318,149,914/- ( 2019- LKR 477,058,132/-) was paid duringthe year for purchases of Property, Plant & Equipment.
20.7 The Company uses the revaluation model of measurement of land and buildings. The company engaged Sunil Fernando & Associates (Private) Limited and A.B.M. Gunadasa, an independent chartered valuation surveyor, to determine the fair value of its land and buildings as at 31 March 2018 ,31 March 2019 and 31 March 2020. The fair value was determined by Comparison Method using current market value of land, residual method of valuation and the depreciated replacement cost of buildings. Valuations are based on market prices, adjusted for any difference in the nature, location or condition of the specific property.
119,352,300
256,052,023
59,262,489
4,998,365
348,292,649
45,297,630
13,963,880
1,783,278,484
421,379,546
3,051,877,367
1 142,015,532
140,634,896
59,417,112
12,288,637
475,128,071
53,876,258
8,762,071
1,727,729,685
440,101,057
3,059,953,319
123,791,680
256,052,023
78,627,425
29,617,630
374,817,188
45,297,630
13,963,880
1,783,278,484
421,379,546
3,126,825,486
146,339,903
140,634,896
75,450,650
35,601,612
502,642,471
53,876,258
8,762,071
1,727,729,685
440,101,057
3,131,138,603
At Cost Furniture & fittings Leasehold improvements Office equipment Motor vehicles Computer equipments Air conditioning system Generators Freehold Land Building & building integrals Total net book value of property, plant & equipment
20.5 Net book values
Company
207,810,056
178,512,498
104,149,094
52,943,614
671,509,981
54,597,045
6,282,493
1,275,804,781
7,554,470
7,554,470
1,283,359,251
38,646,586
83,570,156
22,998,119
17,966,744
178,398,533
12,642,128
2,099,591
356,321,858
8,080,225
8,080,225
364,402,083
(5,657)
-
(453,125)
(6,739,638)
(153,061)
-
-
(7,351,481)
-
-
(7,351,481)
246,450,985
262,082,654
126,694,088
64,170,720
849,755,453
67,239,173
8,382,084
1,624,775,158
15,634,695
15,634,695
1,640,409,853
BalanceAs at
01.04.2019LKR
Additions/Transfers
LKR
ValuationLKR
BalanceAs at
31.03.2020LKR
DepreciationFreehold Assets Furniture & Fittings Leasehold improvements Office equipment Motor vehicles Computer Equipments Air conditioning system Generators
At Valuation Building and building integrals
Total Depreciation
20.4 Depreciation Group
Commercial Credit and Finance PLC Annual Report 2019/20 163

Commercial Credit and Finance PLC Annual Report 2019/2020164
P 12
.2
P 13
.4
P 73
8.9
P 13
.64
A 2
3 R
2 28
.95
P
P 45
8.12
P
P 29
.85
P 26
.5
P 66
1640
squ
are
feet
3975
squ
are
feet
1285
0 sq
uare
feet
2700
squ
are
feet
2930
5 sq
uare
feet
A.B.
M.G
unad
asa
A.B.
M.G
unad
asa
A.B.
M.G
unad
asa
A.B.
M.G
unad
asa
A.B.
M.G
unad
asa
A.B.
M.G
unad
asa
A.B.
M.G
unad
asa
A.B.
M.G
unad
asa
Suni
l Fer
nand
o &
Asso
ciate
s (Pv
t) Lt
d
A.B.
M.G
unad
asa
A.B.
M.G
unad
asa
Suni
l Fer
nand
o &
Asso
ciate
s (Pv
t) Lt
d
A.B.
M. G
unad
asa
Suni
l Fer
nand
o &
Asso
ciate
s(Pv
t) Lt
d
31/0
3/20
20
31/0
3/20
20
31/0
3/20
20
31/0
3/20
20
31/0
3/20
20
-
20/0
4/20
17
09/0
5/20
18
31/0
3/20
19
31/0
3/20
20
31/0
3/20
20
31/0
3/20
20
09/0
5/20
18
31/0
3/20
19
Com
paris
on M
etho
dCo
mpa
rison
Met
hod
Resid
ual M
etho
d of
valu
atio
n
Com
paris
on M
etho
dCo
mpa
rison
Met
hod
- Com
paris
on M
etho
dCo
mpa
rison
Met
hod
Com
paris
on M
etho
d
Depr
ecia
ted
Repl
acem
ent C
ost
Depr
ecia
ted
Repl
acem
ent C
ost
Depr
ecia
ted
Repl
acem
ent C
ost
Depr
ecia
ted
Repl
acem
ent C
ost
Depr
ecia
ted
Repl
acem
ent C
ost
& In
vest
men
t or I
ncom
e ba
sed
valu
atio
n
-
-
-
-
-
-
-
-
-
1 1 1 1 1
33,0
55,0
00
99,
160,
000
134,
400,
000
10,
912,
000
22,
400,
000
216,
576,
485
202,
667,
600
41,
107,
399
1,0
23,0
00,0
00
1,78
3,27
8,48
4
4,78
4,85
1
19,1
89,9
18
86,4
56,9
72
4,58
2,50
0
322,
000,
000
437,
014,
241
Rs. 2
,750
,000
/- pe
r per
ch
Rs.7,
400,
000/
- per
per
ch
Rs. 3
50,0
00/-
per
per
ch
Rs. 8
00,0
00/-
per p
erch
Rs
. 950
,000
/- pe
r acr
e
Rs. 2
76,6
97/-
per a
cre
Rs. 4
50,0
00/-
per p
erch
Rs
. 1,7
00,0
00/-
per p
erch
Rs
. 15,
500,
000/
- per
per
ch
Rs. 3
,500
/- pe
r squ
are
feet
Rs
. 4,7
50/-
per s
quar
e fe
et
Rs. 6
,500
/- pe
r squ
are
feet
Rs
. 2,5
00/-
- Rs.2
750/
-pe
r squ
are
feet
R
s. 11,
000/
- per
squa
re fe
et
Exte
ntVa
luer
Valu
atio
nD
ate
Valu
atio
nD
etai
lsN
o. o
fbu
ildin
gsFa
irVa
lue
LKR
Sign
ifica
nt u
nobs
erva
ble
inpu
t: pr
ice
per
perc
h/ a
cre/
rang
e "Pl
an 5
48, L
ot 1
,Mai
thrip
ala
Sena
naya
keM
awat
ta, N
ew To
wn,
Anu
radh
apur
aNo
106,
Yat
inuw
ara
Veed
iya,
Kan
dyPl
an 3
256,
Lot C
1A &
C1B
, Yag
gapi
tiya
,Ku
rune
gala
Plan
806
, Lot
2, A
sses
smen
t No.
136
,Ku
rune
gala
Roa
d, P
utta
lam
Lot 1
,2 , P
lan
390,
Kum
bukk
anna
, Mon
arag
ala
Lot N
o.1 t
o 7
in P
lan
No. 2
762,
Dam
pe R
oad,
Bolg
oda
Lot N
o. 2
75,2
77,2
83,2
85,2
87,&
289
High
Leve
l Roa
d ,N
ugeg
oda
113/11
, Gre
en ro
ad, N
egom
boPl
an 3
333A
, No
165,
Kyns
ey R
oad,
Col
ombo
08
Tota
l
Fai
r Val
ue o
f Bui
ldin
gsPl
an 8
06, L
ot 2
, Ass
essm
ent N
o. 13
6 ,
Kuru
nega
la R
oad,
Putta
lam
Plan
548
, Lot
1 ,M
aith
ripal
a Se
nana
yake
Maw
atta
,Ne
w To
wn,
Anu
radh
apur
aNo
106,
Yat
inuw
ara
Veed
iya,
Kan
dy
113/11
, Gre
en ro
ad, N
egom
bo
Plan
333
3A, N
o 16
5,Ky
nsey
Roa
d, C
olom
bo 0
8
Tota
l
Com
mer
cial C
redi
t and
Fin
ance
PLC
Fair
Valu
e of
Land
s
Loca
tion

Risk
Man
agem
ent &
Corp
orat
e Go
vern
ance
Sust
aina
bilit
yRe
port
Man
agem
ent D
iscus
sion
and
Anal
ysis
Boa
rd o
f Dire
ctor
s &Ex
ecut
ive M
anag
emen
tHi
ghlig
hts
Fina
ncia
lIn
form
atio
n
Commercial Credit and Finance PLC Annual Report 2019/20 165
1,019,111,351
-
1,019,111,351
201,855,541
(15,634,695)
186,220,846
1,019,111,351
-
1,019,111,351
201,855,541
(6,545,572)
195,309,969
Land
LKR
Company2020 2019
Buildin& building
integralsLKR
Land
LKR
Building& building
integralsLKR
CostLess: Accumulated depreciation Net carrying amount
20.8 If land and buildings were measured using the cost model, the carrying amounts would be as follows:
20.9 Property, Plant and equipment included fully depreciated assets having a gross amount of LKR 374,087,257/-( 2019 - LKR 214,992,572/-) and Group fully depreciated assets amounted to LKR 374,087,257/-. (2019- LKR Rs. 241,057,616/-)20.10 Title Restriction on Property, Plant and Equipment - Company & Group There were no restrictions existed on the title of the property, plant and equipment of the Company as at the reporting date. 20.11 Property, Plant and Equipment Pledged as Security for Liabilities - Company & Group There were no items of property, plant and equipment pledged as securities for liabilities as at the reporting date other than those disclosed in the Note 52 of these Financial Statements. 20.12 Temporarily Idle Property, Plant and Equipment - Company & Group There were no temporarily idle Property, Plant and Equipment as at the reporting date.
ACCOUNTING POLICY Property, Plant and equipment are recognised if it is probable that future economic benefits associated with the assets will flow to the entity and the cost of the asset can be measured reliably in accordance with LKAS 16 on Property, Plant and equipment. Initially Property, Plant and equipment are measured at cost.
Subsequent measurement Property, Plant and equipment is stated at cost or valuation, excluding the costs of day to day servicing, less accumulated depreciation and accumulated impairment in value. Changes in the expected useful life are accounted for by changing the amortisation period or method, as appropriate, and treated as changes in accounting estimates. The Company has elected to use the revaluation model for land and buildings, while other classes of property, plant and equipment are measured using the cost model. Cost Model These are the amount of cash or cash equivalent paid or the fair value of other consideration given to acquire the asset at the time of its acquisition or construction, if it is probable that the future economic benefits embodied within that part will flow to the Company and it can be reliably measured. Revaluation Model Land and buildings are measured at fair value, less accumulated depreciation on buildings, and impairment losses recognised at the date of revaluation. Valuations are performed with sufficient frequency to ensure that the fair value of a revalued asset does not differ materially from its carrying amount. Accumulated depreciation at the revaluation date is eliminated against the gross carrying amount of the asset and the net amount is restated to the revalued amount of the asset. Upon disposal, any revaluation reserve relating to the particular asset being sold is transferred to retained earnings. Depreciation The provision for depreciation is calculated by using a straight line method on the cost or valuation of all Property, Plant & Equipment other than freehold land, in order to write off such amounts over the estimated useful lives.

Notes to the Financial Statements [Cont.]As at 31st March 2020
Commercial Credit and Finance PLC Annual Report 2019/2020166
21. RIGHT OF USE ASSETS SLFRS 16 "Leases" requires lessee to recognise all significant leases in the statement of Financial Position as "Right of Ues Assets" together with their corresponding lease liability with effect from 1st January 2019. These leases were classified as operating leases under the requirement of "LKAS 17 Leases" up to 31st December 2018.
-
576,226,098
576,226,098
251,708,210
-
827,934,308
-
(178,108,601)
(178,108,601)
649,825,707
-
606,260,943
606,260,943
253,868,210
-
860,129,153
-
(187,970,243)
(187,970,243)
672,158,910
Company2020LKR
Group2020LKR
Balance as at 1st AprilDay 1 impact from the application of SLFRS 16Restated Balance as at 1st AprilAdditions / renewal operating lease during the yearExpiration of operating lease agreements during the yearBalance as at 31st MarchAccumulated amortisationBalance as at 1st AprilAmortisation for the yearBalance as at 31st MarchNet Book Value at 31st March 2020
21.1 Movement in right-of-use assets
The estimated useful lives used are as follows:
Components included in buildings and building integrals Useful Life Buildings 50 years Cladding 8 years Furniture and Fittings 8 years Leasehold Improvements 5 years Office Equipment 8 years Motor Vehicles 4 years Computer Hardware 5 years Air Conditioning System 8 years De-recognition An item of property, plant and equipment is derecognized upon disposal or when no future economic benefits are expected from its use or disposal. Any gain or loss arising on derecognition of the asset (calculated as the difference between the net disposal proceeds and the carrying amount of the asset) is recognized in ‘Other Operating Income’ in the Statement of profit or loss in the year the asset is derecognized.

Notes to the Financial Statements [Cont.]As at 31st March 2020
Risk
Man
agem
ent &
Corp
orat
e Go
vern
ance
Sust
aina
bilit
yRe
port
Man
agem
ent D
iscus
sion
and
Anal
ysis
Boa
rd o
f Dire
ctor
s &Ex
ecut
ive M
anag
emen
tHi
ghlig
hts
Fina
ncia
lIn
form
atio
n
Commercial Credit and Finance PLC Annual Report 2019/20 167
The operating lease liabilities are presented under Note 27 to the financial statements. Above is the movement of the operating lease liability during the period Sensitivity of Right-of-Use Assets/Lease Liability to Key Assumption Sensitivity to Incremental Borrowing Rates Increase/(decrease)in incremental borrowing rate as at 31st March 2020 by 1% would have (decreased)/increased the lease liability by approximately Rs 635 Mn and Rs 664 Mn respectively. Had the company increased/(decreased) the discount rate by 1%, the company profi t before tax for the year would have (decreased)/increased by approximately Rs 1,796 Mn and Rs 1,798 Mn respectively
-
403,860,506
403,860,506
252,832,429
71,380,167
(220,966,439)
507,106,662
-
419,709,008
419,709,008
252,832,429
73,220,998
(227,975,435)
517,787,000
Company2020LKR
Group2020LKR
Balance as at 1st April Day 1 impact from the application of SLFRS 16 Restated Balance as at 31st March Additions/renewal of operating lease agreements during the yearAccretion of interest Payments to lease creditors As at 31st March
21.2 Movement in operating lease liabilities
ACCOUNTING POLICY
Basis oF Recogision The Group applies Sri Lanka Accounting Standard SLFRS 16 “Leases” in accounting for all lease hold rights except for short term leases, which are held for use in the provision for services. Basis of Measurement The Company recognises right-of-use assets at the date of commencement of the lease, which is the present value of lease payments to be made over the lease term. Right-of-Use assets are measured at cost less any accumulated amortization and impairment losses and adjusted for any re-measurement of lease liabilities. The cost of the right-of-use assets includes the amount of lease liabilities recognised, initial direct cost incurred, and lease payments made at or before the commencement date less any lease incentives received Right of use assets are amortised on the straight line basis over the lease term. Lease Liability At the commencement date of the lease, the company recognises lease liabilities, measured at present value of lease payments to be made over the lease term.
The present value of lease commitments as at 1st April 2019 has been calculated using weighted average incremental borrowing rate of 13% The Company applied modified retrospective approach in accordance with SLFRS 16 when accounting for right - of use assets and operating lease liabilities.

Notes to the Financial Statements [Cont.]As at 31st March 2020
Commercial Credit and Finance PLC Annual Report 2019/2020168
-
199,319,998
199,319,998
-
176,116,081
176,116,081
741,712,566
218,168,752
959,881,318
741,712,566
199,332,288
941,044,854
2020
LKR
Company Group
2019
LKR
2019
LKR
2020
LKR
GoodwillComputer software (22.1)
22.INTANGIBLE ASSETS & GOODWILL
22.1 Computer software
Business growth rate
Discount rate
Inflation rate
-
-
-
The volume growth has been budgeted on a resonable and realistic basis by taking in toaccount historical growth rate and business plan of the Trade Finance and Investments PLC. The discount rate used is the risk free rate, adjusted by the addition of an appropriaterisk premium The basis to used to determine the value assigned to the budgeted cost inflation, is the inflation rate, based on projected economic conditions.
Goodwill Goodwill amounting to LKR 741,712,566/- has been recognised in respect of acquisition of Trade Finance and Investments PLC.
The company carried out an impairment assessment as at 31 March 2020 on the goodwill recognised on acquisition of Trade Finance & Investments PLC and concluded that there is no impairment based on the future earnings projections. The Group performed its annual impairement test on Goodwill based on earnings growth model. The assumptions applied in the computations are reviewed each year.The key assumptions used to determine the recoverable amount of the Subsidiary are as follows,
177,516,778
58,947,939
236,464,717
225,000
45,407,742
45,632,742
58,947,939
(58,947,939)
-
236,689,717
45,407,742
282,097,459
Balance As At01.04.2019
LKR
CompanyAdditions/
Incurred LKR
Balance As At31.03.2020
LKR
Transfers
LKR
CostComputer softwareCapital work in progress - Computer softwareWritten down value
60,348,636
60,348,636
176,116,081
22,248,486
22,248,486
-
-
82,597,122
82,597,122
199,319,998
Balance As At01.04.2019
LKR
Charged
LKR
Balance As At31.03.2020
LKR
Transfers
LKR
AmortisationComputer software
Net Book Value

Risk
Man
agem
ent &
Corp
orat
e Go
vern
ance
Sust
aina
bilit
yRe
port
Man
agem
ent D
iscus
sion
and
Anal
ysis
Boa
rd o
f Dire
ctor
s &Ex
ecut
ive M
anag
emen
tHi
ghlig
hts
Fina
ncia
lIn
form
atio
n
Commercial Credit and Finance PLC Annual Report 2019/20 169
23. DUE TO BANKSCompany Group
256,749,719 12,404,867,135
12,661,616,855
507,747,620 8,733,725,354
9,241,472,974
267,312,411 18,946,896,706
19,214,209,118
653,149,700 14,374,366,092
15,027,515,792
2020
LKR
2019
LKR
2020
LKR
2019
LKRBank OverdraftsSecuritised Borrowings, Syndicated Loans and Other BankFacilities (Note 23.1)Total
2019
LKR 84,086,891
84,086,891 199,332,288
28,258,976
28,258,976
-
-
112,345,867
112,345,867 218,348,752
Balance As At01.04.2019
LKR
Charged
LKR
Balance As At31.03.2020
LKR
Transfers
LKRAmortisationComputer software
Net Book Value
Group
224,471,240
58,947,939
283,419,180
1,868,036
45,407,742
47,275,778
58,947,939
(58,947,939)
-
285,287,216
45,407,742
330,694,958
Balance As At01.04.2019
LKR
Additions/Incurred
LKR
Balance As At31.03.2020
LKR
Transfers
LKR
CostComputer softwareCapital work in progress - Computer software
The volume growth has been budgeted on a resonable and realistic basis by taking in toaccount historical growth rate and business plan of the Trade Finance and Investments PLC. The discount rate used is the risk free rate, adjusted by the addition of an appropriaterisk premium The basis to used to determine the value assigned to the budgeted cost inflation, is the inflation rate, based on projected economic conditions.
Goodwill Goodwill amounting to LKR 741,712,566/- has been recognised in respect of acquisition of Trade Finance and Investments PLC.
The company carried out an impairment assessment as at 31 March 2020 on the goodwill recognised on acquisition of Trade Finance & Investments PLC and concluded that there is no impairment based on the future earnings projections. The Group performed its annual impairement test on Goodwill based on earnings growth model. The assumptions applied in the computations are reviewed each year.The key assumptions used to determine the recoverable amount of the Subsidiary are as follows,
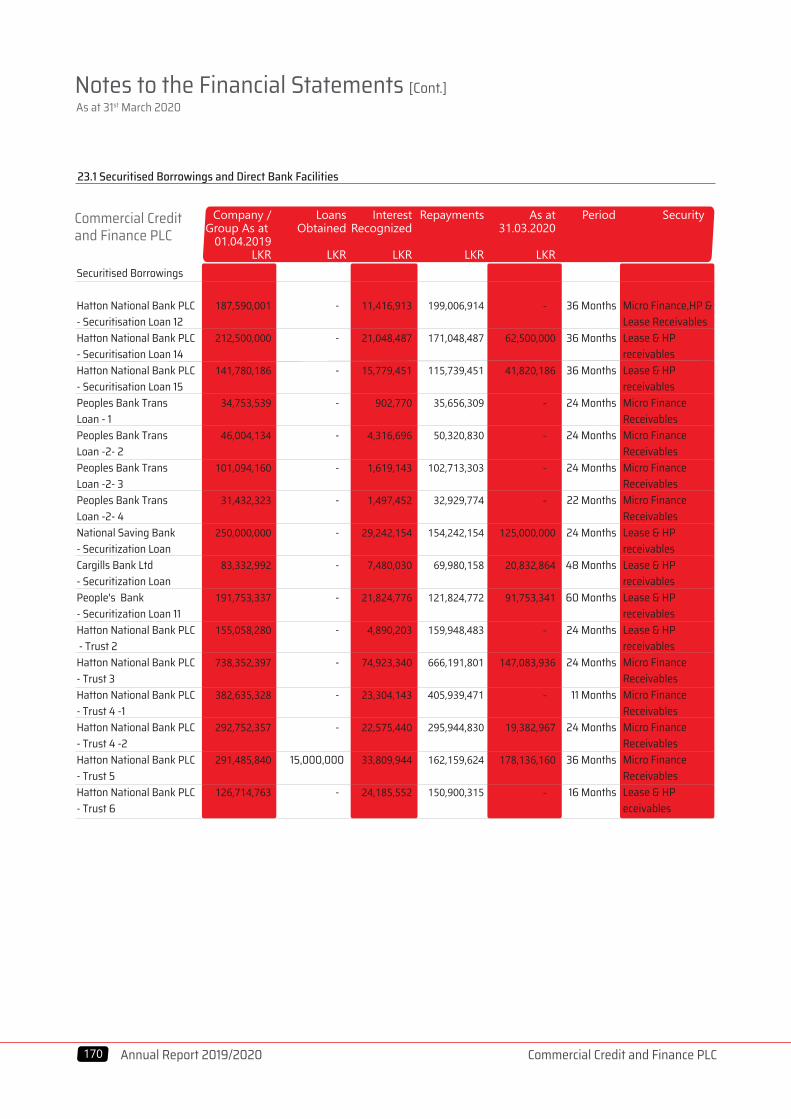
Notes to the Financial Statements [Cont.]As at 31st March 2020
Commercial Credit and Finance PLC Annual Report 2019/2020170
23.1 Securitised Borrowings and Direct Bank Facilities
Commercial Credit and Finance PLC
Company /Group As at
01.04.2019LKR
Loans Obtained
LKR
Interest Recognized
LKR
Repayments
LKR
As at31.03.2020
LKR
Period Security
Securitised Borrowings
Hatton National Bank PLC - Securitisation Loan 12Hatton National Bank PLC - Securitisation Loan 14Hatton National Bank PLC - Securitisation Loan 15Peoples Bank TransLoan - 1Peoples Bank TransLoan -2- 2Peoples Bank TransLoan -2- 3Peoples Bank TransLoan -2- 4National Saving Bank- Securitization LoanCargills Bank Ltd- Securitization Loan People's Bank- Securitization Loan 11Hatton National Bank PLC - Trust 2Hatton National Bank PLC- Trust 3Hatton National Bank PLC- Trust 4 -1Hatton National Bank PLC- Trust 4 -2Hatton National Bank PLC- Trust 5Hatton National Bank PLC- Trust 6
187,590,001
212,500,000
141,780,186
34,753,539
46,004,134
101,094,160
31,432,323
250,000,000
83,332,992
191,753,337
155,058,280
738,352,397
382,635,328
292,752,357
291,485,840
126,714,763
-
-
-
-
-
-
-
-
-
-
-
-
-
-
15,000,000
-
11,416,913
21,048,487
15,779,451
902,770
4,316,696
1,619,143
1,497,452
29,242,154
7,480,030
21,824,776
4,890,203
74,923,340
23,304,143
22,575,440
33,809,944
24,185,552
199,006,914
171,048,487
115,739,451
35,656,309
50,320,830
102,713,303
32,929,774
154,242,154
69,980,158
121,824,772
159,948,483
666,191,801
405,939,471
295,944,830
162,159,624
150,900,315
-
62,500,000
41,820,186
-
-
-
-
125,000,000
20,832,864
91,753,341
-
147,083,936
-
19,382,967
178,136,160
-
36 Months
36 Months
36 Months
24 Months
24 Months
24 Months
22 Months
24 Months
48 Months
60 Months
24 Months
24 Months
11 Months
24 Months
36 Months
16 Months
Micro Finance,HP &Lease ReceivablesLease & HPreceivablesLease & HPreceivablesMicro Finance ReceivablesMicro FinanceReceivablesMicro FinanceReceivablesMicro FinanceReceivablesLease & HPreceivablesLease & HPreceivablesLease & HPreceivablesLease & HPreceivablesMicro FinanceReceivablesMicro FinanceReceivablesMicro FinanceReceivablesMicro FinanceReceivablesLease & HP eceivables

Risk
Man
agem
ent &
Corp
orat
e Go
vern
ance
Sust
aina
bilit
yRe
port
Man
agem
ent D
iscus
sion
and
Anal
ysis
Boa
rd o
f Dire
ctor
s &Ex
ecut
ive M
anag
emen
tHi
ghlig
hts
Fina
ncia
lIn
form
atio
n
Commercial Credit and Finance PLC Annual Report 2019/20 171
Company /Group As at
01.04.2019LKR
Loans Obtained
LKR
Interest Recognized
LKR
Repayments
LKR
As at31.03.2020
LKR
Period Security
Hatton National Bank PLC- Trust 7Peoples Bank Trust Loan- 1 - 1Peoples Bank Trust Loan- 1 - 2Peoples Bank Trust Loan- 2 - 1Peoples Bank Trust Loan- 3Peoples Bank Trust Loan- 2 - 2Hatton National Bank PLC- Trust 8Hatton National Bank PLC- Trust 9Hatton National Bank PLC- Trust 10Hatton National Bank PLC- Trust 11Hatton National Bank PLC- Trust 12Hatton National Bank PLC- Syndicaion Loan
19,019,854
174,597,965
200,000,000
-
-
-
-
-
-
-
-
-
3,660,857,453
-
-
-
659,091,000
499,798,800
289,600,000
200,000,000
493,719,990
300,000,000
472,697,630
824,500,000
900,000,000
4,654,407,419
-
24,759,661
31,350,846
87,024,542
60,057,552
34,796,294
16,462,680
41,038,766
24,654,747
30,561,712
16,683,136
68,625,000
734,831,428
19,019,854
161,326,097
23,750,466
-
112,911,205
-
21,521,077
-
48,391,512
-
-
68,625,000
3,350,091,885
-
38,031,529
207,600,380
746,115,542
446,945,147
324,396,294
194,941,603
534,758,756
276,263,235
503,259,342
841,183,136
900,000,000
5,700,004,417
4 Months
24 Months
24 Months
48 Months
15 Months
24 Months
24 Months
24 Months
24 Months
24 Months
48 Months
18 Months
Lease & HPreceivablesLease Receivables
Lease & HPreceivablesLease Receivables
Lease & HPreceivablesLease & HPreceivablesLease & HPreceivablesGold Loan
Gold Loan
Gold Loan
Lease & HPreceivablesLease & HPreceivables
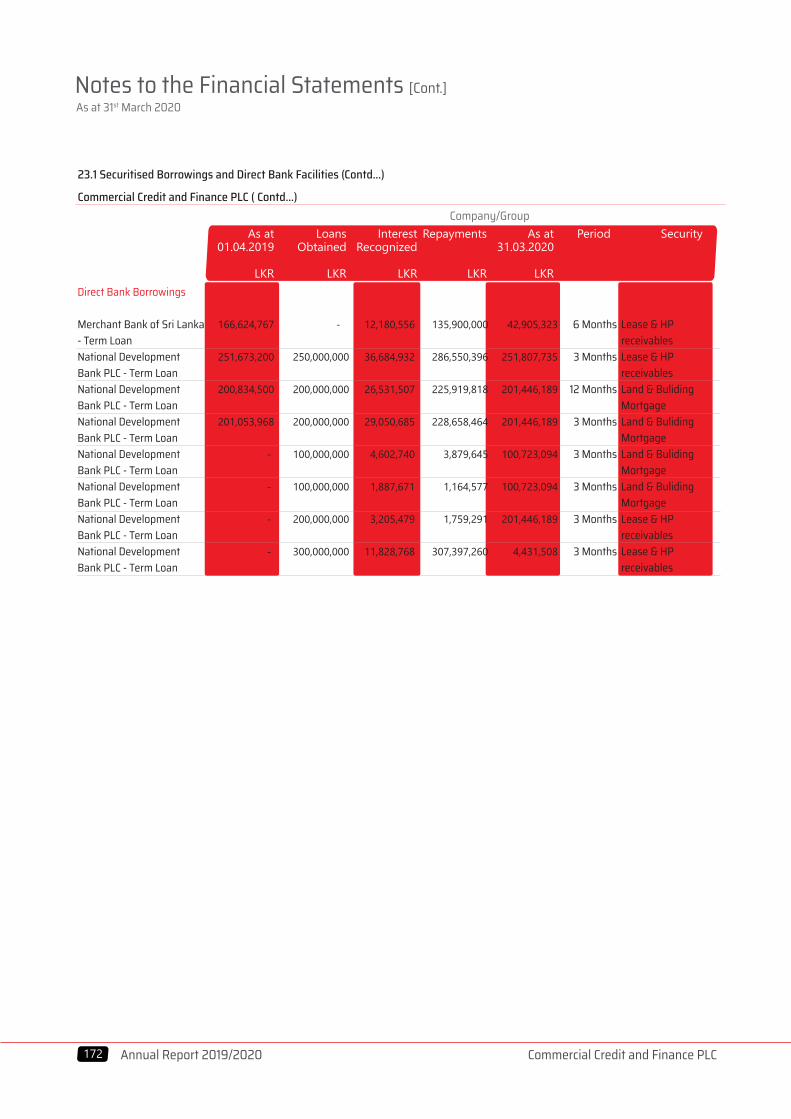
Notes to the Financial Statements [Cont.]As at 31st March 2020
Commercial Credit and Finance PLC Annual Report 2019/2020172
As at01.04.2019
LKR
Loans Obtained
LKR
Interest Recognized
LKR
Repayments
LKR
As at31.03.2020
LKR
Period Security
Direct Bank Borrowings
Merchant Bank of Sri Lanka- Term Loan National DevelopmentBank PLC - Term Loan National DevelopmentBank PLC - Term Loan National DevelopmentBank PLC - Term Loan National DevelopmentBank PLC - Term Loan National DevelopmentBank PLC - Term Loan National DevelopmentBank PLC - Term Loan National DevelopmentBank PLC - Term Loan
166,624,767
251,673,200
200,834,500
201,053,968
-
-
-
-
-
250,000,000
200,000,000
200,000,000
100,000,000
100,000,000
200,000,000
300,000,000
12,180,556
36,684,932
26,531,507
29,050,685
4,602,740
1,887,671
3,205,479
11,828,768
135,900,000
286,550,396
225,919,818
228,658,464
3,879,645
1,164,577
1,759,291
307,397,260
42,905,323
251,807,735
201,446,189
201,446,189
100,723,094
100,723,094
201,446,189
4,431,508
6 Months
3 Months
12 Months
3 Months
3 Months
3 Months
3 Months
3 Months
Lease & HPreceivablesLease & HPreceivablesLand & BulidingMortgageLand & BulidingMortgageLand & BulidingMortgageLand & BulidingMortgageLease & HPreceivablesLease & HPreceivables
23.1 Securitised Borrowings and Direct Bank Facilities (Contd…)
Commercial Credit and Finance PLC ( Contd…)Company/Group

Risk
Man
agem
ent &
Corp
orat
e Go
vern
ance
Sust
aina
bilit
yRe
port
Man
agem
ent D
iscus
sion
and
Anal
ysis
Boa
rd o
f Dire
ctor
s &Ex
ecut
ive M
anag
emen
tHi
ghlig
hts
Fina
ncia
lIn
form
atio
n
Commercial Credit and Finance PLC Annual Report 2019/20 173
Security As at
01.04.2019
LKR
Loans Obtained
LKR
Interest Recognized
LKR
Repayments
LKR
As at31.03.2020
LKR
Period Security
Seylan Bank PLC- Term Loan 03Seylan Bank PLC- Term Loan 04Seylan Bank PLC- Term Loan 06Seylan Bank PLC- Term LoanSeylan Bank PLC Term LoanCargills Bank Ltd- Term LoanCargills Bank Ltd- Term LoanHatton National Bank PLC-Term Loan 1Hatton National Bank PLC-Term Loan 3
300,000,000
225,000,000
281,249,997
374,990,002
-
250,000,000
-
145,840,000
1,125,000,000
300,000,000
-
-
-
228,000,000
500,045,890
200,000,000
-
1,500,000,000
42,448,575
27,579,781
34,823,098
38,886,330
13,071,337
39,568,493
6,881,627
17,581,462
111,353,419
342,448,575
127,579,780
159,823,113
288,906,331
116,775,337
536,803,353
39,998,065
61,321,462
1,423,853,403
300,000,000
125,000,001
156,249,982
124,970,002
124,296,000
252,811,030
166,883,562
102,100,000
1,312,500,016
6 Months
60 Months
48 Months
21 Months
3 Months
3 Months
18 Months
48 Months
12 Months
Lease & HPreceivablesLease & HPreceivablesLease & HPreceivablesLease & HPreceivablesFixed deposit
Lease & HPreceivablesLease & HPreceivablesFixed deposit
Lease & HPreceivables
Security As at
01.04.2019
LKR
Loans Obtained
LKR
Interest Recognized
LKR
Repayments
LKR
As at31.03.2020
LKR
Period Security
Sampath Bank PLC- Short Term Loan Sampath Bank PLC- Short Term Loan Sampath Bank PLC- Short Term Loan Sampath Bank PLC- Short Term Loan Hatton National Bank PLC- Short Term LoanHatton National Bank PLC- Short Term LoanBank of Ceylon -Term Loan
Bank of Ceylon -Term Loan
Bank of Ceylon -Term LoanBank of Ceylon -Term LoanDFCC Bank - Term LoanFirst CapitalFirst CapitalAcuity securities limited- Short Term Loan
Total for Company
124,970,000
300,000,000
300,000,000
-
-
-
255,141,200
251,740,262
318,750,000
5,072,867,896
8,733,725,354
-
-
-
300,000,000
500,000,000
500,000,000
-
-
100,000,000
100,000,000
-
250,000,000
250,000,000
392,309,124
6,470,355,014
11,124,762,433
10,866,575
39,515,993
12,863,034
29,672,860
21,287,114
-
28,026,011
29,787,290
4,180,059
4,180,038
37,579,540
29,198,630
29,174,658
2,678,908
737,177,169
1,472,008,597
110,874,575
339,515,993
12,863,034
29,672,860
21,287,114
-
150,546,011
122,363,319
10,846,726
10,846,705
150,079,540
15,664,352
13,053,627
299,184,637
5,575,537,364
8,925,629,249
24,962,000
-
300,000,000
300,000,000
500,000,000
500,000,000
132,621,200
159,164,233
93,333,333
93,333,333
206,250,000
263,534,278
266,121,031
95,803,395
6,704,862,715
12,404,867,135
60 Months
6 Months
6 Months
6 Months
3 Months
6 Months
48 Months
48 Months
60 Months 60 Months 48 Months
6 Months 6 Months 1 Months
Lease & HPreceivablesLian Foreign CurrancyA.c.no 502920006278Lease & HP eceivablesLease & HPreceivablesLease & HPreceivablesFixed deposit
Lease & HPreceivablesLease & HPreceivablesLand MortgageLand MortgagePromissory NoteLease & HP receivablesLease & HP receivablesRepo Investment
Company/Group
Company/Group

Notes to the Financial Statements [Cont.]As at 31st March 2020
Commercial Credit and Finance PLC Annual Report 2019/2020174
Security As at01.04.2019
LKR
Loans Obtained
LKR
Interest Recognized
LKR
Company/Group
Cash Flows Non Cash Flows
Repayments
LKR
As at31.03.2020
LKR
Period SecurityPeriod
Securitised Borrowings
Sampath Bank PLC
Hatton National Bank PLC- Trust LoansHatton National Bank PLC
Central Finance Company PLC
MBSL Securutization Loan
HDFC Securutization Loan
NDB Bank PLC
Seylan Bank PLC
Total for Group
500,782,500
4,237,138,896
335,408,106
43,316,539
185,819,425
174,204,267
-
163,971,005
5,640,640,738
14,374,366,092
-
2,740,808,367
500,000,000
-
-
-
550,000,000
-
3,790,808,367
14,915,570,800
55,562,683
827,152,769
74,857,320
4,976,430
23,906,286
21,775,988
17,396,269
29,034,436
1,054,662,181
2,526,670,778
270,606,734
2,777,790,803
318,381,426
31,981,534
105,471,099
65,815,684
282,500,001
91,534,436
3,944,081,717
12,869,710,966
285,738,449
5,027,309,228
591,884,000
16,311,436
104,254,612
130,164,571
284,896,268
101,471,004
6,542,029,568
18,946,896,706
48 Months
36 Months
48 Months
24 Months
48 Months
48 Months
48 Months
48 Months
Lease & HPreceivablesLease & HPreceivablesLease & HPreceivablesLease & HPreceivablesLease & HPreceivablesLease & HPreceivablesLease & HPreceivablesLease & HPreceivables
Opening1/4/2019
LKR
LoansObtained
LKR
Capital Repaid andInterest NetMovement
LKR
prepaid expenseamortisation
LKR
Closing31/3/2020
LKR
CompanySecuritised Borrowings,Syndicated Loans and OtherBank Facilities
GroupSecuritised Borrowings,Syndicated Loans and OtherBank Facilities
8,733,725,353
14,374,366,092
11,124,762,433
14,915,570,800
1,472,008,597
2,526,670,778
8,925,629,249
12,869,710,966
12,404,867,137
18,946,896,708
Company Group
Fixed Deposits - MonthlyFixed Deposits - MaturitySavings Deposits
27,935,782,517
18,193,561,884
1,265,177,476
47,394,521,877
30,896,140,357
19,884,072,513
1,128,154,468
51,908,367,338
27,935,782,517
19,747,681,784
1,265,177,476
48,948,641,777
30,896,140,357
21,912,024,343
1,128,154,468
53,936,319,168
Trade Finance and Investments PLC
23.2 Changes in liabilities arrising from financing activities (Securitised Borrowings, Syndicated Loans and Other Bank Facilities)
24. DUE TO CUSTOMERS
2020
LKR
2019
LKR
2020
LKR
2019
LKR

Risk
Man
agem
ent &
Corp
orat
e Go
vern
ance
Sust
aina
bilit
yRe
port
Man
agem
ent D
iscus
sion
and
Anal
ysis
Boa
rd o
f Dire
ctor
s &Ex
ecut
ive M
anag
emen
tHi
ghlig
hts
Fina
ncia
lIn
form
atio
n
Commercial Credit and Finance PLC Annual Report 2019/20 175
3,030,176,811
319,717,655
3,349,894,465
3,011,533,608
-
3,011,533,608
2020
LKR
Company / Group2019
LKR
Debentures (Note 25.1)Commercial Papers (Note 25.3)
25. DEBT INSTRUMENTS ISSUED
25.1 Debentures
25.2 Changes in liabilities arrising from financing activities (Debentures)
25.3 Commercial Papers
(86,782,556)
-
-
-
-
(86,782,556)
-
101,246,092
155,002,000
31,855,900
31,613,663
319,717,655
9.38%
9.34%
9.84%
11.08%
11.63%
86,782,556
100,000,000
150,000,000
30,000,000
30,000,000
396,782,556
Repayments
LKR
TenureAmortised Cost
As at31.03.2020
LKR
Interest rate IssuedAmount
LKR
Less than 90 days
90 days to 182 days
Above 182 daysTotal
SecurityFace value
(LKR)
Interest rate Frequencyof interest
payment
Issued date Maturity date AmortisedCost
LKR
AmortisedCost
LKR
Rated, Subordinated,Guaranteed, RedeemableDebentures Rated, Guaranteed ,Subordinated, RedeemableDebentures (Type A) Rated, Guaranteed,Subordinated, Redeemable Debentures (Type B)
1,000,000,000 10.5%
10.40%
6 monthsgross treasury
bill rate + 1.50%
Quarterly 1-Jun-15 30-May-20 999,918,547 995,824,292
2,000,000,000Semi
Annually10-Dec-15 9-Dec-20 2,030,258,264 2,015,709,316
3,030,176,811 3,011,533,608
Company/GroupType of debenture
Cash Flows Non Cash FlowsAs at
1/4/2019
LKR
DebenturesCapitalRepaid
LKR
DebentureInterest NetMovement
LKR
prepaid expenseamortisation
LKR
As at31/3/2020
LKR
Debts Instruments Issued 3,011,533,608 - - 18,643,202 3,030,176,811

Notes to the Financial Statements [Cont.]As at 31st March 2020
Commercial Credit and Finance PLC Annual Report 2019/2020176
1,987,798,983
1,987,798,983
2,546,086,231
2,546,086,231
2020
LKR
Group
2019
LKR
1,753,986,571
1,753,986,571
2,162,248,713
2,162,248,713
2020
LKR
Company
2019
LKR
Trade Payables
26. OTHER FINANCIAL LIABILITIES
27. OTHER LIABILITIES
606,766,346
2,287,501
2,629,438
329,305,504
517,787,000
4,219,621
1,462,995,410
810,595,750
9,027,261
1,910,777
568,490,293
-
8,843,599
1,398,867,679
2020
LKR
Group
2019
LKR
600,885,712
2,287,501
2,629,438
202,449,148
507,106,662
4,219,621
1,319,578,082
762,170,742
9,027,261
1,910,777
458,007,715
-
8,843,599
1,239,960,092
2020
LKR
Company
2019
LKR
VAT PayablesAdvances received against Real Estate stockDividend PayableOther LiabilitiesLease LiabilitiesDeferred Revenue on Land sale income
28. POST EMPLOYMENT BENEFIT OBLIGATIONS
189,283,759
72,459,570
(18,893,773)
78,849,526
321,699,082
166,395,524
52,884,126
(12,856,586)
(17,139,305)
189,283,759
2020
LKR
Group
175,608,858
65,625,989
(18,527,375)
75,984,355
298,691,827
155,833,660
49,166,640
(12,347,688)
(17,043,754)
175,608,858
2020
LKR
Company
2019
LKR
2019
LKR
As at the 1 AprilAmount Charged for the year (Note 28.1)Payments made during the yearActuarial Gains for the yearAs at 31 March
28.1 Expenses on Defined Benefit Plan
45,606,580
20,019,409
65,625,989
35,671,455
17,212,671
52,884,126
2020
LKR
Group
45,606,580
20,019,409
65,625,989
33,115,774
16,050,866
49,166,640
2020
LKR
Company
2019
LKR
2019
LKR
Current Service Cost for the year Interest cost for the year

Risk
Man
agem
ent &
Corp
orat
e Go
vern
ance
Sust
aina
bilit
yRe
port
Man
agem
ent D
iscus
sion
and
Anal
ysis
Boa
rd o
f Dire
ctor
s &Ex
ecut
ive M
anag
emen
tHi
ghlig
hts
Fina
ncia
lIn
form
atio
n
Commercial Credit and Finance PLC Annual Report 2019/20 177
10.10%
10.00%
10.00%
10.00%
10.00%
10.00%
10.00%
GA 1983Mortality Table
55 years
11.00%
10.00%
15.00%
15.00%
15.00%
15.00%
15.00%
GA 1983Mortality Table
55 years
2020
Subsidiary (Trade Finance andInvestment PLC)
2019
9.79%
9.00%
10.00%
7.50%
5.00%
2.50%
1.00%
GA 1983Mortality Table
55 years
10.30%
9.00%
10.00%
7.50%
5.00%
2.50%
1.00%
GA 1983Mortality Table
55 years
2020
Company
2019
Discount Rate Salary scale Staff Turnover 20 - 30 years 35 years 40 years 45 years 50 yearsMortality
Retirement age
28.2 Assumptions
28.4 Expected Benefit payout in the future years for retirement gratuity
28.3 The following table demonstrates the sensitivity to a reasonable possible change in the key assumptions employed with all other variables held constant in the employment benefit liability measurement, in respect of the year ended 31 March 2020
An actuarial valuation of the gratuity of the Company and its Subsidary was carried out as at 31 March 2020 by Piyal S Goonetilleke and Associates, a firm of professional actuaries. The valuation method used by the actuary to value the Fund is the "Projected Unit Credit Method".
18,088,137
142,260,413
257,217,887
18,771,631
173,053,784
212,946,546
Group
18,088,137
142,260,413
257,217,887
18,771,631
173,053,784
212,946,546
Company
Within next 12 monthsBetween 1 to 5 yearsBeyond 5 years
30,397,286
(25,975,299)
(25,904,824)
29,700,763
19,134,815
(16,320,695)
16,593,926
(18,807,294)
2020
LKR
Group
2019
LKR
28,518,948
(24,394,042)
(24,323,567)
27,890,268
18,069,133
(15,422,412)
15,557,532
(17,918,764)
2020
LKR
CompanyIncrease/
(Decrease)in Salary Scale
Increase/(Decrease)
in Discount Rate
Increase/(Decrease) in PVDBO Increase/(Decrease) in PVDBO
2019
LKR
2020
LKR
2019
LKR
2020
LKR
2019
LKR
(-1%)
1%
(-1%)
1%

Notes to the Financial Statements [Cont.]As at 31st March 2020
Commercial Credit and Finance PLC Annual Report 2019/2020178
ACCOUNTING POLICYThe Group measures the present value of the defined retirement benefits of gratuity which is a defined benefit plan using the projected unit credit actuarial valuation method. The actuarial valuation involves making assumptions about discount rate, expected rates of return on assets, future salary increases and mortality rates. Due to the long-term nature of these plans, such estimates are subject to significant uncertainty. All assumptions are reviewed at each reporting date.
Accordingly, the employee benefit liability is based on the actuarial valuation as of 31 March 2020, carried out by Messers Piyal S Goonetilleke and Associates, a firm of professional actuaries. All the employees of the Group are eligible for gratuity under the Payment of Gratuity Act No. 12 of 1983. the liability for payment to an employee arises only after the completion of 5 years of continued service.
Funding Arrangements The Gratuity liability is not externally funded. Defined Contribution Plans – Employees’ Provident Fund & Employees’ Trust FundEmployees are eligible for Employees’ Provident Fund Contributions and Employees’ Trust Fund Contributions in line with respective Statutes and Regulations. The Group contributes 12% and 3% of salaries and other entitled allowances of employees to Employees’ Provident Fund and Employees’ Trust Fund respectively.
29. DEFERRED TAXATION
29.1 Deferred Tax Assets, Liabilities and Income Tax relates to the following;
125,807,593
47,730,162
12,988,983
204,170,313
390,697,052
(83,633,712)
-
(41,702,055)
(125,335,767)
-
-
265,361,284
66,905,777
32,574,669
6,789,880
327,458,361
433,728,687
(49,170,480)
-
-
(49,170,480)
-
-
384,558,207
58,901,816
165,779
6,199,103
(123,288,048)
(58,021,349)
(13,187,613)
-
(41,684,732)
(54,872,345)
(112,893,694)
-
-
(93,442,765)
-
(1,787,768)
(333956571)
(429,187,104)
(10,286,556)
1,037,996,275
-
1,027,709,719
598,521,615
-
14,989,714
-
14,989,714
(21,275,619)
-
-
(21,275,619)
-
(6,285,905)
-
-
-
-
-
4,772,251
-
-
4,772,251
-
4,772,251
-
Company
Deferred Tax LiabilitiesCapital Allowances for taxpurposesRevaluation of BuildingInvestment PropertyLease Rental Receivable
Deferred Tax AssetsPost Employment BenefitObligationsTemporary difference onprovisionsTax Losses
Deferred income tax charge/(reversal) Statement of Profitor Loss Statement of OtherComprehensiveIncome Net Deferred Tax(Asset)/Liability
Statement ofFinancial Position
2020
LKR
2019
LKR
2020
LKR
2019
LKR
2020
LKR
2019
LKR
Statement of Profitor Loss
Statement of OtherComprehensive Income

Commercial Credit and Finance PLC Annual Report 2019/20 179
29.2 Deferred Tax Assets, Liabilities and Income Tax relates to the following;
Risk
Man
agem
ent &
Corp
orat
e Go
vern
ance
Sust
aina
bilit
yRe
port
Man
agem
ent D
iscus
sion
and
Anal
ysis
Boa
rd o
f Dire
ctor
s &Ex
ecut
ive M
anag
emen
tHi
ghlig
hts
Fina
ncia
lIn
form
atio
n
ACCOUNTING POLICY Deferred tax is provided, using the liability method, on temporary differences at the reporting date between the tax bases of assets and liabilities and their carrying amounts for financial reporting purposes. Deferred tax liabilities are recognised for all taxable temporary differences except where the deferred income tax liability arises from the initial recognition of an asset or liability in a transaction that is not a business combination and, at the time of the transaction, affects neither the accounting profit nor taxable profit or loss. Deferred tax assets are recognised for all deductible temporary differences, carry-forward of unused tax credits and unused tax losses, to the extent that it is probable that taxable profit will be available against which the deductible temporary differences, and the carry-forward of unused tax assets and unused tax losses can be utilised. The carrying amount of deferred tax assets is reviewed at each reporting date and reduced to the extent that it is no longer probable that sufficient taxable profit will be available to allow all or part of the deferred income tax asset to be utilised. Deferred tax assets and liabilities are measured at the tax rates that are expected to apply to the year when the asset is realised or the liability is settled, based on tax rates (and tax laws) that have been enacted or substantively enacted at the reporting date. Deferred tax relating to items recognised outside profit or loss is recognised outside profit or loss. Deferred tax items are recognised in correlation to the underlying transaction either in other comprehensive income or directly in equity. Deferred tax assets and liabilities are off set if legally enforceable right exists to set off current tax assets against current income tax liabilities and Deferred tax relates to the same taxable entity and the same taxation authotity.
128,838,012
431,495
47,730,162
12,988,983
205,282,695
395,271,348
(90,075,743)
-
(98,917,594)
(125,516,878)
(314,510,215)
80,761,132
70,167,430
366,649
32,574,669
6,789,880
8,577,648
312,395,469
(52,999,452)
(52,335,726)
-
-
(105,335,178)
207,060,291
58,670,582
64,846
15,155,493
6,199,103
2,785,854
82,875,879
(15,800,671)
(989,066,564)
(1,140,319,884)
(125,516,878)
(2,270,703,998)
(2,187,828,119)
(749,795,863)
(31,954)
-
6,789,880
193,919,193
(549,118,744)
(1,613,704)
985,660,549
-
-
984,046,845
(522,153,223)
-
-
14,989,714
-
14,989,714
(21,275,619)
-
-
-
(21,275,619)
(6,285,905)
-
-
-
-
-
(4,772,251)
-
-
-
(4,772,251)
(4,772,251)
Group
Deferred Tax LiabilitiesCapital Allowances for taxpurposesFair Value through otherComprehensive Income ReserveRevaluation of BuildingInvestment PropertyLease rental receivables
Deferred Tax AssetsPost Employment BenefitObligationTemporary difference onprovisionsLease Rental ReceivablesTax Losses
Deferred income tax chargeStatement of Profitor LossStatement of OtherComprehensiveIncomeNet Deferred Tax (Asset)/Liability
Statement ofFinancial Position
2020LKR
Liability
2019LKR
Liability
2020
LKR
2019
LKR
2020
LKR
2019
LKR
Statement of Profitor Loss
Statement of OtherComprehensive Income

Notes to the Financial Statements [Cont.]As at 31st March 2020
Commercial Credit and Finance PLC Annual Report 2019/2020180
32.RESERVES
Company
181,972,474
38,544,978
-
220,517,452
58,751,125
-
-
58,751,125
2,989,810,673
-
332,779,815
3,322,590,488
(6,262,158)
-
(6,262,158)
3,224,272,114
38,544,978
332,779,815
3,595,596,907
RevaluationReserve
LKR
GeneralReserve
(Note 30.1)LKR
StatutoryReserve
(Note 30.2)LKR
FVOCIReserve
LKR
TotalReserve
LKR
As at 01 April 2019 Other Comprehesive Income for theyear net of tax Transfers to/(from) duringthe yearAs at 31 March 2020
30.STATED CAPITAL
30.1 Issued and Fully Paid-Ordinary shares
31.RETAINED EARNINGS
30.2 Rights of Shareholders
The holders of ordinary shares confer right to receive dividends as declared from time to time and are entitled to onevote per share at meeting. All shares rank equally with regard to the Company's residual assets.
Company/GroupCompany/Group
318,074,365
318,074,365
2,150,640,315
2,150,640,315
2019
318,074,365
318,074,365
2,150,640,315
2,150,640,315
No. ofShares
2020
GroupCompany
LKR No. ofShares
LKR
At the beginning of the yearAt the end of the year
7,356,688,195
-
2,005,362,994
(56,901,561)
(318,074,370)
(350,701,199)
8,636,374,058
7,859,293,595
(2,465,963,389)
2,633,406,656
12,340,059
(238,555,774)
(443,832,952)
7,356,688,195
6,612,084,610
-
1,663,899,075
(54,708,736)
(318,074,370)
(332,779,815)
7,570,420,764
7,284,658,283
(2,109,232,265)
2,078,678,579
12,271,503
(238,555,774)
(415,735,716)
6,612,084,610
2020
LKR
2019
LKR
2020
LKR
2019
LKR
As at 01 AprilImpact of adopting SLFRS -9 Profit for the YearOther Comprehensive Income net of taxDividend Paid (Note 45)Transfers to Statutory Reserve Fund (Note 32)As at 31 March
ACCOUNTING POLICY Deferred tax is provided, using the liability method, on temporary differences at the reporting date between the tax bases of assets and liabilities and their carrying amounts for financial reporting purposes. Deferred tax liabilities are recognised for all taxable temporary differences except where the deferred income tax liability arises from the initial recognition of an asset or liability in a transaction that is not a business combination and, at the time of the transaction, affects neither the accounting profit nor taxable profit or loss. Deferred tax assets are recognised for all deductible temporary differences, carry-forward of unused tax credits and unused tax losses, to the extent that it is probable that taxable profit will be available against which the deductible temporary differences, and the carry-forward of unused tax assets and unused tax losses can be utilised. The carrying amount of deferred tax assets is reviewed at each reporting date and reduced to the extent that it is no longer probable that sufficient taxable profit will be available to allow all or part of the deferred income tax asset to be utilised. Deferred tax assets and liabilities are measured at the tax rates that are expected to apply to the year when the asset is realised or the liability is settled, based on tax rates (and tax laws) that have been enacted or substantively enacted at the reporting date. Deferred tax relating to items recognised outside profit or loss is recognised outside profit or loss. Deferred tax items are recognised in correlation to the underlying transaction either in other comprehensive income or directly in equity. Deferred tax assets and liabilities are off set if legally enforceable right exists to set off current tax assets against current income tax liabilities and Deferred tax relates to the same taxable entity and the same taxation authotity.

Risk
Man
agem
ent &
Corp
orat
e Go
vern
ance
Sust
aina
bilit
yRe
port
Man
agem
ent D
iscus
sion
and
Anal
ysis
Boa
rd o
f Dire
ctor
s &Ex
ecut
ive M
anag
emen
tHi
ghlig
hts
Fina
ncia
lIn
form
atio
n
Commercial Credit and Finance PLC Annual Report 2019/20 181
33.GROSS INCOME
20,835,015,311
1,319,142,520
6,929,903
(10,350,171)
753,252,067
54,828,026
22,958,817,657
22,125,265,906
1,432,368,091
24,023,559
(35,984,919)
684,882,046
208,796,848
24,439,351,531
Group
17,966,128,159
1,267,296,634
6,929,903
(10,350,171)
600,849,246
54,828,026
19,885,681,797
19,626,812,489
1,336,533,359
24,023,559
(35,984,919)
723,444,622
208,796,848
21,883,625,959
Company
Interest income (Note 33.1)Fee and Commission Income (Note 34)Net income from Real estate sales (Note 35)Net gain/(loss) from trading (Note 36)Other operating income (Note 37)Change in fair value of Investment property
2020
LKR
2019
LKR
2020
LKR
2019
LKR
33.1 Interest Income
278,559,488
501,716,413
5,467,601,595
14,377,999,508
209,138,307
20,835,015,310
227,674,574
416,158,943
9,560,478,207
11,680,817,339
240,136,844
22,125,265,906
Group
261,063,254
478,552,449
5,120,633,748
11,928,880,907
176,997,801
17,966,128,159
220,072,775
426,169,771
9,363,797,713
9,388,417,687
228,354,544
19,626,812,489
Company
Reverse repurchase agreementsPlacement with Banks and other Financial InstitutionsLoans and AdvancesLease rentals receivable & Stock out on hireFinancial assets - fair value through profit or lossTotal Interest Income
2020
LKR
2019
LKR
2020
LKR
2019
LKR
32.1 General reserve represents amounts set aside by the Board of Directors from time to time which is availablefor general application at the discretion of the Board.
32.2 Statutory Reserve Fund is a capital reserve which contains profits transferred as required by Section3(b)(ii) of Central Bank Direction No. 1 of 2003.
Group
181,972,475
38,544,978
-
220,517,452
58,751,126
-
-
58,751,125
3,079,067,382
350,701,199
3,429,768,580
(7,294,556)
230,785
-
(7,063,772)
3,312,496,424
38,775,764
350,701,199
3,701,973,390
RevaluationReserve
LKR
GeneralReserve
(Note 30.1)LKR
StatutoryReserve
(Note 30.2)LKR
FVOCIReserve
LKR
TotalReserve
LKR
As at 01 April 2019 Other Comprehesive Income for theyear net of tax Transfers to/(from) during the year
As at 31 March 2020

Notes to the Financial Statements [Cont.]As at 31st March 2020
Commercial Credit and Finance PLC Annual Report 2019/2020182
34.FEE AND COMMISSION INCOME/EXPENSE
318,549,019
1,000,593,501
1,319,142,520
302,509,237
1,129,858,854
1,432,368,091
Group
266,703,133
1,000,593,501
1,267,296,634
216,719,254
1,119,814,105
1,336,533,359
Company
Fee and Commission IncomeCredit Related Fees and CommissionsService ChargesTotal Fee and Commission Income
2020
LKR
2019
LKR
2020
LKR
2019
LKR
35.NET INCOME FROM REAL ESTATE SALES
24,032,060
(17,102,156)
6,929,903
24,032,060
(8,501)
24,023,559
Group
24,032,060
(17,102,156)
6,929,903
24,032,060
(8,501)
24,023,559
Company
Proceeds from Real Estate salesCost of sales
2020
LKR
2019
LKR
2020
LKR
2019
LKR
36.NET GAIN/(LOSS) FROM TRADING
(10,350,171)
(10,350,171)
(35,984,919)
(35,984,919)
Group
(10,350,171)
(10,350,171)
(35,984,919)
(35,984,919)
Company
Financial assets recognised through profit or loss- measured at fair value
2020
LKR
2019
LKR
2020
LKR
2019
LKR
33.2 Interest Expenses
2,644,727,607
6,890,264,413
314,659,512
73,220,998
9,922,872,530
2,012,232,511
7,357,789,681
289,720,517
-
9,659,742,709
Group
1,587,660,631
6,619,446,143
314,659,512
71,380,167
8,593,146,453
1,389,050,865
7,091,854,116
289,720,517
-
8,770,625,499
Company
Due to BanksDue to CustomersDebt instruments issuedInterest Expense on Lease LiabilitiesTotal Interest Expenses
2020
LKR
2019
LKR
2020
LKR
2019
LKR

Risk
Man
agem
ent &
Corp
orat
e Go
vern
ance
Sust
aina
bilit
yRe
port
Man
agem
ent D
iscus
sion
and
Anal
ysis
Boa
rd o
f Dire
ctor
s &Ex
ecut
ive M
anag
emen
tHi
ghlig
hts
Fina
ncia
lIn
form
atio
n
Commercial Credit and Finance PLC Annual Report 2019/20 183
38.IMPAIRMENT CHARGES OF FINANCIAL ASSETS
771,744,919
2,588,051,906
44,785,377
3,404,582,022
1,884,668,185
1,185,525,725
-
3,070,193,910
Group
782,722,709
1,886,472,724
44,785,377
2,713,980,811
1,817,059,672
1,061,304,038
-
2,878,363,710
Company
Loans and ReceivablesLease rentals receivable & Stock out on hireOther Financial Assets
2020
LKR
2019
LKR
2020
LKR
2019
LKR
39.PERSONNEL EXPENSES
1,937,484,148
-
203,865,322
44,972,545
72,459,570
242,519,760
204,224,866
2,705,526,210
2,323,757,725
-
210,952,642
47,462,918
52,884,126
275,961,914
495,705,861
3,406,725,185
Group
1,774,135,511
179,890,181
44,972,545
65,625,989
242,519,760
204,224,866
2,511,368,853
2,108,857,246
189,921,969
47,462,918
49,166,640
275,961,914
456,240,768
3,127,611,455
Company
Salaries and bonus Contribution to Defined Contribution Plan Contribution to EPF Contribution to ETFContribution to defined benefit plan (Note 28.1) Travelling & Subsistence Other allowances & staff related expenses
2020
LKR
2019
LKR
2020
LKR
2019
LKR
37.OTHER OPERATING INCOME
2,161,995
797,974
497,970,630
1,017,472
3,236,135
202,841,325
289,505
44,937,034
753,252,066
1,982,393
1,118,180
568,873,201
4,703,123
2,647,078
76,145,544
1,628,500
27,784,028
684,882,045
Group
-
797,974
459,394,587
1,017,472
2,942,109
91,470,564
289,505
44,937,034
600,849,246
1,066,659
1,118,180
565,917,380
4,703,123
51,128,724
70,098,028
1,628,500
27,784,028
723,444,622
Company
Profit on disposal of property & equipmentSundry Income from Real estateBad debt recoveriesRent incomeDividend IncomeOther sundry incomeGain from disposal of investment propertyPawning auction (loss)/gainTotal Other Operating Income
2020
LKR
2019
LKR
2020
LKR
2019
LKR

Notes to the Financial Statements [Cont.]As at 31st March 2020
Commercial Credit and Finance PLC Annual Report 2019/2020184
41.TAX ON FINANCIAL SERVICES
676,610,427
304,892,097
981,502,524
913,235,428
262,719,550
1,175,954,978
Group
594,028,190
269,463,668
863,491,858
767,693,905
221,553,566
989,247,471
Company
Value added taxDebt repayment levy
2020
LKR
2019
LKR
2020
LKR
2019
LKR
42.SHARE OF LOSS OF ASSOCIATE
(15,711,053)
-
(15,711,053)
(10,085,857)
-
(10,085,857)
Group Group
Share of Loss of associates before income taxIncome tax on share of operating results of associatesShare of Loss of associates net of income tax
2020
LKR
2019
LKR
40.OTHER OPERATING EXPENSES
36,925,714
10,290,084
4,085,249
181,060,533
2,000,000
2,404,105,587
542,375,077
3,180,842,243
9,422,040
10,308,548
3,197,002
160,833,502
4,500,000
2,478,631,372
529,256,371
3,196,148,835
Group
10,589,832
4,800,000
4,085,249
179,537,857
2,000,000
2,190,068,560
473,967,137
2,865,048,634
6,112,040
5,601,750
3,197,002
153,996,609
4,500,000
2,269,929,838
506,373,983
2,949,711,222
Company
Directors' Fees and Expense Auditors' remuneration - Audit - Non-auditProfessional and Legal Expenses Regulatory Penalties Office Administration and Establishment Expenses Advertising and Business Promotion Expenses
2020
LKR
2020
LKR
2019
LKR
2019
LKR
2019
LKR

Risk
Man
agem
ent &
Corp
orat
e Go
vern
ance
Sust
aina
bilit
yRe
port
Man
agem
ent D
iscus
sion
and
Anal
ysis
Boa
rd o
f Dire
ctor
s &Ex
ecut
ive M
anag
emen
tHi
ghlig
hts
Fina
ncia
lIn
form
atio
n
Commercial Credit and Finance PLC Annual Report 2019/20 185
43.2 Reconciliation of Accounting Profit and Taxable Income
2,200,779,691
10,229,932,638
(87,953,377)
(9,176,218,394)
3,166,540,559
(1,920,565,859)
1,245,974,700
1,245,974,700
337,483,962
9.84%
3,562,858,297
14,922,232,656
(1,453,809,883)
(12,342,611,002)
4,688,670,068
(3,076,093,430)
1,612,576,638
1,612,576,638
451,521,461
24.88%
Group
1,797,487,160
8,456,774,692
(87,953,377)
(7,326,897,914)
2,839,410,562
(1,920,565,859)
918,844,702
918,844,702
246,499,102
7.43%
2,841,894,340
11,964,681,499
(51,196,996)
(11,160,919,097)
3,594,459,747
(3,076,093,430)
518,366,316
518,366,316
145,142,569
26.17%
Company
Acccounting profit before taxNon deductible Expenses and Capital portion of lease rentalsExempt IncomeAllowable Expenses including depreciation allowances onleased hold assetsTotal profit from businesses ( leasing and non- leasing)Loss on leasing businessTotal Statutory IncomeTaxable IncomeIncome Tax Expense
Effective tax rate
2020
LKR
2019
LKR
2020
LKR
2019
LKR
A reconciliation between the tax expense and the accounting profit multiplied by government of Sri Lanka’s tax rate for the years ended 31 March 2020 and 2019 is as follows:
337,483,962
(38,051,778)
-
-
-
(120,979,250)
178,452,933
(6,285,905)
(6,285,905)
451,521,461
13,524,967
19,427,770
7,870,155
434,928,101
927,272,453
4,772,251
4,772,251
Group
246,499,102
-
-
-
(112,911,016)
133,588,085
(6,285,905)
(6,285,905)
145,142,571
-
-
19,427,770
598,522,615
763,092,956
4,772,251
4,772,251
Company
Statement of Profit or Loss Current Income Tax Income Tax for the year (Over)/under Provision of Current Taxes in respect ofPrevious YearsDividend TaxTax on Capital Gains
Deferred TaxDeferred Taxation Charge/(Reversal) (Note 29) Statement of Other Comprehensive IncomeDeferred tax related to other comprehensive income(Note 29) Income tax charged directly Statement of OtherComprehensive ncome
2020
LKR
2019
LKR
2020
LKR
2019
LKR
43.1 The major components of income tax expense for the years ended 31 March are as follows:
43. TAXATION

Notes to the Financial Statements [Cont.]As at 31st March 2020
Commercial Credit and Finance PLC Annual Report 2019/2020186
44.2DILUTED EARNINGS PER ORDINARY SHARE
2,005,362,994
318,074,365
6.30
2,633,406,656
318,074,365
8.28
Group
1,663,899,075
318,074,365
5.23
2,078,678,579
318,074,365
6.54
Company
Amounts Used as the Numerators:Profit attributable to Ordinary Shareholdersfor Basic Earnings Per Share
Weighted Average Number of Ordinary Shares
Diluted Earnings per ordinary share (Rs.)
2020
LKR 2019
LKR
2020
LKR
2019
LKR
Diluted EPS is calculated by dividing the net profit for the year attributable to ordinary shareholders by weightedaverage number of ordinary shares outstanding during the year plus the weighted average number of ordinary shares hat would be issued on conversion of all the dilutive potential ordinary shares in to ordinary shares.
Number of Ordinary Shares Used as Denominators for Diluted Earnings per share
ACCOUNTING POLICY
44.EARNINGS PER ORDINARY SHARE
44.1BASIC EARNINGS PER ORDINARY SHAREBasic earnings per share is calculated by dividing the net profit for the year attributable to ordinary shareholders by weighted average number of ordinary shares outstanding during the year, as per LKAS 33- Earnings Per Share.
Current income tax assets and liabilities for the current period are measured at the amount expected to be recoveredfrom or paid to the taxation authorities. The tax rates and tax laws used to compute the amount are those that areenacted or substantively enacted, at the reporting date. Current income tax relating to items recognized directly in equity is recognized in equity and not in the Statementof profit or loss. Management periodically evaluates positions taken in the tax returns with respect to situations inwhich applicable tax regulations are subject to interpretation and establishes provisions where appropriate.
2,005,362,994
318,074,365
6.30
2,633,406,656
318,074,365
8.28
Group
1,663,899,075
318,074,365
5.23
2,078,678,579
318,074,365
6.54
Company
Amounts Used as the Numerators:Profit attributable to Ordinary Shareholdersfor Basic Earnings Per Share Number of Ordinary Shares Used as Denominators for BasicEarnings per share Weighted Average Number of Ordinary Shares Basic Earnings per ordinary share (Rs.)
2020
LKR 2019
LKR
2020
LKR
For the year ended 31 March 2019
LKR

Risk
Man
agem
ent &
Corp
orat
e Go
vern
ance
Sust
aina
bilit
yRe
port
Man
agem
ent D
iscus
sion
and
Anal
ysis
Boa
rd o
f Dire
ctor
s &Ex
ecut
ive M
anag
emen
tHi
ghlig
hts
Fina
ncia
lIn
form
atio
n
Commercial Credit and Finance PLC Annual Report 2019/20 187
45. DIVIDEND PAID
ACCOUNTING POLICY
Dividend on ordinary shares are recognised as a liability and deducted from equity when they are approved by thecompany’s shareholders. Interim dividends are deducted when they are declared and no longer at the discretion ofthe company.
45.1 Declared and Paid During the Year
318,074,365
318,074,365
238,555,774
238,555,774
Group
318,074,365
318,074,365
238,555,774
238,555,774
Company
Dividends on Ordinary Shares: Final Dividend for 2018/19 Rs.1/- per share(Final Dividend for 2017/18 Rs.0.75/- per share.)
2020
LKR
2019
LKR
2020
LKR
2019
LKR

Commercial Credit and Finance PLC Annual Report 2019/2020188
12,
011,
492,
021
760
,492
,355
434
,253
,638
13,
206,
238,
014
2,1
64,4
67,9
62
44,2
33,5
05,7
32
37,
097,
948,
086
Fina
nce
Leas
e
LKR
2,7
13,4
75,3
34
171
,800
,243
98,
100,
763
2,98
3,37
6,34
0
488
,967
,600
8,45
5,99
4,61
1
7,0
91,9
10,1
69
Hire
Purc
hase
LKR
1,2
50,9
47,6
89
79,
202,
163
45,
225,
738
1,37
5,37
5,59
0
225
,420
,472
2,81
7,20
4,24
3
2,3
62,7
45,0
51
Mic
rofin
ance
and
SME
Loan
s L
KR
1,6
08,0
14,9
94
101
,809
,426
58,
134,
856
1,76
7,95
9,27
6
289
,763
,914
5,99
8,47
7,68
6
5,0
30,8
29,2
35
Paw
ning
LKR
1,5
29,7
30,9
74
96,
852,
973
55,
304,
640
1,68
1,88
8,58
7
275
,657
,152
7,6
64,1
65,0
75
6,4
27,8
15,1
45
Ter
m L
oan
LKR
61,
232,
928
3,8
76,8
85
2,2
13,7
65
67,3
23,5
78
11,
034,
159
384,
092,
411
322
,132
,286
Rev
olvi
ngLo
ans
LKR
989
,414
,207
62,
643,
503
(10,
350,
171)
35,
770,
470
1,07
7,47
8,01
0
176
,595
,835
13,4
41,7
62,4
49
11,
273,
395,
524
Inv
estm
ents
LKR
670
,707
,163
42,
464,
972
6,9
29,9
03
24,
248,
197
54,8
28,0
26
799
,178
,261
130
,983
,232
6,86
6,97
5,18
0
5,7
59,2
24,4
73
Una
lloca
ted
LKR
20,
835,
015,
311
1,3
19,1
42,5
20
6,9
29,9
03
(10,
350,
171)
753
,252
,067
54,8
28,0
26
22,9
58,8
17,6
56
3,7
62,8
90,3
26
(580
,608
,111
)
3,1
82,2
82,2
15
(676
,610
,427
)
(304
,892
,097
)
(15,
711,
053)
2,1
85,0
68,6
37
(178
,452
,933
)
2,0
06,6
15,7
05
89,
862,
177,
386
89,
862,
177,
386
75,
365,
999,
968
75,
365,
999,
968
Tot
al
LKR
Inte
rest
inco
me
Fee
Base
d In
com
e Ne
t inc
ome
from
Rea
l est
ate
sale
sNe
t gai
n fro
m tr
adin
gOt
her o
pera
ting
inco
me
Chan
ge in
fair
valu
e of
Inve
stm
ent p
rope
rtyTo
tal R
even
ueSe
gmen
tal R
esul
t Bef
ore
depr
ecia
tion
and
amor
tisat
ion
Depr
ecia
tion
and
Amor
tisat
ion
Segm
ents
Res
ults
VAT
on F
inan
cial S
ervi
ces
Debt
repa
ymen
t lev
ySh
are
of lo
ss o
f ass
ocia
tes
Profi
t bef
ore
Taxa
tion
Inco
me
Tax
Expe
nses
Net p
rofit
for t
he Y
ear
Segm
ent A
sset
Tota
l Ass
ets
Segm
ent L
iabi
litie
sTo
tal L
iabi
litie
s
46 O
PERA
TING
SEG
MEN
TS
46.1
Grou
p 20
20
For m
anag
emen
t pur
pose
s, th
e Gr
oup
is or
gani
sed
into
seve
n op
erat
ing
segm
ents
bas
ed o
n se
rvice
s offe
red
to cu
stom
ers a
s fol
low
s. Th
e fo
llow
ing
tabl
e pr
esen
tsin
com
e an
d pr
ofit a
nd ce
rtain
ass
et a
nd lia
bilit
y in
form
atio
n re
gard
ing
the
Grou
p’s o
pera
ting
segm
ents
.

Risk
Man
agem
ent &
Corp
orat
e Go
vern
ance
Sust
aina
bilit
yRe
port
Man
agem
ent D
iscus
sion
and
Anal
ysis
Boa
rd o
f Dire
ctor
s &Ex
ecut
ive M
anag
emen
tHi
ghlig
hts
Fina
ncia
lIn
form
atio
n
Commercial Credit and Finance PLC Annual Report 2019/20 189
9,1
78,1
83,1
30
594
,186
,606
284
,108
,352
10,0
56,4
78,0
88
2,1
00,6
53,3
29
39,1
01,4
64,6
63
33,
475,
491,
302
Fin
ance
Leas
e
LKR
2,7
00,5
78,6
05
174
,832
,820
83,
595,
732
2,95
9,00
7,15
7
618
,093
,947
7,65
3,00
1,37
9
6,5
51,8
76,8
49
Hire
Purc
hase
LKR
3,7
63,4
79,1
32
243
,643
,961
116
,497
,551
4,1
23,6
20,6
43
861
,364
,919
5,75
1,17
3,70
8
4,9
23,6
86,8
00
Mic
rofin
ance
and
SME
Loan
s L
KR
1,3
90,4
03,8
76
90,
013,
388
43,
039,
603
1,52
3,45
6,86
6
318
,228
,182
5,22
0,86
2,88
4
4,4
69,6
77,8
39
Paw
ning
LKR
2,2
98,8
13,5
30
148
,822
,941
71,
159,
195
2,5
18,7
95,6
67
526
,140
,111
8,19
6,53
6,68
7
7,0
17,2
07,5
38
Ter
m L
oan
LKR
1,0
37,1
60,9
13
67,
144,
784
32,
105,
055
1,13
6,41
0,75
2
237
,379
,827
525,
060,
247
449
,513
,845
Rev
olvi
ngLo
ans
LKR
883
,970
,361
57,
227,
377
(35,
984,
919)
27,
363,
080
932,
575,
900
194
,801
,664
13,1
73,6
71,6
96
11,
278,
225,
408
Inv
estm
ents
LKR
872
,676
,359
56,
496,
215
24,
023,
559
27,
013,
477
208
,796
,848
1,18
9,00
6,45
8
248
,366
,312
9,52
0,86
1,85
1
8,1
50,9
86,9
47
Una
lloca
ted
LKR
22,
125,
265,
907
1,4
32,3
68,0
91
24,
023,
559
(35,
984,
919)
684
,882
,045
208
,796
,848
24,4
39,3
51,5
32
5,1
05,0
28,2
91
(356
,129
,159
)
4,7
48,8
99,1
32
(913
,235
,428
)
(262
,719
,550
)
(10,
085,
857)
3,5
62,8
58,2
97
(927
,272
,453
)
2,6
35,5
85,8
44
89,
142,
633,
115
89,
142,
633,
115
76,
316,
666,
528
76,
316,
666,
528
Tot
al
LKR
Inte
rest
inco
me
Fee
Base
d In
com
e Ne
t inc
ome
from
Rea
l est
ate
sale
sNe
t gai
n fro
m tr
adin
gOt
her o
pera
ting
inco
me
Chan
ge in
fair
valu
e of
Inve
stm
ent p
rope
rtyTo
tal R
even
ueSe
gmen
tal R
esul
t Bef
ore
depr
ecia
tion
and
amor
tisat
ion
Depr
ecia
tion
and
Amor
tisat
ion
Segm
ents
Res
ults
VAT
on F
inan
cial S
ervi
ces
Debt
repa
ymen
t lev
ySh
are
of lo
ss o
f ass
ocia
tes
Profi
t bef
ore
Taxa
tion
Inco
me
Tax
Expe
nses
Net p
rofit
for t
he Y
ear
Segm
ent A
sset
Tota
l Ass
ets
Segm
ent L
iabi
litie
sTo
tal L
iabi
litie
s
46.2
Gro
up -
2019

Notes to the Financial Statements [Cont.]As at 31st March 2020
Commercial Credit and Finance PLC Annual Report 2019/2020190
ACCOUNTING POLICY
An operating segment is a component of the Group that engages in business activities from which it may earn revenues and incur expenses, including revenues and expenses that relate to transactions with any of the Group’s other components, whose operating results are reviewed regularly by the Senior Management to make decisions about resources allocated to each segment and assess its performance, and for which discrete financial information is available.
Income taxes are managed on a group basis and are not allocated to operating segments. Interest income is reported net, as management primarily relies on net interest revenue as a performance measure, not the gross income and expense. Transfer prices between operating segments are on an arm’s length basis in a manner similar to transactions with third parties. No revenue from transactions with a single external customer or counterparty amounted to 10% or more of the company’s total revenue in 2020 or 2019.
· Finance Lease · Term loans· Hire purchase · Revolving loan· Microfinance & SME loans · Investments· Pawning · Unallocated

Risk
Man
agem
ent &
Corp
orat
e Go
vern
ance
Sust
aina
bilit
yRe
port
Man
agem
ent D
iscus
sion
and
Anal
ysis
Boa
rd o
f Dire
ctor
s &Ex
ecut
ive M
anag
emen
tHi
ghlig
hts
Fina
ncia
lIn
form
atio
n
Commercial Credit and Finance PLC Annual Report 2019/20 191
47.1
47 ANALYSIS OF FINANCIAL INSTRUMENTS BY MEASUREMENT BASIS
854,570,071
3,004,279,491
3,812,279,883
-
18,219,942,284
43,395,382,046
114,822,765
-
743,285,925
70,144,562,465
854,570,071
3,004,279,491
3,812,279,883
2,072,291,864
18,219,942,284
43,395,382,046
114,822,765
4,310,479
743,285,925
72,221,164,808
Cost
-
-
-
2,072,291,864
-
-
-
-
2,072,291,864
-
-
-
-
-
-
4,310,479
-
4,310,479
Fair valuethrough profit
or LossLKR
At Fair ValueCompanyFair value
through OtherComprehensive
Income LKR
Financialassets measured
at amortisedcost LKR
Total
LKR
AssetsCash and Bank BalancesReverse repurchase agreementsPlacements with banksFinancial assets recognised through profit orloss - measured at fair valueFinancial assets at amortised costLoans and ReceivablesLease rentals receivable & Stock out on hireDebt & other instrumentsFinancial assets at fair value through othercomprehensive incomeOther financial assetsTotal Financial Assets
12,661,616,855
47,394,521,877
3,349,894,465
1,753,986,571
65,160,019,768
12,661,616,855
47,394,521,877
3,349,894,465
1,753,986,571
65,160,019,768
At Amortised CostCompanyAs at 31 March 2020
As at 31 March 2020
Other FinancialLiabilities
LKR
Total
LKR
Liabilities Due to BanksDue to CustomersDebt Instruments Issued and Other borrowed fundsOther Financial LiabilitiesTotal Financial Liabilities

Notes to the Financial Statements [Cont.]As at 31st March 2020
Commercial Credit and Finance PLC Annual Report 2019/2020192
1,208,461,539
3,141,542,623
3,826,996,141
-
18,377,266,075
52,689,500,344
114,822,765
-
725,285,925
80,083,875,411
1,208,461,539
3,141,542,623
3,826,996,141
2,228,854,997
18,377,266,075
52,689,500,344
114,822,765
67,223,703
725,285,925
82,379,954,110
Cost
-
-
-
2,228,854,997
-
-
-
-
2,228,854,997
-
-
-
-
-
-
67,223,703
-
67,223,703
Fair valuethrough profit
or LossLKR
At Fair ValueGroupAs at 31 March 2020 Fair value
through OtherComprehensive
Income LKR
Financialassets measured
at amortisedcost LKR
Total
LKRAssetsCash and Bank BalancesReverse repurchase agreementsPlacements with banksFinancial assets recognised through profit orloss - measured at fair valueLoans and ReceivablesLease rentals receivable & Stock out on hireDebt & other instrumentsFinancial assets at fair value through othercomprehensive incomeOther financial assetsTotal Financial Assets
19,214,209,118
48,948,641,777
3,349,894,465
1,987,798,983
73,500,544,343
19,214,209,118
48,948,641,777
3,349,894,465
1,987,798,983
73,500,544,343
At Amortised CostGroupAs at 31 March 2020 Other Financial
Liabilities
LKR
Total
LKRLiabilities Due to BanksDue to CustomersDebt Instruments Issued and Other borrowed fundsOther Financial LiabilitiesTotal Financial Liabilities

Risk
Man
agem
ent &
Corp
orat
e Go
vern
ance
Sust
aina
bilit
yRe
port
Man
agem
ent D
iscus
sion
and
Anal
ysis
Boa
rd o
f Dire
ctor
s &Ex
ecut
ive M
anag
emen
tHi
ghlig
hts
Fina
ncia
lIn
form
atio
n
Commercial Credit and Finance PLC Annual Report 2019/20 193
47.ANALYSIS OF FINANCIAL INSTRUMENTS BY MEASUREMENT BASIS
47.2
1,748,596,904
3,662,522,772
3,603,184,738
-
23,704,115,396
37,150,447,901
187,244,522
-
630,157,554
70,686,269,785
1,748,596,904
3,662,522,772
3,603,184,738
2,112,157,240
-
23,704,115,396
37,150,447,901
187,244,522
4,310,479
630,157,554
72,802,737,504
Cost
-
-
-
2,112,157,240
-
-
-
-
2,112,157,240
-
-
-
-
-
-
4,310,479
-
4,310,479
Fair valuethrough profit
or LossLKR
At Fair Value
CompanyAs at 31 March 2019 Fair valuethrough Other
ComprehensiveIncome LKR
Financialassets measured
at amortisedcost LKR
Total
LKR
AssetsCash and Bank BalancesReverse repurchase agreementsPlacements with banksFinancial assets recognised through profit orloss - measured at fair valueFinancial assets at amortised costLoans and ReceivablesLease rentals receivable & Stock out on hireDebt & other instrumentsFinancial assets at fair value through othercomprehensive incomeOther financial assetsTotal Financial Assets
9,241,472,974
51,908,367,338
3,011,533,608
2,162,248,713
66,323,622,633
9,241,472,974
51,908,367,338
3,011,533,608
2,162,248,713
66,323,622,633
At Amortised Cost
CompanyAs at 31 March 2019 Other FinancialLiabilities
LKR
Total
LKR
Liabilities Due to BanksDue to CustomersDebt Instruments Issued and Other borrowed fundsOther Financial LiabilitiesTotal Financial Liabilities

Notes to the Financial Statements [Cont.]As at 31st March 2020
Commercial Credit and Finance PLC Annual Report 2019/2020194
2,340,080,214
3,787,893,629
3,513,125,045
-
24,000,337,936
46,081,967,199
187,244,522
-
630,157,554
80,540,806,099
2,340,080,214
3,787,893,629
3,513,125,045
2,116,671,777
24,000,337,936
46,081,967,199
187,244,522
63,107,921
630,157,554
82,720,585,795
Cost
-
-
-
2,116,671,777
-
-
-
-
2,116,671,777
-
-
-
-
-
-
63,107,921
-
63,107,921
Fair valuethrough profit
or LossLKR
At Fair ValueGroupAs at 31 March 2019 Fair value
through OtherComprehensive
Income LKR
Financialassets measured
at amortisedcost LKR
Total
LKR
AssetsCash and Bank BalancesReverse repurchase agreementsPlacements with banksFinancial assets recognised through profit orloss - measured at fair valueLoans and ReceivablesLease rentals receivable & Stock out on hireDebt & other instrumentsFinancial assets at fair value through othercomprehensive incomeOther financial assetsTotal Financial Assets
15,027,515,792
53,936,319,168
3,011,533,608
2,546,086,231
74,521,454,799
15,027,515,792
53,936,319,168
3,011,533,608
2,546,086,231
74,521,454,799
At Amortised CostGroupAs at 31 March 2019 Other Financial
Liabilities
LKR
Total
LKR
Liabilities Due to BanksDue to CustomersDebt Instruments Issued and Other borrowed fundsOther Financial LiabilitiesTotal Financial Liabilities

Risk
Man
agem
ent &
Corp
orat
e Go
vern
ance
Sust
aina
bilit
yRe
port
Man
agem
ent D
iscus
sion
and
Anal
ysis
Boa
rd o
f Dire
ctor
s &Ex
ecut
ive M
anag
emen
tHi
ghlig
hts
Fina
ncia
lIn
form
atio
n
Commercial Credit and Finance PLC Annual Report 2019/20 195
48.FAIR VALUE OF FINANCIAL INSTRUMENTS
48.1 Determination of Fair Value and Fair Value Hierarchy
Financial Instruments recorded at Fair ValueThe following is a description of how fair values are determined for financial instruments that are recorded at fair value using valuation techniques. These incorporate the Company’s estimate of assumptions that a market participant would make when valuing the instruments.
Financial assets recognised through profit or loss - measured at fair valueFinancial assets recognised through profit or loss are valued using a valuation technique and consists of government debt securities, investments in unit trust and listed equity securities. The Company values the government securities using discounted cash flow valuation models which incorporate observable data. Observable inputs include assumptions regarding current rates of interest, daily unit traded prices, broker statements and market data published by Central Bank of Sri Lanka. Financial assets at fair value through other comprehensive incomeFinancial assets at fair value through other comprehensive income, primarily consist of equity securities which are valued using valuation techniques or pricing models. These assets are valued using models that use both observable and unobservable data. Quoted equities are valued using quoted market prices in the active market as at the reporting date.
The Company uses the following hierarchy for determining and disclosing the fair value of financial instruments byvaluation techniques.
Level 1 : quoted (unadjusted) prices in active markets for identical assets or liabilities.Level 2: other techniques for which all inputs which have a significant effect on the recorded fair value are observable, either directly or indirectlyLevel 3: techniques which use inputs that have a significant effect on the recorded fair value that are not based on observable market data

Notes to the Financial Statements [Cont.]As at 31st March 2020
Commercial Credit and Finance PLC Annual Report 2019/2020196
2,03
4,73
9,36
1
37,5
52,5
03
-
-
-
-
2,0
72,2
91,8
64
-
-
-
-
Leve
l 1 LKR
-
-
-
-
-
-
-
-
-
-
-
-
Leve
l 2 LKR
-
-
-
-
-
4,31
0,47
9 -
4,3
10,4
79
1,783
,278
,484
4
21,3
79,5
46
1,69
8,46
1,370
3
,903
,119
,400
Leve
l 3 LKR
2,03
4,73
9,36
1
37,5
52,5
03
-
-
-
4,3
10,4
79
-
2,0
76,6
02,3
43
1,78
3,27
8,48
4
421
,379
,546
1,6
98,4
61,3
70
3,9
03,1
19,4
00
Tota
l
LKR
2,03
4,73
9,36
1
39,2
02,0
52
154
,913
,584
-
60,9
31,8
42
-
-
2,2
89,7
86,8
38
-
-
-
-
Leve
l 1 LKR
-
-
-
-
-
-
-
-
-
-
-
-
Leve
l 2 LKR
-
-
-
-
-
6,29
1,86
1
-
6,2
91,8
61
1,78
3,27
8,48
4
421
,379
,546
1,6
98,4
61,3
70
3,9
03,1
19,4
00
Leve
l 3 LKR
2,03
4,73
9,36
1
39,2
02,0
52
154
,913
,584
-
60,9
31,8
42
6,29
1,86
1
-
2,2
96,0
78,7
00
1,7
83,2
78,4
84
421
,379
,546
1,6
98,4
61,3
70
3,9
03,1
19,4
00
Tota
l
LKR
Fina
ncia
l Ass
ets
Fina
ncia
l ass
ets -
Rec
ogni
sed
thro
ugh
profi
t or l
oss
Gove
rnm
ent o
f Sri
Lank
aTr
easu
ry B
illsQu
oted
equ
ities
Inve
stm
ents
in U
nit T
rust
s
Fina
ncia
l ass
ets -
fire
valu
ethr
ough
othe
r com
preh
ensiv
e in
com
eGo
vern
men
t of S
ri La
nka
Trea
sury
Bon
dsGo
vern
men
t of S
ri La
nka
Trea
sury
Bills
Unqu
oted
equ
ities
Unit
Trus
tsTo
tal F
inan
cial A
sset
s
Non
finan
cial a
sset
s mea
sure
dat
fair
valu
eFr
eeho
ld la
ndBu
ildin
g &
Bui
ldin
g in
tegr
als
Inve
stm
ent p
rope
rty
48. F
AIR
VALU
E OF
FIN
ANCI
AL IN
STRU
MEN
TS (C
ontd
...)
The
follo
win
g ta
ble
show
s an
anal
ysis
of fi
nanc
ial in
stru
men
ts re
cord
ed a
t fai
r val
ue b
y le
vel o
f the
fair
valu
e hi
erar
chy.
As a
t 31
Mar
ch 2
020
Com
pany
Grou
p

Risk
Man
agem
ent &
Corp
orat
e Go
vern
ance
Sust
aina
bilit
yRe
port
Man
agem
ent D
iscus
sion
and
Anal
ysis
Boa
rd o
f Dire
ctor
s &Ex
ecut
ive M
anag
emen
tHi
ghlig
hts
Fina
ncia
lIn
form
atio
n
Commercial Credit and Finance PLC Annual Report 2019/20 197
2,05
4,93
7,00
4
57,2
20,2
36
-
-
-
2,1
12,1
57,2
40
-
-
-
-
Leve
l 1 LKR
-
-
-
-
-
-
-
-
-
-
Leve
l 2 LKR
-
-
-
-
4,31
0,47
9
-
4,3
10,4
79
1,7
27,7
29,6
85
92,
535,
320
1,4
48,3
51,3
20
3,2
68,6
16,3
24
Leve
l 3 LKR
2,05
4,93
7,00
4
57,2
20,2
36
-
-
4,3
10,4
79
-
2,1
16,4
67,7
19
1,7
27,7
29,6
85
92,
535,
320
1,4
48,3
51,3
20
3,2
68,6
16,3
24
Tota
l
LKR
2,05
4,93
7,00
4
60,2
56,8
05
1,4
77,9
68
56,9
28,3
15
-
-
2,1
73,6
00,0
92
-
-
-
-
Leve
l 1 LKR
-
-
-
-
-
-
-
-
-
-
-
Leve
l 2 LKR
-
-
-
-
6,1
79,6
06
-
6,1
79,6
06
1,7
27,7
29,6
85
92,
535,
320
1,4
48,3
51,3
20
3,2
68,6
16,3
24
Leve
l 3 LKR
2,05
4,93
7,00
4
60,
256,
805
1,4
77,9
68
56,
928,
315
6,1
79,6
06
-
2,1
79,7
79,6
98
1,7
27,7
29,6
85
92,
535,
320
1,4
48,3
51,3
20
3,2
68,6
16,3
24
Tota
l
LKR
Fina
ncia
l Ass
ets
Fina
ncia
l ass
ets -
Rec
ogni
sed
thro
ugh
profi
t or l
oss
Gove
rnm
ent o
f Sri
Lank
aTr
easu
ry B
illsQu
oted
equ
ities
Inve
stm
ents
in U
nit T
rust
s
Fina
ncia
l ass
ets -
fire
valu
ethr
ough
othe
r com
preh
ensiv
e in
com
eGo
vern
men
t of S
ri La
nka
Trea
sury
Bills
Unqu
oted
equ
ities
Inve
stm
ents
in U
nit T
rust
sTo
tal F
inan
cial A
sset
s
Non
finan
cial a
sset
s mea
sure
dat
fair
valu
eFr
eeho
ld la
ndBu
ildin
g &
Bui
ldin
g in
tegr
als
Inve
stm
ent p
rope
rty
48. F
AIR
VALU
E OF
FIN
ANCI
AL IN
STRU
MEN
TS (C
ontd
...)
The
follo
win
g ta
ble
show
s an
anal
ysis
of fi
nanc
ial in
stru
men
ts re
cord
ed a
t fai
r val
ue b
y le
vel o
f the
fair
valu
e hi
erar
chy.
As a
t 31
Mar
ch 2
019
Com
pany
Grou
p

Notes to the Financial Statements [Cont.]As at 31st March 2020
Commercial Credit and Finance PLC Annual Report 2019/2020198
48.2 Movements in level 3 financial instruments measured at fair value
4,310,479
-
112,255
4,422,734
4,838,346
-
(527,867)
4,310,479
Group
4,310,479
-
4,310,479
4,310,479
-
4,310,479
Company
Equity SecuritiesAs at 1 April Sold during the financial yearAcquired duringt the yearAs at 31 March
2020
LKR
2019
LKR
2020
LKR
2019
LKR
48.3 Movements in level 3 Non financial assets measured at fair value
746,633,985
915,095,700
66,000,000
-
-
1,757,351,884
-
25,926,600
-
-
1,783,278,484
92,535,320
(14,700,000)
289,949,853
75,277,647
(2,961,763)
409,406,149
-
-
27,608,092
-
(15,634,695)
421,379,546
1,983,431,494
(19,568,545)
620,692,023
208,796,848
(1,345,000,000)
-
1,448,351,820
(18,902,183)
229,784,208
54,827,525
(15,600,000)
-
1,698,461,370
Free holdLand
LKR
Building& building
integralsLKR
InvestmentProperty
LKR
Company / Group
Balance as at 1 April 2018DisposalsAcquired during the yearFair Value Recognised During the yearDisposals/TransfersDepreciationBalance as at 31 March 2019DisposalsAcquired during the yearFair Value Recognised During the yearDisposals/TransfersDepreciationBalance as at 31 March 2020

Risk
Man
agem
ent &
Corp
orat
e Go
vern
ance
Sust
aina
bilit
yRe
port
Man
agem
ent D
iscus
sion
and
Anal
ysis
Boa
rd o
f Dire
ctor
s &Ex
ecut
ive M
anag
emen
tHi
ghlig
hts
Fina
ncia
lIn
form
atio
n
Commercial Credit and Finance PLC Annual Report 2019/20 199
48.4 Estimated Fair Value of financial assets and liabilities carried at other than fair value
Set out below is the comparison, by class, of the carrying amounts of fair values of the Company's financial instruments that are not carried at fair value in the financial statements. This table does not include the fair values of non- financial assets and non- financial liabilities.
1,748,596,904
3,662,522,772
3,603,184,738
-
23,704,115,396
37,150,447,901
187,244,522
-
630,157,554
70,686,269,785
9,241,472,974
51,710,377,365
3,011,533,608
2,162,248,713
66,125,632,660
1,748,596,904
3,662,522,772
3,603,184,738
-
36,126,081,319
28,461,642,471
187,244,522
-
630,157,554
74,419,430,278
8,646,435,290
51,446,889,741
2,999,705,378
2,162,248,713
65,255,279,122
2019
854,570,071
3,004,279,491
3,812,279,883
2,072,291,864
18,219,942,284
43,395,382,046
114,822,765
4,310,479
743,285,925
72,221,164,808
12,661,616,855
47,394,521,877
3,349,894,465
1,753,986,571
65,160,019,768
Level 1
Level 2Level 2Level 2Level 3
Level 2Level 2Level 2
854,570,071
3,004,279,491
3,812,279,883
2,072,291,864
20,171,750,023
43,660,007,655
114,822,765
4,310,479
743,285,925
74,437,598,156
12,728,933,957
47,310,530,555
3,056,622,160
1,753,986,571
64,850,073,243
CarryingAmount
LKR
Level
2020Company
Fair Value
LKR
CarryingAmount
LKR
Fair Value
LKR
Financial Assets Cash and Bank BalancesReverse Repurchase AgreementsPlacement with BanksFinancial assets recognised throughprofit or loss - measured at fair valueLoans and ReceivablesLease rentals receivable & Stock out on hireDebt & other instruments Financial assets at fair value throughother comprehensive income Other financial assets Total Financial Assets Financial Liabilities Due to Banks Due to Customers Debt Instruments Issued Other Financial LiabilitiesTotal Financial Liabilities
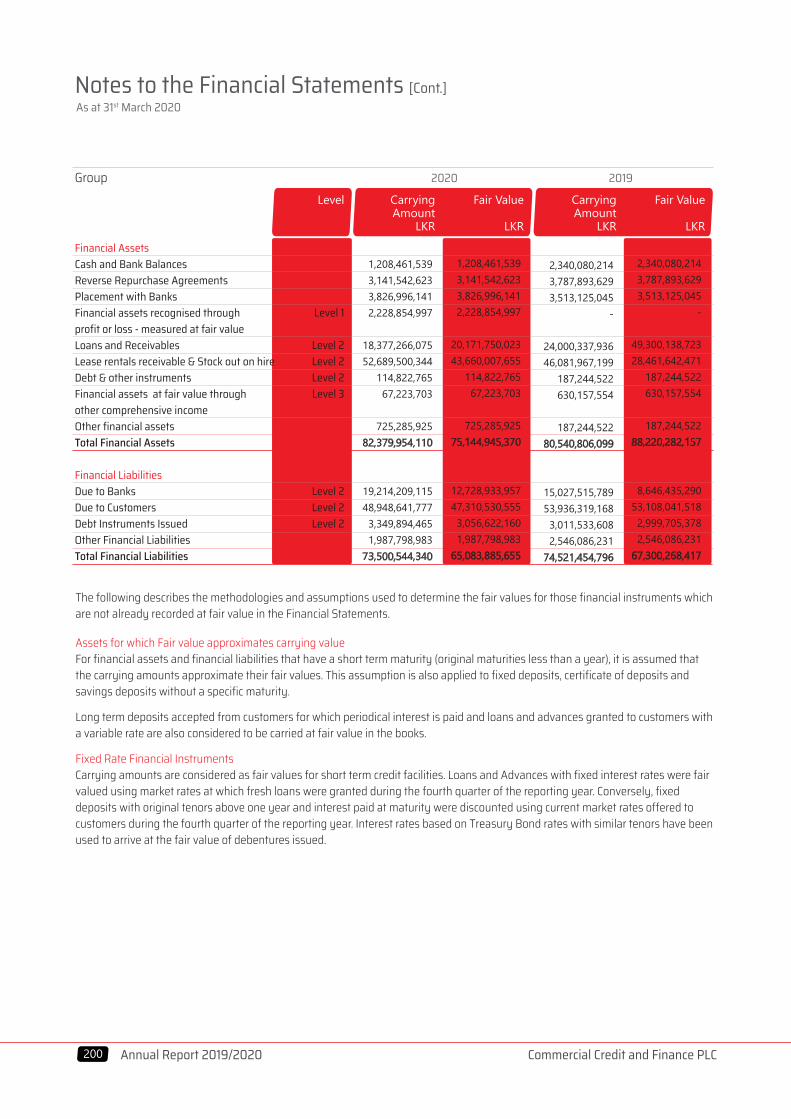
Notes to the Financial Statements [Cont.]As at 31st March 2020
Commercial Credit and Finance PLC Annual Report 2019/2020200
2,340,080,214
3,787,893,629
3,513,125,045
-
24,000,337,936
46,081,967,199
187,244,522
630,157,554
187,244,522
80,540,806,099
15,027,515,789
53,936,319,168
3,011,533,608
2,546,086,231
74,521,454,796
2,340,080,214
3,787,893,629
3,513,125,045
-
49,300,138,723
28,461,642,471
187,244,522
630,157,554
187,244,522
88,220,282,157
8,646,435,290
53,108,041,518
2,999,705,378
2,546,086,231
67,300,268,417
2019
1,208,461,539
3,141,542,623
3,826,996,141
2,228,854,997
18,377,266,075
52,689,500,344
114,822,765
67,223,703
725,285,925
82,379,954,110
19,214,209,115
48,948,641,777
3,349,894,465
1,987,798,983
73,500,544,340
Level 1
Level 2Level 2Level 2Level 3
Level 2Level 2Level 2
1,208,461,539
3,141,542,623
3,826,996,141
2,228,854,997
20,171,750,023
43,660,007,655
114,822,765
67,223,703
725,285,925
75,144,945,370
12,728,933,957
47,310,530,555
3,056,622,160
1,987,798,983
65,083,885,655
CarryingAmount
LKR
Level
2020GroupFair Value
LKR
CarryingAmount
LKR
Fair Value
LKR
Financial Assets Cash and Bank BalancesReverse Repurchase AgreementsPlacement with BanksFinancial assets recognised throughprofit or loss - measured at fair valueLoans and ReceivablesLease rentals receivable & Stock out on hireDebt & other instruments Financial assets at fair value throughother comprehensive income Other financial assets Total Financial Assets Financial Liabilities Due to Banks Due to Customers Debt Instruments Issued Other Financial LiabilitiesTotal Financial Liabilities
The following describes the methodologies and assumptions used to determine the fair values for those financial instruments whichare not already recorded at fair value in the Financial Statements.
Assets for which Fair value approximates carrying value For financial assets and financial liabilities that have a short term maturity (original maturities less than a year), it is assumed that the carrying amounts approximate their fair values. This assumption is also applied to fixed deposits, certificate of deposits and savings deposits without a specific maturity.
Long term deposits accepted from customers for which periodical interest is paid and loans and advances granted to customers with a variable rate are also considered to be carried at fair value in the books.
Fixed Rate Financial Instruments Carrying amounts are considered as fair values for short term credit facilities. Loans and Advances with fixed interest rates were fair valued using market rates at which fresh loans were granted during the fourth quarter of the reporting year. Conversely, fixed deposits with original tenors above one year and interest paid at maturity were discounted using current market rates offered to customers during the fourth quarter of the reporting year. Interest rates based on Treasury Bond rates with similar tenors have been used to arrive at the fair value of debentures issued.

Risk
Man
agem
ent &
Corp
orat
e Go
vern
ance
Sust
aina
bilit
yRe
port
Man
agem
ent D
iscus
sion
and
Anal
ysis
Boa
rd o
f Dire
ctor
s &Ex
ecut
ive M
anag
emen
tHi
ghlig
hts
Fina
ncia
lIn
form
atio
n
Commercial Credit and Finance PLC Annual Report 2019/20 201
49.1 INTRODUCTION Risk is inherent in a financial business and such risks are managed through a process of ongoing identification, measurement and monitoring. This process of risk management is critical to the Company’s continuing profitability and each individual within the Company is accountable for the risk exposures relating to his or her esponsibilities. The Company is primarily exposed to credit risk, interest rate risk, operational risk and liquidity risk the management of which is explained below. 49.1.1 Risk Management structure
The Board of Directors is responsible for establishing the overall risk management framework within the Company. The Integrated Risk Management Committee (IRMC), which is a sub-committee of the board has been established with delegated risk management responsibilities. The IRMC plays a vital role in establishing best practices in relation to risk policies and practices within the Company. The activities of the Company’s risk management system take place at three broad levels of hierarchy, as follows: -Strategic Level Overall financial risks are monitored at the IRMC level, and the decisions made by the IRMC are communicated to the Board of Directors. The Board ratifies the risk policies and directions issued to the management by the IRMC. - Management Level: Development and implementation of underlying procedures, processes and controls are carried out at the Management Level. Assuring the compliance with laid down policies, procedures and controls and reviewing the outcomes of operations, and measuring and analysing risk related information is also performed at this level. - Operational Level: The individuals accountable for the risk exposures relating to his or her responsibilities are required to comply with approved policies, procedures and controls. 49.1.2 Risk measurement and reporting system A risk management process has been developed and is continuously reviewed by the IRMC together with the operationalmanagement. The Company has established four risk sub committees, namely Credit, Legal and Recoveries sub-committee, Fixed Deposits sub-committee, Human Resources sub-committee and Information Technology sub-committee to review operational risks related to each area. In addition the Assets and Liabilities Committee (ALCO) reviews market and liquidity risks. The effectiveness of these committees is assessed by the IRMC. The risk sub committees comprise of selected members of the operational management, middle management and operational staff of each relevant department. These sub committees meet on a regular basis and are responsible for identifying and analysing risks. The identified risks are taken up for discussion at risk subcommittee meetings and the minutes of the subcommittee meetings are circulated among the members of the IRMC. The decisions and directives of the IRMC are communicated to the operationalmanagement through the sub committees for operationalization of such decisions and directives.
49 RISK MANAGEMENT

Notes to the Financial Statements [Cont.]As at 31st March 2020
Commercial Credit and Finance PLC Annual Report 2019/2020202
49.2 CREDIT RISK Credit risk is the potential loss incurred in the event that a borrower fails to fulfil agreed obligations. The Company’s credit risk arises mainly from various accommodations granted and could be identified as the most significant risk faced by the Company. Impairment Assessment The methodology of the impairment assessment is explained in Note 5.5.5 under Accounting policies. The references below should be read in conjunction with those Accounting policies. The Impact on COVID 19- Impairment of Financial Assets - Expected Credit Loss calculation The Company considered the Probability of Default (PD), Loss Given Default (LGD) and Economic Factor Adjustment (EFA) computed as at February 29, 2020, in order to estimate the Expected Credit Loss (ECL) as at March 31, 2020, due to uncertainty and lack of sufficient information to make any adjustments to capture the potential impact of COVID 19 based on the “COVID - 19 Pandemic: Guidance Notes on the Implications on Financial Reporting” issued by The Institute of Chartered Accountants of Sri Lanka has provided reporting guidelines Mitigation: Credit is required to be granted according to the approved policies and procedures of the Company. Special attention is given to credit risk management in terms of analysing customer credit worthiness through rigorous customer investigation before and after credit facilities are provided. Repayment of accommodations granted is closely monitored by those responsible for granting various facilities as well as those directly responsible for recovery activities. Indicators have been developed to measure risks associated with credit which are reviewed on a continuous basis for the entire organization as well as for each product and operational location. Microfinance Loans & Abhivurdhi SME Loans Microfinance loans and Abhiwurdhi Loans form a substantial part of the loans and advances granted by the Company. As is the practice in general in the industry both in Sri Lanka and Internationally, Microfinance loans are granted without obtaining any security from the borrower. Abhiwurdhi Loans are granted mainly to Microfinance customers who have obtained Microfinance loans in the past and settled them satisfactorily. As these accommodations are not covered by collateral they could lead to substantial credit risks to the Company. Credit risks associated with Microfinance and Abhiwurdhi portfolios are controlled by the following measures: - Limiting individual's first Microfinance loan to less than Rs. 40,000 and these are granted as group-loans where loans granted to each member of the group is guaranteed by the other members of the group. Loans are granted after careful evaluation of the purpose for which they are taken and the repayment capacity, - Microfinance Loans in higher amounts and Abhivurdhi SME Loans are granted based on past credit performance of applicants and with careful evaluation of the purpose for which they are taken and the repayment capacity, - Weekly and fortnightly collection system which closely monitors each loan granted, - Careful monitoring of various ratios such as Portfolio-at-Risk (PAR)

Risk
Man
agem
ent &
Corp
orat
e Go
vern
ance
Sust
aina
bilit
yRe
port
Man
agem
ent D
iscus
sion
and
Anal
ysis
Boa
rd o
f Dire
ctor
s &Ex
ecut
ive M
anag
emen
tHi
ghlig
hts
Fina
ncia
lIn
form
atio
n
Commercial Credit and Finance PLC Annual Report 2019/20 203
Pawning
The Company also has a substantial portfolio of loans and advances granted under pawn brokering and related activities. These facilities are granted mainly based on gold articles obtained as security. In the event the price of gold in the local market reduce substantially, this would lead to a reduction in the value of the security obtained thereby exposing the Company to the risk that some customers may not redeem the articles retained by the Company. Where the articles are not so redeemed, the difference between the realizable value of the article held and the total of the capital , interest and other charges due would result in a loss to the Company . In order to manage this risk the Company has adopted the following practices: - Frequent review of gold prices in the local and international markets and adjusting the amount of the loans granted for each sovereign of gold contained in the article, - Close follow up of the payment of capital and interest due on loans and advances granted, - Structuring of the loans and advances granted in a manner that recovery action is possible

Notes to the Financial Statements [Cont.]As at 31st March 2020
Commercial Credit and Finance PLC Annual Report 2019/2020204
49.2.1 Assesment of Expected Credit Losses
(a)Analysis of the total impairment for expected credit losses is as follows,
Please refer Note 10.1 and 11.1 for the movement of expected credit loss of the Loans & Receivables and Lease rentals receivables & Stock out on hire respectively
Company
322,974,421
618,754,363
44,785,377
986,514,161
10.1
11.1
14.1
295,519,510
526,269,095
-
821,788,605
1,699,112,717
1,408,367,483
-
3,107,480,199
2,317,606,656
2,553,390,942
44,785,377
4,915,782,965
Stage 1NoteAs at 31 March 2020
As at 31 March 2019
Stage 2 Stage 3 Total
Loans and receivablesLease Rentals Receivable & Stocks out on hireOther Financial assets
Group
963,265,937
427,941,583
44,785,377
1,435,992,897
10.1
11.1
14.1
519,855,371
448,797,797
-
968,653,168
1,845,274,772
764,650,377
-
2,609,925,149
3,328,396,080
1,641,389,758
44,785,377
5,014,571,215
Stage 1NoteAs at 31 March 2020 Stage 2 Stage 3 Total
Loans and receivablesLease Rentals Receivable & Stocks out on hireOther Financial assets
733,748,121
427,941,583
23,678,810
1,185,368,514
10.1
11.1
14.1
519,855,371
448,797,797
-
968,653,168
2,049,479,170
764,650,377
-
2,814,129,547
3,303,082,662
1,641,389,758
23,678,810
4,968,151,229
Stage 1Note Stage 2 Stage 3 Total
Loans and receivablesLease Rentals Receivable & Stocks out on hireOther Financial assets
As at 31 March 2019
748,151,580
506,495,757
23,678,810
1,278,326,148
10.1
11.1
14.1
521,121,688
571,770,481
-
1,092,892,169
2,085,213,897
915,878,693
-
3,001,092,590
3,354,487,165
1,994,144,932
23,678,810
5,372,310,907
Stage 1Note Stage 2 Stage 3 Total
Loans and receivablesLease Rentals Receivable & Stocks out on hireOther Financial assets

Risk
Man
agem
ent &
Corp
orat
e Go
vern
ance
Sust
aina
bilit
yRe
port
Man
agem
ent D
iscus
sion
and
Anal
ysis
Boa
rd o
f Dire
ctor
s &Ex
ecut
ive M
anag
emen
tHi
ghlig
hts
Fina
ncia
lIn
form
atio
n
Commercial Credit and Finance PLC Annual Report 2019/20 205
(c) Sensitivity analysis of inpairment allowance for Loans and advances and Lease rentals receivables
Increase by 5%Increase by 5%
Delayed by 1 year
77,421,170
205,609,737
5,808,643
84,246,434
230,549,414
125,840,921
ChangeFactor
Sensitivity Effect on impairment allowanc increase
2019
Sensitivity Effect on impairment allowanc increase
2020Probability of DefaultLoss Given DefaultRealisation of Cash Flows - Individually Significant Loans
Change Criteria
2026202520242023202220212020ECLScenario
AssignedProbabilities
Key Drivers
GDP Growth (%)
Inflation (YoY Average)
Interest Rate (PLR)
Exchange Rate-YE (US$:LKR)
Unemployment (% of Labor Force)
Best CaseBase CaseWorst CaseBest CaseBase CaseWorst CaseBest CaseBase CaseWorst CaseBest CaseBase CaseWorst CaseBest CaseBase CaseWorst Case
2.86%
2.70%
2.57%
4.00%
4.40%
4.90%
8.86%
10.00%
11.50%
184.14
250.00
250.00
5.00%
5.10%
5.15%
2.86%
2.70%
2.57%
4.00%
4.40%
4.90%
8.86%
10.00%
11.50%
183.72
241.42
250.00
5.00%
5.10%
5.15%
2.84%
2.70%
2.60%
4.10%
4.40%
4.85%
9.13%
10.00%
11.35%
183.30
228.06
250.00
5.03%
5.10%
5.15%
2.81%
2.70%
2.61%
4.14%
4.40%
4.74%
9.25%
10.00%
11.01%
182.88
215.45
250.00
5.04%
5.10%
5.15%
2.77%
2.70%
2.63%
4.18%
4.40%
4.63%
9.37%
10.00%
10.68%
182.46
203.53
250.00
5.05%
5.10%
5.15%
2.74%
2.70%
2.64%
4.23%
4.40%
4.52%
9.49%
10.00%
10.36%
182.05
192.27
217.28
5.06%
5.10%
5.13%
27.50%
27.50%
45.00%
27.50%
27.50%
45.00%
27.50%
27.50%
45.00%
27.50%
27.50%
45.00%
27.50%
27.50%
45.00%
2.86%
2.70%
2.57%
4.00%
4.40%
4.90%
8.86%
10.00%
11.50%
184.57
250.00
250.00
5.00%
5.10%
5.15%
(b) Analysis of inputs to the ECL model under multiple economic scenarios

Notes to the Financial Statements [Cont.]As at 31st March 2020
Commercial Credit and Finance PLC Annual Report 2019/2020206
Company
1,748,596,903
3,662,522,772
3,603,184,738
2,112,157,240
12,519,538,478
16,506,447,786
187,244,522
-
415,503,314
40,755,195,751
-
-
-
-
13,792,482,228
21,876,812,810
-
214,654,240
35,883,949,278
-
-
-
-
720,490,769
382,377,460
4,310,479
-
1,107,178,708
1,748,596,903
3,662,522,772
3,603,184,738
2,112,157,240
-
27,032,511,475
38,765,638,057
187,244,522
4,310,479
630,157,554
77,746,323,739
Neither Past DueNor Impaired
IndividuallyLKR
As at 31 March 2019 Past Due But Not Impaired
IndividuallyLKR
IndividuallyImpaired
LKR
Total
LKR
AssetsCash and Bank BalancesReverse Repurchase AgreementsPlacements with BanksFinancial assets recognised through profit or loss - measured at fair valueFinancial assets at amortised cost Loans and Receivables (Gross) Lease rentals receivable & Stock out on hire (Gross) Debt & other instrumentsFinancial assets at fair value through other comprehensive incomeOther financial assetsTotal Financial Assets
49.2.2 CREDIT QUALITY BY CLASS OF FINANCIAL ASSETS
Company
854,570,071
3,004,279,491
3,812,279,883
2,072,291,865
4,818,702,004
8,016,300,321
114,822,765
-
575,989,305
23,269,235,703
-
-
-
-
13,055,894,998
35,347,951,532
-
-
48,403,846,530
-
-
-
-
345,345,281
31,130,194
4,310,479
167,296,620
548,082,574
854,570,071
3,004,279,491
3,812,279,883
2,072,291,864
18,219,942,284
43,395,382,046
114,822,765
4,310,479
743,285,925
72,221,164,809
Neither Past DueNor Impaired
IndividuallyLKR
As at 31 March 2020 Past Due But Not Impaired
IndividuallyLKR
IndividuallyImpaired
LKR
Total
LKR
Assets Cash and Bank Balances Reverse Repurchase Agreements Placements with Banks Financial assets recognised through profit or loss - measured at fair value Financial assets at amortised cost Loans and Receivables (Gross) Lease rentals receivable & Stock out on hire (Gross) Debt & other instruments Financial assets at fair value through other comprehensive income Other financial assets Total Financial Assets

Risk
Man
agem
ent &
Corp
orat
e Go
vern
ance
Sust
aina
bilit
yRe
port
Man
agem
ent D
iscus
sion
and
Anal
ysis
Boa
rd o
f Dire
ctor
s &Ex
ecut
ive M
anag
emen
tHi
ghlig
hts
Fina
ncia
lIn
form
atio
n
Commercial Credit and Finance PLC Annual Report 2019/20 207
Group
1,208,461,539
3,141,542,623
3,826,996,141
2,228,854,997
-
5,290,240,883
16,996,203,530
114,822,765
-
557,989,305
33,365,111,782
-
-
-
-
-
13,055,894,998
35,347,951,532
-
-
-
48,403,846,530
-
-
-
-
-
31,130,194
345,345,281
-
67,223,703
167,296,620
610,995,598
1,208,461,539
3,141,542,623
3,826,996,141
2,228,854,997
18,377,266,075
52,689,500,344
114,822,765
67,223,703
725,285,925
82,379,954,111
Neither Past DueNor Impaired
IndividuallyLKR
As at 31 March 2020 Past Due But Not Impaired
IndividuallyLKR
IndividuallyImpaired
LKR
Total
LKR
Assets Cash and Bank BalancesReverse Repurchase AgreementsPlacements with BanksFinancial assets recognised through profit or loss - measured at fair valueFinancial assets at amortised cost Loans and Receivables (gross) Lease rentals receivable & Stock out on hire (gross) Debt & other instrumentsFinancial assets at fair value through other comprehensive incomeOther financial assetsTotal Financial Assets
Group
2,340,080,213
3,787,893,629
3,513,125,045
2,116,671,776
-
12,773,799,611
19,643,111,554
187,244,522
58,797,442
415,503,314
44,836,227,106
-
-
-
-
-
13,885,848,139
27,866,346,015
-
-
214,654,240
41,966,848,394
-
-
-
-
-
720,490,769
540,454,959
-
4,310,479
-
1,265,256,207
2,340,080,213
3,787,893,629
3,513,125,045
2,116,671,776
-
27,380,138,519
48,049,912,529
187,244,522
63,107,921
630,157,554
88,068,331,707
Neither Past DueNor Impaired
IndividuallyLKR
As at 31 March 2019 Past Due But Not Impaired
IndividuallyLKR
IndividuallyImpaired
LKR
Total
LKR
Assets Cash and Bank BalancesReverse Repurchase AgreementsPlacements with BanksFinancial assets recognised through profit or loss - measured at fair valueFinancial assets at amortised cost Loans and Receivables (gross) Lease rentals receivable & Stock out on hire (gross) tDebt & other instrumentsFinancial assets at fair value through other comprehensive incomeOther financial assetsTotal Financial Assets
49.2.2.1 Aging analysis of past due (i.e facilities in arrears of one day and abovebut not impaired loans by class of financial assets.

Notes to the Financial Statements [Cont.]As at 31st March 2020
Commercial Credit and Finance PLC Annual Report 2019/2020208
49.2.2.1 Aging analysis of past due (i.e facilities in arrears of one day and above but not impaired loans by class of financial assets.
2,557,129,998
6,764,238,267
9,321,368,265
3,591,541,085
15,033,803,692
18,625,344,777
1,715,555,416
5,305,132,340
7,020,687,757
5,191,668,499
8,244,777,233
13,436,445,731
13,055,894,998
35,347,951,532
48,403,846,530
As at 31 March 2020
Past Due But Not Individually Impaired
Company
61 to 90 days
LKR
"More than 91 days"
LKR
Total
LKR
31 to 60 days
LKR
"Less than 30 days"
LKR
Loans and Advances Lease rentals receivable & Stock out on hire
2,658,027,926
5,533,359,124
8,191,387,051
4,197,462,783
7,353,626,183
11,551,088,967
2,245,444,518
4,382,162,654
6,627,607,172
4,691,547,000
4,607,664,849
9,299,211,849
13,792,482,228
21,876,812,810
35,669,295,038
As at 31 March 2019
Past Due But Not Individually Impaired
Company
61 to 90 days
LKR
"More than 91 days"
LKR
Total
LKR
31 to 60 days
LKR
"Less than 30 days"
LKR
Loans and Advances Lease rentals receivable & Stock out on hire
2,557,129,998
6,764,238,267
9,321,368,265
3,591,541,085
15,033,803,692
18,625,344,777
1,715,555,416
5,305,132,340
7,020,687,757
5,191,668,499
8,244,777,233
13,436,445,730
13,055,894,998
35,347,951,532
48,403,846,530
As at 31 March 2020
Past Due But Not Individually Impaired
Group
61 to 90 days
LKR
"More than 91 days"
LKR
Total
LKR
31 to 60 days
LKR
"Less than 30 days"
LKR
Loans and Advances Lease rentals receivable & Stock out on hire
2,674,700,628
6,449,057,869
9,123,758,498
4,224,207,438
8,649,941,677
12,874,149,116
2,261,144,167
4,911,999,764
7,173,143,931
4,725,795,905
7,855,346,705
12,581,142,609
13,885,848,139
27,866,346,015
41,752,194,154
As at 31 March 2019
Past Due But Not Individually Impaired
Group
61 to 90 days
LKR
"More than 91 days"
LKR
Total
LKR
31 to 60 days
LKR
"Less than 30 days"
LKR
Loans and Advances Lease rentals receivable & Stock out on hire

Risk
Man
agem
ent &
Corp
orat
e Go
vern
ance
Sust
aina
bilit
yRe
port
Man
agem
ent D
iscus
sion
and
Anal
ysis
Boa
rd o
f Dire
ctor
s &Ex
ecut
ive M
anag
emen
tHi
ghlig
hts
Fina
ncia
lIn
form
atio
n
Commercial Credit and Finance PLC Annual Report 2019/20 209
49.2.3 Analysis of maximum exposure to credit risk and collateral
The following table shows the maximum exposure to credit risk by class of financial asset.
854,570,071
3,004,279,491
3,812,279,883
2,072,291,865
20,537,548,938
45,948,772,987
114,822,765
4,310,479
743,285,925
77,092,162,403
857,417,013
-
3,812,279,883
2,072,291,865
12,694,022,921
759,508,868
114,822,765
4,310,479
743,285,925
21,057,939,718
1,748,596,903
3,662,522,772
3,603,184,738
2,112,157,240
27,032,511,475
38,765,638,057
187,244,522
4,310,479
630,157,554
77,746,323,741
1,748,596,903
-
3,603,184,738
2,112,157,240
13,136,034,977
707,046,840
187,244,522
4,310,479
630,157,554
22,128,733,252
As at 31 March 2020
As at 31 March 2020 As at 31 March 2019
Company
Net Exposure
LKR
MaximumExposure
to Credit RiskLKR
Net Exposure
LKR
Maximum Exposure to
Credit RiskLKR
Assets Cash and Bank Balances Reverse Repurchase Agreements Placements with Banks Financial assets recognised through profitor loss - measured at fair value Financial assets at amortised cost Loans and Receivables Lease rentals receivable & Stock out on hire Debt & other instruments Financial assets recognised through profit or loss - measured at fair value Other financial assets Total Financial Assets
1,208,461,539
3,141,542,623
3,826,996,141
2,228,854,997
20,485,443,700
45,686,059,451
114,822,765
67,223,703
725,285,925
77,484,690,843
1,208,461,539
-
3,826,996,141
2,228,854,997
13,445,201,329
759,508,868
114,822,765
67,223,703
725,285,925
22,315,949,529
2,340,080,214
3,789,768,571
3,513,125,045
2,116,672,126
27,380,138,520
48,049,912,529
187,244,522
60,607,465
630,157,554
88,067,706,545
2,340,080,214
-
3,513,125,045
2,116,672,126
13,445,201,329
707,046,840
187,244,522
60,607,465
630,157,554
23,000,135,095
As at 31 March 2020
As at 31 March 2020 As at 31 March 2019
Group
Net Exposure
LKR
MaximumExposure
to Credit RiskLKR
Net Exposure
LKR
Maximum Exposure to
Credit RiskLKR
Assets Cash and Bank Balances Reverse Repurchase Agreements Placements with Banks Financial assets recognised through profitor loss - measured at fair value Financial assets at amortised cost Loans and Receivables Lease rentals receivable & Stock out on hire Debt & other instruments Financial assets recognised through profit or loss - measured at fair value Other financial assets Total Financial Assets
49.2.2.1 Aging analysis of past due (i.e facilities in arrears of one day and above but not impaired loans by class of financial assets.

Notes to the Financial Statements [Cont.]As at 31st March 2020
Commercial Credit and Finance PLC Annual Report 2019/2020210
49.3 Liquidity Risk & Funding Management
49.3.1 The Finance Companies (Liquid Assets) Direction No. 01 of 2009 requires Company to maintainminimum liquid assets as follows;
a) 10% of the outstanding value of time deposits received by the company and accrued interest payable at close of business on such day; and b) 15% of the outstanding value of savings deposits accepted by the company and accrued interest payable at close of business on such day: and c) 10% of total outstanding borrowings and any other payable that may be determined by the CBSL excluding the borrowings that are included in the capital funds of the company and borrowings which are secured by the mortgage of any assets of the company.
Net Exposure
LKR
Liquidity risk is the risk of only being able to meet liquidity obligations at increased cost or, ultimately, being unable to meet obligations as they fall due. In the case of the Company this relates mainly to the ability to meet refund of deposits obtained from the public as they fall due and settlement of instalments on bank and other borrowings.
Mitigation: Special attention is focused on the liquidity of the Company as it provides critical defense against this and several other risks such as reputational, compliance, and financial risks. A liquidity policy has been developed and integrated in to risk policy to provide necessary guidelines. The Company’s projected liquidity requirements are assessed on a continuous basis to ensure that they can be met as and when such requirements arise. The Company also strives to ensure that the liquidity ratios required to be maintained by the applicable Central Bank regulations are complied with. The Group’s primary objective in liquidity risk management is to ensure adequate funding for its businesses throughout market cycles, including periods of financial stress. To achieve this objective the Group regularly monitors liquidity position and maintain an adequate buffer of liquid assets. Group also maintains access to diverse funding sources to meet unforeseen liquidity requirements. All statutory and prudent liquidity ratios are monitored against tolerance limits and stress testing is carried out regularly to assess the effectiveness of liquidity management. With the onset of COVID 19 pandemic in late March of this year, the Group introduced more rigour to the processes already in place to manage its liquid assets. While closely monitoring any developments related to the pandemic, it has continued to keep its risk management measures under review to readily respond to changing circumstances. The Group is comfortable with its existing buffer of liquid assets. The actions taken will help to maintain existing liquidity position while mitigating any disruptive effect on liquidity that may arise due to the continuously evolving nature of the pandemic.

Risk
Man
agem
ent &
Corp
orat
e Go
vern
ance
Sust
aina
bilit
yRe
port
Man
agem
ent D
iscus
sion
and
Anal
ysis
Boa
rd o
f Dire
ctor
s &Ex
ecut
ive M
anag
emen
tHi
ghlig
hts
Fina
ncia
lIn
form
atio
n
Commercial Credit and Finance PLC Annual Report 2019/20 211
259,596,661
3,576,067,132
3,835,663,793
5,860,520,155
4,969,112,426
12,418,559,502
1,126,250,000
1,704,058,114
20,217,980,042
(7,554,599,117)
5,575,084,623
22,718,435,137
2,314,250,010
30,607,769,770
(340,696,609)
3,225,392,496
13991058952
17,216,451,448
19,984,602,489
-
157,681,711
14,029,186,207
52,704,120,723
3,440,500,010
1,704,058,114
71,877,865,054
18,107,508,629
Financial Liabilities Due to BanksDue to CustomersDebt Instruments Issued and Other borrowed fundsOther Financial LiabilitiesTotal Financial LiabilitiesTotal Net Financial Assets/(Liabilities)
"Less than 03 Months"
LKR
"OnDemand"
LKR
03-12 MonthsLKR
Over 05Years
LKR
01-05 YearsLKR
TotalLKR
854,570,071
29,949,186
-
3,447,086,858
5,364,577,833
-
9,696,183,948
-
1,864,746,339
1,445,300,885
916,442,657
4,020,939,516
3,888,291,186
103,676,515
-
423,983,829
12,663,380,925
-
1,198,228,259
2,496,523,248
1,177,977,180
4,382,927,008
20,883,175,266
12,101,404
-
116,140,797
30,267,073,162
-
-
4,825,151,442
32,172,741,195
-
203,161,300
37,201,053,937
-
-
137,116,354
16,254,878
4,310,479
157,681,711
854,570,071
3,062,974,598
3,971,773,319
2,094,419,837
16,813,221,178
62,325,040,359
115,777,918
4,310,479
743,285,925
89,985,373,683
"Less than 03 Months"
LKR
"OnDemand"
LKR
03-12 MonthsLKR
Over 05Years
LKR
01-05 YearsLKR
TotalLKR
Company
Financial AssetsCash and Bank BalancesReverse repurchase agreementsPlacement with BanksFinancial assets recognised through profit or loss - measured at fair valueFinancial assets at amortised costLoans and AdvancesLease rentals receivable & Stock out on hireDebt & other instrumentsFinancial assets at fair value through other comprehensive incomeOther financial assetsTotal Financial Assets
The table below summarises the maturity profile of the undiscounted cash flows of the Company’s financial assets and liabilities as at 31 March 2020.
49.3.2 Analysis Of Financial Assets And Liabilities By Remaining Contractual Maturities

Notes to the Financial Statements [Cont.]As at 31st March 2020
Commercial Credit and Finance PLC Annual Report 2019/2020212
1,748,596,903
26,013,169
-
4,482,420,755
3,364,071,042
-
9,621,101,869
-
949,988,430
1,546,800,604
1,053,986,125
8,603,700,279
6,205,345,096
178,397,589
-
585,136,006
19,123,354,129
-
2,760,034,595
2,173,124,127
1,069,778,800
11,645,146,212
16,587,892,966
-
45,021,547
34,280,998,246
-
-
-
-
6,301,025,012
26,546,270,600
15,250,000
-
32,862,545,612
-
-
-
-
115,881,229
2,768,095
4,310,479
122,959,803
1,748,596,903
3,710,023,025
3,745,937,900
2,123,764,925
-
31,148,173,486
52,706,347,800
193,647,589
4,310,479
630,157,554
96,010,959,660
Financial AssetsCash and Bank BalancesReverse repurchase agreementsPlacement with BanksFinancial assets recognised through profit or loss - measured at fair valueFinancial assets at amortised cost Loans and Advances Lease rentals receivable & Stock out on hire Debt & other instrumentsFinancial assets at fair value through other comprehensive incomeOther financial assetsTotal Financial Assets
"Less than 03 Months"
LKR
"OnDemand"
LKR
03-12 MonthsLKR
Over 05Years
LKR
01-05 YearsLKR
TotalLKR
807,941,181
1,128,154,468
96,612,665
2,032,708,315
7,588,393,555
2,723,212,147
7,352,811,147
78,731,269
2,676,161,155
12,830,915,718
6,292,438,412
4,710,492,634
6,909,413,043
236,193,808
11,856,099,485
22,424,898,761
2,317,851,558
49,931,264,951
3,175,087,592
55,424,204,101
(22,561,658,489)
- 122,959,803
10,559,497,519
65,321,643,609
3,586,625,335
2,676,161,155
82,143,927,619
13,867,032,041
Financial Liabilities Due to BanksDue to CustomersDebt Instruments Issued and Other borrowed fundsOther Financial LiabilitiesTotal Financial LiabilitiesTotal Net Financial Assets/(Liabilities)
"Less than 03 Months"
LKR
"OnDemand"
LKR
03-12 MonthsLKR
Over 05Years
LKR
01-05 YearsLKR
TotalLKR
The table below summarises the maturity profile of the undiscounted cash flows of the Company’s financial assets and liabilities as at 31 March 2019.

Risk
Man
agem
ent &
Corp
orat
e Go
vern
ance
Sust
aina
bilit
yRe
port
Man
agem
ent D
iscus
sion
and
Anal
ysis
Boa
rd o
f Dire
ctor
s &Ex
ecut
ive M
anag
emen
tHi
ghlig
hts
Fina
ncia
lIn
form
atio
n
"Less than 03 Months"
LKR
"OnDemand"
LKR
03-12 MonthsLKR
Over 05Years
LKR
01-05 YearsLKR
TotalLKR
Commercial Credit and Finance PLC Annual Report 2019/20 213
857,417,013
-
29,949,186
-
-
3,447,086,858
5,364,577,833
1,103,487
-
-
9,700,134,376
-
1,864,746,339
1,441,664,109
918,054,791
-
4,020,939,516
3,888,291,186
115,540,006
-
585,136,006
12,834,371,953
-
1,198,228,259
2,494,524,886
1,180,732,411
-
4,382,927,008
20,883,175,266
520,685
-
45,021,547
30,185,130,062
-
-
-
-
-
4,825,151,442
32,172,741,195
-
-
-
36,997,892,637
-
-
-
37,522,504
-
137,116,354
16,254,878
-
4,310,479
-
195,204,215
857,417,013
3,062,974,598
3,966,138,181
2,136,309,706
16,813,221,178
62,325,040,359
117,164,178
4,310,479
630,157,554
89,912,733,244
Financial AssetsCash and Bank BalancesReverse repurchase agreementsPlacement with BanksFinancial assets recognised through profit or loss - measured at fair valueFinancial assets at amortised costLoans and AdvancesLease rentals receivable & Stock out on hireDebt & other instrumentsFinancial assets at fair value through other comprehensive incomeOther financial assetsTotal Financial Assets
259,596,661
-
-
-
259,596,661
9,440,537,714
4,969,112,426
5,836,850,762
1,126,250,000
1,704,058,114
13,636,271,302
(801,899,351)
5,575,084,623
15,237,259,364
2,314,250,010
-
23,126,592,997
7,058,537,064
3,225,392,496
35,761,416,395
-
-
38,986,808,892
(1,988,916,255)
- - - -
-
195,204,215
14,029,186,207
56,835,526,521
3,440,500,010
1,704,058,114
76,009,270,853
13,903,462,390
Financial LiabilityDue to BanksDue to CustomersDebt Instruments Issued and Other borrowed fundsOther Financial LiabilitiesTotal Financial LiabilitiesTotal Net Financial Assets/(Liabilities)
"Less than 03 Months"
LKR
"OnDemand"
LKR
03-12 MonthsLKR
Over 05Years
LKR
01-05 YearsLKR
TotalLKR
The table below summarises the maturity profile of the undiscounted cash flows of the Company’s financial assets and liabilities as at 31 March 2020.
Group

Notes to the Financial Statements [Cont.]As at 31st March 2020
Commercial Credit and Finance PLC Annual Report 2019/2020214
2,340,080,214
-
26,013,169
-
-
4,482,420,755
3,364,071,042
-
-
-
10,212,585,180
-
949,988,430
1,546,800,604
1,053,986,125
-
8,603,700,279
6,205,345,096
178,397,589
-
585,136,006
19,123,354,129
-
2,760,034,595
2,173,124,127
1,069,778,800
-
11,645,146,212
16,587,892,966
-
-
45,021,547
34,280,998,246
-
-
-
-
-
6,301,025,012
26,546,270,600
15,250,000
-
-
32,862,545,612
-
-
-
-
-
115,881,229
2,768,095
-
4,310,479
-
122,959,803
2,340,080,214
3,710,023,025
3,745,937,900
2,123,764,925
-
31,148,173,486
52,706,347,800
193,647,589
4,310,479
630,157,554
96,602,442,971
Financial AssetsCash and Bank BalancesReverse repurchase agreementsPlacement with BanksFinancial assets recognised through profit or loss - measured at fair valueFinancial assets at amortised costLoans and AdvancesLease rentals receivable & Stock out on hireDebt & other instrumentsFinancial assets at fair value through other comprehensive incomeOther financial assetsTotal Financial Assets
807,941,181
1,128,154,468
96,612,665
-
2,032,708,315
8,179,876,864
2,723,212,147
7,352,811,147
78,731,269
2,676,161,155
12,830,915,718
6,292,438,410
4,710,492,634
6,609,413,043
236,193,808
-
11,856,098,485
(22,424,899,761)
2,317,851,558
49,931,264,951
3,175,087,592
-
55,424,204,102
(22,561,658,490)
-
-
-
-
-
122,959,803
10,559,496,519
65,321,643,609
3,586,625,335
2,676,161,155
82,143,926,621
14,458,516,351
Financial LiabilityDue to BanksDue to CustomersDebt Instruments Issued and Other borrowed fundsOther Financial LiabilitiesTotal Financial LiabilitiesTotal Net Financial Assets/(Liabilities)
216,590,063
80,845,000
297,435,063
-
-
-
-
-
-
-
-
1 216,590,063
80,845,000
297,435,063
CommitmentsCommitment for unutilised facilitiesFinancial guarantee contractsTotal Commitments
"Less than 03 Months"
LKR
"OnDemand"
LKR
03-12 MonthsLKR
Over 05Years
LKR
01-05 YearsLKR
TotalLKR
"Less than 03 Months"
LKR
"OnDemand"
LKR
03-12 MonthsLKR
Over 05Years
LKR
01-05 YearsLKR
TotalLKR
The table below summarises the maturity profile of the undiscounted cash flows of the Group’s financial assets and liabilities as at 31 March 2019.
Group
"Less than 03 Months"
LKR
"OnDemand"
LKR
03-12 MonthsLKR
Over 05Years
LKR
01-05 YearsLKR
TotalLKR
Company/group
As at 31 March 2020
49.3.3 Contractual Maturities Of Financial Commitments
The table below shows the contractual expiry by maturity of the customers' undrawn loan commitments. These are included in the time band containing the earliest date such can be drawn down by the Customers.

Risk
Man
agem
ent &
Corp
orat
e Go
vern
ance
Sust
aina
bilit
yRe
port
Man
agem
ent D
iscus
sion
and
Anal
ysis
Boa
rd o
f Dire
ctor
s &Ex
ecut
ive M
anag
emen
tHi
ghlig
hts
Fina
ncia
lIn
form
atio
n
920,531,781
44,163,000
964,694,781
-
-
-
-
-
-
-
-
920,531,781
44,163,000
964,694,781
CommitmentsCommitment for unutilised facilitiesFinancial guarantee contractsTotal Commitments
"Less than 03 Months"
LKR
"OnDemand"
LKR
03-12 MonthsLKR
Over 05Years
LKR
01-05 YearsLKR
TotalLKR
Company/Group
As at 31 March 2019
Commercial Credit and Finance PLC Annual Report 2019/20 215
TotalLKR
Market risk is the risk arising from fluctuations in market variables such as interest rates, foreign currencies, equity prices and gold prices. This is the risk that the fair value or future cash flows of financial instruments will fluctuate due to changes in the market variables. As the Company’s operations involve granting accommodations, accepting deposits and obtaining funding facilities, the movements in interest rates constitute the most important market risk for the Company.
Mitigation: Movements in interest rates are closely monitored. Further the Company maintains an adequate Net Interest Margin (NIM) so that increases in interest expenses can be absorbed. The assets and liabilities maturity mismatch is also closely monitored so that the possible adverse effects arising due to interest rate movements could be minimized. Although the mismatch in assets and liabilities in
49.4 MARKET RISK
Equity price risk is the risk that the fair value of equities decreasing as a result of changes in the level of equity indices and individual stocks. The market value of the Company's equity portfolio as of 31 March 2020 is LKR 37,552,504/- (2019 - LKR 57,220,236/-).
49.4.1 Equity price risk
Interest rate risk arises from the possibility that changes in interest rates will affect future cash flows or the fair values of financial instruments. The Management of the Company is closely scrutinizing the impact on NII/NIMs resulting from interest rate related relief measures announced by CBSL to the Covid-19 affected groups.
49.4.2 INTEREST RATE RISK
The following table demonstrates the sensitivity to a reasonably possible change in interest rates, with all other variables held constant, of the company's profit or loss statements and equity, arising from interest bearing loans and borrowings.
49.4.3 INTEREST RATE SENSITIVITY
TotalLKR
2020LKR
2019LKR
+10%
-10%
3,755,250
(3,755,250) 5,722,024
(5,722,024)
Increase/(Decrease)
in basis points
Financial Instrument
Sensitivity of Profit/(Loss)
2019LKR Mn
2020LKR Mn
2019LKR Mn
2020LKR Mn
Sensitivity of Equity
Impact on profit/loss Company/Group
Long Term Loans linked to AWPLR* +100/ (-100) (5.87)/5.87 (65.84)/65.84 (5.87)/5.87 (65.84)/65.84
COMPANY

Notes to the Financial Statements [Cont.]As at 31st March 2020
TotalLKRTotal
LKRIncrease/
(Decrease) in basis points
Financial Instrument
Sensitivity of Profit/(Loss)
2019LKR Mn
2020LKR Mn
2019LKR Mn
2020LKR Mn
Sensitivity of Equity
Long Term Loans linked to AWPLR* +100/ (-100) (5.87)/5.87 (122.25)/122.25 (5.87)/5.87 (122.25)/122.25
GROUP
Commercial Credit and Finance PLC Annual Report 2019/2020216
49.4.4 INTEREST RATE RISK EXPOSURE ON FINANCIAL ASSETS & LIABILITIES
The table below analyses the Company's interest rate risk exposure on financial assets & liabilities. The Company'sassets & liabilities are included at carrying amounts and categorized by the earlier of contractual reprising ormaturity dates.
151,807,501
1,844,151,058
1,457,430,180
907,204,856
10,384,766,816
6,496,245,830
104,822,765
-
-
21,346,429,006
10,751,951,855
15,080,499,716
-
25,832,451,571
(4,486,022,565)
-
1,160,128,434
2,354,849,703
1,127,534,506
4,022,107,432
13,115,945,080
10,000,000
-
-
21,790,565,155
684,305,000
20,370,272,432
1,100,000,000
-
22,154,577,432
(364,012,277)
-
-
-
-
3,695,641,316
23,767,610,113
-
-
-
27,463,251,429
1,225,360,000
11943749730
2,210,000,000
-
15,379,109,730
12,084,141,699
-
-
-
-
117,426,719
15,581,022
-
-
133,007,741
-
-
-
-
-
133,007,741
702,762,570
-
-
37,552,504
-
-
-
4,310,479
743,285,925
1,487,911,478
-
-
39,894,465
1,753,986,571
1,793,881,036
(305,969,558)
854,570,071
3,004,279,492
3,812,279,883
2,072,291,866
18,219,942,283
43,395,382,046
114,822,765
4,310,479
743,285,925
72,221,164,809
12,661,616,855
47,394,521,878
3,349,894,465
1,753,986,571
65,160,019,769
7,061,145,040
Up to 03Months
LKR
03-12Months
LKR
01-05Years
LKR
Over 05Years
LKR
Non interestbearing
LKR
Total as at 31March 2019
LKR
Company
As at 31 March 2020
AssetsCash and Bank BalancesReverse repurchase agreementsPlacement with BanksFinancial assets recognisedthrough profit or loss -measured at fair valueLoans and receivablesLease rentals receivable& Stock out on hireDebt & other InstrumentsFinancial assets at fair valuethrough other comprehensiveincomeOther financial assetsTotal Financial Assets
Financial LiabilitiesDue to banksDue to CustomersDebt Instruments Issued andOther borrowed fundsOther Financial Liabilities Total Financial Liabilities
INTEREST SENSITIVITY GAP

Risk
Man
agem
ent &
Corp
orat
e Go
vern
ance
Sust
aina
bilit
yRe
port
Man
agem
ent D
iscus
sion
and
Anal
ysis
Boa
rd o
f Dire
ctor
s &Ex
ecut
ive M
anag
emen
tHi
ghlig
hts
Fina
ncia
lIn
form
atio
n
Commercial Credit and Finance PLC Annual Report 2019/20 217
679,650,166
3,662,522,772
1,557,445,749
1,039,054,806
11,271,530,668
8,235,684,444
176,417,686
26,622,306,291
8,506,567,974
7,166,291,969
15,672,859,943
10,949,446,348
-
-
2,045,738,989
1,015,882,199
10,888,244,441
10,630,347,894
24,580,213,524
632,805,000
3,269,357,209
250,010,000
4,152,172,208
20,428,041,314
-
-
-
-
4,771,790,071
19,897,055,940
10,826,835
24,679,672,846
102,100,000
40,100,794,664
2,749,990,000
42,952,884,664
(18,273,211,818)
-
-
-
-
100,946,296
2,549,778
103,496,074
-
103,496,074
1,068,946,737
-
-
57,220,236
-
-
-
4,310,479
630,157,554
1,760,635,006
1,371,923,495
11,533,608
2,162,248,712
3,545,705,815
(1,785,070,809)
1,748,596,903
3,662,522,772
3,603,184,737
2,112,157,241
27,032,511,475
38,765,638,057
187,244,522
4,310,479
630,157,554
77,746,323,741
9,241,472,974
51,908,367,338
3,011,533,608
2,162,248,712
66,323,622,632
11,422,701,108
Up to 03Months
LKR
03-12Months
LKR
01-05Years
LKR
Over 05Years
LKR
Non interestbearing
LKR
Total as at 31March 2018
LKR
Company
As at 31 March 2019
AssetsCash and Bank Balances Reverse repurchase agreements Placement with Banks Financial Investments measuredat amortised cost Loans and receivables Lease rentals receivable &Stock out on hire Debt & other Instruments Financial Investments -Available for Sale Other financial assets Total Financial Assets Financial Liabilities Due to banks Due to Customers Debt Instruments Issued andOther borrowed funds Other Financial LiabilitiesTotal Financial Liabilities INTEREST SENSITIVITY GAP

Notes to the Financial Statements [Cont.]As at 31st March 2020
Commercial Credit and Finance PLC Annual Report 2019/2020218
49.4.4 INTEREST RATE RISK EXPOSURE ON FINANCIAL ASSETS & LIABILITIES
148,027,228
3,787,893,629
1,557,445,749
1,039,054,806
11,585,857,750
14,113,250,618
176,417,686
-
-
32,407,947,467
9,326,948,895
7,857,655,861
-
-
17,184,604,756
15,223,342,711
-
1,160,128,434
1,955,679,297
1,020,396,735
10,921,544,404
13,878,029,750
-
58,797,442
-
28,994,576,061
3,343,072,264
3,824,977,302
1,100,000,000
-
8,268,049,566
20,726,526,495
-
-
-
-
3,695,641,316
20,056,082,382
10,000,000
-
-
23,761,723,698
2,357,494,634
40,881,762,509
2,210,000,000
-
45,449,257,143
(21,687,533,445)
-
-
-
-
117,426,719
15,581,022
-
-
-
133,007,741
-
-
-
-
-
133,007,741
1,660,430,047
-
-
37,552,504
-
-
-
4,310,479
727,793,410
2,430,086,440
-
1,265,177,476
11,533,608
2,546,086,230
3,822,797,314
(1,392,710,874)
1,808,457,275
4,948,022,063
3,513,125,046
2,097,004,045
26,320,470,189
48,062,943,772
63,107,921
727,793,410
87,540,923,721
15,027,515,793
53,829,573,148
3,321,533,608
2,546,086,230
74,724,708,779
12,816,214,942
Up to 03Months
LKR
03-12Months
LKR
01-05Years
LKR
Over 05Years
LKR
Non interestbearing
LKR
Total as at 31March 2019
LKR
GroupAs at 31 March 2020
AssetsCash and Bank BalancesReverse repurchase agreementsPlacement with BanksFinancial Investments measuredat amortised cost Loans and Advances Lease rentals receivable &Stock out on hire Debt & other instrumentsFinancial assets at fair valuethrough other comprehensiveincome Other financial assetsTotal Financial Assets
Financial LiabilitiesDue to banksDue to CustomersDebt Instruments Issued andOther borrowed fundsOther Financial LiabilitiesTotal Financial Liabilities
INTEREST SENSITIVITY GAP

Risk
Man
agem
ent &
Corp
orat
e Go
vern
ance
Sust
aina
bilit
yRe
port
Man
agem
ent D
iscus
sion
and
Anal
ysis
Boa
rd o
f Dire
ctor
s &Ex
ecut
ive M
anag
emen
tHi
ghlig
hts
Fina
ncia
lIn
form
atio
n
Commercial Credit and Finance PLC Annual Report 2019/20 219
679,650,166
3,787,893,629
1,557,445,749
1,039,054,806
-
11,585,857,750
14,113,250,618
176,417,686
-
-
32,939,570,405
9,326,948,895
7,857,655,861
-
-
17,184,604,756
15,754,965,649
-
-
1,955,679,297
1,020,396,735
-
10,921,544,404
13,878,029,750
-
58,797,442
-
27,834,447,627
3,343,072,264
3,824,977,302
250,010,000
-
7,418,059,566
20,416,388,061
-
-
-
-
-
4,771,790,071
20,056,082,382
10,826,835
-
-
24,838,699,288
2,357,494,634
40,881,762,509
2,749,990,000
-
45,989,247,143
(21,150,547,855)
-
-
-
-
-
100,946,296
2,549,778
-
-
-
103,496,074
-
-
-
-
-
103,496,074
1,660,430,047
-
-
57,220,236
-
-
-
-
4,310,479
630,157,554
2,352,118,316
-
1,371,923,495
11,533,608
2,546,086,230
3,929,543,333
(1,577,425,017)
2,340,080,213
3,787,893,629
3,513,125,046
2,116,671,777
-
27,380,138,521
48,049,912,528
187,244,521
63,107,921
630,157,554
88,881,081,189
15,027,515,793
53,936,319,167
3,011,533,608
2,546,086,230
74,521,454,798
13,546,876,911
Up to 03Months
LKR
03-12Months
LKR
01-05Years
LKR
Over 05Years
LKR
Non interestbearing
LKR
Total as at 31March 2018
LKR
Group
As at 31 March 2019
AssetsCash and Bank BalancesReverse repurchase agreementsPlacement with BanksFinancial Investments -Held for TradingFinancial Investments measuredat amortised costLease rentals receivable &Stock out on hireLease rentals receivable &Stock out on hireDebt & other InstrumentsFinancial Investments -Available for SaleOther financial assetsTotal Financial Assets Financial Liabilities Due to banks Due to Customers Debt Instruments Issued andOther borrowed fundsOther Financial LiabilitiesTotal Financial Liabilities
INTEREST SENSITIVITY GAP

Notes to the Financial Statements [Cont.]As at 31st March 2020
50 CURRENT AND NON CURRENT ANALYSIS OF ASSETS AND LIABILITIES
The table below shows an analysis of assets and liabilities analysed according to when they are expected to berecovered or settled.
854,570,071
3,004,279,491
3,812,279,883
2,034,739,361
14,406,874,248
19,612,190,910
114,822,765
-
560,287,055
-
138,222,412
-
-
-
-
-
311,261,563
44,849,527,759
6,984,271,494
35,450,790,134
3,349,894,465
1,753,986,571
903,010,682
265,361,284
-
48,707,314,630
-
-
-
37,552,503
3,813,068,035
23,783,191,136
-
4,310,479
182,998,870
65,910,298
34,977,106
1,599,288,321
390,000,000
1,698,461,370
3,051,877,367
649,825,707
199,319,998
-
35,510,781,189
5,677,345,361
11,943,731,743
-
-
416,567,400
-
298,691,827
18,336,336,332
854,570,071
3,004,279,491
3,812,279,883
2,072,291,864
18,219,942,284
43,395,382,046
114,822,765
4,310,479
743,285,925
65,910,298
173,199,518
1,599,288,321
390,000,000
1,698,461,370
3,051,877,367
649,825,707
199,319,998
311,261,563
80,360,308,948
12,661,616,855
47,394,521,877
3,349,894,465
1,753,986,571
1,319,578,082
265,361,284
298,691,827
67,043,650,962
1,748,596,904
3,662,522,772
3,603,184,738
2,054,937,004
18,649,752,781
14,269,806,994
177,244,522
-
132,465,413
-
53,100,210
-
-
-
-
-
234,306,485
44,585,917,823
7,235,269,394
33,071,366,833
-
2,162,248,713
1,239,960,094
384,558,207
-
44,093,403,241
-
-
-
57,220,236
5,054,362,614
22,880,640,907
10,000,000
4,310,479
497,692,140
77,133,325
261,695,163
1,599,288,321
390,000,000
1,448,351,320
3,059,953,319
176,116,081
-
-
35,516,763,904
2,006,203,580
18,837,000,505
3,011,533,608
-
-
175,608,858
24,030,346,551
1,748,596,904
3,662,522,772
3,603,184,738
2,112,157,240
23,704,115,396
37,150,447,901
187,244,522
4,310,479
630,157,553
77,133,325
389,870,741
1,599,288,321
390,000,000
1,448,351,320
3,059,953,319
176,116,081
-
234,306,485
80,102,681,728
9,241,472,974
51,908,367,338
3,011,533,608
2,162,248,713
1,239,960,092
384,558,207
175,608,858
68,123,749,792
2020With in 12
Months LKR
2020After 12Months
LKR
2020Total as at 31
March 2020 LKR
2019With in 12
Months LKR
2019After 12Months
LKR
2019Total as at 31
March 2019 LKR
Company
AssetsCash and Bank BalancesReverse Repurchase AgreementsPlacement with BanksFinancial assets recognisedthrough profit or loss -measured at fair valueLoans and ReceivablesLease rentals receivable &Stock out on hireDebt & other instrumentsFinancial assets at fair valuethrough other comprehensiveincomeOther financial assetsInventoriesOther assetsInvestments in SubsidiariesInvestments in associatesInvestment property Property, plant and equipmentIntangible assets & goodwillRight of use assetsCurrent tax assetsTotal AssetsLiabilities Due to BanksDue to CustomersDebt instruments issuedOther Financial LiabilitiesOther liabilitiesDeferred tax liabilities Post employment benefitobligationsTotal liabilities
Commercial Credit and Finance PLC Annual Report 2019/2020220

Risk
Man
agem
ent &
Corp
orat
e Go
vern
ance
Sust
aina
bilit
yRe
port
Man
agem
ent D
iscus
sion
and
Anal
ysis
Boa
rd o
f Dire
ctor
s &Ex
ecut
ive M
anag
emen
tHi
ghlig
hts
Fina
ncia
lIn
form
atio
n
1,208,461,539
3,141,542,623
3,826,996,141
2,039,253,898
14,406,874,248
19,612,190,910
114,822,765
58,797,442
560,287,055
-
138,222,412
-
-
-
-
-
-
-
-
45,107,449,032
10,514,920,043
36,801,170,379
3,349,894,465
1,753,986,571
1,462,995,410
80,761,132
-
53,963,728,000
-
-
-
189,601,099
3,970,391,826
33,077,309,434
-
8,426,261
164,998,870
65,910,298
119,764,248
-
364,203,089
1,698,461,370
3,126,825,486
672,158,910
-
-
336,796,145
43,794,847,035
8,699,289,075
12,147,471,398
0
233,812,412
-
-
321,699,082
21,402,271,968
1,208,461,539
3,141,542,623
3,826,996,141
2,228,854,997
18,377,266,075
52,689,500,344
114,822,765
67,223,703
725,285,925
65,910,298
257,986,659
-
364,203,089
1,698,461,370
3,126,825,486
672,158,910
959,881,318
-
336,796,145
89,862,177,386
19,214,209,118
48,948,641,777
3,349,894,465
1,987,798,983
1,462,995,410
80,761,132
321,699,082
75,365,999,968
2,340,080,214
3,787,893,629
3,513,125,045
2,059,451,541
18,649,752,781
14,269,806,994
177,244,522
58,797,442
132,465,413
-
53,100,210
-
-
-
-
-
54,594,333
-
45,096,312,124
10,765,917,943
34,421,747,078
-
2,162,248,713
1,398,867,679
207,060,291
-
48,955,841,704
-
-
-
57,220,236
5,350,585,154
31,812,160,204
10,000,000
4,310,479
497,692,140
77,133,325
3368,770,531
-
379,914,143
1,448,351,320
3,131,138,603
941,044,854
-
-
-
44,046,320,988
4,261,597,849
19,514,572,090
3,011,533,608
383,837,518
-
-
189,283,759
27,360,824,824
2,340,080,214
3,787,893,629
3,513,125,045
2,116,671,777
24,000,337,936
46,081,967,198
187,244,522
63,107,921
630,157,553
77,133,325
389,870,741
-
379,914,143
1,448,351,320
3,131,138,603
941,044,854
54,594,333
-
89,142,633,114
15,027,515,792
53,936,319,168
3,011,533,608
2,546,086,231
1,398,867,679
207,060,291
189,283,759
76,316,666,528
2020With in 12
Months LKR
2020After 12Months
LKR
2020Total as at 31
March 2019 LKR
2019With in 12
Months LKR
2019After 12Months
LKR
2019Total as at 31
March 2018 LKR
Group
AssetsCash and Bank Balances Reverse Repurchase Agreements Placement with Banks Financial assets recognisedthrough profit or loss -measured at fair value Loans and Advances Lease rentals receivable &Stock out on hire Debt & other instruments Financial assets at fair valuethrough other comprehensiveincome Other financial assets Inventories Other assets Investments in subsidiary Investments in associates Investment property Property, plant and equipment Intangible assets & Goodwill Right of use assets Current tax assets Deferred tax assets Total AssetsLiabilities Due to BanksDue to CustomersDebt Instruments Issued andOther borrowed fundsOther Financial LiabilitiesOther liabilitiesDeferred tax liabilities Post employment benefitobligationsTotal liabilities
The table below shows an analysis of assets and liabilities analysed according to when they are expected to berecovered or settled.
Commercial Credit and Finance PLC Annual Report 2019/20 221

Notes to the Financial Statements [Cont.]As at 31st March 2020
Commercial Credit and Finance PLC Annual Report 2019/2020222
216,590,063
80,845,000
297,435,063
920,531,781
44,163,000
964,694,781
216,590,063
80,845,000
297,435,063
920,531,781
44,163,000
964,694,781
2020LKR
Nature ofLiability
Company/GroupNature of Assets
2019LKR
2020LKR
2019LKR
Included Under
Commitment for unutilised facilitiesGuarantees issuedTotal commitments and contingencies
There were no material contingent liabilities outstanding as at the reporting date.
51. COMMITMENTS AND CONTINGENCIES
51.2. Commitments
52.ASSETS PLEDGED
The following assets have been pledged as security for liabilities.
Company Group
7,483,218,183
-
156,375,750
447,616,717
1,812,531,108
9,899,741,757
Loans
LoansOverdraft
Loans
Loans
5,501,219,648
-
156,300,000
397,071,378
891,111,094
6,945,702,119
7,483,218,183
-
156,375,750
447,616,717
1,812,531,108
9,899,741,757
10,483,818,128
1,049,916,649
156,300,000
-
891,111,094
12,581,145,870
Lease Rentals Receivable & Stock out on HireLoans & ReceivablesProperty, Plant and Equipment Cash & Bank Balances
Placement with banks
2020LKR
2019LKR
2020LKR
2019LKR
Lease Rentals Receivable & Stock out on HireMicrofinance LoansLand & Building
Balance held in foreign currency accountPlacement with banks
51.1 Legal Claims The Company has controls and policies for managing legal claims. Once professional advice has been obtained and the amount of loss reasonably estimated, the Company makes adjustments to account for any adverse effects which the claims may have on its financial standing. At year-end the Company had seven unresolved legal claims amounting to LKR 40,600,000/- ( 2019-LKR 40,300,000/-) against the Company. Although there can be no assurance, the Directors believe, based on the information currently available, that the ultimate resolution of such legal procedures would not likely to have a material adverse effect of the results of operations, financial position of liquidity. Accordingly, no provision for any liabilities has been made in these Financial Statements.
COMPANY
Carrying Amount Pledged
GROUP

Risk
Man
agem
ent &
Corp
orat
e Go
vern
ance
Sust
aina
bilit
yRe
port
Man
agem
ent D
iscus
sion
and
Anal
ysis
Boa
rd o
f Dire
ctor
s &Ex
ecut
ive M
anag
emen
tHi
ghlig
hts
Fina
ncia
lIn
form
atio
n
Commercial Credit and Finance PLC Annual Report 2019/20 223
121,679,850
9,403,550
8,255,000
139,338,400
185,942,000
9,035,550
6,112,040
201,089,590
121,679,850
9,403,550
8,255,000
139,338,400
185,942,000
9,035,550
6,272,040
201,249,590
2020LKR
2019LKR
2020LKR
2019LKR
Company Group
Short Term Employment BenefitsPost Employment BenefitsDirectors Fees & Expenses
18,568,115
1,630,933
471,808
14,030,392
1,100,261
353,856
18,568,115
1,630,933
471,808
24,390,392
2,084,082
353,856
2020LKR
2019LKR
2020LKR
2019LKR
Company Group
Fixed Deposits held at the end of the yearInterest on Fixed DepositsDividend Paid
53. RELATED PARTY TRANSACTIONS
53.1.1 Key Management Personnel Compensation
The Company carried out transactions with parties who are defined as Related Parties as per the Sri Lanka Accounting Standard - LKAS 24 ‘Related Party Disclosures’.
The pricing applicable to such tansactions is based on the assessment of risk and pricing method of the company and is compairable with what is applied to transactions between the company / goup and its unrelated customers.
Details of significant related party transactions which the company had during the year are as follows,
53.1 Transactions with Key Managerial Personnel (KMPs) Related party includes KMPs defined as those persons having authority and responsibility for planning directing and controlling the activities for the Company and "Key Management Personnel" has been defined to be the Board of Directors of the Company fall under such definition.
53.1.2 Transactions, Arrangements and Agreements Involving KMPs, and their Close Members of Family (CFMs)
CFMs of a KMPs are those family members who may be expected to influence, or be influenced by, that KMP in their dealing with the entity.

Notes to the Financial Statements [Cont.]As at 31st March 2020
Commercial Credit and Finance PLC Annual Report 2019/2020224
250,000,000
21,625,000
-
-
250,000,000
21,625,000
-
-
2020LKR
2019LKR
2020LKR
2019LKR
Company Group
Investment in Fixed Deposit at Commercial Credit and Finance PLCFixed deposit Interest paid for the period ended 31 March 2020
TotalLKR
Amounts paid for being a member of the Key Management Personnel as included in 53.1.1 above
53.2.1 Transactions with Ultimate Controlling Party
53.2.2 Transactions with Ultimate Parent Entity BG Capital (Pvt) Ltd
159,832,175
267,000,000
68,316,531
-
119,874,131
893,300,506
-
-
159,832,175
267,000,000
68,316,531
-
119,874,131
1,081,724,388
-
280,850,000
2020LKR
2019LKR
2020LKR
2019LKRCompany Group
Dividends Paid (Gross) Investment in Fixed Deposit at Commercial Credit and Finance PLC Fixed deposit Interest paid for the period ended - Investment in Fixed Deposit at Trade Finance and Investment PLC
95,390,500 71,542,875 95,390,500 71,542,875 Dividend Paid (Gross)
53.2.3 Transactions with Immediate Parent Entity BG Investments (Pvt) Ltd
-
50,000,000
1,878,493
1,886,426
56,800,430
103,369,260
-
28,185,756
-
50,000,000
1,878,493
1,886,426
- -
-
-
2020LKR
2019LKR
2020LKR
2019LKR
Dividend Received (Gross) - Investment in Fixed Deposits at Trade Finance and Investments PLC Interst Expense Paid on Fixed deposits at Commrecial Credit and Finance PLCInterest earned on Fixed deposit at Trade Finance and
2,227,740,552
583,636,591
2,227,740,552
583,636,591
2020LKR
2019LKR
2020LKR
2019LKR
TVS Lanka (Pvt) LtdPayment for lease contracts
53.2.5 Transactions with Subsidiary Trade Finance and Investments PLC
53.2.6 TRANSACTIONS WITH ASSOCIATES
53.2.4 Transactions with Significant Investor - Group Lease Holdings Pte Ltd
53.2 Transactions with related entity
2019LKR

Risk
Man
agem
ent &
Corp
orat
e Go
vern
ance
Sust
aina
bilit
yRe
port
Man
agem
ent D
iscus
sion
and
Anal
ysis
Boa
rd o
f Dire
ctor
s &Ex
ecut
ive M
anag
emen
tHi
ghlig
hts
Fina
ncia
lIn
form
atio
n
Commercial Credit and Finance PLC Annual Report 2019/20 225
300,000,000
21,000,000
-
-
-
-
300,000,000
21,000,000
2020LKR
2019LKR
2020LKR
2019LKR
(a) APIIT Lanka (Pvt) Ltd Investment in Fixed Deposits at Commercial Credit and Finance PLC Interst paid on Fixed Deposits
30,360,125
20,672,635
20,672,635
30,360,125
(b) Creation Investments Lanka LLC Dividend Paid
53.2.7 Transactions with other group entities
54. EVENTS AFTER THE REPORTING DATE There are no events occurring after the reporting date which require adjustments to or disclosure in the financial statements. ACCOUNTING POLICY All material events after the reporting date events have been considered where appropriate judgement or disclosures are made in respective notes to the Financial Statements 55.CAPITAL The Company maintains capital in order to cover risks inherent in the business and meet the capital adequacy requirements ofCentral Bank of Sri Lanka. The adequacy of the Company's capital is monitored based on the measures, rules and ratios adopted by Central Bank of Sri Lanka.

Interest IncomeNet Interest IncomeInterest ExpensesOperating ExpensesProfit/(Loss) before TaxIncome Tax & VAT on Financial ServicesNet Profit/(Loss)Dividend PaidASSETSCash & Bank BalanceTreasury Bills & BondsPlacements with Banks & Other Finance CompaniesInvestment in Dealing Securities Lease,Hire Purchase,Loans and AdvancesProperty, Plant and EquipmentTotal AssetsLIABILITIESDepositsBorrowingsTotal LiabilitiesSHARE HOLDERS’ FUNDSStated CapitalReservesTotal Share Holders’ FundsRATIOSGrowth of Income (%)Growth of Net Profit (%)Interest Cover (times)Net Assets Growth (%)Equity Assets Ratio (%)Growth of Leases, Hire Purchases, Loans and Advances (%)Return on Assets (%)Return on Equity (%)Total Assets to Share Holders’ Funds (times)Fixed Assets to Share Holders’ Funds (times)Net Asset per ShareEarning per ShareDividend per Share
1,112,597702,488410,109497,323244,366184,27260,094
-
203,70866,969
112,05630,165
4,323,467238,532
5,238,595
3,958,394594,986
4,909,633
170,640158,322328,962
195.0432.981.69 44.976.28
155.784.66
18.2715.920.731.510.28
-
2,442,0861,741,800
700,285881,341960,421388,139655,609
-
140,96183,558
378,39445,320
8,413,092290,505
10,244,294
6,925,8901,517,7219,259,724
170,640813,931984,571
119.49990.97
2.37199.39.61
94.599.38
66.5910.40 0.30 4.513.01
-
3,963,1682,408,0121,555,1561,620,520
865,704288,670679,401238,074
395,655257,673572,72146,705
14,485,926557,661
18,285,191
13,155,6092,796,157
16,831,846
470,640982,705
1,453,345
62.293.631.62
47.617.95
72.186.07
55.7412.580.386.102.851.00
6,913,7724,037,6422,876,1292,555,1961,194,504
353,1091,007,836
119,037
1,123,108811,343624,132144,356
25,931,647607,580
31,643,210
22,855,7794,251,989
28,340,201
1,478,6401,824,3693,303,009
74.4548.341.47
127.2710.4479.014.78
42.389.580.18
11.554.200.50
Operating Results 2013/14Rs.’000
2010/11Rs.’000
2011/12Rs.’000
2012/13Rs.’000
Ten Year Summary
Commercial Credit and Finance PLC Annual Report 2019/2020226

Risk
Man
agem
ent &
Corp
orat
e Go
vern
ance
Sust
aina
bilit
yRe
port
Man
agem
ent D
iscus
sion
and
Anal
ysis
Boa
rd o
f Dire
ctor
s &Ex
ecut
ive M
anag
emen
tHi
ghlig
hts
Fina
ncia
lIn
form
atio
n
Commercial Credit and Finance PLC Annual Report 2019/20 227
11,146,5687,000,9424,145,6273,770,0972,500,686
761,4412,103,953
143,037
2,470,271857,039798,534279,846
46,555,6251,197,329
57,706,278
42,185,5246,386,357
51,807,928
2,150,6403,747,7105,898,351
61.22108.76
1.6078.5810.2279.535.60
45.739.780.20
18.547.150.50
15,729,1649,667,3316,061,8334,920,1802,769,691
1,085,927 2,151,694
318,074
1,142,1361,679,5961,119,606 474,212
58,764,0611,393,909
70,707,765
49,297,29910,399,32462,925,888
2,150,6405,631,2367,781,877
41.112.27 1.5331.9311.0026.22 4.31
31.469.090.18
24.466.761.00
19,048,828 11,237,208 7,811,619 5,529,662 3,910,562 1,771,799 2,902,978
477,112
1,851,853 1,854,181 1,507,448
358,391 68,242,214 1,548,296
82,854,513
53,737,081 14,274,358 72,606,699
2,150,640 8,097,173
10,247,814
21.11 34.92 1.60
31.69 12.37 16.13 5.09
32.20 8.09 0.15
32.22 9.13 1.50
20,141,562 10,834,606 9,306,956 5,537,152 3,479,819 2,017,071 2,350,694
318,078
1,695,964 2,490,000 2,284,988
310,266 66,905,445 1,765,511
83,792,948
54,224,085 11,554,221 71,529,511
2,150,640 10,112,797 12,263,437
5.74 (19.02)
1.47 19.67 14.64 (1.96)4.18
20.88 6.83 0.14
38.56 7.39
1.00
19,626,812 10,856,187 8,770,625 6,403,618 2,841,772 1,752,340 2,078,679
238,556
1,748,597 2,054,937 3,603,185
57,220 60,854,563 3,059,953
80,110,747
51,908,367 12,253,007 68,123,750
2,150,640 9,836,357
11,986,997
(2.56)(11.57)
0.87 (2.25)14.96 (9.04)3.47
17.14 6.68 0.26
37.69 6.54
0.75
17,966,128 9,372,982 8,593,146 5,917,576 1,797,487
997,080 1,663,899
318,074
854,570 2,034,739 3,812,280
37,553 61,615,324 3,051,877
80,360,309
47,394,522 16,011,511 67,043,651
2,150,640 11,166,018 13,316,658
(8.46)(19.95)
1.20 11.09 16.57 1.25 2.24
13.15 6.03 0.23
41.43 5.23
1.00
2019/20 Rs.’000
2014/15Rs.’000
2015/16Rs.’000
2016/17 Rs.’000
2017/18 Rs.’000
2018/19 Rs.’000

1 - 1,0001,001 - 5,000
5,001 - 10,00010,001 - 50,000
50,001 - 100,000100,001 - 500,000500,001 & Above
Total
1,001361111114141216
1,629
237,218 913,751 886,999
2,508,560 976,409
2,741,888 309,809,540 318,074,365
0.07%0.29%0.28%0.79%0.31%0.86%
97.40%100.00%
99833398
102109
14 1,564
240,275 822,952 768,878
2,165,467 708,846
2,093,775 311,274,172 318,074,365
0.08%0.26%0.24%0.68%0.22%0.66%
97.86%100.00%
Range ofShares
Percent ofShareholding
Investor Information
Commercial Credit and Finance PLC Annual Report 2019/2020228
1.Stock Exchang ListingThe Ordinary shares of the company listed on the clombo stock Exchange since 1 June 2011 and the stock exchange ticker symbol for commercial credit and finance PLC is " COCR ".
The Audited Statement of profit or Loss for the year ended 31 March 2020 and the Audited statement pf Financila Postion of the company will be submitted to the colombo exchange before 30June 2020
2. Share Holder BaseThe Total Number of (Ordinary Voting) shareholders as at 31 March 2020 were 1629 compared to 1564 shareholders as at 31 March 2019
3. Distribution Shareholders
No of Shareholders
No of Shares Percent ofShareholding
No of Shareholders
No of SharesAs at 31 March 2020 As at 31 March 2019
ResidentNon- ResidentTotalIndividualInstitutionTotal
156267
1,6291514115
1,629
194,584,967 123,489,398 318,074,365
23,525,428 294,548,937 318,074,365
61%39%
100%7%
93%100%
155212
1,5641461103
1,564
194,938,208 123,136,157 318,074,365
23,012,798 295,061,567 318,074,365
61.29% 38.71%
100% 7.24%
92.76% 100%
Shareholders Percent ofShareholding
No of Shareholders
No of Shares Percent ofShareholding
No of Shareholders
No of Shares
As at 31 March 2020 As at 31 March 2019
4. Composition of Shareholders

Risk
Man
agem
ent &
Corp
orat
e Go
vern
ance
Sust
aina
bilit
yRe
port
Man
agem
ent D
iscus
sion
and
Anal
ysis
Boa
rd o
f Dire
ctor
s &Ex
ecut
ive M
anag
emen
tHi
ghlig
hts
Fina
ncia
lIn
form
atio
n
1234567891011121314151617181920
B G Investments (PVT) Ltd Group Lease Holdings PTE Ltd Lanka Orix Finance PLC/B G Investments (PVT) Ltd Creation Investments Sri Lanaka,LLC Creation Investments SL1 LLC DR. E Fernando People's Leasing & Finance PLC / Ms. S. N. Egodage Ceylinco Life Insurance Limited Account No. 1 Mrs. H H J Hewage Mr. S B Hemachandra Mr. N Y Hemachandra Mrs. H N Hemachandra Mr. S M Hemachandra Mr. T K Hemachandra Mr. S K Semage People's Leasing & Finance PLC / B G Investments (PVT) Ltd DFCC Bank PLC / P.S.R. Casie Chitty Mrs. L S Semage Code-Gen International PVT LTD Seylan Bank PLC / W.D.N.H. Perera Sub Total Other Total
132,530,096 95,390,500 26,700,000 20,347,220 7,216,294 6,500,000 5,093,438 4,014,843 1,937,800 1,796,320 1,796,072 1,796,070 1,796,070 1,555,689
737,049 602,079 429,808 423,429 405,000 383,087
311,450,864 6,623,501
318,074,365
41.67%29.99%8.39%6.40%2.27%2.04%1.60%1.26%0.61%0.56%0.56%0.56%0.56%0.49%0.23%0.19%0.14%0.13%0.13%0.12%
97.92%2.08%
100.00%
% No of Shareholders
As at 31 March 2020
5.Top Twenty Shareholders
Ordinary Voting Shares
Commercial Credit and Finance PLC Annual Report 2019/20 229
No. Name of the Shareholder
1234567891011121314151617181920
B G Investments (PVT) Ltd Group Lease Holdings PTE Ltd Lanka Orix Finance PLC/B G Investments (PVT) Ltd Creation Investments Sri Lanaka,LLC Mrs.E Fernando Mr.G G Hemachandra Creation Investments SL1 LLC People's Leasing & Finance PLC / Ms. S. N. Egodage Ceylinco Life Insurance Limited Account No. 1 Mrs.H H J Hewage Mr.T K Hemachandra Commercial Bank of Ceylon PLC/Dunamis Capital PLC Mr.S K Semage Mr.M E Wickremesinghe People's Leasing & Finance PLC / B G Investments (PVT) Ltd DFCC Bank PLC / P.S.R. Casie Chitty Mrs.L . S. Semage Code-Gen International PVT LTD Mr. N.A. Peiris Mr. D. K. Gunarathne Sub Total Other Total
132,530,096 95,390,500 26,700,000 20,347,220 7,216,294 7,184,282 6,500,000 5,093,438 4,014,843 1,910,000 1,555,689 1,492,682
737,049 602,079 429,808 425,929 405,000 200,000 180,132 131,388
313,046,429 5,027,936
318,074,365
41.6729.998.396.402.272.262.041.601.260.600.490.470.230.190.140.130.130.060.060.04
98.42 1.58
100.00
% No of Shareholders
As at 31 March 2020
Ordinary Voting Shares
No. Name of the Shareholder

Mr. K. J.C. Perera Mr. R.S. Egodage Mrs. G. R. Egodage Mr. E. D. P. Soosaipillai Mr. M. S. D. Pinto MR. P. S. R. C. Chitty Mr. P. T. Fisher Mr. K. D. Vander Weele Mr. B. Zschorsch MR. A. J. P. Dufes Mr. L. L. S. Wickramasinghe Ms. T. M. L. Paktsun
N/ANilNilNil
42,000429,808
NilNilNilNilNilNil
N/ANilNilNil
0.0130.14
NilNilNilNilNilNil
NilNilNilNil
42,000429,808
NilNilNilNil
N/AN/A
NilNilNilNil
0.0130.14
NilNilNilNil
N/AN/A
Name
"% ofHoldings "
"No.ofShares"
"% ofHoldings "
No of Shares
As at 31 March 2020 As at 31 March 2019
6. Director's Shareholding
Net Asset per Share (Rs) Share Price Highest (Rs.) Lowest (Rs.) Last Traded (Rs.) Earnings Basic Earning per share (Rs.) Price Earning Ratio (Times) Divident per share (Rs.) Divident Payout Ratio Number of Transactions Market Capitalisation
41.43
31.0018.0018.30
5.233.501.000.03
2,386 5,821
37.69
28.6022.7027.30
6.544.080.750.15
1,767 8,683
As at March 2019As at March 2020
7. Share Information
Debt/ Equity Ratio Quick Asset Ratio Interest Cover
4.93 0.61 1.20
5.68 0.831.32
As at March 2019As at March 2020
8. Debenture Information
Commercial Credit and Finance PLC Annual Report 2019/2020230

Risk
Man
agem
ent &
Corp
orat
e Go
vern
ance
Sust
aina
bilit
yRe
port
Man
agem
ent D
iscus
sion
and
Anal
ysis
Boa
rd o
f Dire
ctor
s &Ex
ecut
ive M
anag
emen
tHi
ghlig
hts
Fina
ncia
lIn
form
atio
n
Yield as at Date of last Trade The Market Prices during the year Highest Price (LKR) Lowest Price (LKR) Last Traded Price (LKR) Credit Rating (Instrument) Comparable Goverment Security Coupon Rate
Not Traded
Not TradedNot TradedNot Traded
AA9.81
Not Traded
Not TradedNot TradedNot Traded
AA 11.04
As at March 2019As at March 2020
Company issued LKR 1,000,000,000 rated subordinated guranteed redeemable Debentures for 5 years in June 2015.These debentures were listed on the Colombo Stock Exchange.
Commercial Credit and Finance PLC Annual Report 2019/20 231
Yield as at Date of last Trade The Market Prices during the year Highest Price (LKR) Lowest Price (LKR) Last Traded Price (LKR) Credit Rating (Instrument) Comparable Goverment Security Coupon Rate
Not Traded
Not TradedNot TradedNot Traded
A+ 9.81
Not Traded
Not TradedNot TradedNot Traded
A+ 11.04
As at March 2019As at March 2020
Company issued LKR 2,000,000,000 rated subordinated guranteed redeemable Debentures for 5 years in December 2015.These debentures were listed on the Colombo Stock Exchange.

Commercial Credit and Finance PLC Annual Report 2019/2020232
Glosssary
Accounting Policies Principles, bases, conventions, rules and practices that are applied in recording transactions and in preparing and presenting Financial Statements.
Accrual BasisRecognising the effects of transaction and other events when they occur without waiting for receipt or payment of cash or its equivalent.
Amortisation The systematic allocation of the depreciable amount of an intangible asset over its expected useful life.
Amortised Cost The amount at which the financial asset or financial liability is measured at initial recognition minus principal repayments, plus or minus the cumulative amortisation using the effective interest method of any difference between that initial amount and the maturity amount, and minus any reduction (directly or through the use of an allowance account) for impairment or uncollectability.
Associate Company An entity, including an unincorporated entity such as a partnership, over which the investor has significant influence and that is neither a subsidiary nor an interest in a joint venture.
Available for Sale (AFS) A debt or equity security that is purchased with the intent of selling before it reaches maturity or selling prior to a lengthy time period in the event the security does not have a maturity.
Capital Adequacy Ratio The relationship between capital and risk weighted assets as defined by the directives issued by The Central Bank ofSri Lanka.
Cash Equivalents Short-term highly liquid investments those are readily convertible to known amounts of cash and which are subject to an insignificant risk of changes in value.
Collectively Assessed Impairment Impairment assessment on a collective basis for homogeneous groups of loans that are not considered individually significant
and to cover losses which have been incurred but have not yet been identified on loans subject to individual assessment.
Commercial Paper An unsecured, short-term debt instrument issued by a corporation, typically for the financing of accounts receivable, inventories and meeting short-term liabilities.
Commitments Credit facilities approved but not yet disbursed to the customers as at the date of the Statement of Financial Position.
Consolidated Financial Statements Financial statements of a holding Company and its subsidiaries based on their combined assets, liabilities and operating results.
Contingencies A condition or situation, the ultimate outcome of which, gain or loss, will be confirmed only on the occurrence or nonoccurrence of one or more uncertain future events.
Corporate Governance The process by which corporate entities are governed. It is concerned with the way in which power is exercised over the management and direction of entity, the supervision of executive actions and accountability to owners and others stakeholders.
Cost/Income Ratio Operating expenses as a percentage of net income.
Credit Risk Credit risk is the potential that a borrower or counter party will fail to meet its obligations in accordance with agreed terms and conditions.
Credit Ratings An evaluation of a corporate’s ability to repay its obligation or the likelihood of non-defaulting, carried out by an independent rating agency.
Currency Swaps The simultaneous purchase of an amount of a currency for spot settlement and the sale of the same amount of the same currency for forward settlement.
A
C

Currency Risk The risk that the fair value or future cash flows of a financial instrument will fluctuate because of changes in foreign exchange rates.
Customer Deposits Money deposited by account holders. Such funds are recorded as liabilities.
Dealing Securities These are marketable securities acquired and held with the intention to resale over a short period of time.
Deferred Taxation Sum set aside for tax in the Financial Statements that may become payable/receivable in a financial year other than the current financial year.
Depreciation The systematic allocation of the depreciable amount of a tangible capital asset or fixed asset over its useful life.
Derecognition Is the removal of a previously recognised financial asset or financial liability form an entity’s Statement of Financial Position.
Derivatives A financial instrument or other contract, the value of which changes in response to some underlying variable (e.g. an interest rate), that has an initial net investment smaller than would be required for other instruments that have a similar response to the variable, and that will be settled at a future date.
Dividend Cover Profit after tax divided by gross dividends. This ratio measures the number of times dividend is covered by current year’s distributable profits.
Dividend per Share Value of the total dividend paid out and proposed to ordinary shareholders divided by the number of ordinary shares in issues; this indicates the proportion of current year’s dividend attributable to an ordinary share in issue.
Dividend Yield Dividend earned per share as a percentage of its market value.
Discount Rate A rate used to place a current value on future cash flows. It is needed to reflect the fact that money has a time value
Earnings per Ordinary Share (EPS) Profit attributable to ordinary shareholders divided by the weighted average number of ordinary shares in issue.
Economic Value Added A measure of productivity that takes into consideration cost of total invested equity.
Effective Interest Method Is a method of calculating the amortised cost of financial asset or a financial liability(or group of financial asset or financial liabilities) and of allocating the interest income or interest expense over the relevant period.
Effective Tax Rate Provision for taxation including deferred tax divided by the profit before taxation.
Exposure A claim, contingent claim or position which carries a risk of financial loss.
Equity Method A method of accounting whereby the investment is initially recognised at cost and adjusted thereafter for the post acquisition changes in the investor’s share of net assets of the investee. The profit or loss of the investor includes the investor’s share of the profit or loss of the investee.
Equity Total of shareholders’ funds: share capital + statutory reserves + other reserves.
Fair Value The amount for which an asset could be exchanged between a knowledgeable, willing buyer and a knowledgeable, willing seller in an arm’s length transaction.
Finance Lease A lease in which the lessee acquires all the financial benefits and risks attaching to ownership of the asset under lease.
Commercial Credit and Finance PLC Annual Report 2019/20 233
Board of Directors
D
E
F

Glossary [Cont.]
Commercial Credit and Finance PLC Annual Report 2019/2020234
Financial Asset Any asset that is cash, an equity instrument of another entity or a contractual right to receive cash or another financial asset from another entity.
Financial Instrument Is any contract that gives rise to a financial asset of one entity and a financial liability or equity instrument of another entity.
Financial Liability A contractual obligation to deliver cash or another financial asset to an other entity.
Gearing Long-term borrowings divided by the total funds available for shareholders.
Gross Dividend The portion of profits distributed to the shareholders including the tax with held.
Guarantees A promise made by a third party (Guarantor), who is not a party to a contract between two others, that the guarantor will be liable if the guarantee fails to fulfill the contractual Obligations.
Hedging A strategy under which transactions are effected with the aim of providing cover against the risk of unfavorable price movements (interest rate, foreign exchange rates, commodity prices, etc).
Held-to-Maturity Investments and debt securities that a Company has the ability and intent to hold until maturity.
Hire Purchase A system by which a buyer pays for an asset in regular installments while enjoying the use of such asset. During the repayment period, ownership(title) of the asset does not pass to the buyer.
Impairment The value of an asset when the recoverable amount is less than its carrying amount.
Impaired Loans Loans where the Group does not expect to collect all the contractual cash flows or expects to collect them later than they are contractually due.
Impairment Allowance for Loans and Receivables Amount set aside against possible losses on loans, lease rentals and advances as a result of such facilities becoming partly or wholly uncollectible.
Individually Assessed Impairment Exposure to loss is assessed on all individually significant accounts that do not qualify for collective assessment.
Intangible Assets An intangible asset is an identifiable non-monetary asset without physical substance.
Interest Cover Earnings before interest and taxes for the year divided by total interest expenses.
Interest in Suspense Interest suspended on non-performing accommodations. (Leases, hire purchases, loans and other advances)
Interest Margin Net interest income expressed as a percentage of average total assets.
Interest Rate Risk The risk that an investment’s value will change due to a change in the absolute level of interest rates, in the spread between two rates, in the shape of the yield curve or in any other interest rate relationship.
Interest Spread The difference between the average yield a financial institution receives from loans and other interest-accruing activities and the average rate it pays on deposits and borrowings.
Investment Properties Property (land or a building – or part of a building – or both) held (by the owner or by lessee under a finance lease) to earn rentals or for capital appreciation or both, rather than for use or sale.
Investment Securities Securities acquired and held for yield and capital growth purposes which are usually held to maturity.
Key Management Personnel People having authority and responsibility for planning, directing and controlling the activities of an entity, either directly or indirectly. (The Board of Directors and Corporate Management).
G
H
I K

P
Liquid Assets Assets that are held in cash or can be converted to cash readily, such as deposits with other banks, Bills of Exchange, Treasury Bills and Bonds.
Liquidity Risk The risk that an entity will encounter difficulty in meeting obligations associated with financial liabilities.
Loans Payable Loan payable are financial liabilities, other than short-term trade payable on normal credit terms.
Loans and Receivables Non-derivative financial assets with fixed or determinable payments that are not quoted in an active market other than those intends to sell immediately or in the near term and designated as fair value through profit or loss or available for sale on initial recognition.
Loss Given Default (LGD) The estimated ratio (percentage) of the loss of an exposure to the amount outstanding at default upon default of counter party.
Market Capitalization Number of ordinary shares in issue multiplied by the market value of a share as at date.
Market Risk This refers to the possibility of loss arising from changes in the value of a financial instrument as a result of changes in market variables such as interest rates, exchange rates, credit spreads and other asset prices.
Materiality The relative significance of a transaction or an event, the omission or misstatement of which could influence the economic decisions of users of Financial Statements.
Net Asset Value per Ordinary Share Total net asset value of a Company divided by the total number of ordinary shares in issue.
Net Interest Income Difference between revenue generated from interest bearing assets and interest incurred on interest bearing liabilities.
Net Interest Margin Net interest income as a percentage of average assets.
Non-Performing Accommodations A sum of borrowed money upon which the debtor has not made scheduled payments for at least 180 days.
Non-Controlling Interest Portion of the profit or loss and net assets of a subsidiary attributable to equity interests that are not owned, directly or indirectly through subsidiaries, by the parent.
Non-Performing Advances Loans and advances of which rentals are in arrears for six months or more.
NPA Ratio Total Non-Performing Accommodations (net of interest in suspense and other adjustments) divided by totalaccommodations (net of interest in suspense and other adjustments).
Operational Risk The losses arising from fraud, negligence, oversight, human error, process errors, system failures, external events, etc.
Parent An entity that controls one or more subsidiaries.
Price Earnings Ratio Market price of a share divided by earnings per share.
Provision The amount of an expense that an entity elects to recognise now, before it has precise information about the exact amount of the expense.
Provision Cover Total provision for losses on loans, leases and advances expressed as a percentage of net non-performing loans before discounting for provision on non-performing loans, leases and advances.
Commercial Credit and Finance PLC Annual Report 2019/20 235
N
L
M
O
Glossary [Cont.]
Commercial Credit and Finance PLC Annual Report 2019/2020236
Related Parties Parties where one party has the ability to control the other party exercise a significant influence over the other party in making financial and operating decisions, directly or indirectly.
Related Party Transactions Is a transfer of resources, services or obligations between related parties, regardless of whether a price is charged or not.
Repurchase Agreements Contracts to sell and subsequently repurchase securities at a specified price at a specified future date.
Return on Average Assets (ROA) Profit before tax divided by total average assets.
Return on Equity Profit after tax divided by total average equity.
Reverse Repurchase Agreements The purchased of securities with the agreement to sell them at a specified price at a specified future date.
Risk Weighted Assets On balance sheet assets and the credit equivalent of off balance sheet assets multiplied by relevant factors weighted by risk.
Segmental Analysis Separately reported results of individual business activities that are required for publicly-held companies.
Shareholders’ Funds This consists of issued and fully paid up ordinary shares and reserves.
Statutory Reserve Fund A capital reserve created as per the provisions of Finance Companies (Capital Funds) Direction No. 01 of 2003.
Specific Impairment Provisions Impairment is measured individually for loans that are individually significant to the Company
Subsidiary Company An entity, including an unincorporated entity such as partner-ship, which is controlled by another entity, known as Parent.
Substance Over Form The consideration that the accounting treatment and the presentation in Financial Statements of transaction and the events are governed by their financial reality and not merely by its legal form.
Tier I Capital - Core Capital Representing permanent shareholders’ equity (paid-up shares) and reserves created or increased by appropriations of retained earnings or other surplus, i.e, retained profits and other reserves.
Tier II Capital Supplementary finance institution capital that includes items such as revaluation reserves, undisclosed reserves, hybrid instruments and subordinated term debt.
Value Added Value of wealth created by providing financial and other related services less the cost of providing such services.
Yield Rate or return on an investment in percentage terms taking into account annual income.
Board of Directors
S
R T
V
Y

Commercial Credit and Finance PLC Annual Report 2019/20 237
NOTICE is hereby given that the Thirty Seventh (37th) Annual General Meeting of Commercial Credit and Finance PLC will be held will be held as a as a Hybrid Meeting at Commercial Credit and Finance PLC, City Office, Third (3rd) Floor,Training Room, No. 165, Kynsey Road, Colombo 08 on 28 September 2020 at 10.00 a.m. and the business to be brought before the meeting will be as follows:
1. To receive and consider the Audited Financial Statements for the Year Ended 31st March 2020 and the Reports of the Auditors’ and of the Directors’ thereon
2. Directors
3. To re-appoint the Auditors Messrs. Ernst & Young, Chartered Accountants, to hold office until the conclusion of the next Annual General Meeting and to authorise the Directors to determine their remuneration.
4. To authorise the Directors to determine contributions to charities.
By Order of the Board
SecretaryJacey & Company
Colombo 03 September 2020
Notice of Meeting
(I) To elect Mrs. Tamara Mu-Lin Lam Paktsun, Director, who retires in terms of Article 24 (2) of the Articles of Association of the Company (II) To re-elect Mr. Roshan Sanjaya Egodage, Director, who retires by rotation in terms of Article 24 (6) of the Articles of Association of the Company
(II) To re-elect Mrs. Geya Rasi Egodage, Director, who retires by rotation in terms of Article 24 (6) of the Articles of Association of the Company
(II) To re-elect Mr. Patrick Thomas Fisher, Director, who retires by rotation in terms of Article 24 (6) of the Articles of Association of the Company

Commercial Credit and Finance PLC Annual Report 2019/2020238
Notes

Commercial Credit and Finance PLC Annual Report 2019/20 239
Form of Proxy
I/We the undersigned
of
being a member/members of Commercial Credit and Finance PLC do
hereby appoint of
whom failing
MR. E D P SOOSAIPILLAI whom failing, MR. R S EGODAGE whom failing, MRS. G R EGODAGE whom failing, MR. K D VANDER WEELE, whom failing MR. P T FISHER, whom failing, MR. R CASIE CHITTY, whom failing, MR. BORIS ZSCHORSCH, whom failing, MR. LASANTHA WICKRAMASINGHE, whom failing, MS. TAMARA PAKTSUN as my/our Proxy to represent me/us and ………………. to vote on my/our behalf at the THIRTY SEVENTH ANNUAL GENERAL MEETING of the Company to be held on 28 September 2020 and at any adjournment thereof, and at every poll which may be taken in consequence thereof. I /We the undersigned hereby authorise my/our proxy to vote on my/our behalf in accordance with the preference indicated below :-
1. To receive and consider the Audited Financial Statements for the Year Ended 31st March 2020 and the Reports of the Auditors’ and of the Directors’ thereon
2. Directors
3. To re-appoint the Auditors Messrs. Ernst & Young, Chartered Accountants, to hold office until the conclusion of the next Annual General Meeting and to authorise the Directors to determine their remuneration.
4. To authorise the Directors to determine contributions to charities.
As witness my/our hand this ……………day of …………….................…..Two Thousand and ………………..
Signature of Shareholder
(I) To elect Mrs. Tamara Mu-Lin Lam Paktsun, Director, who retires in terms of Article 24 (2) of the Articles of Association of the Company (II) To re-elect Mr. Roshan Sanjaya Egodage, Director, who retires by rotation in terms of Article 24 (6) of the Articles of Association of the Company (III) To re-elect Mrs. Geya Rasi Egodage, Director, who retires by rotation in terms of Article 24 (6) of the Articles of Association of the Company (IV) To re-elect Mr. Patrick Thomas Fisher, Director, who retires by rotation in terms of Article 24 (6) of the Articles of Association of the Company
Notes:If you wish your Proxy to speak at the Meeting you should insert the words “to speak and” in the place indicated with an asterisk and initial such insertion.
Please indicate with an "x" in the space provided how your Proxy is to vote. If there is in the view of the Proxyholder doubt (by reason of the way in which the instructions contained in the Proxy have been completed) as to the way in which the Proxyholder should vote, the Proxy holder shall vote as he thinks fit.
A Proxy holder need not be a member of the Company
Instructions as to completion appear on the reverse hereof
If you wish your Proxy to speak at the Meeting you should insert the words “to speak and” in the place indicated with an asterisk and initial such insertion.
.
.
.
.
For Against

Form of Proxy [Cont.]
Commercial Credit and Finance PLC Annual Report 2019/2020240
INSTRUCTIONS AS TO COMPLETION
1. To be valid this Form of Proxy must be deposited at the Registered Office of the Company at No.106, Yatinuwara Vidiya, Kandy(Please confirm) not less than 48 hours before the time appointed for the holding of the Meeting.
2. The instrument appointing a Proxy shall in the case of an individual be signed by the appointor or by his Attorney and in the case of a Company/Corporation, the Proxy Form must be executed under its Common Seal, which should be affixed and attested in the manner prescribed by its Articles of Association or other constitutional documents.
3. If the Proxy Form is signed by an Attorney, the relevant Power of Attorney or a notarially certified copy thereof, should also accompany the completed Form of Proxy if it has not already been registered with the Company.
4. The full name and address of the Proxyholder and of the Shareholder appointing the Proxyholder should be entered legibly in the Form of Proxy.

Commercial Credit and Finance PLC Annual Report 2019/20 241
Investor Feedback Form
To request information or submit a comment/query to the Company, please complete the following and return this page to,
Chief Financial OfficerCommercial Credit and Financial PLCNo. 165, Kynsey Road,Colombo 08,Sri Lanka.E-mail: [email protected]
Name :
Permanent Mailing Address :
Contact Numbers :
E-mail :
Name of the Company :(If Applicable)
Designation :(If Applicable)
Company Address :(If Applicable)
Comments/Queries :


Corporate InformationCompany Name Commercial Credit and Finance PLC
Legal FormIncorporated as a Private Limited Liability Company under the Companies Act No. 17 of 1982 on 4 October 1982 and converted to a Public Company on 16 December 1989 and re-registered under the Companies Act No. 07 of 2007 on 8 April 2008.A Registered Finance Company under the Finance Companies Act No. 78 of 1988 and re-registered under the Finance Business Act No. 42 of 2011.A Registered Finance Leasing establishment under the Finance Leasing Act No. 56 of 2000(as amended).The Shares of the Company were listed on Dirisavi Board of the Colombo Stock Exchange on 1 June 2011. The Stock Exchange code for the Company share is “COCR”.
Registration NumberPB 269 PQ
Place of IncorporationKandy, Sri Lanka
Registered OfficeNo. 106, Yatinuwara Veediya, Kandy
Telephone+94 (0) 81 2 000 000
Fax+94 (0) 81 2 234 977
Websitewww.cclk.lk
Board of Directors of The CompanyMr. E. D. P. Soosaipillai – Independent Non-Executive Director (Chairman)Mr. R. S. Egodage - Executive Director (Chief Executive Officer)Mrs. G. R. Egodage - Executive DirectorMr. P. T. Fisher - Non-Executive DirectorMr. K. D. Vander weele - Non-Executive DirectorMr. P. S. R. C Chitty - Executive Director(Chief Executive Officer)Mr. B. B. Zschorsh - Non-Executive DirectorMr. L. L. S. Wickremasinghe – Independent Non-Executive DirectorMs. T.M.L. Paktsun - – Independent Non-Executive Director
Company SecretaryJacey & CompanyNo. 9/5, Thambiah Avenue, Colombo 07
Lawyers of The CompanyJulius & Creasy, Attorneys-at-LawNo. 41, Janadhipathi Mawatha, Colombo 01Company AuditorsErnst & Young, Chartered AccountantsNo. 201, De Saram Place, Colombo 10
Bankers of the CompanyBank of CeylonCargills Bank LimitedCommercial Bank of Ceylon PLCHatton National Bank PLCNational Development Bank PLCNations trust Bank PLCPan Asia Banking Corporation PLCPeople’s BankSampath Bank PLCSeylan Bank PLC
Board Audit CommitteeMr. E. D. P. Soosaipillai (Chairman)Mr. L. L. S. Wickremasinghe Ms. T.M.L. Paktsun
Related Party Transactions Review CommitteeMs. T. M. L. Paktsun (Chairperson)Mr. P. S. R. C. ChittyMr. L. L. S. Wickremasinghe
Integrated Risk Management CommitteeMr. L. L. S. Wickremasinghe (Chairman)Mr. E. D. P. SoosaipillaiMr. R. S. EgodageMr. P. S. R. C. ChittyMs. T.M.L. PaktsunMr. M.A.D.J. DeshapriyaMr. K.L.A. SeneviratneMr. K. A. Buddika
Remuneration CommitteeMr. E. D. P. Soosaipillai (Chairman)Mr. R. S. EgodageMr. B. B. ZschorshMs. T.M.L. Paktsun
Nomination CommitteeMr. E. D. P. Soosaipillai (Chairman)Mr. R. S. EgodageMr. L. L. S. Wickremasinghe
Designed & Developed By:

www.cclk.lkCommercial Credit and Finance PLC
Copyright © 2022 FDOKUMEN