PARTNERSHIPS - CSE
292
PARTNERSHIPS THAT LIGHT UP LIVES UNION ASSURANCE PLC | ANNUAL REPORT 2017
-
Upload
khangminh22 -
Category
Documents
-
view
4 -
download
0
Transcript of PARTNERSHIPS - CSE

PARTNERSHIPSTHAT LIGHT UP LIVESUNION ASSURANCE PLC | ANNUAL REPORT 2017


Light is critical for growth. Insufficient light is known to handicap growth. But what really is light? It is a combination of rays of different wavelengths in the electromagnetic spectrum, and their many vibrant hues can be seen through a prism.
Since our inception three decades ago, Union Assurance has strived to be this light. We have made it our ethos to create big and better things together with our partners. The cornerstone of our success has been these partnerships – which began as a single ray of light and have transformed into something vibrant and beautiful. As we stand at the pinnacle of success as one of the largest insurance providers to the nation, we are proud of everything we have achieved. Our relationships make us strive for higher objectives; give us a sense of invincibility; the strength to overcome challenges and the right spirit to celebrate our triumphs.
The stronger our relationships become, the more we will grow – as individuals, as teams, as partners, and as a company that is ready to reach higher and further.
As we turn a new page in our ‘life book’, we are sharpening our aspiration to become a larger and broader entity, seeking to offer unparalleled products and services that will build more great partnerships that light up lives.
PARTNERSHIPSTHAT LIGHT UP LIVES

UNION ASSURANCE PLC | ANNUAL REPORT 2017
2
OUR INTEGRATED ANNUAL REPORT
Navigating our 2017 ReportUnion Assurance at a Glance
Management Discussion and Analysis
Corporate Governance
Audited Financial Statements and other Information
Online
Our report, with additional updated
information is available on our website:
www.unionassurance.com
Snapshot of the
business, a brief
review of our value
creation model,
Chairman’s message
and CEO's review
A brief review of
operating context,
and in depth review of
capital management
Corporate Governance
disclosure and a brief
review of enterprise
risk management
Detailed analysis of
our financial results,
with audited financial
statements prepared
in accordance with
SLFRSs / LKASs
and supplementary
information
Partnerships That Lights Up Lives We are pleased to present our integrated
annual report in accordance with the
Integrated Reporting Framework of the
International Integrated Reporting Council
(IIRC).
In order to keep the report concise and
pertinent to the year under review, while
being comprehensive and detailed, we
have ensured that the commentaries in
certain sections are limited to a high level
view of the events and progress within
the year.
Standard and Principles
Reporting
Integrated Reporting Framework of
the International Integrated Reporting
Council (IIRC)
Governance, Risk Management and Operations
Laws and Regulations of the Companies
Act No. 7 of 2007
Listing Rules of the Colombo Stock
Exchange (CSE) and subsequent
revisions to date
Regulation of Insurance Industry
Act No. 43 of 2000 and subsequent
amendments to date
Guidelines, Determinations, Rules and
Regulations issued by the Insurance
Regulatory Commission of Sri Lanka
(IRCSL)
Code of Best Practice on Corporate
Governance jointly advocated by the
Securities and Exchange Commission
of Sri Lanka (SEC) and the Institute of
Chartered Accountants of Sri Lanka
(ICASL)
Financial Reporting
Sri Lanka Accounting Standards
(SLFRSs / LKASs) issued by the Institute
of Chartered Accountants of Sri Lanka
(ICASL)
Sustainability and Corporate Social Responsibility Reporting
This report has been prepared in accordance
with GRI Standards: Core Option
Reporting Scope and BoundaryThe Union Assurance Annual Report 2017
is a reflection of the Company’s integrated
approach of management (during the
period 1 January 2017 to 31 December
2017) and strives to deliver a balanced and
relevant report that will bring clarity and
detail of its business during the year under
review.
Material events post this reporting period,
up to the sign off date by the Board of
Directors on 29 March 2018, have been
included, ensuring a more relevant and up
to date report.
Integrated Reporting Guidelines The seven guiding principles in integrated
reporting; strategic focus and future
orientation, connectivity of information,
stakeholder relationships, materiality,
conciseness, reliability and completeness,
consistency and comparability; have been
given due consideration when preparing
and presenting this report.
Contact with Stakeholders
This report has been prepared with
stakeholders expectations in mind in order
to improve transparency, accountability and
disclosure of material information. Feedback
is gathered through stakeholder feedback
forms, a dedicated mail box, one-on-one
meetings and stakeholder engagement fora.
Our Approach to MaterialityThis report provides information that we
believe is of material interest to current
and prospective investors, and to any
other stakeholder who wishes to make
an informed assessment of UA’s ability to
GRI 102-12 | 102-45 | 102-46
102-50 | 102-54
PARTNERSHIPSTHAT LIGHT UP LIVESUNION ASSURANCE PLC | ANNUAL REPORT 2017

3
UNION ASSURANCE PLC | ANNUAL REPORT 2017
UN
ION
AS
SU
RA
NC
E A
T A
GLA
NC
E
Union Assurance at a Glance
6 A Snapshot of the Business
8 Our History
9 Year at a Glance
10 Performance Highlights
14 Chairman’s Message
16 Chief Executive Officer’s Review
22 Our Value Creation Model
Management Discussion and Analysis
38 Our Operating Environment
50 Capital Management Review
51 Financial Capital
65 Social and Relationship Capital
77 Human Capital
89 Intellectual Capital
95 Natural Capital
101 Manufactured Capital
Corporate Governance
106 Board of Directors
108 Executive Committee
109 The Chairman's Statement on
Corporate Governance
110 Corporate Governance Commentary
156 Enterprise Risk Management
Audited Financial Statements and Other Information
169 Annual Report of the Board of Directors
on the Affairs of the Company
175 Actuary's Report
176 Statement of Director's Responsibility
177 Independent Auditors' Report
178 Table of Contents
179 Income Statement
180 Statement of Profit or Loss and Other
Comprehensive Income
181 Statement of Financial Position
182 Statement of Changes in Equity
184 Statement of Cash Flows
186 Notes to the Financial Statements
259 Supplementary Information
259 Memberships Maintained by
the Company
260 Decade at a Glance
262 Independent Assurance Report on
Non - Financial Reporting
264 GRI Content Index
Contents271 Certificate of Carbon Footprint
272 Glossary of Insurance Terms
274 Quarterly Analysis 2017
275 Life Insurance Fund
275 Insurance Revenue Account
275 Statement of Financial Position
276 Statement of Cash Flows
278 Notes to the Statement of
Financial Position
280 Understanding Our Financials
281 Distribution Network
283 Corporate Information
284 Notice of Meeting
285 Proxy Form
287 Stakeholder Feedback Form
generate value over the short, medium and
long term. Rather than providing a simple
listing of ‘material issues’, we have sought to
ensure that all the information in this report
relates to matters affecting value creation at
UA. Snapshot of our business (pages 6 to
7), our value creation model (pages 22 to
23) and capital management review (pages
50 to 103) forms the basis for appreciating
how UA creates value, and for identifying
those issues impacting value. Our ability
to create value is determined by our
operating environment (pages 38 to 47) and
by our response to the resulting risks and
opportunities (pages 48 and 49). Making
an informed assessment of our response
requires an appreciation of our strategy
(pages 24 to 26), our performance (pages
10 to 13), our leadership team (pages 106
to 108), and our governance practices
(pages 105 to 165).
Assurance The information contained in this report has
been reviewed, as applicable, by
The Board of Directors
page 106
The Executive Committee
page 108
The Board Audit and Compliance
Committee
page 119
Independent Auditors confirming
the accuracy of the annual financial
statements
page 177
An independent Actuary confirming the life
fund valuation and liability adequacy
page 175
An independent assurance engagement
for the non-financial information
prepared in accordance with the GRI
Standards: Core Option
page 262
Forward Looking Statements This report contains certain forward-
looking statements with respect to UA’s
financial condition, results, operations and
businesses. These statements and forecasts
involve risk and uncertainty as they relate to
events and depend on circumstances that
may occur in the future. There are various
factors that could cause actual results or
developments to differ materially from those
expressed or implied by these forward -
looking statements.
Contact Person For any inquiries and feedback with
reference to this report please contact
Sherin Cader
Chief Financial Officer
Union Assurance PLC
No 20, St. Michael's Road
Colombo 03.
Tel: 011 2990302


6 A Snapshot of the Business
8 Our History
9 Year at a Glance
10 Performance Highlights
14 Chairman’s Message
16 Chief Executive Officer’s Review
22 Our Value Creation Model
UNION ASSURANCE AT A GLANCE
Guided by a vision, to be the most sought after provider of insurance solutions, driven by values of excellence, caring, innovation, trust and ethics and integrity and nurtured by a business philosophy of sustainable development, we have sped ahead in leaps and bounds. At the heart of this endeavour lie our partnerships…. Partnerships that light up lives.

UNION ASSURANCE PLC | ANNUAL REPORT 2017
A SNAPSHOT OF THE BUSINESS
Key Elements Operating Footprint Our Key Products
Rs.10.1BnRevenue [ 22% YOY ]
14%Market Share [ 112 basis points YOY ]
Rs. 3.8 BnOperating Profit [ 190% YoY ]
3rdLargest New Business Producer in the Industry [ 25% YoY ]
Rs. 67.92Earning Per Share [ 205% YoY ]
Rs.18.00Dividend Per Share [ 71% YoY ]
Rs. 36.8 BnAssets Under Management [ 19% YoY ]
Rs. 2.7 BnBenefits and Claims Paid [ 75% YoY ]
352%Capital Adequacy Ratio [ 2016 - 411% ]
208Community Programmes [ 49% YoY ]
4,808Work Force [ 1% YoY ]
Northern
Central
Eastern
Uva
North Central
North Western
Western
Sabaragamuwa
Southern
Protection
Union Advantage
A life protection insurance
product that can cater to
the needs of all customers.
Family Healthcare
Union Smart Health+
A comprehensive medical
expenses reimbursement
rider benefit which can be
added to the Advantage Plan.
The benefit also provides a
“cashless card” for hassle
free hospital bill payment and
treatment within Sri Lanka,
India, Thailand, Singapore
and Malaysia.
Pension / Retirement
Union Pension Advantage
An universal life product that
builds a fund for retirement with
regular premium remittances up
to desired retirement age.
Locations[ Excluding Virtual Locations ]
97+
North Central Province
08
744,764
471
Northern Province
08
906,893
369
Eastern Province
06
339,780
79
Sabaragamuwa Province
10
687,564
291
Western Province
26
3,805,709
965
Central Province
09
698,215
754
Uva Province
06
397,938
273
North Western Province
12
1,531,674
238
Southern Province
12
1,005,093
562
GRI 102-4
Number of
Branches
GWP
(Rs. '000)
Number of
Agents
Investment and Savings
Union Super Investor
An universal life product with
short - term (5 years) premium
payment to boost an investment
for future savings need.
6
* Excluding one - off surplus transfer of Rs. 3.4 billion in 2017
*
*

UNION ASSURANCE PLC | ANNUAL REPORT 2017
Ownership Structure
John Keells Group
Union Assurance PLC
Fairfirst Insurance Ltd.
KKRREESTSSKREST
Transportation
Leisure
Property
Consumer Food and Retail
Financial Services
Information Technology
Other
John Keells Holdings PLC (JKH)JKH is one of the largest listed firms on the Colombo Stock Exchange, with business interests in
Transportation, Leisure, Property, Consumer Foods and Retail, Financial Services, Information
Technology and Plantations among others.
The Group’s investment philosophy is based on a positive outlook, bold approach, commitment to delivery,
and flexibility to change. JKH is also committed to maintaining integrity, ethical dealings, sustainable
development, and greater social responsibility in a multi-stakeholder context. JKH is a full member of the
World Economic Forum and a member of the UN Global Compact. JKH has offices and businesses located
across Sri Lanka, India, and the Maldives.
Union Assurance PLC (UA)UA is a primary brand under the financial services sector of John Keells Group.
John Keells Holdings PLC is the main shareholder of the Company. UA contributed
6% to the Group profits, 4% to the Group operating cash flow and 36% Return on
Equity in 2016.
Fairfirst Insurance LimitedFairfirst is the amalgamated entity of the former Union Assurance General Limited
and the former Asian Alliance General Insurance Limited. Fairfirst is in non - life
insurance business and has 11% market share.
7
UN
ION
AS
SU
RA
NC
E A
T A
GLA
NC
E
93.79%
22%
A summary of the John Keells industry groups, sectors and primary brands are given below;

UNION ASSURANCE PLC | ANNUAL REPORT 2017
8
OUR HISTORY
1988
2000
2005
2007
2009
2015
1994
2003
2006
2008
2011
Union Assurance formed.
Listed on the Colombo Stock Exchange and
commences operations.
Life fund exceeded Rs. 1 billion.
Invested Rs. 80 million to upgrade computer system.
In the aftermath of the tsunami, UA settled
over 280 tsunami related liable non life and life
insurance claims.
Entered the 20th year of operations with the life
fund crossing Rs. 6 billion mark.
John Keells Holdings PLC gained 81% control of UA.
Implemented a web based sales force management
system for life business.
UA Brand was repositioned on a platform of Trust.
Expanded bancassurance distribution channel.
Segregates life and non - life businesses and divested
78% of the non - life business to Fairfax Asia Limited.
Completed construction of Union Assurance Centre at
No 20, St. Michael's Road, Colombo 3.
Opened Union Assurance Centre in Kurunegala.
Opened fully fledged motor centre.
First insurance company to launch fully integrated and
automated sms supported service facility for motor claims.
Launched 'Union Pay Easy', the country's first
automated payment system.
Launched web based motor insurance policy,
enabling customers to print their motor insurance
certificate 24 x 7 x 365.
Launched the 1st trilingual website in the insurance industry.
Implemented SAP finance module to integrate core
business activities with financial reporting.
Launched an e-learning system in line with international
best practice.

9
UNION ASSURANCE PLC | ANNUAL REPORT 2017
UN
ION
AS
SU
RA
NC
E A
T A
GLA
NC
EYEAR AT A GLANCE
January Launched 'GOYO' an App based
personal health advisor that provides
rewards to customers for achieving
fitness goals.
February Adjudged the winner in the Finance and
Insurance Sector for the 9th consecutive
year at the Sustainability Reporting
Awards conducted by the Association of
Chartered Certified Accountants (ACCA).
March Conducted the second 'Women’s Day'
recruitment campaign.
Launched 'Union Pension Advantage',
an universal life product that builds a
fund for retirement with regular premium
remittances up to desired retirement age.
April Launched e-consultant project
targeting housewives and higher
education students.
2017
June Successfully concluded first ever offshore
Annual Award ceremony in Kuala Lumpur,
Malaysia.
Recognised for the 5th consecutive year as
a great place to work in Sri Lanka by the
Great Place to Work ® Institute.
July 'Union Smart Health' was adjudged
the winner for product innovation at the
Fintalekt Insurance awards.
Acknowledged with the Global Master
Brand Status for the period of 2017/18
at the first ever Master Brand Award
ceremony organized by CMO Asia hosted
by World Marketing Congress.
Received the prestigious ‘Best Employer
Brand Award’ along with the 'Dream
Employer of the Year' award, at the HR
awards organized by the World HRD
Congress.
August Opened Pettah Branch at No: 3, Sea
Street, Colombo 11
September Participated in the industry awareness
campaign to highlight the value of life
insurance to the general public.
October Launched a special brand awareness
programme throughout the island.
November Reinforced Diabetes Awareness
throughout the island under 'Union
Manushyathwaya'.
Won John Keells Chairman’s Awards for
disruptive innovation and sustainability
practices.
December Our business practices were recognised
by the National Chamber of Commerce at
the National Business Excellence Awards
receiving a silver award for excellence in
corporate governance and a silver award
in the insurance category.
Our financial reporting practices were
recognised by the Institute of Chartered
Accountants of Sri Lanka, with the 2016
annual report receiving a Silver Award
in the Insurance Category and a Silver
Award for best Corporate Governance
Disclosures.
Crossed Rs. 10 Bn gross written
premiums.
People development practices were
recognised at the SLITAD People
Development Awards for the 2nd
consecutive time by being the only
company to receive the Platinum Award
for People Development.

UNION ASSURANCE PLC | ANNUAL REPORT 2017
10
PERFORMANCE HIGHLIGHTS
Financial Capital Social and Relationship Capital Human Capital
1 Excluding one - off surplus transfer of Rs. 3.4 billion in 2017
UA recorded the highest new business
premium growth among its peers.
0
5
10
15
20
Market Share and New BusinessPremium Market Share Market Share%
20172016201520142013
14
%
17
%
15
%
15
%16
%
15
%
13
%
13
%
13
%
13
%
Market Share New Business Premium
Market Share
0
1,500
3,000
4,500
6,000
7,500
9,000
10,500
12,000
GWPRs. Mn
Operating
Profit
Rs. Mn
20172016201520142013
Revenue / Operating Profit
0
500
1,000
1,500
2,000
2,500
3,000
3,500
4,000
GWP Operating Profit 1
0
10
20
30
40
50
60
70
Return on Equity and Dividend Payout Ratio
ROE % DPR %
20172016201520142013
64
36
23
16
22
0
10
20
30
40
50
60
70
ROE 1 Dividend Payout Ratio (DPR)
0
200
400
600
800
1,000
Status of Customer Complaints
No.
201720162015
93
8
50
3
52
8
82
2
19
4
46
7
11
6
30
9
61
Received Resolved In Progress
0
20
40
60
80
100
120
0
4
8
12
16
20
24
No. ofrecruits Attrition
20172016201520142013
Attrition Rate & New Employees Recruited
New Employees
Recruited
Attrition Rate
10
13
16
19
22
25
%
2017
Q1
2017
Q2
2017
Q3
2017
Q4
20
16
Q1
20
16
Q2
20
16
Q3
20
16
Q4
Productivity
Movement in higher advisor income category
(5)
0
5
10
15
20
25
Growth %
20172016201520142013
New Business Premium Growth
25
%
22
%
23
%
12
%
(4%
)
0
1,000
2,000
3,000
4,000
5,000
6,000
7,000
8,000
Hours
Investment
Rs.‘000
Assis
tan
tM
an
ag
er
& M
an
ag
er
Se
nio
rM
an
ag
er
Exe
cu
tive
No
n -
Exe
cu
tive
2,9
41
5,2
96
6,6
29
4,5
92
1,8
74
3,4
59
2,2
02
95
2
Total Training Hours
0
1,000
2,000
3,000
4,000
5,000
6,000
7,000
8,000
2016 2017 Total Investment
0
200,000
400,000
600,000
800,000
1,000,000No. of lives
Number of Lives Touched throughCSR Programmes
201720162015
DiabetesThalassemia
Dengue

11
UNION ASSURANCE PLC | ANNUAL REPORT 2017
UN
ION
AS
SU
RA
NC
E A
T A
GLA
NC
E
Intellectual Capital Natural Capital Manufactured Capital
0.0
0.5
1.0
1.5
2.0
2.5
Brand Value
Rs. Bn
20172016201520142013
1.8
0
1.2
3
2.1
52.3
6
2.0
7
Brand values include non life insurance
business upto 2015.
40
50
60
70
80
90
100
Digital
proposals %
Auto
underwriting %
Ma
y
Ju
n
Ju
l
Au
g
Sep
Oc
t
No
v
De
c
Ma
r
Fe
b
Ja
n
Digital Proposal and Auto Underwriting
40
50
60
70
80
90
100
Digital Proposal Auto Underwriting
0
10
20
30
40
50
60
70
80
Electricity and Water
Gigajoules Litres
2017201620152014
22,1
21
64
.74
78
.74
18,2
446
9.7
1 24,1
16
79
.33
20
,25
8
Electricity Water
0
5,000
10,000
15,000
20,000
25,000
0
200
400
600
800
1,000
Trees Saved
No.
20172016201520142013
86
8
54
4
18
2
50
4
39
4
Rs. Mn
201720162014 2015
Investment in Manufactured Capital
0
10
20
30
40
50
60
70
80
40
71
53
53
0
20
40
60
80
100
No.
2017201620152014
Employee Know How / Award Winners
MDRT
LIMRA International
Award for Productivity
LIMRA International
Quality Award
0
20
40
60
80
100
120
No.
20172015 2016
Number of Locations
Business
Development Offices
Branches
Regional Offices
0
500
1,000
1,500
2,000
Carbon Footprint
Scope 1 - Direct GHG emissions
Scope 2 - Energy indirect GHG emissions
Scope 3 - Other indirect emissions
TonnesCo
2e
201720162015
0
1,250
2,500
3,750
5,000
30,000
40,000
50,000
Investment in Property, Plant and Equipment
Rs. ‘000
Co
mp
ute
re
qu
ipm
en
t
Fu
rnitu
rea
nd
fitt
ing
s
Pla
nt
ma
ch
ine
ry,
Offic
ee
qu
ipm
en
t
6,0
09
1,2
722,2
42
41
,22
6
5,7
65
36
,84
3
2016 2017

UNION ASSURANCE PLC | ANNUAL REPORT 2017
12
PERFORMANCE HIGHLIGHTS
Financial Highlights
2017 2016 % 2015
Results of the year
Revenue Rs. million 10,118 8,271 22 6,964
Paid in benefits and claims to policyholders Rs. million 2,674 1,524 75 1,448
Profit from operations Rs. million 7,196 1,313 448 1,039
Profit from operations 1 Rs. million 3,814 1,313 190 1,039
Profit after tax Rs. million 7,384 1,313 463 2,347
Profit after tax 1, 2 Rs. million 4,002 1,313 205 1,125
Earnings per share Rs. 125.31 22.27 463 31.20
Recurrent earnings per share 1, 2 Rs. 67.92 22.27 205 14.96
Dividends Rs. million 1,061 619 71 501
Average annual premium per policy (Rs.) Rs. 52,272 48,312 8 44,482
Persistency - Year 1 % 83 76 9 78
- Year 2 % 71 70 1 67
- Year 3 % 67 64 5 59
Investment yield % 12.48 11.56 8 11.36
Earning yield 1, 2 % 50.31 15.57 223 9.07
Total expenses ratio % 74 66 12 70
Return on equity % 93 36 158 68
Recurrent return on equity 1, 2 % 64 36 78 23
Return on assets % 18.8 3.7 408 7.0
Recurrent return on assets 1, 2 % 10.2 3.7 176 3.6
Financial position at year end
Total assets Rs. million 43,067 35,693 21 31,014
Financial investments Rs. million 36,793 30,847 19 26,541
Life fund Rs. million 29,071 30,267 4 26,272
Total shareholder funds Rs. million 11,965 3,866 209 3,465
Net asset per share Rs. 203.04 65.61 209 58.80
Net assets per share excluding restricted regulatory reserve Rs. 145.65 65.61 122 58.80
Market / shareholder information
Market price per share as at 31 December Rs. 135.00 143.00 6 165.00
Highest market value per share Rs. 165.00 167.90 2 200.00
Lowest market value per share Rs. 134.00 127.00 6 150.00
Market capitalisation Rs. million 7,955 8,427 6 9,723
Total shareholder return % 7.0 (9.4) 174 4.6
Price earning ratio 1, 2 times 1.99 6.42 69 5.29
Dividend cover 1, 2 times 3.77 2.12 78 1.76
Dividend per share Rs. 18.00 10.50 71 8.50
Dividend payout / effective dividend rate % 27 47 43 45
Dividend yield % 13.33 5.9 126 3.9
Statutory requirements / ratios
Excess in approved assets Rs. million 1,967 1,856 6 1,723
Capital adequacy ratio (CAR) % 352 411 14 N/A
Solvency ratio times N/A N/A N/A 2.73
1 Excluding one - off surplus transfer of Rs. 3.4 billion in 20172 Excluding gain on disposal of UAG shares in 2015
GRI 102-7

13
UNION ASSURANCE PLC | ANNUAL REPORT 2017
UN
ION
AS
SU
RA
NC
E A
T A
GLA
NC
E
Non-Financial Highlights
Indicator 2017 2016 2015
Financial capital
201-1 Direct economic value added Rs. million 13,841 10,824 9,112
Manufactured capital
Total number of branches Number 97 107 107
Natural capital
302-1 Energy consumption within the organisation Gigajoules 6,474 7,874 6,971
Direct energy consumption per Rs. million of revenue Gigajoules 0.65 0.95 1.00
302-3 Energy intensity (in Gigajoules) - Per area 0.02 0.03 0.03
- Per full time
employees 1.35 1.61 1.41
- Per branch 67 74 65
303-1 Total water withdrawal Cubic meters 20,258 24,116 18,244
Water withdrawal (m3) per Rs. million of revenue Cubic meters 2.00 2.92 2.62
303-3 Percentage and total volume of water recycled and reused % 0.65 1 1
305-1 Direct greenhouse gas (ghg) emissions (scope 1) tonnes CO2e 85.35 3.95 1.56
305-2 Energy indirect greenhouse gas (ghg) emissions (scope 2) tonnes CO2e 833 1,071 953
305-3 Other indirect greenhouse gas (ghg) emissions (scope 3) tonnes CO2e 376 567 883
305-4 Greenhouse gas (ghg) emissions per Rs.1 million of revenue tonnes CO2e 0.13 0.20 0.26
305-5 Total emissions tonnes CO2e 1,295 1,642 1,838
306-2 Weight of waste recycled through 3rd party contractors Kgs 28,010 17,773 30,066
307-1 Significant environmental fines Rs. million Nil Nil Nil
Human capital
201-3 Coverage of organisations defined benefit plan Rs. million 123 108 100
401-1 Total workforce
Permanent cadre Number 529 474 450
Non-Permanent cadre Number 4,279 4,406 4,488
Total number of new employees hired during the reporting period Number 430 434 479
Employee turnover during the period Number 100 72 77
Attrition of new hires (as a percentage of total new hires) % 12 4 9
403-1 Percentage of workforce represented in management worker health and
safety committees % None 3 3
403-2 Number of injuries Number None 32 37
404-1 Training per permanent staff member No of hours 19 38 24
Training per non-permanent staff member No of hours 74 57 48
404-3 Percentage of employees receiving performance reviews % 100 100 100
410-1 Percentage of security personnel trained in the organisation's human rights
policies or procedures % 100 100 100
414-1 Percentage of new suppliers that were screened using human rights criteria % 100 100 100
Social and relationship capital
203-1 Investment in community and infrastructure projects Rs. million 13 7 7
413-1 Community engagement (No of persons impacted)
Dengue awareness programmes Number 272,540 107,139 2,382
Thalassemia awareness programmes Number 24,354 14,761 11,975
Diabetes prevention awareness programmes 1 Number 603,297 1,169 200,839
Health awareness campaigns Count 210 140 89
Staff volunteerism Count 942 2,014 240
419-1 Significant fines for violation of laws / regulations Rs. million Nil Nil Nil
417-3 Voluntary standards relating to advertising Group policy / Internal code of conduct
417-3 Number of customer complaints received Number 528 503 938
Number of customer complaints resolved Number 467 194 822
Disputes referred to Insurance ombudsman
Number
Referred 18
Settled 18
Referred 26
Settled 7
Referred 29
Settled 16
419-1 Significant fines for product / service issues Rs. million Nil Nil Nil
Intellectual capital
Brand value 2 Rs. billion 1.80 1.23 2.15
1 Conducted an island wide awareness campaign together with the launch of CSR week in 2015
2 Brand values in 2016 and 2017 represent only life insurance business. Previous values include non life insurance business as well
GRI 102-7 | 201-3 | 203-1 | 303-3 | 403-1
403-2 | 404-3 | 413-1 | 414-1 | 419-1

UNION ASSURANCE PLC | ANNUAL REPORT 2017
14
CHAIRMAN’S MESSAGE
We have marked our 30th anniversary by achieving an outstanding business performance that is sure to light up the many stakeholders we partner. We are delighted to have delivered on our promise of value creation in real terms, reaffirming the fact that our stakeholders are the focus of all that we do.
Dear Stakeholders,
On behalf of the Board of Directors, it gives
me great pleasure to present the Integrated
Annual Report of Union Assurance PLC
(UA) for the financial year ended 31
December 2017.
Business PerformanceUA has performed exceptionally well
in terms of revenue and profits in 2017.
Insurance premiums increased by 22%
during the year to Rs. 10.1 billion. Growth
was primarily due to fundamental changes
in the sales force compensation and
recognition structure, reforms in agency
and bancassurance channels, enhanced
customer service, and introduction of
innovative life insurance solutions to cater
to the changing needs of customers. 2017
was a landmark year for the Company as
we celebrated 30 years of operations by
increasing our market share to 14% and
ranking as the 3rd largest new business
producer in the industry while recording the
highest new business growth among peers.
The Company’s profit after tax of Rs. 7.4 billion
was a 463% increase over the profit after tax
of Rs. 1.3 billion recorded in the previous year.
This profit after tax included a one off surplus
transfer of Rs. 3.4 billion. Claims and benefit
payments increased compared to previous
year mainly due to the increase in maturity
and surrender payouts. Further, UA improved
its’ operating earnings by growing the pool of
funds under management.
Life Insurance IndustryThe life insurance industry in Sri Lanka
grew by 13% in 2017 as against an 18%
growth in 2016. This growth was attributable
to factors such as increased awareness
regarding the benefits of life insurance,
introduction of new life insurance products
and enhanced customer service.
As per the latest figures published by the
Insurance Regulatory Commission of Sri
Lanka (IRCSL), the life insurance industry
has recorded a CAGR of 13% over the
past five years up to 2016. Life insurance
penetration in Sri Lanka is significantly low
compared to regional markets, and this
growth momentum is expected to continue
as a result of favourable demographic
trends and rising disposable incomes.
Further, as per statistics published by the
IRCSL, only 36% of the working population
have some form of insurance (34% in 2015).
Company’s Strength and Stability UA’s Capital Adequacy Ratio (CAR) under
the Risk Based Capital (RBC) regime was
352% which is significantly higher than the
minimum required by regulatory authorities.
This reflects the strong financial stability of
the Company which will enable UA to deliver
sustainable value to all stakeholders in the
short term as well as on a long term basis.
Our insurance liabilities are backed by
reinsurers who have credit ratings of ‘A+’ or
above from international rating agencies.
Regulatory Framework and Government PoliciesWe work closely with the Insurance
Regulatory Commission of Sri Lanka to
implement regulations that enable industry
growth while safeguarding policyholder
interests. As per the new Inland Revenue
Act No. 24 of 2017 which will be effective
from 1 April 2018, life insurance companies
will be taxed on the profits they generate.
We believe, that this is a mutually beneficial
arrangement for all stakeholders involved in
the life insurance industry.
Corporate GovernanceI am pleased to state that UA is compliant
with the Code of Best Practice on Corporate
Governance issued jointly by the Securities
and Exchange Commission of Sri Lanka and
the Institute of Chartered Accountants of Sri
Lanka. Further details can be found in the
Corporate Governance Commentary section
of this report.
EmployeesThe value creation process of the Company
has been built around our loyal and
committed employees, and I wish to pay
tribute to them for their contribution and
commitment. We continue to engage and
encourage our employees to perform to the
best of their ability through a performance
oriented culture founded on ethical and
transparent behaviour. The Corporate
Governance Commentary and the Human
Capital section of this Report explain in
further detail the best practices, policies
and procedures that are in place to ensure
that Union Assurance is a 'Great Place
to Work'.
Sustainability This Report has been prepared in
accordance with the GRI Standards and has
successfully completed the GRI Materiality
Disclosure Service. The report contains the
overall sustainability strategy, framework
and performance of the Company and an
independent assurance report has been
provided by KPMG Sri Lanka.

15
UNION ASSURANCE PLC | ANNUAL REPORT 2017
UN
ION
AS
SU
RA
NC
E A
T A
GLA
NC
E
I am pleased to announce that this year too
we have made significant progress on the
objectives stated in last year’s Integrated Annual
Report. During the year, the Company’s carbon
footprint decreased by 21% to 1,295 tonnes,
due to various energy saving and emission
management initiatives which have been
commissioned over the years. Our activities
to add value to customers, employees, field
staff, suppliers, community and shareholders
is reflected in the Management Discussion and
Analysis section of this report.
Corporate Social ResponsibilityThe Company’s CSR initiatives are centred
on one strongly championed objective
- creating healthy communities around
the country - as there is a strong linkage
between this objective and UA’s life
insurance operations. Accordingly, we work
together with the Ministry of Health to create
awareness regarding critical health concerns
such as dengue, diabetes and thalassaemia.
During 2017, with the support of the
Public Health Department of the Colombo
Municipal Council and the Public Health
Inspector, UA successfully conducted a total
of 52 dengue awareness campaigns, over
108 thalassaemia awareness programmes
and 48 diabetes prevention programmes
impacting over 900,000 people.
Business Outlook and StrategiesThe outlook for the life insurance industry is
extremely positive. Rising consumer wealth
as a result of economic growth and an ageing
population will drive demand for protection
and retirement solutions which life insurers
are well positioned to provide. Campaigns
conducted by all industry stakeholders to
raise awareness regarding the benefits and
value of life insurance will further help to
improve penetration levels. UA continues
to make significant investments in multiple
digital initiatives and is well positioned to
capitalise on these opportunities.
The life insurance industry is catching up
with the digital revolution. In the next few
years, digital tools such as big data and
advanced analytics will enable a wide range
of new business opportunities leading to
improved marketing, underwriting and
customer retention. UA has already set up
an analytics centre of excellence and will
continue to invest in people and technology
to improve business results.
UA will leverage the significant investments
made in people, brand, service, products
and technology to target both retail and
corporate customer segments. The agency
channel is expected to generate a significant
share of our revenue and profit and we will
continue to focus on quality and consistent
delivery from this channel. We also aim
to grow the bancassurance channel by
investing in strategic partnerships and further
improving our service delivery, product
offerings and distribution capabilities.
We will continue to focus our product
development initiatives on protection,
retirement and health solutions as these
remain significant needs in the market and
there is much scope to offer innovative
solutions to meet this demand. UA has
invested in a new IT platform which will
enable us to develop and launch new
products across multiple distribution channels
in a speedy and cost effective manner. The
system is expected to go - live in mid 2018.
DividendsThe Board declared a first and final
dividend of Rs. 18.00 per share compared
to the dividend of Rs. 10.50 per share
declared for 2016. The total pay - out was
Rs. 1,061 million compared to Rs. 619
million in the previous financial year.
AchievementsUA continues to garner national and regional
recognition for our sustainability, corporate
governance, financial reporting, HR
practices and overall business operations.
We were adjudged winners in the Finance
and Insurance sector at the Sustainability
Awards conducted by the Association of
Chartered Certified Accountants (ACCA).
This was the 9th time the Company’s
activities were recognised at this prestigious
event in the last 10 years.
Our reporting practices were also
recognised by the Institute of Chartered
Accountants of Sri Lanka, with the 2016
annual report receiving a silver award in the
insurance category and a silver award for
best corporate governance disclosure.
We were recognised as a 'Great Place to Work'
for the 5th consecutive year by the Great Place
to Work Institute reflecting the consistent
emphasis UA has placed on attracting and
retaining the best talent in the industry.
Our excellent business practices were
recognised by the National Chamber
of Commerce with silver awards in the
insurance category and for excellence in
corporate governance.
Union Smart Health Rider was recognised
as the most innovative product at the
Fintelekt Insurance Awards (Sri Lanka
Insurance Industry Awards).
UA received a platinum award for people
development at the SLITAD people
development awards. UA is the only
company to win the platinum award for two
years in a row.
ConclusionOn behalf of the Board, I would like to
thank Mr. Ajit Gunewardene for his valuable
contribution to the Company over the past
25 years as a Board member and for his
excellent leadership as the Chairman of UA
since January 2006.
We place on record our appreciation to
the former Chairperson, Director General
and their team at the Insurance Regulatory
Commission of Sri Lanka for the consultative
approach they continue to adopt in
balancing the interests of all stakeholders
involved in this dynamic industry.
On behalf of the Board, we also appreciate
the efforts of the Insurance Ombudsman
and his untiring commitment to build public
confidence and trust by providing an efficient,
independent grievance handling mechanism.
I also take this opportunity to thank the Chief
Executive Officer, the management team and
the UA staff for their continuing commitment
to achieving the Company’s objectives.
My fellow Directors have played a pivotal
role in the success of UA, and deserve my
gratitude.
I also take this opportunity to thank all our
stakeholders for being an integral part of
UA’s exciting journey.
Susantha Ratnayake
Chairman
29 March 2018
UNION ASSURANCE PLC | ANNUAL REPORT 2017
16
CHIEF EXECUTIVE OFFICER’S REVIEW
GRI 102-14
We celebrate 30 years of exceptional operations by increasing our market share and crossing Rs. 10 Billion in Gross Written Premiums. We have set a target to become the largest digital insurer in Sri Lanka delivering sustainable value to all stakeholders.
Strategy and FocusWe aim to be the number one digital life
insurer in Sri Lanka by developing the most
productive agency and bancassurance
sales channels and leveraging digital
resources to improve operational
excellence, customer service and
engagement. We are the 3rd largest new
business producer this year and recorded
the highest new business growth among our
peers. Moreover we increased our market
share in the life insurance industry by 1%
during the year to 14%.
For over 30 years, we have delivered the
finest in customer friendly products and
services, designed to enhance speed,
access and convenience. Our focus is always
to serve our stakeholders with better value
than anyone else. Union Assurance (UA) was
recognised as the most respected entity in the
insurance industry in the LMD ranking of Most
Respected Entities 2017. We were the only
insurance company ranking within the top 50.
Life Insurance IndustryYear 2017 was another successful year for
the life insurance industry which recorded
a 13% growth in gross written premiums in
a challenging environment. Life insurance
business generated premiums amounting to
Rs. 72 billion in 2017 compared with
Rs. 64 billion recorded in 2016. This growth
was mainly due to increased awareness,
introduction of new products catering to
retirement and health needs and enhanced
customer service.
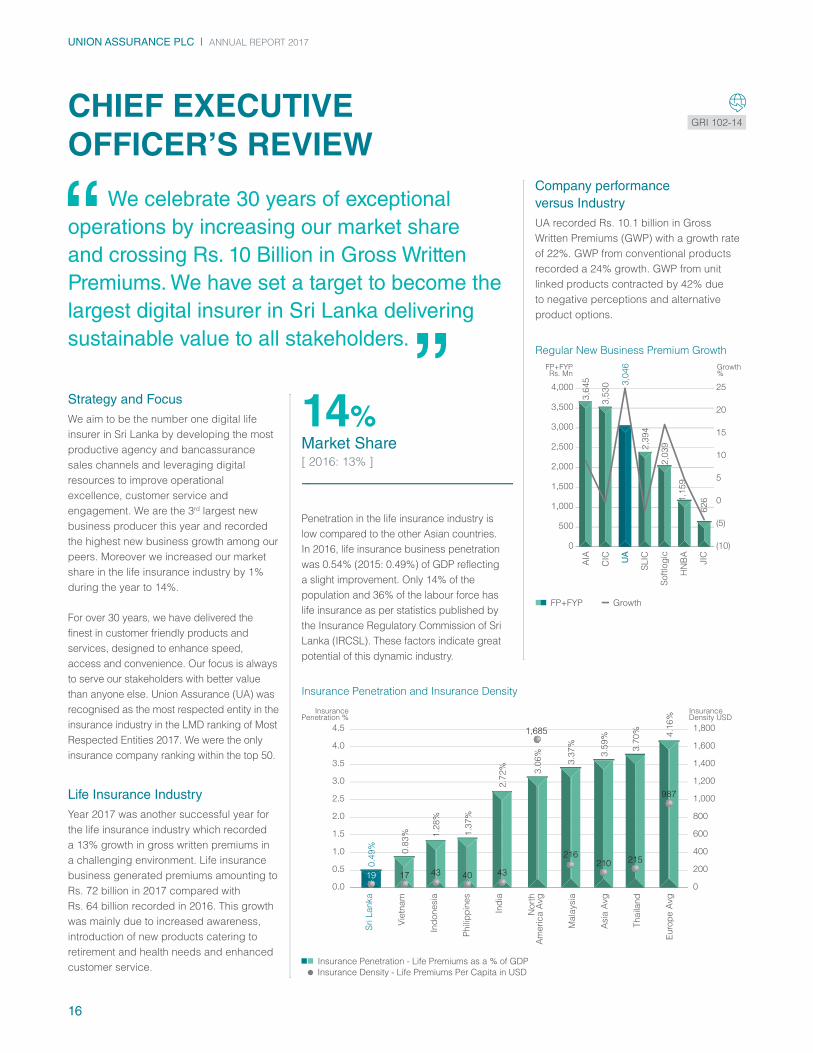
Penetration in the life insurance industry is
low compared to the other Asian countries.
In 2016, life insurance business penetration
was 0.54% (2015: 0.49%) of GDP reflecting
a slight improvement. Only 14% of the
population and 36% of the labour force has
life insurance as per statistics published by
the Insurance Regulatory Commission of Sri
Lanka (IRCSL). These factors indicate great
potential of this dynamic industry.
0.0
0.5
1.0
1.5
2.0
2.5
3.0
3.5
4.0
4.5
Insurance Penetration and Insurance Density
InsurancePenetration %
InsuranceDensity USD
Sri L
an
ka
Vie
tna
m
Ind
on
esia
Ph
ilip
pin
es
Ind
ia
Nort
hA
me
ric
a A
vg
Ma
laysia
Asia
Avg
Th
aila
nd
Eu
rop
e A
vg
0.4
9% 0.8
3% 1.2
8%
1.3
7%
2.7
2% 3.0
6%
3.3
7%
3.5
9%
1,685
987
215210216
43431719 40
3.7
0% 4.1
6%
Insurance Penetration - Life Premiums as a % of GDP
Insurance Density - Life Premiums Per Capita in USD
0
200
400
600
800
1,000
1,200
1,400
1,600
1,800
FP+FYPRs. Mn
Growth%
AIA
CIC UA
SL
IC
So
ftlo
gic
HN
BA
JIC
62
6
3,0
46
3,5
30
3,6
45
2,3
94
2,0
39
1,1
59
Regular New Business Premium Growth
0
500
1,000
1,500
2,000
2,500
3,000
3,500
4,000
(10)
(5)
0
5
10
15
20
25
FP+FYP Growth
Company performance versus Industry UA recorded Rs. 10.1 billion in Gross
Written Premiums (GWP) with a growth rate
of 22%. GWP from conventional products
recorded a 24% growth. GWP from unit
linked products contracted by 42% due
to negative perceptions and alternative
product options.
14%Market Share [ 2016: 13% ]

17
UNION ASSURANCE PLC | ANNUAL REPORT 2017
UN
ION
AS
SU
RA
NC
E A
T A
GLA
NC
E
GRI 102-14
22%YoY Growth
Gross Written Premium Growth
25%YoY Growth
New Business Regular Premium growth
14%Market Share
3New Life Insurance Solutions
Our dividend based products contributes
mainly to conventional GWP. UA continued
to declare above market dividend rates to
policyholders.
0
2
4
6
8
10
12
Rate %
2017
2016
2015
2014
2013
10
.23
%9
.5%
8.0
%
8.0
%
11
.5%
11
.75
%
6.6
9%
5.9
9%
8.0
%1
0.5
%7
.1%
9.5
%
9.0
1%
10
.25
%1
0%
Annual Dividend Rate
Declared
Dividend Rate
Average Market
Interest Rate *
Minimum Dividend
Rate Guaranteed
*Calculated based on the Average Weighted
Deposit Rate of commercial banks for the
corresponding year (Source: Central Bank)
0
5
10
15
20
25
Growth %
2017
2016
2015
2014
2013
2012
7%
9.1
%
8%
8%
11
%14
%
3.4
%
4.9
%7
%
17
%4
.8%
18
%1
9%
4.4
%
20
%
3.1
%2
2%
13
%
UA Growth vs Industry Growth
UA GrowthGDP Growth
Industry Growth
New Customer PropositionsUA launched 'Union Pension Advantage',
targeting retirement needs and 'Union
Single Premium Advantage' targeting
investment and saving needs of customers.
In January 2018, we launched 'Union Smart
Health Plus', a health rider with overseas
cover, no claim bonus, cashless service,
free fitness tracker, deductible options
and reinstatement benefit (revival benefit)
features. The product caters to all customer
segments including families.
Our unique life insurance propositions are
discussed in the Social and Relationship
Capital section of this report.
PersistencyThere was a significant improvement in
the persistency ratio of both agency and
bancassurance channels. This improvement
is attributable to changes in compensation
structure and improvement in need based
selling as a result of intense training and
development.
We will continue to implement strategies
to improve persistency since it is a key driver
to improve renewal GWP and cash flow.
40
50
60
70
80
90
100
Persistency
%
20172016201520142013
61
%6
9%
64
%7
6%
71
%
57
%6
1%
72
%
70
%
67
%8
3%
59
%6
7%
78
%
Persistency Ratio
Persistency
(12 months)
Persistency
(24 months)
Persistency
(36 months)
Financial Performance UA recorded Rs. 7.4 billion profit after tax in
2017. The normal surplus transfer from Life
fund amounting to Rs. 3.6 billion, one - off
surplus transfer from non - participating
life fund amounting to Rs. 3.4 billion,
Rs. 172 million was generated from the
shareholder portfolio and Rs. 188 million was
accounted as UA’s share of profits from the
general insurance business of Fairfirst. UA
maintained the dividend payout ratio in the
range of 25% to 50%. This indicates both
quality of UA earnings and financial stability.
Investment income recorded a 38%
growth. This is mainly due to increase in
interest rates of government securities in
the first half of the year and net increase in
unrealised gains from equities.
Net insurance benefits and claims paid
increased by 75% mainly due to increase
in maturity and surrender payouts. Maturity
payouts are in line with UA's contractual
obligations and surrenders have increased
due to the challenging economic
environment. Underwriting and net
acquisition cost increased by 28% to Rs.1.8
billion due to increase in GWP and changes
in incentive structure. Other operating,
administrative and selling expenses
increased by 21% to support growth. As a
result of the above life fund decreased by
4% to Rs. 29.1 billion by year end.

UNION ASSURANCE PLC | ANNUAL REPORT 2017
18
CHIEF EXECUTIVE OFFICER’S REVIEWGRI 102-6 | 102-14
Review of Distribution ChannelsThe agency channel grew by 20% during
the year. Growth was delivered through
key changes in leadership, incentive and
recognition structures, enabling the sales
force digitally and aligning learning and
development to recruit and retain high
quality advisors.
The bancassurance channel contributed 9%
of the GWP during the year and recorded a
growth of 53%. This remarkable growth was
achieved through specific changes in the
compensation and organisation structure
of the channel and digitally enabling the
sales force.
Digitisation and Operational ExcellenceUA is committed to a 'digital first' business
model, and invested people and financial
resources in order to achieve the vision
of becoming the largest digital insurer in
Sri Lanka. We are investing over Rs. 800
million to deploy the latest digital platform.
This will enable us to develop and launch
new products across multiple distribution
channels faster and manage policy, claims
and billing in a more efficient and effective
manner. We are also investing heavily in
digital talent. We have a multi - disciplinary
team of experts forming a Digital Centre of
Excellence which has been in operation for
five years. Having access to global best
practices and a close relationship with one
of the leading global experts on digital
insurance have further added value to
this process.
The Company’s ambition is to ensure 100%
digital operation, and the latest statistics in
this regard are as follows;
40
50
60
70
80
90
100
Digital
Proposal %
Auto
Underwritting%
May
Jun
Jul
Au
g
Sep
Oc
t
Nov
De
c
Ma
r
Fe
b
Ja
n
Digital Proposal and Auto Underwriting
40
50
60
70
80
90
100
Digital Proposal Auto Underwriting
Claim SettlementWe have implemented multiple initiatives
to improve the claims settlement period
automating key aspects of the process
including automation of cheque printing.
Regulatory Review The key change during the year is the
change in life insurance company taxation.
Currently life insurance companies are
taxed on “I-E” basis (Investment income –
Management Expenses).
A surplus based income tax method was
included in the new Inland Revenue Bill
which will be effective from 1 April 2018.
As per IRCSL guidelines, UA transferred a
one - off surplus of Rs. 3.4 billion from non -
participating fund to shareholder fund which
is recorded as a restricted regulatory reserve
under equity in the statement of financial
position. Distribution of such reserve is subject
to meeting governance requirements stipulated
by the IRCSL and can only be released upon
receiving approval from the IRCSL.
Strong Portfolio YieldsThe investment of cash flows is carried
out with a long term view in line with the
strategic asset allocation policy of the
Company. Our aim is to effectively and
efficiently utilise cash flows and earn higher
returns by taking acceptable levels of risks
while complying with requirements of
the IRCSL.
In a challenging economic environment, we have recorded a significant increase in investment income as a result of prudent investment strategies and portfolio rebalancing. This has enabled us to declare above market dividend rates to our policyholders.

19
UNION ASSURANCE PLC | ANNUAL REPORT 2017
UN
ION
AS
SU
RA
NC
E A
T A
GLA
NC
E
38%YoY Growth
Investment Income
19%YoY Growth
Investment Portfolio
10.25%Annual Dividend Rate to Policyholders
Strategic RisksThe Company’s key strategic risks and our responses to them are as follows:
Risk Description Company Response
Political uncertainty and inconsistent
economic policies impacting growth.
Consistently deliver best in class insurance products and services that meet customers’
needs with additional value through health and lifestyle benefits.
Recruitment and retention of talent
specifically for distribution related activities.
UA has implemented several initiatives to attract high quality candidates and offers a variety of
training and development programmes to enhance the quality and productivity of the sales force.
Compensation / benefits and rewards and recognition schemes are consistently aligned to
drive individuals to achieve organisation objectives.
Regulatory changes and interventions. UA takes a proactive approach by engaging in direct dialogue with legislators or by
participating in industry level discussions.
The risk is also managed as far as possible through clear contracting with customers that
allows for changes to policy terms in line with changing regulatory requirements.
Read more in the report on the Regulatory review on page 40.
Increasing market share in light of increasing
competition and managing margins due to
upward pressure on cost base.
The Company relies on its culture of customer-centricity and innovation, well established
brand and technical expertise to maintain and grow revenue and margins.
Cost efficiencies and improvements are key focus areas and managed through the annual
budgeting and monthly operating performance review processes.
Reduction in investment yields. Investment committee has devised various investment strategies to increase investment
yields. UA was able to declare an above market dividend rate in 2017.
GRI 102-14
Investment Environment
Yields from short and long term government
securities declined in 2017 to single digit
levels. The corporate debenture market
was subdued in 2017 with speculation of
capital gain taxes and interest income from
debentures becoming liable for income
tax. In line with falling government security
returns, money market yields also declined.
The equity market benefited from foreign
inflows and ASPI improved 2.26% while the
S&PSL20 gained 5.01% providing better
capital gain returns during 2017.
Assets Under Management (AUM)
UA’s Life fund’s assets under management at
the end of 2017 amounted to Rs. 36.8 billion
which is a 19% YoY growth. The life fund was
able to provide a weighted average return of
12.48% in 2017.
0
5,000
10,000
15,000
20,000
25,000
30,000
35,000
40,000
Life AUM Growth
Rs. Mn
20172016201520142013
36
,79
3
26
,54
0
24
,03
8
24
,29
7 30
,84
7

UNION ASSURANCE PLC | ANNUAL REPORT 2017
20
Business Outlook
Life Insurance Penetration
Life insurance is significantly
underpenetrated compared to peer
countries and this provides strong
upside potential.
The Protection Gap
The protection gap is a ticking time bomb
for society. It is defined as the difference
between the protection needed, and the
protection in place, in order to maintain
dependents’ living standards following the
death of the primary breadwinner. The gap
is huge, estimated globally at USD 86 trillion
– or in Asia-Pacific, for example, at as much
as USD 58 trillion.
Closing the protection gap is a real social
need that UA can offer real solutions to.
With growth in incomes, this gap has the
potential to accelerate, creating needs for
customers which UA can offer solutions to.
Demographic Changes
Sri Lanka’s demographic trends of ageing
population, increasing urbanisation and
increase in non-communicable diseases
will create demand for health, pension and
retirement products.
Economic Growth
The growth forecast for Sri Lanka in 2018 is
4.6% due to tight monetary and fiscal policies.
Rising consumer income will create demand
for protection and investment products.
2018 is likely to witness lower rates than
the previous two years, resulting in a
steady pickup in aggregate demand in the
economy. Recovery in the agriculture sector
and lower interest rates are likely to have a
positive impact on consumer spending.
However, the results of local government
elections, in 2018 and the likely actions
policy makers take leading to the 2020 / 21
elections, particularly with regard to fiscal
loosening are key material risks for the
economy and investment outlook.
Technology
The digital revolution is catching up to the
life insurance industry. In the next few years,
digital tools such as big data and advanced
analytics will enable a wide range of new
business opportunities and lead to vast
improvements in marketing, underwriting
and customer retention.
Insurers can increase the number of
touchpoints with customers by coupling
traditional protection products with broader
advice on financial wellness and physical well
- being. Embedding products into a broader
ecosystem of partners who can add value
beyond protection will be key to winning new
customers.
In keeping with this trend, UA has launched
GOYO, a wearable device linked to an App
which works as a personal health advisor
motivating users to achieve personal fitness
targets by offering a multitude of rewards from
an eco system of business partners.
Future Strategies Our future strategies are focused on
becoming the number one digital life
insurance company in Sri Lanka.
We will continue to implement strategies
to transform the agency as customers
prefer to deal with trusted, professional
advisors. We will also focus on growing the
bancassurance channel, which we believe
has strong upside potential with the higher
banking penetration in Sri Lanka.
We will develop products to cater to
changing customer requirements driven by
rising income levels and greater awareness
regarding the benefits of life insurance to
their lifestyles.
We will also focus on developing products
which go beyond the traditional insurance
boundaries by embedding insurance in
to a wider eco system. GOYO is one such
initiative.
Our investment in the IT platform will enable
us to develop and launch new products
across multiple distribution channels in a
speedy and cost effective manner.
We have already digitally enabled our sales
force, streamlined operations to suit a digital
environment and leveraged technology to
increase customer service and engagement
levels. We have established a data analytics
team to support our business strategies
and we will continue to invest on multiple
digital initiatives to achieve our business
objectives.
AppreciationUA is making terrific progress due to the
efforts of our people and the support of
customers, and other stakeholders. Sincere
thanks and appreciation to all involved.
We have ended 2017 on a strong note
and we expect this momentum to continue
to 2018 as well. UA has a strong brand,
reputation for good governance, a
professional team and performance driven
culture. These aspects combined with our
financial strength and customer focus,
positions UA to deliver sustainable value to
all stakeholder in the years to come.
Dirk Pereira
Chief Executive Officer
29 March 2018
GRI 102-14
CHIEF EXECUTIVE OFFICER’S REVIEW

Our value creation model provides the framework for us to win for our partners. This section discusses;
Our Business
Model
Strategy and
Resource Allocation
Sustainability Stakeholder
Engagement
Materiality
OUR VALUE CREATION MODEL
21

UNION ASSURANCE PLC | ANNUAL REPORT 2017
2222
OUR VALUE CREATION MODELOUR BUSINESS MODEL
Input
Value Creation
Vision
Mission
Pages
51 to 64
Ris
ks a
nd O
ppor
tunit
ies
Pages 48 and 49 Strategy and Resource Allocation
Pages 24 to 26
Sustainability
Strategic Objectives
Principle Activities
Sub Activities
Develop Products
Build Distribution
Acquire and Service Customers
FinanceHuman
ResourcesLogistics
Information
Technology
Brand
Management
Invest Prudently
Manage Payouts and
Liabilities
Page 26
Pages 27 to 29
Operating Environment Pages 38 to 49
Page 24
Page 24
Financial and N
on-Financial Highlights Pages 12 and 13
Business
Outl
ook
Pag
e 20
EEEEEEnnnnnnnnnnnnnnttttttteeeeeeeerrrrrrrrppppppppppppppprrrrrrrrrrrrrriiiiiiiiiiiisssssssssseeeeeeeeeee RRRRRRRRRRRRiissskkkkkkk MMMMMMMMMMaaaaaaaaaaaannnnnnnnnnnaaaaaaaaaaagggggggggggeeeeeeeeemmmmmmmmmeeeeeeeeeeennnnnnnnnntttttttttttt PPPPPPPPPPPPPPaaaaaaaaaaaaaaaaaaaaaaaggggggggggggggggeeeeeeeessssssssssssssssss 111111111111111115555555555555566666666666 tttttttttooooooooo 1111111111111166666666555555555555555555
Governance Pages 105 to 155
Financial Capital
Pages
65 to 76
Social & Relationship
Capital
Pages
77 to 88
Human Capital
Pages
89 to 94
Intellectual Capital
Pages
101 to 103
Manufactured Capital
Pages
95 to 100
Natural Capital

23
UNION ASSURANCE PLC | ANNUAL REPORT 2017
UN
ION
AS
SU
RA
NC
E A
T A
GLA
NC
E
23
Output Outcome
Financial Capital
Rs. 10.1 Bn Gross Written Premium
Rs. 7.2 Bn Operating profit
Rs. 18.00 Dividend per share
352% Capital adequacy ratio
Financial Capital
Financial stability
Financial growth
Creation of wealth
Social and Relationship Capital
240,258 Lives covered
3
New propositions for
pension, investment
and health needs
88% Customer complaints
settled within the year
900,191
Lives touched through
Dengue, Thalassemia
and Diabetes
awareness campaigns
Social and Relationship Capital
Creation of wealth
Creation of better customer experience
Human Capital
5th Consecutive year as a
Great Place to Work
33% Increase in top advisor
productivity during
the year
5% Increase in attrition
54 MDRT members
produced
Human Capital
Alignment of workforce with Company vision
Increase profitability through improved productivity
and efficiency
Intellectual Capital
Rs. 1.8 Bn Brand Value
87% Life insurance
proposals received
digitally
91% Auto underwriting
of policies
GOYO Proposition beyond
protection
161,123+ Fan base Largest Facebook fan
base in the industry
Intellectual Capital
Product portfolio to suit ever changing, customer
needs
Better prepared to face disruptive business models
Efficient business operation
Profitability
Natural Capital
2,529 m3 Litres of water saved
868 Number of trees saved
70,246 kwh Energy saved
1,295 tCO2e Carbon footprint
Natural Capital
Brand visibility and reputation
Sustainable communities
Business growth
Manufactured Capital
97+ Locations island wide
1,126 Customer touch points
38,757 Square feet of
training space
Manufactured Capital
Sustainable natural resource utilisation
Bio-diversity preservation
Redeployment

UNION ASSURANCE PLC | ANNUAL REPORT 2017
24
OUR VALUE CREATION MODELSTRATEGY AND RESOURCE ALLOCATION
VisionTo be the most sought after provider of insurance solutions.
MissionTo provide protection, financial security and create wealth for our
customers, adding value to employees, field staff, business partners,
shareholders and the community.
Values
Excellence
Strive for
excellence in
everything we do
be the best we
can be
Innovation
Improving
constantly,
reinventing and
evolving
Caring
Fostering a great
place to work by
supporting each
other to reach our
full potential
Trust
Building strong
relationships
based on
transparency
and convenience
with internal
and external
customers
Ethics and integrity
Doing the right
thing always
GRI 102-16

25
UNION ASSURANCE PLC | ANNUAL REPORT 2017
UN
ION
AS
SU
RA
NC
E A
T A
GLA
NC
E
Our Long Term StrategyA snapshot of our long term strategy is given below;
Our Values Business Model Differentiators
Mis
sion
Str
ateg
ic O
bjec
tives
Vis
ion
Excellence
Caring
Innovation
Trust
Ethics & Integrity Support Services
Ag
ency
Bancassura
nce
Technology
Brand Value
UA is the 3rd largest private sector life insurer in the country and 3rd largest new business producer with a market share of 14%.
UA strategy is guided by its values and is focused on three key areas i.e. agency transformation, bancassurance transformation and
operational excellence. We believe these strategies will differentiate UA and provide a competitive edge over competitors.
Continue to be market leader
in adopting latest, and relevant
technology for superior
customer service.
Uphold values of UA / care
for the environment, foster
sustainable livelihoods in the
communities we operate in.
Inte
llectu
al
Cap
ital
Socia
l and
R
ela
tionship
C
ap
ital
Natu
ral
Cap
ital
Fin
ancia
l C
ap
ital
Key performance indicators are set for monitoring the progress of the strategy and can be categorised into six capitals. In a turbulent
environment, UA continues to review its strategies to align with its vision. Progress on strategy, medium term objectives and long term
objectives are discussed in the capital management review section of the management discussion and analysis section of this report.
Financial
Stability
Grow sales, operating profits
and investment income with
efficient management of
operating expenses. Maintain
healthy capital adequacy ratio
and dividend payout ratio.
Unique Product
Portfolio
Provide right products and
services that customers want
and need at the right price.
Superior
Customer Service
Customers: Provide continuous,
helpful advice that is simple and
easy to understand, be accessible,
respond quickly & efficiently to
queries & claims.
Employees: Best training, career
development, competitive C&B
and a great culture to work in.
Hum
an C
ap
ital
/ M
anufa
ctu
red
C
ap
ital

UNION ASSURANCE PLC | ANNUAL REPORT 2017
26
UA’s short term strategic objectives and progress is outlined in the table below;
Progress on Strategy
CapitalShort Term Strategic
Objectives (2017) Strategies Progress
Financial
Capital
Rs. 10 Bn GWP
Fundamental changes to rewards and recognition structure to
drive aggressive GWP growth
Agency consolidation
Collaboration with bancassurance partners
Achieved GWP of Rs. 10 Bn
ROE over 20%
Fundamental changes to rewards and recognition structure to
drive the aggressive GWP growth
Expense rationalisation
Achieved recurrent ROE of 64%
Social and
Relationship
Capital
2 new product
propositions
Launch products which address demographic trends in
the country
Launch products which serve beyond protection and link with
a whole eco system
Launched
Pension advantage
Investment plus
GOYO
Healthy community
(Touch 500,000 lives)
Drive ambitious targets for CSR platforms (Dengue, Thalassemia
and Diabetes) to achieve meaningful results.
Number of Lives touched:
900,191
Human Capital
GPTW score of 72
Learning and development initiatives focus on improving
capabilities of Agency and Bancassurance sales cadre
Initiatives centred on improving collaboration with employees
Achieved score of 70
Intellectual
Capital
Increase brand
value by 5%
Embed brand into internal systems and stakeholder activities.
Create brand awareness amongst customers through all
activities and communications
Achieved brand value of
Rs. 1.8 Bn (an increase of 46%)
Most respected insurance
company in the LMD ranking
of most respected entities 2017
20% improvement in
productivity
Set up a centralised data analytics unit
Gamify L&D in line with digital road map initiatives
Enforce over 85% digital submissions for 2017
87% of life proposals
submitted digitally
25% of agency force achieved
UA's productivity goals
Natural Capital
5% reduction in
carbon footprint Energy saving and emission management initiatives
Achieved 21% reduction in
carbon footprint
Manufactured
Capital
Optimise Head
Office (HO) and
Branch running cost
(Increase not more
than 10%)
Efficiently manage HO space
Cost reduction strategies such as using energy efficient
equipment and consolidate under performing Business
Development Offices
Implemented a work from
home policy
9% Increase in Head Office
and Branch running costs to
support the growth
Medium Term / Long Term Strategic Objectives
Strategic Objectives (Next 5 Years) Strategies
Become the number 1 digital life
insurer in terms of
Agency channel
Bancassurance channel
Operational excellence
The Company strategy is centred on one
theme which is 'mission ONE – Overcome
challenges and Navigate to be Eminent'.
In 2017, the Company completed a 5 year strategic plan
and the strategies focus on the following key themes.
Agency transformation
Bancassurance transformation
Operations transformation
Resource AllocationResource allocation is driven by the strategies which UA pursues. ROE is the key driver of resource allocation. Significant amount of resources
have been allocated for medium to long term strategies of the Company. The Company strategies are funded principally through internally
generated funds. This requires a serious consideration on factors such as regulatory measures (Capital Adequacy Ratio and Determination 1),
dividend payout ratio and timing of cash flows.
OUR VALUE CREATION MODELSTRATEGY AND RESOURCE ALLOCATION

27
UNION ASSURANCE PLC | ANNUAL REPORT 2017
UN
ION
AS
SU
RA
NC
E A
T A
GLA
NC
EOUR VALUE CREATION MODEL
Sustainability Framework Sustainability is embedded in the Union
Assurance culture. Given the nature of the
business, we believe it is the very purpose
of our existence and is reflected in our
Mission and Corporate Values. Over the
years Union Assurance has committed
towards building a citizenship culture with
the aim of enabling internal and external
stakeholders to form opinions and make
informed decisions. As a result, we have
been able to balance the aspiration of value
creation along with the responsibility of
being a benchmark corporate citizen.
Our road map for building a citizenship culture is based on the following model;
Vision for Sustainability
Sustainability Strategy
Review and Refresh
Operationalisation of Strategy
Reinforcement
Sustainability Approach We strive to improve our performance
throughout the years by obtaining the
support of all the stakeholders. We believe
success can be achieved only if we create
value internally and externally, maintaining
an effective governance system and a
sustainability framework that fulfils the
economic, social and environmental needs
of key stakeholders. Our sustainability
principles mainly consider offering simple
and transparent products that are easy
to access and fairly priced, continuously
embedding environmental, social and
ethical consideration in our core activities
and facilitating better customer service.
Our approach is articulated not just in the
sustainability policy, but also in our HR,
CSR, Energy and Environmental policies.
We believe success can be achieved only if we create value internally and externally, maintaining an effective governance system and a sustainability framework that fulfils the economic, social and environmental needs of key stakeholders. Our approach is articulated not just in the sustainability policy, but also in our HR, CSR, Energy and Environmental policies.
SUSTAINABILITY
Building a Citizenship
Culture

UNION ASSURANCE PLC | ANNUAL REPORT 2017
28
Sustainability Reporting Principles
Sustainability Management Framework
Rev
iew
and
Rev
ise
the
Pro
cess
Quality of Information
Stakeholder Inclusiveness
Identify stakeholders
Responding
to stakeholder
expectations and
interests
Strategies for
Enrichment
of Sustainability
Completeness
Coverage of material
topics and boundaries
sufficient to reflect
significant economic,
environmental and
social impact of UA
Sustainability
Reporting
Materiality
Topics that reflect
significant economic,
environmental and
social impacts
Topics that
substantially influence
the assessment
and decisions of
stakeholders
Management
Approach
Sustainability Context
Presenting UA’s
performance in
wider context of
sustainability
Sustainable
Organisation Structure
Accuracy
Timeliness
Balance
Comparability
Clarity
Reliability
High Quality Reporting
No
Yes
Our Engagement with Strategic Sustainable Development GoalsBased on detailed content of the United Nations' 17 sustainable development goals, Union Assurance has evaluated, chosen and integrated
these sustainable development goals into the enterprise strategic sustainability direction. UA's reporting systems complies with the GRI
standards and Capital Management as listed overleaf together with a summary of achievement during the year.
OUR VALUE CREATION MODELSUSTAINABILITY
Key aspects of our sustainability reporting approach are indicated as below;

29
UNION ASSURANCE PLC | ANNUAL REPORT 2017
UN
ION
AS
SU
RA
NC
E A
T A
GLA
NC
E
Ensuring Gender Equality and Continuously Invest in Developing Skills and Competencies of People
Male:Female ratio in the;
Management is 1.2 : 1
Permanent cadre is 1.3 : 1
Fixed term contract cadre is 1 : 3
Agency cadre is 1 : 1
46 positions filled internally
26 numbers of staff received personal education support
15 children of staff recognised for higher achievement
in education
1,771 permanent and 4,002 field staff received 9,995 and
16,628 hours of training respectively.
207 new suppliers assessed on HR practices
GRI Standards201: Economic Performance Opportunity
203: Indirect Economic Impacts
401: Employment
404: Training and Education
405: Diversity and Equal opportunity
414: Supplier Social Assessment
Pages 265 and 267 to 269
Delivering Sustainable Financial Performance
Achieved GWP of Rs. 10.1Bn
Profits grew by 463%
Provision of employment for 529 permanent
staff, 277 fixed term contract staff and
4,002 agency force.
GRI Standards201: Economic Performance
203: Indirect Economic Impacts
401: Employment
405: Diversity and Equal Opportunity
Pages 265, 267 and 268
Promoting Sound Environmental Practices and Conducting Operations in a Sustainable Manner
132,000 Litres of water recycled and
reused. 16% drop in water usage
227 LED and florescent bulbs safely
disposed
Used 388,678 Kwh of less electricity
compared to last year
20,280 kg of paper collected for recycling
Signed the group pledge to reduce, reuse
and recycle plastic.
Collected 1,330 kg e-waste for recycling
GRI StandardsGRI 302: Energy
GRI 303: Water
GRI 305: Emissions
GRI 306: Effluents and Waste
Pages 265 and 266
Providing a Better Customer Experience and Reach
8 relocated and new branches used
energy efficient lighting
GRI StandardsGRI 201: Economic Performance
GRI 203: Indirect Economic Impacts
Page 265
Creating Healthy Communities in Sri Lanka
66,514 protection, health, savings and investment
products sold.
52 dengue, 108 thalassaemia and 48 diabetes awareness
sessions conducted and funded Rs.12.7 Mn of free diabetes
and thalassaemia tests.
57 staff members on flexi work times, 9 staff members
work from home full time / part time, 23 house wives
/ higher education students work part time as
e-consultants.
GRI Standards203: Indirect Economic Impacts
305: Emissions
306: Effluents and Waste
403: Occupational Health and Safety
Pages 265 to 267
Innovation, Disruption of Business Models and Serving the Needs of an Evolving and Emerging Customers
Partnered with eBao (China) to migrate core system to a
world class platform.
Partnered with Tryonics (Pvt) Limited to digitize all policy
submissions and automatically underwrite policies.
Further development of GOYO product to disrupt traditional
life insurance products.
GRI StandardGRI 203: Indirect Economic Impacts
Page 265
Financial CapitalIntellectual
Capital
Natural Capital
Human Capital
Manufactured Capital
Social and Relationship
Capital
Our Contribution
towards Sustainability Development
Goals

UNION ASSURANCE PLC | ANNUAL REPORT 2017
30
We continue to have dialogues with our stakeholders and are responsive towards their expectations / material issues to ensure the sustainability of our operations.
STAKEHOLDER RELATIONSHIP
OUR VALUE CREATION MODEL
Stakeholder EngagementWe identify stakeholders as entities or
individuals who can be affected by UA’s
activities, products, or services; or whose
actions can affect our ability to implement
strategies to achieve our objectives.
We continue to have dialogues with our
stakeholders and are responsive towards
their expectations / material issues to
ensure the sustainability of our operations.
UA is also mindful of the risk of not meeting
their needs and aspirations and have
mitigation strategies in place to ensure that
there is an unbroken relationship between
the company and its stakeholders.
Stakeholder Identification
In our process to identify key stakeholders
to engage we have used Power, Legitimacy
and Urgency model as developed by
Mitchell, R. K., Agle, B. R. and Wood.
D. J. (1997). Based on the analysis the
Stakeholders have been categorised in to
3 groups as depicted below;
1
Customers
4
Environment
2
Shareholders
5
Employees / Advisors
3
Suppliers and Business Partners
6
Community
7
Government and Regulators
Individual policyholders, corporate
policyholders
Parent, retail and institutional investors
Suppliers of goods and services,
banks, reinsurance partners, financial
intermediaries, business consultants
Environmental authorities
Permanent, fixed term contract employees
and sales advisors
Communities and community based
institutions
Insurance Regulatory Commission, Inland
Revenue Department, Ministry of Finance,
Ministry of Health etc.
Power
Urgency Legitimacy
7
2 3
145
6
GRI 102-40 | 102-42

31
UNION ASSURANCE PLC | ANNUAL REPORT 2017
UN
ION
AS
SU
RA
NC
E A
T A
GLA
NC
E
The Stakeholder Engagement Process
We have aligned our stakeholder engagement process to AA 1000 stakeholder engagement standards. It is a generally
applicable, open-source framework for designing, implementing, assessing, and communicating the quality of stakeholder
engagement. The steps of the stakeholder engagement process are as follows;
Planning the Process
Preparing the Resources
Implement
Review and Improve
Determining Stakeholders and Establishing the Process
Profile stakeholders according to their power, legitimacy and urgency and determine
most important individual and groups of stakeholders to engage based on purpose
and scope.
Build Resources and Capacity
Allocate resources required for successful engagement, identify and address
capacity gaps while ensuring continuous contribution by stakeholders.
Implementation of Stakeholder Engagement Process
Implementation and ensuring the stakeholders reasonably engage
with the process.
Monitor and Evaluate Process
Systematically monitor and evaluate the overall quality of the process
and implement corrective actions. Publicly report findings.
Mobilise resources Build capacityIdentify and prepare for
engagement risks
Monitor and evaluate
engagement
Learn and improve and
develop an action planReport on engagement
1
2
3
4
Profiling and
mapping
stakeholders
Determining levels
and methods of engagement
Establish and communicate boundaries
of disclosure
Invite
to engageBrief
Engage /
interact
Document
engagement
and outputs
Develop
action
plan
Communicate
engagement
outputs and
action plan
GRI 102-43

UNION ASSURANCE PLC | ANNUAL REPORT 2017
32
Outcomes of the Stakeholder Engagement Process
(A) Stakeholder Reasons for Engagement
Shareholders
Expectation
Financial performance
Sustainable growth
Healthy liquidity position
Our Commitment
Growing premiums in a sustainable
manner, regular review and update
of corporate governance practices
and implementation of effective
performance management systems
Employees
Expectation
Attractive remuneration
packages
Job security
Personal development and
career progression
A sound social environment
Our Commitment
Transparent recruitment and
promotion process, invest in
learning and development,
developing conducive work
culture and implement competitive
compensation structure
Suppliers and Business Partners
Expectation
Forming long term and reliable
partnerships
Contractual performance
Our Commitment
Maintaining pricing discipline,
effective management of risk and
build sustainable relationships
Community
Expectation
Demand for multi-pronged
community development
initiatives
Our Commitment
Operate through a health
awareness platform and
partnership with national level
institutions to implement various
CSR projects
Environment
Expectation
Demand for sustainable
business practices
Minimise the impact on the
environment
Our Commitment
Regular monitoring of carbon
footprint and leverage technology
to minimise the impact on the
environment
Government and Regulatory Institutes
Expectation
Compliance with rules and
regulations
Our Commitment
Proactive communications with
regulatory institutions, adherence
to all regulations and active
contribution towards developing /
implementing policies impacting the
insurance industry and economy
Customers
Expectation
Long term promise of
protection and wealth
accumulation
Demand for prompt, convenient
and high quality service
Our Commitment
Leverage technology and enhance
knowledge of internal staff and
third party service providers,
regular service standard reviews,
expanding customer service points
and fair pricing of products
OUR VALUE CREATION MODELSTAKEHOLDER RELATIONSHIP
Stakeholders
GRI 102-44

33
UNION ASSURANCE PLC | ANNUAL REPORT 2017
UN
ION
AS
SU
RA
NC
E A
T A
GLA
NC
E
(B) Methods of Engagement
Stakeholder Levels of
Engagement Mode of Engagement Frequency
Customers
Consult Customer satisfaction surveys Monthly
Consult Customer research As and when required
Consult One to one meetingsMonthly and as and when
required
InvolveWelcome calls All new policies issued
Complaint management On going
Passive Corporate website On going
Advocate Social media On going
Passive Media advertisements As and when required
Collaborate Customer get together programmes Annually
Shareholders
Inform Annual report Annually
Inform Interim financial statements Quarterly
Consult Annual and extraordinary general meetingsAGMs annually and EGMs
as and when required
Inform Announcements to CSE As and when required
Inform Media releases and press conferences As and when required
Involve Investor relation hotline On going
Passive Corporate website On going
Consult One to one meetings As and when required
Employees
Consult Employee satisfaction surveys (GPTW survey) Annually
Involve Skip level meetings On going
EmpowerBrainstorming sessions with all business units when
reviewing medium to long term strategies.Annually
InformCorporate communication via emails, intranet,
newsletters etc.On going
Involve Management meetings Quarterly
Collaborate Recreation club activities On going
Suppliers and business partners
Consult On-site visits and meetings As and when required
Consult Formal interactions with reinsurers On going
Community
Collaborate Interactions with community representatives and institutes On going
Passive Corporate website and social media On going
Collaborate CSR projects On going
Passive Press releases As and when required
Collaborate Public events As and when required
Environment
Passive Employee training on environmental impacts On going
Passive Careful resource consumption On going
PassiveIntegrating environmental consideration into business
decisions On going
Government and regulatory
institutions
Consult On-site surveillances As and when required
Inform Filling of returns Periodic deadlines
Involve Directives and circulars As and when required
Passive Press releases As and when required
GRI 102-44

UNION ASSURANCE PLC | ANNUAL REPORT 2017
34
Material issues were identified through
the stakeholder engagement process.
Defining materiality is important for us
to understand the significant economic,
environmental and social impact of
conducting business. These issues were
defined by mapping stakeholder concerns
and our business priorities. It can be
identified as those that could make a major
impact on the Company’s ability to deliver
its promises to various stakeholders. The
main considerations are on what and how
they matter to the business. Reporting
on materiality is important for UA to make
sound decisions and take decisive actions.
Material Aspects The identification, prioritisation and validation
of material issues were conducted in line with
GRI Standards and therefore is a reflection
of best practice in defining report content. In
determining the report content, the Company
sought to prioritise material impacts based
on the relative importance to internal and
external stakeholders.
Materiality Assessment
GRI Standard No
GRI Topic BoundaryImpact to
UAImpact
outside UAUA Response
Economic
201 Economic performance UA High High Financial Capital
Page 51202 Market presence UA Low Low
203 Indirect economic impacts Community High High
204 Procurement practices Suppliers Low Low Social and Relationship
Capital
Page 65
205 Anti-corruption UA Low Low
206 Anti-competitive behaviour UA Low Low
Environmental
301 Material UA Low Low Natural Capital
Page 95302 Energy UA Medium Medium
303 Water UA Medium Medium
304 Bio diversity UA Low Low
305 Emissions UA Medium Medium
306 Effluent and waste Environment Medium Medium
307 Environmental compliance Environment Medium Medium
308 Supplier environmental assessment Supplier Low Low
Social
401 Employment UA High High Human Capital
Page 77402 Labour / management relations UA High High
403 Occupational health and safety UA High Low
404 Training and education UA High High
405 Diversity and equal opportunity UA High Medium
406 Non-discrimination UA High Medium
407 Freedom of association and collective bargaining UA Low Low
408 Child labour UA & Suppliers Low Low
409 Forced or compulsory labour UA Low Low
410 Security practices UA Medium Medium
411 Rights of indigenous people UA Low Low
412 Human rights assessment UA Low Low
OUR VALUE CREATION MODELMATERIALITY
GRI 102-47

35
UNION ASSURANCE PLC | ANNUAL REPORT 2017
UN
ION
AS
SU
RA
NC
E A
T A
GLA
NC
E
GRI Standard No
GRI Topic BoundaryImpact to
UAImpact
outside UAUA Response
413 Local communities Community High Medium Social and Relationship
Capital
Page 65
414 Supplier social assessment Suppliers Low Medium
415 Public policy UA and
Government High High
416 Customer health and safety Customers High High
417 Marketing and labelling UA and
Community High High
Intellectual Capital
Page 89418 Customer privacy Customers High High
419 Socioeconomic compliance Community Medium High Social and Relationship
Capital
Page 65
Materiality Matrix
The results of the materiality assessment as discussed earlier has been categorised as High, Medium and Low based on the impact on
UA and impact outside the organisation. The levels of reporting has been based on the following categorisation;
High - Issues indicated are of high significance and impact both stakeholders and the organisation. The indicators shown in this area
are fully discussed in the Annual Report.
Medium - Issues indicated in this area have a relatively moderate impact on the business. They are reported in brief.
Low - Issues indicated in this area have lower impact on the business. Therefore, those are not reported.
Low
Imp
ort
ance o
f is
sues to o
ur
sta
kehold
ers
Importance of issues to our business
Low
High
High
201 / Economic performance
203 / Indirect economic impacts
204 / Procurement practices
202 / Market presence 407 / Freedom of association and collective bargaining
205 / Anti-corruption
206 / Anti-competitive behaviour
301 / Material
302 / Energy
303 / Water
304 / Bio diversity
308 / Supplier environmental assessment
305 / Emissions
306 / Effluent and waste
307 / Environmental compliance
401 / Employment
402 / Labour / Management relations
403 / Occupational health and safety
404 / Training and education
405 / Diversity and equal opportunity
406 / Non - discrimination
408 / Child labour
409 / Forced or compulsory labour
410 / Security practices
411 / Rights of indigenous people
412 / Human rights assessment
413 / Local communities 414 / Supplier social assessment
415 / Public policy 416 / Customer health and safety
417 / Marketing and labelling 418 / Customer privacy
419 / Socioeconomic compliance
GRI 102-47 | 102-48 | 102-49
There were neither reinstatement of information nor material changes in the scope and aspect boundaries.
Economic Indicators Environmental Indicators Social Indicators


MANAGEMENT DISCUSSIONAND ANALYSIS
Our partnerships have reinforced our business capabilities and delivered on our promise of value creation in real terms that light up the many stakeholders we partner. With them we have set the trends of growth and every year we will accelerate this pace.
38 Our Operating Environment
50 Capital Management Review
51 Financial Capital
65 Social and Relationship Capital
77 Human Capital
89 Intellectual Capital
95 Natural Capital
101 Manufactured Capital

OUR OPERATING ENVIRONMENT Our operating environment has an impact on UA directly and indirectly. The operating environment is discussed in detail as follows;
Economic
Review
Regulatory
Review
Key Demographic
Changes
Technological
Environment
Competitive
Landscape
Risks and
Opportunities
38

39
UNION ASSURANCE PLC | ANNUAL REPORT 2017
MA
NA
GE
ME
NT
DIS
CU
SS
ION
AN
D A
NA
LYS
IS
Economic ReviewThe Sri Lanka economy grew by 3.1% in
2017, 130 bps below the 4.4% GDP growth
recorded in 2016. Economic growth was
mainly supported by the expansion of
industry and services related activities.
Due to extreme weather conditions (severe
drought as well as heavy rainfalls) that
prevailed during the last 2 years in many
districts of the country, agricultural activities
reported a negative growth.
Following are notable developments in the
year under review.
The Executive Board of the International
Monetary Fund (IMF) completed the
second review of Sri Lanka’s economic
performance under the Extended Fund
Facility arrangement and approved the
disbursement of SDR 119.894 Mn
(≈ USD 167.2 Mn).
The new Inland Revenue Bill 2017 was
passed in Parliament by a majority
and would come into effect from April
2018. The new Act aims to simplify the
existing tax structure to increase the tax
base while improving tax administration.
A surplus based income tax has been
introduced for life insurance companies.
New forex law has allowed a Company
listed on the Colombo Stock Exchange
to invest up to USD 2 Mn a year in
overseas assets. The outward investors
could buy shares, units, debt securities,
and sovereign bonds.
The government of Sri Lanka has
completed the formal handover of the
strategic port of Hambantota to China,
who has taken control of the facility on a
99-year lease for USD 1.12 Bn.
Standard and Poor's has lifted the
outlook on Sri Lanka's 'B+' rating to
‘stable' from ‘negative' as the country
raised taxes to pay for salary and
subsidy hikes in 2015 which contributed
to a balance of payments crisis.
These helped Sri Lanka to stay on course,
in-spite of the political volatility and the
impact of extreme weather conditions.
The following is a discussion on the
movement of the primary macro - economic
variables during the year under review, and
the resultant impacts on the performance
of UA.
Macro-economic Variables Movement Cause Impact to UA
Economic Growth
0
2,000,000
4,000,000
6,000,000
8,000,000
10,000,000
GDPRs. Mn
Growth%
201720162015
Agriculture
Industry
Services
GDP Growth %
0
1
2
3
4
5
During 2017 the economy,
in terms of GDP grew by
3.1% YoY to Rs. 8.4 trillion.
In 2016 economic growth
stood at 4.4%.
Agriculture sector contributed 7.6% to GDP at
current price, and reported a negative growth
of 0.8% during the year due to adverse weather
conditions.
Industry activities contributed 29.6% of GDP at
current price and grew at a moderate growth of
3.9% mainly due to slowdown in construction
sector that grew at 3.1% against 8.3% in 2016.
However, manufacturing of textile wearing
appeal and leather related products improved
5.7%
Service sector that contributed 62.8% gained
3.2% YoY during the year 2017.
The growth in GDP
enhanced the sentiment
of both customers and
business alike, which
positively impacted
the performance of UA
during the year.
Inflation
0
30
60
90
120
150
CCPI % Growth %
Jan-1
7
Feb
-17
Mar-
17
Ap
r-17
May-
17
Jun-1
7
Jul-1
7
Aug
-17
Sep
-17
Oct-
17
Nov-
17
Dec-1
7
4
5
6
7
8
9
YoY GrowthCCPI
Headline inflation
measured by the Colombo
Consumer Price Index
(CCPI – Base year 2013)
moved upward by 6.6%
in 2017, higher than last
year’s 4.0%.
Core inflation based on
CCPI increased to 5.9% in
2017 from 4.8% last year.
Revision in government’s direct and indirect
taxes and disturbing weather, negatively
impacted supply side developments and
food prices, further non - food categories,
such as transport, miscellaneous goods and
services, restaurants and hotels, recreation and
culture, education, clothing and footwear, and
furnishing, household equipment and routine
household maintenance contributed towards
the increase in inflation.
Increasing prices
escalates other
operating, administrative
and selling expenses
which negatively impacts
UA’s operating margins.

UNION ASSURANCE PLC | ANNUAL REPORT 2017
40
Macro-economic Variables Movement Cause Impact to UA
Interest Rates
0
3
6
9
12
15
%
5 Year T bondAWDR
AWLR
Jan-1
7
Feb
-17
Mar-
17
Ap
r-17
May-
17
Jun-1
7
Jul-1
7
Aug
-17
Sep
-17
Oct-
17
Nov-
17
Dec-1
7
The AWDR and AWLR
increased during 2017
by 5.15% (68 bps)
and 11.02% (90 bps)
respectively.
However, treasury rates
adjusted downwards
during the year. 5 year
treasury bond rate
declined by approximately
268 bps.
The CBSL continued to tighten monetary
policy to prevent adverse inflation and excess
monetary and credit expansion. In March 2017
the CBSL increased the SDFR and SLFR by 25
basis points.
Foreign inflows of USD 391.9 Bn YTD, GOSL
securing funds from IMF, funds from lease of
Hambantota Port, etc. lessened borrowing
pressure for the Government leading to a drop
in treasury yields.
The decline in treasury
rates will increase value
of UA’s financial assets.
However, if the decline in
treasury rates continues,
UA’s fresh investments
will earn lower yields.
Exchange Rate
100
120
140
160
180
200
Rs.
LKR / €LKR / US$
Jan-1
7
Feb
-17
Mar-
17
Ap
r-17
May-
17
Jun-1
7
Jul-1
7
Aug
-17
Sep
-17
Oct-
17
Nov-
17
Dec-1
7
The rupee depreciated
by 2.82% against the US
Dollar and 14.45% against
the Euro in 2017.
Strong export earnings growth of 10.2% YoY,
foreign net inflows to treasury bills and bonds,
net inflow to CSE, foreign currency term loans,
IMF receipt and foreign direct investments
controlled the LKR depreciation against the
US$.
However, the notable increase in imports
partly driven by adverse weather conditions
negatively impacted the exchange rate.
Depreciation of the
Rupee has negatively
impacted payments to
reinsurers and other
overseas suppliers.
Ultimately this had a
negative impact on the
margins of the Company.
Share Market
5,000
5,750
6,500
7,250
8,000
3,000
3,250
3,500
3,750
4,000
ASPI S&PSL20
S&PSL20ASPI
Jan-1
7
Feb
-17
Mar-
17
Ap
r-17
May-
17
Jun-1
7
Jul-1
7
Aug
-17
Sep
-17
Oct-
17
Nov-
17
Dec-1
7
The ASPI returned 2.26%
in 2017 closing at 6,369.26
while the S&PSL20
returned 5.01% closing at
3,671.72.
The market capitalisation
stood at Rs. 2.899 trillion
at the end of year 2017
against Rs. 2.75 trillion
last year.
Given the attractive valuations when compared
with regional capital markets, CSE attracted
net foreign inflows amounting to Rs. 17.66
billion. Further, the drop in treasury rates made
equities attractive during the year.
However, slowdown in consumer spending,
adverse weather, higher taxes on certain
sectors, increased inflation and slow economic
growth had a negative impact on equities.
As a result of portfolio
rebalancing and
investment strategies
UA’s equity investment
provided better returns
during the year which
enhanced total other
revenue in 2017.
Regulatory Review The key change in regulatory environment
during the year is the change in life
insurance company taxation. Currently life
insurance companies are taxed based on
'I - E' basis (Investment income –
Management Expenses). UA has worked
collaboratively with the Insurance
Association of Sri Lanka to agree on a
OUR OPERATING ENVIRONMENT
surplus based income tax for life insurance
companies with the Inland Revenue
Department. As an outcome in the new
Inland Revenue bill, Life insurance
companies are taxed on the following basis.
Life Insurance Income Tax
The gains and profits liable to tax from the
business of Life Assurance, whether mutual
or proprietary, is the aggregate of the
following, subject to the deduction of any
unrelieved loss from business specified in
the Act:
The surplus distributed to shareholders
from the life insurance policyholders
fund, as certified by the Appointed
Actuary, and

41
UNION ASSURANCE PLC | ANNUAL REPORT 2017
MA
NA
GE
ME
NT
DIS
CU
SS
ION
AN
D A
NA
LYS
IS
The investment income of the
shareholders fund less any expenses
incurred in the production of such income.
The surplus distributed to a life insurance
policyholder who shares the profits of a
person engaged in life insurance business
shall be deemed as profit from business of
that person and be liable to tax accordingly.
UA participating products contribute 8% to
the current GWP. Participating policyholders
will be liable for tax at temporary
concessionary rate of 14% for 3 years,
commencing 1 April 2018 participating
products will not be competitive due to
policyholder receiving net of tax.
The new tax basis will be applicable from
1 April 2018.
One - Off Surplus
Based on the direction issued by the IRCSL
dated 20 March 2018 and subsequent
approval, Company has transferred a
one - off surplus of Rs. 3,382 million
attributable to non-participating and non
unit fund of unit linked business from
life policyholder fund to life shareholder
fund (SHF) through Income Statement.
The distribution of this one - off surplus to
shareholders, held as part of the Restricted
Regulatory Reserve, is subject to meeting
governance requirements stipulated by
the IRCSL and can only be released upon
receiving approval from the IRCSL. The
one - off surplus in the SHF is invested
in government debt securities as per the
directions of the IRCSL.
Key Demographic Changes Population
The proportion of young population is
declining in line with the dip in the number
of births. However, the share of elderly
population is rising at a faster pace in line
with greater life expectancy and better
access to health care. This change will
place a greater burden on the working
population as they support an increasing
number of dependents. These changes
create demand for health, pension and
retirement products.
0
2
4
6
8
10
12
14
16
18
%
2041
(F)
2031
(F)
2021
(F)
201220011981
4.3
% 6.3
%
7.9
%
10.9
%
14.5
%
17.1
%
Rapid Growth of Ageing Population 65+ Years
0
5
10
15
20
25
30
Population Aged 65 and Above (%)
%
Bang
lad
esh
Sri L
anka
Ind
ia
Mala
ysia
Ind
onesia
Nep
al
Pakis
tan
Thaila
nd
Chin
a
Jap
an
5.8
9%
5.5
5%
10.4
7%
9.3
%
4.9
7%
5.6
2%
5.1
7%
4.4
9%
9.5
5%
26.3
4%
Source: Sri Lanka Paradigm shifts in population,
W. Indralal De Silva, World Bank
Trend of Urbanisation in Sri Lanka and Forecast for 2030
The country is expected to see rapid
urbanisation with a growth rate of 3.3%
annually over next 15 years giving an impetus
for industry growth. As families relocate
to cities, their ability to depend on village
support and other means of localised security
diminishes. Thus, sustaining an urban family,
should the bread winner of the family face a
tragedy that affects the households' income,
25%
67%
53.8%46.2%
8%
1.7MnElderly
Population
(>65 Years)
14.2MnWorking age Population
(15-64 years)
5.3MnYoung
Population
(<15 years)
7.6MnInactive
8.3MnLabour Force
21.2 Mn - Population
X
Source: Central Bank Annual Report 2016
0
1,000
2,000
3,000
4,000
5,000
Per Capita GDP (USD)
Per Capita
GDP USD
Growth
%
2018
2017
2016
2015
2014
2013
2012
4,2
04
3,8
21
3,6
09
3,3
51
0
2
4
6
8
10
Per Capita GDP Growth3,8
43
3,8
35
4,0
15
Source: Central Bank Annual Report 2016,
Asian Development Bank: Economic forecast
for South Asian Countries
Asian Development Bank forecasts 4.7%
growth in per capita GDP for 2017 and 2018
Among the developing countries, Sri
Lanka's percentage of population age 65
and above is higher due to better access to
health care.
Source: Sri Lanka Paradigm shifts in population,
W. Indralal De Silva, World Bank

UNION ASSURANCE PLC | ANNUAL REPORT 2017
42
Non Communicable Diseases
0
2,000
4,000
6,000
8,000
10,000
No. USD
20142008 2010 201220062004
Increasing Trend in Deaths Due to NCDs
0
500
1,000
1,500
2,000
2,500
3,000
3,500
4,000
4,500
Heart Diseases
GDP Per Capita
Cancer
Diabetes
Source: Health Ministry, World Bank
In recent times, rapid growth of NCDs due
to demographic changes and growing
ageing population was also witnessed
(NCDs account for 71% of annual deaths).
Therefore, compared to few decades back,
we believe that people have become more
aware of the risks associated with NCDs
and thereby looking for life / health covers
providing an impetus for the industry.
OUR OPERATING ENVIRONMENT
Technological Environment Insurance industry is on the edge of major
technology-driven change. Better operating
efficiency, need to engage creatively
with consumers digitally and increased
disintermediation of information are relevant
for the insurance industry as much as most
other industries. Internet of Things (IoT) and
Big Data will change the type of data that
insurers use to assess risk, the way in which
information is analysed and ultimately the
size of the actual risk pools.
Today, mobile is key, even more than the
web, and this requires an engagement model
30
40
50
60
70
80
90
Cause of Deaths by NCDs as a %of Total Deaths (2012)
%
Ind
ia
Sin
gap
ore
Ban
gla
des
h
Chi
na
Jap
an
Mal
aysi
a
Sri
Lank
a
Vie
tnam
Source: Health Ministry and the World Bank
0
5
10
15
20
Relative Satisfaction Utility Score
Pers
onal
Bankin
g
Onlin
eM
erc
hants
Med
ia R
eta
il
Ele
ctr
onic
sR
eta
il
Ap
pare
l R
eta
il
Airlin
es
Investm
ents
Hote
ls
Sup
erm
ark
ets
Ele
ctr
icity,
Gas,
Wate
r
Auto
mob
iles
Govern
ment
Serv
ices
Health C
are
Pro
vid
ers
Insura
nce
Real E
sta
te
Telc
o &
Cab
le
10.0
8.5
8.0
5.0
4.2
4.0
3.8
3.5
7.3
11.8
15.2
11.1
8.9
8.5
5.8
4.3
4.1
Source: BCG digital satisfaction survey March 2013, Morgan Stanley Research
Ecosystems Drive the Need for Partnerships
Cheap, connected sensors have the
potential to transform the insurance offering
– be it in motor, home or health insurance,
or industrial settings.
An example of a digital ecosystem is
provided overleaf - these will become
increasingly important for delivery of
insurance products.
Those devices (IoTs) enable insurers to
collect new datasets, gain a much better
understanding of their customers and
assess risks in a completely different way.
High Impact Areas
Risk segments (property & casualty,
protection and health) are likely to see the
greatest long-run impact from technology,
as the industry moves from actuarial risk
assessment (statistical techniques) to
include new sources of data, Big Data
techniques and new data sets from
connected devices (potentially real-time
risk observation and modelling).
Trend of Urbanisation in Sri Lanka
and Forecast for 2030
2030201520122001
13.1% 18.2% 18.4% 30%
Source: World Bank CBSL
spurs the desire to have life insurance
coverage. Additionally, housing market boom
and low unemployment rate is also poised
well for urban living, creating an opportunity
for the life insurance industry growth.
specifically conceived for a digital world.
Overall, consumers are far less satisfied with
their digital insurance experience compared
to other industries particularly when it
comes to ‘moments of truth’ such as paying
claims. Consumers have significant unmet
needs, with many products perceived to be
expensive and inflexible.

43
UNION ASSURANCE PLC | ANNUAL REPORT 2017
MA
NA
GE
ME
NT
DIS
CU
SS
ION
AN
D A
NA
LYS
IS
The Internet of Things
Connected City Smart Meters
Smart Traffic
Connected
Community
Connected Home Safety and Security
Domestic &
Entertainment
Energy Efficiency
Connected Car Safety and Security
Convenience
Live Navigation
Infotainment
Connected Government Connected Public Admin
e-Government
Connected Civil
Protection
Connected Health Care eHealth
Health Monitoring and
Prevention
Wellness
Connected Enterprise Real-time Analytics
Connected Workforce
Smart Processes
Robotics
Overall insurance technology spending is
expected to grow modestly (mid-single digits)
with most insurers looking to reallocate spend
from legacy areas to front end technology
to connect digitally with customers. Hence,
Challenges faced by Insurers
Complex legacy IT systems
limiting insurers’ agility.
A bias toward largely
intermediated distribution and
technical nature of products
hindering a shift towards greater
consumer orientation.
Complex insurers, often siloed
by branch as well as long-term
orientation within the industry,
tend to have a limited focus on
innovation.
The economic environment
creates significant pressure in
terms of investment capability,
increasing the short-term focus
of insurance companies.
Facing these challenges, Insurers need to focus on
Consumer centricity
Cutting across silos
Partnerships
IT evolution
Innovation
Data analytics
technology vendors exposed to priority
spending areas should see double-digit
growth. The main priority areas, will be
interaction / distribution channels and
analytics – particularly in contextualising
data from telematics / IoT devices. However,
insurers will also have to invest in core
systems (policy underwriting, claims, billing)
and middleware solutions (wrapping the
legacy systems so they integrate with state-
of-the-art capabilities) to benefit fully from the
channels / analytics spend.
Competitive LandscapeGlobal Life Insurance Industry
Global life insurance premiums are
estimated to have risen by 3% in 2017 in real
terms, up from 2% in 2016. The emerging
markets are likely to fuel improvement in life
premiums in the coming years, with China
and India being the main growth drivers, as
per Swiss Re institute report quarter 3, 2017.
This growth may be a consequence of more
favourable economic conditions, leading
individuals to purchase insurance products.
In most countries, the relatively low
penetration of insurance (especially in Latin
America and some Asian countries) shows
that the insurance sector still has significant
room to expand. In some countries, gross
premiums declined where continued low
interest rates may have deterred individuals
from purchasing life insurance products with
lower guarantees.
Sri Lankan Insurance Market Structure
The Sri Lankan insurance industry depicts a
highly dynamic atmosphere with escalated
competition existing amongst 29 industry
players. The composition of the Insurance
companies (Insurers) registered with the
Insurance Regulatory Commission of Sri
Lanka (IRCSL) is as follows. There are 58
insurance brokering companies registered
with the IRCSL.
12Life
Insurers
14Non Life Insurers
3Composite
Insurers

UNION ASSURANCE PLC | ANNUAL REPORT 2017
44
OUR OPERATING ENVIRONMENT
Life Insurance Industry Performance
Overview
Despite the challenging environment, year
2017 ended with a positive note for the
Sri Lankan insurance industry with the life
insurance sector generating GWP amounting
to Rs. 71,575 million, up by 12% against
the GWP of Rs. 63,553 million generated in
2016. This significant growth is attributable
to increased awareness regarding life
insurance, introduction of new life insurance
products catering to customer requirements
such as retirement and investments,
enhanced customer service, etc.
0
10,000
20,000
30,000
40,000
50,000
60,000
70,000
80,000
GWPRs. Mn
Growth%
20172016201520142013
71
,57
5
53
,57
5
44
,59
6
41
,67
6
0
5
10
15
20
25
30
GWP Rs. Mn Growth %
63
,55
3
Growth in Life Insurance Industry
The decline in growth momentum from
2015 onwards is partly attributable to the
reduction in economic growth.
0
10,000
20,000
30,000
40,000
50,000
60,000
70,000
80,000
Composition of Industry GWP
Rs. Bn
20172016201520142013
FP+FYP
Single Premium
Renewal Premium
Group Insurance
Life GWP Growth vs GDP Growth
Higher industry growth experienced
compared to economic growth of the country.
0
5
10
15
20
25
30
Growth %
2016
2015
2014
2013
2012
2011
2010
Life Insurance
Asset Growth
GDP Growth
Life GWP Growth
Insurance Industry Performance vs GDP
Market Competition
As illustrated below, Ceylinco Life, SLIC,
AIA Life, Union Assurance and Softlogic Life
together contributed 80.25% to the total
long-term insurance GWP in 2017 almost
similar to the 80.14% recorded in 2016. The
other ten players generated 19.75% of GWP
in 2017 (2016: 19.86%).
0
5
10
15
20
25
30
%
UA
L
Soft
log
ic
Oth
ers
AIA
SLIC
Ceylin
co
GWP Market Share
2013
2014
2015
2016 2017
Life Insurance Penetration
Insurance penetration reflects insurance
premium as a percentage of GDP. In 2016,
penetration ratio of life insurance business
was recorded as 0.49% (2015: 0.48%)
reflecting improvement in penetration
level. Sri Lanka being a country largely
characterised by social collectivism and
dependency remains underpenetrated
compared to regional peers.
0.0
0.5
1.0
1.5
2.0
2.5
3.0
3.5
4.0
4.5
Insurance Penetration and Density
Sri L
an
ka
Vie
tna
m
Ind
on
esia
Ph
ilip
pin
es
Ind
ia
No
rth
Am
eric
a A
vg
Ma
laysia
Asia
Avg
Th
aila
nd
Eu
rop
e A
vg
0.4
9% 0.8
3% 1.2
8%
1.3
7%
2.7
2% 3.0
6%
3.3
7%
3.5
9%
1,685
987
215210216
43431719 40
3.7
0% 4.1
6%
Insurance Penetration - Life Premiums in % of GDP (LHS)
Insurance Density - Life Premiums Per Capita in USD (RHS)
0
200
400
600
800
1,000
1,200
1,400
1,600
1,800
InsurancePenetration %
InsuranceDensity USD

45
UNION ASSURANCE PLC | ANNUAL REPORT 2017
MA
NA
GE
ME
NT
DIS
CU
SS
ION
AN
D A
NA
LYS
IS
In 2016, Life insurers have issued 662,701
new policies, a decrease of 10.51%
compared to 740,511 new policies issued
in 2015. The total life insurance policies
in force has gradually increased over the
last five years reflecting that Life insurance
business is continuously expanding in the
country. Number of life insurance policies
as a percentage of the total population was
13.7% in 2016 though recording a slight
decrease compared to 13.8% recorded in
2015. Number of life insurance policies as a
percentage of the labour force reflects the
low level of life insurance penetration in the
country and the potential that life insurers
have to further develop and expand.
Reduction in number of new policies issued
is partly attributable to the challenging
economic environment.
Claims and Benefits Paid by Life Insurance Industry
Life insurers incurred Rs. 22,622 million total
claims and benefits, an 8.06% increase
compared to Rs. 20,934 million incurred
in 2015. The total comprised of disability
benefits, death benefits, surrenders,
maturity benefits and other benefits paid
to policyholders. Out of the total claims
incurred, maturity benefits represented
56.20% in 2016 recording an increase
compared to 55.83% in 2015.
0
500,000
1,000,000
1,500,000
2,000,000
2,500,000
3,000,000
Number of Insurance Policies Issued and
Policies in Force
No. %
20162015201420132012
2,8
95,5
42
662,7
01
545,3
03
2,6
04,6
67
546,2
92
2,4
77,6
95
514,5
16
2,4
38,3
40
0
10
20
30
40
No. of New Life Policies Issued
No. of Life Policies in Force
No. of Life Policies in Force as % of the Total Population
No. of Life Policies in Force as % of the Labour Force
740,5
11
2,8
89,7
63
0
3,000
6,000
9,000
12,000
15,000
Claims and Benefits Paid by Life
Insurance Companies
Rs. Mn
2016201520142013
Disability Benefits
Death
Surrenders
Maturity Benefits
Others
Insurance Density
Insurance density reflects the life insurance
premium income per person of the
population and amounts to Rs. 3,307 in
2016. Insurance density has grown by
14.5% in 2016 compared to 2015. This
growth was due to increased premium
income against the insignificant growth in
the population. Insurance density of Sri
Lanka is lower compared to the regional
markets. This indicates the growth potential
for the life insurance industry.
0
2,000
4,000
6,000
8,000
10,000
Insurance Density
USD
% of Per Capita Income 2016
0% 1% 2% 3% 4%
Country
Sri Lanka
PakistanBangladesh
Vietnam
Philippines
China
Malaysia
Thailand
India
Indonesia
Industry Issues
Number of Policies Lapsed
Lapsation of policies is a key issue in the local
insurance industry compared to developed
markets. Policy lapses are due to varied
reasons and some of them include lack of
servicing, wrong selling and negative market
conditions. During the year under review
insurance companies educated their sales
force through training and development and
improved service standards. in addition,
in September 2017, the insurance industry
conducted an islandwide awareness
campaign on the need for protection.
Source: IRCSL Statistical Review 2016
0
100,000
200,000
300,000
400,000
500,000
Number of Policies LapsedNo. of
policies lapsed %
20162015201420132012
403,4
23
96,5
02
103,5
00
362,6
64
107,9
06
366,5
06
94,9
36
332,7
07
0
10
20
30
40
New Insurance Policies Lapsed
Total Insurance Policies Lapsed
New Insurance Policies Lapsed as a % of New Policies Issued
Total Insurance Policies Lapsed as a % of Total Policies in Force
93,0
08
364,5
67

UNION ASSURANCE PLC | ANNUAL REPORT 2017
46
OUR OPERATING ENVIRONMENT
Recruitment of Quality Sales Advisors
Recruiting agents with required skill set is
a challenge especially since agency is the
dominant channel.
Distribution Channels of Insurance Companies
Insurers use distribution channels such
as agency, brokers, direct marketing,
bancassurance and other channels to
reach their customers. Agency is the
dominant distribution channel in the life
insurance Industry, while the potential
of Bancassurance is yet to be exploited
despite deeper penetration of the bank
branch network in the country.
0
2
4
80
100
6
Life Industry Distribution Channels
%
20162015
87.4
%
6.2
%4.9
%
1.0
%
0.5
%
89.9
%
4.0
%
0.9
%
0.4
%
4.8
%
Agents
Direct
Bancassurance
Others
Brokers
Bancassurance Penetration
Sri Lankan Bancassurance is under
penetrated compared to other regions of the
world despite having a strong banking sector.
Sri Lankan commercial bank branch density
(18 branches per 100,000 people) is much
greater than its peers and therefore insurers
can leverage the branch network of the
banking industry to increase productivity and
reduce the acquisition cost.
0
5
10
15
20
SL’s Bank Branch Network has Deeper Penteration Over Peers
No.
20142013201220112010
Sri Lanka Vietnam Singapore Malaysia Indonesia Thailand Philippines
Source: Central Bank Annual Report 2016
Turkey
Taiwan
South Korea
Hong Kong
Thailand
China
Malaysia
Singapore
Indonesia
Philippines
India
Sri Lanka
Vietnam
0 20 40 60 80 100
79.9
26.153.6
52.0
49.242.3
39.038.337.0
36.735.0
20.84.92.0
44.240.0
45.055.0
2.42.7
7.6 9.819.04.015.97.33.34.4
6.2 1.571.487.4
98
48.6 10.0 2.451.5 6.2
27.8
40.7 5.721.9
22.5
7.5 9.5 3.2
Bancassurance’s Market Share for Life Insurance in the Asia Pacific Region -
Premium Income
Bancassurance Direct Other (Brokers / Financial Advisors)Agents (Solicitors)
Competitor Analysis - Life Insurance Industry
Threat of new entrants
(Moderate)
Bargaining power
of reinsurers,
bancassurance partners
(High)
Bargaining power of
policyholders
(Moderate)
Threat of substitutes
(Moderate to Low)
Rivalry among existing players
(Moderate)
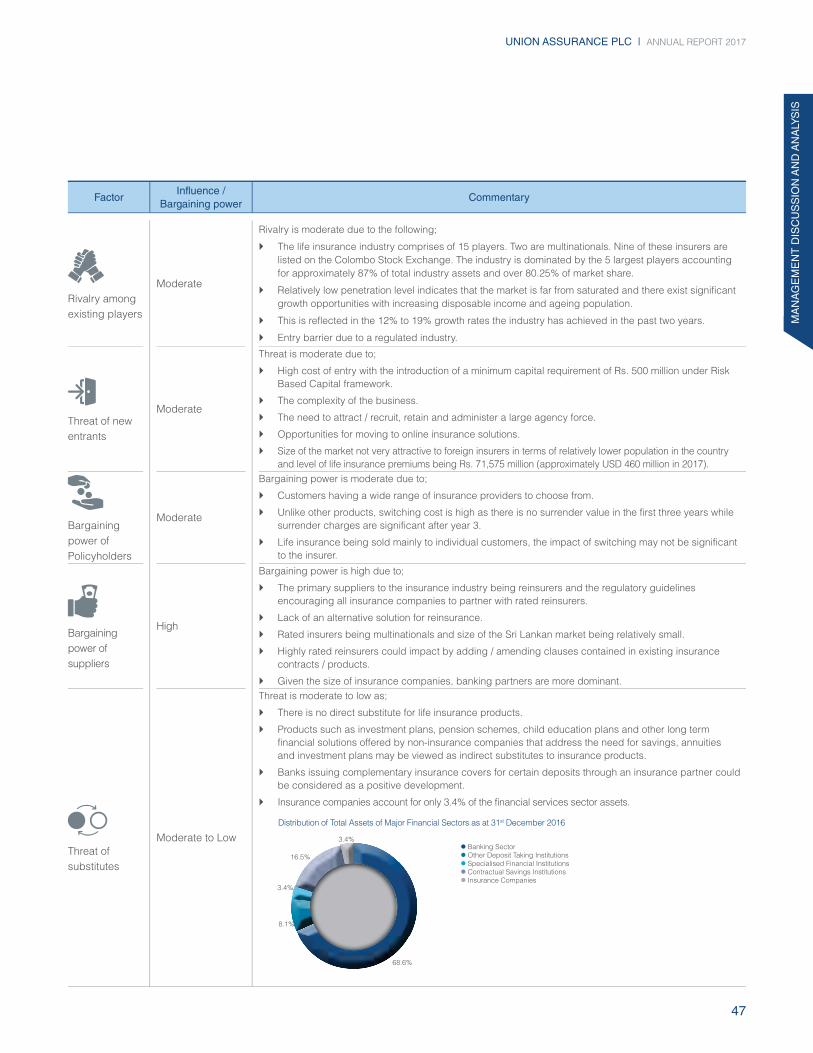
47
UNION ASSURANCE PLC | ANNUAL REPORT 2017
MA
NA
GE
ME
NT
DIS
CU
SS
ION
AN
D A
NA
LYS
IS
Factor Influence /
Bargaining powerCommentary
Rivalry among
existing players
Moderate
Rivalry is moderate due to the following;
The life insurance industry comprises of 15 players. Two are multinationals. Nine of these insurers are
listed on the Colombo Stock Exchange. The industry is dominated by the 5 largest players accounting
for approximately 87% of total industry assets and over 80.25% of market share.
Relatively low penetration level indicates that the market is far from saturated and there exist significant
growth opportunities with increasing disposable income and ageing population.
This is reflected in the 12% to 19% growth rates the industry has achieved in the past two years.
Entry barrier due to a regulated industry.
Threat of new
entrants
Moderate
Threat is moderate due to;
High cost of entry with the introduction of a minimum capital requirement of Rs. 500 million under Risk
Based Capital framework.
The complexity of the business.
The need to attract / recruit, retain and administer a large agency force.
Opportunities for moving to online insurance solutions.
Size of the market not very attractive to foreign insurers in terms of relatively lower population in the country
and level of life insurance premiums being Rs. 71,575 million (approximately USD 460 million in 2017).
Bargaining
power of
Policyholders
Moderate
Bargaining power is moderate due to;
Customers having a wide range of insurance providers to choose from.
Unlike other products, switching cost is high as there is no surrender value in the first three years while
surrender charges are significant after year 3.
Life insurance being sold mainly to individual customers, the impact of switching may not be significant
to the insurer.
Bargaining
power of
suppliers
High
Bargaining power is high due to;
The primary suppliers to the insurance industry being reinsurers and the regulatory guidelines
encouraging all insurance companies to partner with rated reinsurers.
Lack of an alternative solution for reinsurance.
Rated insurers being multinationals and size of the Sri Lankan market being relatively small.
Highly rated reinsurers could impact by adding / amending clauses contained in existing insurance
contracts / products.
Given the size of insurance companies, banking partners are more dominant.
Threat of
substitutes
Moderate to Low
Threat is moderate to low as;
There is no direct substitute for life insurance products.
Products such as investment plans, pension schemes, child education plans and other long term
financial solutions offered by non-insurance companies that address the need for savings, annuities
and investment plans may be viewed as indirect substitutes to insurance products.
Banks issuing complementary insurance covers for certain deposits through an insurance partner could
be considered as a positive development.
Insurance companies account for only 3.4% of the financial services sector assets.

UNION ASSURANCE PLC | ANNUAL REPORT 2017
48
OUR OPERATING ENVIRONMENT
Risks and Opportunities 2017 operating environment remained challenging due to severe drought as well as heavy rainfalls in many parts of the country and increase
in inflation, impacting consumer confidence negatively. Within this environment our strategies guide us to manage risks and material issues as
well as to capitalise on opportunities that ensure we deliver on our short, medium and long term objectives.
We highlight here some of the key risks and opportunities identified within our operating environment which impact our business and the
strategies to mitigate, overcome or capitalise on them.
Operating Environment
Factor UA Response
Economic
Environment
Political stability and consistent economic policies are key for
economic growth.
Political uncertainty will slow down economic growth.
The moves policymakers take leading up to the 2020/2021
elections, particularly with regard to fiscal loosening possibly in
2019, is a key risk, calling to question the current path of fiscal
consolidation the Government has been highlighting.
We offer best in class insurance products and services
that meet customers’ needs. UA provides customers with
additional value through health and lifestyle benefits and
product integration via ecosystems. Through innovation
and design of product and services we improve
customer experience. UA is able to improve persistency,
retain and grow its customer base. Refer UA growth vs
industry growth graph on page 17.
On average, 2018 is likely to witness lower interest rates than the
previous two years. Rates could continue to come off, through
the first half of 2018 and possibly quite sharply. However, with
debt repayments pressures coming in during the second half,
we expect a marginal rise in yields thereafter.
Investment committee has devised various investment
strategies to increase the investment yield. UA was able
to declare above market dividend rate in the industry
in 2017.
Regulatory
Environment
Changes in Regulatory Environment Inconsistencies in regulatory environment will have a negative
impact on operations and profitability of the industry.
UA maintains good relations with the Insurance Regulatory
Commission of Sri Lanka (IRCSL). We work closely with
the Insurance Association of Sri Lanka (IASL) to lobby
regulators and other policy makers (including the Ministry
of Finance) to implement rules which will develop the
market while safeguarding policyholders interests.
New Inland Revenue Bill 2017New Inland Revenue bill 2017 introduced a surplus based
income tax for life insurance companies. However, profit share
of participating policyholders will be taxed at a temporary
concessionary rate of 14% commencing from 1 April 2018.
Insurance premium paid to non-residents is to be liable at a
14% WHT subject to Double tax treaty rate.
Changes in government fiscal policies.
UA will focus on non-participating insurance solutions
considering the negative tax impact on participating
products. Currently participating products contribute
8% to the GWP.
We have informed our reinsurers regarding the future
change in regulation and discussions are in progress.
IFRS 17The new international accounting standard IFRS 17 (effective in
2021) creates a standardised and more transparent approach
to measure insurance liabilities. It will likely require significant
investment in new data capture, systems and processes.
UA has appointed a team constituting members from
Finance, Actuarial and IT departments to study the
impact of the standard. Requirements of the standard
have been considered in the new front-end system
development.
Social
Environment
Increased UrbanizationOngoing housing market boom and low unemployment rate
are catalysts for urban living, creating opportunities for industry
growth as the need to have a life insurance policy increases with
more urbanization.
We offer best in class insurance products and services
that meet customers’ needs.
Please refer to our product portfolio given in pages
68 and 69.
Refer trend of urbanisation in Sri Lanka and forecast for
Demographic Changes Demographic changes are conducive for Life insurance
business. Sri Lanka’s population is one of the oldest and fastest
ageing in the world. SL’s population aged 65+, surpasses most
of the South Asian regional peers.
UA offers suitable products to this segment. Union
Pension Advantage and Union 60 plus are two such
products.

49
UNION ASSURANCE PLC | ANNUAL REPORT 2017
MA
NA
GE
ME
NT
DIS
CU
SS
ION
AN
D A
NA
LYS
IS
Operating Environment
Factor UA Response
Social
Environment
The population over 65 years is expected to increase up to 17% by
2041 and people are expected to set aside more money for health
risks that they would potentially be exposed to.
NCDs have shown an increasing trend with 71% of all annual
deaths attributing to chronic NCDs. Compared to the past, people
have become more aware of the risks of NCDs and thereby looking
for life / health covers which will augur well for industry growth.
UA product development initiatives are centred on
demographic changes.
Technology
Internet of Things (IoT) and Big Data
Internet of Things (IoT) and Big Data will change the type of data
that insurers use to assess risk, the way in which information is
analysed and ultimately the size of the actual risk pools.
UA has established a data analytics team constituting
members of different disciplines to provide valuable
management information for decision making.
Disruptive Business Model
Traditional insurers will be threatened by new entrants with
disruptive business models.
UA continues to focus on innovation, superior customer
service and developing a unique brand to overcome this
challenge.
Competitive
landscape
Low penetration
Life insurance industry still remains underpenetrated compared
to regional peers as Sri Lanka is a country largely characterized
by collectivism and dependency where the need for a life
insurance policy is yet to be realized.
Low penetration indicates strong upside potential for the
industry. UA will drive long term strategies to take full
advantage of this opportunity.
Protection gap
There is a sizable and expanding mortality protection gap
within Sri Lanka. Swiss Re estimates that “Every dollar spent on
prevention saves society between US$5 and US$10 in losses.
The situation looks very different if the loss is insured. The first hit
is lower, the rebound much stronger – and the cumulative effect
can even be positive, up to 2.4% of GDP.”
(Martyn Parker, Swiss Re’s Chairman Global Partnerships).
UA will drive long term strategies to reduce this gap.
Bancassurance penetration
Sri Lanka has a higher banking penetration (69% of adults
has bank accounts in 2012, Source: IFC Mobile Money
Scoping Country Report: Sri Lanka). However, bancassurance
penetration in Sri Lanka is low compared to regional markets,
indicating a higher upside growth potential for this channel.
UA is developing relationships with banks and focuses
on developing complementary products to drive the
growth in this potential channel.
Sales force
Recruitment and retention of talent specifically for distribution
related activities are challenging.
UA has implemented several initiatives to attract high
quality candidates and offers a variety of training and
development programmes to enhance their quality and
productivity. Compensation / benefits and rewards and
recognition schemes have also been updated to align
individual and organisation objectives. Defined career
path and performance management system have been
established to improve the retention.
Market share
Increasing market share in the light of increasing
competition and managing margins due to upward pressure
on the cost base.
UA relies on its culture of customer-centricity and
innovativeness, its well-stablished brand and technical
expertise to maintain and grow revenue and margins. Cost
efficiencies and improvements are key focus areas and
is managed through the annual budgeting and monthly
operating performance reviews and reporting processes.
Key strategies are formulated to improve case size,
productivity and persistency to drive the market share.

CAPITAL MANAGEMENT REVIEW Capital Management Review analyses how we add value to our partners, in terms of the organisations six capitals. The review includes the following.
Financial
Capital
Social and
Relationship Capital
Human Capital Intellectual
Capital
Natural
Capital
Manufactured
Capital
50

FINANCIAL CAPITAL
Key Value
Drivers of Life
Business
Financial
Performance
Finance Position Cash Flow UA Share
Performance
Management ApproachWe are in the life insurance industry and seek to create long term sustainable value to our shareholders while protecting the interests of our
policyholders. Therefore, financial stability and profitability are key facets of our financial strategy.
Performance
of Investment
Portfolio 51

UNION ASSURANCE PLC | ANNUAL REPORT 2017
52
2017 Objectives and Achievements
Objectives - 2018 and Beyond
Objectives Year
Achieve GWP of Rs. 12.5 Bn 2018
Maintain CAR in excess of 160% 2018
Return on equity above 20% 2018 and beyond
Achieve 15% increase in life fund 2018
Challenges Increasing market share amidst intense competition Pages 46 and 47
Generating higher ROE with increasing cost structure Pages 39 and 40
Inconsistent economic policies Page 48
Achieve GWP of Rs.10 Bn
Maintain a CAR in excess of 160%
Achieve 15% increase in life fund
Profits to grow at 20% over the year
Return on equity above 20%
Achieved GWP of Rs.10.1 Bn
Profits grew by 463%
Life fund has decreased by 4% as a result of
one - off surplus transfer of Rs. 3.4 Bn
CAR as at 31 December 2017 was 352%
Recurrent ROE as at year end
was 64%
Key Performance Measures
Rs.10.1BnGross Written Premium
352%Capital Adequacy Ratio
Rs.3.8BnOperating Profit
64% Return on Equity
Rs.18.00Dividend per Shares
CAPITAL MANAGEMENT REVIEW FINANCIAL CAPITAL
1 Excluding one - off surplus transfer of Rs. 3.4 billion in 2017
1
1

53
UNION ASSURANCE PLC | ANNUAL REPORT 2017
MA
NA
GE
ME
NT
DIS
CU
SS
ION
AN
D A
NA
LYS
IS
Productivity Ratio Composition of Insurance Representatives
Annual Average Premium Per Policy (AAPP)
Commentary
Productivity ratio has dropped
mainly due to change in
our strategy and aligning
compensation structures to
focus on persistency and higher
premium values.
Commentary
Rising income levels of
customers as a result of
economic growth and priority
for high value cases and
introducing a minimum average
premium resulted in growth
in AAPP.
Commentary
We have implemented several
initiatives to attract high quality
candidates and offer a variety
of training and development
programmes to enhance their
quality and productivity.
Company launched the
e-Consultant initiative to
encourage housewives,
university students and students
of other institutes to join the life
insurance industry.
Compensation and rewards
schemes have been made
dynamic to drive individual and
organisation objectives.
Outlook
We will continue to improve the
productivity since it is one of the
key levers to achieving our long
term objectives.
Outlook
We continue to improve AAPP
since it will enable us to achieve
higher GWP. Political uncertainty
and slow down of economic
activities are key challenges in
this regard.
Outlook
We believe our people will
deliver our objectives therefore
we continue to invest in
attracting high quality sales
staff.
Key Value Drivers of Life BusinessWe consider the following key value drivers important in achieving our strategic objectives. Improving all value drivers at a given time is a
challenging task.
0.0
0.5
1.0
1.5
2.0
2.5
Productivity Ratio
No. oftimes
20172016201520142013
1.8
1.5
9
1.4
61.6
7
2.0
1
0
10,000
20,000
30,000
40,000
50,000
60,000
Annual Average Premium Per Policy (AAPP)
AAPPRs. Mn
Growth%
20172016201520142013
52,2
72
44,4
82
35,5
20
29,4
00
0
5
10
15
20
25
30
Average Annualized
Premium Per Policy
Growth
48,3
12

UNION ASSURANCE PLC | ANNUAL REPORT 2017
54
CAPITAL MANAGEMENT REVIEW FINANCIAL CAPITAL
Performance of Investment PortfolioA snapshot of the performance of strategic
investment assets is given below;
(500)
0
500
1,000
1,500
2,000
2,500
3,000
Rs. Mn
201720162015
2,6
00
815
214
1,4
22
2,0
27
776
(2)
992
109
Interest Income Received
Corporate
Securities
EquityGovernment
Securities
Investment in Government Securities
In 2017 UA invested Rs 6.5 Bn in treasury
securities which accounted for 81% of
total funds available for investments during
the year. With treasury yields declining in
2017, UA executed suitable investment
strategies to capture the double digit yields
that prevailed during the year. At the end
of 2017 investment in treasury securities
accounted for 70% of the life investment
portfolio (66% in 2016) which is significantly
above the minimum requirement of 30%
as per Section 25 of the Regulation of
Insurance Industry Act No 43 of 2000 and
subsequent amendments.
There were less corporate debentures
issues in 2017 and UA invested
Rs. 410 Mn in 2017 which was 5% of total
funds available for investment.
As government securities returns were
relatively attractive to other corporate fixed
income assets, UA did not invest in other
types of corporate fixed income securities
other than corporate debentures. As a
risk control measure UA only invested in
investment grade corporate securities.
Investment in Corporate Fixed Income Assets
Since we are in the life insurance business,
our liabilities are long term in nature in
comparison to our assets. Assets are
relatively short term. Maturity profile analysis
plays a pivotal role in strategic asset
allocation due to the asset and liability
tenure miss match.
Equity Portfolio
Given the attractive valuation in equities, UA
Life fund invested fresh cash of Rs. 524 Mn in
listed equities in 2017. As a strategic measure
UA exited from one stock during 2017 and
increased exposure to eight stocks in 2017.
Subscription to rights issues totalled to a
considerable amount, Rs. 154 Mn which was
29% of fresh investments made in equities.
UA Life funds equity portfolio outperformed
the total return index of S&PSL20 by
+3.56% in 2017.
(5)
0
5
10
15
20
Life Equities vs TRI S&PSL20
%
Dec-1
6
Jan-1
7
Feb
-17
Mar-
17
Ap
r-17
May-1
7
Jun-1
7
Jul-17
Aug
-17
Sep
-17
Oct-
17
Nov-1
7
Nov-1
7
UAL TRI S&PSL20
Unit Linked Investments
UA’s Unit linked investments related to
Unit Linked Insurance products fared well
during 2017. UA managed three unit liked
funds namely the Fixed income (FIXD),
Managed (MNGD) and Equity (EQTY) fund.
The Unit Linked Equity fund is outsourced
to an external fund management company.
The FIXD fund invests only in fixed income
instruments while EQTY fund invests at least
90% in equity and MNGD fund maintains a
balance between debt and equity. In terms
of unit prices growth, the FIXD, MNGD and
EQTY funds improved by 9.70%, 8.44% and
9.03% respectively.
(5)
0
5
10
15
20
Unit Linked Investments
Cumulative
YTD return %
Dec-1
6
Jan-1
7
Feb
-17
Mar-
17
Ap
r-17
May-1
7
Jun-1
7
Jul-17
Aug
-17
Sep
-17
Oct-
17
Nov-1
7
Dec-1
7
FIXD MNGD EQTY

55
UNION ASSURANCE PLC | ANNUAL REPORT 2017
MA
NA
GE
ME
NT
DIS
CU
SS
ION
AN
D A
NA
LYS
IS
Financial PerformanceYear 2017 was a challenging year for UA in terms of a slowdown of economic growth, negative performance in the capital market, depreciation of
the rupee and managing escalating costs. Despite these challenges, our strong fundamentals and strategy guided us to achieve strong growth in
Gross Written Premium and operating profits. Our healthy Capital Adequacy Ratio and dividend payout ratio indicate financial stability and quality
of our earnings. These fundamentals will deliver sustainable value to all our partners in short term as well as long term.
Income Statement
Element Rs. Mn 5 year performance and Commentary
Gross written
premiums
(GWP)
10,118
0
2,000
4,000
6,000
8,000
10,000
12,000
Gross Written Premiums (GWP)
GWPRs. Mn
Growth%
20172016201520142013
10,1
18
8,2
71
6,9
64
5,9
46
5,5
15
0
5
10
15
20
25
GWPGrowth
GWP has increased by 22% to Rs. 10.1 Bn as
a result of reforms in the agency leadership,
focused changes in compensation structures,
distribution channel transformation initiatives
and product development initiatives.
Premium
Ceded to
reinsurers
498
0
100
200
300
400
500
600
Premium Ceeded to Reinsurers
Premium ceededRs. Mn
Growth%
20172016201520142013
498
424
364
328
281
0
2
4
6
8
10
12
14
16
18
20
Rs. MnGrowth
Premium ceded to reinsurers has increased
in line with the GWP growth. Maintaining
approximately. 5% cession rate over the
years indicate consistency in our underwriting
practices.
Investment and
other income
4,033
(30)
(20)
(10)
0
10
20
30
40
50
Growth %
20172016201520142013
27%
50%
(26%
)
18%
38%
Investment and Other Income Investment and other income has increased
by 38% YoY due to increase in interest income
received from government securities and
debentures, unrealised gain from equity shares
and unrealised gain from forward treasury
bond purchases. Increase in interest rates of
government securities in the first half of the year
and portfolio rebalancing contributed to this
growth.
The Life fund was able to provide a weighted
average return of 12.48% and the shareholders’
funds weighted average return for the year
stood at 10.95%.

UNION ASSURANCE PLC | ANNUAL REPORT 2017
56
CAPITAL MANAGEMENT REVIEW FINANCIAL CAPITAL
Element Rs. Mn 5 year performance and Commentary
Net insurance
benefits and
claims
2,679
0
500
1,000
1,500
2,000
2,500
3,000
Rs. Mn %
20172016201520142013
2,6
79
1,4
73
1,3
33
1,1
42
0
5
10
15
20
25
30
1,5
95
Net Insurance Benefits and Claims
Rs. Mn% from NWP
Net insurance benefits and claims has
increased by 68% YoY mainly due to increase
in maturity payouts and policy surrenders.
Maturity payout increased in line with policy
payout dates and surrenders increased due to
the challenging economic environment.
Net claims as a percentage of net written
premium has increased to 28% ( 2016 -19%)
with the increase of maturity payments.
Objectives 2017 2016 Growth
Maturities 1,882,229 1,016,155 85%
Policy Surrenders 509,552 363,818 39%
Death Disability and Hospitalisation 273,888 213,221 28%
Annuity Payments 13,366 2,191 510%
Total Net Claims and Benefits 2,679,035 1,595,385 68%
Underwriting
and net
acquisition
costs
1,841
Underwriting and net acquisition costs has increased
by 28% due to growth in GWP and change in the
incentive structure.
In addition, acquisition cost accounts for 61%
of the new business premium earned.
Operating,
administration
and other
expenses
2,609
0
500
1,000
1,500
2,000
2,500
3,000
Rs. Mn %
20172016201520142013
2,6
09
1,8
52
1,7
47
1,6
60
0
5
10
15
20
25
30
Expense
As a % of NWP
2,1
76
Operating, Administration and Other Expenses Operating, administration and other
expenses increased by 20% to support
the growth in GWP.
0
500
1,000
1,500
2,000
2,500
3,000
3,500
New Business Premium as a % of Net Acquisition Cost
Rs. Mn %
20172016201520142013
3,0
38.6
3
1,8
41
1,1
16
1,3
67.4
6968
0
20
40
60
80
Contribution1,5
64.1
7
1,2
89
1,9
76.0
4
1,4
42
2,4
66.5
3
Acquisition Cost
New Business
Premium Earned
0
500
1,000
1,500
2,000
Underwriting and Net Acquisition Costs
Rs. Mn %
20172016201520142013
1,8
41
1,2
89
1,1
16
968
0
5
10
15
20
25
30
1,4
42
Rs. Mn% from NWP

57
UNION ASSURANCE PLC | ANNUAL REPORT 2017
MA
NA
GE
ME
NT
DIS
CU
SS
ION
AN
D A
NA
LYS
IS
Element Rs. Mn 5 year performance and Commentary
Operating
profits
(Recurrent)
3,814
0
600
1,200
1,800
2,400
3,000
3,600
4,200
Rs. Mn %
20172016201520142013
3,8
14
1,0
39
881
791
0
30
60
90
120
150
180
210
Profit for the YearGrowth
1,3
13
Operating Profit Operating profits have increased by 190%
mainly due to surplus transfer of Rs. 3,642
million in 2017 and higher interest income
received from treasury bonds due to increase
in life shareholder investments as a result of the
surplus transferred in 2016.
(Excluding one - off surplus transfer of
Rs. 3.4 billion in 2017).
Return on
Assets (ROA)
Return on
Equity (ROE)
(Recurrent)
10.2%
64%
0
10
20
30
40
50
60
70
80
%
2017201620152014
2.5
%
36%
23%
16%
3.6
%
3.7
%
10.2
%64%
ROE and ROA
ROEROA
The Company recorded ROA and ROE of
10.2% and 64% against 3.7% and 36% in 2016
respectively. Increase in both ratios was a result
of growth in profits.
(Excluding one - off surplus transfer of
Rs. 3.4 billion in 2017).
Economic Value StatementOur economic value added statement reflects
the manner in which the company has
created and distributed wealth among various
stakeholders throughout the value chain. The
total value generated for the current year is
Rs. 13,841 million. The total value addition has
increased by 28% compared to the preceding
year and recorded a compounded average
growth of 16% over the previous 5 years.
0
2,000
4,000
6,000
8,000
10,000
12,000
14,000
16,000
Value addedRs. Mn
Growth%
20172016201520142013
10
,82
4
13
,84
1
9,1
128,9
45
7,4
59
Economic Value Added
0
5
10
15
20
25
30
Rs. Mn Growth
Rs. Mn 2017 2016 2015 2014 2013
Direct economic value generatedNet written premium 9,620 7,847 6,600 5,617 5,234
Other revenue 4,033 2,917 2,454 3,328 2,225
Share of results of equity
accounted investee 188 60 58 - -
13,841 10,824 9,112 8,945 7,459
Economic value distributedas operating costs 1,631 1,302 1,008 997 999
to employees as salaries and
other benefits 816 772 659 634 638
to life policyholders as benefits
and claims paid 2,679 1,595 1,473 1,333 1,042
to intermediaries as commissions 1,841 1,442 1,289 1,116 968
to Government as taxes 57 51 36 23 23
to shareholders as dividends 619 501 557 362 248
7,643 5,663 5,022 4,465 3,918
Economic value retainedas depreciation 72 81 89 65 45
as amortisation 33 30 31 28 19
as profit after dividends 3,383 812 569 519 543
as increase in Life fund 2,710 4,238 3,401 3,868 2,934
6,198 5,161 4,090 4,480 3,541
GRI 201-1 | 203-2

UNION ASSURANCE PLC | ANNUAL REPORT 2017
58
CAPITAL MANAGEMENT REVIEW FINANCIAL CAPITAL
Other Comprehensive Income
Other comprehensive income includes revaluation gains of Rs. 539 Mn arising from revaluation of Head Office and Kurunegala properties.
Valuation gain arising from the Available For Sales financial instruments amounts to Rs. 790 Mn as a result of decrease in interest rates.
Statement of Financial Position
Ratio Rs. Mn 5 year performance and Commentary
Total assets 43,067
0
10,000
20,000
30,000
40,000
50,000
Rs. Mn %
2017201620152013 2014
Total Assets
(15)
0
15
30
45
60
30,3
19
35,6
04
31,0
14
35,6
93 4
3,0
67
Rs. MnGrowth
Total Assets of the Company has increased
by 21% mainly due to the increase in financial
investments.
Financial
investments
36,793
0
5,000
10,000
15,000
20,000
25,000
30,000
35,000
40,000
InvestmentRs. Mn
Growth%
20172016201520142013
Financial Investment
24,0
39
24,2
97
26,5
41
30,8
47 36,7
93
(10)
(5)
0
5
10
15
20
25
30
Rs. MnGrowth
Financial investments have increased due to the
inflow of Rs. 6,248 million policyholder funds into
the investment portfolio.
0
5,000
10,000
15,000
20,000
25,000
30,000
35,000
Investment in Government Securities - Life Fund
InvestmentRs. Mn
Growth%
20172016201520142013
24,9
0729,0
71
23,0
54
11,1
70
19,3
25
0
20
40
60
80
100
16,2
64
26,2
72
19,5
28
30,2
67
19,8
92
Life Insurance
Fund
Investment in
Government
Securities
Growth in
Investment in
Government
Securities
Financial investment in Government Securities
increased in order to safe guard the policyholder
interest as per the IRCSL guidelines.
Intangible
assets
Property plant
and equipment
213
2,001
0
400
800
1,200
1,600
2,000
2,400
2,800
ValueRs. Mn
Growth%
2017201620152013 2014
PPEIntangible Assets
Growth in PPE
Growth in Intangible Assets
Intangible Assets and Property, Plant
& Equipment
-60
-30
0
30
60
90
120
150
Intangible assets have increased due to
the investment in the new core IT platform
(Policy Administration System).
Property, plant and equipment value has
increased mainly due to revaluation of Head
Office and Kurunegala properties.

59
UNION ASSURANCE PLC | ANNUAL REPORT 2017
MA
NA
GE
ME
NT
DIS
CU
SS
ION
AN
D A
NA
LYS
IS
Ratio Rs. Mn 5 year performance and Commentary
Insurance
contract
liabilities
29,071
0
5,000
10,000
15,000
20,000
25,000
30,000
35,000
Insurance Contract Liabilities
Rs. Mn %
201720162015201420132,1
22
23,7
31
20,4
36
17,5
18
0
5
10
15
20
25
LICL - Life
LICL - Unit LinkedGrowth %
27,8
90
26,9
50
2,5
41
2,6
18
1,8
07
2,3
78
Life insurance contract liabilities refer to the
reserves set aside to meet future claims and
maturities of life insurance policyholders.
There is a 4% decrease in insurance contract
liabilities mainly due to one - off surplus
transfer of Rs. 3.4 billion in 2017.
Shareholders’
funds
11,965
0
3,000
6,000
9,000
12,000
15,000
Rs. Mn %
20172016201520142013
Shareholder’s Funds
(50)
30
110
190
270
350
Stated Capital
Restricted Regulatory
Reserves
Retained Earnings
Reserves
Growth in Equity
UA is a fully equity funded company and
retained earnings is the main source of
capital for future strategic investments.
Shareholder fund has increased by 209%
due to current year profits of Rs. 7.4 billion.
Current year profit includes normal surplus
transfer of Rs. 3.6 billion and one - off surplus
transfer of Rs. 3.4 billion.
Capital
Adequacy
Ratio (CAR)
352%
0
5,000
10,000
15,000
20,000
Capital Adequacy Ratio
Rs. Mn %
14,2
74
4,2
58
14,0
73
0
100
200
300
400
500
3,5
09
15,4
91
3,8
76
16,5
38
4,7
02
Total Available Capital (TAC)
Risk Capital Required (RCR)
Capital Adequacy Ratio
Q4
2017
Q3
2017
Q2
2017
Q1
2017
Minimum CAR
Regulatory
Intervention Level
120%160%
CAR under the Risk Based Capital (RBC)
regime measures adequacy of the Total
Available Capital (TAC) as against the Risk
Capital Required (RCR). Healthy CAR of UA
reflects the financial stability of the Company.
Cash Flow
Cash Flow Based on Activities Commentary
-5,000
-4,000
-3,000
-2,000
-1,000
0
1,000
2,000
3,000
4,000
5,000
6,000
Rs. Mn
Financing
activities
Investing
activities
Operating
activities
(4,5
07)
(4,5
40)
(464)
(583)
5,0
03
5,3
01
Cash Flow Generated Based on Activities
2016
2017
Cash in hand & at banks and short term deposits, net of bank overdraft balance stood at
Rs. 417 million as at 31 December 2017 compared to Rs. 239 million of previous year.
During the year under review net cash generated from operating activities was Rs. 5,301
million. The majority of these funds were from insurance premiums. Cash flow management
is key to UA since it has assets with short term tenures, and liabilities with long term tenures.
The investment team, actuarial team and the Investment Committee of UA regularly reviews
the maturity profiles of assets and liabilities and necessary action is taken to minimise the
impact of asset liability cashflow mismatches.
Significant outflow in investing activities mainly reflects the investment of net fund inflow from
the life business.

UNION ASSURANCE PLC | ANNUAL REPORT 2017
60
CAPITAL MANAGEMENT REVIEW FINANCIAL CAPITAL
UA Share Performance The detailed analysis of UA’s share is
discussed below.
Local Share Market Review
In 2017 the CSE returned bullish and
produced positive returns against the
negative trend displayed in 2016. The
ASPI improved by +2.26% while the
S&PSL20 improved by +5.01%. During
the first quarter of 2017 the ASPI declined
to the lowest at 5,974.94 (-4.07% YTD)
however reverting back thereafter, to reach
the highest at 6,766.14 (+8.64% YTD) in
July. Subsequently, the market declined
resulting a net return of +.2.26 for the year.
The S&PSL20 in 2017 reached the highest
at 3,933.51 (+12.50% YTD) and lowest at
3,398.17 (-2.81% YTD).
The overall market capitalization as at the end
of 2017 amounted to Rs. 2.89 trillion which is
+5.61% higher than previous year. The Price
to Earnings (PE) and price to book value
(PBV) ratios further deteriorated in 2017.
The PE and PBV stood at 10.60X and 1.31X
respectively indicating the low valuation when
compared with the regional peers.
CSE saw net inflows of foreign investments
amounting to Rs. 17 Bn which was higher
than last year’s Rs. 384 Mn. A significant
amount of net foreign investments were seen
from March to July resulting in high daily
volumes and high returns during this period.
Favourable macro related factors such as
passing of the new Inland Revenue Act, the
Foreign Exchange Act, the completion of
the Hambantota port sale, prudent action by
the CBSL, Fitch Ratings assigning B+ with
a stable outlook, and decline in local bond
rates supported the positive performance
of the CSE. Extreme weather conditions,
slowdown in consumption, upward inflation,
and increase in taxes for certain sectors
had a negative bearing on equities in 2017.
When compared with peer market’s CSE
has underperformed in terms of YTD return
against most markets.
(6)
(3)
0
3
6
9
12
15
CSE Performance
Growth %
Jan
Feb
Mar
Ap
r
Ma
y
Jun
Jul
Aug
Sep
Oct
Nov
Dec
ASPI S&PSL20
(40)
(20)
0
20
40
60
Regional Equity Market Returns
%
Vie
tnam
IM
I
Chin
a
Fro
ntier
mark
et A
sia
Em
erg
ing
mark
et A
sia
Nig
eria
Em
erg
ing
mark
et
Thaila
nd
Fr o
ntier
mark
et
Kore
a
Ind
ia
AC
Asia
Pacific
Taiw
an
Bang
lad
esh IM
I
Chin
a A
Ind
onesia
IMI G
ross
Sri L
anka IM
I
Sri L
anka
Pakis
tan IM
I
Pakis
tan
42.8
3%
37.2
8%
32.3
2%
30.4
9%
27.5
3%
20.4
7%
6.1
7%
-24.1
8%
-28.0
5%
54.3
3%
55.9
2%
45.8
2%
37.6
4%
34.5
2%
30.5
6%
28.7
1%
21.1
5%
19.6
1%
2.9
1%
Source: MSCI Index for each Market
UA Share Price
Total number of shares in issue as at
31/12/2017
Public shareholding
as at 31/12/2017
Stock Symbol
58,928,572
UAL.N0000 6.19%
UA Share Elements
Issued Share Capital
The number of shares in issue by the
Company remained as previous year at
58,928,572 shares.
UA Share Performance vs Market Performance
During the year, UA share declined by 5.6%
to close at Rs. 135.00 by end of 2017. UA
share traded between a low of Rs. 134.00
(-6.29% YTD on 07 December) and high
of Rs. 165.00 (+15.38% YTD on 10 March)
during 2017. The negative return could be
partially attributed to the higher taxes on the
life insurance sector. Adequate corporate

61
UNION ASSURANCE PLC | ANNUAL REPORT 2017
MA
NA
GE
ME
NT
DIS
CU
SS
ION
AN
D A
NA
LYS
IS
-6
-3
0
3
6
9
12
15
UA Share Performance vs Market Performance
%
UAL ASPI S&PSL20
Jan
Feb
Mar
Ap
r
May
Jun
Jul
Au
g
Se
p
Oct
Nov
Dec
EPS vs Retention Per Share
The solid improvement in GWP (22% YoY)
and other revenue (38% YoY) outweighed
benefits, claims and expenses (11% YoY )
that resulted in EPS of Rs. 67.92, growth of
+205% YoY. The items contributing to profits
are discussed in depth in the financial
performance section.
0
10
20
30
40
50
60
70
80
EPS vs Retention Per Share
Rs. Mn %
2017
2008
2009
2010
2011
2012
2013
2014
2015
2016
67.9
2 1
49.9
2 1
4.5
6
2.9
4
5.3
5
2.8
5
6.8
3
3.7
0 9.2
7
4.2
7 12.2
8
7.2
8 13.1
1
7.1
1
14.0
4
7.5
4 14.9
6
6.4
6
22.2
7
11.7
7
0
10
20
30
40
50
60
70
80
EPS
Retention Per ShareRetention Ratio
1 Excluding one - off surplus transfer of Rs. 3.4 billion in 2017
Dividends Yield
The dividend policy of UA seeks to ensure
a dividend payout which correlates with
the growth in profits, while ensuring that
the Company retains adequate funds to
meet the risk based capital requirements
as stipulated by the Insurance Regulatory
Commission of Sri Lanka (IRCSL) in the
short, medium and long term. The Board of
Directors declared a first and final dividend
of Rs. 18.00 per share, based on the profits
of 2017. Accordingly, the gross dividend
payable out of the profits for the year ended
31 December 2017 will be Rs. 1,061 million,
compared to the dividend of Rs. 619 million
in the previous year.
Gross Dividend vs Dividend Payout
After considering the dividend of Rs. 1,061
million, the capital adequacy ratio (CAR) of
the Company is 352%. This is significantly
above the minimum CAR required under
RBC requirements of 120%.
0
3
6
9
12
15
%
2017201620152014
13.3
3%
5.9
0%
3.9
0%
3.7
0%
Dividends Yield
0
200,000
400,000
600,000
800,000
1,000,000
1,200,000
Gross Dividend vs Dividend Payout
Gross DividendsRs. Mn
Payout%
2017
2008
2009
2010
2011
2012
2013
2014
2015
2016
1,0
60
,71
4
121,8
75
187,5
00
234,3
75
375,0
00
428,5
71
514,2
86
557,1
43
500,8
93
618,7
50
0
10
20
30
40
50
60
70
80
Gross Dividends Dividend Payout
Total Shareholder Return
Total return to shareholders amounted
to 6.99% that was mainly driven by the
dividend return. Even though UA’s share
declined by 5.59% the dividend yield of
12.59% (against the opening price in 2017)
resulted in a total return of 6.99%.
Rs.18.00Dividend per Share [ 2016: Rs.10.50 ]
disclosures are provided to the financial
community by UA in order to allow optimum
pricing of UA securities. The share’s beta
values against ASPI stood at 0.73 as of third
quarter of 2017.

UNION ASSURANCE PLC | ANNUAL REPORT 2017
62
CAPITAL MANAGEMENT REVIEW FINANCIAL CAPITAL
(10)
(8)
(6)
(4)
(2)
0
2
4
6
8
%
201720162015
6.9
9%
(9.4
0%
)
4.6
0%
Total Shareholder Return
Market Capitalisation
Due to the decline UA share price, the
market capitalisation of the company
decreased by 5.6%YoY to Rs. 7.96 billion
as at 31 December 2017. At the financial
year end, UA represented 0.3% of the total
market capitalisation of the Colombo Stock
Exchange.
0
3,000
6,000
9,000
12,000
15,000
Market Capitalisation
Rs. Mn
20172016201520142013
7,9
559
,72
3
14
,05
7
8,9
14
8,4
27
Price Earning Ratio (PER)
PER of UA share was 1.99 times as at 31
December 2017 excluding one - off surplus
transfer of Rs. 3.4 billion in 2017 compared
to 6.42 times recorded in the previous
financial year. The noticeable low PE is due
to the consolidated impact from improved
EPS and decline in UA’s stock price. When
considering the Market PE of 10.60x, UA is
trading at a significant discount.
0
2
4
6
8
10
12
14
Times
20172016201520142013
7.9
4
11
.68
5.2
9
6.4
2
1.9
9
Price Earnings Ratio (PER)
Price to Book Ratio
The price to book ratio of the Company
as at 31 December 2017 was 0.93 times,
a decrease of 57% YoY from 2.18 times
recorded in the previous financial year. The
ratio decreased due to the increase in the
net assets value per share to Rs. 145.65
and the decrease in UA share price as
discussed above.
0.0
0.5
1.0
1.5
2.0
2.5
3.0
Times
2017 12016201520142013
1.7
4
2.2
6
2.8
1
2.1
8
0.9
3
Price to Book Ratio
1.99Price Earnings Ratio (PER) [ 2016: 6.42 ]
Net Assets Per Share (NPS)
NPS has increased by 122% due to
increase in net assets as a result of current
year profits and consistent number of
shares in issue.
0
30
60
90
120
150
%
2017 12016201520142013
14
5.7
58
.8
72
.5
59
.7
65
.6
Net Assets Per Share (NPS)
1 Excluding one - off surplus transfer of
Rs. 3.4 billion in 2017
Liquidity
During the financial year, 341,956 shares
changed hands over 800 transactions
compared to 134,090 shares changing hands
over 500 transactions in the previous financial
year. The average daily turnover of the UA
shares was Rs. 350,603 during 2017 in
comparison to Rs. 173,963 recorded last year.
Trading Statistics 2017 2016
Number of transactions 819 509
Number of shares traded 341,965 134,090
Value of shares traded (Rs.) 49,785,678 20,527,634
Shares traded as a percentage of total shares in issue (%) 0.6 0.2
Market capitalisation (Rs.) 7,955,357,220 8,426,785,796
Percentage of market capitalisation (%) 0.3 0.3
Gross dividends (Rs.Mn) 1,061 619
1 Excluding one - off surplus transfer of
Rs. 3.4 billion in 2017

63
UNION ASSURANCE PLC | ANNUAL REPORT 2017
MA
NA
GE
ME
NT
DIS
CU
SS
ION
AN
D A
NA
LYS
IS
Distribution and Composition of ShareholdersUA has a diversified shareholder base, both
geographically and in the ratio of private to
institutional investors. The total number of
shareholders increased from 1,326 as at 31
December 2016 to 1,333 as at 31 December
2017. The number of public shareholders and
percentage of shares held by the public as
at 31 December 2017 was 1,330 and 6.19%
respectively (31 December 2016 - 1,323 and
6.07%). On 31 December 2017, UA had 1,239
registered individual shareholders, representing
93% of the shareholders; 72% of the
shareholders hold less than 1,000 shares. The
vast majority of UA’s individual shareholders are
residents of Sri Lanka. Institutional shareholders
represent approximately 95% of UA’s ordinary
share capital.
The top twenty shareholders hold 96.95%
of UA’s shares. The Directors of UA held
0.01% of the total outstanding shares in their
individual capacity as of 31 December 2017.
Composition of Shareholders
31 December 17 31 December 16No of
shareholders %No of
shares %No of
shareholders %No of
shares %
Directors & spouses: 1 0.08 8,562 0.01 1 0.08 8,562 0.01
RESIDENTIndividuals 1,226 91.96 2,739,864 4.65 1,217 91.78 2,151,832 3.65
Institutions 90 6.75 5,104,258 8.66 94 7.09 5,754,382 9.77
NON-RESIDENT:Individuals 12 0.9 62,409 0.11 11 0.83 25,258 0.04
Institutions 3 0.23 31,941 0.06 2 0.15 7,000 0.01
Shareholders holding more
than 10%: 1 0.08 50,981,538 86.51 1 0.08 50,981,538 86.51
Total 1,333 100 58,928,572 100 1,326 100 58,928,572 100
Distribution of Shareholders
Range of shareholders31 December 17 31 December 16
No of shareholders %
No of shares %
No of shareholders %
No of shares %
Less than 1,000 954 71.57 243,856 0.41 938 70.74 241,401 0.41
1,001 to 10,000 327 24.53 1,046,141 1.78 334 25.19 1,063,873 1.81
10,001 to 100,000 44 3.30 1,111,376 1.89 47 3.54 1,144,962 1.94
100,001 to 1,000,000 6 0.45 1,253,401 2.12 5 0.38 1,134,026 1.92
Over 1,000,001 2 0.15 55,273,798 93.80 2 0.15 55,344,310 93.92
Total 1,333 100 58,928,572 100 1,326 100 58,928,572 100
Market Information of Ordinary Share of the Company
Market value 2017 2016
Highest price (Rs.) 165.00 (10 March 2017) 167.90 (26 February 2016)
Lowest price (RS.) 134.00 (07 December 2017) 127.00 (28 December 2016)
Closing price (Rs.) 135.00 143.00
Directors’ Shareholders
No. of shares as at 31.12.2017 31.12.2016
Mr. Ajit D. Gunewardene (Chairman)
[Resigned w.e.f. 31.12.2017]
8,562 8,562
Mrs. D. C. Alagaratnam Nil Nil
Mr. S. Rajendra Nil Nil
Mr. A. S. De Zoysa Nil Nil
Mr. G. F. C. De Saram Nil Nil
Mr. H. A. J. De S. Wijeyeratne Nil Nil
Mr. A. D. Pereira Nil Nil

UNION ASSURANCE PLC | ANNUAL REPORT 2017
64
CAPITAL MANAGEMENT REVIEW FINANCIAL CAPITAL
CEO’s Shareholding
No. of shares as at 31.12.2017 31.12.2016
Mr. A. D. Pereira Nil Nil
Twenty Largest Shareholders
Name of ShareholderAs at December 2017 As at December 2016
No of shares % No of shares %
1 John Keells Holdings PLC 50,981,538 86.51% 50,981,538 86.51%
2 Whittall Boustead Limited 4,292,260 7.28% 4,362,772 7.40%
3 Mrs. A.S.Palihena 600,000 1.02% 600,000 1.02%
4 Corporate Holdings (Private) Limited 149,373 0.25% 149,373 0.25%
5 People's Leasing & Finance PLC / Hi - Line Trading (Pvt) Ltd 146,360 0.25% 146,360 0.25%
6 People's Leasing & Finance PLC / Mr. L.P. Hapangama 137,210 0.23% 118,255 0.20%
7 Dr. (Mrs.) V. Bandaranayake 120,038 0.20% 120,038 0.20%
8 Mr. D.F.G. Dalpethado 100,420 0.17%
9 People's Leasing & Finance PLC / Mr. L.H.L.M.P Haradasa 88,392 0.15% 88,392 0.15%
10 People's Leasing & Finance PLC / Dr. H.S.D. Soysa & Mrs. G.Soysa 82,701 0.14% 60,066 0.10%
11 Mr. H.A.D. Ratnapala 56,250 0.10% 56,250 0.10%
12 Mr. J.W. Nanayakkara 56,250 0.10% 56,250 0.10%
13 Mrs. R.Z. Wikramanayake (Deceased) 53,585 0.09% 53,585 0.09%
14 Dr. N.I. Wikramanayake 53,059 0.09% 53,059 0.09%
15 Mr. V.S. Vikas 44,200 0.08%
16 Mr. H.A. Rehmanjee 40,000 0.07% 40,000 0.07%
17 Mr. N.D. Kurukulasuriya 39,000 0.07% 39,000 0.07%
18 Mrs. L. Amaradasa 33,750 0.06% 33,750 0.06%
19 Mr. S. Vasudevan 28,800 0.05% 28,800 0.05%
20 Mrs. M. R. Wijetunga 28,124 0.05% 28,124 0.05%
Others 1,797,262 3.04% 1,912,960 3.24%
Total 58,928,572 100.00% 58,928,572 100.00%
Record of Changes in Number of Shares
Year Issue Basis No. of shares Share capital (Rs.)
1987 Prior to public issue - 8,000,000 80,000,000
1988 Public issue - 2,000,000 20,000,000
1995 Rights @ Rs. 50 3:1 3,333,333 33,333,333
1999 Bonus 2:1 6,666,667 66,666,667
2002 Bonus 4:1 5,000,000 50,000,000
2007 Bonus 2:1 12,500,000 125,000,000
2011 Share split 1:2 37,500,000 -
2012 Rights @ Rs. 70 7:1 10,714,286 750,000,020
2015 Share repurchase 32:10 (26,785,714) -
2015 Capital reorganisation - (125,000,020)
58,928,572 1,000,000,000

Customers Community Business Partners
Management ApproachOur successful journey of 30 years is built on our commitment to maintain strong and sustainable relationships that differentiate us from
competition. We are committed to provide a superior customer experience through unique insurance propositions and services to our
customers. Our CSR initiatives aim to achieve healthy Sri Lankan communities and we endeavour to be a fair and transparent business
partner to our suppliers.
SOCIAL AND RELATIONSHIP CAPITAL
65

UNION ASSURANCE PLC | ANNUAL REPORT 2017
66
2017 Objectives and Achievements
Objectives - 2018 and Beyond
Objectives Year
Drive direct customer engagement 2018
Improve persistency 2018 and beyond
Reduce operating costs 2018 and beyond
Use CSR platform (dengue, thalassaemia and diabetes awareness campaigns) to improve health of the community 2018 and beyond
Better supply chain management to provide superior customer service 2018 and beyond
Develop products beyond protection and engage a whole ecosystem 2018 and beyond
Challenges Intense market competition Pages 43 to 47
Change in customer needs Pages 41 to 43
Digitisation and disruptive innovation Pages 42 and 43
Develop a new Customer Feedback System
Enhanced solution selection process for customers
Improve persistency
Lean initiatives to optimise life operation processes for better customer service
Enable gainful employment for working mothers and part time job seekers
Use CSR platforms to achieve CSR objectives for the year 2017.
Completed in February 2018
‘Chatbot’ has been launched with product
recommendation features.
12 months persistency improved from 76% to
83% by the year end
208 programmes carried out during the year
Training conducted for customer service
staff and revised performance criteria –
Ongoing.
23 number of e-Consultants recruited and
the project is progressing well. 66 number
of permanent staff signed up to work from
home or work with flexi work arrangement.
Key Performance Measures
25%Expansion of ProtectionRs. 3 billion of New Business
Growth in Lives Covered
3Meeting Emerging Customer NeedsNew propositions for Retirement,
Investment & Savings and
Health needs
79%Customer Satisfaction467 Complaints Settled by
the year end
Rs.2.7BnBenefits and Claims Paid
900,000+Lives TouchedThrough Dengue, Thalassaemia
and Diabetes awareness
campaigns
Rs. 2.3BnSupplier RelationsOn time supplier settlements
CAPITAL MANAGEMENT REVIEW SOCIAL AND RELATIONSHIP CAPITAL

67
UNION ASSURANCE PLC | ANNUAL REPORT 2017
MA
NA
GE
ME
NT
DIS
CU
SS
ION
AN
D A
NA
LYS
IS
Building
competencies
to serve customers
Customer relationship
management
Customer Capital Building Model
CustomersCustomers are the reason for the existence of the Company. With the wide geographic presence consisting of 97 branches and 4,002 Agency
force, UA offers a spectrum of products to suit the diverse protection, retirement, health, investment and saving needs of our customer base.
Customer Relationship Capital
Customer Capital Building Activities
Re-
Dep
loym
ent
Responsible Service
Customer Satisfaction
Customer Loyalty
Brand Equity
Customer Relationship Capital
Provide Affordable
and Quality
Products
Deliver Superior
Customer
Service
Regular Feedback
and Complaint
Management
Reaching the Customer
Physically Digitally
Reaching Our Customers
We connect with our customers genuinely,
thoughtfully and frequently, because we
believe that this dialogue is vital in creating
the level of brand equity we seek. Customer
contact takes place over multiple platforms
in ways that are convenient and relevant
to each individual whether face to face,
online, or over the phone. Our branch
network enables us to reach customers
in all corners of the country and provide
them with insurance solutions most suited
to their needs, making premium payments,
administering changes in line with their
requirements, or processing claims.
Refer page 6 for our operating footprint.
Responsible Service
Our focus is to provide affordable and
quality products, deliver superior customer
service and settle claims fairly and
speedily in line with UA’s philosophy of
overall corporate responsibility; giving our
customers the assurance of integrity across
the value creation. Responsible customer
care enables the Company to mitigate
risks, which may otherwise lead to loss of
credibility and reputation.
We continually seek to develop innovative
insurance solutions and have brought two
new plans to market during the year. At
UA we have a comprehensive portfolio of
products from savings and investments,
to protection, family healthcare and
retirement, covering all life stages. These
are supported by a comprehensive range
of riders covering, for example, accidental
death, disability, critical illness, funeral
expenses, hospital cash and family income
benefits.
GRI 102-2 | 416-1 | 417-1
240,258[2016 - 253,843]
07[2016 - 04]
92%
08[2016 - 08]
No. of Lives Covered
No. of Key Insurance
Propositions
% of Claims Settled within
a day
No. of Payment Channels
Customers
Key Performance Measures

UNION ASSURANCE PLC | ANNUAL REPORT 2017
68
CAPITAL MANAGEMENT REVIEW SOCIAL AND RELATIONSHIP CAPITAL
Our Unique Life Insurance Propositions
Retail Customers
Customer Segment / Product Name
Customer Need Key Features
Union Advantage
with additional benefits /
covers
Base plan provides flexibility to add combination of
protection covers to ensure tailor-made protection;
An additional life cover can be added up to 5 times the
basic sum assured for a minimal premium.
Double accidental death benefit for a higher protection
against accidental deaths.
Family income benefit enables dependents to continue to
enjoy the quality of life.
Disability benefit to provide protection against permanent
disabilities.
Protection benefits can be extended to cover the spouse.
Protection
GRI 102-2
Union Advantage
with additional covers to
provide a tailor - made health
solution
Union Advantage
Universal life product with
long-term premium payment
to build an investment for
savings need
Union Super Investor:
Universal life product with
short-term premium payment
to boost an investment for
savings need
Union Single Premium
Advantage:
Universal life product allowing
customers to deposit a lump
sum for higher investment
benefits.
Range of health benefits available to complement the base
plan and to provide a comprehensive health solution;
Union Smart Health is a comprehensive medical
expenses reimbursement rider benefit which can be
added to the Advantage Plan. The benefit also provides
a “cashless card” for hassle free hospital bill payment
and treatments within Sri Lanka, India, Thailand,
Singapore and Malaysia.
The benefit can be taken as a “family cover” or
“individual cover”
Hospital cash benefit is available for the whole family,
where a fixed per day benefit is payable for each day
hospitalised.
Critical Illness covers against 24 predefined critical
illnesses.
Funds invested is professionally managed with a track
record of attractive returns.
100% of distributable investment yield of the life fund
credited as dividend to customers’ individual “investment
account.”
Individual investment account accumulates monthly with
dividends to enhance returns and this fund value will be
paid at maturity.
Guaranteed minimum dividend declared at the
beginning of each calendar year.
In the event of an unfortunate demise of the policyholder,
the value of the investment account or the sum assured,
whichever is higher will be paid to the nominees.
Family Healthcare
Savings & Investments with Protection

69
UNION ASSURANCE PLC | ANNUAL REPORT 2017
MA
NA
GE
ME
NT
DIS
CU
SS
ION
AN
D A
NA
LYS
IS
GRI 102-2
Retail Customers
Loan Customers
Customer Segment / Product Name
Customer Need Key Features
Pension Advantage
Universal life product
that builds a fund for
retirement with regular
premium remittances up
to desired retirement age.
GOYO
Personal health advisor
Union Loan Protection
Decreasing term
assurance policy to
cover all loan types
A monthly pension starting from the chosen retirement
age (i.e. 55/ 60/ 65) for a fixed period.
In the event of a total permanent disability, future
premium payments will be waived off and the policy will
be continued to ensure the intended pension payment.
An additional cover is available to ensure continuous
payment of premiums in the event of an untimely death
of the policyholder.
A wearable device linked to an “App” which works as a
“personal health advisor”.
This motivates users to achieve personal fitness targets
by offering rewards and benefits from a host of local and
international partners.
Single premium policy
Sum assured decreases periodically with loan
repayments.
Provides cover against death or total permanent
disability of the policyholder.
Simplified underwriting for hassle free administration.
Ability to provide group cover covering all Housing loans,
Loans against property, Business loans against security
up to 10 million without any underwriting.
Minimum underwriting requirements with very high
non-medical limits for loans falling outside the above
category.
Retirement
Wellness Solution
Protection Against Loan Repayment
Corporate Customers
Union Protect
Employee benefit
scheme to provide
a comprehensive
protection solution
Group life policy ensuring simple administration
Simplified underwriting requirements
Flexible solution customised to suit the financial
objectives and needs of employees.
Able to include additional protection benefits to cover
critical illness, hospitalisation, disability etc.
Employee Welfare

UNION ASSURANCE PLC | ANNUAL REPORT 2017
70
CAPITAL MANAGEMENT REVIEW SOCIAL AND RELATIONSHIP CAPITAL
GRI 102-2
Multiple Payment Channels
With customer convenience in mind, we
have tied up with multiple service providers
to open a wide array of payment channels to
our customers. During the year under review,
UA has taken various measures to increase
usage of alternative payment channels
including mobile cash. The company
focused on the mobile payment channel to
leverage the mobile phone penetration in
Sri Lanka. Further steps have been taken
to increase standing order payments. At
the end of the year standing order usage
has increased to 15% in agency and 25%
in bancassurance channel. These payment
modes are convenient and also improve
persistency enabling their insurance policies
to continue undisrupted.
The following illustration gives a list
of payment channels available to our
customers.
Deliver Superior Customer Service
In our business, customer service is of high
importance. From initiation of a policy to
the event of a claim or maturity, we strive
to provide customers with best in class
service. We firmly believe that price is not a
long term differentiator, but that consumers
will look to partner with an insurance
company which offers them convenience
and transparency and provide greater value
to them in every customer engagement.
Customer Connectivity
Online
UA website is dynamic with increasing
traffic. We continuously receive product
inquiries via our web page. We also interact
with our customers via Facebook, which
saw strong engagement during the year.
UA 24/7 Call Centre
Customers can access our call centre 24/7 to make claim inquiries, product inquiries or
provide feedback. This personalised interaction helps us to develop real and enduring
relationships with our customers. Our call centre statistics as follows;
Standing Order
Internet Banking
ATM Tele Banking
Over the Counter
Credit Card
Mobile Cash
Pay Easy
1
11
1 11
72
1
5 52
2
6 22 3
2
63
5
4 4
3
5 5 6
45 6 8
2 3 4 5 6 7 8
The number indicates each payment channel
0
50,000
100,000
150,000
200,000
250,000
No. of visits No. of likes
201720162015
Number of Corporate Website Visits and Corporate Facebook Likes
Corporate
Website Visits
Corporate
Facebook Likes
50,000
100,000
150,000
200,000
1,256
25,642
215,612
Daily
MonthlyYearly
Average Incoming
Calls

71
UNION ASSURANCE PLC | ANNUAL REPORT 2017
MA
NA
GE
ME
NT
DIS
CU
SS
ION
AN
D A
NA
LYS
ISRegular Feedback and Complaint Management
At UA, we have consistently improved the
quality of our customer service and strive
to be the benchmark of the industry. In our
commitment to deliver superior customer
service we place high importance to all
customer complaints that we receive.
Customers are able to send their feedback /
complaints in writing or call on our customer
service hotline +94 112990990 or lodge
the complaint in writing or verbally at any of
our branch locations. All such feedback is
uploaded to our online Customer Feedback
System (CFS).
These complaints are then reviewed at bi
monthly CFS committee meetings with the
participation of senior management and
necessary action is taken. The committee
physically met 12 times during the year to
discuss and address customer complaints.
Statistics related to complaints received
over the past 3 years are indicated in the
graph provided next.
0
200
400
600
800
1,000
Status of Customer Complaints
No.
201720162015
93
8
50
3
52
8
82
2
19
4
46
7
11
6
30
9
61
Received Resolved In Progress
Customer PortalThe online customer portal enables access to most insurance needs at the click of a button. The portal is accessible to all life insurance
policyholders with an array of personalised services.
Maintained Service Standards through the Customer Service Unit (CSU)To provide best in class service, pre-agreed service standards are constantly monitored via a workflow system which is integrated with the
core life insurance system. A summary of the performance during 2017 is provided below.
New Business
Call Centre
Policyholder Servicing Customer Service Unit
Claims
97%100% underwriting decision making on new Proposals within 2 days [ 2016 - 98% ] -1%
94%100% of policies to be dispatched within 8 days [ 2016 - 99% ] -5%
100%100% of minor alterations to be completed within a day [ 2016 - 100% ]
100%100% of policy assignments and reassignments to be completed within a day [ 2016 - 100% ]
100%100% of bank standing order requests to be processed within 2 days [ 2016 - 100% ]
96%100% of revival requests to be completed within 2 days [ 2016 - 97% ] -1%
97%100% of major alterations to be completed within 2 days [ 2016 - 96% ] +1%
93%100% of customer letters to be responded to within 2 days [ 2016 - 92% ] +1%
97%Meeting the needs of walk – in customers within 15 minutes [ 2016 - 98% ] -1%
93%Handle 97% of presented inbound calls [ 2016 - 90% ] +3%
86%96% of the inbound calls to be answered within 20 seconds [ 2016 - 87% ] -1%
7%Total abandoned calls to be below 3% [ 2016 - 10% ] -3%
96%100% of maturities and advance payments within 2 days [ 2016 - 99% ] -3%
97%100% of non maturity claim payments (with no further investigation) to be processed within 3 days [ 2016 - 98% ] -1%
95%100% of non maturity claim payments (with further investigation) to be processed within 14 days [ 2016 - 95% ]
97%100% of policy loans to be processed within 2 days [ 2016 - 99% ] -2%
91%100% of queries on claims to be closed within 2 days [ 2016 - 83% ] +8

UNION ASSURANCE PLC | ANNUAL REPORT 2017
72
CAPITAL MANAGEMENT REVIEW SOCIAL AND RELATIONSHIP CAPITAL
At Union Assurance, we believe that the society
we operate is the bedrock of the Company. As
a responsible organisation we seek to improve
the health and safety of the society that we
serve. For the year 2017 the Company has
invested Rs. 13 million, 1% of 2016 net profit
after tax, for betterment of society.
Volunteerism
Employees are encouraged to participate
in volunteering activities in line with the
CSR plan.
2016 2017
140
2,014
8,056
210
942
3,768
No. of volunteer activities
No. of employees engaged
No. of Volunteer hours
Community
Key Performance Measures
Provide strategic direction on the Company’s
CSR activities.
Include the entire Board in CSR decisions.
Delegate CSR responsibilities to the
management team.
Members of the ExCo are tasked with
CSR oversight.
Assigns CSR responsibilities to the
committee.
Provides guidance on CSR initiatives.
Overall responsibility for implementation of
CSR initiatives and report on progress.
Board of Directors
Management Team
(Chaired By the CEO)
CSR Committee
Health Awareness Platform
The 'Health Awareness' platform was
selected due to the direct relationship with
business operations. UA works together
with the Ministry of Health to create
awareness regarding the critical and
burning issues of the nation.
Objectives of Health Awareness Programmes
To create awareness of critical health
issues faced by a larger segment of the
society.
To participate in a national cause by
supporting the Government in order to
assist in eradication or containment.
Minimise claims by supporting all efforts
to ensure a healthy populace.
To maintain and raise awareness of the
UA brand.
CSR Committee
The following table demonstrates our
approach on addressing key material issues
applicable to the community.
GRI 203-1 | 203-2 | 413-1
Rs.13 Mn [2016 - Rs. 7 Mn]
900,191[2016 - 123,069]
52Dengue
[2016 - 57]
108Thalassaemia
[2016 - 60]
48Diabetes [2016 - 14]
Community
No. of Programmes
No. of Lives Touched
Investment in CSR
activities

73
UNION ASSURANCE PLC | ANNUAL REPORT 2017
MA
NA
GE
ME
NT
DIS
CU
SS
ION
AN
D A
NA
LYS
IS
Initiatives under the Health Awareness Platform
Prevention of epidemic diseases –
e.g: dengue awareness programmes
across the island
Awareness on the prevention of
thalassemia
Awareness on diabetes prevention
Being continuously sensitive to the
communities which we operate in, Union
Manushyathwaya: the CSR brand of Union
Assurance was able to continue its efforts
and spread awareness on health, wellness
and goodness for people across the
island. As the year 2017 concludes, Union
Manushyathwaya CSR activities achieved
several milestones that positively impacted
multiple communities.
Progress During the Year 2017
Awareness on Dengue Awareness on the Prevention of Thalassaemia Awareness on Diabetes Prevention
UA launched an islandwide
dengue awareness campaign
including house–to–house
visits, dengue prevention–
shramadhana campaigns and
information leaflet distributions
in order to encourage dengue
prevention across the country.
UA was able to provide
invaluable support towards
controlling the severe blood
disorder by conducting
thalassaemia awareness and
prevention campaigns.
UA aims to raise awareness
and prevent the spread of
diabetes. Pre-screening sessions
were carried out during these
programmes to diagnose
potential patients and necessary
advice was provided to them on
controlling their blood sugar levels
and leading a healthy lifestyle.
Major Programmes held in 20171. Islandwide dengue campaign
held on 11th February 2017
2. Worked with the dengue
control unit and Prime
Minister’s office and
supported their 3 month
awareness sticker campaign
Major Programmes held in 20171. Conducted 30 programmes
with the Life Guidance Centre
Kandy
2. Conducted 78 blood
screening programmes with
the National Thalassemia
Centre and Hemal’s
Thalassaemia Care Unit
Major Programmes held in 20171. Conducted 42 pre-screening
programmes Island wide.
2. Live life healthy campaign
was completed in 50
locations
3. Other programmes are given
in graph below
0
20
40
60
80
100
5,000
10,000
15,000
20,000
Thalassemia Programmes
No.
No. of LivesTouched
No. ofProgrammes
30
7,1
82
17,1
72
78
Thalassemia Awareness and Successful Life Programme
Thalassemia Awareness and Blood Screening Programme
0
15
30
45
60
3,000
4,000
500,000
600,000
Diabetes Programmes
No.
No. ofLives Touched
No. ofProgrammes
1
3,2
97
600,0
00
47
Diabetes Programmes
Direct Mailer Campaigns
0
10
20
30
40
8,000
9,000
100,000
200,000
Dengue Programmes
No.
Mass L
eaflet
Dis
trib
ution
House to
house
Pro
gra
mm
es
Sticker
Cam
paig
n
39
8,4
40
12
100,0
00
1
164,1
00
No. of Programmes
No. of Lives Touched

UNION ASSURANCE PLC | ANNUAL REPORT 2017
74
CAPITAL MANAGEMENT REVIEW SOCIAL AND RELATIONSHIP CAPITAL
Business Partners
Key Performance Measures
UA’s business partnerships lie at the heart
of our value creation process and therefore,
we consider this a capital that requires
careful management.
The key counterparties that we have developed
relationships over time are listed below;
Suppliers and Banks
Reinsurers
Business Partner Capital Building Model
Recognising the benefits of collaborative
relationships within and beyond UA, our
appreciation of supply chain management
has steadily increased over the years. Our
partners contribute to the quality of delivery
that we have promised our customers.
For us, supply chain is the total system of
products, services and information from
partners, right through to our people,
including activities, information, and
resources involved in designing, developing
and delivering our products to our
customers. Therefore, partners are a critical
link in our supply chain. The following
diagram illustrates our approach to address
key material issues of our partners.
Re-Development
Business Partner Capital
Business Partner CapitalBusiness Partner
Evaluation and Assessing
Strategic Fit
Relationship Building
Fair and
unbiased
selection
On time
settlement
of dues
Supply
chain
management
Rs. 498 Mn[2016 - Rs.424 Mn]
Rs.1,601Mn[2016 - Rs.1,569 Mn]
Supplier Meeting
GRI 414-1
Business Partners
Payments to Reinsures
Payments to all suppliers
Payments to New Relationships
Reinsurers
Sup
pliers
Business Partners
Relationships
Rs.151Mn[2016 - Rs.268 Mn]
207[ 2016 - 138 ]

75
UNION ASSURANCE PLC | ANNUAL REPORT 2017
MA
NA
GE
ME
NT
DIS
CU
SS
ION
AN
D A
NA
LYS
IS
Business Partner Evaluation and Strategic Fit
It is important to us that our business
partners share our core values. While
profitability is always an important factor
in any transaction, we believe that a
congruence of business philosophies and a
meeting of corporate minds makes the best
business sense. When we commence a
partnership, we conduct an initial evaluation
followed by annual reviews to ensure that
our partners are strategically aligned with
us and will remain so over a long period
of time.
Relationship Building
Strong business relationships take time and
effort. We strive to build trust by identifying
our business partner expectations,
delivering on these expectations,
maintaining transparency and practicing
conflict resolution. We set the ground
rules for a good relationship at the start,
by defining and agreeing on our primary
expectations.
Fair and Unbiased Selection
UA has developed a formal process to
evaluate suppliers annually and ensures
that all suppliers have an equal opportunity
to present their products or services.
As a responsible corporate citizen, we
take every endeavour to work only with
ethical business partners and our supplier
selection criteria takes into account ethical
business practices that we expect to
witness in their business practices. The
supplier selection process considers the
following attributes when short-listing
suppliers to be recommended to the
supplier approval committee.
Certain products and services we procure
are from vendors registered by the JKH
Group and are selected based on the same
stringent criteria. UA is represented in the
category management committees which
select such vendors.
Supplier Selection Criteria Products / Service Selection Criteria
Company profile and service
record
Financial stability
Governance process
Environmental practices
Labour practices
Human rights practices /
diversity and equal opportunities
Anti-corruption policy
Fitness - fit for the purpose the
product / service is to be used.
Operational simplicity including
ease of maintenance and
disposal
Durability and quality
Energy consumption,
upgradability and reusability
Price competitiveness
On-Time Settlement to Suppliers
As an ethical business organisation, we are
conscious of the working capital requirements
of our suppliers. We ensure that our suppliers
are paid within the agreed time lines in order
to maintain a collaborative relationship which
is beneficial to both parties.
Supply Chain Management
At UA, we regularly engage with our
suppliers to improve our service to our
customers. We believe maintaining
good relationships with our suppliers will
ensure uninterrupted supply, quality and
reasonable pricing. The entire supply chain
of the organisation has been designed
covering three criteria i.e. local sourcing,
international sourcing and 3PL functions
(outsourced operations).
Reinsurers Our reinsurance partners play a crucial role
in our operations as they allow us to transfer
part of the risk that exceeds our appetite
(our underwriting capacity). We only
enter into reinsurance arrangements with
financially stable reinsurers whose security
ratings are either on par or better than the
minimum ratings stipulated by the IRCSL.
Details of our reinsurance panel including
their ratings are given below.
GRI 102-9
ReinsurerFinancial
Strength RatingCredit Rating Rating Agency
AA AA Fitch
AA- AA- Standard & Poor’s
A+ A+ Standard & Poor’s
A+ A+ Fitch

UNION ASSURANCE PLC | ANNUAL REPORT 2017
76
CAPITAL MANAGEMENT REVIEW SOCIAL AND RELATIONSHIP CAPITAL
In view of protecting both customers and
the Company, the additional risk taken by
reinsurers can have a significant impact on
product pricing in a highly competitive market.
The following diagram illustrates the key
material issues which impact our reinsurance
partners in the ordinary course of business.
Deliver a balanced
and Profitable
Portfolio
Effective risk
assessment practices
and policies
Reliable and
timely
information
Reinsurers
Deliver a Balanced and Profitable Portfolio
UA has a balanced insurance portfolio
with diversified risks. Therefore, losses
can be balanced collectively enabling us
to better negotiate with our reinsurers. UA
is equipped with a well experienced and
qualified underwriting team who ensures
risks are underwritten in line with globally
accepted underwriting practices, in turn
delivering a well-balanced portfolio to our
reinsurance partners.
Reliable and Timely Information
Exchange of right information at the right
time with our reinsurers helps us make
better business decisions. Therefore,
corporate agility and the ability to analyse
information speedily are viewed as core
competencies and a source of competitive
differentiation by our reinsurers.
Effective Risk Assessment Practices and Policies
These provide a mechanism to identify
which risks represent opportunities and
which represent potential pitfalls for both
parties. The right risk assessment provides
a clear view of variables to which UA and
the reinsurers may be exposed, whether
internal or external, retrospective or forward
looking.
UA risk assessment is anchored in the
company’s defined risk appetite and
tolerance and provides a basis for selecting
appropriate risks. A robust risk assessment
process, applied consistently throughout
the underwriting process, empowers UA
underwriting staff to better identify, evaluate
and exploit the right risks.
OutlookSuccessful business partnerships remain
at the heart of our success and in line with
our strategy of differentiation, UA continues
to seek value creating relationships
through collaboration with our customers,
community and business partners.
The profile and longevity of our partnerships
demonstrate that we possess strong
relationships required to make our strategy
work. The processes and efforts we
direct at nurturing these relationships and
establishing new relationships give us the
confidence that this capital will provide
inputs in the required quality and quantity.

Management ApproachWe are mindful that the key to sustained success is the quality and commitment of our people. The company has continuously invested in
developing the skills and competencies of the team, to meet current as well as future business opportunities and challenges. The company is
committed to being a “Great Place to Work” while the foundation of its HR philosophy is to be an equal opportunity employer.
Employees Field Staff
HUMAN CAPITAL
77

UNION ASSURANCE PLC | ANNUAL REPORT 2017
78
2017 Objectives and Achievements
Objectives - 2018 and Beyond
Objectives Year
Transform the sales force to achieve higher income levels 2018 and beyond
New recruitment strategies for sales force recruitments 2018 and beyond
Redefining the HRIS Solution and e-Learning platform to drive digitised HR interventions 2018 and beyond
Competency development through talent management 2018 and beyond
Grow e-Consultant sales force 2018 and beyond
Positioning UA as an 'Employer of choice, exciting place to work’ 2018
Challenges Employee attrition Pages 81 and 82
Performance focused training Pages 83 and 84
Retention of key staff Page 81
CAPITAL MANAGEMENT REVIEW HUMAN CAPITAL
Continue to work on improvement areas identified through the GPTW survey
Several initiatives were taken - On going
Work life balance initiatives 2 initiatives launched
Align learning and development activities to transform the sales force
On going
Continue and enhance leadership development programmes and technical training interventions
118 training programmes
conducted
Revamp rewards and recognition schemes Completed
Develop e-Consultant sales forceLaunched e-consultant
project – Ongoing
Transform the sales force for higher income categoryHigher income category
increased from18% to 25%.
Define career development opportunities for all staff On going
Key Performance Measures
5th Consecutive yearGreat Place to WorkAttracted 430 talented new
permanent staff
33%ProductivityGrowth in higher advisor income
category
19.92%AttritionConsistent customer contacts
and enhanced staff morale
54 MDRT MembersMillion Dollar Round Table Members
9,996 Hours
Training and DevelopmentProviding continuous training by
dedicated trainers
GRI 404-1

79
UNION ASSURANCE PLC | ANNUAL REPORT 2017
MA
NA
GE
ME
NT
DIS
CU
SS
ION
AN
D A
NA
LYS
IS
At UA, we recognise that the human
capital we possess is fundamental to
creating sustainable value to all partners.
Therefore, we continuously strive to invest
in the human capital we have, enhancing
it through training, development and
appropriate recruitment decisions to enable
this capital to continuously create value
within a strong ethical and governance
framework.
People are at the heart of everything we do
at UA. Providing a great place to work is a
critical component of our journey towards
sustainable performance. We strive to be
the preferred employer for existing and
potential employees. We seek to empower
our people to make a positive difference to
our customers and we encourage them to
develop and advance in their careers and
contribute positively to the society.
Being a life insurance company, our human
capital consists of two main categories;
1. Employees
2. Field Staff
Facets of our strategy to attract, develop
and retain employees’ is presented below.
Attracting Developing
and Retaining Employees
Talent Management
Performance Appraisal
Training and Development
Health and Safety
Employee Benefits
Work Life Balance
Rewards and Recognition
Employee Diversity
HR Policies and Processes
Employee Engagement
Employee DiversityWe respect diversity and inclusivity and we
are taking extensive measures to ensure
that the attitudes of openness and inclusivity
are embedded at every level of UA. The
workforce as at 31 December 2017 was
4,808, comprising 529 employees, 277 fixed
term contract (FTC) employees and, 4,002
sales advisors.
This is why at UA we;
Treat others the way we want to be
treated,
Promote a workforce, in which diverse
thinking and free expression of personal
values is appreciated,
Stand for equal treatment and work
opportunities and work closely together
recognising that collaboration leads to
better results.
Diversity goes beyond the male / female
ratio. We want to be inclusive in our
hiring process across race, age, sexual
orientation, physical abilities and personal
philosophies. However, we mainly report
on gender equality due to different legal
definitions in measuring diversity.
The company monitors the diversity of its
workforce based on age and gender as
illustrated by the diagrams indicated in next
two pages.
GRI 405-2

UNION ASSURANCE PLC | ANNUAL REPORT 2017
80
CAPITAL MANAGEMENT REVIEW HUMAN CAPITAL
0
2
4
6
8
Employees by Province
%
No
rth
ern
No
rth
Ce
ntr
al
No
rth
We
ste
rn
Ea
ste
rn
Ce
ntr
al
We
ste
rn
Uva
Sa
ba
rag
am
uw
a
So
uth
ern
3% 4
%
4%
7%
2%
3%
1%
5%
5%
66
%
78
%
2%
2% 2%
1%
5%
4%5
%
2016 2017
60
70
80
90
Employee
FTC
Field Staff
12%
-6%
-3%
78%Western Province
Male
Female
Employees
-7%
53%
New Hires by Gender
Employees - 30 years and below
65% 35%Male Female
GRI 102-8 | 405-1
41%

81
UNION ASSURANCE PLC | ANNUAL REPORT 2017
MA
NA
GE
ME
NT
DIS
CU
SS
ION
AN
D A
NA
LYS
IS
Talent ManagementThe company continuously monitors its
employee retention and, in particular, seeks
to address staff attrition in typically high
attrition departments through proactive
initiatives that engage employees. These
include surveys such as Great Place to
Work (GPTW) which allows employees
to rate the company’s performance on
key attributes such as credibility, caring,
fairness, pride and camaraderie.
The Company attrition rate (for executive
and non-executive) and new hire attrition
rates were 19.92% and 12% respectively.
However, the Company has seen
insignificant turnover in staff identified as
talent, with senior management placing
extra emphasis on developing and
nurturing them with many one-on-one
interactions during the year. Executive level
attrition is relatively lower than attrition at
non-executive levels. Further, recruitment
based on profile mapping was introduced
in certain business segments to ensure a
better fit with the needs of the organisation.
A survey of millennials’ aspirations to
understand their needs better has enabled
the Company to take appropriate action to
retain employees of this age group.
A new development platform in the form of
an internal mentoring programme has been
introduced as part of the talent development
strategy of UA. The overarching objectives
are to enable the Executive Committee and
other identified Assistant General Managers
to interact / engage with identified talent
covering executive to senior manager level
employees and share their knowledge
relating to a predefined set of management
disciplines. The mentoring sessions take
the form of knowledge sharing fora where
the management team members share their
tacit and explicit knowledge in an engaging
manner.
19.92%Current Year Attrition Rate
14.93%Previous Year Attrition Rate
Action Carried Out Permanent cadre vehicle loan scheme was
enhanced
Number of months bonus distribution was
increased
Implemented a more relaxed / flexi working
environment (Flexi hours extended, work from
home policy introduced, dress code relaxed)
Celebrating success (Treats for staff celebrating
company achievements)
GRI 102-8 | 401-1

UNION ASSURANCE PLC | ANNUAL REPORT 2017
82
CAPITAL MANAGEMENT REVIEW HUMAN CAPITAL
Performance AppraisalUA has implemented a robust performance
management system where each
employee’s performance is assessed in a
fair and equitable manner.
Employees' performance against the set
objectives is first self-assessed, then assessed
by his / her immediate supervisor and
recommendations provided. A 360 degree
feedback from peers and subordinates is also
obtained for all managers at UA.
All recommendations and 360 degree
feedback (where relevant) are presented
to a career committee comprising senior
management from different departments.
Based on the recommendations received,
the respective committee assesses the
performance of employees and provides
final recommendations on performance
along with their feedback as a committee.
This ensures that employee evaluations are
fair and consistent across the organisation.
Performance Feedback
The performance feedback process is an
ongoing activity between management and
employees. The exchange of information
involves both performance expected and
performance exhibited.
SuccessfulPerformance
Appraisal
Set GoalsSet measurable
goals for people,
aligned to the
organisation's
goals
PlanPerformance
Appraisal
Regular Informal FeedbackRegularly
provide informal
feedback on
achievements
and learning
Review AchievementsHalf yearly
meeting
to review
achievements
and learning
RewardReward
Achievements
Formal FeedbackAnnually provide
formal feedback
on achievements
and learning
Annual ReviewAnnual meeting
to review
achievements
New PlanIdentify and
plan new
development
needs
Subsequently, individual feedback sessions are held to communicate the final performance
rating and career committee feedback to staff members. The full cycle of object setting to
performance appraisal is depicted below;
0
5
10
15
50
60
70
80
Attrition by Province
%
4%
4% 5%
5%
11%
2%
5%
4%
4%
8%
59%
67%
1%
5%
3%
8%
5%
Nor
ther
n
Nor
th C
entral
Nor
th W
este
rn
Eas
tern
Cen
tral
Wes
tern
Uva
Sab
arag
amuw
a
Sou
ther
n
2016 2017
GRI 404-3

83
UNION ASSURANCE PLC | ANNUAL REPORT 2017
MA
NA
GE
ME
NT
DIS
CU
SS
ION
AN
D A
NA
LYS
IS
Appeals Process
UA also has a grievance handling and
appeals process if the employee is not
satisfied or disagrees with the performance
rating.
Training and DevelopmentThe company’s training and development
programmes are key policy components of
talent retention and ensuring a sustainable
competitive advantage. Hence, UA invests
heavily in learning and development
initiatives. Our approach covers a range of
technical, functional, language, information
technology and general management
skills with a wide range of resources and
programmes established for learning and
development (L&D) purposes.
In 2017, we conducted 43 in-house training
programmes and 75 external programmes
including 31 overseas programmes. Our
unique training programmes are created
based on the existing talent management
process. It is designed to build capacities of
employees, in all categories.0
5
10
15
20
Investment in Learning and Development
Rs. Mn
20172016
17
.22
17
.91
Areas of Learning and Development Spend
0
1
2
3
4
5
6
7
8
Rs. Mn
In-H
ouse
Train
ing
Exte
rnal
Train
ing
Confe
rence
Overs
eas
Train
ing
Insura
nce a
nd
Pro
fessio
nal
Ed
ucation
Pro
fessio
nal
Mem
bers
hip
4.0
8
2.0
1
1.7
2
1.4
9 2.0
1
7.4
7
1.3
6 1.9
9
1.6
2
0.4
2
4.0
3
2016 2017
Manager par excellence
Executive development programme
The ladder project
Overseas training
Technical and sales training
Digitalisation and learning interventions
Guides Managers and Assistant Managers towards professional development.
Designed to provide executives with the knowledge and tools to enhance their managerial skills
to face corporate challenges.
A four month learning endeavour for non-executives covering a wider range of professional concepts.
For enhancing technical knowledge as it is an essential element for the business.
Initiatives to enhance skills of regional managers in the technical aspects of the business.
L&D activities have been digitalised to provide 24 x 7 access via an online platform, branded as,
‘Learn easy’.
UA's main training programmes are as follows;
0
500
1,000
1,500
2,000
2,500
3,000
3,500
Hours
Assis
tant
Manag
er
& M
anag
er
Senio
rM
anag
er
Executive
Non-E
xecutive
Total Training Hours
2,9
41
2,6
43
3,4
59
953
GRI 404-1 | 404-2

UNION ASSURANCE PLC | ANNUAL REPORT 2017
84
CAPITAL MANAGEMENT REVIEW HUMAN CAPITAL
A Toastmaster Club Session
Toastmaster Achievements
Fire Safety Training
0
5
10
15
20
25
30
35
No. of International Training Programmes
No.
20172016
31
28
0
5
10
15
20
25
Overseas Training by Gender
No.
20172016
23
8
22
6
Male Female
GRI 403-1
Toastmasters Achievements
The Union Assurance Toastmasters Club,
(UATMC) has won numerous accolades in
the recent past. They achieved the highest
accolade from Toastmasters International
- the ‘Golden Gavel Plus’, at the District 82
Toastmasters Conference in 2015 and 2016.
UATMC ExCo, provides leadership in
honing the skills of its 33 active members.
Health and SafetyCaring is one of our core values and we
believe it is a vital part in fostering a great
place to work. As a preferred employer of
choice within the insurance industry, we
have adopted a unique culture that strives
to provide a healthy workplace for staff.
UA follows various national and international
guidelines on workplace health and
safety. These directives set out general
principles to maintain and enhance workers’
occupational safety and health.
Union Health Camp
A health camp was conducted for all
employees at head office. Further UA
conducts selective programmes to
educate and create awareness on serious
diseases such as HIV / AIDS. UA has also
engaged an institute to provide confidential
counselling support should any employee
require this service.
My Doctor
UA partnering with Mydoctor, a mobile
App which enables employees to access
general practitioners via their mobile
phones. Utilising modern technology,
MyDoctor brings medical solutions to the
fingertips of our employees.

85
UNION ASSURANCE PLC | ANNUAL REPORT 2017
MA
NA
GE
ME
NT
DIS
CU
SS
ION
AN
D A
NA
LYS
IS
Members from the Maintenance Crew0
200
400
600
800
1,000
Employee Compensation and Benefits
Rs. Mn
20172016201520142013
81
6
77
2
65
9
63
4
60
8
Work Life BalanceAs a responsible employer we have
incorporated into our work procedures,
the necessary means for employees to
choose a comfortable balance between
their duties at work, their lifestyle and social
undertakings.
The following are initiatives, internalised
for supporting work-life balance among
employees.
Flexi Hours UA Recreation Club Sports Work from Home
A flexi-hours
arrangement is in place
for employees to best
manage their personal
commitments without
impacting service
standards or official
responsibilities.
UA’s Recreation club
organised several
events to foster
camaraderie among
staff. The recreation
club contracted several
leading establishments
to provide goods and
services at special rates
and easy payment terms
to our staff.
Sports activities are
pursued by employees,
as we encourage
them to take part in
competitive events such
as cricket, badminton
basketball, swimming,
rugby. The Company
encourages staff
participation at inter-
company (JKH Group)
sports tournaments.
UA has implemented a
'work from home' policy
for permanent cadre
staff effective from
5 December 2017.
GRI 201-3
Employee BenefitsEmployees are eligible for the Employees’
Provident Fund (EPF) and the Employees’
Trust Fund (ETF) contributions. The total
contribution made to the trust fund for the
reporting year was Rs. 14 million while the
total contribution made to the provident
fund was Rs. 55 million. Employees are also
entitled to retirement gratuity. The employee
benefit liability as at 31 December 2017 was
Rs. 123 million.
My Doctor Mobile App

UNION ASSURANCE PLC | ANNUAL REPORT 2017
86
HR Policies and Processes
Resignations, Terminations and Transfer Policy
UA has a comprehensive HR manual
which addresses resignation, termination
and transfer of employees. Employees
may resign from the company subject
to the terms and conditions set in their
appointment letters, while retirement of
employees would be at the age of 55. The
company conducts exit interviews prior to
employees leaving the company, in order
to identify reasons for their exit and to
strengthen HR practices if necessary.
0
2
4
6
8
80
90
100
Employee Turnover by Reason
No.
Re
sig
na
tio
n
Re
tire
me
nt
Term
ina
tio
n1
2
97
Human Rights at the Workplace
We have integrated human rights policies
into our everyday governance and business
practices through training, workshops,
assessments, grievance mechanisms, audits
and reporting. Our human rights policy
draws on all labour standards and laws of
the country and the UN Global Compact
principles. It includes commitments to our
workforce, local communities and business
partners, and covers health and safety,
labour rights and the rights of indigenous
people. UA upholds the elimination of all
discrimination based on race, religion,
gender, age, nationality, social origin,
disability, sexual orientation, gender identity,
CAPITAL MANAGEMENT REVIEW HUMAN CAPITAL
political affiliation or opinion and any form of
forced labour and child labour.
All security personnel engaged are from
reputed security firms and they have been
inducted on best practices with respect to
human rights by their respective firms.
Non - discrimination
The company has a strong mechanism
to avoid discrimination when recruiting,
promoting and granting recognitions. During
the period, there were no incidents reported
on such cases.
Grievance Management Process
UA has a very effective grievance
handling process in place. Our grievance
handling procedure provide opportunities
to employees who are aggrieved by
alleged unfair, unjust or inequitable
practice to seek redress without prejudice
to the complainant. The Company has
implemented an online grievance handling
system where employees could present
their case in an anonymous manner.
Open Door Policy
Open door policy has become an integral
part of UA’s culture and creates a very
conducive atmosphere for employees to
openly express their concerns. This allows
people inside and outside the company to
report any concerns about possible alleged
unfair, unjust or inequitable practices.
Whistle Blowing
The Company has set up a formal
procedure as well as confidential hot line
to encourage whistle blowing in respect
of mismanagement, corruption, illegality,
or some other wrong doing. The whistle
blowing policy is reviewed regularly and
actively communicated to all members of
staff to enable any employee to raise issues
with the management and / or the Board, in
order to identify and resolve potential issues
at an early stage.
Employee EngagementWe have developed several communication
channels and fora to ensure that our
employees are fully informed regarding the
company’s operations, strategies, progress
against objectives and any other areas
which directly impact them. Employee
satisfaction surveys are conducted
every year to allow employees to air any
grievances in an anonymous fashion
and identify any areas which require
improvement.
A practice session for an Employee engagement event
GRI 402-1

87
UNION ASSURANCE PLC | ANNUAL REPORT 2017
MA
NA
GE
ME
NT
DIS
CU
SS
ION
AN
D A
NA
LYS
IS
Values Walkway
UA believes that core values are central to the
long term success of the organisation With
the re-enforcement of UA values, a “Values
Walkway” was created along the 6th floor
to the rooftop at UA head office. The main
objective of this was to inspire UA staff with
the corporate values, “ExCITE” – Excellence,
Caring, Innovation, Trust and Ethics & Integrity
Management Meetings
Open and transparent communication plays
a vital role in our strategy to engage with
our employees. The company conducts
management meetings on a quarterly
basis to discuss business developments,
company activities and progress against
plans. This information is then cascaded
to every employee by the respective
departmental / branch manager.
Coffee with CEO
This initiative was launched to provide an
opportunity for staff to directly interact with
the CEO and discuss any matters related to
their area of work. It is also an opportunity
for staff to interact with team members
from other functions to clarify any issues
Service champions, employees / teams of the year 2017
and appreciate their points of view. During
the year, the programme was expanded to
discuss ideas / suggestions of employees
who recently joined UA.
Rewards and RecognitionUA has implemented multiple rewards and
recognition programmes to recognise staff
achievements including Employee (s) /
Team (s) of the Year Awards, recognition
of Service Champions and instant rewards
entitled 'Bravo' where a peer or superior can
nominate an employee for an instant reward
in appreciation of work performed.
Awards / Certifications UA's HR practices has received many accolades in the recent past. A summary of these achievements and certifications is listed below.
Field StaffOur field staff members are an integral part of the Union family. Currently 90 % of the
company GWP is contributed by field staff. Facets of our goal of providing a rewarding
career to field staff are provided overleaf.
The Great Place to Work© Best Employer Brand AwardThe SLITAD People
Development Awards
the Asia Banking, Finance Services & Insurance
Excellence Awards
The Great Place to
Work© (GPTW) Institute
recognised UA for the
fifth consecutive year
as a work place that is
conducive to growth and
personal development.
UA HR practices were
recognised with two
prestigious awards at
Sri Lanka Best Employer
Brand Awards organised by
the World HRD Congress.
UA achieved the prestigious
title ‘Best Employer Brand
Award’ along with the
'Dream Employer of the
Year' award.
UA won the platinum
award for people
development at
the SLITAD people
development awards 2017,
organised by Sri Lanka
Institute of Training and
Development (SLITAD). UA
is the only company to win
the platinum award for two
consecutive years.
UA HR Practices were
recognised with the “Best
HR Practice in Finance
Sector" award at the Asia
Banking, Finance Services
& Insurance Excellence
Awards organised by
CMO Asia.

UNION ASSURANCE PLC | ANNUAL REPORT 2017
88
CAPITAL MANAGEMENT REVIEW HUMAN CAPITAL
Field Staff
During the year under review, following
key initiatives were carried out:
1. Specialised training for top advisors
to enable them to sell more
2. Focused training for low performing
advisors to improve quality,
productivity and persistency
3. Key value drivers / Key result areas of
trainers aligned to set of KPIs to drive
sales productivity
4. Training resources aligned with
distribution structure, thus providing
everyone easy and quick access to
L&D interventions
5. Introduced training programs focused
on technical, soft skills, motivational
and professional coaching
6. Conducted product training as well
as special refresher sessions to
improve product knowledge
7. Conducted programs to enhance
selling skills
0
10,000
20,000
50,000
150,000
250,000
Total Training Hours
Hours
Re
gio
na
l a
nd
Sa
les M
an
ag
ers
Un
it L
ea
de
rs
Ad
vis
ors
Ba
nc
assu
ran
ce
246,1
73
17
,46
7
10
,41
8 19
,47
7
2,1
84
Su
pp
ort
Sta
ff
We are focused on developing a smaller but more productive advisor force.
Key initiatives carried out during the year include;
1. Employment opportunities created for housewives, university students
and students of other institutes branded ‘e-Consultant insurance’
2. Implemented a centralised worksite model within the ‘Group Life’
channel
3. Established a separate elite advisor channel in the Western region.
4. Centralised team leader and unit development manager recruitment
process
1. UA incorporated ‘new business based’
incentives into R&R criteria
2. UA held its first offshore Annual Awards
Ceremony in Kuala Lumpur, Malaysia.
33 categories of Awards including
the pinnacle award, ‘Champion of
Champions Award’ were given away
3. Best performers were rewarded with
overseas tours
4. Brilliant starter recognition awards
handed over to high performing new
comers
5. Brilliant Starter Leader / coach recognition
awards handed over to Development
Officers who supported new comers to
achieve Brilliant Starter status
6. Certification programmes for Advisors and
Unit Leaders who completed specified
training modules and maintained
consistent business performance
7. Produced 30 International Award for
Productivity (IAP) winners
8. Produced 9 LIMRA International Quality
Award (IQA) winners
9. Produced 54 Million Dollar Round Table
(MDRT) Award winners (2016 – 29)
10. Infinity club member rewards were
enhanced
UA provides a transparent career path to achieve
personal and professional success. A system
has also been implemented enabling advisors to
track their career path and target the next level
of achievement which is generally based on
achieving business volumes and participating in
relevant training programmes.
Performance is managed in a transparent manner via web enabled
sales force management system (FAME).
OutlookIn Sri Lanka life insurance business primarily takes place as a face to face sale. We believe this trend will continue. We want to be the life
insurance company of choice for employees and field staff. Therefore, we continue to invest in our people to enable them to stand out
amongst peers.
Learning and Development
Rewards and Recognition
Performance Management
Recruitment
Defined Career path

Brand
Value
Product
Development
Employee
Know How
IT
Infrastructure
INTELLECTUAL CAPITAL
Management ApproachWe believe that our Intellectual capital is a vital source of competitive advantage which in the long term will result in a value premium for
UA through innovation and disruption of business models and ultimately serving the needs of evolving and emerging customers. We are
committed to develop our intellectual capital in terms of brand value, technology, new product development and employee know how.
89

UNION ASSURANCE PLC | ANNUAL REPORT 2017
90
2017 Objectives and Achievements
Objectives - 2018 and Beyond
Objectives Year
Implement comprehensive CRM solution 2018
Migrate core system to modern platform In progress and completion by 2018
Redefine brand positioning beyond trust 2018
Availability of automated policy issuance, in order to manage increase in volumes and
achieve economies of scale 2018 and beyond
100% digital submission of proposals 2018
Drive digital first agenda 2018 / 2019
Challenges Growing the brand value Page 94
Information security threat Page 164
Disruption through digitisation Pages 42 and 43
85% digital submission of proposals
Availability of automated policy issuance, in order to manage increase in volumes and achieve economies of scale
Develop products which cater to health needs of customers
Set up a centralised data analytics unit to provide business insights
Migrate core system to modern platform
Enhance information security awareness
87% achieved by year end
91% of policies are auto
underwritten
Launched Union Smart Health in 2018
20 e-mail campaigns and 1
presentation to staff, and on going
Unit was established
In progress and planned go - live in July 2018
Key Performance Measures
Beyond protectionWith an eco system of partners
promoting healthier lifestyles
161,123+Social media presenceLargest FB fan base in the
industry
Rs.1.8BnBrand value createdvalue created over
30 years of trusted service
87%Life insurance proposals received digitally33% reduction in conversion time
91%Automated underwriting of proposals without human intervention3 times faster processing
CAPITAL MANAGEMENT REVIEW INTELLECTUAL CAPITAL

91
UNION ASSURANCE PLC | ANNUAL REPORT 2017
MA
NA
GE
ME
NT
DIS
CU
SS
ION
AN
D A
NA
LYS
IS
Tablet and web enabled
Financial Need Analysis,
quotation and proposal through
the Digital Advisor Toolkit
Tablet and web enabled MIS
(via dashboards) for advisors
and managers
Data Analytics tools to derive
business insights from the large
amounts of data collected in
the company.
Forensic analytics tools for real
time outlier alerts for vendor
payments, claims payments,
etc; with embedded
artificial intelligence
technology.
Automated claims processing for
faster settlement of claims.
Currently, we are making a once in
a generation back end upgrade. In
line with our strategic objectives.
We have committed to invest over
Rs. 800 million to deploy the latest
digital platform which will enable us
to bring world class best practices
to the market in a modular, flexible
and customisable manner.
Driving its digital-first initiatives
UA launched the first ever,
Facebook messenger based
artificial intelligence insurance
assistant – ‘Ask from Amanda’
to provide collaborative
services to potential customers.
Key objective of launching
a project of this calibre is to
craft and embed the services
provided by an insurance
assistant in to a mostly used,
emerging chat platform
provided by Facebook -
Messenger App within a digital
environment leveraging the
human-like nature to introduce
a new level of user experience.
Customers can make policy
inquiries and submit claim
documents via this Chatbot.
Auto policy issuance
(straight through
processing) for
standard life products
The portal is accessible to all life
insurance policyholders with an
array of personalised services.
Tablet and web based knowledge
centre for advisors
Lead management solution
IT Infrastructure
Automated claims
processing
Lead management
solution
Customer portal
Straight through
processing
FAME
Data Analytics
tools
Learn Easy
New policy administration
system
Chat Bot

UNION ASSURANCE PLC | ANNUAL REPORT 2017
92
CAPITAL MANAGEMENT REVIEW INTELLECTUAL CAPITAL
The Company’s ambition is to ensure 100% digital proposal submissions and auto underwriting for non complex cases. The latest
statistics in this regard are as follows:
Proposals Received Digitally Auto Underwriting
40
50
60
70
80
90
100
Digital
Proposal %
May
Jun
Jul
Aug
Sep
Oct
Nov
Dec
Mar
Feb
Jan
40
50
60
70
80
90
100
Auto
underwriting
%
May
Jun
Jul
Aug
Sep
Oct
Nov
Dec
Mar
Feb
Jan
Digital proposals have reduced proposal
conversion time by 33%.
Auto underwriting is 3 times faster than the
manual process. This enables us to deliver
insurance policies faster to customers.
Awards / CertificationsUA’s best in class technology has received many accolades in the recent past. A summary of these achievements and certifications is
listed below.
Chairman’s Award SLT Zero One Award Sri Lanka Insurance Industry Award Celent Award
Digital Advisor Toolkit
(DAT) won the JKH
Chairman’s Award 2017
Digital Advisor Toolkit
(DAT) was shortlisted
for Best Digital Enabled
Product / Service in the
Financial Sector at SLT
Zero One Awards 2017
Industry Technology
Leader at the inaugural
Sri Lanka Insurance
Industry Awards 2015
ceremony
Won the prestigious
Celent Award in 2013,
2014 and 2015
Cyber Security
Given the recent incidents, the company
has also implemented the following
activities to enhance cyber security.
Union Assurance is amongst the few
BFSI companies with ISO 27001:2005
certification in Sri Lanka, which assures
security of information assets i.e. business
information, customer data, financial
information, intellectual property, employee
details and information entrusted by third
parties. Given the escalation in cyber risk,
Union Assurance has established a Cyber
security policy in line with the JKH Group
and is in the process of implementing IBM’s
managed Security Operations Centre (SOC)
and security intelligence platform to further
strengthen cyber resilience.
Product DevelopmentConsidering the demographic changes,
retirement, investment and savings needs
of customers, UA launched three products
during the year.

93
UNION ASSURANCE PLC | ANNUAL REPORT 2017
MA
NA
GE
ME
NT
DIS
CU
SS
ION
AN
D A
NA
LYS
IS
Customer Need
Product Name Key Features
Investment and
savings
Union Single Premium Advantage:
Universal life product allowing
customers to deposit a lump
sum to generate higher
investment benefits.
In the event of an unfortunate demise
of the policyholder, the value of
the investment account or the sum
assured, whichever is higher will be
paid to the nominees.
Retirement Pension Advantage:
Universal life product that
builds a fund for retirement with
regular premium remittances up
to desired retirement age.
A monthly pension starting from the
chosen retirement age (i.e. 55/ 60/
65) for a fixed period
In the event of a total permanent
disability, future premium payments
will be waived off and the policy will
be continued to ensure the intended
pension payment.
An additional cover is available
to ensure continuous payment of
premiums in the event of an untimely
death of the policyholder, so that the
pension payment to dependents is
unaffected.
GOYO
In addition to traditional insurance solutions,
UA launched a wellness solution i.e.
GOYO to motivate people to lead an active
lifestyle. The product includes a wearable
device linked to an “App” which works
as a “personal health advisor” motivating
users to achieve personal fitness targets
by offering rewards and benefits from a
host of local and international partners,
thus encouraging people to lead an active
lifestyle.
GOYO as the nation’s first homegrown
fitness App with an attractive eco partner
wellness platform promoting a localised
sustainable shift towards a healthier and
fulfilling lifestyle. Unlike other fitness trackers
and wellness platform products available
in the local market, the GOYO wearable
fitness device operates in sync with the
App, designed with distinctive features for
the everyday Sri Lankan. The App functions
as a personal health advisor monitoring
customer’s sleep patterns and their different
phases of sleep, calculates average resting
heart rate, measures calories burnt, distance
walked and step count, all on a periodic
basis helping the user track and monitor their
progress.

UNION ASSURANCE PLC | ANNUAL REPORT 2017
94
Fintelekt Insurance Industry Award
CAPITAL MANAGEMENT REVIEW INTELLECTUAL CAPITAL
Brand ValueThe UA brand is also positioned on the
platform of trust, and strives to deliver
this promise by providing convenience
to customers, being transparent in our
dealings and being respectful to all
stakeholders. The UA brand was ranked
47th in the LMD list of most valuable brands
2017 (3rd most valuable brand in the life
insurance industry).
UA was also recognised as the most
respected entity in the insurance industry
in the LMD ranking of Most Respected
Entities 2017. Union Assurance was the only
insurance company ranked within the top 50.
Most respected
entities 2017
The UA brand was valued at Rs. 1.8 Bn
in 2017. The value was derived from the
valuation conducted by Brand Finance
(UK) in association with Sting Consultants
using the “relief of royalty approach, which
assumes that the company does not own
the brand and calculates how much it would
need to license it from a third party.
UA brand value increased by Rs. 574 Mn
in 2017 compared to 2016. The brand was
ranked at 43 (2016 - 47) and rated AA-
(2016 - AA-).
It is noteworthy to mention that the 2017
and 2016 values are based only on the
performance of the life business since
the segregation of the non life and life
businesses in 2015.
0.0
0.5
1.0
1.5
2.0
2.5
Brand Value
Rs. Mn
20172016201520142013
1.8
0
1.2
3
2.1
52.3
6
2.0
7
UA stringently maintains its brand health
and initiated many brand building activities
during the year under review.
UA brand has been redefined as 'life
changing partnerships' which go beyond
trust, using results of recent research with
existing / potential customers, life advisors
and lapsed policy customers.
Employee Know HowAt UA, employees at all levels have been
given opportunities to develop themselves
which is the main reason behind our
success despite aggressive competition
in the insurance sector. UA places great
emphasis on developing employees and
executes various training programmes to
sharpen their knowledge.
Details of the training programmes
conducted by the company are provided in
the Human Capital section of the report.
OutlookIntellectual capital provides a competitive
advantage for UA. We pursue a digital first
agenda since technology will change the life
insurance industry significantly. We continue
to build our brand and it provides us a key
differentiator among our peers. We are in the
process of reviewing options to transition the
brand positioning beyond trust.
Our product development will be focused
on demographic changes, and the new
IT platform will enable us to develop and
launch new products across multiple
distribution channels in a speedy and cost
effective manner.
Union Smart Health won the Best
product innovation award at
the Fintelekt Insurance Industry
Awards 2017.
Brand change awareness session

Energy
Management
Water
Management
Emission
Management
Effluent
and Waste
Management
Compliance with
Environmental
Regulations
NATURAL CAPITAL
Management ApproachWe are mindful of the future generations and committed to promoting sound environmental practices when conducting our business operations.
Our environmental management framework play an important role in managing effort.
95

UNION ASSURANCE PLC | ANNUAL REPORT 2017
96
2017 Objectives and Achievements
Objectives - 2018 and Beyond
Objectives Year
Recycling of 20,000kgs of paper 2018
Recycling of 125 used bulbs 2018
Save water consumption by 1,800 units 2018
Save energy consumption by 195,000 Kwh 2018
Promote usage of renewable energy in the branch network 2018 and beyond
Challenges Managing significant initial investment required in implementing natural capital management projects.
Getting employees to contribute towards sustainability initiatives.
We take measures to monitor the long term and short term impacts on the environment as a result of the strategies we implement. Considering
our natural capital management framework, it mainly includes the elements of material, energy, water, emissions, bio diversity, effluents and
waste. However, based on materiality we have not considered material and bio diversity for reporting.
Save energy consumption by 10%
Save water consumption by 20%
Recycling waste to minimise impact on environment
Reduction in Carbon footprint
Arrange safe disposal of all used LED and florescent tube lights to prevent mercury being released to the environment
Achieved, 18% reduction in energy consumption
In progress and achieved 16% reduction in
water consumption
Achieved. 28,010 kg of waste recycled
Achieved, 21% reduction in carbon
footprint compared to previous year
Achieved. 227 light bulbs were
securely disposed
Key Performance Measures
1,295 tCO2eCarbon Footprint
0.65GJEnergy Intensity per Rs. million of Sales
20,258m3
Water Consumption
20,280kgPaper Recycled
28,010kgWaste Recycle
CAPITAL MANAGEMENT REVIEW NATURAL CAPITAL

97
UNION ASSURANCE PLC | ANNUAL REPORT 2017
MA
NA
GE
ME
NT
DIS
CU
SS
ION
AN
D A
NA
LYS
IS
Actions / Implementation
Environmental sustainability
champions
Training & Employee Awareness
Sustainability Initiatives
Management Guidance
Mission
Sustainability management
principles and policies
Supplier code of conduct
Leadership involvement
Review / Feedback
Certification and recognition
Benchmarking results
Management review
Measurement
Group CSR and development
capital management platform
Facility assessments
Reporting
Su
Reviement
Our Sustainability partners;
1. Think Green (Pvt) Limited
2. Neptune Papers (Pvt) Limited
3. Ewis Peripherals
Energy ManagementWe use energy derived from both
renewable and non - renewable sources for
consumption within the organisation. Energy
is generated primarily from the national
grid using fossil fuel, coal power and hydro
power. This energy source is mainly used
for lighting the premises, power supply for
office equipment and air conditioning.
We use petroleum fuel for energy
consumption outside office complexes.
This is mainly used for staff transport
entitlements, employee travel for field visits
and business meetings, managing logistics,
movement of technicians for branch
maintenance and use of propaganda
vehicles for marketing promotion purposes.
During the year under review, we consumed
37,520 litres of fuel for such purposes.
The energy consumption ratios during the
year is shown as follows;
Energy Consumption 2017 2016
Total (GJ) 6,474 7,874
Cost per Rs. 1 million of revenue (Rs.) 46.0 45.5
Per full time employee (GJ) 1.35 1.61
Per Branch (GJ) 67 74
Per Area (GJ) 0.02 0.03
Solutions to Monitor and Control Energy Consumption
As almost all UA business activities involve
consumption of energy, there are various
initiatives we have undertaken at head
office and at branch level to minimise the
impact this creates. We have enhanced
internal communications to raise employee
awareness on environmental protection, and
encourage them to save energy at head
office and branches. Also, we have invested
in information technology applications,
making online transactions possible thereby
conserving energy usage.
As we operate across a wide geographical
area, conserving energy at branch level has
been considered important. The initiatives
we have taken to conserve energy across
the company is given below;
Power Management System
Lighting System
Air Conditioning System
53,520KwhSaved Per Annum
12,492KwhSaved Per Annum
4,234KwhSaved Per
Annum
Effective Power Saving Solution
Continued with the initiative of installing
AC timer switches to split type air
conditioners in all branches, which were
designed, built, tested and installed by
our own technical team.
Effective Power Saving Solution
Continued with the initiative of maintaining
master key switches at all floors of the
Head Office building to control wastage of
electricity after working hours.
Effective Power Saving Solution
Continued with the initiative of installing
LED lights in all our common premises such
as passages, stairway and wash rooms
at the head office building and branches,
enabling significant saving.
Energy Consumption by Type
Energy Type2017
GJ2016
GJ
Diesel 0.002 0.002
Petrol 0.002 0.003
Electricity 6,474 7,874
GRI 302-1 | 302-2 | 302-3
302-4 | 302-5
Our environmental management framework that helps us to manage environmental impacts is
indicated in a diagram below;
Environment Management Framework

UNION ASSURANCE PLC | ANNUAL REPORT 2017
98
CAPITAL MANAGEMENT REVIEW NATURAL CAPITAL
GRI 303-1 | 303-2 | 303-3
305-1 | 305-2 | 305-3 | 305-4
The above initiatives have caused a
significant reduction in energy consumption
within the organisation as reflected.
Water ManagementFresh clean water is a limited resource
and should be managed wisely in order
to eliminate future shortages. Hence, we
have taken measures to ensure effective
management of this resource. Our water
consumption is limited to drinking, washing
of pool vehicles and for sanitary purpose.
However, considering the nature of the
business we have a significant staff cadre
engaged in business operations. As a
result, drinking water consumption is
significant. At head office and branch
level we mainly withdraw pipe-borne water
provided by the National Water Supply
and Drainage Board and drinking water
provided by third party vendors. Withdrawal
of water during the year amounted to
20,258 m3.
As a result of our water withdrawal for
consumption, surface water and inland
ground water has been affected. Water
intensity data can be indicated as follows;
Water Consumption 2017 2016
Total company
volume (m³) 20,258 24,116
Cost Rs. million 4.5 4.4
Per employee (m³) 4.2 4.9
Per Branch (m³) 209 225
Management of Water Usage
Reuse of Waste Water
Water Cistern Improvisation
Company has implemented the initiative
of water cistern improvisation by using
vacuum type Syphon set. This has enabled
a saving of 2,529 m³ of water.
Effective Water Solution
Continued with the initiative of reusing water
discharged by the cooling system of air
conditioning units. We currently use the
discharged water to wash company vehicles
and for other cleaning requirements. A total
of approximately 132,000 litres per annum is
reused through this initiative.
Over the years we have taken following initiatives to ensure effective management of water;
2,529m3
Saved Water
132,000litersper annum is reused
Emission Management We take necessary steps to measure
and reduce what we discharge to the
atmosphere. As part of this process, we
have partnered with Carbon Consulting
Company (Pvt) Ltd for the sixth consecutive
year. Carbon Consulting Company (Pvt)
Ltd has computed the carbon footprint
of our operations in accordance with the
Greenhouse Gas Protocol – Corporate
Accounting and Reporting Standard (GHG
Protocol) developed in partnership with
the World Business Council for Sustainable
Development and the World Resources
Institute. As per the framework carbon
dioxide and other greenhouse gases
emitted have been summarised under three
main scopes;
Scope 1 - Direct emission released from sources that are owned or controlled by the company.
This mainly includes fuel used for on - site power generation which is a negligible amount.
Scope 2 - Indirect emission associated from the generation of imported energy.
This includes total electricity purchased by the company.
Scope 3 - All other indirect emissions that are not released from sources mentioned under scope
2. At UA this mainly includes employee commuting, waste disposal and business travel.
ScopeEmissions
(tCO2e) 2017 %Emissions
(tCO2e) 2016 %
Scope 1 - Direct GHG emissions 85.35 6.59 3.95 0.24
Scope 2 - Energy indirect GHG
emissions 833.23 64.36 1,071.47 65.24
Scope 3 - Other indirect GHG
emissions 376.11 29.05 566.81 34.51
Total Carbon Footprint 1,294.69 100 1,642.22 100
Emission per employee 1.59 2.14
Carbon footprint (tCO2e) per
Rs. 1 million of revenue 0.13 0.20 (0.35)

99
UNION ASSURANCE PLC | ANNUAL REPORT 2017
MA
NA
GE
ME
NT
DIS
CU
SS
ION
AN
D A
NA
LYS
IS
Our Green House Gas (GHG) emission has
reduced gradually from 2015 to 2017 as
indicated below;
0
500
1,000
1,500
2,000
201720162015
Scope 1 Scope 2 Scope 3
We witnessed an overall reduction in the
carbon foot print from 2015 to 2017 by 30%
mainly due to number of energy and waste
management initiatives we have undertaken
over the years. According to current year
carbon footprint calculation, total carbon
footprint is 1,294.69 tCO2e which is a 21%
drop from 2016. The main contributor to
the carbon emission reduction is Scope 2
category reduction in purchased electricity.
Effluent and Waste ManagementWe make every effort to minimise waste
through recycling and reusing of materials.
The effective management of waste has
been considered as a material aspect
based on the impact created on the
environment. Given the nature of the
business we don’t generate any hazardous
waste. However, used paper, e - waste,
food and waste water has been generated
through business operations. In addition to
the measures highlighted in environmental
management framework, we have taken
3R approach in managing waste. The
information on weight of waste type is
given below;
Waste Type 2017 2016
Paper (kgs) 20,280 17,602
E-waste (kgs) 1,330 171
Printer Cartridges (No.) 423 142
Reuse
RecycleReduce
Effective Waste Management
We continued the partnership with
Neptune Papers (Private) Limited, to
recycle used paper. This helped UA
to make a positive contribution to the
environment as presented below.
Partnership with Ewis Peripherals to
recycle printer cartridges continued in
2017. The company bought back 423
toner cartridges manufactured from used
cartridges (142 in 2016).
Waste Water Management
Installation and commissioning
of waste water treatment tank at
Kurunegala branch. This has ensured
that only treated water is released to
the drainage system. During the year
5,280 m3 of water was treated before
releasing.
Food Waste Management
All food waste collected at Head Office is
dispatched to a piggery on a daily basis.
During the year 6,400 kgs was disposed.
Recycle and reuse of paper
Releasing treated water to the environment
Effective disposal of food waste
In our attempt to ensure the effective management of waste, as mentioned previously we
have taken number of initiatives as given below in partnership with external parties.
Total Savings from Waste Management Initiatives 2017 2016
Neptune Papers (Pvt) Ltd
Trees (No.) 345 299
Oil (Litres) 35,591 30,892
Electricity (Kwh) 81,120 70,408
Water (Litres) 644,498 559,392
Land fill (m3) 61 53
GHG Emission saving (Carbon Equivalent) (Kg) 20,280 17,602
Think Green (Pvt) Ltd
Land filling (Kg) 1,330 171
Carbon Emission (Ibs) 10,023 1,928
Trees (No.) 523 95
GRI 305-5 | 306-2

UNION ASSURANCE PLC | ANNUAL REPORT 2017
100
Compliance with Environmental RegulationsUA complies with all relevant standards
relating to environmental regulations and
confirms that the company did not have
any incidents of non-compliance with
environmental regulations during the
year under review. Various campaigns
were launched to improve awareness on
environmental compliance.
In line with a JKH group initiative all UA
staff have taken a pledge to reduce plastic
pollution in Sri Lanka
CAPITAL MANAGEMENT REVIEW NATURAL CAPITAL
OutlookWe will continue to use renewable energy sources to conduct our business operations.
Our paperless approach will add more value to natural capital. We will also continue to reduce
our carbon footprint through various energy saving and emission management initiatives.

MANUFACTURED CAPITAL
Management ApproachThe company is committed to provide better customer experience and reach, through its branch network. The Company’s manufactured
capital consists of physical infrastructure that is available for use in the provision of services. We target cost reduction initiatives while
improving our branch outlook, customer experience and ensuring quality through better supply chain management practices.
Investment in
Manufactured Capital
Branch Network Work from Home
101

UNION ASSURANCE PLC | ANNUAL REPORT 2017
102
2017 Objectives and Achievements
Objectives - 2018 and Beyond
Objectives Year
Consolidate BDOs in accordance with long term business plan 2018 and beyond
Upgrade and categorise branches in accordance with long term business plan 2018 and beyond
Use energy efficient equipment and renewable energy for branches 2018 and beyond
Challenges Cost implications of branch upgrading and relocations
Finding strategic locations
Investment in Manufactured CapitalWhen investing in infrastructure relating
to manufactured capital, we take a long
term view. ROI and qualitative factors are
considered when evaluating an investment
decision.
Rs. Mn
201720162014 2015
Investment in Manufactured Capital
0
10
20
30
40
50
60
70
80
40
71
53
53
0
1,250
2,500
3,750
5,000
30,000
40,000
50,000
Investment in PPE Category
Rs. ‘000
Co
mp
ute
re
qu
ipm
en
t
Fu
rnitu
rea
nd
fitt
ing
s
Pla
nt
ma
ch
ine
ry,
Offic
ee
qu
ipm
en
t
6,0
09
1,2
722,2
42
41
,22
6
5,7
65
36
,84
3
2016 2017
Use energy efficient equipment and renewable energy for branches
Roll-out fully fledged virtual branches
Consolidate under-performing Business Development Offices (BDO) with nearest branch.
On going
On going
7 BDOs closed down /
consolidated during the year
Implemented a work from home
policy for permanent staffWork from home for permanent staff
Key Performance Measures
97+
Number of Locations
38,757Square FeetTraining Space
Rs.40MnInvestment in Manufactured Capital
1,126Customer Touch Points
CAPITAL MANAGEMENT REVIEW MANUFACTURED CAPITAL

103
UNION ASSURANCE PLC | ANNUAL REPORT 2017
MA
NA
GE
ME
NT
DIS
CU
SS
ION
AN
D A
NA
LYS
IS
Branch Network90% of the Company's GWP is generated
through the agency channel which reaches
every corner of Sri Lanka through our branch
network. The Company invested in expanding,
repositioning and upgrading existing
branches to optimise geographical reach
while enhancing customer convenience.
Branch and BDO Expansions / Consolidation
2016 2017
2
6
6
1
1
3
4
7
New Branches / BDOs
Upgrades
Strategic Relocations
Closed Down / Consolidated
Interaction Between Capitals
Financial CapitalManufactured
CapitalSocial and
Relationship Capital
When UA invests in branches, the
company expends financial capital to build
manufactured capital. Manufactured capital
builds relationship capital through better
customer experience. Relationship capital in
turn builds financial capital which eventually
translates to higher shareholder returns.
Enhancing Performance of Branches
The process of enhancing the performance
of our branches is shown below. The
company top line and other key targets
have been cascaded down to branches.
The company targets are determined based
on economic outlook, industry outlook and
company long term business strategy. Each
branch is given a GWP, first year premium
and persistency target. The Learning and
Development division carries out various
programmes to improve the skills of the
advisor cadre to enable them to sell more.
Each branch cost base is monitored against
the budget and corrective action taken
for budget overruns. Branch ambience
is regularly reviewed by head office and
zonal managers. Branch layouts and
appearance are changed to improve
customer experience. Branches are
evaluated and ranked on a monthly basis
based on performance. Resource allocation
to branches is based on branch ranking.
Rewards and recognition is provided to
branches which excel vs their peers.
Work from Home for Permanent Staff As part of our commitment towards
maintaining work-life balance philosophy
which reflects a ‘Great Place to Work,’
UA has initiated the “Work from Home”
facility for permanent cadre staff effective,
5th December 2017. This provides an
alternative option for efficient utilisation of
office space.
OutlookAs a part of our business expansion
strategies, we will upgrade our branch
network to provide superior customer
experience and create an exciting working
environment to our sales force.
Set targets
for branchesAllocate /
Reallocate
Resource
based on
performance Enhance skills
of advisor
cadre through
learning and
development
Evaluate
performance of
branches
Optimise the
branch new
work’s cost
base
Improve
customer
experience /
branch outlook
Branch Performance


CORPORATEGOVERNANCE
For over 30 years we have maintained a flawless reputation for trustworthiness, governance and integrity in all we do. Corporate Governance is the corner stone of our operations which protects the long term interests of our partners.
106 Board of Directors
108 Executive Committee
109 The Chairman's Statement on Corporate Governance
110 Corporate Governance Commentary
156 Enterprise Risk Management

UNION ASSURANCE PLC | ANNUAL REPORT 2017
106
CORPORATE GOVERNANCEBOARD OF DIRECTORS
Susantha RatnayakeChairman / Non-Executive Director
(Member of the Board Since January 2018)
Board Committees: Chairman, Remuneration
Committee
Skills and Experience: Member of the John
Keells Holdings PLC Board since 1992 /
1993 and has 39 years of management
experience, all of which is within the John
Keells Group. He is a past Chairman of the
Sri Lanka Tea Board, Ceylon Chamber of
Commerce, and the Employers’ Federation
of Ceylon.
Other Current Appointments:
Listed Companies: He is the Chairman and
CEO of John Keells Holdings PLC and
Chairman of many listed companies in the
John Keells Group.
Others: He is the Chairman of many unlisted
companies in the John Keells Group.
Gerald De Saram Independent Non-Executive Director
(Member of the Board Since April 2009)
Board Committees: Member, Remuneration
Committee
Skills and Experience: He was the
Managing Director / CEO of Akzo Nobel
Paints Lanka (Private) Limited (formerly CIC
Paints Private Ltd), the market leader in the
paints business in Sri Lanka. He joined CIC
Paints when it was formed, first managing
the sales and later the marketing functions
of the company. He was appointed as the
Managing Director in 2001 and has also
served on the Paints Asia Executive Team
of ICI Paints. Following the global merger
of ICI and Akzo Nobel BV, he led the
integration of these two large businesses
in Sri Lanka. Gerald holds a BSc. Honours
degree from the University of London and
holds a Post Graduate Diploma in Marketing
from the Chartered Institute of Marketing
(CIM) of UK. He was an active member of
the Sri Lanka Institute of Marketing and a
former Board Member of the IAA (Sri Lanka
Chapter)
Other Current Appointments:
Listed Companies: None
Others: He has been the Managing Director
of Alpha Omega Holdings Private Limited
since May 2017.
Ashan De Zoysa Independent Non-Executive Director
(Member of the Board since April 2009)
Board Committees: Member, Audit
and Compliance Committee, Member,
Investment committee
Skills and Experience: Ashan de Zoysa
counts more than 30 years of experience
in the field of Information & Communication
Technology including several years of
overseas exposure, in the fields of IT and
derivative / commodity trading in Australia.
Ashan holds a Bachelor of Commerce
Degree from the University of New South
Wales. He has served on the Board of AMW
Group as a working Director.
Other Current Appointments:
Listed Companies: None
Others: Serves on the Board of Associated
Electrical Corporation Ltd. He is a managing
director of A. E. C. Properties Private Ltd.
Suresh Rajendra Non-Executive Director
(Member of the Board since August 2011)
Board Committees: Member, Audit and
Compliance Committee
Skills and Experience: Suresh has over 25
years of experience in the fields of finance,
property and real estate, travel and tourism,
and business development acquired
both in Sri Lanka and overseas. Prior to
joining the JKH Group, he was the head of
commercial and business development for
NRMA Motoring and Services in Sydney,
Australia, Director / General Manager
of Aitken Spence Hotel Managements
(Private) Limited, and also served on the
Boards of the hotel companies of the Aitken
Spence Group. Suresh is a Fellow member
of the Chartered Institute of Management
Accountants, UK.
Other Current Appointments:
Listed Companies: He is a member of
the Group Executive Committee and the
President of property group of John Keells
Holdings PLC, also serves as a Director of
Asian Hotels and Properties PLC.
Others: He is a director of many unlisted
companies in the John Keells Group.

107
UNION ASSURANCE PLC | ANNUAL REPORT 2017
CO
RP
OR
ATE
GO
VE
RN
AN
CE
Dilani AlagaratnamNon-Executive Director
(Member of the Board since August 2011)
Board Committees: None
Skills and Experience: A Lawyer by
profession, she has been with John
Keells Holdings PLC for 26 years and is
a law graduate and a holder of a Master’s
Degree in Law. She is also a member of
the Group Executive Committee of John
Keells Holdings PLC, President with overall
responsibility for Human Resources,
Legal and Secretarial, Corporate
Communications, Sustainability and
Enterprise Risk Management, and Group
Initiatives functions of the Group.
Other Current Appointments:
Listed Companies: Member of the Group
Executive Committee of John Keells
Holdings PLC, the President with overall
responsibility for Human Resources,
Legal and Secretarial, Corporate
Communications, Sustainability and
Enterprise Risk Management, and Group
Initiatives functions of the Group.
Others: Dilani is a Director of several
unlisted companies within the John Keells
Group. Currently, she is the Chairperson of
the Legislation Sub Committee of the Ceylon
Chamber of Commerce, member of the
National Labour Advisory Committee, and a
Council member of the Sri Lanka Institute
of Directors.
Harin De Silva Wijeyeratne Independent Non-Executive Director
(Member of the Board since September
2011)
Board Committees: Chairman, Audit
and Compliance Committee, Member,
Remuneration Committee
Skills and Experience: Harin De Silva
Wijeyeratne is an Associate member of the
Institute of Chartered Accountants of Sri
Lanka and Fellow member of the Chartered
Institute of Management Accountants of UK.
He counts over 28 years of experience in
the fields of general management, financial
management and auditing which has
been acquired while being employed at
Investcorp Bank, Bahrain, Grindlays Bahrain
Bank, Ernst & Young, Bahrain and Ernst &
Young, Sri Lanka.
Other Current Appointments
Listed Companies: None
Others: Chief Executive Officer of the Sri
Lanka Institute of Nanotechnology (Pvt)
Limited (SLINTEC). In addition, he is
currently, a Board Member of the Gamini
Corea Trust, the SLINTEC Academy and
a Trustee of the SLINTEC Endowment
Trust Fund.
Note: Mr. Ajit D Gunewardene resigned from
the Board w.e.f. 31 December 2017.
Dirk Pereira Executive Director / Chief Executive Officer
(Member of the Board since May 2014)
Skills and Experience: Dirk Pereira has
functioned as CEO of Union Assurance
PLC since 2010. He is a Fellow member
of the Chartered Institute of Management
Accountants, UK and the Institute of
Chartered Accountants of Sri Lanka. He
also holds an MBA from the University of
Sri Jayewardenepura.
Other Current Appointments
Listed Companies: None
Others: Serves on the Board of Fairfirst
Insurance Limited as a Non-Executive
Director.

UNION ASSURANCE PLC | ANNUAL REPORT 2017
108
CORPORATE GOVERNANCEEXECUTIVE COMMITTEE
Sherin CaderGeneral Manager, Finance and Planning
Sherin joined Union Assurance in June
2012. She has been with the John Keells
Group for over 14 years serving in many
capacities including as the Financial
Controller at John Keells Holdings PLC. She
has played diverse roles across finance and
operations in financial services, IT enabled
service sector and centre functions.
Sherin is a Fellow member of the Chartered
Institute of Management Accountants, UK
and is a Fellow member of the Association
of Chartered Certified Accountants, UK.
Suresh MuttiahGeneral Manager, Human Resources
Suresh joined Union Assurance in May
2016. He has been with the John Keells
Group for 5 years serving in the capacity
of Vice President - Human Resources,
Retail Sector. Suresh has more than 16
years experience in HR Management and
Operations, having worked at leadership
positions at Dialog Axiata PLC, Carsons
Cumberbatch and Lion Brewery PLC.
Suresh holds a Professional Qualification
in Human Resource Management (IPM
Sri Lanka), a Post Graduate Diploma
and MBA from University of Southern
Queensland - Australia. Suresh is a member
of SHRM – USA and The Association of
HR Professionals – Sri Lanka. He currently
serves as Chairperson of the HR Sub
Committee of the Insurance Association of
Sri Lanka.
Iroshini TittagallaGeneral Manager, Life Operations
Iroshini commenced her insurance career at
Union Assurance in April 2001 and left the
company in 2005 to pursue higher studies.
She subsequently rejoined the company in
2008 in a senior capacity where she rapidly
rose to the position of General Manager, Life
Operations.
Iroshini is a Chartered Insurer and is an
Associate of the Chartered Insurance
Institute, UK. She also holds a BA (Hons)
Degree in Business Management.
Nimesha LiyanageGeneral Manager, Actuarial
Nimesha joined Union Assurance in
September 2016. She also served
the company previously in a senior
management position from 2008 to 2013.
Nimesha left the company in 2013 to join
AIA Insurance PLC as a Senior Manager,
Actuarial. She was responsible for
the overall management of Product &
Compensation Pricing, Data, IFRS reporting
and Experience Investigation functions.
Nimesha holds a First Class (Hons) Degree
in Finance, Business and Computational
Mathematics from the University of
Colombo. She is a Fellow Member of the
Society of Actuaries, USA and a Member
of the Actuarial Association of Sri Lanka
and held the post of the Treasurer in
2015 - 2016.
Dharshana AmarasiyngheGeneral Manager, Marketing and Distribution
Dharshana joined Union Assurance in
September 2005. He counts for more than
20 years of management experience in
sales, marketing and human resources in
the fields of insurance, pharmaceuticals
and consumer products in Sri Lanka and
overseas.
He is a Chartered Marketer, CIM (UK)
and also holds a Post Graduate Diploma
in Marketing, CIM (UK). In addition, he
possesses a Diploma in Training and
Human Resource Development from the
Institute of Personnel Management (SL).
He is a member of the Sri Lanka Institute of
Marketing (SL), Institute of Management Sri
Lanka and the Sri Lanka Institute of Training
& Development.
Harsha SenanayakeGeneral Manager, Information Technology
Harsha joined Union Assurance in
October 2016. He has been with the
John Keells Group for more than 14 years
where he gained experience in IT and
management. During his tenure at JKH
he was instrumental in the implementation
SAP and also promoting it as an ERP
solution to many leading organisations in
Sri Lanka. Harsha also plays a key role in
the Groups digitization initiatives and in
driving technology innovation to all areas of
business.
He holds a BSc in Computer Science from
the London Metropolitan University and
a Post Graduate Diploma in Information
Systems Management from the University
of Colombo.

109
UNION ASSURANCE PLC | ANNUAL REPORT 2017
CO
RP
OR
ATE
GO
VE
RN
AN
CE
THE CHAIRMAN’S STATEMENT ON CORPORATE GOVERNANCE REPORT
Dear Valued Stakeholders,
On behalf of the Board of Union Assurance
PLC (UA), I am pleased to present our
Corporate Governance Statement for
the financial year ended 31st December
2017. At UA, we believe good corporate
governance is key to maintaining the trust
that our investors and customers have
placed in us. We believe good corporate
governance is a cornerstone of a successful
and sustainable Company. This report
explains and demonstrates the framework
and activities carried out during the year to
ensure the highest standards of corporate
governance and compliance within UA.
Governance AttitudeThe highest standards of transparency,
reliability and ethical business conduct
are well established guiding principles
within the Company and are articulated in
a comprehensive policy framework and a
Code of Conduct which is communicated to
and understood by all employees.
In addition to legal requirements, the
Company’s policy framework embraces
international best practices and complies
with voluntary frameworks, providing a
solid foundation for performance as well
as effectively managing risks arising
from economic, social and environmental
impacts. Formal governance structures
serve to ensure judicious empowerment and
create an appropriate balance of authority
and responsibility within the organisation.
Governance Structure and LeadershipThe Company operates within a clearly
defined governance structure enabling the
Board to provide strategic guidance and
risk oversight whilst adhering to regulatory
requirements. The structure also provides
for delegation of authority while retaining
effective control. The Board delegates
authority to the relevant Board sub
committees and the Executive committee
with clearly defined mandates and authority
levels whilst maintaining its accountability.
We are mindful that it is important for the
Board to be composed of personnel that are
best placed to provide guidance on UA's
strategic direction with a diverse range of
skills and experiences which collectively are
both complementary and directly relevant
to the Company strategy. Therefore, an
appraisal of the Board’s performance is
conducted annually.
We also work closely with all relevant
regulators to ensure that our internal
governance standards meet their increasing
expectations.
Accountability and RiskThe Board periodically discusses the risk
management process and the principal
risks facing the Company. The Board Audit
and Compliance Committee has played an
important role in monitoring the Company
risk and assurance systems, including in
relation to strategically important projects
such as the implementation of a new core IT
platform. The BACC reviews the reporting
framework for controls being used by the
Company.
Engagement with StakeholdersThe process of stakeholder identification
and engagement is well established
to identify challenges and concerns
and systematically address them while
balancing multiple interests. This process
also forms a key input in the Company’s
strategy formulation to ensure responsible
and sustainable growth.
Future DirectionThe Board’s priorities for 2018 remain
consistent with last year’s priorities. We
will continue to monitor progress against
our strategy to ensure that we drive growth
and improve returns. We are committed to
investing in and supporting our people so
that the Company maintains an appropriate
balance of management skills and
capabilities as it grows and develops.
Statement of DeclarationI also wish to state that to the best of my
knowledge and available information, I am
not aware of any material violations of any of
the provisions of the code of best practice
on corporate governance issued jointly by
the Institute of Chartered Accountants of
Sri Lanka and the Securities and Exchange
Commission of Sri Lanka.
Susantha Ratnayake
Chairman
29 March 2018

UNION ASSURANCE PLC | ANNUAL REPORT 2017
110
CORPORATE GOVERNANCE
Key Actions Taken in 2017 to Enhance UA’s Corporate Governance
Highlights of the 30th Annual General Meeting Held on 31 March 2017 Statement of Compliance
Cyber Security
UA established a Cyber security policy in
line with the JKH Group and is in the process
of implementing IBM’s managed Security
Operations Centre (SOC) and security
intelligence platform to further strengthen
cyber resilience.
Conducted an end to end review of Investment Functions
The overall objective of the review was
to determine whether the investment
policy, procedures and controls were
adequate to meet current requirements,
effective in mitigating investment risks and
compliant with all regulatory guidelines.
The review was conducted by Messrs.
PricewaterhouseCoopers.
Strengthening internal controls by applying Forestpin, a forensic data analytics tool
The Forestpin Data Analytics tool was
implemented to identify outliers and exceptions
with regard to vendor payments and claims
and trigger alerts for management to take
relevant actions.
Business continuity and disaster recovery testing
Two business continuity and disaster recovery
tests were carried out for all critical business
processes.
1. Mr. Anthony Dirk Pereira who
retired in terms of Article 84 of
the Articles of Association of the
Company was re - elected Director
of the Company.
2. Mrs. Dilani Champika Alagaratnam
who retired in terms of Article 84
of the Articles of Association of the
Company was re - elected Director
of the Company.
3. Re - appointment of Auditors
Messrs. KPMG, Chartered
Accountants, as the External
Auditors of the Company.
UA is fully compliant with the Regulation
of Insurance Industry (RII) Act No. 43
of 2000 and subsequent amendments
thereto, Listing requirements of the
Colombo Stock Exchange (CSE),
Code of Best Practice on Corporate
Governance issued jointly by the
Institute of Chartered Accountants of
Sri Lanka (ICASL) and the Securities
and Exchange Commission of Sri Lanka
(SEC) as well as the rules on Corporate
Governance published by the CSE.
The systems and procedures are
continuously assessed against the
core principles of accountability,
participation and transparency which
have been embedded and adopted by
UA, and updated as necessary.
The Board of Directors also wishes
to confirm that, to the best of its
knowledge and belief, the Company
has complied with all requirements
under the Companies Act No.7 of 2007
and satisfied all its statutory payment
obligations to the Government and
other statutory / regulatory bodies.
The full statement of Directors’
Responsibility is provided in page 176.
Refer table below for the mandatory
and voluntary adoption of codes of
governance and compliance by the
Company.
Summary of Requirements Adoption Reference
Code of best practice on Corporate Governances as per section 7.10 of the listing rules of the CSE Mandatory Page 152
Code of best practice on Related Party Transactions (RPT) published by the SEC Mandatory Pages 126 and 254
Content of the Annual Report as per section 168 of the Companies Act No. 7 of 2007 Mandatory Page 155
Content of the Annual Report as per section 7.6 of the listing rules of the CSE Mandatory Page 151
Code of best practice on corporate governance issued jointly by the SEC and the ICASL.
(The revised version issued on 13 December 2017 will be adopted w.e.f. 1 January 2018) Voluntary Page 138
Good governance practices recommended in the corporate Directors' handbook, a joint publication by
the Sri Lanka Institute of Directors' and the Chartered Institute of Management Accountants (CIMA) Voluntary Online
Corporate Governance Commentary

111
UNION ASSURANCE PLC | ANNUAL REPORT 2017
CO
RP
OR
ATE
GO
VE
RN
AN
CE
How We View Corporate GovernanceThe Board is responsible to shareholders
for creating and delivering sustainable
shareholder value and it has come to be
viewed as a differentiator among firms
as good governance practices provide a
sustainable competitive advantage. UA’s
governance policies and practices enable
the Board to manage the Company for
the benefit of all stakeholders, ensuring a
viable long term business. The corporate
governance framework is built on the core
principles of accountability, participation
and transparency which are essential for the
creation, enhancement and maintenance of
a sustainable business model.
UA’s governance practices stand to
ensure that;
The business is driven in the right
strategic direction and decisions are
aligned appropriately
The Executives lead and manage their
respective units effectively and with
accountability
The Company has appropriate controls
in place and risks are regularly
monitored and managed
Employees 'do the right thing' at all
times for the benefit of all stakeholders
Our Integrated Governance FrameworkOur application of best practices enables
us to act in the best interest of shareholders
as well as the communities in which
we operate. Our robust governance
framework also enables us to instil trust
and confidence in the stakeholders that
we deal with and demonstrate a culture of
responsibility, accountability, transparency
and impartiality with a value driven
approach to everything we do.
Internal Governance Structure
Internal governance structure of the
Company focuses on the responsibility
of the Board of Directors and senior
management. The Board concerned
with setting the Company’s business
objectives and its appetite for risk, how the
business of the Company is organised,
how responsibilities and authority levels
are allocated, how reporting lines are set
up and what information they convey, as
well as how internal controls (including risk
controls, compliance, and internal audit) is
organised.
Summary of the elements of the internal
governance structure and assurance are
highlighted in the Company’s' corporate
governance model.
External Governance Structure
External mechanisms are often imposed
on the Company by external stakeholders
in the forms of relevant laws, contracts,
regulatory guidelines or best practices. The
Company is governed by mandatory rules
and regulations and voluntary adoption of
codes of best practice.
Internal Governance Structure External Governance Structure
Our Integrated Governance Framework
Governance
(A) Effective Culture of Good Governance
Our
App
roac
hP
erfo
rman
ce A
spec
ts
(B) Integrity of Operations
(C) Sustainable Business Model
(D) Engagement With Stakeholders
(E) Compliance With Regulatory Requirements
Board of Directors
Company Secretary
Board Sub
Committees
Directors’
remuneration policy
Accountability and
audit
Relations with
shareholders
CEO and the
Executive Committee
Three Levels of Assurance
Process control
Internal audit
External audit
Other Internal Governance Rules
Policies and
procedures
Articles of Association
Manual of financial
authority
Code of conduct
Principles of doing
business
Risk management
Business continuity
Planning
Shareholder Charter
Environmental Charter
Community Charter
Employee Charter
Customer Charter
Companies Act No. 7
of 2007
Listing Rules of the CSE
Inland Revenue
Act No. 10 of 2006
and subsequent
amendments
RII Act No. 43 of
2000 and subsequent
amendments
Rules, Regulations,
Directives and Circulars
Issued by the IRCSL
Code of best practices
on RPT issued by the
SEC of Sri Lanka
Code of Best Practice on
Corporate Governance
Issued jointly by the SEC
and the ICASL
Ste
war
dshi
p
Aud
it an
d A
ssur
ance
Ent
erpr
ise
Ris
k M
anag
emen
t
Str
uctu
re
of C
hart
ers
Reg
ulat
ory
Fram
ewor
k
Assurance
GRI 102-18
Material Issues

UNION ASSURANCE PLC | ANNUAL REPORT 2017
112
CORPORATE GOVERNANCE
Audit and Compliance Committee
Two Independent Non - Executive Directors and One Non - Executive Director
Chairman: Harin De Silva Wijeyeratne
Key Objectives:
Effective governance over,
- Financial reporting
- Internal and external audit
- Compliance with legal and regulatory requirements
- Internal controls
More Details Page 119
Remuneration Committee
One Non - Executive Director and Two Independent Non - Executive Directors
Chairman : Susantha Ratnayake
Key Objectives:
- To assess and make recommendations to the Board on the policy on executive remuneration.
- Review the ongoing appropriateness and relevance of the remuneration policy.
More Details Page 122
Investment Committee
One Independent Non - Executive Director, Chairman of the Committee appointed by the Board
Chairman: Krishan Balendra
Key Objectives
- To formulate the investment strategy
- Review performance of the funds
- Ensure compliance with internal and external investment regulations.
More Details Page 124
Nominations Committee of the Parent Company Chairman: M A Omar
Key Objectives
- Define and establish the nomination process for Non - Executive Directors
- Lead the process of Board appointments and make recommendations to the Board on the appointment of Non - Executive Directors
More Details Page 121
Related Party Transactions Review Committee of the Parent Company
Chairperson: M P Perera
Key Objectives
- To ensure on behalf of the Board that all related party transactions of John Keells Holdings PLC and its listed subsidiaries are consistent with the Code of Best Practices on related party transactions issued by the Securities and exchange committee of Sri Lanka.
More Details Page 126
ChairmanSusantha Ratnayake
Key Objective: Provide leadership and governance, ensure effectiveness of the Board and set agenda for the Board
Executive Committee Seven members made up of the Chief Executive Officer and General Managers who provide advice on key functions of the Company.
Key Objective: The Committee focuses on contributing to the Company strategy, financial and operational planning and execution of the strategy, with emphasis on strong HRM practices, building a differentiated brand and implementing transformational technology to benefit all stakeholders.
Internal Governance Structure (A) Effective Culture of Good Governance
Stewardship
The BoardSeven Directors: Three Non - Executive Directors including Chairman, Three Independent Non - Executive Directors, One Executive Director / CEO
Key Objective: Monitor responsibilities delegated to committees to ensure proper
and effective oversight and control of the Company’s activities, establish a framework
for risks to be assessed and managed, Determine Company’s values and standards
and ensure obligations to stakeholders are understood and met, review management
performance. The Company’s strategic and business plans, develop succession plans
for the Board and KMPs, ensure effectiveness of governance practices.
Chief Executive Officer
Key Objectives :
Responsible for the
management of
the business and
implementation of Board
strategy and policy.
More Details
Page 107
Accountability
through reporting
obligations
Delegated authority
Management
Delegated Authority
Provides advice to the CEO
on key decisions made under
management delegation
Availability of independent
advice and assurance
GRI 102-18
More Details Page 106
More Details
Page 106
More Details Page 108

113
UNION ASSURANCE PLC | ANNUAL REPORT 2017
CO
RP
OR
ATE
GO
VE
RN
AN
CE
The performance and execution mechanism of the governance framework is depicted below;
VisionMission, targets and
deliverables
Annual Report / Interim FinancialsInforms stakeholders about
performance against targets
and deliverables
Monthly MISApprises the Board and the
Management on outcome of
strategic priorities
Performance Measurement and EvaluationEvaluation of performance
of Branches / Divisions
and individuals against
assigned deliverables - drives
improvement
Strategic PlanKey strategic priorities
for the next five years
Branch / Divisions Business PlanKey activities and
deliverables
Individual Business PlanMission, targets and
deliverables
Governance MechanismsBoard of Directors
Board Committees
Executive Committees
ReportingPlanning
Strategies and Performance of Governance
Wor
kfor
ce P
lan
Our Corporate Governance covers many
aspects in line with the Code of Best
Practice on Corporate Governance issued
jointly by the ICASL and the SEC.
We have in place a comprehensive Code
on Business Conduct and Ethics (the
Code) applicable to all our Directors and
employees. The Code has been circulated
to all the Directors and employees and has
been published in our intranet to ensure
strict compliance with same.
The Company's commitment with respect to
the above aspects is detailed below;
Company Structure and Shareholders
Description of UA’s Operational Structure
UA's organisation structure is illustrated
on page 130 of this report. The Company’s
management structure is depicted in the
Executive Committee’s span of control on
page 108.
Shareholding Structure
The John Keells Group continued to be the
largest shareholder, with a 93.9% stake
(93.9% in 2016).
Capital Structure
As at 31 December 2017, the Company’s
stated capital of Rs. 1,000 million meets
the share capital requirements set by
the Insurance Regulatory Commission
of Sri Lanka (IRCSL) for a Life insurance
company.
1. The Board
1.1 UA Board Structure
UA maintains a dual panel structure, namely
the Board of Directors, who are Non - Executive
Directors and, the ‘Chief Executive Officer /
Executive Director and Executive Committee’.
It thus distinguishes clearly between the
supervisory body and the management
including the division of responsibilities
between the Chairman and CEO.
1.2 Composition of the Board of Directors, Their Skills and Diversity
The Board consist of Seven Directors and
the Company policy is to maintain a healthy
balance between the Executive, Non -
Executive and Independent Directors with
the Executive Director bringing in deep
knowledge of the business and the Non -
Executive Independent Directors bringing
in experience, objectivity and independent
oversight. Brief profiles of the current Board
members are given in page 106 and 107 of
this report.
The Current Board Composition
Executive
Independent Non - Executive
Period of Service to the Board
Over 9 Years Nil
0-5 Years
5-9 Years
Non - Executive
1
3
3

UNION ASSURANCE PLC | ANNUAL REPORT 2017
114
CORPORATE GOVERNANCE
0
1
2
3
4
5
6
Experience
No. ofDirectors
20-30 Years
1
6
>30 Years
Gender Diversity
1:6
1.3 The Chairman
The Chairman is responsible for leadership
and governance of the Board while
ensuring its effectiveness. The Chairman
also sets the agenda, style and the tone
of the Board discussions and ensures the
effective participation of all directors and
that the Board is in complete control of the
company’s affairs and alert to its obligations
to all stakeholders.
1.4 The Board of Directors
The Board performs its supervisory
functions through the following committees
in order to ensure competence and
effectiveness;
1. Board Audit and Compliance Committee
(BACC)
2. Remuneration Committee (RC)
3. Investment Committee (IC)
4. Nominations Committee (NC)
5. Related Party Transactions Review
Committee (RPTRC)
Members of professional accounting
bodies are on the Board ensuring financial
acumen and knowledge. A standard set
of appropriate, timely and comprehensive
documents are provided to the Board
in addition to the ad-hoc information
requested from time to time.
The Board has set up a process to appraise
the CEO’s performance and conduct self-
appraisals of their performance as well.
Information with respect to each Director
has been disclosed together with the other
disclosure requirements as per the Code of
Best Practice on Corporate Governance in
various sections of this report.
1.5 Board Responsibilities
The Board’s key responsibilities include:
Providing direction and guidance to the
Company in the formulation of medium
and long term strategies which are
aimed at promoting sustainable long-
term success of the Company.
Reviewing and approving Company's
annual plan and business strategies
and tracking performance against
same.
Appointing the CEO and reviewing the
performance of the CEO, the Board and
its sub committees annually.
Reviewing and making changes when
necessary to authority levels delegated
from the Board to the sub committees of
the Board and executive levels.
Review of objectives and key
performance indicators of the CEO
and senior management, and ensuring
that the CEO and management team
possesses the skills, experience and
knowledge to implement the strategy.
Reviewing HR process and approving
annual increments, bonuses and
changes in perquisites and incentives.
Approving the issue of equity / debt
securities
Approval of financial policies and
certain items outside the remit of the
Investment Committee.
Approval of the Company’s financial
statements.
Recommending / declaring dividends.
Reviewing systems of internal control,
risk management and integrity of the
financial information.
Review of the Company’s overall
corporate governance arrangements.
Ensuring all stakeholder interests are
considered in corporate decisions.
Monitoring systems of compliance and
governance.
Approving any amendments to
Company's policy documents.
The principal matters reserved for the
Board are set out above. Day to day
operational decisions are managed by
members of the Executive Committee.
Where appropriate, matters are delegated
to Board sub committees where they will be
considered with their respective terms of
reference. Brief terms of reference of each
of the Board sub committees, which have
been approved by the Board and comply
with the ‘Code’ are provided in each of the
committee reports from pages 119 to 126.
1.6 Board Skills and Experience
Collectively, the Board brings in a
wealth of diverse exposure in the fields
of management, business, finance,
economics, legal, banking, marketing,
and human resources, which facilitates
constructive and challenging discussions in
the Board room. All directors of UA possess
the necessary skills and knowledge
complemented with a high sense of integrity
and independent judgement. Following
diagram illustrates the key skills, experience
& personal attributes of the directors of UA.

115
UNION ASSURANCE PLC | ANNUAL REPORT 2017
CO
RP
OR
ATE
GO
VE
RN
AN
CE
Capabilities
Thorough understanding of the business
Mix of skills, perspectives, and experience
Structure & Process
Clear roles & effective committees
Effective communication of information
Effective board meetings & calendaring
Effective member nomination & succession
Behaviours
Trust & respect
Active engagement
Openness to dissent and divergent thinking
Alignment on strategy
Key Considerations
for Board Appointments
Means for enhancing Board
performance
Skills, expertise and experience
necessary to meet the strategic vision
for the business
Skills, expertise and experience not
adequately represented at the Board
Process necessary to ensure the selection of a candidate who
possesses the required qualities
Key Considerations for Board Appointments
1.7 Board Appointments
Board appointments follow a structured
and formal process within the purview of
the Nominations Committee. The Terms
of Reference for the members of the
Nominations Committee and the Committee
report can be found on page 121.
Details of new Directors are disclosed
to the shareholders at the time of
their appointment by way of public
announcement as well as in the Annual
Report. The Directors are required to report
any substantial changes in their professional
responsibilities and business associations
to the Nominations Committee, which will
examine the facts and circumstances and
make recommendations to the Board.
1.8 Managing Conflicts of Interests and Ensuring Independence
In order to avoid potential conflicts or
biases, the Directors make a general
disclosure of interests, as illustrated
below, at appointment, at the beginning
of every financial year and during the
year as required. Such potential conflicts
are reviewed by the Board from time
to time to ensure the integrity of the
Board’s independence. Further, the Board
ensures that no related party benefits
from favourable treatment. All related
party transactions as defined in Sri Lanka
Accounting Standard LKAS - 24 Related
Party Transactions, are disclosed in Note 43
to the Financial Statements.
To avoid potential conflicts or bias, Directors
adhere to a process where review takes
place as follows;
Prior to Appointment
Nominees are
requested to make
known their
various interests
Once Appointed During Board Meetings
Directors obtain
Board clearance
prior to:
Accepting new
position
Engaging in any
transaction that
could create
or potentially
create a conflict
of interest
All NEDs are
required to notify
the Chairman of
any changes to
their current Board
representations
or interests and a
new declaration
is made every
financial year
Directors who
have an interest
in a matter under
discussion:
Excuse
themselves from
deliberation
on the subject
matter
Abstain from
voting on the
subject matter
(abstentions
from decisions
are duly
minuted)
Further details of their qualifications and experience are provided under the Board profiles
section of this Annual Report.

UNION ASSURANCE PLC | ANNUAL REPORT 2017
116
CORPORATE GOVERNANCE
Compliance of Independent Non - Executive Directors in terms of their interest in business is as follows;
Director
Employment in the
Company
(A)
Material Business
Relationship
(B)
Close Family Member is
a Director or CEO (C)
Carrying not Less than
10% of Voting Rights
(D)
Continuously Served for more than Nine Years
(E)
Business Connection
(F)
Director / Shareholder in another
Entity (G) and (H)
G. F. C. De Saram Compliant Compliant Compliant Compliant Compliant Compliant Compliant
H. A. J. De Silva Wijeyeratne Compliant Compliant Compliant Compliant Compliant Compliant Compliant
A. S. De Zoysa Compliant Compliant Compliant Compliant Compliant Compliant Compliant
(A) Has not been employed by the Company during the period of two years immediately preceding appointment as a Director.
(B) Currently has no material business relationship with the Company directly or indirectly, nor had any during the period of two years immediately preceding
appointment as a Director.
(C) Does not have any close family member/s who is a Director or CEO or key management personnel in the Company.
(D) Does not have a significant shareholding in the Company (more than 10% of voting rights of the Company).
(E) Has not served on the Board of the Company for a period exceeding nine years from the date of first appointment.
(F) Self or close family member is not a Director or employee of another Company or a trustee which is materially connected to the Company in terms of
shareholding or business relationship.
(G) Not a Director of another Company in which majority of the other directors are employed / directors or have any significant shareholding.
(H) Does not have any material business relationship or significant shareholding in another Company in which majority of the other directors are employed /
directors or have any significant shareholding.
All Directors make a formal declaration of their independence on an annual basis. Board positions held outside the Company by the Independent
Non-Executive Directors are provided in their respective profiles under Board of Directors on page 106 and 107 of this report.
1.9 Re-Election
In accordance with the Articles of
Association of the Company, one third of the
total number of Directors retire from office
at each Annual General Meeting (AGM). A
retiring Director is eligible for re - election
by the shareholders. Any Director who has
been appointed to the Board during the
year, holds office until the next AGM,
when he / she is required to retire and be
re - elected by the shareholders.
1.10 Board Induction and Training
When Directors are newly appointed to
the Board, they undergo a comprehensive
induction where they are apprised, inter-
alia, of the Company values and culture,
its operating model, policies, governance
framework and processes, the code of
conduct and the operational strategies
of the Company. Additionally, the newly
appointed Directors are provided access
to relevant parts of the business and are
availed of the opportunity to meet with
key management personnel and other
key third party service providers such as
External Auditors, Internal Auditors etc.
The Board of Directors recognises the
need for continuous training and expansion
of knowledge and undertakes such
professional development as they consider
necessary in assisting them to carry out
their duties as Directors.
1.11 Procedures to Obtain Professional Advice
On access to information and professional
development; it is essential that the
Directors are up to date with key business
developments to maintain and enhance
their effectiveness.
The Directors have access to;
Information necessary to carry out
duties and responsibilities effectively
and efficiently
External and internal auditors
Updates on regulations, best practices
as relevant to the business and other
matters which are considered to warrant
Board attention
Financial plans, including budgets and
forecasts and periodic performance
reports
Independent professional advice from
experts and other external professional
services as required. The Company will
incur the required expenses on such
services.
Company Secretaries whose
appointment and / or removal is the
responsibility of the Board
Any of the locations in which the
business operates (Branch network)
Senior management
1.12 Timely Supply of Information
The Board of Directors was provided with the
necessary information well in advance (at
least 7 working days prior to the meeting),

117
UNION ASSURANCE PLC | ANNUAL REPORT 2017
CO
RP
OR
ATE
GO
VE
RN
AN
CE
by way of Board papers and proposals,
for all Board meetings held during the
year in order to ensure robust discussion,
informed deliberation and effective decision
making. The senior management team made
presentations to Directors on important
issues relating to strategy, performance
against targets, risk management, investment
proposals, new system implementation, life
fund valuation, reinsurance arrangement
for 2017 and embedded value assignment,
and other relevant information as necessary.
The Directors continue to have independent
contact with the senior management of
the Company.
1.13 Board Evaluation
Board evaluation to assess the effectiveness
of the Board is done each year and the
2016 evaluation was done in January
2017 using a questionnaire covering the
operations of the Board and each of its
principal committees. The Board evaluation
for the year 2017 was conducted and the
findings were tabled and discussed at the
board meeting held on 30 November 2017.
1.14 Board Meetings
Board meetings are usually held once
every two months, unless the business
exigencies demand the convening of
additional meetings. During the year, there
were 6 meetings of the Board. The Board
ensures that items relating to strategy,
finance, operations, corporate governance
and compliance are covered in its meeting
agenda to support, assist and advise
executive management to deliver the
Company’s strategy within a transparent
governance framework. There is, formal
schedule of matters reserved for the
Board’s consideration, which is regularly
reviewed. Preparation of the Agenda for
Board meetings has been delegated to the
Company Secretaries and it is reviewed
and approved by the Chairman, where
necessary, in consultation with the CEO and
members of the Board.
The general time allocation of the Board
during 2017 was as illustrated below.
Board Activities During 2017
Strategy
Performance
Finance
Governance
Human Capital
Other
7%
12% 13%
15%
25%
28%
Six Board Meetings
1.15 2017 Board Topics
The Board met six times during 2017. The
key areas of focus as per the Board’s agenda
of meetings during the year included;
The Chief Executives’ brief on the
strategy, its implementation and other
business developments.
System migration project progress update
GOYO strategy review
Long term business plan progress review
Review minutes and reports from the
Board Sub Committees.
Review of brand value, positioning and
competitor analysis.
An update by the Chief Executive
Officer on operational matters including
technology, actuarial valuations,
technical updates on product portfolios,
re - insurance arrangements, regulatory
changes, any consultancy support on
projects and other ongoing operational
initiatives and compliance matters.
Review and approval of variable bonus
scheme for staff.
The following were also addressed by the
Board during 2017 in line with the Company
objectives.
Area of Focus Action by the Board
Strategy The 2018 - 2022 five year strategy review was conducted in October 2017.
Finance
The Board regularly monitored the financial performance of the Company. The monthly performance pack
provided to the Board by the CFO includes an overview of the operational and financial performance including
performance of the Life Insurance Fund, detailed analysis of the expenses, the key performance indicators and
key value drivers against the plan and previous year, regulatory compliance report, Capital Adequacy Ratio and
approved assets status, financial review of the associate entity and performance of investments.
All financial reports released to the market which included the interim financial statements and the annual report
were reviewed.
Financial budget 2018 was reviewed and approved in October 2017.

UNION ASSURANCE PLC | ANNUAL REPORT 2017
118
CORPORATE GOVERNANCE
2. Company SecretaryThe Company Secretary is responsible
for inducting new Directors, assisting
the Chairman and the Chief Executive
Officer in determining the annual Board
plan, guiding the Board and individual
Directors in the proper discharge of their
responsibilities and acts as a central source
of guidance on matters of ethics and
governance. In addition to these duties,
the Company Secretary is responsible for
making necessary disclosures on related
party transactions required by laws and
regulations and also acts as a channel of
communication with shareholders to ensure
good shareholder relations.
The shareholders can contact Keells
Consultants (Private) Limited, the Company
Secretaries on 011 - 2306245 for any
company related information requirements.
The calendar of meeting of the Board in
2017 and attendance is given below.
3. Board Sub-CommitteesThe Board has delegated some of its
functions to Board Sub Committees, while
retaining decision rights. Members of
these Sub Committees are able to focus
on their designated areas of responsibility
and impart knowledge and oversight in
areas where they have greater expertise.
Recommendations of these Committees
are addressed directly to the Board
and minutes of meetings are tabled and
discussed at the main Board meetings.
The extent of the adherence by these
committees to the Code of Best Practice on
Corporate Governance issued jointly by the
ICASL and the SEC of Sri Lanka is given on
pages 138 to 151.
The Board Sub committees are as follows;
1. Board Audit and Compliance Committee
2. Board Nominations Committee
3. Remuneration Committee
4. Investment Committee, and
5. Related Party Transaction Review
Committee
Board Sub Committees comprised
predominantly of Independent
Non - Executive Directors. The Board
Sub Committee reports together with
their composition is as follows;
Name of DirectorDate Of
Appointment to The Board
30..0
1.20
17
27.0
3.20
17
30.0
5.20
17
28.0
7.20
17
18.1
0.20
17
30.1
1.20
17
Elig
ible
to
Atte
nd
Atte
nded
Non-Executive
Susantha Ratnayake 01.01.2018 - - - - - - 0 0
Ajit D. Gunewardene
(Resigned w.e.f. 31.12.2017)
24.02.2004 6 6
Suresh Rajendra 16.08.2011 6 6
Dilani Alagaratnam 16.08.2011 6 6
Independent NED
Ashan De Zoysa 01.04.2009 6 5
Harin A. J. De Silva Wijeyeratne 07.09.2011 6 6
Gerald De Saram 01.04.2009 6 4
Executive
Dirk Pereira 28.05.2014 6 6
Attended Not Attended
Area of Focus Action by the Board
Operational
Performance
Each Board paper contains a set of reports of the business performance, including the financial and non financial
performance measures against the plan. Regular updates are provided by the CEO on the risks and opportunities
faced by the business including a quarterly review of competitor performance.
The sustainability dashboard is circulated to the Board each quarter which indicates status in terms of health
and safety (number of injuries), carbon foot print (carbon MT), power usage (KwH), water usages and waste
generated.
HR
Regular review of HR matrices, review of succession plans and diversity and inclusion practices across the Company.
Review progress on the action items to be implemented stemming from the Great Place to Work (GPTW) survey
conducted in 2017.
Risk & Governance
Review of quarterly company risk grid.
Review of the minutes of Board sub committee meetings.
Presentation and approval for services rendered by Strategic Group IT (JKH) division to UA and related costs.

119
UNION ASSURANCE PLC | ANNUAL REPORT 2017
CO
RP
OR
ATE
GO
VE
RN
AN
CE
REPORT OF THE BOARD AUDIT AND COMPLIANCE COMMITTEE
Composition The Board Audit and Compliance
Committee (Committee) comprised of the
following members as at the end of the year.
Harin De Silva Wijeyeratne – Committee
Chairman / Independent Non-Executive
Director
Ashan De Zoysa - Independent Non-
Executive Director
Suresh Rajendra - Non- Executive
Director
The members have an adequate blend of
experience and knowledge to carry out their
duties. Brief profiles of the Directors are
provided on pages 106 and 107 of this report.
Executive Vice President and CFO Financial
Services Group of John Keells Holdings
PLC, Mr. S. Wijesinghe functions as the
Secretary of the Committee.
CEO, GM Finance & Planning (CFO), other
members of the Executive Committee
(where relevant), Head of Group Risk and
Control Review of John Keells Holdings
PLC, External Auditors and Internal Auditors
participate as invitees at the Committee
meetings.
Terms of Reference The Committee operates pursuant to an audit
committee charter which is formally approved
by the Board. The role of the Committee is
to assist the Board of Directors in fulfilling its
oversight responsibilities with regard to:
Ensuring the integrity of the financial
statements of the company and that
a sound financial reporting system is
in place and is well managed in order
to provide accurate, appropriate and
timely information to the management,
regulatory authorities and shareholders
in compliance with Sri Lanka
Accounting Standards, Regulation of
Insurance Industry Act No. 43 of 2000,
Companies Act No. 7 of 2007 and other
financial reporting related regulations
and requirements.
Ensuring effectiveness of the internal
control system and the Company’s Risk
Management function
Ensuring the Company’s compliance
with legal and regulatory requirements
including the performance of the
Company’s compliance function.
Assessing the independence and
monitoring the performance and
functions of internal and external
auditors.
Assessing the company’s ability to
continue as a going concern in the
foreseeable future;
The Committee is empowered to carry
out any investigations it deems necessary
and review all internal control systems and
procedures, compliance reports and risk
management reports in order to fulfil it’s
responsibilities.
The Committee has reviewed and discussed
with management and internal and external
auditors, the audited financial statements,
the quarterly unaudited financial statements
as well as matters relating to the company’s
internal control over financial reporting,
key judgements and estimates in the
preparation of financial statements and the
processes that support certification of the
financial statements by the CEO and CFO.
MeetingsThe Committee had five meetings during the
year under review which were attended by
the external auditors and internal auditors
as required. These meetings were attended
by the CEO, CFO and General Managers
responsible for underwriting, marketing and
distribution, actuarial and IT by invitation.
Attendance of the Committee members at
the meetings is illustrated at the end of the
report.
The Chairman and members of the
Committee were in regular contact with
the management of the company through
numerous meetings and communications
to oversee the auditing and control
aspect in various initiatives the Company
undertook during the year including
the implementation of the new policy
administration system which will enhance
the efficiency of the operations.
The activities and views of the Committee
are communicated to the Board of
Directors through papers tabled and
verbal discussion, as well as by tabling the
minutes of the Committees’ meetings at the
Board meetings.
Financial ReportingThe Committee reviews the financial
statements of the Company before
submission to the Board, in order to monitor
the integrity of the financial statements
prepared for disclosure, and the significant
financial reporting judgements contained
therein. In reviewing the financial statements
prior to their release, the Committee focuses
particularly on:
(i) major judgmental areas
(ii) any changes in accounting policies and
practices
(iii) significant adjustments arising from the
audit
(iv) the going concern assumption, and
(v) the compliance with relevant accounting
standards and other legal requirements
The Committee also assesses the
Company’s compliance with financial
reporting requirements as per the
Companies Act, Insurance Industry Act and
other relevant financial reporting related
regulations and requirements.
Internal Audit The Committee monitors the effectiveness of
the internal audit function and is responsible
for recommending to the Board their
appointment or removal and for ensuring
they have adequate access to information
required to conduct their audits.
During the year, the Committee monitored
and reviewed the scope, extent and

UNION ASSURANCE PLC | ANNUAL REPORT 2017
120
CORPORATE GOVERNANCE
effectiveness of the activity of the Internal
Auditors. This included reviewing of updates
on audit activities and achievements
against the audit plan and advising
corporate management to take corrective
measures on significant audit findings. The
areas covered and the regularity of audits
depended on the risk level of each area,
with higher risk areas being audited more
frequently.
The Committee reviewed 40 internal audit
reports covering the operations of 36
branch locations and several head office
functions including underwriting, claims,
reinsurance, finance, investments and
information technology. During the year,
the Committee reviewed the findings of
the special end to end process review of
the investment division and ensured that
most of the recommendations have been
implemented in 2017 with a few being
carried forward to 2018.
The Committee ensured that the internal
audit function is independent of the
activities it audits and that it is performed
with impartiality, proficiency and due
professional care. Audit findings presented
in the reports were prioritised based
on the level of risk. The Committee also
reviewed and monitored management’s
responsiveness to the significant audit
findings and recommendations of the
internal auditor. The internal audit reports
were made available to external auditors
as well.
The Committee met the internal auditors
without the presence of the management
during the year.
External AuditorsMessrs. KPMG was re - appointed as the
external auditors at the Annual General
Meeting held on 31 March 2017.
The Committee reviewed the external
audit plan, audit findings as well as the
management letters and any issues raised
were followed up. The Committee met the
external auditors without the presence of the
management during the year.
Independence and Objectivity of the External Auditors
The Committee has policies in place
aimed at safeguarding and supporting
the independence and objectivity of
the external auditors. The Committee
reviewed the audit and non-audit work
that is assigned to Messrs. KPMG, to
ensure that provision of such services does
not impair KPMG’s independence. The
services provided by the external auditors
were segregated between what requires
an independent view such as audit and
assurance services and other advisory
services such as tax consultancy. Work is
assigned in a manner to prevent a conflict
of interest for the external auditors.
The Committee has received a declaration
from Messrs. KPMG, as required by the
Companies Act No. 7 of 2007, confirming that
it does not have any relationship or interest in
the company, which may have a bearing on
its independence within the meaning of the
Code of Conduct and Ethics of The Institute
of Chartered Accountants of Sri Lanka.
Oversight on Regulatory Compliance The Committee with the assistance of
both the internal auditors and the external
auditors closely scrutinizes the compliance
with mandatory statutory requirements and
the systems and procedures in place to
ensure compliance with such requirements.
Changes in Contractual Liability – Transfer of one off surplus
Based on the directions issued by the IRCSL
dated 20 March 2018 and subsequent
approval, the Company has transferred
Rs. 3,382 million attributable to non -
participating business from life policyholder
fund to life shareholder fund (SHF) through
Income Statement and is held as part of
the Restricted Regulatory Reserve under
Equity in the statement of Financial Position.
The distribution of this one - off surplus is
subject to meeting governance requirements
stipulated by the IRCSL and can only be
released upon receiving approval from the
IRCSL. For further details, please refer
Note 38.
Corporate Governance
IT Risk and Control Assessment
The Committee receives a report detailing
the robustness of the IT controls and any
risks that need attention from Messrs.
KPMG on an annual basis.
Internal Controls and Risk Management
The effectiveness of the company’s internal
controls and risk management processes
are evaluated in the reports furnished by the
External and Internal Auditors. In addition,
the Committee requests the management to
provide reports on controls in specific focus
functions as and when required. In addition
to this, the Committee is presented with
an organisational risk grid on a quarterly
basis which illustrates the foreseeable risks
the company faces and the likelihood and
possible impact to the business. The grid
also illustrates the action taken to mitigate
such risks.
Report of External Actuary
The Committee received written
representations from the independent
external actuary, summarising the
observations and comments with regard to
the work performed.
Professional Advice
It is within the power of the Committee
to seek external professional advice as
and when it requires on any relevant
subject area.
Ethics and Good Governance
The Committee continuously emphasised
on the importance of upholding ethical
values by all staff members. In this regard,
a Code of Ethics and Whistle-Blowers
Charter is in place and all members of
staff are encouraged to resort to whistle -
blowing, if they suspect wrong doings or
other improprieties. The highest standards
of Corporate Governance and adherence
to the Company’s Code of Ethics were
REPORT OF THE BOARD AUDIT AND COMPLIANCE COMMITTEE

121
UNION ASSURANCE PLC | ANNUAL REPORT 2017
CO
RP
OR
ATE
GO
VE
RN
AN
CE
The calendar of meetings of the Committee in 2017 and attendance is given below.
NameYear of
Appointment to the Committee
27.0
1.20
17
24.0
3.20
17
09.0
5.20
17
09.0
8.20
17
09.1
1.20
17
Elig
ible
to
Atte
nd
Atte
nded
Chairman
Harin A J De Silva Wijeyeratne 26.09.2011 5 5
Independent NED
Ashan De Zoysa 01.04.2009 5 5
NED
Suresh Rajendra 26.09.2011 5 4
Attended Not Attended
ensured. All appropriate procedures
were in place to conduct independent
investigations into incidents reported
through Whistle - Blowing or identified
through other means. The Whistle-Blowers
Charter guarantees the maintenance of
strict confidentiality of the identity of
whistle blowers.
Evaluation of the Committee
The Committee conducts a self-evaluation
exercise once a year with input by each
member of the Committee and in addition
by the external and internal auditors, CEO,
CFO and the Secretary of the Committee.
The results were presented to the Board
and it was determined that the Committee
was effective.
Re - Appointment of the External Auditors
The Committee has recommended to the
Board that Messrs. KPMG be re-appointed
as auditors for the financial year ending 31
December 2018, subject to approval by the
shareholders at the next Annual General
Meeting. The Committee recommends the
fees payable to the statutory auditors for
approval by the Board.
Conclusion The Committee is satisfied that internal
controls have been operating as designed
and the Company’s assets have been
adequately safeguarded during the period
under review. The Committee is also
satisfied that the Company’s internal and
external auditors have been effective and
REPORT OF THE BOARD NOMINATIONS COMMITTEE
The Nominations Committee (NC) of John
Keells Holdings PLC (the Parent) acts as the
NC of the Company
CompositionThe Committee comprised the following
Directors of the Parent Company, John
Keells Holdings PLC (JKH):
M A Omar - Chairman of the Committee
/ Non-Executive Director of JKH
M P Perera (Ms.), Non-Executive
Director of JKH
S C Ratnayake, Executive Director /
Chairman and CEO of JKH
S S H Wijayasuriya (Dr.), Non-Executive
Director of JKH
Terms of Reference Define and establish nomination process
for Non-Executive Directors (NEDs), lead
the process of Board appointments and
make recommendations to the Board on the
appointment of Non-Executive Directors
(i) Assess skills required on the Board
given the needs of the business
(ii) From time to time assess the extent to
which required skills are represented on
the Board
(iii) Prepare a clear description of the role
and capabilities required for a particular
appointment
(iv) Identify and recommend suitable
candidates for appointment to the Board.
(v) Ensure, on appointment to Board, NEDs
receive a formal letter of appointment
specifying clearly
Expectation in terms of time
commitment
Involvement outside of formal
board meetings
Participation in committees
The appointment of Chairperson and Executive
Directors is a collective decision of the Board.
Recommendation was made to appoint
Mr. S. C. Ratnayake to the Board of Union
Assurance PLC as the Chairman with effect
from 1 January 2018.
independent throughout the period. The
Committee believes that the Company’s
accounting policies are appropriate and
have been applied accurately.
H A J De Silva Wijeyeratne
Chairman
Board Audit and Compliance Committee
29 March 2018

UNION ASSURANCE PLC | ANNUAL REPORT 2017
122
CORPORATE GOVERNANCEREPORT OF THE BOARD REMUNERATION COMMITTEE
CompositionThe Board Remuneration Committee
comprised of the following members.
S C Ratnayake - Chairman of the
Committee / Non - Executive Director
(Appointed to the Committee w.e.f.
1 February 2018)
A D Gunewardene - Chairman of the
Committee / Non - Executive Director
(Resigned w.e.f. 31 December 2017)
G F C De Saram - Independent Non -
Executive Director
H A J De S Wijeyeratne - Independent
Non - Executive Director
The Chief Executive Officer (CEO) and the
EVP / CFO - Financial Services Industry
Group, John Keells Holdings PLC, Mr. Suran
Wijesinghe attends the meetings of the
Committee by invitation. Other Executive
Committee members are invited as and
when required.
The CEO who is responsible for the overall
management of the Company assists the
Committee by providing relevant information
and participating in its analysis and
deliberations, except when matters relating
to the CEO are discussed.
The Committee obtains the services of
professional advisors in relevant fields when
deemed necessary.
Terms of Reference The responsibilities of the Committee
include;
Formulating, on behalf of the Board,
formal and transparent procedures
for developing policy on remuneration
for Directors, CEO and the senior
management team
Developing strategic human resources
policies.
Recommending corporate management
appointments and advising on
succession planning.
Setting the total compensation
packages for the CEO and senior
management.
Review of objectives and key
performance indicators of the CEO
and senior management, and their
development and succession planning.
Review performance ratings of the CEO
and senior management team.
Maintaining competitive and attractive
remuneration packages linked to
performance.
Ensuring that the performance related
element of remuneration is designed
and tailored to align employees’
interests with those of the company and
main stakeholders.
Approving annual increments, bonuses
and changes in perquisites and
incentives.
Ensuring that no Director is involved in
setting his / her own remuneration.
Meetings The Committee had one meeting during the
year under review. The Committee forwarded
minutes of its meeting to the Board.
Attendance of the committee members at the
meetings is illustrated at the end of the report.
Remuneration PolicyOur reward strategies and remuneration
structure is designed to attract, motivate
and retain high-calibre people, at all levels
of the organisation, in a highly competitive
environment. Accordingly, a key feature
of our remuneration policy is pay for
performance. The skills, experience of the
individual and his/ her level of responsibility
are also taken into account in deciding on
the remuneration.
Remuneration Policy Principles The following objectives are the guiding
principles that underpin our remuneration
strategy;
Total remuneration is set at a level that
can attract, motivate and retain high
quality executive talent.
Remuneration is commensurate with
each employee’s level of expertise
and contribution and aligned with the
business’ performance and long term
shareholder returns.
Executive remuneration is set so that
a significant portion of remuneration is
linked to performance.
The performance related element of
remuneration is designed and tailored
to align employees’ interests with those
of the company and main stakeholders.
Remuneration levels are based on
industry and market surveys.
To incentivise employees to deliver and
sustain high levels of performance and
the execution of our strategic priorities.
To align with the principles of good
corporate governance.
Methodology Used
Employees
Rewards and recognition are a key factor
influencing employee behaviour. Therefore
UA‘s compensation policy is designed to
pay for performance and promotions are
based on performance and potential.
Base Salary
Base salary is the fixed component of the
remuneration for the role performed and
is based on the scope and complexity of
the role and is reviewed annually. Overall
competence and performance are key
factors that determine an individual’s base
pay. Annual performance appraisals are
conducted and increments are granted
based on performance.
Variable Pay
There are several performance based
incentive schemes in place to reward
individuals. Variable pay opportunities are
provided for certain employees, when it
is necessary to motivate them to achieve

123
UNION ASSURANCE PLC | ANNUAL REPORT 2017
CO
RP
OR
ATE
GO
VE
RN
AN
CE
key short term and medium term goals.
Incentives include inter alia, commissions
paid for acquiring new business, incentives
for achieving key result areas and annual
bonus.
Annual Bonus
The Company has implemented a
performance based bonus scheme for staff
at all levels. As per the scheme, the annual
bonus is subject to individual performance
and achievement of the Company’s
objectives. If the Company’s performance
exceeds the targets set for the year,
employees are entitled to a higher bonus.
Conversely, if the Company performs poorly,
employees may not receive a bonus.
Employee Benefits
Other benefits provided to employees
include, travelling allowances, vehicle loans
and insurance benefits including the staff
health insurance cover, critical illness cover
and personal accident cover for selected
categories.
Retirement Benefits
Gratuity, Employee Provident Fund (EPF)
and Employee Trust Fund (ETF) are the
retirement benefits available for employees.
Board of Directors
Remuneration for Directors is determined
by the Remuneration Committee. The
remuneration for Non - Executive Directors
reflects the time, commitment and
responsibilities of their role and is based on
industry and market surveys. No Director
is involved in determining his or her own
remuneration.
Remuneration for Directors
The fees paid to the Directors are disclosed
in Note 21. This includes fees for all the
Committees of the company that they serve
on. The Directors’ business interests with
the Company are disclosed in Note 43.
Share Options for Directors
The Company does not have a share
options scheme for Directors.
Directors’ Shareholding
The shareholdings of Directors are provided
on page 63.
Personal Loans to Directors
None of the Directors have taken loans from
the Company
Susantha Ratnayake
Chairman
Board Remuneration Committee
29 March 2018
The calendar of meetings of the Committee in 2017 and attendance is given below.
NameYear of
Appointment to the Committee
27.0
3.20
17
Elig
ible
to
Atte
nd
Atte
nded
Chairman
Susantha Ratnayake 01.02.2018 - 0 0
Ajit D. Gunewardene
(Resigned w.e.f. 31.12.2017) 25.03.2008 1 1
Independent Non-Executive Director
Harin A. J. De Silva Wijeyeratne 26.09.2011 1 1
Gerald De Saram 26.05.2009 1 0
Attended Not Attended

UNION ASSURANCE PLC | ANNUAL REPORT 2017
124
CORPORATE GOVERNANCEREPORT OF THE INVESTMENT COMMITTEE
CompositionThe Investment Committee comprised of the
following members as at the end of the year.
Krishan Balendra – Chairman
A S De Zoysa – Independent Non-Executive
Director
The Head of Investments acts as the
Secretary to the Committee.
Group Finance Director, John Keells
Holdings PLC, Mr. Gihan Cooray and
EVP / CFO Financial Services Industry
Group, John Keells Holdings PLC, Mr.
Suran Wijesinghe attended meetings of
the Committee by invitation. The CEO,
GM Finance and Planning (CFO) and GM
Actuarial participated as invitees at the
Investment Committee meetings.
The Chairman Mr. Krishan Balendra has
extensive knowledge and experience in the
field having held positions in investment
banking and corporate finance at UBS
Warburg Hong Kong and at Aitken Spence
& Co PLC, Sri Lanka. Mr. Balendra is a
former Chairman of the Colombo Stock
Exchange. He is the Deputy Chairman
of John Keells Holdings PLC and the
Chairman of Nations Trust Bank PLC.
Mr. A S De Zoysa brings in knowledge and
experience from diverse fields including
commodity trading. A brief description
of his profile can be found on page 106.
The Committee solicits the services of
economists and other experts in related
fields to aid in the decision-making process.
Terms of Reference The Committee is guided by the Board
approved Investment Policy Statements
(IPS) and the purpose of the Committee
is to assist the Board of Directors to fulfil
their responsibility to shareholders and
policyholders, in relation to the management
of the investment portfolios including
the development of overall and portfolio
specific investment guidelines. Within this
framework, the Committee performs the
following duties.
Advice on the formulation of the
investment strategy.
Review and develop broad
investment policies and guidelines for
implementation
Provide guidance on the asset
allocation of the investment funds
Review fund performance for the month
and on a cumulative basis.
Manage risk exposure.
Ensure compliance with internal
investment policy and procedures, and
external investment regulations.
The minutes of the Committee meetings
are presented to the Board of Directors
along with a detailed list of investments
made during the period. In carrying out its
responsibilities, the Committee’s policies
and procedures remain flexible, in order to
best react to changing conditions and to
ensure that the management of the Funds
are performed to the highest standards
possible and in accordance with all internal
and external regulations. During the year,
the Committee reviewed and updated the
investment policies and procedures to
reflect changes to applicable regulatory
requirements and market conditions.
Meetings The Committee met ten times during the
year. Independent professionals in the
fields of economics, risk and investment
management also attended the meetings
when required, to provide technical input
and facilitate decision making.
Attendance of the Committee members at
the meetings is illustrated at the end of the
report.
Summary of Activities The Committee obtained independent
advice on macroeconomic forecasts,
yield curve predictions and other
factors, including key macro-economic
indicators such as inflation, interest
rates, exchange rates and their impact
on the performance of capital markets.
Based on expert advice, the Committee
reviewed and assigned probabilities
for different macro-economic scenarios
and investment strategies were aligned
accordingly.
At the beginning of the year, the
Committee considered the profit plan
together with the budgeted investment
income for the Life fund and advised on
the formulation of investment strategies
taking into account the investment
objectives for the planning period, the
maturity profiles and risk tolerance of
the respective funds.
Provided guidance on asset allocation
for the Funds under management,
including Unit Linked Funds in order
to achieve the budgeted investment
income, and returns to policyholders
taking into account the determinations
issued by the Insurance Regulatory
Commission of Sri Lanka (IRCSL),
the maturity profiles of the Funds and
agreed investment strategies, and
the investment policy statements of
each fund.
The Committee reviewed the investment
policies of the funds and was satisfied
with the scope and principles covered
in the IPS. Discussed and agreed
on duration of investments for asset
liability management and provided
advice on the proportion of long term
versus short term investments to be
maintained for the year. Maturity profile
of liabilities were obtained for necessary
realignment in the asset and liability
structure.
Reviewed fund performance for each
month and on a cumulative basis
against agreed benchmarks. The
Committee was also updated each

125
UNION ASSURANCE PLC | ANNUAL REPORT 2017
CO
RP
OR
ATE
GO
VE
RN
AN
CE
month on fund growth, maturity profiles
and asset liability management of the
respective funds.
The Committee has set separate
exposure limits for banks and corporate
entities, which are reviewed monthly.
These limits are updated on a regular
basis in line with respective fund sizes
and information pertaining to the
financial stability of such entities.
The Committee reviewed compliance
with internal and external investment
regulations at each meeting, including
IRCSL regulations related to solvency
and approved assets.
The Committee also ensured that the
agreed investment strategies and
asset allocations for the year were
implemented.
The Committee monitors the
performance of the unit linked equity
fund monthly and the outsourced party
meets with the Committee each quarter
for a detailed review.
The core principles of asset management
that were adopted:
1. An effective and efficient governance
structure
UA’s investment function is governed
by the Investment Committee which
comprises of Board members,
specialists in the field of fund
management and members of the
senior management team.
Solicit external expertise to advice on
the economic climate and any other
specialised areas.
Review investment performance
on a monthly basis, appraise
investment proposals submitted by
the management and set investment
strategy.
2. Develop an investment strategy and
implement policies and procedures to
execute the strategy at the operational
level.
Document Investment Policies for each
of the Funds.
3. UA has an in-house investment division
which operationalises the strategies
set by the Committee and monitors
and controls the investment portfolio
effectively and efficiently.
UA has invested in a world class ERP
system (SAP) to provide MIS support
to manage its investment portfolio.
The Committee is provided with
information on a monthly basis. The
valuations of investments are carried out
automatically by the system and manual
processes are minimised to increase
accuracy and integrity.
In the process of selecting investments,
while reports from rating agencies are
considered, UA conducts rigorous
appraisal on market conditions and
Issuer’s performance. In relation to
related party investments, the Company
strictly complies with applicable
regulatory requirements and all
transactions are entered into on an
arm`s length basis and follows the
guidelines set by the Parent Company’s
related party transactions review
committee.
4. Establish internal control mechanisms
specifically with respect to investment
activities.
Processes streamlined to ensure the
integrity of the investment activities. A
back office and front office segregation
is in place and signatories and system
controls are in place to ensure that the
work flow is properly segregated.
Authority and dealing limits are strictly
enforced via the Manual of Financial
Authority (MOFA) limits.
ConclusionIn view of all of the above, the Committee
was satisfied with the performance of the
Funds under management during the year
and the policies and procedures in place for
the management of the invested funds
Krishan Balendra
Chairman
Investment Committee
29 March 2018
The calendar of meetings of the Investment Committee in 2017 and attendance is given below.
NameYear of Appointment
to the Committee
19.0
1.20
17
20.0
2.20
17
31.0
3.20
17
27.0
4.20
17
24.0
5.20
17
23.0
6.20
17
21.0
9.20
17
24.1
0.20
17
23.1
1.20
17
14.1
2.20
17
Elig
ible
to
Atte
nd
Atte
nded
Chairman
Krishan Balendra 23.04.2009 10 10
Independent NED
Ashan De Zoysa 30.03.2010 10 9
Attended Not Attended

UNION ASSURANCE PLC | ANNUAL REPORT 2017
126
CORPORATE GOVERNANCE
On the basis that the Parent company
is also a listed company, the securities
and Exchange Commission of Sri Lanka
(SEC) has permitted the Related Party
Transactions Review Committee of the
Parent Company, to represent the listed
Companies in the JKH Group of which,
Union Assurance PLC is a member.
CompositionThe Committee comprised of the following
members as at the end of the year.
M P Perera (Ms.) – Chairperson of the
Committee / Non-Executive Director of
JKH.
D A Cabraal, Non-Executive Director
of JKH
A N Fonseka, Non-Executive Director
of JKH
S C Ratnayake, Executive Director /
Chairman and CEO of JKH
Head of Group Business Process Review Mr.
Hisham Nazeem served as the Secretary to
the Committee during the year. In addition,
the former Group Finance Director of John
Keells Holdings PLC, Mr. Ronnie Peiris
(resigned w.e.f. 31 December 2017) and the
Group Finance Director Mr. Gihan Cooray
attended meetings by invitation.
Objective The objective of the Committee is to exercise
oversight on behalf of the Board, of John
Keells Holdings PLC and its listed subsidiaries,
in complying with the Code on Related Party
Transactions (RPTs) as issued by the SEC
(“The Code”) and with the Listing Rules of
the Colombo Stock Exchange (CSE). The
Committee has also adopted best practices as
recommended by the ICASL and the CSE.
Functions The Committee in discharging its functions
primarily relied on processes that were
validated from time to time and periodic
reporting by the relevant entities and Key
Management Personnel (KMP) with a view
to ensuring:
that there is compliance with the Code;
that shareholder interests are protected;
and
that fairness and transparency are
maintained.
The Committee reviewed and pre-approved
all proposed non recurrent RPTs of the
company. Further recurrent RPTs were
reviewed annually by the Committee.
Meetings The Committee held 4 meetings during the
financial year under review. Information on
the attendance of these meetings by the
members of the Committee is illustrated at
the end of the report.
Conclusion The activities and views of the Committee
have been communicated to the Board of
Directors quarterly through verbal briefings,
and by tabling the minutes of the Committee
meetings.
The calendar of meetings of the Committee in 2017 and attendance is given below.
NameYear of
Appointment to the Committee
25/0
1/20
17
25/0
5/20
17
26/0
7/20
17
01/1
1/20
17
Elig
ible
to
Atte
nd
Atte
nded
Non-Executive Directors (JKH)
P Perera 24.07.2014 4 4
N Fonseka 01.04.2014 4 4
A Cabraal 01.04.2014 4 4
Executive Director (JKH)
S Ratnayake 01.04.2014 4 4
Attended Not Attended
REPORT OF THE RELATED PARTY TRANSACTIONS REVIEW COMMITTEE

127
UNION ASSURANCE PLC | ANNUAL REPORT 2017
CO
RP
OR
ATE
GO
VE
RN
AN
CE
REPORT OF THE INFORMATION TECHNOLOGY COMMITTEE
CompositionThe Committee comprised of the following
members as at the end of the year
A D Pereira – Chairman / CEO
H Senanayake - General Manger,
Information Technology
I Tittagalla - General Manger, Life
Insurance
S Cader - General Manager, Finance
and Planning
Brief profiles of the committee members are
provided on pages 107 to 108 of the Annual
Report
Terms of Reference The Information Technology Committee
is established to ensure that IT strategies
align with the overall business operations
and effective implementation of the Board
approved IT strategies.
The Committee is responsible for;
Developing and reviewing the IT
strategic plan on an ongoing basis
Approving and reviewing the progress
of new IT projects / initiatives
Ensuring post implementation system
reviews
Reviewing vendors for major IT supplies
Ensuring proper IT governance
MeetingsThe committee meets as and when required
in addition to monthly meetings to review
the progress of ongoing initiatives.
Significant Progress Made During the Year Commenced the implementation of the
new policy administration system, eBao
and distribution management system,
Herald Logic. Both projects on track to
go-live mid 2018.
Launched a Chat Bot for policy inquiries
and submission of claims documents.
Key objective of launching a project
of this calibre was to craft and embed
the services provided by an insurance
assistant in to a popular chat platform
provided by Facebook - Messenger App.
Successfully tested and implemented
“e-consultant insurance”, leveraging
technology to enable under employed
segments of society to promote life
insurance solutions via social networks
and other digital channels.
Revamped the recruitment process
using ‘blue link’ technology, improving
the effectiveness and efficiency of the
recruitment process.
Further in our commitment to ensure data
integrity and data security of the Data
Centre Management System, the ISO
27001:2005 accreditation was maintained.
ConclusionThe Committee confirms that the Company
has made satisfactory progress in relation
to the implementation of the strategic plans
of 2017.
A D Pereira
Chairman
Information Technology Committee
29 March 2018

UNION ASSURANCE PLC | ANNUAL REPORT 2017
128
CORPORATE GOVERNANCE
4. Directors’ RemunerationRemuneration Procedure: The Company
has established a formal and transparent
procedure / policy on remuneration for
individual Directors. No Director is involved
in deciding his or her own remuneration.
Accordingly, the Board Remuneration
Committee (RC) consisting exclusively of
Non-Executive Directors has been set up to
make recommendations to the Board within
agreed terms of reference.
Level and Make Up of Remuneration: Due
care is taken to ensure that remuneration
paid to Board members is commensurate
with their skills, knowledge, competencies
and involvement in Board activities
and in reference to fees paid to other
Non-Executive Directors of comparable
companies.
The remuneration to Executive Director
has a fixed and a variable component.
The variable component is linked to the
achievement of the objectives set by the
Board. The RC is responsible for setting up
the remuneration of the Executive Director.
Disclosure of Remuneration: The break-
up of remuneration paid to Directors is
disclosed among the other disclosures
regarding remuneration on Note 43 in the
Annual Report.
5. Accountability and Audit Financial Reporting: A balanced and
understandable assessment of the
Company’s financial position, performance
and prospects is presented by the
Company. Various reports including the
Chairman’s Message, CEO’s Review and
Management Discussion and Analysis
are used in addition to annual financial
statements and interim accounts for this
purpose.
The Board presents a Directors’ Report with
this Annual Report, containing information
with regard to declarations by them in
accordance with the guidelines of the Code
of Best Practice jointly issued by the ICASL
and the SEC of Sri Lanka.
Internal Controls: The Board has delegated
certain responsibilities to the Board Audit
and Compliance Committee (BACC). The
BACC’s main responsibilities are to ensure
that good financial reporting systems
are in place, internal control systems are
effective, laws and regulations are complied
with and the company’s risk assessment
processes are effective. The BACC ensures
the independence and evaluates the
performance of the auditors regularly. The
company has issued a Code of Conduct
applicable to all Directors and employees
and any violation is disclosed. Details of
the Code of Conduct and other policies are
provided below.
Pages 138 to 151 of this report discloses
the extent to which the Company has
complied with the Code of Best Practice
and rules on Corporate Governance.
Code of Business Conduct and Ethics: The Company has in place a ‘Code of
Business Conduct & Ethics’ for Directors,
key management personnel and all its'
employees.
DIRECTORS’ STATEMENT ON INTERNAL CONTROLS
The following statement fulfils the
requirement to publish the Directors’
statement on Internal Controls as per the
Code of Corporate Governance issued
jointly by the ICASL and the SEC of Sri
Lanka.
The Board is responsible for maintaining
a sound system of internal controls to
safeguard shareholders’ investments and
company assets.
The Board has structured an Enterprise
Risk Management (ERM) process to identify
the principal risks impacting the business
and mitigating actions by management.
The Company’s management implements
policies on risk and control set by the
Board and are accountable to the Board
for monitoring and providing assurance as
to their effectiveness. The Company has
commissioned PricewaterhouseCoopers, as
independent internal auditors to ensure the
effectiveness of the internal control systems.
As a result of their activities, several
processes have been enhanced during the
year under review.
The Board has implemented the following
to obtain reasonable assurance that proper
systems of internal controls are in place;
Delegated certain responsibilities to
Board Sub Committees where the
members of these committees have
expertise to assist in discharging the
Board’s duties and to improve the
governance structure.
Instituted and maintained an effective
Board Audit and Compliance
Committee (BACC) and independent
Internal Auditor to review and report on
the internal control environment of the
Company
The minutes of the BACC meetings are
tabled at regular Board meetings. The
report of the BACC is provided on page
119 of the Annual Report.
The BACC reviews and approves the
internal audit plan for the year. The audit
plan is structured on a matrix based on
key risk areas and delivery dates which
is regularly monitored, and any delays
highlighted and rectified

129
UNION ASSURANCE PLC | ANNUAL REPORT 2017
CO
RP
OR
ATE
GO
VE
RN
AN
CE
During the year under review the audit
committee reviewed 40 audit reports
4 of which covered several Head
Office processes while 36 covered
different branch locations. The reports
covered key findings with management
comments and action taken to rectify
any control weaknesses. Control
weaknesses identified in previous
reviews were also tracked to ensure that
the management has taken necessary
action to eliminate or minimise any risks.
During the year under review the BACC
reviewed the findings of the end to end
process review of investment functions.
Most of the recommendation made
by the internal auditors have been
implemented during the year with a few
carried forward to be implemented in
2018.
On Information Technology (IT) controls,
the Board has initiated multiple
mechanisms;
IT system audits were carried out
to ensure the integrity of financial
information, data security and
adequate access controls are in
place with regard to processing
of data
In addition to the year - end system
review, the external auditors
performed a follow up on all critical
IT applications / systems reviewed
during the previous year.
The Company continued to implement
the bottom up enterprise risk
management (ERM) process. This is
an on going process for identifying,
evaluating and managing the risks
faced by the Company. This is done at
each department level in detail.
A summary of the key risks is updated
on a risk grid and reported to the BACC
on a quarterly basis. The quarterly
updates also include new risks,
mitigating actions and changes of risk
status of earlier identified risks. The
process continued to be effective during
the year under review.
Business continuity plan was tested
during the year under review.
The internal auditors conducted regular
reviews to ensure the effective design
and implementation of internal controls;
The effectiveness of the internal controls
are measured based on the repetition of
the control weaknesses or improvement
areas that have been highlighted in the
audit reports
Improvements in line with industry
and / or non - industry best
practices are also implemented on
an on going basis
BACC continued to monitor
the progress of the bottom up
compliance sign off process
which strengthened the control
environment and provide comfort to
senior management and Board that
staff at all functions are aware and
conducts business transactions as
per laid down rules and procedures.
The process was subjected to an
independent audit by the internal
auditors to ensure that the process is
working as intended.
Conclusion The Board having implemented the above
is aware that such systems are designed
to manage rather than eliminate the risk
of failure to achieve business objectives
and can only provide reasonable and
not absolute assurance against material
misstatements of loss.
The Board confirms that the financial
reporting system has been designed to
provide reasonable assurance regarding
the reliability of financial reporting and
financial statements have been prepared
in accordance with applicable accounting
standards, requirements of the Company’s
Act No.7 of 2007, Regulation of Insurance
Industry Act No. 43 of 2000 and subsequent
amendments and the listing rules of the
Colombo Stock Exchange.
Susantha Ratnayake
Chairman
A S De Zoysa
Director
H A J De Silva Wijeyeratne
Chairman
Board Audit and Compliance Committee
29 March 2018

UNION ASSURANCE PLC | ANNUAL REPORT 2017
130
CORPORATE GOVERNANCE
6. Relations With Shareholders Objective: To enhance long-term
shareholder value through regular
communication with both individual and
institutional shareholders.
Annual General Meeting (AGM) and
Conduct of General Meetings: The
Board uses the AGM to communicate
with shareholders and encourages their
participation. Each substantially separate
issue is proposed as a separate resolution
at the AGM including the proposal for the
adoption of the Annual Report and accounts.
The Chairman ensures that the Chairmen of
the Board Audit and Compliance Committee
and Remuneration Committee, Directors,
senior management and representatives of
the external auditors are available to answer
questions at the AGM, if required. The notice
of meeting and related documents are
circulated to the shareholders 15 working
days prior to the AGM.
Extraordinary General Meetings (EGM):
When regulation requires, the Company
calls for Extraordinary General Meetings to
engage with shareholders.
Communication with Shareholders: All
institutional and other investors are
encouraged to participate and cast
their votes at the Company’s AGM. The
Company uses the AGM as the forum
to have structured, objective dialogue
with shareholders. Sufficient information
is included in the interim and annual
reports for shareholders to make informed
decisions. From time to time, the Company
communicates other information to
shareholders by way of announcements and
/ or circulars, in compliance with regulatory
requirements or otherwise.
Major and Material Transactions:
Disclosures have been made where
required to shareholders on major
transactions which materially alter the
Company’s net asset base.
Further details and the policy on
shareholder communication is provided in
the Engagement with Stakeholders section
of the Annual Report on page 30.
7. The CEO and Executive Committee (ExCo) Composition
Committee members as at 31 December
2017 comprises of D Pereira – Director /
Chief Executive Officer as Chairman and the
Executive Committee as provided on page
108 of this report.
Role and Structure Led by Dirk Pereira, the ExCo drives the
Company strategy and operationalises the
Company policies. The ExCo forms the
senior management of the Company and is
responsible for the day to day operational
management of the business.
The ExCo met 10 times during the year
under the chairmanship of the Chief
Executive Officer. General agenda and
topics covered by the Committee during the
year included;
Performance update by the Chief
Executive
Long term business plan and status of
its progress
Short briefings by individual General
Managers on the state of the respective
business areas, update on key initiatives
and industry developments
Substantial business developments,
projects, risks and opportunities
Talent and related matters
Presentations from various functional heads
Competitor analysis and strategy
This year, the committee, together with the
Chief Executive, conducted a five year
strategy review with high level strategic
direction from the Chairman and inputs from
industry experts. As a result, a five year
strategy themed 'Mission One' was formulated
and launched in December 2017. 2018
objectives of 'Mission One' is discussed under
each capital in the Management Discussion
and Analysis session of this report.
Chief Executive Officer / Director
Executive Committee
GM - Marketing & Distribution
Agency
Bancassurance
Marketing &
branding
Group life
GM - Human Resources
Human
Resources
Management
Learning and
Development
Sales force
administration
GM - Life Operations
Underwriting
Life
Operations
Reinsurance
Claims
Customer call
centre
GM - Finance & Planning
Financial Reporting
Budgeting, planning and
data analytics
Finance operations
Audit and compliance
Logistics
Investments
GM - Information Technology
Operations and
systems support
IT infrastructure
Application
development and
support
Governance and
compliance
GM - Actuarial
Pricing
Valuations
Actuarial control
Reporting and
projections
CEO and the Executive Committee span of control

131
UNION ASSURANCE PLC | ANNUAL REPORT 2017
CO
RP
OR
ATE
GO
VE
RN
AN
CE
(B) Integrity of Operations
Audit and Assurance
1. Three Levels of Assurance
The Company has a three - level assurance
structure to ensure integrity of its operations.
Process control at corporate
management level
Internal assurance - internal auditors
External assurance - external auditors
1.1 Process Control at Corporate Management Level
The corporate management with the
guidance of the BACC periodically reviews
the adequacy of processes and procedures
in place to ensure the highest level of
internal controls within the organisation.
During the year, the internal assurance
process was reviewed and further
strengthened.
The following are the main areas of process
control adopted at corporate management
level by the Company;
Decision making process
Compliance assurance
Employee participation in assurance
Resource management
IT governance
Fraud and risk assessment
Decision Making Process
The deliberations and decision making
of the ExCo broadly takes the following
process:
Identify The Problem and Objectives
Monitor and Re - assess
Make Decision
Implement Decision
Establish Decision Making
Criteria
Identify Options
Assess Risk
Appraise Options
Impact on people,
community, environment,
etc. are considered at
this stage
Board Audit and Compliance Committee / Group Audit Committee
Operational Compliance Statement
Financial Compliance Statement
Bottom up Compliance sign off process
Branch operational
compliance
checklist
Branch underwriting,
claims and operational
procedure manuals
Head office
procedure manual
Head Office
underwriting,
claims, operational
procedure manuals
Branch financial
procedure
Statutory
submission
sign off
Head office
financial
compliance
check list
sign off
Regulatory
compliance
check list
sign off
Branch
financial
compliance
check list
sign off
Bottom
up
sig
n o
ff
Compliance Assurance To conduct business in accordance with
prevalent laws and regulations in the
country, UA has established a monitoring
process to assess compliance with
laws, regulations, regulatory guidelines,
internal controls and approved policies
on all areas of business operations. This
mechanism is adopted to monitor reporting
and compliance with all mandatory
reporting requirements with the intention
of establishing a fully compliant corporate
governance and risk mitigating culture.

UNION ASSURANCE PLC | ANNUAL REPORT 2017
132
CORPORATE GOVERNANCE
Bottom up Compliance Sign Off Process
Compliance assurance is derived through
a bottom up sign off process, and sign
off checklists are based on the internal
policies and procedure manuals. The
Company obtains assurance on financial
controls, regulations compliance as well
as operational compliance aspects. The
diagram in the previous page summarises
the process adopted by the Company;
The financial compliance statement as well
as the operational compliance statement
are signed off and submitted to the BACC
on a quarterly basis. These are reported
to the JKH Group Audit and Compliance
Committee on a quarterly basis as well.
The regulatory sign off is maintained on a
monthly basis.
Employee Participation in Assurance
The Company is continuously working
towards introducing innovative and
effective ways of employee awareness. The
importance of communication - top down,
bottom - up and lateral in gaining employee
commitment to organisational goals has
been conveyed extensively through various
communications issued by the CEO and
the Management. Whilst employees have
many opportunities to interact with senior
management, the Company has created
formal channels for such communication
through feedback as listed below.
Skip Level meetings
Exit interviews
360 degree evaluation
Employee surveys
Monthly staff meetings
Focus group discussions
Coffee with CEO
Continuously reiterating the
'Open Door' policy
Ladies forum
Additionally, the Company continued with
its whistle - blower policy and securities
trading policy. The Company has witnessed
an increased level of communication flow
from employees. Such communication and
feedback received from the employees by
the management are recorded, irrespective
of the level of anonymity, and subsequently
discussed and followed up. The respective
outcomes are duly recorded.
Resource Management
The Board has delegated certain of its
financial authority to the CEO and General
Managers within a comprehensively
documented Manual of Financial Authority
(MOFA).
The MOFA indicates the responsibilities of
all staff members who enter into financial
transactions and commitments on behalf
of the Company, including persons
responsible for recommendation, approval
and payment. All General Managers
including the CEO are required to provide a
sign off on compliance with the MOFA on a
quarterly basis.
In addition, the following committees comprising of senior management personnel have been set up to manage expenses in an efficient,
transparent and in an effective manner.
Resource Management Committee
Objectives and Functions Composition
Capital Expenditure
Committee
Review and rationalise capital expenditure
(excluding IT related expenses)
CEO (Chair)
GM - Finance and Planning
GM - HR
GM - Life Operations
GM of the division for which the item is
required (without voting rights)
IT Steering Committee
Review and rationalise IT related capital and revenue
expenditure in order to:
Improve overall productivity, efficiency and effectiveness
across distribution and service functions
Improve quality of management information
Provide secured and uninterrupted IT facilities
Ensure IT resource readiness for future advancements,
while optimising the usage of existing IT resources
CEO (Chair)
GM - Information Technology
GM - Finance and Planning
GM - Life Operations

133
UNION ASSURANCE PLC | ANNUAL REPORT 2017
CO
RP
OR
ATE
GO
VE
RN
AN
CE
Resource Management Committee
Objectives and Functions Composition
Supplies Committee
Transparent supplier registration
Optimise purchases and ensure quality, reliability and
value for money
GM - Finance and Planning ( Chair)
GM - Marketing and Distribution
GM - HR
AGM - Logistics
Staff Committee
Review cadre increases in line with expected volume growth
and required service standards. Recommend promotions
based on annual performance appraisal process and review
any organisational requirements outside this cycle
GM - HR (Chair)
All other GMs
IT Governance
IT Governance plays a critical role in assuring integrity, confidentiality and continuity of information management within the Company.
The core areas of IT governance at UA are as follows;
Alignment with Business
Value Delivery
Compliance
Continuous review ensures that IT objectives are aligned with business objectives by defining them in
business terms. To this end the IT policies, standards, procedures are aligned as and when needed
when new technologies are utilised.
Necessary emphasis is placed on monitoring strategic implementations, project completion, resource usage,
results of disaster recovery / business continuity plan tests and service delivery. It includes people, processes
and technologies for improving the efficiency and effectiveness of business solutions. Further tracking
mechanisms for security related events and use of security dashboards are also included.
Focus on IT risk is based on severity of impact and probability of occurrence. Risk management
encompasses processes designed to understand risks and implement controls to effectively
manage them as well as techniques for minimising risk exposure and embedding risk management
responsibilities into the organisation.
Ensure optimal investment in support of corporate objectives, with the availability of proper controls including
well defined policies and Key Result Areas (KRAs) for the management of critical resources and people.
Involvement of all corporate stakeholders in the decision making process is ensured with seamless
integration to assurance activities. This is done by enabling the processes to operate as intended from
end - to - end, while minimising hidden risks.
Regulatory and compliance requirements are embedded through implementation of appropriate IT
controls in systems and conducting periodic reviews of the same to ensure effectiveness.
IT Risk Management
Resource and Performance Measurement
Integration

UNION ASSURANCE PLC | ANNUAL REPORT 2017
134
CORPORATE GOVERNANCE
IT Controls Over Financial Reporting
The reliability of financial reporting is heavily dependent on a well - controlled IT environment.
Therefore, the following IT controls over financial reporting are in place to ensure the quality
of information used for financial reporting.
System software
controls over
the effective
acquisition,
implementation
and maintenance
of system software,
security software
and utility software.
Data centre
operation controls
such as job setup
and scheduling,
operator actions
and data backup
and recovery
procedures.
‘System
Development Life
Cycle’ document
defines processes
that should
be followed in
application system
development.
‘Software Change
Management’
document defines
change processes.
Access security
controls
that prevent
inappropriate and
unauthorised use
of the system.
System Software
Data Centre
Systems Development
Access Control
1.2 Assurance by the Internal Auditors
The internal audit function of the
Company has been outsourced to
PricewaterhouseCoopers. There are clear
processes for monitoring and following up
on corrective actions on control weaknesses
or failures reported. These audit findings
together with the management comments
are reviewed by the BACC and the Board.
These are also reported to the Group
Finance Director and reviewed by the Group
Audit Committee.
During the year, 40 reports covering several
Head Office processes and 36 branch
locations were issues by the internal auditors.
Internal audit
assurance and control
Group Audit Committee
Board Audit and Compliance Committee
Outso
urce
d in
tern
al a
udit
func
tion Outsourced internal audit function
Internal audit plan focussing on underwriting
Internal audit pla
n co
verin
g he
ad o
ffice
a
nd branches
controls and claims processing
CE
O a
nd Executive Comm
ittee
Internal Assurance Framework
Fraud Risk Assessment
The Company has set up a committee to manage customer
complaints channelled through the Customer Feedback
System (CFS). These include premium misappropriation
complaints, wrong selling, etc. A well - structured process
has been set up to handle these as well as detect risks
related to fraud in customer premiums. A summary of all
complaints and the resolution status of each is reported to
the BACC each quarter.
The susceptibility of business processes to
misappropriation and fraud is reviewed as part of the
internal audit program. The external auditors also perform
an evaluation of the Company’s processes to assess the
possibility of manipulation, falsification and alteration
of accounting records. The Company adopts a zero -
tolerance policy in cases of fraud and misappropriation.
The Company adopts a zero - tolerance policy in cases of fraud and misappropriation.

135
UNION ASSURANCE PLC | ANNUAL REPORT 2017
CO
RP
OR
ATE
GO
VE
RN
AN
CE
Assurance by the External Auditors
KPMG, the Company’s external auditors
performs an interim audit in addition to the
audit at year end to obtain assurance that
the internal controls and processes that are
in place in preparation and presentation of
the financial statement are effective. This
audit covers IT security and data assurance
as well. UA, the Board of Directors and
Management do not have any relationship
with KPMG, apart from latter’s engagement
as the Independent External Auditor of the
Company.
2. Other Internal Governance Practices
Governance of Ethics
The Board while assuming ultimate
responsibility for the Company’s ethical
performance, delegates this function to the
management, which utilises the following
mechanisms to fulfil this mandate:
HR policy
Code of business conduct and ethics
Employee induction programme and
employee induction handbook
Performance evaluation programme
Supplier code of conduct
Regulatory and Accounting Benchmarks
The Board of Directors also took all
reasonable steps in ensuring that all financial
statements were prepared in accordance with
the Sri Lanka Accounting Standards (SLFRSs
/ LKASs) issued by the ICASL and the
requirements of the CSE and other applicable
authorities. Information contained in the
financial statements of this Annual Report is
supplemented by a detailed Management
Discussion and Analysis which explains
to shareholders, the strategic, operational,
investment, sustainability and risk related
aspects of the Company, and the means by
which value is created and how it is translated
into the reported financial performance and is
likely to influence future results.
Code of Conduct for Field Staff
UA has also implemented a Code of
Conduct for the field staff covering their
responsibility, commitment and level of
service to clients. The formal code is read
as a pledge at all formal meetings of the
sales force during the year.
Re - Enforcement of the Company’s Code of Conduct
The Company continued to keep the code
of conduct live by ensuring the formal online
sign-off from each staff member annually to
ensure that the message was received and
staff committed.
Other Policies Within the Company
In addition to our charters and codes of
conduct, we have implemented policies
covering the following areas;
Recruitment and selection
Financial integrity
Financial authority levels
Outside employment
Confidentiality of information
Use of Company property including use
of computers
Harassment and non - discrimination in
the workplace
Environmental, health and safety at work
Fraud
Media
IT security
Prevention of money laundering and
terrorist financing
(C) Sustainable Business Model
Enterprise Risk Management
Stemming from the stewardship
commitment towards our stakeholders and
to ensure the sustainability of our business
operations, it is a prerequisite that the
Company has an effective risk management
model across the organisation and a tested
business continuity plan.
1. Risk Management
The Company has implemented a
comprehensive risk management program
to identify risks which may impede the
achievement of business objectives and
develop appropriate mitigation strategies.
The risk management process has been
revamped from a top down approach
to a bottom up approach. The heads of
departments conduct risk management
workshops with their relevant teams to
identify the key strategic / operational risks
which affect their functions and list out
mitigating action plans, responsibilities and
target dates.
Code of Business
Conduct and Ethics
Avoidance of Conflict of Interests
Maintenance of Confidentiality
Fair DealingsProtection of
Company Assets
Compliance with Laws and Regulations
Proactive Promotion of Ethical Behaviour
Code of Business Conduct and Ethics

UNION ASSURANCE PLC | ANNUAL REPORT 2017
136
CORPORATE GOVERNANCE
The risk grids prepared by the departments
are summarised at a corporate level and
reviewed by the senior management
and the BACC. The review is done and
presented to the BACC on a quarterly basis.
A detailed report on risk management is
provided on pages 156 to 165.
2. Business Continuity Planning
The Business Continuity Plan (BCP) is an
essential part of our organisation’s response
planning. It sets out how the business will
operate following an incident and how it
expects to return to ‘business as usual’ in
the quickest possible time. We have an
effective BCP developed with the support of
an external consultancy firm to ensure that
our Company is well prepared to respond
to any unforeseen disaster situation,
minimising any potential economic, social
and environmental impact.
During the year the following were carried
out in our BCP testing process;
An integrated recovery test was
conducted to recover both business
and technology processes at alternate
sites. The test was simulated on a
real - time scenario by carrying out a
simulated interruption to production at a
primary site.
Thirteen core business processes and
five support processes were covered in
the BCP test that was conducted.
(D) Engagement With Stakeholders
Structure of Charters
The Board is responsible to ensure that the
Company has a well structured policy and
procedures in place to engage with various
stakeholders. To address apparent conflicts
between various stakeholder groups, the
Company has developed several Charters.
The key expectations of our stakeholders
and the progress during 2017 are provided
in the Stakeholder Relationships and
Materiality sections on pages 30 to 35.
External Governance Structure
(E) Compliance With Regulatory Requirements
Regulatory Framework
The internal assurance process is designed
by the Board to provide assurance that
the Company has checks and controls to
ensure that it complies with all the regulatory
requirements that govern the Company.
Principal Officer (PO) / Chief Financial Officer (CFO) Sign Off Required by the Insurance Regulatory Commission of Sri Lanka (IRCSL)
In accordance with the determinations
issued by the IRCSL, the Company provides
Compliance Certificate (A) and (B) to IRCSL
on a quarterly basis signed off by the Chief
Executive Officer (who is the Company’s
PO) and the CFO on behalf of the Board of
Directors of the Company.
Compliance Certificate A: Certifies that the Company has;
Complied with all provisions in the
regulation of Insurance Industry (RII)
Act No.43 of 2000, rules, regulations,
determinations, directions issues by
IRCSL; Complied with all orders made
by the Ministry of Finance and Planning
under the RII Act, No. 43 of 2000,
Complied with terms and conditions
pertaining to reinsurance placements
issued by IRCSL in terms of section
31(1) of the RII Act, No. 43 of 2000,
Complied with conditions pertaining to
co - insurance issued by IRCSL and
Complied with all applicable circulars
issued by IRCSL.
Compliance Certificate B: Certifies that the Company has;
Complied with all provisions in the
Financial Transactions Reporting Act,
No. 6 of 2006,
Complied with rules on Know Your
Customer (KYC) and Customer Due
Diligence (CDD) for the Insurance
Industry issued by the Financial
Intelligence Unit established under the
Financial Transactions Reporting Act,
No. 6 of 2006,
Complied with guidelines on Anti Money
Laundering Program for Insurers issued
by IRCSL.
Compliance With Regulations Governing Investments
The life fund is fully backed by 'approved
investments' as per Section 25 (1) of the RII
Act and subsequent determinations.
Ability to Meet Policyholder Obligations
An insurance company’s ability to meet its
obligations to policyholders is measured by
Capital Adequacy Ratio (CAR). CAR reflects
UA’s total available capital as against Risk
Capital required at a particular date.
The CAR as of 31 December 2017 is 352%.
The minimum regulatory requirement
is 120%.
Actuarial Valuation of Insurance Liabilities
Life Insurance liabilities have been validated
by an independent external actuary in
accordance with the RII Act. The Actuary’s
report is available on page 175.
Reinsurance Arrangements
The IRCSL has stipulated that insurance
companies must enter into reinsurance
arrangements with companies which at a
minimum having a rating of BBB. As per
details on page 75, 100% of our reinsurance
placements are with reinsurance companies
that have been assigned at the minimum, an
'A+' rating by an international rating agency
Capital Structure
As at 31 December 2017 the Company’s
stated capital of Rs. 1,000 million, exceeds
the minimum share capital requirement set
by the IRCSL for a life insurance company
of Rs. 500 million.

137
UNION ASSURANCE PLC | ANNUAL REPORT 2017
CO
RP
OR
ATE
GO
VE
RN
AN
CE
Compliance with
content of the
Annual Report
required by
section 168 of the
companies Act
No. 7 of 2007
Compliance Framework and Self - Regulation
The Board recognises its responsibility of
ensuring that business is conducted in
accordance with relevant laws, rules and
regulations
Statutory Submission Sign Off
A statutory submission checklist is
signed off on a monthly basis by persons
responsible for ensuring compliance with
such requirements. Changes to regulations
are updated in the checklist on a regular
basis with relevant evidence of compliance.
This is a proactive measure to ensure that
no violations take place. Any deviations
detected are reported to the BACC with the
quarterly compliance sign - off.
Regulatory Compliance Sign Off
A regulatory compliance checklist is signed
off on a quarterly basis by the respective
head of department ensuring compliance
with the applicable laws and regulations
governing the Insurance business.
Changes to regulations are updated in the
checklist as and when changes occur. This
is a proactive measure to ensure that no
violations take place. Any deviations are
reported to the BACC with the quarterly
submission of the summary of the sign-off.
The Company is in compliance with the
statutory and regulatory requirements as
summarised below;
Codes of Best Practice on Corporate Governance and Compliance by the Company
The extent of Company’s adherence with
the Code of Best Practices on Corporate
Governance (the Code) issued jointly by the
Institute of Chartered Accountants of Sri Lanka
(ICASL) and the Securities and Exchange
Commission of Sri Lanka (SEC) is given in the
pages that follow.
Compliance Requirement 2017
No of Submissions
Inland Revenue 61
IRCSL Directives and RII Act 38
National Insurance Trust Fund 4
Employees' Provident Fund 12
Employees' Trust Fund 12
Colombo Stock Exchange 7
SLAAS Monitoring Board 1
Central Bank of Sri Lanka 12
Municipal Council 4
Total Compliance 2017 151
Total Non Compliance 2017 Nil
Code of Best
Practice on
Corporate
Governance issued
jointly by the ICASL
and the SEC of
Sri Lanka.
Compliance with Content of the
Annual Report as per Section 7.6
of the Listing Rules of the CSE and
Code of Best Practice on Corporate
Governance as per Section 7.10
The Code covers the following seven
fundamental principles.
Section 1: The Company
A. Directors
B. Directors’ Remuneration
C. Relations with Shareholders
D. Accountability and Audit
Section 2: Shareholders
E. Institutional Investors
F. Other Investors
G. Sustainability Reporting
Codes of Best practice on Corporate Governance

UNION ASSURANCE PLC | ANNUAL REPORT 2017
138
CORPORATE GOVERNANCE
1. Codes of Best Practice on Corporate Governance issued jointly by the ICASL and the SEC of Sri Lanka and Compliance by the Company
Reference Corporate Governance Rule Status UA Compliance and Implementation
Section 1 – The Company
A. Directors
A.1 Effective Board To Direct And Control The Company
A.1.1 Need for the Board to meet regularly Complied During 2017 the Board met 6 times.
For more details of Board meetings, please refer page 118.
A.1.2 Responsibilities of the Board Complied For details of responsibilities and duties of the Board, please refer
page 114.
Ensure formulation and
implementation of a sound business
strategy
Complied The 5 year strategy and business plan 2018 - 2022 was debated,
reviewed and approved in October 2017.
Please refer pages 24 to 26 for a summary of the Company strategy.
Ensure CEO and the management
team possess the necessary skills,
experience and knowledge for
effective implementation of the
strategy.
Complied Adequacy of the skills of the management team to meet changing needs
of the business is continuously monitored by the Board through the
performance evaluation process
For details of profiles of CEO and Executive Committee, please refer
pages 107 and 108.
Adopt effective CEO and senior
management succession strategy
Complied The Company’s structured succession planning process is part of the
annual performance appraisal cycle and uses a grid for critical positions
which marks the readiness of the second in command to take over within
1 year, 2 years and >3 years. Training plans for skills gap are designed
based on this grid.
Identified skills gap were addressed by providing the required people
management, technical and / or soft skills training and development.
The succession plan was updated twice during the year.
Five manager and above positions were filled internally during the year.
Ensure effective systems to secure
integrity of information, internal
controls, business continuity and
risk management
Complied The Board has delegated this responsibility to the Board Audit and
Compliance Committee (BACC).
Each year the BACC reviews the adequacy of the systems to secure
integrity of information, internal controls and risk management.
Activities performed by the BACC during the year are disclosed in their
report on pages 119 to 121.
Compliance with laws, regulations
and ethical standards
Complied Details of compliance with applicable laws and regulations in 2017 are
provided on page 110.
More details of processes in place to ensure compliance are provided in
pages 138 to 155.
Details of the Code of Conduct are provided on page 135.

139
UNION ASSURANCE PLC | ANNUAL REPORT 2017
CO
RP
OR
ATE
GO
VE
RN
AN
CE
Reference Corporate Governance Rule Status UA Compliance and Implementation
Ensure that all stakeholder interests
are considered in corporate
decisions
Complied All charters and policies of the Company have been developed to ensure
that responsibilities to shareholders and other stakeholders are timely and
appropriately discharged. Particular emphasis is given by the Board to the
framework of these charters and policies in the decision - making process.
The Company aligned itself with the GRI Standards and the process
helped in streamlining this further.
Recognise sustainable business
development in corporate strategy,
decisions and activities
Complied The Board recognises the importance of sustainable business
development in the corporate strategy, decisions and activities of the
Company. The Board has debated and reviewed the 5 year business plan
in terms of economic viability, environmental responsibility and social
accountability.
Ensure that the Company’s values
and standards are set with emphasis
on adopting appropriate accounting
policies and fostering compliance
with financial regulations
Complied The Company continues to keep up to date with all developments in
relation to changes in accounting standards and have reviewed the
accounting policies in place during the year under review.
For more details on Financial Reporting, Regulatory and accounting
benchmarks, please refer page 135.
Fulfilling other Board functions as
are vital, given the scale, nature and
complexity of the organisation.
Complied During the year under review every endeavour was made by the
Board to fulfil its obligations towards all stakeholders and the same
is reflected in the performance of the Company, shareholder returns,
governance processes and an entrepreneurial performance focused work
environment prevailing in the Company.
The CEO and where required the members of the management
team consulted Board members individually as well as at Board
Sub Committee levels for various requirements.
A.1.3 Act in accordance with laws of the
country relevant to the organisation
and procedure for Directors to obtain
independent professional advice at
the company’s’ expense
Complied During the year, professional advice was sought on various matters
including the following
Actuarial valuation of the life liabilities and retirement benefit
obligations
Legal, tax and accounting aspects
Economic and Investment advice
5 year business plan
Procedures to obtain independent professional advice is detailed in
page 116.
A.1.4 Need for the Directors to have
access to the advice and services
of the Company Secretary and
the need for the removal of the
Company Secretary to be a matter
for the Board as a whole
Complied All Directors have the opportunity to obtain advice and services of the
Company Secretaries, Keells Consultants (Private) Limited which is
responsible for ensuring follow up of Board procedures, compliance
with relevant rules and regulations, directions and statutes, keeping and
maintaining Minutes and relevant records of the Company.
A.1.5 Need for the Directors to bring
independent judgment to bear on
issues of strategy, performance,
resources and standards of business
conduct
Complied Composition of the Board and Compliance of Independence of
Non - Executive Directors are given in page 116.
None of the Non - Executive Directors have held Executive roles during
the year

UNION ASSURANCE PLC | ANNUAL REPORT 2017
140
CORPORATE GOVERNANCE
Reference Corporate Governance Rule Status UA Compliance and Implementation
A.1.6 Obligation of the Directors to
dedicate adequate time and effort
to matters of the Board and the
Company
Complied All meetings are scheduled in advance and relevant papers circulated
prior to the meeting to ensure sufficient time to review them and call for
additional information or clarifications, if required.
Details of the Board meetings and attendance of Directors are given in
page 118.
A.1.7 Need for every Director to receive
appropriate training when first
appointed to the Board and
subsequently as necessary
Complied For detail of Board induction and training, please refer page 116.
The Directors are constantly updated on the latest trends and issues
facing the Company and the local and global insurance industry in
general.
During the year, the Board obtained advice from external foreign
consultants on 5 year business plan and execution, new product
development, actuarial practices, bancassurance channel strategy,
implementation of data analytics and digital initiatives.
A.2 Division of Responsibilities Between Chairman and CEO
A.2.1 Justification and disclosure of the
decision to combine the posts of
Chairman and CEO in one person
Complied The posts of Chairman and the CEO are held separately by Mr. Susantha
Ratnayake and Mr. Dirk Pereira respectively thereby, ensuring the balance
of power and authority. Mr. Ajit D Gunawardene was the Chairman until 31
December 2017.
A.3 Chairman’s Role
A.3.1 Responsibility of the Chairman to
conduct Board proceedings in a
proper manner
Complied Role of Chairman, please refer page 114.
A.4 Financial Acumen
A.4 Availability of financial acumen and
knowledge to offer guidance on
matters of finance.
Complied The following Directors provide the Board with the necessary degree of
financial acumen and knowledge:
Mr. H. A. J. De Silva Wijeyeratne
Mr. S. Rajendra
Mr. A. D. Pereira
In addition, all members of the Board have extensive experience in
various aspects of financial management.
Their profiles are provided on pages 106 and 107 of this report.
A.5 Board Balance
A.5.1 Need to have at least two Non -
Executive Directors or such number
of Non - Executive Directors
equivalent to one third of total
number of Directors, whichever is
higher
Complied Refer page 113 for the composition of the Board and pages 106 and 107
for their profiles.
A.5.2 Need for two or one third of Non -
Executive Directors appointed to the
Board, whichever is higher, to be
‘independent’
Complied Mr. H. A. J. De Silva Wijeyeratne, Mr. A. S. De Zoysa and
Mr. G. F. C. De Saram continued to be Independent Non - Executive
Directors during 2017.

141
UNION ASSURANCE PLC | ANNUAL REPORT 2017
CO
RP
OR
ATE
GO
VE
RN
AN
CE
Reference Corporate Governance Rule Status UA Compliance and Implementation
A.5.3 Need for Independent Directors to be
independent of management and free
of any business or other relationship
Complied Managing Conflicts of Interests and summary of the Non - Executive /
Independent Directors’ interests is given on pages 115 and 116 of
this report.
A.5.4 Need for Non-Executive Directors
to submit an annual declaration
of his / her independence or non
independence
Complied Annual self declaration of independence or non - independence have
been submitted by each Non Executive Director for 2017.
A.5.5 Determination of the independence
and Non-Independence of each
Non-Executive Directors annually
Complied The Board has reviewed the declarations submitted by the Non -
Executive Directors, and determined their independence. The following
Directors qualify to be Independent Directors:
Mr. A. S. De Zoysa
Mr. G. F. C. De Saram
Mr. H. A. J. De Silva Wijeyeratne
A.5.6 Need for alternate directors
appointed by an Independent
Director to meet the criteria of
independence
Complied No alternate Directors were appointed during the year 2017.
A.5.7 Need to appoint a “Senior
Independent Director” if the
Chairman and CEO is the same
person
Complied The requirement to appoint a 'Senior Independent Director' does not arise
under the Code in view of the roles of the Chairman and the CEO being
held by two different individuals. Hence, no 'Senior Independent Director'
was appointed during the year 2017.
A.5.8 The Senior independent Director
should make himself available for
confidential discussion with other
Directors who may have concerns
Complied Not Applicable
A.5.9 Responsibility of the Chairman to
hold meetings exclusively with the
Non-executive Directors at least
once each year
Complied When deemed necessary, Chairman holds meetings without the
Executive Director / CEO being present.
A.5.10 Recording of concerns of Directors
in Board minutes where they cannot
be unanimously resolved.
Complied The Board minutes are prepared in order to record any concerns of
the Board as a whole or those of individual Directors regarding matters
placed for their approval / guidance / action. These minutes are circulated
and formally approved at the subsequent Board meeting. Additionally,
Directors have access to the past Board papers and minutes in case of
need at all times.
A.6 Supply of Information
A.6.1 Management should provide timely
information to the Board and the
Chairman should ensure all Directors
are properly briefed on issues
arising at Board meetings.
Complied Timely supply of information, please refer pages 116 and 117.
A.6.2 Need to provide the minutes,
agenda and papers required for a
Board Meeting at least seven (7)
days before the meeting
Complied Timely supply of information, please refer pages 116 and 117.

UNION ASSURANCE PLC | ANNUAL REPORT 2017
142
CORPORATE GOVERNANCE
Reference Corporate Governance Rule Status UA Compliance and Implementation
A.7 Appointments to the Board
A.7.1 Need to have a Nomination
Committee to make
recommendations to the Board on all
new Board appointments
Complied Details and composition of the Nominations Committee are provided on
page 121 in the Nominations Committee Report.
The Nominations Committee (NC) of John Keells Holdings PLC
(the Parent company) represents the NC of the Company.
During the year, recommendation was made to appoint Mr. S. C.
Ratnayake to the Board of Union Assurance PLC as Non - Executive
Director and the Chairman with effect from 1 January 2018.
A.7.2 Need for the Nominations Committee
or the Board to annually assess
Board composition
Complied During the annual self - evaluation process, the Board as a whole
assesses its own composition to ascertain whether the experience and
the exposure of the Board members are adequate to meet the strategic
demands faced by the Company and findings of these assessments are
taken in to consideration in the appointment of new Directors.
The current set of Directors together, deemed to possess the required
knowledge and experience to match the strategic opportunities and
threats facing the Company in the foreseeable future.
A.7.3 Disclosure of information to
shareholders upon appointment of
new Directors
Complied There were no new appointments during the year 2017.
A.8 Re-Election
A.8.1 Need for the Non - Executive
Directors to be appointed subject
to re-election and the provisions in
the Companies Act relating to their
removal
Complied Re - election, please refer page 116.
Mr. A D Pereira and Mrs. D C Alagaratnam were re-elected to the Board
at the last Annual General Meeting.
Mr. H A J De Silva Wijeyeratne and Mr. Suresh Rajendra retire in terms of
article 84 of the Articles of Association of the Company and are eligible
for re - election at the next AGM.
Mr. S C Ratnayake retire in terms of article 90 of the Articles of Association
of the Company and is eligible for re - election at the next AGM.
A.8.2 Need for all Directors including
the Chairman to be subject to
election by shareholders at the first
opportunity after their appointment
Complied All Directors, including the Chairman, are subject to election by
shareholders at the first opportunity after their appointment and to
re - election as stated above.
As per the Articles of Association the Chairman is not subject to
retirement by rotation.
With the resignation of Mr. Ajit D Gunewardene w.e.f. 31 December 2017,
Mr. S C Ratnayake was appointed as a Non - Executive Director and
the Chairman w.e.f 1 January 2018. Mr. S C Ratnayake retire in terms of
Article 90 of the Articles of Association of the Company and is eligible for
re - election at the next AGM.

143
UNION ASSURANCE PLC | ANNUAL REPORT 2017
CO
RP
OR
ATE
GO
VE
RN
AN
CE
Reference Corporate Governance Rule Status UA Compliance and Implementation
A.9 Appraisal of Board Performance
A.9.1 The Board should annually appraise
itself on its performance in the
discharge of its key responsibilities
Complied Board evaluations, please refer page 117.
A.9.2 Need for the Board to undertake
an annual self-evaluation of its
own performance and that of its
Committees.
A.9.3 Need for the Board to disclose in
the Annual Report how performance
evaluations have been conducted
A.10 Disclosure of Information in Respect of Directors
A.10.1 Annual Report to disclose specified
information regarding Directors
1. Name, qualification and a brief
profile
2. Nature of his / her expertise in
relevant function
3. Immediate family and / or
material business relationships
with other Directors of the
Company
4. Whether Executive, Non-
Executive and / or Independent
Director
5. Names of listed companies in
Sri Lanka in which the Director
concerned serves as a Director
6. Names of other companies or
companies in a Group in Sri
Lanka in which the Director
concerned serves as a Director
7. Board meetings attended
8. The total number of Board seats
held by each Director indicating
listed and unlisted Companies
and whether in an executive or
non-executive capacity
9. Board committees served as
Chairman / member
10. Committee meetings attended
Complied Information in relation to each Director required by the Code of Best
Practice on Corporate Governance is disclosed in the Annual Report
as follows;.
1. Pages 106 and 107
2. Pages 106 and 107
3. Note 43 to the Financial Statements
4. Pages 106 and 107
5. Pages 106 and 107
6. Pages 106 and 107
7. Page 118
8. Pages 106 and 107
9. Pages 106 and 107
10. Refer respective committee reports on pages 119 to 126.

UNION ASSURANCE PLC | ANNUAL REPORT 2017
144
CORPORATE GOVERNANCE
Reference Corporate Governance Rule Status UA Compliance and Implementation
A.11 Appraisal of the Chief Executive Officer (CEO)
A.11.1 Need for the Board to set financial
and non-financial targets to be met
by the CEO during the year in line
with the short, medium and long-
term objectives of the Company.
Complied Assessment of the performance of the CEO by the Board is an on going
process. The performance of the CEO is evaluated by the Board at the
mid and end of each financial year by comparing the performance of
the Company with the financial and non - financial targets set at the
beginning of the financial year.
Summarised objectives / action plans set by the Board for 2017:
Achievement of GWP, profitability and embedded value of the
Company
Maintaining a cost effective distribution model
Transform sales force via L&D intervention and revamp rewards and
recognition schemes
New / improved products to match needs of the market
Service related aspects including improvement of policy retention
Technology to increase efficiency, reliability and faster decision making
Brand rating improvement initiatives
Sustainability aspects and CSR initiatives
Audit and control environment aspects
A.11.2 Need for the Board to evaluate the
performance of the CEO at the end
of each fiscal year
Complied As per the annual performance appraisal cycle, CEO’s performance for
2017 will be reviewed in March 2018.
B. Directors’ Remuneration
B.1 Remuneration Procedure
B.1.1 Appointment of a Remuneration
Committee (RC)
Complied Refer RC Report on pages 122 and 123.
B.1.2 Need for the RC to consist
exclusively of Non-Executive
Directors
Complied Refer RC Report on pages 122 and 123.
B.1.3 Requirement to list the Chairman
and members of the RC in the
Annual Report
Complied Refer RC Report on pages 122 and 123.
B.1.4 The Board should determine the
remuneration of Non-Executive
Directors, including members of the RC
Complied No changes were made to the Remuneration of the Non - Executive
Directors in 2017.
Non - Executive Directors who are part of the JKH Group remit their fees
to John Keells Holdings PLC.
Other Non - Executive Directors are remunerated in line with market
practices.
B.1.5 Need for the RC to consult the
Chairman and / or CEO on proposals
relating to the remuneration of other
Executive Directors
Complied Remuneration of Executive Directors is determined by the Board RC.
During the year, as done each year, the Committee reviewed the
information provided by UA’s team of HR professionals to determine
market and industry trends with regard to remuneration and perquisites.

145
UNION ASSURANCE PLC | ANNUAL REPORT 2017
CO
RP
OR
ATE
GO
VE
RN
AN
CE
Reference Corporate Governance Rule Status UA Compliance and Implementation
B.2 The Level and Make Up of Remuneration
B.2.1 Need for the RC to provide
competitive packages needed to
attract, retain and motivate Executive
Directors of the quality required
Complied Board is aware that the remuneration of Executive and Non - Executive
Directors should reflect the market expectations and be sufficient enough
to attract and retain the quality of personnel needed to run the Company.
During the year, the Board approved payment to the Executive Director
of the Company, Mr. A. D. Pereira, remuneration as recommended by
the Board Remuneration Committee in keeping with the Company’s
remuneration policy comprising of a fixed element and a variable element
in the form of short term incentive which is based inter alia, on the
individual performance and the organisation performance.
B.2.2 Need for the RC to judge where
to position levels of remuneration
of the Company, relative to other
companies
Complied Refer RC report on pages 122 and 123 for the remuneration policy
principles and methodology used in setting remuneration structure.
No changes were made to the remuneration of the Non - Executive
Directors during the year.
B.2.3 Need for the RC to be sensitive
to remuneration and employment
conditions elsewhere in the
Company
Complied The RC reviews the annual increments provided to companies within the
John Keells Group, when deciding on increments for UA staff.
B.2.4 Performance - related elements of
remuneration of Executive Directors
should be designed to align their
interests with the Company and main
stakeholders.
Complied The performance related elements of remuneration applicable to the CEO
is based on achieving the objectives as outlined in A.11.1. It is believed
that these measures best align the interests of the Company and main
stakeholders.
The variable element of the CEO’s remuneration is linked to achievement
of the set objectives for the year.
B.2.5 Avoidance of offering executive
share options at a discount
Complied The senior management is entitled to participate in the employee share
options scheme (ESOP) of John Keells Holdings PLC.
Further details are provided in Note 36 of the financial statements.
B.2.6 Need for the RC to follow the
provisions set out in Schedule E of
the Code in designing schemes of
performance - related remuneration
Complied The CEO is eligible for annual bonuses based on the Company
achieving business profitability. As per the scheme, there is an upper
limit on the annual bonus.
In terms of long term incentive schemes, the senior management is
entitled to participate in the share options scheme (ESOP) of John
Keells Holdings PLC.
The consequences of pension and associated costs are considered
when determining salary increases.
Performance related remuneration schemes are not applied
retrospectively.
Annual bonuses are not pensionable.
Non - Executive Directors are not eligible for performance based
remuneration schemes.
UA continued to adopt the same schemes during the year under review.

UNION ASSURANCE PLC | ANNUAL REPORT 2017
146
CORPORATE GOVERNANCE
Reference Corporate Governance Rule Status UA Compliance and Implementation
B.2.7 &
B.2.8
Compensation commitments in the
event of early termination.
Complied There are no terminal compensation commitments other than gratuity in
the company’s contracts of service.
No changes were made to the policy during the year.
B.2.9 Need for the levels of remuneration
for Non-Executive Directors to
reflect the time commitment and
responsibilities of their role
Complied Non - Executive Directors are paid only a fee that reflects the time
commitment and responsibilities of their role
Non - Executive Directors are remunerated in line with market practices.
B.3 Disclosure of Remuneration
B.3.1 Requirement to disclose the
Remuneration Policy and details
of remuneration of the Board in the
Annual Report
Complied Refer page 128 for details on Directors’ remuneration.
Details of the RC are provided on pages 122 and 123.
The information in Note 21 to the financial statements provides the
remuneration paid to Executive and Non - Executive Directors.
The Board RC ensured that the CEOs / Executive Directors’
remuneration is set objectively.
C. Relations with Shareholders
C.1 Constructive Use of the Annual General Meeting (AGM) and Conduct of General Meetings
C.1.1 Need to count all proxy votes lodged Complied All proxy votes and the votes at the AGM were considered for all
resolutions passed at the 30th AGM held on 31 March 2017.
C.1.2 Need to propose separate
resolutions for each substantially
separate issue and adoption of
annual report and accounts
Complied The following separate resolutions were passed at the 30th AGM held on
31 March 2017
Receive and consider the Annual Report and financial statements of
the Company for the year ended 31 December 2016 with the report of
auditors.
Re - election of Mr. Dirk Pereira and Mrs. Dilani Alagaratnam to the
Board, who retired in terms of Article 84 of the Articles of Association
of the Company.
Re - appointment of the retiring auditors KPMG, Chartered
Accountants, and authorise Directors to determine their remuneration.
C.1.3 Need for necessary arrangement
by the Chairman of the Board that
all Chairmen of Sub-committees be
available at the AGM.
Complied The Chairmen of the Board sub committees were present at the AGM
held on 31 March 2017
C.1.4 Need for Circulation of Notice of
AGM and related documents to
shareholders
Complied Notice of the AGM and related documents were circulated to the
shareholders 15 working days prior to the AGM held in 2017
C.1.5 Need to circulate a summary of
procedures governing voting at
General Meetings with the Notice of
Meeting
Complied Please refer page 284 for the notice of meeting and pages 285 and 286
for the proxy form for the 31st AGM to be held on the 9 May 2018.

147
UNION ASSURANCE PLC | ANNUAL REPORT 2017
CO
RP
OR
ATE
GO
VE
RN
AN
CE
Reference Corporate Governance Rule Status UA Compliance and Implementation
C.2 Communication with Shareholder
C.2.1 Need to have a channel to reach all
shareholders to disseminate timely
information.
Complied UA used the following channels to disseminate timely information during
the year;
Shareholders meetings
Financial and other notices as and when required through the
Colombo Stock Exchange
Corporate website
Press notices
C.2.2 Need to disclose policy and
methodology for communication with
shareholders
Complied Please refer ‘Relations with Shareholders’ provided on page 130 for
details of the policy and methodology adopted for communication.
C.2.3 Need to disclose Implementation
of the communication policy and
methodology.
Complied Please refer ‘Relations with Shareholders’ provided on page 130
for details of how the policy and methodology adopted are being
implemented.
C.2.4 &
C.2.6
Need to identify and disclose
a Contact person in relation to
shareholder matters.
Complied The Company has appointed the Company Secretaries as the person to be
contacted on shareholder matters or in his / her absence, the Director / CEO.
The Company Secretaries can be contacted by phone on 011-2306245 or
by mail to Keells Consultants (Private) Limited, 117, Sir Chittampalam A.
Gardiner Mawatha, Colombo 02, Sri Lanka.
Shareholders can also contact;
Director / CEO, at Union Assurance PLC, Union Assurance Centre,
20, St. Michael’s Road, Colombo 3, Sri Lanka or on 011 - 2990701.
The Chairman of the Company on 011 - 2306111.
Investor relations Hotline on 011 - 2990314 or email to
UA also provides a host of investor information through its website
www.unionassurance.lk.
C.2.5 Need for a process to make
Directors aware of major issues and
concerns of shareholders
Complied A process has been adopted to ensure that all Directors are aware of
the major issues and concerns raised by shareholders. The process is
disclosed in C.2.7 below.
C.2.7 Need for a process responding to
shareholder matters
Complied The Board has formulated a process of responding to shareholder
matters and it is disclosed in the annual report each year.
Shareholder matters will be responded to through the same mode the
query was directed to the Company or through a mode agreed with
shareholder/s.
All queries made other than the queries raised directly with the Chairman,
will be brought to the notice of the Chairman by the CEO or the Company
Secretaries. Should any query need the attention of the Board of Directors,
the Chairman escalates such queries and seeks the assistance of the Board.
The Company recognises the importance of shareholders’ privacy and
does not disclose shareholders’ information without their consent unless
required by law.

UNION ASSURANCE PLC | ANNUAL REPORT 2017
148
CORPORATE GOVERNANCE
Reference Corporate Governance Rule Status UA Compliance and Implementation
C.3 Major and Material Transactions
C.3.1 Need to disclose Major transactions. Complied During the year, there were no major or material transactions engaged in
or committed to by the Company as prescribed by the Code that required
disclosure to the shareholders
D. Accountability and Audit
D.1 Financial Reporting
D.1.1 Responsibility of the Board for
statutory and regulatory reporting
Complied The following disclosures as required by the Code are included in this Report:
Financial reporting - page 128
Financial calendar - page 168
Regulatory reports were filed by the due dates. Summary of
compliances - page 137.
Price sensitive information was also disclosed to the Colombo Stock
Exchange on a timely basis.
A summary of the interim accounts - page 274
D.1.2 Requirement to include declarations
by Directors in the Directors’ Report
Complied The Annual Report of the Board of Directors on the Affairs of the
Company disclosed on pages 169 to 173 contains the declarations as
required by the Code.
D.1.3 Responsibilities of the Board for
the preparation and presentation of
Financial Statements and statement
by the Auditors about their reporting
responsibilities
Complied The statement of Directors’ responsibility for the preparation and
presentation of financial statements is provided on page 176.
Directors’ Statement on Internal Control over Financial Reporting is
provided on Pages 128 and 129.
Independent Auditors’ Report is provided on page 177.
D.1.4 Need to Include a Management
Discussion & Analysis in the Annual
Report
Complied The Management Discussion and Analysis is provided in pages 39 to 103
and covers the information specified in the Code as given below;
Information Required Page
Industry structure and developments 43 to 47
Opportunities and threats, risks and concerns 48 and 49
Internal control systems and their adequacy 156 to 165
Social and environmental protection activities carried out
by the Company
65 to 76 and
95 to 100
Financial performance 51 to 64
Material developments in human resources / industrial relations 77 to 88
Prospects for the future 20
D.1.5 Need to include a declaration by the
Board on the going concern of the
Business
Complied This information is provided in the Annual Report of the Board of Directors
on the affairs of the Company on page 173.
D.1.6 Requirement to summon an
Extraordinary General Meeting (EGM)
to notify serious loss of capital
Complied This situation has not arisen during the year 2017 and the likelihood of
such a situation is remote. However, should such a situation arise, an
EGM would be convened to keep the shareholders informed thereof.
D.1.7 Requirement to disclosure Related
Party Transactions in the Annual
Report.
Complied Refer Financial Statements on Pages 254 to 257 for details on related
party transactions during 2017.
Refer page 126 for details on the Related Party Transactions Review
Committee.

149
UNION ASSURANCE PLC | ANNUAL REPORT 2017
CO
RP
OR
ATE
GO
VE
RN
AN
CE
Reference Corporate Governance Rule Status UA Compliance and Implementation
D.2 Internal Control
D.2.1 Need to Maintain a sound system
of internal control to safeguard
shareholders’ investments and the
company assets
Complied Refer Board Audit and Compliance Committee Report on pages
119 to 121. Directors Report on Internal Controls on pages 128 and 129.
D.2.2 Need for an internal audit function Complied PricewaterhouseCoopers – a leading firm of Chartered Accountants who
was appointed as the internal auditors in September 2010 continued to
be internal auditors in 2017.
For more details refer Board Audit and Compliance Committee Report on
pages 119 to 121.
D.2.3 &
D.2.4
Need for the Audit Committee to
review the process and effectiveness
of risk management and internal
controls
Responsibilities of Directors in
maintaining a sound system of
internal controls and content of
Statement of Internal Control
Complied BACC reviews the internal audit plan and monitors progress on a
regular basis.
Internal auditors may also carry out any additional tasks they deem
necessary to effectively discharge their duties.
The BACC reviewed the internal controls and procedures at the
meetings held during 2017. Refer pages 119 to 121 for the BACC
report for 2017.
The minutes of the BACC meetings were tabled at the meetings of the
Board of Directors.
Please refer pages 128 and 129 for 'Directors Statement on Internal
Controls' for further details.
D.3 Audit Committee
D.3.1 Need for the Audit Committee
to be comprised a minimum of
two independent Non-Executive
Directors or exclusively by Non-
Executive Directors, a majority of
whom should be independent,
whichever is higher
Complied The BACC consists of three Non - Executive Directors, two of whom are
independent
Refer page 119 for the composition of the Audit Committee.
D.3.2 Review of External Audit function
and relationship with External
Auditors
Complied Please refer pages 119 to 121 of the BACC report.
D.3.3 &
D.3.4
Need for the Audit Committee to
have written Terms of Reference and
need to disclose the names of the
members of the Audit Committee
and report of the Audit Committee in
the Annual Report
Complied The BACC operates within clearly defined terms of reference which have
been approved by the Board.
The duties and responsibilities of the BACC are in line with the Code of
Best Practice on Audit Committees issued by the ICASL and Code of
Best Practice on Corporate Governance jointly issued by the ICASL and
the SEC.
Please refer Board Audit and Compliance Committee Report from pages
119 to 121 for further details.

UNION ASSURANCE PLC | ANNUAL REPORT 2017
150
CORPORATE GOVERNANCE
Reference Corporate Governance Rule Status UA Compliance and Implementation
D.4 Code of Business Conduct and Ethics
D.4.1 Need to make a disclosure on the
presence of a Code of Business
Conduct & Ethics
Complied A summary of the Company’s ‘Code of Conduct’ is provided on page
135 of this report.
There have been no violations of the Code of Ethics during 2017 by
any of the Directors or any member of the Executive Committee.
D.4.2 Affirmation by the Chairman that
there is no violation of the Code of
Business Conduct & Ethics
Complied Please refer Chairman’s report on corporate governance on page 109.
D.5 Corporate Governance Disclosure
D.5.1 Need for inclusion of a Corporate
Governance Report in the Annual
Report
Complied Corporate Governance Report from Pages 106 to 155 sets out the manner
in and the extent to which the Company has complied with the Code.
Section 2 – Shareholders
E. Institutional Investors
E.1 Shareholders Voting
E.1.1 Need to conduct Regular
and structured dialogue with
Shareholders
Complied All Shareholders are encouraged to participate at AGM and cast their
votes. Investor relations hotline / email is open for any Investor to reach
out to the CEO / Director if required. From the company’s perspective, the
AGM provides a forum for the Board to inform the shareholders what the
Company does and how it has performed during the year. For investors,
it provides a forum to learn more about the business and ask questions
from the Directors and to use their votes responsibly.
E.2 Evaluating The Governance Disclosure
E.2 Need to Encourage institutional
investors to give due weight to
relevant governance arrangements
Complied Institutional investors are kept apprised of the Company’s governance practices
through the Annual Report and new initiatives are highlighted at regular
meetings to ensure that due weightage is given to good Corporate Governance.
This report sets out the Company’s governance arrangements.
F. Other Investors
F.1 Investing / Divesting Decisions
F.1 Encourage individual shareholders
to seek independent advice in
investing or divesting decisions
Complied The Annual Report together with the interim financial statements
published each quarter, provide sufficient information to enable retail
investors / any potential investors to carryout their own analysis and make
informed judgements regarding the performance of the Company.
The following reports aim to provide a balanced overall assessment
of the company’s activities, performance and prospects. The report
contains information about the plans and strategies of the Company
for the medium and long term and represent the Company view of the
management. The plans are forward looking in nature and their feasibility
depends on number of economic, political and legal factors which are
outside the influence of the Company such as global and domestic
financial, economic and political situations. For the;
Chairman’s Message, refer pages 14 and 15.
CEO’s Review, refer pages 16 to 20.
Management Discussion and Analysis, refer pages 38 to 103.
Audited Financial statements, refer pages 169 to 258.

151
UNION ASSURANCE PLC | ANNUAL REPORT 2017
CO
RP
OR
ATE
GO
VE
RN
AN
CE
Reference Corporate Governance Rule Status UA Compliance and Implementation
F.2 Shareholder Voting
F.2 Encourage individual shareholders
to participate in General Meetings
and exercise voting rights
Complied To achieve this purpose, the notices of meetings are dispatched to all
shareholders within the prescribed time periods.
Proxy forms are sent with the Annual Report to shareholders who are
unable to be physically present at the AGM to cast their vote
G. Sustainability Reporting
G.1 Principles of Sustainability Reporting
G.1.1 Reporting of Economic sustainability Complied The contribution to the national economy from life insurance business and
economic value addition to other stakeholders is illustrated on page 57.
G.1.2 Reporting on the Environment Complied Please refer Natural Capital report on pages 95 to 100.
G.1.3 Reporting on labour practices. Complied Please refer remuneration committee report on pages 122 and 123 and
Human Capital report on pages 77 to 88 for further details.
G.1.4 Reporting on society Complied Please refer Social and Relationship Capital report on pages 65 to 76.
G.1.5 Reporting on Product Responsibility Complied Please refer Social and Relationship Capital report on pages 65 to 76.
G.1.6 Reporting on stakeholders
identification, engagement and
effective communication
Complied Please refer Stakeholder Relationship on pages 30 to 33.
G.1.7 Formalising sustainable reporting as
part of Company’s reporting process
Complied UA has aligned itself to the GRI Standards in its sustainability reporting.
Please refer details on pages 264 to 270.
2. Our compliance with the requirements on the content of the Annual Report as per rule 7.6 and requirements on Corporate Governance as per rule 7.10 of the listing rules of the Colombo Stock Exchange (Listing Rules) is as follows.
(a) Compliance with requirements on the content of the Annual Report as per rule 7.6 of the Listing Rules
Rule RequirementStatus of
ComplianceUA Action and Reference
7.6 (i) Names of persons who during the financial year were directors
of the Entity
Compliant Mr. Ajit D Gunewardene
(Resigned w.e.f 31 December 2017)
Refer details on page 106 and 107.
7.6 (ii) Principal activities of the entity and its subsidiaries during the
year and any changes therein.
Compliant Please refer Accounting policy ‘Principal
Activities’ on page 186.
7.6 (iii) The names and the number of shares held by the 20 largest
holders of voting and non-voting shares and the percentage of
such shares held.
Compliant Refer details on page 64.
7.6 (iv) The public holding percentage. Compliant Refer details on page 63.
7.6 (v) A statement of each director’s holding and Chief Executive
Officer’s holding in shares of the Entity at the beginning and
end of each financial year.
Compliant Refer details on page 63.
7.6 (vi) Information pertaining to material foreseeable risk factors of
the entity.
Compliant Please refer the risk management section from
pages 156 to 165 and Note 7 to the Financial
Statements.
7.6 (vii) Details of material issues pertaining to employees and
industrial relations of the entity.
Compliant Please refer Human Capital Report on pages
77 to 88 for details.

UNION ASSURANCE PLC | ANNUAL REPORT 2017
152
CORPORATE GOVERNANCE
Rule RequirementStatus of
ComplianceUA Action and Reference
7.6 (viii) Extents, locations, valuations and the number of buildings of
the entity’s land holdings and investment properties.
Compliant Refer property, plant and equipment Note 26
on pages 226 to 230.
7.6 (ix) Number of shares representing the entity’s stated capital. Compliant The total number of shares is 58,928,572
which are ordinary shares with voting rights.
7.6 (x) A distribution schedule of the number of holders in each class
of equity securities, and the percentage of their total holdings
in the given categories:
Compliant Refer details on page 63.
7.6 (xi) List of Ratios and market price information Compliant Please refer the shareholder information
section on pages 60 to 62.
7.6 (xii) Significant changes in the entity’s or its subsidiaries’ fixed
assets and the market value of land, if the value differs
substantially from the book value
Compliant Changes in the entity’s fixed assets and
market value of land is explained in Note 26 to
the financial statements.
7.6 (xiii) If during the year the entity has raised funds either through a
public issue, Rights Issue, and private placement;
Compliant No funds were raised during 2017 in such
manner.
7.6 (xiv) Employee share Option Schemes and Employee Share
Purchase Scheme.
Compliant Please refer Note 36 to the financial
statements.
7.6 (xv) Disclosures pertaining to Corporate Governance practices in
terms of rules 7.10.3, 7.10.5 C, and 7.10.6 C of section 7 of
the rule.
Compliant Please refer following for details.
Rule 7.10.3 on page 153
Rule 7.10.5 C on page 153
Rule 7.10.6 C on page 154
7.6 (xvi) Related Party transactions exceeding 10% of the Equity or
5% of the total assets of the Entity as per audited financial
statements, whichever is lower.
Compliant There were no material transactions during
the year with related parties other than what
is disclosed in Note 43 to the Financial
Statements.
(b) Compliance with requirements on Corporate Governance as per in rule 7.10 of the Listing Rules
Rule RequirementStatus of
ComplianceUA Action and Reference
7.10 Compliance with Corporate Governance Rules Compliant The Company is in compliance with the
Corporate Governance Rules and any
deviations are explained where applicable.
Refer ‘Statement of Compliance’ on page 110.
7.10.1 Non - Executive Directors (NED)
7.10.1(a) The Board of directors of a Listed Entity shall include at least,
two NEDs; or
such number of NEDs equivalent to one third of the total
number of directors whichever is higher.
Compliant Six out of the seven Directors on UA’s Board
are NEDs of whom three are independent.
7.10.1(b) The total number of Directors is to be calculated based on
the number as at the conclusion of the immediately preceding
Annual General Meeting.
Compliant No change to the number of Directors since
the last AGM.
7.10.1(c) Any change occurring to this ratio shall be rectified within
ninety (90) days from the date of the change
Compliant No impact to the ratio since no change to the
composition since last AGM.

153
UNION ASSURANCE PLC | ANNUAL REPORT 2017
CO
RP
OR
ATE
GO
VE
RN
AN
CE
Rule RequirementStatus of
ComplianceUA Action and Reference
7.10.2 Independent Directors
7.10.2 (a) Two or one third of NEDs, whichever is higher, should be
independent.
Compliant The Board has determined that three Directors
out of six NEDs are Independent.
7.10.2 (b) The Board shall require each NED to submit signed
declaration of independence / non-independence annually
Compliant All Directors have submitted annual
declarations in respect of the year under
review.
7.10.3 Disclosures Relating to Directors
7.10.3 (a) Names of Independent Directors should be disclosed in the
Annual Report.
Compliant Please refer pages 106 and 107 of the
Annual Report.
7.10.3 (b) In the event a Director does not qualify as independent as per
the rules on corporate governance but if the Board is of the
opinion that the Director is nevertheless independent, it shall
specify the basis of the determination in the Annual Report.
N/A No such determination was required to be
made by the Board, as the Independent
Directors of the Company met the specified
criteria.
7.10.3 (c) A brief resume of each Director should be published in the
annual report including the areas of expertise
Compliant Please refer page 106 and 107 for brief
profiles of the Directors.
7.10.3 (d) A brief resume of any new Director appointed to the Board
should be provided to the Exchange for dissemination to the
public
Compliant A brief resume of Mr. Susantha Ratnayake who
has been appointed to the Board with effect
from 1 January 2018, has been provided to
the CSE on 2 January 2018.
7.10.4 Criteria for Defining Independence
7.10.4
(a to h)
Requirements for meeting the criteria to be an Independent
Director
Compliant The Company’s independent NEDs meet the
required criteria. Refer Note 43 to the financial
statements and page 116 for a summary of Non
- Executive / Independent Directors’ interests.
7.10.5 Remuneration Committee (RC)
7.10.5 A Listed Entity shall have a remuneration committee Compliant The Company has its own Remuneration
committee
7.10.5 (a) The RC shall comprise a minimum of two Independent NEDs
or a majority of Independent NEDs, whichever is higher
One NED shall be appointed as Chairman of the committee by
the Board
Complaint Please refer report of the RC on pages
122 and 123 of the Annual Report.
7.10.5 (b) Functions of the RC shall be to recommend the remuneration
of the Chief Executive Officer and the Executive Directors.
Complaint Please refer report of the RC on pages
122 and 123 of the Annual Report.
7.10.5 (c) The Annual Report shall set out:
The names of the Directors that comprise the RC.
A Statement of Remuneration Policy.
Aggregate remuneration paid to Executive and
Non - Executive Directors
Complaint
Complaint
Complaint
Please refer report of the RC on pages
122 and 123 of the Annual Report.
Please refer report of the RC on pages
122 and 123 of the Annual Report.
Please refer Note 21 to the Financial
Statements.

UNION ASSURANCE PLC | ANNUAL REPORT 2017
154
CORPORATE GOVERNANCE
Rule RequirementStatus of
ComplianceUA Action and Reference
7.10.6 (A) Audit Committee – Composition
7.10.6 A listed Company shall have an Audit Committee Complaint The Company has its own Board Audit and
Compliance Committee (BACC)
7.10.6 (a) The Audit Committee shall comprise a minimum of two
Independent NEDs, or a majority of Independent NEDs,
whichever is higher
One NED shall be appointed as Chairman of the Audit
Committee by the Board
The Chief Executive Officer and Chief Financial Officer shall
attend Audit Committee meetings
The Chairman or one member of the Committee should be a
member of a recognised professional accounting body
Complaint
Complaint
Complaint
Complaint
Please refer report of the BACC on pages 119
to 121 of the Annual Report.
Please refer report of the BACC on pages 119
to 121 of the Annual Report.
The CEO and CFO attended all BACC
meetings.
Two out of the three members of the BACC are
members of professional accounting bodies.
7.10.6 (B) Audit Committee – Functions
7.10.6 (b) The functions of the Audit Committee shall include;
Overseeing of the preparation, presentation and adequacy
of disclosures in the financial statements in accordance
with Sri Lanka Accounting Standards,
Overseeing the compliance with financial reporting and
information requirements as per laws and regulations,
Ensuring the internal controls and risk management
are adequate to meet the requirements of the Sri Lanka
Auditing Standards,
Assessing of the independence and performance of the
external auditors, and
Make recommendations to the Board pertaining to
appointment, re- appointment and removal of external
auditors and to approve the remuneration and terms of
engagement of the external auditors.
Complaint Please refer report of the BACC on pages 119
to 121 of the Annual Report.
7.10.6 (c) The Annual Report shall set out; the names of the Directors
who comprise the Audit Committee.
The Audit Committee shall make a determination of the
independence of the Auditors and disclose the basis for such
determination.
A report by the Audit Committee setting-out the manner of
compliance of the functions set out in above, during the period
to which the annual report relates.
Complaint
Complaint
Complaint
Please refer report of the BACC on pages 119
to 121 of the Annual Report.
Please refer report of the BACC on pages 119
to 121 of the Annual Report.
Please refer report of the BACC on pages 119
to 121 of the Annual Report.

155
UNION ASSURANCE PLC | ANNUAL REPORT 2017
CO
RP
OR
ATE
GO
VE
RN
AN
CE
3. As per the requirements set out in Section 168 of the Companies Act No. 07 of 2007, the following information is disclosed in this Report for the year under review
Reference to the Companies Act
Information required to be disclosed as per the Companies Act No. 07 of 2007
Level of compliance by the Company
Section 168 (1) (a) The nature of the business of the Company Refer ‘Principal Business Activities, Nature of Operations and
Ownership by the Company and its Associates’ on page 186.
Section 168 (1) (b) Signed Financial Statements of the Company for
the accounting period under review
The Financial Statements of the Company for the year ended 31
December 2017 which were duly certified by the Chief Financial
Officer and were approved by two members of the Board as
appearing on pages 169 to 258 of this Report.
Section 168 (1) (c) Auditors’ Report on Financial Statements of the
Company
Refer page 177 for the “Independent Auditors’ Report”
Section 168 (1) (d) Changes in Accounting Policies during the
accounting period
Significant Accounting Policies adopted in the preparation of
the Financial Statements of the Company are given on pages
186 to 258.
There were no changes to the Accounting Policies used by the
Company during the year.
Section 168 (1) (e) Particulars of entries in the Interests Register made
during the accounting period
All Directors have made declarations as required by the
Sections 192 (1) and (2) of the Companies Act aforesaid and all
related entries were made in the Interests Register during the
year under review.
The Interests Register is available for inspection by
shareholders or their authorised representatives as required by
Section 119 (1) (d) of the Companies Act No. 07 of 2007.
Section 168 (1) (f) Remuneration and other benefits paid to the
Directors during the accounting period
Refer Note 21 to the Financial Statements on page 219.
Section 168 (1) (g) Total amount of donations made by the Company
during the accounting period
Refer Note 21 to the Financial Statements on page 219.
Section 168 (1) (h) Information on Directorate of the Company at the
end of the accounting period
Refer Board of Directors brief profiles on pages 106 and 107.
Section 168 (1) (i) Amounts payable to the Auditor as audit fees
and fees for other services rendered during the
accounting period as a separate disclosure
Refer Note 21 to the Financial Statements on page 219.
Section 168 (1) (j) Auditors’ relationship or any interest with the
Company
Auditors do not have any other relationship or interest in
contracts with the Company, or it’s Associate other than being
the Auditors for the Company and Associate. Refer page 177.
Section 168 (1) (k) Annual Report of the Board of Directors on the
affairs of the Company to be signed on behalf
of the Board by two Directors and the Company
Secretary
Refer the Statement of Directors Responsibility on page 176.

Mission and
Objectives of Risk
Management
Risk
Governance
Key Elements
of Risk
Management
Analysis by
Risk Type
ENTERPRISE RISK MANAGEMENT Enterprise risk management is a key element of our Corporate Governance process and stems from our stewardship commitment towards our
partners to ensure the sustainability of our business.
Risk Management
Framework
156

157
UNION ASSURANCE PLC | ANNUAL REPORT 2017
CO
RP
OR
ATE
GO
VE
RN
AN
CE
UA’s approach to risk management aims to protect the Company’s capital, enhance value creation, optimise its risk-return profile, support decision making and protect UA’s reputation and brand.
352%Capital Adequacy Ratio
Rs. 5,172MnAdmissible Assets Over Liabilities
4.9%Cession Rate
'A' or above credit rating from International rating agencies Reinsurers
Mission and Objectives of Risk Management The mission of risk management at UA
is to enhance the value of the Company
by embedding disciplined risk taking in
its culture, in which risk-reward trade-offs
are transparent, understood and risks are
appropriately rewarded.
The Company’s risk management objectives
are to:
Protect the capital base by monitoring
that risks and ensuring that risks are
not taken beyond the company’s risk
tolerance
Enhance value creation and contribute
to an optimal risk-return profile by
providing the basis for efficient capital
deployment
Support decision-making processes by
providing consistent, reliable and timely
risk information
Protect UA’s reputation and brand
by promoting a sound culture of risk
awareness and disciplined, and
informed risk taking.
Risk Management FrameworkThe risk management framework is based
on a governance process that sets forth
clear responsibilities for taking, managing,
monitoring and reporting risks by the
Executive Committee. The UA risk policy
is the company’s main risk governance
document; it specifies the company’s
risk tolerance, risk limits and authorities,
reporting requirements, procedures to
approve any exceptions and procedures
for referring risk issues to the Board Audit
and Compliance Committee (BACC) and
the Board of Directors. The company has
procedures to refer risk issues to the BACC
and the Board of Directors in a timely
manner. To foster transparency, the Board
receives quarterly risk grid reports and
additional updates. The company regularly
measures and quantifies material risks to
which it is exposed.
Risk GovernanceThe Board is responsible and provides
oversight, and sets UA’s risk appetite and
annually evaluates the implementation of
UA’s risk policy and risk management plan.
The Board has delegated the responsibility
to design, implement and monitor the
risk management plan to the CEO, who
in turn manages this through the a team
comprising the senior management.
Line managers support UA’s risk
management philosophy, promote
compliance with its risk appetite, and
manage risks within their spheres of
responsibility consistent with risk tolerances
as per the delegated authority levels. Other
personnel are responsible for executing
enterprise risk management in accordance
with established directives and protocols.
Risk management is however, a team effort
and every employee will be responsible
for managing risks in his / her working
environment and therefore assist to identify

UNION ASSURANCE PLC | ANNUAL REPORT 2017
158
ENTERPRISE RISK MANAGEMENT
risks at all levels and in all functions of the business as required by the integrated risk management plan. Regular and formal risk analysis
provides the basis for risk identification and evaluation, and the appropriate risk responses and mitigation.
The management ensures continuous and regular measurement of risks, and reports the Company’s risk performance to the BACC.
Business Unit
(Risk organization
within risk appetite)
1st Line of defence
Divisional Risk
A Team
2nd Line of defence
Board
3rd Line Independent Assurance
Divisional risk
appetite and policies
Company / wide
standards and policies
Risk identification,
evaluation and management
Risk acceptance
and monitoring
Risk Reporting
Risk appetite
and Framework
1st Line of Defense
Business units are accountable for
managing all risks relating to the respective
unit. Department level detailed risk grids are
maintained for this purpose and is reviewed
regularly for any changes in identified risks
and their status, and any new and potential
risks are escalated to the BACC.
2nd Line of Defense
The risk committee with the guidance of the
BACC and the Board reviews applicability
and proper execution of company risk
policies and standards on a regular basis.
3rd Line of Defense
This is the independent assurance by
outsourced internal auditors and external
auditors regarding the adequacy and
improvements required to existing controls.
GRI 102-11
Key Elements of Risk Management
Capital Adequacy Ratio (CAR)
The CAR under the Risk Based Capital
Regime measures adequacy of the Total
Available Capital (TAC) as against the Risk
Capital Required (RCR). As per regulations,
the minimum CAR should be consistently
maintained in excess of 120%, with a
significant margin (that is above 160%)
to avoid any regulatory interventions.
In addition, the Insurance Regulatory
Commission of Sri Lanka (IRCSL) stipulates
a minimum Total Available Capital of
Rs. 500 million.
UA maintained a CAR in excess of 120%
with a significant margin on a consistent
basis.
0
5,000
10,000
15,000
20,000
Capital Adequacy Ratio
Rs. Mn %
14
,27
3.7
4,2
58
.07
14
,07
3
0
100
200
300
400
500
3,5
08
.85
15
,49
1.2
3,8
76
.34
16
,53
8.4
4,7
01
.64
120%160%
Total Available Capital (TAC)
Risk Capital Required (RCR)
Capital Adequacy Ratio
Minimum CAR
Regulatory
Intervention Level
Dec
emb
er31
,201
7
Sep
tem
ber
30,2
017
June
30,2
017
Mar
ch31
,201
7
The table below shows the estimated
impact on the company’s CAR of one
percentage increase / decrease in yield
curve. The sensitivities are considered as
separate scenarios.
The management ensures continuous and regular measurement of risks, and reports the Company’s risk performance to the BACC.

159
UNION ASSURANCE PLC | ANNUAL REPORT 2017
CO
RP
OR
ATE
GO
VE
RN
AN
CE
GRI 102-11
SolvencyBase case
Rs '000
Sensitivities1 % increase in yield curve
Rs'000
1 % decrease in yield curve
Rs'000
Total Available Capital (TAC) 16,538,376 16,980,711 16,063,197
Formula Risk-based Capital Required (FRCR) 4,701,641 5,103,931 4,319,576
Surrender Value Capital Charge (SVCC) - - -
Risk Based Capital requirement (RCR) 4,701,641 5,103,931 4,319,576
% % %
Risk-based Capital Adequacy Ratio (CAR) 352 333 372
In addition to the sensitivities shown above,
the company also evaluates certain stress
scenarios on the CAR. Scenarios are
defined as events that have a very small
probability of occurring but that could, if
realised, negatively affect the CAR. As
reflected below, lapse risk represents the
company’s largest life insurance specific
risk- exposure.
Scenario: Lapse risk
Parallel upward shift of 300 basis points
to the risk-free yield curves
Increase in base lapse rates of 50% for
all future years
ObjectivesBase case
Rs '000
3 % increase in yield curve with
50% Lapse rates for all future years
Rs'000
TAC 16,538,376 16,734,545
FRCR 4,701,641 2,556,474
SVCC - -
RCR 4,701,641 2,556,474
% %
CAR 352 655
Determination 1
Excess in Admissible Assets
Every insurer carrying on a long term
insurance business shall invest the balance
assets of the Long Term Insurance Fund
[referred to in Section 38 of the Regulation
of Insurance Industry Act, No 43 of 2000
and also known as Insurance Provision Life]
in certain types of investments (Admissible
assets) subject to limitations stipulated
therein: The approved assets have higher
credit profiles which ensure that the life fund
is secured
UA has maintained a significant excess in
approved assets over the quarters.
0
5,000
10,000
15,000
20,000
25,000
30,000
35,000
Excess in Approved Assets
Ma
rch
31
, 2
01
6
Ju
ne
30
, 2
01
6
Se
pte
mb
er
30
, 2
01
6
De
ce
mb
er
31
, 2
01
6
Ma
rch
31
, 2
01
7
Ju
ne
30
, 2
01
7
Se
pte
mb
er
30
, 2
01
7
De
ce
mb
er
31
, 2
01
7
Approved Assets
0
400
800
1,200
1,600
2,000
Life Insurance Fund Liability Excess in Approved Assets
Rs. Mn Rs. Mn
Risk Capital required by Risk Type
Risk Based Capital (RBC)
The chart below shows UA’s risk capital
required by type of risk as of 31 December
2017 and 31 December 2016 respectively.
As of 31 December 2017, the largest
proportion of UA risk capital required arose
from market risk which comprised 62%
of the total. Liability risk was the second
largest, comprising 20%.
Risk Capital Required by Type of Risk

UNION ASSURANCE PLC | ANNUAL REPORT 2017
160
ENTERPRISE RISK MANAGEMENT
Analysis by Risk Type
UA Risk Categories
The diagram below shows UA’s risk categories. The significant risks are discussed in pages to follow.
Risk Categories
Asset Liability Management /
Investment / Credit Risk
Business and Strategic Risk
Insurance Risk
Page 160
Operational Risk
Page 164
Investment Credit Risk
Page 163
Reinsurance Credit Risk
Page 163
Other Receivable
Credit Risk
Pages 163 and 164
Interest Rate / Asset
Liability Management Risk
Page 163
Liquidity Risk
Page 165
Strategic Risk
Page 165
Governance
Page 157
Reputation
Page 165
Natural Catastrophe Risk
Underwriting Risk
Reserving Risk
Life Insurance Risk
External Events
People Risk
Systems Risk
Process Risk
Liability / Insurance RiskInsurance risk is the inherent uncertainty
regarding the occurrence, amount
or timing of insurance liabilities. The
exposure is transferred to UA through the
underwriting process. UA actively seeks
to write those risks it understands and that
provide a reasonable opportunity to earn
an acceptable profit. UA manages the
customer risks it assumes, and minimises
unintended underwriting risks, through such
means as:
Establishing limits for underwriting
authority
Requiring specific approvals for
transactions above established limits or
new products
Using a variety of reserving and
modelling methods
Ceding insurance risk through external
proportional or non-proportional
reinsurance treaties and facultative
single-risk placements.
The risks associated with life insurance
include:
Mortality risk – when on average, the
death incidence among policyholders is
higher than expected
Longevity risk – when on average,
annuitants live longer than expected
Morbidity risk – when on average, the
incidence of sickness or disability
among policyholders is higher or
recovery rates from disability are lower
than expected

161
UNION ASSURANCE PLC | ANNUAL REPORT 2017
CO
RP
OR
ATE
GO
VE
RN
AN
CE
Policyholder behaviour risk – on
average, policyholders discontinue
or reduce contributions or withdraw
benefits prior to the maturity of contracts
at a rate that is different from expected
Expense risk – expenses incurred in
acquiring and administering policies are
higher than expected
New business risk – volumes of new
business are lower than sufficient to
cover fixed acquisition expenses
Market risk – the risk associated with
the Company’s balance sheet positions
where the value or cash flow depends
on financial markets, which is analysed
in the ‘market risk’ section
Credit risk – the risk associated
with a loss or potential loss from
counterparties failing to fulfil their
financial obligations, which is analysed
in the ‘credit risk’ section.
A more diversified portfolio of risks is less
likely than an undiversified portfolio to be
affected across the board by a change
in any subset of the risks. As a result, the
offsetting effects between unit-linked and
traditional business reduce some of the risk
associated with the life business.
From a risk-management perspective,
unit-linked products are designed to
reduce much of the market and credit risk
associated with UA’s traditional business.
Risks that are inherent in these products
are largely passed on to the policyholder,
although a portion of the company’s
management fees are linked to the value
of funds under management, and hence
are at risk if fund values decrease. To the
extent that there are guarantees built into
the product design, unit-linked products
carry mortality / morbidity and market risks.
Contracts may have minimum guaranteed
death benefits where the sum at risk
depends on the fair value of the underlying
investments. For certain contracts these
risks are mitigated by mortality and
morbidity charges.
Other life insurance liabilities include
traditional life insurance products, such
as protection and life annuity products.
Protection products carry mortality,
longevity and morbidity risks, as well as
market and credit risks. Epidemics and
lifestyle changes are among the most
significant factors that could result in earlier
or more claims than expected. Disability,
defined in terms of the ability to perform an
occupation, could be affected by economic
conditions. To reduce pricing cross-
subsidies, where permitted, premiums are
adjusted for factors such as age, gender
and smoker status. Policy terms and
conditions and disclosure requirements
in insurance applications are designed to
mitigate the risk arising from non-standard
and unpredictable risks that could result in
severe financial loss.
In the life annuity business, medical
advances and improved social conditions
that lead to increased longevity is the
most significant insurance risk. Annuitant
(beneficiary) mortality assumptions include
allowance for future mortality improvements.
The Company is also exposed to risks
posed by policyholder behaviour, and
fluctuating expenses. Expense risk is
reduced by carefully controlling expenses,
and through regular expense analysis and
allocation exercises.
Natural Catastrophe RiskImpact of natural catastrophes such as
spread of contagious diseases are being
periodically evaluated. Sufficient excess of
Loss (XOL) reinsurance covers have been
purchased. UA has retained the XOL limits
per annum as well as per event relating to
catastrophes.
Concentration RiskThe Company defines concentration risk
as the risk of exposure to increased losses
associated with inadequately diversified
portfolios of assets or obligations.
Concentration risk for a life insurer may
arise with respect to investments in a
geographical area, economic sector, or
individual issuers, or due to a concentration
of business written within a geographical
area, of a policy type, or of underlying risks
covered.
Observing best estimate assumptions on
cash flows related to benefits of insurance
contracts gives some indication of the size
of the exposure to risks and the extent of
risk concentration. The following graph
shows the company’s concentration of
risk by line of business based on reserves
for life insurance on a net basis. The
Company’s exposure to life insurance risks
varies significantly by line of business and
may change over time.
0
5,000
10,000
15,000
20,000
25,000
30,000
35,000
Reserve Composition
Rs. Mn
20172016
2,3
78
2,1
22
30,2
68
33,0
95
27,8
90
30,9
74
Unit - Lined Insurance Contracts
Other Life Insurance Liabilities
Total Reserve
Reinsurance The Company’s objective in purchasing
reinsurance is to provide market-leading
capacity for customers while protecting
the financial position and achieving capital
efficiency. UA structures and aligns its
reinsurance programs to achieve an
optimum risk-return ratio. The Company
is able to manage its risks to retain a
significant and stable portion of its risk
exposure. The cession rate for reinsurers
was 4.9% and 5.1% as of December 31,
2017 and December 31, 2016, respectively.

UNION ASSURANCE PLC | ANNUAL REPORT 2017
162
ENTERPRISE RISK MANAGEMENT
%
201720162014 2015
Cession Rate
0
1
2
3
4
5
64
.9
5.5
5.2
5.1
Increased diversity in product portfolio
helped decrease in cession ratio
96% of UA corporate debt securities
represent investments in the banking,
finance and insurance sector. This is mainly
due to credit quality and stability in the
banking, finance and insurance sector.
Quoted Equities – Concentration Risk by Industry
UA predominantly invested in equities of
the banking, finance and insurance sector
considering credit risk and stability.
Market Risk
As of 31 December 2017, the largest
proportion of UA’s market risk arose from
interest rate risk which accounted for 66%
of the total market risk. Equity risk was
the second largest, accounting for 21%.
Compared with the 31 December 2016, as
at 31 December 2017 the composition of
market risk has not changed significantly.
Prominence of the interest rate risk increased
due to the volatility of the market.
Market risk is the risk associated with the
Company’s financial position where the
value or cash flow depends on financial
markets. Risk factors include:
Equity market prices
Property market prices, and
Interest rates
UA manages the market risk of assets
relative to liabilities on an economic total
balance sheet basis. This is done to achieve
the maximum risk-adjusted excess return
on assets relative to the liability benchmark,
while taking into account the Company’s risk
tolerance and local regulatory constraints.
The Company has policies and limits to
manage market risk and keeps its strategic
asset allocation in line with its risk capacity
to control risk aggregation and ensure
a consistent approach to constructing
portfolios.
The Company has set limits on concentration
in investments in single issuers and certain
asset classes as well as by how much
asset interest rate sensitivities can deviate
from liability interest-rate sensitivities. The
Company also limits illiquid investments.
The Investment Committee reviews and
monitors the Company's strategic asset
allocation and tactical boundaries, and
monitors company asset / liability exposure.
The economic effect of potential extreme
market moves is regularly examined
and considered when setting the asset
allocation. Risk assessment reviews include
the analysis of the management of interest
rate risk for each major maturity bucket and
adherence to the aggregate positions with
risk limits. The Company applies processes
to manage market risks and analyse market
risk hotspots. Actions to mitigate risks are
taken if necessary to manage fluctuations
affecting asset / liability mismatch and risk
based capital.
74%Quoted Equities - Banking, Finance and Insurance [ 2016: 70% ]
Corporate Debt Securities

163
UNION ASSURANCE PLC | ANNUAL REPORT 2017
CO
RP
OR
ATE
GO
VE
RN
AN
CE
Risk from Equity Securities UA is exposed to risks from price
fluctuations on equity securities which
could affect the company’s liquidity,
reported income, surplus and regulatory
capital position. Returns on unit linked
contracts, whether classified as insurance
or investment contracts, may be exposed to
risks from equity. But these risks are borne
by policyholders. However, the Company
is indirectly exposed to market movements
from unit-linked contracts with respect
to both earnings and economic capital.
Market movements affect the amount of
fee income earned when the fee income
level is dependent on the valuation of the
asset base. Therefore, the value of in-force
business of the unit linked portfolio can be
negatively affected by adverse movements
in equity market.
UA manages its risks from equity securities
as part of the overall investment risk
management process, and applies limits as
expressed in policies and guidelines.
Under Unit linked business, UA maintains
three funds; fixed and Managed Funds, are
managed internally, and the Equity Fund
is managed by an expert external fund
management entity.
Risk from Interest Rates Interest rate risk is the risk of loss resulting
from changes in interest rates, including
changes in the shape of yield curves. UA is
exposed to interest rate risks including debt
securities, reserves for insurance contracts,
employee benefit plans, and loans and
receivables.
UA has limits on holdings in real assets
and limits on deviations of asset interest
rate sensitivities from liability interest rate
sensitivities. UA also manages credit
spread risk, which describes the sensitivity
of the values of assets and liabilities due
to changes in the level or the volatility of
credit spreads over the risk free interest
rate yield curves. Movements of credit
spreads are driven by expected probability
of defaults, expected losses in cases of
defaults of issuers, the uncertainty of default
probabilities and losses, as well as actual
defaults of issuers.
Credit RiskCredit risk is the risk associated with a loss
or potential loss from counterparties failing
to fulfil their financial obligations. UA’s
exposure to other credit risks is derived
from the following main categories of
assets:
Investment portfolio
Reinsurance assets, and
Receivables
The Company’s objective in managing
credit risk exposures is to maintain them
within parameters that reflect UA’s strategic
objectives and risk tolerance. Sources of
credit risks are assessed and monitored,
and the Company has policies to manage
the specific risks within the various
subcategories of credit risks. To assess
counterparty credit risk, UA uses the ratings
assigned by external rating agencies. The
Company actively uses collateral to mitigate
credit risks. Nevertheless, underlying credit
risks are managed independently from the
collateral.
Credit Risk ConcentrationThe Company limits and regularly
monitors credit exposures to individual
and related counterparties. There is no
unapproved material exposure in excess
of the Company’s limits for counterparty
aggregation as of December 31, 2017 or
December 31, 2016.
Policyholder Loans
Age Analysis31.12.17
Rs. Mn31.12.16
Rs. Mn
Past due not
impaired 77 52
61 - 90 days 31 23
91-180 days 82 65
181 days + 812 726
1,002 867
Surrender value of
the life policies 1,693 1,471
96% of UA corporate debt securities represent investments in the banking, finance and insurance sector. This is mainly due to credit quality and stability in the banking, finance and insurance sector.

UNION ASSURANCE PLC | ANNUAL REPORT 2017
164
ENTERPRISE RISK MANAGEMENT
Premiums Receivables
Age Analysis31.12.17
Rs. Mn31.12.16
Rs. Mn
0 - 30 days 269 247
Over 30 days Nil Nil
Operational Risk Operational risk is the risk of loss resulting
from inadequate or failed internal
processes, people, systems or from external
events such as outsourcing, catastrophes,
legislation, or fraud.
UA has a comprehensive framework with
a common approach to identify, assess,
quantify, mitigate, monitor and report
operational risks. Within this framework, the
Company:
Documents and reviews of loss events
exceeding a threshold determined by
UA’s Risk Policy. Remedial action is
taken to avoid a recurrence of such
operational loss events.
Conducts risk assessments where
operational risks are identified for key
business areas. Risks identified and
assessed above a certain threshold
must be mitigated. Risk mitigation
plans are documented and tracked on
a quarterly basis. In the assessments,
the Company uses such sources
of information as internal control
assessments, audit findings and loss
event data.
UA has specific processes and systems in
place to focus on high priority operational
matters such as managing information
security and third party suppliers, as well as
combating fraud.
Data Security RiskUA mitigates and responds to cyber risks
and threats to data security. Data held by
UA’s business partners is protected through
contractual arrangements and controls
that are built into ‘cloud governance’
procedures designed to secure UA’s data
in accordance with regulatory requirements
and UA’s information security policies.
Given the escalation in cyber risk, UA has
established a Cyber security policy in line
with the JKH Group and is in the process
of implementing IBM’s managed Security
Operations Centre (SOC) and security
intelligence platform to further strengthen
cyber resilience.
3rd Party Supplier RiskUA regularly assesses risks associated with
strategic suppliers to verify that suppliers
remain financially viable and able to
deliver services, and that the Company is
not exposed to geographic and supplier
concentration risks.
Fraud RiskPreventing, detecting and responding to
fraud is embedded in UA’s business. Both
claims and non-claims fraud are included in
the common framework for assessing and
managing operational risks.
Risk Alert Tools During the year Forestpin, an analytical
and risk alert tool was implemented for
claim and customer complaint settlement
processes to identify outliers in a timely
manner. Currently forestpin covers payment,
claim and customer complaint settlement
processes.
The outliers need to be investigated and
cleared by designated employees who
are not involved with the process. Senior
Management approval is required to close
risk alerts.
Risk Management and Internal Controls The Company considers controls to
be key instruments for monitoring and
managing operational risks. The Board
has overall responsibility for the company’s
risk management and internal controls, in
particular for their adequacy and integrity.
UA’s internal control system increases the
reliability of its financial reporting, makes
operations more effective, and aims to
ensure legal and regulatory compliance.
The internal controls system is designed to
manage rather than eliminate the material
risks that business objectives may result
in not being achieved. It can provide only
reasonable, not absolute, assurance against
material financial misstatement or loss.

165
UNION ASSURANCE PLC | ANNUAL REPORT 2017
CO
RP
OR
ATE
GO
VE
RN
AN
CE
Awareness and Internal Controls The Company encourages risk awareness
and understanding of controls with
communication and training. Primary
risk management and internal control
systems are established at company level
and implemented company-wide. The
management is responsible for identifying,
evaluating and addressing significant risks,
and designing and maintaining internal
controls. Key processes and controls in
the organisation are subject to reviews by
outsourced internal auditors. Significant
risks and mitigation actions are reported
regularly to the BACC.
The details of UA’s internal audit function
and external audit are given in pages 119
and 120.
Liquidity RiskLiquidity risk is the risk that the company may
not have sufficient liquid financial resources
to meet its obligations when they fall due, or
would have to incur excessive costs to do so.
UA’s policy is to maintain adequate liquidity
and contingent liquidity to meet its cashflow
needs under normal conditions and in times
of stress. To achieve this, the company
assesses, monitors and manages its liquidity
needs on an ongoing basis.
Detailed liquidity forecasts are regularly
conducted, based on business’ input
and the Company’s forecasts. As part of
its liquidity management, UA maintains
sufficient cash and cash equivalents and
high-quality liquid investment portfolios to
meet outflows under expected and stressed
conditions. The Company takes into
account the amount, availability and speed
at which these sources can be accessed.
The Company limits the percentage of
the investment portfolio that is not readily
realisable and regularly monitors exposures
to take action, if necessary, to maintain an
appropriate level of asset liquidity.
The maturity profile of the Company is given
on pages 191 to 204.
Strategic Risk Strategic risk refers to the risk that UA is
unable to achieve its strategic targets.
Strategic risks can arise from:
Inadequate assessment of strategic
plans
Ineffective implementation of strategic
plans, and
Unexpected changes to assumptions
underlying strategic plans
UA defines the strategy as the long
term plan of action designed to allow
the Company to achieve its goals and
aspirations. The Company works to reduce
unintended risks of strategic business
decisions through its risk assessment
processes and tools. In 2017, the Executive
Committee assessed the key strategic risk
scenarios, looking at 2017 and beyond. UA
assessed risks in executing the company’s
transformation programs for agency,
bancassurance and operations, delivering
on its customer strategy, information
security and cyber risks.
We have put mitigating actions in place
to manage and carry out the Company’s
transformation; to meet the challenge of
evolving customer needs and changes
in the distribution model affected by
digitalisation; and to strengthen UA’s ability
to handle and protect data and information
in anticipation of a rapidly evolving external
environment.
Risk to UA’s ReputationRisks include acts or omissions by the
Company or any of its employees that could
damage the Company’s reputation or lead
to a loss of trust among its stakeholders.
Every risk type has potential consequences
for UA’s reputation. Effectively managing
each type of risk helps reduce threats to
UA’s reputation. UA aims to preserve its
reputation by adhering to applicable laws
and regulations, and by following the core
values, principles and the code of conduct
of the company, which promotes integrity
and good business practices.


FINANCIALINFORMATION
The pages that follow record excellent bottom line growth for your company. Our strong fundamentals will deliver sustainable value to all our partners in short term as well as long term.
169 Annual Report of the Board of Directors on the Affairs of the Company
174 Chief Executive Officer's and Chief Financial Officer's Responsibility Statement
175 Actuarys' Report
176 Statement of Directors' Responsibility
177 Independent Auditors' Report
178 Table of Contents
179 Income Statement
180 Statement of Profit or Loss and Other Comprehensive Income
181 Statement of Financial Position
182 Statement of Changes in Equity
184 Statement of Cash Flows
186 Notes to the Financial Statements

Financial Calendar 2017 2018
31st Annual General Meeting to be held on N/A 9-May-18
30th Annual General Meeting held on 31-Mar-17 N/A
The first and final dividends for the year 2017 paid on N/A 20-Mar-18
The first and final dividends for the year 2016 paid on 17-Mar-17 N/A
Audited financial statements of preceding year authorised on 27-Feb-17 29-Mar-18
Interim financial statements will be published as per rule 7.4 of the Colombo Stock Exchange
Interim results for the three months ended 31 March (Unaudited) 12-May-17 15-May-18
Interim results for the three months ended 30 June (Unaudited) 14-Aug-17 15-Aug-18
Interim results for the three months ended 30 September (Unaudited) 14-Nov-17 15-Nov-18
Interim results for the three months ended 31 December (Unaudited) 27-Feb-18 28-Feb-19

169
UNION ASSURANCE PLC | ANNUAL REPORT 2017
FIN
AN
CIA
L IN
FO
RM
ATIO
NANNUAL REPORT OF THE BOARD OF DIRECTORS ON THE AFFAIRS OF THE COMPANYOverviewThe Directors have pleasure in presenting
the Annual Report of your Company
together with the audited financial
statements for the year ended 31st
December 2017.
Principal ActivitiesThe principal activity of the Company, which
is 'Life Insurance', remained unchanged
during the financial year.
The Company has not engaged in any
activities, which contravene laws and
relevant regulations.
Vision, Mission and Corporate ConductThe corporate vision and mission are provided
on page 24 of this report. In achieving its
vision and mission, the Company has ensured
that all Directors and employees conduct their
activities in compliance with the highest level
of ethical standards and integrity as set out in
the Code of Conduct.
Review of Business and Future DevelopmentsA review of the financial and operational
performance and future business
developments of the Company is contained
in the Chairman’s Message, Chief Executive
Officer’s Review and the Management
Discussion and Analysis section of the
Annual Report, as required under Section 168
(1) (a) of the Companies Act No 07 of 2007
(‘Companies Act’). These reports form an
integral part of the report of the Directors and
together with the audited financial statements
reflect the state of affairs of the Company.
TurnoverThe total gross written premium generated
by the Company for the year 2017 was Rs.
10,118 million (2016 – Rs. 8,271 million).
Financial Results and AppropriationsThe net profit after tax of the Company
was Rs.7,384 million for the year (2016 -
Rs.1,313 million).
A synopsis of the performance is presented below;
For the year ended 31 December Union Assurance PLC
2017Rs. '000
2016Rs. '000
Profit after tax 7,384,128 1,312,628
Balance brought forward from previous year 2,049,189 1,232,035
Profit available for appropriation 9,433,317 2,544,663
AppropriationsDividend paid for previous year (618,750) (500,893)
Transfer of one - off surplus to restricted regulatory reserve (3,381,934) -
Transfer from revaluation reserve 5,419 5,419
Un - appropriated profit carried forward 5,438,052 2,049,189
Financial Statements and Auditors’ ReportThe financial statements for the year ended
31st December 2017 has been prepared
in accordance with Sri Lanka Accounting
Standards (SLFRSs / LKASs) issued by the
Institute of Chartered Accountants of Sri
Lanka. The financial statements duly signed
by the Directors are provided on pages
179 to 258 and the Auditors’ Report on the
financial statements is provided on page
177 of this Annual Report.
Accounting PoliciesDetails of accounting policies are presented
on Pages 186 to 258 to the financial
statements, and comply with Section 168
(1) (d) of the Companies Act. There have
been no changes in the accounting policies
adopted by the Company during the year
under review. For all periods up to and
including the year ended 31st December
2017, the Company prepared its financial
statements in accordance with Sri Lanka
Accounting Standards (SLFRSs / LKASs)
which have materially converged with the
International Financial Reporting Standards
(IFRSs) as issued by the International
Accounting Standards Board (IASB).
DividendsThe Board of Directors has approved a
first and final dividend of Rs. 18.00 per
share for the year 2017 (2016 - Rs. 10.50).
The Board of Directors has confirmed
that the Company satisfies the solvency
test in accordance with Section 56 of the
Companies Act No. 7 of 2007 and has
obtained a certificate from the auditors prior
to declaring the dividend.
The dividend is paid partly out of dividends
received and partly out of taxable profits
of the Company. The dividend paid out of
profits will be subject to withholding tax.
Provision for TaxationThe Company is liable to income tax at 28%
(2016 - 28%) in terms of the Inland Revenue
Act No. 10 of 2006 and amendments
thereto. The tax position of the Company
is disclosed in Note 22 to the financial
statements on page 219.
Property, Plant and EquipmentDuring the financial year, the Company
acquired property, plant and equipment
to the aggregate value of Rs. 40 million.
The carrying value of property, plant and
equipment as at 31st December 2017 was
Rs. 2,001 million. The details of property,
plant and equipment are shown in Note 26
to the financial statements on page 226.
Intangible AssetsDuring the financial year, the Company
acquired intangible assets to the aggregate
value of Rs. 151 million. The carrying value
of intangible assets was Rs. 213 million
as at the reporting date. The details of
intangible assets are shown in Note 25 to
the financial statements on page 225.

UNION ASSURANCE PLC | ANNUAL REPORT 2017
170
ANNUAL REPORT OF THE BOARD OF DIRECTORS ON THE AFFAIRS OF THE COMPANY
Market Value of Freehold PropertiesThe land and building owned by the
Company at No. 6, Rajapihilla Road,
Kurunegala and at No. 20, St. Michael’s
Road Colombo 3 were revalued as at 31st
December 2017 to reflect its market value
as per Company policy.
The revaluation was performed by Mr. P B
Kalugalagedera and Associates, Chartered
Valuation Surveyor. The details of the
revaluation and relevant accounting policies
are provided in Note 26 to the financial
statements on page 226.
InvestmentsDetails of investments held by the Company
are disclosed in Note 28 to the financial
statements on page 234.
Stated Capital and ReservesIn compliance with the Companies Act No.
7 of 2007, the financial statements reflect
the stated capital of the Company. The
stated capital is the total of all amounts
received by the Company in respect of the
issued share capital. The stated capital of
the Company as at 31st December 2017 was
Rs. 1,000 million (2016 - Rs. 1,000 million)
and the total capital and reserves was
Rs. 11,965 million (2016 - Rs. 3,866 million).
As explained in Note 38.4 (c) on page 250,
based on the directions issued by IRCSL
dated 20 March 2018 and subsequent
approval, Company has transferred the one
- off surplus of Rs. 3,382 million attributable
to non-participating and non unit fund of unit
linked business from life policyholder fund to
life shareholder fund (SHF) through Income
Statement. The distribution of this one - off
surplus to shareholders, held as part of the
Restricted Regulatory Reserve, is subject to
meeting governance requirements stipulated
by the IRCSL and can only be released
upon receiving approval from the IRCSL.
The one - off surplus in the SHF is invested
in government debt securities as per the
directions of the IRCSL.
Share InformationInformation relating to earnings, dividends,
net assets and market value per share
is given in the UA share performance on
pages 60 to 64 of this report.
Share HoldingsThere were 1,333 registered shareholders,
holding ordinary voting shares as at 31st
December 2017 (2016 - 1,326). The
distribution of shareholding including the
percentage held by the public is given on
page 63 of this report.
Equitable Treatment to All ShareholdersThe Company has made every endeavour
to ensure the equitable treatment of all
shareholders and adopted adequate
measures to prevent information asymmetry.
Substantial ShareholdingsThe list of top twenty shareholders as at
31st December 2017 is given on page 64
of this report, together with comparative
shareholding as at 31st December 2016.
Information to ShareholdersThe Board strives to be transparent
and provide accurate information to
shareholders in all published material. The
quarterly financial information during the
year has been sent to the Colombo Stock
Exchange in a timely manner.
Corporate Governance The Board of Directors is committed
to maintaining an effective corporate
governance structure and process. A
more comprehensive report on corporate
governance is found on pages 106 to 165.
Directors’ Declaration
The Directors declare that;
a) The Company has not engaged in any
activity, which contravenes laws and
regulations
b) The Directors have declared all material
interests in contracts involving the
Company and refrained from voting on
matters in which they were materially
interested
c) The Company has made all endeavours
to ensure the equitable treatment of
shareholders
d) The business is a going concern
e) A review of the internal controls
covering, financial, operational
and compliance controls and risk
management has been conducted, and
the Directors have obtained reasonable
assurance of their effectiveness and
successful adherence therewith
f) The Company, being listed on the
Colombo Stock Exchange (CSE), is
compliant with the rules on corporate
governance under the listing rules of the
CSE with regard to the composition of
the Board and its sub committees
g) The Company is in compliance with the
Code of Best Practice on Corporate
Governance jointly issued by the
Securities and Exchange Commission
of Sri Lanka (SEC) and the Institute of
Chartered Accountants of Sri Lanka
(ICASL)
Board Audit and Compliance CommitteeThe composition of the Board Audit and
Compliance Committee comprising of Non
- Executive Directors is provided on page
119. The CEO, other Executive Committee
members and internal and external auditors
attend the meetings by invitation. The
report of the Board Audit and Compliance
Committee is provided on pages 119 to 121
of this report.
System of Internal ControlsThe Board of Directors has put in place
an effective and comprehensive system
of internal controls covering financial,
operational and compliance controls and
have obtained reasonable assurance
of their effectiveness. An enterprise
risk management initiative has been
implemented. The Board is satisfied that the
process is sufficiently robust to identify and
manage risks which have an impact on the
Company’s performance.
Risk ManagementThe Board and the executive management
of the Company have put in place
a comprehensive risk identification,

171
UNION ASSURANCE PLC | ANNUAL REPORT 2017
FIN
AN
CIA
L IN
FO
RM
ATIO
N
measurement and mitigation process.
The risk management process is an integral
part of the annual strategic planning cycle.
A detailed overview of the process is
outlined in the Enterprise Risk Management
report in the Corporate Governance section
on page 156.
The Board of DirectorsAs at 31st December 2017 the Board of
Directors of Union Assurance PLC consisted
of Directors with diverse knowledge and
experience. Brief profiles of the Directors
are given in the Corporate Governance
section on pages 106 and 107.
Resignation and Appointment of DirectorsMr. A. D. Gunewardene resigned from the
Board of Directors of the Company with
effect from 31st December 2017 upon his
retirement as an employee of John Keells
Holdings PLC.
Mr. S. C. Ratnayake was appointed to the
Board as a Non Independent Non Executive
Director and Chairman of the Company with
effect from 01st January 2018.
Retirement and Re - election / Re - appointment of DirectorsIn terms of Article 84 of the Articles of
Association of the Company, Mr. H. A. J. De
Silva Wijeyeratne and Mr. S. Rajendra retire
by rotation and are eligible for re - election.
A brief profile of the said Directors are given
on pages 106 and 107.
In terms of Article 90 of the Articles of
Association of the Company, Mr. S.C.
Ratnayake is eligible for re - election. A brief
profile of Mr. S.C. Ratnayake is given on
page 106.
Responsibility of the BoardDetails of responsibilities of the Board and
the manner in which those responsibilities
were discharged during the year are
disclosed in the Corporate Governance
section on page 114.
Review of Performance of the BoardThe performance of the Board has been
appraised through a formalised process,
where each individual Director anonymously
comments on the dynamics of the Board.
Board Sub CommitteesThe Board while assuming the overall
responsibility and accountability in the
management of the Company has also
appointed Board sub committees to ensure
control over certain affairs of the Company.
Details of the sub committees, their
mandate and composition are provided
in the Corporate Governance section on
pages 118 to 127.
Directors’ Interests RegisterThe Company, in compliance with the
requirements of the Companies Act No. 07
of 2007 maintains an Interests Register.
The particulars of the Company’s interest
register are given below.
a) Directors’ Interests in Transactions
The Directors of the Company have made
general declarations as provided for in
Section 192 (2) of the Companies Act.
Arising from this, details of contracts
in which they have an interest are
provided in Note 43 on page 254 to the
financial statements, under related party
transactions.
b) Directors’ Interests in Shares
The Directors’ individual shareholdings in
the Company is provided on page 63 of the
Annual Report.
c) Share Dealings
There have been no share dealings by the
Directors during the year.
d) Indemnities and Remuneration to Directors
Directors’ remuneration is established within
a framework approved by the Remuneration
Committee. The Directors are of the opinion
that the framework assures appropriateness
of remuneration and fairness for the
Company. The remuneration of the
Non - Executive Directors is determined
according to scales of payment decided
upon by the Board. Details of Directors’ fees
and emoluments paid during the year along
with the corresponding amounts for the
previous year are set out in Note 21 of the
financial statements.
The Board approved payment to the
Executive Director of the Company,
Mr. A. D. Pereira, remuneration as
recommended by the Board Remuneration
Committee in keeping with the Company’s
remuneration policy comprising of a fixed
element and a variable element in the form
of short term incentive which is based inter
alia, on the individual performance and the
organisation performance.
Directors’ MeetingsDetails of Board meetings and Board sub
committee meetings are presented on
pages 118 to 127 of the Annual Report.
Directors’ Responsibility for Financial ReportingThe Directors are responsible for the
preparation of the financial statements of
the Company to reflect a true and fair view
of the state of its affairs. The Directors are
of the view that these financial statements
have been prepared in conformity with the
requirements of the Sri Lanka Accounting
Standards (SLFRSs / LKASs) issued by the
Institute of Chartered Accountants of Sri
Lanka, Companies Act No. 7 of 2007, Sri
Lanka Accounting and Auditing Standards
Act No. 15 of 1995, Regulation of Insurance
Industry Act No. 43 of 2000 and the Listing
Rules of the Colombo Stock Exchange.
Related Party TransactionsThere are no related party transactions
which exceed the lower of 10% of equity
or 5% of the total assets of the Company.
Directors have disclosed the transactions
with related parties in terms of Sri Lanka
Accounting Standard LKAS 24 - Related
Party Disclosures, in Note 43 to the

UNION ASSURANCE PLC | ANNUAL REPORT 2017
172
ANNUAL REPORT OF THE BOARD OF DIRECTORS ON THE AFFAIRS OF THE COMPANY
financial statements and have complied
with Colombo Stock Exchange Listing Rule
9.3.2 and Code of Best Practice on Related
Party Transactions under the Securities and
Exchange Commission Directive issued
under Section 13 (C) of the Securities
Exchange Commission Act.
Compliance with the Transfer Pricing RegulationsAll transactions entered into with associated
persons during the period are on an
arm’s length basis, and are comparable
with transactions carried out with non -
associated persons.
DonationsThere were no donations made during
the year.
Corporate Social ResponsibilityThe Company manages a range of
programmes towards its stakeholders
in order to bring about sustainable
development in all areas of business. The
CSR initiatives are detailed in the Social and
Relationship Capital section on pages 66
to 76.
Compliance with Laws and RegulationsThe Company has complied with all
applicable laws and regulations. A
compliance checklist is signed off on a
monthly basis by responsible officers and
any violations are reported to the Board
Audit and Compliance Committee. Refer
page 110 for a statement of compliances.
Risk Based Capital Requirement (RBC)With effect from 1st January 2016 all
insurance companies were required to
maintain a capital amount as computed
under the risk based capital framework
introduced by the IRCSL or Rs. 500 million
whichever is higher. From the first quarter of
2016 onwards, the Company reported RBC
requirements on a quarterly basis within
the reporting time lines. Refer page 159 for
details on RBC of the Company.
Integrated Corporate ReportingThe integrated annual report has been
prepared in accordance with the Integrated
Reporting Framework of the International
Integrated Reporting Council (IIRC). The
Board Audit and Compliance Committee
has reviewed the framework presented
in this Annual Report and based on their
recommendation, the Board has adopted
the framework as a transparent basis to
report the Company’s activities and results
to all stakeholder groups.
SustainabilityThe Company is aware of the need
to pursue its business goals from a
stakeholder perspective of business
governance. Hence, through the structured
stakeholder engagement process, the
Company has identified material issues
in relation to each stakeholder group and
endeavours to achieve its business goals
with due respect to all stakeholder needs.
This integrated Annual Report, combining
financial information with sustainability
information aims to provide its stakeholders
a more holistic set of information.
Messrs. KPMG has issued an assurance of
the financial performance data disclosed
and the content of the report which
represents the Company’s sustainability
policies, objectives, management approach
and performance, and as prepared under
the requirements of the GRI Standards.
The report has also gone through a GRI
Materiality Disclosures Service.
Human ResourcesThe Company continued to implement
appropriate human resource management
policies to develop employees and optimize
their contribution towards the achievement
of corporate objectives. These policies and
procedures ensure the equitable treatment
of all employees. The Company also adopts
equality of opportunity for all employees
irrespective of ethnic origin, religion,
political opinion, gender, marital status or
physical disability. Some of the processes
and procedures adopted in this regard are
mentioned in the Human Capital report on
page 77. The number of persons employed
by the Company as at 31st December 2017
was 529 (2016 - 474).
There were no material issues pertaining
to employees and industrial relations of the
Company during the year under review.
Code of ConductThe Company demands impeccable
standards of conduct from its Directors
and employees in the performance of their
official duties and in situations that could
affect the Company’s image. The Company
has also implemented a code of conduct
for field staff covering their responsibility,
commitment and level of service to the
client. During the year no material violations
of the code was noted.
Environment ProtectionInitiatives taken by the Company to
preserve the environment are presented in
the Natural Capital report on page 95. The
Company has not engaged in any activity
that is harmful to the environment.
Supplier PolicyThe Company applies an overall policy of
agreeing and clearly communicating terms
of payments as part of the commercial
agreements negotiated with suppliers, and
endeavours to pay for all items properly
charged in accordance with those agreed
terms. As at 31st December 2017, the other
payments of the Company amounted to
Rs. 1,564 million (2016 - Rs. 1,166 million).
Statutory PaymentsThe Directors, to the best of their knowledge
and belief are satisfied that all statutory
payments due to the government, other
regulatory institutions and in relation to
employees as at the reporting date have
been paid or, where relevant provided for,

173
UNION ASSURANCE PLC | ANNUAL REPORT 2017
FIN
AN
CIA
L IN
FO
RM
ATIO
N
except as detailed in Note 46 to the financial
statements, relating to contingent liabilities.
Capital CommitmentsNo significant capital commitments exist
as at 31st December 2017 other than
those disclosed in Note 44 to the financial
statements.
Contingencies and Outstanding LitigationIn the opinion of the Directors and in
consultation with the Company lawyers,
litigation currently pending against the
Company will not have a material impact
on the reported financial results or future
operations of the Company.
Events after the Reporting DateThere have been no events subsequent to
the reporting date, which would have any
material effect on the Company, other than
those disclosed in Note 45 to the financial
statements.
Going ConcernAfter considering the financial position,
operating conditions, regulatory and other
factors and such matters required to be
addressed in the Code of Best Practice on
Corporate Governance, issued jointly by
the ICASL and the SEC of Sri Lanka, the
Directors have a reasonable expectation
that the Company possesses adequate
resources to continue in operation for
the foreseeable future. For this reason,
the going concern basis is adopted in
preparing the financial statements.
AuditorsThe Company’s external auditors during the
period under review were Messrs. KPMG.
The fee amount paid / payable for the
services provided to the Company during
the year 2017 and 2016 is presented below.
Rs.’000 2017 2016
Audit and audit
related fees 4,355 4,271
Non audit fees 1,332 1,208
Independence of AuditorsBased on the declaration from Messrs.
KPMG, and as far as the Directors are
aware, the auditors do not have any
relationship or interest other than that of an
Auditor in the Company.
Re - Appointment of AuditorsThe retiring auditor Messrs. KPMG have
intimated their willingness to continue in
office and a resolution to re - appoint them
as auditors and authorising the Directors to
fix their remuneration will be proposed at
the Annual General Meeting.
Auditors’ ReportAuditors’ Report on the financial statements
is given on page 177 of this annual report.
Approval of Financial StatementsThe audited financial statements were
approved by the Board of Directors on
29 March 2018. The appropriate number
of copies of this report will be submitted to
the Colombo Stock Exchange and to the Sri
Lanka Accounting and Auditing Standards
Monitoring Board.
Annual General MeetingThe Annual General Meeting will be held
at the Auditorium of Union Assurance PLC,
No. 20, St. Michael’s Road, Colombo 3, on
Wednesday, 9th May 2018 at 9.00 a.m. The
notice of the meeting relating to the thirty
first Annual General Meeting is given on
page 284.
This Annual Report is signed for and on
behalf of the Board of Directors by:
S. C. Ratnayake
Chairman
A. S. De Zoysa
Director
Keells Consultants (Private) Limited
Secretaries
29 March 2018

UNION ASSURANCE PLC | ANNUAL REPORT 2017
174
CHIEF EXECUTIVE OFFICER'S AND CHIEF FINANCIAL OFFICER'S RESPONSIBILITY STATEMENTThe financial statements of Union
Assurance PLC as at 31st December 2017
are prepared and presented in compliance
with the following;
Sri Lanka Accounting Standards
(SLFRSs / LKASs) issued by the Institute
of Chartered Accountants of Sri Lanka
(ICASL)
Requirements of the Companies Act
No. 7 of 2007
Sri Lanka Accounting and Auditing
Standards Act No 15 of 1995
Listing rules of the Colombo Stock
Exchange (CSE)
The Regulation of Insurance Industry
(RII) Act No. 43 of 2000 and subsequent
amendments thereto
Code of best practice on corporate
governance issued jointly by the ICASL
and the Securities and Exchange
Commission of Sri Lanka (SEC)
Accordingly, the Company has prepared
the financial statements which comply with
SLFRSs / LKASs and related interpretations
applicable for the year ended 31st December
2017, together with the comparative data
as at and for the year ended 31st December
2016, where required, as described in the
accounting policies.
The accounting policies used in the
preparation of the financial statements
are appropriate and are consistently
applied, unless otherwise stated in
the notes accompanying the financial
statements. There have been no changes
in the accounting policies adopted by the
company during the year under review.
The accounting policies applicable to
Fairfirst Insurance Limited, the associate
company of Union Assurance PLC have
been disclosed separately in Note 27 to the
financial statements.
Significant accounting policies and
estimates that involve a high degree of
judgment and complexity were discussed
with our external auditors and the Board
Audit and Compliance Committee (BACC).
We confirm that to the best of our knowledge,
the financial statements and other financial
information included in this annual report,
fairly present in all material respects the
financial position, results of operations and
cash flows of the Company as of, and for, the
periods presented in this Annual Report.
We are responsible for establishing
and maintaining internal controls and
procedures. We have designed such
controls and procedures, or caused
such controls and procedures to be
designed under our supervision, to ensure
that material information relating to the
Company is made known to us and for
safeguarding the Company’s assets and
preventing and detecting fraud and error.
We have evaluated the effectiveness of the
Company’s internal controls and procedures
and are satisfied that the controls and
procedures were effective as of the end of
the period covered by this annual report
and on an ongoing basis.
We confirm, based on our evaluations
that there were no significant deficiencies
and material weaknesses in the design
or operation of internal controls and any
fraud that involves management or other
employees.
Our Internal Auditors also conduct periodic
reviews to ensure that the internal controls
and procedures are consistently followed.
The financial statements were audited by
Messrs. KPMG, Chartered Accountants,
Independent Auditors.
The BACC pre - approves the audit and
non - audit services provided by Messrs.
KPMG, in order to ensure that the provision
of such services does not impair KPMG’s
independence. The BACC also reviews the
external audit plan, the internal audit plan,
all internal audit reviews and management
letters and follows up on any issues raised
during the statutory audit as well as the
internal audits. The BACC also meets with
the external and internal auditors to review
the effectiveness of the audits.
We confirm that the company has complied
with all applicable laws and regulations and
guidelines and that there are no material
litigations that are pending against the
Company other than those arising in the
normal course of conducting insurance
business. We also confirm that the
Company has complied with the following
Insurance Regulatory Commission of Sri
Lanka (IRCSL) requirements;
All provisions in the RII Act No. 43 of
2000, and subsequent amendments
there to, and all rules, regulations,
determinations, directions issues by
IRCSL; complied with all orders made
by the Ministry of Finance and Planning
under the RII Act, No. 43 of 2000
Terms and conditions pertaining to
reinsurance placements issued by
IRCSL in terms of section 31(1) of the
RII Act, No. 43 of 2000
Conditions pertaining to co - insurance
issued by IRCSL
All applicable circulars issued by IRCSL
All provisions in the Financial Transactions
Reporting Act, No. 06 of 2006
Rules on Know Your Customer (KYC)
and Customer Due Diligence (CDD) for
the Insurance Industry issued by the
Financial Intelligence Unit established
under the Financial Transactions
Reporting Act, No. 06 of 2006
Guidelines on Anti Money Laundering
Programme for Insurers issued by IRCSL
Dirk Pereira
Chief Executive Officer
Sherin Cader
Chief Financial Officer
29 March 2018

175
UNION ASSURANCE PLC | ANNUAL REPORT 2017
FIN
AN
CIA
L IN
FO
RM
ATIO
NACTUARY'S REPORT
Private and Confidential
29 March 2018
The Board of Directors
Union Assurance PLC
No 20, St. Michael's Road,
Colombo 03,
Sri Lanka
Actuarial Valuation of the Long Term Insurance Business as at 31 December 2017
In accordance with the engagement letter dated 9 September 2015, Willis Towers Watson India Private Limited (”Willis Towers Watson”, “we”, “our” or
“us”), formerly called Towers Watson India Private Limited has carried out an actuarial review of the valuation of long term insurance liabilities of Union
Assurance PLC’s Long Term Insurance Business as at 31 December 2017.
We hereby certify that:
1. Reasonable steps have been taken by the Company to ensure that data used for the actuarial valuation of the liabilities of the Long Term Insurance
Fund is complete and accurate;
2. Adequate and proper reserves have been provided as at 31 December 2017, for all liabilities in respect of the Long Term Insurance Fund, taking
into account all current and contingent liabilities as at that date.
3. The total long term insurance provisions maintained within the life fund for conventional business is LKR24,932 million. The value of assets held in
respect of conventional life business is LKR 26,265 million. Therefore, surplus in respect of the conventional life business after making an allowance
for a shareholder transfer of LKR 6,832 million is LKR 1,334 million. The surplus in respect of the conventional business before shareholder transfer
is LKR 8,166 million.
4. The total long term insurance provisions within the life fund for the non-unit liabilities in respect of unit-linked business is LKR9 million. The value
of assets (other than assets backing unit-linked liabilities) held in respect of this business is LKR26 million. Therefore, surplus in respect of the
unit-linked business after making an allowance for a shareholder transfer of LKR 192 million is LKR 18 million. The surplus in respect of the
unit-linked business before shareholder transfer is LKR 209 million.
5. The shareholder transfers mentioned above includes transfer of the one-off surplus in respect of other than participating business of LKR 3,382
million. However, it should be noted that the distribution of the one-off surplus to shareholders is subject to meeting governance requirements
stipulated by the IRCSL and can only be released upon receiving approval from the IRCSL.
6. The risk based capital required under the Regulation of Insurance Industry Act No. 43 of 2000 is LKR 4,702 million, and company’s CAR
(after allowing for the LKR 7,024 million shareholder transfer) is 352%, compared to the regulatory minimum requirement of 120%.
7. We have undertaken a liability adequacy test for long term insurance provisions maintained within the life fund of Union Assurance PLC as
contemplated by SLFRS 4. In carrying out the liability adequacy test, we have compared the provisions held as per the audited accounts with
the actuarial liability. For this purpose, the value of the actuarial liability is determined following the principles laid out within the risk based capital
framework as prescribed by the IBSL [the Solvency Margin (Risk Based Capital) Rules 2015]. Based on this test, we conclude that the long term
insurance provisions maintained within the life fund of Union Assurance PLC as per the audited accounts of the Company for the year ended
31 December 2017 is in excess of the liabilities computed in the above mentioned manner.
Vivek Jalan, FIA, FIAI
Director and Practice Leader, Insurance Consulting, India,
Willis Towers Watson

UNION ASSURANCE PLC | ANNUAL REPORT 2017
176
STATEMENT OF DIRECTORS' RESPONSIBILITYThe responsibility of the Directors in relation
to the financial statements is set out in
the following statement. The responsibility
of the Auditors in relation to the financial
statements prepared in accordance with
the provision of the Companies Act No. 7 of
2007 is set out in the Report of the Auditors
on page 177. As per the provisions of the
Companies Act No. 7 of 2007 the Directors
are required to prepare, for each financial
year and place before a general meeting,
financial statements which comprise of;
a statement of income and statement of
profit or loss and other comprehensive
income of the Company which present a
true and fair view of the profit or loss of
the Company for the financial year; and
a statement of financial position, which
presents a true and fair view of the state
of affairs of the Company as at the end
of the financial year; and
a statement of changes in equity; and
a statement of cash flows for the year
then ended and notes to the financial
statements
The Directors have ensured that, in
preparing these financial statements;
the appropriate accounting policies
have been selected and applied in
a consistent manner and material
departures, if any, have been disclosed
and explained; and
all applicable accounting standards
in accordance with the Sri Lanka
Accounting Standards (SLFRSs / LKASs)
as relevant have been applied; and
reasonable and prudent judgments and
estimates have been made so that the
form and substance of transactions are
properly reflected; and
it provides the information required
by and otherwise complies with
the Companies Act No. 7 of 2007,
Regulation of Insurance Industry
Act No. 43 of 2000 and subsequent
amendments thereto and the Listing
Rules of the Colombo Stock Exchange
and requirements of any other
regulatory authority as applicable to the
Company.
The Directors have also ensured that the
Company has adequate resources to
continue in operation to justify applying the
going concern basis in preparing these
financial statements.
Further, the Directors have a responsibility
to ensure that the Company maintains
sufficient accounting records to disclose,
with reasonable accuracy the financial
position of the Company.
The Directors are also responsible for taking
reasonable steps to safeguard the assets
of the Company and in this regard to give
proper consideration to the establishment of
appropriate internal control systems with a
view to preventing and detecting fraud and
other irregularities.
The Directors are required to prepare the
financial statements and to provide the
auditors with every opportunity to take
whatever steps and undertake whatever
inspections they may consider to be
appropriate to enable them to give their
audit opinion.
Further, as required by Section 56 (2) of the
Companies Act No. 7 of 2007, the Board of
Directors have confirmed that the Company,
based on the information available, satisfies
the solvency test immediately after the
distribution, in accordance with Section
57 of the Companies Act No. 7 of 2007,
and have obtained a certificate from the
Auditors, prior to declaring a final dividend
of Rs. 18.00 per share for the year ended
31st December 2017, paid on 20th March
2018.
The Directors are of the view that they have
discharged their responsibilities as set out
in this statement.
Compliance ReportThe Directors confirm that to the best of
their knowledge, all taxes, duties and levies
payable by the Company, all contributions
levies and taxes payable on behalf of and in
respect of the employees of the Company,
and all other known statutory dues as were
due and payable by the Company as at the
reporting date have been paid or, where
relevant provided for except as detailed in
Note 46 to the financial statements, relating
to contingent liabilities.
By order of the Board
Keells Consultants (Private) Limited
Secretaries
29 March 2018

177
UNION ASSURANCE PLC | ANNUAL REPORT 2017
FIN
AN
CIA
L IN
FO
RM
ATIO
NINDEPENDENT AUDITORS' REPORT
TO THE SHAREHOLDERS OF UNION ASSURANCE PLC
Report on the Financial StatementsWe have audited the accompanying
financial statements of Union Assurance
PLC, (“the Company”), which comprise the
statement of financial position as at
31 December 2017, and the income
statement, statements of profit or loss and
other comprehensive income, changes in
equity and, cash flows for the year then
ended, and a summary of significant
accounting policies and other explanatory
information set out on pages 179 to 258 of
this Annual Report.
Board’s Responsibility for the Financial Statements The Board of Directors (“Board”) is
responsible for the preparation of these
financial statements that give a true and
fair view in accordance with Sri Lanka
Accounting Standards, and for such internal
control as Board determines is necessary
to enable the preparation of financial
statements that are free from material
misstatement, whether due to fraud or error.
Auditors’ ResponsibilityOur responsibility is to express an opinion
on these financial statements based
on our audit. We conducted our audit
in accordance with Sri Lanka Auditing
Standards. Those standards require that
we comply with ethical requirements
and plan and perform the audit to obtain
reasonable assurance about whether the
financial statements are free from material
misstatement.
An audit involves performing procedures
to obtain audit evidence about the
amounts and disclosures in the financial
statements. The procedures selected
depend on the auditors’ judgment,
including the assessment of the risks of
material misstatement of the financial
statements, whether due to fraud or error.
In making those risk assessments, the
auditor considers internal control relevant
to the entity’s preparation of the financial
statements that give a true and fair view in
order to design audit procedures that are
appropriate in the circumstances, but not
for the purpose of expressing an opinion
on the effectiveness of the entity’s internal
control. An audit also includes evaluating
the appropriateness of accounting policies
used and the reasonableness of accounting
estimates made by Board, as well as
evaluating the overall presentation of the
financial statements.
We believe that the audit evidence we have
obtained is sufficient and appropriate to
provide a basis for our audit opinion.
OpinionIn our opinion, the financial statements give
a true and fair view of the financial position
of the Company as at 31 December 2017,
and of its financial performance and cash
flows for the year then ended in accordance
with Sri Lanka Accounting Standards.
Report on Other Legal and Regulatory RequirementsAs required by section 163 (2) of the
Companies Act No. 07 of 2007, we state the
following:
a) The basis of opinion and scope and
limitations of the audit are as stated
above.
b) In our opinion we have obtained all
the information and explanations that
were required for the audit and, as
far as appears from our examination,
proper accounting records have been
kept by the Company and the financial
statements of the Company, comply
with the requirements of section 151 of
the Companies Act.
As required by Section 47(2) of the
Regulation of Insurance Industry Act,
No.43 of 2000, as far as appears from our
examination, the accounting records of
the Company have been maintained in the
manner required by the rules issued by the
Insurance Regulatory Commission of Sri
Lanka (formally known as Insurance Board
of Sri Lanka), so as to clearly indicate the
true and fair view of the financial position of
the Company.
CHARTERED ACCOUNTANTS
Colombo
29 March 2018

UNION ASSURANCE PLC | ANNUAL REPORT 2017
178
TABLE OF CONTENTS
Page
Primary Financial Statements
Income Statement 179
Statement of Profit or Loss and
Other Comprehensive Income 180
Statement of Financial Position 181
Statement of Changes in Equity 182
Statement of Cash Flows 184
Notes to the Financial Statements
1 Corporate Information 186
2 Basis of Preparation 187
3 Significant Accounting Judgements, Estimates
and Assumptions 187
4 Operating Segments 188
5 Standards Issued but Not Yet Effective 188
6 Summary of Significant Accounting Policies 190
7 Financial Risk Management 191
8 Fair Value Measurement and Related
Fair Value Disclosures 205
9 Financial Assets and Liabilities 208
Income Statement
10 Gross Written Premium (GWP) 212
11 Premium Ceded to Reinsurers 213
12 Net Investment Income 214
13 Net Realised Gains / Losses 215
14 Net Fair Value Gains / (Losses) 216
15 Other Income 216
16 Net Insurance Benefits and Claims Paid 216
17 Net Change in Insurance Claims Outstanding 217
18 Change in Contract Liabilities - Life Fund 218
19 Underwriting and Net Acquisition Costs
(Net of Reinsurance) 218
20 Other Operating, Administrative and Selling Expenses 218
21 Profit Before Tax 219
22 Income Tax Expense 219
23 Earnings per Share 224
24 Dividends per Share 224
Page
Statement of Financial Position
Assets
25 Intangible Assets 225
26 Property, Plant and Equipment 226
27 Investment in Equity Accounted Investee 230
28 Financial Investments (Including Derivatives) 234
29 Loans to Life Policyholders 241
30 Reinsurance Receivable 242
31 Premiums Receivable 243
32 Receivables and Other Assets 243
33 Cash in Hand and at Bank 244
Equity
34 Stated Capital 245
35 Restricted Regulatory Reserve 245
36 Reserves 245
37 Retained Earnings 247
Liability
38 Insurance Contract Liabilities 248
39 Insurance Contract Liabilities - Unit Linked 252
40 Employee Benefits Liabilities 252
41 Reinsurance Payables 253
42 Other Liabilities 254
Other Disclosures
43 Related Party Disclosures 254
44 Commitments 257
45 Events After the Reporting Date 257
46 Provisions and Contingencies 258
47 Comparative Information 258
48 Directors’ Responsibility 258

179
UNION ASSURANCE PLC | ANNUAL REPORT 2017
FIN
AN
CIA
L IN
FO
RM
ATIO
NINCOME STATEMENT
For the year ended 31 December 2017 2016 ChangeNote Page Rs. ‘000 Rs. ‘000 %
Gross written premium 10 212 10,117,630 8,270,751 22
Premium ceded to reinsurers 11 213 (497,612) (423,857) 17
Net written premium 9,620,018 7,846,894 23
Other revenue
Net investment income 12 214 3,636,008 3,025,094 20
Net realised gains / (losses) 13 215 75,591 (131,948) 157
Net fair value gains / (losses) 14 216 258,360 (34,751) 843
Other income 15 216 63,176 58,653 8
Total other revenue 4,033,135 2,917,048 38
Total net revenue 13,653,153 10,763,942 27
Benefits, claims and expenses
Net insurance benefits and claims paid 16 216 (2,673,733) (1,524,310) 75
Net change in insurance claims outstanding 17 217 (5,302) (71,075) (93)
Change in contract liabilities - Life Fund 18 218 (2,709,661) (4,238,265) (36)
Change in contract liability due to transfer of one off surplus 35 / 38 245 / 248 3,381,934 - 100
Underwriting and net acquisition costs (net of reinsurance) 19 218 (1,841,151) (1,441,617) 28
Other operating, administrative and selling expenses 20 218 (2,504,333) (2,064,793) 21
Depreciation and amortisation 25 / 26 225 / 226 (104,623) (110,890) (6)
Total benefits, claims and expenses (6,456,869) (9,450,950) (32)
Profit from operations 7,196,284 1,312,992 448
Share of results of equity accounted investee, net of tax 27 230 187,844 60,315 211
Profit before tax 21 219 7,384,128 1,373,307 438
Income tax expense 22 219 - (60,679) (100)
Profit for the year 7,384,128 1,312,628 463
Earnings per share
Basic (Rs.) 23 224 125.31 22.27 463
Diluted (Rs.) 23 224 125.31 22.27 463
The notes to the financial statements as set out on pages 186 to 258 form an integral part of these financial statements.

UNION ASSURANCE PLC | ANNUAL REPORT 2017
180
STATEMENT OF PROFIT OR LOSS AND OTHER COMPREHENSIVE INCOMEFor the year ended 31 December 2017 2016 Change
Note Page Rs. ‘000 Rs. ‘000 %
Profit for the year 7,384,128 1,312,628 463
Other comprehensive income
Items that will never be reclassified to profit or loss
Net gains on revaluation of land and buildings 26.8 / 36.1 (b) 229 / 245 539,365 -
Share of net change in actuarial gains / (losses) on defined
benefit plan of equity accounted investee, net of tax 36.2 (b) 246 (2,291) 4,348
Actuarial losses on defined benefit plan 36.2 (b) / 40.3 246 / 253 (4,271) (4,861)
Related tax 36.1 (b) / 36.2 (b) 245 / 246 - 2,878
532,803 2,365 22,429
Items that are or may be reclassified to profit or loss
Fair value reserve (available for sale financial assets)
Net change in fair value of available for sale financial assets 80,850 (24,749)
Share of net change in fair value of available for sale financial
assets of equity accounted investee, net of tax 36.2 (a) 246 32,823 (23,533)
Net change in fair value of available for sale financial assets
transferred to the income statement - -
Related tax - 6,930
113,673 (41,352) 375
Net change in liabilities of insurance contracts arising from fair
value changes in available for sale financial assets 652,979 (431,771)
Net change in fair value of available for sale financial assets of
insurance liabilities transferred to the income statement 36.2 (a) 246 23,666 (48)
Related tax - 50,871
676,645 (380,948) 278
790,318 (422,300) 287
Other comprehensive income, net of tax 1,323,121 (419,935) 415
Total comprehensive income for the year, net of tax 8,707,249 892,693 875
The notes to the financial statements as set out on pages 186 to 258 form an integral part of these financial statements.

181
UNION ASSURANCE PLC | ANNUAL REPORT 2017
FIN
AN
CIA
L IN
FO
RM
ATIO
NSTATEMENT OF FINANCIAL POSITION
As at 31 December 2017 2016Note Page Rs. ‘000 Rs. ‘000
Assets
Intangible assets 25 225 212,817 94,647
Property, plant and equipment 26 226 2,000,716 1,493,040
Investment in equity accounted investee 27 230 995,722 777,346
Financial investments, including derivatives 28 234 36,792,921 30,847,256
Loans to life policyholders 29 241 1,001,538 867,177
Reinsurance receivable 30 242 267,417 178,181
Premiums receivable 31 243 268,511 246,800
Receivables and other assets 32 243 947,239 809,784
Cash in hand and at bank 33 244 580,126 379,232
Total assets 43,067,007 35,693,463
Equity and liabilities
Equity
Stated capital 34 245 1,000,000 1,000,000
Restricted regulatory reserve 35 245 3,381,934 -
Reserves 36 245 2,144,728 817,003
Retained earnings 37 247 5,438,052 2,049,189
Total equity 11,964,714 3,866,192
Liabilities
Insurance contract liabilities 38 248 26,949,613 27,889,682
Insurance contract liabilities - Unit Linked 39 252 2,121,609 2,377,707
Employee benefit liabilities 40 252 122,588 107,963
Reinsurance payables 41 253 345,146 208,742
Other liabilities 42 254 1,368,031 1,092,871
Bank overdraft 33 244 195,306 150,306
Total liabilities 31,102,293 31,827,271
Total equity and liabilities 43,067,007 35,693,463
The notes to the financial statements as set out on pages 186 to 258 form an integral part of these financial statements.
I certify that the above financial statements comply with the requirements of the Companies Act No. 07 of 2007.
S. Cader
Chief Financial Officer
The Board of Directors is responsible for the preparation and presentation of these financial statements.
Signed on behalf of the Board:
S. C. Ratnayake H. A. J. De Silva Wijeyeratne
Chairman Director
Colombo
29 March 2018

UNION ASSURANCE PLC | ANNUAL REPORT 2017
182
STATEMENT OF CHANGES IN EQUITY
Reserves
Stated capital
Restricted regulatory
reserve
Revaluation reserve
Reserve on merger
Other reserves
Retained earnings Total
Rs. ‘000 Note
Available for sale reserve
Other capital
reserves
Balance as at 1 January 2016 1,000,000 - 1,158,265 16,752 45,425 12,451 1,232,035 3,464,928
Profit for the year - - - - - - 1,312,628 1,312,628
Other comprehensive income for the year, net of tax
Net change in fair value of available for
sale financial assets - - - - (24,749) - - (24,749)
Net change in liabilities of insurance
contracts arising from fair value changes
in available for sale financial assets - - - - (431,819) - - (431,819)
Actuarial loss on defined benefit plan 36.2 (b)
/ 40.3
- - - - - (4,861) - (4,861)
Share of net change in fair value of
available for sale financial assets of
equity accounted investee, net of tax 36.2 (a) - - - - (23,533) - - (23,533)
Share of net change in actuarial gains
on defined benefit plan of equity
accounted investee, net of tax 36.2 (b) - - - - - 4,348 - 4,348
Tax on other comprehensive
income
36.1 (b) /
36.2 (a) / 36.2 (b) - - 1,517 - 57,801 1,361 - 60,679
Total other comprehensive income - - 1,517 - (422,300) 848 - (419,935)
Total comprehensive income for the year - - 1,517 - (422,300) 848 1,312,628 892,693
Transactions with owners, transfers, recorded directly in equity
Contributions and distributions
First and final dividend 2015 24.2 - - - - - - (500,893) (500,893)
Share based payments 36.3 - - - - - 9,464 - 9,464
Transfer from revaluation reserve to
retained earnings
26.10 /
36.1 (b) - - (5,419) - - - 5,419 -
Total contributions and distributions - - (5,419) - - 9,464 (495,474) (491,429)
Balance as at 31 December 2016 1,000,000 - 1,154,363 16,752 (376,875) 22,763 2,049,189 3,866,192

183
UNION ASSURANCE PLC | ANNUAL REPORT 2017
FIN
AN
CIA
L IN
FO
RM
ATIO
N
Reserves
Stated capital
Restricted regulatory
reserve
Revaluation reserve
Reserve on merger
Other reserves
Retained earnings Total
Rs. ‘000 Note
Available for sale reserve
Other capital
reserves
Balance as at 1 January 2017 1,000,000 - 1,154,363 16,752 (376,875) 22,763 2,049,189 3,866,192
Profit for the year - - - - - - 7,384,128 7,384,128
Other comprehensive income for the year, net of tax
Net change in fair value of available for
sale financial assets - - - - 80,850 - - 80,850
Net change in liabilities of insurance
contracts arising from fair value changes
in available for sale financial assets - - - - 676,645 - - 676,645
Revaluation gains on land and buildings 26.8 /
36.1 (b)
- - 539,365 - - - - 539,365
Actuarial loss on defined benefit plan 36.2 (b)
/ 40.3
- - - - - (4,271) - (4,271)
Share of net change in fair value of
available for sale financial assets of
equity accounted investee, net of tax 36.2 (a) - - - - 32,823 - - 32,823
Share of net change in actuarial losses
on defined benefit plan of equity
accounted investee, net of tax 36.2 (b) - - - - - (2,291) - (2,291)
Tax on other comprehensive
income
36.1 (b) /
36.2 (a) / 36.2 (b) - - - - - - - -
Total other comprehensive income - - 539,365 - 790,318 (6,562) - 1,323,121
Total comprehensive income for the year - - 539,365 - 790,318 (6,562) 7,384,128 8,707,249
Transactions with owners, transfers, recorded directly in equity
Contributions and distributions
First and final dividend 2016 24.2 - - - - - - (618,750) (618,750)
Share based payments 36.3 - - - - - 10,023 - 10,023
Transfer of one - off surplus 35 / 38.6 - 3,381,934 - - - - (3,381,934) -
Transfer from revaluation reserve to
retained earnings
26.10 /
36.1 (b) - - (5,419) - - - 5,419 -
Total contributions and distributions - 3,381,934 (5,419) - - 10,023 (3,995,265) (608,727)
Balance as at 31 December 2017 1,000,000 3,381,934 1,688,309 16,752 413,443 26,224 5,438,052 11,964,714
The notes to the financial statements as set out on pages 186 to 258 form an integral part of these financial statements.

UNION ASSURANCE PLC | ANNUAL REPORT 2017
184
STATEMENT OF CASH FLOWS
For the year ended 31 December 2017 2016Note Page Rs. ‘000 Rs. ‘000
Cash flows from operations
Insurance premiums received 10,095,919 8,227,672
Reinsurance premiums paid (361,208) (428,970)
Insurance benefits and claims paid 16 216 (2,828,188) (1,682,170)
Reinsurance claims received 16 216 154,455 157,860
Payments to intermediaries to acquire insurance contracts (1,793,544) (1,430,821)
Cash paid to and on behalf of employees (925,873) (841,087)
Interest received 2,990,027 2,324,369
Dividends received 121,026 102,922
Other operating cash flows (2,139,507) (1,401,971)
Cash generated from operating activities A 185 5,313,107 5,027,804
Retiring gratuity paid 40.3 253 (12,408) (20,430)
Retiring gratuity transfer 40.3 253 - 2,385
Interest paid on obligation to repurchase securities - (6,750)
Net cash flow from operating activities 5,300,699 5,003,009
Cash flows used in investing activities
Acquisition of investments (30,401,850) (48,477,502)
Maturity proceeds of investments 24,067,766 42,013,532
Proceeds from sale of investments 1,986,068 2,075,057
Acquisition of property, plant and equipment 26.1 228 (40,357) (53,000)
Acquisition of intangible assets 25.1 225 (151,196) (65,397)
Proceeds on sale of property, plant and equipment 36 156
Net cash used in investing activities (4,539,533) (4,507,154)
Net cash inflow before financing activities 761,166 495,855
Cash flows used in financing activities
Dividends paid to equity holders of the company (559,272) (453,197)
Dividend tax paid (23,699) (10,659)
Net cash used in financing activities (582,971) (463,856)
Net increase in cash and cash equivalents 178,195 31,999
Cash and cash equivalents at the beginning of the year 239,059 207,060
Cash and cash equivalents at the end of the year B / 33.2 185 / 244 417,254 239,059
The notes to the financial statements as set out on pages 186 to 258 form an integral part of these financial statements.

185
UNION ASSURANCE PLC | ANNUAL REPORT 2017
FIN
AN
CIA
L IN
FO
RM
ATIO
N
For the year ended 31 December 2017 2016Note Page Rs. ‘000 Rs. ‘000
NOTE A.
Reconciliation of profit before taxation with cash from operating activities
Profit before tax 7,384,128 1,373,307
Non - cash items included in profit before tax
Depreciation and amortisation 25.1 / 26.1 225 / 228 104,623 110,890
Provision for employee benefits 40.3 253 22,762 20,948
Provision for doubtful debts 32.1 (a) / 32.2 (a) 244 541 732
Net realised (gains) / losses 13 215 (75,591) 131,948
Net fair value (gains) / losses 14 216 (258,360) 34,751
(Gain) / losses on sale of property, plant and equipment 15 216 413 (83)
Amortisation of financial investments (310,000) (319,623)
Scrip dividend income (24,499) (26,531)
Share of results of equity accounted investee 27.1 233 (187,844) (60,315)
Interest expense on obligation to repurchase securities - 6,750
Share based payment expenses 36.3 247 10,023 9,464
Profit before working capital changes 6,666,196 1,282,238
Net change in operational assets
Net change in reinsurance assets / liabilities 47,168 (33,522)
Net change in premiums receivable (21,711) (43,078)
Net change in receivables and other assets (443,034) (404,595)
Net change in operational liabilities
Net change in life insurance contract liabilities (1,196,167) 3,994,928
Net change in other liabilities 260,655 231,833
Cash generated from operating activities 5,313,107 5,027,804
NOTE B.
Cash and cash equivalents at the end of the year
Cash in hand and at bank 33.1 244 580,126 379,232
Bank overdraft 33.2 244 (195,306) (150,306)
Short term deposits 33.2 244 32,434 10,133
Cash and cash equivalents 33.2 244 417,254 239,059
For the purpose of the cash flow statement, cash and cash equivalent consist of cash in hand & at bank and short - term deposits, net of
outstanding bank overdraft as shown above.
The notes to the financial statements as set out on pages 186 to 258 form an integral part of these financial statements.

UNION ASSURANCE PLC | ANNUAL REPORT 2017
186
NOTES TO THE FINANCIAL STATEMENTS1 Corporate Information
Reporting Entity
Union Assurance PLC (‘the Company’) is a public limited
liability company incorporated and domiciled in Sri Lanka
and the ordinary shares of the Company are listed on
the Colombo Stock Exchange. The registered office and
principal place of business of the Company is located
at Union Assurance Centre, No. 20, St. Michael’s Road,
Colombo 03.
For further information please refer page 283 of this
Annual Report.
Parent Entity and Ultimate Parent Entity
The Company’s controlling entity and ultimate parent
undertaking is John Keells Holdings PLC which is
incorporated in Sri Lanka.
Principal Activities and Nature of Operations
The Company
Union Assurance PLC is in the Life insurance business
providing Life insurance solutions for both Individual and
corporate customers. There were no significant changes in
the nature of the principal activities of the Company during
the financial year under review.
Associate Company
Union Assurance General Limited (UAGL) and Fairfirst
Insurance Limited (FIL) were amalgamated on 28 February
2017. Consequent to the above amalgamation, UAGL
ceased to exist as a legal entity, and FIL was recognised as
the continuing entity.
Accordingly, the Company’s shareholding in UAGL was
transferred to the amalgamated entity, Fairfirst Insurance
Limited, and remains unchanged at 22% (2016 - 22%).
Fairfirst Insurance Limited is in the non - life insurance
business and there were no significant change in the nature
of the principal activity of the associate during the year.
Number of Employees
The staff strength of the Company as at 31 December 2017
is 529 (2016 – 474).
Financial Statements
The financial statements for the year ended 31 December
2017, comprise of the Company and the results of the
equity accounted investee. The results of equity accounted
investee of the Company, Fairfirst Insurance Limited has
been presented in the financial statements in accordance
with LKAS 27.
Approval of Financial Statements
The financial statements for the year ended 31 December
2017 were authorised for issue by the Directors on
29 March 2018.
Responsibility for Financial Statements
The responsibility of the Board of Directors in relation to the
financial statements is set out in the Statement of Directors’
Responsibility report in the annual report.
Statement of Compliance
The financial statements have been prepared in accordance
with Sri Lanka Accounting Standards (SLFRSs / LKASs) as
issued by the Institute of Chartered Accountants of Sri Lanka
(ICASL), the requirements of the Companies Act No. 07 of
2007, Regulation of Insurance Industry (RII) Act No. 43 of
2000 and the listing rules of the Colombo Stock Exchange.
These financial statements include the following
components:
an Income Statement and Statement of Profit or Loss and
Other Comprehensive Income providing information on
the financial performance of the Company for the year
under review; (Refer pages 179 and 180)
a Statement of Financial Position providing information
on the financial position of the Company as at the year
end; (Refer page 181)
a Statement of Changes in Equity depicting all changes
in shareholders’ funds during the year under review of
the Company; (Refer pages 182 and 183)
a Statement of Cash Flows providing information to the
users, on the ability of the Company to generate cash
and cash equivalents and the needs of the entity to
utilise those cash flows; (Refer pages 184 and 185)
Notes to the financial statements comprising accounting
policies and other explanatory information. (Refer pages
186 to 258).
The Company has opted to defer full application of SLFRS
9 - Financial Instruments, until the earlier of 2021 or
adopting the SLFRS 17 - Insurance Contracts, exercising the
temporary exemption (Refer Note 5.1).

187
UNION ASSURANCE PLC | ANNUAL REPORT 2017
FIN
AN
CIA
L IN
FO
RM
ATIO
N
2 Basis of Preparation
Basis of Measurement
These financial statements have been prepared on an accruals basis and under the historical cost convention except for the following
material items, which are measured on an alternative basis on each reporting date:
Items Measurement basis Note Page
Non - derivative financial assets
at fair value through profit or loss Fair value 9.1 208
Derivative financial instruments Fair value 9.1 208
Available for sale financial assets Fair value 9.1 208
Financial assets - Unit linked Fair value 9.1 208
Freehold land and buildings Fair value 26.6 229
Insurance contract liabilities Actuarially valued in line with the guidelines issued by the
Insurance Regulatory Commission of Sri Lanka (IRCSL) 38 248
Net defined benefit liabilities Actuarially valued and recognised at present value 40 252
No adjustments have been made for inflationary factors affecting the financial statements.
Functional and Presentation Currency
The Financial Statements of the Company are presented in
Sri Lankan Rupees (LKR), which is the primary economic
environment in which the Company operates and is also the
Functional Currency.
There was no change in the Company’s Presentation and
Functional Currency during the year under review.
All values presented in rupees have been rounded to the
nearest rupees thousand (Rs’000), except when otherwise
indicated.
Materiality and Aggregation
Each item which is similar in nature is presented separately if
material. Items of dissimilar nature or function are presented
separately unless they are immaterial as permitted by the
Sri Lanka Accounting Standard LKAS 1 - Presentation of
financial statements.
Going Concern
The Directors have made an assessment of the Company’s
ability to continue as a going concern and is satisfied
that it has the resources to continue in business for the
foreseeable future. Furthermore, management is not aware
of any material uncertainties that may cast significant doubt
upon the Company’s ability to continue as a going concern.
Therefore, the financial statements continue to be prepared
on a going concern basis.
Supplementary Statements - Statement of Financial Position of the Life Insurance Fund
Supplementary statement of financial position of the Life
insurance fund together with the notes are disclosed in
pages 275 to 279, continuing the past practice which is a
requirement of the Statement of Recommended Practice
(SoRP) for insurance contracts then applicable, adopted by
the ICASL.
Comparative Information
The presentation and classification of assets and liabilities
in the financial statements of the previous year have been
amended, where relevant for better presentation and to be
comparable with those of the current year.
3 Significant Accounting Judgements, Estimates and AssumptionsIn preparing these financial statements, management has
made judgements, estimates and assumptions that affect the
application of the Company’s accounting policies and the
reported amounts of assets, liabilities, income and expenses.
Actual results may differ from these estimates.
Estimates and underlying assumptions are reviewed on
an ongoing basis. Revisions to estimates are recognised
prospectively.

UNION ASSURANCE PLC | ANNUAL REPORT 2017
188
NOTES TO THE FINANCIAL STATEMENTS
3.1 Information about judgements made in applying accounting policies that have the most significant effects on the amounts recognised
in the financial statements is included in the following notes:
Critical Accounting Estimates / Judgements Note Page
Impairment of financial assets: assessing whether credit risk on the financial asset has increased significantly
with initial recognition 9.1 208
Classification of financial assets 9.1 208
Classification of insurance, reinsurance and investment contracts: assessing whether the contract transfers
significant insurance risk and whether an insurance contract contains direct participation features 38.3 248
Revaluation of land and buildings 26.6 229
Measurement of insurance and reinsurance contracts 38.3 248
3.2 Information about assumptions and estimation uncertainties that have a significant risk of resulting in material adjustments to the
carrying amounts of assets and liabilities is included in the following notes:
Critical Accounting Estimates / Judgements Note Page
Impairment of financial assets 9.1 208
Determination of the fair value of financial instruments and investments and owner occupied properties with
significant unobservable inputs 26.7 229
Measurement of defined benefit obligations: key actuarial assumptions 40.4 253
Recognition and measurement of provisions and contingencies: key assumptions on the likelihood and
magnitude of an outflow of resources 46 258
Recognition of deferred tax assets: availability of future taxable profits against which tax losses carried forward
can be used 22.11 222
Impairment of non financial assets: key assumptions underlying recoverable amounts 6.1 191
Measuring insurance and reinsurance contracts 38.3 248
Liability Adequacy Test 38.7 251
Measurement of GWP accrual adjustment 10 212
Valuation of derivative financial instruments 9.1 208
4 Operating SegmentsFor management purposes the Company has only one
business segment, which is the life insurance business.
All operating results are reviewed regularly by the Chief
Executive Officer (CEO) and corporate management to
make decisions regarding resource allocation and assess its
performance, and for which financial information is available.
5 Standards Issued but Not Yet Effective The following new standards have been issued and are
effective for annual periods beginning after 1 January 2018.
Accordingly, these standards have not been applied to these
financial statements.
5.1 SLFRS 9 - Financial Instruments and SLFRS 17 - Insurance Contracts
SLFRS 9 is effective for annual periods beginning on or after
1 January 2018. It replaces LKAS 39 - Financial Instruments:
Recognition and Measurement.
Based on the proposed amendments to SLFRS 4 - Insurance
contracts (to be replaced by SLFRS 17), the entities whose
predominant activity is issuing insurance contracts are
permitted to defer the full application of SLFRS 9 until the
earlier of 2021 or adoption of SLFRS 17, which is currently
expected to commence in 2021.
An insurer may apply the temporary exemption from SLFRS
9 if, and only if:
(a) it has not previously applied any version of SLRFS 9,
other than only the requirements for the presentation of
gains and losses on financial liabilities designated as at
fair value through profit or loss
(b) its activities are predominantly connected with insurance,
as its annual reporting date that immediately precedes
1 April 2016, or at a subsequent annual reporting date.

189
UNION ASSURANCE PLC | ANNUAL REPORT 2017
FIN
AN
CIA
L IN
FO
RM
ATIO
N
Disclosures on Qualifying for the Temporary Exemptions Based on the proposed SLFRS 17 - Insurance Contracts, the
Company is permitted to apply the temporary exemption as
the Company meets the following eligibility criteria:
1 The Company has not applied SLFRS 9 before; and
2 The Company's activities are predominantly connected
with insurance as the ratio of its liabilities connected with
insurance, including investment contracts measured
at fair value through profit or loss, compared with total
liabilities is greater than 90%. Accordingly, the Company
qualifies as a pure insurance company.
As at 31 December 2017Rs. '000
2016Rs. '000
Insurance contract liabilities 26,949,613 27,889,682
Insurance contract liabilities -
Unit Linked 2,121,609 2,377,707
Reinsurance payables 345,146 208,742
Liabilities connected with
insurance 29,416,368 30,476,131
Total liabilities 31,102,293 31,827,271
Predominance ratio 95% 96%
Disclosures to Provide Comparability
Business Model Assessment
The Company will make an assessment of the objective
of the business model when a financial asset is held at a
portfolio level because this best reflects the way the business
is managed and information is provided to management.
i. Classification - Financial assets
SLFRS 9 contains a new classification and measurement
approach for financial assets that reflects the business
model in which assets are managed and their cash flow
characteristics.
SLFRS 9 includes three principal classification categories
for financial assets: measured at amortised cost, Fair value
through other comprehensive income (FVTOCI) and fair
value through profit or loss (FVTPL). It replaces the existing
four categories under LKAS 39 of held to maturity (HTM),
loans and receivables (L&R), fair value through profit or loss
(FVTPL) and available for sale (AFS).
The table below provides an initial assessment made by the
Company on its financial assets portfolio:
Financial assets that meet the Solely Payment of Principle and Interest (SPPI) Test (excluding the financial assets that meet the
definition of held for trading or managed and evaluated on a fair value basis).
InstrumentsCurrent classification
Credit risk grading
Carrying value under LKAS 39
Rs. '000
Fair value
Rs. '000
Classification under SLFRS 9
Treasury bonds HTM n/a 18,028,394 18,941,981 Amortised cost
Bank deposits L & R AA- 647,447 647,447 Amortised cost
Reverse repurchase agreements L & R n/a 610,277 610,277 Amortised cost
Debentures HTM / L & R Please refer Note
28.3 (a) & 28.4 (a)
4,916,292 5,025,976 Amortised cost
All other financial assets (that meet the definition of held for trading or managed and evaluated on a fair value basis)
Instruments Current classification
Carrying value under LKAS 39
Rs. '000
Fair value
Rs. '000
Classification under SLFRS 9
Equity shares FVTPL 3,972,950 3,972,950 FVTPL
Treasury bonds AFS / FVTPL 7,942,899 7,942,899 FVTOCI / FVTPL
Treasury bills AFS / FVTPL 281,340 281,340 FVTOCI / FVTPL

UNION ASSURANCE PLC | ANNUAL REPORT 2017
190
NOTES TO THE FINANCIAL STATEMENTS
Impact assessmentThe standard will affect the classification and measurement
of financial assets held, as follows;
Trading assets and derivative assets held for risk
management, which are classified as held for trading
and measured at fair value under LKAS 39, will also be
measured at fair value under SLFRS 9.
Loans and receivables measured at amortised cost
under LKAS 39 will also be measured at amortised cost
under SLFRS 9.
Held to maturity investment securities measured at
amortised cost under LKAS 39 will be in general
classified as loans and receivables and measured at
amortised cost under SLFRS 9.
Debt investment securities that are classified as available
for sale under LKAS 39 may, under SLFRS 9, be classified
under FVOCI or L&R and measured at fair value /
amortised cost depending on the particular circumstance.
The majority of the equity investment securities that are
classified as available for sale under LKAS 39 will be
classified under FVTPL and measured at fair value under
SLFRS 9. However, some of these equity investment
securities are held for long-term strategic purposes and
will be designated as FVTOCI on initial recognition, and
measured at fair value.
ii. Impairment - Financial assets, loan commitments and financial guarantee contracts
SLFRS 9 replaces the 'incurred loss' model in LKAS 39 with
a forward looking 'expected credit loss' model. This will
be required considerable judgement over how changes in
economic factors affect Expected Credit Loss (ECL), which
will be determined on a probability weighted basis.
The new impairment model applies to financial assets that
are debt instruments, that are not measured at FVTPL.
SLFRS 9 requires a loss allowance to be recognised
at an amount equal to either 12 month ECLs or lifetime
ECLs. Lifetime ECLs are the ECLs that result from all
possible default events over the expected life of a financial
instrument, whereas 12 month ECLs are the portion of ECLs
that result from default events that are possible within the 12
months after the reporting date.
5.2 SLFRS 15 - Revenue From Contracts With Customers; Effective from 1 January 2018
Revenue arising from insurance contacts and financial
instruments is outside the scope of SLFRS 15. The impact
of recognising the revenue from other services when these
services are delivered to customers is not expected to be
material to the Company.
5.3 SLFRS 16 - Leases; Effective From 1 January 2019
SLFRS 16 eliminates the current dual accounting model
for lessees which distinguishes between on balance sheet
finance leases and off balance sheet operating leases.
Instead there will be a single on balance sheet accounting
model that is similar to the current finance lease accounting.
The Company is in the process of assessing the potential
impact based the operating leases disclosed in Note 44.2
6 Summary of Significant Accounting PoliciesThe Company has consistently applied the following
accounting policies to all periods presented in these
financial statements. The accounting policies are presented
along with the respective notes.
Set out below is an index of the significant policies;
Note Significant Accounting Policies Page
6.1 Impairment of non financial assets 191
6.2 Foreign currency transactions and balances 191
7 Financial Risk Management 191
8 Fair Value Measurement and Related Fair Value Disclosures 205
9 Financial assets and liabilities 208
10 Gross written premium 212
11 Premium ceded to reinsurers 213
12 Net investment income 214
13 Net realised gains / (losses) 215
14 Net fair value gains / (losses) 216
15 Other income 216
16 Net insurance benefits and claims paid 216
17 Net change in insurance claims outstanding 217
18 Change in contract liabilities 218
19 Underwriting and net acquisition costs 218
20 Other operating, administrative and
selling expenses 218
22 Taxes 219
23 Earnings per share 224
24 Dividends per share 224
25 Intangible assets 225
26 Property, plant and equipment / leases 226
27 Investment in equity accounted investee 230
28 Financial investments (including derivatives) 234
29 Loans to life policyholders 241
30 Reinsurance receivable 242
31 Premiums receivable 243
32 Receivables and other assets 243
33 Cash and cash equivalents 244
34 Stated capital 245
38 Insurance contract liabilities 248
39 Insurance contract liabilities - unit linked 252
40 Employee benefits liabilities 252
41 Reinsurance payables 253
45 Events after the reporting date 257
46 Provisions and contingencies 258

191
UNION ASSURANCE PLC | ANNUAL REPORT 2017
FIN
AN
CIA
L IN
FO
RM
ATIO
N
Other Significant Accounting Policies Not Covered With Individual Notes
Following accounting policies which have been applied
consistently by the Company, are considered to be
significant but are not covered in any other sections.
6.1 Impairment on Non Financial Assets
The carrying amounts of the Company’s non financial
assets (other than insurance and reinsurance contract
assets, deferred tax assets and employee benefit assets)
are reviewed at each reporting date to determine whether
there is any indication of impairment. If any such indication
exists, then the assets' recoverable amount is estimated.
For intangible assets that have indefinite useful lives or that
are not yet available for use, the recoverable amount is
estimated each year at the same time. An impairment loss
is recognised if the carrying amount of an asset exceeds its
estimated recoverable amount.
The recoverable amount of an asset is the greater of its value
in use and its fair value less costs to sell. In assessing value
in use, the estimated future cash flows are discounted to
their present value using a pre tax discount rate that reflects
current market assessments of the time value of money and
the risks specific to the asset. For the purpose of impairment
testing, assets that cannot be tested individually are grouped
together into the smallest group of assets that generate cash
inflows from continuing use that are largely independent of
the cash inflows of other assets.
Impairment losses are recognised in profit or loss. An
impairment loss is reversed only to the extent that the asset's
carrying amount does not exceed the carrying amount
that would have been determined, net of depreciation or
amortisation, if no impairment loss had been recognised.
6.2 Foreign Currency Transactions and Balances
All foreign exchange transactions are converted to functional
currency, at the rates of exchange prevailing at the time the
transactions are effected.
Monetary assets and liabilities denominated in foreign
currency are retranslated to functional currency equivalents
at the spot exchange rate prevailing at the reporting date.
Non monetary items that are measured in terms of historical
cost in a foreign currency are translated using the exchange
rates as at the dates of the initial transactions. Non monetary
assets and liabilities are translated using exchange rates that
existed when the values were determined. The gain or loss
arising on translation of non monetary items is treated in line
with the recognition of gain or loss on fair value of the item.
7 Financial Risk ManagementThe following presents the risks that the Company considers
in Risk Management. This note presents information about
the Company’s exposure to each of the stated risks, the
Company’s objectives, policies and processes for measuring
and managing such risks.
Organisation Risk
Operational R
isk
Financial Risk
Life
Insurance
Busin
ess Risk Product Design Risk
Investment Concentration Risk
Underwriting Risk
Liquidity Risk
Reinsurance Risk
Credit Risk
Claims Risk
Market Risk

UNION ASSURANCE PLC | ANNUAL REPORT 2017
192
Risk Management Framework
Primary objective of the Company’s business and financial
risk management framework is to protect the Company’s
shareholders from events that could hinder the sustainable
delivery of financial objectives. The risk management
process comprises the identification and evaluation of
existing and potential risks associated with the Company’s
operations and strategy, followed by appropriate
management responses such as tolerance, mitigation,
transfer, avoidance, termination or a combination of such
responses.
The Company’s Board of Directors (the Board) has overall
responsibility for the establishment and oversight of the
Company’s risk management framework. The Company’s risk
management policies are established to identify and analyse
the risk faced by the Company, to set appropriate risk
limits and controls, and to monitor risks and adherence to
the limits.
The Board has delegated the responsibility to design,
implement and monitor the risk management plan to the
Risk Committee comprising the senior management. The
management ensures effective management of risk through
continuous and regular measurement and reports the
Company’s risk management performance to the Board
Audit and Compliance Committee (BACC) which in turn
updates the Board.
The risk management policies and systems are reviewed
regularly to reflect changes in market conditions and the
Company’s activities. The Company, through its training and
management standards and procedures, aims to develop a
disciplined and constructive control environment in which all
employees understand their roles and obligations.
Financial risk management can be qualitative and
quantitative. As a specialisation of risk management,
financial risk management focuses on when and how to use
financial instruments to manage costly exposures.
Details of our risk management framework, objectives
and regulatory framework is provided under Corporate
Governance and Enterprise Risk Management section.
Regulatory Framework
The Insurance Regulatory Commission of Sri Lanka (IRCSL)
safeguards policyholders through supervisory control of
insurance companies in line with the Regulation of Insurance
Industry Act No. 43 of 2000 and subsequent amendments.
All insurance companies need to comply with rules with
respect to the solvency position and the determination
requirements to ensure the Company maintains appropriate
level of admissible and approved investments in excess
of liabilities to meet risks arising from unforeseen events.
Further the Company is in compliance with the Risk Based
Capital (RBC) requirement as per IRCSL. The Company has
adequate Total Available Capital (TAC) in policyholder's and
shareholder’s funds collectively, to support the Risk based
Capital Required (RCR).
The operations of the Company are also subject to oversight
by various other regulators such as the Securities and
Exchange Commission of Sri Lanka (SEC), the Colombo
Stock Exchange (CSE), the Central Bank of Sri Lanka
(CBSL), the Department of Inland Revenue etc. The
Company is also regulated by the Companies Act No. 7
of 2007.
7.1 Business Risk
NOTES TO THE FINANCIAL STATEMENTS
Mortality Risk Morbidity RiskInvestment Return Risk
Expense RiskPolicyholder
Decision RiskConcentration
RiskLongevity
Risk
Life Insurance Business Risk
Claims Risk 7.1 (d)
Reinsurance Risk 7.1 (c)
Product Design Risk
7.1 (a)
Underwriting Risk
7.1 (b)

193
UNION ASSURANCE PLC | ANNUAL REPORT 2017
FIN
AN
CIA
L IN
FO
RM
ATIO
N
The Company being in the insurance industry, life insurance
business risk is the risk that the Company is exposed to as a
result of the insurance contracts undertaken. Insurance risk
is the inherent uncertainty regarding the occurrence, amount
or timing of insurance liabilities.
Risk Response
The objective of the Company is to ensure that sufficient
reserves are available to cover these liabilities. The risk
exposure is mitigated by;
Diversification across a large portfolio of insurance
contracts and geographical spread.
Careful selection and implementation of underwriting
guidelines.
The use of reinsurance arrangements.
Risk management procedures adopted by the Company to
manage insurance risk is given on pages 191 to 205.
Business Risk - Life Insurance Risk
Traditional Life Insurance
Life insurance is a contractual agreement between a
policyholder and a life insurance company. Policyholders
agree to make premium payments to the company, and the
company agrees to pay beneficiaries a sum of money if the
policyholder dies or an insured event occurred.
Traditional life insurance products include protection and
annuity covers. Protection products carry product designing,
underwriting, claims and reinsurance risk.
7.1 (a) Product Design Risk
Life insurance product design largely depends on futuristic
hypothetical assumptions. Accordingly there is a risk of
introducing unprofitable products to the market due to
inappropriate use of assumptions or judgements. The
fundamental assumptions used in product development are
explained below.
Risk Description Assumptions used / risk response
Mortality risk Risk of loss arising due to policyholders
death experience being different from
expected
Use of standard mortality tables with adjustments to reflect the
Company's mortality experience.
Morbidity risk Risk of loss arising due to policyholders
health experience being different from
expected
Assumptions are based on reinsurance tables, adjustments made
when appropriate to reflect the Company’s own risk experience.
Investment
return risk
Risk of loss arising from actual returns
being different from expected
The weighted average rate of return is derived based on a model
portfolio that is assumed to back liabilities, consistent with the long
term asset allocation strategy.
Expense risk Risk of loss arising from the expense
experience being different from expected
Operating expense assumptions reflect the projected costs of
maintaining and servicing in – force policies and associated
overhead expenses.
Policyholder
decision risk
Risk of loss arising due to policyholders
experiences (lapses and surrenders)
being different from expected
Lapse and surrender rates are projected according to the Company’s
past experience.
Longevity risk Risk of loss arising due to the annuitant
living longer than expected
Terms and conditions included in insurance applications have been
designed to address non standard and unpredictable risks.
Concentration
risk
Risk of losses due to not maintaining a
balanced product portfolio
Developing a proper product mix in line with Company strategy.

UNION ASSURANCE PLC | ANNUAL REPORT 2017
194
NOTES TO THE FINANCIAL STATEMENTS
Overall Risk Mitigation Approach in Traditional Life Insurance
Product Key risks Risk mitigation
Traditional participating Market risk: Investment return on underlying
items falling below guaranteed minimum rates
Policyholder behaviour risk
Management discretion to determine amount and
timing of policyholder bonuses (within limits)
Surrender penalties
Non Participating Market risk: Insufficient fees to cover cost of
guarantees and expenses
Policyholder behaviour risk
Derivative hedging programme
Surrender penalties
Universal life Interest rate risk: Differences in duration and
yield of assets and liabilities
Investment credit risk
Matching of asset and liability cash flows
Investing in investment grade assets
Unit linked product Market risk: Insufficient fees to cover expenses
Policyholder behaviour risk
Surrender penalties
Unit Linked Products
Unit linked products have been designed in order to
reduce much of the market and credit risks associated with
traditional products. It is a type of insurance vehicle in which
the policyholder purchases units at their net asset values
and also makes contributions toward another investment
vehicle. Unit linked insurance plans allow for the coverage of
an insurance policy.
Under unit linked contracts, risks are largely passed on to the
policyholder, although a portion of the Company’s management
fees are linked to the value of funds under management and
hence are at risk if the fund values decrease.
Unit linked products carry mortality risk and market risk to
the extent that there are guarantees built into the product
design. Contracts may have minimum guaranteed death
benefits where the sum at risk depends on the fair value of
the underlying investments. For certain contracts these risks
are minimised by explicit mortality and morbidity charges.
Participating Fund vs Non Participating Fund
The following table shows the concentration of the Participating
and Non Participating funds position of the Company.
As at 31 December 2017 2016
Type of Contract Rs. '000 % Rs. '000 %
Participating 10,427,564 39 9,529,656 34
Non Participating 16,484,493 61 18,173,754 66
Total traditional 26,912,057 100 27,703,410 100
Non unit fund of
linked insurance 37,556 186,272
Total value of insurance liabilities 26,949,613 27,889,682
The table below presents the sensitivity of the value of
insurance liabilities to movements in the key assumptions
used in the estimation of insurance liabilities with other
assumptions held constant. For liabilities under life insurance
contracts with fixed and guaranteed terms, changes in
assumptions will not cause a change to the amount of the
liability, unless the change is severe enough to trigger a
liability adequacy test adjustment. No adjustments were
required in 2017 or 2016, based on the results of the liability
adequacy test.
Change %
Impact on liabilities %
Impact on liabilities Rs. '000
Assumption 2017 2016 2017 2016
Mortality + 10 0.34 0.64 60,092 79,891
- 10 (0.34) (0.64) (60,237) (160,073)
Discount rate + 1 (1.56) (4.80) (348,476) (823,669)
- 1 1.67 (2.22) 373,811 381,079
7.1 (b) Underwriting Risk
Underwriting risk arise from an inaccurate assessment of the
risks entailed in writing an insurance policy. As a result, the
policy may cost the insurer much more than it has earned in
premiums.
Risk Response
Validation of policyholder data before underwriting.
Accordingly, policyholder undergoes a medical test at
Company’s expense
Appropriate training is provided to insurance advisors.
Use of common pricing policy.

195
UNION ASSURANCE PLC | ANNUAL REPORT 2017
FIN
AN
CIA
L IN
FO
RM
ATIO
N
7.1 (c) Reinsurance Risk
Notwithstanding the advantages reinsurance provide, it can
expose them at varying degrees to various risks inherent in
its use. A new or continuing reinsurance contract could give
rise to one or more of the following risks:
Residual insurance risk may arise from discrepancies
between reinsurance needs and the actual coverage
provided for in the contract, resulting in the insurer
retaining greater risk than anticipated.
Legal risk may arise when the terms of the contract do
not accurately reflect the intent of the insurer or when the
contract cannot be legally enforced;
Counterparty risk may result from the inability or potential
refusal of the reinsurer, or a stakeholder in the case of
an alternative risk transfer mechanism, to honour its
obligations towards the ceding insurer.
Liquidity risk may arise from the possible lag time
between the payment of a claim by the insurer to its
insured and receipt of the reinsurance recoverable.
Operational risk may result from inadequate contractual
arrangements or from insufficient technological or
administrative capacity to manage and collect sums
owed by reinsurers
Risk Response
Reinsurance is placed in line with policy guidelines
approved by the Board of Directors on an annual basis
based on the guidelines issued by the IRCSL.
Management assesses the credit worthiness of
reinsurers on a regular basis to update the reinsurance
strategy and ascertain the suitable allowance for
impairment of reinsurance assets.
The Company reinsures approximately 5% of gross
written premium.
For the year ended 31 December 2017 2016
Rs. '000 % Rs. '000 %
Gross Written premium 10,117,630 8,270,751
Reinsurance (497,612) 5 (423,857) 5
Net Written Premium 9,620,018 7,846,894
Company has recovered approximately 5% of gross claims
from reinsurers during the period under review.
For the year ended 31 December 2017 2016
Rs. '000 % Rs. '000 %
Gross claims paid 2,828,188 1,682,170
Claims recovered
from reinsurers (154,455) 5 (157,860) 9
Net claims 2,673,733 1,524,310
7.1 (d) Claims Risk
The possibility of adverse variance in claim pattern of the product
which is not expected at the product development stage.
Risk Response
Obtaining adequate reinsurance cover.
Adequate information is gathered to confirm the
event occurred prior to processing the claim.
In house actuarial department closely monitors
claim reserves.
7.2 Financial Risk
Financial risk is the probability of loss inherent in financing
methods which may impair the ability to provide adequate
returns. The Company is exposed to a range of financial
risks through financial assets and financial liabilities.
Financial risks can be categorised as follows;
Financial Risk
Investment Concentration
Risk 7.2 (a)
Market Risk 7.2 (d)
Liquidity Risk 7.2 (b)
Credit Risk 7.2 (c)
7.2 (a) Investment Concentration Risk
Investment concentration risk is the risk that an investor will
suffer from lack of diversification, investing too heavily in one
industry, one geographic area or one type of security. It may
also be defined as the risk of loss due to over exposure to
one investment, asset class, risk factor, etc.

UNION ASSURANCE PLC | ANNUAL REPORT 2017
196
NOTES TO THE FINANCIAL STATEMENTS
Risk Response
The Investment Committee (IC) sets an overall asset
allocation target at the start of the year. The decision
is based on a number of factors including an analysis
of the macroeconomic environment, regulatory
requirements, liquidity position and return expectations
during the plan period.
The IC sets sectorial asset allocation limits for equity
investments as well as related party exposure limits.
The Company limits the maximum cash amount that can
be deposited with a single counterparty.
The above is based on the approved investment policy of
the Company. Investment concentration related to financial
investments is given below;
As at 31 December 2017 2016
Rs. '000 % Rs. '000 %
Government
securities and
related institutions 26,704,668 77 20,768,546 73
Corporate debt
securities 4,916,292 14 5,407,765 19
Fixed deposits 647,447 2 584,609 2
Investment in
quoted equity 2,344,572 7 1,706,751 6
Derivative financial
instruments 50,737 - - -
Total 34,663,716 100 28,467,671 100
Government Securities and Related Institutions
This includes investments made in treasury bills, treasury
bonds, and reverse repurchase agreements.
Corporate Debt Securities
The Company has predominantly invested in Banking,
finance and insurance sectors for which the Company
believes, the credit risk and market risk is low.
As at 31 December 2017 2016
Rs. '000 % Rs. '000 %
Banking, Finance
and Insurance 4,723,242 96 5,158,049 95
Beverage, Food
and Tobacco 46,743 1 82,545 2
Diversified Holdings 146,307 3 144,445 3
Manufacturing - - 22,726 -
Total 4,916,292 100 5,407,765 100
Fixed Deposits
This includes investments made in fixed deposits issued
by DFCC Bank PLC.
Investment in Quoted Equity
Considering the market return and risk, the Company has
predominantly invested in Banking, Finance and Insurance
sectors and regularly reviews market risk of the portfolio to
assess adequacy of diversification.
As at 31 December 2017 2016
Sector Rs. '000 % Rs. '000 %
Banking, Finance
and Insurance 1,729,058 74 1,195,167 70
Diversified Holdings 218,137 9 202,606 12
Manufacturing 306,107 13 238,125 14
Construction and
Engineering 69,695 3 42,308 2
Motors 10,810 1 12,818 1
Hotels and Travels 10,765 - 15,727 1
Total 2,344,572 100 1,706,751 100
7.2 (b) Liquidity Risk
Liquidity risk is the risk, that the Company may not have sufficient
liquid financial resources to meet its obligations when they fall
due, or would have to incur excessive costs to do so. In respect
of catastrophic / unexpected large claim events there is also
a liquidity risk associated with the timing differences between
gross cash outflows and expected reinsurance recoveries.
Risk Response
The Investment Committee manages this risk by
diversifying investment durations and reviewing cash
flow projections regularly.
Guidelines are set for asset allocations, portfolio limit
structures and maturity profiles of assets, in order to
ensure availability of sufficient funding to meet insurance
and investment contract obligations.
Reinsurance contracts contain clauses permitting the
immediate draw down of funds to meet claim payments
should claim events exceed a certain size.
Availability of stand by overdraft facility to be used only
in the event of an emergency.
Reviewing the maturity mix of the investment portfolio
by the management and the Investment Committee on a
regular basis.
Maintaining sufficient cash balances, overnight investments
and other short tenure investments to accommodate
expected obligations and commitments of the Company.

197
UNION ASSURANCE PLC | ANNUAL REPORT 2017
FIN
AN
CIA
L IN
FO
RM
ATIO
N
Excess liquidity position of the Company excluding
insurance contract liabilities is given below;
As at 31 December 2017 2016
Rs. '000 % Rs. '000 %
Up to one year 7,229,190 11 6,211,090 12
1 - 5 Years 23,303,309 36 21,734,927 40
Over 5 years 31,707,547 49 24,226,229 45
No maturity 2,344,572 4 1,706,751 3
64,584,618 100 53,878,997 100
For reinsurance receivables, maturity profiles are determined
based on estimated timing of net cash outflows from the
recognised insurance liabilities.
Unit linked liabilities are repayable or transferable on
demand and are included as ‘current’ repayments.
The table below summarises the maturity profiles of
non derivative financial assets and financial liabilities
based on remaining undiscounted contractual obligations,
including interest payable and receivable.
As at 31 December 2017 Rs. ‘000
Carrying amount
No fixed tenure
Up to one year
1 - 5 years
Over 5 years Total
Financial assets
Held to maturity 18,319,379 - 4,068,090 11,037,738 26,124,171 41,229,999
Loans and receivables 5,883,031 - 1,715,672 5,086,501 - 6,802,173
Available for sale 8,065,997 - 1,182,908 6,718,074 4,892,838 12,793,820
Fair value through profit or loss 2,395,309 2,344,572 50,737 - - 2,395,309
Other financial assets 361,181 - 135,110 195,971 94,837 425,918
Loans to life policyholders 1,001,538 - 140,812 265,025 595,701 1,001,538
Reinsurance receivable 267,417 - 267,417 - - 267,417
Premiums receivable 268,511 - 268,511 - - 268,511
Cash in hand and at bank 580,126 - 580,126 - - 580,126
Total undiscounted assets 37,142,489 2,344,572 8,409,383 23,303,309 31,707,547 65,764,811
Financial liabilities
Reinsurance payables 345,146 - 345,146 - - 345,146
Other financial liabilities 639,741 - 639,741 - - 639,741
Bank overdraft 195,306 - 195,306 - - 195,306
Total undiscounted liabilities 1,180,193 - 1,180,193 - - 1,180,193
Total excess liquidity 35,962,296 2,344,572 7,229,190 23,303,309 31,707,547 64,584,618
0
5,000
10,000
15,000
20,000
25,000
30,000
35,000

UNION ASSURANCE PLC | ANNUAL REPORT 2017
198
NOTES TO THE FINANCIAL STATEMENTS
As at 31 December 2016Rs. ‘000
Carrying amount
No fixed tenure
Up to one year
1 - 5 years
Over 5 years Total
Financial assets
Held to maturity 15,396,036 - 3,904,327 9,917,157 18,957,725 32,779,209
Loans and receivables 5,409,853 - 1,116,771 5,350,391 773,681 7,240,843
Available for sale 5,955,031 - 824,973 5,803,319 4,271,078 10,899,370
Fair value through profit or loss 1,706,751 1,706,751 - - - 1,706,751
Other financial assets 404,898 - 234,555 200,965 78,108 513,628
Loans to life policyholders 867,177 - 258,445 463,095 145,637 867,177
Reinsurance receivable 178,181 - 178,181 - - 178,181
Premiums receivable 246,800 - 246,800 - - 246,800
Cash in hand and at bank 379,232 - 379,232 - - 379,232
Total undiscounted assets 30,543,959 1,706,751 7,143,284 21,734,927 24,226,229 54,811,191
Financial liabilities
Reinsurance payables 208,742 - 208,742 - - 208,742
Other financial liabilities 573,146 - 573,146 - - 573,146
Bank overdraft 150,306 - 150,306 - - 150,306
Total undiscounted liabilities 932,194 - 932,194 - - 932,194
Total excess liquidity 29,611,765 1,706,751 6,211,090 21,734,927 24,226,229 53,878,997
The table below sets out the availability of the Company’s financial assets to support future funding.
As at 31 December 2017 2016
UnencumberedRs.’000
Restricted as
collateralAvailable as
collateral Total
Restricted as
collateralAvailable as
collateral Total
Held to maturity 17,727,184 592,195 18,319,379 15,396,036 - 15,396,036
Loans and receivables 5,806,251 76,780 5,883,031 5,380,958 28,895 5,409,853
Available for sale 6,538,609 1,527,388 8,065,997 4,632,489 1,322,542 5,955,031
Fair value through profit or loss 4,524,514 - 4,524,514 4,086,336 - 4,086,336
Loans to life policyholders 1,001,538 - 1,001,538 867,177 - 867,177
Reinsurance receivable 267,417 - 267,417 178,181 - 178,181
Premiums receivable 268,511 - 268,511 246,800 - 246,800
Other financial assets 125,230 235,951 361,181 193,021 211,877 404,898
Cash in hand and at bank 580,120 6 580,126 379,182 50 379,232
Total 36,839,374 2,432,320 39,271,694 31,360,180 1,563,364 32,923,544
Assets restricted as collateral represents the assets owned by the policyholders of the Company.
Financial Assets Pledged as Collateral
There were no financial assets pledged as collateral as at 31 December 2017.

199
UNION ASSURANCE PLC | ANNUAL REPORT 2017
FIN
AN
CIA
L IN
FO
RM
ATIO
N
7.2 (c) Credit Risk
Credit risk is the risk associated with a loss or potential loss
from counterparties failing to fulfil their financial obligations.
The Company’s exposure to credit risk is derived from the
following main categories of assets and the analysis of
maximum credit exposure is given below.
As at 31 December 2017 2016
Risk element Rs. '000 % Rs. '000 %
Financial investments 32,268,407 92 26,760,920 93
Loans to life policyholders and staff / agents 1,305,579 4 1,146,740 4
Amounts due from related parties 11,954 - 100,988 -
Reinsurance receivable 267,417 1 178,181 1
Premiums receivable 268,511 1 246,800 1
Cash in hand and at bank 580,126 2 379,232 1
Total 34,701,994 100 28,812,861 100
Credit Risk Related to Financial Investments
The Company is exposed to credit risk from counterparties
where the Company holds securities issued by those entities.
Risk Response
The Company’s investment policy prohibits non graded
investments, unless specifically authorised.
Appropriate actions are implemented when the
Company identifies investments that are expected to be
downgraded.
The Company identifies and selectively reduces
unsecured and subordinated credit exposure issued by
3rd parties with weak credit profiles.
Structured finance exposures are assessed on a look
through basis prior to acquisition and not merely on the
strength of prevailing credit ratings or credit profiles.
The Company actively manages its investment portfolio to
ensure that there is no significant concentration of credit risk.
The Company monitors concentration of credit risk by sector
and instrument. An analysis of concentration of credit risk
and credit quality of financial investments are shown below.
As at 31 December 2017
Rs. ‘000
Held tomaturityfinancial
assetsLoans and
receivables
Available forsale
financialassets
Financialassets atfair valuethrough
profit or loss Total %
Maximum exposure to credit risk, carrying amount 18,319,379 5,883,031 8,065,997 - 32,268,407
Government securities and related institutionsTreasury bonds 18,028,394 - 7,900,165 - 25,928,559 80
Treasury bills - - 165,832 - 165,832 1
Reverse repo - 610,277 - - 610,277 2
Corporate debt securitiesAA+ to AA- (Fitch) 74,395 863,559 - - 937,954 3
A+ to A- (Fitch) 216,590 3,329,240 - - 3,545,830 11
A+ to A- (ICRA) - 255,821 - - 255,821 1
BBB+ to BBB- (Fitch) - 176,687 - - 176,687 -
Fixed depositsDeposit with licensed commercial banks - 647,447 - - 647,447 2
Total 18,319,379 5,883,031 8,065,997 - 32,268,407 100
Past due but not impaired Nil Nil Nil Nil Nil
Impaired Nil Nil Nil Nil Nil

UNION ASSURANCE PLC | ANNUAL REPORT 2017
200
NOTES TO THE FINANCIAL STATEMENTS
As at 31 December 2016
Rs. ‘000
Held tomaturityfinancial
assetsLoans and
receivables
Available forsale
financialassets
Financialassets atfair valuethrough
profit or loss Total %
Maximum exposure to credit risk, carrying amount 15,396,036 5,409,853 5,955,031 - 26,760,920
Government securities and related institutionsTreasury bonds 14,542,076 - 5,822,216 - 20,364,292 77
Treasury bills - - 132,815 - 132,815 -
Reverse repo - 271,439 - - 271,439 1
Corporate debt securitiesAA+ to AA - (Fitch) 798,245 2,462,665 - - 3,260,910 12
A+ to A- (Fitch) 55,715 1,817,164 - - 1,872,879 7
A+ to A- (ICRA) - 203,144 - - 203,144 1
BBB+ to BBB- (Fitch) - 70,832 - - 70,832 -
Fixed depositsDeposit with licensed commercial banks 584,609 - - 584,609 2
Total 15,396,036 5,409,853 5,955,031 - 26,760,920 100
Past due but not impaired Nil Nil Nil Nil Nil
Impaired Nil Nil Nil Nil Nil
Collateral of Debt Securities
Reverse repo investments which fall under government
securities is backed by Treasury bills and bonds which are
provided as collateral. Management monitors the market
value of the collateral, requests additional collateral when
needed and performs an impairment valuation when
applicable. A haircut of 10% is maintained at all times. As at
the reporting date, the Company held Treasury bonds and
Treasury bills worth Rs 690 million as collateral for reverse
repo investments amounting to Rs. 610 million.
Credit Risk Related to Policy Loans and Others
Financial losses could arise due to non settlement of loans
obtained by policyholders.
Risk Response
Policy loans are collateralised by the surrender value of
the policy.
System controls are in place to automatically convert
a policy to lapse stage when the policy loan amount
together with the interest reaches the surrender value of
the policy.
Analysis of maximum exposure to credit risk related to life
policyholder loans can be summarised as follows;
As at 31 December 2017 2016Rs. '000 Rs. '000
Neither past due nor impaired
Past due but not impaired 76,593 51,610
61- 90 days 31,396 23,047
91-180 days 81,571 65,705
181 days + 811,978 726,815
Total 1,001,538 867,177
Impaired Nil Nil
Total - Maximum exposure to credit risk 1,001,538 867,177

201
UNION ASSURANCE PLC | ANNUAL REPORT 2017
FIN
AN
CIA
L IN
FO
RM
ATIO
N
The Company considers the surrender value of the life policy
as collateral for loans issued. As at the reporting date, the
value of policy loans granted amounted to Rs. 1,002 million
(2016 - 867 million) and its related surrender value is
Rs. 1,693 million (2016 – 1,471 million).
Credit Risk Related to Amounts Due From Related Parties
Financial losses could arise due to non settlement of
amounts due from related parties.
Risk Response
Related party transaction are settled within pre agreed
specific duration according to the Company policy.
Credit Risk Related to Reinsurance Assets
This is the risk of reinsurers failing to fulfil their financial
obligations towards the Company.
Risk Response
The Company operates a policy to manage its
reinsurance counterparty exposures, by limiting the
reinsurers that may be used, and applying strict limits to
each reinsurer.
Regular review of credit worthiness of reinsurers.
As at 31 December 2017 2016
Rs. '000 % Rs. '000 %
Reinsurance receivables on outstanding claims 135,657 51 85,306 48
Reinsurance receivables on settled claims 131,760 49 92,875 52
Total reinsurance receivables / Maximum exposure to credit risk 267,417 100 178,181 100
As at 31 December 2017,100% (2016 - 100%) of our reinsurance receivables was due from reinsurers with a rating of A+ and above.
There were no collateral against reinsurance receivables as at reporting date.
As at 31 December 2017 2016
Reinsurer
Rating Agency
RatingReinsurance
receivables %Reinsurance
receivables %
Munich Fitch AA 217,717 81 157,240 88
Hannover Standard & Poor's AA- 48,341 18 13,101 8
RGA Fitch A+ 1,359 1 7,840 4
Total 267,417 100 178,181 100
Credit Risk Related to Premiums Receivable
Premiums receivable consist of premiums receivable from
intermediaries that create the risk of financial losses due to
non settlement of dues or taking substantial time to settle dues.
Risk Response
Only designated institutions are employed as
intermediary parties.
Agreements have been signed with the intermediaries
committing them to settle dues within a specified time
period.
Maximum exposure to credit risk related to premiums
receivable as at 31 December 2017 is Rs. 269 million
(2016 - Rs. 247 million).
As at 31 December 2017 2016Rs. '000 Rs. '000
Neither past due nor impaired
0 - 30 days 268,511 246,800
Pass due but not impaired Nil Nil
Total - Maximum exposure to credit risk 268,511 246,800

UNION ASSURANCE PLC | ANNUAL REPORT 2017
202
NOTES TO THE FINANCIAL STATEMENTS
Credit Risk Related to Cash at Bank
Risk Response
The Company maintains an authorised list of acceptable
bank counterparties based on current ratings and economic
outlook, taking into account analysis of fundamentals and
market indicators.
The Company manages credit risk by maintaining its
deposits with various banking institutions with quality
credit ratings. A list of such banking partners is provided
below. Majority i.e 57% of funds are deposited in banking
institutions backed by government of Sri Lanka.
As at 31 December 2017 2016
Bank
AmountRs. '000 %
AmountRs. '000 %
Bank of Ceylon 270,979 47.0 204,114 54.3
Commercial Bank of Ceylon PLC 45,529 7.9 22,152 5.9
Deutsche Bank AG 6,103 1.1 - -
DFCC Bank PLC 450 0.1 185 -
HDFC Bank of Sri Lanka 5,094 0.9 3,794 1.0
Hatton National Bank PLC 17,313 3.0 13,182 3.5
National Development Bank PLC 31,958 5.5 14,627 3.9
National Savings Bank 5,246 0.9 7,566 2.0
Nations Trust Bank PLC 40,057 6.9 26,014 6.9
People's Bank 17,117 3.0 35,860 9.5
Sampath Bank PLC 10,340 1.7 11,421 3.0
Standard Chartered Bank 6,985 1.2 7,237 1.9
Seylan Bank PLC 7,967 1.4 3,579 1.0
Union Bank of Colombo PLC 111,890 19.4 26,683 7.1
Total cash at banks 577,028 100 376,414 100
Cash in hand 3,098 2,818
Total cash in hand 3,098 2,818
Total cash in hand and at bank 580,126 379,232
The Company held cash in hand and at bank of Rs. 580 million as at 31 December 2017 (2016 - Rs. 379 million). The cash at bank are
held with banks and financial institutional counterparties, which are rated BB+ or better as at 31 December 2017.
As at 31 December 2017 2016 Rating
AmountRs. '000 %
AmountRs. '000 %
AAA 5,246 0.9 7,566 2.0
AA+ 288,096 49.7 239,974 63.4
AA 45,529 7.8 29,389 7.7
AA- 17,763 3.1 27,994 7.4
A+ 49,283 8.5 11,421 3.0
A 40,057 6.9 26,014 6.9
A- 14,070 2.4 3,579 0.9
BBB 5,094 0.9 3,794 1.0
BB+ 111,890 19.3 26,683 7.0
Cash in hand 3,098 0.5 2,818 0.7
Total 580,126 100 379,232 100

203
UNION ASSURANCE PLC | ANNUAL REPORT 2017
FIN
AN
CIA
L IN
FO
RM
ATIO
N
7.2 (d) Market Risk
This is the risk that the fair value of future cash flows of a
financial instrument will fluctuate because of changes in the
market prices. The Company has assessed the market risk
under three main categories;
Market Risk
Equity Price Risk
(i)
Currency Risk (ii)
Interest Rate Risk
(iii)
(i) Equity Price Risk
Listed equity securities are susceptible to market price risk
arising from uncertainties of future values of the investment
securities. The Company manages the equity price risk
through diversification and placing limits on individual and
total equity portfolio investments.
Risk Response
Equity investment decisions are based on fundamentals
rather than on speculation.
Decisions are based on in depth macroeconomic
and industry analysis as well as research reports on
company performance.
A model to review the market prices of certain asset
classes has been developed and is referred to the
Investment Committee on a monthly basis.
As at 31 December 2017, the Company has invested 7% in
equity as shown in the table below.
As at 31 December 2017 2016
Rs.’000 Value% of
allocation Value% of
allocation
Banking, Finance and Insurance 1,729,058 5 1,195,167 4
Diversified Holdings 218,137 1 202,606 1
Manufacturing 306,107 1 238,125 1
Construction and Engineering 69,695 - 42,308 -
Motors 10,810 - 12,818 -
Hotels and Travels 10,765 - 15,727 -
Total value of equity 2,344,572 7 1,706,751 6
Total value of investments 34,663,716 28,467,671
The following shows the estimated impact from a 10% change in the stock market prices on the portfolio with indicative comparatives.
Sensitivity of Fund Inflow to Change in Equity Prices
As at 31 December 2017 2016
Rs.’000Impact on
fund inflow
Impact onequity
investmentsImpact on
fund inflow
Impact onequity
investments
10% increase in equity prices 234,457 234,457 170,675 170,675
10% decrease in equity prices (234,457) (234,457) (170,675) (170,675)

UNION ASSURANCE PLC | ANNUAL REPORT 2017
204
NOTES TO THE FINANCIAL STATEMENTS
(ii) Currency Risk
Currency risk is the risk that the fair value / present value of
the future cash flows of a financial instrument will fluctuate
because of changes in foreign exchange rates. The
Company’s principal transactions are carried out in
Sri Lankan Rupees and its exposure to foreign exchange
risk primarily arises when transacting with reinsurers and
software vendors who operates outside the country.
Risk Response
Company does not carry foreign currency dominated assets
or liabilities and any such foreign payment is promptly
processed.
(iii) Interest Rate Risk
Interest rate risk is the risk of fluctuation of the value or cash
flows of an instrument due to changes in market interest rates.
Floating rate instruments expose the Company to cash flow
fluctuations, whereas fixed interest rate instruments expose
the Company to changes in fair values.
Risk Response
The Investment Committee keeps a regular track of
macroeconomic scenarios and their likely impact on
interest rates.
Initial recognition of investments is closely monitored.
Proactively evaluate and execute forward purchases to
lock in future cash flows at favourable interest rates.
The following provides details of the quantum of investment
exposed to fluctuations in fair values. No instrument is
exposed to fluctuations in cash flows as the Company does
not hold any instruments with variable interest rates.
As at 31 December 2017 2016InstrumentsRs.’000
Fixed Interest Rate
VariableInterest Rate
Non-Interestbearing
Fixed Interest Rate
VariableInterest Rate
Non-Interestbearing
Government securities 26,704,668 - - 20,768,546 - -
Corporate debts 4,916,292 - - 5,407,765 - -
Fixed deposits 647,447 - - 584,609 - -
Equity instruments - - 2,344,572 - - 1,706,751
Derivative financial instruments - - 50,737 - - -
Total 32,268,407 - 2,395,309 26,760,920 - 1,706,751
7.3 Operational Risk
Risk is stemming from inadequate or failed internal
processes, people and systems, or from external events.
The Board of Directors has delegated responsibility for
operational risk to risk owners and managers who are
responsible for the development and implementation of
controls to address operational risks. This responsibility
is supported by the development of overall company
standards for the management of operational risks in the
following areas:
Segregation of duties, including the independent
authorisation of transactions.
Reconciliation and monitoring of transactions.
Compliance with regulatory and other legal
requirements.
Documentation of controls and procedures.
Periodic assessment of operational risks faced, and the
adequacy of controls and procedures to address the
risks identified
Reporting of operational losses and proposed remedial
action
Development of contingency plans
Training and professional development
Ethical and business standards
Risk mitigation, including insurance, where this is cost
effective
Compliance with company standards, policies and
procedures is supported by a programme of periodic
reviews undertaken by internal audit
The results of internal audit reviews are discussed with
the Executive Committee, with summaries submitted to
the BACC and the Board

205
UNION ASSURANCE PLC | ANNUAL REPORT 2017
FIN
AN
CIA
L IN
FO
RM
ATIO
N
7.4 Capital Management
For the purpose of the Company’s capital management,
capital includes stated capital, reserves and retained
earnings. The primary objectives of the Company’s capital
management are to maximise shareholder returns, share price
appreciation, sustain financial stability and financial strength.
The Company manages its capital structure and makes
adjustments in light of changes in economic conditions and
regulatory requirements. To maintain or adjust the capital
structure, the Company may adjust the dividend payment
to shareholders, return capital to shareholders or issue new
shares. The Company monitors capital using the Risk Based
Capital method.
In terms of using capital, the Company engages in following
value adding processes in order to provide the desired
output to it’s varied stakeholders, while maintaining the right
balance of risk base capital required.
Providing financial security to citizens (Underwriting process)
Management of overall business operations
Prudent investments and risk management
Delivering benefits and claims assured
The Company has adequate Total Available Capital (TAC) to
support the Risk Based Capital Required (RCR).
As at 31 December 2017Rs. '000
2016Rs. '000
Total Available Capital (TAC) 16,538,376 14,346,884
Formula Risk based Capital
Required (FRCR) 4,701,641 3,492,978
Surrender Value Capital Charge
(SVCC) - -
Risk based Capital requirement
(RCR) 4,701,641 3,492,978
Risk based Capital Adequacy Ratio (CAR) 352% 411%
8 Fair Value Measurement and Related Fair Value DisclosuresFinancial instruments and non financial assets disclosed
at fair value or that are measured at fair value are given in
this note. Aside from this note, additional fair value related
disclosures, including the valuation methods, significant
estimates and assumptions are also provided in;
Property, plant and equipment
under revaluation model Note 26
Financial instruments
(Including those carried at amortised cost) Note 28
‘Fair value’ is the price that would be received to sell an asset
or paid to transfer a liability in an orderly transaction between
market participants at the measurement date. The fair value
measurement is based on the presumption that the transaction
to sell the asset or transfer the liability takes place either;
In the principal market for the asset or liability, or
In the absence of a principal market, in the most
advantageous market for the asset or liability.
The principal or the most advantageous market must be
accessible to the Company.
The fair value of an asset or a liability is measured using
the assumptions that market participants would use
when pricing the asset or liability, assuming that market
participants act in their economic best interest.
A fair value measurement of a non financial asset takes into
account a market participant’s ability to generate economic
benefits by using the asset in its highest and best use or by selling
it to another market participant that would use the asset in its
highest and best use. External professional valuers are involved
for valuation of significant assets such as land and buildings.
Fair value hierarchy
The Company measures the fair value using the following fair
value hierarchy, which reflects the significance of the inputs
used in making the measurement.
Level 1
Inputs that are unadjusted quoted market prices in an active market for identical instruments
When available, the Company measures the fair value of
an instrument using active quoted prices or dealer price
quotations (assets and long positions are measured at a bid
price; liabilities and short positions are measured at an ask
price), without any deduction for transaction costs. A market
is regarded as active if transactions for asset or liability take
place with sufficient frequency and volume to provide pricing
information on an ongoing basis.
Level 2
Inputs other than quoted prices included within level that are observable either directly (i.e. as prices) or indirectly (i.e. derived from prices)
This category includes instruments valued using;
quoted market prices in active markets for similar
instruments,
quoted prices for identical or similar instruments in
markets that are considered to be less active, or
other valuation techniques in which almost all significant
inputs are directly or indirectly observable from market data.

UNION ASSURANCE PLC | ANNUAL REPORT 2017
206
NOTES TO THE FINANCIAL STATEMENTS
Level 3
Inputs that are unobservable
This category includes all instruments for which the valuation
technique includes inputs not based on observable data
and the unobservable inputs have a significant effect on the
instruments value.
Valuation techniques include net present value and
discounted cash flow models comparisons with similar
instruments for which observable market prices exist, option
pricing models and other valuation models.
Assumptions and inputs used in valuation techniques include
risk free and benchmark interest rates, risk premiums in
estimating discount rates, bond and equity prices, foreign
exchange rates, expected price volatilities and corrections.
Observable prices or model inputs such as market interest rates
are usually available in the market for listed equity securities
and government securities such as treasury bills and bonds.
Availability of observable prices and model inputs reduces the
need for management judgement and estimation while reducing
uncertainty associated in determining the fair values.
Models are adjusted to reflect the spread for bid and ask
prices to reflect costs to close out positions, credit and
debit valuation adjustments, liquidity spread and limitations
in the models. Also profit or loss calculated when such
financial instruments are first recorded (‘Day 1’ profit or loss)
is deferred and recognised only when the inputs become
observable or on recognition of the instrument.
Following note explains the methodology for valuing our
financial assets and provides an analysis of these according
to the ‘fair value hierarchy'.
Instrument Category Fair value basis Fair value hierarchy
Government SecuritiesTreasury Bonds
Treasury BillsValued using the market yield
Valued using the market yield
Level 1
Level 1
Investment in SharesInvestment in Listed Shares Closing market prices Level 1
Corporate DebtListed Published market prices Level 1 / Level 2*
Fixed and Term DepositsDeposits over one year
Discounted Cash Flow (DCF) Method
Using Treasury Bond rates for similar maturity plus a risk premium. The risk premium
is determined based on the upgrade / downgrade of the credit rating of the institution.
Level 2
* Listed corporate debts which have been traded during the period have been classified under Level 1 and others under level 2.
Use of Judgements and Estimates
Where the fair value of financial assets and financial liabilities
recorded in the statement of financial position cannot be
derived from active markets, their fair value is determined
using valuation techniques including the discounted cash
flow model. The inputs to these models are taken from
observable markets where possible.
Where this is not feasible, a degree of judgement is
required in establishing fair values. The judgements include
considerations of inputs such as liquidity risk, credit risk and
volatility. Changes in assumptions about these factors could
affect the reported fair value of financial instruments.
8.1 Valuation framework
The Company has established a control framework with
respect to the measurement of fair values of investments.
The investment committee has overall responsibility for
the results of trading and investment operations and all
significant fair value measurements carried out by the
treasury division, which include;
Verification of observable pricing.
Re - performance of model valuations.
Quarterly calibration and back testing of models against
observed market transactions.
Analysis and investigation of significant daily valuation
movements.
When third party information, such as broker quotes
or pricing services are used to measure fair value,
documentary evidence is obtained from third parties to
support the conclusion that such valuations meet the
requirements of SLFRSs / LKASs.

207
UNION ASSURANCE PLC | ANNUAL REPORT 2017
FIN
AN
CIA
L IN
FO
RM
ATIO
N
8.2 Financial assets measured at fair value
The following table analyses financial assets measured
at fair value at the reporting date, by the level in the fair
value hierarchy into which the fair value measurement is
categorised. Whenever available, quoted prices in active
markets are obtained for identical assets at the reporting
date to measure fixed maturity securities at fair value in
trading and AFS portfolios. Market price data is generally
obtained from dealer markets.
Fair value hierarchy
As at 31 December 2017 2016
Rs.’000 Note Level 1 Level 2 Level 3 Total Level 1 Level 2 Level 3 Total
Financial assets at FVTPL
Financial assets held for trading:
Equity securities 28.6 2,344,572 - - 2,344,572 1,706,751 - - 1,706,751
Derivative financial instruments 28.6 - 50,737 - 50,737 - - - -
Designated at FVTPL
Investments for the benefit of Life insurance policyholders who bear the investment risk
Equity securities 28.6 1,628,378 - - 1,628,378 1,814,977 - - 1,814,977
Debt securities 28.6 - 86,790 - 86,790 - 56,283 - 56,283
Government securities 28.6 158,242 223,361 - 381,603 259,630 202,959 - 462,589
Fixed deposits 28.6 - 32,434 - 32,434 - 45,736 - 45,736
4,131,192 393,322 - 4,524,514 3,781,358 304,978 - 4,086,336
AFS financial assets:
Treasury bonds 28.5 7,900,165 - - 7,900,165 5,822,216 - - 5,822,216
Treasury bills 28.5 165,832 - - 165,832 132,815 - - 132,815
8,065,997 - - 8,065,997 5,955,031 - - 5,955,031
Total of fair values of financial assets carried at fair value
12,197,189 393,322 -
12,590,511 9,736,389 304,978 - 10,041,367
8.3 Transfer between levels
There were no transfers in 2017. (2016 - Nil)
8.4 Financial assets and liabilities not measured at fair value
Financial assets and liabilities of which value approximates
carrying value.
The following financial assets and liabilities that have a
short term maturity, it is assumed that the carrying amounts
approximate their fair values.
As at 31 December 2017 Rs. '000
2016Rs. '000
Financial Assets
Reinsurance receivable 267,417 178,181
Premiums receivable 268,511 246,800
Receivables and other assets 361,181 404,898
Cash in hand and at bank 580,126 379,232
Financial Liabilities
Reinsurance payables 345,146 208,742
Other financial liabilities 639,741 573,146
Bank overdraft 195,306 105,306
The fair value of policyholder loans are equals to its carrying
value as those are given at competitive market rates.

UNION ASSURANCE PLC | ANNUAL REPORT 2017
208
NOTES TO THE FINANCIAL STATEMENTS
8.5 Fixed rate financial instruments
The fair value of fixed rate financial investments carried
at amortised cost are estimated by comparing market
interest rates when they were first recognised with current
market rates for similar financial instruments. The estimated
fair value of fixed interest bearing deposits is based on
discounted cash flows using prevailing money market
interest rates for debts with similar credit risk and maturity.
For quoted debt issued, the fair values are determined
based on observable market inputs.
Table below analyses the fair value of financial investments
in to their levels in fair value hierarchy which are carried at
amortised cost.
Fair value hierarchy
As at 31 December 2017 2016
Rs.’000 NoteAmortised
cost Level 1 Level 2 Level 3 Total Amortised
cost Level 1 Level 2 Level 3 Total
HTM financial assets
Quoted debentures 28.3 290,985 75,475 255,014 - 330,489 853,960 56,534 818,971 - 875,505
Treasury bonds 28.3 18,028,394 18,941,981 - - 18,941,981 14,542,076 13,720,452 - - 13,720,452
18,319,379 19,017,456 255,014 - 19,272,470 15,396,036 13,776,986 818,971 - 14,595,957
L & R financial assets
Bank deposits 28.4 647,447 - 647,484 - 647,484 584,609 - 591,372 - 591,372
Quoted debentures 28.4 4,625,307 2,153,269 2,542,218 - 4,695,487 4,553,805 1,788,347 2,765,458 4,553,805
Reverse repurchase
agreements 28.4 610,277 - 610,277 - 610,277 271,439 - 271,439 - 271,439
5,883,031 2,153,269 3,799,979 - 5,953,248 5,409,853 1,788,347 3,628,269 - 5,416,616
Total of fair values of financial investments not measured at fair value 24,202,410 21,170,725 4,054,993 - 25,225,718 20,805,889 15,565,333 4,447,240 - 20,012,573
9 Financial Assets and Liabilities
9.1 Non Derivative Financial Assets
Accounting Policy
Initial Recognition and Measurement
The Company initially recognises loans and receivables
and deposits on the date that they are originated. All
other financial assets (including assets designated at fair
value through profit or loss) are recognised initially on the
trade date at which the Company becomes a party to the
contractual provisions of the instrument.
In the case of financial assets not measured at fair value
through profit or loss, it is measured initially at fair value
plus transaction costs that are directly attributable to its
acquisition or issue.
Income and expenses are presented on a net basis only
when permitted under SLFRSs / LKASs, or for gains and
losses arising from a group of similar transactions such as
the Company’s trading activity.
Depending on the intention and ability to hold the invested
assets, the financial assets category and their classification
categories are shown in the table below.
Held To Maturity (HTM)
Loans and Receivables (L&R)
Financial assets with fixed or determinable payments and fixed maturities are classified as held
to maturity when the Company has the positive intention and ability to hold it to maturity.
Loans and receivables are financial assets with fixed or determinable payments that are not
quoted in an active market.

209
UNION ASSURANCE PLC | ANNUAL REPORT 2017
FIN
AN
CIA
L IN
FO
RM
ATIO
N
Available For Sale (AFS)
Fair Value Through Profit or Loss (FVTPL)
Financial assets that are designated as AFS and that are not classified in any of the previous
categories.
AFS financial investments include equity and debt securities. Equity investments classified as AFS
are those that are neither classified as held for trading nor designated at FVTPL. Debt securities in
this category are those that are intended to be held for an indefinite period of time and which may
be sold in response to the need for liquidity or in response to changes in the market conditions.
Financial assets held for trading and those designated upon initial recognition at FVTPL and
investments typically bought with the intention to sell in the near future.
For investments designated at FVTPL, the following criteria must be met;
The designation eliminates or significantly reduces the inconsistent treatment that would
otherwise arise from measuring the assets or liabilities or recognising gains or losses on a
different basis, Or
The assets and liabilities are part of a Company's financial assets, financial liabilities or both,
which are managed and their performance evaluated on a fair value basis, in accordance with
the Company’s' investment strategy.
Subsequent Measurement
Fair Value Through Profit or Loss (FVTPL)
Financial assets at fair value through profit or loss
investments are carried in the statement of financial position
at fair value with changes in fair value recognised in the
income statement.
Financial assets at fair value through profit or loss comprises
of financial assets of the unit linked fund, equity instruments
and derivative financial instruments of the life fund.
Held to Maturity Financial Assets (HTM)
Subsequent to initial recognition held to maturity financial
assets are measured at amortised cost using the effective
interest method, less any impairment losses.
Amortised cost is calculated by taking into account any
discount or premium on acquisition and fees or costs that
are an integral part of the effective interest rate (EIR). The
EIR amortisation is included in net investment income in the
income statement.
Held to maturity financial assets comprise of quoted
debentures and treasury bonds.
Loans and Receivables (L&R)
Subsequent to initial recognition, loans and receivables
are measured at amortised cost using the effective interest
method, less any impairment losses.
Loans and receivables comprise of investments in quoted
debentures, reverse repurchase agreements, policy
loans and other loans, reinsurance receivable, premiums
receivable and cash at bank and in hand.
Available for Sale Financial Assets (AFS)
Subsequent to initial recognition, they are measured at fair
value and changes therein, other than impairment losses on
available for sale equity instruments, are recognised in the
statement of profit or loss and other comprehensive income
and presented within equity in the available for sale reserve.
AFS financial assets comprise of treasury bills and bonds.
Company's non derivative financial assets and their
classifications are summarised as follows;
Financial Asset Category
HTM AFS L&R FVTPL
Treasury bonds - -
Treasury bills - -
Reverse repurchase agreements - -
Quoted shares - - -
Corporate debts -
Policy loans - - -
Staff and advisor loans - - -
Term deposits - -
Cash in hand and at bank - - -
Reinsurance receivables - - -
Premiums receivable - - -
Other receivables - - -

UNION ASSURANCE PLC | ANNUAL REPORT 2017
210
NOTES TO THE FINANCIAL STATEMENTS
Impairment of Financial Assets
The Company assesses at each reporting date whether
there is any objective evidence that a financial asset or a
group of financial assets is impaired. A financial asset or a
group of finance assets is deemed to be impaired if, and
only if, there is objective evidence of impairment as a result
of one or more events that has occurred after the initial
recognition of the asset and the loss event has an impact on
the estimated future cash flows of the financial asset or the
group of financial assets that can be reliably estimated.
Objective evidence that financial assets (including equity
securities) are impaired may include;
Significant financial difficulty of the borrower or user,
Default or delinquency by debtor,
It becoming probable that the issuer or debtor will enter
bankruptcy or other financial reorganization,
Adverse change in the payment status of issuers or
debtors in the Company, or
In the case of equity a significant or prolonged decline in
its fair value below its cost.
Impairment Losses on Financial Assets Carried at Amortised Cost
The Company considers evidence of impairment for financial
assets measured at amortised cost (L&R and HTM financial
assets) at both a specific asset and collective level. All
individually significant assets are assessed for specific
impairment. Those found not to be specifically impaired are
then collectively assessed or any impairment that has been
incurred but not yet identified. Assets that are not individually
significant are collectively assessed for impairment by
grouping together assets with similar risk characteristics.
An impairment loss in respect of a financial asset measured
at amortised cost is calculated as the difference between
its carrying amount and the present value of the estimated
future cash flows discounted at the asset’s original effective
interest rate. Losses are recognised in income statement
under other cost and reflected in an allowance account
against L&R or HTM investment securities. Interest on the
impaired asset continues to be recognised. When an event
occurring after the impairment was recognised causes the
amount of impairment loss to decrease, the decrease in
impairment loss is reversed through the income statement.
Impairment Losses on AFS Financial Assets
Impairment losses on AFS financial assets are recognised
by reclassifying the losses accumulated in the fair value
reserve in equity to the income statement. The cumulative
loss that is reclassified from equity to profit or loss is the
difference between the acquisition cost, net of any principal
repayment and amortisation, and the current fair value,
less any impairment loss recognised previously in profit or
loss. Changes in cumulative impairment losses attributable
to application of the effective interest method are reflected
as a component of interest income. In the case of equity
investments impairment, the cumulative loss is measured as
the difference between the acquisition cost and the current
fair value, less any impairment loss on that investment
previously recognised in the income statement.
If, in a subsequent period, the fair value of an impaired AFS
debt security increases and the increase can be related
objectively to an event occurring after the impairment loss
was recognised, then the impairment loss is reversed,
with the amount of the reversal recognised in profit or loss.
However, impairment losses on equity investments are not
reversed through the income statement and increases in
their fair value after impairment is recognised directly in the
statement of profit or loss and other comprehensive income.
Derecognition
The Company derecognises a financial asset when;
The rights to receive cash flows from the asset have
expired, or the Company has transferred its rights to receive
cash flows from the asset or has assumed an obligation to
pay the received cash flows in full without material delay to a
third party under a ‘pass through’ arrangement and either;
(a) the Company has transferred substantially all the risks
and rewards of the asset, or
(b) the Company has neither transferred nor retained
substantially all the risks and rewards of the asset, but
has transferred control of the asset.
On derecognition of a financial asset, the difference between
the carrying amount of the asset (or the carrying amount
allocated to the portion of the asset transferred), and the
sum of;
(a) the consideration received (including any new asset
obtained less any new liability assumed) and
(b) In case of AFS financial investments, any cumulative
gain or loss that had been recognised in the statement
of profit or loss and other comprehensive income is
recognised in the income statement.

211
UNION ASSURANCE PLC | ANNUAL REPORT 2017
FIN
AN
CIA
L IN
FO
RM
ATIO
N
9.2 Non Derivative Financial Liabilities
Accounting Policy
Initial Recognition and Measurement
The Company initially recognises debt securities issued and
subordinated liabilities on the date that they are originated.
All other liabilities are recognised initially on the trade date
at which the Company becomes a party to the contractual
provisions of the instrument.
The Company classifies non derivative financial liabilities into
other financial liabilities category. Such financial liabilities are
recognised initially at fair value plus any directly attributable
transaction costs. Subsequent to initial recognition, these
financial liabilities are measured at amortised cost using the
effective interest method.
Other financial liabilities comprise, reinsurance payables,
other liabilities and bank overdraft.
Derecognition
The Company derecognises a financial liability when its
contractual obligations are discharged, cancelled or expired.
9.3 Offsetting of Financial Instruments
Financial assets and financial liabilities are offset and the net
amount reported in the statement of financial position if, and
only if, there is a currently enforceable legal right to offset
the recognised amounts and there is an intention to settle on
a net basis, or to realise the assets and settle the liabilities
simultaneously.
9.4 Amortised Cost Measurement
The amortised cost of a financial asset or liability is the
amount at which the financial asset or liability is measured
at initial recognition, minus principal repayments, plus
or minus the cumulative amortisation using the effective
interest method of any difference between the initial amount
recognised and the maturity amount, minus any reduction
for impairment.
9.5 Reclassification of Financial Assets and Liabilities
The Company reclassifies non derivative financial assets out
of the held for trading category and into the AFS, L&R, or
HTM categories as permitted by the Sri Lanka Accounting
Standard LKAS 39 - Financial Instruments: Recognition
and Measurement, Further, in certain circumstances, the
Company is permitted to reclassify financial instruments
out of the AFS category and into the L&R category.
Reclassifications are recorded at fair value at the date of
reclassification, which becomes the new amortised cost.
Reclassification to held to maturity is permitted only when
the entity has the ability and intention to hold the financial
asset until maturity.
For a financial asset with a fixed maturity reclassified out
of the AFS category, any previous gain or loss on that asset
that has been recognised in equity is amortised to profit
or loss over the remaining life of the asset using the EIR.
Any difference between the new amortised cost and the
expected cash flows is also amortised over the remaining
life of the asset using the EIR. If the asset is subsequently
determined to be impaired, then the amount recorded in
equity is reclassified to the income statement.
In the case of a financial asset that does not have a fixed
maturity, the gain or loss is recognised in the profit or loss
when such financial asset is sold or disposed of. If the
financial asset is subsequently determined to be impaired,
then the amount recorded in equity is recycled to profit
or loss.
The Company may reclassify a non derivative trading asset
out of the 'held for trading' category and into the 'L&R'
category, if it meets the definition of loans and receivables
and the Company has the intention and ability to hold the
financial asset for the foreseeable future or until maturity.
If a financial asset is reclassified and if the Company
subsequently increases its estimates of future cash receipts
as a result of increased recoverability of those cash receipts,
the effect of that increase is recognised as an adjustment to
the EIR from the date of the change in estimate.
Reclassification is at the election of the management and is
determined on an instrument by instrument basis.
The Company does not reclassify any financial instrument
into the FVTPL category after initial recognition. Further,
the Company does not reclassify any financial instrument
out of the FVTPL category if upon initial recognition it was
designated as fair value through profit or loss.
9.6 Derivatives Held for Risk Management Purposes
Derivatives held for risk management purposes include
all derivative assets and liabilities that are not classified
as trading assets or liabilities. Derivatives held for risk
management purposes are measured at fair value in the
statement of financial position.
Other Non Trading Derivatives
If a derivative is not held for trading, and is not designated
in a qualifying hedge relationship, then all changes in its
fair value are recognised immediately in profit or loss as a
component of net income from other financial instruments
at FVTPL.

UNION ASSURANCE PLC | ANNUAL REPORT 2017
212
NOTES TO THE FINANCIAL STATEMENTS
10 Gross Written Premium (GWP)
Accounting Policy
Revenue is recognised to the extent that it is probable that
the economic benefits will flow to the Company and the
revenue can be reliably measured.
Gross written premiums on life and investment contracts with
discretionary participating features (DPF) are recognised
as revenue when receivable from the policyholder (policies
within the 30 day grace period are considered as due). For
single premium business, revenue is recognised on the date
on which the policy is effective.
Premiums received in advance are not recorded as
revenue and recorded as liability until the premium is due
unless otherwise the relevant policy conditions require
such premiums to be recognised as income. Benefits and
expenses are provided against such revenue to recognise
profits over the estimated life of the policies.
For the year ended 31 December 2017 2016Rs. '000 Rs. '000
Conventional 9,948,845 7,978,191
Unit linked 168,785 292,560
Total gross written premium 10,117,630 8,270,751
For the year ended 31 December 2017 2016
Rs.’000 Conventional Unit linked Total Conventional Unit linked Total
Individual policies
First year premium 3,033,613 12,842 3,046,455 2,397,493 46,098 2,443,591
Renewal premium 6,262,164 153,893 6,416,057 5,189,512 242,103 5,431,615
Single premium 528,356 2,050 530,406 283,477 4,359 287,836
9,824,133 168,785 9,992,918 7,870,482 292,560 8,163,042
Corporate policies
New business premium 34,583 - 34,583 22,943 - 22,943
Renewal premium 90,129 - 90,129 84,766 - 84,766
124,712 - 124,712 107,709 - 107,709
Total gross written premium 9,948,845 168,785 10,117,630 7,978,191 292,560 8,270,751
Financial Assets and Liabilities by Category
L&R FVTPL
As at 31 DecemberRs'000 Note
2017 2016 2017 2016
Financial Assets
Financial investments 28 5,883,031 5,409,853 4,524,514 4,086,336
Loans to life policyholders 29 1,001,538 867,177 - -
Reinsurance receivable 30 267,417 178,181 - -
Premiums receivable 31 268,511 246,800 - -
Receivables and other assets 32 361,181 404,898 - -
Cash in hand and at bank 33 580,126 379,232 - -
Total financial assets 8,361,804 7,486,141 4,524,514 4,086,336
Financial Liabilities
Reinsurance payables 41 - - - -
Other financial liabilities 42 - - - -
Bank overdraft 33 - - - -
Total financial liabilities - - - -

213
UNION ASSURANCE PLC | ANNUAL REPORT 2017
FIN
AN
CIA
L IN
FO
RM
ATIO
N
AFS HTM Other financial liabilities Total
2017 2016 2017 2016 2017 2016 2017 2016
8,065,997 5,955,031 18,319,379 15,396,036 - - 36,792,921 30,847,256
- - - - - - 1,001,538 867,177
- - - - - - 267,417 178,181
- - - - - - 268,511 246,800
- - - - - - 361,181 404,898
- - - - - - 580,126 379,232
8,065,997 5,955,031 18,319,379 15,396,036 - - 39,271,694 32,923,544
- - - 345,146 208,742 345,146 208,742
- - - 639,741 573,146 639,741 573,146
- - - 195,306 150,306 195,306 150,306
- - - - 1,180,193 932,194 1,180,193 932,194
11 Premium Ceded to Reinsurers
Accounting Policy
Reinsurance premiums on life and investment contracts are
recognised as an expense on the earlier of the date when
premiums are payable or when the policy becomes effective.
Value of the premiums are decided on the rates agreed with
reinsurers and accounted on an accrual basis.
For the year ended 31 December 2017 2016Rs. '000 Rs. '000
Conventional 496,641 422,742
Unit linked 971 1,115
Total premium ceded to reinsurers 497,612 423,857
0
2,000
4,000
6,000
8,000
10,000
12,000

UNION ASSURANCE PLC | ANNUAL REPORT 2017
214
NOTES TO THE FINANCIAL STATEMENTS
12 Net Investment Income
Accounting Policy
Investment income comprises interest income on funds
invested (including AFS financial assets) and dividend income.
Interest income is recognised in the income statement as it
accrues and is calculated by using the Effective Interest Rate
method (EIR). The effective interest rate is the rate that exactly
discounts the estimated future cash receipts or payments
through the expected life of the financial asset or liabilities
(or, where appropriate, a shorter period) to the carrying
amount of the financial asset or liabilities. When calculating
the EIR, the Company estimates future cash flows considering
all contractual terms of the financial instrument, but not
future credit losses. The calculation of the EIR includes all
transaction costs and fees that are an integral part of the EIR.
Transaction costs include incremental costs that are directly
attributable to the acquisition or issue of a financial asset or
liability. Fees and commissions that are an integral part of the
effective yield of the financial asset or liability are recognised
as an adjustment to the EIR of the instrument.
Investment related expenses consist of costs relating to
investment such as custodial fee, bank guarantee fee and
brokerage fee, etc. These expenses are recognised on an
accrual basis.
Dividends on equity investments are recognised in the
income statement when the right to receive payment is
established which is on the date at which the investment is
priced ‘ex dividend’.
For the year ended 2017 201631 December Note Rs. '000 Rs. '000
Investment income from;
Held to maturity financial
assets 12.1 1,928,009 1,697,817
Loans and receivables 12.2 802,686 274,111
Available for sale
financial assets 12.3 776,659 914,416
Financial assets at fair value
through profit or loss 12.4 190,026 177,921
Investment related expenses (61,372) (39,171)
Total net investment income 3,636,008 3,025,094
0
5
10
15
20
60
70
80

215
UNION ASSURANCE PLC | ANNUAL REPORT 2017
FIN
AN
CIA
L IN
FO
RM
ATIO
N
12.1 Investment Income from Held to Maturity Financial Assets
For the year ended 31 December 2017 2016Rs. '000 Rs. '000
Interest incomeQuoted debentures 123,686 178,857
Treasury bonds 1,804,323 1,518,960
1,928,009 1,697,817
12.2 Investment Income from Loans and Receivables
For the year ended 31 December 2017 2016Rs. '000 Rs. '000
Interest incomeInterest income on policy loans 127,924 112,928
Reverse repurchase agreements 41,118 73,212
Fixed deposits 68,507 61,350
Interest income on loans given
to staff and agents 16,440 18,495
Unquoted debentures - 6,520
Quoted debentures 540,277 -
Savings account interest 7,376 1,344
Call deposits 1,044 262
802,686 274,111
12.3 Investment Income from Available for Sale Financial Assets
For the year ended 31 December 2017 2016Rs. '000 Rs. '000
Interest incomeQuoted debentures - 428,898
Treasury bonds 764,464 475,632
Treasury bills 12,195 9,886
776,659 914,416
12.4 Investment Income from Fair Value Through Profit or Loss
For the year ended 31 December 2017 2016Rs. '000 Rs. '000
Interest incomeTreasury bills 15,403 19,951
Treasury bonds 3,553 2,648
Quoted debentures 7,139 4,010
Reverse repurchase agreements 17,262 19,642
Fixed deposits 8,413 871
Commercial paper - 683
51,770 47,805
Dividend incomeHeld for trading - Conventional 74,255 60,982
Held for trading - Unit linked 64,001 69,134
138,256 130,116
190,026 177,921
13 Net Realised Gains / Losses Accounting Policy
Realised gains and losses recorded in the income statement
on investments include gains and losses on financial assets.
Gains and losses on the sale of investments are calculated as
the difference between net sales proceeds and the carrying
value, and are recorded on occurrence of the sale transaction.
On derecognition of an investment classified as AFS, the
cumulative gain or loss previously recognised in other
comprehensive income is recognised in the income statement.
For the year ended 31 December 2017 2016Rs. '000 Rs. '000
Realised gains 117,564 48
Realised losses (41,973) (131,996)
Total net realised gains / (losses) 75,591 (131,948)
For the year ended 31 December 2017 2016
Rs.’000Realised
gainsRealised
losses
Net realised gains / (losses)
Realised gains
Realised losses
Net realised gains / (losses)
Available for sale financial assetsDebentures - - - 25 - 25
Treasury bonds - (23) (23) 23 - 23
- (23) (23) 48 - 48
Fair value through profit or loss financial assets
Quoted equity securities 117,564 (41,950) 75,614 - (131,996) (131,996)
117,564 (41,950) 75,614 - (131,996) (131,996)
117,564 (41,973) 75,591 48 (131,996) (131,948)

UNION ASSURANCE PLC | ANNUAL REPORT 2017
216
NOTES TO THE FINANCIAL STATEMENTS
14 Net Fair Value Gains / (Losses)
Accounting Policy
Fair value gains and losses recorded in the income
statement on investments include fair value gains / losses on
financial assets at FVTPL and unrealised gain on derivative
financial instruments.
For the year ended 31 December 2017 2016Rs. '000 Rs. '000
Fair value through profit or loss financial assets
Quoted equity securities 204,767 (32,858)
Treasury bonds 2,118 (1,233)
Treasury bills 384 734
Debentures 354 (1,394)
Unrealised gain on derivative
financial instruments 50,737 -
Total net fair value gains / (losses) 258,360 (34,751)
15 Other Income
Accounting Policy
Other income comprises fees charged for policy
administration services, disposal gains / losses on property,
plant and equipment, mortality charges, rent income and
miscellaneous income.
For the year ended 31 December 2017 2016Rs. '000 Rs. '000
Policy administration fee 10,418 11,216
Mortality charges 9,774 11,978
Miscellaneous income 25,646 16,512
Rent income 17,751 18,864
Gains / (losses) on sale of
property, plant and equipment (413) 83
Total other income 63,176 58,653
16 Net Insurance Benefits and Claims Paid
Accounting Policy
Gross benefits and claims for life insurance contracts include
the cost of all claims arising during the year, including internal
and external claims handling costs that are directly related
to the processing and settlement of claims and policyholder
bonuses declared on DPF contracts. Death claims and
surrenders are recorded on the basis of notifications received.
Maturities and annuity payments are recorded when due.
For the year ended 31 December 2017 2016
Rs.’000
Grossclaims
paid
Claimsrecovered from
reinsurers
Netclaims
paid
Grossclaims
paid
Claimsrecovered from
reinsurers
Netclaims
paid
Death, disability and hospitalisation 428,391 (154,455) 273,936 365,914 (157,860) 208,054
Surrenders 506,382 - 506,382 363,764 - 363,764
Annuity payments 13,366 - 13,366 2,191 - 2,191
Policy maturities 1,880,049 - 1,880,049 950,301 - 950,301
Total net insurance benefits and claims paid 2,828,188 (154,455) 2,673,733 1,682,170 (157,860) 1,524,310
(5)
0
5
10
15
20
25
30

217
UNION ASSURANCE PLC | ANNUAL REPORT 2017
FIN
AN
CIA
L IN
FO
RM
ATIO
N
17 Net Change in Insurance Claims Outstanding
Accounting Policy
Reinsurance claims recoveries are recognised when the
related gross insurance claim is recognised according to the
terms of the relevant contract.
Differences between the estimated cost and subsequent
settlement of claims or re-estimated costs are recognised in
the income statement in the year in which they are settled or
in which the insurance contract liabilities are re-estimated.
Net change in insurance claims outstanding is recognised in
the income statement.
For the year ended 31 December 2017 2016
Rs.’000
Gross changein insurance
claimsoutstanding
Change inreinsurancerecoverable
Net changein insurance
claimsoutstanding
Gross changein insurance
claimsoutstanding
Change inreinsurancerecoverable
Net changein insurance
claimsoutstanding
Death, disability and hospitalisation 89,187 (89,235) (48) 33,577 (28,410) 5,167
Surrenders 3,170 - 3,170 54 - 54
Policy maturities 2,180 - 2,180 65,854 - 65,854
Total net change in insurance claims outstanding 94,537 (89,235) 5,302 99,485 (28,410) 71,075
17.1 Net Insurance Benefits and Claims Expense
For the year ended 31 December 2017 2016Note Rs. '000 Rs. '000
Net insurance benefits and claims paid 16 2,673,733 1,524,310
Net change in insurance claims outstanding 17 5,302 71,075
Total net insurance benefits and claims expense 2,679,035 1,595,385
(100)
(80)
(60)
(40)
(20)
0
20
40
60
80
100

UNION ASSURANCE PLC | ANNUAL REPORT 2017
218
NOTES TO THE FINANCIAL STATEMENTS
18 Change in Contract Liabilities - Life Fund
Accounting Policy
Changes in the valuation of insurance contract liabilities are recognised in the income statement under change in contract liabilities.
For the year ended 31 December 2017 2016
Rs.’000 Note Gross Reinsurance Net Gross Reinsurance Net
Premiums written 10 / 11 10,117,630 (497,612) 9,620,018 8,270,751 (423,857) 7,846,894
Insurance benefits and claims
incurred 17.1 (2,922,725) 243,690 (2,679,035) (1,781,655) 186,270 (1,595,385)
Underwriting and net acquisition
costs (including reinsurance) 19 (1,902,872) 61,721 (1,841,151) (1,528,721) 87,104 (1,441,617)
Other operating, selling and
administrative expenses
attributable to policyholders (2,570,396) - (2,570,396) (2,157,253) - (2,157,253)
Investment and other income
attributable to policyholders 3,822,225 - 3,822,225 2,746,305 - 2,746,305
Income tax (expense) / reversal - - - (60,679) - (60,679)
Surplus from life insurance fund
transferred to Life shareholder’s fund 38.5 (a) (3,642,000) - (3,642,000) (1,100,000) - (1,100,000)
Change in contract liabilities - Life Fund 2,901,862 (192,201) 2,709,661 4,388,748 (150,483) 4,238,265
19 Underwriting and Net Acquisition Costs (Net of Reinsurance)
Accounting Policy
All acquisition costs are recognised as an expense when
incurred. Reinsurance commission income on outward
reinsurance contracts is recognised when receivable.
For the year ended 31 December 2017 2016Rs. '000 Rs. '000
Acquisition cost 1,902,872 1,528,721
Reinsurance commission
including profit commission (61,721) (87,104)
Total underwriting and net acquisition costs 1,841,151 1,441,617
20 Other Operating, Administrative and Selling Expenses
Accounting Policy
Expenses are recognised in the income statement on the
basis of a direct association between the cost incurred and
the earning of specific items of income. All expenditure
incurred in the running of the business and in maintaining
the property, plant and equipment in a state of efficiency has
been charged to the income statement.
For the year ended 31 December 2017 2016
Note Rs. '000 Rs. '000
Employee benefits
expenses 20.1 815,989 771,604
Administration and
establishment expenses 1,102,577 857,656
Selling expenses 585,767 435,533
Total other operating, administrative and selling expenses 2,504,333 2,064,793
20.1 Employee Benefits Expenses
Refer Note 40 for the Accounting Policy.
Short term employee benefit obligations are measured on an
undiscounted basis and are expensed as the related service
is provided. A liability is recognised for the amount expected
to be paid under short - term cash bonus if the Company has
a present legal or constructive obligation to pay this amount
as a result of past service provided by the employee, and the
obligation can be estimated reliably.

219
UNION ASSURANCE PLC | ANNUAL REPORT 2017
FIN
AN
CIA
L IN
FO
RM
ATIO
N
For the year ended 31 December 2017 2016
Note Rs. '000 Rs. '000
Short Term Employee Benefits
Staff remuneration 634,547 606,639
Defined contribution plan
cost - EPF 55,238 52,086
Defined contribution plan
cost - ETF 13,810 13,021
Staff welfare 36,363 30,989
Training expenses 32,439 23,817
Other costs 10,807 14,640
783,204 741,192
Long Term Employee Benefits
Defined benefit plan cost 40.3 22,762 20,948
Share based payment
expense 36.3 10,023 9,464
32,785 30,412
Total employee benefits expenses 815,989 771,604
21 Profit Before TaxProfit before tax is stated after charging all expenses
including the following;
For the year ended 31 December 2017 2016
Note Rs. '000 Rs. '000
Directors fees and
emoluments 44,559 34,711
Auditors remuneration
- Statutory audit and
audit related services 4,355 4,271
- Non audit related
services 1,332 1,208
Legal fees 1,328 2,551
Depreciation 26.1 71,597 80,524
Amortisation 25.1 33,026 30,366
Defined contribution plan
- EPF 20.1 55,238 52,086
- ETF 20.1 13,810 13,021
Defined benefit plan cost 40.3 22,762 20,948
Research and
development costs 465 1,488
CSR expenses 12,681 8,719
Provision for impairment of
- Staff loans 32.1 (a) - 358
- Agent loans 32.2 (a) 541 374
22 Income Tax Expense
Accounting Policy
Income tax expense comprises current and deferred tax.
Current tax and deferred tax relating to items recognised
directly in equity or OCI is recognised in equity or OCI and
not in the income statement. Current tax assets and liabilities
are offset only if certain criteria are met.
22.1 Current Tax
Current tax is the expected tax payable or receivable on the
taxable income or loss for the year, using tax rates enacted
or substantively enacted at the reporting date, and any
adjustment to tax payable in respect of previous years.
22.2 Tax Exposures
In determining the amount of current and deferred tax,
the Company takes into account the impact of uncertain
tax positions and whether additional taxes and interest
may be due. This assessment relies on estimates and
assumptions and may involve a series of judgements about
future events. New information may become available that
causes the Company to change its judgement regarding the
adequacy of existing tax liabilities and such changes to tax
liabilities will impact tax expense in the period that such a
determination is made.
22.3 Economic Service Charge (ESC)
As per the provisions of the Economic Service Charge Act
No.13 of 2006 and the amendments thereto, ESC is payable
on the liable turnover at specified rates. ESC is deductible
from the income tax liability. Any unclaimed liability can be
carried forward within the specified time period mentioned in
the Act and set off against the income tax payable as per the
relevant provisions in the Act
22.4 Crop Insurance Levy
The Crop Insurance Levy was introduced under the
provisions of Section 14 of the Finance Act No. 12 of 2013,
and came into effect from 1 April 2013. It is payable to the
National Insurance Trust Fund and liable at 1% of the Profit
after Tax.
22.5 Withholding Tax on Dividends
Withholding tax that arises from the distribution of dividends
by the Company is recognised at the time the liability to pay
the related dividend is recognised.

UNION ASSURANCE PLC | ANNUAL REPORT 2017
220
NOTES TO THE FINANCIAL STATEMENTS
22.6 Sales Tax
Revenues, expenses and assets are recognised net of the
amount of sales tax except;
Where the sales tax incurred on a purchase of asset or
service is not recoverable from the taxation authority,
in which case the sales tax is recognised as part of the
cost of acquisition of the asset or as part of the expense
item as applicable; and
Receivables and payables that are stated with the
amount of sales tax included.
The net amount of sales tax recoverable from, or payable to,
to the taxation authority is included as a part of receivables
or payables in the statement of financial position.
22.7 Deferred Tax Assets
Deferred tax is recognised in respect of temporary
differences between the carrying amounts of assets and
liabilities for financial reporting purposes and amounts used
for taxation purposes. Deferred tax is not recognised for;
Temporary differences on the initial recognition of
assets or liabilities in a transaction that is not a business
combination and that affects neither accounting nor
taxable profit or loss;
Temporary differences related to investments in
subsidiaries, associates and jointly controlled entities to
the extent that the Company is able to control the timing
of the reversal of the temporary differences and it is
probable that they will not reverse in the foreseeable
future; and
Taxable temporary differences arising on the initial
recognition of goodwill.
The measurement of deferred tax reflects the tax
consequences that would follow the manner in which the
Company expects, at the end of the reporting period, to
recover or settle the carrying amount of its assets and
liabilities.
Deferred tax assets and liabilities are offset if there is a
legally enforceable right to offset current tax liabilities and
assets, and they relate to taxes levied by the same tax
authority on the same taxable entity, or on different tax
entities, but they intend to settle current tax liabilities and
assets on a net basis or their tax assets and liabilities will be
realised simultaneously.
A deferred tax asset is recognised for unused tax losses
and deductible temporary differences to the extent that it is
probable that future taxable profit will be available against
which the temporary differences can be utilised. Deferred
tax assets are reviewed at each reporting date and are
reduced to the extent that it is no longer probable that the
related benefit will be realised.
Deferred tax assets and liabilities are measured at the
tax rates that are expected to be applied to temporary
differences when they reverse, based on the laws that have
been enacted or substantially enacted by the reporting date.
22.8 Tax Expenses / Reversal
22.8 (a) Amount Recognised in the Profit or Loss
For the year ended 31 December 2017 2016
Note Rs. '000 Rs. '000
Current tax expense
Current tax expense for
the year - -
- -
Deferred tax expense
Origination of deferred
tax assets
22.11 (a) - 4,557
Origination of deferred
tax liabilities
22.11 (a) - (65,236)
Net deferred tax expense recognised in the profit or loss - (60,679)
Income tax expense recognised in the profit or loss - (60,679)
Union Assurance PLC is liable to income tax at 28% in 2017
(2016 - 28%) in terms of the Inland Revenue Act No. 10 of
2006 and amendments thereto. Currently, the Company does
not have an income tax expense as the business continues
to report taxable losses.
Income tax expenses excludes the Company's share of
income tax (expenses) / reversal of equity accounted
investee of Rs. 6.9 million [2016 - Rs. (48.8 million)], which
has been included in share of profit of equity accounted
investee, net of tax.

221
UNION ASSURANCE PLC | ANNUAL REPORT 2017
FIN
AN
CIA
L IN
FO
RM
ATIO
N
22.8 (b) Amount Recognised in Other Comprehensive Income (OCI)
For the year ended 31 December 2017 2016
Note Rs. '000 Rs. '000
Other comprehensive income
Items that will not be reclassified to profit or loss
Revaluation of property
plant and equipment - 1,517
Reassessment of defined
benefit obligations - 1,361
Items that may be reclassified subsequently to profit or loss
Available for sale
investment securities - 57,801
Deferred tax expense recognised in OCI
22.11 (a) - 60,679
22.8 (c) Impact of the Inland Revenue Act No 24 of 2017
Based on Inland Revenue Act No 24 of 2017, which has
been legislated and is expected to become effective from
1 April 2018, the gains and profits liable to tax from the
business of Life Assurance, whether mutual or proprietary,
is the aggregate of the following, subject to the deduction of
any unrelieved loss from business specified in the Act.
The surplus distributed to shareholders from the life
insurance policyholders fund, as certified by the
Appointed Actuary, and
The investment income of the shareholders fund less any
expenses incurred in the production of such income.
The surplus distributed to a life insurance policyholder who
shares the profits of a person engaged in life insurance
business shall be deemed as profits from business of that
person and be liable to tax accordingly.
Temporary concession has been granted via a reduced rate
of tax of 14% on the surplus distributed to life insurance
policyholders who shares profits, for three years of
assessment from the commencement of the Act.
This amendment to the existing tax law will change the
tax base for the Company and accordingly, the re -
measurement of deferred tax assets and liabilities of the
Company. In the absence of transitional provisions relating
to recognition of tax losses carried forward and tax relating
to sale of land and building (business assets) held on behalf
of the policyholders, no adjustments have been made to the
basis on which the Company has been recognising deferred
tax assets / liabilities so far, and no entries have been
passed in the current year for deferred tax asset / liability
computation.
22.8 (d) Reconciliation of Effective Tax Rate
A reconciliation between tax expense and the product of accounting profit.
For the year ended 31 December 2017 2016Rs. '000 Rs. '000
Profit from continuing operations 7,384,128 1,312,628
Income tax expense - 60,679
Profit before tax from continuing operations 7,384,128 1,373,307
Tax using the Company’s domestic tax rate 28% 2,067,556 28% 384,526
Share of profit of equity accounted investee reported net of tax 1% 52,596 1% 16,888
Aggregate disallowable expenses 8% 573,453 71% 981,503
Tax - exempt income (36%) (2,693,605) (104%) (1,425,696)
Current year losses for which no deferred tax asset is
recognised - - 3% 42,779
Deferred tax expense - - (4%) (60,679)
Total income tax expense - - (4%) (60,679)

UNION ASSURANCE PLC | ANNUAL REPORT 2017
222
NOTES TO THE FINANCIAL STATEMENTS
22.9 Tax Loss Analysis
The tax loss carried forward as at the reporting date is
Rs. 5,472 million (2016 - Rs.3,950 million) which is made up
as follows;
For the year ended 31 December 2017 2016Rs. '000 Rs. '000
Balance as at 1 January 3,949,822 3,767,271
Utilised during the year - -
3,949,822 3,767,271
Loss incurred in the business of
life insurance 944,597 152,783
Unrecognised tax losses from
previous year 577,769 29,768
Balance as at 31 December 5,472,188 3,949,822
22.10 Notional Tax Credit for Withholding Tax on Treasury Bills and Bonds
The Inland Revenue Act No.10 of 2006 as amended by
subsequent legislation provides that a company which
derives interest income from secondary market transactions
in government securities on or after 1 April 2002 would be
entitled to a notional tax credit being one ninth of the net
interest income, provided such interest income forms part of
the statutory income of the Company.
As per the Inland Revenue Act No 24 of 2017, the notional
taxes (withholding tax) on the interest of government
securities have been withdrawn. However, IRD has not
issued transition provisions on brought forward notional tax
credits. The Company has not recognised notional tax credit
in the past but has made required disclosures. Accordingly,
no adjustments are made in the financial statements.
The notional tax credit available for set off against the future
tax liability of the Company is as follows;
For the year ended 31 December 2017 2016Rs. '000 Rs. '000
Balance as at 1 January 1,426,127 1,206,274
Tax credit for the year 295,369 219,853
Balance as at 31 December 1,721,496 1,426,127
22.11 Deferred Tax
For the year ended 31 December 2017 2016Rs. '000 Rs. '000
Deferred tax assets (105,390) (105,390)
Deferred tax liabilities 105,390 105,390
Net tax liabilities / (assets) - -
As discussed in note 22.8 (c), due to change in future tax
base and unavailability of transitional provisions relating
to brought forward tax losses and capital gains relating to
land and building held on behalf of the policyholders, no
adjustments have been made to existing deferred tax assets
/ liabilities. Deferred tax assets / liabilities remain the same
as reported as at 31 December 2016.
22.11 (a) Movement in Deferred Tax Balances
For the year ended 31 December 2017
Rs.’000
Net balance as at
1 January
Recognisedin profit or
loss Recognised
in OCI NetDeferred tax
assetsDeferred
tax liabilities
Deferred tax liabilities
Property, plant and equipment 98,713 - - 98,713 - 98,713
Intangible assets 6,677 - - 6,677 - 6,677
105,390 - - 105,390 - 105,390
Deferred tax assets
Employee benefits (30,231) - - (30,231) (30,231) -
Staff bonus provisions (39,200) - - (39,200) (39,200) -
Reserve for AFS financial assets (35,959) - - (35,959) (35,959) -
(105,390) - - (105,390) (105,390) -
Net tax liabilities / (assets) - - - - (105,390) 105,390

223
UNION ASSURANCE PLC | ANNUAL REPORT 2017
FIN
AN
CIA
L IN
FO
RM
ATIO
N
For the year ended 31 December 2016
Rs.’000
Net balance as at
1 January
Recognisedin profit or
loss Recognised
in OCI NetDeferred tax
assetsDeferred
tax liabilities
Deferred tax liabilities
Property, plant and equipment 101,573 (1,343) (1,517) 98,713 - 98,713
Intangible assets 9,891 (3,214) - 6,677 - 6,677
Reserve for AFS financial assets 21,842 - (21,842) - - -
133,306 (4,557) (23,359) 105,390 - 105,390
Deferred tax assets
Employee benefits (28,056) (814) (1,361) (30,231) (30,231) -
Staff bonus provisions (24,365) (14,835) - (39,200) (39,200) -
Carry forward tax losses (80,885) 80,885 - - - -
Reserve for AFS financial assets - - (35,959) (35,959) (35,959) -
(133,306) 65,236 (37,320) (105,390) (105,390) -
Net tax liabilities / (assets) - 60,679 (60,679) - (105,390) 105,390
22.11 (b) Analysis of Recognised Deferred Tax Assets / Liabilities
Use of Judgements and Estimates
Deferred Tax Assets
Deferred tax assets are recognised in respect of tax losses
to the extent that it is probable that future taxable profits will
be available against which such tax losses can be utilised.
Judgement is required to determine the amount of deferred
tax assets that can be recognised based upon the likely
timing and level of future taxable profits, together with future
tax planning strategies.
As at 31 December 2017 2016
Rs.’000TemporaryDifference Tax effect
TemporaryDifference Tax effect
Deferred tax assets
Employee benefits (107,963) (30,231) (107,963) (30,231)
Staff bonus provisions (140,000) (39,200) (140,000) (39,200)
Reserve for AFS financial assets (128,425) (35,959) (128,425) (35,959)
(376,388) (105,390) (376,388) (105,390)
Deferred tax liabilities
Property, plant and equipment 352,543 98,713 352,543 98,713
Intangible assets 23,845 6,677 23,845 6,677
376,388 105,390 376,388 105,390
Net recognised deferred tax assets / liabilities - - - -

UNION ASSURANCE PLC | ANNUAL REPORT 2017
224
22.11 (c) Unrecognised Deferred Tax Assets / Liabilities
As at 31 December 2017 2016
Rs.’000TemporaryDifference Tax effect
TemporaryDifference Tax effect
Deferred tax assets
Carry forward tax losses (5,472,128) (1,532,196) (3,949,822) (1,105,950)
AFS financial assets 507,359 142,060 (250,138) (70,039)
Unrecognised deferred tax assets (4,964,769) (1,390,136) (4,199,960) (1,175,989)
22.11 (d) Carry Forward Tax Losses
Tax losses as at the reporting date was Rs. 5,472 million
(2016 - Rs. 3,950 million) which gave rise to deferred tax
assets of Rs. 1,532 million (2016 - Rs. 1,106 million). The
deferred tax asset has not been recognised as discussed in
Note 22.8 (c).
23 Earnings per Share
Accounting Policy
The Company presents basic and diluted earnings per share
(EPS) data for its ordinary shares. Basic EPS is calculated by
dividing the profit after tax of the Company by the weighted
average number of ordinary shares outstanding during
the year.
Diluted EPS is determined by adjusting the profit after tax and
the weighted average number of ordinary shares outstanding
for the effects of all dilutive potential ordinary shares.
23.1 Basic Earnings per Share
For the year ended 31 December 2017 2016
Profit after tax (Rs. ‘000) 7,384,128 1,312,628
Weighted average number of
ordinary shares (‘000) 58,929 58,929
Basic earnings per share (Rs.) 125.31 22.27
23.2 Diluted Earnings per Share
There was no dilution of ordinary shares outstanding.
Therefore, diluted earnings per share is the same as basic
earnings per share as shown in Note 23.1.
24 Dividends per Share
Accounting Policy
Dividend declared by the Board of Directors after the
reporting date is not recognised as a liability and is
disclosed as a note to the financial statements.
The Board of Directors of the Company has declared a first
and final dividend of Rs. 18.00 per share (2016 - Rs. 10.50
per share) for the financial year ended 31 December 2017.
For the year ended 31 December 2017 2016
Dividend declared (Rs. ‘000) 1,060,722 618,750
Number of ordinary shares
(‘000) 58,929 58,929
Dividend per share (Rs.) 18.00 10.50
NOTES TO THE FINANCIAL STATEMENTS
0
20
40
60
80
100
120
140

225
UNION ASSURANCE PLC | ANNUAL REPORT 2017
FIN
AN
CIA
L IN
FO
RM
ATIO
N
24.1 Compliance With Section 56 and 57 of the Companies Act No. 07 of 2007
As required by Section 56 of the Companies Act No. 07
of 2007, the Board of Directors of the Company satisfied
the solvency test in accordance with Section 57, prior to
declaring the final dividend. A statement of solvency duly
completed and signed by the Directors on 27 February 2018
has been audited by Messrs. KPMG.
24.2 Dividend Paid During the Year
For the year ended 31 December 2017 2016Rs. '000 Rs. '000
First and final dividend for 2016
- Rs.10.50 per share
(2015 - Rs. 8.50 per share) 618,750 500,893
25 Intangible Assets
Accounting Policy
Recognition and Measurement
An intangible asset is recognised if it is probable that future
economic benefits associated with the asset will flow to the
entity and the cost of the asset can be measured reliably in
accordance with the Sri Lanka Accounting Standard
LKAS 38 - Intangible Assets.
Software
Software acquired separately are measured on initial
recognition at cost. Following initial recognition, these assets
are stated in the statement of financial position at cost, less
accumulated amortisation and accumulated impairment losses.
Expenditure on internally developed software is recognised
as an asset when the Company is able to demonstrate its
intention and ability to complete the development and use
the software in a manner that will generate future economic
benefits, and can reliably measure the costs to complete the
development. The capitalised costs of internally developed
software include all costs directly attributable to developing
the software and capitalised borrowing costs, and are
amortised over its useful life. Internally developed software is
stated at capitalised cost less accumulated amortisation and
any accumulated impairment losses.
Subsequent Expenditure
Subsequent expenditure on software assets is capitalised
only when it increases the future economic benefits
embodied in the specific asset to which it relates. All other
expenditure is expensed as incurred.
Useful Economic Life and Amortisation
Amortisation is calculated to write off the cost of intangible
assets over their estimated useful lives and is generally
recognised in profit or loss. None of the intangible assets are
assumed to have a residual value.
The estimated useful lives of intangible assets and the
amortisation methods for the current and comparative
periods are as follows;
Software 3 -10 years using the straight line method
from the date the software is available for use
Amortisation methods, useful lives and residual values are
reviewed at each reporting date and adjusted if appropriate.
De - Recognition
An Intangible Asset is de - recognised on disposal or when
no future economic benefits are expected from it. The gain or
loss arising from de - recognition of such Intangible Assets is
included in income statement.
25.1 Reconciliation of Carrying Amounts of Intangible Assets - Software
As at 31 December 2017 2016Rs.’000 Licensed Purchased Total Total
CostBalance as at 1 January 39,063 237,420 276,483 211,086
Acquisitions during the year - separately acquired - 151,196 151,196 65,397
Balance as at 31 December 39,063 388,616 427,679 276,483
Accumulated amortisation and impairment lossesBalance as at 1 January 31,961 149,875 181,836 151,470
Amortisation 6,370 26,656 33,026 30,366
Balance as at 31 December 38,331 176,531 214,862 181,836
Carrying valueAs at 31 December 2017 732 212,085 212,817
As at 31 December 2016 7,102 87,545 94,647

UNION ASSURANCE PLC | ANNUAL REPORT 2017
226
25.2 Assessment of Impairment of Intangible Assets
The Board of Directors has assessed the potential
impairment loss of intangible assets as at 31 December
2017. Based on the assessment, no impairment provision
is required to be made in the financial statements as at the
reporting date.
25.3 Title Restriction on Intangible Assets
There are no restrictions that existed on the title of the
intangible assets of the Company as at the reporting date.
25.4 Acquisition of Intangible Assets During the Year
During the financial year, the Company acquired intangible
assets to the aggregate value of Rs. 151 million (2016 -
Rs. 65 million). Cash payments amounting to Rs. 151
million (2016 - Rs. 65 million) were made during the year for
purchase of intangible assets.
25.5 Capitalisation of Borrowing Costs
There were no capitalised borrowing costs relating to the
acquisition of intangible assets during the year (2016 - Nil).
25.6 Fully Amortised Intangible Assets in Use
Intangible assets include fully amortised computer software
which are in use in the normal business activities to the gross
carrying value of Rs. 161 million (2016 - Rs. 103 million).
26 Property, Plant and Equipment
Accounting Policy
Recognition and Measurement
The Company applies the requirements of the Sri Lanka
Accounting Standard LKAS 16 - Property, Plant and
Equipment, in accounting for its owned assets which
are held and used in the provision of services or for
administrative purposes and are expected to be used for
more than one year.
Basis of Recognition
Property, plant and equipment are recognised if it is
probable that future economic benefits associated with the
asset will flow to the Company and cost of the asset can be
reliably measured.
Basis of Measurement
An item of property, plant and equipment that qualifies for
recognition as an asset is initially measured at its cost.
Except for land and buildings, the Company applies the
cost model for all property, plant and equipment and
records at cost of purchase together with any incidental
expenses thereon, less accumulated depreciation and any
accumulated impairment losses. Cost includes expenditure
that is directly attributable to the acquisition of the asset. The
cost of self constructed assets includes the following;
The cost of materials and direct labour
Any other costs directly attributable to bringing the
assets to a working condition for their intended use
When the Company has an obligation to remove the
asset or restore the site, an estimate of the costs of
dismantling and removing the items and restoring the
site on which they are located, and
Capitalised borrowing costs.
Purchased software that is integral to the functionality of the
related equipment is capitalised as part of that equipment.
When parts of an item of property, plant and equipment have
different useful lives, they are accounted for as separate
items (major components) of property, plant and equipment.
Any gain or loss on disposal of an item of property, plant and
equipment (calculated as the difference between the net
proceeds from disposal and the carrying amount of the item)
is recognised in ‘other income’ in the income statement.
Subsequent Costs
Subsequent expenditure is capitalised only if it is probable
that the future economic benefits associated with the
expenditure will flow to the Company.
Repairs and Maintenance
Repairs and maintenance are charged to the income
statement during the financial period in which they are
incurred. The cost of major renovations is included in the
carrying amount of the assets when it is probable that future
economic benefits in excess of the most recently assessed
standard of performance of the existing assets will flow to
the Company and the renovation replaces an identifiable
part of the asset. Major renovations are depreciated during
the remaining useful life of the related asset.
Revaluations
Freehold land and buildings are measured at fair value less
accumulated depreciation on buildings and impairment
losses are recognised after the date of the revaluation.
Valuations are performed every two years to ensure that the
fair value of a revalued asset does not differ materially from
its carrying amount.
NOTES TO THE FINANCIAL STATEMENTS

227
UNION ASSURANCE PLC | ANNUAL REPORT 2017
FIN
AN
CIA
L IN
FO
RM
ATIO
N
Any revaluation surplus is recognised in the statement
of profit or loss and other comprehensive income and
accumulated in equity in the asset revaluation reserve,
except to the extent that it reverses a revaluation decrease
of the same asset previously recognised in the Income
Statement, in which case the increase is recognised in the
Income Statement. A revaluation deficit is recognised in
the Income Statement, except to the extent that it offsets an
existing surplus on the same asset recognised in the asset
revaluation reserve.
An annual transfer from the asset revaluation reserve to
retained earnings is made for the difference between
depreciation based on the revalued carrying amount of the
assets and depreciation based on the assets’ original cost.
Additionally, accumulated depreciation as at the revaluation
date is eliminated against the gross carrying amount of the
asset and the net amount is restated to the revalued amount of
the asset. Upon disposal, any revaluation reserve relating to the
particular asset being sold is transferred to retained earnings.
Depreciation
Depreciation is recognised in the Income Statement on a
straight line basis over the estimated useful lives of each
part of an item of property, plant and equipment since this
most closely reflects the expected pattern of consumption of
the future economic benefits embodied in the asset. Land is
not depreciated.
The estimated useful lives for the current and comparative
periods are as follows.
Asset Class Basis
Freehold buildings 50 years
Office furniture 5 years
Furniture and fittings 5 years
Computer equipment 5 years
Motor vehicles 5 years
Depreciation methods, useful lives and residual values
are reassessed at each reporting date and adjusted if
appropriate.
The depreciation rates are determined separately for each
significant part of an item of property, plant and equipment
and depreciation commences when it is available for use,
i.e. when it is in the location and in the condition necessary
for it to be capable of operating in the manner intended by
the management. Depreciation of an asset ceases at the
earlier of the date that the asset is classified as held for sale
or the date that the asset is derecognised.
Carrying Amount
The carrying amount of an asset or significant group of
assets within the class is assessed annually, if there are
impairment indicators with its fair value and where the
fair value is less than the carrying amount, the asset is
written down to its fair value. The consequent adjustment is
recognised in the income statement.
The residual values of assets that are significant are
reassessed annually.
Depreciation on revalued classes of assets is based on
the remaining useful life of the assets at the time of the
revaluation.
De - Recognition
An item of property, plant and equipment is de - recognised
upon disposal or when no future economic benefits
are expected from its use. Any gain or loss arising on
de - recognition of the asset (calculated as the difference
between the net disposal proceeds and the carrying amount
of the asset) is included in the income statement in the year
the asset is de - recognised.
Capital Work in Progress
Capital work in progress is stated at cost. These are
expenses of a capital nature directly incurred in property,
plant and equipment, awaiting for capitalisation.
Leased Assets – Lessee
The determination of whether an arrangement is a lease
or contains a lease is based on the substance of the
arrangement at the inception date.
Finance Leases
Finance leases that transfer to the Company substantially
all of the risks and benefits incidental to ownership of the
leased item, are capitalised at the commencement of the
lease at the fair value of the leased property or if lower, at
the present value of the minimum lease payments. Lease
payments are apportioned between finance charges and
reduction of the lease liability so as to achieve a constant
rate of interest on the remaining balance of the liability.
Finance charges are recognised in finance cost in the
Income Statement. Leased assets are depreciated over the
useful life of the asset. However, if there is no reasonable
certainty that the Company will obtain ownership by the end
of the lease term, the asset is depreciated over the shorter of
the estimated useful life of the asset and the lease term.

UNION ASSURANCE PLC | ANNUAL REPORT 2017
228
NOTES TO THE FINANCIAL STATEMENTS
Operating Leases
Leases that do not transfer to the company, substantially all the risks and benefits incidental to ownership of the leased items, are
operating leases. Operating lease payments are recognised as an expense in profit or loss on a straight line basis over the lease term.
26.1 Reconciliation of Carrying Amounts of Property, Plant and Equipment
As at 31 December
Rs. ‘000Freehold
Land Freehold
Buildings
Plantmachinery and Officeequipment
Furniture and
fittings Computer
equipment Motor
vehicles 2017Total
2016Total
Cost / Revaluation
Balance as at 1 January 1,049,000 303,500 148,204 171,849 448,744 80 2,121,377 2,134,761
Additions during the year - - 2,242 1,272 36,843 - 40,357 53,000
Revaluation 522,000 17,365 - - - - 539,365 -
Transfer of accumulated
depreciation on assets revalued - (18,865) - - - - (18,865) -
Disposals during the year - - (534) (1,133) (3,018) - (4,685) (66,384)
Balance as at 31 December 1,571,000 302,000 149,912 171,988 482,569 80 2,677,549 2,121,377
Accumulated depreciation and impairment losses
Balance as at 1 January - 9,433 121,439 155,754 341,652 59 628,337 611,085
Depreciation for the year - 9,432 12,519 6,829 42,801 16 71,597 80,524
Transfer of accumulated
depreciation on assets revalued - (18,865) - - - - (18,865) -
Accumulated depreciation on
disposals during the year - - (534) (1,133) (2,569) - (4,236) (63,272)
Balance as at 31 December - - 133,424 161,450 381,884 75 676,833 628,337
Carrying value
As at 31 December 2017 1,571,000 302,000 16,488 10,538 100,685 5 2,000,716
As at 31 December 2016 1,049,000 294,067 26,765 16,095 107,092 21 1,493,040
26.2 Title Restriction on Property, Plant and Equipment
There are no restrictions that existed on the title of
property, plant and equipment of the Company as at the
reporting date.
26.3 Acquisition of Property, Plant and Equipment During the Year
During the financial year, the Company acquired property,
plant and equipment to the aggregate value of Rs. 40 million
(2016 - Rs. 53 million). Cash payments amounting to Rs. 40
million (2016 - Rs. 53 million) were made during the year for
purchase of property plant and equipment.
26.4 Capitalisation of Borrowing Costs
There were no capitalised borrowing costs relating to the
acquisition of property, plant and equipment during the year
(2016 - Nil).
26.5 Amount of Contractual Commitments for the Acquisition of Property, Plant and Equipment
There are no contractual commitments for the acquisition of
property, plant and equipment as at the reporting date.

229
UNION ASSURANCE PLC | ANNUAL REPORT 2017
FIN
AN
CIA
L IN
FO
RM
ATIO
N
26.6 The details of Freehold Land and Buildings which are stated at Valuation
Property owned by Union Assurance PLC
Extent
Method ofvaluation
Date ofvaluation Valuer
Rs.’000Carrying
value%
LandPerches
BuildingSquare
feet
Revalued amount Carryingvalue after
revaluationLand Building
Land and building
situated at
No. 20, St. Michael’s Road,
Colombo 3 93.4 57,916
Market
comparable
method
31
December
2017
Mr. P. B.
Kalugalagedera
and Associates
Chartered
valuation
surveyor
1,401,000 199,000 1,600,000 85
Land and building
situated at
No. 6, Rajapihilla Road,
Kurunegala 32.3 27,904
Market
comparable
method
31
December
2017 170,000 103,000 273,000 15
1,571,000 302,000 1,873,000 100
26.7 Significant Unobservable Inputs used in Measuring Fair Value
The table below sets out the significant unobservable inputs used in measuring Land and buildings categorised as Level 3 in the fair
value hierarchy as at 31 December 2017.
Location and address of Property
Method of valuation
Significant unobservable inputs
Range of estimates for unobservable inputs
Estimated fair value would increase or decrease if
Kollupitiya
No. 20,
St. Michael’s Road,
Colombo 3
Market
comparable
method
Land - Price per perch Rs 15,000,000 Price per perch for land
increases, decreases
Building - Price per
square foot
Rs 500 - Rs 4,250 Price per square foot for
building increases, decreases
Kurunegala
No. 6, Rajapihilla Road,
Kurunegala
Market
comparable
method
Land - Price per perch Rs 6,000,000 Price per perch for land
increases, decreases
Building - Price per
square foot
Rs 2,500 - Rs 4,400 Price per square foot for
building increases, decreases
Market Comparable Method
Market comparable method considers the selling price of a similar property within a reasonable period of time in determining the fair
value of the property being revalued. This involves evaluation of recent active market prices of similar assets, making appropriate
adjustment for differences in size, nature, location and condition of the specific property. In this process, outlier transactions, indicative
of particularly motivated buyers or sellers are compensated for, since the price may not adequately reflect the fair market value.
26.8 Revaluation Surplus
2017Rs.’000 Land Buildings Total
Revalued amount 1,571,000 302,000 1,873,000
Carrying value (prior to revaluation) (1,049,000) (284,635) (1,333,635)
Revaluation surplus for the year ended 31 December 522,000 17,365 539,365
As explained in note 22.8 (c), no provision has been made for deferred tax liability for future taxes that could be incurred on disposal
of business assets (Freehold Land). In the absence of transitional provisions, the Company has not made any adjustments to these
financial statements.

UNION ASSURANCE PLC | ANNUAL REPORT 2017
230
NOTES TO THE FINANCIAL STATEMENTS
26.9 If Land and Buildings were stated at Historical Cost, the Amounts would have been as follows;
As at 31 December 2017 2016Rs. '000 Rs. '000
Cost 251,124 251,124
Accumulated depreciation (81,603) (77,589)
Carrying value 169,521 173,535
26.10 The Effect of Revaluation of Freehold Buildings on the Statement of Income during the year was as follows;
As at 31 December 2017 2016Rs. '000 Rs. '000
Depreciation charge per annum
after revaluation 9,433 9,433
Depreciation charge per annum
prior to revaluation (4,014) (4,014)
Decrease in profit in subsequent period 5,419 5,419
26.11 Impairment of Property, Plant and Equipment
Impairment exists when the carrying value of an asset or
cash generating unit exceeds its recoverable amount, which
is the higher of its fair value less costs to sell and its value
in use (VIU). The fair value less costs to sell calculation is
based on available data from an active market, in an arm’s
length transaction, of similar assets or observable market
prices less incremental costs for disposing of the asset. The
value in use calculation is based on a discounted cash flow
model. The cash flows are derived from the budget for the
next five years and do not include restructuring activities that
the Company is not yet committed to or significant future
investments that will enhance the asset’s performance of the
cash generating unit being tested. The recoverable amount
is most sensitive to the discount rate used for the discounted
cash flow model as well as the expected future cash inflows
and the growth rate used for extrapolation purposes.
The Management has assessed the potential impairment loss
of property, plant and equipment as at 31 December 2017.
Based on the assessment, no impairment provision is required
to be made in the financial statements as at the reporting date
in respect of property, plant and equipment.
26.12 Fully Depreciated Property, Plant and Equipment
The initial cost of fully depreciated property, plant and
equipment which are still in use as at the reporting date is
as follows;
As at 31 December 2017 2016Rs. '000 Rs. '000
Computer equipment 272,676 240,270
Office equipment 94,148 66,846
Furniture and fittings 143,225 124,016
Total 510,049 431,132
26.13 Property, Plant and Equipment pledged as Security
None of the property, plant or equipment have been pledged
as security as at the reporting date.
26.14 Permanent Fall in Value of Property, Plant and Equipment
There has been no permanent fall in value of PPE which
require an impairment provision in the Financial Statements.
26.15 Temporarily Idle Property, Plant and Equipment
There are no temporarily idle property, plant or equipment as
at the reporting date.
26.16 Compensation from Third Parties for Items of Property, Plant and Equipment
There were no compensation received / receivable from third
parties for items of property, plant or equipment that were
impaired, lost or given up.
27 Investment in Equity Accounted Investee
Accounting Policy
An associate is an entity over which the company has
significant influence. Significant influence is the power to
participate in the financial and operating policy decisions of the
investee, but is not control or joint control over those policies.
Investments in associate is accounted for using the equity
method and are recognised initially at cost, in terms of Sri
Lanka Accounting Standards LKAS 28 - Investments in
Associates and Joint ventures.
The Company’s investment in its associate is accounted for
using the equity method and reported as a separate line
item in the Statement of Financial Position. Under the equity
method, investments in associate is carried at cost plus post
acquisition changes in the Company’s share of net assets
of the associate. The carrying amount of the investment is
adjusted to recognise changes in the Company’s share of net
assets of the associate since the acquisition date. Goodwill
relating to the associate is included in the carrying amount
of the investment and is not tested for impairment individually.

231
UNION ASSURANCE PLC | ANNUAL REPORT 2017
FIN
AN
CIA
L IN
FO
RM
ATIO
N
The income statement reflects the Company’s share of the
results of operations of the associate. Any change in the OCI
of the investee is presented as part of the Company’s OCI. In
addition, when there has been a change recognised directly
in the equity of the associate, the Company recognises its
share of any changes, when applicable, in the statement
of changes in equity. Unrealised gains and losses resulting
from transactions between the Company and the associate
are eliminated to the extent of the interest in the associate.
The aggregate of the Company’s share of profit or loss of
an associate is shown on the face of the income statement
outside the operating profit and represents profit or loss
after tax.
After application of the equity method, the Company
determines whether it is necessary to recognise an
impairment loss on its investment in its associate, at each
reporting date, the Company determines whether there is
objective evidence that the investment in the associate is
impaired. If there is such evidence, the Company calculates
the amount of impairment as the difference between the
recoverable amount of the associate and its carrying value,
and then recognises the loss as ‘Share of results of equity
accounted investees’ in the income statement.
Upon loss of significant influence over the associate, the
Company measures and recognises any retained investment
at its fair value. Any difference between the carrying amount
of the associate upon loss of significant influence and the fair
value of the retained investment and proceeds from disposal
is recognised in the income statement.
The accounting policies of the associate company conform
to those used for similar transactions of the Company.
The associate has the same reporting date as the Company
and the financial statements are prepared to a common
financial year ending 31 December.
As at 31 December 2017 2016
Place ofincorporationand operation
Proportionof ownership
interestNumber of
SharesCost
Rs. ‘000
Directorsvaluation /
market valueRs. ‘000
Carryingvalue
Rs. ‘000
Directorsvaluation /
market valueRs. ‘000
Carryingvalue
Rs. ‘000
Unquoted
Fairfirst Insurance Limited Sri Lanka 22% 68,902,870 689,029 995,722 995,722 777,346 777,346
In October 2016, Fairfirst Insurance Limited, (formally known
as Asian Alliance General Insurance Limited) was acquired
by Union Assurance General Limited.
In compliance with Section 241(1) of the Companies Act No.
07 of 2007 (as amended) (the "Companies Act"), the Board
of Directors and shareholders of Fairfirst Insurance Limited
("Fairfirst"), approved the amalgamation with its parent
company Union Assurance General Limited. Subsequent
to obtaining relevant regulatory approvals, Union Assurance
General Limited (UAGL) and Fairfirst Insurance Limited (FIL)
were amalgamated on 28th February 2017.
Consequent to the above amalgamation, UAGL ceased
to exist as a legal entity, and FIL was recognised as the
continuing entity. Accordingly, the Company’s shareholding
in UAGL was transferred to the amalgamated entity, Fairfirst
Insurance Limited, and remains unchanged at 22%.
Significant Accounting Policies That are Specific to the Business of Equity Accounted Investee - Fairfirst Insurance Limited
Gross Written Premiums (GWP)
Gross written premiums comprise the total premiums
received / receivable for the whole period of cover provided
by contracts entered into during the accounting period. GWP
is generally written upon inception of the policy. Rebates that
form part of the premium rate, such as no claim rebates, are
deducted from the gross written premium.
Unearned Premium Reserve (UPR)
Unearned premiums are those proportions of premiums
written in a year that relate to periods of risk after the reporting
date. UPR represents the portion of the premium written in the
year but relating to the unexpired term of coverage. Unearned
premiums are calculated on the 1/24 basis except for the
marine and title policies which are computed on a 60/40
basis. The proportion attributable to subsequent periods is
deferred as a provision for unearned premiums.

UNION ASSURANCE PLC | ANNUAL REPORT 2017
232
NOTES TO THE FINANCIAL STATEMENTS
Reinsurance Premiums
Reinsurance premiums written comprise the total premiums
payable for the whole cover by contracts entered during the
period, and are generally recognised on the date on which
the policy incepts.
Unearned Reinsurance Premiums
Unearned reinsurance premiums are those proportions of
premiums written in a year that relate to periods of risk after
the reporting date. Unearned reinsurance premiums are
calculated on the 1/24 basis except for the marine policies
which are computed on a 60/40 basis.
Unexpired Risk
Provision is made where appropriate for the estimated
amount required over and above unearned premiums to
meet future claims and related expenses on the business in
force as at the reporting date.
Acquisition Cost
Acquisition costs comprise commissions and other variable
costs directly connected with acquisition or renewal of
insurance contracts, are deferred to the extent that these costs
are recoverable out of future premiums. All other acquisition
costs are recognised as an expense when incurred.
Reinsurance Commission Income
Reinsurance commission income on outwards reinsurance
contracts are recognised as revenue when receivable.
Subsequent to initial recognition, reinsurance commission
income on outwards reinsurance contracts are deferred
and amortised on a straight line basis over the term of the
expected premiums payable.
Gross Claims Expense
Gross claims expense include all claims occurring during
the year, whether reported or not, related internal and
external claims handling costs that are directly related to
the processing and settlement of claims, a reduction for the
value of salvage and other recoveries, and any adjustments
to claims outstanding from previous years.
Claims outstanding are assessed by review of individual
claim files and estimating changes in the ultimate cost of
settling claims.
Gross claims expense includes gross claims expense
reported but not yet paid, incurred but not reported claims
(IBNR) and the anticipated direct cost of setting those
claims. The provision in respect of IBNR is actuarially valued
to ensure a more realistic estimation of the future liability
based on past experience and trends. Actuarial valuations
are performed on an annual basis.
While the Directors of the associate consider that the
provision for claims is fairly stated on the basis of information
currently available, the ultimate liability will vary as a result
of subsequent information and events. This may result in
adjustment to the amounts provided. Such amounts are
reflected in the financial statements for that period. The
methods used and the estimates made are reviewed regularly.
Reinsurance Claims Recoveries
Reinsurance claims recoveries are recognised when the
related gross insurance claim is recognised according to
the terms of the relevant contract. This includes reinsurance
exposure of IBNR.
Deferred Acquisition Costs (DAC)
Deferred acquisition costs comprise commissions and other
variable costs directly connected with acquisition or renewal of
insurance contracts, are deferred to the extent that these costs
are recoverable out of future premiums. All other acquisition
costs are recognised as an expense when incurred.
DAC is amortised over the period in which the related
revenues are earned. The reinsurers share of DAC is
amortised in the same manner as the UPR is amortised.
Changes in the expected useful life or the expected pattern
of consumption of future economic benefits embodied in the
asset are accounted for by changing the amortisation period
and are treated as a change in an accounting estimate.
An impairment review is performed at each reporting
date or more frequently when an indication of impairment
arises. DAC is reviewed for recoverability based on the
profitability of the underlying insurance contracts and when
the recoverable amount is less than the carrying value, an
impairment loss is recognised in the income statement.
DAC are derecognised when the related contracts are either
settled or disposed off.
Reinsurance Commissions - Unearned Commission Reserve (UCR)
Commissions receivable on outwards reinsurance contracts
are deferred and amortised on a straight line basis over the
term of the expected premiums payable.
Insurance Contract Liabilities
Non - life insurance contract liabilities include the
outstanding claims provision (Reserve for gross outstanding
and incurred but not reported, and incurred and not enough
reported - IBNR / IBNER) and the provision for unearned
premium and the provision for premium deficiency.

233
UNION ASSURANCE PLC | ANNUAL REPORT 2017
FIN
AN
CIA
L IN
FO
RM
ATIO
N
Claims Payable Including IBNR
The outstanding claims provision is based on the estimated
ultimate cost of all claims incurred but not settled at the
reporting date, whether reported or not, together with related
claims handling costs and reduction for the expected value
of salvage and other recoveries. Delays can be experienced
in the notification and settlement of certain types of claims,
therefore, the ultimate cost of these cannot be known with
certainty at the reporting date. The liability is calculated
at the reporting date using a range of standard actuarial
claim projection techniques, based on empirical data and
current assumptions that may include a margin for adverse
deviation. The liability is not discounted for the time value of
money. No provision for equalisation or catastrophe reserves
is recognised. The liabilities are derecognised when the
obligation to pay a claim expires, is discharged or is cancelled.
IBNR reserve is determined by an independent external actuary.
Provision for Unearned Premiums
The provision for unearned premiums represents that portion
of premiums received or receivable that relates to risks that
have not yet expired at the reporting date. The provision is
recognised when contracts are entered and is brought to
account as premium income over the term of the contract in
accordance with the pattern of insurance service provided
under the contract. Provision for unearned premium is
calculated on a 1/24 basis except for marine / cargo class
which is subject to 60/40 basis.
Liability Adequacy Test (LAT)
At the end of each reporting period the company reviews
its unexpired risk and a liability adequacy test is performed
as laid out in SLFRS 4 to determine whether there is any
overall excess of expected claims and deferred acquisition
costs over unearned premiums. The calculation uses current
estimates of future cash flows after taking account of the
investment return expected to arise from assets relating to
the relevant non life insurance technical provisions. If the
assessments show that the carrying amount of the unearned
premiums (less related deferred acquisition costs) is
inadequate, the deficiency shall be recognised in the income
statement by setting up a provision for liability adequacy.
Non life insurance liability adequacy is decided by an
independent external actuary.
27.1 Summarised Financial Information in respect of Associate is set out below Share of Results of Associate Income Statement
For the year ended 31 December 2017 2016Rs. '000 Rs. '000
Net earned premium 8,438,680 5,611,558
Finance and other income 955,974 754,816
Benefits, claims and expenses (8,572,095) (5,870,377)
Profit before tax 822,559 495,997
Income tax (expense) / reversal 31,276 (221,838)
Profit from continuing operations, net of tax 853,835 274,159
Percentage ownership interest 22% 22%
Company’s share of profit from investment in associate, net of tax 187,844 60,315
Other Comprehensive IncomeOther comprehensive income, net of tax 138,783 (87,205)
Company’s share of other comprehensive income, net of tax 30,532 (19,185)
Total comprehensive income 992,618 186,954
Share of results of equity accounted investee recognised in statement of profit or loss and other comprehensive income, net of tax 218,376 41,130
27.1 (a) Company's share of other comprehensive income, net of tax
For the year ended 31 December 2017 2016Note Rs. '000 Rs. '000
Share of gains / (losses) on AFS assets 36.2 (a) 32,823 (23,533)
Share of acturial gains / (losses) on defined benefit plans 36.2 (b) (2,291) 4,348
30,532 (19,185)

UNION ASSURANCE PLC | ANNUAL REPORT 2017
234
NOTES TO THE FINANCIAL STATEMENTS
Statement of Financial Position
As at 31 December 2017 2016Rs. '000 Rs. '000
Total Assets 15,432,894 17,854,733
Total Liabilities (10,906,883) (14,321,344)
Net assets 4,526,011 3,533,389
Percentage ownership interest 22% 22%
Company’s share of net assets 995,722 777,346
Less unrealised profits - -
Carrying amount of interest in associate 995,722 777,346
27.2 Reconciliation of Summarised Financial Information
Reconciliation of the above summarised financial information to the carrying amount of the interest in associate recognised in the
financial statements is as follows.
As at 31 December 2017 2016Rs. '000 Rs. '000
Value of investment in equity accounted investee as at 1 January 777,346 736,216
Add
Net profit for the period recognised in income statement 187,844 60,315
Other comprehensive income 30,532 (19,185)
Dividend received - -
Company share of (net of tax) equity accounted investee for the year ended 31 December 218,376 41,130
Value of investment in equity accounted investee as at 31 December 995,722 777,346
Contingent liabilities of equity accounted investee Nil Nil
Capital and other commitments of equity accounted investee Nil Nil
27.3 There are no restrictions on the ability of the associate to transfer funds to the investor in the form of cash dividends, or repayment of
loans or advances.
27.4 The Company has neither contingent liabilities nor capital and other commitments towards its associate company.
28 Financial Investments (Including Derivatives)Refer note 9 for accounting policies
The risk management practices adopted by the Company
in relation to the investment portfolio and risk management
disclosures are outlined in Note 7 to the financial statements.
28.1 Financial Investments pledged as Security
None of the financial investments have been pledged as
security as at the reporting date.
28.2 The Company’s financial instruments are summarised as follows:
As at 31 December 2017 2016
Rs.’000 NoteCarrying
value Fair ValueCarrying
value Fair Value
Held to maturity financial assets (HTM) 28.3 18,319,379 19,272,470 15,396,036 14,595,957
Loans and receivables (L&R) 28.4 5,883,031 5,953,248 5,409,853 5,416,616
Available for sale financial assets (AFS) 28.5 8,065,997 8,065,997 5,955,031 5,955,031
Financial assets at fair value through profit or loss (FVTPL) 28.6 4,524,514 4,524,514 4,086,336 4,086,336
Total financial investments 36,792,921 37,816,229 30,847,256 30,053,940

235
UNION ASSURANCE PLC | ANNUAL REPORT 2017
FIN
AN
CIA
L IN
FO
RM
ATIO
N
28.2 (a) Investments Supporting Restricted Regulatory Reserve
Based on the direction issued by the IRCSL dated 20 March
2018 on one - off surplus transfer, following investments have
been marked to support the Restricted Regulatory Reserve
of the Company.
As at 31 December 2017Rs. '000
Treasury bondsHeld to maturity financial investments 1,304,224
Available for sale financial investments 2,099,503
3,403,727
28.3 Held to Maturity Financial Assets (HTM)
As at 31 December 2017 2016Note Rs. '000 Rs. '000
Amortised cost
Quoted debentures 28.3 (a) 290,985 853,960
Treasury bonds 18,028,394 14,542,076
Total HTM financial investments 18,319,379 15,396,036
28.3 (a) Quoted Debentures - Diversified Holdings
As at 31 December 2017
IssuerCreditrating
Maturitydate
No. ofdebentures
Carrying value
Rs. ‘000
Marketvalue
Rs. ‘000Interest
%
Peoples’ Leasing & Finance PLC AA - 26/03/2018 686,300 74,395 75,475 16.75
Hatton National Bank PLC A+ 31/07/2022 2,000,000 216,590 255,014 16.75
290,985 330,489
As at 31 December 2016
IssuerCreditrating
Maturitydate
No. ofdebentures
Carrying value
Rs. ‘000
Marketvalue
Rs. ‘000Interest
%
Bank of Ceylon AA 30/11/2017 5,000,000 506,995 523,945 16.00
Sampath Bank PLC A 12/10/2017 476,900 55,715 56,534 16.50
Peoples’ Leasing & Finance PLC AA- 26/03/2018 686,300 74,408 78,184 16.75
Hatton National Bank PLC A+ 31/07/2022 2,000,000 216,842 216,842 16.75
853,960 875,505
28.3 (b) Impairment of Held to Maturity Financial Investments At the reporting date, there were no HTM financial investments that were overdue and impaired.
0
5,000
10,000
15,000
20,000

UNION ASSURANCE PLC | ANNUAL REPORT 2017
236
28.4 Loans and Receivables (L&R)
As at 31 December 2017 2016Note Rs. '000 Rs. '000
Amortised costBank deposits 647,447 584,609
Quoted debentures 28.4 (a) 4,625,307 4,553,805
Reverse repurchase agreements 610,277 271,439
Total L&R financial investments 5,883,031 5,409,853
The effective interest rates on non current portion of portfolio 15.90% 13.58%
28.4 (a) Quoted Debentures
As at 31 December 2017
IssuerCreditrating
Maturitydate
No. ofdebentures
Carrying value
Rs. ‘000
Marketvalue
Rs. ‘000Interest
%
Peoples’ Leasing & Finance PLC AA- 26/03/2018 595,000 65,282 65,376 16.75
Peoples’ Leasing & Finance PLC AA- 26/03/2018 120,000 14,346 14,248 17.00
Merchant Bank of Sri Lanka PLC A 28/03/2018 469,300 57,379 55,955 17.50
Hatton National Bank PLC A+ 13/06/2018 2,533,733 274,291 276,741 14.00
Central Finance Company PLC A+ 17/06/2018 1,552,000 162,480 164,376 14.75
Lion Brewery (Ceylon) PLC A+ 17/06/2018 448,000 46,743 47,231 14.00
Peoples’ Leasing & Finance PLC AA- 23/09/2018 309,900 33,456 33,875 9.625
Sampath Bank PLC A 04/12/2018 1,114,800 119,454 116,556 13.00
Sampath Bank PLC A 04/12/2018 1,114,800 127,042 129,306 13.40
Central Finance Company PLC A+ 12/12/2018 446,900 47,999 47,834 13.50
Central Finance Company PLC A+ 12/12/2018 710,500 81,700 88,876 13.95
Nations Trust Bank PLC A- 19/12/2018 2,881,300 306,887 313,466 13.00
Hemas Holdings PLC AA- 29/04/2019 1,452,900 146,308 150,423 11.00
Merchant Bank of Sri Lanka PLC A 12/11/2019 500,000 50,889 52,673 9.00
Lanka Orix Leasing Company PLC A- 24/11/2019 1,000,000 94,827 98,240 9.00
Sampath Bank PLC A 15/12/2019 3,000,000 297,496 310,799 8.25
Seylan Bank PLC A- 23/12/2019 2,000,000 183,816 191,415 8.60
Siyapatha Finance Limited BBB+ 24/12/2019 250,000 25,277 26,122 8.90
Central Finance Company PLC A+ 01/06/2020 400,000 40,866 42,594 9.52
National Development Bank PLC A 24/06/2020 4,279,000 368,046 331,484 9.40
Senkadagala Finance PLC BBB+ 10/11/2020 500,000 50,575 50,979 13.75
Commercial Bank of Ceylon PLC AA- 09/03/2021 250,000 26,071 25,826 10.75
Seylan Bank PLC A- 15/07/2021 950,400 101,609 104,534 13.00
Siyapatha Finance Limited A- 20/09/2021 102,400 10,468 11,179 13.50
Bank of Ceylon AA 24/10/2021 242,499 25,280 26,718 13.25
Nations Trust Bank PLC A- 08/11/2021 3,000,000 305,584 315,140 12.65
People's Leasing & Finance Company PLC AA- 16/11/2021 2,000,000 203,102 203,027 12.60
Bank of Ceylon AA 29/12/2021 2,000,000 203,642 200,145 13.25
Lanka Orix Leasing Company PLC A 31/07/2022 500,000 52,726 52,785 13.00
LB Finance PLC A- 11/12/2022 1,000,000 100,714 100,734 12.75
LB Finance PLC BBB+ 11/12/2022 1,000,000 100,836 100,856 13.25
Sampath Bank PLC A 21/12/2022 1,600,000 160,587 160,603 12.50
Hatton National Bank PLC AA- 30/08/2023 1,204,706 98,415 108,658 8.00
Bank of Ceylon AA 25/10/2023 452,300 47,656 47,067 13.75
Hatton National Bank PLC A+ 01/11/2023 724,000 73,937 73,973 13.00
National Development Bank PLC A 19/12/2023 4,500,000 519,521 555,673 13.90
4,625,307 4,695,487
NOTES TO THE FINANCIAL STATEMENTS

237
UNION ASSURANCE PLC | ANNUAL REPORT 2017
FIN
AN
CIA
L IN
FO
RM
ATIO
N
As at 31 December 2016
IssuerCreditrating
Maturitydate
No. ofdebentures
Carrying value
Rs. ‘000
Marketvalue
Rs. ‘000Interest
%
Senkadagala Finance PLC BBB+ 28/05/2017 185,014 20,358 20,358 17.25
Lion Brewery (Ceylon) PLC AA- 17/06/2017 33,600 35,134 35,134 13.75
DFCC Bank PLC AA- 18/08/2017 3,000,000 304,166 304,166 8.50
Singer Sri Lanka PLC A- 23/12/2017 216,700 22,727 22,727 8.25
Peoples’ Leasing & Finance PLC AA- 26/03/2018 595,000 67,783 67,783 16.75
Peoples’ Leasing & Finance PLC AA- 26/03/2018 120,000 14,951 14,951 17.00
Merchant Bank of Sri Lanka PLC AA- 28/03/2018 469,300 62,267 62,267 17.50
Hatton National Bank PLC A+ 13/06/2018 2,533,733 277,637 277,637 14.00
Lion Brewery (Ceylon) PLC AA- 17/06/2018 44,800 47,411 47,411 14.00
Central Finance Company PLC A+ 17/06/2018 155,200 165,509 165,509 14.75
Peoples’ Leasing & Finance PLC AA- 23/09/2018 309,900 32,750 32,750 9.63
Sampath Bank PLC A 04/12/2018 1,114,800 119,982 119,982 13.00
Sampath Bank PLC A 04/12/2018 1,114,800 127,391 127,391 13.40
Central Finance Company PLC A+ 12/12/2018 446,900 48,212 48,212 13.50
Central Finance Company PLC A+ 12/12/2018 710,500 82,249 82,249 13.95
Nations Trust Bank PLC A- 19/12/2018 2,881,300 306,514 306,514 13.00
Hemas Holdings PLC AA- 29/04/2019 1,452,900 144,445 144,445 11.00
Merchant Bank of Sri Lanka PLC AA- 12/11/2019 500,000 49,265 49,265 9.00
Lanka Orix Leasing Company PLC A- 24/11/2019 1,000,000 91,612 91,612 9.00
Sampath Bank PLC A 15/12/2019 3,000,000 285,750 285,750 8.25
Seylan Bank PLC BBB+ 23/12/2019 2,000,000 176,753 176,753 8.60
Siyapatha Finance PLC BBB+ 24/12/2019 250,000 24,442 24,442 8.90
Central Finance Company PLC A+ 01/06/2020 400,000 39,884 39,884 9.52
National Development Bank PLC A 24/06/2020 1,850,000 342,858 342,858 9.40
Senkadagala Finance PLC BBB+ 10/11/2020 500,000 50,472 50,472 13.75
Commercial Bank of Ceylon PLC AA- 09/03/2021 250,000 26,136 26,136 10.75
Seylan Bank PLC BBB+ 15/07/2021 950,400 101,698 101,698 13.00
Siyapatha Finance PLC BBB+ 20/09/2021 102,400 10,456 10,456 13.50
Bank of Ceylon AA 24/10/2021 242,499 25,270 25,270 13.25
Nations Trust Bank PLC A- 08/11/2021 3,000,000 305,599 305,599 12.65
Peoples’ Leasing & Finance PLC AA- 16/11/2021 2,000,000 203,167 203,167 12.60
Bank of Ceylon AA 29/12/2021 2,000,000 204,028 204,028 13.25
Hatton National Bank PLC AA- 30/08/2023 1,204,706 95,697 95,697 8.00
Bank of Ceylon AA 25/10/2023 452,300 47,827 47,827 13.75
Hatton National Bank PLC A+ 01/11/2023 724,000 73,969 73,969 13.00
National Development Bank PLC A 19/12/2023 4,500,000 519,436 519,436 13.90
4,553,805 4,553,805
28.4 (b) Impairment of L&R Financial Investments
At the reporting date, there were no L&R financial
investments that were overdue and impaired.
28.5 Available for Sale Financial Assets (AFS)
As at 31 December 2017 2016Rs. '000 Rs. '000
Fair value
Treasury bonds 7,900,165 5,822,216
Treasury bills 165,832 132,815
Total AFS financial investments 8,065,997 5,955,031

UNION ASSURANCE PLC | ANNUAL REPORT 2017
238
28.5 (a) Impairment of AFS Financial Investments
At the reporting date, there were no AFS financial investments that were overdue and impaired.
28.6 Financial Assets at Fair Value Through Profit or Loss (FVTPL)
As at 31 December 2017 2016Note Rs. '000 Rs. '000
Fair value
Quoted equities 28.6 (a) 2,344,572 1,706,751
Deravative financial instruments 50,737 -
2,395,309 1,706,751
Investments in unit linked fund
Quoted equities 28.6 (b) 1,628,378 1,814,977
Reverse repurchase agreements 223,361 202,959
Treasury bills 115,508 228,781
Treasury bonds 42,734 30,849
Bank deposits 32,434 45,736
Quoted debentures 86,790 56,283
2,129,205 2,379,585
Total FVTPL financial investments 4,524,514 4,086,336
28.6 (a) Quoted Equities - Other than Unit Linked Investments
As at 31 December 2017 2016
No of sharesCost
Rs. ‘000
Carrying Value
Rs. ‘000 No of sharesCost
Rs. ‘000
CarryingValue
Rs. ‘000
Banks, Finance and InsuranceCommercial Bank PLC (non - voting) 649,979 45,779 68,248 581,706 40,414 66,896
Commercial Bank PLC 395,992 40,195 53,776 355,515 36,106 51,550
Hatton National Bank PLC 2,952,546 485,564 654,084 2,088,232 303,670 430,251
Sampath Bank PLC 1,866,391 436,555 589,220 1,264,695 286,696 329,327
HNB Assurance PLC 336,266 23,645 24,379 336,266 23,645 19,772
Central Finance Company PLC 429,269 39,522 39,622 429,269 39,522 42,927
DFCC Bank PLC 391,520 65,599 48,079 391,520 65,599 47,961
National Development Bank PLC 886,800 160,675 120,960 854,220 160,675 133,258
People's Leasing & Finance PLC 3,821,672 67,308 64,968 3,821,672 67,308 65,733
People's Insurance Limited 394,300 5,915 9,069 394,300 5,915 7,492
Seylan Bank PLC 819,383 60,816 56,653 - - -
1,431,573 1,729,058 1,029,550 1,195,167
Diversified HoldingsHemas Holdings PLC 536,638 18,644 67,616 536,638 18,644 52,591
Melstacorp Limited 2,529,764 145,110 150,521 2,529,764 145,110 150,015
163,754 218,137 163,754 202,606
Construction and EngineeringAccess Engineering PLC 2,965,739 74,852 69,695 950,570 25,547 23,574
Colombo Dockyard PLC - - - 238,350 50,507 18,734
74,852 69,695 76,054 42,308
NOTES TO THE FINANCIAL STATEMENTS

239
UNION ASSURANCE PLC | ANNUAL REPORT 2017
FIN
AN
CIA
L IN
FO
RM
ATIO
N
As at 31 December 2017 2016
No of sharesCost
Rs. ‘000
Carrying Value
Rs. ‘000 No of sharesCost
Rs. ‘000
CarryingValue
Rs. ‘000
Manufacturing
Chevron Lubricants Lanka PLC 244,400 16,129 29,084 244,400 16,129 38,395
Tokyo Cement Company (Lanka) PLC
(voting) 768,932 7,817 50,750 640,777 7,817 37,934
Tokyo Cement Company (Lanka) PLC
(non - voting) 1,729,956 36,938 102,065 1,658,150 42,486 85,395
Piramal Glass PLC 5,103,984 36,422 29,603 1,874,100 16,585 9,933
Textured Jersey Lanka PLC 2,782,495 74,831 94,605 1,553,000 25,384 66,468
172,137 306,107 108,401 238,125
Motors
Diesel and Motor Engineering PLC 22,062 33,340 10,810 22,062 33,340 12,818
33,340 10,810 33,340 12,818
Hotels and Travel
Aitken Spence Hotel Holdings PLC 364,900 25,931 10,765 364,900 25,931 15,727
25,931 10,765 25,931 15,727
1,901,587 2,344,572 1,437,030 1,706,751
28.6 (b) Quoted Equities - Unit Linked Investments
As at 31 December 2017 2016
No of sharesCost
Rs. ‘000
Carrying Value
Rs. ‘000 No of sharesCost
Rs. ‘000
CarryingValue
Rs. ‘000
Banking, Finance and Insurance
Hatton National Bank PLC 1,262,271 228,615 255,169 1,254,131 227,243 263,192
Sampath Bank PLC 569,454 119,296 179,777 455,992 85,653 118,740
Commercial Bank of Ceylon PLC 52,089 5,532 7,074 46,765 4,995 6,781
Commercial Bank of Ceylon PLC -
(non - voting) 92,953 7,999 9,760 83,190 7,231 9,567
Central Finance Company PLC 161,531 14,923 14,909 161,531 14,923 16,153
DFCC Bank PLC 70,960 12,500 8,714 90,552 15,951 11,093
National Development Bank PLC 158,782 29,521 21,658 193,756 37,397 30,226
People's Leasing & Finance PLC 694,444 11,798 11,806 694,444 11,798 11,944
People's Insurance PLC 3,277,953 62,120 75,393 88,200 1,323 1,676
People's Leasing & Finance PLC - - - 1,617,917 38,844 27,828
Hatton National Bank PLC - - - 272,441 43,046 57,535
Sampath Bank PLC - - - 192,813 40,912 50,209
Ceylinco Insurance PLC - - - 25,532 36,672 38,043
People's Insurance Limited PLC - - - 971,451 18,082 18,458
492,304 584,260 584,070 661,445
Beverage, Food and Tobacco
Nestle Lanka PLC 13,000 21,125 21,138 - - -
The Lion Brewery Ceylon PLC 24,327 13,037 13,137 - - -
Ceylon Cold Stores Plc - - - 77,356 36,390 58,048
34,162 34,275 36,390 58,048

UNION ASSURANCE PLC | ANNUAL REPORT 2017
240
As at 31 December 2017 2016
No of sharesCost
Rs. ‘000
Carrying Value
Rs. ‘000 No of sharesCost
Rs. ‘000
CarryingValue
Rs. ‘000
Construction and EngineeringAccess Engineering PLC 3,055,072 79,961 71,794 3,055,072 79,961 75,766
Colombo Dockyard PLC - - - 43,365 9,993 3,408
79,961 71,794 89,954 79,174
Diversified HoldingsMelstacorp PLC 1,565,004 79,094 93,118 1,845,000 89,278 109,408
Hemas Holdings PLC 1,516,925 150,686 191,133 942,512 76,164 92,366
John Keells Holdings PLC - - - 1,060,182 165,365 153,726
Aitken Spence PLC - - - 201,633 23,838 13,106
229,780 284,251 354,645 368,606
Hotels and TravelAitken Spence Hotel Holdings PLC 125,493 9,003 3,702 125,493 9,003 5,409
9,003 3,702 9,003 5,409
ManufacturingTokyo Cement Company Lanka PLC -
(non - voting) 388,112 8,378 22,899 281,745 6,373 14,510
Alumex PLC 1,457,962 29,100 26,972 2,950,705 58,986 59,604
Hayleys Fabric PLC 7,074,329 116,808 95,503 - - -
Piramal Glass Ceylon PLC 17,673,950 101,248 102,509 8,833,613 48,404 46,818
Textured Jersey Lanka PLC 5,806,742 226,473 197,429 2,181,931 93,749 93,387
Chevron Lubricants Lanka PLC - - - 468,714 64,972 73,635
Piramal Glass Ceylon PLC - - - 806,000 4,917 4,272
Textured Jersey Lanka PLC - - - 388,200 6,150 16,615
Chevron Lubricants Lanka PLC - - - 49,200 4,322 7,729
Tokyo Cement Company Lanka PLC -
(non - voting) - - - 1,796,819 88,924 92,536
Tokyo Cement Company Lanka PLC
- (voting) - - - 1,145,000 68,550 67,784
482,007 445,312 445,347 476,890
TelecommunicationDialog Axiata PLC 15,752,754 167,142 204,784 15,752,754 167,142 165,405
167,142 204,784 167,142 165,405
1,494,359 1,628,378 1,686,551 1,814,977
NOTES TO THE FINANCIAL STATEMENTS

241
UNION ASSURANCE PLC | ANNUAL REPORT 2017
FIN
AN
CIA
L IN
FO
RM
ATIO
N
28.6 (c) The Company uses derivatives, not designated in a qualifying hedge relationship, to manage its exposure to interest rates.
The instrument used is an interest rate swaps.
28.6 (d) Impairment of Fair Value Through Profit or Loss Financial Investments
At the reporting date, there were no fair value through profit or loss financial investments that were overdue and impaired.
28.7 Movement of Financial Investments
Rs.’000Held to
maturity Loans andreceivables
Available for sale
Fair valuethrough profit
or loss Total
As at 1 January 2016 13,600,906 1,888,987 7,041,021 4,010,020 26,540,934
Purchases 2,248,325 23,825,333 4,894,324 17,519,653 48,487,635
Maturities (748,148) (24,909,132) (537,596) (15,818,656) (42,013,532)
Disposals - - (569,522) (1,637,483) (2,207,005)
Scrip Dividend - - - 26,531 26,531
Fair value gains recorded in statement of
income (excluding net realised gains)
classified as held for trading - - - (34,751) (34,751)
Fair value losses recorded in OCI - - (456,568) - (456,568)
Amortisation 276,097 - 24,120 19,406 319,623
Net change in accrued Interest 18,856 50,860 113,057 1,616 184,389
Reclassification of financial investment from
AFS to L & R - 4,553,805 (4,553,805) - -
As at 31 December 2016 15,396,036 5,409,853 5,955,031 4,086,336 30,847,256
As at 1 January 2017 15,396,036 5,409,853 5,955,031 4,086,336 30,847,256
Purchases 5,060,281 17,445,081 1,495,854 6,433,068 30,434,284
Maturities (2,426,619) (17,075,538) (190,209) (4,385,533) (24,077,899)
Disposals - - - (1,910,477) (1,910,477)
Scrip Dividend - - - 24,499 24,499
Fair value gains recorded in statement of
income (excluding net realised gains)
classified as held for trading - - - 258,360 258,360
Fair value gains recorded in OCI - - 733,852 - 733,852
Amortisation 246,226 43,559 29,026 14,832 333,643
Net change in accrued Interest 43,455 60,076 42,443 3,429 149,403
As at 31 December 2017 18,319,379 5,883,031 8,065,997 4,524,514 36,792,921
29 Loans to Life PolicyholdersPolicyholder loans are granted up to 90% of the surrender
value of a life insurance policy at a rate equivalent to market
rate. Policyholder loans are initially measured at fair value
and subsequently measured at the amortised cost. If the
policyholder dies before the full repayment of the loan, the
loan balance is deducted from the death benefit.
As at 31 December 2017 2016Rs. '000 Rs. '000
Balance as at 1 January 646,645 558,757
Loans granted during the year 394,376 315,723
Repayments during the year (289,975) (227,835)
751,046 646,645
Interest receivables on loans to
life policyholders 250,492 220,532
Balance as at 31 December 1,001,538 867,177

UNION ASSURANCE PLC | ANNUAL REPORT 2017
242
29.1 Collateral Details
As at 31 December 2017 surrender value of policyholder
loans amounted to Rs.1,693 million (2016 - Rs. 1,471 million).
If the total receivable of the loan, including interest due
and accrued exceeds the cash surrender value, the policy
terminates and becomes void.
The Company has a first lien on all policies which are
subject to policy loans. This mitigates the Company’s credit
exposure on policy loans.
29.2 Fair Value of Loans to Life Policyholders
The fair value of the policyholder loans are equal to its
carrying value as those are given at competitive market rates.
29.3 Concentration Risk of Loans to Life Policyholders
There is lower concentration of credit risk with respect
to policyholders, as the Company has a large number of
dispersed receivables.
29.4 Impairment of Loans to Life Policyholders
Policyholder Loans are reviewed for impairment at each
reporting date. As of 31 December 2017, there were no
impaired loss recorded on policyholder loans (2016 - Nil).
29.5 Number of Policy Loans
Number of policy loans due as at 31 December 2017 was
15,983 (2016 - 15,221).
30 Reinsurance Receivable
Accounting Policy
The Company cedes insurance risk in the normal course of
business for all of its Insurance Contracts. Reinsurance assets
represent balances due from reinsurance companies. These
assets consist of short term balances due from reinsurers,
as well as longer term receivables that are dependent on
the expected claims and benefits arising under the related
reinsured insurance contracts. Amounts recoverable from
reinsurers are estimated in a manner consistent with the
outstanding claims provision or settled claims associated with
the reinsurer’s policies and are in accordance with the related
reinsurance contract. Reinsurance is recorded gross in the
statement of financial position unless a right to offset exists.
Reinsurance assets are reviewed for impairment at each
reporting date or more frequently when an indication of
impairment arises during the reporting year. Impairment
occurs when there is objective evidence as a result of an
event that occurred after initial recognition of the reinsurance
asset that the Company may not receive all outstanding
amounts due under the terms of the contract, and the event
has a reliably measurable impact on the amounts that the
company will receive from the reinsurer. The impairment loss
is recorded in the income statement.
Reinsurance assets are derecognised when the contractual
rights are extinguished or expired.
As at 31 December 2017 2016Rs. '000 Rs. '000
Reinsurance receivable on
outstanding claims 135,657 85,306
Reinsurance receivable on
settled claims 131,760 92,875
Total reinsurance receivables 267,417 178,181
30.1 Impairment of Reinsurance Receivables
The Board of Directors has assessed potential impairment
loss of reinsurance receivables as at 31 December 2017.
Based on the assessment, there was no impairment loss on
reinsurance receivables.
30.2 Fair Value of Reinsurance Receivables
The carrying values disclosed above approximate the fair
value at the reporting date.
30.3 The Ageing of Reinsurance Receivables on Paid Claims
As at 31 December 2017 2016Note Rs. '000 Rs. '000
Less than 60 days 33,628 39,493
More than 60 days 30.4 98,132 53,382
131,760 92,875
30.4 Reinsurance Receivable Past Due but Not Impaired (On Paid Claims)
As at 31 December 2017, reinsurance receivable of
Rs. 98 million (2016 - Rs. 53 million) were past due but not
impaired. These relate to parties where there were no recent
history of default.
30.5 Collateral Details
The Company does not hold any collateral as security
against potential default by reinsurance counter parties.
30.6 Reinsurance Receivable on Outstanding Claims
This includes reinsurance reserves on claims that has not been
paid and the reinsurance receivable has not been received.
30.7 Risk Management
Refer Note 7 to the financial statements for risk management
initiatives relating to reinsurance.
NOTES TO THE FINANCIAL STATEMENTS

243
UNION ASSURANCE PLC | ANNUAL REPORT 2017
FIN
AN
CIA
L IN
FO
RM
ATIO
N
31 Premiums Receivable
Accounting Policy
Premiums receivable are recognised when due and
measured on initial recognition at the fair value of the
consideration received or receivable. The carrying value of
premiums receivable is reviewed for impairment whenever
events or circumstances indicate that the carrying amount
may not be recoverable.
Impairment losses on premiums receivable are the
difference between the carrying amount and the recoverable
amount. The impairment losses are recognised in the income
statement.
The life insurance premiums for policies within the 30 day
grace period are considered as due premium, subject to
a provision for premium default. Premium default ratio is
computed by analysing the default history. Commission and
reinsurance premium relating to that accrued income are
also recorded in the same manner.
As at 31 December 2017 2016Rs. '000 Rs. '000
Premiums receivable from;
Policyholders 132,713 102,193
Intermediaries (Including
collections in transit) 135,798 144,607
Total premiums receivable 268,511 246,800
31.1 Fair Value of Premiums Receivable
The carrying amount disclosed above approximates the fair
value at the reporting date.
31.2 Impairment of Premiums Receivable
The Management has assessed potential impairment loss
of premiums receivable as at 31 December 2017. Based on
the assessment, there was no impairment loss on premiums
receivable (2016 - Nil).
31.3 Collateral Details
The Company does not hold any collateral as security
against potential default by policyholders or intermediaries.
31.4 Risk Management Initiatives Relating to Premiums Receivable
Refer Note 7 to the financial statements for risk management
initiatives relating to premiums receivable.
32 Receivables and Other Assets
Accounting Policy
Staff / Agent Loans
Refer note 9 for accounting policy.
Inventories
Inventories are measured at the lower of cost or net
realisable value. Cost is generally determined by reference
to weighted average cost. Net realisable value is the
estimated market price in the ordinary course of business
less any estimated expense to sell.
As at 31 December 2017 2016Note Rs. '000 Rs. '000
Financial Assets
Staff loans* 32.1 235,951 211,877
Agent / advisor loans 32.2 68,090 67,686
Refundable deposits 8,090 7,550
Amounts due from Fairfirst
Insurance Limited 11,954 100,988
Other receivables 37,096 16,797
361,181 404,898
Non Financial Assets
Taxes recoverable 32.4 218,350 218,469
Prepayments 138,080 114,884
Inventories 21,521 14,177
Advance payments 155,553 17,948
Other receivables 52,554 39,408
586,058 404,886
Total receivables and other assets 947,239 809,784
*No loans have been granted to Directors of the Company.
32.1 Staff Loans
As at 31 December 2017 2016Note Rs. '000 Rs. '000
Balance as at 1 January 212,235 207,981
Loans provided during
the year 200,619 94,865
Payments / settlements
during the year (148,070) (85,839)
Fair value adjustment
during the year (28,475) (4,772)
236,309 212,235
Provision for impairment 32.1 (a) (358) (358)
Balance as at 31 December 235,951 211,877

UNION ASSURANCE PLC | ANNUAL REPORT 2017
244
NOTES TO THE FINANCIAL STATEMENTS
32.1 (a) Provision for Impairment
As at 31 December 2017 2016Rs. '000 Rs. '000
Balance as at 1 January 358 -
Charge for the year - 358
Balance as at 31 December 358 358
32.2 Agent Loans
As at 31 December 2017 2016Note Rs. '000 Rs. '000
Balance as at 1 January 72,455 81,855
Loans provided during
the year 46,494 45,860
Payments / settlements
during the year (45,549) (55,260)
73,400 72,455
Provision for impairment 32.2 (a) (5,310) (4,769)
Balance as at 31 December 68,090 67,686
32.2 (a) Provision for Impairment
As at 31 December 2017 2016Rs. '000 Rs. '000
Balance as at 1 January 4,769 4,395
Charge for the year 541 374
Balance as at 31 December 5,310 4,769
32.3 Impairment of Staff and Agent Loans
The Management has assessed potential impairment loss
of staff and agent loans as at 31 December 2017. Based
on the assessment, no additional impairment provision is
required to be made in the financial statements as at the
reporting date in respect of staff and agent loans, other than
the amounts provided in Note 32.1 (a) and 32.2 (a)
32.4 Taxes Recoverable
As at 31 December 2017 2016Rs. '000 Rs. '000
ACT recoverable 92,296 92,296
WHT recoverable 107,391 112,723
ESC receivable 18,663 13,450
218,350 218,469
32.5 Fair Value
The fair value of staff loans are based on discounted cash
flows. Discount rate is equal to AWPLR plus appropriate risk
margin. The fair values of agent / advisor loans are equal
to the carrying amount as they are granted at competitive
market rates.
32.6 Refer Note 7 to the financial statements for risk management
policies / initiatives relating to other financial assets.
33 Cash in Hand and at Bank
Accounting Policy
Cash and cash equivalents comprise cash in hand & at bank
and short term investments net of bank overdrafts that are
repayable on demand.
33.1 Cash in Hand and at Bank
As at 31 December 2017 2016Rs. '000 Rs. '000
Cash at Bank 536,971 350,400
Cash at Bank with related parties
- Nations Trust Bank PLC 40,057 26,014
Cash in hand 3,098 2,818
Total cash in hand and at bank 580,126 379,232
33.2 Cash and Cash Equivalent in the Statement of Cash Flows
As at 31 December 2017 2016Note Rs. '000 Rs. '000
Cash in hand and at bank 33.1 580,126 379,232
Bank overdraft used for
cash management
purposes (195,306) (150,306)
Short term investments
(included under investments) 32,434 10,133
Cash and cash equivalent in the statement of cash flows 417,254 239,059
33.3 Fair Value of Cash in Hand and at Bank
The carrying amounts disclosed above reasonably
approximate fair value at the reporting date.
33.4 Risk Management Initiatives Relating to Cash in Hand and at Bank
Please refer Note 7 to the financial statements.

245
UNION ASSURANCE PLC | ANNUAL REPORT 2017
FIN
AN
CIA
L IN
FO
RM
ATIO
N
34 Stated Capital
Accounting Policy
Ordinary Shares
The Company has issued ordinary shares that are classified
as equity instruments. Incremental external costs that
are directly attributable to the issue of these shares are
recognised in equity, net of tax.
All issued shares are fully paid. There is only one class
of ordinary shares. All shares issued carry equal voting
rights. The holders of ordinary shares are entitled to receive
dividends as declared from time to time, and are entitled to
one vote per share at meetings of the Company.
Dividends on Ordinary Shares
Dividends on ordinary shares are recognised as a liability
and deducted from equity when they are approved by
the Company’s Board of Directors in accordance with the
Articles of Association.
Dividends for the year that are approved after the reporting
date are dealt with as an event after the reporting date.
As at 31 December 2017 2016
No. of shares Rs. ‘000 No. of shares Rs. ‘000
Ordinary voting shares 58,928,572 1,000,000 58,928,572 1,000,000
58,928,572 1,000,000 58,928,572 1,000,000
35 Restricted Regulatory ReserveBased on the direction issued by the IRCSL dated 20
March 2018, the Company has transferred Rs. 3,382
million attributable to non - participating and non unit fund
of unit linked business from life policyholder fund to life
shareholder fund (SHF). The distribution of one - off surplus
to shareholders, held as part of the Restricted Regulatory
Reserve, is subject to meeting governance requirements
stipulated by the IRCSL and can only be released upon
receiving approval from the IRCSL. The one - off surplus in
the SHF is represented by government debt securities as per
the direction of the IRCSL [Note 28.2 (a)].
As at 31 December 2017 2016Rs. '000 Rs. '000
Transfer of one - off surplus
from non participating fund 3,393,900 -
Transfer from shareholder fund
for the one - off deficit created
in the non unit fund of unit
linked life insurance contracts (11,966) -
3,381,934
36 Reserves
As at 31 December 2017 2016Note Rs. '000 Rs. '000
Capital reserves 36.1 1,705,061 1,171,115
Other reserves 36.2 439,667 (354,112)
Total reserves 2,144,728 817,003
36.1 Capital Reserves
As at 31 December 2017 2016Note Rs. '000 Rs. '000
Revaluation ReserveUnrealised gain reserve 36.1 (a) 475,860 475,860
Life policy holders’
revaluation reserve,
net of tax 36.1 (b) 1,212,449 678,503
1,688,309 1,154,363
Reserve on merger
with Cornhill
(Private) Limited 36.1 (c) 16,752 16,752
1,705,061 1,171,115
36.1 (a) Unrealised Gain Reserve
Unrealised gain reserve comprises of the gain from
transferring the investment of Cornhill (Private) Limited to
life policyholders in 2007, and the gain on transferring the
land and building at Kurunegala in 2011. These gains will be
realised to shareholders when the properties are disposed.
36.1 (b) Life Policy Holders’ Revaluation Reserve
As at 31 December 2017 2016Rs. '000 Rs. '000
Balance as at 1 January 678,503 682,405
Revaluation surplus during the year 539,365 -
Adjustment for deferred tax - 1,517
Net gain on revaluation of land and buildings 1,217,868 683,922
Depreciation transfer during the year (5,419) (5,419)
Balance as at 31 December 1,212,449 678,503
The revaluation relates to land and building as indicated in
Note 26.6.

UNION ASSURANCE PLC | ANNUAL REPORT 2017
246
NOTES TO THE FINANCIAL STATEMENTS
36.1 (c) Reserve on Merger with Cornhill (Private) Limited
The unrealised gain reflects the net result of the merger of the
Company and Cornhill (Private) Limited. The investment in
Cornhill (Private) Limited was absorbed by merging all assets and
liabilities into the life policyholders' statement of financial position.
36.2 Other Reserves
As at 31 December 2017 2016Note Rs. '000 Rs. '000
Reserve for AFS
financial instruments 36.2 (a) 413,443 (376,875)
Other Capital ReservesReserves on retirement
benefit obligation 36.2 (b) (8,356) (1,794)
Employee share
based option 36.3 34,580 24,557
26,224 22,763
439,667 (354,112)
36.2 (a) Reserve for Available for Sale (AFS) Financial Instruments
As at 31 December 2017 2016Rs. '000 Rs. '000
Balance as at 1 January (376,875) 45,425
Unrealised gains / (losses) on
AFS assets 733,829 (456,520)
Share of gains / (losses) on AFS
assets of equity accounted
investee 32,823 (23,533)
Transferred to the statement
of income 23,666 (48)
Related tax - 57,801
Balance as at 31 December 413,443 (376,875)
36.2 (b) Reserves on Retirement Benefit Obligation
Refer Note 40 for Accounting Policies.
As at 31 December 2017 2016Rs. '000 Rs. '000
Balance as at 1 January (1,794) (2,642)
Actuarial loss on defined
benefit plan (4,271) (4,861)
Share of actuarial gains / (losses)
on defined benefit plan of
equity accounted investee (2,291) 4,348
Related tax - 1,361
Balance as at 31 December (8,356) (1,794)
36.2 (c) Other Capital Reserves
Share Based Payment Plan
Employees receive remuneration in the form of share based
payment transactions, whereby employees render services
as consideration for equity instruments (equity settled
transactions). The cost of the employee services received in
respect of the shares or share options granted is recognised in
the income statement over the period that employees provide
services, from the time when the award is granted up to the
vesting date of the options. The overall cost of the award is
calculated using the number of share options expected to vest
and the fair value of the options at the date of grant.
Equity Settled Transactions
The cost of equity settled transactions is recognised, together
with a corresponding increase in other capital reserves in
equity, over the period in which the performance and service
conditions are fulfilled. The cumulative expense recognised
for equity settled transactions at each reporting date until the
vesting date reflects the extent to which the vesting period
has expired and the best estimate of the number of equity
instruments that will ultimately vest. The income statement
expense or credit for a period represents the movement in
cumulative expense recognised as at the beginning and end of
that period and is recognised in employee benefits expense.
No expense is recognised for awards that do not ultimately
vest, except for equity settled transactions where vesting is
conditional upon a market or non vesting condition, which
are treated as vesting irrespective of whether or not the
market or non vesting condition is satisfied, provided that all
other performance and service conditions are satisfied.
Where the terms of an equity settled transaction award are
modified, the minimum expense recognised is the expense
as if the terms had not been modified, if the original terms
of the award are met. An additional expense is recognised
for any modification that increases the total fair value of the
share based payment transaction, or is otherwise beneficial
to the employee as measured at the date of modification.
Where an equity settled award is cancelled, it is treated as
if it vested on the date of cancellation, and any expense not
yet recognised for the award is recognised immediately. This
includes any award where non vesting conditions within the
control of either the entity or the employee are not met.
However, if a new award is substituted for the cancelled
award, and designated as a replacement award on the date
that it is granted, the cancelled award and the new award
are treated as if they were a modification of the original
award, as described in the previous paragraph.
Description of the Employee Share Option Scheme
Under the John Keells Group’s Employee Share Option
Scheme (ESOP), share options of the Parent are granted to
senior executives of the Company and is dependent on a
performance criteria and a service criteria. SLFRS 02 - Share
based payment has been applied to equity

247
UNION ASSURANCE PLC | ANNUAL REPORT 2017
FIN
AN
CIA
L IN
FO
RM
ATIO
N
instruments in share based transactions that were granted after 1 January 2012, which was the effective date of the standard. Hence
options granted subsequent to this date have been accounted for as per the standard. All options are to be settled by shares and
there are no cash settlement alternatives.
The Directors confirm that the Company has not granted any funding to employees to exercise options.
The terms and conditions of the grants are as follows;
Grant date /employees entitled
Number ofinstruments Vesting conditions
Contractual lifeof the Awards Exercise price
The grant date for each Award is
on the 1 of July of that respective
financial year.
Please refer
table below
Vests over a period of
four years. A minimum
performance achievement
of meeting the Key Result
Areas (KRA’s) and being in
employment at the time the
share options vests.
5 years for each
Award
For each 'Award' it is equal to
the 30 day volume weighted
average market price of the
underlying shares on the
date of grant.Senior executives of the
company with more than 12
months of service as at the
respective reporting date.
Reconciliation of Outstanding Share Options
The following table illustrates the number of options (No.), weighted average exercise prices (WAEP) and movements of share options
during the year:
As at 31 December 2017 2017 2016 2016No. WAEP (Rs.) No. WAEP (Rs.)
Outstanding at 1 January 764,241 220.29 409,932 221.06
Granted during the year 234,515 142.83 181,610 142.83
Adjustment for 7:8 sub - division - - 66,425 173.02
Transferred to UA - - 168,894 167.62
Forfeited during the year - - (65,645) 173.93
Exercised during the year - - - -
Expired during the year - - - -
Adjustment for warrants 43:1000 - - 3,025 190.96
Outstanding at 31 December 998,756 202.10 764,241 220.29
Exercisable at 31 December 508,186 172.36 336,405 177.62
There were no options exercised during the year ended 31 December 2017.
36.3 Employee Expenses for Share Based Payment Transactions
The expense recognised for employee services received
during the year is as follows.
As at 31 December 2017 2016Rs. '000 Rs. '000
Balance as at 1 January 24,557 15,093
Expense arising from equity
settled share based payment
transactions 10,023 9,464
Balance as at 31 December 34,580 24,557
The expense recognised for employee services is based on
the Parent company’s best estimate of the number of options
that will ultimately vest. No expense is recognised for Awards
that do not ultimately vest.
36.4 Fair Value of the Share Options and Assumptions
The fair value of the share options is estimated at the grant date
using a binomial option pricing model, taking into account the
terms and conditions upon which the share options were granted.
37 Retained Earnings
As at 31 December 2017 2016Note Rs. '000 Rs. '000
Balance as at 1 January 2,049,189 1,232,035
Profit for the year 7,384,128 1,312,628
Transfer of one-off surplus (3,381,934) -
Transfer from revaluation
reserve to retained
earnings, net of tax 5,419 5,419
First and final dividends
2016 / 2015 24.2 (618,750) (500,893)
Balance as at 31 December 5,438,052 2,049,189

UNION ASSURANCE PLC | ANNUAL REPORT 2017
248
NOTES TO THE FINANCIAL STATEMENTS
38 Insurance Contract Liabilities Accounting Policy
38.1 Life Insurance Contract Liabilities
Life insurance contract liabilities are recognised when
contracts are entered into and premiums are charged.
These liabilities are measured by using the gross premium
valuation method as prescribed by the Regulation of
Insurance Industry ACT, No. 43 of 2000. The liability is
determined as the discounted value of the expected
contractual cash outflows less the discounted value of the
expected premiums. Valuation assumptions are derived
based on the best estimate experience with a prescribed
risk margin to allow for adverse deviations. Non participating
liabilities are discounted using the risk free yields.
The value of participating policy liabilities is the higher of
the value of the guaranteed benefits liability and the total
benefits liability, derived at the participating insurance fund
level. In calculating the guaranteed benefits liability, only
the guaranteed benefits are considered and the cashflows
are discounted using the risk free interest rate yield curve.
Total benefits liability includes all the guaranteed and non
guaranteed benefits, and discount the cash flows using the
fund based yield of the participating insurance fund.
At each reporting date, an assessment is made of whether
the recognised life insurance liabilities are adequate, by
using a liability adequacy test.
38.2 Liability Adequacy Test (LAT)
At each reporting date, an assessment is made of whether
the recognised life insurance liabilities are adequate by
using an existing liability adequacy test as laid out under
SLFRS 4. The liability value is adjusted to the extent that
it is adequate to meet future benefits and expenses. In
performing the adequacy test, current best estimates of
future contractual cash flows, including related cash flows
such as claims handling and policy administration expenses,
policyholder options and guarantees, as well as investment
income from assets backing such liabilities, are used.
Any deficiency is recognised in the income statement by
setting up a provision for liability adequacy.
38.3 Use of Judgements and Estimates38.3 (a) Product Classification
SLFRS 4 requires contracts written by insurers to be classified
as either insurance contracts or investment contracts
depending on the level of insurance risk transferred.
Insurance contracts are contracts under which one party
(the Insurer) accepts significant insurance risk from another
party (the policyholder) by agreeing to compensate the
policyholder if a specified uncertain future event (the
insured event) adversely affects the policyholder. Significant
insurance risk exists if an insured event could cause an
insurer to pay significant additional benefits in any scenario,
excluding scenarios that lack commercial substance
(i.e. have no discernible effect on the economics of the
transaction). The classification of contracts identifies both
the insurance contracts that the company issues and
reinsurance contracts that the company holds.
Contracts where the company does not assume a significant
insurance risk is classified as investment contracts.
Investment contracts are those contracts that transfer
significant financial risks and no significant insurance risks.
Financial risk is the risk of a possible future change in one or
more of a specified interest rates, financial instrument prices,
commodity prices, foreign exchange rates, index of price
or rates, credit ratings or credit index or other variables,
provided in the case of a non financial variable that the
variable is not specific to a party to the contract.
Once a contract has been classified as an insurance contract,
it remains an insurance contract for the remainder of its lifetime,
even if the insurance risk reduces significantly during this period,
unless all rights and obligations are extinguished or expired.
Investment contracts can, however, be reclassified as insurance
contracts after inception if insurance risk becomes significant.
Insurance and investment contracts are further classified as
being either with or without discretionary participating features.
Discretionary Participating Features (DPF)
DPF is a contractual right to receive, as a supplement to
guaranteed benefits, additional benefits that;
are likely to be a significant portion of the total
contractual benefits;
the amount or timing of which is contractually at the
discretion of the issuer;
and contractually based on:
The performance of a specified pool of contracts or a
specified type of contract,
Realised and or unrealised investment returns on a
specified pool of assets held by the issuer, and
The profit or loss of the company, fund or other entity that
issues the contract.
Derivatives embedded in an insurance contract or an
investment contract with DPF are separated and fair valued
through the income statement unless the embedded
derivative itself is an insurance contract or investment
contract with DPF. The derivative is also not separated if the
host insurance contract and / or investment contract with
DPF is measured at fair value through the profit and loss.
IRCSL regulations and the terms and conditions of these
contracts set out the bases for the determination of the amounts
on which the additional discretionary benefits are based (the
DPF eligible surplus) and within which the company may

249
UNION ASSURANCE PLC | ANNUAL REPORT 2017
FIN
AN
CIA
L IN
FO
RM
ATIO
N
exercise its discretion as to the quantum and timing of their
payment to contract holders. At least 90% of the eligible surplus
must be attributed to contract holders as a group (which can
include future contract holders) and the amount and timing of
the distribution to individual contract holders is at the discretion
of the company, subject to the advice of the appointed actuary.
All DPF liabilities including unallocated surpluses, both
guaranteed and discretionary, at the end of the reporting period
are held within insurance contract liabilities, as appropriate.
38.3 (b) Valuation of Insurance Contract LiabilitiesThe main assumptions used relate to mortality, morbidity,
longevity, investment returns, expenses, lapses, surrender
rates and discount rates as further detailed in notes to the
financial statements. For those contracts that insure risk
related to longevity, prudent allowance is made for expected
future mortality improvements, as well as wide ranging
changes to the life style, which could result in significant
changes to the expected future mortality exposure.
Estimates are also made for future investment income
arising from the assets backing Life Insurance contracts.
These estimates are based on current market returns, as
well as expectations about future economic and financial
developments.
Assumptions on future expenses are based on current
expense levels, adjusted for expected expense inflation, if
appropriate. Lapse and surrender rates are based on the
company’s historical experience of lapses and surrenders.
38.4 Insurance Contract Liabilities
As at 31 December 2017 2016
Rs. ‘000 Note
Insurancecontractliabilities Reinsurance Net
Insurancecontractliabilities Reinsurance Net
Insurance contract liabilities 25,570,643 (1,764,806) 23,805,837 22,880,158 (1,421,649) 21,458,509
Reversal of one - off surplus after changes
made to NPV and GPV computation 2,050,764 - 2,050,764 - - -
Adjusted insurance contract liabilities 38.4 (a) 27,621,407 (1,764,806) 25,856,601 22,880,158 (1,421,649) 21,458,509
Surplus created due to changes in valuation
method from NPV to GPV 38.4 (c) 5,867,744 - 5,867,744 5,867,744 - 5,867,744
Reversal of one - off surplus after changes
made to NPV and GPV computation 38.4 (d) (2,050,764) - (2,050,764) - - -
Adjusted surplus created due to changes in
valuation method from NPV to GPV 3,816,980 - 3,816,980 5,867,744 - 5,867,744
Transfer of one - off surplus attributable to
non - participating and non unit fund of unit
linked business from policyholder fund to
shareholder fund
35 /
38.5 (3,381,934) - (3,381,934) - - -
38.4 (c) 435,046 - 435,046 5,867,744 - 5,867,744
Unclaimed benefits 657,966 - 657,966 563,429 - 563,429
Total insurance contract liabilities 38.5 28,714,419 (1,764,806) 26,949,613 29,311,331 (1,421,649) 27,889,682
38.4 (a) Insurance Contract Liabilities
As at 31 December 2017 2016
Rs. ‘000 Note
Insurancecontractliabilities Reinsurance Net
Insurancecontractliabilities Reinsurance Net
Balance as at 1 January - NPV Basis 28,747,902 (1,421,649) 27,326,253 24,422,947 (1,155,652) 23,267,295
Surplus created due to changes in valuation
method from NPV to GPV (3,816,980) - (3,816,980) (5,867,744) - (5,867,744)
Balance as at 1 January - GPV / NPV Basis 24,930,922 (1,421,649) 23,509,273 18,555,203 (1,155,652) 17,399,551
Premium income / Reinsurance expenses 10 / 11 10,117,630 (497,612) 9,620,018 8,270,751 (423,857) 7,846,894
Liabilities paid for death, maturities,
surrenders, benefits and claims 16 (2,828,188) 154,455 (2,673,733) (1,682,170) 157,860 (1,524,310)
Benefits and claims experience variation (3,796,420) - (3,796,420) (1,421,540) - (1,421,540)
Investment return 3,609,010 - 3,609,010 2,817,463 - 2,817,463
Expenses (4,411,547) - (4,411,547) (3,598,870) - (3,598,870)
Income tax expenses 22.8 (a) - - - (60,679) - (60,679)
Balance as at 31 December 27,621,407 (1,764,806) 25,856,601 22,880,158 (1,421,649) 21,458,509

UNION ASSURANCE PLC | ANNUAL REPORT 2017
250
NOTES TO THE FINANCIAL STATEMENTS
38.4 (b) Valuation of Life Insurance Fund
Long duration contract liabilities included in the life insurance
fund, result primarily from traditional participating and
non participating life insurance products. Short duration
contract liabilities are primarily group term, accident and
health insurance products. The actuarial reserves have been
established based on the following;
Non participating liabilities are discounted using risk free
yield curve provided by the IRCSL and the participating
liabilities are based on the fund yield of the life fund.
Mortality rates based on published mortality tables
adjusted for actual experience as required by regulations
issued by the IRCSL.
Surrender rates based on actual experience.
The amount of policyholder dividend to be paid is determined
annually by the Company. The dividend includes life
policyholders share of net income that is required to be
allocated by the insurance contract.
The valuation of the conventional life insurance fund as at 31
December 2017 was carried out by Mr. Vivek Jalan FIA, FIAI
of Willis Towers Watson India Private Limited and a sum of Rs.
3,438 million was transferred from the conventional life insurance
fund to the shareholders fund for the year 2017. Subsequent to
the transfer the conventional life fund stood at Rs. 26,912 million.
Similarly the non unit fund of linked long term business
valuation was carried out by Mr. Vivek Jalan FIA, FIAI of
Willis Towers Watson India Private Limited and a sum of
Rs. 204 million was transferred from the non unit fund to
the shareholders fund for the year 2017. Subsequent to the
transfer the non unit fund stood at Rs. 38 million.
In the opinion of the consultant actuary, the admissible assets
of the conventional life insurance fund and the non unit fund
of linked long term business as at 31 December 2017 is
adequate to cover the liabilities of the funds.
38.4 (c) One - Off Surplus Arising from Change in Policy Liability Valuation
Based on the letter issued by the Insurance Regulatory
Commission of Sri Lanka (IRCSL) (previously known as IBSL)
dated 30 December 2016, all insurance companies were
instructed to maintain the one - off surplus arising from change
in policy liability valuation, separately within the long-term
insurance fund / insurance contract liabilities. Accordingly, the
one - off surplus was identified separately within the insurance
contract liabilities as “Surplus created due to changes in
valuation method from NPV to GPV”.
The amount reported as the one-off surplus of Rs. 5,868 million in
the 2016 financial statements was based on the internal actuarial
valuation. Subsequently as directed by the IRCSL, the Company
obtained an independent actuarial valuation certification from
Willis Towers Watson India Private Limited who confirmed it as
Rs. 4,636 million. The one off surplus has been further reduced
to Rs. 3,817 million in line with the "Minimum One - off Surplus"
calculation basis provided in the IRCSL guidelines. As the
adjustments of Rs. 2,050 million were due to estimate changes,
the difference has been adjusted in the current year to reflect the
above accordingly [Note 38.4 (d)].
The one off surplus comprises of Rs. 432.5 million attributable
to participating business and Rs. 2.5 million attributable
to unit linked fund and Rs. 3,382 million attributable to non
participating and non unit fund of unit linked business.
Based on the directions issued by the IRCSL dated 20 March
2018 and subsequent approval, the Company has transferred
Rs. 3,382 million attributable to non - participating and non unit
fund of unit linked business from life policyholder fund through
Income Statement to life shareholder fund and held as part of the
Restricted Regulatory Reserve under equity in the statement of
financial position.
Disclosures required in the Financial Statements as per Identification and Treatment of One - Off Surplus: Direction #16 - 20.03.2016 issued, under Section 96A of the Regulation of Insurance Industry Act No 43 of 2000
Disclosure in Financial Statements Compliance with the Requirement Page
i Equity and statement of changes in equity to include a new line item called 'Restricted
Regulatory Reserve' with value equal to one - off surplus for other than participating
business. Adequate disclosure to be made with regards to 'Restricted Regulatory Reserve'.
Complied [Note 35] 181, 183 and
245
ii The transfer of one - off surplus to be treated as a release permitted by the IRCSL
during the relevant period and accounted through Income Statement.
Complied
[Note 38.4 (c) and Note 45.1]
249, 250 and
258
iii Income Statement to carry a new line item 'change in contract liability due to transfer
of one - off surplus'. Complied 179
iv Disclosure stating 'distribution of one - off surplus to shareholders', held as 'Restricted
Regulatory Reserve', is subject to meeting governance requirements stipulated by the
IRCSL and can only be released upon approval from the IRCSL. Complied [Note 35] 245
v The basis of computation of one - off surplus.
Any deviation from the direction in respect of determining the 'minimum one - off surplus'. Complied [Note 38.4 (c)] 250
vi One-off surplus relating to participating and other than participating should be
disclosed separately. Complied [Note 38.4] 249
vii Financial ratios should be determined in accordance with SLASs. Additional financial
ratios, excluding the impact of transfer of one - off surplus may be disclosed separately. Complied 12
viii Disclosure on composition of investments supporting the Restricted Regulatory Reserve. Complied [Note 28.2 (a)] 235

251
UNION ASSURANCE PLC | ANNUAL REPORT 2017
FIN
AN
CIA
L IN
FO
RM
ATIO
N
One - off Surplus was determined as the difference between
the NPV solvency basis liability and the GPV distribution
basis liability as of 31 December 2015. This is calculated for
Participating and other than participating funds, separately.
Above basis is in line with the 'Minimum One - off Surplus'
calculation basis provided in the IRCSL guideline.
38.4 (d) Reversal of One - Off Surplus After Changes Made to NPV and GPV Computation
Based on the instructions received from the IRCSL, the
Company has obtained new valuations of life fund under
both NPV and GPV method as at 1 January 2016 from Wills
Towers Watson.
The following changes were made to the NPV and GPV
computations.
As at 1 January 2016Rs. '000
Changes made to GPV due to changes made on non - economic assumptions (2,050,764)
Changes made to NPV (netted off against contingency reserves) -
Net impact to one off surplus (2,050,764)
As difference arose due to changes in assumption to
the GPV valuation (resulting in an estimate change) as at 1 January
2016, the difference was transferred to life fund during the current
year. The prior year numbers were not restated / readjusted.
38.5 Movement in Insurance Contract Liabilities
As at 31 December 2017 2016Note Rs. '000 Rs. '000
Conventional life insurance fundBalance as at 1 January 27,703,410 23,581,967
Increase in life insurance fund before surplus transfer to shareholders 5,950,069 5,123,562
Transfer to shareholders 38.5 (a) (3,438,283) (1,100,000)
Transfer of one - off surplus from non participating fund 38.6 (3,393,900) -
Net change in unclaimed benefits 90,761 97,881
Balance as at 31 December - Conventional Life insurance 26,912,057 27,703,410
Non Unit Fund of Linked Life Insurance ContractsBalance as at 1 January 186,272 149,271
Increase in non unit fund of linked life insurance before surplus transfer to shareholders 39,259 35,396
Transfer from shareholders fund for the one - off deficit created in the non unit fund 38.6 11,966 -
Transfer to shareholders 38.5 (a) (203,717) -
Net change in unclaimed benefits 3,776 1,605
Balance as at 31 December - Non unit fund of linked Life insurance 37,556 186,272
26,949,613 27,889,682
38.5 (a) Surplus from Life Insurance Fund Transferred to Life Shareholder Fund
As at 31 December 2017 2016Rs. '000 Rs. '000
Conventional life insurance fund 3,438,283 1,100,000
Non unit fund of linked Life insurance 203,717 -
3,642,000 1,100,000
38.6 One - Off Surplus Transfer
As at 31 December 2017 2016Note Rs. '000 Rs. '000
Transfer of one - off surplus from non participating fund (3,393,900) -
Transfer from shareholders fund for the one - off deficit created in the non unit fund 11,966 -
(3,381,934) -
38.7 Liability Adequacy Test (LAT) - Life Insurance Contract Liabilities
As at the reporting date, liability adequacy test was performed by the appointed actuary Mr. Vivek Jalan FIA, FIAI of Willis Towers
Watson India Private Limited and concluded that, the liability value is sufficient to meet future benefits and expenses. Hence, no
provision was required to be made for any premium deficiency.

UNION ASSURANCE PLC | ANNUAL REPORT 2017
252
39 Insurance Contract Liabilities - Unit Linked
Accounting Policy
Unit linked contracts are those that do not meet the
definition of insurance contract or investment contract with
discretionary participating features. For these Unit linked
contracts, the liabilities are valued at current unit value, i.e.
on the basis of the fair value of the financial investment,
backing those contracts at the reporting date together with
rights to future management fees.
As at 31 December 2017 2016Note Rs. '000 Rs. '000
Liability of Fund investment 1,684,920 2,154,233
Liability of Fund income 39.1 436,689 223,474
Total insurance contract liabilities 2,121,609 2,377,707
39.1 Movement in Liability of Fund Income
As at 31 December 2017 2016Rs. '000 Rs. '000
Balance as at 1 January 223,474 294,631
Net investment income 93,240 94,860
Net realised gains / (losses) 72,742 (131,996)
Net fair value gains 80,963 830
Management fee expense (33,730) (34,851)
Balance as at 31 December 436,689 223,474
Fair value of the financial investments backing unit linked
contracts are as follows.
As at 31 December 2017 2016Rs. '000 Rs. '000
Government securities 381,603 462,589
Equity instruments 1,628,378 1,814,977
Corporate debt instruments 86,790 56,283
Fixed deposits 32,434 45,736
2,129,205 2,379,585
Other financial investments
and assets 1,762 3,625
Other unit linked liabilities (9,358) (5,503)
Insurance contract liabilities - Unit Linked 2,121,609 2,377,707
40 Employee Benefits Liabilities
Accounting Policy
40.1 Defined Contribution Plans
A defined contribution plan is a post employment benefit
plan under which an entity pays fixed contributions into a
separate entity and has no legal or constructive obligation to
pay further amounts. Obligations for contributions to defined
contribution plans are recognised as an employee benefit
expense in the income statement in the periods during which
related services are rendered by employees.
Employees’ Provident Fund
All employees of the Company are members of the
Employees’ Provident Fund (EPF). The Company and
employees contribute 12% and 8% respectively of the salary,
monthly to the Employees Provident Fund managed by the
Central Bank of Sri Lanka.
Employees’ Trust Fund
All employees of the company are members of the
Employees’ Trust Fund (ETF). The Company contributes
each month at the rate of 3% of the salaries of each
employee, to the Employees’ Trust Fund administrated by
the Employees’ Trust Fund Board.
Defined Contribution Plans
Following contributions have been made to the employee
provident fund and employee trust fund during the year.
For the year ended 31 December 2017 2016Rs. '000 Rs. '000
Employees’ Provident Fund (EPF)
Employers' contribution (12%) 55,238 52,086
Employees' contribution (8%) 36,825 34,724
Employees’ Trust Fund (ETF)
Employers' contribution (3%) 13,810 13,021
40.2 Defined Benefit Plans - Gratuity
A defined benefit plan is a post employment benefit plan
other than a defined contribution plan. The Company’s net
obligation in respect of defined benefit plans is calculated
by estimating the amount of future benefit that employees
have earned in return for their service in the current and prior
periods and discounting that amount to determine its present
value. The calculation is performed annually by a qualified
independent actuary using the projected unit credit method.
As per LKAS 19 - Employee Benefits, the re-measurements
of the net defined benefit liability, which comprise actuarial
gains and losses, are recognised immediately in the
statement of profit or loss and other comprehensive income.
Under the Payment of Gratuity Act No. 12 of 1983, the
liability to an employee arises only on completion of 5 years
of continued service.
The obligation is not externally funded.
NOTES TO THE FINANCIAL STATEMENTS

253
UNION ASSURANCE PLC | ANNUAL REPORT 2017
FIN
AN
CIA
L IN
FO
RM
ATIO
N
40.3 Movement in Present Value of Gratuity
For the year ended 31 December 2017 2016Rs. '000 Rs. '000
Balance as at 1 January 107,963 100,199
Included in Profit or Loss:Current service cost 11,966 10,690
Interest cost 10,796 10,258
22,762 20,948
Included in OCI:Net actuarial loss on obligation 4,271 4,861
OtherPayments during the year (12,408) (20,430)
Gratuity transfer - 2,385
Balance as at 31 December 122,588 107,963
40.4 Principal Actuarial Assumptions Used
The defined benefit obligation liability of the Company
is based on an actuarial valuation carried out by
Mr. M. Poopalanathan (AIA) of Actuarial & Management
Consultants (Pvt) Ltd. an Independent Actuary. The actuarial
valuation involves making assumptions about discount rates
and future salary increases. Due to the complexity of the
valuation and the underlying assumptions and its long term
nature, the defined benefit obligation is highly sensitive to
changes in these assumptions. All assumptions are reviewed
at each reporting date.
Assumption 2017 2016
Discount rate 10.5% 11.0%
Staff turnover rate - early withdrawal through resignations
- i) Less than 5 years 14.3% 13%
- ii) More than 5 years 5% 2%
Salary increase 8% 8%
Retirement age 55 years 55 years
Assumptions regarding future mortality are based on the
A1967/70 for Staff / Executive and A1949/52 for Worker,
issued by the Institute of Actuaries, London.
40.5 Maturity Analysis of the Payments
The following payments are expected on employee benefit
liabilities in future years
As at 31 December 2017 2016Rs. '000 Rs. '000
Within the next 12 months 3,362 6,874
Between 1 and 2 years 2,721 5,772
Between 2 and 5 years 15,192 52,151
Over 5 years 101,313 43,166
Total expected payments 122,588 107,963
40.6 Sensitivity Analysis
Reasonably possible variation in one of the relevant actuarial assumptions, holding other assumptions constant, would have affected
the defined benefit obligation by the amounts shown below:
Increase / (Decrease) in discount rate
Increase / (Decrease) in salary increment
Change in employee definedbenefit liability Rs’000
Estimated employee defined benefit liability Rs’000
+1% - (4,600) 117,988
-1% - 4,979 127,567
- +1% 5,673 128,261
- -1% (5,322) 117,266
41 Reinsurance Payables
Accounting Policy
Reinsurance payables represent balances due to
reinsurance companies. Amounts payable are recognised
when due and measured on initial recognition at the fair
value less directly attributable transaction costs in a manner
consistent with the related reinsurance contract.
Reinsurance liabilities are derecognised when the
contractual rights are extinguished or expire, or when the
contract is transferred to another party.
As at 31 December 2017 2016Rs. '000 Rs. '000
Balance as at 1 January 208,742 213,855
Arising during the year 497,612 423,857
Utilised during the year (361,208) (428,970)
Balance as at 31 December 345,146 208,742

UNION ASSURANCE PLC | ANNUAL REPORT 2017
254
NOTES TO THE FINANCIAL STATEMENTS
42 Other Liabilities
As at 31 December 2017 2016Rs. '000 Rs. '000
Other Financial Liabilities
Agency commission payable 189,244 141,696
Other staff related provisions 158,389 140,000
Premiums in suspense 292,108 284,922
Amounts due to related parties - 6,528
639,741 573,146
Other Non Financial Liabilities
Government levies 38,145 11,406
Other liabilities and accruals 542,974 375,074
Premium received in advance 147,171 133,245
728,290 519,725
Total other liabilities 1,368,031 1,092,871
Maturity schedule of other financial liabilities as of
31 December 2017 and 2016 are shown in Note 7 to
the financial statements.
43 Related Party DisclosuresA related party transaction is a transfer of resources,
services or obligations between related parties, regardless
of whether a price is charged.
The Company carries out transactions in the ordinary course
of its business on an arm’s length basis with parties who are
defined as related parties in Sri Lanka Accounting Standard
LKAS 24 - Related Party Disclosures.
43.1 Parent and Ultimate Controlling Party
The company’s immediate and ultimate controlling party is
John Keells Holdings PLC.
43.2 Recurrent Related Party Transactions
There were no recurrent related party transactions which
in aggregate value exceeded 10% of the gross revenue of
the company as per 31 December 2017 audited financial
statements, which required additional disclosures in the
2017 Annual Report under Colombo Stock Exchange
listing Rule 9.3.2 and Code of Best Practices on Related
Party Transactions under the Securities and Exchange
Commission Directive issued under Section 13 (c) of the
Securities and Exchange Commission Act.
43.3 Non-Recurrent Related Party Transactions
There were no non-recurrent related party transactions which
aggregate value exceeded 10% of the equity or 5% of the
total assets which ever is lower of the Company as per 31
December 2017 audited financial statements, which required
additional disclosures in the 2017 Annual Report under
Colombo Stock Exchange listing Rule 9.3.2 and Code of Best
Practices on Related Party Transactions under the Securities
and Exchange Commission Directive issued under Section
13 (c) of the Securities and Exchange Commission Act.
43.4 Transactions with Related Entities
The Directors of the company as at 31 December 2017 was
also Directors of the following companies as set out below
and transactions included in Note 43.4 (a), 43.4 (b) and
43.4 (c) have been carried out with such companies.
Company Name of Director Position Relationship Details of financial dealings
John Keells
Holdings PLC
Ajit D. Gunewardene Deputy Chairman John Keells Holdings
PLC and its subsidiaries
own 93.79% of the
Company’s issued
share capital
The Company has transactions
in the normal course of business
with John Keells Holdings PLC,
its subsidiaries and associate
companies
Suresh Rajendra President -
Property Group
D. C. Alagaratnam President - HR,
Legal, Secretarial
& Sustainability
Keells Consultants
(Pvt) Ltd
Ajit D. Gunewardene Director Keells Consultants (Pvt)
Ltd is the Secretary of
Union Assurance PLC
and Fellow subsidiary of
Union Assurance PLC
The Company has transactions in
the normal course of business with
Keells Consultants (Pvt) Ltd
D. C. Alagaratnam Director
John Keells Office
Automation (Pvt) Ltd
Ajit D. Gunewardene Director Fellow Subsidiary of
Union Assurance PLC
The Company has transactions
in the normal course of business
with John Keells Office Automation
(Pvt) Ltd
D. C. Alagaratnam Director

255
UNION ASSURANCE PLC | ANNUAL REPORT 2017
FIN
AN
CIA
L IN
FO
RM
ATIO
N
Company Name of Director Position Relationship Details of financial dealings
John Keells Computer
Services (Pvt) Ltd
Ajit D. Gunewardene Director Fellow Subsidiary of
Union Assurance PLC
The Company has transactions in
the normal course of business with
John Keells Computer Services
(Pvt) Ltd
Asian Hotels and
Properties PLC
Ajit D. Gunewardene Director Fellow Subsidiary of
Union Assurance PLC
The Company has transactions in
the normal course of business with
Asian Hotels and Properties PLCS. Rajendra Director
Trans Asia Hotels PLC Ajit D. Gunewardene Director Fellow Subsidiary of
Union Assurance PLC
The Company has transactions in
the normal course of business with
Trans Asia Hotels PLC
Whittal Boustead
(Pvt) Ltd
Ajit D. Gunewardene Director Whittal Boustead Ltd
owns 7.28% shares of
Union Assurance PLC
and Fellow Subsidiary of
Union Assurance PLC
The Company has transactions in
the normal course of business with
Whittal Boustead (Pvt) Ltd
Tea Smallholder
Factories PLC
Ajit D. Gunewardene Director Fellow Subsidiary of
Union Assurance PLC
The Company has transactions in
the normal course of business with
Tea Smallholder Factories PLC
Fairfirst Insurance
Limited.
A. D. Pereira Director Associate company of
Union Assurance PLC
The Company owns 22% of the
company’s issued share capital
and has transactions in the normal
course of business
InfoMate Private
Limited
D. C. Alagaratnam Director Fellow Subsidiary of
Union Assurance PLC
The Company has transactions in
the normal course of business with
InfoMate Private Limited
Note: Mr. Ajit D. Gunewardene resigned w.e.f 31 December 2017.
43.4 (a) Transactions with the Parent and Ultimate Controlling Party
As at 31 December 2017 2016Rs. '000 Rs. '000
Statement of financial position
Assets
Intangible assets 24,970 -
24,970 -
Liabilities
Other liabilities (6,954) (2,621)
(6,954) (2,621)
Transacted amounts for the 2017 2016year ended 31 December Rs. '000 Rs. '000
Gross written premium 2,187 2,314
Net benefits and claims (400) (120)
Other operating and
administrative expenses (48,930) (20,513)

UNION ASSURANCE PLC | ANNUAL REPORT 2017
256
NOTES TO THE FINANCIAL STATEMENTS
43.4 (b) Transactions with / Between Subsidiary Companies and Associates of the Parent Company and Other Related Entities
As at 31 DecemberCompany
Relationship with Parent Company
Investment / Nature of transaction
2017Rs. '000
2016Rs. '000
Statement of financial positionAssetsProperty, plant and equipmentJohn Keells Office Automation (Pvt) Ltd Subsidiary Acquisition of property plant,
and equipment
15,032 12,359
John Keells Computer Services (Pvt) Ltd Subsidiary 159 1,119
15,191 13,478
Financial investmentsNations Trust Bank PLC Associate Debentures 627,996 602,675
Nations Trust Bank PLC Associate Cash at Bank 40,057 26,014
668,053 628,689
Other liabilitiesOther subsidiaries and associates Payment for shared services (3,902) (673)
(3,902) (673)
For the year ended 31 DecemberCompany
Relationship with Parent Company
Investment / Nature of transaction
2017Rs. '000
2016Rs. '000
Income StatementGross written premiumOther subsidiaries and associates 2,665 3,050
2,665 3,050
Net benefits and claimsOther subsidiaries and associates (2,100) (1,600)
(2,100) (1,600)
Investment incomeNations Trust Bank PLC Associate Debentures 77,338 57,466
77,338 57,466
Other operating and administrative expensesOther subsidiaries and associates (129,465) (61,466)
(129,465) (61,466)
43.4 (c) Transactions with / Between Associate of the Company - Fairfirst Insurance Ltd
Income Statement
For the year ended 31 December 2017 2016Rs. '000 Rs. '000
Gross written premium 2,579 1,660
Net benefits and claims (1,000) -
Rent Income 12,379 12,224
Other operating and
administrative expenses (36,340) (42,409)
Statement of Financial Position
As at 31 December 2017 2016Rs. '000 Rs. '000
Other receivables 13,793 100,988
Other liabilities (1,839) (3,234)

257
UNION ASSURANCE PLC | ANNUAL REPORT 2017
FIN
AN
CIA
L IN
FO
RM
ATIO
N
43.5 Transactions with Key Management Personnel (KMPS)
Key management personnel (KMP) are those persons having
authority and responsibility for planning, directing and
controlling the activities directly or indirectly. Accordingly,
the KMP include members of the Board of Directors of the
company (including Executive and Non - Executive Directors)
and selected key employees who meet the criteria for KMP.
As John Keells Holdings PLC (JKH) is the ultimate parent
of the Company and the Board of Directors of JKH has
the authority and responsibility of planning, directing and
controlling the activities of the Company, the Directors of
JKH have also been identified as KMP of the Company.
43.5 (a) Compensation of KMPS
For the year ended 31 December 2017 2016Rs. '000 Rs. '000
Short term employment benefits 44,559 34,711
Post employment benefits 21,177 17,204
Share based benefits - -
Total 65,736 51,915
The short term employment benefits include only the Non
Executive Directors fees and emoluments paid to the
Executive Director. Where applicable Directors fees are paid
directly to the companies that the Directors represent. There
are no short - term, long - term, post - employment, terminal
and share - based payments linked to the remuneration of
the Non - Executive Directors and no ex - gratia payments
were made to Directors during the year.
43.5 (b) Transactions, Arrangements and Agreements Involving KMPS, and their Close Family Members (CFMS)
CFMs of a KMP are those family members who may be
expected to influence, or be influenced by that KMP in their
dealings with the entity. They may include KMPs’ domestic
partner and children, children of the KMPs’ domestic partner
and dependents of the KMP or the KMPs’ domestic partner.
For the year ended 31 December 2017 2016Rs. '000 Rs. '000
Insurance premium 2,643 543
The Directors of the Company and their immediate relatives do
not have substantial shareholdings in the Company as at 31
December 2017.
43.5 (c) Share Based Benefits to KMP and CFM
As at 31 December 2017 2016
Number of ordinary shares held 8,562 8,562
Dividends paid (in Rs. 000) 90 73
44 Commitments
44.1 Capital Commitments
There were no significant capital commitments as at the
reporting date other than the following (2016 - Nil).
As at 31 December 2017 2016Rs. Mn Rs. Mn
Capital commitment contracted 241 Nil
44.2 Operating Lease
The Company has leased a number of branches under
operating leases. These leases have an average tenure
between one to five years. Lease agreements include clauses
to enable upward revision of the rental payments on a periodic
basis to reflect market conditions. There are no restrictions
placed upon the Company by entering into these leases.
44.2 (a) Future Minimum Lease Payments
The Company does not have any non cancellable operating
leases as at the reporting date.
44.2 (b) Amount Recognised in Profit or Loss
For the year ended 31 December 2017 2016Rs. '000 Rs. '000
Lease expenses 82,088 70,679
Contingent rent expenses Nil Nil
45 Events After the Reporting Date Accounting Policy
Events after the reporting period are those events,
favourable and unfavourable, that occur between the
reporting date and the date when the financial statements
are authorised for issue.
All material events after the reporting date have been
considered and where appropriate, adjustments or
disclosures have been made in the respective notes to the
financial statements.
There have been no events subsequent to the reporting
date, which would have any material effect on the Company,
other than the following;

UNION ASSURANCE PLC | ANNUAL REPORT 2017
258
45.1 Adjusting Events After Reporting Date
As disclosed in Note 38.4 (C), the Company has transferred
Rs. 3,382 million to a 'Restricted Regulatory Reserve' through
Income Statement, based on the direction issued by the IRCSL
on 20 March 2018 and subsequent approval. In accordance
with LKAS 10 - Events After Reporting Periods, this has been
treated as an adjusting event. Accordingly, these Financial
Statements have been adjusted.
45.2 Non Adjusting Events After Reporting Date
45.2 (a) The Board of Directors of the Company has declared a first
and final dividend of Rs. 18.00 per share for the financial
year ended 31 December 2017.
As required by Section 56 of the Companies Act No. 07
of 2007, the Board of Directors of the Company satisfied
the solvency test in accordance with Section 57, prior to
declaring the first and final dividend. A statement of solvency
duly completed and signed by the Directors on 27 February
2018 has been audited by Messrs. KPMG.
In accordance with the LKAS 10, Events after the reporting
period, the first and final dividend has not been recognised as
a liability in the financial statements as at 31 December 2017.
45.2 (b) Mr. S.C. Ratnayake has been appointed to the Board of
Directors of the Company with effect from 1 January 2018 as
Chairman and Non - Executive Director.
46 Provisions and Contingencies Accounting Policy
A provision is recognised if, as a result of a past event, the
company has a present legal or constructive obligation that
can be estimated reliably, and it is probable that an outflow
of economic benefits will be required to settle the obligation.
Provisions are determined by discounting the expected
future cash flows at a pre - tax rate that reflects current
market assessments of the time value of money and the
risks specific to the liability. The unwinding of the discount is
recognised in the profit or loss.
Contingent liabilities are disclosed if there is a possible future
obligation as a result of a past event, or if there is a present
obligation as a result of a past event but either a payment is not
probable or the amount cannot be reasonably estimated.
Use of Judgement and Estimates
The Company receives legal claims against it in the normal
course of business. Management has made judgement as to
the likelihood of any claim succeeding in making provisions. The
time of concluding legal claims is uncertain, as is the amount of
possible outflow of economic benefits. Timing and cost ultimately
depend on the due process in the respective legal jurisdictions.
46.1 The contingent liabilities of the Company as at 31 December 2017, relates to the following;
Income tax assessment relating to years of assessment 2010/11, 2011/12, 2012/13, 2013/14 and 2014/15
The Department of Inland Revenue has raised assessments
on Union Assurance PLC for the years of assessment
2010 / 11, 2011 / 12 and 2012 / 13, assessing the Life
insurance business to pay income tax liabilities of
Rs. 13 million, Rs. 132 million and Rs. 411 million together
with a Rs. 233 million penalty totalling to Rs. 644 million
respectively. The Company has lodged valid appeals against
the said assessments with the Tax Appeals Commission.
The Department of Inland Revenue has raised assessments
on Union Assurance PLC for the years of assessment
2013 / 14 and 2014 / 15, assessing the Life insurance
business to pay an income tax liability of Rs. 175 million
along with a 50% penalty totalling to Rs. 263 million and
Rs. 862 million along with a 50% penalty totalling to
Rs. 1,294 million respectively. The Company has lodged
valid appeals with the Commissioner General of Inland
Revenue against the said assessments.
Directors are of the view that it has followed due process
and acted in accordance with the prevailing laws in its tax
submissions for years of assessment 2010 / 11, 2011/ 12,
2012 / 13, 2013 / 14 and 2014 / 15 and therefore, the above
assessments have no rationale or basis in law.
The Company operates in the insurance industry and is subject to legal proceedings in the normal course of business.
While it is not practicable to forecast or determine the final results
of all pending or potential legal proceedings, Directors do not
believe that such proceedings (including litigation) will have a
material effect on the company’s results and financial position. All
pending litigation for claims have been evaluated and adequate
provisions have been made in the financial statements.
The Company is also subject to insurance solvency regulations and has complied with all solvency regulations
There are no contingencies associated with the Company’s
compliance or lack of compliance with such regulations.
47 Comparative InformationThe presentation and classification in the financial
statements have been amended where appropriate to
ensure comparability with the current year.
48 Directors’ ResponsibilityThe Board of Directors of the Company is responsible for the
preparation and presentation of these financial statements.
Please refer page 176 for the Statement of Directors’
Responsibility.
NOTES TO THE FINANCIAL STATEMENTS

Memberships Maintained by the Company
We actively participate in public policy development for the
betterment of society as a whole by being active members of;
The Ceylon Chamber of Commerce
American Chamber of Commerce in Sri Lanka
National Chamber of Exporters of Sri Lanka
Insurance Association of Sri Lanka
Employers’ Federation of Ceylon
Sri Lanka Association of Software and Service
Companies (SLASSCOM)
Sri Lanka Institute of Directors
LIMRA (Life Insurance and Market Research Association)
GRI 102-13SUPPLEMENTARY INFORMATION260 Decade at a Glance
262 Independent Assurance Report on Non-Financial Reporting
264 GRI Content Index
271 Certificate of Carbon Footprint
272 Glossary of Insurance Terms
274 Quarterly Analysis 2017
Life Insurance Fund
275 - Insurance Revenue Account
275 - Statement of Financial Position
276 - Statement of Cash Flows
278 - Notes to the Statement of Financial Position
280 Understanding our Financials
281 Distribution Network
283 Corporate Information
284 Notice of Meeting
285 Proxy Form
287 Stakeholder Feedback Form 259

UNION ASSURANCE PLC | ANNUAL REPORT 2017
260
DECADE AT A GLANCEIn
com
e S
tate
men
tR
s’0
00
2017
2016
2015
2014
2013
2012
2011
2010
2009
2008
Gro
ss w
ritten p
rem
ium
10,1
17,6
30
8
,270,7
51
6
,964,3
90
5
,945,4
99
5
,515,0
63
5
,106,3
23
4
,471,6
28
3
,465,5
05
2
,778,1
84
2
,503,8
87
Net w
ritten p
rem
ium
9,6
20,0
18
7
,846,8
94
6
,600,2
08
5
,617,4
35
5
,234,5
21
4
,856,7
28
4
,268,7
20
3
,367,1
79
2
,678,4
82
2
,372,3
75
Investm
ent and
oth
er
incom
e 3
,822,2
25
2
,746,3
06
2
,167,3
04
3
,159,9
57
2
,017,5
44
1
,722,0
70
1
,215,0
43
1
,806,8
73
1
,361,8
53
9
34,9
14
Net b
enefits
and
cla
ims
(5,3
88,6
96)
(5,8
33,6
50)
(4,8
73,6
07)
(5,2
01,0
25)
(3,9
76,2
48)
(3,5
72,7
69)
(2,7
91,6
35)
(2,8
39,0
59)
(2,1
79,3
44)
(1,7
46,7
36)
Chang
e in c
ontr
act lia
bili
ty d
ue to
transfe
r of one o
ff s
urp
lus
3,3
81,9
34
--
--
--
--
-
Und
erw
riting
and
net acq
uis
itio
n c
osts
(inclu
din
g r
ein
sura
nce)
(1,8
41,1
51)
(1,4
41,6
17)
(1,2
89,4
37)
(1,1
15,8
34)
(968,1
81)
(890,5
36)
(819,0
76)
(675,6
73)
(503,1
50)
(457,4
31)
Oth
er
op
era
ting
and
ad
min
istr
ative
exp
enses
(2,5
70,3
96)
(2,1
57,2
54)
(1,8
32,7
43)
(1,7
10,5
33)
(1,6
95,6
36)
(1,5
90,4
93)
(1,4
44,0
52)
(1,3
34,3
20)
(1,1
22,8
41)
(918,1
22)
Incom
e tax r
evers
al / (c
harg
e)
- (
60,6
79)
28,2
75
-
-
-
-
-
-
-
Sur
plus
from
life
insu
ranc
e fu
nd 7
,023,9
34*
1,1
00,0
00
8
00,0
00
7
50,0
00
6
12,0
00
5
25,0
00
4
29,0
00
3
25,0
00
2
35,0
00
1
85,0
00
Investm
ent and
oth
er
incom
e n
ot
attrib
uta
ble
to p
olic
yhold
ers
236,2
90
1
79,4
32
1
,530,8
51
1
67,6
23
2
07,0
74
2
3,1
61
-
-
-
-
Exp
enses n
ot attrib
uta
ble
to
polic
yhold
ers
(63,9
40)
(27,1
19)
(42,2
05)
(36,8
83)
(28,1
10)
(15,3
42)
(12,8
26)
-
-
-
Share
of net re
sult o
f eq
uity a
ccounte
d
investe
e 1
87,8
44
6
0,3
15
5
7,9
90
-
-
-
-
-
-
-
Pro
fit fo
r th
e ye
ar 7
,384,1
28*
1,3
12,6
28
2
,346,6
36
8
80,7
40
7
90,9
64
5
32,8
19
4
16,1
74
3
25,0
00
2
35,0
00
1
85,0
00
Sta
tem
ent
of
finan
cial
po
siti
on
Rs’
00
020
1720
1620
1520
14R
esta
ted
2013
2012
2011
2010
2009
2008
Ass
ets
Inta
ng
ible
assets
212,8
17
9
4,6
47
5
9,6
16
6
6,7
66
1
17,4
75
-
--
49,5
00
4
9,5
00
Pro
pert
y, p
lant and
eq
uip
ment
2,0
00,7
16
1
,493,0
40
1
,523,6
76
1
,203,9
34
1
,337,4
98
1
,318,2
25
1
,298,3
80
1
,108,7
23
1
,070,0
60
3
53,7
25
Investm
ent in
sub
sid
iary
-
-
-
-
-
-
-
-
-
183,2
00
Investm
ent in
eq
uity
accounte
d in
veste
e 9
95,7
22
7
77,3
46
7
36,2
16
-
-
-
-
-
-
-
Fin
ancia
l in
vestm
ents
inclu
din
g
derivatives
36,7
92,9
21
30,8
47,2
56
2
6,5
40,9
34
2
4,0
38,9
78
2
4,2
97,4
98
2
0,8
02,3
09
1
6,5
79,0
94
1
4,3
37,8
60
1
1,9
11,0
86
9
,389,3
19
Loans to life p
olic
yhold
ers
1,0
01,5
38
8
67,1
77
7
41,8
52
6
60,7
44
5
15,7
35
3
85,6
88
2
46,6
74
2
32,6
18
2
24,3
25
1
89,2
74
Rein
sura
nce r
eceiv
ab
le 2
67,4
17
1
78,1
81
1
49,7
72
6
7,5
36
5
02,5
71
4
00,6
27
5
45,7
74
6
19,2
28
9
00,8
00
8
36,7
08
Pre
miu
ms r
eceiv
ab
le 2
68,5
11
2
46,8
00
2
03,7
22
1
59,1
17
1
,844,8
31
1
,459,4
40
1
,236,2
99
1
,237,5
94
8
45,7
56
7
24,7
48
Receiv
ab
les a
nd
oth
er
assets
947,2
39
8
09,7
84
7
32,0
17
8
16,7
18
1
,087,5
85
1
,055,0
06
1
,795,7
27
1
,552,0
89
1
,329,8
48
1
,164,8
21
Defe
rred
acq
uis
itio
n c
ost
-
-
-
-
149,1
45
1
46,0
97
1
47,4
95
1
39,1
76
1
30,4
45
1
15,0
19
Cash in h
and
and
at b
ank
580,1
26
3
79,2
32
3
26,0
12
1
96,4
29
4
66,4
02
3
15,6
34
3
73,4
13
3
90,1
38
3
13,8
55
2
72,0
80
Assets
held
for
sale
-
-
-
8,3
93,3
14
-
-
-
-
-
-
Tota
l Ass
ets
43,0
67,0
07
35,6
93,4
63
3
1,0
13,8
17
3
5,6
03,5
36
3
0,3
18,7
40
2
5,8
83,0
26
2
2,2
22,8
56
1
9,6
17,4
26
1
6,7
75,6
75
1
3,2
78,3
94
* In
clu
des the r
estr
icte
d o
ne -
off s
urp
lus tra
nsfe
r of R
s. 3.4
bill
ion in 2
017.

261
UNION ASSURANCE PLC | ANNUAL REPORT 2017
SU
PP
LEM
EN
TAR
Y IN
FO
RM
ATIO
N
Sta
tem
ent
of
Fin
anci
al P
osi
tio
n
Rs’
00
020
1720
1620
1520
1420
1320
1220
1120
1020
0920
08
Equ
ity
Sta
ted
cap
ital
1,0
00,0
00
1
,000,0
00
1
,000,0
00
1
,138,4
33
1
,138,4
33
1
,133,3
05
3
88,4
33
3
88,4
33
3
88,4
33
3
88,4
33
Restr
icte
d r
eg
ula
tory
reserv
e 3
,381,9
34
--
--
--
--
-
Oth
er
reserv
es
2,1
44,7
28
8
17,0
03
1
,232,8
93
1
,228,7
22
8
29,0
94
7
20,8
30
9
55,1
94
1
,340,9
70
5
84,3
59
4
7,9
58
Reta
ined
earn
ing
s 5
,438,0
52
2
,049,1
89
1
,232,0
35
3
,843,7
04
3
,149,7
66
2
,454,9
23
1
,903,5
87
1
,439,1
09
1
,332,3
59
1
,051,0
77
Tota
l Equ
ity11,9
64,7
14
3
,866,1
92
3
,464,9
28
6
,210,8
59
5
,117,2
93
4
,309,0
58
3
,247,2
14
3
,168,5
12
2
,305,1
51
1
,487,4
68
Liab
ilitie
s
Insura
nce c
ontr
act lia
bili
ties -
Life
26,9
49,6
13
27,8
89,6
82
2
3,7
31,2
38
2
0,4
35,8
76
1
7,5
18,0
16
1
5,3
56,3
40
1
3,4
40,4
59
1
1,7
69,3
08
9
,783,6
76
8
,134,0
40
- U
nit
Lin
ked
2,1
21,6
09
2
,377,7
07
2
,541,2
21
2
,618,0
07
1
,807,1
37
1
,143,5
46
5
55,5
41
1
65,8
35
-
-
-
Non L
ife
-
-
-
-
3,4
40,2
49
3
,200,8
38
3
,050,9
76
2
,813,2
50
2
,689,3
94
2
,371,3
42
Em
plo
yee b
enefit lia
bili
ties
122,5
88
1
07,9
63
1
00,1
99
9
0,4
37
1
86,0
78
1
63,5
72
8
9,4
67
8
3,0
32
7
7,8
23
6
8,6
20
Defe
rred
revenue
-
-
-
-
109,4
02
9
6,9
04
1
54,7
02
1
32,4
22
9
5,9
55
8
3,8
11
Rein
sura
nce p
ayab
les
345,1
46
2
08,7
42
2
13,8
55
1
50,7
84
7
64,9
77
4
15,3
94
4
41,5
67
4
05,7
64
3
27,1
96
3
44,9
91
Oth
er
liab
ilities
1,3
68,0
31
1,0
92,8
71
8
43,4
24
7
70,1
87
1
,336,8
64
1
,172,8
99
1
,212,5
57
1
,050,1
94
1
,474,2
37
7
88,1
22
Bank o
verd
raft
195,3
06
1
50,3
06
1
18,9
52
6
6,0
17
3
8,7
24
2
4,4
75
3
0,3
73
2
9,1
09
2
2,2
43
-
Lia
bili
ties h
eld
for
sale
-
-
-
5,2
61,3
66
-
-
-
-
-
-
Tota
l Lia
bilit
ies
31,1
02,2
93
31,8
27,2
71
2
7,5
48,8
89
2
9,3
92,6
74
2
5,2
01,4
47
2
1,5
73,9
68
1
8,9
75,6
42
1
6,4
48,9
14
1
4,4
70,5
24
1
1,7
90,9
26
Tota
l equ
ity a
nd li
abili
ties
43,0
67,0
07
35,6
93,4
63
3
1,0
13,8
17
3
5,6
03,5
36
3
0,3
18,7
40
2
5,8
83,0
26
2
2,2
22,8
56
1
9,6
17,4
26
1
6,7
75,6
75
1
3,2
78,3
94
Inve
stor
Info
rmat
ion
Retu
rn o
n N
et A
ssets
(%
)* 6
1.7
2
33.9
5
67.7
0
19.3
9
21.9
5
21.3
8
21.4
1
16.1
6
17.3
9
23.0
0
Earn
ing
s P
er
Share
(R
s.)
* 1
25.3
1
22.2
7
31.2
0
14.0
4
13.1
1
12.2
8
9.2
7
6.8
3
5.3
5
4.5
6
Div
idend
Per
Share
(R
s.)
18.0
0 1
0.5
0
8.5
0
6.5
0
6.0
0
5.0
0
5.0
0
3.1
3
2.5
0
1.6
3
Net A
ssets
Per
Share
(R
s.)
203.0
4 6
5.6
1
58.8
0
72.4
6
59.7
0
50.2
7
43.3
0
84.4
9
61.4
7
39.6
7
Mark
et P
rice P
er
Share
(R
s.)
135.0
0
143.0
0
165.0
0
164.0
0
104.0
0
83.0
0
108.1
0
122.1
0
90.7
5
49.7
5
Mark
et C
ap
italis
ation (
Rs. M
n.)
7,9
55.0
8
,426.7
9
9,7
23.2
1
14,0
57.1
0
8,9
14.2
6
7,1
14.2
9
8,1
07.5
0
4,5
78.7
5
3,4
03.1
3
1,8
65.6
3
Price E
arn
ing
s R
atio (
Tim
es)
1.0
8
6.4
2
5.2
9
11.6
8
7.9
4
6.7
6
11.6
6
8.9
4
8.4
9
5.4
5
Oth
er In
form
atio
n
Num
ber
of em
plo
yees
529
474
450
445
1,1
57
1,0
88
1,0
09
989
949
902
No o
f S
hare
s (
'000)
58,9
29
58,9
29
58,9
29
85,7
14
85,7
14
85,7
14
75,0
00
37,5
00
37,5
00
37,5
00
* 2008 to 2
014 fig
ure
s inclu
de p
rofits
of th
e n
on life insura
nce b
usin
ess.

UNION ASSURANCE PLC | ANNUAL REPORT 2017
262
INDEPENDENT ASSURANCE REPORT ON NON-FINANCIAL REPORTING GRI 102-56
INDEPENDENT ASSURANCE REPORT TO UNION ASSURANCE PLC
We have been engaged by the Directors of
Union Assurance PLC (“the Company”) to
provide reasonable assurance and limited
assurance in respect of the Sustainability
Indicators as identified below for the
year ended December 31, 2017. The
Sustainability Indicators are included in the
Union Assurance PLC’s Integrated Annual
Report for the year ended December 31,
2017 (the "Report").
The Reasonable Assurance Sustainability
Indicators covered by our reasonable
assurance engagement are:
Assured Sustainability Indicators
Integrated Annual Report Page
Financial Highlights 12
The Limited Assurance Sustainability
Indicators covered by our limited assurance
engagement are:
Limited Assurance Sustainability Indicators
Integrated Annual
Report Page
Sustainability performance indicators:
- Non-Financial Highlights 13
- Performance Highlights 10 - 11
Information provided on following
stakeholder groups:
Shareholders - Financial
capital and Share Information 51 - 64
Customers - Manufactured
capital, Social and
Relationship Capital and
Intellectual Capital
101 - 103,
65 - 76
and
89 - 94
Environment - Natural capital 95 - 100
Employees - Human capital 77 - 88
Suppliers - Social and
Relationship capital 65 - 76
Community - Social and
Relationship capital 65 - 76
Our Conclusions:
Our conclusion has been formed on the
basis of, and is subject to, the matters
outlined in this report.
We believe that the evidence we have
obtained is sufficient and appropriate to
provide a basis for our conclusions.
Reasonable Assurance Sustainability Indicators
In our opinion, the Reasonable Assurance
Sustainability Indicators, as defined above,
for the year ended December 31, 2017 are, in
all material respects, prepared and presented
in accordance with the GRI Standards.
Limited Assurance Sustainability Indicators
Based on the limited assurance procedures
performed and the evidence obtained, as
described below, nothing has come to our
attention that causes us to believe that the
Limited Assurance Sustainability Indicators,
as defined above, for the year ended
December 31, 2017, have not in all material
respects, been prepared and presented in
accordance with the GRI Standards.
Management's Responsibility
Management is responsible for the
preparation and presentation of the
Reasonable Assurance Sustainability
Indicators and the Limited Assurance
Sustainability Indicators in accordance with
the GRI Standards.
These responsibilities includes establishing
such internal controls as management
determines are necessary to enable the
preparation of the Reasonable Assurance
Sustainability Indicators and the Limited
Assurance Sustainability Indicators that are
free from material misstatement whether
due to fraud or error.
Management is responsible for preventing
and detecting fraud and for identifying
and ensuring that the Company complies
with laws and regulations applicable to its
activities.
Management is also responsible for
ensuring that staff involved with the
preparation and presentation of the
description and Report are properly
trained, information systems are properly
updated and that any changes in reporting
encompass all significant business units.
Our Responsibility
Our responsibility is to express a reasonable
assurance conclusion on the Company’s
preparation and presentation of the
Reasonable Assurance Sustainability
Indicators and a limited assurance
conclusion on the preparation and
presentation of the Limited Assurance
Sustainability Indicators included in the
Report, as defined above.
We conducted our assurance engagement
in accordance with Sri Lanka Standard on
Assurance Engagements SLSAE 3000:
Assurance Engagements other than
Audits or Reviews of Historical Financial
Information (SLSAE 3000) issued by the
Institute of Chartered Accountants of Sri
Lanka.
We have complied with the independence
and other ethical requirements of the Code
of Ethics issued by the Institute of Chartered
Accountants of Sri Lanka.
SLSAE 3000 requires that we plan and
perform the engagement to obtain
reasonable assurance about whether
the Reasonable Assurance Sustainability
Indicators are free from material
misstatement and limited assurance
about whether the Limited Assurance

263
UNION ASSURANCE PLC | ANNUAL REPORT 2017
SU
PP
LEM
EN
TAR
Y IN
FO
RM
ATIO
N
GRI 102-56
Sustainability Indicators are free from
material misstatement.
Reasonable Assurance Over Reasonable Assurance Sustainability Indicators
The procedures selected in our reasonable
assurance engagement depend on our
judgment, including the assessment of
the risks of material misstatement of the
Reasonable Assurance Sustainability
Indicators whether due to fraud or error.
In making those risk assessments, we
have considered internal control relevant
to the preparation and presentation of
the Reasonable Assurance Sustainability
Indicators in order to design assurance
procedures that are appropriate in
the circumstances, but not for the
purposes of expressing a conclusion as
to the effectiveness of the Company's
internal control over the preparation and
presentation of the Report.
Our engagement also included assessing
the appropriateness of the Reasonable
Assurance Sustainability Indicators, the
suitability of the criteria, being the GRI
Standards, used by the Company in
preparing and presenting the Reasonable
Assurance Sustainability Indicators within
the Report, obtaining an understanding
of the compilation of the financial and
non-financial information to the sources
from which it was obtained, evaluating
the reasonableness of estimates made by
the Company, and re-computation of the
calculations of the Reasonable Assurance
Sustainability Indicators.
Limited Assurance on the Assured Sustainability Indicators
Our limited assurance engagement on the
Limited Assurance Sustainability Indicators
consisted of making enquiries, primarily
of persons responsible for the preparation
of the Limited Assurance Sustainability
Indicators, and applying analytical and
other procedures, as appropriate. These
procedures included:
interviews with senior management and
relevant staff at corporate and selected
site level concerning sustainability
strategy and policies for material issues,
and the implementation of these across
the business;
enquiries of management to gain
an understanding of the Company's
processes for determining material
issues for the Company's key
stakeholder groups;
enquiries of relevant staff at corporate
and selected site level responsible
for the preparation of the Limited
Assurance Sustainability Indicators;
enquiries about the design and
implementation of the systems and
methods used to collect and report
the Limited Assurance Sustainability
Indicators, including the aggregation of
the reported information;
comparing the Limited Assurance
Sustainability Indicators to relevant
underlying sources on a sample basis
to determine whether all the relevant
information has been appropriately
included in the Report;
reading the Limited Assurance
Sustainability Indicators presented in
the Report to determine whether they
are in line with our overall knowledge of,
and experience with, the sustainability
performance of the Company;
reading the remainder of the Report
to determine whether there are any
material misstatements of fact or
material inconsistencies based on our
understanding obtained as part of our
assurance engagement.
The procedures performed in a limited
assurance engagement vary in nature
and timing from, and are less in extent
than for, a reasonable assurance
engagement, and consequently the level of
assurance obtained in a limited assurance
engagement is substantially lower than the
assurance that would have been obtained
had a reasonable assurance engagement
been performed. Accordingly, we do not
express a reasonable assurance conclusion
on the Limited Assurance Sustainability
Indicators.
Purpose of Our Report
In accordance with the terms of our
engagement, this assurance report has
been prepared for the Company for
the purpose of assisting the Directors
in determining whether the Company's
Reasonable and Limited Assurance
Sustainability Indicators are prepared and
presented in accordance with the GRI
Standards and for no other purpose or in
any other context.
Restriction of Use of Our Report
Our report should not be regarded as
suitable to be used or relied on by any party
wishing to acquire rights against us other
than the Company, for any purpose or in
any other context. Any party other than the
Company who obtains access to our report
or a copy thereof and chooses to rely on our
report (or any part thereof) will do so at its
own risk. To the fullest extent permitted by
law, we accept or assume no responsibility
and deny any liability to any party other
than the Company for our work, for this
independent assurance report, or for the
conclusions we have reached.
Chartered Accountants
Colombo
29 March 2018

UNION ASSURANCE PLC | ANNUAL REPORT 2017
264
GRI CONTENT INDEX
This report has been prepared in accordance with the GRI Standards: Core option
GRI Standard
Disclosure Page NumberReason for Omission
GRI 101: Foundation 2016
GRI 102: General Disclosures 2016
Organizational profile
102-1 Name of the organisation 283
102-2 Activities, brands, products, and services 67 to 70
102-3 Location of headquarters 283
102-4 Location of operations 6
102-5 Ownership and legal form 283
102-6 Markets served 18
102-7 Scale of the organisation 12 and 13
102-8 Information on employees and other workers 80 and 81
102-9 Supply chain 75
102-10 Significant changes to the organization and its supply chain No significant change in the
supply chain
102-11 Precautionary Principle or approach 158 and 159
102-12 External initiatives 2
102-13 Membership of associations 259
Strategy
102-14 Statement from senior decision-maker 16 to 20
Ethics and integrity
102-16 Values, principles, standards, and norms of behaviour 24
Governance
102-18 Governance structure 111 and 112
Stakeholder engagement
102-40 List of stakeholder groups 30
102-41 Collective bargaining agreements No collective bargaining agreements
102-42 Identifying and selecting stakeholders 30
102-43 Approach to stakeholder engagement 31
102-44 Key topics and concerns raised 32 and 33
Reporting practice
102-45 Entities included in the consolidated financial statements 2
102-46 Defining report content and topic Boundaries 2
102-47 List of material topics 34 and 35
102-48 Restatements of information 35
102-49 Changes in reporting 35
102-50 Reporting period 2
GRI 102-55

265
UNION ASSURANCE PLC | ANNUAL REPORT 2017
SU
PP
LEM
EN
TAR
Y IN
FO
RM
ATIO
N
GRI 102-55
GRI Standard
Disclosure Page NumberReason for Omission
102-51 Date of most recent report 31 December 2016
102-52 Reporting cycle Annual
102-53 Contact point for questions regarding the report Nadee Perera
102-54 Claims of reporting in accordance with the GRI Standards 2
102-55 GRI content index 264 to 270
102-56 External assurance 262 and 263
Topic-specific Standards- Material Topics
GRI 200: Economic Standard Series
GRI 201: Economic Performance 2016
Management Approach
103-1 Explanation of the material topic and its Boundary
Create long term value to shareholders while protecting the interest of our policyholders.
103-2 The management approach and its components 52
103-3 Evaluation of the management approach 52
201-1 Direct economic value generated and distributed 57
201-2 Financial implications and other risks and opportunities due to climate change No major impact due to climate change
201-3 Defined benefit plan obligations and other retirement plans 13 and 85
201-4 Financial assistance received from government None
GRI 203: Indirect Economic Impacts 2016
Management Approach
103-1 Explanation of the material topic and its Boundary
Be accountable and implement strategies that would transmit change through the social
and economic parameters of the business operations
103-2 The management approach and its components 66
103-3 Evaluation of the management approach 66
203-1 Infrastructure investments and services supported 13 and 72 to 73
203-2 Significant indirect economic impacts 57 and 72 to 73
GRI 300: Environment Standard Series
GRI 302: Energy 2016
Management Approach
103-1 Explanation of the material topic and its Boundary
Implement various energy conservation initiatives at head office and branch level to
minimise the impact create on the environment and use of non-renewable energy
103-2 The management approach and its components 96
103-3 Evaluation of the management approach 96
302-1 Energy consumption within the organisation 97
302-2 Energy consumption outside of the organisation 97
302-3 Energy intensity 97
302-4 Reduction of energy consumption 97
302-5 Reduction in energy requirements of products and services 97

UNION ASSURANCE PLC | ANNUAL REPORT 2017
266
GRI Standard
Disclosure Page NumberReason for Omission
GRI 303: Water 2016
Management Approach
103-1 Explanation of the material topic and its Boundary
Implement various water conservation initiatives at head office and branch level to
ensure effective utilization of water
103-2 The management approach and its components 98
103-3 Evaluation of the management approach 98
303-1 Water withdrawal by source 98
303-2 Water sources significantly affected by withdrawal of water 98
303-3 Water recycled and reused 13 and 98
GRI 305: Emissions 2016
Management Approach
103-1 Explanation of the material topic and its Boundary
Measure and reduce what has been discharged to atmosphere and adherence to all
globally accepted measurement parameters with regard to emission management
103-2 The management approach and its components 98
103-3 Evaluation of the management approach 99
305-1 Direct (Scope 1) GHG emissions 98 and 271
305-2 Energy indirect (Scope 2) GHG emissions 98 and 271
305-3 Other indirect (Scope 3) GHG emissions 98 and 271
305-4 GHG emissions intensity 98
305-5 Reduction of GHG emissions 99
305-6 Emissions of ozone-depleting substances (ODS) Not tracked
305-7 Nitrogen oxides (NOX), sulphur oxides (SOX), and other significant air emissions Not tracked
GRI 306: Effluents and Waste 2016
Management Approach
103-1 Explanation of the material topic and its Boundary
Re-use and Recycle of materials including paper, e-waste, food and waste water to
minimise the impact created on the environment
103-2 The management approach and its components 99
103-3 Evaluation of the management approach 99
306-1 Water discharge by quality and destination Not tracked
306-2 Waste by type and disposal method 99
306-3 Significant spills No significant spills reported during
the year
306-4 Transport of hazardous waste Business does not involve transport
to hazardous waste
306-5 Water bodies affected by water discharges and / or runoff No major water bodies affected by
water discharge
GRI CONTENT INDEXGRI 102-55

267
UNION ASSURANCE PLC | ANNUAL REPORT 2017
SU
PP
LEM
EN
TAR
Y IN
FO
RM
ATIO
N
GRI 102-55
GRI Standard
Disclosure Page NumberReason for Omission
GRI 307: Environmental compliance 2016
Management Approach
103-1 Explanation of the material topic and its Boundary
Compliance with all the environmental regulations applicable to branch expansion and
business operations
103-2 The management approach and its components 100
103-3 Evaluation of the management approach 100
307-1 Non-compliance with environmental laws and regulations No non-compliance reported
GRI 400: Social Standard Series
GRI 401: Employment 2016
Management Approach
103-1 Explanation of the material topic and its Boundary
Continuously invest in developing skills and competencies of the team, to meet current
as well as future business opportunities and challenges. Committed to be a “Great
Place to Work” and to be an equal opportunity employer.
103-2 The management approach and its components 77 and 78
103-3 Evaluation of the management approach 78
401-1 New employee hires and employee turnover 81
401-2 Benefits provided to full-time employees that are not provided to temporary or
part-time employees
Benefits vary based on the terms
of employment and not based on
locational operation
401-3 Parental leave Not tracked but
have not noticed any
significant drop out
GRI 402: Labour/Management relations 2016
Management Approach
103-1 Explanation of the material topic and its Boundary
Maintaining healthy relationship by implementing number of employee
engagement initiatives
103-2 The management approach and its components 86
103-3 Evaluation of the management approach 86
402-1 Minimum notice periods regarding operational changes 86
GRI 403: Occupational Health and Safety 2016
Management Approach
103-1 Explanation of the material topic and its Boundary
Adopting unique culture that drives to provide a healthy workplace for staff
103-2 The management approach and its components 84
103-3 Evaluation of the management approach 84
403-1 Workers representation in formal joint management–worker health and safety committees 13 and 84
403-2 Types of injury and rates of injury, occupational diseases, lost days, and absenteeism,
and number of work-related fatalities 13

UNION ASSURANCE PLC | ANNUAL REPORT 2017
268
GRI Standard
Disclosure Page NumberReason for Omission
403-3 Workers with high incidence or high risk of diseases related to their occupation No such workers
403-4 Health and safety topics covered in formal agreements with trade unions No trade union
GRI 404: Training and Education 2016
Management Approach
103-1 Explanation of the material topic and its Boundary
Developing an learning environment and ensure people development, talent retention
and sustainable competitive advantage
103-2 The management approach and its components 83
103-3 Evaluation of the management approach 83
404-1 Average hours of training per year per employee 83
404-2 Programs for upgrading employee skills and transition assistance programs 83 and 84
404-3 Percentage of employees receiving regular performance and career development reviews 13 and 82
GRI 405: Diversity and equal opportunity 2016
Management Approach
103-1 Explanation of the material topic and its Boundary
Taking extensive measures to ensure the attitudes of openness and inclusivity are
embedded in the every part of the organisation
103-2 The management approach and its components 79
103-3 Evaluation of the management approach 79
405-1 Diversity of governance bodies and employees 80 and 81
405-2 Ratio of basic salary and remuneration of women to men 79
GRI 406: Non-Discrimination 2016
Management Approach
103-1 Explanation of the material topic and its Boundary
Avoid discrimination when recruiting, promoting and granting recognitions.
103-2 The management approach and its components 86
103-3 Evaluation of the management approach 86
406-1 Incidents of discrimination and corrective actions taken No incidents reported
GRI 407: Freedom of association and collective bargaining 2016
Management Approach
103-1 Explanation of the material topic and its Boundary
Integrate human right policies into everyday governance and business practices
103-2 The management approach and its components 86
103-3 Evaluation of the management approach 86
407-1 Operations and suppliers in which the right to freedom of association and collective
bargaining may be at risk
No such operation has been
recognised
GRI CONTENT INDEXGRI 102-55

269
UNION ASSURANCE PLC | ANNUAL REPORT 2017
SU
PP
LEM
EN
TAR
Y IN
FO
RM
ATIO
N
GRI 102-55
GRI Standard
Disclosure Page NumberReason for Omission
GRI 410: Security practices 2016
Management Approach
103-1 Explanation of the material topic and its Boundary
Providing training to security personnel ensure work place safety and positively
contributes to security of employees, customers, community.
103-2 The management approach and its components 74
103-3 Evaluation of the management approach 74
410-1 Security personnel trained in human rights policies or procedures 100% training provided
GRI 413: Local communities 2016
Management Approach
103-1 Explanation of the material topic and its Boundary
Identifying and addressing key material issues applicable to community through
CSR committee
103-2 The management approach and its components 72
103-3 Evaluation of the management approach 72
413-1 Operations with local community engagement, impact assessments, and
development programs 13 and 72 to 73
413-2 Operations with significant actual and potential negative impacts on local communities No such operations
reported
GRI 414: Supplier social assessment 2016
Management Approach
103-1 Explanation of the material topic and its Boundary
Implementation of proper supplier selection criteria when recruiting and maintaining
suppliers relationships
103-2 The management approach and its components 74
103-3 Evaluation of the management approach 74
414-1 New suppliers that were screened using social criteria 13 and 74 to 75
414-2 Negative social impacts in the supply chain and actions taken No negative social impacts reported
GRI 415: Public policy 2016
Management Approach
103-1 Explanation of the material topic and its Boundary
Providing positive contribution towards various policy initiatives implemented
by government
103-2 The management approach and its components 72 and 73
103-3 Evaluation of the management approach 72 and 73
415-1 Political contributions No political contribution made

UNION ASSURANCE PLC | ANNUAL REPORT 2017
270
GRI CONTENT INDEX
GRI Standard
Disclosure Page NumberReason for Omission
GRI 416: Customer health and safety 2016
Management Approach
103-1 Explanation of the material topic and its Boundary
Developing and providing insurance products that ensure health and safety of
the customers
103-2 The management approach and its components 67 to 70
103-3 Evaluation of the management approach 67 to 70
416-1 Assessment of the health and safety impacts of product and service categories 67 to 70
416-2 Incidents of non-compliance concerning the health and safety impacts of
products and services No non-compliance reported
GRI 417: Marketing and Labelling 2016
Management Approach
103-1 Explanation of the material topic and its Boundary
Providing insurance solutions, fair and responsible marketing communications as well
as access to information about the composition of products.
103-2 The management approach and its components 67 to 70
103-3 Evaluation of the management approach 67 to 70
417-1 Requirements for product and service information and labelling 67 to 70
417-2 Incidents of non-compliance concerning product and service information and labelling Zero incidents
417-3 Incidents of non-compliance concerning marketing communications Zero incidents
GRI 418: Customer privacy 2016
Management Approach
103-1 Explanation of the material topic and its Boundary
Taking reasonable measures to ensure the security of personal data collected
103-2 The management approach and its components 70
103-3 Evaluation of the management approach 70
418-1 Substantiated complaints concerning breaches of customer privacy and losses of
customer data Zero incidents
GRI 419: Socioeconomic Compliance 2016
Management Approach
103-1 Explanation of the material topic and its Boundary
Compliance with socioeconomic regulations applicable to the organisations
103-2 The management approach and its components 71
103-3 Evaluation of the management approach 71
419-1 Non-compliance with laws and regulations in the social and economic area 13
Zero non-compliance
GRI 102-55

271
UNION ASSURANCE PLC | ANNUAL REPORT 2017
SU
PP
LEM
EN
TAR
Y IN
FO
RM
ATIO
NCERTIFICATE OF CARBON FOOTPRINT GRI 305-1 | 305-2 | 305-3
271

UNION ASSURANCE PLC | ANNUAL REPORT 2017
272
GLOSSARY OF INSURANCE TERMS
Accumulation - The situation where a significant
number of risks insured or reinsured with the
same company may be affected simultaneously
by a loss event.
Acquisition expenses - All expenses which vary
with, and are primarily related to, the acquisition
of new insurance contracts and the renewal of
existing insurance contracts e.g. commissions.
Actuary - Qualified expert who analyses
problems from the area of insurance,
investments and pensions using methods of
probability theory and financial mathematics
and develops solutions with due regard to legal
and economic parameters.
Administrative expenses - Costs of an
administrative nature including those arising
from premium collection portfolio administration,
handling of bonuses and rebates and inward
and outward reinsurance, including staff costs
and depreciation provisions in respect of
property, plant and equipment.
Admissible assets - Assets that may be included
in determining an insurer’s statutory solvency.
Such assets are specified under the rules made
by the Insurance Board of Sri Lanka under the
Regulation of Insurance Industry Act No. 43 of
2000.
Annuity - A series of regular payments.
Annuities include annuities certain, where
payments are made at definite times, and life
annuities, where payments depend on the
survival of an annuitant.
A life annuity is a contract that provides a
regular payment typically monthly during the
lifetime of the policyholder or a fixed period
if less. If the payments start at the outset of
the contract, it is an immediate annuity. If they
start at some point in the future, it is a deferred
annuity.
Bancassurance - An arrangement whereby
insurer sells insurance and investment products
to bank customers.
Beneficiary - A person named by the
policyholder as the recipient of the sum insured
and other benefits due in the event of the
policyholder’s death.
Benefits and claims experience variation - The
difference between the expected and the actual
benefit payout
Cedent - Client of a reinsurance company (also
see primary insurers).
Claims - The amount payable under a contract
of insurance arising from the occurrence of an
insured event.
Claims incurred - A claim is incurred when the
event giving rise to the claim occurs. Claims
incurred include paid claims and movements in
outstanding claims.
Claims outstanding - Life insurance business
- The amount provided to cover the estimated
ultimate cost of settling claims arising out
of events which have been notified by
the reporting date being the sums due to
beneficiaries together with claims handling
expenses, less amounts already paid in respect
of those claims.
Commissions - A payment made to a broker or
a sales agent in return for selling and servicing
an insurer’s products.
Capital Adequacy Ratio (CAR) - Measures
adequacy of the Total Available Capital (TAC) as
against the Risk Capital Required (RCR) under
the Risk Based Capital Regime.
Discretionary participating features (DPF) - A
contractual right given to a policyholder to
receive, as a supplement to guaranteed
benefits, additional benefits;
That are likely to be a significant portion of
the total contractual benefits;
Whose amount or timing is contractually at
the discretion of the issuer;
That are contractually based on;
The performance of a specified pool of
contracts or a specified type of contract;
The realised and or unrealised investment
returns on a specified pool of assets held
by the issuer; and
The profit or loss of the company, fund or
other entity that issues the contract.
Endowment - Life insurance payable to the
policyholder if living on the maturity date stated
in the policy or to a beneficiary if the insured
dies before that date.
Financial risk - The risk of a possible future
change in one or more of a specified interest
rate, financial instrument price, commodity
price, foreign exchange rate, index of prices
or rates, credit rating or credit index or other
variable, provided in the case of a non financial
variable that the variable is not specific to a
party to the contract.
Global Reporting initiative (GRI) - A leading
organisation in the sustainability field. GRI
promotes the use of sustainability reporting
as a way for organisations to become more
sustainable and contribute to sustainable
development. It allied with the UN Global
Compact.
Healthcare - An insurance contract which
provides medical coverage to a policyholder.
Insurance contract - A contract under which one
party (the insurer) accepts significant insurance
risk from another party (the policyholder) by
agreeing to compensate the policyholder if a
specified uncertain future event (the insured
event) adversely affects the policyholder.
Insurance risk - Uncertainty over the likelihood
of an insured event occurring, the quantum of
the claim, or the time when claims payments will
fall due.
Insurance provision – Life - The fund or funds
maintained by an insurer in respect of its life
insurance business in accordance with the
Regulation of Insurance Industry Act No. 43 of
2000.
Investment contract - A contract, which contains
significant financial risk and may contain
insignificant insurance risk, but does not meet
the definition of insurance.
Investment management services - The
management of an investment contract on
behalf of a policyholder, for which an investment
management service fee is charged.
Lapsed Policy - A policy terminated at the end
of the grace period because of non payment of
premiums.
Liability adequacy test (LAT) - An annual
assessment of the sufficiency of insurance and
/ or investment contract with DPF liabilities, to
cover future insurance obligations.
Life surplus - The excess of the assets over the
liabilities as determined by the actuary and after
the distribution of dividends to policyholders
Life insurance business - Insurance (including
reinsurance) business falling within the classes
of insurance specified as long term insurance
business under the Regulation of Insurance
Industry Act No. 43 of 2000.
Longevity - The insurer’s risk that an insured
person lives longer than expected or that life
expectancy within an insured portfolio rises as
a whole.

273
UNION ASSURANCE PLC | ANNUAL REPORT 2017
SU
PP
LEM
EN
TAR
Y IN
FO
RM
ATIO
N
Loss ratio - Percentage ratio of claims expenses
to earned premiums.
Mortality - The ratio of deaths to the entire
population or to a particular age group. It is
globally expressed in numbers or rates and set
out in mortality tables.
Net asset value - The value of all tangible
and intangible assets of a company minus its
liabilities. It reflects a company’s fundamental
value.
Net expenses for claims and benefits - These
include the expenses for claims (claims
payments and the change in the provision for
outstanding claims), expenses for premium
refunds and the change in the remaining
technical provisions (provision for future
policy benefits and other), in each case after
deduction of the ceded share.
Non-participating business - Life insurance
business where policyholders are not entitled to
share in the surplus of the relevant life fund.
Non-proportional reinsurance - Under this form
of reinsurance, the reinsurer assumes payment
of the primary insurer’s loss above a defined
amount. The calculation of the reinsurance
premium is based on claims experience with the
type of business concerned.
Outstanding claims provision - Comprises claims
incurred by the policyholder and reported to the
insurance company, and IBNR claims.
Participating business - Life insurance business
where the policyholders are contractually
entitled to share in the surplus of the relevant
life fund.
Policyholders’ bonuses - In life and health
insurance, policyholders are entitled
contractually and by law to an appropriate
share of the surplus earned by their insurers.
The amount of this bonus is fixed anew each
year. As a rule, in life insurance these bonuses
increase the benefit payable on maturity of the
policy or on occurrence of the insured event;
in health insurance, they are paid by way of
premium refunds.
Policy loans - A loan from the insurer to a
policyholder on the security of the surrender
value of a life insurance policy. The loan is
normally limited to a percentage of the current
surrender value of the policy and interest is
charged on such loans.
Premiums - The instalments paid by the
customers.
Primary insurers - Insurance companies that
assume risks in return for an insurance premium
and have a direct contractual relationship with
the holder of the insurance policy (private
individual, firm or organisation).
Proportional reinsurance - Form of reinsurance
in which the sum insured written by the primary
insurer is divided proportionally between the
primary insurer and the reinsurer, and the
reinsurer is allocated a corresponding share of
the premiums and claims.
Provision for outstanding claims - Provision for
claims that have already been incurred at the
reporting date but have either not yet been
reported or not yet been fully settled.
Reinsurance - An arrangement whereby one
party (the reinsurer), in consideration for a
premium, agrees to indemnify another party
(the cedent) against part or all of the liability
assumed by the cedent under a policy or
policies of insurance.
Reinsurance commission - Commission
received or receivable in respect of premiums
paid or payable to a reinsurer.
Reinsurance insurance risk - that is ceded
to another insurer to compensate for losses,
but the ultimate obligation to the policyholder
remains with the entity who issued the original
insurance contract.
Reinsurance inwards - The acceptance of risks
under a contract of reinsurance.
Reinsurance outwards - The placing of risks
under a contract of reinsurance.
Reinsurance profit commission - Commission
received or receivable by the cedent (reinsured)
from the reinsurer based on the net profit (as
defined in the treaty) made by the reinsurer on
the reinsurance treaty.
Retention - The part of the risk assumed which
the insurer / reinsurer does not reinsure /
retrocede, i.e. retained net for own account.
Retrocession - The reinsurance outwards of
risks previously accepted by an insurer as
reinsurance inwards. The recipient is known as
the retrocessionaire.
Risk Based Capital - A “Risk Based” approach
to assess the solvency and is based on the real
“cash flows” of the business.
Scenario analysis - Type of analysis used to
investigate how certain key figures (market
values or carrying amounts) change in the event
that predefined market developments occur.
Scenario analyses usually takes the form of
average if-then analyses.
Solvency margin - Life - The difference between
the value of assets and value of liabilities,
required to be maintained by the insurer who
carries on life insurance business (Long Term
Insurance) as defined in Solvency Margin
(Long Term Insurance) Rules, 2002 made
under section 26 of the Regulation of Insurance
Industry Act No. 43 of 2000.
Stress test - A special form of scenario analysis.
The aim is to make a quantitative statement on
the loss potential of portfolios in the event of
extreme market fluctuations, tail dependencies.
The result of risk drivers interacting in
exceptional situations.
Surrender value - The amount payable by an
insurer to a policyholder on termination of an
insurance policy before the expiry of its term
(more common in life insurance).
Technical provisions - Uncertain liabilities
directly connected with non-life insurance
business. These provisions are made to ensure
that obligations under insurance contracts can
always be met.
Underwriter - Member of an insurance company
that acts on behalf of his or her employer to
negotiate, accept or reject the terms of an
insurance contract. They are responsible
for ensuring the quality and reliability of
risk-transfer solutions. Their job is to develop
products that best reflect the characteristics of
the risks and clients’ needs.
Unit-linked life Insurance - A type of life
insurance with a savings component, where the
benefits payable depend on the performance
of the assets invested in a fund. The investment
risk is borne by the policyholder.
Variable annuities - A special form of unit-linked
life insurance where the investment risk is borne
primarily by the policyholder but the insurer
guarantees a minimum payment on occurrence
of the insured event.
Written premium - Life insurance business -
Premiums to which the insurer is contractually
entitled and received in the accounting period.

UNION ASSURANCE PLC | ANNUAL REPORT 2017
274
QUARTERLY ANALYSIS 201720
1720
16
Rs’
00
0
1st q
uart
erJa
nuar
y -
Mar
ch
2nd
quar
ter
Apr
il -
June
3rd
quar
ter
July
-Se
ptem
ber
4th
quar
ter
Oct
ober
-D
ecem
ber
Tota
l
1st q
uart
erJa
nuar
y -
Mar
ch
2nd
quar
ter
Apr
il -
June
3rd
quar
ter
July
-Se
ptem
ber
4th
quar
ter
Oct
ober
-D
ecem
ber
Tota
l
Gro
ss w
ritten p
rem
ium
2,2
86,0
33
2
,312,7
53
2
,625,7
92
2
,893,0
52
10,1
17,6
30
1
,932,6
47
1
,934,9
87
2
,144,2
49
2
,258,8
68
8
,270,7
51
Pre
miu
m c
ed
ed
to r
ein
sure
rs (
117,9
61)
(121,6
48)
(128,5
35)
(129,4
68)
(497,6
12)
(99,5
49)
(105,4
72)
(108,0
46)
(110,7
90)
(423,8
57)
Net
writ
ten
prem
ium
2,1
68,0
72
2,1
91,1
05
2,4
97,2
57
2,7
63,5
84
9,6
20,0
18
1,8
33,0
98
1,8
29,5
15
2,0
36,2
03
2,1
48,0
78
7,8
46,8
94
Oth
er r
even
ue
Net in
vestm
ent in
com
e 8
88,1
63
8
93,1
76
9
12,8
47
9
41,8
22
3
,636,0
08
6
79,0
63
7
32,7
14
7
64,0
32
8
49,2
85
3
,025,0
94
Net re
alis
ed
gain
s / (
losses)
2,8
87
3
2,9
65
4
5,3
11
(
5,5
72)
75,5
91
(
100,3
23)
(15,2
35)
26,2
22
(
42,6
12)
(131,9
48)
Net fa
ir v
alu
e g
ain
s /
(lo
sses)
(50,5
93)
510,8
02
(210,1
23)
8,2
74
258,3
60
(374,8
83)
105,0
14
320,6
15
(85,4
97)
(34,7
51)
Oth
er
incom
e 1
3,9
01
14,7
84
16,0
75
18,4
16
63,1
76
11,1
89
11,0
74
10,6
35
25,7
55
58,6
53
Tota
l oth
er r
even
ue 8
54,3
58
1,4
51,7
27
764,1
10
962,9
40
4,0
33,1
35
215,0
46
833,5
67
1,1
21,5
04
746,9
31
2,9
17,0
48
Tota
l net
rev
enue
3,0
22,4
30
3,6
42,8
32
3,2
61,3
67
3,7
26,5
24
13,6
53,1
53
2,0
48,1
44
2,6
63,0
82
3,1
57,7
07
2,8
95,0
09
10,7
63,9
42
Ben
efits
, cla
ims
and
expe
nses
Net in
sura
nce b
enefits
and
cla
ims p
aid
(512,1
90)
(420,9
26)
(745,0
02)
(995,6
15)
(2,6
73,7
33)
(318,7
49)
(352,0
12)
(437,0
01)
(416,5
48)
(1,5
24,3
10)
Net chang
e in insura
nce c
laim
s
outs
tand
ing
60,9
23
(13,5
28)
21,7
42
(74,4
39)
(5,3
02)
(54,3
00)
(18,0
40)
5,1
40
(3,8
75)
(71,0
75)
Chang
e in
contr
act lia
bili
ties -
Life
Fund
(1,5
84,7
60)
(2,2
23,9
89)
(1,4
03,4
62)
2,5
02,5
50
(2,7
09,6
61)
(953,7
37)
1,4
12,5
08)
1,7
83,4
00)
(88,6
20)
(4,2
38,2
65)
Chang
e in
contr
act lia
bili
ty d
ue to
transfe
r of one o
ff s
urp
lus
--
- 3
,381,9
34
3,3
81,9
34
--
--
-
Und
erw
riting
and
ne
t acq
uis
itio
n c
osts
(inclu
din
g r
ein
sura
nce)
(410,9
39)
(395,5
20)
(479,3
44)
(555,3
48)
(1,8
41,1
51)
(263,2
39)
(347,6
20)
(392,2
44)
(438,5
14)
(1,4
41,6
17)
Oth
er
op
era
ting
, ad
min
istr
ative a
nd
selli
ng
exp
enses
(493,6
51)
(515,4
15)
(580,6
47)
(914,6
20)
(2,5
04,3
33)
(398,4
15)
(471,8
61)
(484,0
31)
(710,4
86)
(2,0
64,7
93)
Dep
recia
tion a
nd
am
ort
isation
(27,5
43)
(26,5
66)
(25,9
50)
(24,5
64)
(104,6
23)
(27,2
19)
(26,9
09)
(28,4
20)
(28,3
42)
(110,8
90)
Tota
l ben
efits
, cla
ims
and
expe
nses
(2,9
68,1
60)
(3,5
95,9
44)
(3,2
12,6
63)
3,3
19,8
98
(6,4
56,8
69)
(2,0
15,6
59)
(2,6
28,9
50)
(3,1
19,9
56)
(1,6
86,3
85)
(9,4
50,9
50)
Pro
fit fr
om o
pera
tions
54,2
70
46,8
88
48,7
04
7,0
46,4
22
7,1
96,2
84
32,4
85
34,1
32
37,7
51
1,2
08,6
24
1,3
12,9
92
Share
of re
sults o
f eq
uity a
ccounte
d
investe
e, net of ta
x 5
4,0
03
20,0
06
42,7
27
71,1
08
187,8
44
28,8
04
23,6
14
33,0
46
(25,1
49)
60,3
15
Pro
fit b
efor
e ta
x 1
08,2
73
66,8
94
91,4
31
7,1
17,5
30
7,3
84,1
28
61,2
89
57,7
46
70,7
97
1,1
83,4
75
1,3
73,3
07
Incom
e tax e
xp
ense
-
-
-
-
-
-
-
-
(60,6
79)
(60,6
79)
Pro
fit fo
r th
e ye
ar 1
08,2
73
66,8
94
91,4
31
7,1
17,5
30
7,3
84,1
28
61,2
89
57,7
46
70,7
97
1,1
22,7
96
1,3
12,6
28

275
UNION ASSURANCE PLC | ANNUAL REPORT 2017
SU
PP
LEM
EN
TAR
Y IN
FO
RM
ATIO
NLIFE INSURANCE FUNDINSURANCE REVENUE ACCOUNT
For the year ended 31 December 2017 2016Rs. ‘000 Rs. ‘000
Gross written premium 10,117,630 8,270,751
Premium ceded to reinsurers (497,612) (423,857)
Net written premium 9,620,018 7,846,894
Policy administration fee 10,418 11,215
Net insurance benefits and claims paid (2,673,733) (1,524,310)
Net change in insurance claims outstanding (5,302) (71,075)
Underwriting and net acquisition costs (net of reinsurance) (1,841,151) (1,441,617)
Other operating, selling and administrative expenses (2,570,396) (2,157,253)
Underwriting surplus 2,539,854 2,663,854
Investment and other income 3,811,807 2,735,090
Change in contract liabilities - Life fund (2,709,661) (4,238,265)
Change in contract liability due to transfer of one off surplus 3,381,934 -
Income tax reversal - (60,679)
Surplus from life insurance fund 7,023,934 1,100,000
Investment and other income not attributable to policyholders 236,290 179,432
Expenses not attributable to policyholders (63,940) (27,119)
Share of results of equity accounted investee, net of tax 187,844 60,315
Profit from shareholders’ fund 360,194 212,628
Profit for the year attributable to equity holders of the company 7,384,128 1,312,628
STATEMENT OF FINANCIAL POSITION
As at 31 December 2017 2016Note Page Rs. ‘000 Rs. ‘000
AssetsIntangible assets 25 225 212,817 94,647
Property, plant and equipment 26 226 2,000,716 1,493,040
Financial investments including derivatives 1 278 34,596,558 29,495,819
Loans to life policyholders 29 241 1,001,538 867,177
Reinsurance receivable 30 242 267,417 178,181
Premiums receivable 31 243 268,511 246,800
Receivables and other assets 2 279 616,905 527,943
Cash in hand and at bank 3 279 580,120 379,182
Total assets 39,544,582 33,282,789
Reserves and liabilitiesReservesOther reserves 4 279 1,585,223 378,902
Total reserves 1,585,223 378,902
LiabilitiesInsurance contract liabilities 38 248 26,949,613 27,889,682
Insurance contract liabilities - Unit Linked 39 252 2,121,609 2,377,707
Employee benefit liabilities 40 252 122,588 107,963
Reinsurance payables 41 253 345,146 208,742
Other liabilities 5 279 8,225,097 2,169,487
Bank overdraft 33 244 195,306 150,306
Total liabilities 37,959,359 32,903,887
Total reserves and liabilities 39,544,582 33,282,789

UNION ASSURANCE PLC | ANNUAL REPORT 2017
276
LIFE INSURANCE FUNDSTATEMENT OF CASH FLOWS
For the year ended 31 December 2017 2016Note Page Rs. ‘000 Rs. ‘000
Cash flows from operations
Insurance premiums received 10,095,919 8,227,672
Reinsurance premiums paid (361,208) (428,970)
Insurance benefits and claims paid 16 216 (2,828,188) (1,682,170)
Reinsurance claims received 16 216 154,455 157,860
Payments to intermediaries to acquire insurance contracts (1,793,544) (1,430,821)
Cash paid to and on behalf of employees (918,381) (834,098)
Interest received 2,822,525 2,200,471
Dividends received 121,026 102,922
Other operating cash flows (2,176,618) (1,129,946)
Cash paid to life shareholder fund (1,100,000) (800,000)
Cash generated from operating activities - (Note A) 4,015,986 4,382,920
Retiring gratuity paid 40.3 253 (12,408) (20,430)
Retiring gratuity transfer 40.3 253 - 2,385
Interest paid on obligation to repurchase securities - (6,750)
Net cash from operating activities 4,003,578 4,358,125
Cash flows from investing activities
Acquisition of investments (29,154,576) (45,290,918)
Maturity proceeds of investments 23,534,686 40,720,703
Proceeds from sale of investments 1,986,068 371,885
Acquisition of property, plant and equipment 26.1 228 (40,357) (53,000)
Acquisition of intangible assets 25.1 225 (151,196) (65,397)
Proceeds on sale of property, plant and equipment 36 156
Net cash used in investing activities (3,825,339) (4,316,571)
Net cash inflow before financing activities 178,239 41,554
Net cash from financing activities - -
Net increase in cash and cash equivalents Note B 277 178,239 41,554
Cash and cash equivalents at the beginning of the year 239,009 197,455
Cash and cash equivalent at the end of the year 417,248 239,009

277
UNION ASSURANCE PLC | ANNUAL REPORT 2017
SU
PP
LEM
EN
TAR
Y IN
FO
RM
ATIO
N
For the year ended 31 December 2017 2016Note Page Rs. ‘000 Rs. ‘000
A. Reconciliation of surplus from life insurance fund before tax with cash from operating activities
Surplus from life insurance fund before tax 7,023,934 1,160,679
Non - cash items included in profit before tax
Depreciation and amortisation 25.1 / 26.1 225 / 228 104,623 110,890
Provision for employee benefits 40.3 253 22,762 20,948
Provision for doubtful staff debtors 32.1 (a) / 32.2 (a) 244 541 732
Net realised (gains) / losses 13 215 (75,591) 131,948
Net fair value (gains) / losses 14 216 (258,360) 34,751
(Gains) / losses on sale of property, plant and equipment 15 216 413 (83)
Amortisation of financial investment (281,164) (314,551)
Scrip dividend income (24,499) (26,531)
Interest expense on obligation to repurchase securities - 6,750
Profit before working capital changes 6,512,659 1,125,533
Net change in operational assets
Net change in reinsurance assets / liabilities 47,168 (33,522)
Net change in premiums receivable (21,711) (43,078)
Net change in receivables and other assets (389,759) (485,417)
Net change in operational liabilities
Net change in life insurance contract liabilities (1,196,167) 3,994,928
Net change in other liabilities (936,204) (175,524)
Cash generated from operating activities 4,015,986 4,382,920
B. Cash and cash equivalents at the end of the year
Cash in hand and at bank 580,120 379,182
Bank overdraft (195,306) (150,306)
Short term deposits 32,434 10,133
Cash and cash equivalents 417,248 239,009
Net cash in hand and at bank for the previous year 239,009 197,455
Increase in cash and cash equivalents 178,239 41,554

UNION ASSURANCE PLC | ANNUAL REPORT 2017
278
1 Financial InvestmentsRefer Note 9 for the accounting policy
As at 31 December 2017 2016
Rs. ‘000 Note Carrying Value Fair Value Carrying Value Fair Value
Held to maturity financial assets (HTM) 1.1 17,727,184 18,667,584 15,396,036 14,595,957
Loans and receivables (L&R) 1.2 5,806,251 5,876,468 5,380,958 5,387,721
Available for sale financial assets (AFS) 1.3 6,538,609 6,538,609 4,632,489 4,632,489
Financial assets at fair value through profit or loss
(FVTPL) 1.4 4,524,514 4,524,514 4,086,336 4,086,336
Total financial investments 34,596,558 35,607,175 29,495,819 28,702,503
1.1 Held to Maturity Financial Assets (HTM)
As at 31 December 2017 2016Note Page Rs. '000 Rs. '000
Amortised cost
Quoted
debentures 28.3 (a) 235 290,985 853,960
Treasury bonds 17,436,199 14,542,076
Total HTM financial investments 17,727,184 15,396,036
Fair values of held to maturity financial assets are based
on market prices / quotations. Where this information is not
available, fair value has been estimated using quoted market
prices for securities with similar credit, maturity and yield
characteristics.
At the reporting date, there were no held to maturity assets
that were overdue and impaired.
1.2 Loans and Receivables (L&R)
As at 31 December 2017 2016Note Page Rs. '000 Rs. '000
Amortised cost
Bank deposits 630,563 572,372
Quoted debentures 28.4 (a) 236 4,625,307 4,553,805
Reverse repurchase
agreements 550,381 254,781
Total L&R financial investments 5,806,251 5,380,958
1.3 Available for Sale Financial Assets (AFS)
As at 31 December 2017 2016Rs. '000 Rs. '000
Fair value
Treasury bonds 6,485,756 4,546,644
Treasury bills 52,853 85,845
Total AFS financial investments 6,538,609 4,632,489
1.4 Financial Assets at Fair Value Through Profit or Loss (FVTPL)
As at 31 December 2017 2016Note Page Rs. '000 Rs. '000
Fair valueQuoted equities 28.6 (a) 238 2,344,572 1,706,751
Derivative financial instruments 50,737 -
2,395,309 1,706,751
Investments in unit linked funds
Quoted equities 28.6 (b) 239 1,628,378 1,814,977
Reverse repurchase agreements 223,361 202,959
Treasury bills 115,508 228,781
Treasury bonds 42,734 30,849
Bank deposits 32,434 45,736
Debentures 86,790 56,283
2,129,205 2,379,585
Total FVTPL investments 4,524,514 4,086,336
LIFE INSURANCE FUNDNOTES TO THE STATEMENT OF FINANCIAL POSITION

279
UNION ASSURANCE PLC | ANNUAL REPORT 2017
SU
PP
LEM
EN
TAR
Y IN
FO
RM
ATIO
N
2 Receivables and Other AssetsRefer Note 9 for the accounting policy.
As at 31 December 2017 2016Note Rs. '000 Rs. '000
Financial assetsAgent / advisor loans 68,090 67,686
Refundable deposits 8,090 7,550
Amount due from Fairfirst
Insurance Limited 11,954 100,988
Other receivables 37,096 16,797
125,230 193,021
Non financial assetsTaxes recoverables 2.1 203,292 203,702
Prepayments 58,755 59,687
Inventories 21,521 14,177
Advance payments 155,553 17,948
Other receivables 52,554 39,408
491,675 334,922
Total receivables and other assets 616,905 527,943
2.1 Taxes Recoverables
As at 31 December 2017 2016Rs. '000 Rs. '000
ACT recoverable 92,296 92,296
WHT receivable 93,265 98,588
ESC receivable 17,731 12,818
203,292 203,702
3 Cash in Hand and at Bank
As at 31 December 2017 2016Rs. '000 Rs. '000
Cash at bank 576,950 376,286
Cash at bank - Unit Linked 72 78
Cash in hand 3,098 2,818
Total 580,120 379,182
4 Other Reserves
As at 31 December 2017 2016Note Rs. '000 Rs. '000
Capital reserves 4.1 1,229,201 695,255
Reserve for AFS financial
instruments 366,370 (310,274)
Reserve on retirement
benefit obligation (10,348) (6,079)
Total other reserves 1,585,223 378,902
4.1 Capital Reserves
As at 31 December 2017 2016Note Rs. '000 Rs. '000
Revaluation reserve 4.1 (a) 1,212,449 678,503
Reserve on Cornhill merger 4.1 (b) 16,752 16,752
1,229,201 695,255
4.1 (a) Revaluation Reserve
As at 31 December 2017 2016Rs. '000 Rs. '000
Balance as at 1 January 678,503 682,405
Revaluation surplus during the year 539,365 -
Adjustment for deferred tax - 1,517
Transfer to retained earnings (5,419) (5,419)
Balance as at 31 December 1,212,449 678,503
4.1 (b) Reserve on Merger with Cornhill (Private) Limited
The unrealised gain reflects the net result of the merger of
the Company and Cornhill (Private) Limited. The investment
in Cornhill (Private) Limited was absorbed by merging all
assets and liabilities into the life policyholders.
5 Other Liabilities
As at 31 December 2017 2016Rs. '000 Rs. '000
Financial liabilities
Agency commission payable 189,244 141,696
Other staff related provisions 158,389 140,000
Premiums in suspense 292,108 284,922
Amount due to related parties - 6,528
639,741 573,146
Non financial liabilities
Government levies 10,103 8,599
Premium received in advance 147,171 133,245
Other liabilities 7,428,082 1,454,497
7,585,356 1,596,341
Total other liabilities 8,225,097 2,169,487

UNION ASSURANCE PLC | ANNUAL REPORT 2017
280
UNDERSTANDING OUR FINANCIALS
Statement of Income
Gross Written Premium (GWP)
The main source of income consisting
premiums paid by customers for the risk/s
which they transfer to the company or the
money charged for a certain amount of
insurance coverage is called the Gross
Written Premium (GWP). It's comparable
with the 'turnover' of a trading or
manufacturing organisation.
Premium Ceded to Reinsurers
The portion of risk that a primary insurer
passes to a reinsurer. This allows the
company to reduce its risk exposure and the
accepting company receives a premium for
taking on the risk.
Net Written Premium
Refers to the portion of premium which is
applicable for the financial year and earned
by the insurer by providing insurance
against various risks during the year.
Net Investment Income
Refers to interest income and dividend
income received, from investments
maintained by the company after deducting
the costs of the related investments such as
bank charges, custodian fees, brokerage
fee, etc.
Net Realised Gains
Net realised gains / losses resulting from
selling of financial investments at a price
higher or lower than the book value.
Net Fair Value Gains
Net fair value gains / losses incurred by the
company due to change in the market value
of investments which are sensitive to market
value change (e.g: Quoted equity).
Net Benefits and Claims Paid
Refers to total amount of claims and claims
related expenses incurred during the year,
where appropriate, adjusted by claims
outstanding provisions at the beginning
and end of the accounting period (e.g.
surrenders, policy maturities, annuities and
interim payments). This also includes the
balance transferred to the life fund.
Underwriting and Net Acquisition Costs
Net acquisition expenses consists of the
following;
Commission / Franchise Fees
Policies are sold by intermediaries, the fee
paid to an agent or broker as a percentage
of the policy premium is considered
as commission. The percentage varies
depending on coverage and the duration of
the policy.
Reinsurance Commission
The commission paid by the reinsurer to
the ceding company (primary insurer) on
reinsurance agreements as compensation
to place the business with the reinsurer and
to cover the ceding company’s acquisition
expenses.
Other Operating and Administrative and Selling Expenses
Refers to staff, administration, sales and
marketing costs incurred by the company.
Share of Results of Equity Accounted Investee, Net of Tax
Refers to the share of profit from Fairfirst
Insurance Limited attributable to the
company.
Statement of Financial PositionIndustry specific items are selected and
explained below
Investment in Equity Accounted Investee
Refers to carrying value of 22% stake in
Fairfirst Insurance Limited.
Financial Investments
Invested money received from policyholders
to pay benefits and increase profitability of
the company with the expectation of capital
appreciation, dividends (profit), interest
earnings, or some combination of these
returns. Income earned from policyholders
money is accumulated to Life fund.
Loans to Life Policyholders
Life policyholders can obtain loans from the
company up to a certain percentage of the
surrender value of the policy. Loan granted
under these criteria are presented here.
Reinsurance Receivables
Includes amounts due from the company’s
reinsurers on current claims and estimates
of amounts that will be due on future claims.
Premium Receivables
Consist of premium related balances due
from policyholders.
Insurance Contract Liabilities – Life
Due to the longer duration of the policy
period, insurance companies are required
to maintain a separate fund to meet future
policyholders obligations. This is known as
the 'Insurance contract liabilities'. The size
of the fund that needs to be maintained
is determined by the actuarial valuation
annually. This process estimates the
excess of the assets over the policyholder’s
liabilities of the fund after distribution of
dividends to the policyholders as at the year
end. The excess is generally known as Life
Surplus and is transferred as shareholders’
funds in the financial statements.
Insurance Contract Liabilities - Unit Linked
Same meaning as above, however it related
to the unit linked operation.
Reinsurance Payables
Represent payables to reinsurers for risk
portion undertaken by them.

281
UNION ASSURANCE PLC | ANNUAL REPORT 2017
SU
PP
LEM
EN
TAR
Y IN
FO
RM
ATIO
NDISTRIBUTION NETWORK
Location Address Contact Number / s
Akuressa No. 38 & No. 6A, D.C. Wanigasekara Mawatha, Akuressa Tel:041 228 3393 / Fax: 041 228 3493Aluthgama No. 51 1/1, Galle Road, Kalutara Modara Aluthgama Tel: 034 313 5922Ambalangoda No. 20 New Road, Ambalangoda Tel: 091 225 8862 / Fax: 091 225 5882Ambalantota Dulmini Traders, No46/1/1, Main Street, Ambalantota Tel: 047 222 3370 / Fax: 047 222 5500Ampara No. 60 & 60/1, ‘Indrawansha Building’, D.S.Senanayaka Street,
Ampara
Tel: 063 222 4668/ 063 222 4401/063 222 3669/ 011 248 2308 / Fax: 063 222 4001
Avissawella No. 15 1/2, Kudagama Road, Avissawella Tel: 036 223 1349 / Fax: 036 223 3575Badulla No. 226/4/ 1/09-14, Lower Street, Badulla. Tel: 055 222 9536 / 011 242 8281 / Fax: 055 222 4373Bandarawela No. 340/1, Badulla Road, Bandarawela Tel: 057 222 3396 / 057 222 3239 / Fax: 057 222 3397Batticaloa No. 217, Trincomalee Road, Batticaloa. Tel: 065 222 4574 / 065 222 9876 / Fax: 065 222 8167Chilaw No. 87, Puttalam Road, Chilaw Tel: 032 222 2104 / Fax: 032 222 4824Chunnaakam No.160, Sir Pon Ramanathan Road, Chunnakam Tel: 021 224 2097City Office No. 305, R. A. De Mel Mawatha, Colombo 03 Tel: 011 257 7129 / Fax: 011 257 7126Dambulla No. 755, Anuradhapura Road, Dambulla Tel: 066 228 4628 / Fax: 066 228 4647Embilipitiya No. 62, Sampath Bank Building, Main Road, Embilipitiya Tel: 045 223 0463 / Fax: 047 226 1946Galle No. 16, 16 A, China Garden Cross Road, Galle Tel: 091 224 3948 / Fax: 091 222 3759Gampaha No. 55 Yakkala Road, Gampaha. Tel: 033 222 2802/ 033 222 6441/ Ext: 8252/ 8253 /
Fax: 033 222 8430Gampola No. 10 B, Nidahas Mawatha, keerapana, Gampola Tel: 081 235 2915/081 235 2256 / Fax: 081 235 0127Hingurakgoda No. 02, Airport Road, Hingurakgoda. Tel: 027-224 6581 / Fax: 027- 224 5299Homagama No. 119/2/1, 119/3/1, Katuwana Road, Homagama Tel: 011-289 2802 – 3 / Fax: 011-289 2804Horana No. 161, Ratnapura Road, Horana. Tel: 034-226 4182 / Fax: 034-226 4182Ja-ela No. 71/A2/1, Negombo Road, Ja Ela. Tel: 011-224 3633 / Fax: 011 223 1661Jaffna No. 139, Stanley Road, Jaffna. Tel: 021-222 3753 / Fax: 021 222 0018Kadawatha No. 1158 2/1, Kandy Road, Kadawatha Tel: 011-292 7252/3 / Fax: 011 292 7254Kalawana No. 46/1/1, Mathugama Road, Kalawana. Tel: 045-225 5772Kalmunai No. 212, Batticaloa Road, Kalmunai. Tel: 067-222 2636, 067-222 2633 / Fax: 067-222 2320Kalutara No. 338/1/2, Main Street, Kalutara Tel: 034-2228964, 034-2223132 / Fax: 034-2228963Kandy No. 28, Hill Street, Kandy. Tel: 081-222 7443, 081- 223 2731 / Fax: 081-223 3291Katugastota No. 185/4, Galagedara Road, Katugastota. Tel: 081-250 0286Kegalle No. 134, Kalugalla Mawatha, Kegalle. Tel: 035-223 2829Fax: 035-223 0363Kilinochchi No. 83 and 85, Kandy Road, Killinochchi. Tel: 021 228 0117-8 / Fax: 021 228 0119Kotte No: 656 A2/1, E.W Perera Mawatha, Pitakotte, Kotte. Tel: 077 3422814Kuliyapitiya No. 93, Madampe Road, Kuliyapitiya. Tel/ Fax: 037-228 1904Kurunegala Union Assurance Centre, No. 6, Rajapihilla Road, Kurunegala. Tel: 037-222 4252, 037-222 2474, 037-222 2282
Fax: 037-222 7585Maharagama No. 272/B/21, Avissawella Road, Maharagama. Tel: 011-289 6474Mahawa No. 272, Moragollagama Road, Mahawa. Tel: 071 7137353Mahiyangana No. 44D, Miyugunagama, Mahiyangana. Tel: 055-225 8244, 055-225 8255 / Fax: 055-225 8200Mannar No. 43, Ward No.2, Pallimuni Street, Mannar Tel/Fax: 023-323 8255Matale No. 553/F1/2, Trincomalee Street, Matale. Tel/ Fax: 066-223 1536Matara No. 13, Station Road, Matara. Tel: 041-222 3024, 041-222 2953 / Fax: 041-222 3026Mathugama No. 94/2, Agalawatta Road, Mathugama. Tel/Fax: 034-394 4339Madirigiriya No. 417, Main Street, Madirigiriya. Tel: 027-224 8310Monaragala No. 112, Wellawaya Road, Monaragala. Tel/ Fax: 055-227 6290Moratuwa No. 494, De Soysa Road, Rawathawatta, Moratuwa Tel: 011-264 1666, 011- 264 1800 / Fax: 011-264 1811Mullaitivu Union Assurance PLC, First Floor, P.W.D. Road,
Mullathive Town, Mullathivu Tel: 077 3422722Negombo No. 147, St.Joseph’s Street, Negombo. Tel: 031-223 5042-3, 031-222 4264 / Fax: 031-222 4243

UNION ASSURANCE PLC | ANNUAL REPORT 2017
282
Location Address Contact Number / s
Nikaweratiya No. 65, Puttalam Road, Nikaweratiya. Tel/ Fax: 037-226 0367Nugegoda No. 376, High Level Road, Gangodawila, Nugegoda. Tel: 011-281 5511-3 / Fax: 011-281 5515Nuwara Eliya No. 36, Park Road, Nuwara Eliya. Tel/ Fax: 052-222 3017Padawiya No. 2, New Town, Padaviya. Tel/Fax: 025-377 0758Panadura No. 571/3, Galle Road, Panadura. Tel: 038-224 4790 / Fax: 038-224 4630Pettah No. 3, Sea Street, Colombo 11. Tel: 077 2990329Piliyandala No. 226, Horana Road, Piliyandala. Tel: 011-261 9550Point Pedro No. 357, Main Street, Point Pedro. Tel / Fax: 011-315 8153Polonnaruwa No. 5, Batticaloa Road, Polonnaruwa. Tel/ Fax: 027-222 6611Puttalam No. 97 B, 2nd Floor,Cargills Food City Building,
Kurunegala Road, Puttalam. Tel/ Fax: 032-226 5980Ratnapura No. 567 1/1, Senevirathna Building, Colombo Road, Ratnapura. Tel: 045-223 0739 / Fax: 045-222 3525Ruwanwella No. 185 1/2, Avissawella Road, Ruwanwella. Tel: 036-226 6631 / Fax: 036-226 8747Tangalle No. 61, Beach Road, Tangalle. Tel: 047-224 1545Thalawathugoda No. 123, Kaduwela Road, Battaramulla. Tel: 011-207 4450-4Thambuttegama No. 148,Thammannagama, Thambuttegama Tel: 025-227 5594 / 025-227 6211 / Fax: 025-227 6060Tissamaharama No. 118, Hambantota Road,Tissamaharama. Tel: 047-223 7711 / Fax: 047 223 9644Trincomalee No. 170, Abeypura, Kandy Road, Trincomalee. Tel: 026-222 7530Valaichchenai Union Assurance PLC, Main Street,Valachchenai. Tel: 065-225 8555 / 065-225 8557 / Fax: 065-225 8556Vavuniya No. 113, Kandy Road, Vavuniya. Tel: 024-222 3138Warakapola No. 198 B1/1, ‘Willara Complex’, Main Street, Warakapola Tel: 035-226 7441 / Fax: 035-226 7039Wariyapola No. 203/A, Kurunegala Road, Wariyapola. Tel: 037-226 7206Wattala No. 250/2/2, Negombo Road, Wattala. Tel: 011-293 2153 / Fax: 011-293 2030Wellawaya No. 210, Moneragala Road, Wellawaya, Tel: 055-360 0031 / 055-227 4380 / Fax: 055-227 4218Wennappuwa No. 6, Colombo Road, Wennappuwa. Tel: 031-225 5844 / Fax: 031-225 3892Wellawatta No. 57 2/1, High Level Road,Kirillapone, Colombo 6. Tel: 011-251 3361
DISTRIBUTION NETWORK

283
UNION ASSURANCE PLC | ANNUAL REPORT 2017
SU
PP
LEM
EN
TAR
Y IN
FO
RM
ATIO
NCORPORATE INFORMATION
Name of CompanyUnion Assurance PLC
Legal FormA public limited liability company
incorporated in Sri Lanka on 8 January 1987
and registered under the Companies Act
No. 07 of 2007 and quoted on the Colombo
Stock Exchange since 1988
Company Registration NumberPQ 12
Tax Payer Identification Number (TIN)134001372
VAT Registration Number134001372 7000
DirectorsS. C. Ratnayake - Chairman
D. C. Alagaratnam
A. S. De Zoysa
G. F. C. De Saram
S. Rajendra
H. A. J. De Silva Wijeyeratne
A. D. Pereira
Board Remuneration CommitteeS. C. Ratnayake - Chairman
G. F. C. De Saram
H. A. J. De Silva Wijeyeratne
Nominations CommitteeThe Nominations Committee (NC) of John
Keells Holdings PLC (the Parent) represents
the NC of the Company
Related Party Transaction Review CommitteeThe Related Party Transaction Review
Committee (RPTC) of John Keells
Holdings PLC (the Parent) represents
the RPTC of the Company
Board Audit and Compliance CommitteeH. A. J. De Silva Wijeyeratne - Chairman
S. Rajendra
A. S. De Zoysa
Investment CommitteeK. N. J. Balendra - Chairman
A. S. De Zoysa
Secretaries and RegistrarsKeells Consultants (Private) Limited
117, Sir Chittampalam A. Gardiner
Mawatha,
Colombo 2
AuditorsMessrs. KPMG (Chartered Accountants)
PO Box 186,
32A, Sir Mohamed Macan Markar Mawatha,
Colombo 3
Appointed ActuariesWillis Towers Watson India Private Limited
Unitech Business Park, 2nd Floor
Tower-B, South City, Sector 41
Gurgaon-122002
India
LawyersThe Legal Department
John Keells Holdings PLC
117, Sir Chittampalam A Gardiner Mawatha,
Colombo 2
BankersBank of Ceylon
Commercial Bank of Ceylon PLC
Deutsche Bank AG
DFCC Bank PLC
Hatton National Bank PLC
Housing Development Finance Corporation
Bank of Sri Lanka
National Development Bank PLC
National Savings Bank
Nations Trust Bank PLC
Pan Asia Banking Corporation PLC
People’s Bank
Sampath Bank PLC
Seylan Bank PLC
Standard Chartered Bank
Union Bank of Colombo PLC
Reinsurance PanelRGA
Hannover Re
Munich Re
Partner Re
Registered Office of the CompanyUnion Assurance Centre
20, St Michaels' Road,
Colombo 3
Investor RelationsAll investor queries should be directed to;
Investor relations hotline 011-2990314
e-mail: [email protected]
GRI 102-1 | 102-3 | 102-5
Produced by

UNION ASSURANCE PLC | ANNUAL REPORT 2017
284
NOTICE OF MEETING
Notice is hereby given that the 31st Annual General Meeting of Union Assurance PLC, will be held on Wednesday 9th May 2018 at 9.00 a.m. at
the Auditorium of Union Assurance PLC, No. 20, St. Michael’s Road, Colombo 3 for the following purposes;
1. To read the Notice convening the meeting.
2. To receive and consider the Annual Report and Financial Statements of the Company for the year ended 31st December 2017 with the
report of Auditors thereon.
3. To re-elect as Director, Mr. Suresh Rajendra who retires in terms of Article 84 of the Articles of Association of the Company. A brief profile of
Mr. Suresh Rajendra is contained in the Board of Directors section of the Annual Report.
4. To re-elect as Director, Mr. Harin Amendra Joseph De Silva Wijeyeratne who retires in terms of Article 84 of the Articles of Association of
the Company. A brief profile of Mr. Harin Amendra Joseph De Silva Wijeyeratne is contained in the Board of Directors section of the
Annual Report.
5. To re-elect as Director, Mr. Susantha Chaminda Ratnayake who retires in terms of Article 90 of the Articles of Association of the Company.
A brief profile of Mr. Susantha Chaminda Ratnayake is contained in the Board of Directors section of the Annual Report.
6. To re-appoint as Auditors, Messrs. KPMG, Chartered Accountants and authorise the Directors to determine their remuneration.
7. To consider any other business of which due notice has been given in terms of the relevant laws and regulations.
By Order of the Board
Union Assurance PLC
Keells Consultants (Private) Limited
Secretaries
29 March 2018
Notes:
a. A member unable to attend is entitled to appoint a Proxy to attend and vote in his/her place.
b. A proxy need not be a member of the Company.
c. A member wishing to vote by Proxy at the meeting may use the Proxy form enclosed.
d. In order to be valid, the completed proxy form must be lodged at the registered office of the Company not less than 48 hours before
the meeting.
e. If a poll is demanded, a vote can be taken on a show of hand or by a poll. Each share is entitled to one vote. Votes can be cast in person,
by proxy or corporate representatives. In the event an individual shareholder and his/her proxy holder are both present at the meeting, only
the shareholder’s vote is counted. If the proxy holder’s appointor has indicated the manner of voting, only the appointor’s indication of the
manner to vote will be used.

285
UNION ASSURANCE PLC | ANNUAL REPORT 2017
SU
PP
LEM
EN
TAR
Y IN
FO
RM
ATIO
NPROXY FORM
I/We……………………………………………......................………………..………of…………………………………………………………………………
…………………………………………………………………………………………………being a member/s of Union Assurance PLC hereby appoint
…………………………………………………………………………………………..of …………………….……………………………....or failing him/her
Mr. Susantha Chaminda Ratnayake or failing him
Mr. Gerald Fredrick Christopher De Saram or failing him
Mr. Ashan Suresh De Zoysa or failing him
Mr. Suresh Rajendra or failing him
Ms. Dilani Champika Alagaratnam or failing her
Mr. Harin Amendra Joseph De Silva Wijeyeratne or failing him
Mr. Anthony Dirk Pereira
as my/our proxy to represent me/us and vote on my/our behalf at the 31st Annual General Meeting of the Company to be held on Wednesday,
9th May 2018 at 9.00 a.m. and at any adjournment thereof, and at every poll which may be taken in consequence thereof.
I/We, the undersigned, hereby direct my/our proxy to vote for me/us and on my/our behalf on the specified Resolution as indicated by the letter
“X” in the appropriate cage;
For Against
1. To re-elect as Director, Mr. Suresh Rajendra who retires in terms of Article 84 of the Articles of Association of
the Company.
2. To re-elect as Director, Mr. Harin Amendra Joseph De Silva Wijeyeratne who retires in terms of Article 84 of
the Articles of Association of the Company.
3. To re-elect as Director, Mr. Susantha Chaminda Ratnayake who retires in terms of Article 90 of the Articles of
Association of the Company.
4. To re-appoint as Auditors, Messrs. KPMG, Chartered Accountants and authorise the Directors to determine
their remuneration.
Signed on this ………………….day of …………………………. Two Thousand and Eighteen.
……………………………………
Signature / s of Shareholder / s
Note:
Instructions as to completion of the Proxy Form are noted on the reverse.

UNION ASSURANCE PLC | ANNUAL REPORT 2017
286
PROXY FORM
INSTRUCTIONS AS TO COMPLETION OF PROXY
1. Please perfect the Form of Proxy by filling in legibly your full name and address, signing in the
space provided and filling in the date of signature.
2. The completed Form of Proxy should be deposited at the Registered Office of the Company at
No. 20, St. Michael’s Road, Colombo 3, not later than 48 hours before the time appointed for the
holding of the meeting.
3. If the Form of Proxy is signed by an Attorney, the relevant Power of Attorney should accompany
the completed Form of Proxy for registration, if such Power of Attorney has not already been
registered with the Company.
4. If the appointer is a company or corporation, the Form of Proxy should be executed under its
Common Seal or by a duly authorised officer of the company or corporate in accordance with
its Articles of Association or Constitution.
5. If this Form of Proxy is returned without any indication of how the person appointed as Proxy
shall vote, then the Proxy shall exercise his/her discretion as to how he/she votes or, whether or
not he/she abstains from voting.
Please fill in the following details:
Name : ............................................................................................................................
Address : ............................................................................................................................
............................................................................................................................
............................................................................................................................
Jointly with : ............................................................................................................................
Share Folio No.: ............................................................................................................................

287
UNION ASSURANCE PLC | ANNUAL REPORT 2017
SU
PP
LEM
EN
TAR
Y IN
FO
RM
ATIO
NSTAKEHOLDER FEEDBACK FORM
We would like to receive your comments / queries. If you wish to communicate with us, please fill in the details below and return to,
General Manager - Finance & Planning
Union Assurance PLC
20, St Michael’s Road,
Colombo 3.
e-mail: [email protected]
Name :
Permanent mailing address :
Contact number :
Comments :