PEOPLE LIVE - CSE
394
CHANGING THE WAY PEOPLE LIVE BANK OF CEYLON | ANNUAL REPORT 2021
-
Upload
khangminh22 -
Category
Documents
-
view
5 -
download
0
Transcript of PEOPLE LIVE - CSE

CHANGING THE WAY PEOPLE LIVE
BANK OF CEYLON | ANNUAL REPORT 2021

Scan the QR code with your smart device or login to https://www.boc.lk/
Online references:

Every day across this island, Bank of Ceylon is changing the way people live. For over 82 years we have served the people of Sri Lanka with the stability, expertise and resilience that has come to symbolise
our legacy an enduring testament of the value and trust that you, our stakeholders, have placed in us. Our success is not measured simply by numbers, but by the individual success of the people who have
placed their confidence in our ability to bring about change in their own lives.
In all corners of this nation, we have been an integral part of bringing people and communities the services that matter most to them, digitalising our systems and reaching out with support for businesses and individuals to help drive their own visions of success towards a better tomorrow.
CHANGING THE WAY PEOPLE LIVE
3
VISIONTo be the Nation’s preferred bank with a strong global presence providing customer centric innovative financial solutions.
MISSIONTo provide highly efficient, customer focused, technologically sophisticated, resilient and innovative financial services to the Nation with global access, empowering employees and enhancing value to the stakeholders.
VALUESIn achieving our vision to be the Nation’s preferred bank with a strong global presence, providing customer centric innovative financial solutions, we are committed to upholding our core five values as follows,
Being customer centric
Respecting all forms of diversity
Committing towards high level of ethics, governance and professionalism
Focusing towards agility and innovation
Being accountable for all our actions
“Bankers to the Nation”
1
CONTENTS
OVERVIEWAbout This Report ..........................................2
Our Approach to Integrated Thinking .........4
About Us .........................................................5
Performance Highlights ................................7
Non-financial Highlights ................................8
LEADERSHIP INSIGHTSChairman’s Message ....................................10
General Manager’s Review .........................14
Board of Directors .......................................18
Corporate Management .............................22
Executive Management ...............................28
OUR BANKValue Creation Model ..................................32
Economic Value Added (EVA) ......................34
Our Economic Impact ..................................35
Operating Context .......................................36
Pestel Analysis ..............................................37
Material Issues .............................................39
OUR STRATEGYTransformational Strategy ..........................42
Resource Allocation and Strategic Outcomes .....................................44
Embedding Sustainability ...........................47
OUR PERFORMANCE
Chief Financial Officer’s Review ..................52
Business Line Reviews
Retail Banking ...............................................56
Corporate and Offshore Banking...............58
International, Treasury, Investment and Overseas Operations ...........................60
STAKEHOLDER OUTCOMESCustomers .....................................................62
Our Employees .............................................68
Shareholder and Fund Providers ...............73
Country and Community ............................74
Business Partners ........................................78
Regulators .....................................................79
Awards...........................................................81
ACCOUNTABILITYCorporate Governance ................................82
Board Subcommittee Reports
Audit Committee Report .............................93
Integrated Risk Management Committee Report .......................................94
Human Resources and Remuneration Committee Report .......................................96
Nomination and Corporate Governance Committee Report .......................................97
Information and Communication Technology Committee Report ..................98
Risk Management ........................................99
FINANCIAL REPORTSAnnual Report of the Directors on the State of Affairs of Bank of Ceylon ............115
Directors’ Interest in Contracts ................120
Directors’ Statement on Internal Control Over Financial Reporting ...........................122
Independent Assurance Report ...............124
Directors’ Responsibility for Financial Reporting ....................................................125
Report of the Auditor General ..................126
Statement of Profit or Loss .......................130
Statement of Comprehensive Income ....131
Statement of Financial Position ...............132
Statement of Changes In Equity ...............134
Statement of Cash Flows ..........................138
Notes to the Financial Statements ...........140
COMPLIANCE ANNEXESCompliance with Code of Best Practice on Corporate Governance 2017 issued by CA Sri Lanka ..............................317
Compliance Requirements as per Banking Act Direction No. 11 of 2007 ......322
Compliance Requirements Enforced by Colombo Stock Exchange..........................339
Compliance Requirements Enforced by the Central Bank of Sri Lanka ..............341
Capital Adequacy .......................................345
SUPPLIMENTARY INFORMATIONGRI Index .....................................................358
Independent Assurance Report - Sustainability ............................................361
Statement of Profit or Loss in USD ..........363
Statement of Comprehensive Income in USD ...............364
Statement of Financial Position in USD ...365
Quarterly Performance .............................366
Share and Debenture Information ..........369
Ten Year Statistical Summary – Bank ......370
Subsidiaries and Associates .....................372
Correspondent Relationships By Country ..................................................374
Exchange Companies By Country ............380
Glossary of Financial/ Banking Terms .....381
Corporate Offices and Overseas Branches ....................................385
Corporate Information ..............................387
BANK OF CEYLON | ANNUAL REPORT 2021
2
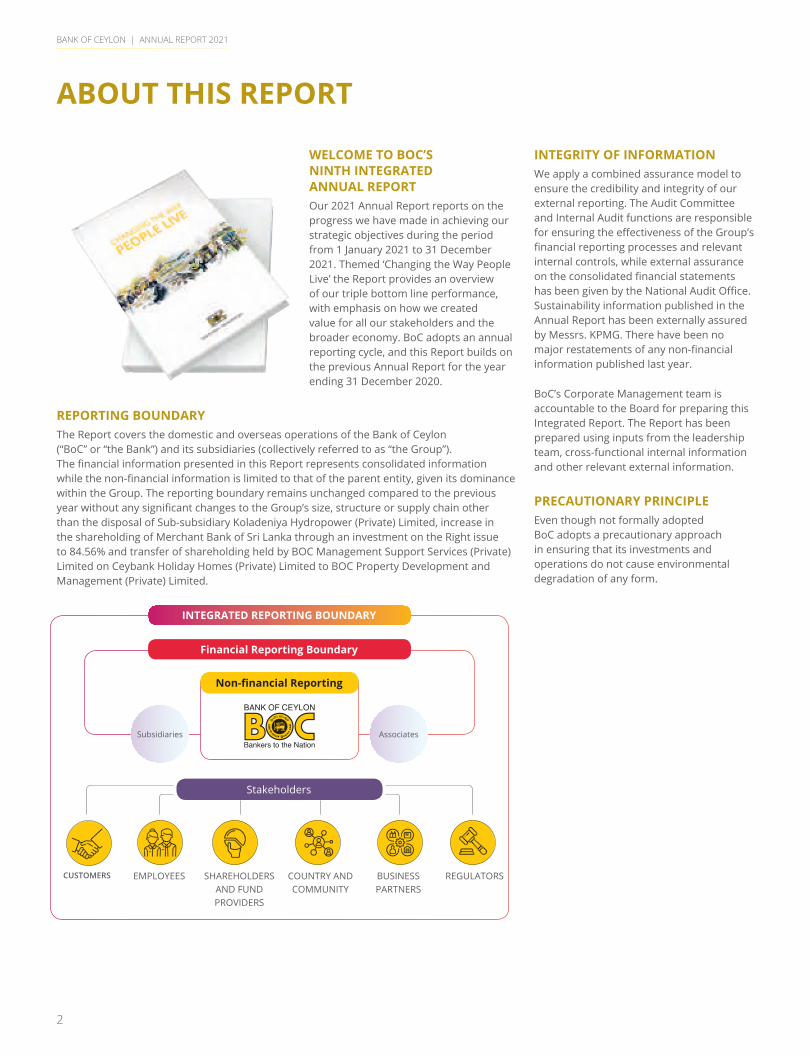
ABOUT THIS REPORT
WELCOME TO BOC’S NINTH INTEGRATED ANNUAL REPORTOur 2021 Annual Report reports on the progress we have made in achieving our strategic objectives during the period from 1 January 2021 to 31 December 2021. Themed ‘Changing the Way People Live’ the Report provides an overview of our triple bottom line performance, with emphasis on how we created value for all our stakeholders and the broader economy. BoC adopts an annual reporting cycle, and this Report builds on the previous Annual Report for the year ending 31 December 2020.
REPORTING BOUNDARY The Report covers the domestic and overseas operations of the Bank of Ceylon (“BoC” or “the Bank”) and its subsidiaries (collectively referred to as “the Group”). The financial information presented in this Report represents consolidated information while the non-financial information is limited to that of the parent entity, given its dominance within the Group. The reporting boundary remains unchanged compared to the previous year without any significant changes to the Group’s size, structure or supply chain other than the disposal of Sub-subsidiary Koladeniya Hydropower (Private) Limited, increase in the shareholding of Merchant Bank of Sri Lanka through an investment on the Right issue to 84.56% and transfer of shareholding held by BOC Management Support Services (Private) Limited on Ceybank Holiday Homes (Private) Limited to BOC Property Development and Management (Private) Limited.
INTEGRITY OF INFORMATIONWe apply a combined assurance model to ensure the credibility and integrity of our external reporting. The Audit Committee and Internal Audit functions are responsible for ensuring the effectiveness of the Group’s financial reporting processes and relevant internal controls, while external assurance on the consolidated financial statements has been given by the National Audit Office. Sustainability information published in the Annual Report has been externally assured by Messrs. KPMG. There have been no major restatements of any non-financial information published last year.
BoC’s Corporate Management team is accountable to the Board for preparing this Integrated Report. The Report has been prepared using inputs from the leadership team, cross-functional internal information and other relevant external information.
PRECAUTIONARY PRINCIPLEEven though not formally adopted BoC adopts a precautionary approach in ensuring that its investments and operations do not cause environmental degradation of any form.
Stakeholders
CUSTOMERS EMPLOYEES SHAREHOLDERS AND FUND PROVIDERS
COUNTRY AND COMMUNITY
BUSINESS PARTNERS
REGULATORS
INTEGRATED REPORTING BOUNDARY
Financial Reporting Boundary
Non-financial Reporting
Subsidiaries Associates
BANK OF CEYLON | ANNUAL REPORT 2021
3
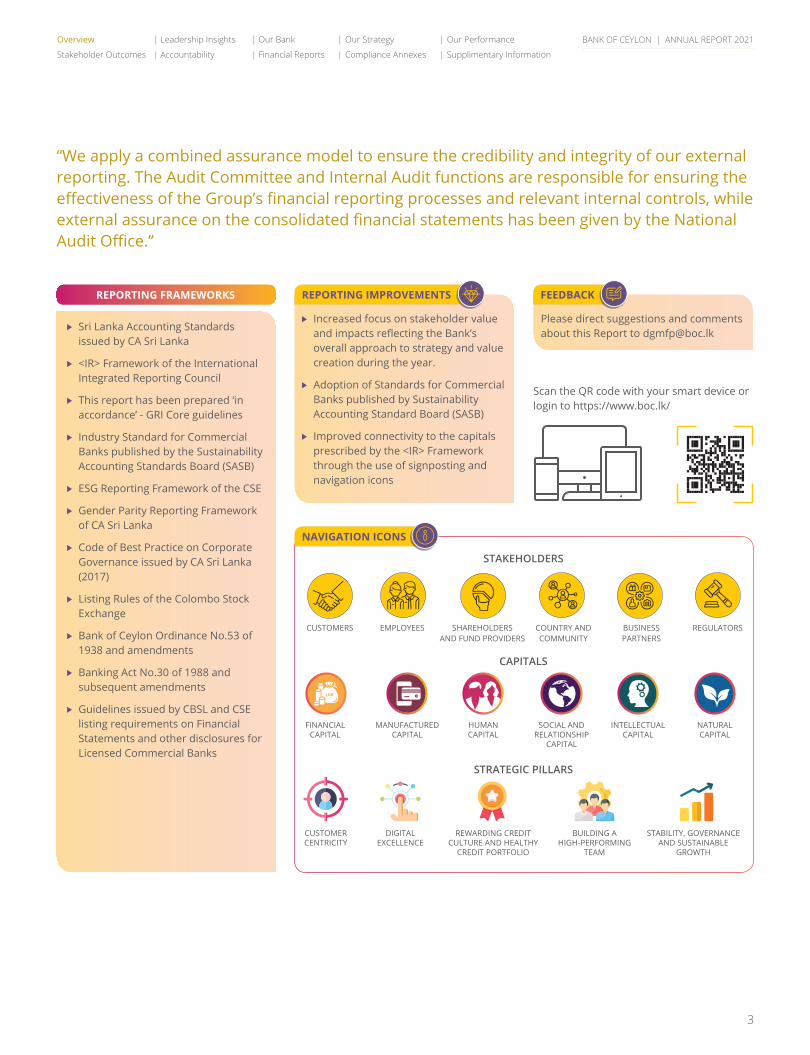
REPORTING IMPROVEMENTS
NAVIGATION ICONS
FEEDBACK
Increased focus on stakeholder value and impacts reflecting the Bank’s overall approach to strategy and value creation during the year.
Adoption of Standards for Commercial Banks published by Sustainability Accounting Standard Board (SASB)
Improved connectivity to the capitals prescribed by the <IR> Framework through the use of signposting and navigation icons
Please direct suggestions and comments about this Report to [email protected]
Scan the QR code with your smart device or login to https://www.boc.lk/
Sri Lanka Accounting Standards issued by CA Sri Lanka
<IR> Framework of the International Integrated Reporting Council
This report has been prepared ‘in accordance’ - GRI Core guidelines
Industry Standard for Commercial Banks published by the Sustainability Accounting Standards Board (SASB)
ESG Reporting Framework of the CSE
Gender Parity Reporting Framework of CA Sri Lanka
Code of Best Practice on Corporate Governance issued by CA Sri Lanka (2017)
Listing Rules of the Colombo Stock Exchange
Bank of Ceylon Ordinance No.53 of 1938 and amendments
Banking Act No.30 of 1988 and subsequent amendments
Guidelines issued by CBSL and CSE listing requirements on Financial Statements and other disclosures for Licensed Commercial Banks
STAKEHOLDERS
CAPITALS
STRATEGIC PILLARS
FINANCIAL CAPITAL
SOCIAL AND RELATIONSHIP
CAPITAL
MANUFACTURED CAPITAL
INTELLECTUAL CAPITAL
NATURAL CAPITAL
HUMAN CAPITAL
CUSTOMER CENTRICITY
DIGITAL EXCELLENCE
REWARDING CREDIT CULTURE AND HEALTHY
CREDIT PORTFOLIO
BUILDING A HIGH-PERFORMING
TEAM
STABILITY, GOVERNANCE AND SUSTAINABLE
GROWTH
“We apply a combined assurance model to ensure the credibility and integrity of our external reporting. The Audit Committee and Internal Audit functions are responsible for ensuring the effectiveness of the Group’s financial reporting processes and relevant internal controls, while external assurance on the consolidated financial statements has been given by the National Audit Office.”
REPORTING FRAMEWORKS
CUSTOMERS EMPLOYEES SHAREHOLDERS AND FUND PROVIDERS
COUNTRY AND COMMUNITY
BUSINESS PARTNERS
REGULATORS
Overview Leadership Insights Our Bank Our Strategy Our Performance
Stakeholder Outcomes Accountability Financial Reports Compliance Annexes Supplimentary Information

BANK OF CEYLON | ANNUAL REPORT 2021
4
OUR APPROACH TO INTEGRATED THINKING
Issues that could potentially have a significant impact on our ability to create value, our social licence to operate and stakeholder relationships.
Our strategy is aimed at transforming BoC to a future-fit, agile and sustainable bank while maintaining market leadership and driving socio-economic value creation.
DELIVERING STRATEGY THROUGH OUR BUSINESS LINES
RESOURCE ALLOCATION
STRATEGY FORMULATION
DETERMINING MATERIAL ISSUES
Deployment of resources and relationships to drive strategy through a formal decision-making framework (Page 44)
A systematic and proactive approach to managing risks enables the Bank to consistently drive stakeholder value creation while safeguarding our financial performance and stability
Our operating contextRisks and opportunities presented by the operating environment, including the unprecedented challenges stemming from the COVID-19 pandemic
(Page 38)
Stakeholder considerationsMatters of interest to stakeholders identified through our numerous engagement platforms
(Page 39)
Internal strengths/weaknessesThe Bank’s inherent strengths and weaknesses which directly impacts its ability to drive strategy
(Page 42)
WHERE WE WANT TO BE STRATEGIC ENABLERS
Excellence in Customer Service Leading the Digital Adoption Retaining Market Leadership Best in Sustainable Banking
Customer Centricity Digital Excellence Rewarding Credit Culture and Healthy
Credit Portfolio
Building a High-Performing Team Stability, Governance and Sustainable
Growth
FINANCIAL CAPITAL
MANUFACTURED CAPITAL
SOCIAL AND RELATIONSHIP CAPITAL
INTELLECTUAL CAPITAL
HUMAN CAPITAL
NATURAL CAPITAL
Retail BankingCorporate and Offshore Banking
International, Treasury, Investment and Overseas Operations
(Page 56)
(Page 99)
(Page 60)(Page 58)
CUSTOMERS EMPLOYEES SHAREHOLDERS AND FUND PROVIDERS
COUNTRY AND COMMUNITY BUSINESS PARTNERS
REGULATORS
Relevant solutions and service
excellence through convenience,
innovation and responsible
banking
(Page 62)
A dynamic and inclusive
workplace providing ongoing opportunities for skill and career development
(Page 68)
Generation of sustainable
returns commensurate
with risk undertaken
(Page 73)
Contribute towards the country’s national development
agenda
(Page 74)
Drive positive and meaningful socio-economic change
(Page 75)
Create opportunities
for mutual growth
(Page 78)
Ensure full compliance to
relevant regulatory and statutory requirements
(Page 79)
MANAGING RISKS
STAKEHOLDER OUTCOMES
BoC’s integrated approach towards strategy formulation has enabled it to proactively respond to emerging challenges presented by the internal and external operating landscape.
BANK OF CEYLON | ANNUAL REPORT 2021
5
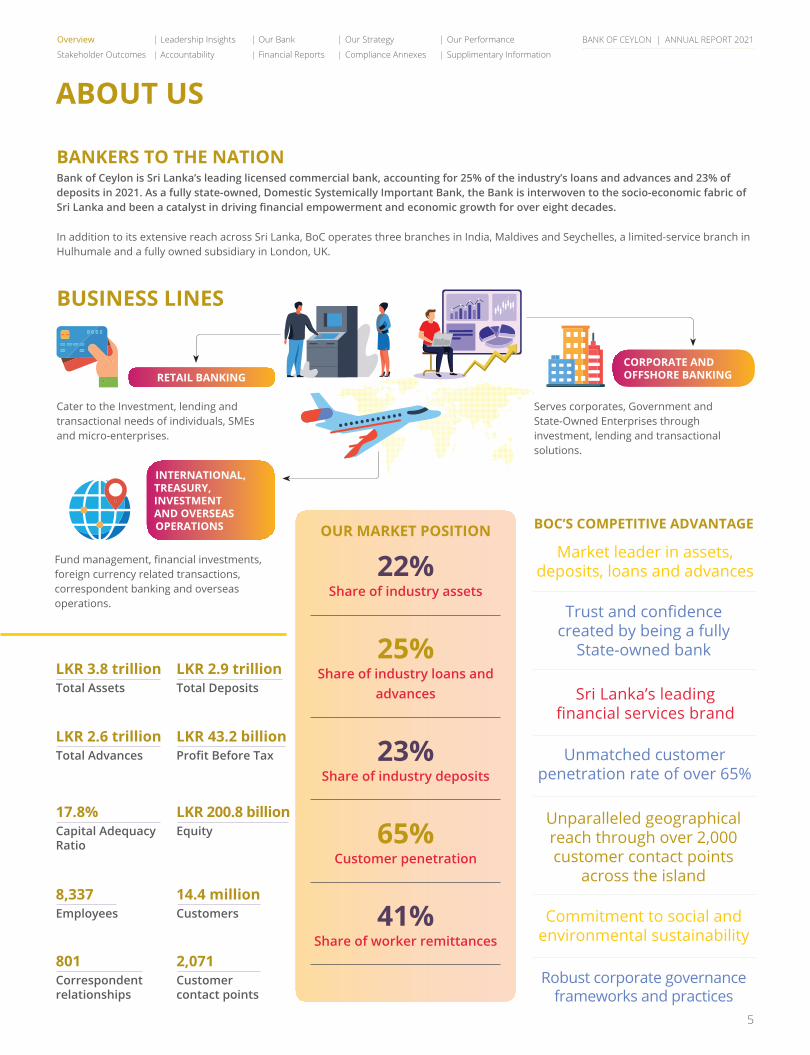
ABOUT US
BUSINESS LINES
BOC’S COMPETITIVE ADVANTAGE
Market leader in assets, deposits, loans and advances
Commitment to social and environmental sustainability
Sri Lanka’s leading financial services brand
Trust and confidence created by being a fully
State-owned bank
Unmatched customer penetration rate of over 65%
Unparalleled geographical reach through over 2,000 customer contact points
across the island
RETAIL BANKINGCORPORATE AND OFFSHORE BANKING
INTERNATIONAL, TREASURY, INVESTMENT AND OVERSEAS OPERATIONS
Robust corporate governance frameworks and practices
BANKERS TO THE NATIONBank of Ceylon is Sri Lanka’s leading licensed commercial bank, accounting for 25% of the industry’s loans and advances and 23% of deposits in 2021. As a fully state-owned, Domestic Systemically Important Bank, the Bank is interwoven to the socio-economic fabric of Sri Lanka and been a catalyst in driving financial empowerment and economic growth for over eight decades.
In addition to its extensive reach across Sri Lanka, BoC operates three branches in India, Maldives and Seychelles, a limited-service branch in Hulhumale and a fully owned subsidiary in London, UK.
OUR MARKET POSITION
22%Share of industry assets
25%Share of industry loans and
advances
23%Share of industry deposits
65%Customer penetration
41%Share of worker remittances
Cater to the Investment, lending and transactional needs of individuals, SMEs and micro-enterprises.
Fund management, financial investments, foreign currency related transactions, correspondent banking and overseas operations.
Serves corporates, Government and State-Owned Enterprises through investment, lending and transactional solutions.
LKR 3.8 trillionTotal Assets
LKR 2.6 trillionTotal Advances
17.8%Capital Adequacy Ratio
8,337Employees
801Correspondent relationships
LKR 2.9 trillionTotal Deposits
LKR 43.2 billionProfit Before Tax
LKR 200.8 billionEquity
14.4 millionCustomers
2,071Customer contact points
Overview Leadership Insights Our Bank Our Strategy Our Performance
Stakeholder Outcomes Accountability Financial Reports Compliance Annexes Supplimentary Information
BANK OF CEYLON | ANNUAL REPORT 2021
6
BoC holding Non controlling interest
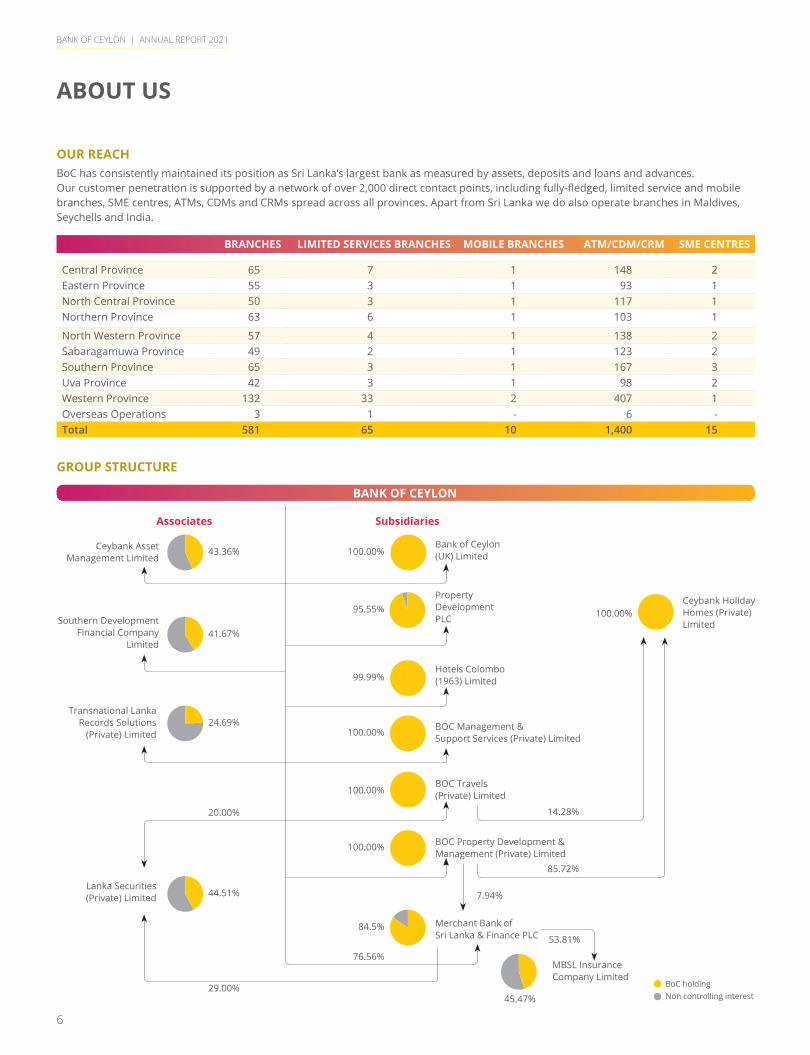
ABOUT US
OUR REACHBoC has consistently maintained its position as Sri Lanka’s largest bank as measured by assets, deposits and loans and advances. Our customer penetration is supported by a network of over 2,000 direct contact points, including fully-fledged, limited service and mobile branches, SME centres, ATMs, CDMs and CRMs spread across all provinces. Apart from Sri Lanka we do also operate branches in Maldives, Seychells and India.
BRANCHES LIMITED SERVICES BRANCHES MOBILE BRANCHES ATM/CDM/CRM SME CENTRES
Central Province 65 7 1 148 2Eastern Province 55 3 1 93 1North Central Province 50 3 1 117 1Northern Province 63 6 1 103 1
North Western Province 57 4 1 138 2Sabaragamuwa Province 49 2 1 123 2Southern Province 65 3 1 167 3Uva Province 42 3 1 98 2Western Province 132 33 2 407 1Overseas Operations 3 1 - 6 -Total 581 65 10 1,400 15
GROUP STRUCTURE
BANK OF CEYLON
Associates Subsidiaries
Ceybank Asset Management Limited
Bank of Ceylon (UK) Limited
Property Development PLC
Hotels Colombo (1963) Limited
Ceybank Holiday Homes (Private) Limited
BOC Management & Support Services (Private) Limited
BOC Travels (Private) Limited
BOC Property Development & Management (Private) Limited
Merchant Bank of Sri Lanka & Finance PLC
MBSL Insurance Company Limited
Southern Development Financial Company
Limited
Transnational Lanka Records Solutions
(Private) Limited
Lanka Securities (Private) Limited
43.36% 100.00%
100.00%
100.00%
100.00%
14.28%
85.72%
7.94%
53.81%
100.00%
84.5%
76.56%
45.47%
95.55%
99.99%
41.67%
24.69%
44.51%
20.00%
29.00%
BANK OF CEYLON | ANNUAL REPORT 2021
7
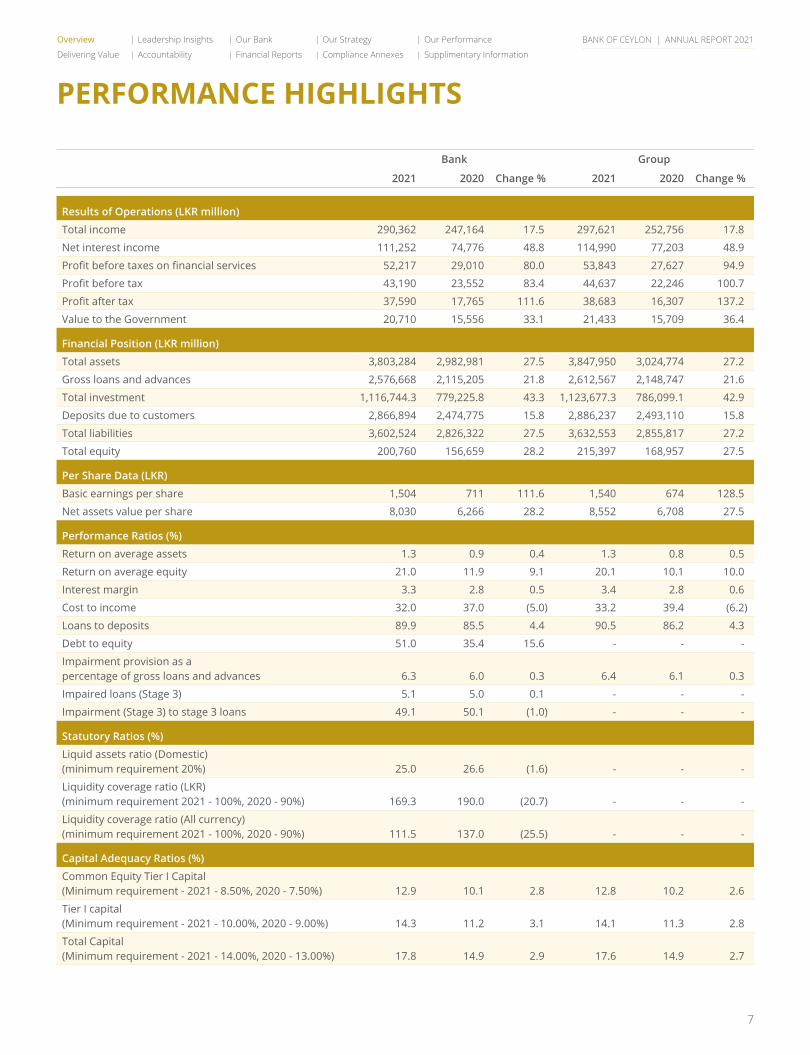
PERFORMANCE HIGHLIGHTS
Bank Group
2021 2020 Change % 2021 2020 Change %
Results of Operations (LKR million)
Total income 290,362 247,164 17.5 297,621 252,756 17.8
Net interest income 111,252 74,776 48.8 114,990 77,203 48.9
Profit before taxes on financial services 52,217 29,010 80.0 53,843 27,627 94.9
Profit before tax 43,190 23,552 83.4 44,637 22,246 100.7
Profit after tax 37,590 17,765 111.6 38,683 16,307 137.2
Value to the Government 20,710 15,556 33.1 21,433 15,709 36.4
Financial Position (LKR million)
Total assets 3,803,284 2,982,981 27.5 3,847,950 3,024,774 27.2
Gross loans and advances 2,576,668 2,115,205 21.8 2,612,567 2,148,747 21.6
Total investment 1,116,744.3 779,225.8 43.3 1,123,677.3 786,099.1 42.9
Deposits due to customers 2,866,894 2,474,775 15.8 2,886,237 2,493,110 15.8
Total liabilities 3,602,524 2,826,322 27.5 3,632,553 2,855,817 27.2
Total equity 200,760 156,659 28.2 215,397 168,957 27.5
Per Share Data (LKR)
Basic earnings per share 1,504 711 111.6 1,540 674 128.5
Net assets value per share 8,030 6,266 28.2 8,552 6,708 27.5
Performance Ratios (%)
Return on average assets 1.3 0.9 0.4 1.3 0.8 0.5
Return on average equity 21.0 11.9 9.1 20.1 10.1 10.0
Interest margin 3.3 2.8 0.5 3.4 2.8 0.6
Cost to income 32.0 37.0 (5.0) 33.2 39.4 (6.2)
Loans to deposits 89.9 85.5 4.4 90.5 86.2 4.3
Debt to equity 51.0 35.4 15.6 - - -
Impairment provision as a percentage of gross loans and advances 6.3 6.0 0.3 6.4 6.1 0.3
Impaired loans (Stage 3) 5.1 5.0 0.1 - - -
Impairment (Stage 3) to stage 3 loans 49.1 50.1 (1.0) - - -
Statutory Ratios (%)
Liquid assets ratio (Domestic) (minimum requirement 20%) 25.0 26.6 (1.6) - - -
Liquidity coverage ratio (LKR) (minimum requirement 2021 - 100%, 2020 - 90%) 169.3 190.0 (20.7) - - -
Liquidity coverage ratio (All currency) (minimum requirement 2021 - 100%, 2020 - 90%) 111.5 137.0 (25.5) - - -
Capital Adequacy Ratios (%)
Common Equity Tier I Capital (Minimum requirement - 2021 - 8.50%, 2020 - 7.50%) 12.9 10.1 2.8 12.8 10.2 2.6
Tier I capital (Minimum requirement - 2021 - 10.00%, 2020 - 9.00%) 14.3 11.2 3.1 14.1 11.3 2.8
Total Capital (Minimum requirement - 2021 - 14.00%, 2020 - 13.00%) 17.8 14.9 2.9 17.6 14.9 2.7
BoC holding Non controlling interest
Overview Leadership Insights Our Bank Our Strategy Our Performance
Delivering Value Accountability Financial Reports Compliance Annexes Supplimentary Information
BANK OF CEYLON | ANNUAL REPORT 2021
8
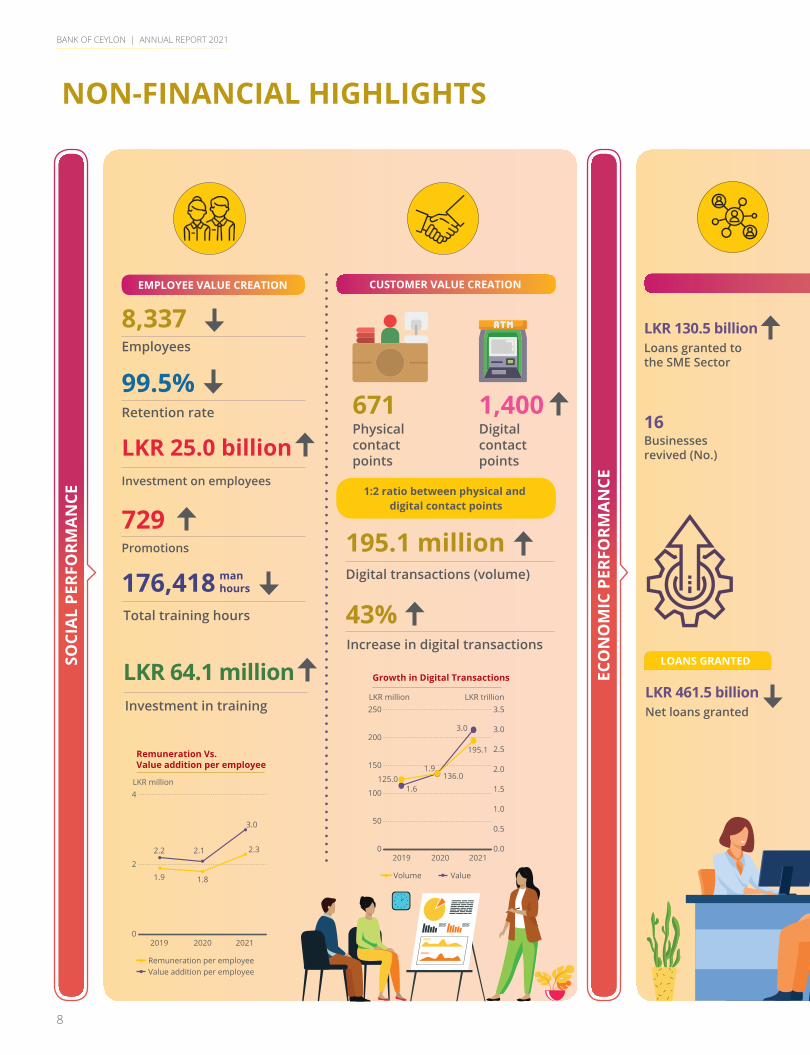
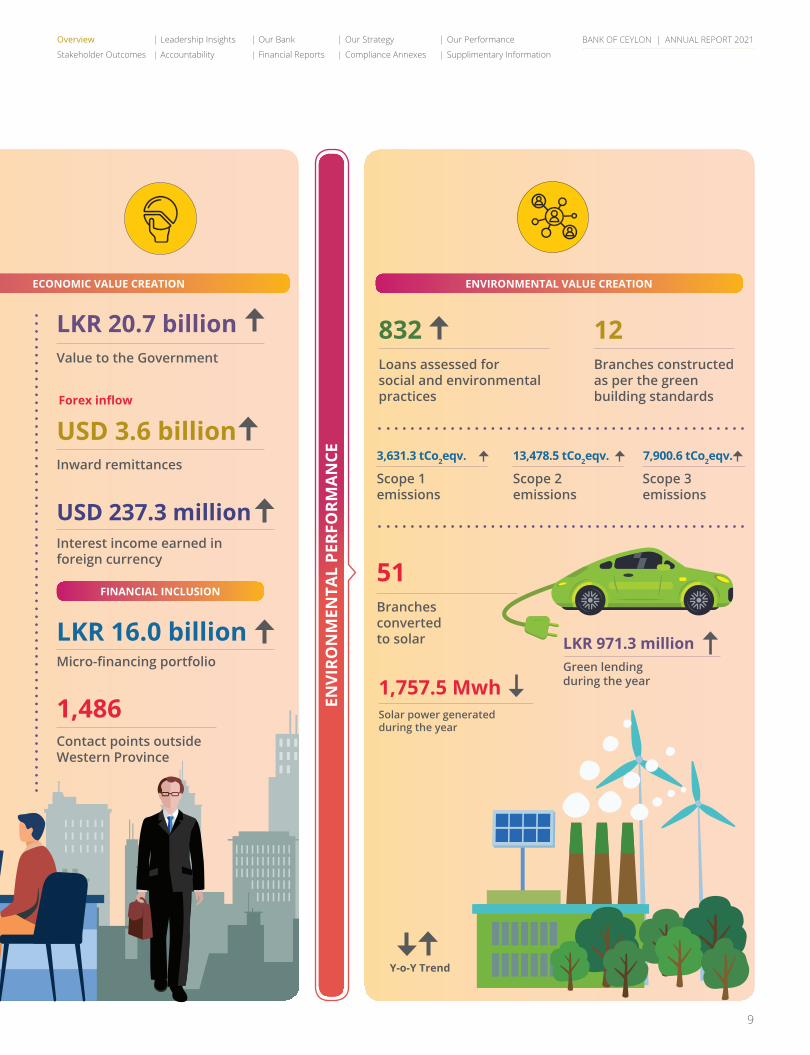
ECONOMIC VALUE CREATION
NON-FINANCIAL HIGHLIGHTS
Employees
Total training hours
Investment in training
Retention rate
Investment on employees
Loans granted to the SME Sector
Net loans granted
Businesses revived (No.)
Physical contact points
Digital transactions (volume)
Increase in digital transactions
Digital contact points
Promotions
8,337
176,418
LKR 64.1 million
99.5%
LKR 25.0 billion
LKR 130.5 billion
LKR 461.5 billion
16671
195.1 million
43%
1,400
729
LOANS GRANTEDSOCI
AL
PERF
ORM
AN
CE
ECO
NO
MIC
PER
FORM
AN
CE1:2 ratio between physical and digital contact points
CUSTOMER VALUE CREATIONEMPLOYEE VALUE CREATION
Remuneration Vs.Value addition per employee
0
2
4
202120202019
LKR million
Remuneration per employeeValue addition per employee
1.9 1.8
2.32.2 2.1
3.0
0.0
0.5
1.0
1.5
2.0
2.5
3.0
3.5
Growth in Digital Transactions
0
50
100
150
200
250
202120202019
LKR million LKR trillion
Volume Value
125.0 136.0
195.1
1.6
1.9
3.0
manhours
BANK OF CEYLON | ANNUAL REPORT 2021
9
ECONOMIC VALUE CREATION
Inward remittances
Value to the Government
Branches constructed as per the green building standards
Branches converted to solar
Solar power generated during the year
Interest income earned in foreign currency
Micro-financing portfolio
Scope 1 emissions
Scope 2 emissions
Scope 3 emissions
Loans assessed for social and environmental practices
Contact points outside Western Province
USD 3.6 billion
LKR 20.7 billion 12
51
1,757.5 Mwh
USD 237.3 million
LKR 16.0 billion
3,631.3 tCo2eqv. 13,478.5 tCo2eqv. 7,900.6 tCo2eqv.
832
1,486 ENVI
RON
MEN
TAL
PERF
ORM
AN
CE
ENVIRONMENTAL VALUE CREATION
FINANCIAL INCLUSION
Forex inflow
Green lending during the year
LKR 971.3 million
Y-o-Y Trend
Overview Leadership Insights Our Bank Our Strategy Our Performance
Stakeholder Outcomes Accountability Financial Reports Compliance Annexes Supplimentary Information

CHAIRMAN’S MESSAGE
I write to you at the close of what has been a uniquely challenging year for governments, organisations and communities around the world. As Sri Lanka’s leading financial intermediary, Bank of Ceylon has always embraced its responsibility in putting the country first, as we are cognizant of the critical interdependencies that exist between our economy, the well-being of our citizens and the Bank. Against this backdrop, I am extremely proud of the role played by BoC in stabilising the country’s economic fundamentals while creating value for our diverse stakeholders in 2021. It is my pleasure and privilege to present BoC’s Annual Report and Audited Financial Statements for 2021.
“I am extremely proud of the role played by BoC in stabilising the country’s economic fundamentals while creating value for our diverse stakeholders in 2021.”
BANK OF CEYLON | ANNUAL REPORT 2021
Kanchana RatwatteChairman
10
BANK OF CEYLON | ANNUAL REPORT 2021
11
“We firmly believe that SMEs will be the engine of growth underpinning Sri Lanka’s economic recovery. During the year, strategic focus was placed on fuelling the growth of this sector through offering a holistic value proposition extending beyond mere financial support. Accordingly, the Bank offered multi-faceted advisory services including capacity building, guidance on market access and opportunities for networking, among others.”
THE OPERATING LANDSCAPEAs Sri Lanka faced the second and third waves of COVID-19 in 2021, businesses showed a high-level of adaptability to operating in conditions of limited mobility by leveraging lessons learned in 2020. This was supported by the Government’s continued efforts to aid affected businesses through extending moratorium periods, concessions for selected industry sectors and adopting an expansionary monetary policy with a view to stimulating demand. Pandemic-led disruptions to the country’s tourism sector and moderation in remittance inflows led to inevitable pressure on Sri Lanka’s external position; a temporary challenge which the Government has sought to address through strategic and timely interventions. Towards the second half of the year, the Central Bank of Sri Lanka sought to tighten monetary policy in order to support continued macro-economic stability; accordingly, the SRR, Bank rate, SDFR and SLFR were increased during the third quarter of 2021.
AN IMPACTFUL STRATEGYThe Bank’s strategic imperatives for 2021 reflected our commitment to balancing the diverse interests of our stakeholders, while contributing towards the country’s socio-economic stability and business revival. Despite periodic lockdowns, BoC offered uninterrupted services to its island-wide customers, ensuring access to essential banking services across the Bank’s extensive network of touchpoints. Parallel importance was placed on safeguarding the health and well-being of our employees and the Bank introduced a range of stringent preventive measures to minimise the risk of cross infection. We also continued to offer transport facilities, medical coverage for COVID-19 related hospitalisation, access to interim care facilities and special quarantine leave among others, for the welfare of staff and their family members.
Strategic emphasis was placed on rehabilitating businesses that were affected by the pandemic, with the aim of ensuring the survival and continued economic contribution of these enterprises. A dedicated Business Revival Unit has been established with the aim of reviving affected corporates and SMEs through providing new facilities and enhancing internal capabilities. To date this Unit has rehabilitated over 16 customers, thereby securing the livelihoods of over 4,900 individuals employed in these enterprises. BoC also continues to be at the forefront of extending moratoria for affected businesses and individuals, with over 97,000 facilities were granted moratoria of around LKR 380.6 billion during the year.
We firmly believe that SMEs will be the engine of growth underpinning Sri Lanka’s economic recovery. During the year, strategic focus was placed on fuelling the growth of this sector through offering a holistic value proposition extending beyond mere financial support. Accordingly, the Bank offered multi-faceted advisory services including capacity building, guidance on market access and opportunities for networking, among others. Meanwhile, we disbursed over LKR 17.8 billion through the ‘Divi Udana’ scheme a dedicated loan scheme targeted at empowering the SME sector. The Board of Directors and the Corporate Management Team were actively
involved in this endeavour and had the opportunity to engage directly with the Bank’s valuable SME customers across the country, understand their concerns and aid them through offering pragmatic solutions.
During the year, BoC’s socio-economic impact was further amplified by the role it played in facilitating the importation of essential items to the country. Despite the challenging foreign currency position, the Bank stepped up efforts to ensure the continued importation of fuel, pharmaceuticals and gas, thereby being a driving force behind uninterrupted economic activity in the country. It is noteworthy that the Bank has financed USD 1,460.0 million during the year to import fuel to the country. I am also extremely proud of the role BoC played in combating the COVID-19 pandemic in Sri Lanka, as the Bank has financed USD 138.0 million for vaccine importation, which in turn has enabled Sri Lanka to achieve a relatively high vaccination rate. Importation of these essential items were made possible by BoC’s ability to leverage its market leadership position in remittances to facilitate critical forex inflows to the country. Despite a reduction in overall remittances to Sri Lanka, BoC successfully increased its remittances by 29%, attesting to the strength of our relationships and presence in strategic locations.
Overview Leadership Insights Our Bank Our Strategy Our Performance
Stakeholder Outcomes Accountability Financial Reports Compliance Annexes Supplimentary Information
BANK OF CEYLON | ANNUAL REPORT 2021
12
CHAIRMAN’S MESSAGE
We are cognizant of the vital importance of addressing Sri Lanka’s external sector vulnerabilities through sustainable, long-term solutions. In supporting this agenda, BoC has in recent years placed strategic focus on strengthening Sri Lanka’s SME exporters through ‘BoC Export Circle’ - a unique initiative which provides exporters a platform for effective networking opportunities and capacity building in addition to financial support. In 2021, 80 new SME level exporters were supported through this initiative, and 351 exporters were supported through awareness programmes conducted across the country.
The Bank was an active contributor to the national effort to combat the pandemic, sponsoring the call centre of the COVID-19 Integrated Home-based Care Solution implemented by the Ministry of Health. This solution comprised a toll-free trilingual hotline and an integrated digital platform to effectively manage the home care of infected persons. This reduced the burden to the hospital sector and front-line workers, providing an effective platform to manage non-critical patients remotely.
PERFORMANCE AND STABILITYDespite the challenges posed during the year, the Bank continued to deliver on its shareholder commitments. Profit for the year increased to a record high of LKR 43.2 billion, thereby enhancing the Bank’s capitalisation through higher profit retention. We understand that in times of uncertainty, stability of the balance sheet is critical, and the Board focused on enhancing capitalisation to support our growth aspirations and fulfil customers’ needs. Accordingly, the Bank raised Tier I capital of LKR 3.4 billion and Tier II capital of LKR 5.2 billion during the year, thereby enhancing its Tier I and total capital ratios to 14.3% and 17.8% respectively. These levels remain comfortably above the regulatory minimum, providing a cushion against potential stress in 2022. BoC also successfully obtained USD 90.0 million funding line from Asian Infrastructure Investment Bank (AIIB) principally to support businesses affected by the COVID-19 pandemic.
“While the inevitable short-term challenges are likely to prevail, we remain confident of the remarkable resilience of the Sri Lankan people. I am optimistic that measures adopted by the Government will drive the country’s economic revival, positioning the country to achieve its full potential in the medium-to-long term.”
LEADERSHIP AND GOVERNANCEEffective and agile leadership has been a critical factor in ensuring the Bank’s resilience during the year as BoC’s strong policy frameworks and clearly defined procedures offered a solid foundation for driving strategy. The Board remained unchanged in 2021, thereby ensuring continuity of vision, collective thinking and strategic alignment. Key areas of Board focus during the year included, embedding sustainable lending principles through approval of a new Environment Social Management System (ESMS) Policy, strengthening credit risk management frameworks and proactively monitoring emerging developments in the operating landscape.
WAY FORWARDWhile the inevitable short-term challenges are likely to prevail, we remain confident of the remarkable resilience of the Sri Lankan people. I am optimistic that measures adopted by the Government will drive the country’s economic revival, positioning the country to achieve its full potential in the medium-to-long term. As Bankers to the Nation, BoC is committed towards supporting the Government’s national development agenda through strengthening the country’s SME and export sectors, building capacity and encouraging local manufacturers to expand overseas. Integrating social and environmental consciousness into our strategy, operations and decision making will be a key priority for 2021 as we fulfil our role as a responsible corporate citizen.
Funding via ‘Divi Udana’ loan scheme in year 2021
Amount of moratoria granted during the year
LKR 17.8 billion LKR 380.6 billion
BANK OF CEYLON | ANNUAL REPORT 2021
13
APPRECIATIONI would like to take this opportunity to extend my deepest gratitude to His Excellency the President, the Honourable Prime Minister and the Honourable Minister of Finance for their continued guidance and confidence placed in me. I also thank the Governor and Officials of the Central Bank of Sri Lanka, the Secretary to the President and the Secretary to the Treasury for their valuable guidance. I also extend my appreciation to my colleagues on the Board for their valuable counsel and contribution during the year. My best wishes go out to Mr Jayampathy Molligoda who resigned from the Board with effect from 1 February 2022. I take this opportunity also to thank Mr D P K Gunasekera who retired as the General Manager/CEO of BoC after over 40 years’ service to the Bank. I welcome the new General Manager/CEO Mr K E D Sumanasiri and look forward to working with him in the future. I am inspired by the efforts and dedication of the BoC leadership team and all employees who delivered the results set out in this Report despite numerous external challenges. Finally, I would like to thank our valuable customers, business partners and other stakeholders for their continued loyalty and support.
Kanchana RatwatteChairman
24 February 2022Colombo
Overview Leadership Insights Our Bank Our Strategy Our Performance
Stakeholder Outcomes Accountability Financial Reports Compliance Annexes Supplimentary Information

BANK OF CEYLON | ANNUAL REPORT 2021
GENERAL MANAGER’S REVIEW
K E D SumanasiriGeneral Manager
Two years after the outbreak of the pandemic, COVID-19 remains a part of our operating landscape, with many countries, including Sri Lanka, seeing the lingering effects of the pandemic’s socio-economic scarring. Against this backdrop, BoC has continued to play a vital role in driving the country’s economic revival, absorbing broad-based shocks and deepening its socio-economic relevance through extending much needed support to businesses, households and the Government. Amid extremely challenging conditions, we continued to make the tough decisions necessary to stabilise the country’s macro-economic fundamentals while enhancing the resilience of our business and generating triple bottom line value. Despite the conditions that prevailed, BoC delivered a year of record profitability and growth, while strengthening its balance sheet and capital position. The Bank maintained its undisputed market leadership in Sri Lanka’s financial sector and was recognised as Bank of the Year – Sri Lanka 2021 by ‘The Banker’ Magazine, UK.
“Driving transformation through digital capabilities is a key pillar of the Bank’s future-proofing strategy and we continued to make significant progress in digitally enabling our customers.”
14
BANK OF CEYLON | ANNUAL REPORT 2021
15
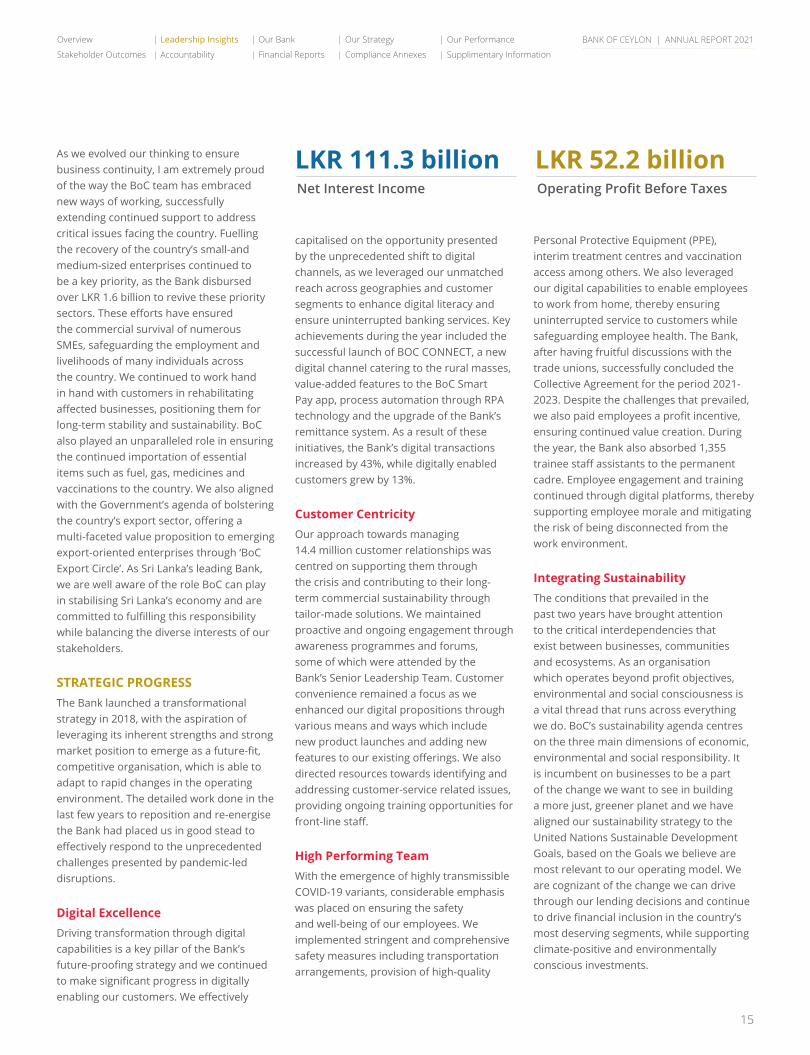
As we evolved our thinking to ensure business continuity, I am extremely proud of the way the BoC team has embraced new ways of working, successfully extending continued support to address critical issues facing the country. Fuelling the recovery of the country’s small-and medium-sized enterprises continued to be a key priority, as the Bank disbursed over LKR 1.6 billion to revive these priority sectors. These efforts have ensured the commercial survival of numerous SMEs, safeguarding the employment and livelihoods of many individuals across the country. We continued to work hand in hand with customers in rehabilitating affected businesses, positioning them for long-term stability and sustainability. BoC also played an unparalleled role in ensuring the continued importation of essential items such as fuel, gas, medicines and vaccinations to the country. We also aligned with the Government’s agenda of bolstering the country’s export sector, offering a multi-faceted value proposition to emerging export-oriented enterprises through ‘BoC Export Circle’. As Sri Lanka’s leading Bank, we are well aware of the role BoC can play in stabilising Sri Lanka’s economy and are committed to fulfilling this responsibility while balancing the diverse interests of our stakeholders.
STRATEGIC PROGRESS The Bank launched a transformational strategy in 2018, with the aspiration of leveraging its inherent strengths and strong market position to emerge as a future-fit, competitive organisation, which is able to adapt to rapid changes in the operating environment. The detailed work done in the last few years to reposition and re-energise the Bank had placed us in good stead to effectively respond to the unprecedented challenges presented by pandemic-led disruptions.
Digital Excellence Driving transformation through digital capabilities is a key pillar of the Bank’s future-proofing strategy and we continued to make significant progress in digitally enabling our customers. We effectively
capitalised on the opportunity presented by the unprecedented shift to digital channels, as we leveraged our unmatched reach across geographies and customer segments to enhance digital literacy and ensure uninterrupted banking services. Key achievements during the year included the successful launch of BOC CONNECT, a new digital channel catering to the rural masses, value-added features to the BoC Smart Pay app, process automation through RPA technology and the upgrade of the Bank’s remittance system. As a result of these initiatives, the Bank’s digital transactions increased by 43%, while digitally enabled customers grew by 13%.
Customer CentricityOur approach towards managing 14.4 million customer relationships was centred on supporting them through the crisis and contributing to their long-term commercial sustainability through tailor-made solutions. We maintained proactive and ongoing engagement through awareness programmes and forums, some of which were attended by the Bank’s Senior Leadership Team. Customer convenience remained a focus as we enhanced our digital propositions through various means and ways which include new product launches and adding new features to our existing offerings. We also directed resources towards identifying and addressing customer-service related issues, providing ongoing training opportunities for front-line staff.
High Performing TeamWith the emergence of highly transmissible COVID-19 variants, considerable emphasis was placed on ensuring the safety and well-being of our employees. We implemented stringent and comprehensive safety measures including transportation arrangements, provision of high-quality
Personal Protective Equipment (PPE), interim treatment centres and vaccination access among others. We also leveraged our digital capabilities to enable employees to work from home, thereby ensuring uninterrupted service to customers while safeguarding employee health. The Bank, after having fruitful discussions with the trade unions, successfully concluded the Collective Agreement for the period 2021-2023. Despite the challenges that prevailed, we also paid employees a profit incentive, ensuring continued value creation. During the year, the Bank also absorbed 1,355 trainee staff assistants to the permanent cadre. Employee engagement and training continued through digital platforms, thereby supporting employee morale and mitigating the risk of being disconnected from the work environment.
Integrating SustainabilityThe conditions that prevailed in the past two years have brought attention to the critical interdependencies that exist between businesses, communities and ecosystems. As an organisation which operates beyond profit objectives, environmental and social consciousness is a vital thread that runs across everything we do. BoC’s sustainability agenda centres on the three main dimensions of economic, environmental and social responsibility. It is incumbent on businesses to be a part of the change we want to see in building a more just, greener planet and we have aligned our sustainability strategy to the United Nations Sustainable Development Goals, based on the Goals we believe are most relevant to our operating model. We are cognizant of the change we can drive through our lending decisions and continue to drive financial inclusion in the country’s most deserving segments, while supporting climate-positive and environmentally conscious investments.
Net Interest Income Operating Profit Before Taxes
LKR 111.3 billion LKR 52.2 billion
Overview Leadership Insights Our Bank Our Strategy Our Performance
Stakeholder Outcomes Accountability Financial Reports Compliance Annexes Supplimentary Information
BANK OF CEYLON | ANNUAL REPORT 2021
16
GENERAL MANAGER’S REVIEW
Despite the prevalent challenges we continued on our branch solarisation initiative and have converted 51 branches to solar as at 31 December 2021. Meanwhile, through the “Haritha Arana” initiative, the Bank has committed to restoring 100 acres of degraded land in Habarana, in line with the national agenda of increasing Sri Lanka’s forest cover.
Resilient PerformanceThe relevance and timeliness of our strategy, together with relentless focus by the team in driving these imperatives, resulted in BoC delivering a record performance during the year under review. Despite the moderating economic conditions that prevailed, the Bank delivered a loan growth of 22%, reflecting continued efforts towards reviving businesses and supporting affected sectors.
Meanwhile, proactive management of asset liability maturity mismatches enabled the Bank to record a 2% decline in interest expenses, which in turn supported a strong NII growth of 49%. Net fee and commission income also increased by 19%.
The Bank’s impairment charge increased by 40% reflecting the broad-based deterioration in credit quality and the proactive and prudent provisioning under expected credit loss model adopted by the Bank. In view of the prevalent conditions, the Bank did not pursue aggressive recovery, litigation or repossession, instead focusing on rehabilitating customers through proactive engagement, debt restructuring and flexible payment plans. Despite the weakening of credit quality, the Bank’s gross NPL ratio remains at same levels compared to last year and remained in line with industry counterparts.
The Bank’s operating expenses increased by 26%, driven mainly by personnel expenses. However, ongoing efforts to automate processes and drive increased digitalisation have led to consistent improvement in the Bank’s cost-to-income ratio which decreased further to 32% during the year. Overall, the Bank’s operating profit before tax on financial services almost doubled to LKR 52.2 billion, while pre-tax profit and profit after tax recorded a growth of 83% and 112% respectively.
The Bank’s total assets increased by 28% to LKR 3.8 trillion, driven primarily by expansion of the credit portfolio. Parallel emphasis was also placed on strengthening our capital position. Due to the Bank’s limited ability to raise capital through the capital market as a fully State own entity the Bank focused on strengthening internally generated capital through limiting our dividend outflow. Resultantly, the Bank’s
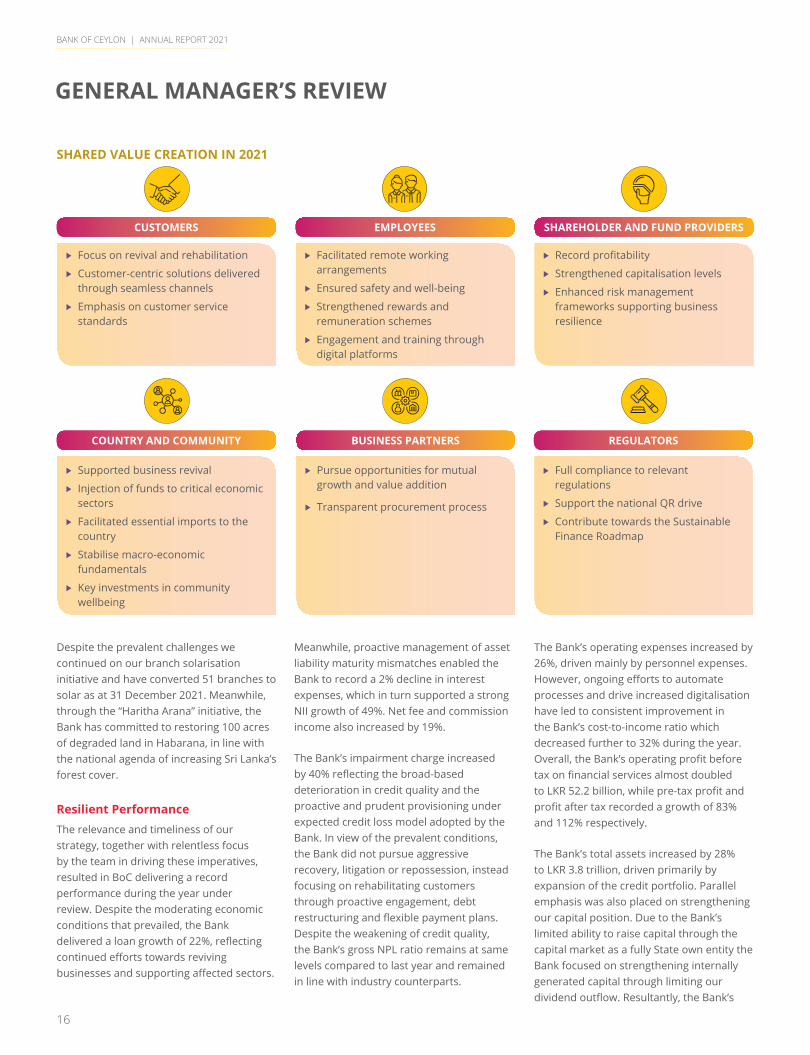
CUSTOMERS
COUNTRY AND COMMUNITY
EMPLOYEES
REGULATORS
SHAREHOLDER AND FUND PROVIDERS
Focus on revival and rehabilitation
Customer-centric solutions delivered through seamless channels
Emphasis on customer service standards
Supported business revival
Injection of funds to critical economic sectors
Facilitated essential imports to the country
Stabilise macro-economic fundamentals
Key investments in community wellbeing
Facilitated remote working arrangements
Ensured safety and well-being
Strengthened rewards and remuneration schemes
Engagement and training through digital platforms
Full compliance to relevant regulations
Support the national QR drive
Contribute towards the Sustainable Finance Roadmap
Record profitability
Strengthened capitalisation levels
Enhanced risk management frameworks supporting business resilience
SHARED VALUE CREATION IN 2021
BUSINESS PARTNERS
Pursue opportunities for mutual growth and value addition
Transparent procurement process
BANK OF CEYLON | ANNUAL REPORT 2021
17
dividend payment was managed at LKR 1,846.4 million, resulting in the Bank’s Tier I and Total Capital ratio increasing to 14.3% and 17.8% respectively. Further, BASEL III complient debenture and ATI instrument issued during the year also contributed on this regard. Deposits increased by 16% and accounted for 77% of the Bank’s total funding attesting to the trust placed by the public on the Bank’s stability.
Preserving ValueWe firmly believe that fit-for-purpose governance frameworks and proactive risk management support informed decision-making. Given the complexities that prevailed during the year, the Bank sought to further strengthen its risk management framework. During the year, we carried out a comprehensive review and updated all risk related policies, strengthened post-sanctioning review of large credit exposures, strengthened provincial operational risk management and incorporated new stress testing scenarios to enhance resilience. In integrating environmental and social risk management with the Bank’s enterprise risk management, BoC established a dedicated ESMS Unit under the Independent Integrated Risk Management Division (IIRMD), thereby enhancing the overall resilience of our business to broader risks stemming from social and environmental factors. The Bank’s stringent risk management frameworks, characterised by the three lines of defence model, multiple level risk committees and objective decision-making across all aspects of our operations ensures that all key risk indicators are within the Board’s defined risk appetite. While ensuing conditions are likely to insert a degree of pressure on our risk profile in 2022, the Bank’s efforts to strengthen capitalisation levels and strong provisioning practices in recent years are expected to provide a cushion against emerging stresses.
“Focus will also be placed on empowering the country’s young and emerging entrepreneurs through providing access to affordable funding, thereby fuelling economic activity across the country.”
WAY FORWARDWe are cognizant of the short-term challenges that may arise from Sri Lanka’s current foreign exchange position, although recent months have shown cause for optimism; the successful vaccination drive across the country has boosted consumer and investor sentiments, resulting in the resurgence of economic activity and a gradual return of tourists to Sri Lanka. The country’s export sector has also recorded a strong rebound, with earnings soaring by 23% during the year. This, together with the policy thrust towards local manufacturing and import substitution, is expected to support the improvement of the country’s external position in the medium term. As Sri Lanka’s leading Bank, we are determined to support Government efforts in formulating sustainable solutions to strengthen the country’s foreign exchange position through driving the long-term development of Sri Lanka’s export sector. In 2022, we will also prioritise the development of the SME sector through the establishment of BoC SME Circles, which will provide a value proposition extending beyond mere financial support. To remain relevant and competitive in this digital age, we will continue to enhance our digital proposition through innovative solutions and seamless delivery channels. Focus will also be placed on empowering the country’s young and emerging entrepreneurs through providing access to affordable funding, thereby fuelling economic activity across the country. As our sustainability journey continues to evolve and mature, we have initiated plans to proactively integrate ESG factors across our business verticals and key processes thereby contributing to sustainable development while strengthening the resilience of our business.
ACKNOWLEDGEMENTSAs we look to 2022 with renewed hope and optimism, I would like to take this opportunity to thank the Chairman and the Board of Directors for the confidence placed in me and their valuable counsel in what has been yet another challenging year. My appriciation also goes to my predecessor, Mr D P K Gunasekera for his valuable service given to the Bank throughout his 40 long years of service. The results set before you in this Report are a testament to the commitment and resilience of the BoC team and I extend my deepest appreciation to the Corporate and Executive Management Team and each and every employee and trade unions of our Bank for their untiring efforts and support extend. I also wish to thank for their continued support throughout the years. I also wish to thank the Ministry of Finance and the officials of the Ministry and the Governor and the staff of the Central Bank of Sri Lanka for their continuous guidance. My gratitude also goes out to the Auditor General and his staff for the execution of the audit of the Financial Statements enabling the timely publication of this Report. Finally, I would like to thank all our valuable customers and all other stakeholders who have placed their trust in us, and I look forward to working with you in the coming years.
K E D SumanasiriGeneral Manager
24 February 2022Colombo
Overview Leadership Insights Our Bank Our Strategy Our Performance
Stakeholder Outcomes Accountability Financial Reports Compliance Annexes Supplimentary Information

BANK OF CEYLON | ANNUAL REPORT 2021
BOARD OF DIRECTORS
Mr Kanchana Ratwatte Chairman, Independent Non-Executive Director
Seated
Standing left to right
1. Ms Janaki Senanayake Siriwardane Secretary, Bank of Ceylon/Secretary to the Board
3. Mr A C Manilka Fernando Independent Non-Executive Director
2. Mr R M Priyantha Rathnayake Non-Executive Ex officio Director
4. Mr G Harsha Wijayawardhana Independent Non-Executive Director
6. Major General (Rtd.) G A Chandrasiri Independent Non-Executive Director
18
5. Mr Jayampathy Molligoda Independent Non-Executive Director
BANK OF CEYLON | ANNUAL REPORT 2021
19
Mr Kanchana RatwatteChairman
Independent Non-Executive Director
Date of appointment02 January 2020
Skills and experience An Attorney-at-Law holding LL.B Degree
from the University of Colombo.
Extensive experience in public sector processes and regulations through leadership positions in public sector institutions.
Private sector administration and leadership in IT, security data printing, software development, Business Process Outsourcing, insurance brokering and securities.
Other appointments Chairman of;
• Property Development PLC.
• Merchant Bank of Sri Lanka and Finance PLC.
• Hotels Colombo (1963) Limited.
• BoC Property Development and Management (Private) Limited.
• Bank of Ceylon (UK) Limited.
Board positions in two private sector companies, one in Stock brokering and the other in Insurance brokering.
Previous appointments Director General of the
Telecommunications Regulatory Commission of Sri Lanka.
Chairman of the Sri Lanka Standards Institution and Ceylon Shipping Corporation among others.
Director of Lanka Coal Co. (Private) Limited.
Director of EW Information Systems Limited.
Director of Toppan Forms (Colombo) Limited.
Mr R M Priyantha RathnayakeNon-Executive Ex officio Director
Date of appointment28 April 2020
Skills and experience A special Grade Officer in the Sri Lanka
Planning Services with over 25 years’ experience.
Holds a MSc in Agriculture from the Agriculture University of Norway and a BSc in Agriculture Economics from the University of Peradeniya.
Extensive experience in multilateral development banking.
Involved in mobilising foreign funding for development projects including bilateral negotiations, co-ordination with development partners and lending agencies.
Other appointments Deputy Secretary to the Treasury.
Director of the Securities and Exchange Commission of Sri Lanka.
Colombo Lotus Tower Management Company (Private) Limited.
Previous appointments Chairman of National Savings Bank.
Member of the National Medicinal Drug Regulatory Authority.
Alternate Executive Director of the Asian Infrastructure Investment Bank, Beijing, People’s Republic of China.
Director of People’s Bank.
Director of the Civil Aviation Authority of Sri Lanka.
Director of the Academy of Financial Studies (Guarantee) Limited.
Member of the Governing Council of the University of Vocational Training.
Director of the Sri Lanka Institute of Tourism and Hotel Management.
Member of the Board of Directors of the National Aquaculture Development Authority of Sri Lanka.
Member of the Sri Lanka Council for Agricultural Research Policy.
Director of the State Pharmaceuticals Corporation of Sri Lanka (SPC).
Director of the Mahaweli Authority of Sri Lanka.
Member of the Advisory Board of the Science and Technology Policy Research Division of the National Science Foundation.
Member of the Sri Lanka Economic Association.
Commission member of Insurance Regulatory Commission of Sri Lanka.
Mr G Harsha WijayawardhanaIndependent Non-Executive Director
Date of appointment14 January 2020
Skills and experience IT professional with over 20 years of wide-
ranging experience in the ICT industry.
Has been involved in Government ICT projects including Government networks.
Established the Software Development Unit of the University of Colombo.
Held responsibility for key national level software projects such as the Automated Fingerprint Identification System (AFIS) of the Police, etc. and is currently involved in developing the Electronic Government Procurement System of Sri Lanka with the Ministry of Finance.
Holds a Bachelor of Science Degree majoring in Biochemistry and Chemistry and Minor in Mathematics from the University of Miami, USA.
Overview Leadership Insights Our Bank Our Strategy Our Performance
Stakeholder Outcomes Accountability Financial Reports Compliance Annexes Supplimentary Information

BANK OF CEYLON | ANNUAL REPORT 2021
20
BOARD OF DIRECTORS
A Chartered fellow of the British Computer Society.
Has published several scientific papers and authored several books and is honoured as an ICT pioneer of Sri Lanka by ICTA,LK Domain Registry and ISOC Sri Lanka Chapter.
Other appointments: COO/CTO of Theekshana (Affiliated
Company of the University of Computing (UCSC)).
Founding Director of LK Domain Registry.
Member of Consultative Committee, Sinhala Dictionary Compilation Institute.
Chairman of the newly regrouped Local Language Working Group under ICTA.
Previous appointments: Served on the Board of Directors of Lanka
Government Information Infrastructure Limited.
Has served as an ICT Consultant to the Telecommunications Regulatory Commission of Sri Lanka.
Has served as a Head/Consultant to the UCSC/Software.
Has served as an ICT Consultant to the Presidential Secretariat.
Mr A C Manilka FernandoIndependent Non-Executive Director
Date of appointment21 April 2020
Skills and experience: A Banking, Strategy, Accounting and
Finance professional with over 40 years experience in Sri Lanka and overseas organisations.
Consulting/advisory services for projects in strategic planning, restructuring and organisational development at a range of organisations including Commercial Banks and Non-Bank Financial Institutions.
A Fellow Member of the Institute of Chartered Accountants of Sri Lanka.
Undergone special training at Harvard University and INSEAD.
Holds a MBA degree from the University of Georgia, USA.
Other appointments: Non-Executive Director of Softlogic
Finance PLC.
Previous appointments: Senior management positions in the
financial services sector at Citibank, Mashreq Bank (Dubai, UAE), NDB Bank and Al Rajhi Bank (Riyadh, Saudi Arabia).
Has been a Director of several other companies in the private sector.
Visiting Lecturer at the Institute of Chartered Accountants, University of Colombo and other institutions.
Major General (Rtd.) G A ChandrasiriIndependent Non-Executive Director
Date of appointment08 January 2021
Skills and experience: Experience in public sector processes and
regulations through leadership positions in the public sector.
A Graduate from the National Defense College, India and Defence Services Command and Staff College, Bangladesh.
Special recognitions awarded include the Rana Wickram Padakkama (RWP), Vishishta Sewa Vibushanaya (VSV) and Uththama Sewa Padakkama (USP).
Other appointments: Chairman of Airport and Aviation Services
(Sri Lanka) (Private) Limited.
Previous appointments: Illustrious military career of 35 years,
holding a number of key command and staff appointments in the Sri Lanka Army including;
• Chief of Staff of the Sri Lanka Army (2nd in Command of the Army).
• Major General Sri Lanka Army.
• Principal Staff Officer at the Joint Operations Command Headquarters and Regimental Commander of the Sri Lanka Army Special Forces and Sri Lanka Armoured Corps.
• Commander of the Security Forces Headquarters, Jaffna.
• Military Security Co-ordinator to HE the President.
• Competent Authority for the resettlement of Internally Displaced People in the Northern Province in the aftermath of war.
Governor of the Northern Province.
Mr Jayampathy MolligodaIndependent Non-Executive Director
Date of appointment18 February 2021
Skills and experience: Over 40 years of executive experience
in the fields of Finance Management, Strategic Planning and Human Resource Development, Plantation Management and International Marketing of Tea.
A Fellow Member of the Institute of Chartered Accountants of Sri Lanka.
Holds a MBA from the Postgraduate Institute of Management.
Successfully completed an Executive Strategy Programme at Victoria University, Melbourne, Australia.
BANK OF CEYLON | ANNUAL REPORT 2021
21
He was conferred the “Professional Excellence Awards 2014” at the CMA National Management Accounting Conference held in June, 2014.
Other appointments: Chairman, Sri Lanka Tea Board.
Council Member of the Institute of Chartered Accountants of Sri Lanka.
Director Metropolitan Resource Holdings Limited.
Previous appointments: Executive Deputy Chairman/CEO at
Bogawantalawa Tea Estates PLC.
Chairman, Independent Audit Committee of Finlay Teas, Colombo.
Chief Accountant, Janatha Estates Development Board.
Senior Finance Manager at Associated Newspapers of Ceylon Limited.
Director, Peoples’s Bank.
Director, Udapussellawa Plantation PLC.
Director, Hapugastenne Plantation PLC.
Accountant, Ceylon Plywoods Corporation.
Ms Janaki Senanayake SiriwardaneSecretary, Bank of Ceylon/ Secretary to the Board
Profile is given on page 24.
Overview Leadership Insights Our Bank Our Strategy Our Performance
Stakeholder Outcomes Accountability Financial Reports Compliance Annexes Supplimentary Information

BANK OF CEYLON | ANNUAL REPORT 2021
CORPORATE MANAGEMENT
Ms Janaki Senanayake Siriwardane, Mr W P Russel Fonseka
Mr G A Jayashantha, Mr M R N Rohana Kumara, Mr Y A Jayathilaka, Mr K A D Wijayawardane, Mr R M N Jeewantha, Mr M P Ruwan Kumara, Mr Nilantha Meneripitiyage, Mr S Sivanjan
Seated left to right
Standing left to right
22

BANK OF CEYLON | ANNUAL REPORT 2021
Mr K E D Sumanasiri, Ms W B P Rathnayake
Mr P M Liyanage, Mr D S Muthukudaarachchi, Mr H Priyal Silva, Mr B K Gurusinghe, Mr K A A Karunaratne, Mr A R F John Pulle, Mr Sameera D Liyanage
Seated left to right
Standing left to right
23
Overview Leadership Insights Our Bank Our Strategy Our Performance
Stakeholder Outcomes Accountability Financial Reports Compliance Annexes Supplimentary Information
BANK OF CEYLON | ANNUAL REPORT 2021
24
CORPORATE MANAGEMENT
Mr K E D SumanasiriGeneral Manager
(Appointed as the General Manager in August 2021)
Skills and Experience Counts over 31 years of multi-disciplinary
experience within the Bank with expertise in credit and people management. During his career at the Bank, he has served in areas of Retail Banking, Micro Finance, Corporate Finance, Recoveries, Learning and Development and Human Resource Management.
BSc (Honours) Degree in Business Administration (University of Sri Jayewardenepura), Management Development Programme for Key Management Personnel (Postgraduate Institute of Management), Special Management Course of higher Management and Public Policy for Business Leadership (Postgraduate Institute of Management), Training programme offered by the Harvard Business School of USA, Associate Member of the Institute of Bankers of Sri Lanka and Chartered Institute of Personnel Management Sri Lanka.
Mr W P Russel FonsekaAdditional General Manager/ Chief Financial Officer
(Appointed to the Corporate Management in March 2012)
Skills and Experience Over 31 years of experience in the Bank
across its local and overseas operations, specialising in financial management, budgets and strategic planning.
Other areas of experience includes Retail Banking, International operations, Treasury and Investment and Corporate and Offshore Banking
BSc (Special) Degree in Business Administration (University of Sri Jayewardenepura), MBA (University of Southern Queensland, Australia) Advanced Management Programme at the Harvard Business School, USA, Fellow member of the Institute of Chartered Accountants of Sri Lanka and a Senior Fellow Member of the Institute of Bankers of Sri Lanka.
Ms Janaki Senanayake SiriwardaneSecretary, Bank of Ceylon/Secretary to the Board
(Appointed to the Corporate Management in October 2010)
Skills and Experience An Attorney-at-Law by profession
with a LLB.
Over 25 years of experience in the Bank in Company Secretarial and Corporate Governance.
MBA (Merit) from the University of Colombo.
Mr D S MuthukudaarachchiDeputy General Manager (Recovery Corporate)
(Appointed to the Corporate Management in February 2020)
Skills and Experience Over 31 years of experience in diverse
aspects of the banking operations.
Wide experience in Retail and Corporate Banking specialising in credit management, credit risk and Overseas Branch operations.
BSc (Special) Degree in Estate Management and Valuation (University of Sri Jayewardhenepura)
Mr Y A JayathilakaDeputy General Manager (Branch Credit Operations - Range II)
(Appointed to the Corporate Management in February 2020)
Skills and Experience Counts over 24 years of experience in
multi-disciplinary roles in Retail Banking, Treasury and Overseas operations, Project Management, Products and Process Development, Credit and Recoveries.
Has been involved in the implementation of major IT projects of the Bank such as Core Banking system and Trade Finance systems in BOC UK Ltd, Core Banking and Teller system upgrade, DMS and Workflow Automation System and several other customer-facing digital offerings in the Bank.
BSc (Special) Degree in Business Administration (University of Sri Jayewardenepura), Master of Business (Finance) Degree (University of Kelaniya), Diploma in Banking and Finance, Associate of the Institute of Bankers of Sri Lanka and Advanced Course in Strategic Management from the Postgraduate Institute of Management (University of Sri Jayewardenepura).
Mr H Priyal Silva Deputy General Manager (Corporate and Offshore Banking)
(Appointed to the Corporate Management in February 2020)
Skills and Experience Counts over 24 years of extensive
experience in various aspects of banking specialising in Corporate, Retail and Development Banking, International and Treasury Operations and Branch Operations including Sales and Marketing.

BANK OF CEYLON | ANNUAL REPORT 2021
25
BBA Second Class (Upper Division) Degree (Specialised in Marketing) (University of Ruhuna), MBA in Accountancy (University of Kelaniya), Postgraduate Diploma in Business Administration and Postgraduate Diploma in Professional Marketing in Chartered Institute of Marketing UK and Associate Member of Institute of Bankers of Sri Lanka.
Mr G A JayashanthaChief Risk Officer
(Appointed to the Corporate Management in September 2020)
Skills and Experience Over 24 years of experience in the Bank.
Specialised skills in Retail Credit, SME, Treasury Operations and Assets and Liability Management, Risk Management and Corporate Credit including Offshore Operations
BSc (Special) Degree in Business Administration (University of Sri Jayewardenepura), MA in Financial Economics (University of Colombo), Diploma in Credit Management (Institute of Bankers of Sri Lanka), Associate Member of Institute of Bankers of Sri Lanka.
Ms W B P RathnayakeDeputy General Manager (Compliance)
(Appointed to the Corporate Management in September 2020)
Skills and Experience Experience in all aspects of commercial
banking with local and international exposure during her career spanning over 24 years.
Expertise in corporate and retail credit and risk management and was instrumental in developing risk management policies and tools for the Bank.
BSc (Special) Degree in Agriculture (University of Ruhuna), MBA (Open University of Sri Lanka), Postgraduate Diploma in Bank Management (The Institute of Bankers of Sri Lanka) and Associate Member of the Institute of Bankers of Sri Lanka.
Mr R M N JeewanthaDeputy General Manager
(International, Treasury and Investment)
(Appointed to the Corporate Management in September 2020)
Skills and Experience Over 19 years of Banking experience
in the areas of Treasury Management, Investment Banking, Financial Management, Credit Management and Retail Banking.
BSc (Special) Degree in Accountancy (University of Sri Jayewardenepura), MBA from the Postgraduate Institute of Management (PIM), Member of the Institute of Certified Professional Managers of Sri Lanka (ACPM) and Associate Member of the Institute of Bankers of Sri Lanka.
Mr M P Ruwan KumaraDeputy General Manager (Finance and Planning)
(Appointed to the Corporate Management in September 2020)
Skills and Experience Over 19 years of experience in banking
specialising in Financial Management, Strategic Planning, Investment Banking, Commercial and Overseas Banking operations.
BSc (Special) Degree in Accountancy (University of Sri Jayewardenepura), Commonwealth Executive MBA (CEMBA) (Open University of Sri Lanka), Fellow Member of the Institute of Chartered Accountants of Sri Lanka, Associate Member of Certified Management Accountants of Sri Lanka, Associate Member of the Institute of Bankers of Sri Lanka and Member of the Sri Lanka Institute of Directors (SLID).
Mr S SivanjanDeputy General Manager (Branch Credit Operations Range I)
(Appointed to the Corporate Management in September 2020)
Skills and Experience Over 19 years of banking experience in
retail branch operations, credit, recovery, development banking, microfinance and overseas operations
BSc First Class Honors Degree in Science (University of Jaffna) and MBA (University of Colombo) specialising in Marketing
Mr B K GurusingheChief Legal Officer
(Appointed to the Corporate Management in September 2020)
Skills and Experience Attorney-at-law from the Sri Lanka Law
College
Over 24 years of experience as a banking professional, with expertise in corporate banking, retail banking, credit and organisational transformation.
BSc (Special) Degree in Business Administration (University of Sri Jayewardenepura), Commonwealth Executive MBA (CEMBA) (Open University of Sri Lanka), Postgraduate Diploma in Business and Financial Administration (PgDBM) from the Institute of Chartered Accountants of Sri Lanka, Membership in several organisations such as the Institute of Bankers of Sri Lanka and the Sri Lanka Bar Association.
Overview Leadership Insights Our Bank Our Strategy Our Performance
Stakeholder Outcomes Accountability Financial Reports Compliance Annexes Supplimentary Information

BANK OF CEYLON | ANNUAL REPORT 2021
26
CORPORATE MANAGEMENT
Mr M R N Rohana KumaraDeputy General Manager (Recovery provinces, Business Revival and Rehabilitation)
(Appointed to the Corporate Management in January 2021)
Skills and Experience Over 19 years of experience in the Bank
including executive leadership roles in recovery, retail credit and project finance.
Contributed towards enhancing organisation-wide credit skills through his role as a resource person of the Bank’s Central Training Institute.
BSc First Class Degree in Mathematics (University of Kelaniya), Diploma in Leadership (Northern Illinois University, USA) and Associate Member of the Institute of Bankers of Sri Lanka.
Mr A R F John PulleDeputy General Manager (Support Services)
(Appointed to the Corporate Management in July 2021)
Skills and Experience Over 30 years of experience in all aspects
of commercial banking, specialising in Treasury Management, Retail Banking, Risk Management and Overseas Banking operations. He has also served as the Head of Treasury in Bank of Ceylon, Chennai and as the Chief Executive Officer of Bank of Ceylon(UK) Ltd in London.
B.Ph First Class Degree in Philosophy from the Universita’ Pontificia Salesiana, Italy and an Associate Member of the Institute of Bankers of Sri Lanka.
Mr Nilantha MeneripitiyageDeputy General Manager (Branch Operations and Development Banking)
(Appointed to the Corporate Management in July 2021)
Skills and Experience Career banker with over 29 years’
experience in both local and overseas operations in areas such as corporate banking, retail banking, risk management, credit card operations, treasury operations and information technology.
Has served as the Chief Executive Officer/Executive Director of Bank of Ceylon (UK) Ltd., and Assistant General Manager (Risk Management). His experience includes the handling of large-scale businesses and government sector infrastructure projects.
BSc (Management) Hons (Special) Degree and a Master of Science (Management) degree from the University of Sri Jayewardenapura, Diploma in Banking and Finance, Associate of the Institute of Bankers Sri Lanka .
Served as a visiting lecturer affiliated to the Post Graduate Studies Department of the University of Moratuwa, The Institute of Bankers of Sri Lanka, Export Development Board and the Central Training Institute of the Bank of Ceylon.
Mr K A D WijayawardaneDeputy General Manager (Human Resources)
(Appointed to the Corporate Management in October 2021)
Skills and Experience Over 19 years of experience in the
Bank specialising in Branch Banking, executive leadership in Human Resource Operations, Credit and Retail Banking.
BSc (General) Second Class (Upper Division) Honours Degree (University of Kelaniya), Postgraduate Diploma in Business Management (University of Wayamba), Diploma in Banking and Finance from the Institute of Bankers of Sri Lanka and Life Member of the Association of Professional Bankers (APB), Sri Lanka
Mr P M LiyanageChief Internal Auditor
(Appointed to the Corporate Management in December 2014)
Skills and Experience A finance professional with over 22 years
of experience in banking and finance
BSc (Special) Degree in Accountancy and Finance (University of Sri Jayewardenepura), Fellow member of the Institute of Chartered Accountants of Sri Lanka and Member of Certified Information Systems Auditors (CISA) of ISACA – USA.

BANK OF CEYLON | ANNUAL REPORT 2021
27
Mr Sameera D LiyanageChief Marketing Officer
(Appointed to the Corporate Management in August 2020)
Skills and Experience Over 23 years of professional expertise in
banking and marketing across both public and private sector institutions.
Awarded the Chartered Marketer status in 2015 by the Chartered Institute of Marketing (UK).
Postgraduate Diploma in Marketing from the CIM UK, Member of the CIM UK, SLIM and Association of Professional Bankers Sri Lanka.
Mr K A Ajith KarunarathneDeputy General Manager (Designated)
(Appointed to the Corporate Management in December 2021)
Skills and Experience Over 19 years of experience in the
Bank specialising in the areas of Branch Banking, Trade Finance, Corporate and Premier banking operations.
Multi-disciplinary experience in Retail Banking and executive leadership roles in multiple provinces with responsibility for Business promotion, Administration and Human Resource.
BSc (Special) Degree in Business Administration (University of Sri Jayewardenepura), Master of Business Administration (Wayamba University of Sri Lanka), Member of AAT and Associate Member of the Institute of Bankers of Sri Lanka.
Overview Leadership Insights Our Bank Our Strategy Our Performance
Stakeholder Outcomes Accountability Financial Reports Compliance Annexes Supplimentary Information

BANK OF CEYLON | ANNUAL REPORT 2021
28
EXECUTIVE MANAGEMENT
Mr M D A Karunaratne Assistant General Manager - IT (Application Systems)
Mr K G C Deepal Assistant General Manager - Information Systems Audit
Ms M M R P Fernando Assistant General Manager - Trade Services
Mr G K G Mahinda Bandara Assistant General Manager - North Central Province
Ms P P M Wijesekara Assistant General Manager - Credit Audit
Mr I S N Perera Assistant General Manager - Accounting and Tax
Ms D R C S Udayakumari Assistant General Manager - Branch Operations
Ms A M R D Subasinghe Assistant General Manager - Recovery Provinces
Ms J Gnanasambanthan Assistant General Manager - Treasury Back Office
Ms S P C K Fernando Assistant General Manager - Corporate Credit
Mr W M A Wanigasekera Assistant General Manager - Eastern Province
Ms T Perera Assistant General Manager - Training and Development
Ms R M M Weerasekera Assistant General Manager - Branch Credit (Range I)
Ms Zeena Ruwais Assistant General Manager - Budget, Strategic Planning and MIS
Ms P M Withana Arachchi Assistant General Manager - Support Services
Ms K P Mallika Assistant General Manager - Digital Products Promotion

BANK OF CEYLON | ANNUAL REPORT 2021
29
Mr D A S S Wimalasiri Assistant General Manager - Consumer and Development Banking
Mr S Aruna Kumara Chief Executive Officer Bank of Ceylon (UK) Limited
Mr S K Wickramasinghe Assistant General Manager - Pettah Branch
Ms N N Nishanadee Deputy Chief Legal Officer (Credit)
Ms K K I C K Kannangara Assistant General Manager - Recovery Corporate
Ms S H M M P Herath Assistant General Manager - Offshore Banking
Ms C P C Abeyratne Assistant General Manager - IT (Operations/Technical Support)
Mr A R Mallikarachchi Assistant General Manager - Administrative Services
Ms K J Yogaratnam Country Manager - Chennai
Mr M T S A Perera Assistant General Manager - Product Development and Business Process Re-Engineering Project
Ms N W J S P Nanayakkara Deputy Chief Legal Officer (Recovery)
Mr S B A M G S Arampath Country Manager - Malé
Ms H M M D Herath Assistant General Manager - Overseas Branches
Ms S Pirapaharan Assistant General Manager - Investment Banking
Ms J M P W Tilakaratna Deputy Chief Legal Officer (International, HR and General Operations)
Mr S P K Liyanage Assistant General Manager - Western Province North
Overview Leadership Insights Our Bank Our Strategy Our Performance
Stakeholder Outcomes Accountability Financial Reports Compliance Annexes Supplimentary Information

BANK OF CEYLON | ANNUAL REPORT 2021
30
EXECUTIVE MANAGEMENT
Mr S W M S Wijesinghe Assistant General Manager - Central Province
Mr W M N D Dayawansa Assistant General Manager - Sabaragamuwa Province
Mr A W R Thushantha Assistant General Manager - Treasury
Mr J K D Dharmapala Assistant General Manager - Metropolitan Branch
Mr V Sivananthan Assistant General Manager - Northern Province
Mr D M A Madhawa Assistant General Manager - Corporate Relations
Ms W K L B N Samanthie Assistant General Manager - Western Province South
Mr M M E I Bandara Assistant General Manager - Electronic Banking Centre
Mr A T Hettiarachchi Assistant General Manager - Marketing
Mr R M Samarakkody Assistant General Manager - Investigations
Ms K Deepa Kumari Assistant General Manager - Risk Management
Ms S S T Kulasekera Assistant General Manager - Project Finance

BANK OF CEYLON | ANNUAL REPORT 2021
31
Mr I K Nawaratne Assistant General Manager - Uva Province
Ms T S Senanayake Assistant General Manager - Province and Branch Audit
Ms W A G L Weerakkody Assistant General Manager - Branch Credit (Range II)
Ms N R D N Perera Assistant General Manager - North Western Province
Mr I U K D Wijegunawardena Country Manager - Seychelles
Mr H K Rajapakse Assistant General Manager - IT (Delivery Channels)
Mr N Krishnakumar Assistant General Manager - Business Revival and Rehabilitation
Ms P Chandradeva Assistant General Manager - IT (Security and Compliance)
Mr R P D R R Ruwanpathirana Assistant General Manager - International
Ms M A D P Dias Assistant General Manager - Human Resource Operations
Overview Leadership Insights Our Bank Our Strategy Our Performance
Stakeholder Outcomes Accountability Financial Reports Compliance Annexes Supplimentary Information

32
VALUE CREATION MODEL
FINANCIAL CAPITAL
MANUFACTURED CAPITAL
SOCIAL AND RELATIONSHIP CAPITAL
INTELLECTUAL CAPITAL
NATURAL CAPITAL
HUMAN CAPITAL
Shareholder’s funds
Customer contact points
Customers
Correspondent relationships
Investment on Digital infrastructure
Brand value
Energy consumption
Water consumption
Land space utilised by the Bank
Employees
Deposits
Branch on wheels
Registered suppliers and service providers
Investment in training and development
Borrowings
LKR 200.8 billion
2,071
14.4 million
801
LKR 884.0 million
LKR 53.9 billion
193.1 TJ 696,304.3 m3
951,864 Sq.ft
8,337
LKR 2,866.9 billion
10
484
LKR 64.1 million
LKR 688.6 billion
Sri Lanka’s strongest financial services brand
Wider range of product brands
CAPITAL INPUTS
KEY BUSINESS ACTIVITIES
Extending credit to individuals, SMEs, Corporates, Government and SoEs
Source funding from customers and fund providers
Fund and forex management
Transactional banking and trade services
Investment in diverse portfolios
Advisory services
Trustee and custodian services
DELIVERED THROUGH OUR BUSINESS CLUSTERS
Retail Banking
Corporate and Offshore Banking
International, Treasury, Investment and Overseas Operations
(Page 60)
(Page 58)
(Page 56)
STRATEGIC PILLARS
VALUE TRANSFORMATION
Stakeholder Engagement Corporate Governance
Resource Allocation Risk Management
(Pages 62-80) (Page 82)
(Page 44) (Page 99)
VISIONTo be the Nation’s preferred bank
with a strong global presence providing customer centric,
innovative financial solutions
Building a High-Performing Team
Stability, Governance and Sustainable Growth
Customer Centricity
Digital Excellence
UNDERPINNED BY
DRIVERS OF CHANGE MACRO-ECONOMIC AND POLICY DEVELOPMENTS DIGITAL DISRUPTION DEMOGRAPHIC CHANGES
Rewarding Credit Culture and Healthy Credit Portfolio
BANK OF CEYLON | ANNUAL REPORT 2021
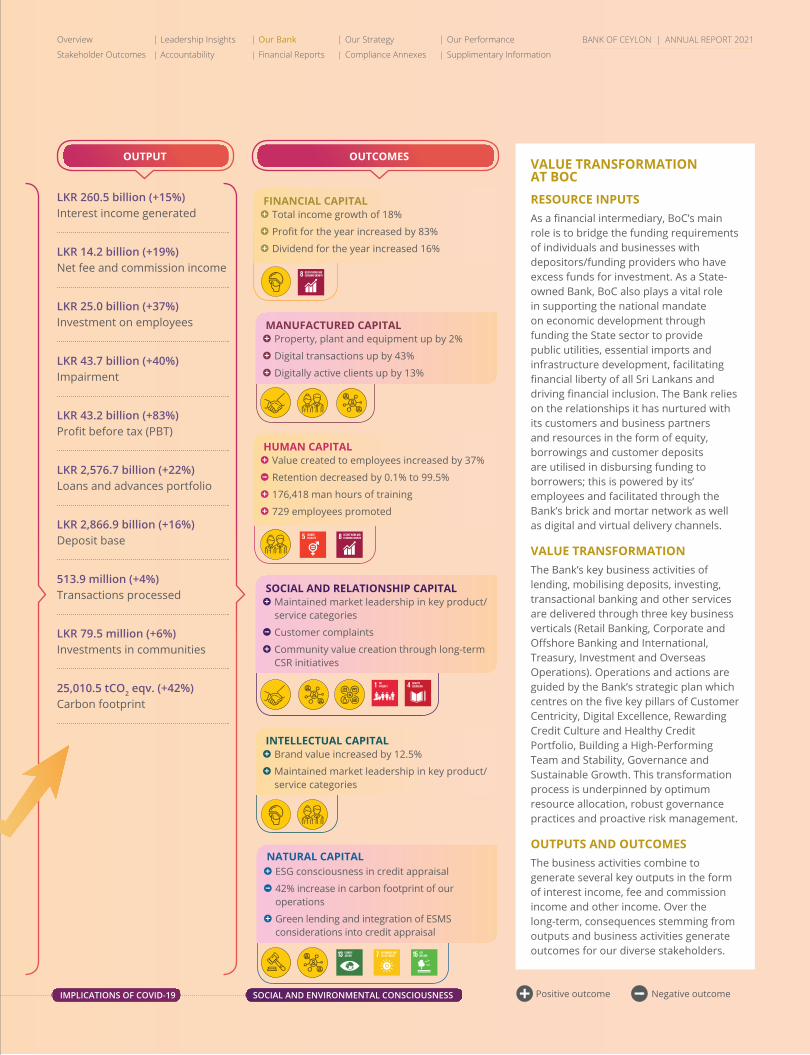
33
OUTPUT OUTCOMES
IMPLICATIONS OF COVID-19 SOCIAL AND ENVIRONMENTAL CONSCIOUSNESS Positive outcome Negative outcome
VALUE TRANSFORMATION AT BOCRESOURCE INPUTSAs a financial intermediary, BoC’s main role is to bridge the funding requirements of individuals and businesses with depositors/funding providers who have excess funds for investment. As a State-owned Bank, BoC also plays a vital role in supporting the national mandate on economic development through funding the State sector to provide public utilities, essential imports and infrastructure development, facilitating financial liberty of all Sri Lankans and driving financial inclusion. The Bank relies on the relationships it has nurtured with its customers and business partners and resources in the form of equity, borrowings and customer deposits are utilised in disbursing funding to borrowers; this is powered by its’ employees and facilitated through the Bank’s brick and mortar network as well as digital and virtual delivery channels.
VALUE TRANSFORMATIONThe Bank’s key business activities of lending, mobilising deposits, investing, transactional banking and other services are delivered through three key business verticals (Retail Banking, Corporate and Offshore Banking and International, Treasury, Investment and Overseas Operations). Operations and actions are guided by the Bank’s strategic plan which centres on the five key pillars of Customer Centricity, Digital Excellence, Rewarding Credit Culture and Healthy Credit Portfolio, Building a High-Performing Team and Stability, Governance and Sustainable Growth. This transformation process is underpinned by optimum resource allocation, robust governance practices and proactive risk management.
OUTPUTS AND OUTCOMESThe business activities combine to generate several key outputs in the form of interest income, fee and commission income and other income. Over the long-term, consequences stemming from outputs and business activities generate outcomes for our diverse stakeholders.
LKR 260.5 billion (+15%)Interest income generated
LKR 14.2 billion (+19%)Net fee and commission income
LKR 25.0 billion (+37%)Investment on employees
LKR 43.7 billion (+40%)Impairment
LKR 43.2 billion (+83%)Profit before tax (PBT)
LKR 2,576.7 billion (+22%)Loans and advances portfolio
LKR 2,866.9 billion (+16%)Deposit base
513.9 million (+4%)Transactions processed
LKR 79.5 million (+6%)Investments in communities
25,010.5 tCO2 eqv. (+42%)Carbon footprint
HUMAN CAPITAL Value created to employees increased by 37%
Retention decreased by 0.1% to 99.5%
176,418 man hours of training
729 employees promoted
MANUFACTURED CAPITAL Property, plant and equipment up by 2%
Digital transactions up by 43%
Digitally active clients up by 13%
FINANCIAL CAPITAL Total income growth of 18%
Profit for the year increased by 83%
Dividend for the year increased 16%
SOCIAL AND RELATIONSHIP CAPITAL Maintained market leadership in key product/service categories
Customer complaints
Community value creation through long-term CSR initiatives
INTELLECTUAL CAPITAL Brand value increased by 12.5%
Maintained market leadership in key product/service categories
NATURAL CAPITAL ESG consciousness in credit appraisal
42% increase in carbon footprint of our operations
Green lending and integration of ESMS considerations into credit appraisal
Overview Leadership Insights Our Bank Our Strategy Our Performance
Stakeholder Outcomes Accountability Financial Reports Compliance Annexes Supplimentary Information
BANK OF CEYLON | ANNUAL REPORT 2021
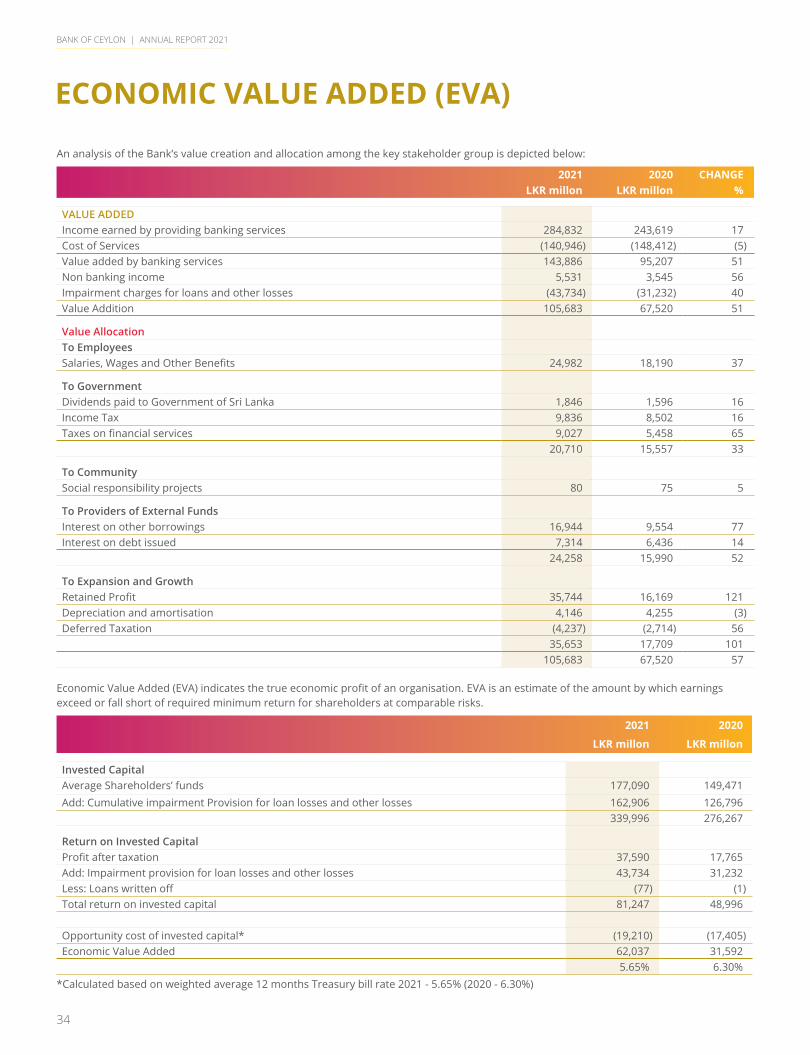
BANK OF CEYLON | ANNUAL REPORT 2021
34
ECONOMIC VALUE ADDED (EVA)
An analysis of the Bank’s value creation and allocation among the key stakeholder group is depicted below:
2021 2020 CHANGELKR millon LKR millon %
VALUE ADDEDIncome earned by providing banking services 284,832 243,619 17 Cost of Services (140,946) (148,412) (5)Value added by banking services 143,886 95,207 51 Non banking income 5,531 3,545 56 Impairment charges for loans and other losses (43,734) (31,232) 40 Value Addition 105,683 67,520 51
Value AllocationTo EmployeesSalaries, Wages and Other Benefits 24,982 18,190 37
To GovernmentDividends paid to Government of Sri Lanka 1,846 1,596 16 Income Tax 9,836 8,502 16 Taxes on financial services 9,027 5,458 65
20,710 15,557 33
To CommunitySocial responsibility projects 80 75 5
To Providers of External FundsInterest on other borrowings 16,944 9,554 77 Interest on debt issued 7,314 6,436 14
24,258 15,990 52
To Expansion and GrowthRetained Profit 35,744 16,169 121 Depreciation and amortisation 4,146 4,255 (3)Deferred Taxation (4,237) (2,714) 56
35,653 17,709 101 105,683 67,520 57
Economic Value Added (EVA) indicates the true economic profit of an organisation. EVA is an estimate of the amount by which earnings exceed or fall short of required minimum return for shareholders at comparable risks.
2021 2020
LKR millon LKR millon
Invested CapitalAverage Shareholders’ funds 177,090 149,471 Add: Cumulative impairment Provision for loan losses and other losses 162,906 126,796
339,996 276,267
Return on Invested CapitalProfit after taxation 37,590 17,765 Add: Impairment provision for loan losses and other losses 43,734 31,232 Less: Loans written off (77) (1)Total return on invested capital 81,247 48,996
Opportunity cost of invested capital* (19,210) (17,405)Economic Value Added 62,037 31,592
5.65% 6.30%*Calculated based on weighted average 12 months Treasury bill rate 2021 - 5.65% (2020 - 6.30%)
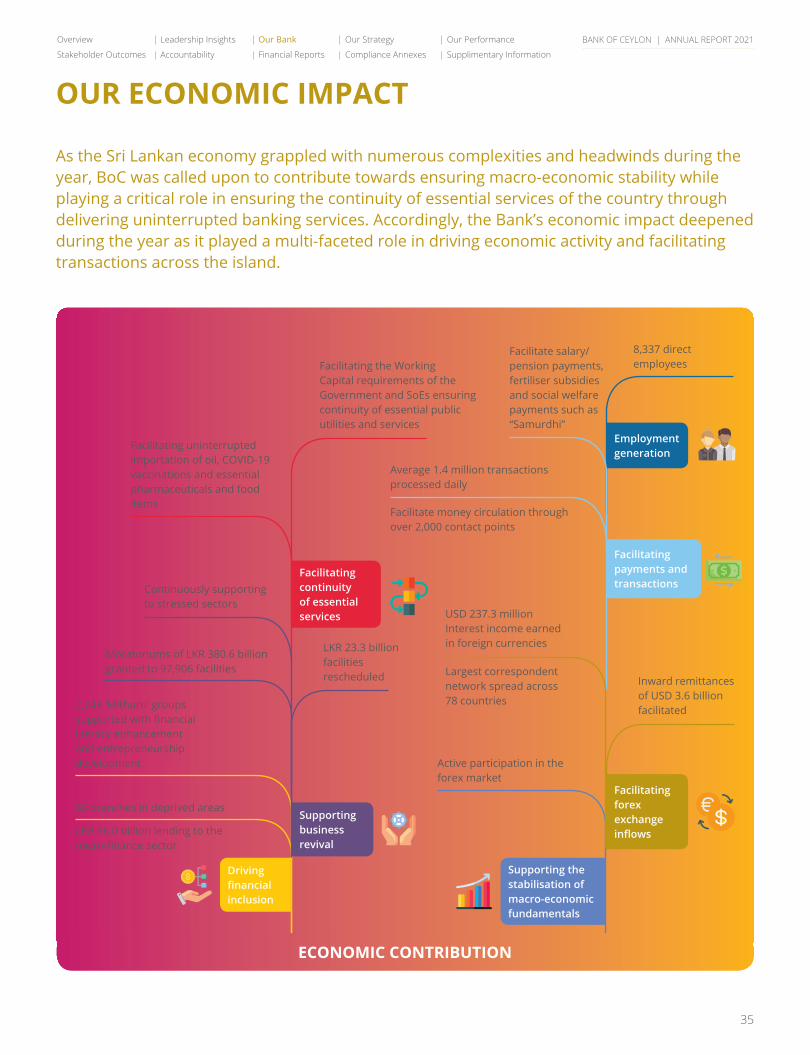
BANK OF CEYLON | ANNUAL REPORT 2021
35
OUR ECONOMIC IMPACT
As the Sri Lankan economy grappled with numerous complexities and headwinds during the year, BoC was called upon to contribute towards ensuring macro-economic stability while playing a critical role in ensuring the continuity of essential services of the country through delivering uninterrupted banking services. Accordingly, the Bank’s economic impact deepened during the year as it played a multi-faceted role in driving economic activity and facilitating transactions across the island.
Driving financial inclusion
Supporting the stabilisation of macro-economic fundamentals
Supporting business revival
Facilitating forex exchange inflows
Facilitating continuity of essential services
Employment generation
2,243 ‘Mithuru’ groups supported with financial literacy enhancement and entrepreneurship development Active participation in the
forex market
LKR 16.0 billion lending to the micro-finance sector
55 branches in deprived areas
USD 237.3 million Interest income earned in foreign currencies
Largest correspondent network spread across 78 countries
8,337 direct employees
Facilitating uninterrupted importation of oil, COVID-19 vaccinations and essential pharmaceuticals and food items
Average 1.4 million transactions processed daily
Facilitate money circulation through over 2,000 contact points
Facilitating the Working Capital requirements of the Government and SoEs ensuring continuity of essential public utilities and services
Facilitate salary/pension payments, fertiliser subsidies and social welfare payments such as “Samurdhi”
Inward remittances of USD 3.6 billion facilitated
Continuously supporting to stressed sectors
Moratoriums of LKR 380.6 billion granted to 97,906 facilities
LKR 23.3 billion facilities rescheduled
ECONOMIC CONTRIBUTION
Facilitating payments and transactions
Overview Leadership Insights Our Bank Our Strategy Our Performance
Stakeholder Outcomes Accountability Financial Reports Compliance Annexes Supplimentary Information
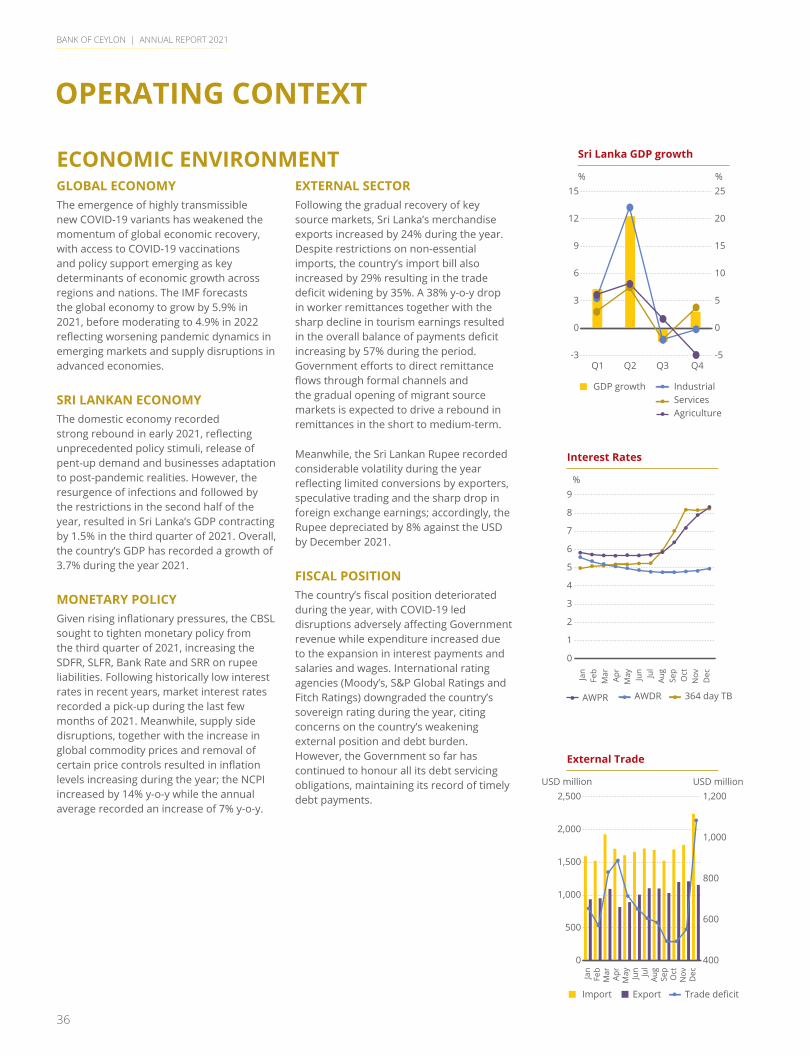
BANK OF CEYLON | ANNUAL REPORT 2021
36
OPERATING CONTEXT
ECONOMIC ENVIRONMENTGLOBAL ECONOMYThe emergence of highly transmissible new COVID-19 variants has weakened the momentum of global economic recovery, with access to COVID-19 vaccinations and policy support emerging as key determinants of economic growth across regions and nations. The IMF forecasts the global economy to grow by 5.9% in 2021, before moderating to 4.9% in 2022 reflecting worsening pandemic dynamics in emerging markets and supply disruptions in advanced economies.
SRI LANKAN ECONOMYThe domestic economy recorded strong rebound in early 2021, reflecting unprecedented policy stimuli, release of pent-up demand and businesses adaptation to post-pandemic realities. However, the resurgence of infections and followed by the restrictions in the second half of the year, resulted in Sri Lanka’s GDP contracting by 1.5% in the third quarter of 2021. Overall, the country’s GDP has recorded a growth of 3.7% during the year 2021.
MONETARY POLICYGiven rising inflationary pressures, the CBSL sought to tighten monetary policy from the third quarter of 2021, increasing the SDFR, SLFR, Bank Rate and SRR on rupee liabilities. Following historically low interest rates in recent years, market interest rates recorded a pick-up during the last few months of 2021. Meanwhile, supply side disruptions, together with the increase in global commodity prices and removal of certain price controls resulted in inflation levels increasing during the year; the NCPI increased by 14% y-o-y while the annual average recorded an increase of 7% y-o-y.
EXTERNAL SECTORFollowing the gradual recovery of key source markets, Sri Lanka’s merchandise exports increased by 24% during the year. Despite restrictions on non-essential imports, the country’s import bill also increased by 29% resulting in the trade deficit widening by 35%. A 38% y-o-y drop in worker remittances together with the sharp decline in tourism earnings resulted in the overall balance of payments deficit increasing by 57% during the period. Government efforts to direct remittance flows through formal channels and the gradual opening of migrant source markets is expected to drive a rebound in remittances in the short to medium-term.
Meanwhile, the Sri Lankan Rupee recorded considerable volatility during the year reflecting limited conversions by exporters, speculative trading and the sharp drop in foreign exchange earnings; accordingly, the Rupee depreciated by 8% against the USD by December 2021.
FISCAL POSITIONThe country’s fiscal position deteriorated during the year, with COVID-19 led disruptions adversely affecting Government revenue while expenditure increased due to the expansion in interest payments and salaries and wages. International rating agencies (Moody’s, S&P Global Ratings and Fitch Ratings) downgraded the country’s sovereign rating during the year, citing concerns on the country’s weakening external position and debt burden. However, the Government so far has continued to honour all its debt servicing obligations, maintaining its record of timely debt payments.
Sri Lanka GDP growth
-3
0
3
6
9
12
15
Q2 Q3 Q4Q1
% %
GDP growth
-5
0
5
10
15
20
25
IndustrialServicesAgriculture
Interest Rates
%
AWPR
0
1
2
3
4
5
6
7
8
9
Jan
Feb
Mar
Apr
May Jun Jul
Aug
Sep
Oct
Nov
Dec
AWDR 364 day TB
External Trade
0
500
1,000
1,500
2,000
2,500USD million USD million
Import
400
600
800
1,000
1,200
Jan
Feb
Mar
Apr
May Jun Jul
Aug
Sep
Oct
Nov
Dec
Export Trade deficit
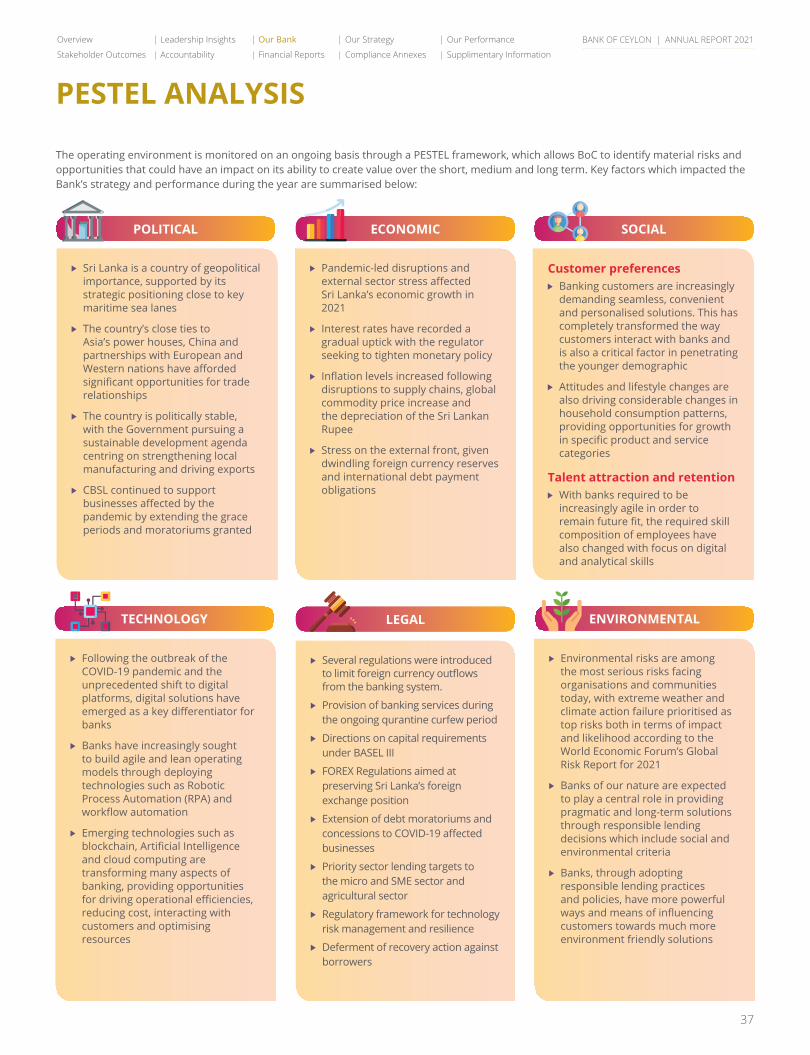
BANK OF CEYLON | ANNUAL REPORT 2021
37
PESTEL ANALYSIS
The operating environment is monitored on an ongoing basis through a PESTEL framework, which allows BoC to identify material risks and opportunities that could have an impact on its ability to create value over the short, medium and long term. Key factors which impacted the Bank’s strategy and performance during the year are summarised below:
Pandemic-led disruptions and external sector stress affected Sri Lanka’s economic growth in 2021
Interest rates have recorded a gradual uptick with the regulator seeking to tighten monetary policy
Inflation levels increased following disruptions to supply chains, global commodity price increase and the depreciation of the Sri Lankan Rupee
Stress on the external front, given dwindling foreign currency reserves and international debt payment obligations
Sri Lanka is a country of geopolitical importance, supported by its strategic positioning close to key maritime sea lanes
The country’s close ties to Asia’s power houses, China and partnerships with European and Western nations have afforded significant opportunities for trade relationships
The country is politically stable, with the Government pursuing a sustainable development agenda centring on strengthening local manufacturing and driving exports
CBSL continued to support businesses affected by the pandemic by extending the grace periods and moratoriums granted
Customer preferences Banking customers are increasingly
demanding seamless, convenient and personalised solutions. This has completely transformed the way customers interact with banks and is also a critical factor in penetrating the younger demographic
Attitudes and lifestyle changes are also driving considerable changes in household consumption patterns, providing opportunities for growth in specific product and service categories
Talent attraction and retention With banks required to be
increasingly agile in order to remain future fit, the required skill composition of employees have also changed with focus on digital and analytical skills
POLITICAL ECONOMIC SOCIAL
Several regulations were introduced to limit foreign currency outflows from the banking system.
Provision of banking services during the ongoing qurantine curfew period
Directions on capital requirements under BASEL III
FOREX Regulations aimed at preserving Sri Lanka’s foreign exchange position
Extension of debt moratoriums and concessions to COVID-19 affected businesses
Priority sector lending targets to the micro and SME sector and agricultural sector
Regulatory framework for technology risk management and resilience
Deferment of recovery action against borrowers
Environmental risks are among the most serious risks facing organisations and communities today, with extreme weather and climate action failure prioritised as top risks both in terms of impact and likelihood according to the World Economic Forum’s Global Risk Report for 2021
Banks of our nature are expected to play a central role in providing pragmatic and long-term solutions through responsible lending decisions which include social and environmental criteria
Banks, through adopting responsible lending practices and policies, have more powerful ways and means of influencing customers towards much more environment friendly solutions
Following the outbreak of the COVID-19 pandemic and the unprecedented shift to digital platforms, digital solutions have emerged as a key differentiator for banks
Banks have increasingly sought to build agile and lean operating models through deploying technologies such as Robotic Process Automation (RPA) and workflow automation
Emerging technologies such as blockchain, Artificial Intelligence and cloud computing are transforming many aspects of banking, providing opportunities for driving operational efficiencies, reducing cost, interacting with customers and optimising resources
TECHNOLOGY ENVIRONMENTALLEGAL
Overview Leadership Insights Our Bank Our Strategy Our Performance
Stakeholder Outcomes Accountability Financial Reports Compliance Annexes Supplimentary Information

BANK OF CEYLON | ANNUAL REPORT 2021
38
PESTEL ANALYSIS
IMPACT ON BOC’S STRATEGY AND PERFORMANCE The trends in the operating landscape as described above have direct implications on the Bank’s strategy and performance while presenting both opportunities and risks to its value creation. These implications are summarised below:
Shortage in foreign currency led to inevitable impacts on import volumes, import-related fee and commission income and challenges in funding cross border transactions
Moderating economic conditions could incur pressure on repayment capability, adversely impacting portfolio quality
Rising interest rate is likely to insert pressure on interest margins
Technological developments can drive increased wallet share through offering holistic, seamless solutions
Increased agility and adaptability required to maintain competitive position in the face of technological disruptions
Through adopting sustainable practices BoC can increase access to funding lines targeted towards green lending
Supporting the revival of COVID-19 affected businesses and strengthen customer relationships through debt relief
Growth opportunities in the export sector, aligned with the national agenda
Drive digital literacy across our unmatched customer base
Build an agile and dynamic workforce through appropriate training interventions
Technology driven opportunities for Increased process efficiencies and cost rationalisation
Sharpen competitive edge through transforming the customer experience
Opportunity in integrating sustainability strategy to corporate strategy
Opportunities stemming from changing lifestyles of the people
Risks stemming from exchange rate volatility and shortage in foreign currency
Challenges in attracting foreign funding, given the downgrading of the country’s sovereign rating
Pressure on NIMs and impact on profitability
Technological obsolescence, given the accelerated pace of change in technology
Labour turnover, particularly among the younger demographic
Risks stemming from escalating implications of climate change on agricultural supply chains and outputs
Cyber security threat stemming from significant growth in digitalisation
POTENTIAL IMPACTS
OPPORTUNITIES RISKS
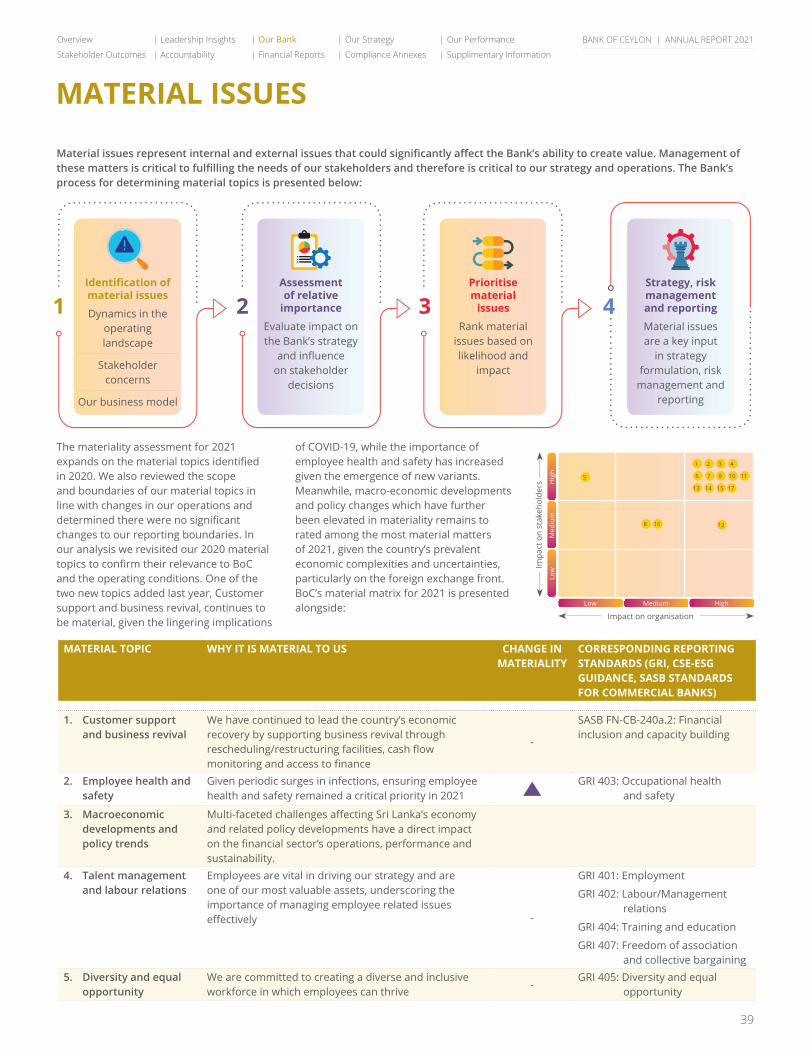
BANK OF CEYLON | ANNUAL REPORT 2021
39
Material issues represent internal and external issues that could significantly affect the Bank’s ability to create value. Management of these matters is critical to fulfilling the needs of our stakeholders and therefore is critical to our strategy and operations. The Bank’s process for determining material topics is presented below:
1 2 3 4Identification of material issues
Dynamics in the operating landscape
Stakeholder concerns
Our business model
Assessment of relative
importance
Evaluate impact on the Bank’s strategy
and influence on stakeholder
decisions
Prioritise material
issues
Rank material issues based on likelihood and
impact
Strategy, risk management and reporting
Material issues are a key input
in strategy formulation, risk
management and reporting
The materiality assessment for 2021 expands on the material topics identified in 2020. We also reviewed the scope and boundaries of our material topics in line with changes in our operations and determined there were no significant changes to our reporting boundaries. In our analysis we revisited our 2020 material topics to confirm their relevance to BoC and the operating conditions. One of the two new topics added last year, Customer support and business revival, continues to be material, given the lingering implications
of COVID-19, while the importance of employee health and safety has increased given the emergence of new variants. Meanwhile, macro-economic developments and policy changes which have further been elevated in materiality remains to rated among the most material matters of 2021, given the country’s prevalent economic complexities and uncertainties, particularly on the foreign exchange front. BoC’s material matrix for 2021 is presented alongside:
Impact on organisation
Impa
ct o
n st
akeh
olde
rs
5
8 16 12
1
9
17
10 11
13 14 15
2 3 4
6 7
Low
Low
Med
ium
Medium
Hig
h
High
MATERIAL TOPIC WHY IT IS MATERIAL TO US CHANGE IN MATERIALITY
CORRESPONDING REPORTING STANDARDS (GRI, CSE-ESG GUIDANCE, SASB STANDARDS FOR COMMERCIAL BANKS)
1. Customer support and business revival
We have continued to lead the country’s economic recovery by supporting business revival through rescheduling/restructuring facilities, cash flow monitoring and access to finance
-
SASB FN-CB-240a.2: Financial inclusion and capacity building
2. Employee health and safety
Given periodic surges in infections, ensuring employee health and safety remained a critical priority in 2021
GRI 403: Occupational health and safety
3. Macroeconomic developments and policy trends
Multi-faceted challenges affecting Sri Lanka’s economy and related policy developments have a direct impact on the financial sector’s operations, performance and sustainability.
4. Talent management and labour relations
Employees are vital in driving our strategy and are one of our most valuable assets, underscoring the importance of managing employee related issues effectively -
GRI 401: Employment
GRI 402: Labour/Management relations
GRI 404: Training and education
GRI 407: Freedom of association and collective bargaining
5. Diversity and equal opportunity
We are committed to creating a diverse and inclusive workforce in which employees can thrive
-GRI 405: Diversity and equal opportunity
MATERIAL ISSUES
Overview Leadership Insights Our Bank Our Strategy Our Performance
Stakeholder Outcomes Accountability Financial Reports Compliance Annexes Supplimentary Information

BANK OF CEYLON | ANNUAL REPORT 2021
40
MATERIAL ISSUES
MATERIAL TOPIC WHY IT IS MATERIAL TO US CHANGE IN MATERIALITY
CORRESPONDING REPORTING STANDARDS (GRI, CSE-ESG GUIDANCE, SASB STANDARDS FOR COMMERCIAL BANKS)
6. Customer experience Customer service has emerged as the key differentiator in the intensely competitive banking sector of Sri Lanka
-
7. Customer privacy and data security
Increased thrust towards digitalisation has heightened vulnerability to customer privacy and security issues, thereby requiring organisations to strengthen IT security frameworks
-
GRI 418: Customer privacy
SASB FN-CB-230a.2: Data security
8. Responsible banking Responsible lending practices underpin BoC’s ability to drive impactful socio-economic change
-GRI 417: Marketing and labelling
9. Financial performance
Critical in ensuring our commercial sustainability and continued value generation to stakeholders
-
10. Socio-economic contribution and financial inclusion
As a State-owned bank, BoC’s role extends beyond traditional banking to drive financial inclusion and socio-economic empowerment across the Island
-
GRI 201: Economic performance
GRI 202: Market presence
GRI 413: Local communities
GRI 203: Indirect economic impacts
SASB N-CB-240a.3: Financial inclusion and capacity building
SASB FN-CB-240a.4: Financial inclusion and capacity building
11. Regulatory environment, governance and compliance
A strong compliance culture and robust corporate governance practices underpins our value creation process
-
GRI 207: Tax
GRI 419: Socio economic compliance
GRI 307: Environmental compliance
12. Responsible procurement
We engage with a large base of suppliers and ensure responsible practices in procurement through propagation of sustainable practices
-GRI 204: Procurement practices
13. Bribery and anti-corruption
As a State-Owned Entity, nurturing a culture of anti-bribery and anti-corruption is vital in the responsible creation of shared value -
GRI 205: Anti-corruption
GRI 406: Non-discrimination
SASB FN-CB-510a.2: Business Ethics
14. Labour rights (outsourced/contract)
BoC is committed to preserving the dignity of labour and providing a conducive work environment for all outsourced and contract employees engaged by us
-
GRI 408: Child labour
GRI 409: Forced or compulsory labour
15. Digitalisation and technology
Driving digital excellence is a key strategic aspiration for the Bank
-
16. Climate change and environmental footprint
We are committed to driving down the environmental footprint of our operations while propagating sustainable practices through green lending -
GRI 302: Energy
GRI 305: Emissions
SASB FN-CB-410a.2: Incorporation of ESG factors in credit analysis
17. Brand reputation Consistently ranked as Sri Lanka’s No.1 banking brand, the BoC brand is a key source of competitive edge, underpinning our strong market position
-

BoC has supported many upcoming and existing small-and medium-scale enterprises with credit facilities and other financial
concessions during an economically challenging period.

TRANSFORMATIONAL STRATEGY
BoC’s strategy aims to leverage its inherent strengths which also includes strong market position to transform the Bank to a future-fit, competitive organisation which is able to adapt to the rapid changes in the operating environment. This transformational strategy was launched in 2018 and is reviewed and revised annually as part of the Bank’s strategic cycle.
STRENGTHS WEAKNESSES
OPPORTUNITIES THREATS
Market leader in assets, deposits, loans, inward remittances and customer penetration
Unparalleled branch network
Leading banking brand in the country
Credibility associated with state-ownership
International presence
Extensive stakeholder partnerships
Limited appeal to millennials and younger demographics
Challenges in rolling out technology and innovation due to size of operations
Legacy systems and challenges in integration
Challenges in maintaining consistency in service quality and customer experience across all contact points due to extensive network
Increased digital adoption by customers
Government thrust towards exports and SME sectors
Flight to quality during challenging economic times
Increased digital literacy in the country
Opportunities in pursuing green finance
Increased demand for credit in low interest rate regime
Changing lifestyles of people with the new normalcy
Weakened macro-economic climate and stressed external sector
Emergence of new variants of the COVID-19 pandemic
Downgrade of Sri Lanka’s sovereign credit rating
Increasing competition from younger, more agile banks
Increasing sophistication in customer demands
Intensifying implications of climate change
Cyber security risk
Excellence in Customer ServiceEnsuring a consistent and superior customer service across all our brick and mortar and virtual platforms
Retaining Market LeadershipLeverage on the Bank’s brand strength and unmatched customer penetration to maintain market leadership position through relevant products and superior customer experience
Leading the Digital AdoptionTransforming the experience of both the internal and external customers through adopting cutting-edge technology
Best in Sustainable BankingEffectively address challenges prevalent in the economic, social and environmental sphere through proactive and meaningful solutions
BANK OF CEYLON | ANNUAL REPORT 2021
WHERE WE ARE NOW WHERE WE WANT TO BE
The Bank adopts a holistic process in determining corporate strategy, culminating in the formulation of a three year Corporate Plan. This Plan is reviewed and refined annually to ensure relevance to changing dynamics in the operating landscape.
42

Customer Centricity
Digital Excellence
Building a High-Performing Team
Stability, Governance and Sustainable Growth
Rewarding Credit Culture and Healthy Credit Portfolio
Net promoter score
Customer satisfaction score
Customers acquired
Customer penetration
Contact points
Brand strength
Growth in digital transactions
Customers onboarded to virtual platforms
Digitally enabled customers
Virtually enabled customers
Growth in loan book
Gross NPA ratio
Facilities rescheduled/restructured
Customer awareness programmes held
Retention rate
Training hours per employee
Net profit per employee
Value added per employee
Female representation
Economic value created
Community investments
Carbon footprint
Renewable energy generated
BANK OF CEYLON | ANNUAL REPORT 2021
HOW WE PLAN TO GET THERE HOW WE MEASURE SUCCESS
Overview Leadership Insights Our Bank Our Strategy Our Performance
Stakeholder Outcomes Accountability Financial Reports Compliance Annexes Supplimentary Information
43
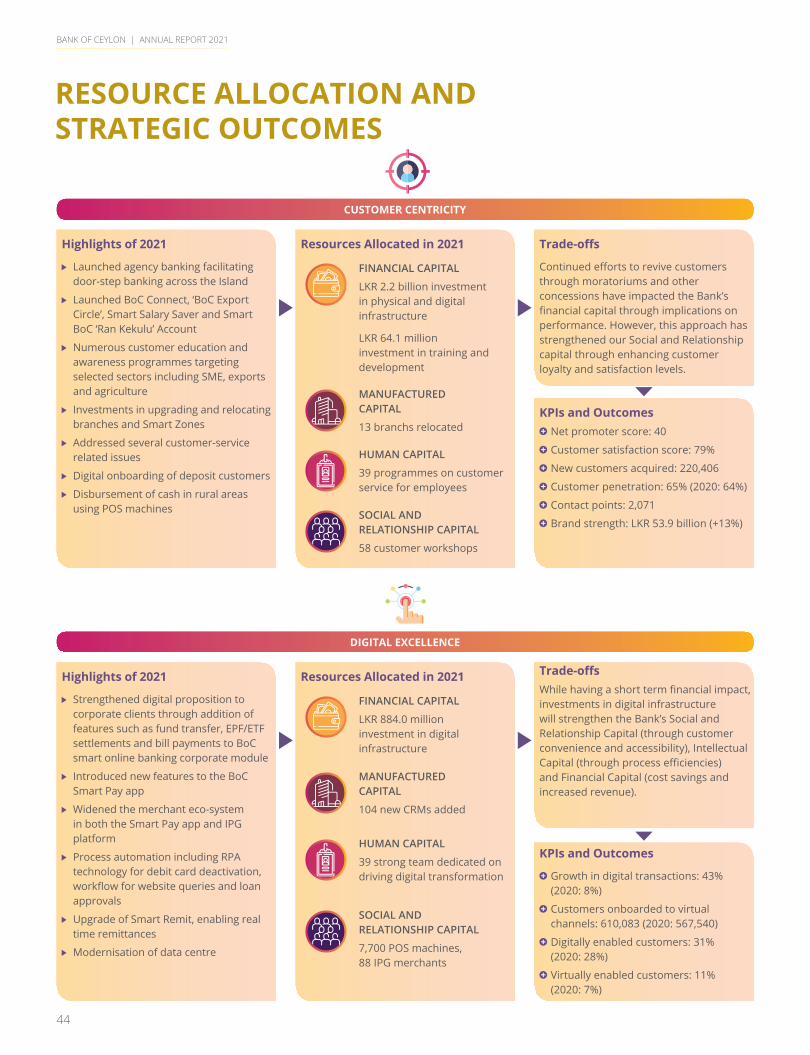
BANK OF CEYLON | ANNUAL REPORT 2021
44
CUSTOMER CENTRICITY
DIGITAL EXCELLENCE
RESOURCE ALLOCATION AND STRATEGIC OUTCOMES
MANUFACTURED CAPITAL
13 branchs relocated
HUMAN CAPITAL
39 programmes on customer service for employees
SOCIAL AND RELATIONSHIP CAPITAL
58 customer workshops
Highlights of 2021
Launched agency banking facilitating door-step banking across the Island
Launched BoC Connect, ‘BoC Export Circle’, Smart Salary Saver and Smart BoC ‘Ran Kekulu’ Account
Numerous customer education and awareness programmes targeting selected sectors including SME, exports and agriculture
Investments in upgrading and relocating branches and Smart Zones
Addressed several customer-service related issues
Digital onboarding of deposit customers
Disbursement of cash in rural areas using POS machines
Highlights of 2021
Strengthened digital proposition to corporate clients through addition of features such as fund transfer, EPF/ETF settlements and bill payments to BoC smart online banking corporate module
Introduced new features to the BoC Smart Pay app
Widened the merchant eco-system in both the Smart Pay app and IPG platform
Process automation including RPA technology for debit card deactivation, workflow for website queries and loan approvals
Upgrade of Smart Remit, enabling real time remittances
Modernisation of data centre
Trade-offs
Continued efforts to revive customers through moratoriums and other concessions have impacted the Bank’s financial capital through implications on performance. However, this approach has strengthened our Social and Relationship capital through enhancing customer loyalty and satisfaction levels.
Trade-offs While having a short term financial impact, investments in digital infrastructure will strengthen the Bank’s Social and Relationship Capital (through customer convenience and accessibility), Intellectual Capital (through process efficiencies) and Financial Capital (cost savings and increased revenue).
KPIs and Outcomes Net promoter score: 40
Customer satisfaction score: 79%
New customers acquired: 220,406
Customer penetration: 65% (2020: 64%)
Contact points: 2,071
Brand strength: LKR 53.9 billion (+13%)
KPIs and Outcomes
Growth in digital transactions: 43% (2020: 8%)
Customers onboarded to virtual channels: 610,083 (2020: 567,540)
Digitally enabled customers: 31% (2020: 28%)
Virtually enabled customers: 11% (2020: 7%)
Resources Allocated in 2021
Resources Allocated in 2021
FINANCIAL CAPITAL
LKR 2.2 billion investment in physical and digital infrastructure
LKR 64.1 million investment in training and development
FINANCIAL CAPITAL
LKR 884.0 million investment in digital infrastructure
MANUFACTURED CAPITAL
104 new CRMs added
HUMAN CAPITAL
39 strong team dedicated on driving digital transformation
SOCIAL AND RELATIONSHIP CAPITAL
7,700 POS machines, 88 IPG merchants
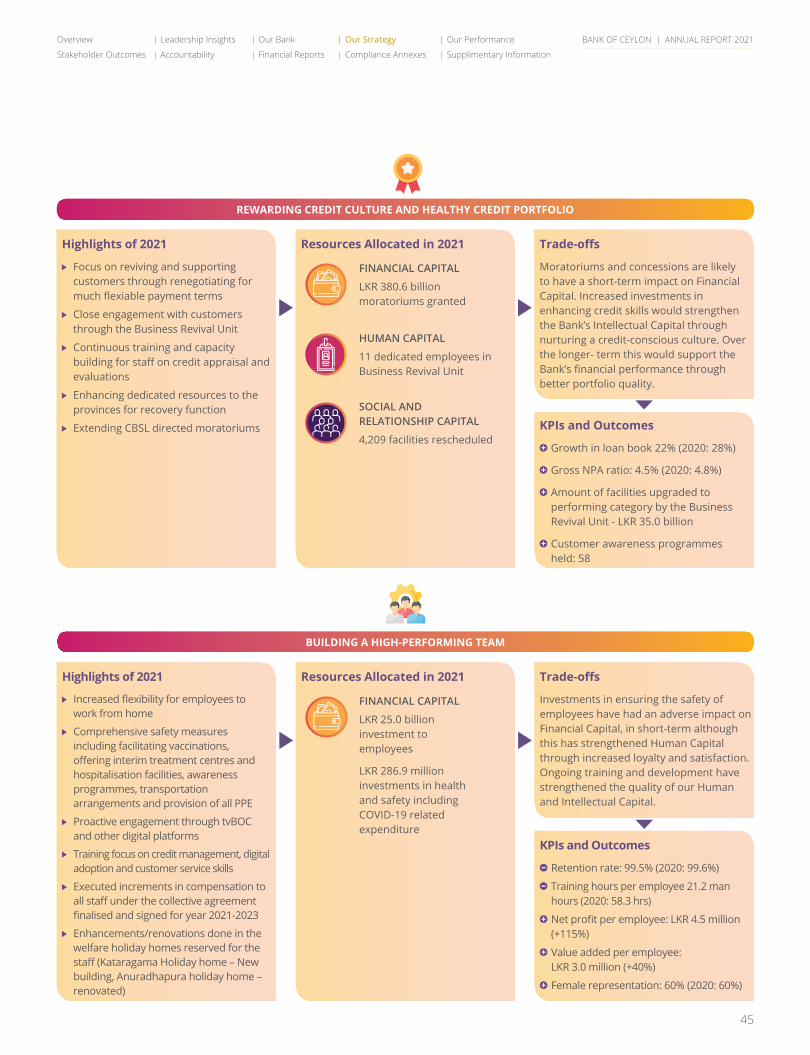
BANK OF CEYLON | ANNUAL REPORT 2021
45
BUILDING A HIGH-PERFORMING TEAM
Highlights of 2021
Increased flexibility for employees to work from home
Comprehensive safety measures including facilitating vaccinations, offering interim treatment centres and hospitalisation facilities, awareness programmes, transportation arrangements and provision of all PPE
Proactive engagement through tvBOC and other digital platforms
Training focus on credit management, digital adoption and customer service skills
Executed increments in compensation to all staff under the collective agreement finalised and signed for year 2021-2023
Enhancements/renovations done in the welfare holiday homes reserved for the staff (Kataragama Holiday home – New building, Anuradhapura holiday home – renovated)
Trade-offs
Investments in ensuring the safety of employees have had an adverse impact on Financial Capital, in short-term although this has strengthened Human Capital through increased loyalty and satisfaction. Ongoing training and development have strengthened the quality of our Human and Intellectual Capital.
KPIs and Outcomes
Retention rate: 99.5% (2020: 99.6%)
Training hours per employee 21.2 man hours (2020: 58.3 hrs)
Net profit per employee: LKR 4.5 million (+115%)
Value added per employee: LKR 3.0 million (+40%)
Female representation: 60% (2020: 60%)
Resources Allocated in 2021
REWARDING CREDIT CULTURE AND HEALTHY CREDIT PORTFOLIO
Highlights of 2021
Focus on reviving and supporting customers through renegotiating for much flexiable payment terms
Close engagement with customers through the Business Revival Unit
Continuous training and capacity building for staff on credit appraisal and evaluations
Enhancing dedicated resources to the provinces for recovery function
Extending CBSL directed moratoriums
Trade-offs
Moratoriums and concessions are likely to have a short-term impact on Financial Capital. Increased investments in enhancing credit skills would strengthen the Bank’s Intellectual Capital through nurturing a credit-conscious culture. Over the longer- term this would support the Bank’s financial performance through better portfolio quality.
KPIs and Outcomes
Growth in loan book 22% (2020: 28%)
Gross NPA ratio: 4.5% (2020: 4.8%)
Amount of facilities upgraded to performing category by the Business Revival Unit - LKR 35.0 billion
Customer awareness programmes held: 58
Resources Allocated in 2021
FINANCIAL CAPITAL
LKR 380.6 billion moratoriums granted
HUMAN CAPITAL
11 dedicated employees in Business Revival Unit
SOCIAL AND RELATIONSHIP CAPITAL
4,209 facilities rescheduled
FINANCIAL CAPITAL
LKR 25.0 billion investment to employees
LKR 286.9 million investments in health and safety including COVID-19 related expenditure
Overview Leadership Insights Our Bank Our Strategy Our Performance
Stakeholder Outcomes Accountability Financial Reports Compliance Annexes Supplimentary Information
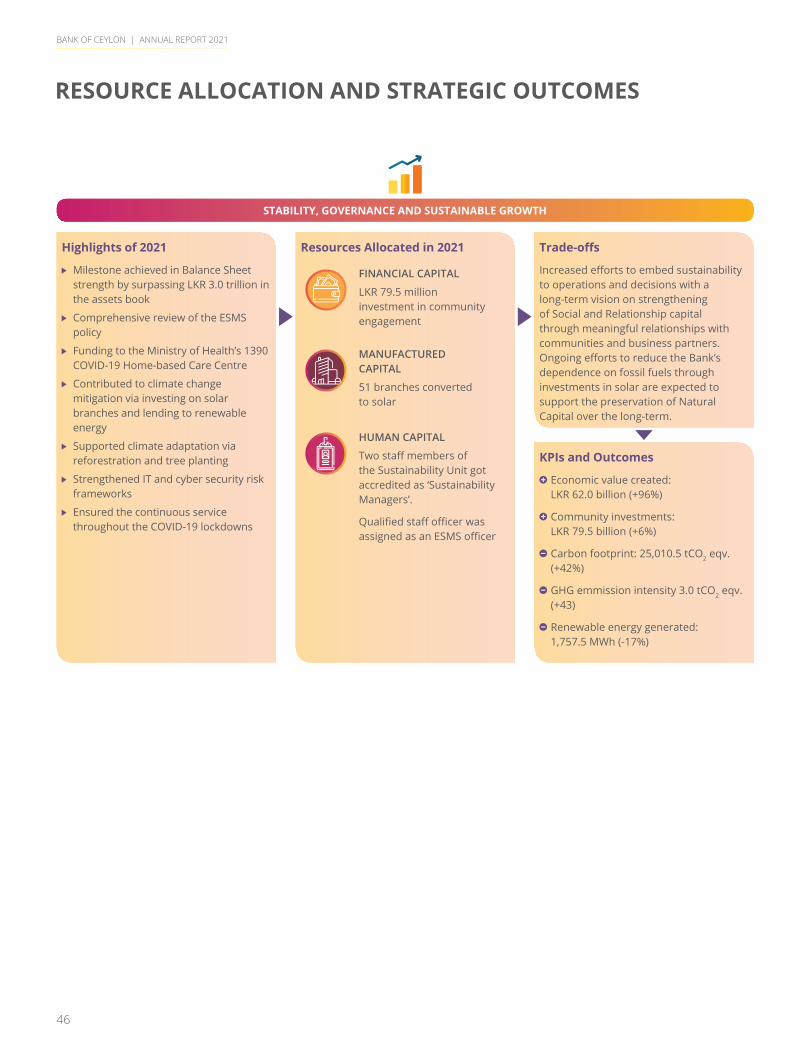
BANK OF CEYLON | ANNUAL REPORT 2021
46
RESOURCE ALLOCATION AND STRATEGIC OUTCOMES
STABILITY, GOVERNANCE AND SUSTAINABLE GROWTH
Highlights of 2021
Milestone achieved in Balance Sheet strength by surpassing LKR 3.0 trillion in the assets book
Comprehensive review of the ESMS policy
Funding to the Ministry of Health’s 1390 COVID-19 Home-based Care Centre
Contributed to climate change mitigation via investing on solar branches and lending to renewable energy
Supported climate adaptation via reforestration and tree planting
Strengthened IT and cyber security risk frameworks
Ensured the continuous service throughout the COVID-19 lockdowns
Trade-offs
Increased efforts to embed sustainability to operations and decisions with a long-term vision on strengthening of Social and Relationship capital through meaningful relationships with communities and business partners. Ongoing efforts to reduce the Bank’s dependence on fossil fuels through investments in solar are expected to support the preservation of Natural Capital over the long-term.
KPIs and Outcomes
Economic value created: LKR 62.0 billion (+96%)
Community investments: LKR 79.5 billion (+6%)
Carbon footprint: 25,010.5 tCO2 eqv. (+42%)
GHG emmission intensity 3.0 tCO2 eqv. (+43)
Renewable energy generated: 1,757.5 MWh (-17%)
Resources Allocated in 2021
FINANCIAL CAPITAL
LKR 79.5 million investment in community engagement
MANUFACTURED CAPITAL
51 branches converted to solar
HUMAN CAPITAL
Two staff members of the Sustainability Unit got accredited as ‘Sustainability Managers’.
Qualified staff officer was assigned as an ESMS officer
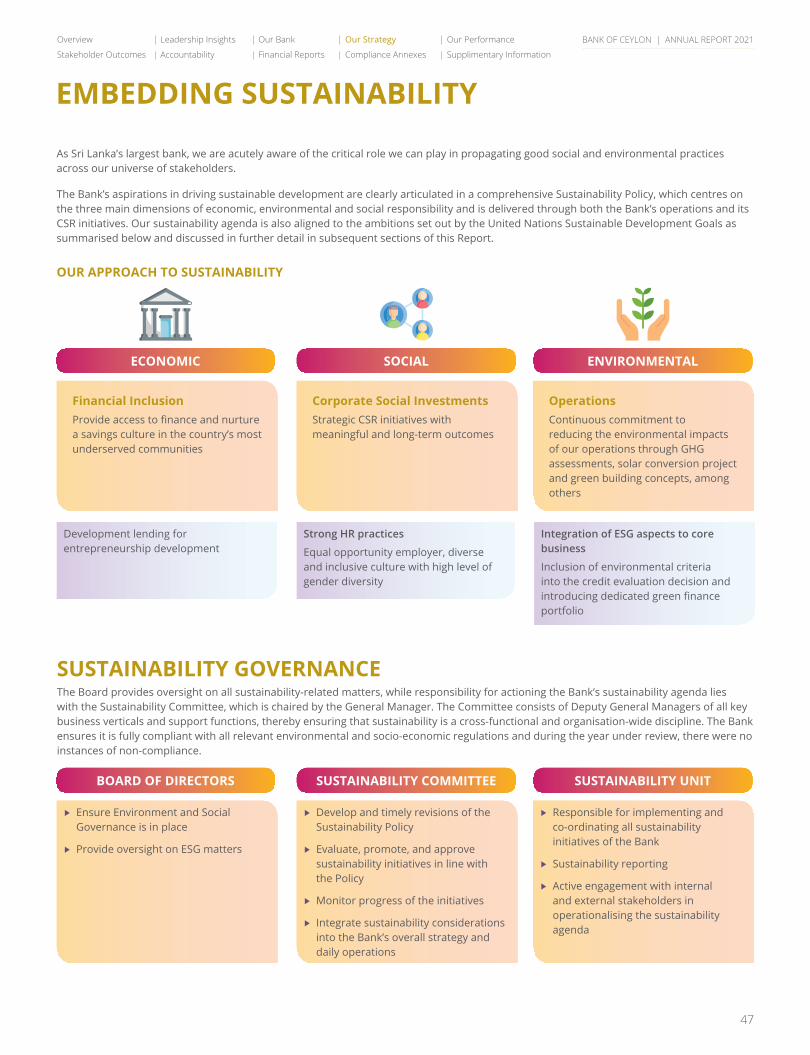
BANK OF CEYLON | ANNUAL REPORT 2021
47
EMBEDDING SUSTAINABILITY
As Sri Lanka’s largest bank, we are acutely aware of the critical role we can play in propagating good social and environmental practices across our universe of stakeholders.
The Bank’s aspirations in driving sustainable development are clearly articulated in a comprehensive Sustainability Policy, which centres on the three main dimensions of economic, environmental and social responsibility and is delivered through both the Bank’s operations and its CSR initiatives. Our sustainability agenda is also aligned to the ambitions set out by the United Nations Sustainable Development Goals as summarised below and discussed in further detail in subsequent sections of this Report.
OUR APPROACH TO SUSTAINABILITY
Financial InclusionProvide access to finance and nurture a savings culture in the country’s most underserved communities
Ensure Environment and Social Governance is in place
Provide oversight on ESG matters
Corporate Social InvestmentsStrategic CSR initiatives with meaningful and long-term outcomes
Develop and timely revisions of the Sustainability Policy
Evaluate, promote, and approve sustainability initiatives in line with the Policy
Monitor progress of the initiatives
Integrate sustainability considerations into the Bank’s overall strategy and daily operations
ECONOMIC
BOARD OF DIRECTORS
SOCIAL
SUSTAINABILITY COMMITTEE
ENVIRONMENTAL
SUSTAINABILITY UNIT
Development lending for entrepreneurship development
Strong HR practices
Equal opportunity employer, diverse and inclusive culture with high level of gender diversity
OperationsContinuous commitment to reducing the environmental impacts of our operations through GHG assessments, solar conversion project and green building concepts, among others
Responsible for implementing and co-ordinating all sustainability initiatives of the Bank
Sustainability reporting
Active engagement with internal and external stakeholders in operationalising the sustainability agenda
Integration of ESG aspects to core business
Inclusion of environmental criteria into the credit evaluation decision and introducing dedicated green finance portfolio
SUSTAINABILITY GOVERNANCEThe Board provides oversight on all sustainability-related matters, while responsibility for actioning the Bank’s sustainability agenda lies with the Sustainability Committee, which is chaired by the General Manager. The Committee consists of Deputy General Managers of all key business verticals and support functions, thereby ensuring that sustainability is a cross-functional and organisation-wide discipline. The Bank ensures it is fully compliant with all relevant environmental and socio-economic regulations and during the year under review, there were no instances of non-compliance.
Overview Leadership Insights Our Bank Our Strategy Our Performance
Stakeholder Outcomes Accountability Financial Reports Compliance Annexes Supplimentary Information
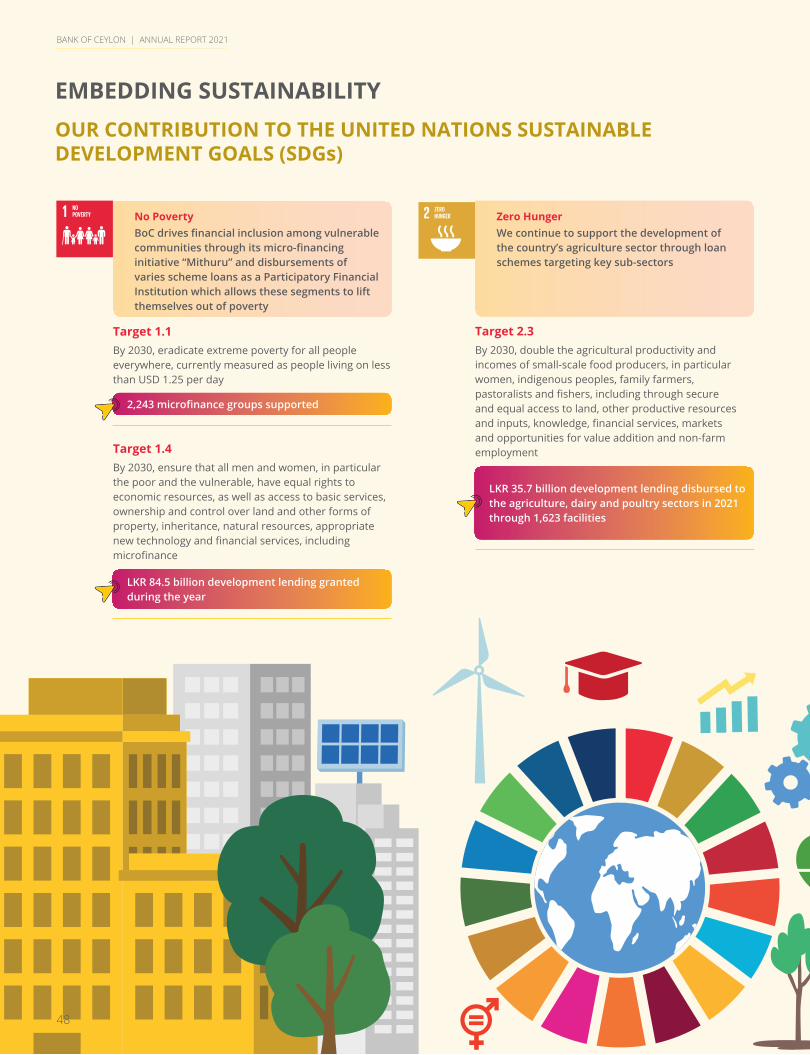
OUR CONTRIBUTION TO THE UNITED NATIONS SUSTAINABLE DEVELOPMENT GOALS (SDGs)
No PovertyBoC drives financial inclusion among vulnerable communities through its micro-financing initiative “Mithuru” and disbursements of varies scheme loans as a Participatory Financial Institution which allows these segments to lift themselves out of poverty
Zero HungerWe continue to support the development of the country’s agriculture sector through loan schemes targeting key sub-sectors
Target 1.1By 2030, eradicate extreme poverty for all people everywhere, currently measured as people living on less than USD 1.25 per day
Target 2.3By 2030, double the agricultural productivity and incomes of small-scale food producers, in particular women, indigenous peoples, family farmers, pastoralists and fishers, including through secure and equal access to land, other productive resources and inputs, knowledge, financial services, markets and opportunities for value addition and non-farm employmentTarget 1.4
By 2030, ensure that all men and women, in particular the poor and the vulnerable, have equal rights to economic resources, as well as access to basic services, ownership and control over land and other forms of property, inheritance, natural resources, appropriate new technology and financial services, including microfinance
2,243 microfinance groups supported
LKR 35.7 billion development lending disbursed to the agriculture, dairy and poultry sectors in 2021 through 1,623 facilities
LKR 84.5 billion development lending granted during the year
BANK OF CEYLON | ANNUAL REPORT 2021
EMBEDDING SUSTAINABILITY
48

Good Health and Well-beingDuring the year, BoC played a key role in facilitating the importation of COVID-19 vaccines and related medical equipment and other essential medical and pharmaceutical supplies to the country
Gender EqualityWe are committed to create opportunities for women, both within the Bank and outside the Bank
Quality EducationEducation is a key pillar of the Bank’s sustainability agenda and we have implemented several strategic ongoing projects to support both primary and secondary education of school students
Clean water and SanitationThe Bank is committed to fund projects which enhance national water supply and drainage and irrigation facilities across the country
Target 3.bSupport the research and development of vaccines and medicines for communicable and non-communicable diseases that primarily affect developing countries, provide access to affordable essential medicines and vaccines
Target 5.5Ensure women’s full and effective participation and equal opportunities for leadership at all levels of decision-making in political, economic and public life
Target 5.aUndertake reforms to give women equal rights to economic resources
Target 4.1By 2030, ensure that all girls and boys complete free, equitable and quality primary and secondary education, leading to relevant and effective learning outcomes
Target 6.1By 2030, achieve universal and equitable access to safe and affordable drinking water for all
Target 4.4By 2030, substantially increase the number of youth and adults who have relevant skills, including technical and vocational skills, for employment, decent jobs and entrepreneurship
Facilitated importation of COVID-19 vaccines through financing USD 138.0 million
60% overall female representation including 42% at Management level
LKR 86.7 billion lending to women during the year
Scholarships and educational support to 2,087 students and 252 youth
LKR 43.7 billion total lending to Water Supply and related services
176,418 total training hours to employees
Training internships programme related certificates issued to 2,253 school leavers and university students who completed the programme
BANK OF CEYLON | ANNUAL REPORT 2021
49
Overview Leadership Insights Our Bank Our Strategy Our Performance
Stakeholder Outcomes Accountability Financial Reports Compliance Annexes Supplimentary Information
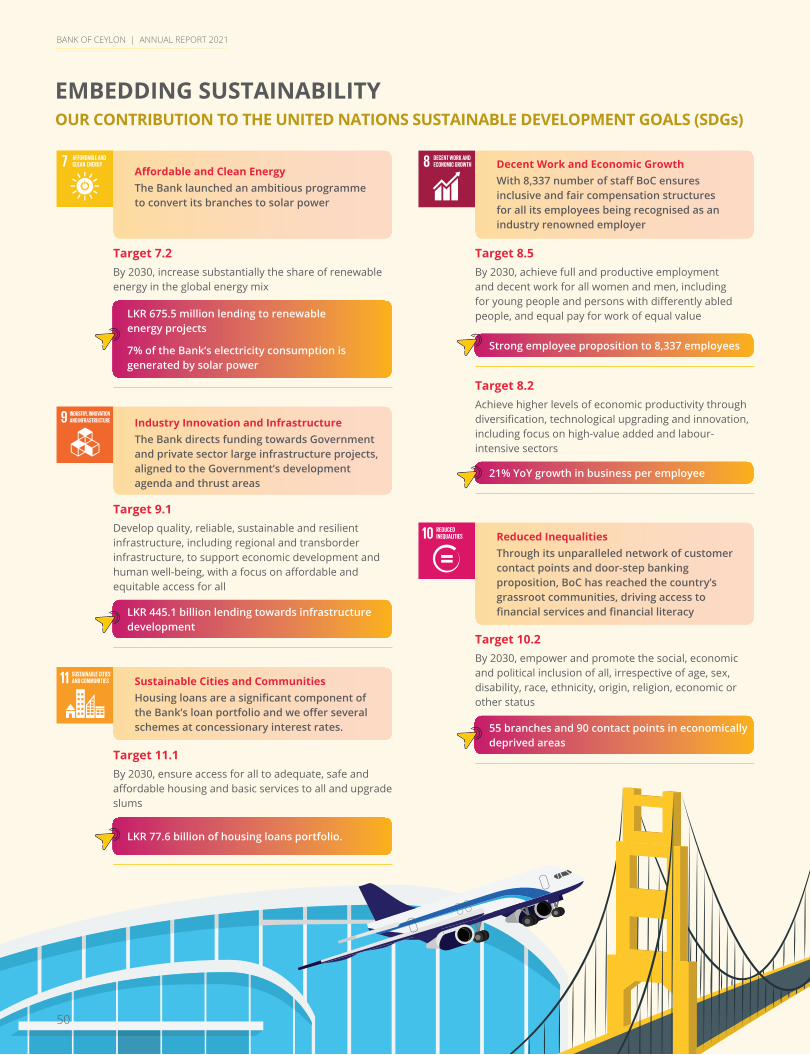
Affordable and Clean EnergyThe Bank launched an ambitious programme to convert its branches to solar power
Industry Innovation and InfrastructureThe Bank directs funding towards Government and private sector large infrastructure projects, aligned to the Government’s development agenda and thrust areas
Sustainable Cities and CommunitiesHousing loans are a significant component of the Bank’s loan portfolio and we offer several schemes at concessionary interest rates.
Reduced InequalitiesThrough its unparalleled network of customer contact points and door-step banking proposition, BoC has reached the country’s grassroot communities, driving access to financial services and financial literacy
Decent Work and Economic GrowthWith 8,337 number of staff BoC ensures inclusive and fair compensation structures for all its employees being recognised as an industry renowned employer
Target 7.2By 2030, increase substantially the share of renewable energy in the global energy mix
Target 9.1Develop quality, reliable, sustainable and resilient infrastructure, including regional and transborder infrastructure, to support economic development and human well-being, with a focus on affordable and equitable access for all
Target 11.1By 2030, ensure access for all to adequate, safe and affordable housing and basic services to all and upgrade slums
Target 10.2By 2030, empower and promote the social, economic and political inclusion of all, irrespective of age, sex, disability, race, ethnicity, origin, religion, economic or other status
Target 8.5By 2030, achieve full and productive employment and decent work for all women and men, including for young people and persons with differently abled people, and equal pay for work of equal value
Target 8.2Achieve higher levels of economic productivity through diversification, technological upgrading and innovation, including focus on high-value added and labour-intensive sectors
LKR 675.5 million lending to renewable energy projects
7% of the Bank’s electricity consumption is generated by solar power
LKR 445.1 billion lending towards infrastructure development
LKR 77.6 billion of housing loans portfolio.
55 branches and 90 contact points in economically deprived areas
Strong employee proposition to 8,337 employees
21% YoY growth in business per employee
BANK OF CEYLON | ANNUAL REPORT 2021
EMBEDDING SUSTAINABILITYOUR CONTRIBUTION TO THE UNITED NATIONS SUSTAINABLE DEVELOPMENT GOALS (SDGs)
50

Responsible Consumption and ProductionThe Bank’s recent thrust towards digital capabilities and process automation has resulted in the sustained decline of paper consumption and waste while responsible consumption and production practices are propagated through the Bank’s Sustainability Policy
Peace and Justice Strong InstitutionsThe Bank promotes highest level of transparency and integrity in all its transactions via strong policies in place
Partnerships for the GoalsThe Bank leverages partnerships across its ecosystem to drive shared value creation through mutual partnerships
Life on LandThe Bank’s “Haritha Arana” project aims to contribute towards increasing the country’s forest cover in line with the Government’s “Wana Ropa” initiative
Climate Action The Bank conducts a comprehensive assessment of its carbon footprint and is driving concerted efforts
Target 12.2By 2030, achieve the sustainable management and efficient use of natural resources
Target 16.5Substantially reduce corruption and bribery in all their forms
Target 17.17Encourage and promote effective public, public-private and civil society partnerships, building on the experience and resourcing strategies of partnerships.
Target 15.2By 2020, promote the implementation of sustainable management of all types of forests, halt deforestation, restore degraded forests and substantially increase afforestation and reforestation globally
Target 13.2Integrate climate change measures into national policies, strategies and planning
Target 12.5By 2030, substantially reduce waste generation through prevention, reduction, recycling and reuse
Target 16.10Ensure public access to information and protect fundamental freedoms, in accordance with national legislation and international agreements
14.5 MT of paper saved through automation
Anti-Corruption and Anti Bribery Policy in place
BoC invested LKR 11.0 million during the year in nurturing more than 8,000 trees it planted in 100 hectare degraded forest patch in Habarana and helped its regeneration
Climate change and environmental footprint recognise as a material topic in strategy formulation
14.0 MT of paper recycled
Adherence to Right to Information Act
Work closely with peer banks in the Sri Lanka Banks Association Sustainable Banking Initiative (SLBA - SBI)
The Bank, during the year partnered with Asian Infrastructure Investment Bank to help COVID-19 affected businesses through a dedicated funding line
BANK OF CEYLON | ANNUAL REPORT 2021
51
Overview Leadership Insights Our Bank Our Strategy Our Performance
Stakeholder Outcomes Accountability Financial Reports Compliance Annexes Supplimentary Information
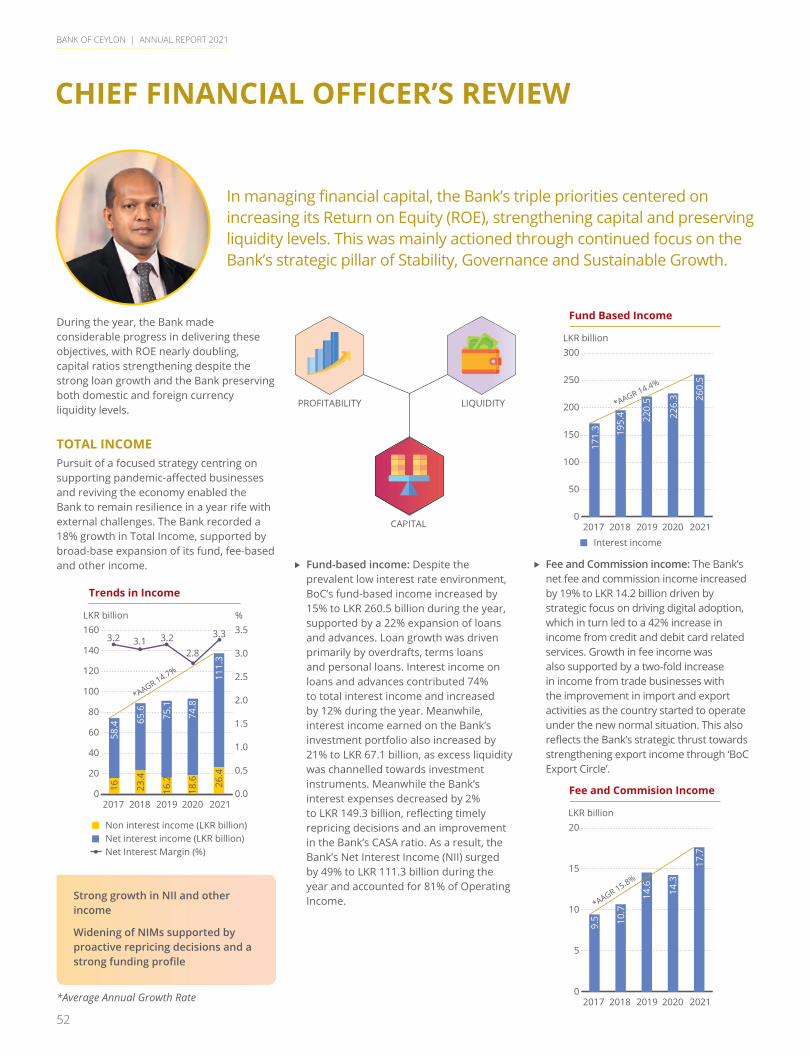
BANK OF CEYLON | ANNUAL REPORT 2021
52
CHIEF FINANCIAL OFFICER’S REVIEW
In managing financial capital, the Bank’s triple priorities centered on increasing its Return on Equity (ROE), strengthening capital and preserving liquidity levels. This was mainly actioned through continued focus on the Bank’s strategic pillar of Stability, Governance and Sustainable Growth.
During the year, the Bank made considerable progress in delivering these objectives, with ROE nearly doubling, capital ratios strengthening despite the strong loan growth and the Bank preserving both domestic and foreign currency liquidity levels.
TOTAL INCOMEPursuit of a focused strategy centring on supporting pandemic-affected businesses and reviving the economy enabled the Bank to remain resilience in a year rife with external challenges. The Bank recorded a 18% growth in Total Income, supported by broad-base expansion of its fund, fee-based and other income.
Trends in Income
0
20
40
60
80
100
120
140
160
201920182017 2020 2021
LKR billion %
Non interest income (LKR billion)Net interest income (LKR billion)Net Interest Margin (%)
0.0
0.5
1.0
1.5
2.0
2.5
3.0
3.5
1658
.4
23.4
65.6
16.2
75.1
18.6
74.8
26.4
111.
3
3.2 3.1 3.22.8
3.3
*AAGR 14.7%
Strong growth in NII and other income
Widening of NIMs supported by proactive repricing decisions and a strong funding profile
Fund-based income: Despite the prevalent low interest rate environment, BoC’s fund-based income increased by 15% to LKR 260.5 billion during the year, supported by a 22% expansion of loans and advances. Loan growth was driven primarily by overdrafts, terms loans and personal loans. Interest income on loans and advances contributed 74% to total interest income and increased by 12% during the year. Meanwhile, interest income earned on the Bank’s investment portfolio also increased by 21% to LKR 67.1 billion, as excess liquidity was channelled towards investment instruments. Meanwhile the Bank’s interest expenses decreased by 2% to LKR 149.3 billion, reflecting timely repricing decisions and an improvement in the Bank’s CASA ratio. As a result, the Bank’s Net Interest Income (NII) surged by 49% to LKR 111.3 billion during the year and accounted for 81% of Operating Income.
Fund Based Income
0
50
100
150
200
250
300
201920182017 2020 2021
LKR billion
171.
3 195.
4 220.
5
226.
3 260.
5
*AAGR 14.4%
Interest income
Fee and Commission income: The Bank’s net fee and commission income increased by 19% to LKR 14.2 billion driven by strategic focus on driving digital adoption, which in turn led to a 42% increase in income from credit and debit card related services. Growth in fee income was also supported by a two-fold increase in income from trade businesses with the improvement in import and export activities as the country started to operate under the new normal situation. This also reflects the Bank’s strategic thrust towards strengthening export income through ‘BoC Export Circle’.
Fee and Commision Income
0
5
10
15
20
201920182017 2020 2021
LKR billion
9.5 10
.7
14.6 14.3
17.7
*AAGR 15.8%
PROFITABILITY LIQUIDITY
CAPITAL
*Average Annual Growth Rate
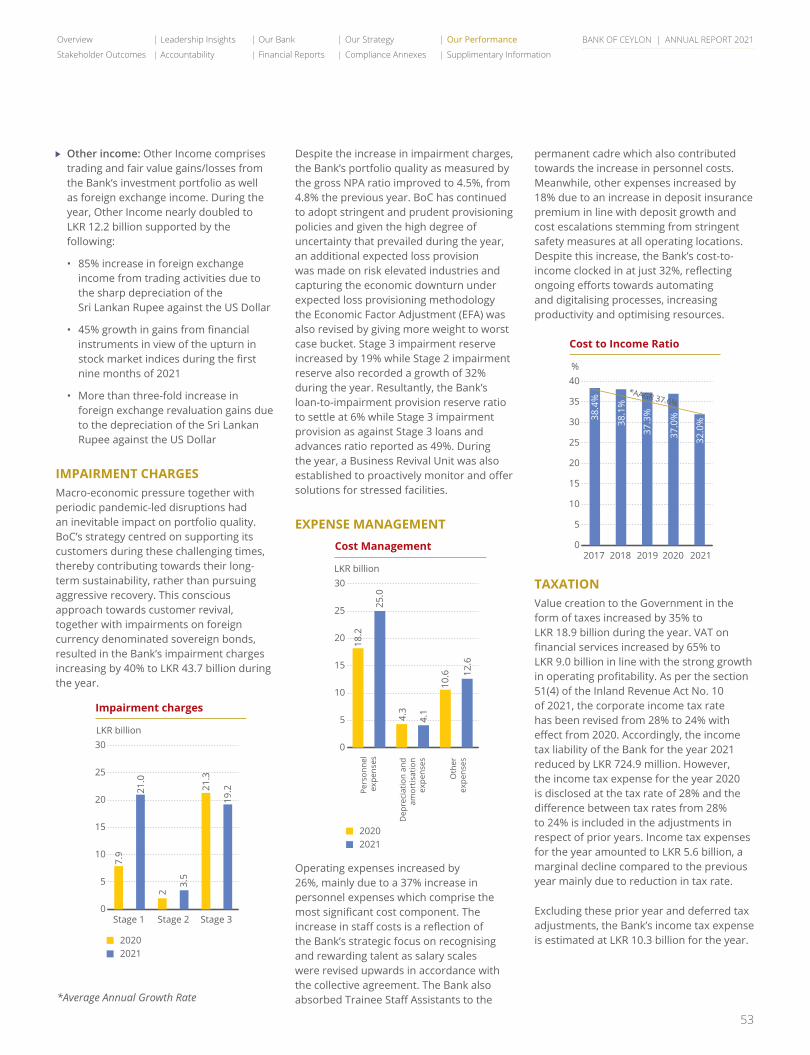
BANK OF CEYLON | ANNUAL REPORT 2021
53
Other income: Other Income comprises trading and fair value gains/losses from the Bank’s investment portfolio as well as foreign exchange income. During the year, Other Income nearly doubled to LKR 12.2 billion supported by the following:
• 85% increase in foreign exchange income from trading activities due to the sharp depreciation of the Sri Lankan Rupee against the US Dollar
• 45% growth in gains from financial instruments in view of the upturn in stock market indices during the first nine months of 2021
• More than three-fold increase in foreign exchange revaluation gains due to the depreciation of the Sri Lankan Rupee against the US Dollar
IMPAIRMENT CHARGESMacro-economic pressure together with periodic pandemic-led disruptions had an inevitable impact on portfolio quality. BoC’s strategy centred on supporting its customers during these challenging times, thereby contributing towards their long-term sustainability, rather than pursuing aggressive recovery. This conscious approach towards customer revival, together with impairments on foreign currency denominated sovereign bonds, resulted in the Bank’s impairment charges increasing by 40% to LKR 43.7 billion during the year.
Impairment charges
0
5
10
15
20
25
30
Stage 3Stage 2Stage 1
LKR billion
20202021
7.9
21.0
2
3.5
21.3
19.2
Despite the increase in impairment charges, the Bank’s portfolio quality as measured by the gross NPA ratio improved to 4.5%, from 4.8% the previous year. BoC has continued to adopt stringent and prudent provisioning policies and given the high degree of uncertainty that prevailed during the year, an additional expected loss provision was made on risk elevated industries and capturing the economic downturn under expected loss provisioning methodology the Economic Factor Adjustment (EFA) was also revised by giving more weight to worst case bucket. Stage 3 impairment reserve increased by 19% while Stage 2 impairment reserve also recorded a growth of 32% during the year. Resultantly, the Bank’s loan-to-impairment provision reserve ratio to settle at 6% while Stage 3 impairment provision as against Stage 3 loans and advances ratio reported as 49%. During the year, a Business Revival Unit was also established to proactively monitor and offer solutions for stressed facilities.
EXPENSE MANAGEMENT Cost Management
0
5
10
15
20
25
30
Pers
onne
lex
pens
es
Dep
reci
atio
n an
dam
ortis
atio
nex
pens
es
Oth
erex
pens
es
LKR billion
20202021
18.2
25.0
4.3
4.1
10.6 12
.6
Operating expenses increased by 26%, mainly due to a 37% increase in personnel expenses which comprise the most significant cost component. The increase in staff costs is a reflection of the Bank’s strategic focus on recognising and rewarding talent as salary scales were revised upwards in accordance with the collective agreement. The Bank also absorbed Trainee Staff Assistants to the
permanent cadre which also contributed towards the increase in personnel costs. Meanwhile, other expenses increased by 18% due to an increase in deposit insurance premium in line with deposit growth and cost escalations stemming from stringent safety measures at all operating locations. Despite this increase, the Bank’s cost-to-income clocked in at just 32%, reflecting ongoing efforts towards automating and digitalising processes, increasing productivity and optimising resources.
Cost to Income Ratio
0
5
10
15
20
25
30
35
40
201920182017 2020 2021
%
38.4
%
38.1
%
37.3
%
37.0
%
32.0
%
*AAGR 37.6%
TAXATIONValue creation to the Government in the form of taxes increased by 35% to LKR 18.9 billion during the year. VAT on financial services increased by 65% to LKR 9.0 billion in line with the strong growth in operating profitability. As per the section 51(4) of the Inland Revenue Act No. 10 of 2021, the corporate income tax rate has been revised from 28% to 24% with effect from 2020. Accordingly, the income tax liability of the Bank for the year 2021 reduced by LKR 724.9 million. However, the income tax expense for the year 2020 is disclosed at the tax rate of 28% and the difference between tax rates from 28% to 24% is included in the adjustments in respect of prior years. Income tax expenses for the year amounted to LKR 5.6 billion, a marginal decline compared to the previous year mainly due to reduction in tax rate.
Excluding these prior year and deferred tax adjustments, the Bank’s income tax expense is estimated at LKR 10.3 billion for the year.
Overview Leadership Insights Our Bank Our Strategy Our Performance
Stakeholder Outcomes Accountability Financial Reports Compliance Annexes Supplimentary Information
*Average Annual Growth Rate
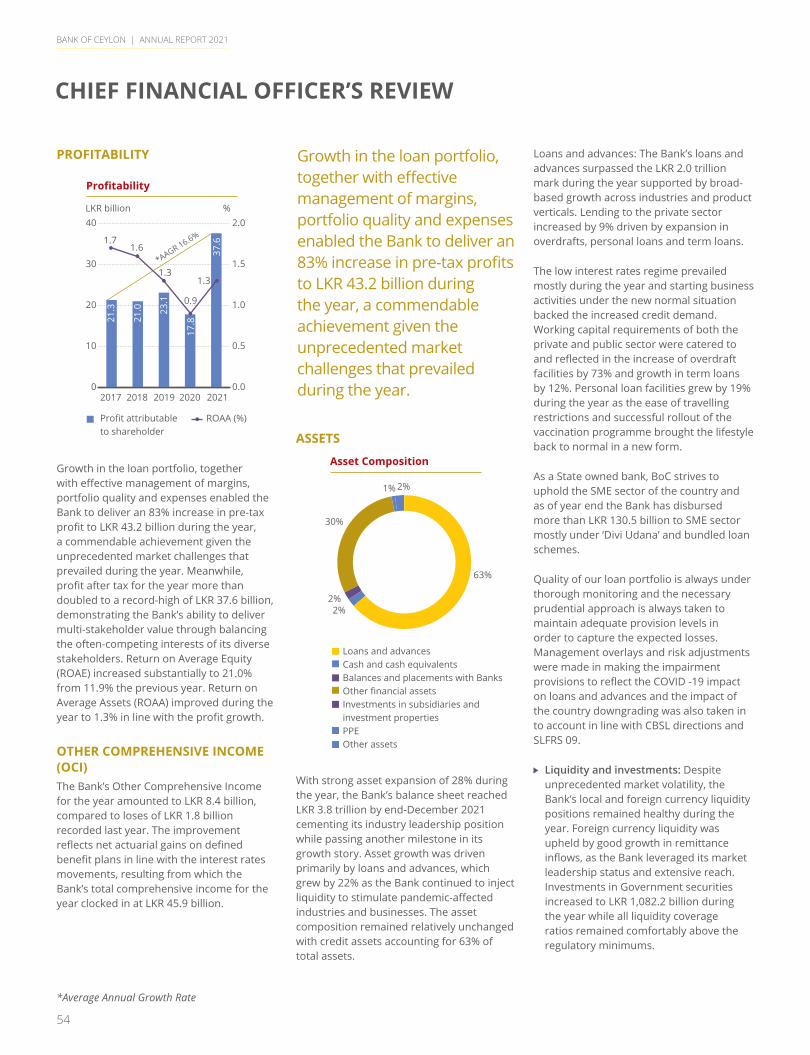
BANK OF CEYLON | ANNUAL REPORT 2021
54
PROFITABILITY
Profitability
0
10
20
30
40
201920182017 2020 2021
LKR billion %
Profit attributableto shareholder
0.0
0.5
1.0
1.5
2.0
21.3
21.0 23
.1
17.8
37.61.7
1.6
1.3
0.9
1.3
*AAGR 16.6%
ROAA (%)
Growth in the loan portfolio, together with effective management of margins, portfolio quality and expenses enabled the Bank to deliver an 83% increase in pre-tax profit to LKR 43.2 billion during the year, a commendable achievement given the unprecedented market challenges that prevailed during the year. Meanwhile, profit after tax for the year more than doubled to a record-high of LKR 37.6 billion, demonstrating the Bank’s ability to deliver multi-stakeholder value through balancing the often-competing interests of its diverse stakeholders. Return on Average Equity (ROAE) increased substantially to 21.0% from 11.9% the previous year. Return on Average Assets (ROAA) improved during the year to 1.3% in line with the profit growth.
OTHER COMPREHENSIVE INCOME (OCI)The Bank’s Other Comprehensive Income for the year amounted to LKR 8.4 billion, compared to loses of LKR 1.8 billion recorded last year. The improvement reflects net actuarial gains on defined benefit plans in line with the interest rates movements, resulting from which the Bank’s total comprehensive income for the year clocked in at LKR 45.9 billion.
ASSETS
Asset Composition
Loans and advancesCash and cash equivalentsBalances and placements with BanksOther financial assetsInvestments in subsidiaries andinvestment propertiesPPEOther assets
63%
2%2%
1% 2%
30%
With strong asset expansion of 28% during the year, the Bank’s balance sheet reached LKR 3.8 trillion by end-December 2021 cementing its industry leadership position while passing another milestone in its growth story. Asset growth was driven primarily by loans and advances, which grew by 22% as the Bank continued to inject liquidity to stimulate pandemic-affected industries and businesses. The asset composition remained relatively unchanged with credit assets accounting for 63% of total assets.
Loans and advances: The Bank’s loans and advances surpassed the LKR 2.0 trillion mark during the year supported by broad-based growth across industries and product verticals. Lending to the private sector increased by 9% driven by expansion in overdrafts, personal loans and term loans.
The low interest rates regime prevailed mostly during the year and starting business activities under the new normal situation backed the increased credit demand. Working capital requirements of both the private and public sector were catered to and reflected in the increase of overdraft facilities by 73% and growth in term loans by 12%. Personal loan facilities grew by 19% during the year as the ease of travelling restrictions and successful rollout of the vaccination programme brought the lifestyle back to normal in a new form.
As a State owned bank, BoC strives to uphold the SME sector of the country and as of year end the Bank has disbursed more than LKR 130.5 billion to SME sector mostly under ‘Divi Udana’ and bundled loan schemes.
Quality of our loan portfolio is always under thorough monitoring and the necessary prudential approach is always taken to maintain adequate provision levels in order to capture the expected losses. Management overlays and risk adjustments were made in making the impairment provisions to reflect the COVID -19 impact on loans and advances and the impact of the country downgrading was also taken in to account in line with CBSL directions and SLFRS 09.
Liquidity and investments: Despite unprecedented market volatility, the Bank’s local and foreign currency liquidity positions remained healthy during the year. Foreign currency liquidity was upheld by good growth in remittance inflows, as the Bank leveraged its market leadership status and extensive reach. Investments in Government securities increased to LKR 1,082.2 billion during the year while all liquidity coverage ratios remained comfortably above the regulatory minimums.
Growth in the loan portfolio, together with effective management of margins, portfolio quality and expenses enabled the Bank to deliver an 83% increase in pre-tax profits to LKR 43.2 billion during the year, a commendable achievement given the unprecedented market challenges that prevailed during the year.
CHIEF FINANCIAL OFFICER’S REVIEW
*Average Annual Growth Rate

BANK OF CEYLON | ANNUAL REPORT 2021
55
LIABILITIES AND CAPITAL Total liabilities increased by 28% to LKR 3.6 trillion, led by 16% growth in deposits and a two-fold increase in other borrowings. With a deposit base of LKR 2.9 trillion, BoC maintained its market leadership position in deposits, supported by its unparalleled geographical reach and brand equity. Of the total deposits, 21% comprise foreign currency deposits which increased by 10% during the year, amounting to LKR 613.2 billion. The Bank’s CASA ratio increased to 36% (35% from the previous year) and was a key factor behind the Bank’s wider NIM in 2021.
Given macro-economic uncertainty and accelerated loan growth, BoC sought to strengthen its capital base during the year. As a State-owned entity, BoC has limited avenues to enhance its capital base and is therefore compelled to rely on internally generated funds. During the year, capital was also enhanced by a dividend policy which prioritised strengthning the capital adequacy through internal capital generation. Accordingly, strong profit retention during the year led to the Bank’s retained earnings increasing by 41% to LKR 136.7 billion, which in turn resulted in the shareholders’ funds increasing by 28% to LKR 200.7 billion. Resultantly, the Bank’s Common Equity Tier 1 capital ratio increased to 12.9% while the total capital ratio clocked in at 17.8% by end-December 2021. Tier 1 Capital strengthened by an issue of LKR 3.4 billion unlisted, unsecured, subordinated perpetual capital bond. Tier 2 capital was also strengthened by the issue of LKR 5.2 billion unlisted, unsecured, subordinated, redeemable debentures in November 2021.
GROUP PERFORMANCE At a consolidated level, Group pre-tax-profit for the year doubled to LKR 44.6 billion, with contributions from Group companies increasing by over 200%. As at end 2021 the Bank had nine subsidiaries and four associate companies which are involved in diverse operations ranging from financial services, property management services and leisure management, among others. The Bank also operates a foreign subsidiary, which has facilitated market access in
Europe while enhancing reputation and providing an effective platform to obtain foreign exposure for the staff. The Bank is by far the dominant entity within the Group, accounting for 99% of total assets.
Highlights in Group activities during the year included the following:
BoC infused LKR 1.7 billion to its subsidiary Merchant Bank of Sri Lanka in September 2021, supporting its turnaround into a profitable entity during the year. As a licensed leasing and financial establishment, MBSL is able to cater to a market segment which often falls outside the risk appetite of the Bank.
Koladeniya Hydropower (Private) Limited which was an indirect subsidiary of the Bank was disposed.
Transfer of shareholding held by BOC Management Support Services (Private) Limited on Ceybank Holiday Homes (Private) Limited to BOC Property Development and Management (Private) Limited.
The Bank also initiated plans to delist a property management subsidiary from the Colombo Stock Exchange, with completion expected in 2022.
The subsidiaries are managed under a subsidiary charter than includes an annual comprehensive subsidiary performance review. The financial and operational performance of the subsidiaries are monitored by the parent entity on a regular basis while risk dashboards are shared with the Bank’s Chief Risk Officer to ensure that risks are managed within acceptable levels in line with the Group’s overall risk appetite. Meanwhile a representative from the Bank typically holds a Board position to ensure that subsidiary and associate operations are conducted in line with the expectations of the parent entity.
WAY FORWARDAs Sri Lanka experiences inevitable macro-economic pressure in the short-term, the Bank remains committed to supporting the importation of essential items and engaging with customers to ensure their long-term sustainability. In line with these aspirations, BoC will also focus on enhancing its capital position through internal profit generation and debenture issues to drive its growth plans. We also hope to obtain direct international funding from International Development Finance Agencies while further expanding our low-cost deposit base through proactively identifying and pursuing suitable customers. Strategic focus will also be placed on strengthening our financial reporting through increased digitalisation of processes and embracing emerging international best practices.
W P Russel FonsekaChief Financial Officer
24 February 2022Colombo
Overview Leadership Insights Our Bank Our Strategy Our Performance
Stakeholder Outcomes Accountability Financial Reports Compliance Annexes Supplimentary Information
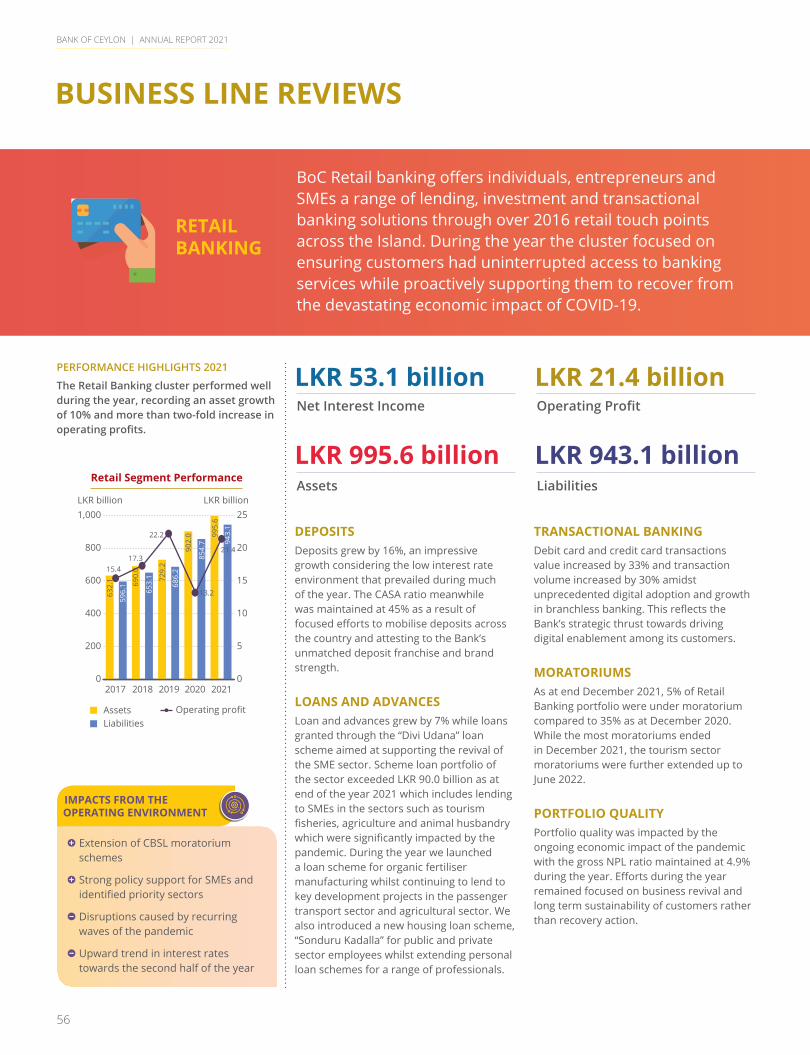
BANK OF CEYLON | ANNUAL REPORT 2021
56
BUSINESS LINE REVIEWS
RETAIL BANKING
BoC Retail banking offers individuals, entrepreneurs and SMEs a range of lending, investment and transactional banking solutions through over 2016 retail touch points across the Island. During the year the cluster focused on ensuring customers had uninterrupted access to banking services while proactively supporting them to recover from the devastating economic impact of COVID-19.
Net Interest Income
Assets
Operating Profit
Liabilities
LKR 53.1 billion
LKR 995.6 billion
LKR 21.4 billion
LKR 943.1 billion
DEPOSITS Deposits grew by 16%, an impressive growth considering the low interest rate environment that prevailed during much of the year. The CASA ratio meanwhile was maintained at 45% as a result of focused efforts to mobilise deposits across the country and attesting to the Bank’s unmatched deposit franchise and brand strength.
LOANS AND ADVANCES Loan and advances grew by 7% while loans granted through the “Divi Udana” loan scheme aimed at supporting the revival of the SME sector. Scheme loan portfolio of the sector exceeded LKR 90.0 billion as at end of the year 2021 which includes lending to SMEs in the sectors such as tourism fisheries, agriculture and animal husbandry which were significantly impacted by the pandemic. During the year we launched a loan scheme for organic fertiliser manufacturing whilst continuing to lend to key development projects in the passenger transport sector and agricultural sector. We also introduced a new housing loan scheme, “Sonduru Kadalla” for public and private sector employees whilst extending personal loan schemes for a range of professionals.
TRANSACTIONAL BANKING Debit card and credit card transactions value increased by 33% and transaction volume increased by 30% amidst unprecedented digital adoption and growth in branchless banking. This reflects the Bank’s strategic thrust towards driving digital enablement among its customers.
MORATORIUMS As at end December 2021, 5% of Retail Banking portfolio were under moratorium compared to 35% as at December 2020. While the most moratoriums ended in December 2021, the tourism sector moratoriums were further extended up to June 2022.
PORTFOLIO QUALITY Portfolio quality was impacted by the ongoing economic impact of the pandemic with the gross NPL ratio maintained at 4.9% during the year. Efforts during the year remained focused on business revival and long term sustainability of customers rather than recovery action.
IMPACTS FROM THE OPERATING ENVIRONMENT
Extension of CBSL moratorium schemes
Strong policy support for SMEs and identified priority sectors
Disruptions caused by recurring waves of the pandemic
Upward trend in interest rates towards the second half of the year
PERFORMANCE HIGHLIGHTS 2021
The Retail Banking cluster performed well during the year, recording an asset growth of 10% and more than two-fold increase in operating profits.
Retail Segment Performance
0
200
400
600
800
1,000
201920182017
729.
2
690.
0
653.
1
632.
1
596.
1 686.
2
902.
0
13.2
22.2
17.315.4
854.
7
995.
6
21.4
943.
1
2020 2021
LKR billion LKR billion
AssetsLiabilities
0
5
10
15
20
25
Operating profit

BANK OF CEYLON | ANNUAL REPORT 2021
57
PERFORMANCE AGAINST STRATEGY
CUSTOMER CENTRICITY DIGITAL EXCELLENCE REWARDING CREDIT CULTURE AND
HEALTHY CREDIT PORTFOLIO
BUILDING A HIGH-PERFORMING
TEAM
STABILITY, GOVERNANCE
AND SUSTAINABLE GROWTH
All branches were kept open for restricted banking hours during the third wave of COVID-19 despite lockdowns
Ongoing support for customers affected by the pandemic through extending CBSL moratoriums
Working capital loans for those affected by the COVID-19 pandemic
Dedicated unit to support post pandemic business revival
Deployed all “Branch on Wheels” mobile vehicles to take banking services to customer door step during the pandemic period
Special savings scheme introduced for farmers/fishermen
Launched BoC Smart ‘Ran Kakulu’ saving product
Launched of “SME Online” loan application facility
Digitalisation of facility application and repayments
Enhanced engagement with customers through digital channels
Online approval of personal loan facilities and leasing facilities
Launched BOC CONNECT, a new service channel to provide banking to the rural, underbanked segments
New loan products launched – BoC ‘Shashrika’ and ‘Soduru Kedella’
Proactive monitoring of potential NPAs
Process efficiencies through 14 Regional loan centres to process loans faster and maintain quality
Through its micro-financing initiative, ‘BoC Mithuru, the Bank drives financial inclusion through providing access to finance to the country’s most vulnerable communities. Lending to this segment amounted to LKR 16.0 billion in 2021
Special transport arrangements were made for staff to report to work
PPEs were provided for the staff
Training and meetings were conducted mostly online to restrict gathering
BoC spirit award was conducted via tvBOC to ensure the staff momentum and engagement
51 branches converted to solar branches as at end of the year.
12 branches are being constructed as per the Green Building Standards
WAY FORWARDWe remain committed to driving growth from the grassroots and will continue to support individuals, SME and micro entrepreneurs with access to funding and personalised financial solutions that expedite post COVID-19 revival. Digitalisation of financial services will also remain a priority as we strive for greater financial inclusion and access. Meanwhile we will continue to focus on enhancing the skills of the credit officers across our branch network through ongoing training opportunities.
Opportunities Significant growth prospects in the SME and Micro sectors Greater digital adoption by customers
Risks A delayed economic recovery could negatively affect the
portfolio quality Continued import and FOREX restrictions
Overview Leadership Insights Our Bank Our Strategy Our Performance
Stakeholder Outcomes Accountability Financial Reports Compliance Annexes Supplimentary Information
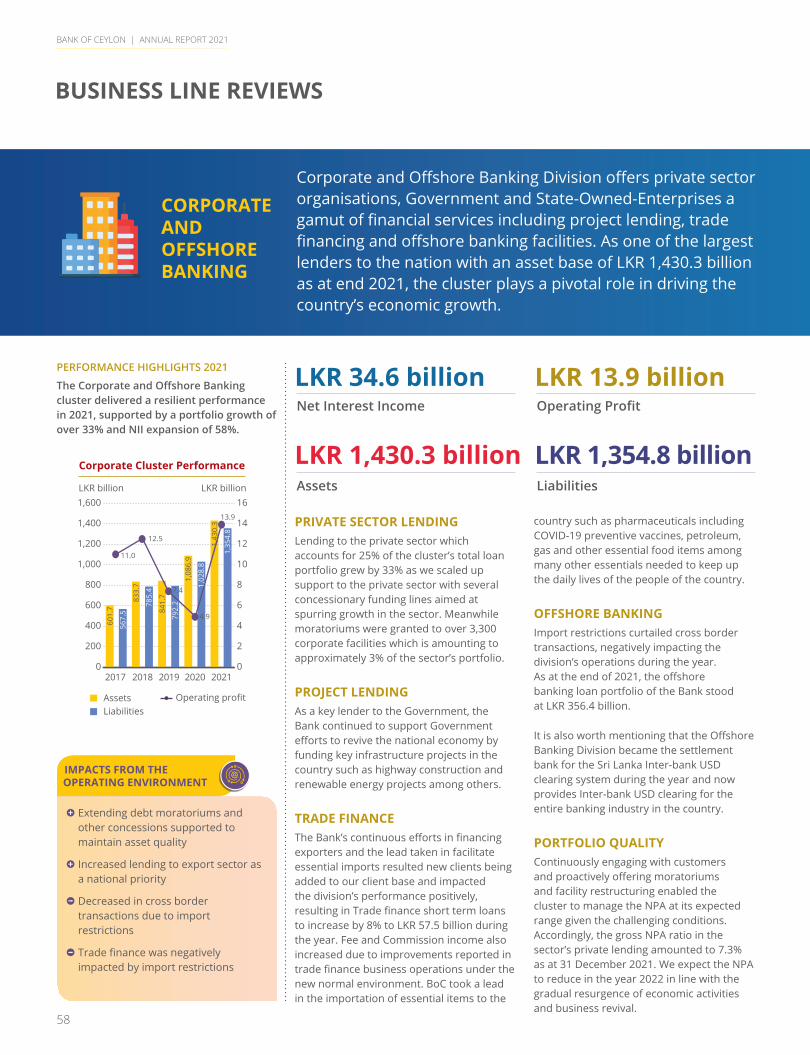
BANK OF CEYLON | ANNUAL REPORT 2021
58
BUSINESS LINE REVIEWS
CORPORATE AND OFFSHORE BANKING
Corporate and Offshore Banking Division offers private sector organisations, Government and State-Owned-Enterprises a gamut of financial services including project lending, trade financing and offshore banking facilities. As one of the largest lenders to the nation with an asset base of LKR 1,430.3 billion as at end 2021, the cluster plays a pivotal role in driving the country’s economic growth.
IMPACTS FROM THE OPERATING ENVIRONMENT
Extending debt moratoriums and other concessions supported to maintain asset quality
Increased lending to export sector as a national priority
Decreased in cross border transactions due to import restrictions
Trade finance was negatively impacted by import restrictions
PRIVATE SECTOR LENDING Lending to the private sector which accounts for 25% of the cluster’s total loan portfolio grew by 33% as we scaled up support to the private sector with several concessionary funding lines aimed at spurring growth in the sector. Meanwhile moratoriums were granted to over 3,300 corporate facilities which is amounting to approximately 3% of the sector’s portfolio.
PROJECT LENDING As a key lender to the Government, the Bank continued to support Government efforts to revive the national economy by funding key infrastructure projects in the country such as highway construction and renewable energy projects among others.
TRADE FINANCE The Bank’s continuous efforts in financing exporters and the lead taken in facilitate essential imports resulted new clients being added to our client base and impacted the division’s performance positively, resulting in Trade finance short term loans to increase by 8% to LKR 57.5 billion during the year. Fee and Commission income also increased due to improvements reported in trade finance business operations under the new normal environment. BoC took a lead in the importation of essential items to the
country such as pharmaceuticals including COVID-19 preventive vaccines, petroleum, gas and other essential food items among many other essentials needed to keep up the daily lives of the people of the country.
OFFSHORE BANKING Import restrictions curtailed cross border transactions, negatively impacting the division’s operations during the year. As at the end of 2021, the offshore banking loan portfolio of the Bank stood at LKR 356.4 billion.
It is also worth mentioning that the Offshore Banking Division became the settlement bank for the Sri Lanka Inter-bank USD clearing system during the year and now provides Inter-bank USD clearing for the entire banking industry in the country.
PORTFOLIO QUALITYContinuously engaging with customers and proactively offering moratoriums and facility restructuring enabled the cluster to manage the NPA at its expected range given the challenging conditions. Accordingly, the gross NPA ratio in the sector’s private lending amounted to 7.3% as at 31 December 2021. We expect the NPA to reduce in the year 2022 in line with the gradual resurgence of economic activities and business revival.
Corporate Cluster Performance
0
200
400
600
800
1,000
1,200
1,400
1,600LKR billion LKR billion
0
2
4
6
8
10
12
14
16
841.
7
785.
4
833.
7
567.
5
601.
7
792.
2
7.4
12.5
11.0
4.9
13.9
1,08
6.9
1,02
8.8
1,35
4.8
201920182017 2020 2021
AssetsLiabilities
Operating profit
1,43
0.3
Net Interest Income
Assets
Operating Profit
Liabilities
LKR 34.6 billion
LKR 1,430.3 billion
LKR 13.9 billion
LKR 1,354.8 billion
PERFORMANCE HIGHLIGHTS 2021
The Corporate and Offshore Banking cluster delivered a resilient performance in 2021, supported by a portfolio growth of over 33% and NII expansion of 58%.

BANK OF CEYLON | ANNUAL REPORT 2021
59
WAY FORWARDWe will continue to support the Government in its efforts to revive the economy in post COVID-19 through working capital and essential import financing and a greater focus on export and import substitute manufacturing based financing. We are optimistic that private sector credit growth will move on an upward trajectory supported by fiscal and monetary policy stimuli and will continue to enhance our offering in terms of product innovation, digitalisation and superior customer service with special focus to opportunities stemming from ongoing and new large scale projects and reaching to unreached geographies.
Opportunities Funding opportunities arising from new large scale infrastructure development
projects
Increased trade financing opportunities due to export thrust and gradual recovery of economy
Risks Prolonged import restrictions
Recurring waves of the pandemic and impact on socio-economic conditions, delaying the economic recovery will impact the portfolio quality
PERFORMANCE AGAINST STRATEGY
CUSTOMER CENTRICITY DIGITAL EXCELLENCE REWARDING CREDIT CULTURE AND HEALTHY
CREDIT PORTFOLIO
BUILDING A HIGH-PERFORMING
TEAM
STABILITY, GOVERNANCE
AND SUSTAINABLE GROWTH
Ongoing engagement with customers through the dedicated Business Revival Unit to offer personalised solutions to ease cash flow constraints and support business revival
Emphasis on customer service through staff training programmes
360 days service to Corporate clients despite COVID-19 related social distancing measures
Expanded our digital proposition to corporate clients with a range of features including online account opening, RTGS-B-SWIFT system for online RTGS payments, EPF/ETF direct debit facilities and 20 explore system introduced to convert export proceeds to LKR.
Facilitation of Inland Revenue Department payments via Smart Online Banking Corporate Module.
Established ‘BoC Export Circle’, as a one stop shop for aspiring export oriented SMEs to obtain financial and non-financial support.
Over 117 loans granted to COVID-19 impacted SMEs through Asian Infrastructure Investment Bank (AIIB) funding line
Remote working access granted to selected employees of the corporate segment
Special transport arrangements made for employees to report to work during lockdown
Virtual training and meetings
Ongoing ESG training for Project Finance teams in the Corporate segment
Overview Leadership Insights Our Bank Our Strategy Our Performance
Stakeholder Outcomes Accountability Financial Reports Compliance Annexes Supplimentary Information
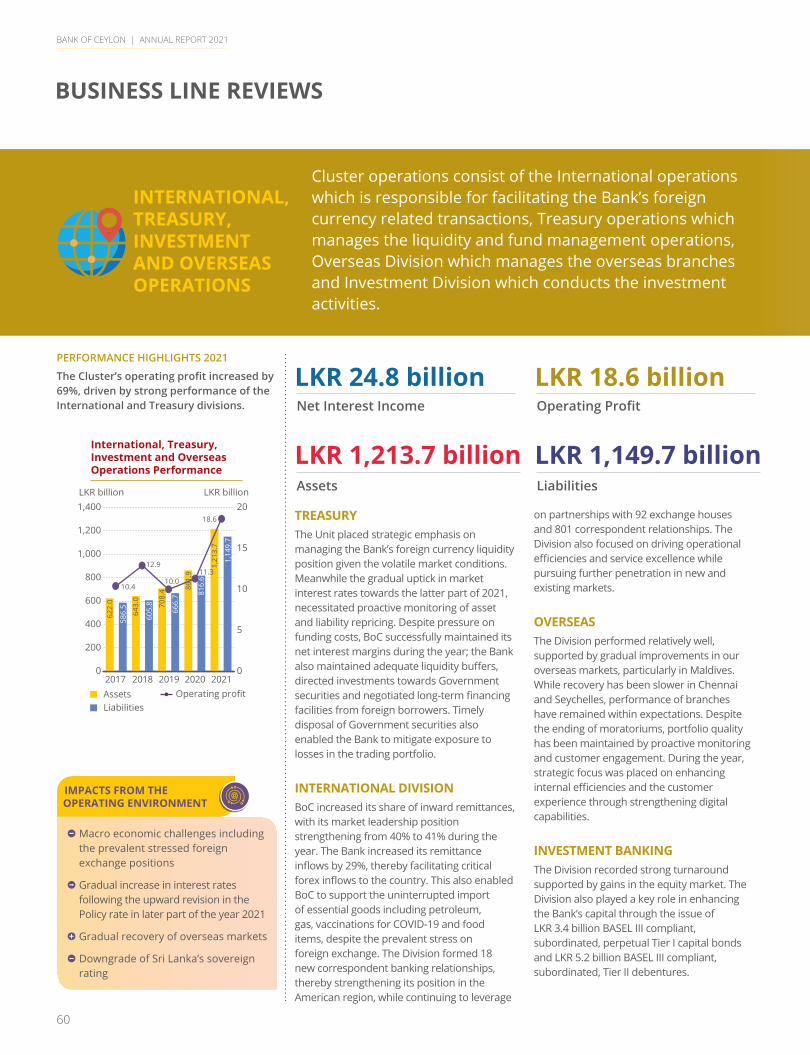
BANK OF CEYLON | ANNUAL REPORT 2021
60
BUSINESS LINE REVIEWS
INTERNATIONAL, TREASURY, INVESTMENT AND OVERSEAS OPERATIONS
Cluster operations consist of the International operations which is responsible for facilitating the Bank’s foreign currency related transactions, Treasury operations which manages the liquidity and fund management operations, Overseas Division which manages the overseas branches and Investment Division which conducts the investment activities.
IMPACTS FROM THE OPERATING ENVIRONMENT
Macro economic challenges including the prevalent stressed foreign exchange positions
Gradual increase in interest rates following the upward revision in the Policy rate in later part of the year 2021
Gradual recovery of overseas markets
Downgrade of Sri Lanka’s sovereign rating
TREASURYThe Unit placed strategic emphasis on managing the Bank’s foreign currency liquidity position given the volatile market conditions. Meanwhile the gradual uptick in market interest rates towards the latter part of 2021, necessitated proactive monitoring of asset and liability repricing. Despite pressure on funding costs, BoC successfully maintained its net interest margins during the year; the Bank also maintained adequate liquidity buffers, directed investments towards Government securities and negotiated long-term financing facilities from foreign borrowers. Timely disposal of Government securities also enabled the Bank to mitigate exposure to losses in the trading portfolio.
INTERNATIONAL DIVISIONBoC increased its share of inward remittances, with its market leadership position strengthening from 40% to 41% during the year. The Bank increased its remittance inflows by 29%, thereby facilitating critical forex inflows to the country. This also enabled BoC to support the uninterrupted import of essential goods including petroleum, gas, vaccinations for COVID-19 and food items, despite the prevalent stress on foreign exchange. The Division formed 18 new correspondent banking relationships, thereby strengthening its position in the American region, while continuing to leverage
on partnerships with 92 exchange houses and 801 correspondent relationships. The Division also focused on driving operational efficiencies and service excellence while pursuing further penetration in new and existing markets.
OVERSEASThe Division performed relatively well, supported by gradual improvements in our overseas markets, particularly in Maldives. While recovery has been slower in Chennai and Seychelles, performance of branches have remained within expectations. Despite the ending of moratoriums, portfolio quality has been maintained by proactive monitoring and customer engagement. During the year, strategic focus was placed on enhancing internal efficiencies and the customer experience through strengthening digital capabilities.
INVESTMENT BANKINGThe Division recorded strong turnaround supported by gains in the equity market. The Division also played a key role in enhancing the Bank’s capital through the issue of LKR 3.4 billion BASEL III compliant, subordinated, perpetual Tier I capital bonds and LKR 5.2 billion BASEL III compliant, subordinated, Tier II debentures.
PERFORMANCE HIGHLIGHTS 2021
The Cluster’s operating profit increased by 69%, driven by strong performance of the International and Treasury divisions.
International, Treasury, Investment and OverseasOperations Performance
0
200
400
600
800
1,000
1,200
1,400LKR billion LKR billion
0
5
10
15
20
708.
410.4
12.9
666.
7
643.
0
605.
8
622.
0
586.
5
816.
6
11.310.0
1,21
3.7
1,14
9.7
18.6
201920182017 2020 2021AssetsLiabilities
Operating profit
861.
9
Net Interest Income
Assets
Operating Profit
Liabilities
LKR 24.8 billion
LKR 1,213.7 billion
LKR 18.6 billion
LKR 1,149.7 billion

BANK OF CEYLON | ANNUAL REPORT 2021
61
WAY FORWARDPlans are underway to enhance non-debt forex inflows through leveraging our international partnerships. We will also seek to widen our product portfolio, particularly in Investment Banking and Treasury with the launch of margin trading and other derivative trading options. Digitalisation remains a key short to medium-term priority, as we seek to strengthen the digital proposition of our overseas branches.
Opportunities Expansion of our overseas presence through entry into new markets Digitalisation of operations to drive increased efficiencies and transformation of the
customer experience Increasing exposure to equity market investments
Risks Macroeconomic challenges including acute shortage of foreign currency and fiscal
constraints Equity market volatility Resurgence of infections with the emergence of new variants of COVID-19
PERFORMANCE AGAINST STRATEGY
CUSTOMER CENTRICITY DIGITAL EXCELLENCE
REWARDING CREDIT CULTURE
AND HEALTHY CREDIT PORTFOLIO
BUILDING A HIGH-PERFORMING
TEAM
STABILITY, GOVERNANCE
AND SUSTAINABLE GROWTH
Partnered with the Sri Lanka Foreign Employment Bureau to conduct 42 awareness programmes for prospective and current migrant workers with 2,100 participants
Uninterrupted operations at the Bandaranaike International Airport counter, despite pandemic-led disruptions
International customer support unit through social media being set-up at International Division
Placing more representatives covering areas and countries where Sri Lankan migrant employees are stationed
Strengthening the corresponding network with new employees being deployed at exchange houses and agents
The International Division upgraded its SMART Remit system thereby enabling real-time crediting of the remittances to the recipient account
Digitalisation of back-office operations in overseas branches
Launch of new internet and mobile banking platforms for the Malé branch
Restructuring pre-depature loan schemes and credit facilities available for migrant employees to be more attractive and hassle free
Managing NPA of overseas branches
Facilitate the COVID-19 related medical and quarantine requirements of overseas staff at the expense of the Bank
Continuous training for Overseas Branch staff
Emphasis on proactively managing the Bank’s forex liquidity position, given the prevalent forex limitations in the country
Timely repricing decisions to effectively manage the Bank’s net interest margins
Overview Leadership Insights Our Bank Our Strategy Our Performance
Stakeholder Outcomes Accountability Financial Reports Compliance Annexes Supplimentary Information
BANK OF CEYLON | ANNUAL REPORT 2021
62
STAKEHOLDER OUTCOMES
With an unmatched penetration rate of 65%, BoC caters to over 14.4 million individuals, micro-enterprises, SMEs, corporates and State-Owned Enterprises across the island.
CUSTOMERS
In delivering the Customer Centricity pillar of BoC’s strategy, the three business verticals work closely with dedicated centralised capabilities in the Product and Banking Development, Information Technology, Sales and Channel Management, Branch Credit Operations and Development Banking and Marketing Departments. This co-ordinated approach has enabled the Bank to deliver relevant and integrated solutions, accelerating the execution of its strategy.
CUSTOMER REVIVAL AND SUPPORTAs COVID-19 led disruptions continued to insert pressure on repayment capabilities, the Bank doubled down on its efforts in delivering the Rewarding Credit Culture and Healthy Credit portfolio pillar of the Bank’s strategy. Accordingly, increased support was granted to affected customers through extended moratoriums, concessions and restructuring facilities. Fresh facilities were also granted to affected businesses, thereby ensuring their survival and commercial sustainability. A dedicated Business Revival and Rehabilitation Unit was established with the aim of reviving underperforming and non-performing corporate customers through new facilities and by strengthening internal capabilities of those business entities. To date, this Unit has rehabilitated over 16 corporate customers, securing the livelihoods of around 5,000 individuals employed in these organisations.
Value of moratoriums granted
No. of customers facilitated via moratoriums
Value of facilities rescheduled
No. of customers rehabilitated
LKR 380.6 billion
97,906
LKR 23.3 billion
16
CUSTOMER-CENTRIC SOLUTIONSThe Bank offers a gamut of investment, lending, transactional and investment banking solutions catering to its diverse customer base. Product conceptualisation and development follows ongoing assessment of market dynamics, the competitive landscape and customer needs. During the year, the Bank sought to enhance its product proposition in selected market segments through value-addition to existing products and launching new products and channels. These included the following:
Launched BOC CONNECT Agent Banking Solution to cater rural masses
Launched BoC Fuel Card
Launch of ‘Ran Kekulu’ minor savings product with digital features such as smart card for balance inquiries and transaction updates via SMS
Value addition in ‘Abhimana’ senior citizens’ proposition by providing funding for start-ups and entrepreneurial ventures.
Launch of Smart Salary Saver Account with attractive features including investments, cash management and salary advance among others.
Launch of Fuel Card for Corporates operating fleets of vehicles.
Refined the ‘Divi Udana’ proposition by combining a range of different loan schemes to fewer, bundled propositions.
LISTENING TO OUR CUSTOMERS
Engagement platforms Periodic satisfaction surveys
Direct engagement through branches and digital channels (ongoing)
Website and social media platforms (ongoing)
Customer hotline (ongoing)
Financial literacy programmes (ongoing)
Marketing, advertising and promotions (ongoing)
What they require Speedy and convenient service
Convenient, reliable and secured platforms
Debt relief
Transparent pricing
Access to finance
How we responded Customer centric solutions
Focus on customer experience
Enhancing digital offerings
Reduce transaction turnaround time through automation

BANK OF CEYLON | ANNUAL REPORT 2021
63
Beneficiaries of awareness programmes targeted export oriented SME customers
No. of new SME level exporters supported
35180
VALUE PROPOSITION OF EXPORT CIRCLE
Export circle set up during the year provided a platform for effective networking opportunities and capacity building in addition to financial support for exporters, with priority being given to export led SMEs. Through this program, exporters are given the opportunity to obtain the support from organisations such as Export Development Board (EDB), National Enterprise Development Authority (NEDA) and SEDA on access to markets, insurance and banking arrangements.
FINANCIAL SUPPORT
NETWORKING
TECHNICAL SUPPORT
ACCE
SSIN
G MARKETS
PRODUCT AND
Overview Leadership Insights Our Bank Our Strategy Our Performance
Stakeholder Outcomes Accountability Financial Reports Compliance Annexes Supplimentary Information
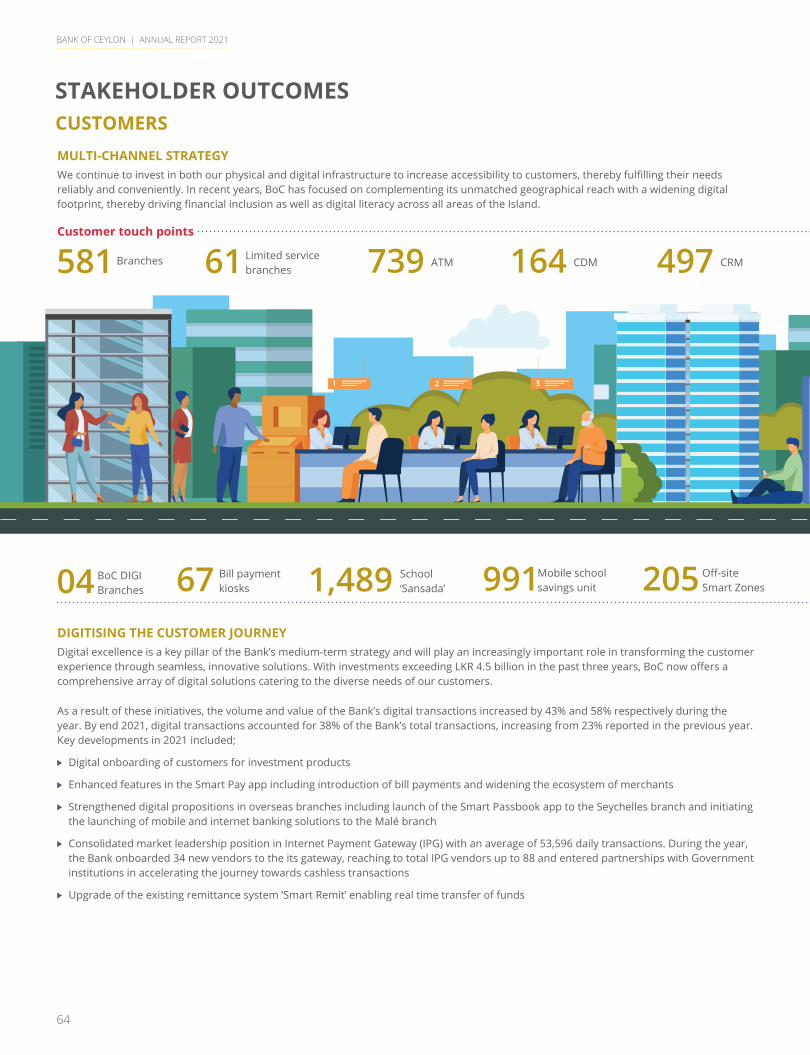
BANK OF CEYLON | ANNUAL REPORT 2021
64
MULTI-CHANNEL STRATEGYWe continue to invest in both our physical and digital infrastructure to increase accessibility to customers, thereby fulfilling their needs reliably and conveniently. In recent years, BoC has focused on complementing its unmatched geographical reach with a widening digital footprint, thereby driving financial inclusion as well as digital literacy across all areas of the Island.
Customer touch points
581 61
991
739 164 497
2051,489
Branches Limited service branches
Mobile school savings unit
ATM CDM CRM
Off-site Smart Zones
School ‘Sansada’
STAKEHOLDER OUTCOMES
DIGITISING THE CUSTOMER JOURNEYDigital excellence is a key pillar of the Bank’s medium-term strategy and will play an increasingly important role in transforming the customer experience through seamless, innovative solutions. With investments exceeding LKR 4.5 billion in the past three years, BoC now offers a comprehensive array of digital solutions catering to the diverse needs of our customers.
As a result of these initiatives, the volume and value of the Bank’s digital transactions increased by 43% and 58% respectively during the year. By end 2021, digital transactions accounted for 38% of the Bank’s total transactions, increasing from 23% reported in the previous year. Key developments in 2021 included;
Digital onboarding of customers for investment products
Enhanced features in the Smart Pay app including introduction of bill payments and widening the ecosystem of merchants
Strengthened digital propositions in overseas branches including launch of the Smart Passbook app to the Seychelles branch and initiating the launching of mobile and internet banking solutions to the Malé branch
Consolidated market leadership position in Internet Payment Gateway (IPG) with an average of 53,596 daily transactions. During the year, the Bank onboarded 34 new vendors to the its gateway, reaching to total IPG vendors up to 88 and entered partnerships with Government institutions in accelerating the journey towards cashless transactions
Upgrade of the existing remittance system ‘Smart Remit’ enabling real time transfer of funds
CUSTOMERS
67 Bill payment kiosks04 BoC DIGI
Branches
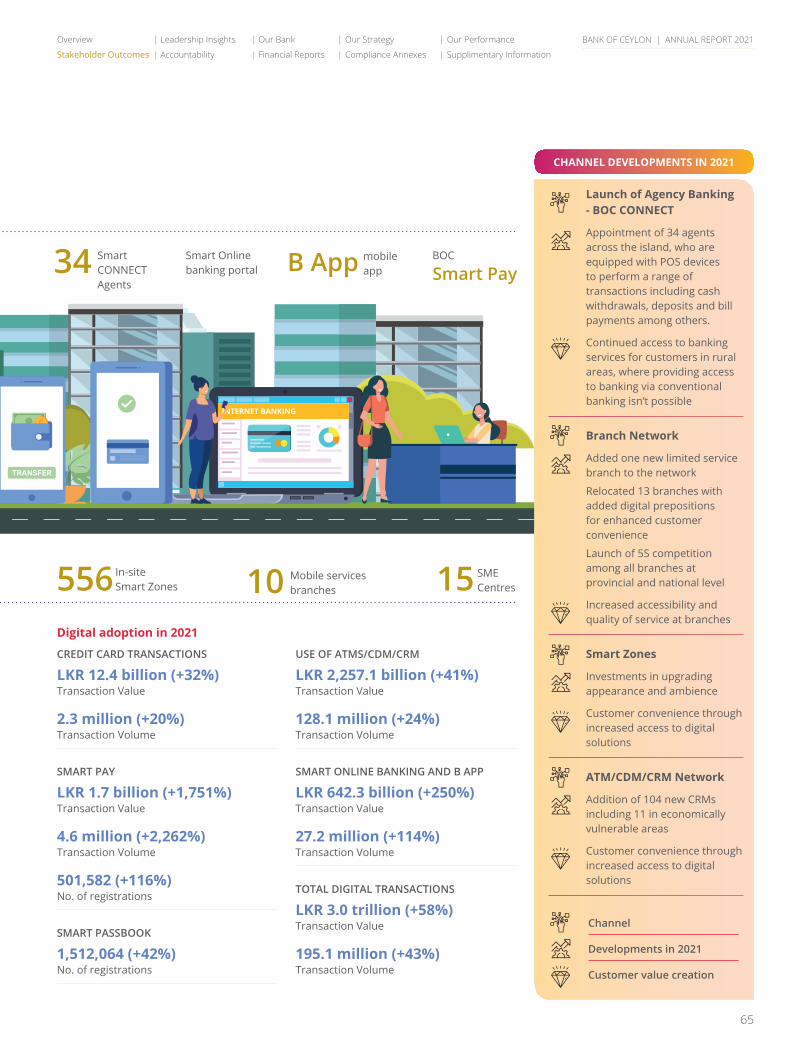
BANK OF CEYLON | ANNUAL REPORT 2021
65
CHANNEL DEVELOPMENTS IN 2021
556
34
10 15
B AppSmart Online banking portal
In-site Smart Zones
Smart CONNECT Agents
mobile app
Mobile services branches
SME Centres
BOC
Smart Pay
Launch of Agency Banking - BOC CONNECT
Appointment of 34 agents across the island, who are equipped with POS devices to perform a range of transactions including cash withdrawals, deposits and bill payments among others.
Continued access to banking services for customers in rural areas, where providing access to banking via conventional banking isn’t possible
Branch Network
Added one new limited service branch to the network
Relocated 13 branches with added digital prepositions for enhanced customer convenience
Launch of 5S competition among all branches at provincial and national level
Increased accessibility and quality of service at branches
Smart Zones
Investments in upgrading appearance and ambience
Customer convenience through increased access to digital solutions
ATM/CDM/CRM Network
Addition of 104 new CRMs including 11 in economically vulnerable areas
Customer convenience through increased access to digital solutions
Digital adoption in 2021
CREDIT CARD TRANSACTIONS
LKR 12.4 billion (+32%)Transaction Value
2.3 million (+20%)Transaction Volume
SMART PAY
LKR 1.7 billion (+1,751%)Transaction Value
4.6 million (+2,262%)Transaction Volume
501,582 (+116%)No. of registrations
SMART PASSBOOK
1,512,064 (+42%)No. of registrations
USE OF ATMS/CDM/CRM
LKR 2,257.1 billion (+41%)Transaction Value
128.1 million (+24%)Transaction Volume
SMART ONLINE BANKING AND B APP
LKR 642.3 billion (+250%)Transaction Value
27.2 million (+114%)Transaction Volume
TOTAL DIGITAL TRANSACTIONS
LKR 3.0 trillion (+58%)Transaction Value
195.1 million (+43%)Transaction Volume
Channel
Developments in 2021
Customer value creation
Overview Leadership Insights Our Bank Our Strategy Our Performance
Stakeholder Outcomes Accountability Financial Reports Compliance Annexes Supplimentary Information
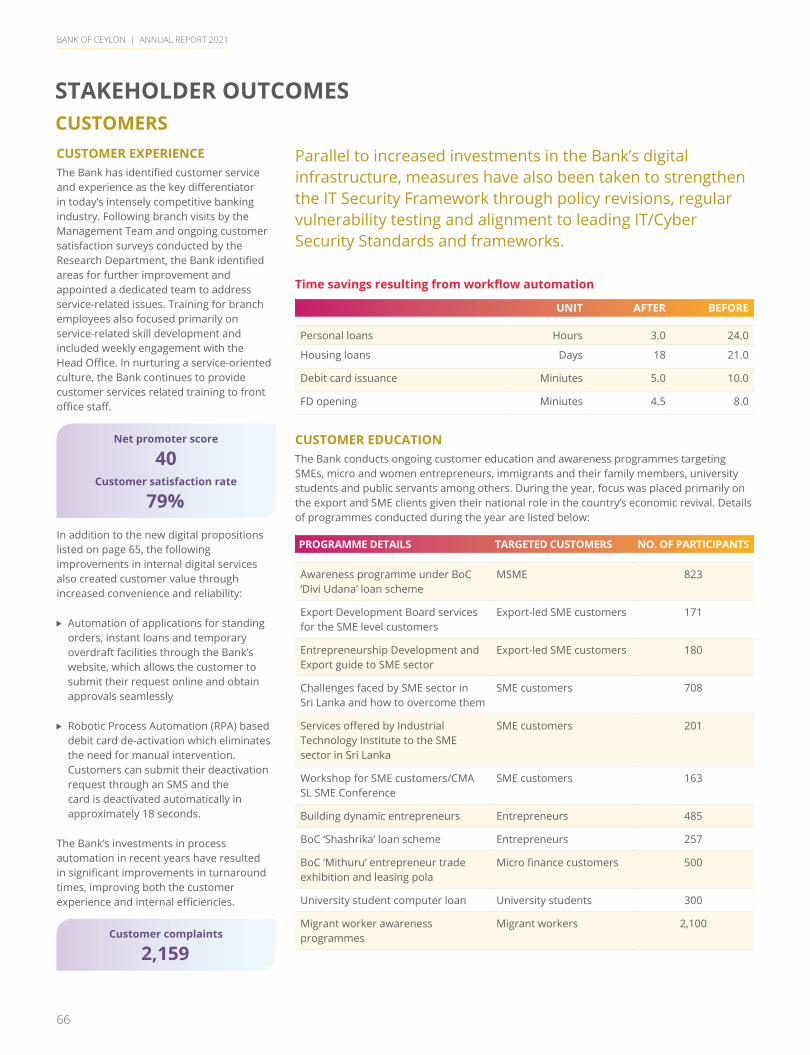
BANK OF CEYLON | ANNUAL REPORT 2021
66
STAKEHOLDER OUTCOMES
CUSTOMER EXPERIENCE The Bank has identified customer service and experience as the key differentiator in today’s intensely competitive banking industry. Following branch visits by the Management Team and ongoing customer satisfaction surveys conducted by the Research Department, the Bank identified areas for further improvement and appointed a dedicated team to address service-related issues. Training for branch employees also focused primarily on service-related skill development and included weekly engagement with the Head Office. In nurturing a service-oriented culture, the Bank continues to provide customer services related training to front office staff.
Net promoter score
40Customer satisfaction rate
79%In addition to the new digital propositions listed on page 65, the following improvements in internal digital services also created customer value through increased convenience and reliability:
Automation of applications for standing orders, instant loans and temporary overdraft facilities through the Bank’s website, which allows the customer to submit their request online and obtain approvals seamlessly
Robotic Process Automation (RPA) based debit card de-activation which eliminates the need for manual intervention. Customers can submit their deactivation request through an SMS and the card is deactivated automatically in approximately 18 seconds.
The Bank’s investments in process automation in recent years have resulted in significant improvements in turnaround times, improving both the customer experience and internal efficiencies.
Customer complaints
2,159
Time savings resulting from workflow automation
UNIT AFTER BEFORE
Personal loans Hours 3.0 24.0
Housing loans Days 18 21.0
Debit card issuance Miniutes 5.0 10.0
FD opening Miniutes 4.5 8.0
CUSTOMER EDUCATIONThe Bank conducts ongoing customer education and awareness programmes targeting SMEs, micro and women entrepreneurs, immigrants and their family members, university students and public servants among others. During the year, focus was placed primarily on the export and SME clients given their national role in the country’s economic revival. Details of programmes conducted during the year are listed below:
PROGRAMME DETAILS TARGETED CUSTOMERS NO. OF PARTICIPANTS
Awareness programme under BoC ‘Divi Udana’ loan scheme
MSME 823
Export Development Board services for the SME level customers
Export-led SME customers 171
Entrepreneurship Development and Export guide to SME sector
Export-led SME customers 180
Challenges faced by SME sector in Sri Lanka and how to overcome them
SME customers 708
Services offered by Industrial Technology Institute to the SME sector in Sri Lanka
SME customers 201
Workshop for SME customers/CMA SL SME Conference
SME customers 163
Building dynamic entrepreneurs Entrepreneurs 485
BoC ‘Shashrika’ loan scheme Entrepreneurs 257
BoC ‘Mithuru’ entrepreneur trade exhibition and leasing pola
Micro finance customers 500
University student computer loan University students 300
Migrant worker awareness programmes
Migrant workers 2,100
CUSTOMERS
Parallel to increased investments in the Bank’s digital infrastructure, measures have also been taken to strengthen the IT Security Framework through policy revisions, regular vulnerability testing and alignment to leading IT/Cyber Security Standards and frameworks.
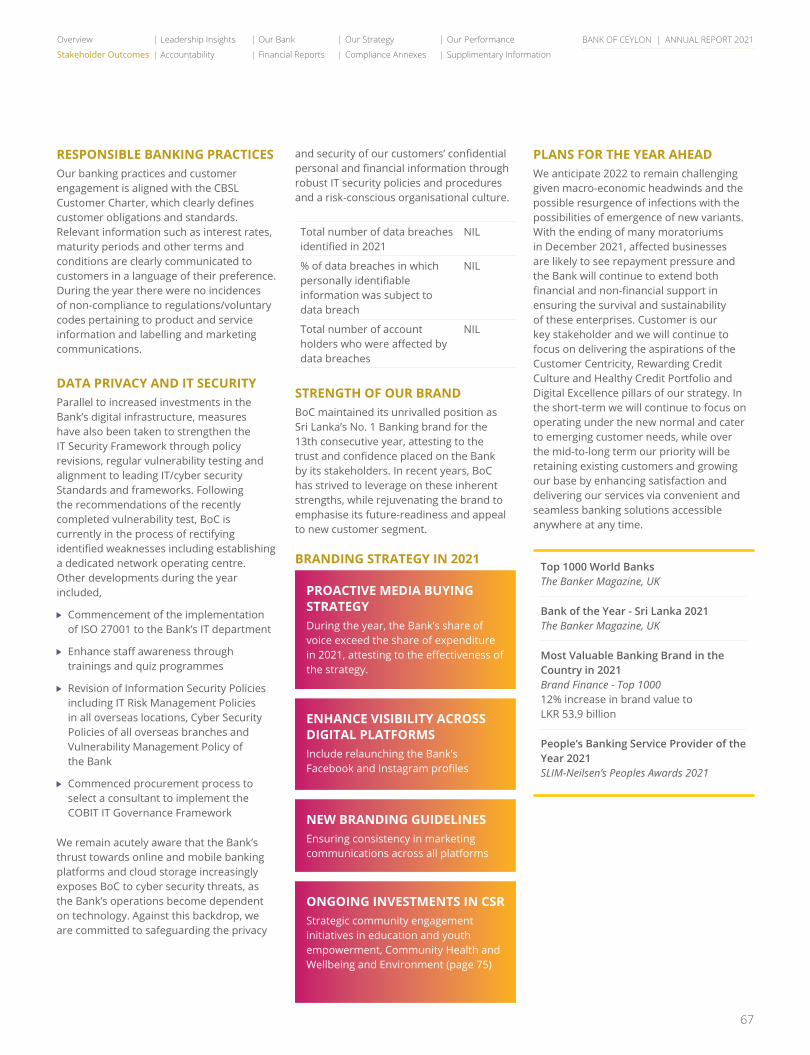
BANK OF CEYLON | ANNUAL REPORT 2021
67
RESPONSIBLE BANKING PRACTICESOur banking practices and customer engagement is aligned with the CBSL Customer Charter, which clearly defines customer obligations and standards. Relevant information such as interest rates, maturity periods and other terms and conditions are clearly communicated to customers in a language of their preference. During the year there were no incidences of non-compliance to regulations/voluntary codes pertaining to product and service information and labelling and marketing communications.
DATA PRIVACY AND IT SECURITY Parallel to increased investments in the Bank’s digital infrastructure, measures have also been taken to strengthen the IT Security Framework through policy revisions, regular vulnerability testing and alignment to leading IT/cyber security Standards and frameworks. Following the recommendations of the recently completed vulnerability test, BoC is currently in the process of rectifying identified weaknesses including establishing a dedicated network operating centre. Other developments during the year included,
Commencement of the implementation of ISO 27001 to the Bank’s IT department
Enhance staff awareness through trainings and quiz programmes
Revision of Information Security Policies including IT Risk Management Policies in all overseas locations, Cyber Security Policies of all overseas branches and Vulnerability Management Policy of the Bank
Commenced procurement process to select a consultant to implement the COBIT IT Governance Framework
We remain acutely aware that the Bank’s thrust towards online and mobile banking platforms and cloud storage increasingly exposes BoC to cyber security threats, as the Bank’s operations become dependent on technology. Against this backdrop, we are committed to safeguarding the privacy
and security of our customers’ confidential personal and financial information through robust IT security policies and procedures and a risk-conscious organisational culture.
Total number of data breaches identified in 2021
NIL
% of data breaches in which personally identifiable information was subject to data breach
NIL
Total number of account holders who were affected by data breaches
NIL
STRENGTH OF OUR BRANDBoC maintained its unrivalled position as Sri Lanka’s No. 1 Banking brand for the 13th consecutive year, attesting to the trust and confidence placed on the Bank by its stakeholders. In recent years, BoC has strived to leverage on these inherent strengths, while rejuvenating the brand to emphasise its future-readiness and appeal to new customer segment.
PROACTIVE MEDIA BUYING STRATEGYDuring the year, the Bank’s share of voice exceed the share of expenditure in 2021, attesting to the effectiveness of the strategy.
ENHANCE VISIBILITY ACROSS DIGITAL PLATFORMSInclude relaunching the Bank’s Facebook and Instagram profiles
NEW BRANDING GUIDELINES Ensuring consistency in marketing communications across all platforms
ONGOING INVESTMENTS IN CSRStrategic community engagement initiatives in education and youth empowerment, Community Health and Wellbeing and Environment (page 75)
BRANDING STRATEGY IN 2021Top 1000 World BanksThe Banker Magazine, UK
Bank of the Year - Sri Lanka 2021The Banker Magazine, UK
Most Valuable Banking Brand in the Country in 2021Brand Finance - Top 100012% increase in brand value to LKR 53.9 billion
People’s Banking Service Provider of the Year 2021SLIM-Neilsen’s Peoples Awards 2021
PLANS FOR THE YEAR AHEADWe anticipate 2022 to remain challenging given macro-economic headwinds and the possible resurgence of infections with the possibilities of emergence of new variants. With the ending of many moratoriums in December 2021, affected businesses are likely to see repayment pressure and the Bank will continue to extend both financial and non-financial support in ensuring the survival and sustainability of these enterprises. Customer is our key stakeholder and we will continue to focus on delivering the aspirations of the Customer Centricity, Rewarding Credit Culture and Healthy Credit Portfolio and Digital Excellence pillars of our strategy. In the short-term we will continue to focus on operating under the new normal and cater to emerging customer needs, while over the mid-to-long term our priority will be retaining existing customers and growing our base by enhancing satisfaction and delivering our services via convenient and seamless banking solutions accessible anywhere at any time.
Overview Leadership Insights Our Bank Our Strategy Our Performance
Stakeholder Outcomes Accountability Financial Reports Compliance Annexes Supplimentary Information

BANK OF CEYLON | ANNUAL REPORT 2021
68
As the largest employer in the banking sector, we offer an inclusive work environment that fosters engaged and empowered individuals who can drive the Nation’s banking sector into the future.
OUR EMPLOYEES
Employment byContract and gender
0
2,000
4,000
6,000
8,000
10,000
2020
Permanent Outsourced Contract
2021
2020
2021
2020
2021
No.
MaleFemale
3,42
5
3,36
7
5,05
4
4,97
0
1,32
3
1,39
027 16
32 25
PERMANENT OUTSOURCED CONTRACT
Western 3,620 351 13Central 723 160 1Eastern 469 131 -Northern 521 120 1North Central 580 127 4North-Western 676 131 5Sabaragamuwa 552 121 1Southern 740 153 -Uva 456 118 -Total 8,337 1,412 25
OUR TEAMThe Bank has a team of 8,337 strong team deployedacross of nine provinces of Sri Lanka and also in the branches in Maldives, Seychells and India and in the Subsidiary Bank in London they represent multi religions, ethnicities and socio-economic backgrounds bringing diversity to our culture. As one of the industry’s most preferred employers, BoC has been able to attract the country’s top talent, who are the driving force behind the Bank’s many achievements. Employees8,337
A DIVERSE TEAMThe diversity of team BoC reflects the Bank’s commitment to catering to the needs of its diverse clientele. Gender diversity is represented by one of the highest female representations in the industry at 60%. The ratio of basic salary between women and men continued to remain 1:1. The Bank’s HR Policy ensures equal opportunity and an anti-sexual harassment environment. The Bank also has a separate policy on Employee Grievance. These policies ensure the creation of a conducive environment in which women can thrive, as demonstrated by 42% female representation at management level and relatively high return to work from parental leave.
STAKEHOLDER OUTCOMES
Employees byCategory and Gender
0
500
1,000
1,500
2,000
2,500
Corp
orat
eM
anag
emen
t (D
GM
)
Exec
utiv
eM
anag
emen
t (AG
M)
Chie
fM
anag
er
Seni
or M
anag
er
Bran
ch M
anag
er a
ndAs
sist
ant M
anag
er g
rade
s
Man
agem
ent T
rain
ees
and
Oth
er o
ffice
r gr
ades
Staff
Ass
ista
nts
and
Allie
d gr
ades
Offi
ce A
ssis
tant
s an
dAl
lied
grad
es
No.
MaleFemale
15 2 26 28 52 62 64 9252
181
372
11,
524
1,57
02,
434
398
15
LISTENING TO OUR EMPLOYEES
Engagement platforms Multi-level staff meetings (ongoing)
Open door culture (ongoing)
Grievance handling mechanism (ongoing)
Virtual engagement through tvBOC (ongoing)
Performance appraisals (Annual)
Engagement through trade unions (ongoing)
Year-round activity calendar (ongoing)
What they require Competitive remuneration schemes
Safe work place
Career progression
Opportunities for skill development
Equal opportunities
Job security
How we responded Measures to ensure physical and
mental well-being
Ongoing opportunities for training and skill development
Attractive reward and compensation structures
OUR TEAMThe Bank has a strong team comprise of 8,337 employees deployed across of nine provinces of Sri Lanka and also in the branches in Maldives, Seychells and India and in the Subsidiary Bank in London. They represent multi religions, ethnicities and socio-economic backgrounds bringing diversity to our culture. As one of the industry’s most preferred employers, BoC has been able to attract the country’s top talent, who are the driving force behind the Bank’s many achievements.
Employees
8,337
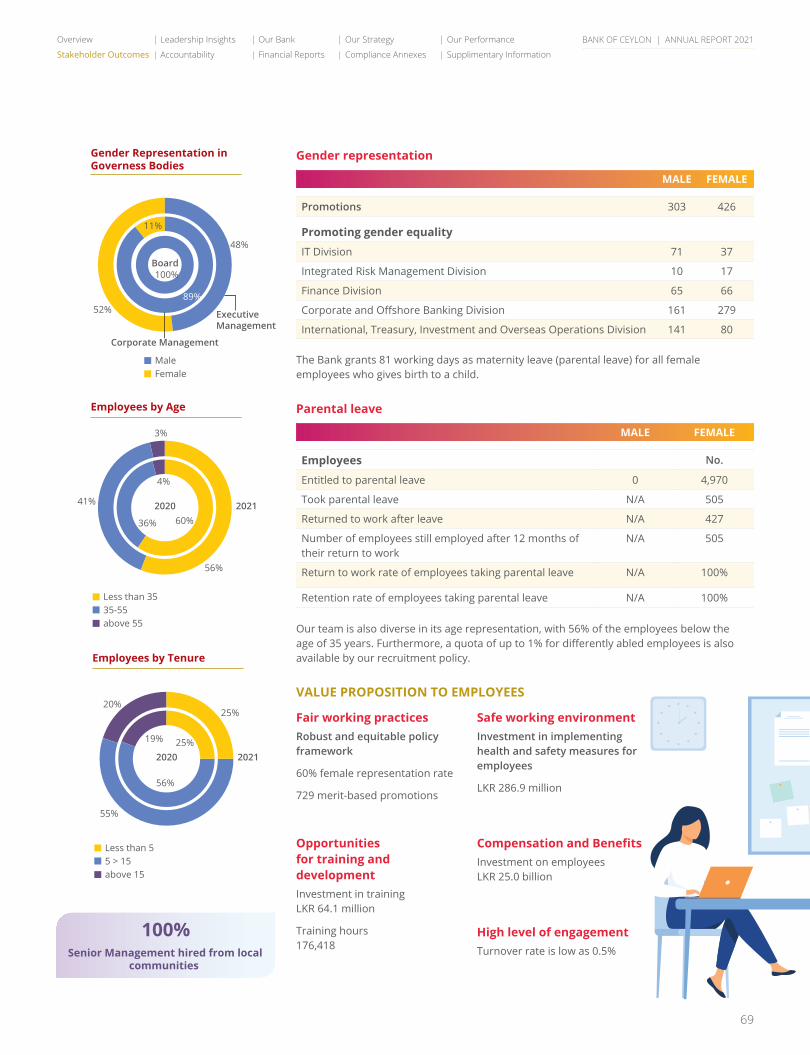
BANK OF CEYLON | ANNUAL REPORT 2021
69
Gender representation
MALE FEMALE
Promotions 303 426
Promoting gender equality
IT Division 71 37
Integrated Risk Management Division 10 17
Finance Division 65 66
Corporate and Offshore Banking Division 161 279
International, Treasury, Investment and Overseas Operations Division 141 80
The Bank grants 81 working days as maternity leave (parental leave) for all female employees who gives birth to a child.
Parental leave
MALE FEMALE
Employees No.
Entitled to parental leave 0 4,970
Took parental leave N/A 505
Returned to work after leave N/A 427
Number of employees still employed after 12 months of their return to work
N/A 505
Return to work rate of employees taking parental leave N/A 100%
Retention rate of employees taking parental leave N/A 100%
Our team is also diverse in its age representation, with 56% of the employees below the age of 35 years. Furthermore, a quota of up to 1% for differently abled employees is also available by our recruitment policy.
VALUE PROPOSITION TO EMPLOYEES
Employees by Age
Less than 3535-55above 55
41%
3%
56%
60%36%
4%
2020 2021
Gender Representation inGoverness Bodies
MaleFemale
ExecutiveManagement
Board
Corporate Management
100%
48%
52%89%
11%
Employees by Tenure
Less than 55 > 15above 15
55%
20%25%
56%
19% 25%2020 2021
Fair working practicesRobust and equitable policy framework
60% female representation rate
729 merit-based promotions
Opportunities for training and developmentInvestment in trainingLKR 64.1 million
Training hours176,418
Safe working environmentInvestment in implementing health and safety measures for employees
LKR 286.9 million
Compensation and BenefitsInvestment on employees LKR 25.0 billion
High level of engagementTurnover rate is low as 0.5%
Overview Leadership Insights Our Bank Our Strategy Our Performance
Stakeholder Outcomes Accountability Financial Reports Compliance Annexes Supplimentary Information
100%Senior Management hired from local
communities
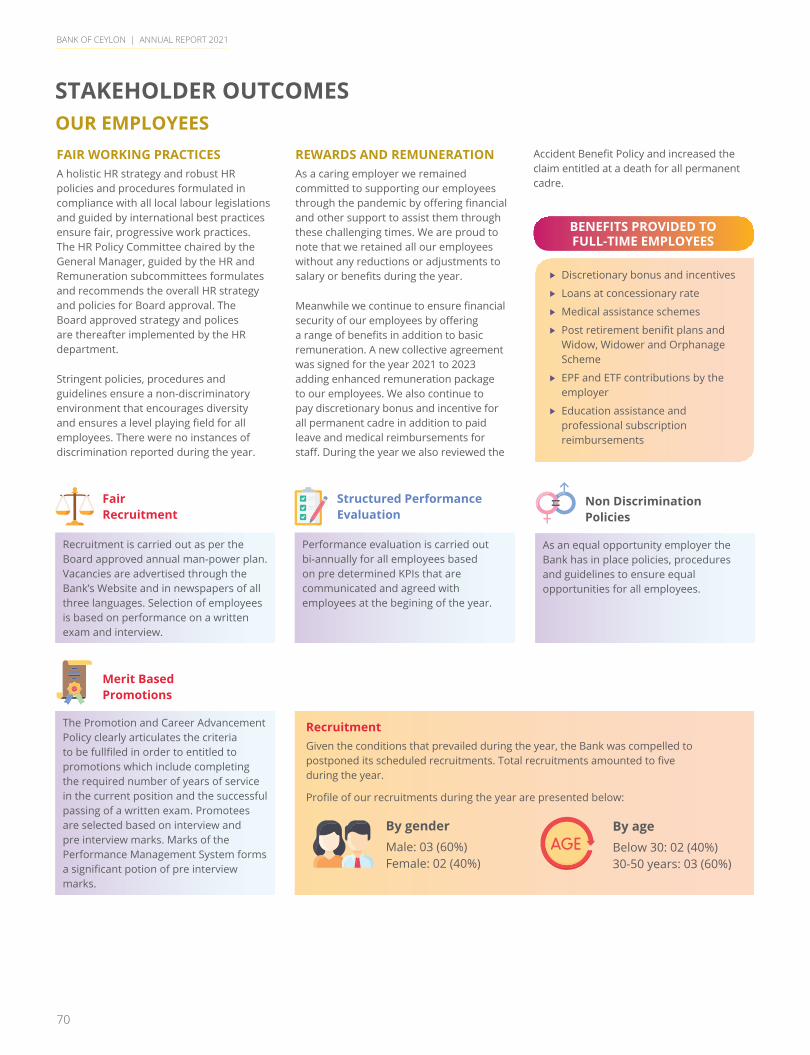
BANK OF CEYLON | ANNUAL REPORT 2021
70
BENEFITS PROVIDED TO FULL-TIME EMPLOYEES
FAIR WORKING PRACTICESA holistic HR strategy and robust HR policies and procedures formulated in compliance with all local labour legislations and guided by international best practices ensure fair, progressive work practices. The HR Policy Committee chaired by the General Manager, guided by the HR and Remuneration subcommittees formulates and recommends the overall HR strategy and policies for Board approval. The Board approved strategy and polices are thereafter implemented by the HR department.
Stringent policies, procedures and guidelines ensure a non-discriminatory environment that encourages diversity and ensures a level playing field for all employees. There were no instances of discrimination reported during the year.
Recruitment is carried out as per the Board approved annual man-power plan. Vacancies are advertised through the Bank’s Website and in newspapers of all three languages. Selection of employees is based on performance on a written exam and interview.
Performance evaluation is carried out bi-annually for all employees based on pre determined KPIs that are communicated and agreed with employees at the begining of the year.
As an equal opportunity employer the Bank has in place policies, procedures and guidelines to ensure equal opportunities for all employees.
The Promotion and Career Advancement Policy clearly articulates the criteria to be fullfiled in order to entitled to promotions which include completing the required number of years of service in the current position and the successful passing of a written exam. Promotees are selected based on interview and pre interview marks. Marks of the Performance Management System forms a significant potion of pre interview marks.
Fair Recruitment
Merit Based Promotions
Structured Performance Evaluation
Non Discrimination Policies
REWARDS AND REMUNERATION As a caring employer we remained committed to supporting our employees through the pandemic by offering financial and other support to assist them through these challenging times. We are proud to note that we retained all our employees without any reductions or adjustments to salary or benefits during the year.
Meanwhile we continue to ensure financial security of our employees by offering a range of benefits in addition to basic remuneration. A new collective agreement was signed for the year 2021 to 2023 adding enhanced remuneration package to our employees. We also continue to pay discretionary bonus and incentive for all permanent cadre in addition to paid leave and medical reimbursements for staff. During the year we also reviewed the
OUR EMPLOYEESSTAKEHOLDER OUTCOMES
Discretionary bonus and incentives
Loans at concessionary rate
Medical assistance schemes
Post retirement benifit plans and Widow, Widower and Orphanage Scheme
EPF and ETF contributions by the employer
Education assistance and professional subscription reimbursements
Recruitment Given the conditions that prevailed during the year, the Bank was compelled to postponed its scheduled recruitments. Total recruitments amounted to five during the year.
Profile of our recruitments during the year are presented below:
By genderMale: 03 (60%)Female: 02 (40%)
By ageBelow 30: 02 (40%)30-50 years: 03 (60%)
Accident Benefit Policy and increased the claim entitled at a death for all permanent cadre.

BANK OF CEYLON | ANNUAL REPORT 2021
71
COVID-19 co-ordinated interventions Vaccination drive for BoC employees in
partnership with the Epidemiology Unit and Divisional MOH offices.
COVID-19 awareness programmes through virtual channels and tvBOC.
Transport service facilities/transport cost reimbursement.
Reimbursement of all COVID-19 related expenditure of staff and their close family members via the Bank’s Medical assistance scheme.
Safe working practices including roster based work arrangements, remote working arrangements and provision of PPE.
HOLISTIC TRAINING OPPORTUNITIESTraining continues to be a core element of our employee value proposition and we dedicate significant resources towards this end. A total of LKR 64.1 million was allocated towards training activities during the year which translated to a total of 176,418 man hours of training delivered via 3,015 programmes.
We continued with our training activities despite the disruptions caused by the pandemic by shifting to virtual platforms and leveraging in-house communications tools such as MSTeams, Zoom and the tvBOC channel. We have now gradually recommenced physical training at our dedicated training centre at Maharagama with all safety protocols in place. Training
during the year focused on the core areas of credit management, technical and customer service skills.
Key training programmes during the year included the following: Certificate in project finance
AML/CFT Compliance for financial institutes
Online programme on granting and recovering of credit facilities
Foreign exchange regulations for financial institutes
Best practices for banking tellers
Online programme on internal controls and auditing for financial institutes
Monetory policy and monetory operations
Artificial intelligence for banking business
Interim treatment centres and hospitalisation facility arrangements for infected staff members and families.
SAFE WORKING ENVIRONMENT The Bank has in place a comprehensive employee health and safety guidelines which covers key areas such as medical benefits, workplace safety and health and wellness. Health and safety topics such as employee entitlements under the medical assistance scheme are also covered in collective agreements to ensure worker participation and consultation in
occupational health and safety matters. In addition to availability of an in-house doctor and pharmacy at the Head Office, all permanent employees are entitled to a comprehensive medical assistance scheme which include re-imbursement of outpatient treatment as well as hospitalisations including PCR and RAT testing and COVID-19 treatments among others.
As the pandemic began to unfold, the Bank formed a Special Safety Task Force comprising Senior Management to assess the risks and ensure the safety of all employees amidst the rising health and safety concerns. Key initiatives implemented during the year to ensure a safe work environment are depicted alongside.
Focus Areas of Training
Compliance, Legal and Risk General BankingITLending and RecoveryFinance and Treasury OperationsSkills DevelopmentOthers
14%
16%
5%
18%10%
19%
18%
Overview Leadership Insights Our Bank Our Strategy Our Performance
Stakeholder Outcomes Accountability Financial Reports Compliance Annexes Supplimentary Information
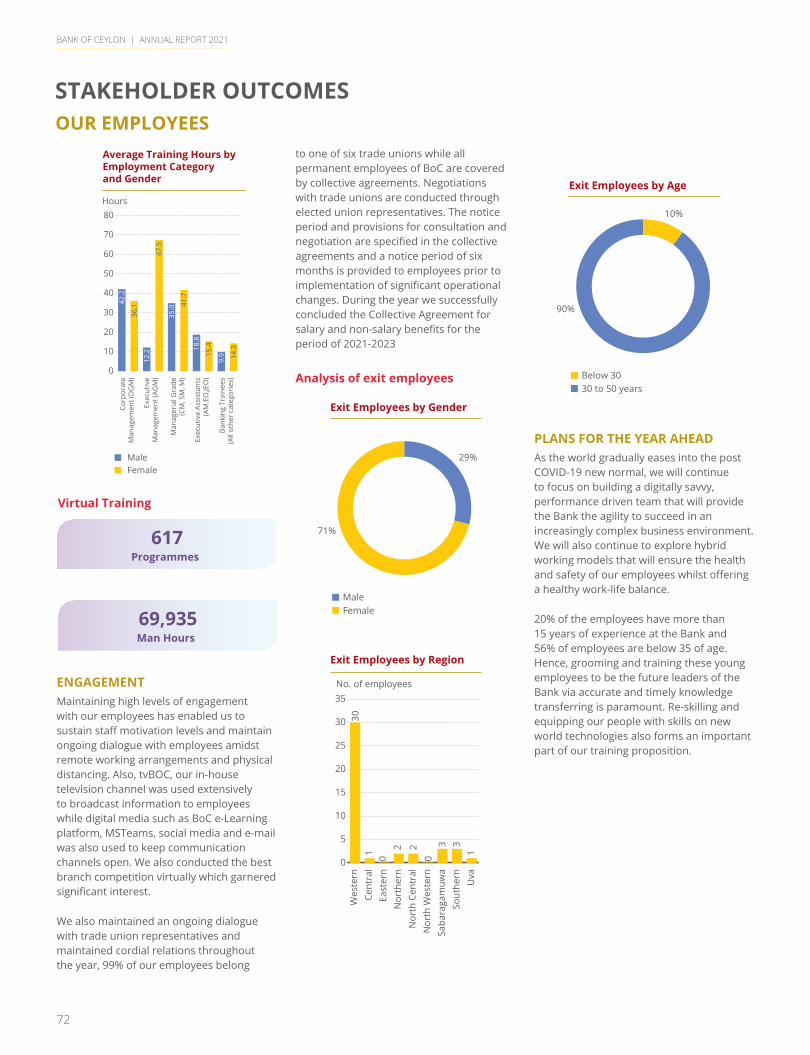
BANK OF CEYLON | ANNUAL REPORT 2021
72
to one of six trade unions while all permanent employees of BoC are covered by collective agreements. Negotiations with trade unions are conducted through elected union representatives. The notice period and provisions for consultation and negotiation are specified in the collective agreements and a notice period of six months is provided to employees prior to implementation of significant operational changes. During the year we successfully concluded the Collective Agreement for salary and non-salary benefits for the period of 2021-2023
Analysis of exit employees
Exit Employees by Gender
MaleFemale
71%
29%
Exit Employees by Region
0
5
10
15
20
25
30
35
Wes
tern
Cent
ral
East
ern
Nor
ther
nN
orth
Cen
tral
Nor
th W
este
rnSa
bara
gam
uwa
Sout
hern
Uva
No. of employees
301 0 0
2 2 3 31
PLANS FOR THE YEAR AHEADAs the world gradually eases into the post COVID-19 new normal, we will continue to focus on building a digitally savvy, performance driven team that will provide the Bank the agility to succeed in an increasingly complex business environment. We will also continue to explore hybrid working models that will ensure the health and safety of our employees whilst offering a healthy work-life balance.
20% of the employees have more than 15 years of experience at the Bank and 56% of employees are below 35 of age. Hence, grooming and training these young employees to be the future leaders of the Bank via accurate and timely knowledge transferring is paramount. Re-skilling and equipping our people with skills on new world technologies also forms an important part of our training proposition.
STAKEHOLDER OUTCOMESOUR EMPLOYEES
ENGAGEMENT Maintaining high levels of engagement with our employees has enabled us to sustain staff motivation levels and maintain ongoing dialogue with employees amidst remote working arrangements and physical distancing. Also, tvBOC, our in-house television channel was used extensively to broadcast information to employees while digital media such as BoC e-Learning platform, MSTeams, social media and e-mail was also used to keep communication channels open. We also conducted the best branch competition virtually which garnered significant interest.
We also maintained an ongoing dialogue with trade union representatives and maintained cordial relations throughout the year, 99% of our employees belong
Exit Employees by Age
Below 3030 to 50 years
90%
10%
Virtual Training
Average Training Hours byEmployment Categoryand Gender
0
10
20
30
40
50
60
70
80
Corp
orat
eM
anag
emen
t (D
GM
)
Exec
utiv
eM
anag
emen
t (AG
M)
Man
ager
ial G
rade
(CM
, SM
, M)
Exec
utiv
e As
sist
ants
(AM
,EO
,JEO
)
Bank
ing
Trai
nees
(All
othe
r ca
tego
ries
)
MaleFemale
42.2
36.1
12.2
67.5
35.0 41
.7
2,06
818
.8
15.4
9.9 14
.3
3,19
5
Hours
617 Programmes
69,935 Man Hours
BANK OF CEYLON | ANNUAL REPORT 2021
73
The Bank is fully owned by the Government of Sri Lanka. Other fund providers include individuals and organisations who invest in the Bank’s debt securities and lenders as well as international funding agencies which provide direct funding lines to selected industries/customer segments.
SHAREHOLDER AND FUND PROVIDERS
LISTENING TO OUR SHAREHOLDER AND FUND
PROVIDERS
Engagement platforms Annual Report and other publications
(ongoing)
Periodic meetings (ongoing)
One-to-one meetings with large investors (periodic)
Investor presentations and roadshows (periodic)
Engagement through market intermediaries (periodic)
What they require Adequate return commensurate with
risk undertaken
Transparent and timely reporting
Strong corporate governance and risk management practices
Reputation
Responsible business practices
How we responded Ensure on adequete returns being
generated
Focus on preserving portfolio quality
Effective margin management
Ongoing focus on strengthening capital
Market disclosure on timely manner
The Bank continued to deliver on its shareholder commitments despite the multitude of challenges that prevailed in the operating environment. BoC generated record profitability while maintaining its capitalisation levels and managing its risk parameters within the defined risk appetite levels.
A high-level overview of the Bank’s performance and stability is presented below. Please refer to the Chief Financial Officer’s Review (Page 52) and Business line reviews (Page 56) for detailed information on the Bank’s performance.
TOTAL INCOME
ASSET GROWTH
SHAREHOLDER RETURN
PROFITABILITY
LIABILITIES
CAPITALISATION
18% growth in total income led by,
15% increase in fund-base income driven by 22% loan growth
19% growth in net fee and commission income
Doubling of Other Income supported by forex income and forex revaluation gains
Asset growth of 28% to LKR 3.8 tillion driven by,
22% increase in loans and advances, supported by overdrafts, personal loans and term loans
Return on equity increased to 21.0% from 11.9% in 2020
Doubling of Earnings per share to LKR 1,503.60
16% increase in dividend per share to LKR 73.86
Profit after tax for the year more than doubled to LKR 37.6 billion. Factors shaping profitability included,
Effective management of margins
Effective cost management, with cost to income ratio at 32%
40% increase in impairment charges
28% growth in total liabilities reflecting,
16% increase in deposits with CASA ratio improving to 36%
Other borrowings doubled
Stronger capitalisation levels with,
41% increase in retained earnings
Dividend policy focusing on preserving the profit generated for internal capital generation
The Bank’s Common Equity Tier 1 capital ratio increased to 12.9%
Total capital ratio increased to 17.8%
Overview Leadership Insights Our Bank Our Strategy Our Performance
Stakeholder Outcomes Accountability Financial Reports Compliance Annexes Supplimentary Information
BANK OF CEYLON | ANNUAL REPORT 2021
74
As Sri Lanka’s largest bank and a State-Owned Entity, BoC has, over the years played a central role in driving the country’s national economic agenda and contributing towards macro-economic stability.
COUNTRY AND COMMUNITY
Contribution to the economyThe importance of this role has been amplified in recent times, given the significant economic stress arising from the COVID-19 pandemic and broad-based implications on individuals, SMEs, corporates and state-owned organisations. The Bank’s value creation to the Government was multi-pronged and is summarised below:
Ensuring the continuity of banking services during lockdowns All BoC branches were open and fully functional despite COVID-19 lockdowns and operational restrictions during 2021, unless being required to close due to health concerns. Given the Bank’s widespread branch reach this enabled continuity of banking services across the island. This was further supported by deployment of 10 mobile banking units and launch of the agent banking solution-BoC Connect. BoC’s strategic thrust towards increasing customer digital adoption has also supported continuity of essential banking activities via digital platforms.
Supporting macro-economic stabilityBoC plays an important role in supporting implementation of the Government’s monetary policy towards strengthening the economic climate aimed of the country. As the market leader in remittances, the Bank facilitated critical foreign currency inflows to the country during the year. The Bank also contributes to Government revenue through tax and dividend. Also, through investments in the Government securities market.
STAKEHOLDER OUTCOMES
ENGAGEMENT WITH COUNTRY AND COMMUNITY
Engagement platforms Annual Report and other publications
(ongoing)
Industry forums and meetings (ongoing)
Engagement through branches (ongoing)
CSR activities and sponsorships (ongoing)
Press releases and media campaigns (ongoing)
What they require Supporting businesses and driving
the revival of the economy
Maintaining confidence within the financial sector
Alignment of national development agenda to the Bank’s strategy
Facilitating financial inclusion
Contribution towards community development projects
Responsible business practices
Financial inclusion and empowerment
How we responded Strong governance and risk
management practices
Employment generation
Facilitating financial inclusion accross the country
Continued investments in long term CSR projects
Value creation to the Government Support the economic revival of the
country
Ensuring continuity of essential imports and Government activitiesDespite the stressed foreign currency reserves in the country, BoC facilitated the import of essential goods such as petroleum, gas, vaccines for COVID-19 and other pharmaceuticals and medical equipment to Sri Lanka in 2021. The Bank during the year has financed USD 1,460.0 million for petrolium imports. Further, BoC has financed USD 138.0 million to import vaccines against COVID-19 being bought to Sri Lanka. Demonstrating its capabilities in managing foreign currency at optimum levels, BoC also continues to facilitate the foreign exchange requirements of Sri Lankan students studying overseas.
The Bank also continued to support the operations of essential Government services through bridging liquidity shortfalls in key State owned organisations while facilitating salary, pension and Samurdhi payments.
Supporting the Economic Revival As described on pages 35 and 62, BoC has played a vital role in driving the country’s economic revival through extended moratoriums and concessions to affected businesses, restructuring and rescheduling facilities and channelling funds towards reviving critical sectors including SMEs, exporters and agriculture-sector organisations. This included special engagement with customers across the country by the Bank’s Management Team, launch of the new credit scheme, ‘BoC Shashrika’ for SMEs and new entrepreneurs, efficient disbursement of special festival advances, thereby boosting money circulation during the festive season.
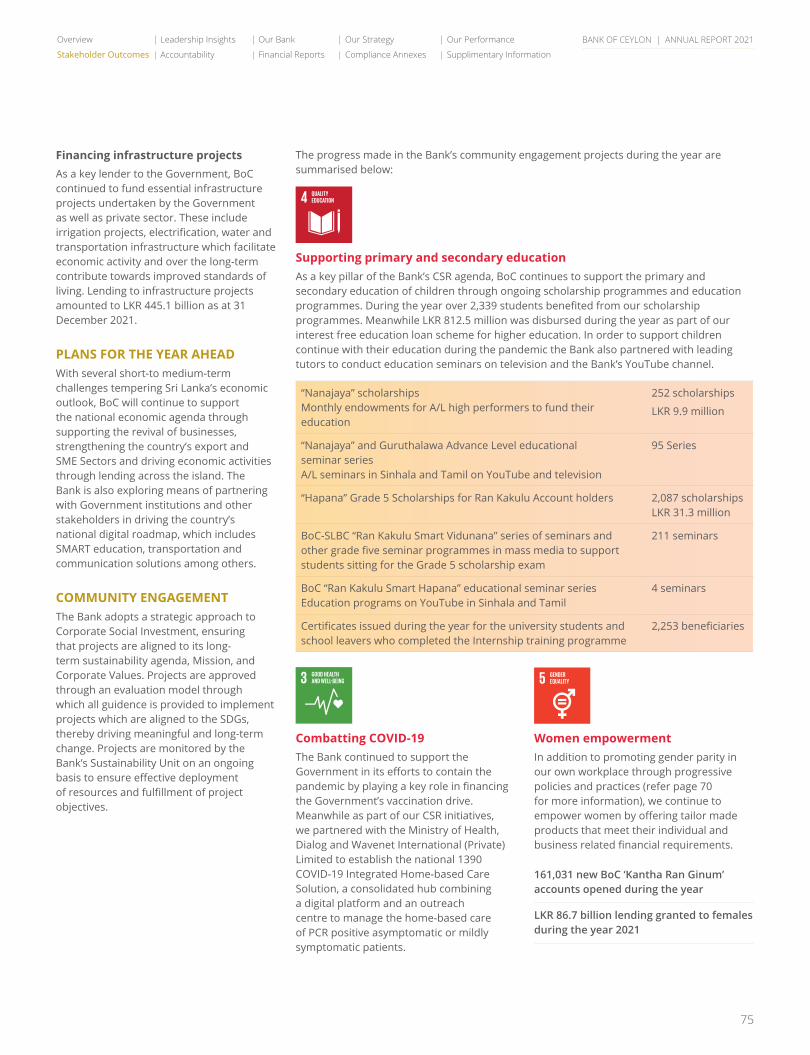
BANK OF CEYLON | ANNUAL REPORT 2021
75
Financing infrastructure projectsAs a key lender to the Government, BoC continued to fund essential infrastructure projects undertaken by the Government as well as private sector. These include irrigation projects, electrification, water and transportation infrastructure which facilitate economic activity and over the long-term contribute towards improved standards of living. Lending to infrastructure projects amounted to LKR 445.1 billion as at 31 December 2021.
PLANS FOR THE YEAR AHEADWith several short-to medium-term challenges tempering Sri Lanka’s economic outlook, BoC will continue to support the national economic agenda through supporting the revival of businesses, strengthening the country’s export and SME Sectors and driving economic activities through lending across the island. The Bank is also exploring means of partnering with Government institutions and other stakeholders in driving the country’s national digital roadmap, which includes SMART education, transportation and communication solutions among others.
COMMUNITY ENGAGEMENTThe Bank adopts a strategic approach to Corporate Social Investment, ensuring that projects are aligned to its long-term sustainability agenda, Mission, and Corporate Values. Projects are approved through an evaluation model through which all guidence is provided to implement projects which are aligned to the SDGs, thereby driving meaningful and long-term change. Projects are monitored by the Bank’s Sustainability Unit on an ongoing basis to ensure effective deployment of resources and fulfillment of project objectives.
The progress made in the Bank’s community engagement projects during the year are summarised below:
Supporting primary and secondary educationAs a key pillar of the Bank’s CSR agenda, BoC continues to support the primary and secondary education of children through ongoing scholarship programmes and education programmes. During the year over 2,339 students benefited from our scholarship programmes. Meanwhile LKR 812.5 million was disbursed during the year as part of our interest free education loan scheme for higher education. In order to support children continue with their education during the pandemic the Bank also partnered with leading tutors to conduct education seminars on television and the Bank’s YouTube channel.
“Nanajaya” scholarshipsMonthly endowments for A/L high performers to fund their education
252 scholarships
LKR 9.9 million
“Nanajaya” and Guruthalawa Advance Level educational seminar seriesA/L seminars in Sinhala and Tamil on YouTube and television
95 Series
“Hapana” Grade 5 Scholarships for Ran Kakulu Account holders 2,087 scholarshipsLKR 31.3 million
BoC-SLBC “Ran Kakulu Smart Vidunana” series of seminars and other grade five seminar programmes in mass media to support students sitting for the Grade 5 scholarship exam
211 seminars
BoC “Ran Kakulu Smart Hapana” educational seminar series Education programs on YouTube in Sinhala and Tamil
4 seminars
Certificates issued during the year for the university students and school leavers who completed the Internship training programme
2,253 beneficiaries
Combatting COVID-19The Bank continued to support the Government in its efforts to contain the pandemic by playing a key role in financing the Government’s vaccination drive. Meanwhile as part of our CSR initiatives, we partnered with the Ministry of Health, Dialog and Wavenet International (Private) Limited to establish the national 1390 COVID-19 Integrated Home-based Care Solution, a consolidated hub combining a digital platform and an outreach centre to manage the home-based care of PCR positive asymptomatic or mildly symptomatic patients.
Women empowermentIn addition to promoting gender parity in our own workplace through progressive policies and practices (refer page 70 for more information), we continue to empower women by offering tailor made products that meet their individual and business related financial requirements.
161,031 new BoC ‘Kantha Ran Ginum’ accounts opened during the year
LKR 86.7 billion lending granted to females during the year 2021
Overview Leadership Insights Our Bank Our Strategy Our Performance
Stakeholder Outcomes Accountability Financial Reports Compliance Annexes Supplimentary Information
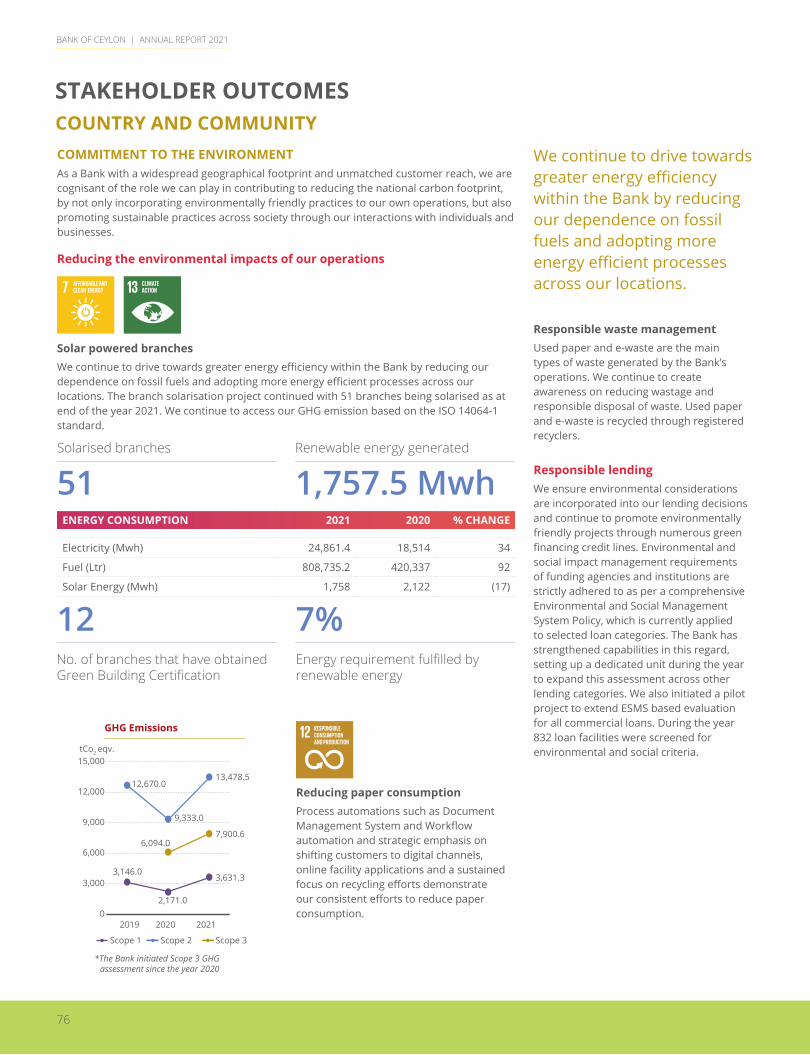
BANK OF CEYLON | ANNUAL REPORT 2021
COMMITMENT TO THE ENVIRONMENTAs a Bank with a widespread geographical footprint and unmatched customer reach, we are cognisant of the role we can play in contributing to reducing the national carbon footprint, by not only incorporating environmentally friendly practices to our own operations, but also promoting sustainable practices across society through our interactions with individuals and businesses.
Reducing the environmental impacts of our operations
Solar powered branchesWe continue to drive towards greater energy efficiency within the Bank by reducing our dependence on fossil fuels and adopting more energy efficient processes across our locations. The branch solarisation project continued with 51 branches being solarised as at end of the year 2021. We continue to access our GHG emission based on the ISO 14064-1 standard.
Renewable energy generated
1,757.5 MwhSolarised branches
51ENERGY CONSUMPTION 2021 2020 % CHANGE
Electricity (Mwh) 24,861.4 18,514 34
Fuel (Ltr) 808,735.2 420,337 92
Solar Energy (Mwh) 1,758 2,122 (17)
Reducing paper consumptionProcess automations such as Document Management System and Workflow automation and strategic emphasis on shifting customers to digital channels, online facility applications and a sustained focus on recycling efforts demonstrate our consistent efforts to reduce paper consumption.
Responsible waste managementUsed paper and e-waste are the main types of waste generated by the Bank’s operations. We continue to create awareness on reducing wastage and responsible disposal of waste. Used paper and e-waste is recycled through registered recyclers.
Responsible lendingWe ensure environmental considerations are incorporated into our lending decisions and continue to promote environmentally friendly projects through numerous green financing credit lines. Environmental and social impact management requirements of funding agencies and institutions are strictly adhered to as per a comprehensive Environmental and Social Management System Policy, which is currently applied to selected loan categories. The Bank has strengthened capabilities in this regard, setting up a dedicated unit during the year to expand this assessment across other lending categories. We also initiated a pilot project to extend ESMS based evaluation for all commercial loans. During the year 832 loan facilities were screened for environmental and social criteria.
We continue to drive towards greater energy efficiency within the Bank by reducing our dependence on fossil fuels and adopting more energy efficient processes across our locations.
STAKEHOLDER OUTCOMESCOUNTRY AND COMMUNITY
76
GHG Emissions
2020 20212019
tCo2 eqv.
0
3,000
6,000
9,000
12,000
15,000
Scope 1 Scope 2 Scope 3
12,670.0
3,146.0
2,171.0
3,631.3
9,333.0
7,900.66,094.0
13,478.5
*The Bank initiated Scope 3 GHGassessment since the year 2020
Energy requirement fulfilled by renewable energy
7%No. of branches that have obtained Green Building Certification
12
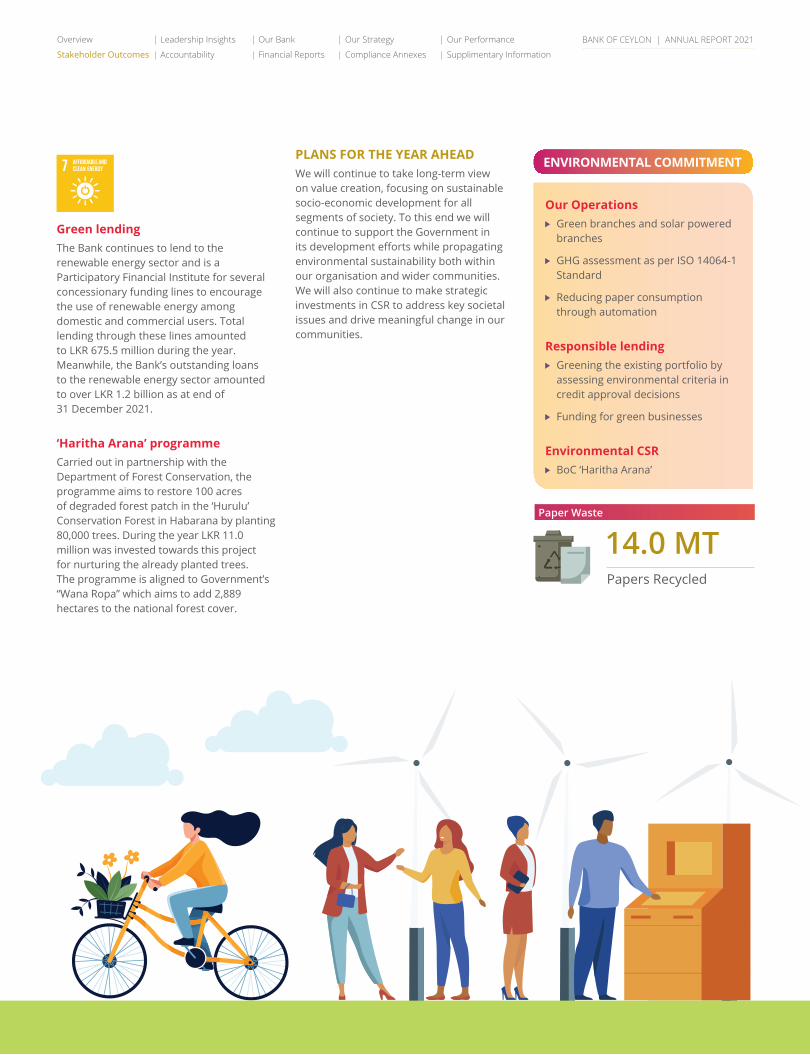
BANK OF CEYLON | ANNUAL REPORT 2021
Green lendingThe Bank continues to lend to the renewable energy sector and is a Participatory Financial Institute for several concessionary funding lines to encourage the use of renewable energy among domestic and commercial users. Total lending through these lines amounted to LKR 675.5 million during the year. Meanwhile, the Bank’s outstanding loans to the renewable energy sector amounted to over LKR 1.2 billion as at end of 31 December 2021.
‘Haritha Arana’ programmeCarried out in partnership with the Department of Forest Conservation, the programme aims to restore 100 acres of degraded forest patch in the ‘Hurulu’ Conservation Forest in Habarana by planting 80,000 trees. During the year LKR 11.0 million was invested towards this project for nurturing the already planted trees. The programme is aligned to Government’s “Wana Ropa” which aims to add 2,889 hectares to the national forest cover.
ENVIRONMENTAL COMMITMENT
Our Operations Green branches and solar powered
branches
GHG assessment as per ISO 14064-1 Standard
Reducing paper consumption through automation
Responsible lending Greening the existing portfolio by
assessing environmental criteria in credit approval decisions
Funding for green businesses
Environmental CSR BoC ‘Haritha Arana’
Papers Recycled
14.0 MTPaper Waste
PLANS FOR THE YEAR AHEADWe will continue to take long-term view on value creation, focusing on sustainable socio-economic development for all segments of society. To this end we will continue to support the Government in its development efforts while propagating environmental sustainability both within our organisation and wider communities. We will also continue to make strategic investments in CSR to address key societal issues and drive meaningful change in our communities.
77
Overview Leadership Insights Our Bank Our Strategy Our Performance
Stakeholder Outcomes Accountability Financial Reports Compliance Annexes Supplimentary Information
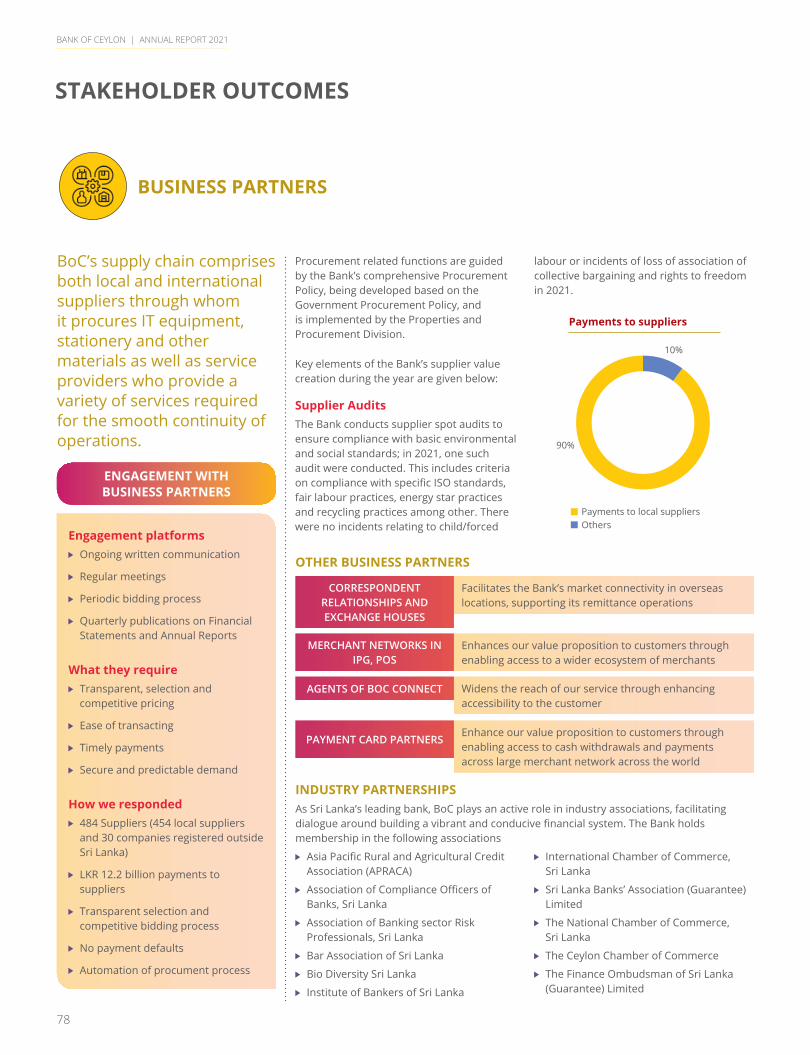
BANK OF CEYLON | ANNUAL REPORT 2021
78
OTHER BUSINESS PARTNERS
CORRESPONDENT RELATIONSHIPS AND EXCHANGE HOUSES
MERCHANT NETWORKS IN IPG, POS
AGENTS OF BOC CONNECT
PAYMENT CARD PARTNERS
Facilitates the Bank’s market connectivity in overseas locations, supporting its remittance operations
Enhances our value proposition to customers through enabling access to a wider ecosystem of merchants
Widens the reach of our service through enhancing accessibility to the customer
Enhance our value proposition to customers through enabling access to cash withdrawals and payments across large merchant network across the world
INDUSTRY PARTNERSHIPSAs Sri Lanka’s leading bank, BoC plays an active role in industry associations, facilitating dialogue around building a vibrant and conducive financial system. The Bank holds membership in the following associations
Asia Pacific Rural and Agricultural Credit Association (APRACA)
Association of Compliance Officers of Banks, Sri Lanka
Association of Banking sector Risk Professionals, Sri Lanka
Bar Association of Sri Lanka
Bio Diversity Sri Lanka
Institute of Bankers of Sri Lanka
International Chamber of Commerce, Sri Lanka
Sri Lanka Banks’ Association (Guarantee) Limited
The National Chamber of Commerce, Sri Lanka
The Ceylon Chamber of Commerce
The Finance Ombudsman of Sri Lanka (Guarantee) Limited
STAKEHOLDER OUTCOMES
BUSINESS PARTNERS
BoC’s supply chain comprises both local and international suppliers through whom it procures IT equipment, stationery and other materials as well as service providers who provide a variety of services required for the smooth continuity of operations.
Procurement related functions are guided by the Bank’s comprehensive Procurement Policy, being developed based on the Government Procurement Policy, and is implemented by the Properties and Procurement Division.
Key elements of the Bank’s supplier value creation during the year are given below:
Supplier AuditsThe Bank conducts supplier spot audits to ensure compliance with basic environmental and social standards; in 2021, one such audit were conducted. This includes criteria on compliance with specific ISO standards, fair labour practices, energy star practices and recycling practices among other. There were no incidents relating to child/forced
ENGAGEMENT WITH BUSINESS PARTNERS
Engagement platforms Ongoing written communication
Regular meetings
Periodic bidding process
Quarterly publications on Financial Statements and Annual Reports
What they require Transparent, selection and
competitive pricing
Ease of transacting
Timely payments
Secure and predictable demand
How we responded 484 Suppliers (454 local suppliers
and 30 companies registered outside Sri Lanka)
LKR 12.2 billion payments to suppliers
Transparent selection and competitive bidding process
No payment defaults
Automation of procument process
Payments to suppliers
Payments to local suppliersOthers
90%
10%
labour or incidents of loss of association of collective bargaining and rights to freedom in 2021.
BANK OF CEYLON | ANNUAL REPORT 2021
79
REGULATORS
The Bank maintains collaborative relationship with its key regulators including the Central Bank of Sri Lanka (CBSL), Securities and Exchange Commission of Sri Lanka and the Colombo Stock Exchange.
Proactive and transparent engagement with these regulators have aided in ensuring full compliance to relevant regulations and guidelines, effective management of the Bank’s risk profile and collective efforts towards creating a conducive and sustainable banking industry in Sri Lanka.
Key aspects of the Bank’s relationship with the regulators during the year under review are summarised below:
Compliance to new directives, regulations and guidelines issued in 2021. Key developments include (but are not limited to), Provision of banking services during the
ongoing qurantine curfew period
Directions on capital requirements under BASEL III
FOREX Regulations aimed at preserving Sri Lanka’s foreign exchange position
Extension of debt moratoriums and concessions to COVID-19 affected businesses
Priority sector lending targets to the micro and SME sector and agricultural sector
Regulatory framework for technology risk management and resilience
Deferment of recovery action against borrowers
Active contribution to the CBSL’s aspiration of transitioning to a less-cash societyThe CBSL launched “Rata Puraama LANKAQR”, a national drive aimed at enhancing financial inclusion in the country through transition to a less-cash society, in partnership with LankaClear (Private) Limited and licensed financial institutions. The platform enables customers to make payments free of charge using payment apps of LANKAQR certified financial institutions. As Sri Lanka’s leading bank, catering to the largest customer base, BoC has been a vital contributor to this aspiration given its customer base of over 14 million.
Alignment to the Central Bank of Sri Lanka’s Roadmap for Sustainable Finance The Roadmap for Sustainable Finance in Sri Lanka was launched in 2019 with the aim of supporting financial institutions to effectively manage emerging ESG risks, while supporting businesses that are greener, climate-friendly and socially inclusive. Over the long-term this is expected to strengthen the resilience of the financial system, while driving towards growth aspirations in a sustainable manner. BoC’s Sustainability Strategy has been developed in alignment with the Sustainable Finance Roadmap and the progress achieved in each pillar of the Roadmap is summarised below.
ENGAGING WITH OUR REGULATORS
Engagement platforms Regulatory reporting (ongoing)
One-to-one meetings (ongoing)
Discussions through industry forums (ongoing)
Annual report and other publications (ongoing)
What they require Supporting businesses and economic
revival
Maintaining confidence in the financial sector
Strong governance and risk management practices
Facilitating financial inclusion
How we responded Timely reporting and adequete
disclosures
Full compliance with all regulations/guidelines
Adhering to mandetory lending requirments to vulnerable segments
Ongoing support to critically affected sectors
Maintain integrity and industry harmony
Overview Leadership Insights Our Bank Our Strategy Our Performance
Stakeholder Outcomes Accountability Financial Reports Compliance Annexes Supplimentary Information
BANK OF CEYLON | ANNUAL REPORT 2021
80
Sustainable lending The Bank promotes the use of renewable energy including
rooftop solar generation through funding lines as a PFI and also via the Bank’s own funds
Through ‘BoC Mithuru’ – a micro-financing initiative – BoC lends to entrepreneurial ventures in underprivileged communities
The Bank operates several dedicated lending and investment products targeting women entrepreneurs
The Bank also offers several loan schemes to promote green business practices and green transportation eg: ‘BoC Shashrika’ loan scheme for ongoing manuer production
ESG Integration Disclosure of material ESG topics through adopting the GRI
Standards for Sustainability Reporting and the Integrated Reporting (IR) Framework of the IIRC
Comprehensive ESMS Policy for credit appraisal to proactively identify and manage the environmental and social risks associated with the Bank’s lending portfolio
New ESMS Unit established under the Integrated Risk Management Division
Capacity building Following the roll-out of the Bank’s Sustainability Policy the
Bank continue to provide ESG - related training for selected employees including credit officers
Two employees at the Sustainability Unit has obtained ‘Certified Sustainability Manager’ status under the ISO/IEC 17024:2012: Certification of Persons for the scope of the Sustainability Manager
The Bank’s dedicated Sustainability Unit continues to work with cross-functional teams in propagating a culture of socio and environmental awareness.
Financial inclusion Accessibility through an unparalleled reach of 2,061 customer
contact points across the country
BOC CONNECT new service channel launched targeting rural segment
Funds channelled to underserved communities through special lending products
• LKR 16.0 billion through 39,451 loans for microfinance sector
STAKEHOLDER OUTCOMESREGULATORS

BANK OF CEYLON | ANNUAL REPORT 2021
81
AWARDS
The Bank of the Year – Sri Lanka – “The Banker”
Most Valuable Banking Brand for the 13th Consecutive year – “Brand Finance”
Top Ten Winners of the Best Management Practices Awards 2022; ‘Back to Business in the New Normal’ – The Institute of Chartered Professional Managers of Sri Lanka
Best Service Provider in HR – Asian HR leadership Award
Best HR Organization to Work For – Global HR Excellence Awards 2022
People’s Banking Service Provider of the Year 2021 – “SLIM- Neilsen’s Peoples Awards 2021
Sri Lanka’s No. 1 Bank among the Top 1000 world Banks – “The Banker”
Gold Award - Best presented Annual Report for the ‘State Bank’ Sector 2021 – “57th Annual Report Awards Competition 2021- CA Sri Lanka”
EXCELLENCE IN OVERALL PERFORMANCE
EXCELLENCE IN BRAND PERFORMANCE
EXCELLENCE IN REPORTING
EXCELLENCE IN MANAGEMENT
EXCELLENCE IN HUMAN RESOURCE MANAGEMENT
Best Disclosure on Value Creation – “CMA Excellence in Integrated Reporting Awards 2021”
Best Integrated Report (State Owned Enterprises) – “CMA Excellence in Integrated Reporting Awards 2021”
Best 10 Integrated Reports Award – “CMA Excellence in Integrated Reporting Awards 2021”
Overview Leadership Insights Our Bank Our Strategy Our Performance
Stakeholder Outcomes Accountability Financial Reports Compliance Annexes Supplimentary Information

BANK OF CEYLON | ANNUAL REPORT 2021
82
CORPORATE GOVERNANCE
The persistent challenges presented by the COVID-19 pandemic in 2021 have reinforced the importance of adaptability and agility, particularly given BoC’s role in supporting the country’s economic revival. Against this backdrop, the Board focused primarily on safeguarding the well-being of our employees, customers and other stakeholders while supporting the country’s economic revival and maintaining the financial performance and stability of the Bank.
Board composition remained unchanged during the year, thereby offering strategic consistency and stability during these volatile times. We continued to engage deeply (strengthened the depth of engagement), with 26 main Board meetings held in 2021. This enabled the Board to keep abreast of changes in the operating environment and potential implications on the Bank’s value creation. During the year, the Board also evaluated and implemented a new ESMS Policy which clearly sets out the procedures, tools and guidance for embedding social and environmental criteria to the credit assessment process. Digitalisation remains a core focus for BoC and during the year we evaluated and approved several new digital offerings and propositions. Priority was also given to ensuring strategic alignment to emerging developments and proactively monitoring potential implications on the Bank’s risk profile particularly with regard to credit, operational and cybersecurity risks.
COMPLIANCEThis Report sets out our approach to governance in practice, how the Board operated in 2021 and discharged its duties during the year. It also demonstrates the status of compliance with the corporate governance regulations under the Banking Act Direction No 11 of 2007 for Licensed Commercial Banks. The Bank has also voluntarily adopted the revised Code of Best Practice on Corporate Governance issued by the Institute of Chartered Accountants of Sri Lanka in December 2017.
WAY FORWARDAs Sri Lanka faces numerous challenges in 2022, BoC is committed to playing a leading role in supporting the country’s enterprises and driving the economic revival. As the country’s leading bank, it is a role we embrace with pride and responsibility as we continue to seek ways to leverage our market position and unparalleled reach to drive socio-economic empowerment in Sri Lanka.
Kanchana RatwatteChairman
24 February 2022Colombo
CHAIRMAN’S MESSAGE ON CORPORATE GOVERNANCE

BANK OF CEYLON | ANNUAL REPORT 2021
83
GOVERNANCE PHILOSOPHY AND FRAMEWORKAs an integral element of Sri Lanka’s financial system and the societies we operate in, we recognise our duty to act in a manner that ensures the smooth functioning of the country’s banking system while balancing the needs of our diverse stakeholders. The Bank’s aspirations of transforming to a digitally enabled, future-fit organisation is underpinned by our governance philosophy, supporting the understanding of risks associated with our strategy, management of resource allocation and creation of sustainable value.
While aligning with regulatory requirements and international best practice, our governance framework also seeks to address the varying needs of the Bank’s stakeholders as well as balancing short-and long-term outcomes, particularly given its status as a state-owned Systemically Important Bank.
PRIMARY RESPONSIBILITIES OF LEADERSHIP
KEY ELEMENTS OF THE GOVERNANCE FRAMEWORK
UNDERPINNED BY
Setting strategic direction and providing oversight on
its progress
Bank of Ceylon Ordinance No.53 of 1938 (referred to as “Ordinance”) and its amendments
Banking Act No.30 of 1988 and subsequent amendments
Banking Act Direction No.11 of 2007 on Corporate Governance for Licenced Commercial Banks
Continuing listing requirements of the Colombo Stock Exchange
Code of Best Practice on Corporate Governance issued by the Chartered Accountants of Sri Lanka in December 2017
Securities and Exchange Commission of Sri Lanka Act No. 19 of 2021
Board Charter
Subcommittee charters
Code of Business Conduct and Ethics for Directors
Comprehensive policies and procedures
Subsidiary Management Charter
Customer Charter
HR and people management
Strategic and corporate planning
Risk management
IT and Cyber Security Governance
Code of Ethics for employees
Being customer centric
Respecting all forms of diversity
Committing towards high level of ethics, governance and professionalism
Focusing towards agility and innovation
Being accountable for all our actions
Customers
Employees
Shareholders and fund providers
Country and the community
Regulators
Business partners and suppliers
Establishing robust risk management frameworks
Safeguarding the Bank’s reputation
Ensure compliance with regulations, policies,
standards and procedures
People
Regulatory Framework
Purpose
Internal Guidelines and Mechanism
Processes
Corporate Values
Performance
Stakeholder Engagement
Overview Leadership Insights Our Bank Our Strategy Our Performance
Stakeholder Outcomes Accountability Financial Reports Compliance Annexes Supplimentary Information

BANK OF CEYLON | ANNUAL REPORT 2021
84
GOVERNANCE OUTCOMES AND HIGHLIGHTS IN 2021The Bank faced unprecedented challenges in 2021, due to COVID-19 and its implications on the customers’ repayment capability as well as the country’s fiscal and macro-economic conditions. BoC was required to act swiftly and astutely in delivering solutions to its customers and other stakeholders and the strength and rigour of our governance processes were put to the ultimate test. The Board discharged its oversight responsibilities through increasing the depth of engagement, strengthening risk management practices and proactively scanning the operating environment.
RESPONSE TO COVID-19 STRATEGIC OVERSIGHT RISK MANAGEMENTENVIRONMENTAL AND SOCIAL SUSTAINABILITYThe Board successfully
transitioned to conducting its activities virtually, with Board meetings and subcommittee meetings being held digitally. The Board focused on the impact of the pandemic on stakeholders, performance and operations and ensured appropriate oversight on the Bank’s response.
The annual strategy workshop was held virtually during the year and short-to-medium term strategic targets and action plans were refined in line with the market conditions. The Board reviewed performance against the Corporate Plan.
Strengthened credit risk management through reviewing and revising the relevant policies, including identification of risk elevated industries and prudential provisioning. Risk management policies relating to the overseas branches were reviewed and revised during the year.
The Bank reviewed its ESMS Policy during the year and, with this year’s review, the Bank’s environmental and social screening practices have been strengthened further, with plans in place to widen the coverage to all project financing facilities by 2022.
GOVERNANCE STRUCTUREThe Board of Directors is supported by subcommittees which has oversight responsibility on matters delegated to them including audit, nominations, remuneration, risk management and information and communication technology, among others. This allows the Board to devote time on strategic agenda items. Each committee Chairperson reports to the Board on the activities and recommendations made by their respective Committees during the Board meetings which are approved by the Board. Day-to-day management of the Bank has been delegated to the Management Team led by the General Manager. Several executive level committees have been established with specific responsibilities and clearly defined mandates (Please refer to page 88 for further details of the Board subcommittees and executive committees). The Governance Structure is illustrated below.
SHAREHOLDER(The Government of Sri Lanka)
GENERAL MANAGER
CORPORATE MANAGEMENT AND THE EXECUTIVE COMMITTEES
EXECUTIVE MANAGEMENT
AUDITOR GENERAL
Secretary to the Board
Internal Audit
Risk Management
Compliance
BOARD OF DIRECTORS
Audit Committee
Integrated Risk
Management Committee
Human Resources and Remuneration
Committee
Nomination and Corporate
Governance Committee
Information and Communication
Technology Committee
Boar
d Su
bcom
mitt
ees
Appointment flowReporting flow
CORPORATE GOVERNANCE
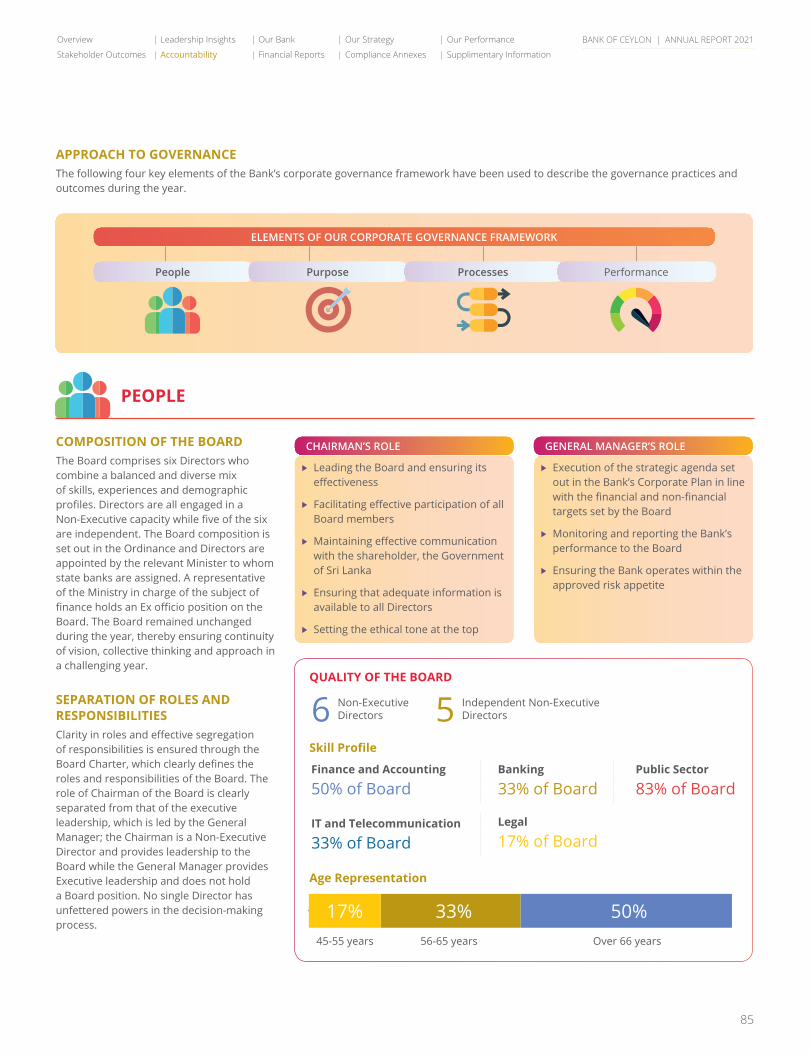
BANK OF CEYLON | ANNUAL REPORT 2021
85
QUALITY OF THE BOARD
Age Representation
Skill Profile
APPROACH TO GOVERNANCEThe following four key elements of the Bank’s corporate governance framework have been used to describe the governance practices and outcomes during the year.
ELEMENTS OF OUR CORPORATE GOVERNANCE FRAMEWORK
People Purpose Processes Performance
PEOPLE
COMPOSITION OF THE BOARDThe Board comprises six Directors who combine a balanced and diverse mix of skills, experiences and demographic profiles. Directors are all engaged in a Non-Executive capacity while five of the six are independent. The Board composition is set out in the Ordinance and Directors are appointed by the relevant Minister to whom state banks are assigned. A representative of the Ministry in charge of the subject of finance holds an Ex officio position on the Board. The Board remained unchanged during the year, thereby ensuring continuity of vision, collective thinking and approach in a challenging year.
SEPARATION OF ROLES AND RESPONSIBILITIESClarity in roles and effective segregation of responsibilities is ensured through the Board Charter, which clearly defines the roles and responsibilities of the Board. The role of Chairman of the Board is clearly separated from that of the executive leadership, which is led by the General Manager; the Chairman is a Non-Executive Director and provides leadership to the Board while the General Manager provides Executive leadership and does not hold a Board position. No single Director has unfettered powers in the decision-making process.
Leading the Board and ensuring its effectiveness
Facilitating effective participation of all Board members
Maintaining effective communication with the shareholder, the Government of Sri Lanka
Ensuring that adequate information is available to all Directors
Setting the ethical tone at the top
Execution of the strategic agenda set out in the Bank’s Corporate Plan in line with the financial and non-financial targets set by the Board
Monitoring and reporting the Bank’s performance to the Board
Ensuring the Bank operates within the approved risk appetite
CHAIRMAN’S ROLE GENERAL MANAGER’S ROLE
Finance and Accounting
50% of BoardBanking
33% of Board
Legal
17% of Board
Public Sector
83% of Board
IT and Telecommunication
33% of Board
45-55 years
17%56-65 years
33%Over 66 years
50%
Non-Executive Directors
Independent Non-Executive Directors6 5
Overview Leadership Insights Our Bank Our Strategy Our Performance
Stakeholder Outcomes Accountability Financial Reports Compliance Annexes Supplimentary Information
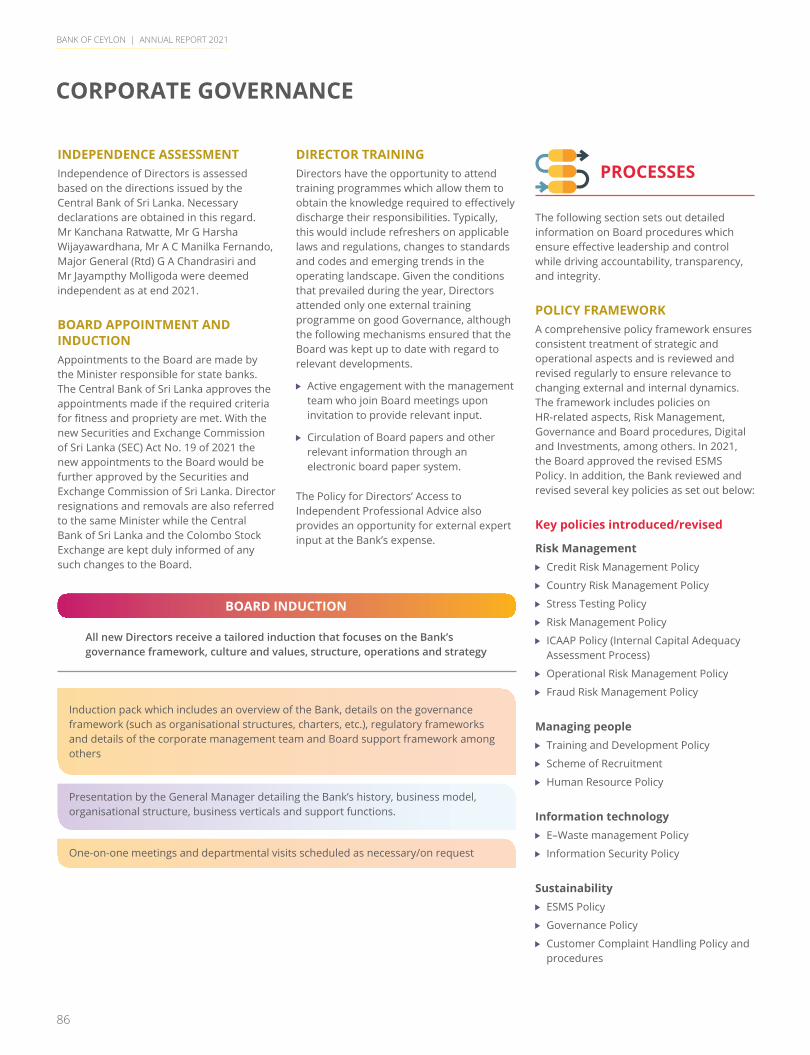
BANK OF CEYLON | ANNUAL REPORT 2021
86
DIRECTOR TRAINING Directors have the opportunity to attend training programmes which allow them to obtain the knowledge required to effectively discharge their responsibilities. Typically, this would include refreshers on applicable laws and regulations, changes to standards and codes and emerging trends in the operating landscape. Given the conditions that prevailed during the year, Directors attended only one external training programme on good Governance, although the following mechanisms ensured that the Board was kept up to date with regard to relevant developments.
Active engagement with the management team who join Board meetings upon invitation to provide relevant input.
Circulation of Board papers and other relevant information through an electronic board paper system.
The Policy for Directors’ Access to Independent Professional Advice also provides an opportunity for external expert input at the Bank’s expense.
INDEPENDENCE ASSESSMENT Independence of Directors is assessed based on the directions issued by the Central Bank of Sri Lanka. Necessary declarations are obtained in this regard. Mr Kanchana Ratwatte, Mr G Harsha Wijayawardhana, Mr A C Manilka Fernando, Major General (Rtd) G A Chandrasiri and Mr Jayampthy Molligoda were deemed independent as at end 2021.
BOARD APPOINTMENT AND INDUCTIONAppointments to the Board are made by the Minister responsible for state banks. The Central Bank of Sri Lanka approves the appointments made if the required criteria for fitness and propriety are met. With the new Securities and Exchange Commission of Sri Lanka (SEC) Act No. 19 of 2021 the new appointments to the Board would be further approved by the Securities and Exchange Commission of Sri Lanka. Director resignations and removals are also referred to the same Minister while the Central Bank of Sri Lanka and the Colombo Stock Exchange are kept duly informed of any such changes to the Board.
PROCESSES
The following section sets out detailed information on Board procedures which ensure effective leadership and control while driving accountability, transparency, and integrity.
POLICY FRAMEWORKA comprehensive policy framework ensures consistent treatment of strategic and operational aspects and is reviewed and revised regularly to ensure relevance to changing external and internal dynamics. The framework includes policies on HR-related aspects, Risk Management, Governance and Board procedures, Digital and Investments, among others. In 2021, the Board approved the revised ESMS Policy. In addition, the Bank reviewed and revised several key policies as set out below:
Key policies introduced/revised
Risk Management Credit Risk Management Policy
Country Risk Management Policy
Stress Testing Policy
Risk Management Policy
ICAAP Policy (Internal Capital Adequacy Assessment Process)
Operational Risk Management Policy
Fraud Risk Management Policy
Managing people Training and Development Policy
Scheme of Recruitment
Human Resource Policy
Information technology E–Waste management Policy
Information Security Policy
Sustainability ESMS Policy
Governance Policy
Customer Complaint Handling Policy and procedures
BOARD INDUCTION
All new Directors receive a tailored induction that focuses on the Bank’s governance framework, culture and values, structure, operations and strategy
Induction pack which includes an overview of the Bank, details on the governance framework (such as organisational structures, charters, etc.), regulatory frameworks and details of the corporate management team and Board support framework among others
One-on-one meetings and departmental visits scheduled as necessary/on request
Presentation by the General Manager detailing the Bank’s history, business model, organisational structure, business verticals and support functions.
CORPORATE GOVERNANCE
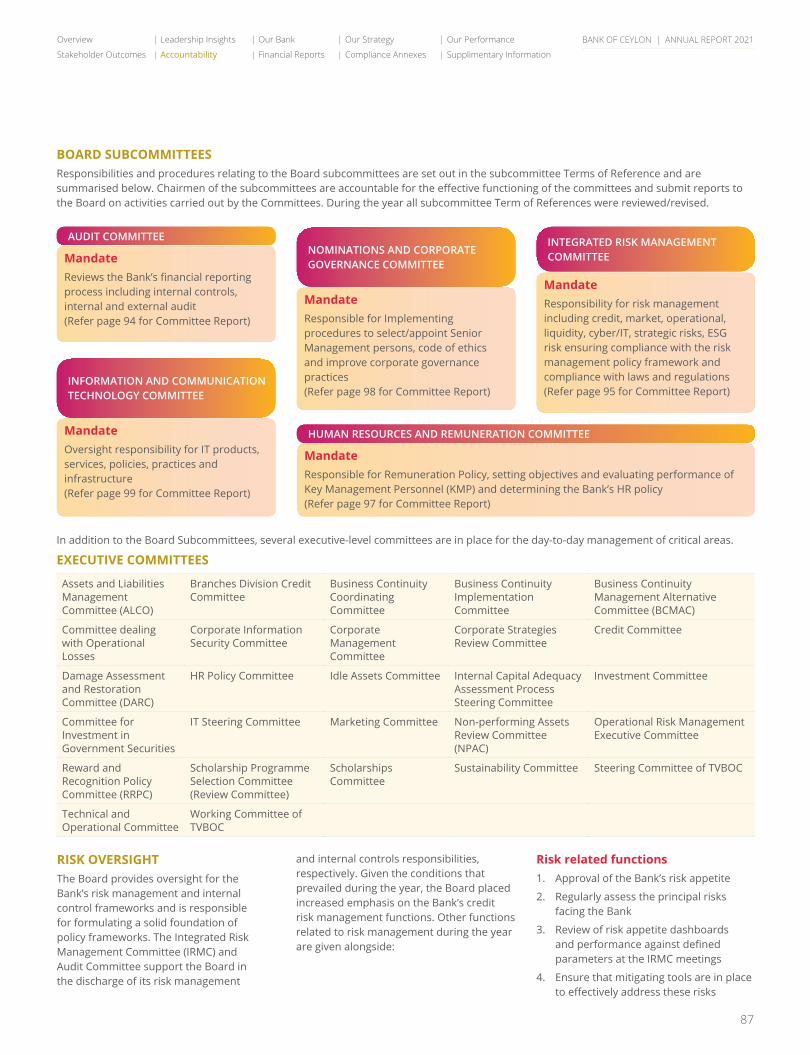
BANK OF CEYLON | ANNUAL REPORT 2021
87
BOARD SUBCOMMITTEESResponsibilities and procedures relating to the Board subcommittees are set out in the subcommittee Terms of Reference and are summarised below. Chairmen of the subcommittees are accountable for the effective functioning of the committees and submit reports to the Board on activities carried out by the Committees. During the year all subcommittee Term of References were reviewed/revised.
In addition to the Board Subcommittees, several executive-level committees are in place for the day-to-day management of critical areas.
Mandate Reviews the Bank’s financial reporting process including internal controls, internal and external audit (Refer page 94 for Committee Report)
Mandate Responsible for Remuneration Policy, setting objectives and evaluating performance of Key Management Personnel (KMP) and determining the Bank’s HR policy (Refer page 97 for Committee Report)
Mandate Responsible for Implementing procedures to select/appoint Senior Management persons, code of ethics and improve corporate governance practices (Refer page 98 for Committee Report)
Mandate Oversight responsibility for IT products, services, policies, practices and infrastructure (Refer page 99 for Committee Report)
Mandate Responsibility for risk management including credit, market, operational, liquidity, cyber/IT, strategic risks, ESG risk ensuring compliance with the risk management policy framework and compliance with laws and regulations (Refer page 95 for Committee Report)
AUDIT COMMITTEE
HUMAN RESOURCES AND REMUNERATION COMMITTEE
NOMINATIONS AND CORPORATE GOVERNANCE COMMITTEE
INFORMATION AND COMMUNICATION TECHNOLOGY COMMITTEE
INTEGRATED RISK MANAGEMENT COMMITTEE
EXECUTIVE COMMITTEES
Assets and Liabilities Management Committee (ALCO)
Branches Division Credit Committee
Business Continuity Coordinating Committee
Business Continuity Implementation Committee
Business Continuity Management Alternative Committee (BCMAC)
Committee dealing with Operational Losses
Corporate Information Security Committee
Corporate Management Committee
Corporate Strategies Review Committee
Credit Committee
Damage Assessment and Restoration Committee (DARC)
HR Policy Committee Idle Assets Committee Internal Capital Adequacy Assessment Process Steering Committee
Investment Committee
Committee for Investment in Government Securities
IT Steering Committee Marketing Committee Non-performing Assets Review Committee (NPAC)
Operational Risk Management Executive Committee
Reward and Recognition Policy Committee (RRPC)
Scholarship Programme Selection Committee (Review Committee)
Scholarships Committee
Sustainability Committee Steering Committee of TVBOC
Technical and Operational Committee
Working Committee of TVBOC
RISK OVERSIGHTThe Board provides oversight for the Bank’s risk management and internal control frameworks and is responsible for formulating a solid foundation of policy frameworks. The Integrated Risk Management Committee (IRMC) and Audit Committee support the Board in the discharge of its risk management
and internal controls responsibilities, respectively. Given the conditions that prevailed during the year, the Board placed increased emphasis on the Bank’s credit risk management functions. Other functions related to risk management during the year are given alongside:
Risk related functions1. Approval of the Bank’s risk appetite
2. Regularly assess the principal risks facing the Bank
3. Review of risk appetite dashboards and performance against defined parameters at the IRMC meetings
4. Ensure that mitigating tools are in place to effectively address these risks
Overview Leadership Insights Our Bank Our Strategy Our Performance
Stakeholder Outcomes Accountability Financial Reports Compliance Annexes Supplimentary Information
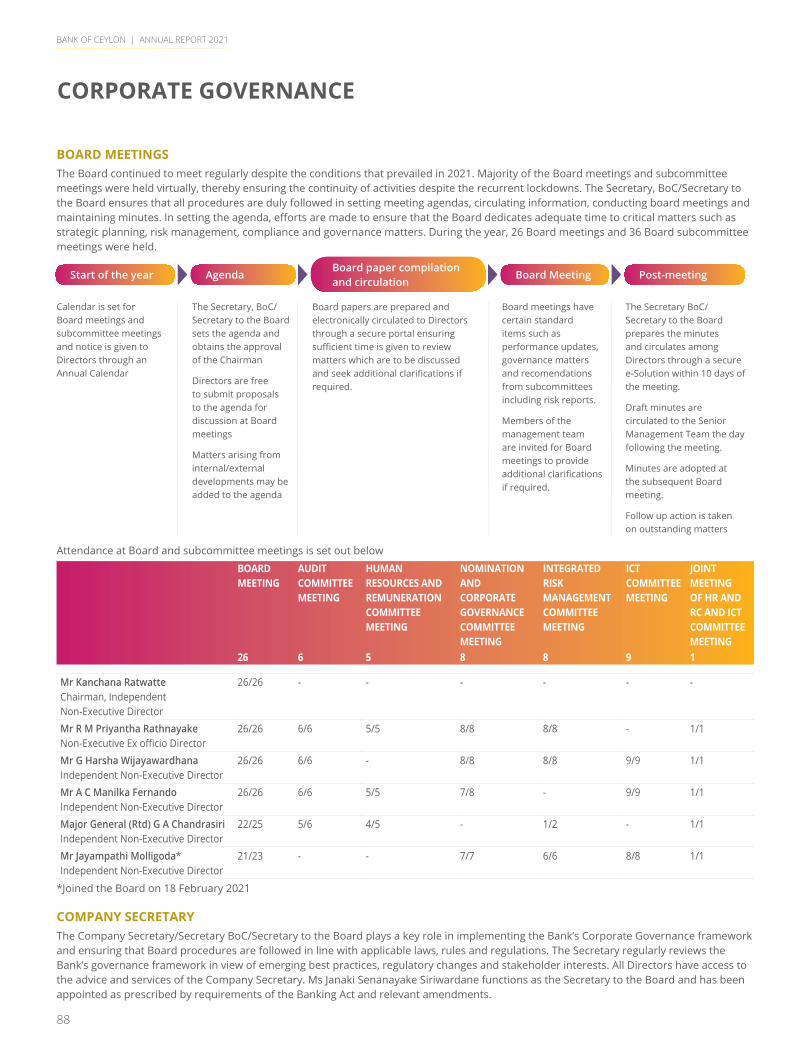
BANK OF CEYLON | ANNUAL REPORT 2021
88
BOARD MEETINGS The Board continued to meet regularly despite the conditions that prevailed in 2021. Majority of the Board meetings and subcommittee meetings were held virtually, thereby ensuring the continuity of activities despite the recurrent lockdowns. The Secretary, BoC/Secretary to the Board ensures that all procedures are duly followed in setting meeting agendas, circulating information, conducting board meetings and maintaining minutes. In setting the agenda, efforts are made to ensure that the Board dedicates adequate time to critical matters such as strategic planning, risk management, compliance and governance matters. During the year, 26 Board meetings and 36 Board subcommittee meetings were held.
Start of the year Agenda Board Meeting Post-meetingBoard paper compilation and circulation
Calendar is set for Board meetings and subcommittee meetings and notice is given to Directors through an Annual Calendar
The Secretary, BoC/Secretary to the Board sets the agenda and obtains the approval of the Chairman
Directors are free to submit proposals to the agenda for discussion at Board meetings
Matters arising from internal/external developments may be added to the agenda
Board meetings have certain standard items such as performance updates, governance matters and recomendations from subcommittees including risk reports.
Members of the management team are invited for Board meetings to provide additional clarifications if required.
The Secretary BoC/Secretary to the Board prepares the minutes and circulates among Directors through a secure e-Solution within 10 days of the meeting.
Draft minutes are circulated to the Senior Management Team the day following the meeting.
Minutes are adopted at the subsequent Board meeting.
Follow up action is taken on outstanding matters
Board papers are prepared and electronically circulated to Directors through a secure portal ensuring sufficient time is given to review matters which are to be discussed and seek additional clarifications if required.
Attendance at Board and subcommittee meetings is set out below
BOARD MEETING
AUDIT COMMITTEE MEETING
HUMAN RESOURCES AND REMUNERATION COMMITTEE MEETING
NOMINATION AND CORPORATE GOVERNANCE COMMITTEE MEETING
INTEGRATED RISK MANAGEMENT COMMITTEE MEETING
ICT COMMITTEE MEETING
JOINT MEETING OF HR AND RC AND ICT COMMITTEE MEETING
26 6 5 8 8 9 1
Mr Kanchana RatwatteChairman, Independent Non-Executive Director
26/26 - - - - - -
Mr R M Priyantha RathnayakeNon-Executive Ex officio Director
26/26 6/6 5/5 8/8 8/8 - 1/1
Mr G Harsha WijayawardhanaIndependent Non-Executive Director
26/26 6/6 - 8/8 8/8 9/9 1/1
Mr A C Manilka FernandoIndependent Non-Executive Director
26/26 6/6 5/5 7/8 - 9/9 1/1
Major General (Rtd) G A ChandrasiriIndependent Non-Executive Director
22/25 5/6 4/5 - 1/2 - 1/1
Mr Jayampathi Molligoda*Independent Non-Executive Director
21/23 - - 7/7 6/6 8/8 1/1
*Joined the Board on 18 February 2021
COMPANY SECRETARY The Company Secretary/Secretary BoC/Secretary to the Board plays a key role in implementing the Bank’s Corporate Governance framework and ensuring that Board procedures are followed in line with applicable laws, rules and regulations. The Secretary regularly reviews the Bank’s governance framework in view of emerging best practices, regulatory changes and stakeholder interests. All Directors have access to the advice and services of the Company Secretary. Ms Janaki Senanayake Siriwardane functions as the Secretary to the Board and has been appointed as prescribed by requirements of the Banking Act and relevant amendments.
CORPORATE GOVERNANCE
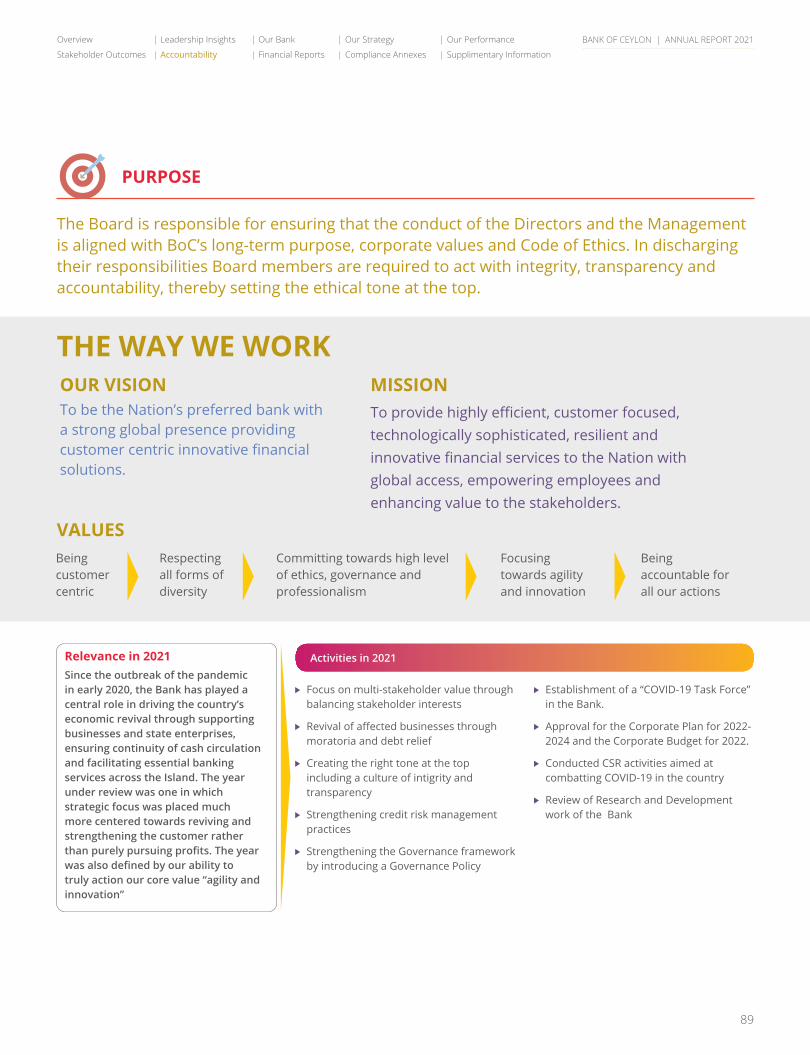
BANK OF CEYLON | ANNUAL REPORT 2021
89
Activities in 2021
PURPOSE
The Board is responsible for ensuring that the conduct of the Directors and the Management is aligned with BoC’s long-term purpose, corporate values and Code of Ethics. In discharging their responsibilities Board members are required to act with integrity, transparency and accountability, thereby setting the ethical tone at the top.
VALUES
OUR VISIONTo be the Nation’s preferred bank with a strong global presence providing customer centric innovative financial solutions.
MISSIONTo provide highly efficient, customer focused, technologically sophisticated, resilient and innovative financial services to the Nation with global access, empowering employees and enhancing value to the stakeholders.
THE WAY WE WORK
Being customer centric
Respecting all forms of diversity
Committing towards high level of ethics, governance and professionalism
Focusing towards agility and innovation
Being accountable for all our actions
Relevance in 2021Since the outbreak of the pandemic in early 2020, the Bank has played a central role in driving the country’s economic revival through supporting businesses and state enterprises, ensuring continuity of cash circulation and facilitating essential banking services across the Island. The year under review was one in which strategic focus was placed much more centered towards reviving and strengthening the customer rather than purely pursuing profits. The year was also defined by our ability to truly action our core value “agility and innovation”
Focus on multi-stakeholder value through balancing stakeholder interests
Revival of affected businesses through moratoria and debt relief
Creating the right tone at the top including a culture of intigrity and transparency
Strengthening credit risk management practices
Strengthening the Governance framework by introducing a Governance Policy
Establishment of a “COVID-19 Task Force” in the Bank.
Approval for the Corporate Plan for 2022-2024 and the Corporate Budget for 2022.
Conducted CSR activities aimed at combatting COVID-19 in the country
Review of Research and Development work of the Bank
Overview Leadership Insights Our Bank Our Strategy Our Performance
Stakeholder Outcomes Accountability Financial Reports Compliance Annexes Supplimentary Information
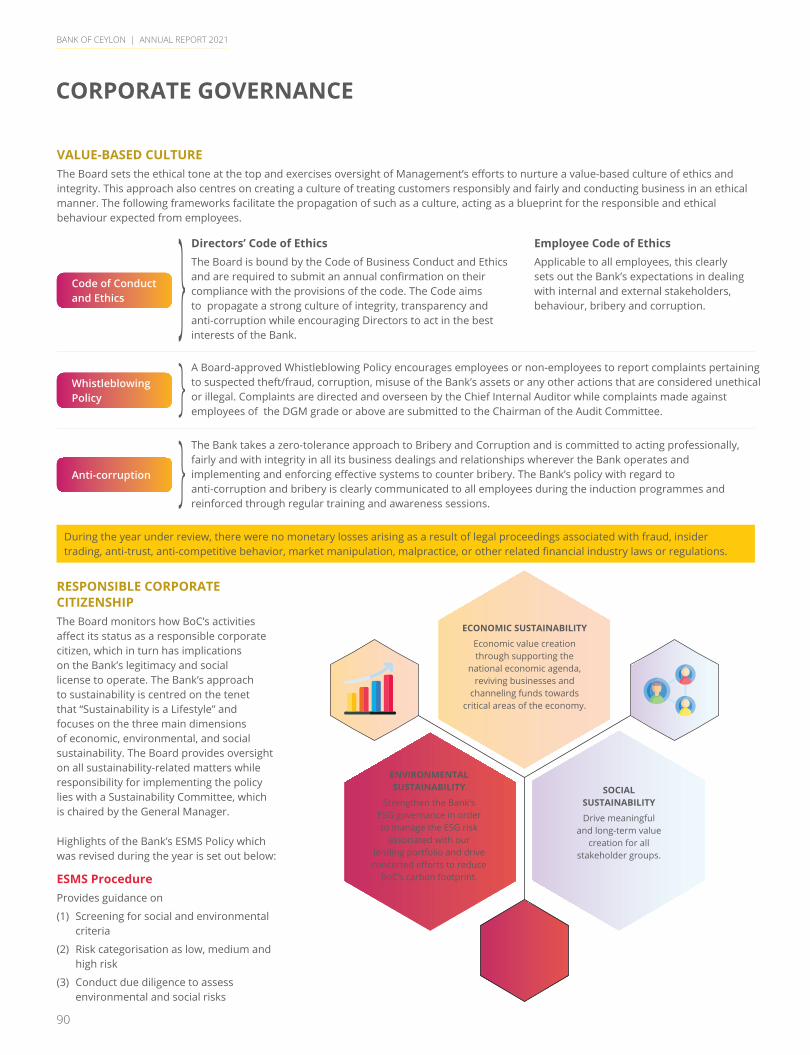
BANK OF CEYLON | ANNUAL REPORT 2021
90
RESPONSIBLE CORPORATE CITIZENSHIP The Board monitors how BoC’s activities affect its status as a responsible corporate citizen, which in turn has implications on the Bank’s legitimacy and social license to operate. The Bank’s approach to sustainability is centred on the tenet that “Sustainability is a Lifestyle” and focuses on the three main dimensions of economic, environmental, and social sustainability. The Board provides oversight on all sustainability-related matters while responsibility for implementing the policy lies with a Sustainability Committee, which is chaired by the General Manager.
Highlights of the Bank’s ESMS Policy which was revised during the year is set out below:
ESMS ProcedureProvides guidance on
(1) Screening for social and environmental criteria
(2) Risk categorisation as low, medium and high risk
(3) Conduct due diligence to assess environmental and social risks
Code of Conduct and Ethics
Whistleblowing Policy
Anti-corruption
Directors’ Code of EthicsThe Board is bound by the Code of Business Conduct and Ethics and are required to submit an annual confirmation on their compliance with the provisions of the code. The Code aims to propagate a strong culture of integrity, transparency and anti-corruption while encouraging Directors to act in the best interests of the Bank.
A Board-approved Whistleblowing Policy encourages employees or non-employees to report complaints pertaining to suspected theft/fraud, corruption, misuse of the Bank’s assets or any other actions that are considered unethical or illegal. Complaints are directed and overseen by the Chief Internal Auditor while complaints made against employees of the DGM grade or above are submitted to the Chairman of the Audit Committee.
The Bank takes a zero-tolerance approach to Bribery and Corruption and is committed to acting professionally, fairly and with integrity in all its business dealings and relationships wherever the Bank operates and implementing and enforcing effective systems to counter bribery. The Bank’s policy with regard to anti-corruption and bribery is clearly communicated to all employees during the induction programmes and reinforced through regular training and awareness sessions.
Employee Code of EthicsApplicable to all employees, this clearly sets out the Bank’s expectations in dealing with internal and external stakeholders, behaviour, bribery and corruption.
During the year under review, there were no monetary losses arising as a result of legal proceedings associated with fraud, insider trading, anti-trust, anti-competitive behavior, market manipulation, malpractice, or other related financial industry laws or regulations.
ECONOMIC SUSTAINABILITY
Economic value creation through supporting the
national economic agenda, reviving businesses and
channeling funds towards critical areas of the economy.
SOCIAL SUSTAINABILITY
Drive meaningful and long-term value
creation for all stakeholder groups.
ENVIRONMENTAL SUSTAINABILITY
Strengthen the Bank’s ESG governance in order to manage the ESG risk
associated with our lending portfolio and drive concerted efforts to reduce
BoC’s carbon footprint.
VALUE-BASED CULTUREThe Board sets the ethical tone at the top and exercises oversight of Management’s efforts to nurture a value-based culture of ethics and integrity. This approach also centres on creating a culture of treating customers responsibly and fairly and conducting business in an ethical manner. The following frameworks facilitate the propagation of such as a culture, acting as a blueprint for the responsible and ethical behaviour expected from employees.
CORPORATE GOVERNANCE
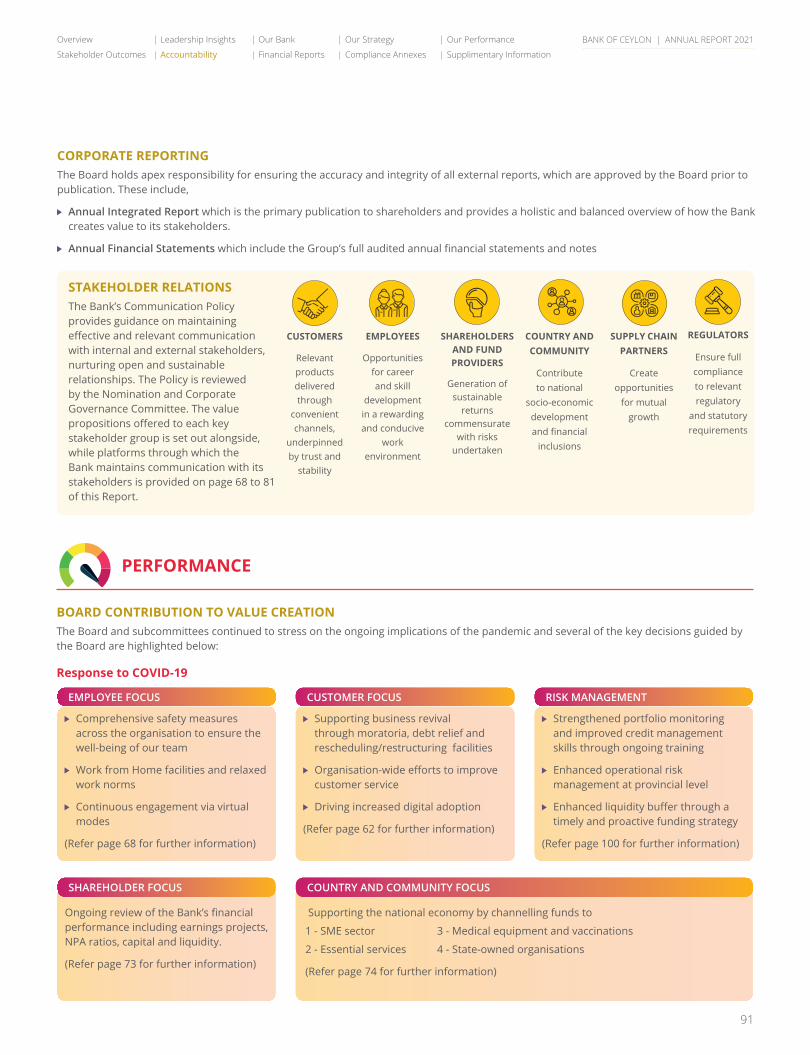
BANK OF CEYLON | ANNUAL REPORT 2021
91
CORPORATE REPORTINGThe Board holds apex responsibility for ensuring the accuracy and integrity of all external reports, which are approved by the Board prior to publication. These include,
Annual Integrated Report which is the primary publication to shareholders and provides a holistic and balanced overview of how the Bank creates value to its stakeholders.
Annual Financial Statements which include the Group’s full audited annual financial statements and notes
CUSTOMERS
Relevant products delivered through
convenient channels,
underpinned by trust and
stability
EMPLOYEES
Opportunities for career and skill
development in a rewarding and conducive
work environment
SHAREHOLDERS AND FUND PROVIDERS
Generation of sustainable
returns commensurate
with risks undertaken
COUNTRY AND COMMUNITY
Contribute to national
socio-economic development and financial
inclusions
SUPPLY CHAIN PARTNERS
Create opportunities
for mutual growth
REGULATORS
Ensure full compliance to relevant regulatory
and statutory requirements
STAKEHOLDER RELATIONS The Bank’s Communication Policy provides guidance on maintaining effective and relevant communication with internal and external stakeholders, nurturing open and sustainable relationships. The Policy is reviewed by the Nomination and Corporate Governance Committee. The value propositions offered to each key stakeholder group is set out alongside, while platforms through which the Bank maintains communication with its stakeholders is provided on page 68 to 81 of this Report.
PERFORMANCE
BOARD CONTRIBUTION TO VALUE CREATION The Board and subcommittees continued to stress on the ongoing implications of the pandemic and several of the key decisions guided by the Board are highlighted below:
Response to COVID-19
Comprehensive safety measures across the organisation to ensure the well-being of our team
Work from Home facilities and relaxed work norms
Continuous engagement via virtual modes
(Refer page 68 for further information)
Supporting business revival through moratoria, debt relief and rescheduling/restructuring facilities
Organisation-wide efforts to improve customer service
Driving increased digital adoption
(Refer page 62 for further information)
Strengthened portfolio monitoring and improved credit management skills through ongoing training
Enhanced operational risk management at provincial level
Enhanced liquidity buffer through a timely and proactive funding strategy
(Refer page 100 for further information)
EMPLOYEE FOCUS CUSTOMER FOCUS RISK MANAGEMENT
SHAREHOLDER FOCUS COUNTRY AND COMMUNITY FOCUS
Ongoing review of the Bank’s financial performance including earnings projects, NPA ratios, capital and liquidity.
(Refer page 73 for further information)
Supporting the national economy by channelling funds to
1 - SME sector 3 - Medical equipment and vaccinations
2 - Essential services 4 - State-owned organisations
(Refer page 74 for further information)
Overview Leadership Insights Our Bank Our Strategy Our Performance
Stakeholder Outcomes Accountability Financial Reports Compliance Annexes Supplimentary Information
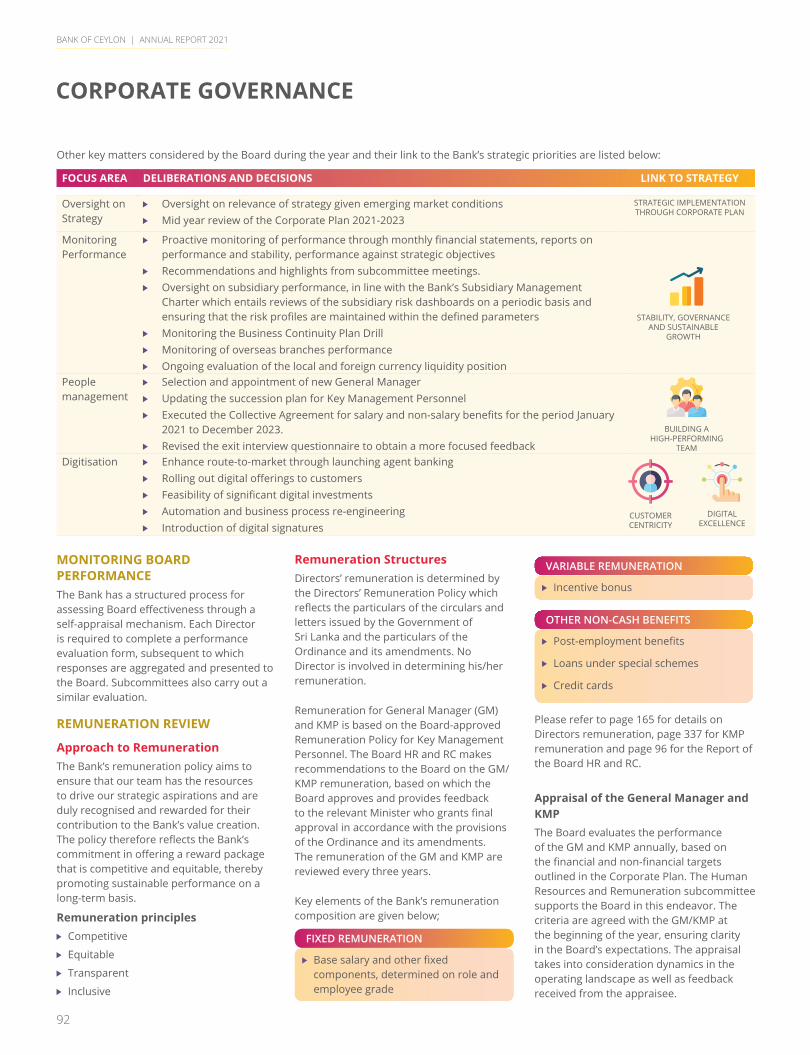
BANK OF CEYLON | ANNUAL REPORT 2021
92
Other key matters considered by the Board during the year and their link to the Bank’s strategic priorities are listed below:
FOCUS AREA DELIBERATIONS AND DECISIONS LINK TO STRATEGY
Oversight on Strategy
Oversight on relevance of strategy given emerging market conditions Mid year review of the Corporate Plan 2021-2023
STRATEGIC IMPLEMENTATION THROUGH CORPORATE PLAN
Monitoring Performance
Proactive monitoring of performance through monthly financial statements, reports on performance and stability, performance against strategic objectives
Recommendations and highlights from subcommittee meetings. Oversight on subsidiary performance, in line with the Bank’s Subsidiary Management
Charter which entails reviews of the subsidiary risk dashboards on a periodic basis and ensuring that the risk profiles are maintained within the defined parameters
Monitoring the Business Continuity Plan Drill Monitoring of overseas branches performance Ongoing evaluation of the local and foreign currency liquidity position
People management
Selection and appointment of new General Manager Updating the succession plan for Key Management Personnel Executed the Collective Agreement for salary and non-salary benefits for the period January
2021 to December 2023. Revised the exit interview questionnaire to obtain a more focused feedback
Digitisation Enhance route-to-market through launching agent banking Rolling out digital offerings to customers Feasibility of significant digital investments Automation and business process re-engineering Introduction of digital signatures
MONITORING BOARD PERFORMANCEThe Bank has a structured process for assessing Board effectiveness through a self-appraisal mechanism. Each Director is required to complete a performance evaluation form, subsequent to which responses are aggregated and presented to the Board. Subcommittees also carry out a similar evaluation.
REMUNERATION REVIEW
Approach to Remuneration The Bank’s remuneration policy aims to ensure that our team has the resources to drive our strategic aspirations and are duly recognised and rewarded for their contribution to the Bank’s value creation. The policy therefore reflects the Bank’s commitment in offering a reward package that is competitive and equitable, thereby promoting sustainable performance on a long-term basis.
Remuneration principles Competitive
Equitable
Transparent
Inclusive
Remuneration Structures Directors’ remuneration is determined by the Directors’ Remuneration Policy which reflects the particulars of the circulars and letters issued by the Government of Sri Lanka and the particulars of the Ordinance and its amendments. No Director is involved in determining his/her remuneration.
Remuneration for General Manager (GM) and KMP is based on the Board-approved Remuneration Policy for Key Management Personnel. The Board HR and RC makes recommendations to the Board on the GM/KMP remuneration, based on which the Board approves and provides feedback to the relevant Minister who grants final approval in accordance with the provisions of the Ordinance and its amendments. The remuneration of the GM and KMP are reviewed every three years.
Key elements of the Bank’s remuneration composition are given below;
Base salary and other fixed components, determined on role and employee grade
FIXED REMUNERATION
Incentive bonus
Post-employment benefits
Loans under special schemes
Credit cards
VARIABLE REMUNERATION
OTHER NON-CASH BENEFITS
Please refer to page 165 for details on Directors remuneration, page 337 for KMP remuneration and page 96 for the Report of the Board HR and RC.
Appraisal of the General Manager and KMPThe Board evaluates the performance of the GM and KMP annually, based on the financial and non-financial targets outlined in the Corporate Plan. The Human Resources and Remuneration subcommittee supports the Board in this endeavor. The criteria are agreed with the GM/KMP at the beginning of the year, ensuring clarity in the Board’s expectations. The appraisal takes into consideration dynamics in the operating landscape as well as feedback received from the appraisee.
CUSTOMER CENTRICITY
DIGITAL EXCELLENCE
BUILDING A HIGH-PERFORMING
TEAM
STABILITY, GOVERNANCE AND SUSTAINABLE
GROWTH
CORPORATE GOVERNANCE
BANK OF CEYLON | ANNUAL REPORT 2021
93
BOARD SUBCOMMITTEE REPORTSAUDIT COMMITTEE REPORT
COMMITTEE COMPOSITION DURING 2021The following Directors were members of the Audit Committee during the year 2021:
(1) Mr A C Manilka Fernando Chairman/Independent Non-Executive
Director
(2) Mr G Harsha Wijayawardhana Member/Independent Non-Executive
Director
(3) Mr R M Priyantha Rathnayake Member/Non-Executive Ex officio
Director
(4) Major General (Rtd) G A Chandrasiri Member/Independent Non-Executive
Director
SECRETARY TO THE COMMITTEEThe Secretary, Bank of Ceylon/Secretary to the Board who is an Attorney-at-Law and a Deputy General Manager, functions as the Secretary to the Committee.
REGULAR PARTICIPANTS Chief Internal Auditor
Chief Risk Officer
Deputy General Manager (Compliance)
Assistant General Manager (Province/Branch and Credit Audit)
Assistant General Manager (Investigations)
Assistant General Manager (Information Systems Audit)
Assistant General Manager (Risk Management)
Internal Auditor
Representatives of the Auditor General (the External Auditor of the Bank)
ATTEND UPON INVITATION General Manager
Additional General Manager/ Chief Financial Officer
Deputy General Manager (Finance and Planning)
Any other member of Corporate or Executive Management/Any other Staff Member
Meetings held in 2021: 06(Attendance given on page 88 of this Report)
Quorum: Two members or majority of the members whichever is higher.
ROLE OF COMMITTEE
Audit Committee CharterThe Terms of Reference of the Audit Committee are governed by the Audit Committee Charter, approved and adopted by the Board.
The Committee also ensures that the scope and coverage of its functions address the requirements of the Banking Act Direction No. 11 of 2007 on “Corporate Governance for Licensed Commercial Banks in Sri Lanka” and its subsequent amendments issued by the Central Bank of Sri Lanka.
Principal FocusThe Audit Committee primarily focuses on assisting the Board in fulfilling its duties by providing an independent and objective review of the Bank’s financial reporting process.
Medium of ReportingThe proceedings of the Audit Committee meetings are tabled and ratified at the Board meetings, where all key issues, concerns, actions taken, outcomes achieved or pending, and follow-up initiated, are clarified, discussed and Board approval obtained thereof.
AREAS OF FOCUS AND ACTIVITIES IN 2021 FINANCIAL REPORTING Reviewed the monthly, quarterly and annual
unaudited/audited Financial Statements to ensure that they are prepared and published in accordance with the requirements prescribed by the supervisory and regulatory authorities and applicable Accounting Standards.
Regulatory Compliance Reviewed compliance with mandatory
banking and other statutory requirements.
Reviewed the progress of action taken in relation to the findings of the statutory examinations carried out by the regulators.
Internal Controls Reviewed the adequacy and effectiveness of
the internal control mechanism of the Bank in line with Section 3(8) (ii)(b) of the Banking Act Direction No.11 of 2007 through the Internal Control Matrix updated for 2021.
On a regular basis and when specific events or cases warranted, conducted root cause analysis and made improvements to the systems, procedures and internal controls.
Internal Audit Reviewed the independence, objectivity, and
performance of the internal audit function as well as the adequacy of the Department’s resources.
Approved the Internal Audit Plan and reviewed the effectiveness of the implementation of the Plan throughout the year.
Monitored the progress of the initiatives taken by the Internal Audit Department to improve Internal Control Monitoring process.
Monitored the compliance with the Banking Act Direction no. 11 of 2007 on Corporate Governance issued by Central Bank of Sri Lanka on Internal Audit Charter and Audit Committee Charter.
Explored alternative audit procedures during the pandemic period.
External Audit The external audit of the Bank is carried
out by the Auditor General in terms of the Constitution of the country. The Committee ensured that the external audit is carried out effectively and independently and maintained a continuous rapport with the representatives of the Auditor General in relation to the audit approach and procedure.
Facilitated close door meetings with the representative of the Auditor General.
WAY FORWARDThe Audit Committee will foster a positive and effective internal control environment by committing to achieve the objectives set out in the Audit Committee Charter during 2022 and beyond.
On behalf of the Audit Committee
A C Manilka FernandoChairman,Audit Committee
24 February 2022
Overview Leadership Insights Our Bank Our Strategy Our Performance
Stakeholder Outcomes Accountability Financial Reports Compliance Annexes Supplimentary Information
BANK OF CEYLON | ANNUAL REPORT 2021
94
INTEGRATED RISK MANAGEMENT COMMITTEE REPORT
COMMITTEE COMPOSITION DURING 2021The composition of the committee during the year 2021 was as follows:
(1) Mr R M Priyantha Rathnayake Chairman/Non-Executive Ex officio
Director
(2) Mr G Harsha Wijayawardhana Member/Independent Non-Executive
Director
(3) Major General (Rtd) G A Chandrasiri Member/Independent Non-Executive Director- From 21.01.2021 to 03.03.2021
(4) Mr Jayampathy Molligoda
Member/Independent Non-Executive Director- From 04.03.2021till 31.01.2022
SECRETARY TO THE COMMITTEEThe Secretary, Bank of Ceylon/Secretary to the Board who is an Attorney-at-Law and a Deputy General Manager, functions as the Secretary to the Committee.
REGULAR PARTICIPANTS General Manager
Chief Risk Officer
Deputy General Manager (Compliance)
ATTEND UPON INVITATIONAny other members of the Board/Corporate Management/Any other Staff Member
Meetings held in 2021: 08(Attendance given on page 88 of this Report)
Quorum: Two members
ROLE OF COMMITTEE
Integrated Risk Management Committee CharterThe Terms of Reference (TOR) of the Integrated Risk Management Committee are governed by the Committee Charter, approved and adopted by the Board.
The Committee also ensures that the scope and coverage of its functions addresses the requirements of the Banking Act Direction No. 11 of 2007 on “Corporate Governance for Licensed Commercial Banks in Sri Lanka” and its subsequent amendments issued by the Central Bank of Sri Lanka.
This includes reviewing and/or recommending the following which are identified in the Charter of the Integrated Risk Management Committee:
Policies, programmes and Management Committee Charters relating to risk management and compliance.
Risk limits and policies that establish appetite for credit, market, liquidity, operational, information security and other risks, as recommended by the Chief Risk Officer.
Adequacy and effectiveness of all Management level committees to address specific risks and to manage those risks within quantitative and qualitative risk limits as specified by the Committee.
Risk management reports on the risk profile of the Bank including overseas branches and subsidiaries, as well as current market and regulatory risks and actions undertaken to identify, measure, monitor and control such risks.
Corrective action to mitigate the effects of specific risks in case such risks are beyond the prudent levels decided by the Committee on the basis of the Bank’s policies and regulatory and supervisory requirements.
Adequacy and effectiveness of risk identification, measurement, monitoring and mitigation relating to credit, market, liquidity, operational, Information Security and compliance risks.
PRINCIPAL FOCUSTo assist the Board in fulfilling its oversight responsibilities for all aspects of risk management. In this connection the Committee focuses on and reviews credit, market, liquidity, operational, Information Security and strategic risks through appropriate risk indicators and management information.
MEDIUM OF REPORTINGThe proceedings of the Integrated Risk Management Committee meetings are tabled and ratified at the Board meetings and Board approval obtained thereof.
AREAS OF FOCUS AND ACTIVITIES IN 2021 Reviewed and recommended the following
policies/manuals/plans based on which the risk profile of the Bank is assessed:
• Loan Review Mechanism Policy (LRM)
• Vulnerability Management Policy
• Business Continuity Management Policy and the Business Continuity Plan of the Bank
• Integrated Risk Management Policy
• Credit Risk Rating Policy
• Credit Risk Management Policy
• Market Risk Management Policy
• Foreign Exchange Risk Management Policy
• Credit Portfolio Risk Management Policy
• Liquidity Risk Management Policy
• Stress Testing Policy
• ICAAP Policy
• Operational Risk Management Policy
• IT Risk Management Policy
• Integrated Environment and Social Risk Management Policy
• Information Security Policy
• Cyber Security Policy for Maldives and Chennai
• Compliance Policy
• AML/CFT Policy (Anti Money Laundering/Combating the Financing of Terrorism)
• Annual Compliance Plan
BOARD SUBCOMMITTEE REPORTS
BANK OF CEYLON | ANNUAL REPORT 2021
95
Following committee charters and TORs were reviewed;
• Integrated Risk Management Committee Charter
• ICAAP and Recovery Capital Plan (RCP) Steering Committee
• Operational Risk Management Executive Committee
• Corporate Information Security Committee
• Adopted the Risk Management Framework and its Governance structure
The Independent Integrated Risk Management Division of the Bank assessed the risks of the Bank on a monthly basis and summary reports were submitted before the Committee. The Committee reviewed them and submitted its recommendation to the Board immediately through minutes of the meeting and specific recommendations
Monitored quantitative and qualitative risks which have gone beyond the limits and made necessary recommendations.
Improved the Risk Management Dashboard to support the subsidiaries to manage the risk functions better
Evaluated and monitored subsidiary Risk Management Dash Boards and made the necessary recommendations to overcome various risks faced by the subsidiaries.
Monitored Key Risk Indicators in the Branch network, critical businesses and support divisions.
Monitored the Risk Aggregation report of the Bank on a quarterly basis.
Risk Appetite and Limit Setting for 2021 was established.
Recommended the adoption of the Internal Capital Adequacy Assessment Process (ICAAP) for the year 2021.
Adopted the necessary initial steps to develop the Recovery Plan as per the CBSL Directions.
Reviewed stress testing results on a quarterly basis.
Reviewed and recommended the Limit Management Framework for year 2021
Carried out risk assessment on regular basis on foreign currency and Rupee liquidity position of the Bank.
Carried out the performance evaluations of the Chief Risk Officer and Compliance Officer.
Ensured that the Bank embarks on setting up the ESMS unit under the guidance of CRO and finalised the ESMS Policy.
Spearheaded the implementation of the ISO 27001 certification project.
Completed the vulnerability assessment and penetration testing for the year 2021 and reviewed the rectification programme on a regular basis.
Initiated the process for adopting Control Objectives for Information and Related Technology (COBIT) governance framework within the Bank.
Reviewed the comprehensive Compliance Reports submitted by the Compliance Officer.
Reviewed the decisions of the Committee dealing with Forged Cheques and Frauds on a quarterly basis.
Reviewed the decisions of the Committee dealing with operational losses on a quarterly basis.
Reviewed the Compliance Risk Assessment format facilitating off-site risk assessment.
The Committee wishes to record an appreciation for Mr Jayampathy Molligoda, who was a member of this Committee during the year under consideration, who has since resigned from the Board of Bank of Ceylon, for the valuable contribution made by him to this Committee.
CONCLUSIONActing collectively, the members of the Integrated Risk Management Committee have evaluated its performance during the year for effectiveness and efficiency.
The Committee is cognisant of the fact that it needs to be vigilant and attuned to its risk combat strategy with the advancement of technology, increased vulnerability with macroeconomic shocks and volatility and industrywide frauds and cyber-crimes beginning to pose greater threats.
Increasing awareness among staff over the need for managing risks, ensuring compliance and training staff are important components of this approach. The Committee is of the view that the Bank is on the right path towards meeting the challenges of risk management and compliance whilst safeguarding the interests of Bank’s stakeholders.
On behalf of the Integrated Risk Management Committee
R M Priyantha Rathnayake Chairman,Integrated Risk Management Committee
24 February 2022
Overview Leadership Insights Our Bank Our Strategy Our Performance
Stakeholder Outcomes Accountability Financial Reports Compliance Annexes Supplimentary Information
BANK OF CEYLON | ANNUAL REPORT 2021
96
HUMAN RESOURCES AND REMUNERATION COMMITTEE REPORT
COMMITTEE COMPOSITION DURING 2021The following Directors were members of the Committee during the year 2021:
(1) Mr A C Manilka Fernando Chairman/Independent Non-Executive
Director
(1) Mr R M Priyantha Rathnayake Member/Non-Executive Ex officio
Director
(2) Major General (Rtd) G A Chandrasiri Member/Independent Non-Executive
Director
SECRETARY TO THE COMMITTEEThe Secretary, Bank of Ceylon/Secretary to the Board who is an Attorney-at-Law and a Deputy General Manager, functions as the Secretary to the Committee.
ATTEND UPON INVITATION General Manager
Deputy General Manager (Human Resources)
Any other member of Corporate or Executive Management
Meetings held in 2021: 05Joint Human Resource and Remuneration and Information and Technology Committee meeting: 01
(Attendance given on page 88 of this Report)
Quorum: Two members
revising remuneration, benefits and other payments of performance based incentives.
Reviewing staff in matters referred to it by the Board.
Determining the Human Resource Policy and Organisation Structure of the Bank.
According to the aforesaid Banking Act Direction No. 11 of 2007, this Committee has to determine the Remuneration Policy relating to the Chairman and Directors. However, in the case of Bank of Ceylon, the remuneration of Directors is determined in accordance with the circulars and instructions issued by the Government of Sri Lanka, the sole shareholder of the Bank. The provisions in the Bank of Ceylon Ordinance No. 53 of 1938 and its amendments, are also taken into consideration in this regard. The Bank has a Remuneration Policy in place, prepared based on the above, which is reviewed as and when new regulations are issued by the Government. The details of the remuneration given to Directors, are disclosed in the Annual Report on a yearly basis.
Principal focus This Committee focuses on assisting the
Board in the Human Resource matters primarily on the evaluation of the KMP.
Medium of Reporting The proceedings of the Committee meetings
are tabled and ratified at Board meetings and approval of the Board is thus obtained for implementation of the recommendations made by the Committee.
Areas of focus and activities in 2021 The Committee evaluated the performance
appraisals made of the Key Management Personnel (KMP) (other than the Deputy General Manager (Compliance), Chief Risk Officer and Chief Internal Auditor whose evaluations were placed before the respective subcommittees) for the year ended 2020 based on the targets set at the commencement of the year in line with the Corporate Plan.
The Committee reviewed and recommended the Key Performance Indicators (KPI) of the members of the Corporate Management and the General Manager for the year 2021.
Followed up on the action plan to develop the employees with required skills, knowledge and attitudes.
A committee was appointed to review the organisation structure of the Bank to make it future ready.
Recommended adoption of the following Policies/Charter –
• Reviewed Human Resource and Remuneration Committee Charter.
• Revised Disciplinary Code of the Bank.
• Revised Code of Ethics of the Bank.
• Revised policy on awarding marks for commendations and deduction of marks for adverse comments/punishments for promotion to the grade of Deputy General Manager and Assistant General Manager.
• Revised policy on Maternity Leave taken by Trainee/Probationer during the Training/Probationary period.
• The remuneration of employees is revised once in three years, with the approval of the Ministry, whose purview the Bank comes under as per the provisions of the Bank of Ceylon Ordinance.
Accordingly, the Committee recommended revision of salaries and special allowances of Assistant General Managers and members of the Corporate Management (other than the contracted employees who are parallel to the grade of Deputy General Manager which are fixed at the time of recruitment) for the period from 01.01.2021 to 31.12.2023.
WAY FORWARDThe Committee will continue to encourage the use of best practices in Human Resource in the Bank.
CONCLUSIONThe members of the Committee collectively evaluated the performance of the Committee.
On behalf of the Human Resources and Remuneration Committee
A C Manilka FernandoChairman,Human Resources and Remuneration Committee
24 February 2022
ROLE OF COMMITTEETerms of Reference of the CommitteeThe main responsibilities of the Committee, which are mainly based on the Banking Act Direction No. 11 of 2007 on Corporate Governance for Licensed Commercial Banks in Sri Lanka issued by the Central Bank of Sri Lanka and incorporated into the Committee Charter, are as follows:
Determining the Remuneration Policy (salaries, allowances and other financial payments) relating to Key Management Personnel (KMP) of the Bank.
Setting goals and targets for the General Manager (GM) and KMP.
Evaluating the performance of the GM and KMP against the set targets and goals periodically and determining the basis for
BOARD SUBCOMMITTEE REPORTS
BANK OF CEYLON | ANNUAL REPORT 2021
97
NOMINATION AND CORPORATE GOVERNANCE COMMITTEE REPORT
COMMITTEE COMPOSITION DURING 2021The following Directors were members of the Committee during the year 2021:
Until 03 March 2021
(1) Mr A C Manilka Fernando Chairman/Independent Non-Executive
Director
(2) Mr R M Priyantha Rathnayake Member/Non-Executive Ex officio
Director
(3) Mr G Harsha Wijayawardhana Member/Independent Non-Executive
Director
From 04 March 2021
(1) Mr Jayampathy Molligoda Chairman/Independent Non-Executive
Director (Submitted resignation to be effective from 01.02.2022)
(2) Mr A C Manilka Fernando Member/Independent Non-Executive
Director
(3) Mr R M Priyantha Rathnayake Member/Non-Executive Ex officio
Director
(4) Mr G Harsha Wijayawardhana Member/Independent Non-Executive
Director
SECRETARY TO THE COMMITTEEThe Secretary, Bank of Ceylon/Secretary to the Board who is an Attorney-at-Law and a Deputy General Manager, functions as the Secretary to the Committee.
ATTEND UPON INVITATION General Manager
Any other member of the management as decided by the Committee
Meetings held in 2021: 08
(Attendance given on page 88 of this Report)
Quorum: Two members
The Committee also ensures that the scope and coverage of its functions addresses the requirements of the Banking Act Direction No. 11 of 2007 on “Corporate Governance for Licenced Commercial Banks in Sri Lanka” and its subsequent amendments issued by the Central Bank of Sri Lanka and that of the Code of Best Practice on Corporate Governance issued by the Institute of Chartered Accountants of Sri Lanka.
Principal FocusThe Nomination and Corporate Governance Committee assists the Board in ensuring compliance with Corporate Governance principles as required by regulations or otherwise in addition to assisting the Board with regard to the appointment of the Chief Executive Officer/General Manager and the Key Management Personnel (KMP).
Medium of ReportingThe proceedings of the Nomination and Corporate Governance Committee meetings are tabled and ratified at the Board meetings and Board approval obtained thereof.
AREAS OF FOCUS AND ACTIVITIES IN 2021 As provided in the Bank of Ceylon Ordinance
No. 53 of 1938 and its amendments the Bank being fully State owned, the Minister under whose purview the Bank falls appoints Directors to the Board of Bank of Ceylon. This Committee accordingly has no direct role in connection with the appointment of Directors. However, an internal Policy on appointment of Directors to the Board is in place in the Bank based on a recommendation of this Committee specifying the criteria required for appointment as a Director of the Bank, which is shared with the appointing authority to assist in identifying the skill set needed for a Director of the Bank.
A Policy on Appointment of Directors to the subsidiaries of Bank of Ceylon is also in place on a recommendation made by this Committee.
A Corporate Governance Policy was introduced and recommended while reviewing the following policies, incorporated therein:
• The Communication Policy of the Bank.
• The Policy on Directors’ Access to Independent Professional Advice.
• The Charter of the Nomination and Corporate Governance Committee.
Ensured that the KMP are fit and proper persons to hold their offices when officers were promoted or appointed as KMP.
Followed up on the succession planning process for the grades below KMP using artificial intelligence (AI Tools).
Reviewed the Succession Plan for Corporate Management and Executive Management (KMP).
Assessed the training needs with a view to leadership development of KMP.
Reviewed and recommended the introduction of new designations for KMP and the movement of the KMP as recommended by the Management.
Ensured the compliance with the applicable Corporate Governance regulations.
Recommended the Board Evaluation Report for the year 2021.
WAY FORWARDThe Committee will strive to promote best practices in Corporate Governance in the Bank, focusing in particular on the implementation of the Directions issued by the Regulators.
CONCLUSIONThe Committee reviewed the efficiency of its work through the annual evaluation that was carried out collectively. The Committee will continue to add value to the Board’s responsibilities through the functions of this Committee.
On behalf of the Nomination and Corporate Governance Committee
Jayampathy MolligodaChairman,Nomination and Corporate Governance Committee
31 January 2022
ROLE OF COMMITTEENomination and Corporate Governance Committee CharterThe Terms of Reference of the Nomination and Corporate Governance Committee are governed by the Committee Charter, approved and adopted by the Board.
Overview Leadership Insights Our Bank Our Strategy Our Performance
Stakeholder Outcomes Accountability Financial Reports Compliance Annexes Supplimentary Information
BANK OF CEYLON | ANNUAL REPORT 2021
98
INFORMATION AND COMMUNICATION TECHNOLOGY COMMITTEE REPORT
COMMITTEE COMPOSITION DURING 2021The following Directors were members of the Committee during the year 2021:
(1) Mr G Harsha Wijayawardhana Chairman/Independent Non-Executive
Director
(2) Mr A C Manilka Fernando Member/Independent Non-Executive
Director
(3) Mr Jayampathy Molligoda1
Member/Independent Non-Executive Director
SECRETARY TO THE COMMITTEEThe Secretary, Bank of Ceylon/Secretary to the Board who is an Attorney-at-Law and a Deputy General Manager, functions as the Secretary to the Committee.
REGULAR PARTICIPANTS General Manager
Chief Information Officer/Head of IT
Deputy General Manager (Product and Banking Development)
Chief Risk Officer
ATTEND UPON INVITATION Assistant General Managers attached to IT
Division
Assistant General Manager (Product Development and Business Process Re-Engineering Project)
Any other member of the Board, the Corporate Management and Staff Member as decided by the Committee
ATTEND AS AN OBSERVER Chief Internal Auditor
Meetings held in 2021: 09(Attendance given on page 88 of this Report)
Joint Human Resource and Remuneration and Information and Technology Committee meeting: 01
Quorum: Two members
Principal FocusThe primary purpose of this Committee is to assist the Board of the Bank in fulfilling their oversight responsibilities with regard to the existence, operation and effectiveness of the IT products and services, policies, practices and IT infrastructure employed by the Bank to manage various types of IT products and services including major technology investments. It ensures that the Bank has a robust IT infrastructure and capabilities in place at all times, follows best practice and maintains alignment with Bank’s Corporate Plan by analysing emerging trends in technology.
Medium of ReportingThe proceedings of the ICT Committee meetings are tabled and ratified at the Board meetings and Board approval obtained thereof.
AREAS OF FOCUS AND ACTIVITIES IN 2021 Reviewed the Committee Charter.
Monitored the ongoing IT developments/IT infrastructure enhancements in the Bank and guided on the proposed developments/improvements.
Monitored the operations of the existing critical applications of the Bank and provided necessary guidance to rectify and resolve existing issues.
Monitored the progress of the proposed digital banking solution (Internet and Mobile banking system (B-APP) for the Bank.
Reviewed the revamping of Corporate Website of the Bank.
Reviewed the IT Procurement Plan for 2022.
Discussed the Bank’s digital initiatives embedded in the Corporate Plan.
Discussed the implementation of web-based e-payment solution for the Bank.
Initiated the digital marketing platform.
Initiated the digital signature platform for the Bank.
Reviewed the proposed bio metric-based payment solution.
Assisted to fulfill the required HR for IT Division.
Initiated the recruitment process for a new Chief Information Officer (CIO) with the expiry of the contract of the previous CIO.
Recommended the following
• Customer Loyalty Management Solution for the Bank.
• E-waste Management Policy.
• Appointment of five committees consisting of industry experts to prepare the “IT Road Map” for the next three to five years and streamline the IT infrastructure of the Bank.
• Development of an “Artificial Intelligence Software Tool” for Credit Assessment.
• Measures to be taken to ensure cyber security.
• A Source Code Management System for the IT Division.
The Committee wishes to record an appreciation for Mr Jayampathy Molligoda, who was a Member of this Committee during the year 2021 who has since resigned, from the Board, for the valuable contribution made by him to this Committee.
WAY FORWARDThe Committee will extend its maximum support in ensuring that the Information and Communication Technology infrastructure is resilient during this challenging time and in reshaping the Bank in the new normal environment.
CONCLUSIONThe members of the Information and Communication Technology Committee have evaluated the Committee’s performance during the year 2021 for effectiveness and efficiency.
On behalf of the Information and Communication Technology Committee
G Harsha WijayawardhanaChairman,Information and Communication Technology Committee
24 February 2022
1 Mr Jayampathy Molligoda, was appointed to the Committee w.e.f. 04 March 2021 and resigned w.e.f. 31 January 2022.
ROLE OF COMMITTEEInformation and Communication Technology (ICT) Committee Charter
The Terms of Reference of the ICT Committee are governed by the ICT Committee Charter, approved and adopted by the Board.
BOARD SUBCOMMITTEE REPORTS
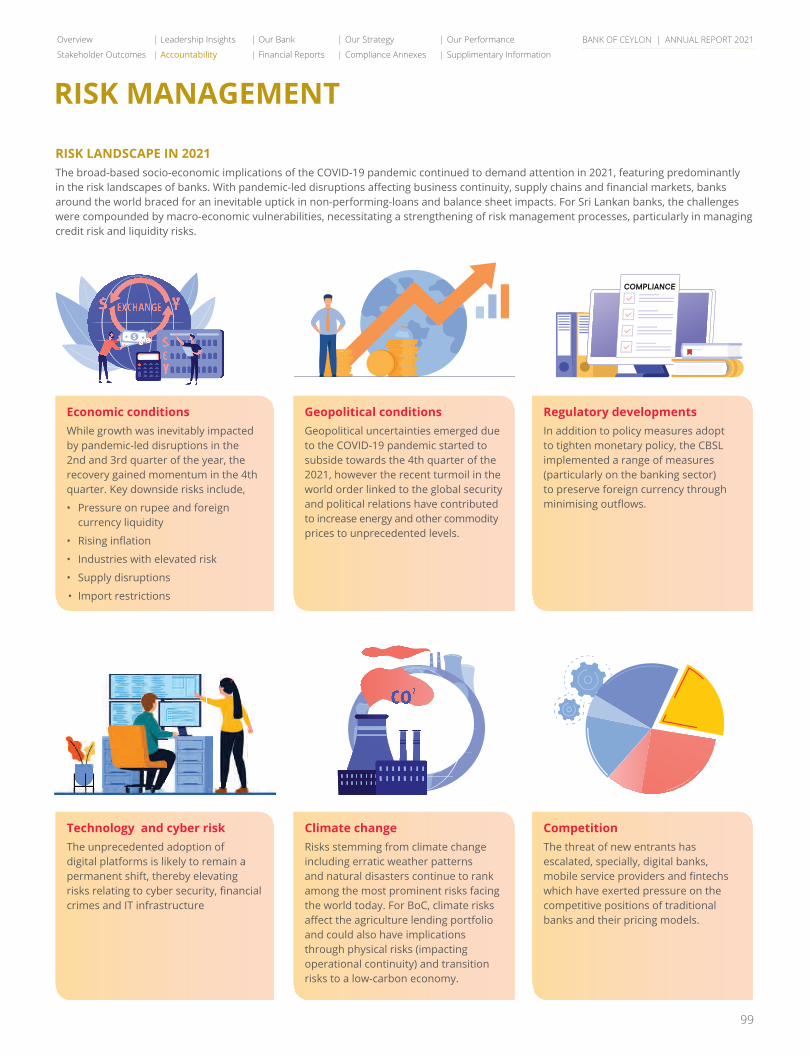
BANK OF CEYLON | ANNUAL REPORT 2021
99
RISK LANDSCAPE IN 2021The broad-based socio-economic implications of the COVID-19 pandemic continued to demand attention in 2021, featuring predominantly in the risk landscapes of banks. With pandemic-led disruptions affecting business continuity, supply chains and financial markets, banks around the world braced for an inevitable uptick in non-performing-loans and balance sheet impacts. For Sri Lankan banks, the challenges were compounded by macro-economic vulnerabilities, necessitating a strengthening of risk management processes, particularly in managing credit risk and liquidity risks.
Economic conditionsWhile growth was inevitably impacted by pandemic-led disruptions in the 2nd and 3rd quarter of the year, the recovery gained momentum in the 4th quarter. Key downside risks include,
• Pressure on rupee and foreign currency liquidity
• Rising inflation
• Industries with elevated risk
• Supply disruptions
• Import restrictions
Technology and cyber riskThe unprecedented adoption of digital platforms is likely to remain a permanent shift, thereby elevating risks relating to cyber security, financial crimes and IT infrastructure
Geopolitical conditionsGeopolitical uncertainties emerged due to the COVID-19 pandemic started to subside towards the 4th quarter of the 2021, however the recent turmoil in the world order linked to the global security and political relations have contributed to increase energy and other commodity prices to unprecedented levels.
Climate changeRisks stemming from climate change including erratic weather patterns and natural disasters continue to rank among the most prominent risks facing the world today. For BoC, climate risks affect the agriculture lending portfolio and could also have implications through physical risks (impacting operational continuity) and transition risks to a low-carbon economy.
Regulatory developments In addition to policy measures adopt to tighten monetary policy, the CBSL implemented a range of measures (particularly on the banking sector) to preserve foreign currency through minimising outflows.
Competition The threat of new entrants has escalated, specially, digital banks, mobile service providers and fintechs which have exerted pressure on the competitive positions of traditional banks and their pricing models.
RISK MANAGEMENT
Overview Leadership Insights Our Bank Our Strategy Our Performance
Stakeholder Outcomes Accountability Financial Reports Compliance Annexes Supplimentary Information
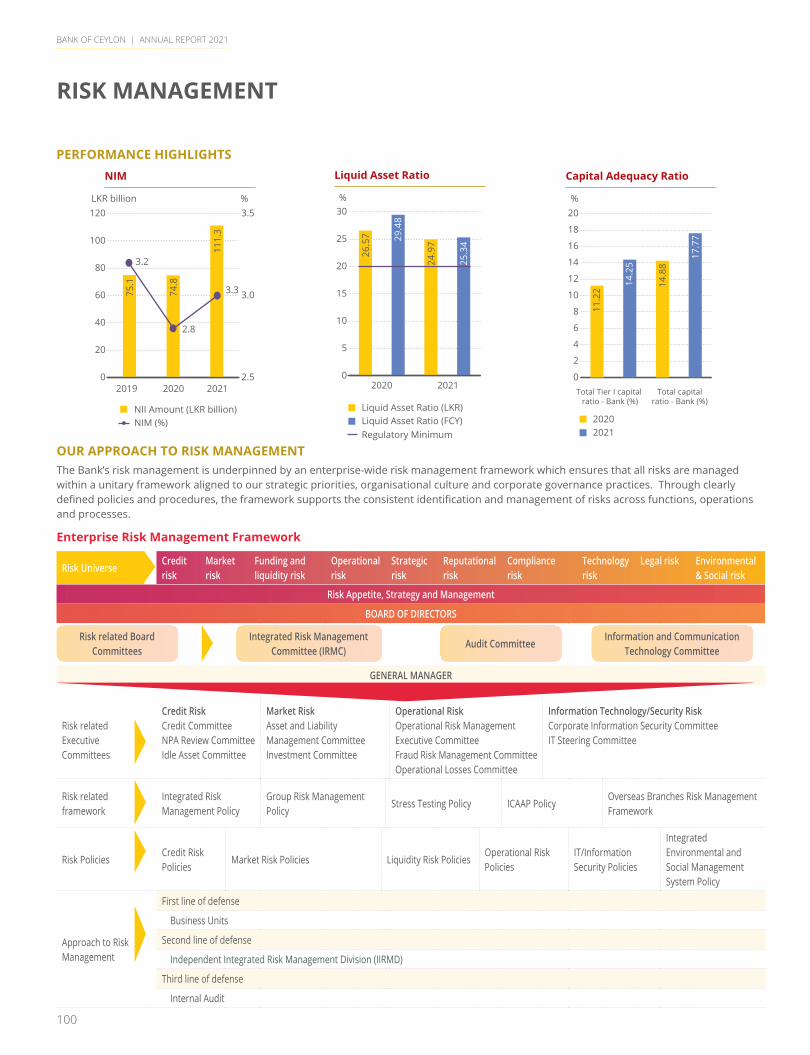
BANK OF CEYLON | ANNUAL REPORT 2021
100
PERFORMANCE HIGHLIGHTS
OUR APPROACH TO RISK MANAGEMENTThe Bank’s risk management is underpinned by an enterprise-wide risk management framework which ensures that all risks are managed within a unitary framework aligned to our strategic priorities, organisational culture and corporate governance practices. Through clearly defined policies and procedures, the framework supports the consistent identification and management of risks across functions, operations and processes.
Enterprise Risk Management Framework
Risk UniverseCredit risk
Market risk
Funding and liquidity risk
Operational risk
Strategic risk
Reputational risk
Compliance risk
Technology risk
Legal risk Environmental & Social risk
Risk Appetite, Strategy and Management
BOARD OF DIRECTORS
GENERAL MANAGER
Risk related Executive Committees
Credit RiskCredit Committee NPA Review Committee Idle Asset Committee
Market RiskAsset and Liability Management CommitteeInvestment Committee
Operational Risk Operational Risk Management Executive CommitteeFraud Risk Management Committee Operational Losses Committee
Information Technology/Security RiskCorporate Information Security CommitteeIT Steering Committee
Risk related framework
Integrated Risk Management Policy
Group Risk Management Policy
Stress Testing Policy ICAAP PolicyOverseas Branches Risk Management Framework
Risk Policies Credit Risk Policies
Market Risk Policies Liquidity Risk PoliciesOperational Risk Policies
IT/Information Security Policies
Integrated Environmental and Social Management System Policy
Approach to Risk Management
First line of defense
Business Units
Second line of defense
Independent Integrated Risk Management Division (IIRMD)
Third line of defense
Internal Audit
Risk related Board Committees
Integrated Risk Management Committee (IRMC)
Audit CommitteeInformation and Communication
Technology Committee
NIM
0
20
40
60
80
100
120LKR billion %
2.5
3.0
3.5
75.1
3.2
2.8
3.374.8
111.
3
2019 2020 2021
NII Amount (LKR billion)NIM (%)
Liquid Asset Ratio
20212020
%
Liquid Asset Ratio (LKR)Liquid Asset Ratio (FCY)Regulatory Minimum
0
5
10
15
20
25
30
29.4
8
25.3
4
24.9
7
26.5
7
Capital Adequacy Ratio
0
2
4
6
8
10
12
14
16
18
20%
20202021
Total capitalratio - Bank (%)
Total Tier I capital ratio - Bank (%)
11.2
2
14.2
5
14.8
8
17.7
7
RISK MANAGEMENT
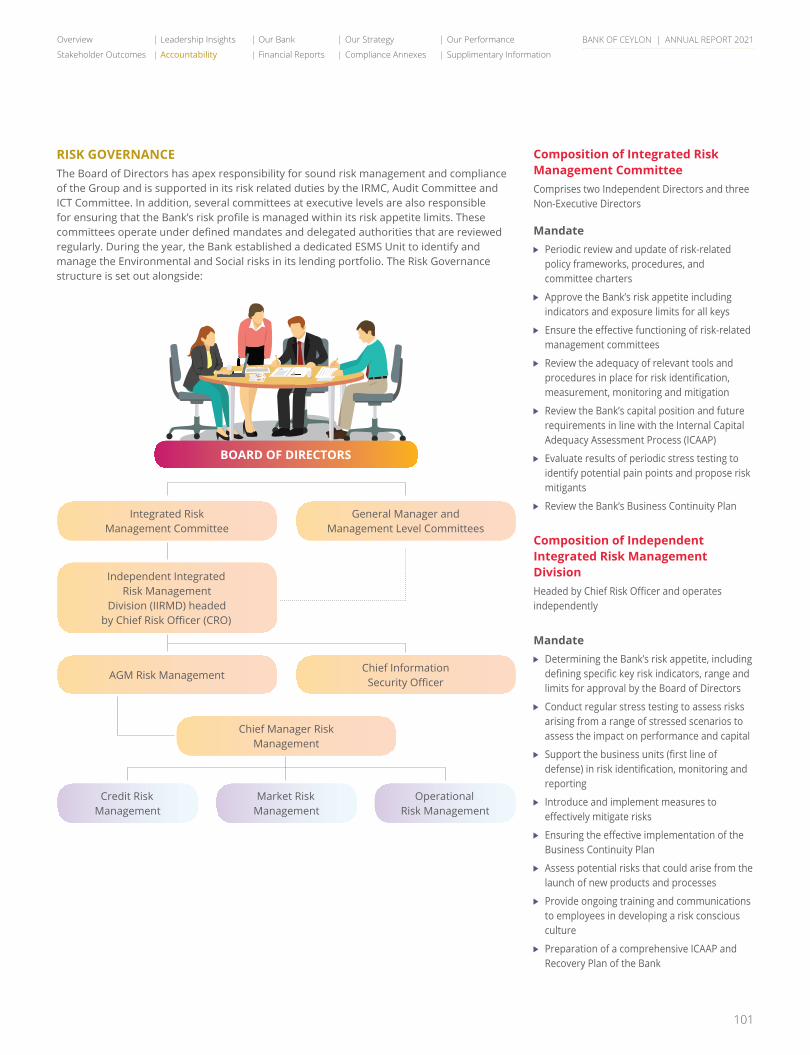
BANK OF CEYLON | ANNUAL REPORT 2021
101
RISK GOVERNANCEThe Board of Directors has apex responsibility for sound risk management and compliance of the Group and is supported in its risk related duties by the IRMC, Audit Committee and ICT Committee. In addition, several committees at executive levels are also responsible for ensuring that the Bank’s risk profile is managed within its risk appetite limits. These committees operate under defined mandates and delegated authorities that are reviewed regularly. During the year, the Bank established a dedicated ESMS Unit to identify and manage the Environmental and Social risks in its lending portfolio. The Risk Governance structure is set out alongside:
Integrated RiskManagement Committee
AGM Risk Management
Chief Manager RiskManagement
Credit RiskManagement
Market RiskManagement
OperationalRisk Management
Chief Information Security Officer
Independent IntegratedRisk Management
Division (IIRMD) headedby Chief Risk Officer (CRO)
General Manager andManagement Level Committees
BOARD OF DIRECTORS
Composition of Integrated Risk Management CommitteeComprises two Independent Directors and three Non-Executive Directors
Mandate Periodic review and update of risk-related
policy frameworks, procedures, and committee charters
Approve the Bank’s risk appetite including indicators and exposure limits for all keys
Ensure the effective functioning of risk-related management committees
Review the adequacy of relevant tools and procedures in place for risk identification, measurement, monitoring and mitigation
Review the Bank’s capital position and future requirements in line with the Internal Capital Adequacy Assessment Process (ICAAP)
Evaluate results of periodic stress testing to identify potential pain points and propose risk mitigants
Review the Bank’s Business Continuity Plan
Composition of Independent Integrated Risk Management DivisionHeaded by Chief Risk Officer and operates independently
Mandate Determining the Bank’s risk appetite, including
defining specific key risk indicators, range and limits for approval by the Board of Directors
Conduct regular stress testing to assess risks arising from a range of stressed scenarios to assess the impact on performance and capital
Support the business units (first line of defense) in risk identification, monitoring and reporting
Introduce and implement measures to effectively mitigate risks
Ensuring the effective implementation of the Business Continuity Plan
Assess potential risks that could arise from the launch of new products and processes
Provide ongoing training and communications to employees in developing a risk conscious culture
Preparation of a comprehensive ICAAP and Recovery Plan of the Bank
Overview Leadership Insights Our Bank Our Strategy Our Performance
Stakeholder Outcomes Accountability Financial Reports Compliance Annexes Supplimentary Information

BANK OF CEYLON | ANNUAL REPORT 2021
102
POLICY FRAMEWORKThe Bank’s risk-related policies are set out in the Enterprise Risk Management Framework on page 101. These Board approved policies and frameworks support consistency in the identification, measurement, monitor and management of risks across the organization, under the regular review of policies complete set of policies were updated to ensure compliance to CBSL guidelines, industry best practices and dynamic business needs relevance to current market conditions; the scope of selected policies were also widened with social and governance risk incorporated to relevant policies. During the year, the Bank also introduced an Integrated Environmental and Social Management (ESMS) Policy in view of the global escalation of these risks in the banking landscape (refer to page 81 for further information)
ESMS PROCEDURE
Evaluating E&S Risk
Transaction Screening
Risk Categorisation
E&S Due Diligence
Conditions of Financing
Monitoring E&S Risk
Reviewing client/investee E&S performance
Managing non-compliance
RISK CULTUREThe Bank has fostered an evolving enterprise-wide risk culture which has the ability to identify, discuss, escalate and mitigate emerging risks. Strong emphasis on organizational and market intelligence, internal controls, Code of Ethics, policy framework aligned with the Bank’s three-lines of defense model is continuously contributing to a creation of sustainable triple bottom line while taking the risk reward dynamics into consideration.
RISK APPETITERisk appetite is defined as the level of risk the Bank is prepared to assume within its risk capacity to achieve its strategic objectives. It is articulated quantitatively as risk measures and qualitatively in terms of policies and controls. In addition to defined limits on risk exposures, the Risk Appetite Statement includes risk appetite triggers and defines specific corrective action to be taken in the event that such limits are exceeded/triggered. It is reviewed annually in view of the Bank’s strategic aspirations, market opportunities and the optimum balance between risk return dynamics.
Risk Appetite Statement and developments in 2021
RISK METRICS INDICATOR/METHODOLOGY ACTION PLAN
Credit RiskConcentration risk
Default risk
Product-wise HHISector-wise HHIGeographical-wise HHI(Herfindahl-Hirschman Index)
Budgeted NPA %Rating grade wise limits
Regular monitoring and reporting of exceptions to the Board of Directors through IRMC
Market RiskExchange rate riskEquity riskInterest rate risk
FX VaREquity VaRPVBP
Liquidity RiskLiquidity Liquidity Ratios
Gap AnalysisOperational RiskOperational loss Sector-wise operational loss
limits
STRESS TESTINGThe Bank conducts regular stress testing to assess the sensitivity of the current and potential risk profile relative to the Bank’s risk appetite. The stress testing framework uses a combination of techniques including macro-economic and business model stress testing.
Stress testing aims for an increased risk awareness throughout the Bank and safeguard business continuity by means of pro-active management. It assists the Bank in risk identification and control, complementing other risk management tools, improving capital and liquidity planning and facilitating business decision-making
RISK STRESS SCENARIO OUTPUTS
Adverse variance of NPA
Increase in gross NPA ratio Decisions on capital position and strategic business planning in-line with ICAAP
Decisions on capital and liquidity buffers
Decisions on risk appetite targets and measures
Contingency planning
Default in specific sector/region Slippage of rescheduled loans
Losing Government exposure
Reduction of Government exposure
Collateral quality Collateral depletion
Deposit run Drop in deposits
Fluctuations in FX Adverse movement in foreign exchange
Impact from subsidiaries
Impairment of investment in subsidiaries
Concentration risk Idiosyncratic Concentration Top Borrowers Top DepositorsSector Concentration
RISK MANAGEMENT
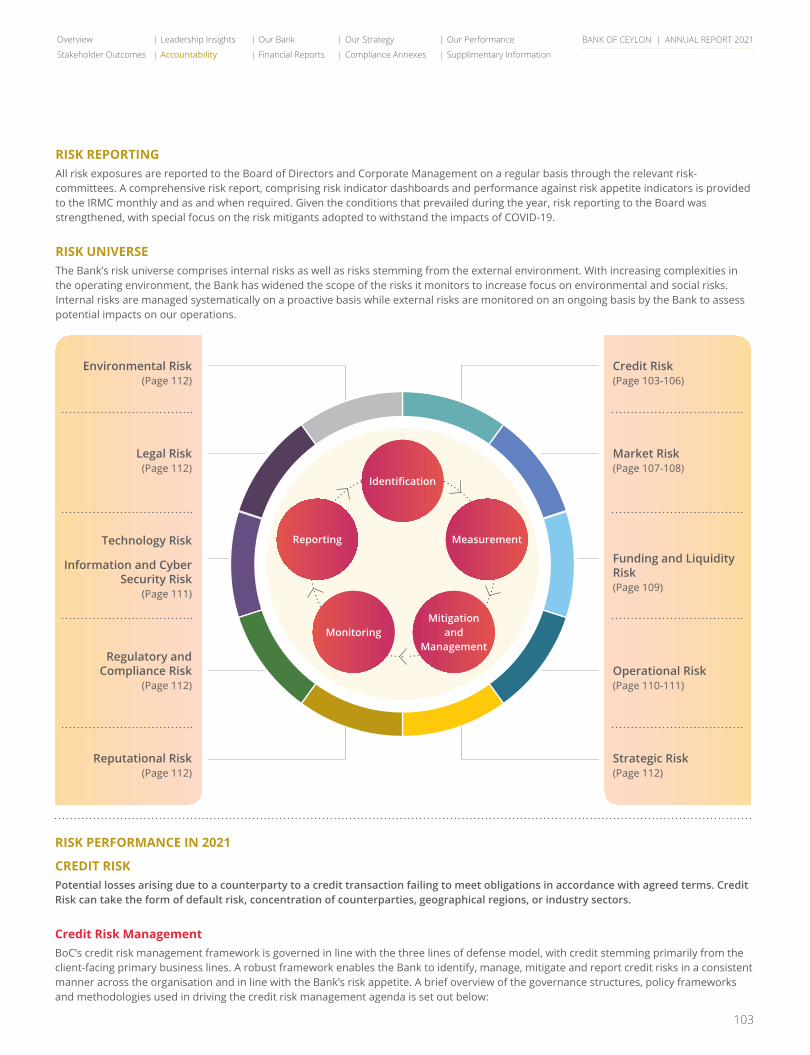
BANK OF CEYLON | ANNUAL REPORT 2021
103
RISK REPORTINGAll risk exposures are reported to the Board of Directors and Corporate Management on a regular basis through the relevant risk-committees. A comprehensive risk report, comprising risk indicator dashboards and performance against risk appetite indicators is provided to the IRMC monthly and as and when required. Given the conditions that prevailed during the year, risk reporting to the Board was strengthened, with special focus on the risk mitigants adopted to withstand the impacts of COVID-19.
RISK UNIVERSEThe Bank’s risk universe comprises internal risks as well as risks stemming from the external environment. With increasing complexities in the operating environment, the Bank has widened the scope of the risks it monitors to increase focus on environmental and social risks. Internal risks are managed systematically on a proactive basis while external risks are monitored on an ongoing basis by the Bank to assess potential impacts on our operations.
Identification
Measurement
Monitoring
Reporting
Mitigation and
Management
Credit Risk(Page 103-106)
Environmental Risk(Page 112)
Operational Risk(Page 110-111)
Regulatory and Compliance Risk
(Page 112)
Market Risk(Page 107-108)
Legal Risk(Page 112)
Strategic Risk(Page 112)
Reputational Risk(Page 112)
Funding and Liquidity Risk(Page 109)
Technology Risk
Information and Cyber Security Risk
(Page 111)
RISK PERFORMANCE IN 2021
CREDIT RISKPotential losses arising due to a counterparty to a credit transaction failing to meet obligations in accordance with agreed terms. Credit Risk can take the form of default risk, concentration of counterparties, geographical regions, or industry sectors.
Credit Risk Management BoC’s credit risk management framework is governed in line with the three lines of defense model, with credit stemming primarily from the client-facing primary business lines. A robust framework enables the Bank to identify, manage, mitigate and report credit risks in a consistent manner across the organisation and in line with the Bank’s risk appetite. A brief overview of the governance structures, policy frameworks and methodologies used in driving the credit risk management agenda is set out below:
Overview Leadership Insights Our Bank Our Strategy Our Performance
Stakeholder Outcomes Accountability Financial Reports Compliance Annexes Supplimentary Information
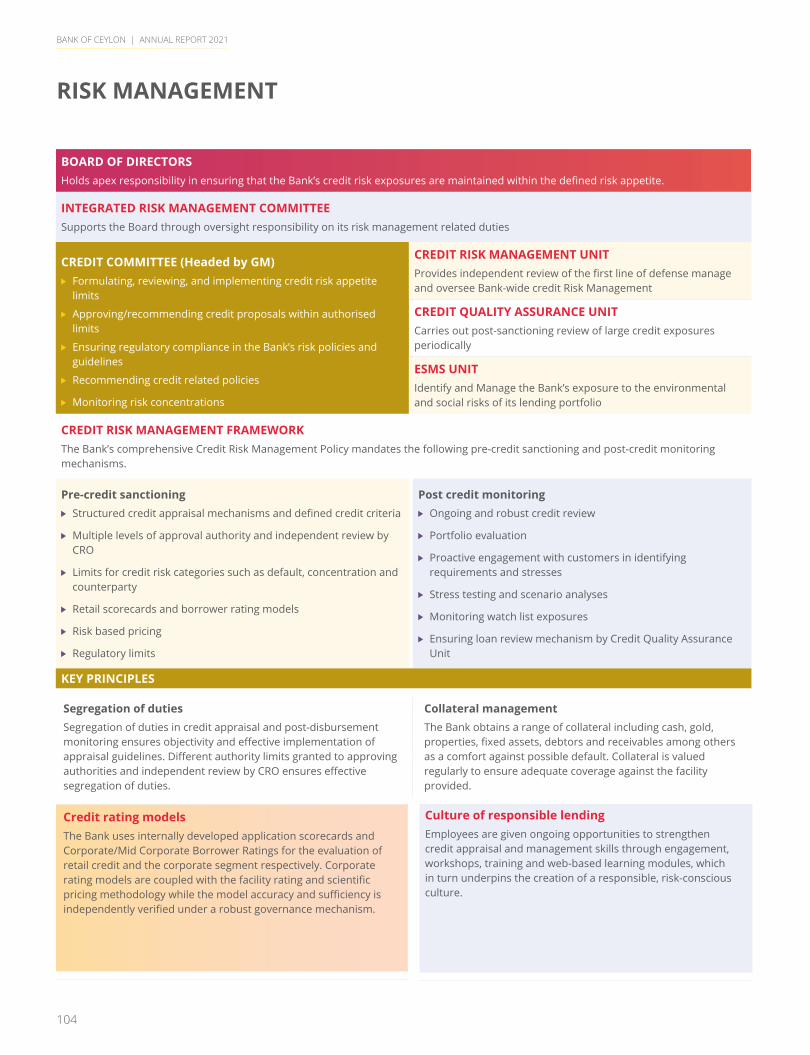
BANK OF CEYLON | ANNUAL REPORT 2021
104
BOARD OF DIRECTORSHolds apex responsibility in ensuring that the Bank’s credit risk exposures are maintained within the defined risk appetite.
INTEGRATED RISK MANAGEMENT COMMITTEESupports the Board through oversight responsibility on its risk management related duties
CREDIT COMMITTEE (Headed by GM) Formulating, reviewing, and implementing credit risk appetite
limits
Approving/recommending credit proposals within authorised limits
Ensuring regulatory compliance in the Bank’s risk policies and guidelines
Recommending credit related policies
Monitoring risk concentrations
CREDIT RISK MANAGEMENT UNIT Provides independent review of the first line of defense manage and oversee Bank-wide credit Risk Management
CREDIT QUALITY ASSURANCE UNITCarries out post-sanctioning review of large credit exposures periodically
ESMS UNITIdentify and Manage the Bank’s exposure to the environmental and social risks of its lending portfolio
CREDIT RISK MANAGEMENT FRAMEWORKThe Bank’s comprehensive Credit Risk Management Policy mandates the following pre-credit sanctioning and post-credit monitoring mechanisms.
Pre-credit sanctioning Structured credit appraisal mechanisms and defined credit criteria
Multiple levels of approval authority and independent review by CRO
Limits for credit risk categories such as default, concentration and counterparty
Retail scorecards and borrower rating models
Risk based pricing
Regulatory limits
Post credit monitoring Ongoing and robust credit review
Portfolio evaluation
Proactive engagement with customers in identifying requirements and stresses
Stress testing and scenario analyses
Monitoring watch list exposures
Ensuring loan review mechanism by Credit Quality Assurance Unit
KEY PRINCIPLES
Segregation of dutiesSegregation of duties in credit appraisal and post-disbursement monitoring ensures objectivity and effective implementation of appraisal guidelines. Different authority limits granted to approving authorities and independent review by CRO ensures effective segregation of duties.
Collateral managementThe Bank obtains a range of collateral including cash, gold, properties, fixed assets, debtors and receivables among others as a comfort against possible default. Collateral is valued regularly to ensure adequate coverage against the facility provided.
Credit rating modelsThe Bank uses internally developed application scorecards and Corporate/Mid Corporate Borrower Ratings for the evaluation of retail credit and the corporate segment respectively. Corporate rating models are coupled with the facility rating and scientific pricing methodology while the model accuracy and sufficiency is independently verified under a robust governance mechanism.
Culture of responsible lendingEmployees are given ongoing opportunities to strengthen credit appraisal and management skills through engagement, workshops, training and web-based learning modules, which in turn underpins the creation of a responsible, risk-conscious culture.
RISK MANAGEMENT
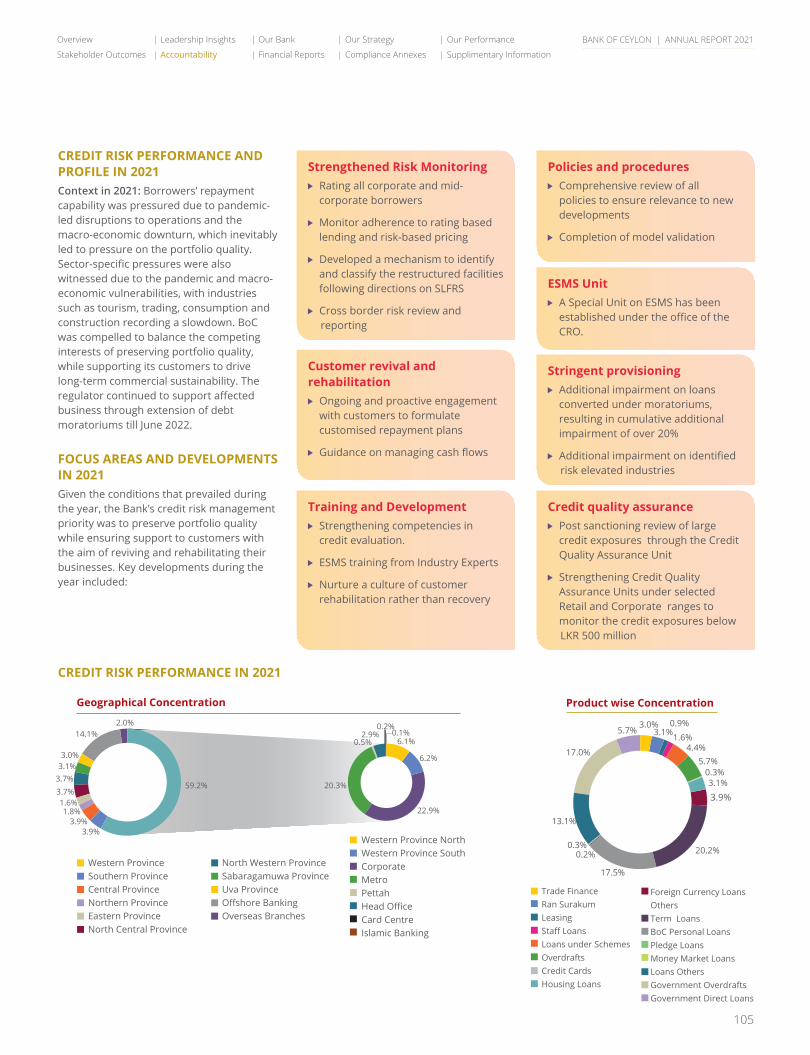
BANK OF CEYLON | ANNUAL REPORT 2021
105
CREDIT RISK PERFORMANCE AND PROFILE IN 2021Context in 2021: Borrowers’ repayment capability was pressured due to pandemic-led disruptions to operations and the macro-economic downturn, which inevitably led to pressure on the portfolio quality. Sector-specific pressures were also witnessed due to the pandemic and macro-economic vulnerabilities, with industries such as tourism, trading, consumption and construction recording a slowdown. BoC was compelled to balance the competing interests of preserving portfolio quality, while supporting its customers to drive long-term commercial sustainability. The regulator continued to support affected business through extension of debt moratoriums till June 2022.
FOCUS AREAS AND DEVELOPMENTS IN 2021Given the conditions that prevailed during the year, the Bank’s credit risk management priority was to preserve portfolio quality while ensuring support to customers with the aim of reviving and rehabilitating their businesses. Key developments during the year included:
Strengthened Risk Monitoring Rating all corporate and mid-
corporate borrowers
Monitor adherence to rating based lending and risk-based pricing
Developed a mechanism to identify and classify the restructured facilities following directions on SLFRS
Cross border risk review and reporting
Customer revival and rehabilitation Ongoing and proactive engagement
with customers to formulate customised repayment plans
Guidance on managing cash flows
Training and Development Strengthening competencies in
credit evaluation.
ESMS training from Industry Experts
Nurture a culture of customer rehabilitation rather than recovery
Policies and procedures Comprehensive review of all
policies to ensure relevance to new developments
Completion of model validation
ESMS Unit A Special Unit on ESMS has been
established under the office of the CRO.
Stringent provisioning Additional impairment on loans
converted under moratoriums, resulting in cumulative additional impairment of over 20%
Additional impairment on identified risk elevated industries
Credit quality assurance Post sanctioning review of large
credit exposures through the Credit Quality Assurance Unit
Strengthening Credit Quality Assurance Units under selected Retail and Corporate ranges to monitor the credit exposures below LKR 500 million
CREDIT RISK PERFORMANCE IN 2021
Geographical Concentration
Western ProvinceSouthern ProvinceCentral ProvinceNorthern ProvinceEastern ProvinceNorth Central Province
Western Province NorthWestern Province SouthCorporate MetroPettahHead Office Card CentreIslamic Banking
3.9%3.9%
1.8%1.6%
3.7%3.7%3.1%3.0%
14.1%2.0%
59.2%
2.9%0.2%
0.1%0.5% 6.1%
6.2%
22.9%
20.3%
North Western ProvinceSabaragamuwa ProvinceUva ProvinceOffshore BankingOverseas Branches
Product wise Concentration
Trade Finance Ran SurakumLeasingStaff LoansLoans under SchemesOverdrafts Credit CardsHousing Loans
17.0%
13.1%
17.5%
0.2%0.3% 20.2%
3.9%3.1%
0.3%5.7%
4.4%1.6%
0.9%3.1%
3.0%5.7%
Foreign Currency Loans OthersTerm LoansBoC Personal LoansPledge LoansMoney Market LoansLoans OthersGovernment OverdraftsGovernment Direct Loans
Overview Leadership Insights Our Bank Our Strategy Our Performance
Stakeholder Outcomes Accountability Financial Reports Compliance Annexes Supplimentary Information
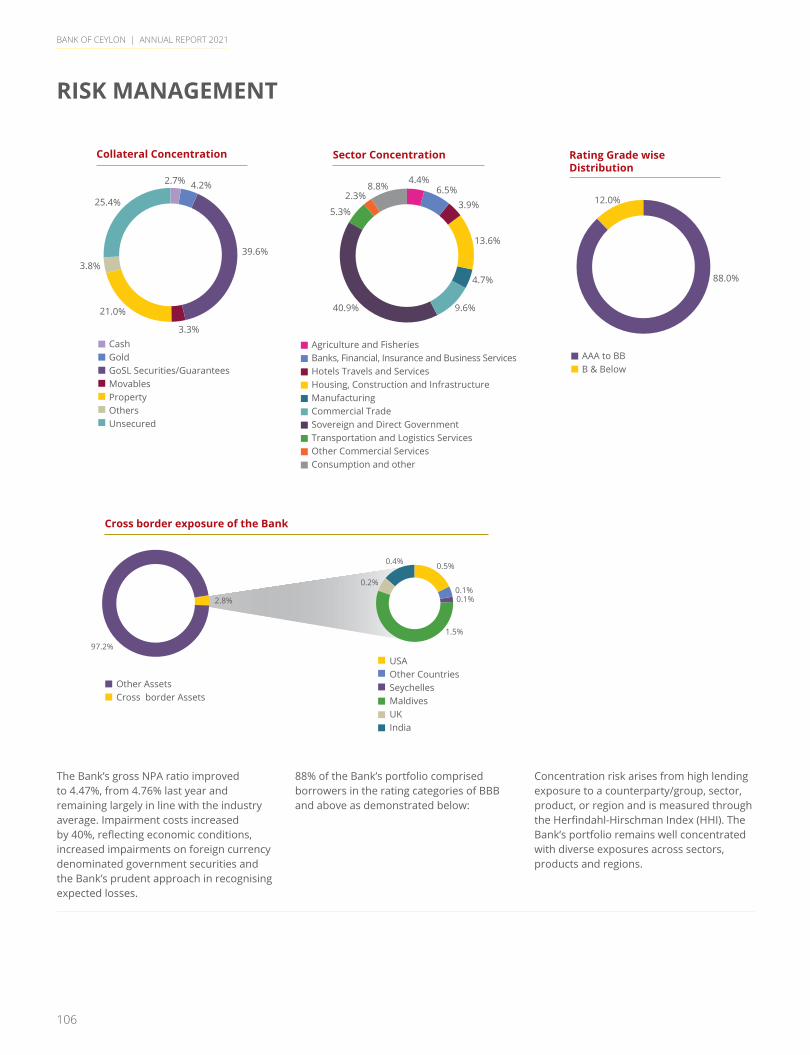
BANK OF CEYLON | ANNUAL REPORT 2021
106
The Bank’s gross NPA ratio improved to 4.47%, from 4.76% last year and remaining largely in line with the industry average. Impairment costs increased by 40%, reflecting economic conditions, increased impairments on foreign currency denominated government securities and the Bank’s prudent approach in recognising expected losses.
88% of the Bank’s portfolio comprised borrowers in the rating categories of BBB and above as demonstrated below:
Concentration risk arises from high lending exposure to a counterparty/group, sector, product, or region and is measured through the Herfindahl-Hirschman Index (HHI). The Bank’s portfolio remains well concentrated with diverse exposures across sectors, products and regions.
Collateral Concentration
CashGoldGoSL Securities/GuaranteesMovablesPropertyOthersUnsecured
39.6%
21.0%
3.8%
25.4%
3.3%
2.7% 4.2%
Sector Concentration
Agriculture and FisheriesBanks, Financial, Insurance and Business ServicesHotels Travels and ServicesHousing, Construction and InfrastructureManufacturingCommercial TradeSovereign and Direct GovernmentTransportation and Logistics ServicesOther Commercial ServicesConsumption and other
13.6%
4.7%
9.6%40.9%
4.4%
5.3%
2.3%8.8% 6.5%
3.9%
Rating Grade wise Distribution
AAA to BBB & Below
88.0%
12.0%
Cross border exposure of the Bank
Other AssetsCross border Assets
USAOther CountriesSeychellesMaldivesUK India
97.2%
2.8%
0.4%
0.2%
0.5%
0.1%0.1%
1.5%
RISK MANAGEMENT
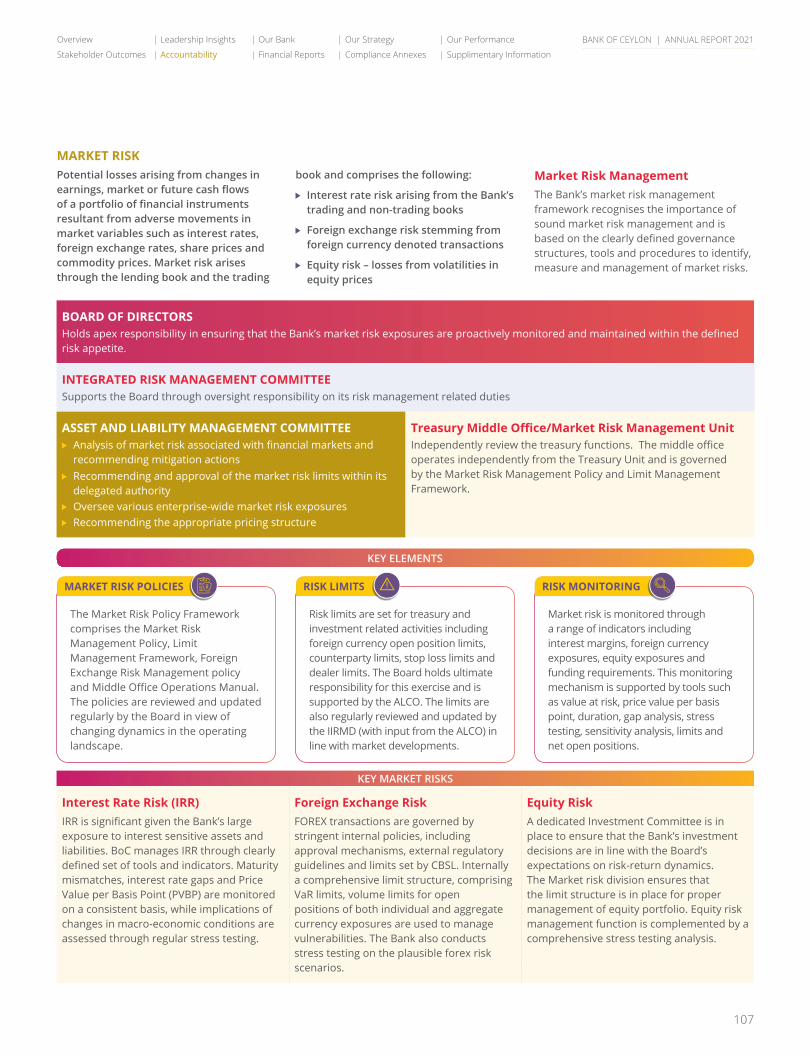
BANK OF CEYLON | ANNUAL REPORT 2021
107
MARKET RISKPotential losses arising from changes in earnings, market or future cash flows of a portfolio of financial instruments resultant from adverse movements in market variables such as interest rates, foreign exchange rates, share prices and commodity prices. Market risk arises through the lending book and the trading
book and comprises the following:
Interest rate risk arising from the Bank’s trading and non-trading books
Foreign exchange risk stemming from foreign currency denoted transactions
Equity risk – losses from volatilities in equity prices
Market Risk Management The Bank’s market risk management framework recognises the importance of sound market risk management and is based on the clearly defined governance structures, tools and procedures to identify, measure and management of market risks.
BOARD OF DIRECTORSHolds apex responsibility in ensuring that the Bank’s market risk exposures are proactively monitored and maintained within the defined risk appetite.
INTEGRATED RISK MANAGEMENT COMMITTEESupports the Board through oversight responsibility on its risk management related duties
ASSET AND LIABILITY MANAGEMENT COMMITTEE Analysis of market risk associated with financial markets and
recommending mitigation actions Recommending and approval of the market risk limits within its
delegated authority Oversee various enterprise-wide market risk exposures Recommending the appropriate pricing structure
Treasury Middle Office/Market Risk Management UnitIndependently review the treasury functions. The middle office operates independently from the Treasury Unit and is governed by the Market Risk Management Policy and Limit Management Framework.
KEY ELEMENTS
MARKET RISK POLICIES RISK LIMITS RISK MONITORING
The Market Risk Policy Framework comprises the Market Risk Management Policy, Limit Management Framework, Foreign Exchange Risk Management policy and Middle Office Operations Manual. The policies are reviewed and updated regularly by the Board in view of changing dynamics in the operating landscape.
Risk limits are set for treasury and investment related activities including foreign currency open position limits, counterparty limits, stop loss limits and dealer limits. The Board holds ultimate responsibility for this exercise and is supported by the ALCO. The limits are also regularly reviewed and updated by the IIRMD (with input from the ALCO) in line with market developments.
Market risk is monitored through a range of indicators including interest margins, foreign currency exposures, equity exposures and funding requirements. This monitoring mechanism is supported by tools such as value at risk, price value per basis point, duration, gap analysis, stress testing, sensitivity analysis, limits and net open positions.
KEY MARKET RISKS
Interest Rate Risk (IRR)IRR is significant given the Bank’s large exposure to interest sensitive assets and liabilities. BoC manages IRR through clearly defined set of tools and indicators. Maturity mismatches, interest rate gaps and Price Value per Basis Point (PVBP) are monitored on a consistent basis, while implications of changes in macro-economic conditions are assessed through regular stress testing.
Foreign Exchange RiskFOREX transactions are governed by stringent internal policies, including approval mechanisms, external regulatory guidelines and limits set by CBSL. Internally a comprehensive limit structure, comprising VaR limits, volume limits for open positions of both individual and aggregate currency exposures are used to manage vulnerabilities. The Bank also conducts stress testing on the plausible forex risk scenarios.
Equity RiskA dedicated Investment Committee is in place to ensure that the Bank’s investment decisions are in line with the Board’s expectations on risk-return dynamics. The Market risk division ensures that the limit structure is in place for proper management of equity portfolio. Equity risk management function is complemented by a comprehensive stress testing analysis.
Overview Leadership Insights Our Bank Our Strategy Our Performance
Stakeholder Outcomes Accountability Financial Reports Compliance Annexes Supplimentary Information
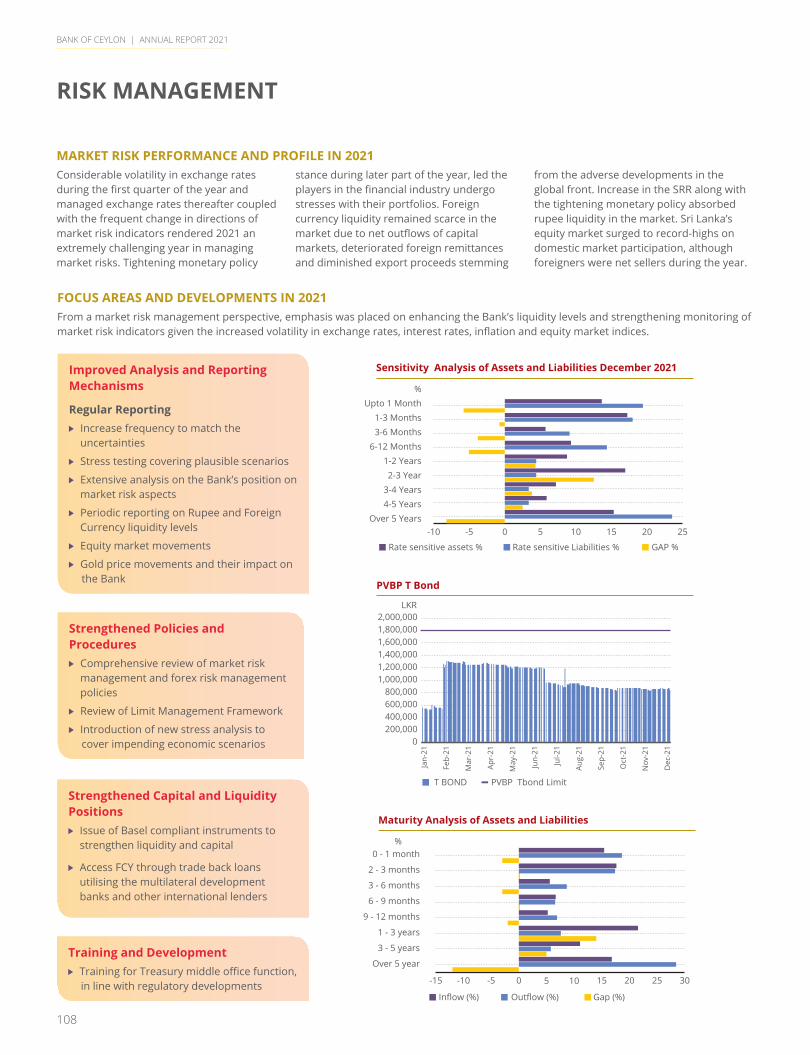
BANK OF CEYLON | ANNUAL REPORT 2021
108
MARKET RISK PERFORMANCE AND PROFILE IN 2021Considerable volatility in exchange rates during the first quarter of the year and managed exchange rates thereafter coupled with the frequent change in directions of market risk indicators rendered 2021 an extremely challenging year in managing market risks. Tightening monetary policy
stance during later part of the year, led the players in the financial industry undergo stresses with their portfolios. Foreign currency liquidity remained scarce in the market due to net outflows of capital markets, deteriorated foreign remittances and diminished export proceeds stemming
from the adverse developments in the global front. Increase in the SRR along with the tightening monetary policy absorbed rupee liquidity in the market. Sri Lanka’s equity market surged to record-highs on domestic market participation, although foreigners were net sellers during the year.
FOCUS AREAS AND DEVELOPMENTS IN 2021From a market risk management perspective, emphasis was placed on enhancing the Bank’s liquidity levels and strengthening monitoring of market risk indicators given the increased volatility in exchange rates, interest rates, inflation and equity market indices.
Strengthened Policies and Procedures Comprehensive review of market risk
management and forex risk management policies
Review of Limit Management Framework
Introduction of new stress analysis to cover impending economic scenarios
Training and Development Training for Treasury middle office function,
in line with regulatory developments
Improved Analysis and Reporting Mechanisms
Regular Reporting Increase frequency to match the
uncertainties
Stress testing covering plausible scenarios
Extensive analysis on the Bank’s position on market risk aspects
Periodic reporting on Rupee and Foreign Currency liquidity levels
Equity market movements
Gold price movements and their impact on the Bank
Strengthened Capital and Liquidity Positions Issue of Basel compliant instruments to
strengthen liquidity and capital
Access FCY through trade back loans utilising the multilateral development banks and other international lenders
Sensitivity Analysis of Assets and Liabilities December 2021
-10 -5 0 5 10 15 20 25
Upto 1 Month1-3 Months3-6 Months
6-12 Months1-2 Years2-3 Year
3-4 Years4-5 Years
Over 5 Years
%
Rate sensitive assets % Rate sensitive Liabilities % GAP %
PVBP T Bond
0200,000400,000600,000800,000
1,000,0001,200,0001,400,0001,600,0001,800,0002,000,000
LKR
T BOND PVBP Tbond Limit
Jan-
21
Feb-
21
Mar
-21
Apr-
21
May
-21
Jun-
21
Jul-2
1
Aug-
21
Sep-
21
Oct
-21
Nov
-21
Dec
-21
Maturity Analysis of Assets and Liabilities
-15 -10 -5 0 5 10 15 20 25 30
0 - 1 month
2 - 3 months
3 - 6 months
6 - 9 months
9 - 12 months
1 - 3 years
3 - 5 years
Over 5 year
%
Inflow (%) Outflow (%) Gap (%)
RISK MANAGEMENT
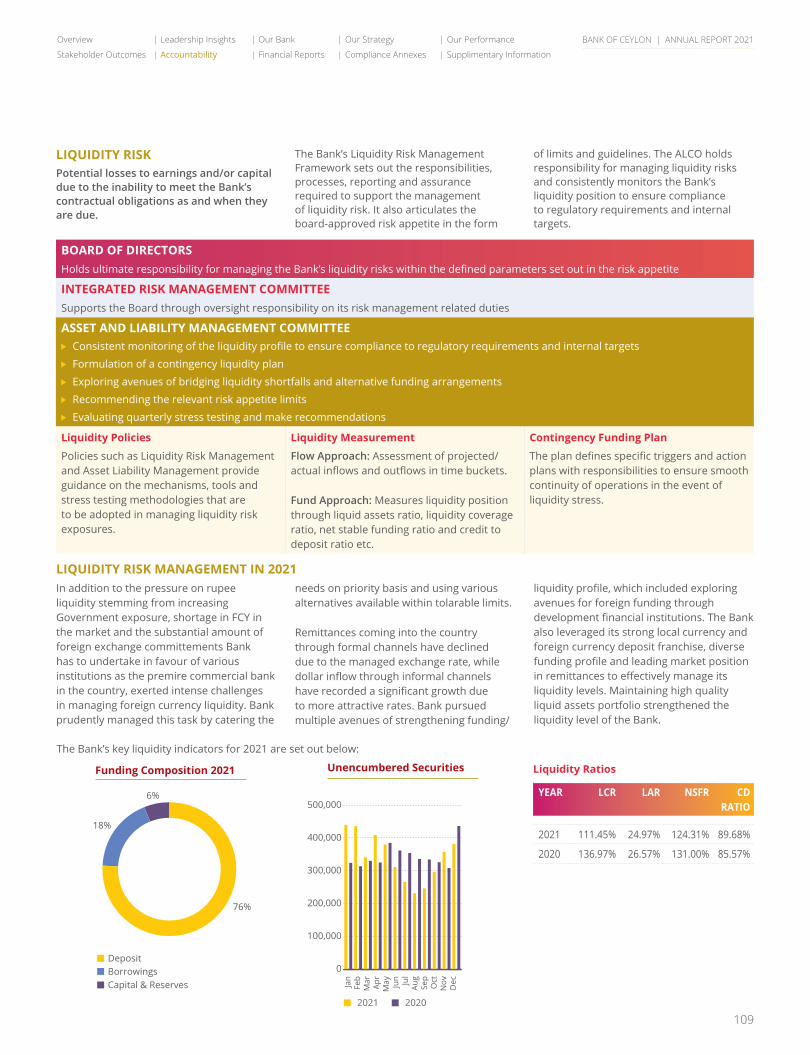
BANK OF CEYLON | ANNUAL REPORT 2021
109
LIQUIDITY RISKPotential losses to earnings and/or capital due to the inability to meet the Bank’s contractual obligations as and when they are due.
The Bank’s Liquidity Risk Management Framework sets out the responsibilities, processes, reporting and assurance required to support the management of liquidity risk. It also articulates the board-approved risk appetite in the form
of limits and guidelines. The ALCO holds responsibility for managing liquidity risks and consistently monitors the Bank’s liquidity position to ensure compliance to regulatory requirements and internal targets.
BOARD OF DIRECTORSHolds ultimate responsibility for managing the Bank’s liquidity risks within the defined parameters set out in the risk appetite
INTEGRATED RISK MANAGEMENT COMMITTEESupports the Board through oversight responsibility on its risk management related duties
ASSET AND LIABILITY MANAGEMENT COMMITTEE Consistent monitoring of the liquidity profile to ensure compliance to regulatory requirements and internal targets
Formulation of a contingency liquidity plan
Exploring avenues of bridging liquidity shortfalls and alternative funding arrangements
Recommending the relevant risk appetite limits
Evaluating quarterly stress testing and make recommendations
Liquidity Policies
Policies such as Liquidity Risk Management and Asset Liability Management provide guidance on the mechanisms, tools and stress testing methodologies that are to be adopted in managing liquidity risk exposures.
Liquidity Measurement
Flow Approach: Assessment of projected/actual inflows and outflows in time buckets.
Fund Approach: Measures liquidity position through liquid assets ratio, liquidity coverage ratio, net stable funding ratio and credit to deposit ratio etc.
Contingency Funding Plan
The plan defines specific triggers and action plans with responsibilities to ensure smooth continuity of operations in the event of liquidity stress.
LIQUIDITY RISK MANAGEMENT IN 2021 In addition to the pressure on rupee liquidity stemming from increasing Government exposure, shortage in FCY in the market and the substantial amount of foreign exchange committements Bank has to undertake in favour of various institutions as the premire commercial bank in the country, exerted intense challenges in managing foreign currency liquidity. Bank prudently managed this task by catering the
needs on priority basis and using various alternatives available within tolarable limits.
Remittances coming into the country through formal channels have declined due to the managed exchange rate, while dollar inflow through informal channels have recorded a significant growth due to more attractive rates. Bank pursued multiple avenues of strengthening funding/
liquidity profile, which included exploring avenues for foreign funding through development financial institutions. The Bank also leveraged its strong local currency and foreign currency deposit franchise, diverse funding profile and leading market position in remittances to effectively manage its liquidity levels. Maintaining high quality liquid assets portfolio strengthened the liquidity level of the Bank.
Liquidity Ratios
YEAR LCR LAR NSFR CD RATIO
2021 111.45% 24.97% 124.31% 89.68%
2020 136.97% 26.57% 131.00% 85.57%
Unencumbered Securities
0
100,000
200,000
300,000
400,000
500,000
2021 2020
Jan
Feb
Mar
Apr
May Jun Jul
Aug
Sep
Oct
Nov
Dec
Funding Composition 2021
DepositBorrowingsCapital & Reserves
76%
18%
6%
The Bank’s key liquidity indicators for 2021 are set out below:
Overview Leadership Insights Our Bank Our Strategy Our Performance
Stakeholder Outcomes Accountability Financial Reports Compliance Annexes Supplimentary Information
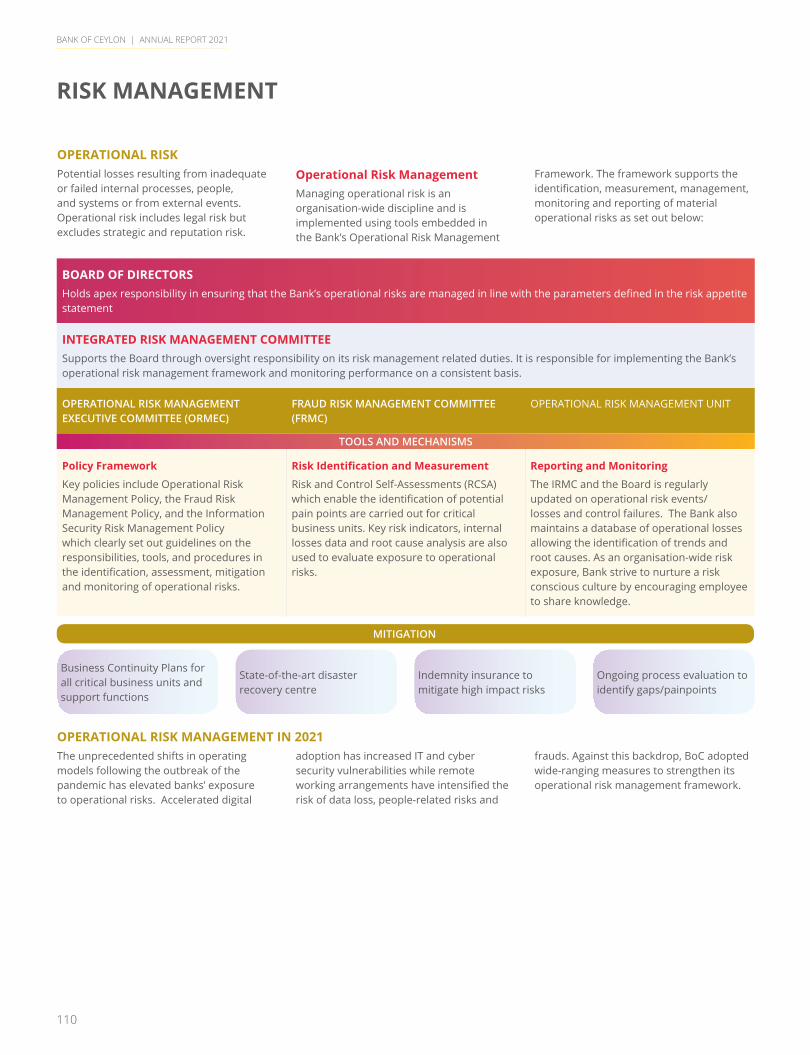
BANK OF CEYLON | ANNUAL REPORT 2021
110
OPERATIONAL RISKPotential losses resulting from inadequate or failed internal processes, people, and systems or from external events. Operational risk includes legal risk but excludes strategic and reputation risk.
Operational Risk ManagementManaging operational risk is an organisation-wide discipline and is implemented using tools embedded in the Bank’s Operational Risk Management
Framework. The framework supports the identification, measurement, management, monitoring and reporting of material operational risks as set out below:
OPERATIONAL RISK MANAGEMENT IN 2021 The unprecedented shifts in operating models following the outbreak of the pandemic has elevated banks’ exposure to operational risks. Accelerated digital
adoption has increased IT and cyber security vulnerabilities while remote working arrangements have intensified the risk of data loss, people-related risks and
frauds. Against this backdrop, BoC adopted wide-ranging measures to strengthen its operational risk management framework.
BOARD OF DIRECTORSHolds apex responsibility in ensuring that the Bank’s operational risks are managed in line with the parameters defined in the risk appetite statement
INTEGRATED RISK MANAGEMENT COMMITTEESupports the Board through oversight responsibility on its risk management related duties. It is responsible for implementing the Bank’s operational risk management framework and monitoring performance on a consistent basis.
OPERATIONAL RISK MANAGEMENT EXECUTIVE COMMITTEE (ORMEC)
FRAUD RISK MANAGEMENT COMMITTEE (FRMC)
OPERATIONAL RISK MANAGEMENT UNIT
TOOLS AND MECHANISMS
Policy Framework
Key policies include Operational Risk Management Policy, the Fraud Risk Management Policy, and the Information Security Risk Management Policy which clearly set out guidelines on the responsibilities, tools, and procedures in the identification, assessment, mitigation and monitoring of operational risks.
Risk Identification and Measurement
Risk and Control Self-Assessments (RCSA) which enable the identification of potential pain points are carried out for critical business units. Key risk indicators, internal losses data and root cause analysis are also used to evaluate exposure to operational risks.
Reporting and Monitoring
The IRMC and the Board is regularly updated on operational risk events/losses and control failures. The Bank also maintains a database of operational losses allowing the identification of trends and root causes. As an organisation-wide risk exposure, Bank strive to nurture a risk conscious culture by encouraging employee to share knowledge.
Business Continuity Plans for all critical business units and support functions
State-of-the-art disaster recovery centre
Indemnity insurance to mitigate high impact risks
Ongoing process evaluation to identify gaps/painpoints
MITIGATION
RISK MANAGEMENT
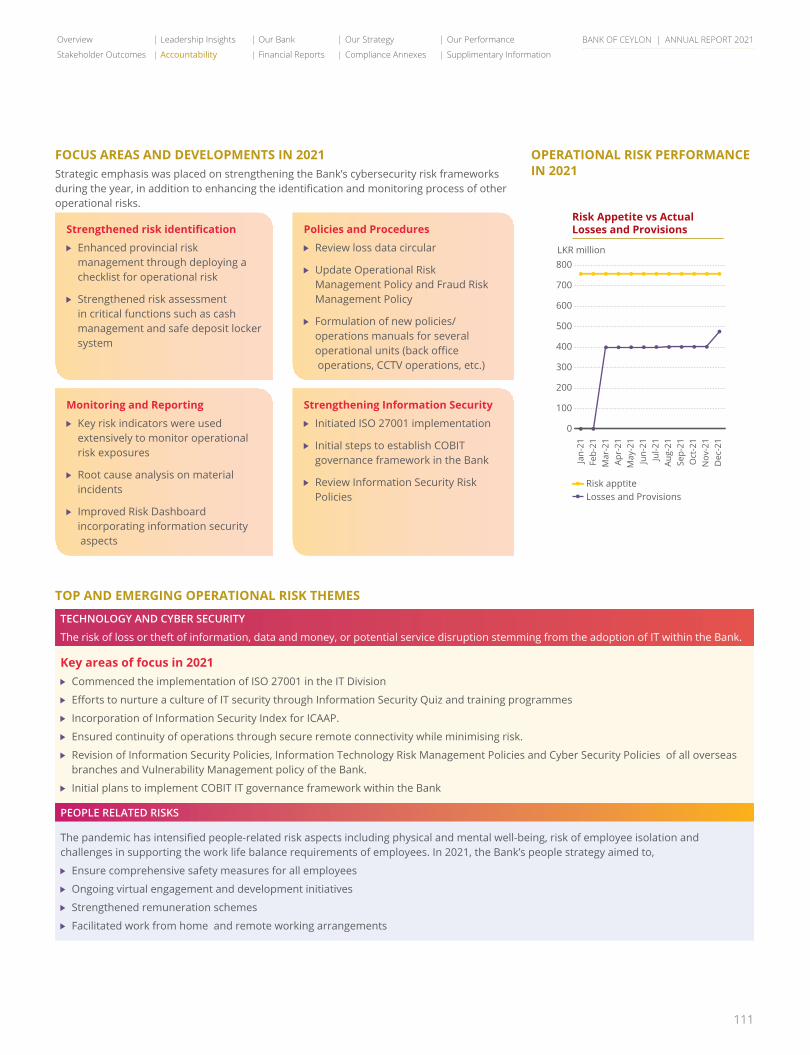
BANK OF CEYLON | ANNUAL REPORT 2021
111
Strengthened risk identification
Enhanced provincial risk management through deploying a checklist for operational risk
Strengthened risk assessment in critical functions such as cash management and safe deposit locker system
Policies and Procedures
Review loss data circular
Update Operational Risk Management Policy and Fraud Risk Management Policy
Formulation of new policies/operations manuals for several operational units (back office operations, CCTV operations, etc.)
Monitoring and Reporting
Key risk indicators were used extensively to monitor operational risk exposures
Root cause analysis on material incidents
Improved Risk Dashboard incorporating information security aspects
Strengthening Information Security Initiated ISO 27001 implementation
Initial steps to establish COBIT governance framework in the Bank
Review Information Security Risk Policies
FOCUS AREAS AND DEVELOPMENTS IN 2021Strategic emphasis was placed on strengthening the Bank’s cybersecurity risk frameworks during the year, in addition to enhancing the identification and monitoring process of other operational risks.
OPERATIONAL RISK PERFORMANCE IN 2021
Risk Appetite vs ActualLosses and Provisions
0
100
200
300
400
500
600
700
800LKR million
Risk apptiteLosses and Provisions
Jan-
21Fe
b-21
Mar
-21
Apr-
21M
ay-2
1Ju
n-21
Jul-2
1Au
g-21
Sep-
21O
ct-2
1N
ov-2
1D
ec-2
1
TOP AND EMERGING OPERATIONAL RISK THEMES
TECHNOLOGY AND CYBER SECURITY
The risk of loss or theft of information, data and money, or potential service disruption stemming from the adoption of IT within the Bank.
Key areas of focus in 2021 Commenced the implementation of ISO 27001 in the IT Division
Efforts to nurture a culture of IT security through Information Security Quiz and training programmes
Incorporation of Information Security Index for ICAAP.
Ensured continuity of operations through secure remote connectivity while minimising risk.
Revision of Information Security Policies, Information Technology Risk Management Policies and Cyber Security Policies of all overseas branches and Vulnerability Management policy of the Bank.
Initial plans to implement COBIT IT governance framework within the Bank
PEOPLE RELATED RISKS
The pandemic has intensified people-related risk aspects including physical and mental well-being, risk of employee isolation and challenges in supporting the work life balance requirements of employees. In 2021, the Bank’s people strategy aimed to,
Ensure comprehensive safety measures for all employees
Ongoing virtual engagement and development initiatives
Strengthened remuneration schemes
Facilitated work from home and remote working arrangements
Overview Leadership Insights Our Bank Our Strategy Our Performance
Stakeholder Outcomes Accountability Financial Reports Compliance Annexes Supplimentary Information

BANK OF CEYLON | ANNUAL REPORT 2021
112
REGULATORY AND COMPLIANCE RISKS
Frequent changes in regulatory guidelines have increased the risk of non-compliance stemming from varied interpretation and manner of implementation. This is mitigated through,
Close and proactive engagement with regulators
Dedicated compliance unit monitoring all compliance with guidelines and regulations
Other RisksIn addition to the principal risks described above, BoC proactively monitors and manages the vulnerabilities stemming from the following internal and external risks.
CLIMATE-RELATED RISKS
Climate-related risks including natural disasters and the failure to implement long-term solutions are among the key risks faced by organisations today. In cognisance of this, BOC intends to strengthen its climate risk management framework and during the year took steps to enhance identification and mitigation measures as described below. The Bank’s exposure to climate risk stems primarily from the following:
Credit riskLending exposures which have high exposure to climate change including agriculture, sectors that rely on agricultural inputs and tourism
Operational riskRisks stemming from natural disasters and erratic weather that can direct or indirectly disrupt the Bank’s operations
Transition risksRisk of changes in policies, investments and strategies and economies gradually shift towards low-carbon societies
Measures adopted by the Group include the following
Roll out of a comprehensive Environment and Social Management System (ESMS) with the establishment of a dedicated ESMS Unit under the IIRMD, integration of the ESMS Policy and adherence to guidelines of donor funding institutions.
Increased focus on renewable energy both from a lending perspective and internal operations
Raising employee awareness on ESMS management within the Bank
Establishing the foundation for complying with the TCFD (Task force on Climate-related Financial Disclosures) within the next three years.
Legal Risk
Potential losses to earnings and reputational damage arising from non-compliance with regulatory/statutory provisions, uncertainty due to legal actions or uncertainty in the applicability or interpretation of relevant laws or regulation applicable to the bank.
A highly-skilled and experienced legal function ensures that all exposures are mitigated through ongoing review of legally binding agreements. This is supported by the Bank’s compliance function.
Ensuring all policies, procedures and guidelines are robust and relevant given changing regulatory requirements and, stakeholder consideration.
There were no material losses suffered by the bank due to legal risk.
Reputation Risk
Reputational risks arise from the loss of confidence and negative perception of the Bank which can adversely impact earnings, assets, capital position and/or brand value. During the year, reputation risk was mitigated through,
Leading role in supporting macro-economic stability and the country’s economic revival through lending to critical sectors of the economy and rehabilitating customers.
BoC is consistently ranked as one of Sri Lanka’s leading brands and the No.1 brand in the banking sector.
Supported uninterrupted access to essentials through facilitating the import of fuel, medicine and vaccinations.
Increase in Brand Value during the year.
Strategic Risk
Potential losses arising from the possible flaws in the Bank’s future business plans and the possibilities of strategies being inadequate.
The Bank’s strategic risks are mitigated through,
Strategic direction of the bank given by its vision and mission is articulated to a corporate plan with specific measurable time bound targets
Robust mechanism for formulating strategy including inputs by the Corporate and Executive Management team, assessment of the operating landscape, consideration of stakeholder needs and finally deliberations by the Board of Directors
Continued monitoring of performance against defined targets
Use of comprehensive scorecards to measure strategic risk exposures
RISK MANAGEMENT
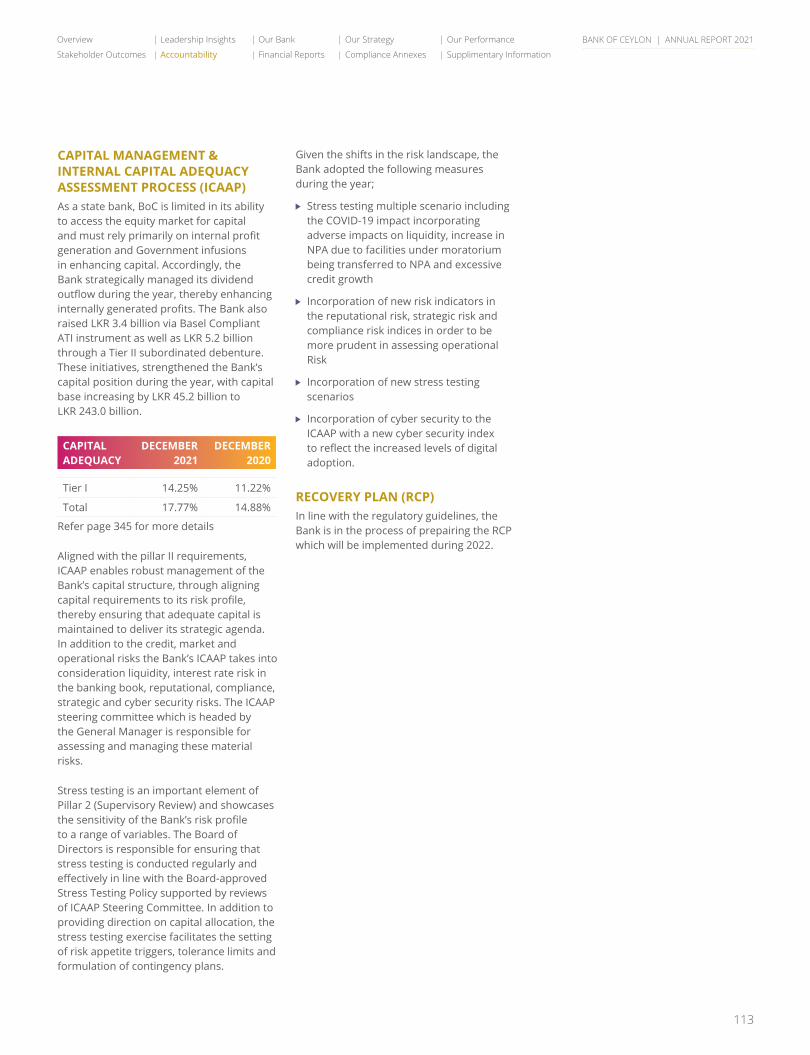
BANK OF CEYLON | ANNUAL REPORT 2021
113
CAPITAL MANAGEMENT & INTERNAL CAPITAL ADEQUACY ASSESSMENT PROCESS (ICAAP)As a state bank, BoC is limited in its ability to access the equity market for capital and must rely primarily on internal profit generation and Government infusions in enhancing capital. Accordingly, the Bank strategically managed its dividend outflow during the year, thereby enhancing internally generated profits. The Bank also raised LKR 3.4 billion via Basel Compliant ATI instrument as well as LKR 5.2 billion through a Tier II subordinated debenture. These initiatives, strengthened the Bank’s capital position during the year, with capital base increasing by LKR 45.2 billion to LKR 243.0 billion.
CAPITAL ADEQUACY
DECEMBER 2021
DECEMBER 2020
Tier I 14.25% 11.22%
Total 17.77% 14.88%
Refer page 345 for more details
Aligned with the pillar II requirements, ICAAP enables robust management of the Bank’s capital structure, through aligning capital requirements to its risk profile, thereby ensuring that adequate capital is maintained to deliver its strategic agenda. In addition to the credit, market and operational risks the Bank’s ICAAP takes into consideration liquidity, interest rate risk in the banking book, reputational, compliance, strategic and cyber security risks. The ICAAP steering committee which is headed by the General Manager is responsible for assessing and managing these material risks.
Stress testing is an important element of Pillar 2 (Supervisory Review) and showcases the sensitivity of the Bank’s risk profile to a range of variables. The Board of Directors is responsible for ensuring that stress testing is conducted regularly and effectively in line with the Board-approved Stress Testing Policy supported by reviews of ICAAP Steering Committee. In addition to providing direction on capital allocation, the stress testing exercise facilitates the setting of risk appetite triggers, tolerance limits and formulation of contingency plans.
Given the shifts in the risk landscape, the Bank adopted the following measures during the year;
Stress testing multiple scenario including the COVID-19 impact incorporating adverse impacts on liquidity, increase in NPA due to facilities under moratorium being transferred to NPA and excessive credit growth
Incorporation of new risk indicators in the reputational risk, strategic risk and compliance risk indices in order to be more prudent in assessing operational Risk
Incorporation of new stress testing scenarios
Incorporation of cyber security to the ICAAP with a new cyber security index to reflect the increased levels of digital adoption.
RECOVERY PLAN (RCP)In line with the regulatory guidelines, the Bank is in the process of prepairing the RCP which will be implemented during 2022.
Overview Leadership Insights Our Bank Our Strategy Our Performance
Stakeholder Outcomes Accountability Financial Reports Compliance Annexes Supplimentary Information
FINANCIAL REPORTSAnnual Report of the Directors on the State of Affairs of Bank of Ceylon ........................... 115
Directors’ Interest in Contracts .................................................................................................. 120
Directors’ Statement on Internal Control Over Financial Reporting ...................................... 122
Independent Assurance Report ................................................................................................. 124
Directors’ Responsibility for Financial Reporting ..................................................................... 125
Report of the Auditor General .................................................................................................... 126
Statement of Profit or Loss ......................................................................................................... 130
Statement of Comprehensive Income ...................................................................................... 131
Statement of Financial Position ................................................................................................. 132
Statement of Changes In Equity ................................................................................................. 134
Statement of Cash Flows ............................................................................................................ 138
Notes to the Financial Statements ............................................................................................. 140
115
Overview Leadership Insights Our Bank Our Strategy Our Performance
Stakeholder Outcomes Accountability Financial Reports Compliance Annexes Supplimentary Information
BANK OF CEYLON | ANNUAL REPORT 2021
ANNUAL REPORT OF THE DIRECTORS ON THE STATE OF AFFAIRS OF BANK OF CEYLON
1. General
The Board of Directors of Bank of Ceylon takes pleasure in presenting their report on the affairs of the Bank together with the Audited Consolidated Financial Statements for the year ended 31 December 2021 of the Bank and the Group and the Auditor General’s Report on those Financial Statements, conforming to the requirements of the Bank of Ceylon Ordinance No. 53 of 1938 and Banking Act No. 30 of 1988 and amendments thereto. The Report also includes certain disclosures laid down by the Colombo Stock Exchange Listing Rules and certain disclosures required to be made under the Banking Act Direction No. 11 of 2007 on Corporate Governance for licensed commercial banks issued by the Central Bank of Sri Lanka and subsequent amendments thereto. The Directors reviewed and approved the Financial Statements on 24 February 2022.
Bank of Ceylon is a licensed commercial bank under the Banking Act No. 30 of 1988 and amendments thereto and was duly incorporated on 1 August 1939 under Bank of Ceylon Ordinance No. 53 of 1938. The Bank is wholly owned by the Government of Sri Lanka. The unsecured subordinated redeemable debentures issued by the Bank are listed on the Colombo Stock Exchange.
2. Review of the Business
2.1 Principal Activities of the Bank
The principal activities of the Bank during the year were personal banking, corporate banking, development banking, off-shore banking, trade financing, lease financing, primary dealing, investment banking and treasury operations, correspondence banking and money remittances, islamic banking, bancassurance, pawning, credit card facilities, foreign currency operations and other financial services.
2.2 Subsidiaries and Associates
The principal activities of subsidiaries and associates are given under Notes to the Financial Statements on page 140. There were no significant changes in the nature of the principal activities of the Bank and the Group during the year under review,
other than changes mentioned under Accounting policies.
2.3 Changes to the Group Structure
During the year, the structure of the Group has been changed as in the first quarter 2021 Property Development PLC has disposed its fully owned subsidiary of Koladeniya Hydropower (Private) Limited.
Further, Merchant Bank of Sri Lanka & Finance PLC has issued LKR 2.2 billion worth of new ordinary shares under a right issue. The Bank and its fully owned subsidiary BOC Property Development & Management (Private) Limited invested in this share issue and the Bank’s shareholding increased to 84.5%.
Notes to the Financial Statements No. 31 and 32 on pages from 207 to 214 of this Annual Report give details about the Group.
2.4 Vision, Mission and Corporate Conduct
The Bank’s Vision and Mission are given in the second inner back cover of this Annual Report. The Bank maintains high ethical standards in its activities whilst pursuing the objectives stated under ‘Vision’, ‘Mission’ and ‘Value Statements’.
2.5 Review of the Year’s Performance
The Chairman’s Message on pages 10 to 13 deals with the year’s performance of the Bank / Group and on the Sri Lankan economy. The General Manager’s Review on pages 14 to 17 provides a detailed description of the operations of the Bank during the year under review. The section titled “Chief Financial Officer’s Review” on pages 52 to 55 provides a detailed analysis of business operations of the Bank. These reports that provide a fair review of the Bank’s affairs form an integral part of the Annual Report.
2.6 Branch Expansion
Even though the COVID-19 pandemic situation prevailed across the country, the Bank expanded its network by 104 CRMs during the year across the island, bringing out the total direct customer contact points to 2,071.
This number does not include peer banks’ ATMs through which customers of Bank of Ceylon can transact and School “Sansada” and Mobile saving units.
2.7 Corporate Donations
The Bank has donated LKR 79.5 million on Corporate Social Responsibility (CSR) activities carried out during the year 2021 (2020 – LKR 75.0 million).
2.8 Directors’ Responsibility for Financial Reporting
The Directors are responsible for the preparation of Financial Statements that will reflect a true and fair view of the state of affairs. The Directors are of the view that these Financial Statements have been prepared in conformity with the requirements of the Sri Lanka Accounting Standards, Banking Act No. 30 of 1988 and its amendments, Bank of Ceylon Ordinance No. 53 of 1938 and its amendments and the Listing Rules of the Colombo Stock Exchange. In the case of subsidiaries, the Financial Statements are prepared also in accordance with the provisions of the Companies Act No. 07 of 2007. The Statement of “Directors’ Responsibility for Financial Reporting” is given on page 125 of this Annual Report and forms an integral part of this Report of the Directors.
2.9 Autditor’s Report
The Auditor General is the Auditor of Bank of Ceylon in terms of the provisions of Article 154 of the Constitution of the Democratic Socialist Republic of Sri Lanka.
Report of the Auditor General on the Financial Statements of the Bank and the Consolidated Financial Statements of the Bank and its subsidiaries as at 31 December 2021 is given on pages 126 to 129 of this Annual Report.
2.10 Accounting Policies
The Group and the Bank prepared their Financial Statements in accordance with Sri Lanka Accounting Standards (LKASs) and Sri Lanka Financial Reporting Standards (SLFRSs).
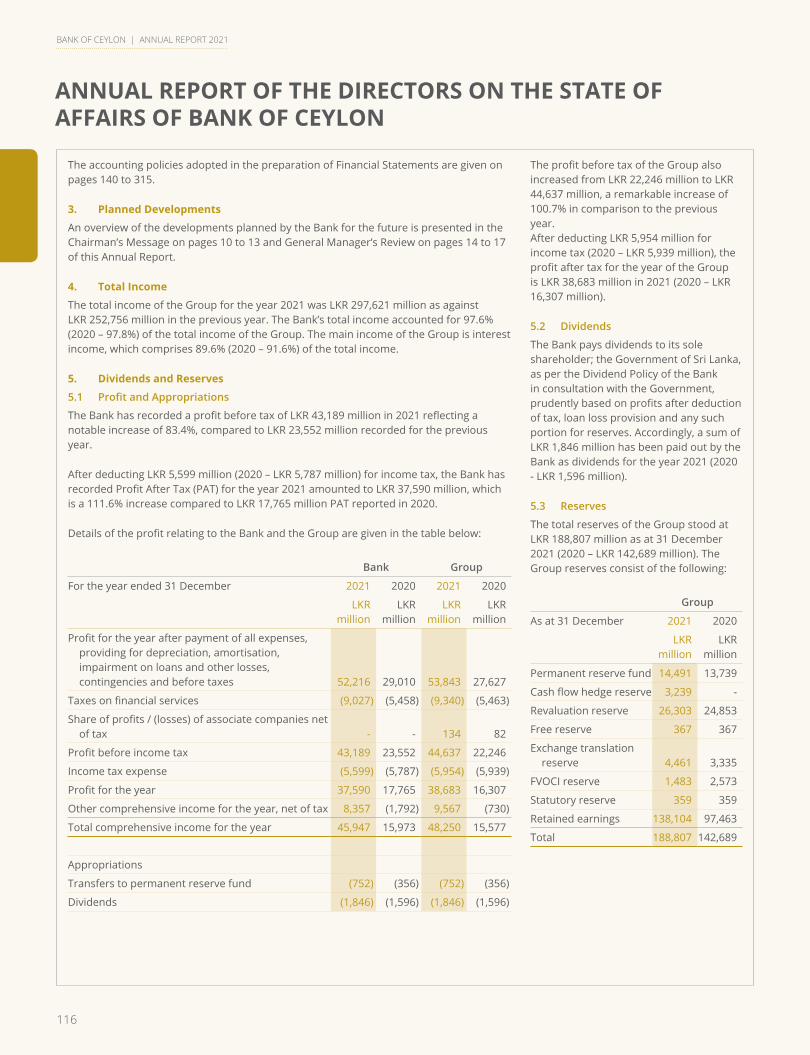
116
BANK OF CEYLON | ANNUAL REPORT 2021
ANNUAL REPORT OF THE DIRECTORS ON THE STATE OF AFFAIRS OF BANK OF CEYLON
The accounting policies adopted in the preparation of Financial Statements are given on pages 140 to 315.
3. Planned Developments
An overview of the developments planned by the Bank for the future is presented in the Chairman’s Message on pages 10 to 13 and General Manager’s Review on pages 14 to 17 of this Annual Report.
4. Total Income
The total income of the Group for the year 2021 was LKR 297,621 million as against LKR 252,756 million in the previous year. The Bank’s total income accounted for 97.6% (2020 – 97.8%) of the total income of the Group. The main income of the Group is interest income, which comprises 89.6% (2020 – 91.6%) of the total income.
5. Dividends and Reserves
5.1 ProfitandAppropriations
The Bank has recorded a profit before tax of LKR 43,189 million in 2021 reflecting a notable increase of 83.4%, compared to LKR 23,552 million recorded for the previous year.
After deducting LKR 5,599 million (2020 – LKR 5,787 million) for income tax, the Bank has recorded Profit After Tax (PAT) for the year 2021 amounted to LKR 37,590 million, which is a 111.6% increase compared to LKR 17,765 million PAT reported in 2020.
Details of the profit relating to the Bank and the Group are given in the table below:
Bank Group
For the year ended 31 December 2021 2020 2021 2020
LKR million
LKR million
LKR million
LKR million
Profit for the year after payment of all expenses, providing for depreciation, amortisation, impairment on loans and other losses, contingencies and before taxes 52,216 29,010 53,843 27,627
Taxes on financial services (9,027) (5,458) (9,340) (5,463)
Share of profits / (losses) of associate companies net of tax - - 134 82
Profit before income tax 43,189 23,552 44,637 22,246
Income tax expense (5,599) (5,787) (5,954) (5,939)
Profit for the year 37,590 17,765 38,683 16,307
Other comprehensive income for the year, net of tax 8,357 (1,792) 9,567 (730)
Total comprehensive income for the year 45,947 15,973 48,250 15,577
Appropriations
Transfers to permanent reserve fund (752) (356) (752) (356)
Dividends (1,846) (1,596) (1,846) (1,596)
The profit before tax of the Group also increased from LKR 22,246 million to LKR 44,637 million, a remarkable increase of 100.7% in comparison to the previous year. After deducting LKR 5,954 million for income tax (2020 – LKR 5,939 million), the profit after tax for the year of the Group is LKR 38,683 million in 2021 (2020 – LKR 16,307 million).
5.2 Dividends
The Bank pays dividends to its sole shareholder; the Government of Sri Lanka, as per the Dividend Policy of the Bank in consultation with the Government, prudently based on profits after deduction of tax, loan loss provision and any such portion for reserves. Accordingly, a sum of LKR 1,846 million has been paid out by the Bank as dividends for the year 2021 (2020 - LKR 1,596 million).
5.3 Reserves
The total reserves of the Group stood at LKR 188,807 million as at 31 December 2021 (2020 – LKR 142,689 million). The Group reserves consist of the following:
Group
As at 31 December 2021 2020
LKR million
LKR million
Permanent reserve fund 14,491 13,739
Cash flow hedge reserve 3,239 -
Revaluation reserve 26,303 24,853
Free reserve 367 367
Exchange translation reserve 4,461 3,335
FVOCI reserve 1,483 2,573
Statutory reserve 359 359
Retained earnings 138,104 97,463
Total 188,807 142,689
117
Overview Leadership Insights Our Bank Our Strategy Our Performance
Stakeholder Outcomes Accountability Financial Reports Compliance Annexes Supplimentary Information
BANK OF CEYLON | ANNUAL REPORT 2021
6. Property, Plant and Equipment
The total capital expenditure incurred by the Group on the addition of Property, Plant and Equipment and intangible assets during the year amounted to LKR 2,372 million (2020 – LKR 3,461 million) the details of which are given in Notes 34 and 36 of Financial Statements on pages 217 to 235 and 238 to 239 of this Annual Report.
7. Value of Freehold Properties
The value of freehold properties owned by the Group as at 31 December 2021 is included in Note 34.2 of the Financial Statements at LKR 29,560 million (2020 – LKR 29,252 million).
8. Stated Capital and Shareholding
8.1 Stated Capital
The total issued and fully paid up capital of the Bank as at 31 December 2021 was LKR 25,000 million (2020 – LKR 25,000 million).
8.2 Shareholding
The Government of Sri Lanka is the sole shareholder of the Bank.
9. Issue of Subordinated Debentures / Bond
During the year, the Bank successfully raised LKR 3.4 billion (2020 – LKR 15.0 billion) through the issuance of Basel III compliant, unlisted, rated, unsecured, subordinated, perpetual Additional Tier 1 (AT1) Capital bonds with a non-viability full and permanent write down at an issue price of LKR 100 each.
These AT1 capital bonds are not listed on the Colombo Stock Exchange and are confined to qualified investors. The bonds are irredeemable and may be callable by the Bank at its discretion at any time after five years from the date of issue, subject to approval of the Central Bank of Sri Lanka.
Apart from the above, the Bank has issued unlisted unsecured subordinated redeemable debentures with non –viability write down features, amounting to LKR 5.2 billion during the year ended 31 December 2021 to support Tier 2 capital base.
The details of debentures outstanding as at the date of Statement of Financial Position are given in Note 49 of the Financial Statements on pages 256 to 259.
10. Share Information
The basic earnings per share and net assets value per share of the Group were LKR 1,540 (2020 - LKR 674) and LKR 8,552 (2020 - LKR 6,708) respectively, for the year under review.
11. Corporate Sustainability and Responsibility
The programmes carried out under Corporate Sustainability and Responsibility (CSR) are detailed on page 74 to 77 under the section titled “Country and Community”.
12. Directors
Details of Directors who held the office during the year 2021 and holding the office as of the sign-off date of this Annual report is given in the table below. The Directors of the Bank do not hold any executive positions in the Bank. They bring wide range of skills and experience to the Bank. The qualifications and experience of the Directors are given on pages 19 to 21 of this Annual report. As of the Annual Report sign- off date, the number of Directors holding office is five (5).
During the year 2021, the Board consisted of the following members;
12.1 List of Directors
Mr Kanchana RatwatteIndependent Non-Executive Director / Chairman(Appointed w.e.f. 02 January 2020)
Mr R M Priyantha RathnayakeNon-Executive Ex officio Director(Appointed w.e.f. 28 April 2020)
Mr G Harsha Wijayawardhana Independent Non-Executive Director (Appointed w.e.f. 14 January 2020)
Mr A C Manilka Fernando Independent Non-Executive Director (Appointed w.e.f. 21 April 2020)
Major General (Rtd.) G A Chandrasiri Independent Non-Executive Director (Appointed w.e.f. 08 January 2021)
Mr Jayampathy MolligodaNon-Executive Director(Appointed w.e.f. 18 February 2021 and ceased to be a Director w.e.f. 31 January 2022)
The Directors are classified as Independent Directors on the basis given in Banking Act Direction No. 11 of 2007 on Corporate Governance for licensed commercial banks issued by the Central Bank of Sri Lanka.
Board of Directors as of the sign off date;
Name of the Director Executive / Non-Executive Status
Status of Independence
Mr Kanchana Ratwatte Non-Executive Independent
Mr R M Priyantha Rathnayake Non-Executive Ex officio Non-Independent
Mr G Harsha Wijayawardhana Non-Executive Independent
Mr A C Manilka Fernando Non-Executive Independent
Major General (Rtd.) G A Chandrasiri
Non-Executive Independent
118
BANK OF CEYLON | ANNUAL REPORT 2021
ANNUAL REPORT OF THE DIRECTORS ON THE STATE OF AFFAIRS OF BANK OF CEYLON
12.2 Board Subcommittees
The Board has formed five subcommittees complying with the aforesaid Banking Act Direction No. 11 of 2007 to ensure oversight control over affairs of the Bank. The subcommittee composition is given under Subcommittee Reports on pages 93 to 98 of this Annual Report.
12.3 Directors’ Meetings
Attendance of Directors at Board and subcommittee meetings are given on page 88 of this Annual Report.
12.4 Directors’ Interests in Contracts
Directors’ interests in contracts with the Bank, both direct and indirect are given on pages 120 and 121. These interests have been declared at meetings of the Board of Directors. Except for the contracts given therein, the Directors do not have any direct or indirect interest in other contracts or proposed contracts with the Bank.
12.5 Directors’ Interests in Debentures Issued by the Bank / Group
There were no debentures registered in the name of any Director.
12.6 Directors’ Allowances/ Fees
The allowances/ fees payable to the Board of Directors are made in terms of the provisions/ contents in the Public Enterprises Circular No. PED 3/2015 dated 17 June 2015 and PED 01/2020 dated 27 January 2020 issued by the Department of Public Enterprises of the Ministry of Finance and Bank of Ceylon Ordinance No. 53 of 1938 and its amendments. The Directors’ remuneration in respect of the Bank and the Group for the financial year ended 31 December 2021 are given in Note 17 on page 165.
13. Risk Management and System of Internal Controls
13.1 Risk Management
The Board of Directors assumes overall responsibility for managing risks. The specific measures which were taken by the Bank in mitigating the risks are detailed on pages 99 to 113 of this Annual Report.
13.2 Internal Control
The Board of Directors has ensured the implementation of an effective and comprehensive system of internal controls in the Bank through the Audit Committee.
The Audit Committee helps the Board of Directors to discharge their fiduciary responsibilities. The Report of the Chairman of the Audit Committee is contained on page 93 of this Annual Report. The Directors are satisfied with the effectiveness of the system of internal controls during the year under review and up to the date of the Annual Report and the Financial Statements.
The Board has issued a statement on the internal control mechanism of the Bank as per Direction No. 3 (8) (ii) (b) of Banking Act Direction No. 11 of 2007 on Corporate Governance for licensed commercial banks. The above report is given on pages 122 and 123 of this Annual Report. The Board has confirmed that the financial reporting system has been designed to provide reasonable assurance regarding the reliability of financial reporting and that the preparation of Financial Statements for external reporting purposes has been done in accordance with relevant accounting principles and regulatory requirements.
The Board has obtained an Assurance Report from the Auditor General on Directors’ Statement on Internal Control and it is given on page 124 of this Annual Report.
14. Corporate Governance
The Board of Directors is committed towards maintaining an effective corporate governance structure and process. The financial, operational and compliance functions of the Bank are directed and controlled effectively within corporate governance practices. These procedures and practices that are in conformity with Corporate Governance Directions issued by the Central Bank of Sri Lanka under Banking Act Direction No. 11 of 2007 and the Code of Best Practice
on Corporate Governance issued by the Institute of Chartered Accountants of Sri Lanka, are described in the section titled “Corporate Governance” appearing on pages 82 to 92 of this Annual Report.
The Board has obtained a report from the Auditor General on the compliance with the provisions of the above mentioned Direction No. 11 of 2007.
15. Human Resources
One of the most valuable assets of the Bank is its employees and it is important for the Bank to develop them. Several measures were taken to strengthen the much valued human capital in order to optimize their contribution towards the achievement of corporate objectives. The Bank’s human resource management policies and practices are detailed in the section titled “Our Employees” on pages 68 to 72 of this Report.
16. Compliance with Laws and Regulations
The Directors, to the best of their knowledge and belief confirm that the Group has not engaged in any activities contravening the laws and regulations.
Details of the Bank’s compliance with laws and regulations are given on pages 317 to 356 under the section titled “Compliance Annexes” which forms an integral part of this Report.
17. Outstanding Litigation
In the opinion of the Directors and as confirmed by the Bank’s lawyers, the litigation currently pending against the Bank will not have a material impact on the reported financial results or future operations of the Bank.
18. Statutory Payments
The Board confirms that all statutory payments due to the Government and in relation to employees have been made on time.

119
Overview Leadership Insights Our Bank Our Strategy Our Performance
Stakeholder Outcomes Accountability Financial Reports Compliance Annexes Supplimentary Information
BANK OF CEYLON | ANNUAL REPORT 2021
19. Environmental Protection
The Bank has not engaged in any activity, which has caused detriment to the environment. Further, precautions taken to protect the environment are given in the section titled “Country and Community” on page 74 to 77.
20. Post-Balance Sheet Events
The Directors are of the view that no material events have arisen in the interval between the end of the financial year and the date of this Report that would require adjustments or disclosures.
21. Going Concern
The Directors are confident that the resources of the Bank are adequate to continue its operations. Therefore, it has applied the going concern basis in preparing the Financial Statements.
By order of the Board,
Janaki Senanayake SiriwardaneSecretaryBank of Ceylon / Secretary to the Board
24 March 2022Colombo
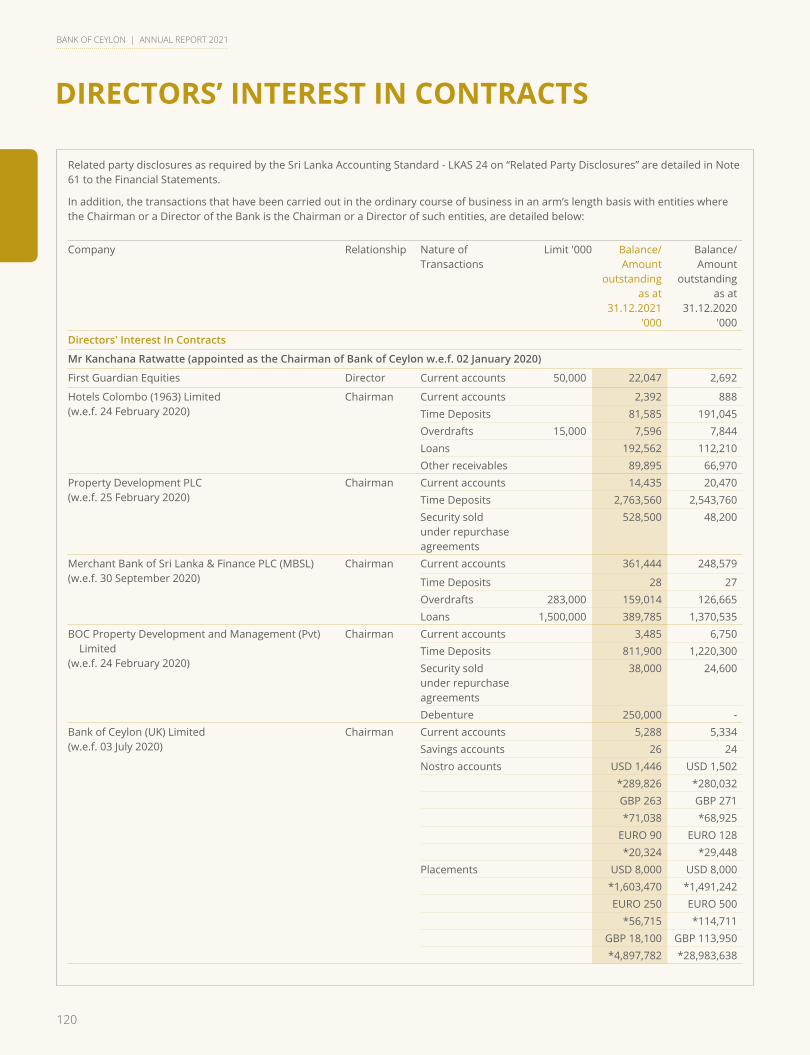
120
BANK OF CEYLON | ANNUAL REPORT 2021
DIRECTORS’ INTEREST IN CONTRACTS
Related party disclosures as required by the Sri Lanka Accounting Standard - LKAS 24 on “Related Party Disclosures” are detailed in Note 61 to the Financial Statements.
In addition, the transactions that have been carried out in the ordinary course of business in an arm’s length basis with entities where the Chairman or a Director of the Bank is the Chairman or a Director of such entities, are detailed below:
Company Relationship Nature ofTransactions
Limit '000 Balance/ Amount
outstanding as at
31.12.2021 '000
Balance/ Amount
outstanding as at
31.12.2020 '000
Directors' Interest In Contracts
Mr Kanchana Ratwatte (appointed as the Chairman of Bank of Ceylon w.e.f. 02 January 2020)
First Guardian Equities Director Current accounts 50,000 22,047 2,692
Hotels Colombo (1963) Limited (w.e.f. 24 February 2020)
Chairman Current accounts 2,392 888 Time Deposits 81,585 191,045 Overdrafts 15,000 7,596 7,844 Loans 192,562 112,210 Other receivables 89,895 66,970
Property Development PLC(w.e.f. 25 February 2020)
Chairman Current accounts 14,435 20,470 Time Deposits 2,763,560 2,543,760 Security sold under repurchase agreements
528,500 48,200
Merchant Bank of Sri Lanka & Finance PLC (MBSL)(w.e.f. 30 September 2020)
Chairman Current accounts 361,444 248,579
Time Deposits 28 27 Overdrafts 283,000 159,014 126,665 Loans 1,500,000 389,785 1,370,535
BOC Property Development and Management (Pvt) Limited
(w.e.f. 24 February 2020)
Chairman Current accounts 3,485 6,750 Time Deposits 811,900 1,220,300 Security sold under repurchase agreements
38,000 24,600
Debenture 250,000 -Bank of Ceylon (UK) Limited (w.e.f. 03 July 2020)
Chairman Current accounts 5,288 5,334 Savings accounts 26 24 Nostro accounts USD 1,446 USD 1,502
*289,826 *280,032 GBP 263 GBP 271 *71,038 *68,925
EURO 90 EURO 128 *20,324 *29,448
Placements USD 8,000 USD 8,000 *1,603,470 *1,491,242 EURO 250 EURO 500
*56,715 *114,711 GBP 18,100 GBP 113,950 *4,897,782 *28,983,638
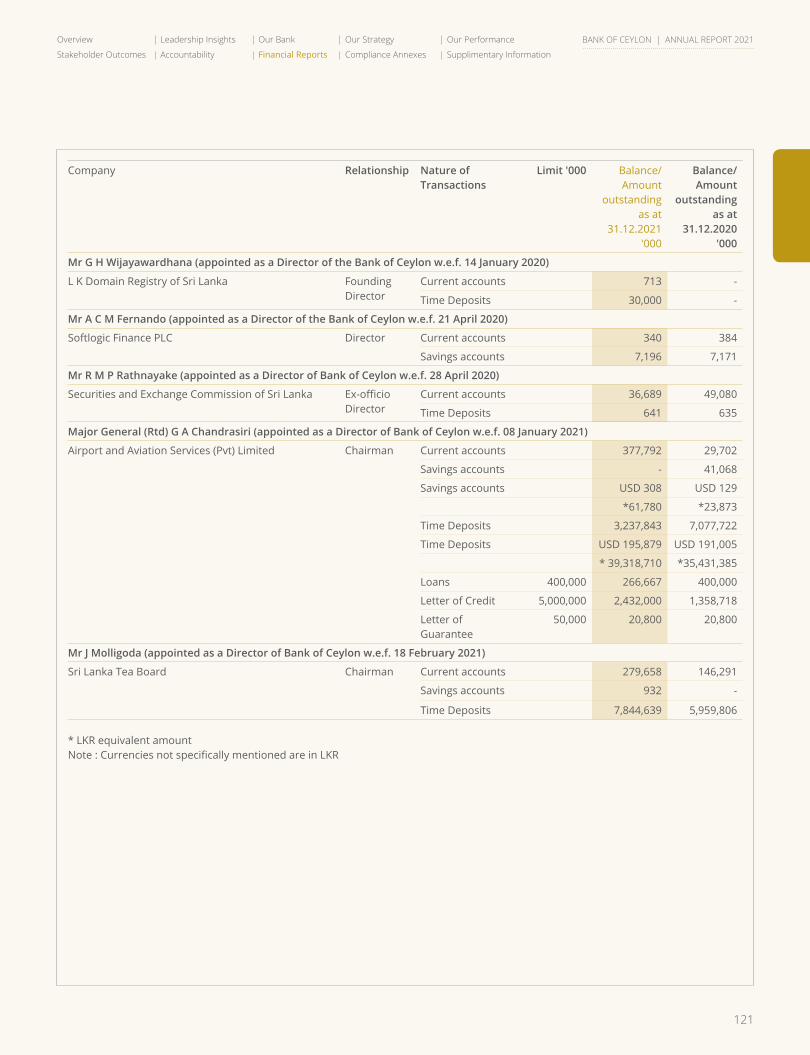
121
Overview Leadership Insights Our Bank Our Strategy Our Performance
Stakeholder Outcomes Accountability Financial Reports Compliance Annexes Supplimentary Information
BANK OF CEYLON | ANNUAL REPORT 2021
Company Relationship Nature ofTransactions
Limit '000 Balance/ Amount
outstanding as at
31.12.2021 '000
Balance/ Amount
outstanding as at
31.12.2020 '000
Mr G H Wijayawardhana (appointed as a Director of the Bank of Ceylon w.e.f. 14 January 2020)
L K Domain Registry of Sri Lanka Founding Director
Current accounts 713 -
Time Deposits 30,000 -
Mr A C M Fernando (appointed as a Director of the Bank of Ceylon w.e.f. 21 April 2020)
Softlogic Finance PLC Director Current accounts 340 384
Savings accounts 7,196 7,171
Mr R M P Rathnayake (appointed as a Director of Bank of Ceylon w.e.f. 28 April 2020)
Securities and Exchange Commission of Sri Lanka Ex-officio Director
Current accounts 36,689 49,080
Time Deposits 641 635
Major General (Rtd) G A Chandrasiri (appointed as a Director of Bank of Ceylon w.e.f. 08 January 2021)
Airport and Aviation Services (Pvt) Limited Chairman Current accounts 377,792 29,702
Savings accounts - 41,068
Savings accounts USD 308 USD 129
*61,780 *23,873
Time Deposits 3,237,843 7,077,722
Time Deposits USD 195,879 USD 191,005
* 39,318,710 *35,431,385
Loans 400,000 266,667 400,000
Letter of Credit 5,000,000 2,432,000 1,358,718
Letter of Guarantee
50,000 20,800 20,800
Mr J Molligoda (appointed as a Director of Bank of Ceylon w.e.f. 18 February 2021)
Sri Lanka Tea Board Chairman Current accounts 279,658 146,291
Savings accounts 932 -
Time Deposits 7,844,639 5,959,806
* LKR equivalent amountNote : Currencies not specifically mentioned are in LKR
122
BANK OF CEYLON | ANNUAL REPORT 2021
DIRECTORS’ STATEMENT ON INTERNAL CONTROL OVER FINANCIAL REPORTING
Responsibility
In line with the Banking Act Direction No. 11 of 2007, section 3(8) (ii) (b), the Board of Directors presents this report on Internal Control over Financial Reporting.
The Board of Directors (“Board”) is responsible for the adequacy and effectiveness of the internal control mechanism in place at Bank of Ceylon, (“the Bank”). In considering such adequacy and effectiveness, the Board recognises that the business of banking requires reward to be balanced with risk on a managed basis and as such the internal control systems are primarily designed with a view to highlighting any deviations from the limits and indicators which comprise the risk appetite of the Bank. In this light, the system of internal controls can only provide reasonable, but not absolute assurance, against material misstatement of financial information and records or against financial losses or fraud.
The Board has established an ongoing process for identifying, evaluating and managing the significant risks faced by the Bank and this process includes enhancing the system of internal control over financial reporting as and when there are changes to business environment or regulatory guidelines. The process is regularly reviewed by the Board and is in accordance with the guidance for Directors of banks on the directors’ statement on internal control issued by the Institute of Chartered Accountants of Sri Lanka. The Board has assessed the internal control over financial reporting taking into account principles for the assessment of internal control system as given in that guidance.
The Board is of the view that the system of internal controls over financial reporting in place is sound and adequate to provide reasonable assurance regarding the reliability of financial reporting, and that the preparation of Financial Statements for external purposes is in accordance with relevant accounting principles and regulatory requirements.
The management assists the Board in the implementation of the Board’s policies and procedures on risk and control by identifying and assessing the risks faced, and in the design, operation and monitoring of suitable internal controls to mitigate and control these risks.
Key features of the process adopted in reviewing the design and effectiveness of the internal control system over financial reporting
The key processes that have been established in reviewing the adequacy and integrity of the system of internal controls with respect to financial reporting include the following:
• Various committees are established by the Board to assist the Board in ensuring the effectiveness of Bank’s daily operations and that the Bank’s operations are in accordance with the corporate objectives, strategies and the annual budget as well as the policies and business directions that have been approved.
• The Internal Audit Division of the Bank checks for compliance with policies and procedures and the effectiveness of the internal control systems on an ongoing basis using samples and rotational procedures and highlights significant findings in respect of any noncompliance. Audits are carried out on all units and branches, the frequency of which is determined by the level of risk assessed, to provide an independent and objective report. The annual audit plan is reviewed and approved by the Board Audit Committee. Findings of the Internal Audit Division are submitted to the Board Audit Committee fòr review at their periodic meetings. Despite the challenges posed by the pandemic, the Internal Audit Division adopted a pragmatic approach and shifted its audit methodology to near real-time and offsite audits in addition to traditional onsite audits. This enabled the Division to ensure continuous compliance with policies / procedures
and assure the effectiveness of the internal control systems of the Bank during this challenging period.
The Board Audit Committee of the Bank reviews internal control issues identified by the Internal Audit Division, the external auditors, regulatory authorities and the management, and evaluates the adequacy and effectiveness of the risk management and internal control systems. They also review the internal audit functions with particular emphasis on the scope of audits and quality of the same. All minutes of the Board Audit Committee meetings are forwarded to the Board. Further details of the activities undertaken by the Audit Committee of the Bank are set out in the Audit Committee Report on page 93.
• In assessing the internal control system over financial reporting, identified officers of the Bank collated all procedures and controls that are connected with significant accounts and disclosures of the Financial Statements of the Bank. These in turn were observed and checked by the Internal Audit Division for suitability of design and effectiveness on an ongoing basis. The assessment did not include subsidiaries of the Bank.
• The Bank adopted the Sri Lanka Accounting Standard — SLFRS 9 - “Financial Instruments” with effèct from 1 January 2018. In order to comply with the requirements of SLFRS 9, the Bank developed expected credit loss (ECL) models using a wide range of forecast economic scenarios to determine impairment provisions with the support of an external international consultant. A firm of Chartered Accountants has been appointed to validate these models and the validation process is underway. The Bank has also taken adequate measures to comply with the Directions No. 13 and 14 issued by the Central Bank of Sri Lanka with regard

123
Overview Leadership Insights Our Bank Our Strategy Our Performance
Stakeholder Outcomes Accountability Financial Reports Compliance Annexes Supplimentary Information
BANK OF CEYLON | ANNUAL REPORT 2021
to classification, recognition and measurement of credit facilities under SLFRS 9 effecting from 01.01.2022.
• The Bank is in the process of implementing an automated financial reporting solution in order to comply with the requirements of recognition, measurement, classification and disclosure of the financial instruments more effectively and efficiently and to facilitate the “Financial Statement Closure” process. The automated solution enables the calculation of impairment provisioning under SLFRS 9 - “Financial Instruments” and facilitates the fulfilling of internal and external reporting requirements.
• The significant impact on economies, businesses, industries, households triggered by COVID 19 pandemic continued in 2021 as well. However, people and businesses took a more sensible approach to adapt to the situation with the Government led vaccination programs and adhered to advanced safety protocols. The Bank modified its business model to align with these trends while meeting applicable regulatory and other compliance requirements and consolidate a sound position operationally and financially.
• The Bank complied with the moratorium packages introduced by the Government and continuously provided relief to those affected by COVID-19 in 2021 as well. The impact of COVID-19 on Bank’s customers in risk elevated industries were also considered when assessing the impairment provisioning using the Expected Credit Loss (ECL) model under SLFRS 9 - “Financial Instruments”. The Bank revised the Economic Factor Adjustment (EFA) used in calculating expected loss by incorporating the current economic condition to the EFA.
• The changes of the external environment such as downgrading of sovereign rating to “CC” from “CCC” and the resulting revision of the Probability of Default (PD) ratio linked to country rating were also considered when making provisions for applicable financial instruments.
• A steering committee composing of various disciplines of the Bank monitors and coordinates the implementation of the automated financial reporting solution with special emphasis on the directions issued by the regulator for classification, recognition and measurement of credit facilities under SLFRS 9.
• The Bank is continuously monitoring and updating procedures inter-alia relating to impairment of loans and advances of the Bank and foreign branches, financial statement disclosures, risk management, related party transactions and all other significant banking activities based on the changing regulatory and market conditions. The requirements under SLFRSs / LKASs and regulatory directions have been communicated to the relevant stakeholders including the Board and senior management through training and awareness sessions.
• The comments made by the external auditors in connection with internal control system over financial reporting in previous years were reviewed during the year and appropriate steps have been taken to rectify them. The recommendations made by the external auditors in 2021 in connection with the internal control system over financial reporting will be addressed in the future.
Confirmation
Based on the above processes, the Board confirms that the financial reporting system of the Bank has been designed to provide a reasonable assurance regarding the reliability of financial reporting and the preparation of financial statements for external purposes and has been done in accordance with Sri Lanka Accounting Standards and regulatory requirements of Central Bank of Sri Lanka.
By order of the Board
Chairman - Audit Committee
Chairman
Director
Colombo, Sri Lanka03 March 2022
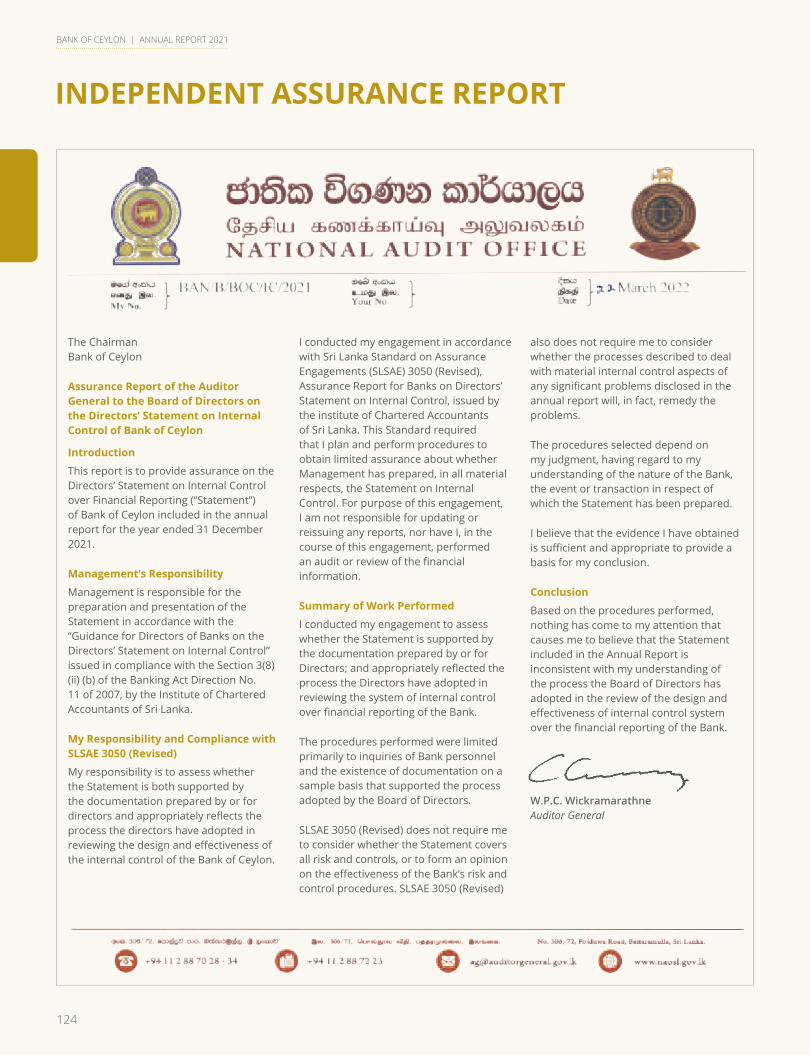
124
BANK OF CEYLON | ANNUAL REPORT 2021
INDEPENDENT ASSURANCE REPORT
The ChairmanBank of Ceylon
Assurance Report of the Auditor General to the Board of Directors on the Directors’ Statement on Internal Control of Bank of Ceylon
Introduction
This report is to provide assurance on the Directors’ Statement on Internal Control over Financial Reporting (“Statement”) of Bank of Ceylon included in the annual report for the year ended 31 December 2021.
Management’s Responsibility
Management is responsible for the preparation and presentation of the Statement in accordance with the “Guidance for Directors of Banks on the Directors’ Statement on Internal Control” issued in compliance with the Section 3(8) (ii) (b) of the Banking Act Direction No. 11 of 2007, by the Institute of Chartered Accountants of Sri Lanka.
My Responsibility and Compliance with SLSAE 3050 (Revised)
My responsibility is to assess whether the Statement is both supported by the documentation prepared by or for directors and appropriately reflects the process the directors have adopted in reviewing the design and effectiveness of the internal control of the Bank of Ceylon.
I conducted my engagement in accordance with Sri Lanka Standard on Assurance Engagements (SLSAE) 3050 (Revised), Assurance Report for Banks on Directors’ Statement on Internal Control, issued by the institute of Chartered Accountants of Sri Lanka. This Standard required that I plan and perform procedures to obtain limited assurance about whether Management has prepared, in all material respects, the Statement on Internal Control. For purpose of this engagement, I am not responsible for updating or reissuing any reports, nor have I, in the course of this engagement, performed an audit or review of the financial information.
Summary of Work Performed
I conducted my engagement to assess whether the Statement is supported by the documentation prepared by or for Directors; and appropriately reflected the process the Directors have adopted in reviewing the system of internal control over financial reporting of the Bank.
The procedures performed were limited primarily to inquiries of Bank personnel and the existence of documentation on a sample basis that supported the process adopted by the Board of Directors.
SLSAE 3050 (Revised) does not require me to consider whether the Statement covers all risk and controls, or to form an opinion on the effectiveness of the Bank’s risk and control procedures. SLSAE 3050 (Revised)
also does not require me to consider whether the processes described to deal with material internal control aspects of any significant problems disclosed in the annual report will, in fact, remedy the problems.
The procedures selected depend on my judgment, having regard to my understanding of the nature of the Bank, the event or transaction in respect of which the Statement has been prepared.
I believe that the evidence I have obtained is sufficient and appropriate to provide a basis for my conclusion.
Conclusion
Based on the procedures performed, nothing has come to my attention that causes me to believe that the Statement included in the Annual Report is inconsistent with my understanding of the process the Board of Directors has adopted in the review of the design and effectiveness of internal control system over the financial reporting of the Bank.
W.P.C. WickramarathneAuditor General
125
Overview Leadership Insights Our Bank Our Strategy Our Performance
Stakeholder Outcomes Accountability Financial Reports Compliance Annexes Supplimentary Information
BANK OF CEYLON | ANNUAL REPORT 2021
DIRECTORS’ RESPONSIBILITY FOR FINANCIAL REPORTING
This Statement by the Board of Directors is made especially to distinguish the respective responsibilities of the Directors and Auditors in relation to financial reporting. The responsibility of Directors in relation to financial reporting of the Bank of Ceylon and the Group is set out in the following statement.
Financial Statements
In terms of the provisions of Bank of Ceylon Ordinance No. 53 of 1938 and its amendments read with the Banking Act No. 30 of 1988 and its amendments and Directions, the Directors of the Bank are responsible for ensuring that the Bank maintains proper books of accounts, which disclose with reasonable accuracy at any time, the financial position of the Bank and prepares proper Financial Statements for each financial year, giving a true and fair view of the state of affairs of the Bank.
The Directors affirm that in preparing the Financial Statements for the year 2021 presented in this Annual Report, the most appropriate accounting policies have been used and applied consistently supported by judgments and estimates that are reasonable and prudent. Material departures, if any, have been disclosed and explained.
The Financial Statements for the year 2021 presented in this Annual Report, are in conformity with the requirements of the Bank of Ceylon Ordinance No. 53 of 1938 and its amendments, Banking Act No. 30 of 1988 and its amendments and Directions issued under it, the Sri Lanka Accounting Standards and other regulatory requirements. These Financial Statements reflect a true and fair view of the state of affairs of the Bank of Ceylon and the Group as at 31 December 2021.
Going Concern
The Directors are of the view that the Bank and the Group have adequate resources to continue in business in the foreseeable future. Accordingly, they have continued to adopt the going concern basis in preparing the Financial Statements.
Internal Controls, Risk Management and Compliance
The Directors are also responsible for the system of internal financial controls and risk management and place considerable importance on maintaining a strong control environment to protect and safeguard the Bank’s assets and prevent fraud and mismanagement.
Whilst inherent and residual risks cannot be completely eliminated, the Bank endeavors to minimise them by ensuring that appropriate infrastructure, controls, systems and ethical behavior are applied and practiced within predetermined procedures and limits/ boundaries.
A report by the Directors on the Bank’s internal control mechanism, confirming that the financial reporting system has been designed to provide reasonable assurance regarding the reliability of financial reporting, is given on page 122 and 123 of this Annual Report.
The Directors and Management have put in place, risk management policies and guidelines. Management committees have been established to monitor and manage material risks. Arrangements are in place to ensure that monthly reports on risk are submitted to the Integrated Risk Management Committee for review and discussion. Compliance with applicable laws, regulations, rules, directives and guidelines are monitored by the Independent Integrated Risk Management Division and reported to the Board.
The Audit Committee and Integrated Risk Management Committee, on an ongoing basis, have acted to strengthen the effectiveness of internal controls and risk management procedures. The reports of the Audit Committee and Integrated Risk Management Committee are included on pages 93 to 95 of this Annual Report.
Audit Report
Pursuant to provisions of Article 154 of the Constitution of the Democratic Socialist Republic of Sri Lanka, the Auditor General is the Auditor of the Bank and issues the final opinion on the Financial Statements of the Bank. The responsibilities of the Auditor in relation to the Financial Statements are set out in the Report of the Auditor General on pages 126 to 129 of this Annual Report. The Auditor General’s certification on the effectiveness of the Bank’s internal control mechanism is given on page 124 of this Annual Report.
Compliance
The Directors to the best of their knowledge and belief, are satisfied that all statutory payments, in relation to all relevant regulatory and statutory authorities, which were due and payable by the Bank and its subsidiaries as at the Statement of Financial Position date, have been paid or where relevant provided for.
The Directors are of the view that they have discharged their responsibilities as set out in this statement.
By order of the Board,
Janaki Senanayake SiriwardaneSecretaryBank of Ceylon / Secretary to the Board
24 March 2022Colombo
126
BANK OF CEYLON | ANNUAL REPORT 2021
REPORT OF THE AUDITOR GENERAL
ChairmanBank of Ceylon
Report of the Auditor General on the Financial Statements and Other Legal and Regulatory Requirements of the Bank of Ceylon and its subsidiaries for the year ended 31 December 2021 in terms of Section 12 of the National Audit Act, No. 19 of 2018.
1. Financial Statements
1.1 Opinion
The audit of the Financial Statements of the Bank of Ceylon (the “Bank”) and the Consolidated Financial Statements of the Bank and its subsidiaries (the “Group”) for the year ended 31 December 2021 comprising the statement of financial position as at 31 December 2021 and the statement of profit or loss, statement of comprehensive income, statement of changes in equity and statement of cash flow for the year then ended, and notes to the Financial Statements, including a
summary of significant accounting policies, was carried out under my direction in pursuance of provisions in Article 154(1) of the Constitution of the Democratic Socialist Republic of Sri Lanka read in conjunction with provisions of the National Audit Act No. 19 of 2018. The Bank has been exempted from the provisions of Part II of the Finance Act, No. 38 of 1971 by an Order of then Minister of Finance published in the Government Gazette No. 715 of 14 May 1992 by virtue of powers vested in him by Sections 5(1) of the said Finance Act. My report to Parliament in pursuance of provisions in Article 154 (6) of the Constitution will be tabled in due course.
In my opinion, the accompanying financial statements give a true and fair view of the financial position of the Bank and the Group as at 31 December 2021, and of their financial performance and their cash flows for the year then ended in accordance with Sri Lanka Accounting Standards.
1.2 Basis for Opinion
I conducted my audit in accordance with Sri Lanka Auditing Standards (SLAuSs). My responsibilities, under those standards are further described in the Auditor’s Responsibilities for the Audit of the Financial Statements section of my report. I believe that the audit evidence I have obtained is sufficient and appropriate to provide a basis for my opinion.
1.3 Key Audit Matters
Key Audit Matters are those matters that, in my professional judgment, are of most significance in my audit of the Financial Statements of the Bank and the Consolidated Financial Statements of the Group of the current period. These matters were addressed in the context of my audit of the Financial Statements of the Bank and the Consolidated Financial Statements of the Group as a whole, and in forming my audit opinion thereon, and I do not provide a separate opinion on these matters.
127
Overview Leadership Insights Our Bank Our Strategy Our Performance
Stakeholder Outcomes Accountability Financial Reports Compliance Annexes Supplimentary Information
BANK OF CEYLON | ANNUAL REPORT 2021
Key audit matter How our audit addressed the key audit matter
Impairmentallowanceonfinancialassetscarried at amortised cost
Impairment allowance on financial assets carried at amortised cost as stated in Notes 28 and 29 respectively determined by management in accordance with the accounting policies described in Notes 4.4.11 and 28.
This was a key audit matter due to:
• Materiality of the reported impairment allowance which involved complex calculations; and
• Degree of management judgement, significance of assumptions and level of estimation uncertainty associated with its measurement.
Key areas of significant judgements, estimates and assumptions used by management in the assessment of the impairment allowance included the following;
• management overlays to incorporate the probable ongoing impacts of COVID-19 and related industry responses such as Government stimulus packages and debt moratorium relief measures granted by the Group;
The use of forward-looking information to reflect current and anticipated future external factors, including judgments related to the ongoing impact of COVID-19, both in the multiple economic scenarios and the probability weighting determined for each of these scenarios.
I assessed the alignment of the Group’s impairment allowance computations and underlying methodology including consideration of COVID 19 impacts and related industry responses with its accounting policies, based on the best available information up to the date of our report. Our audit procedures included amongst others the following:
• I evaluated the design, implementation, and operating effectiveness of controls over estimation of impairment, which included assessing the level of oversight, review and approval of provision for credit impairment policies and procedures by the Board and management.
• I checked the completeness and accuracy of the underlying data used in the impairment computation by agreeing details to relevant source documents and accounting records of the Group. We also checked the underlying calculations.
• In addition to the above, the following procedures were performed:
For loans and advances assessed on an individual basis for impairment:
– I assessed the reasonableness and timeliness of Management’s internal assessments of credit quality based on the borrower’s particular circumstances
– I evaluated the reasonableness of key inputs used in the impairment allowance made with particular focus on the ongoing impact of COVID-19. Such evaluations were carried out considering the value and timing of cash flow forecasts, elevated risk industries, status of recovery action and collateral values.
For financial assets assessed on a collective basis for impairment:
– I tested the key calculations used in the impairment allowance.
– I assessed whether judgements, estimates and assumptions used by the Management in the underlying methodology and the management overlays were reasonable. Our testing included evaluating the reasonableness of forward-looking information used, economic scenarios considered and probability weighting assigned to each of those scenarios.
– I assessed the adequacy of the related financial statements disclosures set out in notes 3.3.8.4, 4.4.11, 14, 28 and 29.

128
BANK OF CEYLON | ANNUAL REPORT 2021
REPORT OF THE AUDITOR GENERAL
Key audit matter How our audit addressed the key audit matter
Information Technology (IT) systems and controlsoverfinancialreporting
A significant part of the Group’s financial reporting process is primarily reliant on multiple IT systems with automated processes and internal controls. Further, key financial statement disclosures are prepared using data and reports generated by IT systems, that are compiled and formulated with the use of spreadsheets.
Accordingly, IT systems and related internal controls over financial reporting was considered a key audit matter.
My audit procedures included the following:
– I obtained an understanding of the internal control environment of the processes relating to financial reporting and related disclosures.
– I identified and test checked relevant controls of key IT systems related to the Group’s financial reporting process.
– I involved specialised resources to evaluate the design and operating effectiveness of IT controls, including those related to user access and change management.
– I checked key source data of the reports used to generate key disclosures for accuracy and completeness, including review of the general ledger reconciliations.
– I also obtained a high level understanding, primarily through inquiry, of the cybersecurity risks affecting the Group and the actions taken to address these risks. Further, I checked changes if any have been made to security monitoring procedures, given the increase use of remote working access including the Group’s monitoring on remote working activities.
required to communicate that matter to those charged with governance for correction. If further material uncorrected misstatements are existed those will be included in my report to Parliament in pursuance of provisions in Article 154 (6) of the Constitution that will be tabled in due course.
1.5 Responsibilities of Management and Those Charged with Governance for the Financial Statements
Management is responsible for the preparation of Financial Statements that give a true and fair view in accordance with Sri Lanka Accounting Standards, and for such internal control as management determine is necessary to enable the preparation of Financial Statements that are free from material misstatement, whether due to fraud or error.
In preparing the Financial Statements, management is responsible for assessing the Group’s ability to continue as a going concern, disclosing, as applicable, matters related to going concern and using the going concern basis of accounting unless management either intends to liquidate
the Group or to cease operations, or has no realistic alternative but to do so.
Those charged with governance are responsible for overseeing the Bank’s and the Group’s financial reporting process.
As per Section 16(1) of the National Audit Act No. 19 of 2018, the Group is required to maintain proper books and records of all its income, expenditure, assets and liabilities, to enable annual and periodic Financial Statements to be prepared of the Group.
1.6 Auditor’s Responsibilities for the Audit of the Financial Statements
My objective is to obtain reasonable assurance about whether the financial statements as a whole are free from material misstatement, whether due to fraud or error, and to issue an auditor’s report that includes my opinion. Reasonable assurance is a high level of assurance, but is not a guarantee that an audit conducted in accordance with Sri Lanka Auditing Standards will always detect a material misstatement when it exists. Misstatements can arise from fraud
1.4 Other information included in the Group’s 2021 Annual Report
The other information comprises the information included in the Group’s 2021 Annual Report, but does not include the financial statements and my auditor’s report thereon, which is expected to be made available to me after the date of this auditor’s report. Management is responsible for the other information.
My opinion on the financial statements does not cover the other information and I do not express any form of assurance conclusion thereon.
In connection with my audit of the financial statements, my responsibility is to read the other information identified above when it becomes available and, in doing so, consider whether the other information is materially inconsistent with the financial statements or my knowledge obtained in the audit or otherwise appears to be materially misstated.
When I read the Bank’s 2021 Annual Report, if I conclude that there are material misstatements therein, I am
129
Overview Leadership Insights Our Bank Our Strategy Our Performance
Stakeholder Outcomes Accountability Financial Reports Compliance Annexes Supplimentary Information
BANK OF CEYLON | ANNUAL REPORT 2021
or error and are considered material if, individually or in the aggregate, they could reasonably be expected to influence the economic decisions of users taken on the basis of these financial statements.
As part of an audit in accordance with Sri Lanka Auditing Standards, I exercise professional judgment and maintain professional scepticism throughout the audit. I also:
• Identify and assess the risks of material misstatement of the financial statements, whether due to fraud or error, design and perform audit procedures responsive to those risks, and obtain audit evidence that is sufficient and appropriate to provide a basis for my opinion. The risk of not detecting a material misstatement resulting from fraud is higher than for one resulting from error, as fraud may involve collusion, forgery, intentional omissions, misrepresentations, or the override of internal control.
• Obtain an understanding of internal control relevant to the audit in order to design audit procedures that are appropriate in the circumstances, but not for the purpose of expressing an opinion on the effectiveness of the Company’s internal control.
• Evaluate the appropriateness of accounting policies used and the reasonableness of accounting estimates and related disclosures made by the management.
• Conclude on the appropriateness of the management’s use of the going concern basis of accounting and based on the audit evidence obtained, whether a material uncertainty exists related to events or conditions that may cast significant doubt on the Group’s ability to continue as a going concern. If I conclude that a material uncertainty
exists, I am required to draw attention in my auditor’s report to the related disclosures in the Financial Statements or, if such disclosures are inadequate, to modify my opinion. My conclusions are based on the audit evidence obtained up to the date of my auditor’s report. However, future events or conditions may cause the Group to cease to continue as a going concern.
• Evaluate the overall presentation, structure and content of the financial statements, including the disclosures, and whether the financial statements represent the underlying transactions and events in a manner that achieves fair presentation.
I communicate with those charged with governance regarding, among other matters, significant audit findings, including any significant deficiencies in internal control that I identify during my audit.
2. Report on Other Legal and Regulatory Requirements
2.1 National Audit Act, No. 19 of 2018 includesspecificprovisionsforfollowingrequirements.
2.1.1 I have obtained all the information and explanation that required for the audit and as far as appears from my examination, proper accounting records have been kept by the Bank as per the requirement of section 12 (a) of the National Audit Act, No. 19 of 2018.
2.1.2 The Financial Statements presented is consistent with the preceding year as per the requirement of section 6 (1) (d) (iii) of the National Audit Act, No. 19 of 2018.
2.1.3 The Financial Statements presented includes all the recommendations made by me in the previous year as per the requirement of section 6 (1) (d) (iv) of the National Audit Act, No. 19 of 2018.
2.2 Based on the procedures performed and evidence obtained were limited to matters that are material, nothing has come to my attention;
2.2.1 to state that any member of the governing body of the Bank has any direct or indirect interest in any contract entered into by the Bank which are out of the normal course of business as per the requirement of section 12 (d) of the National Audit Act, No. 19 of 2018;
2.2.2 to state that the Bank has not complied with any applicable written law, general and special directions issued by the governing body of the Bank as per the requirement of section 12 (f) of the National Audit Act, No. 19 of 2018;
2.2.3 to state that the Bank has not performed according to its powers, functions and duties as per the requirement of section 12 (g) of the National Audit Act, No. 19 of 2018;
2.2.4 to state that the resources of the Bank had not been procured and utilised economically, efficiently and effectively within the time frames and in compliance with the applicable laws as per the requirement of section 12 (h) of the National Audit Act, No. 19 of 2018.
W.P.C. WickramaratneAuditor General
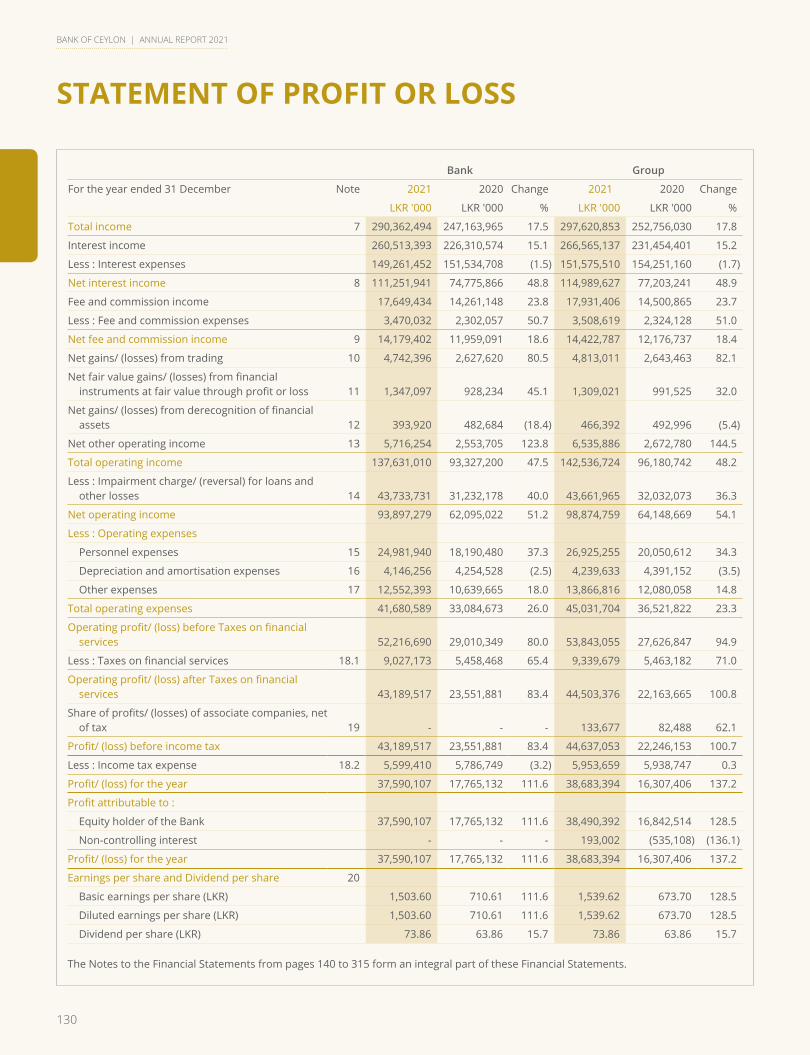
130
BANK OF CEYLON | ANNUAL REPORT 2021
STATEMENT OF PROFIT OR LOSS
Bank Group
For the year ended 31 December Note 2021 2020 Change 2021 2020 Change
LKR '000 LKR '000 % LKR '000 LKR '000 %
Total income 7 290,362,494 247,163,965 17.5 297,620,853 252,756,030 17.8
Interest income 260,513,393 226,310,574 15.1 266,565,137 231,454,401 15.2
Less : Interest expenses 149,261,452 151,534,708 (1.5) 151,575,510 154,251,160 (1.7)
Net interest income 8 111,251,941 74,775,866 48.8 114,989,627 77,203,241 48.9
Fee and commission income 17,649,434 14,261,148 23.8 17,931,406 14,500,865 23.7
Less : Fee and commission expenses 3,470,032 2,302,057 50.7 3,508,619 2,324,128 51.0
Net fee and commission income 9 14,179,402 11,959,091 18.6 14,422,787 12,176,737 18.4
Net gains/ (losses) from trading 10 4,742,396 2,627,620 80.5 4,813,011 2,643,463 82.1
Net fair value gains/ (losses) from financial instruments at fair value through profit or loss 11 1,347,097 928,234 45.1 1,309,021 991,525 32.0
Net gains/ (losses) from derecognition of financial assets 12 393,920 482,684 (18.4) 466,392 492,996 (5.4)
Net other operating income 13 5,716,254 2,553,705 123.8 6,535,886 2,672,780 144.5
Total operating income 137,631,010 93,327,200 47.5 142,536,724 96,180,742 48.2
Less : Impairment charge/ (reversal) for loans and other losses 14 43,733,731 31,232,178 40.0 43,661,965 32,032,073 36.3
Net operating income 93,897,279 62,095,022 51.2 98,874,759 64,148,669 54.1
Less : Operating expenses
Personnel expenses 15 24,981,940 18,190,480 37.3 26,925,255 20,050,612 34.3
Depreciation and amortisation expenses 16 4,146,256 4,254,528 (2.5) 4,239,633 4,391,152 (3.5)
Other expenses 17 12,552,393 10,639,665 18.0 13,866,816 12,080,058 14.8
Total operating expenses 41,680,589 33,084,673 26.0 45,031,704 36,521,822 23.3
Operating profit/ (loss) before Taxes on financial services 52,216,690 29,010,349 80.0 53,843,055 27,626,847 94.9
Less : Taxes on financial services 18.1 9,027,173 5,458,468 65.4 9,339,679 5,463,182 71.0
Operating profit/ (loss) after Taxes on financial services 43,189,517 23,551,881 83.4 44,503,376 22,163,665 100.8
Share of profits/ (losses) of associate companies, net of tax 19 - - - 133,677 82,488 62.1
Profit/ (loss) before income tax 43,189,517 23,551,881 83.4 44,637,053 22,246,153 100.7
Less : Income tax expense 18.2 5,599,410 5,786,749 (3.2) 5,953,659 5,938,747 0.3
Profit/ (loss) for the year 37,590,107 17,765,132 111.6 38,683,394 16,307,406 137.2
Profit attributable to :
Equity holder of the Bank 37,590,107 17,765,132 111.6 38,490,392 16,842,514 128.5
Non-controlling interest - - - 193,002 (535,108) (136.1)
Profit/ (loss) for the year 37,590,107 17,765,132 111.6 38,683,394 16,307,406 137.2
Earnings per share and Dividend per share 20
Basic earnings per share (LKR) 1,503.60 710.61 111.6 1,539.62 673.70 128.5
Diluted earnings per share (LKR) 1,503.60 710.61 111.6 1,539.62 673.70 128.5
Dividend per share (LKR) 73.86 63.86 15.7 73.86 63.86 15.7
The Notes to the Financial Statements from pages 140 to 315 form an integral part of these Financial Statements.
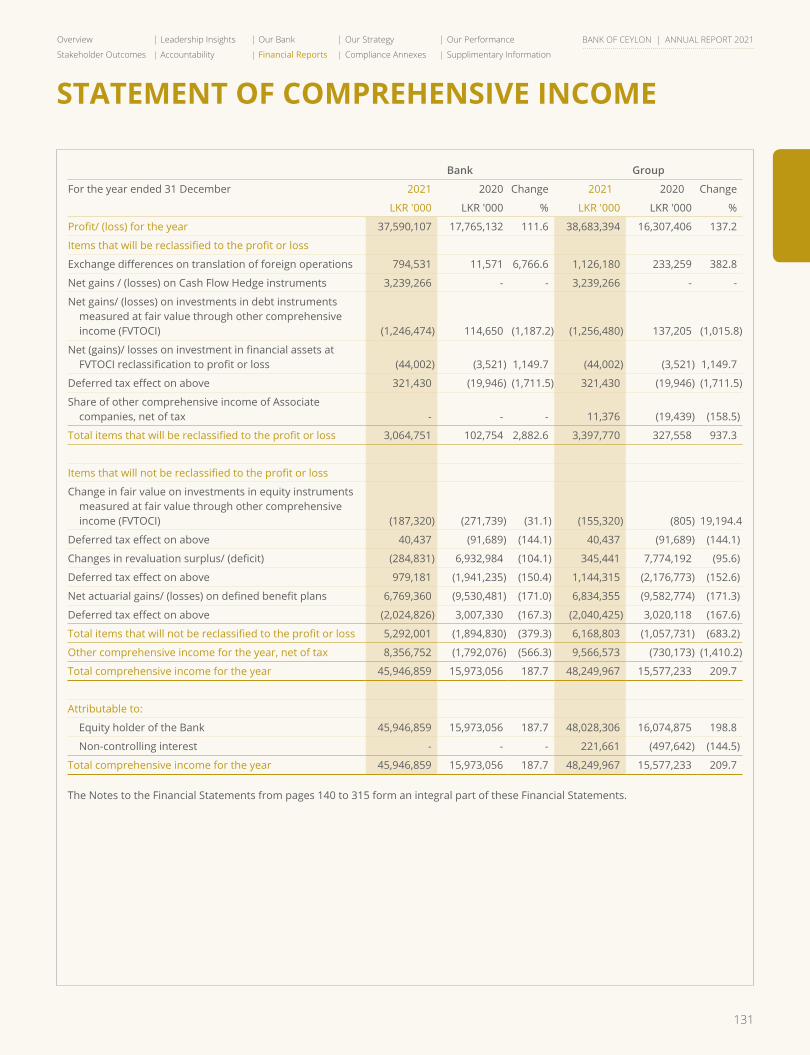
131
Overview Leadership Insights Our Bank Our Strategy Our Performance
Stakeholder Outcomes Accountability Financial Reports Compliance Annexes Supplimentary Information
BANK OF CEYLON | ANNUAL REPORT 2021
STATEMENT OF COMPREHENSIVE INCOME
Bank Group
For the year ended 31 December 2021 2020 Change 2021 2020 Change
LKR '000 LKR '000 % LKR '000 LKR '000 %
Profit/ (loss) for the year 37,590,107 17,765,132 111.6 38,683,394 16,307,406 137.2
Items that will be reclassified to the profit or loss
Exchange differences on translation of foreign operations 794,531 11,571 6,766.6 1,126,180 233,259 382.8
Net gains / (losses) on Cash Flow Hedge instruments 3,239,266 - - 3,239,266 - -
Net gains/ (losses) on investments in debt instruments measured at fair value through other comprehensive income (FVTOCI) (1,246,474) 114,650 (1,187.2) (1,256,480) 137,205 (1,015.8)
Net (gains)/ losses on investment in financial assets at FVTOCI reclassification to profit or loss (44,002) (3,521) 1,149.7 (44,002) (3,521) 1,149.7
Deferred tax effect on above 321,430 (19,946) (1,711.5) 321,430 (19,946) (1,711.5)
Share of other comprehensive income of Associate companies, net of tax - - - 11,376 (19,439) (158.5)
Total items that will be reclassified to the profit or loss 3,064,751 102,754 2,882.6 3,397,770 327,558 937.3
Items that will not be reclassified to the profit or loss
Change in fair value on investments in equity instruments measured at fair value through other comprehensive income (FVTOCI) (187,320) (271,739) (31.1) (155,320) (805) 19,194.4
Deferred tax effect on above 40,437 (91,689) (144.1) 40,437 (91,689) (144.1)
Changes in revaluation surplus/ (deficit) (284,831) 6,932,984 (104.1) 345,441 7,774,192 (95.6)
Deferred tax effect on above 979,181 (1,941,235) (150.4) 1,144,315 (2,176,773) (152.6)
Net actuarial gains/ (losses) on defined benefit plans 6,769,360 (9,530,481) (171.0) 6,834,355 (9,582,774) (171.3)
Deferred tax effect on above (2,024,826) 3,007,330 (167.3) (2,040,425) 3,020,118 (167.6)
Total items that will not be reclassified to the profit or loss 5,292,001 (1,894,830) (379.3) 6,168,803 (1,057,731) (683.2)
Other comprehensive income for the year, net of tax 8,356,752 (1,792,076) (566.3) 9,566,573 (730,173) (1,410.2)
Total comprehensive income for the year 45,946,859 15,973,056 187.7 48,249,967 15,577,233 209.7
Attributable to:
Equity holder of the Bank 45,946,859 15,973,056 187.7 48,028,306 16,074,875 198.8
Non-controlling interest - - - 221,661 (497,642) (144.5)
Total comprehensive income for the year 45,946,859 15,973,056 187.7 48,249,967 15,577,233 209.7
The Notes to the Financial Statements from pages 140 to 315 form an integral part of these Financial Statements.

132
BANK OF CEYLON | ANNUAL REPORT 2021
STATEMENT OF FINANCIAL POSITION
Bank Group
As at 31 December Note 2021 2020 Change 2021 2020 Change
LKR '000 LKR '000 % LKR '000 LKR '000 %
Assets
Cash and cash equivalents 22 82,647,406 84,416,624 (2.1) 82,313,908 83,198,445 (1.1)
Balances with Central Banks 23 74,121,781 33,351,852 122.2 74,121,781 33,351,852 122.2
Placements with banks 24 4,957,417 27,615,851 (82.0) 5,342,369 27,913,969 (80.9)
Securities purchased under resale agreements 25 2,074,474 2,001,047 3.7 2,976,664 3,822,312 (22.1)
Derivative financial instruments 26 4,342,531 548,926 691.1 4,342,531 548,926 691.1
Financial assets recognised through profit or loss - measured at fair value 27 9,230,022 9,856,220 (6.4) 9,640,813 10,869,471 (11.3)
Financial assets at amortised cost
- loans and advances 28 2,413,762,291 1,988,409,007 21.4 2,446,330,329 2,018,393,730 21.2
- debt and other instruments 29 1,082,179,876 724,390,172 49.4 1,082,837,662 725,579,585 49.2
Financial assets measured at fair value through OCI 30 18,302,556 15,362,480 19.1 22,879,810 17,913,778 27.7
Investment in subsidiary companies 31 8,181,138 6,513,048 25.6 - - -
Investment in associate companies 32 92,988 92,988 - 595,531 510,084 16.8
Investment properties 33 2,414,640 2,534,118 (4.7) 107,704 114,370 (5.8)
Property, Plant and Equipment 34 32,757,485 33,366,003 (1.8) 46,944,191 47,418,620 (1.0)
Right of Use Assets/ Leasehold properties 35 3,137,955 3,208,879 (2.2) 2,825,719 2,643,686 6.9
Intangible assets 36 1,039,985 1,020,881 1.9 1,214,591 1,228,597 (1.1)
Deferred tax assets 37 2,152,712 - - 2,213,847 76,873 2,779.9
Other assets 38 61,888,586 50,292,999 23.1 63,262,306 51,189,477 23.6
Total assets 3,803,283,843 2,982,981,095 27.5 3,847,949,756 3,024,773,775 27.2
Liabilities
Due to banks 39 17,936,070 2,402,043 646.7 18,646,339 2,628,434 609.4
Securities sold under repurchase agreements 40 162,156,413 57,106,652 184.0 161,668,335 57,697,780 180.2
Derivative financial instruments 41 380,328 102,182 272.2 380,328 102,182 272.2
Financial liabilities at amortised cost
- due to depositors 42 2,866,894,010 2,474,775,488 15.8 2,886,237,094 2,493,110,291 15.8
- other borrowings 43 444,107,977 180,884,127 145.5 447,875,002 185,102,055 142.0
Debt securities issued 44 - - - 2,107,182 2,107,493 -
Current tax liabilities 45 647,993 591,723 9.5 978,532 775,259 26.2
Deferred tax liabilities 37 - 923,462 (100.0) 2,153,309 3,305,797 (34.9)
Insurance provision - Life 46 - - - 413,743 498,767 (17.0)
Insurance provision - Non life 46 - - - 526,017 488,784 7.6
Other liabilities 47 46,042,365 44,898,628 2.5 47,461,127 45,372,722 4.6
Subordinated liabilities 49 64,358,855 64,637,407 (0.4) 64,105,970 64,627,397 (0.8)
Total liabilities 3,602,524,011 2,826,321,712 27.5 3,632,552,978 2,855,816,961 27.2
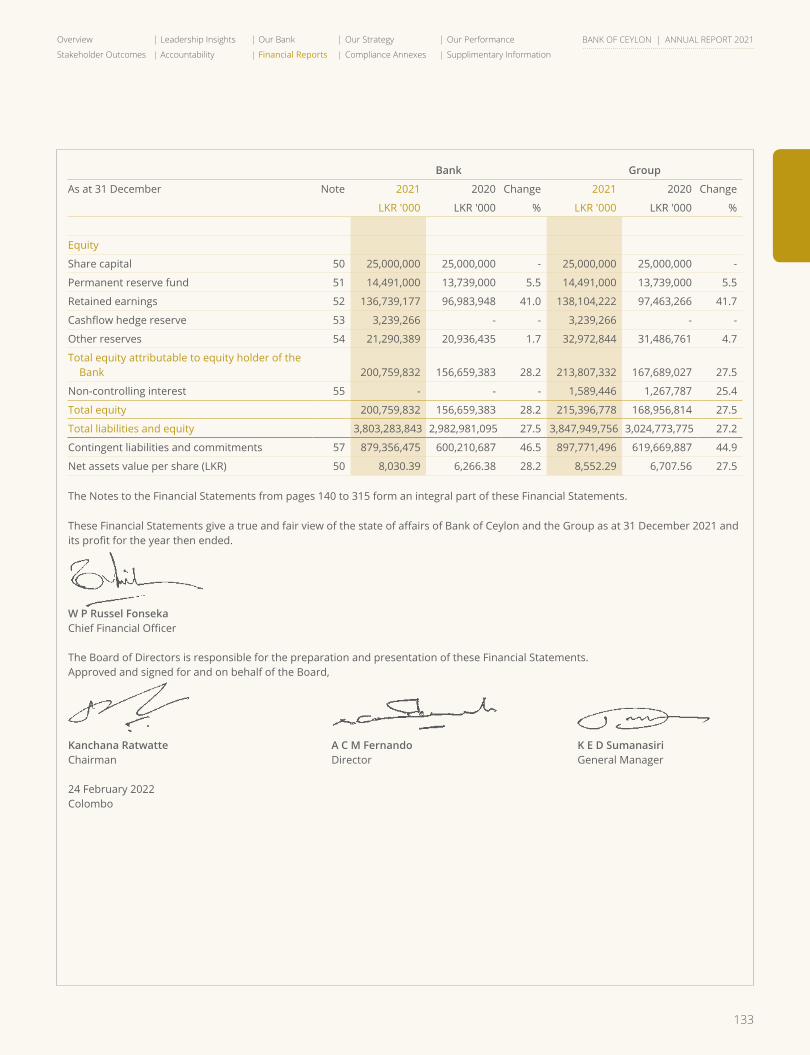
133
Overview Leadership Insights Our Bank Our Strategy Our Performance
Stakeholder Outcomes Accountability Financial Reports Compliance Annexes Supplimentary Information
BANK OF CEYLON | ANNUAL REPORT 2021
Bank Group
As at 31 December Note 2021 2020 Change 2021 2020 Change
LKR '000 LKR '000 % LKR '000 LKR '000 %
Equity
Share capital 50 25,000,000 25,000,000 - 25,000,000 25,000,000 -
Permanent reserve fund 51 14,491,000 13,739,000 5.5 14,491,000 13,739,000 5.5
Retained earnings 52 136,739,177 96,983,948 41.0 138,104,222 97,463,266 41.7
Cashflow hedge reserve 53 3,239,266 - - 3,239,266 - -
Other reserves 54 21,290,389 20,936,435 1.7 32,972,844 31,486,761 4.7
Total equity attributable to equity holder of the Bank 200,759,832 156,659,383 28.2 213,807,332 167,689,027 27.5
Non-controlling interest 55 - - - 1,589,446 1,267,787 25.4
Total equity 200,759,832 156,659,383 28.2 215,396,778 168,956,814 27.5
Total liabilities and equity 3,803,283,843 2,982,981,095 27.5 3,847,949,756 3,024,773,775 27.2
Contingent liabilities and commitments 57 879,356,475 600,210,687 46.5 897,771,496 619,669,887 44.9
Net assets value per share (LKR) 50 8,030.39 6,266.38 28.2 8,552.29 6,707.56 27.5
The Notes to the Financial Statements from pages 140 to 315 form an integral part of these Financial Statements.
These Financial Statements give a true and fair view of the state of affairs of Bank of Ceylon and the Group as at 31 December 2021 and its profit for the year then ended.
W P Russel FonsekaChief Financial Officer
The Board of Directors is responsible for the preparation and presentation of these Financial Statements.Approved and signed for and on behalf of the Board,
Kanchana Ratwatte A C M Fernando K E D SumanasiriChairman Director General Manager
24 February 2022Colombo
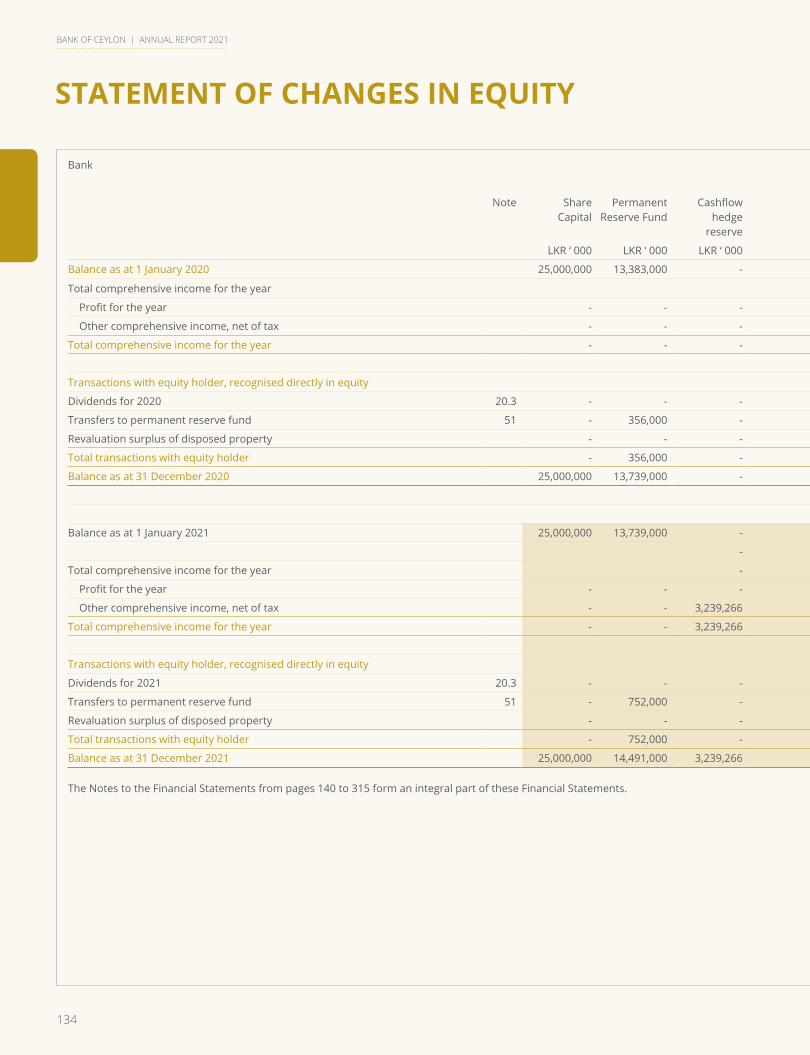
134
BANK OF CEYLON | ANNUAL REPORT 2021
Bank
Other Reserves
Note ShareCapital
PermanentReserve Fund
Cashflowhedge
reserve
FVOCI reserve
Other Reserves
Revaluation Reserve
Retained Earnings
Total Equity
LKR ‘ 000 LKR ‘ 000 LKR ‘ 000 LKR ‘ 000 LKR ‘ 000 LKR ‘ 000 LKR ‘ 000 LKR ‘ 000
Balance as at 1 January 2020 25,000,000 13,383,000 - 1,976,601 2,539,318 11,694,338 87,689,480 142,282,737
Total comprehensive income for the year
Profit for the year - - - - - - 17,765,132 17,765,132
Other comprehensive income, net of tax - - - (272,245) 11,571 4,991,749 (6,523,151) (1,792,076)
Total comprehensive income for the year - - - (272,245) 11,571 4,991,749 11,241,981 15,973,056
Transactions with equity holder, recognised directly in equity
Dividends for 2020 20.3 - - - - - - (1,596,410) (1,596,410)
Transfers to permanent reserve fund 51 - 356,000 - - - - (356,000) -
Revaluation surplus of disposed property - - - - - (4,897) 4,897 -
Total transactions with equity holder - 356,000 - - - (4,897) (1,947,513) (1,596,410)
Balance as at 31 December 2020 25,000,000 13,739,000 - 1,704,356 2,550,889 16,681,190 96,983,948 156,659,383
Balance as at 1 January 2021 25,000,000 13,739,000 - 1,704,356 2,550,889 16,681,190 96,983,948 156,659,383
-
Total comprehensive income for the year -
Profit for the year - - - - - - 37,590,107 37,590,107
Other comprehensive income, net of tax - - 3,239,266 (1,115,929) 794,531 694,350 4,744,534 8,356,752
Total comprehensive income for the year - - 3,239,266 (1,115,929) 794,531 694,350 42,334,641 45,946,859
Transactions with equity holder, recognised directly in equity
Dividends for 2021 20.3 - - - - - - (1,846,410) (1,846,410)
Transfers to permanent reserve fund 51 - 752,000 - - - - (752,000) -
Revaluation surplus of disposed property - - - - - (18,998) 18,998 -
Total transactions with equity holder - 752,000 - - - (18,998) (2,579,412) (1,846,410)
Balance as at 31 December 2021 25,000,000 14,491,000 3,239,266 588,427 3,345,420 17,356,542 136,739,177 200,759,832
The Notes to the Financial Statements from pages 140 to 315 form an integral part of these Financial Statements.
STATEMENT OF CHANGES IN EQUITY
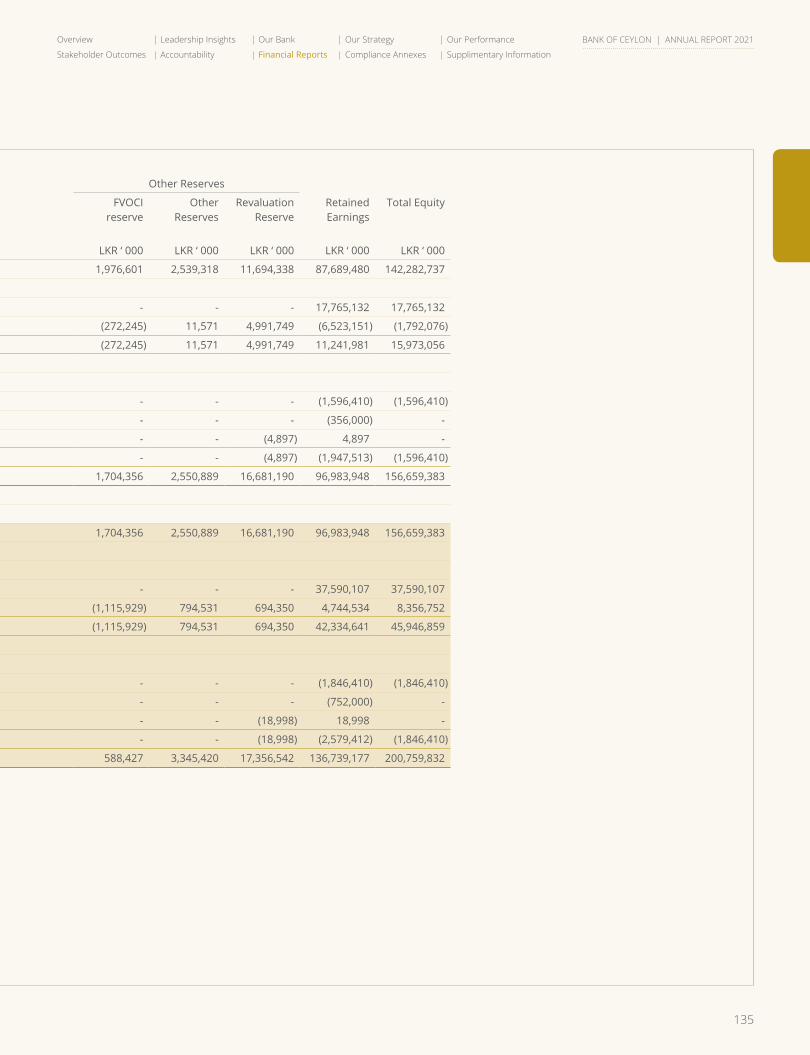
135
Overview Leadership Insights Our Bank Our Strategy Our Performance
Stakeholder Outcomes Accountability Financial Reports Compliance Annexes Supplimentary Information
BANK OF CEYLON | ANNUAL REPORT 2021
Bank
Other Reserves
Note ShareCapital
PermanentReserve Fund
Cashflowhedge
reserve
FVOCI reserve
Other Reserves
Revaluation Reserve
Retained Earnings
Total Equity
LKR ‘ 000 LKR ‘ 000 LKR ‘ 000 LKR ‘ 000 LKR ‘ 000 LKR ‘ 000 LKR ‘ 000 LKR ‘ 000
Balance as at 1 January 2020 25,000,000 13,383,000 - 1,976,601 2,539,318 11,694,338 87,689,480 142,282,737
Total comprehensive income for the year
Profit for the year - - - - - - 17,765,132 17,765,132
Other comprehensive income, net of tax - - - (272,245) 11,571 4,991,749 (6,523,151) (1,792,076)
Total comprehensive income for the year - - - (272,245) 11,571 4,991,749 11,241,981 15,973,056
Transactions with equity holder, recognised directly in equity
Dividends for 2020 20.3 - - - - - - (1,596,410) (1,596,410)
Transfers to permanent reserve fund 51 - 356,000 - - - - (356,000) -
Revaluation surplus of disposed property - - - - - (4,897) 4,897 -
Total transactions with equity holder - 356,000 - - - (4,897) (1,947,513) (1,596,410)
Balance as at 31 December 2020 25,000,000 13,739,000 - 1,704,356 2,550,889 16,681,190 96,983,948 156,659,383
Balance as at 1 January 2021 25,000,000 13,739,000 - 1,704,356 2,550,889 16,681,190 96,983,948 156,659,383
-
Total comprehensive income for the year -
Profit for the year - - - - - - 37,590,107 37,590,107
Other comprehensive income, net of tax - - 3,239,266 (1,115,929) 794,531 694,350 4,744,534 8,356,752
Total comprehensive income for the year - - 3,239,266 (1,115,929) 794,531 694,350 42,334,641 45,946,859
Transactions with equity holder, recognised directly in equity
Dividends for 2021 20.3 - - - - - - (1,846,410) (1,846,410)
Transfers to permanent reserve fund 51 - 752,000 - - - - (752,000) -
Revaluation surplus of disposed property - - - - - (18,998) 18,998 -
Total transactions with equity holder - 752,000 - - - (18,998) (2,579,412) (1,846,410)
Balance as at 31 December 2021 25,000,000 14,491,000 3,239,266 588,427 3,345,420 17,356,542 136,739,177 200,759,832
The Notes to the Financial Statements from pages 140 to 315 form an integral part of these Financial Statements.
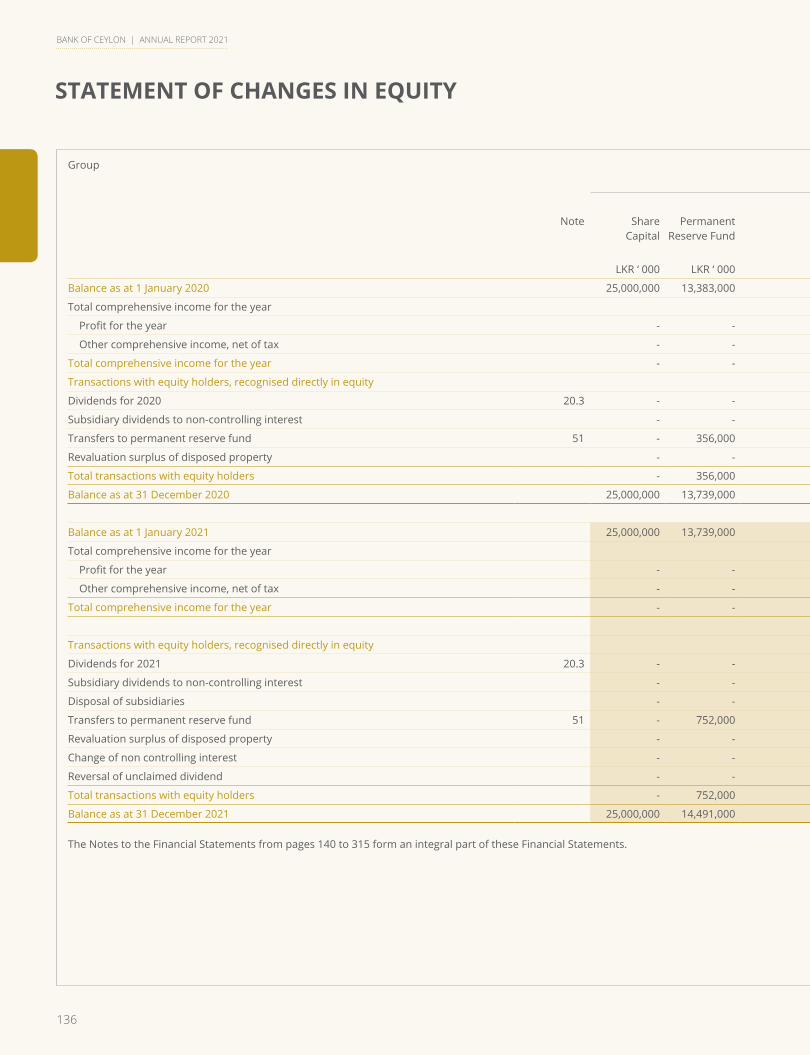
136
BANK OF CEYLON | ANNUAL REPORT 2021
Group
Attributable to equity holder of the Bank
Other Reserves
Note ShareCapital
PermanentReserve Fund
Cashflowhedge
reserve
FVOCI reserve
Other Reserves
Revaluation Reserve
Retained Earnings
Non-Controlling
Interest
Total Equity
LKR ‘ 000 LKR ‘ 000 LKR ‘ 000 LKR ‘ 000 LKR ‘ 000 LKR ‘ 000 LKR ‘ 000 LKR ‘ 000 LKR ‘ 000
Balance as at 1 January 2020 25,000,000 13,383,000 - 2,571,824 3,827,349 19,287,824 89,140,565 1,785,087 154,995,649
Total comprehensive income for the year
Profit for the year - - - - - - 16,842,514 (535,108) 16,307,406
Other comprehensive income, net of tax - - - 1,324 233,259 5,570,078 (6,572,300) 37,466 (730,173)
Total comprehensive income for the year - - - 1,324 233,259 5,570,078 10,270,214 (497,642) 15,577,233
Transactions with equity holders, recognised directly in equity
Dividends for 2020 20.3 - - - - - - (1,596,410) - (1,596,410)
Subsidiary dividends to non-controlling interest - - - - - - - (19,658) (19,658)
Transfers to permanent reserve fund 51 - 356,000 - - - - (356,000) - -
Revaluation surplus of disposed property - - - - - (4,897) 4,897 - -
Total transactions with equity holders - 356,000 - - - (4,897) (1,947,513) (19,658) (1,616,068)
Balance as at 31 December 2020 25,000,000 13,739,000 - 2,573,148 4,060,608 24,853,005 97,463,266 1,267,787 168,956,814
Balance as at 1 January 2021 25,000,000 13,739,000 2,573,148 4,060,608 24,853,005 97,463,266 1,267,787 168,956,814
Total comprehensive income for the year
Profit for the year - - - - - - 38,490,392 193,002 38,683,394
Other comprehensive income, net of tax - - 3,239,266 (1,089,736) 1,126,180 1,468,637 4,793,566 28,660 9,566,573
Total comprehensive income for the year - - 3,239,266 (1,089,736) 1,126,180 1,468,637 43,283,958 221,662 48,249,967
Transactions with equity holders, recognised directly in equity
Dividends for 2021 20.3 - - - - - - (1,846,410) - (1,846,410)
Subsidiary dividends to non-controlling interest - - - - - - - (10,280) (10,280)
Disposal of subsidiaries - - - - - (64,923) (6,142) (71,065)
Transfers to permanent reserve fund 51 - 752,000 - - - - (752,000) - -
Revaluation surplus of disposed property - - - - - (18,998) 18,998 - -
Change of non controlling interest - - - - - - - 116,419 116,419
Reversal of unclaimed dividend - - - - - - 1,333 - 1,333
Total transactions with equity holders - 752,000 - - - (18,998) (2,643,002) 99,997 (1,810,003)
Balance as at 31 December 2021 25,000,000 14,491,000 3,239,266 1,483,412 5,186,788 26,302,644 138,104,222 1,589,446 215,396,778
The Notes to the Financial Statements from pages 140 to 315 form an integral part of these Financial Statements.
STATEMENT OF CHANGES IN EQUITY
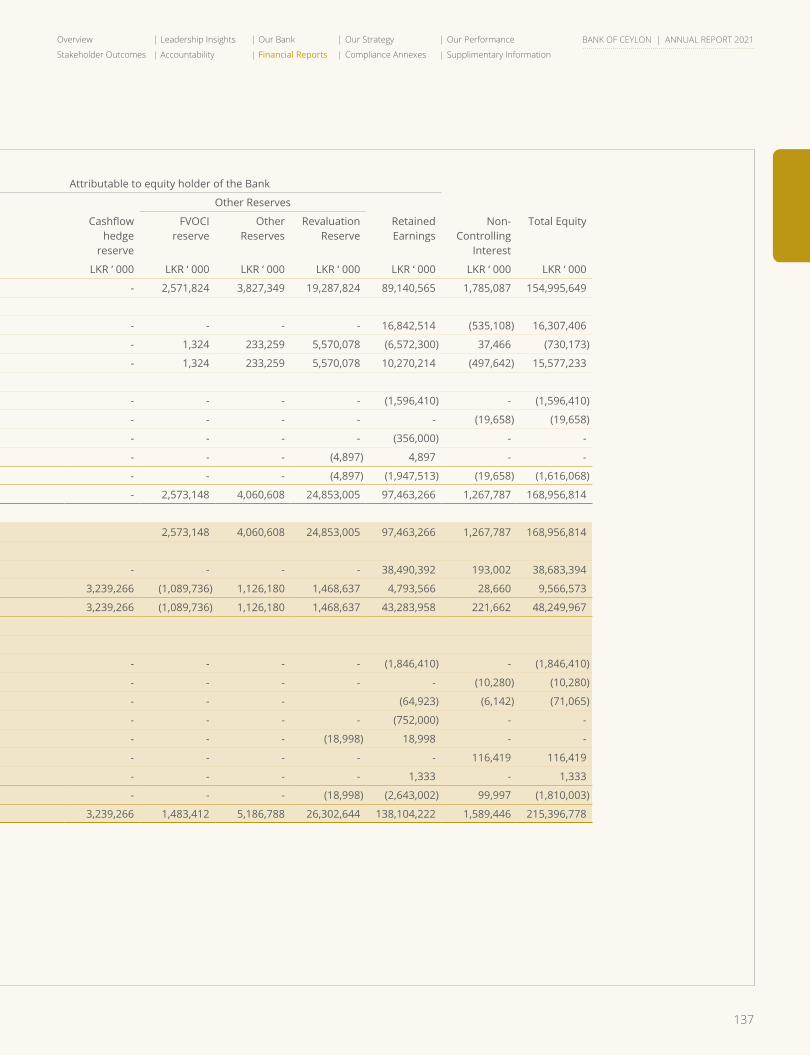
137
Overview Leadership Insights Our Bank Our Strategy Our Performance
Stakeholder Outcomes Accountability Financial Reports Compliance Annexes Supplimentary Information
BANK OF CEYLON | ANNUAL REPORT 2021
Group
Attributable to equity holder of the Bank
Other Reserves
Note ShareCapital
PermanentReserve Fund
Cashflowhedge
reserve
FVOCI reserve
Other Reserves
Revaluation Reserve
Retained Earnings
Non-Controlling
Interest
Total Equity
LKR ‘ 000 LKR ‘ 000 LKR ‘ 000 LKR ‘ 000 LKR ‘ 000 LKR ‘ 000 LKR ‘ 000 LKR ‘ 000 LKR ‘ 000
Balance as at 1 January 2020 25,000,000 13,383,000 - 2,571,824 3,827,349 19,287,824 89,140,565 1,785,087 154,995,649
Total comprehensive income for the year
Profit for the year - - - - - - 16,842,514 (535,108) 16,307,406
Other comprehensive income, net of tax - - - 1,324 233,259 5,570,078 (6,572,300) 37,466 (730,173)
Total comprehensive income for the year - - - 1,324 233,259 5,570,078 10,270,214 (497,642) 15,577,233
Transactions with equity holders, recognised directly in equity
Dividends for 2020 20.3 - - - - - - (1,596,410) - (1,596,410)
Subsidiary dividends to non-controlling interest - - - - - - - (19,658) (19,658)
Transfers to permanent reserve fund 51 - 356,000 - - - - (356,000) - -
Revaluation surplus of disposed property - - - - - (4,897) 4,897 - -
Total transactions with equity holders - 356,000 - - - (4,897) (1,947,513) (19,658) (1,616,068)
Balance as at 31 December 2020 25,000,000 13,739,000 - 2,573,148 4,060,608 24,853,005 97,463,266 1,267,787 168,956,814
Balance as at 1 January 2021 25,000,000 13,739,000 2,573,148 4,060,608 24,853,005 97,463,266 1,267,787 168,956,814
Total comprehensive income for the year
Profit for the year - - - - - - 38,490,392 193,002 38,683,394
Other comprehensive income, net of tax - - 3,239,266 (1,089,736) 1,126,180 1,468,637 4,793,566 28,660 9,566,573
Total comprehensive income for the year - - 3,239,266 (1,089,736) 1,126,180 1,468,637 43,283,958 221,662 48,249,967
Transactions with equity holders, recognised directly in equity
Dividends for 2021 20.3 - - - - - - (1,846,410) - (1,846,410)
Subsidiary dividends to non-controlling interest - - - - - - - (10,280) (10,280)
Disposal of subsidiaries - - - - - (64,923) (6,142) (71,065)
Transfers to permanent reserve fund 51 - 752,000 - - - - (752,000) - -
Revaluation surplus of disposed property - - - - - (18,998) 18,998 - -
Change of non controlling interest - - - - - - - 116,419 116,419
Reversal of unclaimed dividend - - - - - - 1,333 - 1,333
Total transactions with equity holders - 752,000 - - - (18,998) (2,643,002) 99,997 (1,810,003)
Balance as at 31 December 2021 25,000,000 14,491,000 3,239,266 1,483,412 5,186,788 26,302,644 138,104,222 1,589,446 215,396,778
The Notes to the Financial Statements from pages 140 to 315 form an integral part of these Financial Statements.

138
BANK OF CEYLON | ANNUAL REPORT 2021
STATEMENT OF CASH FLOWS
Bank Group
For the year ended 31 December Note 2021 2020 2021 2020
LKR '000 LKR '000 LKR '000 LKR '000
Cash flows from operating activities
Profit before income tax 43,189,517 23,551,881 44,637,053 22,246,153
Adjustments for:
Net interest income 8 (111,251,941) (74,775,866) (114,989,627) (77,203,241)
Dividend income 10/13 (302,564) (403,351) (391,238) (404,776)
Dividends from subsidiaries and associates 13 (394,454) (434,475) - -
Share of (profits) / losses of associate companies, net of tax 19 - - (133,677) (82,488)
Change in operating assets 56.1 (495,708,888) (412,923,813) (497,153,928) (408,051,752)
Change in operating liabilities 56.2 535,337,949 496,722,445 535,950,023 497,455,395
Other non-cash items included in profit before tax 56.3 46,351,388 39,963,871 46,385,644 40,978,788
Other net gains from investing activities (1,741,017) (1,410,918) (1,775,413) (1,484,521)
15,479,990 70,289,774 12,528,837 73,453,558
Benefit paid from defined benefit plans (8,890,151) (8,590,729) (8,897,006) (8,625,429)
Interest received 193,501,226 168,040,640 199,239,746 172,733,898
Interest paid (136,973,421) (128,555,512) (138,568,991) (130,549,871)
Dividends received 75,792 73,023 126,157 73,245
Net cash from / (used in) operating activities before income tax 63,193,436 101,257,196 64,428,743 107,085,401
Income tax paid 45 (8,166,811) (5,158,415) (8,399,520) (5,361,254)
Net cash from / (used in) operating activities 55,026,625 96,098,781 56,029,223 101,724,147
Cash flows from investing activities
Net increase in financial investments at amortised cost (345,016,186) (145,229,377) (344,484,560) (145,189,269)
Net increase in financial assets measured at fair value through OCI (4,346,097) (935,063) (6,339,860) (412,408)
Investment in subsidiary companies (1,668,090) - - -
Proceeds from sale of subsidiary companies - - 180,550 -
Addition to investment properties - (3,007) - -
Purchase of Property, Plant and Equipment (1,771,198) (2,946,477) (1,900,544) (3,059,995)
Purchase of intangible assets (471,365) (367,195) (471,365) (401,078)
Proceeds from sale of Property, Plant and Equipment 21,998 37,635 102,831 50,688
Dividends received 621,226 764,802 265,081 331,531
Interest received 53,951,314 44,988,953 54,264,536 45,439,524
Net cash from/ (used in) investing activities (298,678,398) (103,689,729) (298,383,331) (103,241,007)

139
Overview Leadership Insights Our Bank Our Strategy Our Performance
Stakeholder Outcomes Accountability Financial Reports Compliance Annexes Supplimentary Information
BANK OF CEYLON | ANNUAL REPORT 2021
Bank Group
For the year ended 31 December Note 2021 2020 2021 2020
LKR '000 LKR '000 LKR '000 LKR '000
Cash flows from financing activities
Net increase in other borrowings 245,235,448 28,159,729 245,076,637 21,685,842
Proceeds from issue of shares - - 233,902 -
Proceeds from issue of debentures/ capital bonds 8,750,000 15,000,000 8,500,000 15,000,000
Payments on redemption of debentures (9,232,254) (4,779,196) (9,222,244) (4,779,196)
Dividends paid to Equity holder of the Bank (1,846,410) (1,596,410) (1,846,410) (1,596,410)
Dividends paid to non-controlling interest - - (10,280) (19,658)
Interest payments on borrowings and debt securities (16,443,988) (8,738,923) (17,165,671) (9,461,333)
Net cash from/ (used in) financing activities 226,462,796 28,045,200 225,565,934 20,829,245
Net increase / (decrease) in cash and cash equivalents during the year (17,188,977) 20,454,252 (16,788,174) 19,312,385
Cash and cash equivalents at the beginning of the year 83,978,210 63,523,958 82,533,640 63,221,255
Cash and cash equivalents at the end of the year 66,789,233 83,978,210 65,745,466 82,533,640
Analysis of cash and cash equivalents
Cash and cash equivalents 22 82,647,406 84,416,624 82,313,908 83,198,445
Bank overdrafts 39 (15,858,173) (438,414) (16,568,442) (664,805)
Cash and cash equivalents at the end of the year 66,789,233 83,978,210 65,745,466 82,533,640
The Notes to the Financial Statements from pages 140 to 315 form an integral part of these Financial Statements.
140
BANK OF CEYLON | ANNUAL REPORT 2021
NOTES TO THE FINANCIAL STATEMENTS
1.0 Reporting Entity
1.1 Corporate Information
Bank of Ceylon (“The Bank”) is a Government-owned bank domiciled in Sri Lanka, duly incorporated on 1 August 1939 under the Bank of Ceylon Ordinance No. 53 of 1938. It is a licensed commercial bank established under the Banking Act No. 30 of 1988 and amendments thereto. The Registered Office of the Bank is situated at “BOC Square”, No. 01, Bank of Ceylon Mawatha, Colombo 01, Sri Lanka. The debentures issued by the Bank are listed on the Colombo Stock Exchange. The staff strength of the Bank as at 31 December 2021 was 8,337 (2020- 8,479).
1.2 Consolidated Financial Statements
The Consolidated Financial Statements are prepared as at and for the year ended 31 December 2021 comprise the Bank (“Parent”), its Subsidiaries (together referred to as the “Group” and individually as (“Group Entities”) and the Group’s interests in its Associate companies. The Financial Statements of the companies in the Group have a common financial year which ends on 31 December, except the Associate companies, Transnational Lanka Records Solutions (Private) Limited and Ceybank Asset Management Limited. The Bank is the ultimate parent of the Group.
1.3 Principal Activities
1.3.1 Bank
The principal activities of the Bank during the year were, personal banking, corporate banking, development banking, off-shore banking, trade financing, lease financing, primary dealing, investment banking and wealth management, treasury operations, correspondent banking and money remittances, Islamic banking,
bancassurance, pawning, credit card facilities, foreign currency operations and other financial services.
1.3.2 Subsidiaries
The principal activities of the Subsidiaries of the Bank are as follows:
Name of the Company Principal Business Activities
Property Development PLC Own, maintain and manage, develop and sustain the utility and value of the Bank of Ceylon head office building.
Merchant Bank of Sri Lanka & Finance PLC
Leasing, hire purchase, corporate and retail credit facilities, corporate advisory services, capital market operations, margin trading, micro-financing, agricultural credit facilities, real estate, pawning, Islamic finance and accepting deposits.
Bank of Ceylon (UK) Limited Authorised commercial bank by the Prudential Regulation Authority and regulated by the Financial Conduct Authority in England and Wales, engages in retail and corporate banking, treasury operations, correspondent banking services and trade financing activities.
BOC Property Development & Management (Private) Limited
Renting of office space of BOC Merchant Tower in Colombo 03 and Ceybank House in Kandy.
BOC Travels (Private) Limited Engages in travel related services.
Hotels Colombo (1963) Limited Provides hotel services.
Ceybank Holiday Homes (Private) Limited
Managing, operating and maintaining of travel rests / hotels / rest houses / guest houses.
MBSL Insurance Company Limited
Carrying on insurance business, both life and non-life insurance.
BOC Management & Support Services (Private) Limited
Not in operation.
1.3.3 Associates
The principal activities of the Associates of the Bank are as follows:
Name of the Company Principal Business Activities
Ceybank Asset Management Limited
Management of unit trust funds and other institutional and private portfolios.
Lanka Securities (Private) Limited Registered stock broker, trading in equity and debt securities, equity debt security brokering and undertaking placement of equity and debt securities.
Transnational Lanka Records Solutions (Private) Limited
Renting buildings and hiring other assets.
Southern Development Financial Company Limited
Not in operation and in the process of liquidation.
141
Overview Leadership Insights Our Bank Our Strategy Our Performance
Stakeholder Outcomes Accountability Financial Reports Compliance Annexes Supplimentary Information
BANK OF CEYLON | ANNUAL REPORT 2021
During the year Koladeniya Hydropower (Private) Limited was disposed and necessary adjustments have been incorporated to the Financial Statements of Group in order to identify the disposal. Merchant Bank of Sri Lanka & Finance PLC has issued LKR 2.2 billion worth of new ordinary shares under a right issue. The Bank and its fully owned subsidiary BOC Property Development & Management (Private) Limited invested in this share issue and the Bank’s shareholding increased to 84.5%. BOC Management & Support Services (Private) Limited (MSS) has not carried out its core business activities since 2007. Southern Development Financial Company Limited (SDFCL) is also not in operations. The Board of Directors of SDFCL has decided to wind-up the company and it is in the process of liquidation.
2. Directors’ Responsibility for Financial Statements
2.1 Preparation and Presentation of the Financial Statements
The Board of Directors is responsible for the preparation and presentation of the Financial Statements of the Bank and its Subsidiaries and Associates in compliance with the requirements of the Bank of Ceylon Ordinance No. 53 of 1938 and its amendments, Banking Act No. 30 of 1988 and its amendments thereto and Sri Lanka Accounting Standards (SLFRSs and LKASs).
These Financial Statements comprise
• Statement of Profit or Loss
• Statement of Comprehensive Income
• Statement of Financial Position
• Statement of Changes in Equity
• Statement of Cash Flows
• Notes to the Financial Statements
2.2 Approval of Financial Statements
The Financial Statements for the year ended 31 December 2021 were authorised for issue on 24 February 2022 by the Board of Directors.
3. Basis of Preparation
3.1 Statement of Compliance
The Consolidated Financial Statements of the Group and the separate Financial Statements of the Bank have been prepared in accordance with Sri Lanka Accounting Standards comprising of Sri Lanka Financial Reporting Standards (SLFRSs) and Sri Lanka Accounting Standards (LKASs) laid down by the Institute of Chartered Accountants of Sri Lanka (together referred to as SLFRSs in these Financial Statements).
The preparation and presentation of these Financial Statements are in compliance with the requirements of the Bank of Ceylon Ordinance No. 53 of 1938, the Banking Act No. 30 of 1988 and the Companies Act No. 07 of 2007. The Group has prepared Financial Statements which comply with SLFRSs applicable for the year ended 31 December 2021, together with the comparative year data as at and for the year ended 31 December 2020, as described in the accounting policies.
The formats used in the preparation and presentation of the Financial Statements and the disclosures made therein also comply with the specified formats prescribed by the Central Bank of Sri Lanka (CBSL) in the Circular No. 02 of 2019 on “Publication of Annual and Quarterly Financial Statements and Other Disclosures by Licensed Banks”.
3.2 Basis of Measurement
The Financial Statements have been prepared on the basis of
historical cost convention and no adjustments have been made for inflationary factors which has been applied on a consistent basis, except for the following:
• Derivative financial instruments are measured at fair value (Note 26 and 41)
• Financial assets recognised through profit or loss - measured at fair value (Note 27)
• Financial assets measured at fair value through OCI (Note 30)
• Owner-occupied freehold land and buildings and buildings on leasehold lands are measured at revalued amount less any subsequent accumulated depreciation and impairment losses (Note 34)
• Defined benefit obligations are actuarially valued and recognised at the present value of the defined benefit obligation less total of the fair value of plan assets (Note 48)
• Cash Flow hedge reserve, accounted as per the hedge accounting (Note 53)
3.3 Presentation of Financial Statements
Items in the Statement of Financial Position of the Bank and the Group are grouped by nature of such item and presented broadly in order of their relative liquidity and maturity pattern. An analysis regarding recovery or settlement within 12 months after the Reporting date (current) and more than 12 months after the Reporting date (non-current) is presented in Note 60 - “Maturity Analysis of Assets and Liabilities”.
3.3.1 Functional and Presentation Currency
Items included in the Financial Statements are measured and presented in Sri Lankan Rupees
142
BANK OF CEYLON | ANNUAL REPORT 2021
NOTES TO THE FINANCIAL STATEMENTS
(“LKR”) which is the functional currency of the primary economic environment in which the Bank operates.
3.3.2 Accrual Basis of Accounting
The Financial Statements, except for information on Statement of Cash Flows have been prepared following the accrual basis of accounting.
3.3.3 Offsetting
Financial assets and financial liabilities are generally reported gross in the Statement of Financial Position. They are only offset and reported net when, in addition to having an unconditional legally enforceable right to offset the recognised amounts without being contingent on a future event, the parties also intend to settle on a net basis in all of the following circumstances:
• The normal course of business.
• The event of default.
• The event of insolvency or bankruptcy of the Bank / Group and/or its counterparties.
Income and expenses are not offset in the Statement of Profit or Loss unless required or permitted by any accounting standard or interpretation and as specifically disclosed in the accounting policies of the Group.
3.3.4 Comparative Information
The comparative information is provided in narrative and descriptive nature, if it is relevant to understand the current period’s Financial Statements and reclassified wherever necessary to conform to the current year’s presentation.
3.3.5 Materiality and Aggregation
In compliance with LKAS 1 – “Presentation of Financial Statements”, each material class of similar items are presented separately in the Financial Statements. Items of dissimilar nature or functions are presented separately unless they are immaterial.
3.3.6 Rounding
The amounts in the Financial Statements have been rounded-off to the nearest Rupees thousands, except where otherwise indicated as permitted by the LKAS 1- “Presentation of Financial Statements”.
3.3.7 Statement of Cash Flow
The Statement of Cash Flow is prepared by using the “Indirect Method” in accordance with the LKAS 7- “Statement of Cash Flows” whereby the profit is adjusted to derive the cash flows from operating activities. Cash and cash equivalents comprise cash in hand, other short term highly liquid investments with maturity less than seven days from date of acquisition and bank overdrafts.
3.3.8 UseofSignificantAccountingJudgements, Estimates and Assumptions
The preparation of the Financial Statements requires management to exercise judgements, estimates and assumptions that affect the application of accounting policies and the reported amounts of assets, liabilities, income and expenses. Actual results may differ from these estimates. The judgements, estimates and assumptions are based on historical experience and various other factors that are believed to be reasonable under the circumstances and reviewed on an ongoing basis. Revisions to accounting estimates are recognised in the period in
which the estimates are revised and / or in future periods if the revision affects future periods too. In the process of applying the Group’s accounting policies, management has made the following judgements, estimates and assumptions, which have the most significant effect on the amounts recognised in the Financial Statements. The Management considered the impact of COVID-19 in preparing the Financial Statements in line with the circulars and guidelines issued by the CBSL and the CA Sri Lanka. While the specific areas of judgement may not change, the impact of COVID-19 resulted in the application of further judgement within those areas due to the evolving nature of the pandemic and the limited recent experience of the economic and financial impacts of such an event. Further, changes to estimates were made in the measurement of Group’s assets where applicable. The accounting policies which are most sensitive to the use of judgements, estimates and assumptions are specified below.
3.3.8.1 Going Concern
The Management has made an assessment on the Group’s ability to continue as a going concern and is satisfied that it has the resources to continue in business for the foreseeable future. Furthermore, management is not aware of any material uncertainties that may cast significant doubt upon the Group’s ability to continue as a going concern. Therefore, the Financial Statements continue to be prepared on the going concern basis. In making this assessment, the Management has considered the potential downsides that the COVID-19 pandemic could bring to the business operations of the Group. Accordingly, the Management satisfied itself that the going concern basis is appropriate.
143
Overview Leadership Insights Our Bank Our Strategy Our Performance
Stakeholder Outcomes Accountability Financial Reports Compliance Annexes Supplimentary Information
BANK OF CEYLON | ANNUAL REPORT 2021
3.3.8.2 Commitment and Contingent Liabilities
All discernible risks are accounted for in determining the amount of all known and measurable liabilities. Contingent liabilities are possible obligations whose existence will be confirmed only by uncertain future events or present obligations where the transfer of economic benefit is not probable or cannot be reliably measured. Contingent liabilities are not recognised in the Statement of Financial Position but are disclosed unless its considered remote that the Group will be liable to settle the possible obligation.
3.3.8.3 Fair Value of Financial Instruments
Fair value is the price that would be received to sell an asset or paid to transfer a liability in an orderly transaction between market participants at the measurement date.
Where the classification of a financial asset or liability results in it being measured at fair value, wherever possible, the fair value is determined by reference to the quoted bid or offer price in the most advantageous active market to which the Group has immediate access. An adjustment for credit risk is also incorporated into the fair value as appropriate. Fair value for a net open position that is a financial liability quoted in an active market is the current offer price, and for a financial asset the bid price, multiplied by the number of units of the instrument held or issued.
Where no active market exists for a particular asset or liability, the Group uses a valuation technique that include the use of mathematical models to arrive at the fair value, including the use of transaction prices obtained in recent arm’s length transactions,
discounted cash flow analysis, option pricing models and other valuation techniques based on market conditions and risks existing at Reporting date. In doing so, fair value is estimated using a valuation technique that makes maximum use of observable market inputs and places minimal reliance upon entity-specific inputs.
The best evidence of the fair value of a financial instrument at initial recognition is the transaction price (i.e. the fair value of the consideration given or received) unless the fair value of that instrument is evidenced by comparison with other observable current market transactions in the same instrument (i.e. without modification or repackaging) or based on a valuation technique whose variables include only data from observable markets. When such evidence exists, the Group recognises the difference between the transaction price and the fair value in Profit or Loss on initial recognition (i.e. on day one). The valuations of financial instruments are described comprehensively in Note 63. Determination of the fair value of financial instruments of the Group were not materially affected by the significant volatility in financial markets created by the COVID–19 pandemic.
3.3.8.4 Impairment Charge for Loans and Advances
The measurement of impairment charge under SLFRS 9- “Financial Instruments” requires judgement by management in identification and estimation of the amount and timing of future cash flows when determining an impairment charge for loans and advances.
Accordingly, the Group reviews its individually significant loans and advances at each Reporting date to assess whether an impairment
charge should be provided in the Statement of Profit or Loss.
In particular, the Management’s judgement is required in identification and estimation of the amount and timing of future cash flows when determining the impairment loss.
In estimating these cash flows, the Group makes judgements about the borrower’s financial position, the net realisable value of collateral and other related factors. These estimates are based on assumptions about a number of factors and actual results may differ, resulting in future changes to the impairment allowance.
A collective impairment provision is established for the groups of homogeneous loans and advances that are not considered individually significant and groups of loans that are individually significant but that were not found to be individually impaired. A collective assessment of impairment takes into account the data from loan portfolio (such as credit quality, levels of arrears, credit utilisation, etc.), concentrations of risk and economic data (including levels of Unemployment, Inflation, GDP growth rate and Country rating) and the Performance of different individual group.
The impairment requirements in SLFRS 9 - “Financial Instruments” are based on an Expected Credit Loss (ECL) model and it is reflected the general pattern of deterioration or improvement, in the credit quality of financial instruments. The Group calculates ECLs either on a collective or an individual basis. The amount of ECLs recognised as a loss allowance or provision depends on the extent of credit deterioration since initial recognition and measured under following bases:
144
NOTES TO THE FINANCIAL STATEMENTS
BANK OF CEYLON | ANNUAL REPORT 2021
• 12-month ECLs (stage 1), which apply to all items as long as there is no significant deterioration in credit risk.
• Lifetime ECLs (stages 2 and 3), which apply when a significant increase in credit risk has occurred on an individual or collective basis.
Further, the Group makes additional judgements and estimates with regard to the following under ECL model.
• The Group’s criteria for assessing if there has been a significant increase in credit risk and so impairment for financial assets should be measured on a Lifetime ECL basis.
• Development of ECL models, including various formula and the choice of inputs.
• Determination of association between macro-economic inputs, such as GDP growth, inflation, interest rates, exchange rates and unemployment with the effect on Probability of Default (PDs), Exposure At Default (EAD) and Loss Given Default (LGD).
• Selection of forward-looking macro-economic scenarios and their probability weightings to derive the economic inputs into the ECL model.
In response to COVID-19 and the Group’s expectations of economic impacts, key assumptions used in the Group’s calculation of ECL have been revised. The economic scenarios and forward-looking macroeconomic assumptions underpinning the collective provision calculation are outlined in Note 4.4.11. Although the credit model inputs and assumptions, including forward looking macroeconomic assumptions, were revised in response to
the COVID-19 pandemic, the fundamental credit model mechanics and methodology underpinning the Group’s calculation of ECL have remained consistent with prior periods.
The Group is focused on supporting customers who are experiencing financial difficulties because of the COVID-19 pandemic and has offered a range of industry-wide financial assistance measures including the debt moratorium initiated by the Central Bank of Sri Lanka. As per industry guidance, eligibility for the debt moratorium does not automatically result in a significant increase in credit risk (SICR) which moves an exposure from stage 1 (12-month ECL) to stage 2 (lifetime ECL). A case-by-case analysis has been conducted on the most significant exposures and only those exposures with increased credit risk has been moved to stage 2 and stage 3.
As per SLFRS 9- “Financial Instruments”, the collective provision for groups of homogeneous loans is established using statistical methods or, a formula approach based on historical loss rate experience, using the statistical analysis of historical data on delinquency to estimate the amount of loss. Management applies judgement to ensure that the estimate of loss arrived at, on the basis of historical information is appropriately adjusted to reflect the economic conditions and portfolio factors as at the Reporting date. The loss rates are regularly reviewed against, actual loss experience.
It has been the Group’s policy to regularly review its model in the context of actual loss experience and adjust when necessary. The accuracy of the provision depends on the model assumptions and
parameters used in determining the impairment. Details of impairment losses on loans and advances are given in Note 14.
3.3.8.5 Impairment of Investment in Subsidiaries, Other Financial Assets and Non- Financial Assets
The Group and the Bank follow the guidance of LKAS 36 – “Impairment of Assets” and SLFRS 9 - “Financial Instruments” in determining whether an investment or a financial asset is impaired. Determination and identification of impairment indicators require the Group and the Bank to evaluate duration and extent to which the fair value of an investment for a financial asset is less than its cost and the financial stability of the near term business outlook of the investment or the financial asset, considering the factors such as performance of the sector and industry, technology and operational environmental changes along with future cash flows. This process involves with significant judgement in aforesaid areas.
3.3.8.6 DefinedBenefitObligation
The cost of the defined benefit pension plans and other post employment benefit plans are determined using an actuarial valuation. An actuarial valuation involves making various assumptions determining the discount rates, expected rates of return on planned assets, future salary increases, mortality rates and future pension increases. Due to the long-term nature of these plans, such estimates are subject to significant uncertainty.
In determining the appropriate discount rate, the Group considers the interest rates of Sri Lanka Government Bonds with maturities corresponding to the expected duration of the Defined Benefit
145
Overview Leadership Insights Our Bank Our Strategy Our Performance
Stakeholder Outcomes Accountability Financial Reports Compliance Annexes Supplimentary Information
BANK OF CEYLON | ANNUAL REPORT 2021
Obligation. The mortality rate is based on publicly available mortality tables. Future salary increases and pension increases are based on inflation rate and salary increase rates of the Group. All assumptions are reviewed at each Reporting date and assumptions used in the year are given in Note 48.
3.3.8.7 Fair Value of Land and Buildings
The freehold land and buildings and the buildings on leasehold land of the Group are reflected at fair value less accumulated depreciation. The Group engaged independent valuation specialists to determine fair value of such properties in terms of the SLFRS 13 – “Fair Value Measurement”. The details of valuation of freehold land and buildings and the buildings on leasehold land are given in Note 34.
3.3.8.8 Useful Life of the Property, Plant and Equipment and Intangible Assets
The Group reviews the residual values, useful lives and methods of depreciation of Property, Plant and Equipment and intangible assets at each Reporting date. Judgement of the management is exercised in the estimation of these values, rates, methods and hence they are subject to uncertainty. The details of the depreciation methods and rates used for each assets category are given in Note 34.
3.3.8.9 ClassificationofInvestmentProperties
Management is required to use its judgement to determine whether a property qualified as an investment property. A property that is held to earn rentals or for capital appreciation or both and which generates cash flows largely independently of the other assets held by the Group are accounted for as investment properties. On the other hand, properties that are used for operations or for the process of providing services or
for administration purposes and which do not directly generate cash flows as stand-alone assets are accounted as Property, Plant and Equipment.
3.3.8.10 Determination of control over investees
Subsidiaries are entities that are controlled by the Bank, control is achieved when the Bank is exposed, or has rights to variable returns from its involvement with the invitee and has the ability to affect the returns of those investees through its power over the investee. The Management applies its judgements to determine the Bank controls over its investees.
3.3.8.11 Taxation
The Group is subject to income tax, Value Added Tax (VAT) and other applicable taxes.
A judgement is required to determine the total provision for current, deferred and other taxes due to the uncertainties that exists with respect to the interpretation of the applicable tax laws at the time of preparing these Financial Statements. The details on the applicable tax rates and other information are given under Notes 4.8, 18 and 37.
The Group is subject to transfer pricing regulations and it is necessitated using management judgement to determine the impact of transfer pricing regulations. Accordingly, critical judgements and estimates were used in applying the regulations in aspects including but not limited to identifying associated undertakings, estimation of the respective arm’s length prices and selection of appropriate pricing mechanism.
The current tax charge is subject to such judgements. Differences between estimated income tax charge and actual
payable may arise as a result of variances between Management’s interpretation and application of tax regulation.
4. Significant Accounting Policies The significant accounting policies
applied by the Bank and the Group in preparation of its Financial Statements are included below and have been consistently applied to all periods presented in the Financial Statements of the Group and the Bank, unless otherwise indicated.
4.1 Basis of Consolidation
The Group’s Financial Statements comprise consolidation of the Financial Statements of the Bank and its Subsidiaries in terms of SLFRS 10 – “Consolidated Financial Statements” and LKAS 27 – “Separate Financial Statements” and the proportionate share of the profit or loss and net assets of its Associates in terms of the Sri Lanka Accounting Standard LKAS 28 – “Investments in Associates and Joint Ventures”.
The Bank’s Financial Statements comprise the amalgamation of the Financial Statements of the Domestic Banking Unit, the Off-shore Banking Unit and the Overseas Operations of the Bank.
The detailed accounting policies pertaining to the consolidation of Subsidiaries and Associates are given in the Notes 31 and 32.
4.1.1 Business Combinations
The Group determines whether a transaction or other event is a business combination by applying the definition in SLFRS 3 – “Business Combinations”, which requires that the assets acquired and liabilities assumed constitute a business. Business combinations are accounted for using the acquisition method. As of the acquisition date, the amount of non-controlling interest is measured either at fair value or
146
NOTES TO THE FINANCIAL STATEMENTS
BANK OF CEYLON | ANNUAL REPORT 2021
at the non-controlling interests’ proportionate share of the acquirer’s identifiable net assets.
Acquisition related cost are costs the acquirer incurs to effect a business combination. Those costs include finder’s fees, advisory, legal, accounting, valuation, other professional consulting fees, general administrative costs including the cost of maintaining an Internal Acquisition Department and cost of registering and issuing debt and equity securities. Acquisition related costs, other than those associated with the issue of debt or equity securities are expensed in the periods in which the costs are incurred and the services are received. The Group elects on a transaction by transaction basis whether to measure non-controlling interests at its fair value or at its proportionate share of the recognised amount of the identifiable net assets, at the acquisition date. Transaction costs, other than those associated with the issue of debt or equity securities that the Group incurs in connection with a business combination are expensed as incurred.
4.1.2 Loss of Control When the Group loses control
over a Subsidiary, it derecognises the assets and liabilities of the Subsidiary, and any related Non-Controlling Interest (NCI) and other components of equity. Any resulting gain or loss is recognised in Profit or Loss. Any interest retained in the former Subsidiary is measured at fair value when control is lost. Further, the Bank’s share of components previously recognised in Other Comprehensive Income (OCI) is reclassified to Profit or Loss or retained earnings as appropriate. Any surplus or deficit arising on the loss of control is recognised in the Profit or Loss. If the Group retains any interest in the previous Subsidiary, then such interest is measured at fair value at the date that control is lost. Subsequently, it is accounted for as an equity-accounted investee
or in accordance with the Group’s accounting policy for financial instruments depending on the level of influence retained.
4.2 Foreign Currency Translations4.2.1 Foreign Currency Transactions
and Balances At the initial recognition,
transactions in foreign currency are translated into the functional currency of the operation which is Sri Lankan Rupees (LKR) at the spot exchange rate at the date of the transaction. Monetary assets and liabilities denominated in foreign currency at the Reporting date are retranslated into the functional currency at the spot exchange rate at that date and all differences arising on non-trading activities are taken to “Net other operating income” (Note 13) in the Statement of Profit or Loss.
Non-monetary assets and liabilities that are measured in terms of historical cost in a foreign currency are translated using the exchange rate at the date of the initial recognition. Non-monetary assets and liabilities denominated in foreign currency that are measured at fair value are retranslated into the functional currency at the spot exchange rate including any exchange gain or loss component at the date on which the fair value is determined. Gain or loss on a non-monetary item including exchange component is recognised in Other Comprehensive Income. Forward exchange contracts are valued at the forward market rates ruling on the Reporting date and resulting net unrealised gains or losses are dealt within the Statement of Profit or Loss.
4.2.2 Foreign Operations The results and financial position
of foreign operations, whose functional currencies are not Sri Lankan Rupees, are translated into Sri Lankan Rupees as follows:
The assets and liabilities of foreign operations are translated into Sri Lankan Rupees at spot exchange rate as at the Reporting date.
The income and expenses of foreign operations are translated at average rate for the period. Foreign currency differences on the translation of foreign operations are recognised in Other Comprehensive Income.
When a foreign operation is disposed off, the relevant amount in the translation reserve is transferred to the Profit or Loss as part of the Profit or loss on disposal in other operating income or other operating expenses.
4.2.3 Hedge Accounting The Bank enters in to hedging
arrangements with the counterparties in order to mitigate the foreign exchange risk from foreign currency transactions. According to the SLFRS 09, an entity may designate an item in its entirety or a component of an item as the hedged item in a hedging relationship. A hedging relationship qualifies for hedge accounting only if the hedging relationship consists only of eligible hedging instruments and eligible hedged items.
At the inception of the hedging relationship there is formal designation and documentation of the hedging relationship and the entity’s risk management objective and strategy for undertaking the hedge. That documentation shall include identification of the hedging instrument, the hedged item, the nature of the risk being hedged and how the entity will assess whether the hedging relationship meets the hedge effectiveness requirements, including its analysis of the sources of hedge ineffectiveness and how it determines the hedge ratio.
SLFRS 09 enables hedge accounting for three different designated categories, namely Cash flow hedge (designated for a highly probable forecasted transaction, a firm commitment (not recorded on the balance sheet), foreign currency cash flows of a recognized asset or liability, or a forecasted intercompany transaction). Fair value hedge (designated for a firm
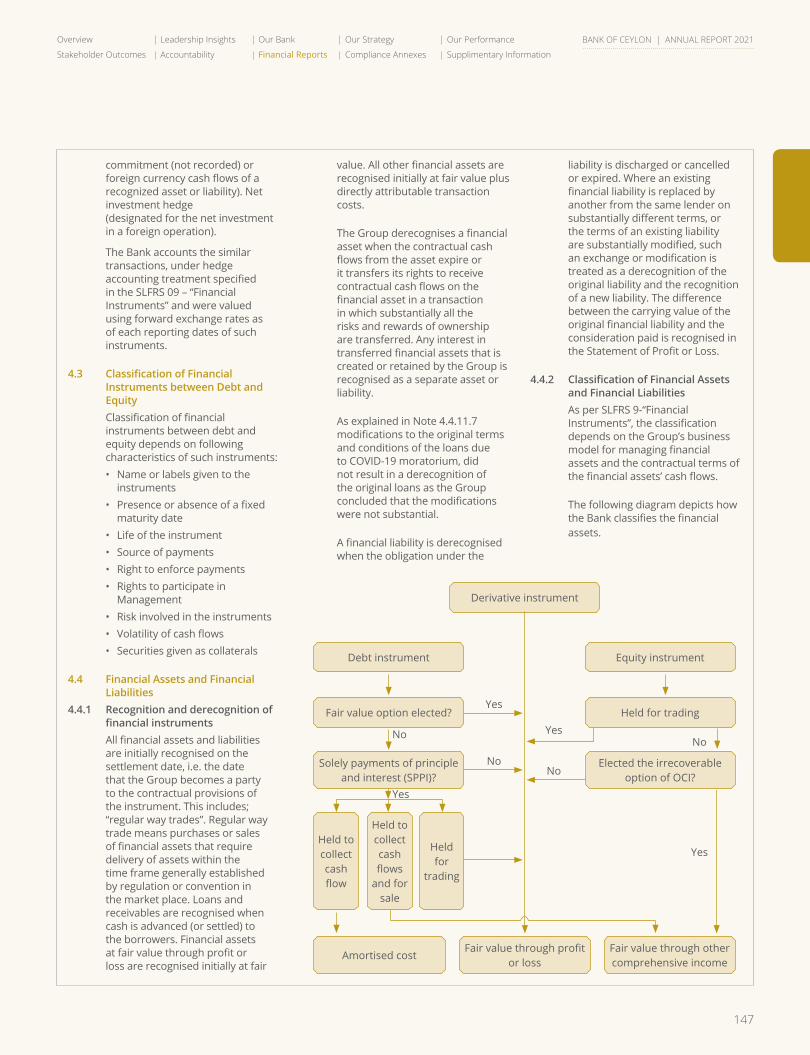
147
Overview Leadership Insights Our Bank Our Strategy Our Performance
Stakeholder Outcomes Accountability Financial Reports Compliance Annexes Supplimentary Information
BANK OF CEYLON | ANNUAL REPORT 2021
commitment (not recorded) or foreign currency cash flows of a recognized asset or liability). Net investment hedge (designated for the net investment in a foreign operation).
The Bank accounts the similar transactions, under hedge accounting treatment specified in the SLFRS 09 – “Financial Instruments” and were valued using forward exchange rates as of each reporting dates of such instruments.
4.3 ClassificationofFinancialInstruments between Debt and Equity
Classification of financial instruments between debt and equity depends on following characteristics of such instruments:• Name or labels given to the
instruments• Presence or absence of a fixed
maturity date• Life of the instrument• Source of payments• Right to enforce payments• Rights to participate in
Management • Risk involved in the instruments• Volatility of cash flows• Securities given as collaterals
4.4 Financial Assets and Financial Liabilities
4.4.1 Recognition and derecognition of financialinstruments
All financial assets and liabilities are initially recognised on the settlement date, i.e. the date that the Group becomes a party to the contractual provisions of the instrument. This includes; “regular way trades”. Regular way trade means purchases or sales of financial assets that require delivery of assets within the time frame generally established by regulation or convention in the market place. Loans and receivables are recognised when cash is advanced (or settled) to the borrowers. Financial assets at fair value through profit or loss are recognised initially at fair
value. All other financial assets are recognised initially at fair value plus directly attributable transaction costs.
The Group derecognises a financial asset when the contractual cash flows from the asset expire or it transfers its rights to receive contractual cash flows on the financial asset in a transaction in which substantially all the risks and rewards of ownership are transferred. Any interest in transferred financial assets that is created or retained by the Group is recognised as a separate asset or liability.
As explained in Note 4.4.11.7 modifications to the original terms and conditions of the loans due to COVID-19 moratorium, did not result in a derecognition of the original loans as the Group concluded that the modifications were not substantial.
A financial liability is derecognised when the obligation under the
liability is discharged or cancelled or expired. Where an existing financial liability is replaced by another from the same lender on substantially different terms, or the terms of an existing liability are substantially modified, such an exchange or modification is treated as a derecognition of the original liability and the recognition of a new liability. The difference between the carrying value of the original financial liability and the consideration paid is recognised in the Statement of Profit or Loss.
4.4.2 ClassificationofFinancialAssetsand Financial Liabilities
As per SLFRS 9-“Financial Instruments”, the classification depends on the Group’s business model for managing financial assets and the contractual terms of the financial assets’ cash flows.
The following diagram depicts how the Bank classifies the financial assets.
Derivative instrument
Debt instrument
Fair value option elected?
Solely payments of principle and interest (SPPI)?
Amortised costFair value through profit
or lossFair value through other comprehensive income
Held to collect cash flow
Held to collect cash flows
and for sale
Held for
trading
Equity instrument
Held for trading
Elected the irrecoverable option of OCI?
Yes
Yes
No Yes
Yes
NoNo
No
148
NOTES TO THE FINANCIAL STATEMENTS
BANK OF CEYLON | ANNUAL REPORT 2021
COVID-19 pandemic has resulted in significant volatility in the financial markets. However, the Group did not require to reclassify any of its financial assets as a result of the significant volatility created by the pandemic.
4.4.2.1 At the Inception, the Financial Assetsareclassifiedinoneofthefollowing categories:
• Financial assets measured at fair value through profit or loss (Note 4.4.7 and 27)
• Financial assets at amortised cost
- Financial assets at amortised cost - loans and advances (Note 28)
- Financial assets at amortised cost - debt and other instruments (Note 4.4.8 and 29)
• Financial assets measured at fair value through Other Comprehensive Income (Note 4.4.9 and 30).
4.4.2.2 At the Inception, the Financial Liabilitiesareclassifiedinoneofthe following categories:
• Financial liabilities at amortised cost
- Financial liabilities at amortised cost – due to depositors (Note 42)
- Financial liabilities at amortised cost-other borrowings and subordinated instruments (Note 43 and 49)
4.4.3 Initial Measurements of Financial Instruments
Financial assets and liabilities are initially measured at their fair value plus transaction cost, except in the case of financial assets and liabilities recorded at fair value through profit or loss. Transaction cost in relation to financial assets
and liabilities at fair value through profit or loss are dealt with in the Statement of Profit or Loss.
4.4.4 “DayOne”ProfitorLoss
When the transaction price differs from the fair value of other observable current market transactions in the same instrument or based on a valuation technique whose variables include only data from observable markets, the Group immediately recognises the difference between the transaction price and fair value (a “Day One” Profit or Loss) in the Statement of Profit or Loss. In cases where fair value is determined using data which is not observable, the difference between the transaction price and model value is only recognised in the Statement of Profit or Loss over the life of the instrument.
4.4.5 Business model assessment
With effect from 1 January 2018, as per SLFRS 9- “Financial Instrument”, the Group classifies all of its financial assets based on the business model and makes an assessment of the objective of a business model in which an asset is held at a portfolio level and not assessed on instrument-by- instrument basis because this best reflects the way the business is managed and information is provided to management. The information considered includes:
• The stated policies and objectives for the portfolio and the operation of those policies in practice. In particular, whether management’s strategy focuses on earning contractual interest revenue, maintaining a particular interest rate profile, matching the duration of the financial assets to the duration of the liabilities that are funding those assets or realising cash flows through the sale of the assets;
• How the performance of the portfolio is evaluated and reported to the Bank’s management;
• The risks that affect the performance of the business model (and the financial assets held within that business model) and how those risks are managed;
• How managers of the business are compensated
– e.g. whether compensation is based on the fair value of the assets managed or the contractual cash flows collected; and
• The frequency, volume and timing of sales in prior periods, the reasons for such sales and its expectations about future sales activity. However, information about sales activity is not considered in isolation, but as part of an overall assessment of how the Bank’s stated objective for managing the financial assets is achieved and how cash flows are realised.
The business model assessment is based on reasonably expected scenarios without taking ‘worst case’ or ‘stress case’ scenarios into account. If cash flows after initial recognition are realised in a way that is different from the Bank’s original expectations, the Bank does not change the classification of the remaining financial assets held in that business model, but incorporates such information when assessing newly originated or newly purchased financial assets going forward.
4.4.6 Assessment of whether contractualcashflowcharacteristics are met the Solely Payments of Principal and Interest (SPPI test)
As a second step of assets classification process, the Group
149
Overview Leadership Insights Our Bank Our Strategy Our Performance
Stakeholder Outcomes Accountability Financial Reports Compliance Annexes Supplimentary Information
BANK OF CEYLON | ANNUAL REPORT 2021
assesses the contractual terms of financial assets to identify whether they meet the SPPI test.
For the purposes of this assessment, “principal” is defined as the fair value of the financial asset on initial recognition and may change over the life of the financial asset (for example, if there are repayments of principal or amortisation of the premium / discount).
“Interest” is defined as consideration for the time value of money and for the credit risk associated with the principal amount outstanding during a particular period of time and for other basic lending risks and costs, as well as profit margin.
In contrast, contractual terms that introduce a more than de minimis exposure to risks or volatility in the contractual cash flows that are unrelated to a basic lending arrangement do not give rise to contractual cash flows that are solely payments of principal and interest on the principal amount outstanding. In such cases, the financial asset is required to be measured at fair value through profit and loss.
In assessing whether the contractual cash flows are solely payments of principal and interest on principal amount outstanding, the Group considers the contractual terms of the instrument. This includes assessing whether the financial asset contains a contractual term that could change the timing or amount of contractual cash flows such that it would not meet this condition. In making the assessment, the Group considers:
• Contingent events that would change the amount and timing of cash flows;
• Leverage features;
• Prepayment and extension terms;
• Terms that limit the Group’s claim to cash flows from specified assets; and
• Features that modify consideration of the time value of money
4.4.7 Financial assets measured at fair valuethroughprofitorloss
Items at fair value through profit or loss comprise:
• Items held for trading purpose;
• Items specifically designated as fair value through profit or loss on initial recognition; and
• Debt instruments with contractual terms that do not represent solely payments of principal and interest.
Financial instruments held at fair value through profit or loss are initially recognised at fair value, with transaction costs recognised in the Statement of Profit or Loss as incurred. Subsequently, they are measured at fair value and any gains or losses are recognised in the Statement of Profit or Loss as they arise.
Where a financial asset is measured at fair value, a credit valuation adjustment is included to reflect the credit worthiness of the counterparty, representing the movement in fair value attributable to changes in credit risk.
4.4.7.1 Financial instruments held for trading purpose
A financial instrument is classified as held for trading if it is acquired or incurred principally for the purpose of selling or repurchasing in the near term, or forms part of a portfolio of financial instruments
that are managed together and for which there is evidence of short-term profit taking, or it is a derivative not in a qualifying hedge relationship.
Trading derivatives and trading securities are classified as held for trading and recognised at fair value in the Statement of Financial Position. Changes in fair value are recognised in “Net gains / (losses) from trading” (Note 10) and “Net fair value gains / (losses) from financial instruments at fair value through profit or loss” (Note 11). Interest income from financial instruments held for trading is recorded under ”Net interest income” (Note 8) while dividend income is recorded in ”Net gains / (losses) from trading” (Note 10) when the right to payment has been established.
4.4.7.2 Financial instruments designated and measured at fair value throughprofitorloss
Upon initial recognition, financial instruments may be designated and measured at fair value through profit or loss. A financial asset may only be designated at fair value through profit or loss if doing so eliminates or significantly reduces measurement or recognition inconsistencies (i.e. eliminates an accounting mismatch) that would otherwise arise from measuring financial assets or liabilities on a different basis.
A financial liability may be designated at fair value through profit or loss if it eliminates or significantly reduces an accounting mismatch or:
• If a host contract contains one or more embedded derivatives; or
• If financial assets and liabilities are both managed and their performance evaluated on a
150
NOTES TO THE FINANCIAL STATEMENTS
BANK OF CEYLON | ANNUAL REPORT 2021
fair value basis in accordance with a documented risk management or investment strategy.
Where a financial liability is designated at fair value through profit or loss, the movement in fair value attributable to changes in the Group’s own credit quality is calculated by determining the changes in credit spreads above observable market interest rates and is presented separately in other comprehensive income.
As of 31 December 2021, there were no any financial liability designated at fair value through profit or loss.
4.4.7.3 Debt instruments with contractual terms that do not represent the solely payments of principal and interest
Financial debt instruments which are not meet solely payments of principal and interest test will be classified as fair value through profit or loss.
4.4.8 Financial assets measured at amortised cost-debt instruments
Investments in debt instruments are measured at amortised cost where they have:
• Contractual terms that give rise to cash flows on specified dates, that represent solely payments of principal and interest on the principal amount outstanding; and
• Are held within a business model whose objective is achieved by holding to collect contractual cash flows.
These debt instruments are initially recognised at fair value plus directly attributable transaction costs and subsequently measured at amortised cost using Effective Interest Rate
(EIR). The measurement of credit impairment is based on the three stage expected credit loss model described below in Note 4.4.11 Impairment of financial assets.
4.4.9 Financial assets measured at fair value through Other Comprehensive Income
4.4.9.1 Debt instruments
Investments in debt instruments are measured at fair value through Other Comprehensive Income where they have:
• Contractual terms that give rise to cash flows on specified dates, that represent solely payments of principal and interest on the principal amount outstanding; and
• Are held within a business model whose objective is achieved by both collecting contractual cash flows and selling financial assets.
These debt instruments are initially recognised at fair value plus directly attributable transaction costs and subsequently measured at fair value. Gains and losses arising from changes in fair value are included in Other Comprehensive Income within a separate component of equity. Impairment losses or reversals, interest revenue and foreign exchange gains and losses are recognised in Profit or Loss. Upon disposal, the cumulative gain or loss previously recognised in Other Comprehensive Income is reclassified from Other Comprehensive Income to Profit or Loss.
The measurement of credit impairment is based on the three stage expected credit loss model as applied to financial assets at amortised cost. The expected credit loss model is described below in Note 4.4.11 Impairment of financial assets.
4.4.9.2 Equity instruments
Investment in equity instruments that are neither held for trading nor contingent consideration recognised by the Group in a business combination to which SLFRS 3- “Business Combination” applies, are measured at fair value through Other Comprehensive Income, where an irrevocable election has been made by management. For portfolios where management does not consider an irrevocable election of adopting fair value through other comprehensive income, by default such investments shall be measured at fair value through profit or loss.
Upon de-recognition, the cumulative gain or loss recognised in Other Comprehensive Income are not transferred to Profit or Loss. However, cumulative gain or loss recognised full derecognition will be transferred from Other Comprehensive Income reserve to retained earnings within the equity. Dividends on such investments are recognised in “Net other operating income” (Note 13) in the Profit or Loss.
4.4.10 ReclassificationofFinancialAssets
The Group reclassifies its financial assets when, and only when, the Group changes its business model for managing financial assets. If the Group reclassifies financial assets which were measured at amortised cost, fair value through other comprehensive income or fair value through profit or loss, the Group applies the reclassification prospectively from the reclassification date. The Group does not re-state any previously recognised gains, losses (including impairment losses) or interest.
151
Overview Leadership Insights Our Bank Our Strategy Our Performance
Stakeholder Outcomes Accountability Financial Reports Compliance Annexes Supplimentary Information
BANK OF CEYLON | ANNUAL REPORT 2021
The table below summaries the treatment of gains and losses on reclassification
Initial Measurement
Measurement after reclassification
Treatment on reclassification
Fair value through profit or loss
Amortised cost Fair value at the reclassification date becomes its new gross carrying amount. The effective interest rate is calculated on the basis of that amount. For the purpose of applying the impairment requirements, the reclassification date is treated as the date of initial application.
Fair value through profit or loss
Fair value through other comprehensive income
The fair value of the financial asset at the reclassification date becomes its new carrying amount and the effective interest rate is determined on the basis of the fair value of the asset at the reclassification date.
Fair value through other comprehensive
Amortised cost The cumulative gain or loss previously recognised in Other Comprehensive Income is removed from equity and adjusted against the fair value of the financial asset at the reclassification date. The effective interest rate and the measurement of expected credit losses are not adjusted as a result of the reclassification.
Fair value through other comprehensive income
Fair value through profit or loss
The fair value of the financial asset at the reclassification date becomes its new carrying amount. The cumulative gain or loss previously recognised in Other Comprehensive Income is reclassified from equity to Profit or Loss as a reclassification adjustment at the reclassification date.
Amortised cost Fair value through profit or loss
Any gain or loss arising from a difference between the previous amortised cost of the financial asset and fair value at the reclassification date is recognised in Profit or Loss.
Amortised cost Fair value through other comprehensive income
Any gain or loss arising from a difference between the previous amortised cost of the financial asset and fair value at the reclassification date is recognised in Other Comprehensive Income. The effective interest rate and the measurement of expected credit losses are not adjusted as a result of the reclassification.
4.4.11 Impairment of Financial Assets
The Group applies a three-stage approach in measuring Expected Credit Loss (ECL) for the following categories of financial assets that are not measured at fair value through profit or loss:
• Debt instruments measured at amortised cost and fair value through other comprehensive income;
• Loan commitments; and
• Financial guarantee contracts.
No ECL is recognised on equity investments.
The Group performs an assessment at the end of each Reporting period, of whether a financial instrument’s credit risk has increased significantly since initial recognition, by considering the change in the risk of default occurring over the remaining life of the financial instrument. Based on this process financial assets migrate through the following three stages based on the change in credit risk since initial recognition:
4.4.11.1 Stage 1: 12-months ECL
For exposures where there has not been a significant increase in credit risk since initial recognition and that are not credit impaired upon origination, the portion of the lifetime ECL associated with the probability of default events occurring within the next 12 months is recognised. The Bank determines 12 months ECL from customers whom are not significantly credit deteriorated.
4.4.11.2 Stage 2: Lifetime ECL
For exposures where there has been a significant increase in credit risk since initial recognition but are not credit impaired, a lifetime ECL (i.e. reflecting the remaining lifetime of the financial asset) is recognised.
4.4.11.3 Stage 3: Lifetime ECL
Exposures are assessed as credit impaired when one or more events that have a detrimental impact on the estimated future cash flows of that asset have occurred. For
152
NOTES TO THE FINANCIAL STATEMENTS
BANK OF CEYLON | ANNUAL REPORT 2021
exposures that have become credit impaired, a lifetime ECL is recognised and interest revenue is calculated by applying the effective interest rate to the amortised cost (net of provision) rather than the gross carrying amount.
4.4.11.4 Calculation of ECL
The Group calculates ECL based on a three probability weighted scenarios to measure the expected cash shortfalls, discounted at an approximation to the Effective Interest Rate (EIR). A cash shortfall is the difference between the cash flows that are due to an entity in accordance with the contract and the cash flows that the entity expects to receive.
The mechanics of the ECL calculations of the Group are outlined below and the key elements are, as follows:
• Probability of Default (PD)
PD is an estimate of the likelihood of default over a given time horizon. A default may only happen at a certain time over the assessed period, if the facility has not been previously recognised and is still in the portfolio. The concept of PDs is further explained in Note 28.
• Exposure At Default (EAD) EAD is an estimate of the
exposure at a future default date, taking into account expected changes in the exposure after the Reporting date, including repayments of principal and interest, whether scheduled by contract or otherwise, expected drawdowns on committed facilities, and accrued interest from missed payments. The EAD is further explained in Note 28.
• Loss Given Default (LGD) LGD is an estimate of the loss
arising in the case where a default occurs at a given time. It is based on the difference between the contractual cash flows due and those that the lender would expect to receive, including from the realisation of any collateral. It is usually expressed as a percentage of the EAD. The LGD is further explained in Note 28.
4.4.11.5 Determining the stage for impairment
At each Reporting date, the Group assesses whether there has been a significant increase in credit risk for exposures since initial recognition by comparing the risk of default occurring over the expected life between the Reporting date and the date of initial recognition. The Group considers reasonable and supportable information that is relevant and available without undue cost or effort for this purpose. This includes quantitative and qualitative information and also, forward-looking analysis.
An exposure will migrate through the ECL stages as asset quality deteriorates. If, in a subsequent period, asset quality improves and also reverses any previously assessed significant increase in credit risk since origination, then the provision for doubtful debts reverts from lifetime ECL to 12-months ECL. Exposures that have not deteriorated significantly since origination, or where the deterioration remains within the Group’s investment grade criteria, or which are less than 30 days past due, are considered to have a low credit risk. The impairment provision for these financial assets is based on a 12-months ECL.
The Group assesses whether the credit risk on an exposure has increased significantly on
an individual or collective basis. For the purposes of a collective evaluation of impairment, financial instruments are grouped on the basis of shared credit risk characteristics, taking into account of instrument type, credit risk ratings, collateral type, date of initial recognition, remaining term to maturity, industry, geographical location of the borrower and other relevant factors.
4.4.11.6 Measurement of ECL
ECL is derived from unbiased and probability-weighted estimates of expected loss, and are measured as follows:
• Financial assets that are not credit-impaired at the Reporting date: as the present value of all cash shortfalls over the expected life of the financial asset discounted by the effective interest rate. The cash shortfall is the difference between the cash flows due to the Group in accordance with the contract and the cash flows that the Group expects to receive.
• Financial assets that are credit-impaired at the Reporting date: as the difference between the gross carrying amount and the present value of estimated future cash flows discounted by the effective interest rate.
• Undrawn loan commitments: as the present value of the difference between the contractual cash flows that are due to the Group if the commitment is drawn down and the cash flows that the Group expects to receive.
• Financial guarantee contracts: as the expected payments to reimburse the holder less any amounts that the Group expects to recover.
153
Overview Leadership Insights Our Bank Our Strategy Our Performance
Stakeholder Outcomes Accountability Financial Reports Compliance Annexes Supplimentary Information
BANK OF CEYLON | ANNUAL REPORT 2021
ECL is recognised in the Statement of Profit or Loss. In the case of debt instruments measured at fair value through Other Comprehensive Income, the measurement of ECL is based on the three-stage approach as applied to financial assets at amortised cost.
4.4.11.7 Relief Measures to Assist COVID-19AffectedBusinessesand Individuals by CBSL
The COVID -19 pandemic has significantly impacted the local economy and disrupted supply chains. Central Bank of Sri Lanka has provided financial assistance to disrupted industry sectors and the affected businesses /individuals in the form of a debt moratorium through licensed banks/financial institutions in the country.
CBSL issued circulars by giving extensions of debt moratorium for COVID-19 affected businesses and individuals covered under the Circular No 05 of 2020 and Circular No 08 of 2021, businesses and individuals in the tourism industry (Circular No. 10 of 2021) and concessions for lease facilities obtained by businesses and individuals in passenger transportation sector (Circular No 3 and 12 of 2021). According to the above circulars, banks were required to extend / offer moratoriums for eligible borrowers under different qualifying criteria.
The Bank has extended the tenor of the loans for eligible borrowers under different qualifying criteria.
As explained in Note 4.4.1 the Group derecognises a financial asset, such as a loan to a customer, when the terms and conditions have been renegotiated to the extent that, substantially, it becomes a new loan. However, the
Group concluded that the COVID -19 moratorium did not give rise to a substantial modification to the original terms and conditions of the moratorium eligible loans. Accordingly, the Group continued to recognize the moratorium eligible loans at the original EIR of the loans while recognizing a modification loss by discounting the revised cash flows of the loan at the original EIR.
The total modification loss has been recognised under interest income in Note 8 to the Financial Statements. Further, with the view of meeting the challenges faced by businesses and individuals due to the third wave of COVID-19, CBSL directed banks to extend the debt moratorium to such businesses and individuals for a further period of six months, nine months etc. Repayment period of the new loan shall be two years in general, however may vary based on the terms and conditions agreed with the borrower. The banks were allowed to recover interest at the original EIR during the moratorium period and therefore did not recognise any modification loss on account of the third phase of the COVID-19 moratorium.
The granting of the moratorium is directly related to the cash flow difficulties generated by the occurrence of the COVID-19 pandemic. However, it did not lead to an automatic transfer of these credit facilities in to stage to nor in to stage 3. A case-by-case analysis has been conducted on the most significant exposures and only those exposures with increased credit risk has been moved to stage 2 and stage 3. Further the exposures which are not individually significant has been moved to stage 2 based on the industry risk of the underlying borrowers.
4.5 Impairment of Non- Financial Assets
The Group assesses at each Reporting date whether there is an indication that an asset may be impaired. If any indication exists, or when annual impairment testing for an asset is required, the Bank estimates the asset’s recoverable amount. An asset’s recoverable amount is the higher of an asset’s fair value less costs to sell or its value in use. Where the carrying amount of an asset exceeds its recoverable amount, the asset is considered impaired and is written down to its recoverable amount. In assessing the value in use, the estimated future cash flows are discounted to their present value using a pre-tax discount rate that reflects current market assessments of the time value of money and the risks specific to the asset. In determining fair value less costs to sell, an appropriate valuation model is used. These calculations are corroborated by valuation multiples, quoted share prices for publicly-traded subsidiaries or other valuable fair value indicators.
4.6 Fiduciary Services
The Group provides fiduciary services to third parties that result in holding of the assets on behalf of its customers. Assets held in fiduciary capacity are not recognised in the Financial Statements, as the Group is not the beneficial owner or does not control such assets.
4.7 Provisions
A provision is recognised as a result of a past event, when the Group has a present (legal or constructive) obligation that can be estimated reliably and it is probable that an outflow of economic benefits will be required to settle the obligation.
154
NOTES TO THE FINANCIAL STATEMENTS
BANK OF CEYLON | ANNUAL REPORT 2021
The amount recognised is the best estimate of the consideration required to settle the present obligation at the Reporting date, taking into account the risks and uncertainties surrounding the obligation at that date. Where a provision is measured using the cash flows estimated to settle the present obligation, its carrying amount is determined based on the present value of those cash flows. A provision for onerous contracts is recognised when the expected benefits to be derived by the Group from a contract are lower than the unavoidable cost of meeting its obligations under the contract. The provision is measured as the present value of the lower of the expected cost of terminating the contract and the expected net cost of continuing with the contract.
4.8 Income Tax Expense and Other Taxes
4.8.1 Income Tax Expense
Income tax expense comprises current and deferred tax. More details are given in Note 18.
4.8.2 Value Added Tax (VAT) on Financial Services
The base for Value Added Tax computation is arrived by aggregating the accounting profit before income tax and emoluments of employees, which is adjusted for the depreciation computed on prescribed rates. During the year, the Group’s total value addition was subjected to 15% (2020– 15%) VAT as per the Value Added Tax Act No. 14 of 2002 and amendments thereto. Also the Group is following value attributable method to compute VAT on financial services.
In terms of the draft bill to amend the Value Added Tax Act, No. 14 of 2002, the VAT rate will be increased from 15% to 18% on
supply of financial services with effect from 1 January 2022.
4.8.3 Crop Insurance Levy (CIL)
As per the provisions of the Finance Act No. 12 of 2013, the CIL was introduced with effect from 1 April 2013 and is payable 1% of the profit after tax to the National Insurance Trust Fund Board.
5. Insurance Business
5.1 Reinsurance
The Group cedes insurance risk in the normal course of business for all of its businesses. Reinsurance assets represent balances due from reinsurance companies. Amounts recoverable from reinsurers are estimated in a manner consistent with the outstanding claims provision or settled claims associated with the reinsurer’s policies and are in accordance with the related reinsurance contract.
Reinsurance assets are reviewed for impairment at each Reporting date or more frequently when an indication of impairment arises during the Reporting year. Impairment occurs when there is objective evidence as a result of an event that occurred after initial recognition of the reinsurance asset that the Group may not receive all outstanding amounts due under the terms of the contract and the event has a reliably measurable impact on the amounts that the Group will receive from the reinsurer. The impairment loss is recorded in the Statement of Profit or Loss.
Premiums and claims are presented on a gross basis for reinsurance. Reinsurance assets or liabilities are derecognised when the contractual rights are extinguished or expire or when the contract is transferred to another party.
5.2 Insurance Receivables
Insurance receivables are recognised when due and measured on initial recognition at the fair value of the consideration receivable. The carrying value of insurance receivables is reviewed for impairment whenever events or circumstances indicate that the carrying amount may not be recoverable, with the impairment loss recorded in the Statement of Profit or Loss.
5.3 Deferred Expenses
5.3.1 Deferred Acquisition Costs (DAC)
The costs of acquiring new businesses including commission, underwriting, marketing and policy issue expenses which vary with and directly related to production of new businesses and/or investment contracts with Discretionary Participation Features (DPF), are deferred to the extent that these costs are recoverable out of future premiums. All other acquisition costs are recognised as an expense when incurred.
Subsequent to initial recognition, DAC for general insurance is amortised over the period on the basis unearned premium is amortised. The reinsurances’ share of deferred acquisition cost is amortised in the same manner as the underlying assets amortisation is recorded in the Statement of Profit or Loss. Changes in the expected useful life or the expected pattern of consumption of future economic benefits embodied in the assets are accounted for by changing the amortisation period and are treated as a change in an accounting estimate. DAC are derecognised when the related contracts are either expired or cancelled.
155
Overview Leadership Insights Our Bank Our Strategy Our Performance
Stakeholder Outcomes Accountability Financial Reports Compliance Annexes Supplimentary Information
BANK OF CEYLON | ANNUAL REPORT 2021
5.4 Reinsurance Commissions
Commissions receivable on outwards reinsurance contracts are deferred and amortised over the period of reinsurance.
5.5 Investment Contract Liabilities
Investment contracts are classified between contracts with and without DPF. The accounting policies for investment contract liabilities with DPF are the same as those for life insurance contract liabilities. Investment contract liabilities without DPF are recognised when contracts are entered into and premiums are charged. These liabilities are initially recognised at fair value being the transaction price excluding any transaction costs directly attributable to the issue of the contract. Subsequent to initial recognition, investment contract liabilities are measured at fair value through profit or loss.
Deposits and withdrawals are recorded directly as an adjustment to the liability in the Statement of Financial Position. Fair value adjustments are performed at each Reporting date and are recognised in the Statement of Profit or Loss. Fair value is determined through the use of prospective discounted cash flow techniques. For unitised contracts, fair value is calculated as the number of units allocated to the policyholder in each unit linked fund multiplied by the unit price of those funds at the Reporting date. The fund assets and fund liabilities used to determine the unit prices at the Reporting date are valued on a basis consistent with their measurement basis in the Statement of Financial Position adjusted to take account of the effect on the liabilities of the deferred tax on unrealised gains on assets in the fund. Non-utilised contracts are subsequently carried
at fair value, which is determined by using valuation techniques such as discounted cash flows and stochastic modelling. Models are validated, calibrated and periodically reviewed by an independent qualified person.
The liability is derecognised when the contract expires, is discharged or is cancelled. For a contract that can be cancelled by the policyholder, the fair value cannot be less than the surrender value. When contracts contain both a financial risk component and a significant insurance risk component and the cash flows from the two components are distinct and can be measured reliably, the underlying amounts are unbundled. Any premiums relating to the insurance risk component are accounted for on the same bases as insurance.
5.6 Discretionary Participation Features (DPF)
A DPF is a contractual right that gives holders of these contracts the right to receive as a supplement to guaranteed benefits, significant additional benefits which are based on the performance of the assets held within the DPF portfolio. Under the terms of the contract, surpluses in the DPF funds can be distributed to policyholders and shareholders on a 90/10 basis. The Group has the discretion over the amount and timing of the distribution of these surpluses to policyholders. All DPF liabilities including unallocated surpluses, both guaranteed and discretionary, at annually are held within insurance or investment contract liabilities as appropriate.
5.7 Unearned Premium Reserve
Unearned premium reserve represents the portion of the premium written in the year but
relating to the unexpired term of coverage. Unearned premiums are calculated on the 1/24th basis.
6. New and Amended Standards and Interpretations
6.1 New Accounting Standards IssuedButNotEffectiveasattheReporting Date
The following Sri Lanka Accounting Standard was issued by the Institute of Chartered Accountants of Sri Lanka which is not yet effective as at 31 December 2021. Accordingly, these Accounting Standard has not been applied in the preparation of the Financial Statements for the year ended 31 December 2021.
We have identified following Standard where this applies to the Group and further details are set out below:
6.1.1 SLFRS 17- Insurance Contracts
SLFRS 17-“Insurance Contracts” establishes principles for the recognition, measurement, presentation and disclosure of insurance contracts within the scope of the standard. The objective of SLFRS 17 –“Insurance Contracts” is to ensure that an entity provides relevant information that faithfully represents those contracts. This information gives a basis for users of Financial Statements to assess the effect that insurance contracts have on the entity’s financial position, financial performance and cash flows. SLFRS 17-“Insurance Contracts” is effective for annual periods beginning on or after 1 January 2023. The Group is assessing the potential impact on its Financial Statements resulting from the application of SLFRS 17-“Insurance Contracts”.
156
NOTES TO THE FINANCIAL STATEMENTS
BANK OF CEYLON | ANNUAL REPORT 2021
6.2 Amended Standards
The Institute of Chartered Accountants of Sri Lanka has made amendments to the following existing Sri Lanka Accounting Standards which are effective for annual periods beginning on or after 1 January 2022. The Group is assessing the potential impact on Financial Statements resulting from the application of following amendments.
6.2.1 Amendments to LKAS 37- “Provisions, Contingent Liabilities and Contingent Assets” : Onerous Contracts–CostsofFulfillingaContract
The amendments apply a “directly related cost approach”. The costs that relate directly to a contract to provide goods or services include both incremental costs and an allocation of costs directly related to contract activities. General and administrative costs do not relate directly to a contract and are excluded unless they are explicitly chargeable to the counterparty under the contract.
6.2.2 Amendments to LKAS 16 - “Property, Plant & Equipment”: Proceeds before Intended Use
Proceeds before Intended Use, which prohibits entities deducting from the cost of an item of property, plant and equipment, any proceeds from selling items produced while bringing that asset to the location and condition necessary for it to be capable of operating in the manner intended by management. Instead, an entity recognises the proceeds from selling such items, and the costs of producing those items, in Profit or Loss.
6.2.3 Amendments to SLFRS 3 - “Business Combinations”: Updating a reference to conceptual framework
The amendments are intended to replace a reference to the Framework for the Preparation and Presentation of Financial Statements, issued in 1989, with a reference to the Conceptual Framework for Financial Reporting issued in March 2018 without significantly changing its requirements. An exception was also added to the recognition principle of SLFRS 3 - “Business Combinations” to avoid the issue of potential ‘day 2’ gains or losses arising for liabilities and contingent liabilities that would be within the scope of LKAS 37 - “Provision Contingent Liabilities, Contingent Assets” or IFRIC 21 Levies, if incurred separately. At the same time, it was decided to clarify existing guidance in SLFRS 3 - “Business Combinations” for contingent assets that would not be affected by replacing the reference to the Framework for the Preparation and Presentation of Financial Statements.
6.2.4 Amendments to SLFRS 1- “First-time Adoption of Sri Lanka Financial Reporting Standards” – Subsidiaryasafirst-timeadopter
The amendment permits a subsidiary that elects to apply paragraph D16(a) of SLFRS 1 - “First time Adoption of Sri Lanka Accounting Standards” to measure cumulative translation differences using the amounts reported by the parent, based on the parent’s date of transition to SLFRS. This amendment is also applied to an associate or joint venture that elects to apply paragraph D16 (a) of SLFRS 1 - “First times Adoption of Sri Lanka, Financial Reporting Standards”.
6.2.5 Amendments to SLFRS 9 - “Financial Instruments” – Fees in the ‘10 per cent’ test for de-recognitionoffinancialliabilities
The amendment clarifies the fees that an entity includes when assessing whether the terms of a new or modified financial liability are substantially different from the terms of the original financial liability. These fees include only those paid or received between the borrower and the lender, including fees paid or received by either the borrower or lender on the other’s behalf. An entity applies the amendment to financial liabilities that are modified or exchanged on or after the beginning of the annual Reporting period in which the entity first applies the amendment.
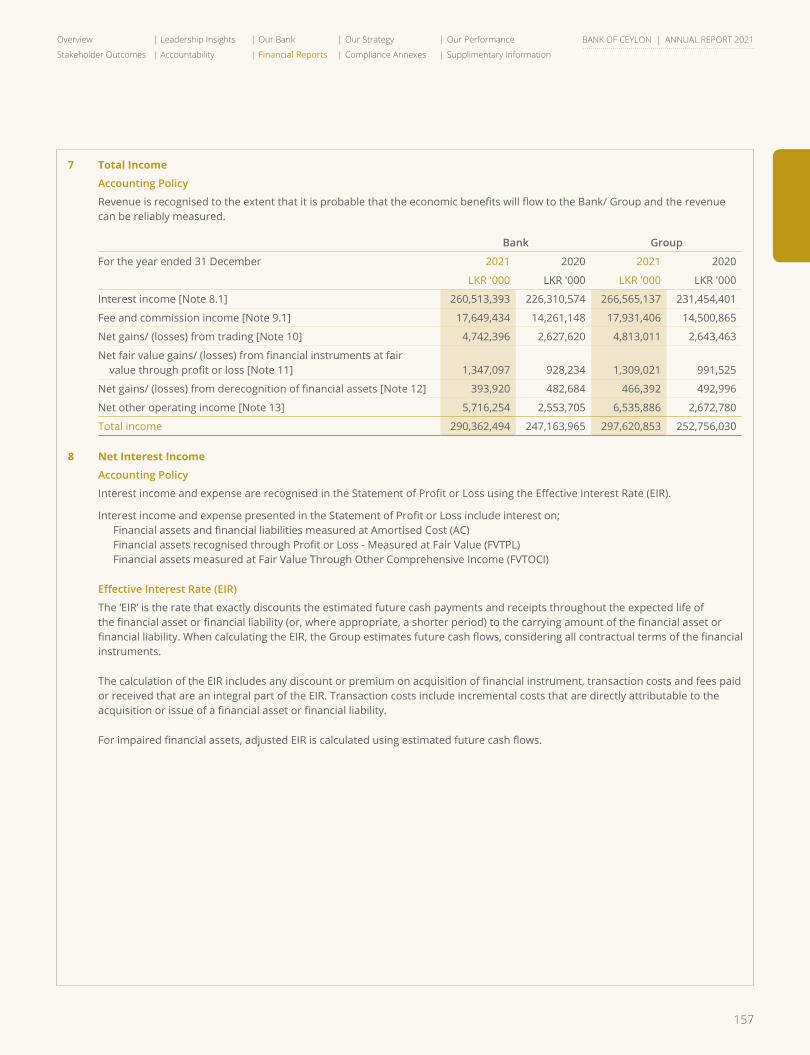
157
Overview Leadership Insights Our Bank Our Strategy Our Performance
Stakeholder Outcomes Accountability Financial Reports Compliance Annexes Supplimentary Information
BANK OF CEYLON | ANNUAL REPORT 2021
7 Total Income
Accounting Policy
Revenue is recognised to the extent that it is probable that the economic benefits will flow to the Bank/ Group and the revenue can be reliably measured.
Bank Group
For the year ended 31 December 2021 2020 2021 2020
LKR '000 LKR '000 LKR '000 LKR '000
Interest income [Note 8.1] 260,513,393 226,310,574 266,565,137 231,454,401
Fee and commission income [Note 9.1] 17,649,434 14,261,148 17,931,406 14,500,865
Net gains/ (losses) from trading [Note 10] 4,742,396 2,627,620 4,813,011 2,643,463
Net fair value gains/ (losses) from financial instruments at fair value through profit or loss [Note 11] 1,347,097 928,234 1,309,021 991,525
Net gains/ (losses) from derecognition of financial assets [Note 12] 393,920 482,684 466,392 492,996
Net other operating income [Note 13] 5,716,254 2,553,705 6,535,886 2,672,780
Total income 290,362,494 247,163,965 297,620,853 252,756,030
8 Net Interest Income
Accounting Policy
Interest income and expense are recognised in the Statement of Profit or Loss using the Effective Interest Rate (EIR).
Interest income and expense presented in the Statement of Profit or Loss include interest on; Financial assets and financial liabilities measured at Amortised Cost (AC) Financial assets recognised through Profit or Loss - Measured at Fair Value (FVTPL) Financial assets measured at Fair Value Through Other Comprehensive Income (FVTOCI)
EffectiveInterestRate(EIR)
The ‘EIR’ is the rate that exactly discounts the estimated future cash payments and receipts throughout the expected life of the financial asset or financial liability (or, where appropriate, a shorter period) to the carrying amount of the financial asset or financial liability. When calculating the EIR, the Group estimates future cash flows, considering all contractual terms of the financial instruments.
The calculation of the EIR includes any discount or premium on acquisition of financial instrument, transaction costs and fees paid or received that are an integral part of the EIR. Transaction costs include incremental costs that are directly attributable to the acquisition or issue of a financial asset or financial liability.
For impaired financial assets, adjusted EIR is calculated using estimated future cash flows.
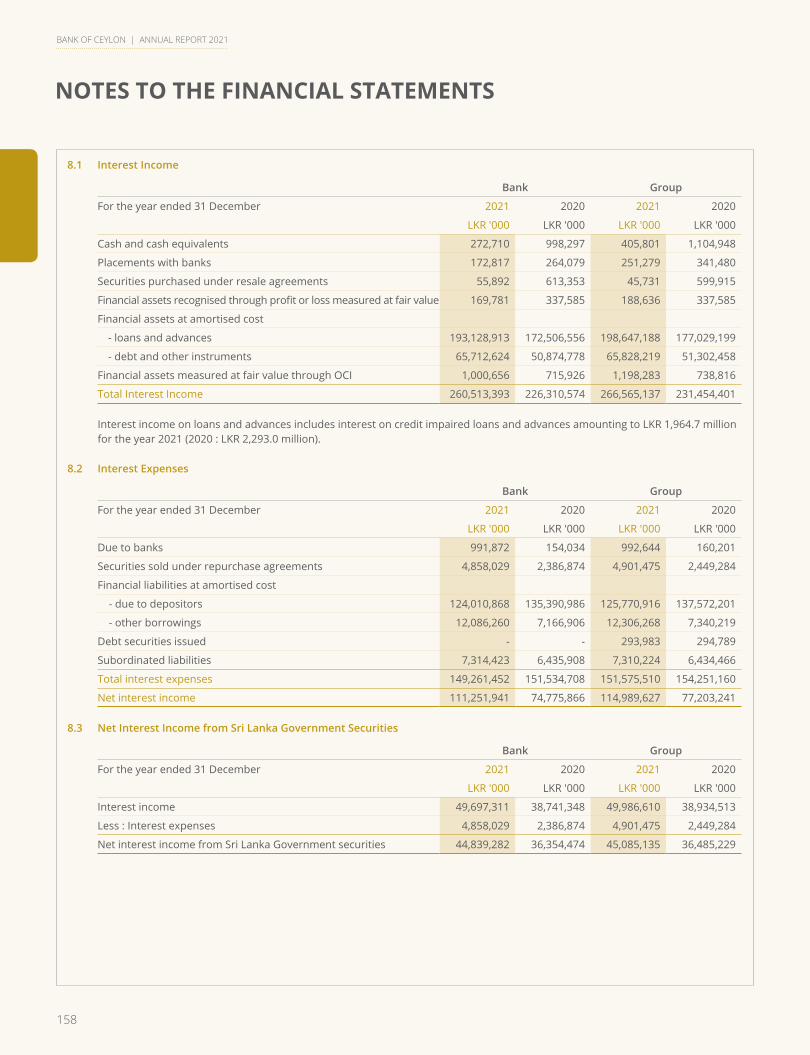
158
NOTES TO THE FINANCIAL STATEMENTS
BANK OF CEYLON | ANNUAL REPORT 2021
8.1 Interest Income
Bank Group
For the year ended 31 December 2021 2020 2021 2020
LKR '000 LKR '000 LKR '000 LKR '000
Cash and cash equivalents 272,710 998,297 405,801 1,104,948
Placements with banks 172,817 264,079 251,279 341,480
Securities purchased under resale agreements 55,892 613,353 45,731 599,915
Financial assets recognised through profit or loss measured at fair value 169,781 337,585 188,636 337,585
Financial assets at amortised cost
- loans and advances 193,128,913 172,506,556 198,647,188 177,029,199
- debt and other instruments 65,712,624 50,874,778 65,828,219 51,302,458
Financial assets measured at fair value through OCI 1,000,656 715,926 1,198,283 738,816
Total Interest Income 260,513,393 226,310,574 266,565,137 231,454,401
Interest income on loans and advances includes interest on credit impaired loans and advances amounting to LKR 1,964.7 million for the year 2021 (2020 : LKR 2,293.0 million).
8.2 Interest Expenses
Bank Group
For the year ended 31 December 2021 2020 2021 2020
LKR '000 LKR '000 LKR '000 LKR '000
Due to banks 991,872 154,034 992,644 160,201
Securities sold under repurchase agreements 4,858,029 2,386,874 4,901,475 2,449,284
Financial liabilities at amortised cost
- due to depositors 124,010,868 135,390,986 125,770,916 137,572,201
- other borrowings 12,086,260 7,166,906 12,306,268 7,340,219
Debt securities issued - - 293,983 294,789
Subordinated liabilities 7,314,423 6,435,908 7,310,224 6,434,466
Total interest expenses 149,261,452 151,534,708 151,575,510 154,251,160
Net interest income 111,251,941 74,775,866 114,989,627 77,203,241
8.3 Net Interest Income from Sri Lanka Government Securities
Bank Group
For the year ended 31 December 2021 2020 2021 2020
LKR '000 LKR '000 LKR '000 LKR '000
Interest income 49,697,311 38,741,348 49,986,610 38,934,513
Less : Interest expenses 4,858,029 2,386,874 4,901,475 2,449,284
Net interest income from Sri Lanka Government securities 44,839,282 36,354,474 45,085,135 36,485,229

159
Overview Leadership Insights Our Bank Our Strategy Our Performance
Stakeholder Outcomes Accountability Financial Reports Compliance Annexes Supplimentary Information
BANK OF CEYLON | ANNUAL REPORT 2021
9 Net Fee and Commission Income
Accounting Policy
Fee and commission income comprises with the fee and commission earned by the Group, providing diverse range of services. Those can be divided into following two main categories.
(i) Fee and commission income earned from services that are provided over a certain period of time;
Fees earned from the provision of services over a period of time are accrued over that period. These fees include commission income and private wealth and asset management fees, custody and other management and advisory fees.
(ii) Feeandcommissionincomefromprovidingtransactionservicesandearnedontheexecutionofaspecificact;
Fees and commission arising from negotiating or participating in the negotiation of a transaction for a third party, such as the arrangement/ participation or negotiation of the acquisition of shares or other securities, or the purchase or sale of businesses, are recognised on completion of the underlying transaction. Fees or components of fees that are linked to a certain performance are recognised after fulfilling the corresponding criteria.
Fees and commission expenses relating to transactions are expensed as the services are received and are recognised on an accrual basis.
9.1 Fee and Commission Income
Bank Group
For the year ended 31 December 2021 2020 2021 2020
LKR '000 LKR '000 LKR '000 LKR '000
Trade services 3,237,924 1,604,137 3,326,981 1,718,299
Debit and credit cards 5,376,831 3,783,023 5,376,831 3,783,023
Travel and remittances services 2,026,849 1,207,299 2,026,849 1,207,299
Custodial services 75,966 59,218 75,966 59,218
Retail banking services 4,789,654 5,891,181 4,928,836 5,954,065
Guarantees and related services 1,390,197 1,037,534 1,390,869 1,038,645
Other financial services 752,013 678,756 805,074 740,316
Total fee and commission income 17,649,434 14,261,148 17,931,406 14,500,865
9.2 Fee and Commission Expense
Bank Group
For the year ended 31 December 2021 2020 2021 2020
LKR '000 LKR '000 LKR '000 LKR '000
Debit and credit cards 2,927,581 1,762,276 2,927,581 1,762,276
Travel and remittances services 143,994 107,430 143,994 107,430
Retail banking services 360,347 391,934 365,774 395,979
Guarantees and related services 11,587 12,675 11,587 12,675
Other financial services 26,523 27,742 59,683 45,768
Total fee and commission Expenses 3,470,032 2,302,057 3,508,619 2,324,128
Net fee and commission income 14,179,402 11,959,091 14,422,787 12,176,737
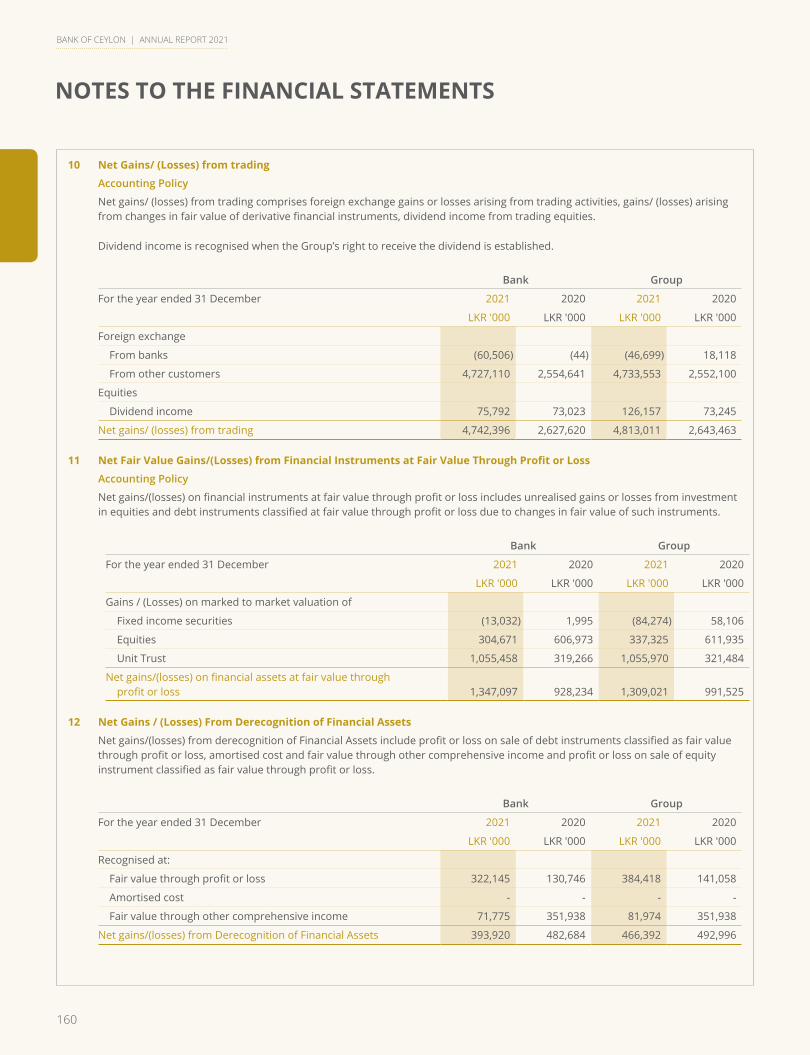
160
BANK OF CEYLON | ANNUAL REPORT 2021
NOTES TO THE FINANCIAL STATEMENTS
10 Net Gains/ (Losses) from trading
Accounting Policy
Net gains/ (losses) from trading comprises foreign exchange gains or losses arising from trading activities, gains/ (losses) arising from changes in fair value of derivative financial instruments, dividend income from trading equities.
Dividend income is recognised when the Group’s right to receive the dividend is established.
Bank Group
For the year ended 31 December 2021 2020 2021 2020
LKR '000 LKR '000 LKR '000 LKR '000
Foreign exchange
From banks (60,506) (44) (46,699) 18,118
From other customers 4,727,110 2,554,641 4,733,553 2,552,100
Equities
Dividend income 75,792 73,023 126,157 73,245
Net gains/ (losses) from trading 4,742,396 2,627,620 4,813,011 2,643,463
11 Net Fair Value Gains/(Losses) from Financial Instruments at Fair Value Through Profit or Loss
Accounting Policy
Net gains/(losses) on financial instruments at fair value through profit or loss includes unrealised gains or losses from investment in equities and debt instruments classified at fair value through profit or loss due to changes in fair value of such instruments.
Bank Group
For the year ended 31 December 2021 2020 2021 2020
LKR '000 LKR '000 LKR '000 LKR '000
Gains / (Losses) on marked to market valuation of
Fixed income securities (13,032) 1,995 (84,274) 58,106
Equities 304,671 606,973 337,325 611,935
Unit Trust 1,055,458 319,266 1,055,970 321,484
Net gains/(losses) on financial assets at fair value through profit or loss 1,347,097 928,234 1,309,021 991,525
12 Net Gains / (Losses) From Derecognition of Financial Assets
Net gains/(losses) from derecognition of Financial Assets include profit or loss on sale of debt instruments classified as fair value through profit or loss, amortised cost and fair value through other comprehensive income and profit or loss on sale of equity instrument classified as fair value through profit or loss.
Bank Group
For the year ended 31 December 2021 2020 2021 2020
LKR '000 LKR '000 LKR '000 LKR '000
Recognised at:
Fair value through profit or loss 322,145 130,746 384,418 141,058
Amortised cost - - - -
Fair value through other comprehensive income 71,775 351,938 81,974 351,938
Net gains/(losses) from Derecognition of Financial Assets 393,920 482,684 466,392 492,996
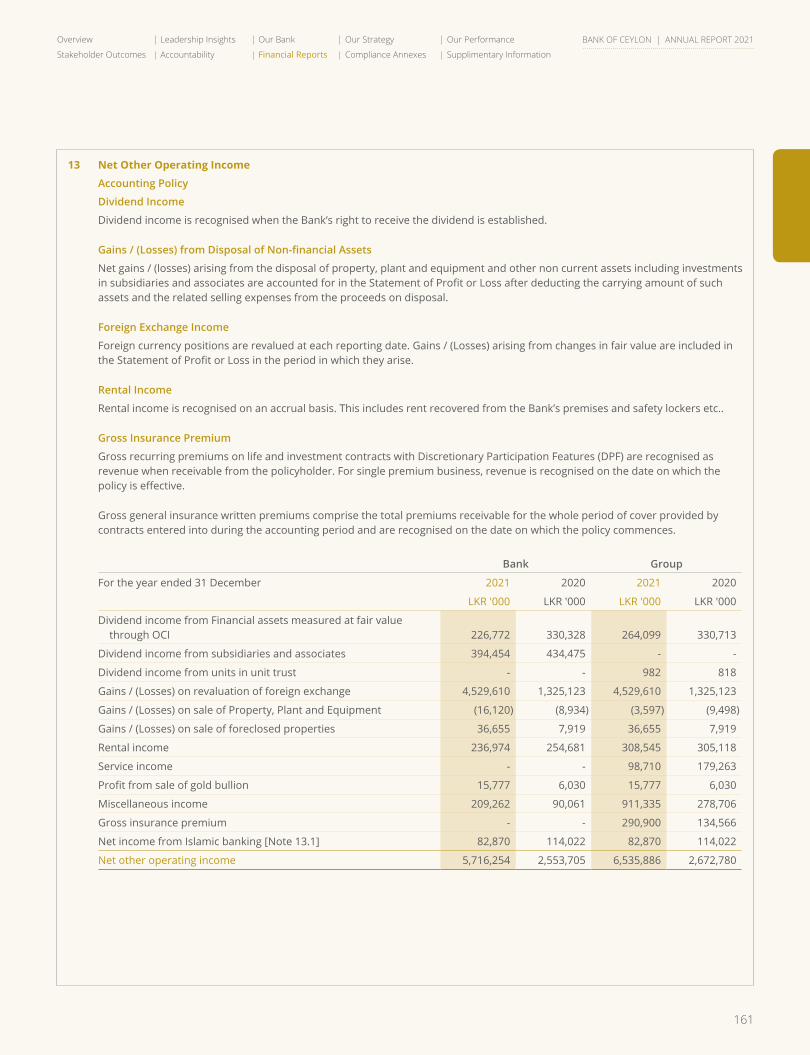
161
Overview Leadership Insights Our Bank Our Strategy Our Performance
Stakeholder Outcomes Accountability Financial Reports Compliance Annexes Supplimentary Information
BANK OF CEYLON | ANNUAL REPORT 2021
13 Net Other Operating Income
Accounting Policy
Dividend Income
Dividend income is recognised when the Bank’s right to receive the dividend is established.
Gains/(Losses)fromDisposalofNon-financialAssets
Net gains / (losses) arising from the disposal of property, plant and equipment and other non current assets including investments in subsidiaries and associates are accounted for in the Statement of Profit or Loss after deducting the carrying amount of such assets and the related selling expenses from the proceeds on disposal.
Foreign Exchange Income
Foreign currency positions are revalued at each reporting date. Gains / (Losses) arising from changes in fair value are included in the Statement of Profit or Loss in the period in which they arise.
Rental Income
Rental income is recognised on an accrual basis. This includes rent recovered from the Bank’s premises and safety lockers etc..
Gross Insurance Premium
Gross recurring premiums on life and investment contracts with Discretionary Participation Features (DPF) are recognised as revenue when receivable from the policyholder. For single premium business, revenue is recognised on the date on which the policy is effective.
Gross general insurance written premiums comprise the total premiums receivable for the whole period of cover provided by contracts entered into during the accounting period and are recognised on the date on which the policy commences.
Bank Group
For the year ended 31 December 2021 2020 2021 2020
LKR '000 LKR '000 LKR '000 LKR '000
Dividend income from Financial assets measured at fair value through OCI 226,772 330,328 264,099 330,713
Dividend income from subsidiaries and associates 394,454 434,475 - -
Dividend income from units in unit trust - - 982 818
Gains / (Losses) on revaluation of foreign exchange 4,529,610 1,325,123 4,529,610 1,325,123
Gains / (Losses) on sale of Property, Plant and Equipment (16,120) (8,934) (3,597) (9,498)
Gains / (Losses) on sale of foreclosed properties 36,655 7,919 36,655 7,919
Rental income 236,974 254,681 308,545 305,118
Service income - - 98,710 179,263
Profit from sale of gold bullion 15,777 6,030 15,777 6,030
Miscellaneous income 209,262 90,061 911,335 278,706
Gross insurance premium - - 290,900 134,566
Net income from Islamic banking [Note 13.1] 82,870 114,022 82,870 114,022
Net other operating income 5,716,254 2,553,705 6,535,886 2,672,780
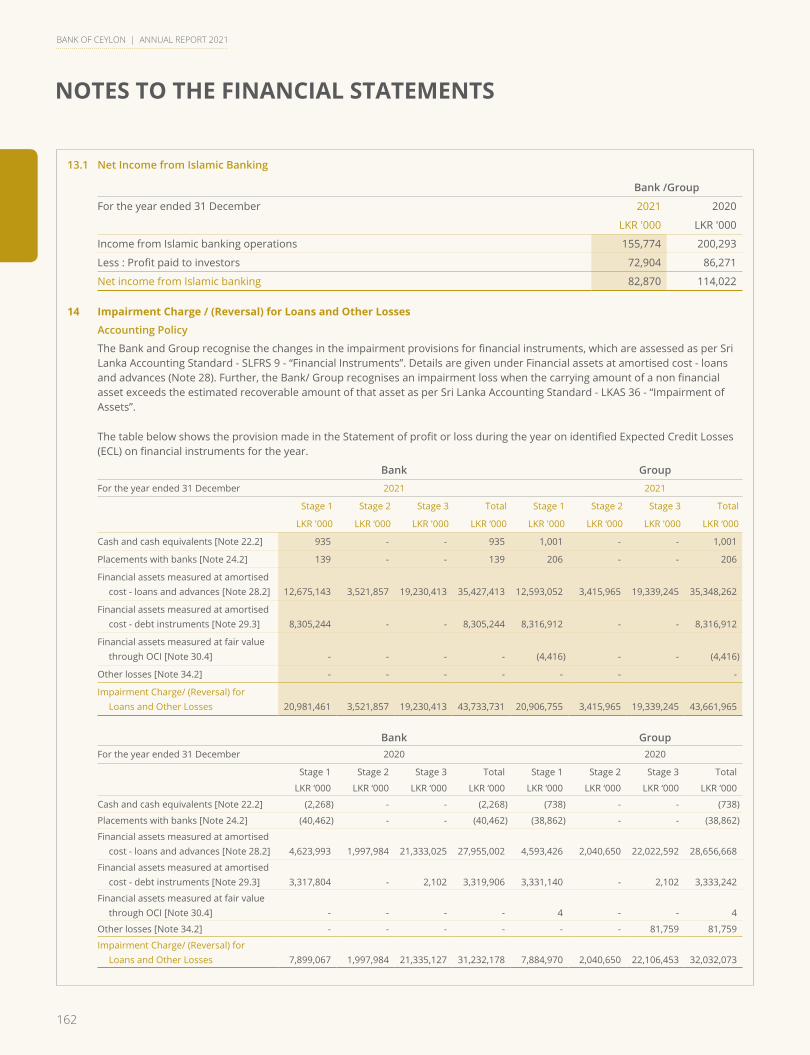
162
NOTES TO THE FINANCIAL STATEMENTS
BANK OF CEYLON | ANNUAL REPORT 2021
13.1 Net Income from Islamic Banking
Bank /Group
For the year ended 31 December 2021 2020
LKR '000 LKR '000
Income from Islamic banking operations 155,774 200,293
Less : Profit paid to investors 72,904 86,271
Net income from Islamic banking 82,870 114,022
14 Impairment Charge / (Reversal) for Loans and Other Losses
Accounting Policy
The Bank and Group recognise the changes in the impairment provisions for financial instruments, which are assessed as per Sri Lanka Accounting Standard - SLFRS 9 - “Financial Instruments”. Details are given under Financial assets at amortised cost - loans and advances (Note 28). Further, the Bank/ Group recognises an impairment loss when the carrying amount of a non financial asset exceeds the estimated recoverable amount of that asset as per Sri Lanka Accounting Standard - LKAS 36 - “Impairment of Assets”.
The table below shows the provision made in the Statement of profit or loss during the year on identified Expected Credit Losses (ECL) on financial instruments for the year.
Bank Group
For the year ended 31 December 2021 2021
Stage 1 Stage 2 Stage 3 Total Stage 1 Stage 2 Stage 3 Total
LKR '000 LKR ‘000 LKR '000 LKR ‘000 LKR '000 LKR ‘000 LKR '000 LKR ‘000
Cash and cash equivalents [Note 22.2] 935 - - 935 1,001 - - 1,001
Placements with banks [Note 24.2] 139 - - 139 206 - - 206
Financial assets measured at amortised cost - loans and advances [Note 28.2] 12,675,143 3,521,857 19,230,413 35,427,413 12,593,052 3,415,965 19,339,245 35,348,262
Financial assets measured at amortised cost - debt instruments [Note 29.3] 8,305,244 - - 8,305,244 8,316,912 - - 8,316,912
Financial assets measured at fair value through OCI [Note 30.4] - - - - (4,416) - - (4,416)
Other losses [Note 34.2] - - - - - - -
Impairment Charge/ (Reversal) for Loans and Other Losses 20,981,461 3,521,857 19,230,413 43,733,731 20,906,755 3,415,965 19,339,245 43,661,965
Bank GroupFor the year ended 31 December 2020 2020
Stage 1 Stage 2 Stage 3 Total Stage 1 Stage 2 Stage 3 Total
LKR ‘000 LKR ‘000 LKR ‘000 LKR ‘000 LKR ‘000 LKR ‘000 LKR ‘000 LKR ‘000
Cash and cash equivalents [Note 22.2] (2,268) - - (2,268) (738) - - (738)
Placements with banks [Note 24.2] (40,462) - - (40,462) (38,862) - - (38,862)
Financial assets measured at amortised cost - loans and advances [Note 28.2] 4,623,993 1,997,984 21,333,025 27,955,002 4,593,426 2,040,650 22,022,592 28,656,668
Financial assets measured at amortised cost - debt instruments [Note 29.3] 3,317,804 - 2,102 3,319,906 3,331,140 - 2,102 3,333,242
Financial assets measured at fair value through OCI [Note 30.4] - - - - 4 - - 4
Other losses [Note 34.2] - - - - - - 81,759 81,759
Impairment Charge/ (Reversal) for Loans and Other Losses 7,899,067 1,997,984 21,335,127 31,232,178 7,884,970 2,040,650 22,106,453 32,032,073
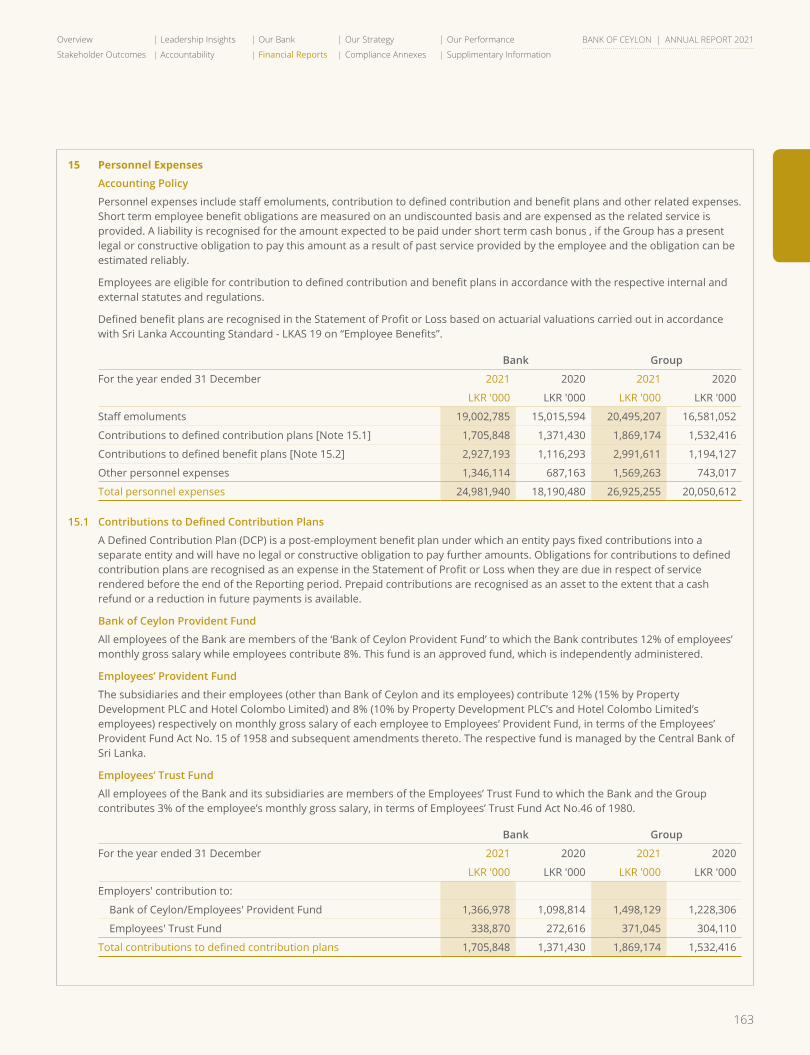
163
Overview Leadership Insights Our Bank Our Strategy Our Performance
Stakeholder Outcomes Accountability Financial Reports Compliance Annexes Supplimentary Information
BANK OF CEYLON | ANNUAL REPORT 2021
15 Personnel Expenses
Accounting Policy
Personnel expenses include staff emoluments, contribution to defined contribution and benefit plans and other related expenses. Short term employee benefit obligations are measured on an undiscounted basis and are expensed as the related service is provided. A liability is recognised for the amount expected to be paid under short term cash bonus , if the Group has a present legal or constructive obligation to pay this amount as a result of past service provided by the employee and the obligation can be estimated reliably.
Employees are eligible for contribution to defined contribution and benefit plans in accordance with the respective internal and external statutes and regulations.
Defined benefit plans are recognised in the Statement of Profit or Loss based on actuarial valuations carried out in accordance with Sri Lanka Accounting Standard - LKAS 19 on “Employee Benefits”.
Bank Group
For the year ended 31 December 2021 2020 2021 2020
LKR '000 LKR '000 LKR '000 LKR '000
Staff emoluments 19,002,785 15,015,594 20,495,207 16,581,052
Contributions to defined contribution plans [Note 15.1] 1,705,848 1,371,430 1,869,174 1,532,416
Contributions to defined benefit plans [Note 15.2] 2,927,193 1,116,293 2,991,611 1,194,127
Other personnel expenses 1,346,114 687,163 1,569,263 743,017
Total personnel expenses 24,981,940 18,190,480 26,925,255 20,050,612
15.1 ContributionstoDefinedContributionPlans
A Defined Contribution Plan (DCP) is a post-employment benefit plan under which an entity pays fixed contributions into a separate entity and will have no legal or constructive obligation to pay further amounts. Obligations for contributions to defined contribution plans are recognised as an expense in the Statement of Profit or Loss when they are due in respect of service rendered before the end of the Reporting period. Prepaid contributions are recognised as an asset to the extent that a cash refund or a reduction in future payments is available.
Bank of Ceylon Provident Fund
All employees of the Bank are members of the ‘Bank of Ceylon Provident Fund’ to which the Bank contributes 12% of employees’ monthly gross salary while employees contribute 8%. This fund is an approved fund, which is independently administered.
Employees’ Provident Fund
The subsidiaries and their employees (other than Bank of Ceylon and its employees) contribute 12% (15% by Property Development PLC and Hotel Colombo Limited) and 8% (10% by Property Development PLC’s and Hotel Colombo Limited’s employees) respectively on monthly gross salary of each employee to Employees’ Provident Fund, in terms of the Employees’ Provident Fund Act No. 15 of 1958 and subsequent amendments thereto. The respective fund is managed by the Central Bank of Sri Lanka.
Employees’ Trust Fund
All employees of the Bank and its subsidiaries are members of the Employees’ Trust Fund to which the Bank and the Group contributes 3% of the employee’s monthly gross salary, in terms of Employees’ Trust Fund Act No.46 of 1980.
Bank Group
For the year ended 31 December 2021 2020 2021 2020
LKR '000 LKR '000 LKR '000 LKR '000
Employers' contribution to:
Bank of Ceylon/Employees' Provident Fund 1,366,978 1,098,814 1,498,129 1,228,306
Employees' Trust Fund 338,870 272,616 371,045 304,110
Total contributions to defined contribution plans 1,705,848 1,371,430 1,869,174 1,532,416
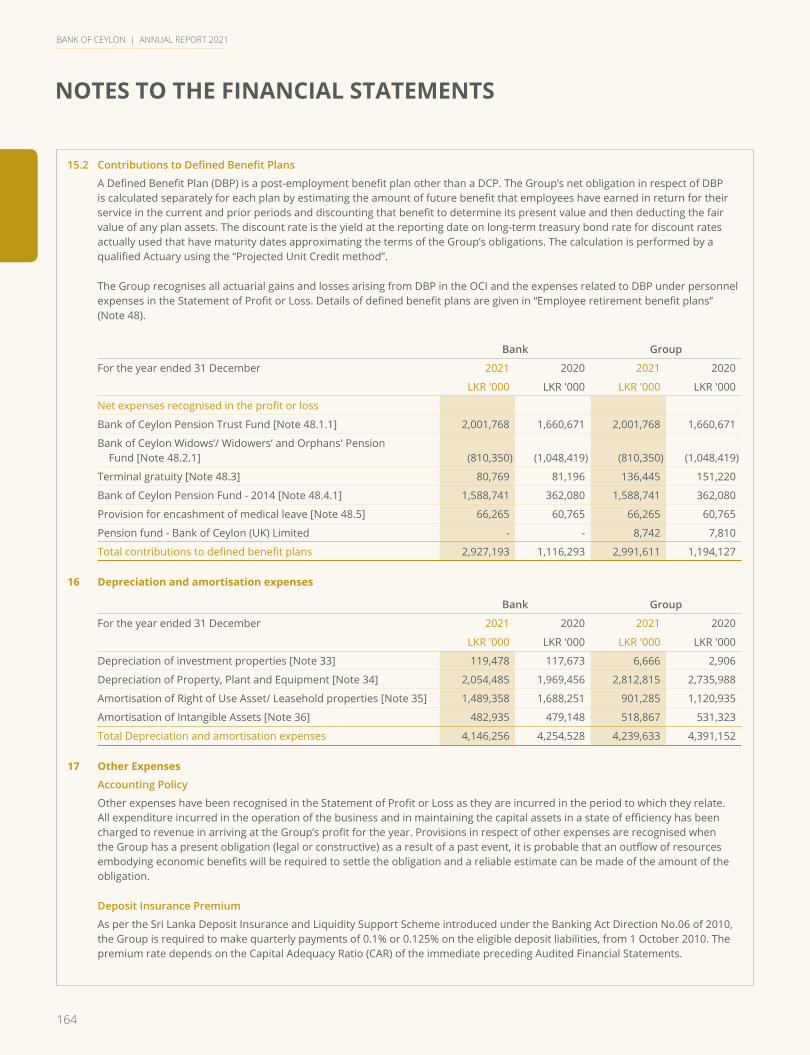
164
NOTES TO THE FINANCIAL STATEMENTS
BANK OF CEYLON | ANNUAL REPORT 2021
15.2 ContributionstoDefinedBenefitPlans
A Defined Benefit Plan (DBP) is a post-employment benefit plan other than a DCP. The Group’s net obligation in respect of DBP is calculated separately for each plan by estimating the amount of future benefit that employees have earned in return for their service in the current and prior periods and discounting that benefit to determine its present value and then deducting the fair value of any plan assets. The discount rate is the yield at the reporting date on long-term treasury bond rate for discount rates actually used that have maturity dates approximating the terms of the Group’s obligations. The calculation is performed by a qualified Actuary using the “Projected Unit Credit method”.
The Group recognises all actuarial gains and losses arising from DBP in the OCI and the expenses related to DBP under personnel expenses in the Statement of Profit or Loss. Details of defined benefit plans are given in “Employee retirement benefit plans” (Note 48).
Bank Group
For the year ended 31 December 2021 2020 2021 2020
LKR '000 LKR '000 LKR '000 LKR '000
Net expenses recognised in the profit or loss
Bank of Ceylon Pension Trust Fund [Note 48.1.1] 2,001,768 1,660,671 2,001,768 1,660,671
Bank of Ceylon Widows’/ Widowers’ and Orphans' Pension Fund [Note 48.2.1] (810,350) (1,048,419) (810,350) (1,048,419)
Terminal gratuity [Note 48.3] 80,769 81,196 136,445 151,220
Bank of Ceylon Pension Fund - 2014 [Note 48.4.1] 1,588,741 362,080 1,588,741 362,080
Provision for encashment of medical leave [Note 48.5] 66,265 60,765 66,265 60,765
Pension fund - Bank of Ceylon (UK) Limited - - 8,742 7,810
Total contributions to defined benefit plans 2,927,193 1,116,293 2,991,611 1,194,127
16 Depreciation and amortisation expenses
Bank Group
For the year ended 31 December 2021 2020 2021 2020
LKR '000 LKR '000 LKR '000 LKR '000
Depreciation of investment properties [Note 33] 119,478 117,673 6,666 2,906
Depreciation of Property, Plant and Equipment [Note 34] 2,054,485 1,969,456 2,812,815 2,735,988
Amortisation of Right of Use Asset/ Leasehold properties [Note 35] 1,489,358 1,688,251 901,285 1,120,935
Amortisation of Intangible Assets [Note 36] 482,935 479,148 518,867 531,323
Total Depreciation and amortisation expenses 4,146,256 4,254,528 4,239,633 4,391,152
17 Other Expenses
Accounting Policy
Other expenses have been recognised in the Statement of Profit or Loss as they are incurred in the period to which they relate. All expenditure incurred in the operation of the business and in maintaining the capital assets in a state of efficiency has been charged to revenue in arriving at the Group’s profit for the year. Provisions in respect of other expenses are recognised when the Group has a present obligation (legal or constructive) as a result of a past event, it is probable that an outflow of resources embodying economic benefits will be required to settle the obligation and a reliable estimate can be made of the amount of the obligation.
Deposit Insurance Premium
As per the Sri Lanka Deposit Insurance and Liquidity Support Scheme introduced under the Banking Act Direction No.06 of 2010, the Group is required to make quarterly payments of 0.1% or 0.125% on the eligible deposit liabilities, from 1 October 2010. The premium rate depends on the Capital Adequacy Ratio (CAR) of the immediate preceding Audited Financial Statements.
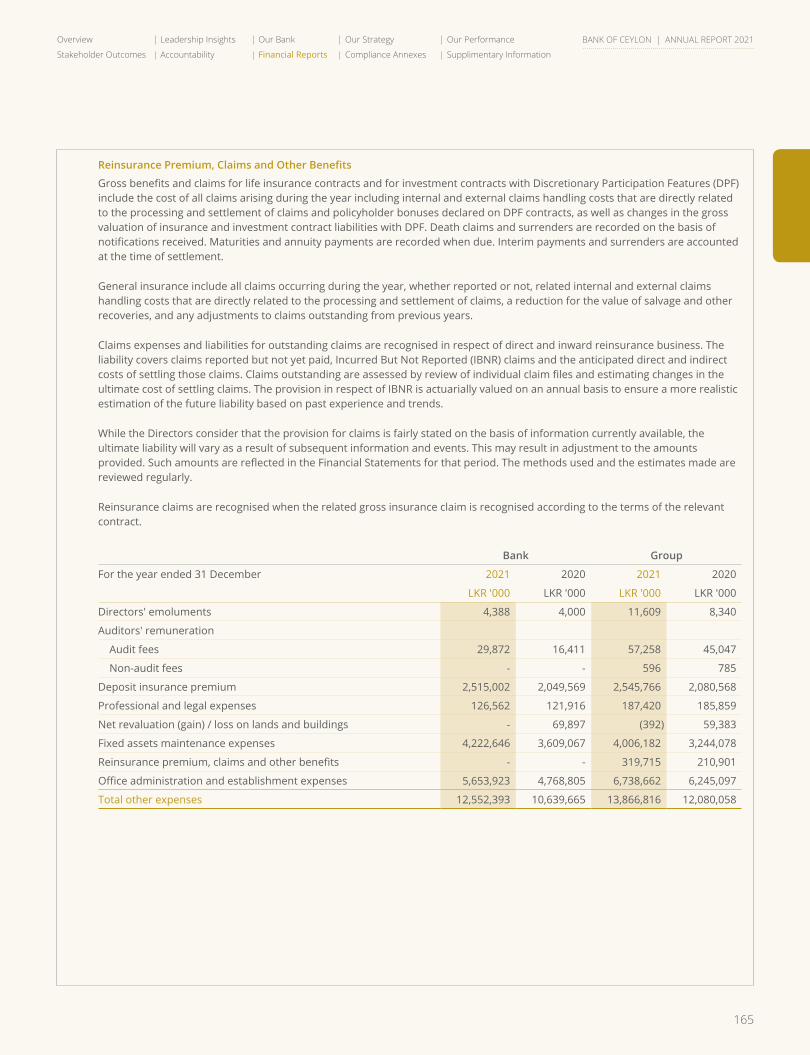
165
Overview Leadership Insights Our Bank Our Strategy Our Performance
Stakeholder Outcomes Accountability Financial Reports Compliance Annexes Supplimentary Information
BANK OF CEYLON | ANNUAL REPORT 2021
ReinsurancePremium,ClaimsandOtherBenefits
Gross benefits and claims for life insurance contracts and for investment contracts with Discretionary Participation Features (DPF) include the cost of all claims arising during the year including internal and external claims handling costs that are directly related to the processing and settlement of claims and policyholder bonuses declared on DPF contracts, as well as changes in the gross valuation of insurance and investment contract liabilities with DPF. Death claims and surrenders are recorded on the basis of notifications received. Maturities and annuity payments are recorded when due. Interim payments and surrenders are accounted at the time of settlement.
General insurance include all claims occurring during the year, whether reported or not, related internal and external claims handling costs that are directly related to the processing and settlement of claims, a reduction for the value of salvage and other recoveries, and any adjustments to claims outstanding from previous years.
Claims expenses and liabilities for outstanding claims are recognised in respect of direct and inward reinsurance business. The liability covers claims reported but not yet paid, Incurred But Not Reported (IBNR) claims and the anticipated direct and indirect costs of settling those claims. Claims outstanding are assessed by review of individual claim files and estimating changes in the ultimate cost of settling claims. The provision in respect of IBNR is actuarially valued on an annual basis to ensure a more realistic estimation of the future liability based on past experience and trends.
While the Directors consider that the provision for claims is fairly stated on the basis of information currently available, the ultimate liability will vary as a result of subsequent information and events. This may result in adjustment to the amounts provided. Such amounts are reflected in the Financial Statements for that period. The methods used and the estimates made are reviewed regularly.
Reinsurance claims are recognised when the related gross insurance claim is recognised according to the terms of the relevant contract.
Bank Group
For the year ended 31 December 2021 2020 2021 2020
LKR '000 LKR '000 LKR '000 LKR '000
Directors' emoluments 4,388 4,000 11,609 8,340
Auditors' remuneration
Audit fees 29,872 16,411 57,258 45,047
Non-audit fees - - 596 785
Deposit insurance premium 2,515,002 2,049,569 2,545,766 2,080,568
Professional and legal expenses 126,562 121,916 187,420 185,859
Net revaluation (gain) / loss on lands and buildings - 69,897 (392) 59,383
Fixed assets maintenance expenses 4,222,646 3,609,067 4,006,182 3,244,078
Reinsurance premium, claims and other benefits - - 319,715 210,901
Office administration and establishment expenses 5,653,923 4,768,805 6,738,662 6,245,097
Total other expenses 12,552,393 10,639,665 13,866,816 12,080,058
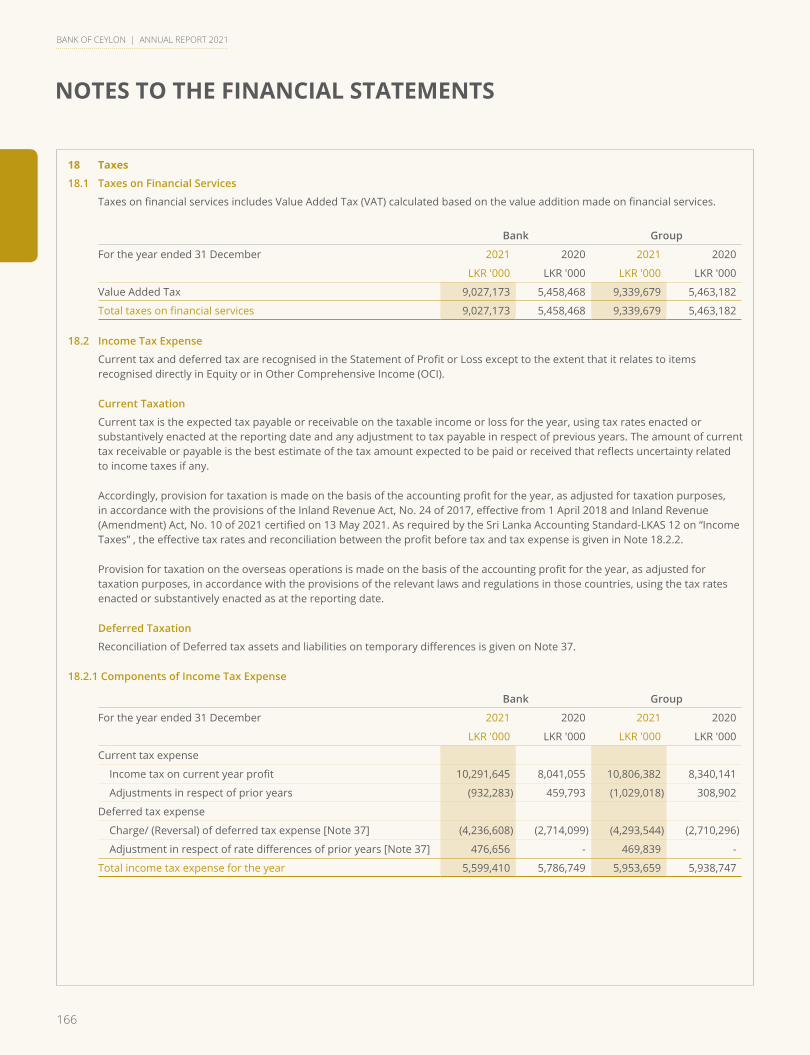
166
NOTES TO THE FINANCIAL STATEMENTS
BANK OF CEYLON | ANNUAL REPORT 2021
18 Taxes
18.1 Taxes on Financial Services
Taxes on financial services includes Value Added Tax (VAT) calculated based on the value addition made on financial services.
Bank Group
For the year ended 31 December 2021 2020 2021 2020
LKR '000 LKR '000 LKR '000 LKR '000
Value Added Tax 9,027,173 5,458,468 9,339,679 5,463,182
Total taxes on financial services 9,027,173 5,458,468 9,339,679 5,463,182
18.2 Income Tax Expense
Current tax and deferred tax are recognised in the Statement of Profit or Loss except to the extent that it relates to items recognised directly in Equity or in Other Comprehensive Income (OCI).
Current Taxation
Current tax is the expected tax payable or receivable on the taxable income or loss for the year, using tax rates enacted or substantively enacted at the reporting date and any adjustment to tax payable in respect of previous years. The amount of current tax receivable or payable is the best estimate of the tax amount expected to be paid or received that reflects uncertainty related to income taxes if any.
Accordingly, provision for taxation is made on the basis of the accounting profit for the year, as adjusted for taxation purposes, in accordance with the provisions of the Inland Revenue Act, No. 24 of 2017, effective from 1 April 2018 and Inland Revenue (Amendment) Act, No. 10 of 2021 certified on 13 May 2021. As required by the Sri Lanka Accounting Standard-LKAS 12 on “Income Taxes” , the effective tax rates and reconciliation between the profit before tax and tax expense is given in Note 18.2.2.
Provision for taxation on the overseas operations is made on the basis of the accounting profit for the year, as adjusted for taxation purposes, in accordance with the provisions of the relevant laws and regulations in those countries, using the tax rates enacted or substantively enacted as at the reporting date.
Deferred Taxation
Reconciliation of Deferred tax assets and liabilities on temporary differences is given on Note 37.
18.2.1 Components of Income Tax Expense
Bank Group
For the year ended 31 December 2021 2020 2021 2020
LKR '000 LKR '000 LKR '000 LKR '000
Current tax expense
Income tax on current year profit 10,291,645 8,041,055 10,806,382 8,340,141
Adjustments in respect of prior years (932,283) 459,793 (1,029,018) 308,902
Deferred tax expense
Charge/ (Reversal) of deferred tax expense [Note 37] (4,236,608) (2,714,099) (4,293,544) (2,710,296)
Adjustment in respect of rate differences of prior years [Note 37] 476,656 - 469,839 -
Total income tax expense for the year 5,599,410 5,786,749 5,953,659 5,938,747
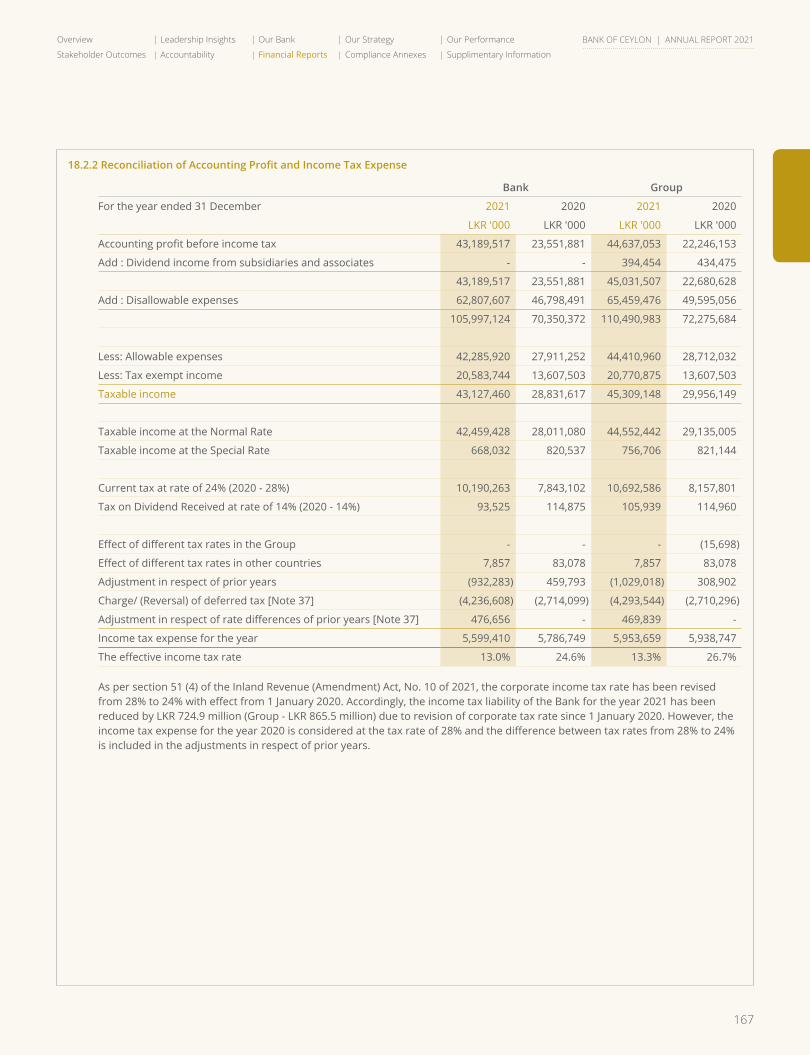
167
Overview Leadership Insights Our Bank Our Strategy Our Performance
Stakeholder Outcomes Accountability Financial Reports Compliance Annexes Supplimentary Information
BANK OF CEYLON | ANNUAL REPORT 2021
18.2.2ReconciliationofAccountingProfitandIncomeTaxExpense
Bank Group
For the year ended 31 December 2021 2020 2021 2020
LKR '000 LKR '000 LKR '000 LKR '000
Accounting profit before income tax 43,189,517 23,551,881 44,637,053 22,246,153
Add : Dividend income from subsidiaries and associates - - 394,454 434,475
43,189,517 23,551,881 45,031,507 22,680,628
Add : Disallowable expenses 62,807,607 46,798,491 65,459,476 49,595,056
105,997,124 70,350,372 110,490,983 72,275,684
Less: Allowable expenses 42,285,920 27,911,252 44,410,960 28,712,032
Less: Tax exempt income 20,583,744 13,607,503 20,770,875 13,607,503
Taxable income 43,127,460 28,831,617 45,309,148 29,956,149
Taxable income at the Normal Rate 42,459,428 28,011,080 44,552,442 29,135,005
Taxable income at the Special Rate 668,032 820,537 756,706 821,144
Current tax at rate of 24% (2020 - 28%) 10,190,263 7,843,102 10,692,586 8,157,801
Tax on Dividend Received at rate of 14% (2020 - 14%) 93,525 114,875 105,939 114,960
Effect of different tax rates in the Group - - - (15,698)
Effect of different tax rates in other countries 7,857 83,078 7,857 83,078
Adjustment in respect of prior years (932,283) 459,793 (1,029,018) 308,902
Charge/ (Reversal) of deferred tax [Note 37] (4,236,608) (2,714,099) (4,293,544) (2,710,296)
Adjustment in respect of rate differences of prior years [Note 37] 476,656 - 469,839 -
Income tax expense for the year 5,599,410 5,786,749 5,953,659 5,938,747
The effective income tax rate 13.0% 24.6% 13.3% 26.7%
As per section 51 (4) of the Inland Revenue (Amendment) Act, No. 10 of 2021, the corporate income tax rate has been revised from 28% to 24% with effect from 1 January 2020. Accordingly, the income tax liability of the Bank for the year 2021 has been reduced by LKR 724.9 million (Group - LKR 865.5 million) due to revision of corporate tax rate since 1 January 2020. However, the income tax expense for the year 2020 is considered at the tax rate of 28% and the difference between tax rates from 28% to 24% is included in the adjustments in respect of prior years.
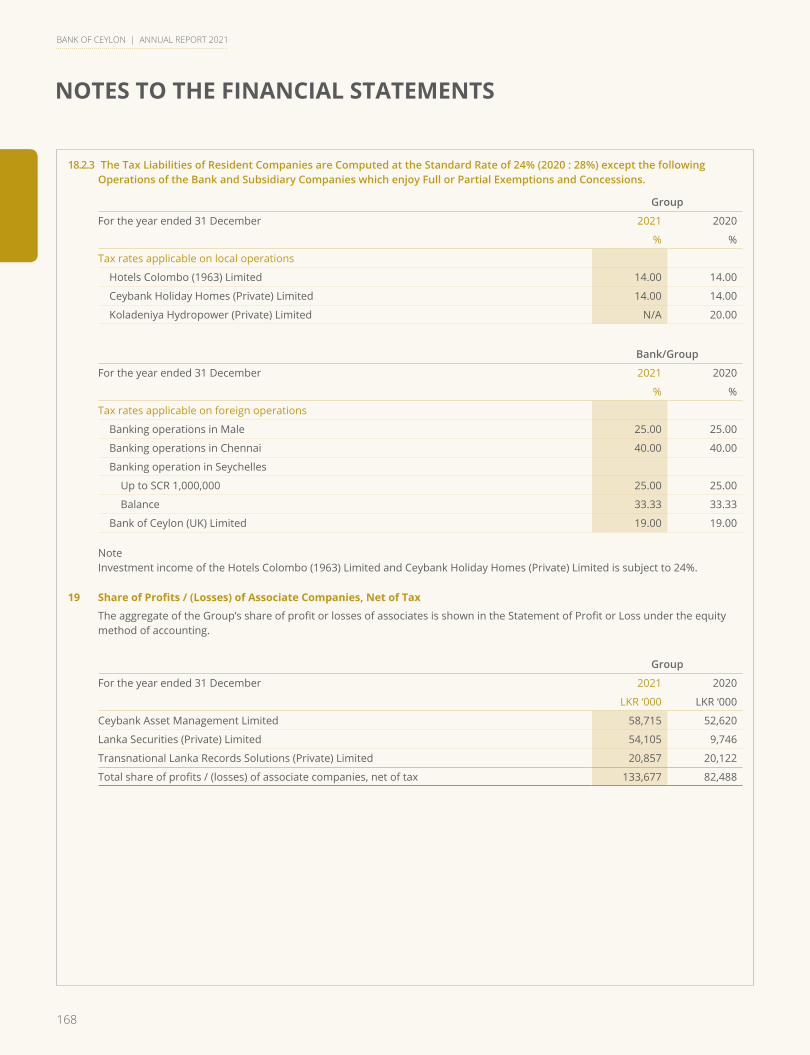
168
NOTES TO THE FINANCIAL STATEMENTS
BANK OF CEYLON | ANNUAL REPORT 2021
18.2.3 The Tax Liabilities of Resident Companies are Computed at the Standard Rate of 24% (2020 : 28%) except the following Operations of the Bank and Subsidiary Companies which enjoy Full or Partial Exemptions and Concessions.
Group
For the year ended 31 December 2021 2020
% %
Tax rates applicable on local operations
Hotels Colombo (1963) Limited 14.00 14.00
Ceybank Holiday Homes (Private) Limited 14.00 14.00
Koladeniya Hydropower (Private) Limited N/A 20.00
Bank/Group
For the year ended 31 December 2021 2020
% %
Tax rates applicable on foreign operations
Banking operations in Male 25.00 25.00
Banking operations in Chennai 40.00 40.00
Banking operation in Seychelles
Up to SCR 1,000,000 25.00 25.00
Balance 33.33 33.33
Bank of Ceylon (UK) Limited 19.00 19.00
Note Investment income of the Hotels Colombo (1963) Limited and Ceybank Holiday Homes (Private) Limited is subject to 24%.
19 Share of Profits / (Losses) of Associate Companies, Net of Tax
The aggregate of the Group’s share of profit or losses of associates is shown in the Statement of Profit or Loss under the equity method of accounting.
Group
For the year ended 31 December 2021 2020
LKR ‘000 LKR ‘000
Ceybank Asset Management Limited 58,715 52,620
Lanka Securities (Private) Limited 54,105 9,746
Transnational Lanka Records Solutions (Private) Limited 20,857 20,122
Total share of profits / (losses) of associate companies, net of tax 133,677 82,488
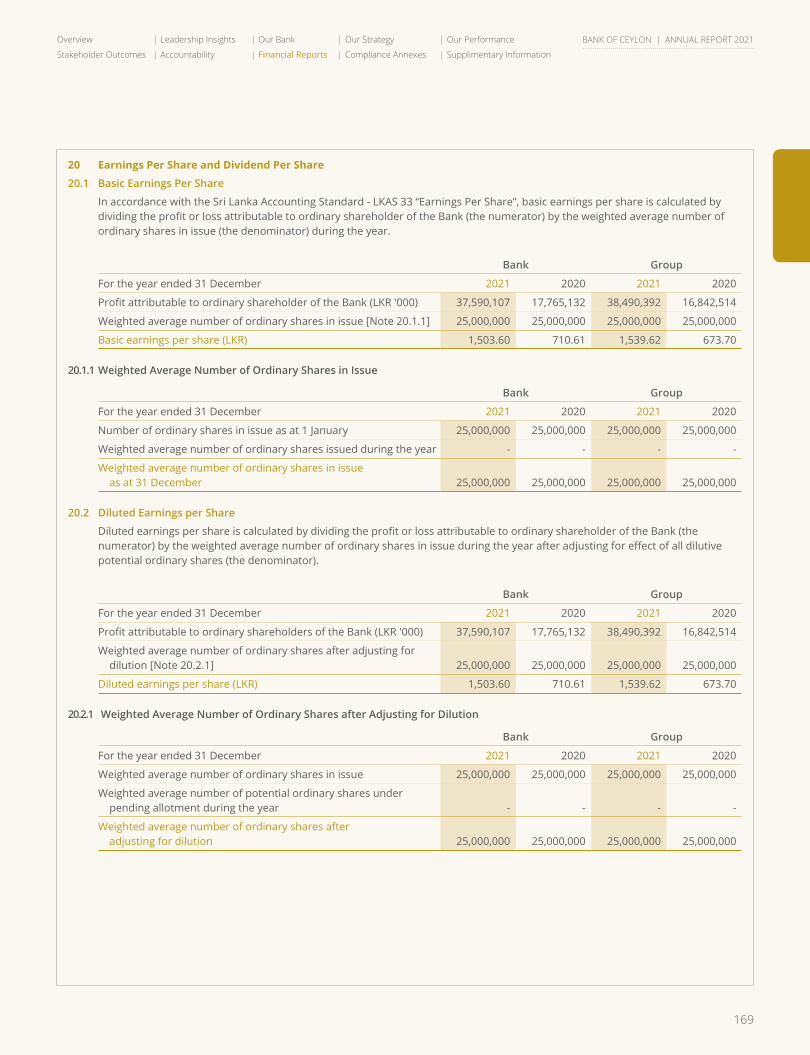
169
Overview Leadership Insights Our Bank Our Strategy Our Performance
Stakeholder Outcomes Accountability Financial Reports Compliance Annexes Supplimentary Information
BANK OF CEYLON | ANNUAL REPORT 2021
20 Earnings Per Share and Dividend Per Share
20.1 Basic Earnings Per Share
In accordance with the Sri Lanka Accounting Standard - LKAS 33 “Earnings Per Share”, basic earnings per share is calculated by dividing the profit or loss attributable to ordinary shareholder of the Bank (the numerator) by the weighted average number of ordinary shares in issue (the denominator) during the year.
Bank Group
For the year ended 31 December 2021 2020 2021 2020
Profit attributable to ordinary shareholder of the Bank (LKR '000) 37,590,107 17,765,132 38,490,392 16,842,514
Weighted average number of ordinary shares in issue [Note 20.1.1] 25,000,000 25,000,000 25,000,000 25,000,000
Basic earnings per share (LKR) 1,503.60 710.61 1,539.62 673.70
20.1.1 Weighted Average Number of Ordinary Shares in Issue
Bank Group
For the year ended 31 December 2021 2020 2021 2020
Number of ordinary shares in issue as at 1 January 25,000,000 25,000,000 25,000,000 25,000,000
Weighted average number of ordinary shares issued during the year - - - -
Weighted average number of ordinary shares in issue as at 31 December 25,000,000 25,000,000 25,000,000 25,000,000
20.2 Diluted Earnings per Share
Diluted earnings per share is calculated by dividing the profit or loss attributable to ordinary shareholder of the Bank (the numerator) by the weighted average number of ordinary shares in issue during the year after adjusting for effect of all dilutive potential ordinary shares (the denominator).
Bank Group
For the year ended 31 December 2021 2020 2021 2020
Profit attributable to ordinary shareholders of the Bank (LKR '000) 37,590,107 17,765,132 38,490,392 16,842,514
Weighted average number of ordinary shares after adjusting for dilution [Note 20.2.1] 25,000,000 25,000,000 25,000,000 25,000,000
Diluted earnings per share (LKR) 1,503.60 710.61 1,539.62 673.70
20.2.1 Weighted Average Number of Ordinary Shares after Adjusting for Dilution
Bank Group
For the year ended 31 December 2021 2020 2021 2020
Weighted average number of ordinary shares in issue 25,000,000 25,000,000 25,000,000 25,000,000
Weighted average number of potential ordinary shares under pending allotment during the year - - - -
Weighted average number of ordinary shares after adjusting for dilution 25,000,000 25,000,000 25,000,000 25,000,000
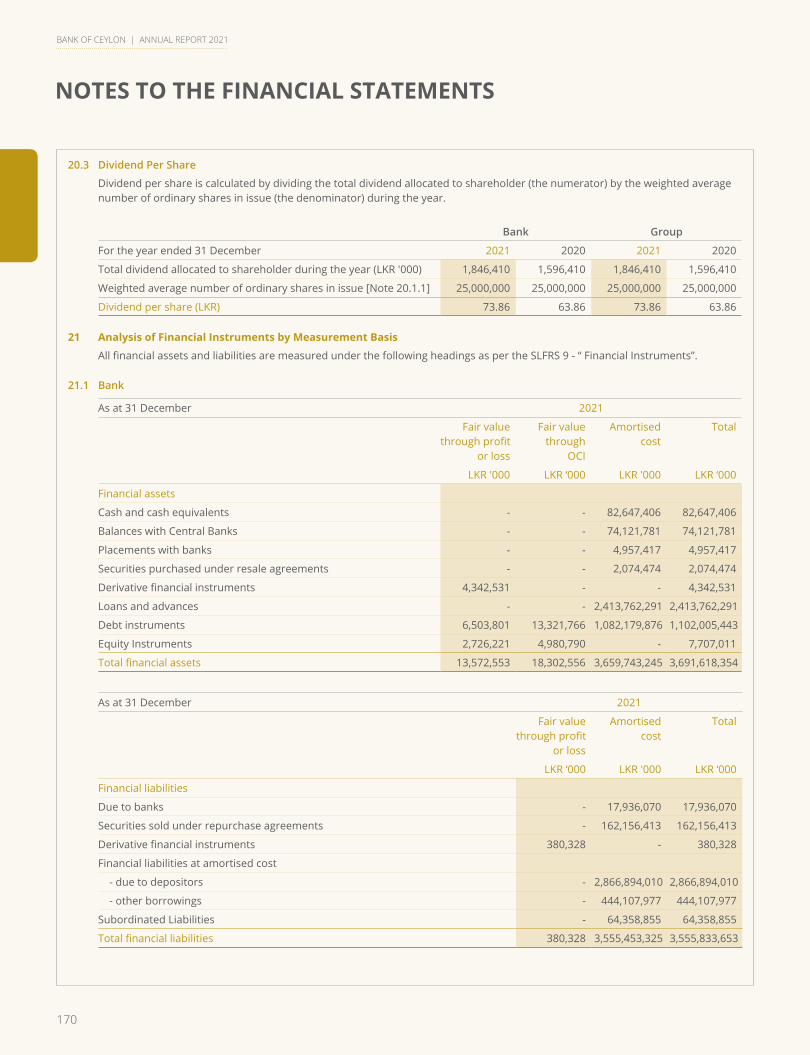
170
NOTES TO THE FINANCIAL STATEMENTS
BANK OF CEYLON | ANNUAL REPORT 2021
20.3 Dividend Per Share
Dividend per share is calculated by dividing the total dividend allocated to shareholder (the numerator) by the weighted average number of ordinary shares in issue (the denominator) during the year.
Bank Group
For the year ended 31 December 2021 2020 2021 2020
Total dividend allocated to shareholder during the year (LKR '000) 1,846,410 1,596,410 1,846,410 1,596,410
Weighted average number of ordinary shares in issue [Note 20.1.1] 25,000,000 25,000,000 25,000,000 25,000,000
Dividend per share (LKR) 73.86 63.86 73.86 63.86
21 Analysis of Financial Instruments by Measurement Basis
All financial assets and liabilities are measured under the following headings as per the SLFRS 9 - “ Financial Instruments”.
21.1 Bank
As at 31 December 2021
Fair value through profit
or loss
Fair value through
OCI
Amortised cost
Total
LKR '000 LKR ‘000 LKR '000 LKR ‘000
Financial assets
Cash and cash equivalents - - 82,647,406 82,647,406
Balances with Central Banks - - 74,121,781 74,121,781
Placements with banks - - 4,957,417 4,957,417
Securities purchased under resale agreements - - 2,074,474 2,074,474
Derivative financial instruments 4,342,531 - - 4,342,531
Loans and advances - - 2,413,762,291 2,413,762,291
Debt instruments 6,503,801 13,321,766 1,082,179,876 1,102,005,443
Equity Instruments 2,726,221 4,980,790 - 7,707,011
Total financial assets 13,572,553 18,302,556 3,659,743,245 3,691,618,354
As at 31 December 2021
Fair value through profit
or loss
Amortised cost
Total
LKR ‘000 LKR '000 LKR ‘000
Financial liabilities
Due to banks - 17,936,070 17,936,070
Securities sold under repurchase agreements - 162,156,413 162,156,413
Derivative financial instruments 380,328 - 380,328
Financial liabilities at amortised cost
- due to depositors - 2,866,894,010 2,866,894,010
- other borrowings - 444,107,977 444,107,977
Subordinated Liabilities - 64,358,855 64,358,855
Total financial liabilities 380,328 3,555,453,325 3,555,833,653
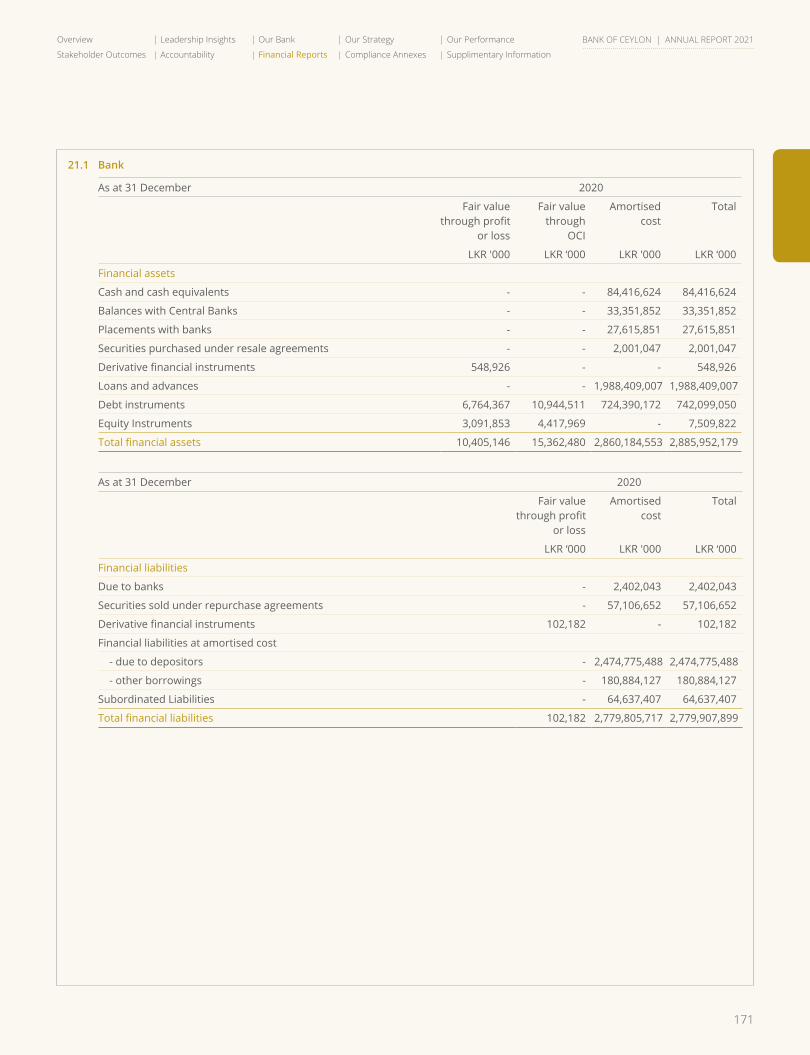
171
Overview Leadership Insights Our Bank Our Strategy Our Performance
Stakeholder Outcomes Accountability Financial Reports Compliance Annexes Supplimentary Information
BANK OF CEYLON | ANNUAL REPORT 2021
21.1 Bank
As at 31 December 2020
Fair value through profit
or loss
Fair value through
OCI
Amortised cost
Total
LKR '000 LKR ‘000 LKR '000 LKR ‘000
Financial assets
Cash and cash equivalents - - 84,416,624 84,416,624
Balances with Central Banks - - 33,351,852 33,351,852
Placements with banks - - 27,615,851 27,615,851
Securities purchased under resale agreements - - 2,001,047 2,001,047
Derivative financial instruments 548,926 - - 548,926
Loans and advances - - 1,988,409,007 1,988,409,007
Debt instruments 6,764,367 10,944,511 724,390,172 742,099,050
Equity Instruments 3,091,853 4,417,969 - 7,509,822
Total financial assets 10,405,146 15,362,480 2,860,184,553 2,885,952,179
As at 31 December 2020
Fair value through profit
or loss
Amortised cost
Total
LKR ‘000 LKR '000 LKR ‘000
Financial liabilities
Due to banks - 2,402,043 2,402,043
Securities sold under repurchase agreements - 57,106,652 57,106,652
Derivative financial instruments 102,182 - 102,182
Financial liabilities at amortised cost
- due to depositors - 2,474,775,488 2,474,775,488
- other borrowings - 180,884,127 180,884,127
Subordinated Liabilities - 64,637,407 64,637,407
Total financial liabilities 102,182 2,779,805,717 2,779,907,899
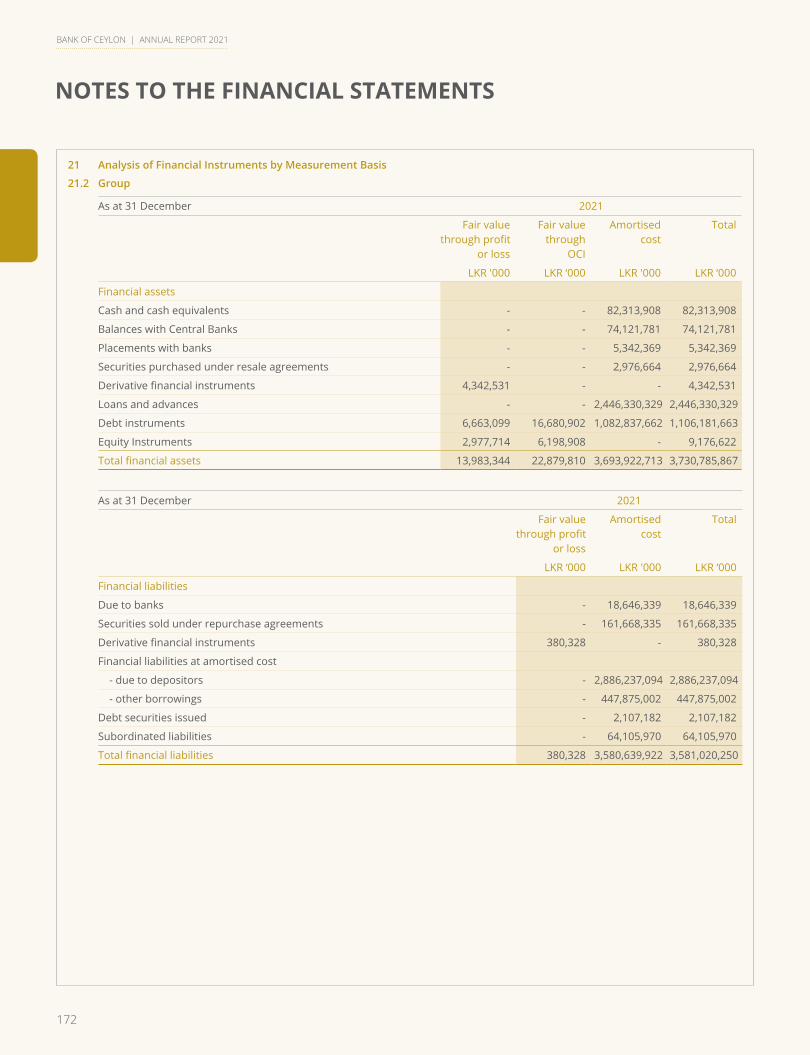
172
NOTES TO THE FINANCIAL STATEMENTS
BANK OF CEYLON | ANNUAL REPORT 2021
21 Analysis of Financial Instruments by Measurement Basis
21.2 Group
As at 31 December 2021
Fair value through profit
or loss
Fair value through
OCI
Amortised cost
Total
LKR '000 LKR ‘000 LKR '000 LKR ‘000
Financial assets
Cash and cash equivalents - - 82,313,908 82,313,908
Balances with Central Banks - - 74,121,781 74,121,781
Placements with banks - - 5,342,369 5,342,369
Securities purchased under resale agreements - - 2,976,664 2,976,664
Derivative financial instruments 4,342,531 - - 4,342,531
Loans and advances - - 2,446,330,329 2,446,330,329
Debt instruments 6,663,099 16,680,902 1,082,837,662 1,106,181,663
Equity Instruments 2,977,714 6,198,908 - 9,176,622
Total financial assets 13,983,344 22,879,810 3,693,922,713 3,730,785,867
As at 31 December 2021
Fair value through profit
or loss
Amortised cost
Total
LKR ‘000 LKR '000 LKR ‘000
Financial liabilities
Due to banks - 18,646,339 18,646,339
Securities sold under repurchase agreements - 161,668,335 161,668,335
Derivative financial instruments 380,328 - 380,328
Financial liabilities at amortised cost
- due to depositors - 2,886,237,094 2,886,237,094
- other borrowings - 447,875,002 447,875,002
Debt securities issued - 2,107,182 2,107,182
Subordinated liabilities - 64,105,970 64,105,970
Total financial liabilities 380,328 3,580,639,922 3,581,020,250
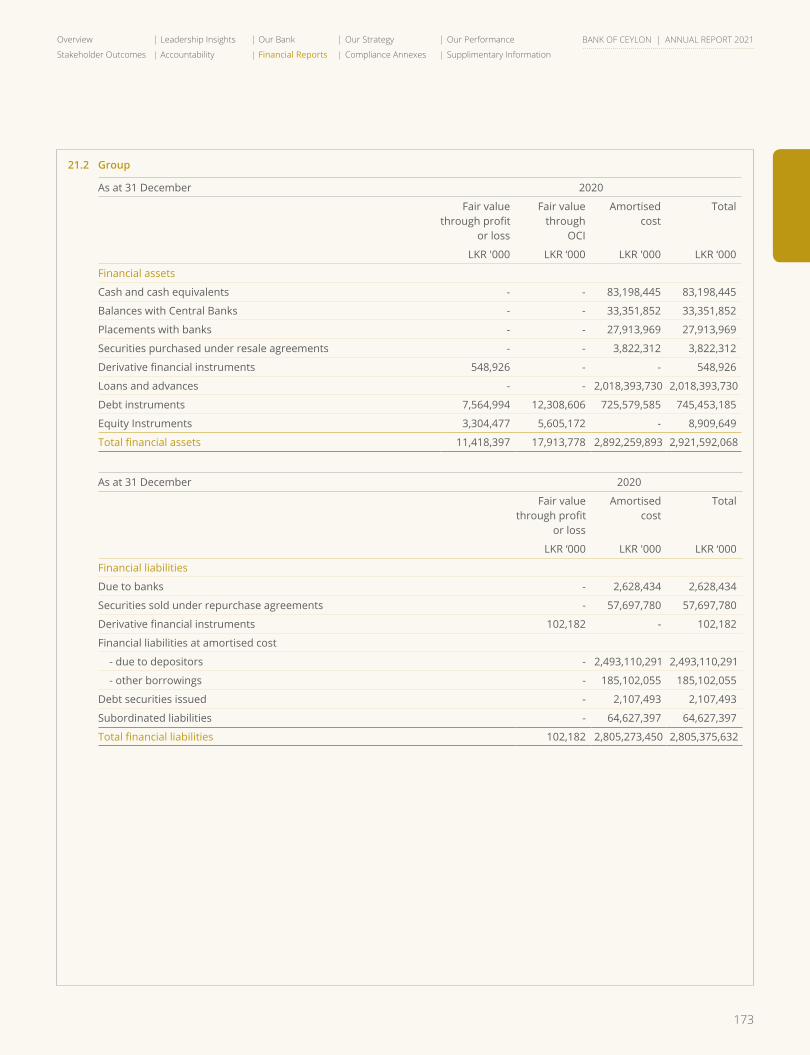
173
Overview Leadership Insights Our Bank Our Strategy Our Performance
Stakeholder Outcomes Accountability Financial Reports Compliance Annexes Supplimentary Information
BANK OF CEYLON | ANNUAL REPORT 2021
21.2 Group
As at 31 December 2020
Fair value through profit
or loss
Fair value through
OCI
Amortised cost
Total
LKR '000 LKR ‘000 LKR '000 LKR ‘000
Financial assets
Cash and cash equivalents - - 83,198,445 83,198,445
Balances with Central Banks - - 33,351,852 33,351,852
Placements with banks - - 27,913,969 27,913,969
Securities purchased under resale agreements - - 3,822,312 3,822,312
Derivative financial instruments 548,926 - - 548,926
Loans and advances - - 2,018,393,730 2,018,393,730
Debt instruments 7,564,994 12,308,606 725,579,585 745,453,185
Equity Instruments 3,304,477 5,605,172 - 8,909,649
Total financial assets 11,418,397 17,913,778 2,892,259,893 2,921,592,068
As at 31 December 2020
Fair value through profit
or loss
Amortised cost
Total
LKR ‘000 LKR '000 LKR ‘000
Financial liabilities
Due to banks - 2,628,434 2,628,434
Securities sold under repurchase agreements - 57,697,780 57,697,780
Derivative financial instruments 102,182 - 102,182
Financial liabilities at amortised cost
- due to depositors - 2,493,110,291 2,493,110,291
- other borrowings - 185,102,055 185,102,055
Debt securities issued - 2,107,493 2,107,493
Subordinated liabilities - 64,627,397 64,627,397
Total financial liabilities 102,182 2,805,273,450 2,805,375,632
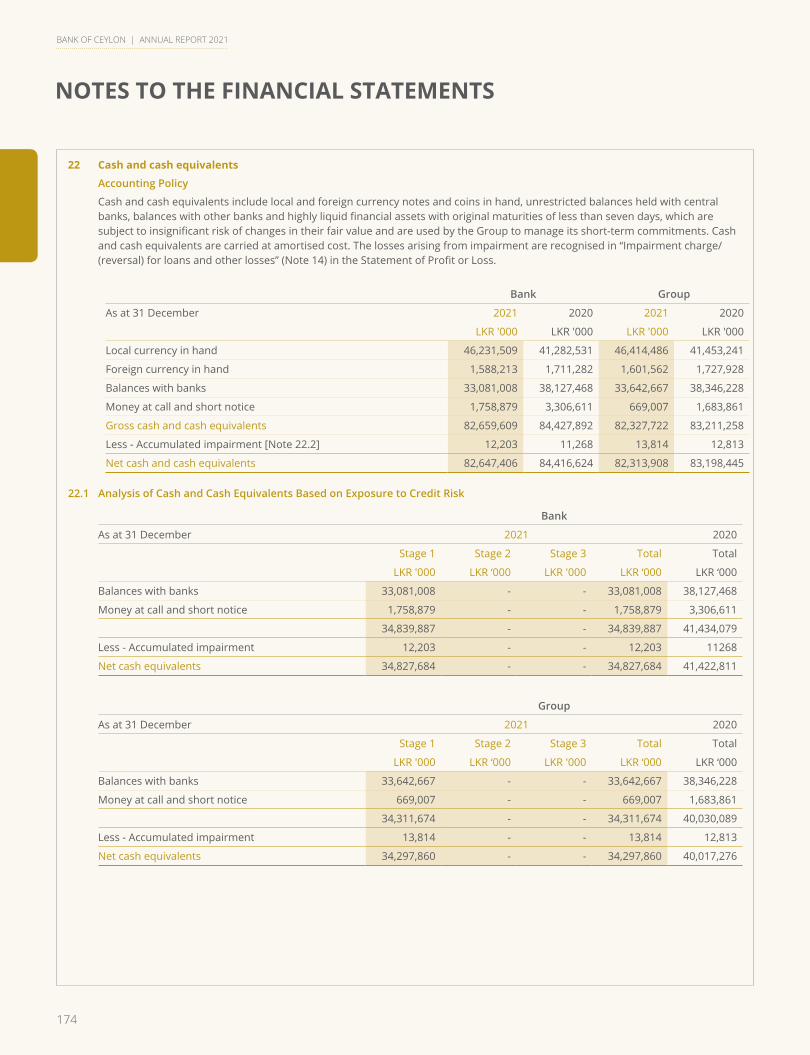
174
NOTES TO THE FINANCIAL STATEMENTS
BANK OF CEYLON | ANNUAL REPORT 2021
22 Cash and cash equivalents
Accounting Policy
Cash and cash equivalents include local and foreign currency notes and coins in hand, unrestricted balances held with central banks, balances with other banks and highly liquid financial assets with original maturities of less than seven days, which are subject to insignificant risk of changes in their fair value and are used by the Group to manage its short-term commitments. Cash and cash equivalents are carried at amortised cost. The losses arising from impairment are recognised in “Impairment charge/ (reversal) for loans and other losses” (Note 14) in the Statement of Profit or Loss.
Bank Group
As at 31 December 2021 2020 2021 2020
LKR '000 LKR '000 LKR '000 LKR '000
Local currency in hand 46,231,509 41,282,531 46,414,486 41,453,241
Foreign currency in hand 1,588,213 1,711,282 1,601,562 1,727,928
Balances with banks 33,081,008 38,127,468 33,642,667 38,346,228
Money at call and short notice 1,758,879 3,306,611 669,007 1,683,861
Gross cash and cash equivalents 82,659,609 84,427,892 82,327,722 83,211,258
Less - Accumulated impairment [Note 22.2] 12,203 11,268 13,814 12,813
Net cash and cash equivalents 82,647,406 84,416,624 82,313,908 83,198,445
22.1 Analysis of Cash and Cash Equivalents Based on Exposure to Credit Risk
Bank
As at 31 December 2021 2020
Stage 1 Stage 2 Stage 3 Total Total
LKR '000 LKR ‘000 LKR '000 LKR ‘000 LKR ‘000
Balances with banks 33,081,008 - - 33,081,008 38,127,468
Money at call and short notice 1,758,879 - - 1,758,879 3,306,611
34,839,887 - - 34,839,887 41,434,079
Less - Accumulated impairment 12,203 - - 12,203 11268
Net cash equivalents 34,827,684 - - 34,827,684 41,422,811
Group
As at 31 December 2021 2020
Stage 1 Stage 2 Stage 3 Total Total
LKR '000 LKR ‘000 LKR '000 LKR ‘000 LKR ‘000
Balances with banks 33,642,667 - - 33,642,667 38,346,228
Money at call and short notice 669,007 - - 669,007 1,683,861
34,311,674 - - 34,311,674 40,030,089
Less - Accumulated impairment 13,814 - - 13,814 12,813
Net cash equivalents 34,297,860 - - 34,297,860 40,017,276

175
Overview Leadership Insights Our Bank Our Strategy Our Performance
Stakeholder Outcomes Accountability Financial Reports Compliance Annexes Supplimentary Information
BANK OF CEYLON | ANNUAL REPORT 2021
22.2 Movement in Provision for Impairment During the Year
Bank Group2021 2020 2021 2020
LKR '000 LKR '000 LKR '000 LKR '000Movement in Stage 1 Impairment Balance as at 1 January 11,268 13,536 12,813 13,551 Charge/(Write back) to income statement 935 (2,268) 1,001 (738)Balance as at 31 December 12,203 11,268 13,814 12,813
Bank Group2021 2020 2021 2020
LKR '000 LKR '000 LKR '000 LKR '000Movement in Total Impairment Balance as at 1 January 11,268 13,536 12,813 13,551 Charge/(Write back) to income statement 935 (2,268) 1,001 (738) Balance as at 31 December 12,203 11,268 13,814 12,813
23 Balances with Central Banks
Accounting Policy
Balances with Central Banks are carried at amortised cost in the Statement of Financial Position
Bank GroupAs at 31 December 2021 2020 2021 2020
LKR '000 LKR '000 LKR '000 LKR '000Statutory balances with central banks Central bank of Sri Lanka 68,797,576 27,264,328 68,797,576 27,264,328 Other Central Banks 5,324,205 6,087,524 5,324,205 6,087,524 Total balances with central banks 74,121,781 33,351,852 74,121,781 33,351,852
23.1 Central Bank of Sri Lanka (CBSL)
In terms of the provisions of Section 93 of the Monetary Law Act No. 58 of 1949, the Bank is required to maintain a cash reserve with Central Bank of Sri Lanka. The minimum cash reserve requirement as of 31 December 2021 was 4.0% (2020 : 2.0%) of Sri Lankan Rupee deposit liabilities. There is no reserve requirement for foreign currency deposit liabilities maintained by domestic branches and the deposit liabilities of the Off-shore Banking Division in Sri Lanka (2020 : Nil).
23.2 Reserve Bank of India (RBI)
In terms of the provisions of Section 42 (1) of the Reserve Bank of India (RBI) Act No. 02 of 1934, the branch in Chennai is required to maintain a cash reserve with RBI. The minimum cash reserve as of 31 December 2021 was 4.0% on its demand and term deposit liabilities (2020 : 3.0%).
23.3 Maldives Monetary Authority (MMA)
In accordance with the prevailing regulations of Maldives Monetary Authority (MMA), the branch in Maldives is required to maintain a reserve deposit based on 10.0% of the branch’s commercial deposits and liabilities to the public in the Maldives in Maldivian Rufiyaa and 5.0% of the branch’s commercial deposits and liabilities to the public in the Maldives in United States Dollar. (2020 : 7.5% for Maldivian Rufiyaa and 5.0% for United States Dollar separately).
23.4 Central Bank of Seychelles (CBS)
In accordance with the regulations of Central Bank of Seychelles, the branch in Seychelles is required to maintain a reserve deposit based on 10.0% on rupee deposits of the branch’s commercial deposits liabilities to the public in Seychelles and 13% for foreign currency deposits of the branch’s commercial deposits liabilities to the public in Seychelles (2020 : 13.0%).
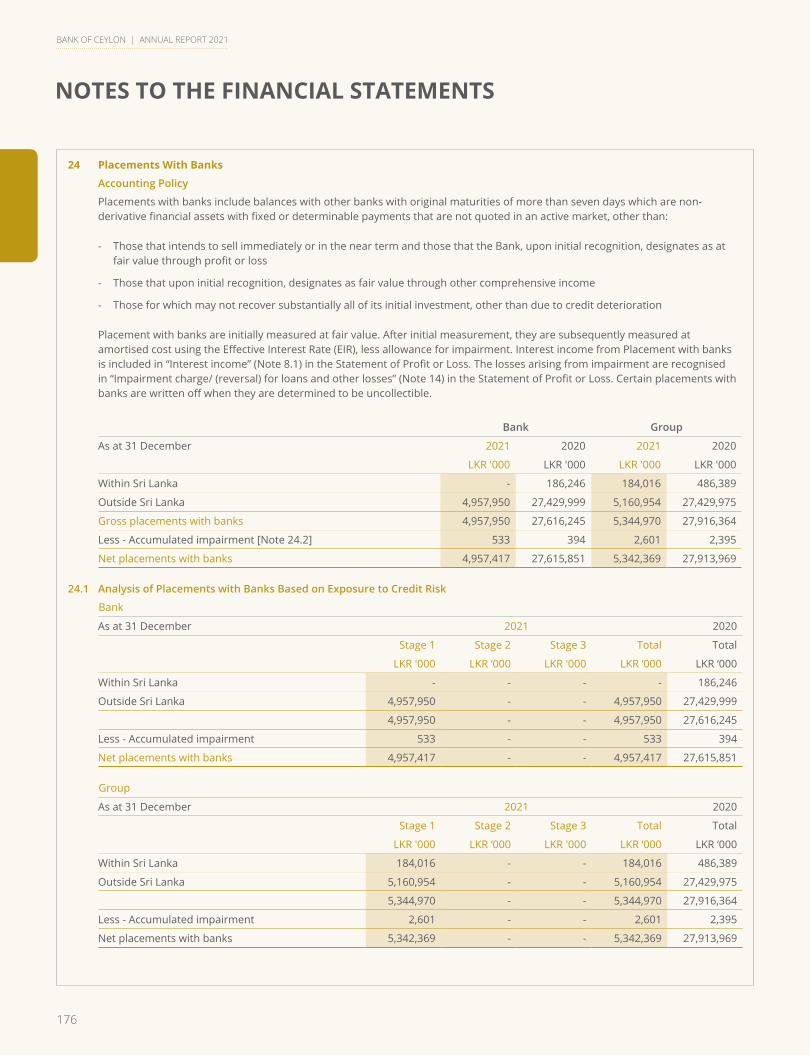
176
NOTES TO THE FINANCIAL STATEMENTS
BANK OF CEYLON | ANNUAL REPORT 2021
24 Placements With Banks
Accounting Policy
Placements with banks include balances with other banks with original maturities of more than seven days which are non-derivative financial assets with fixed or determinable payments that are not quoted in an active market, other than:
- Those that intends to sell immediately or in the near term and those that the Bank, upon initial recognition, designates as at fair value through profit or loss
- Those that upon initial recognition, designates as fair value through other comprehensive income
- Those for which may not recover substantially all of its initial investment, other than due to credit deterioration
Placement with banks are initially measured at fair value. After initial measurement, they are subsequently measured at amortised cost using the Effective Interest Rate (EIR), less allowance for impairment. Interest income from Placement with banks is included in “Interest income” (Note 8.1) in the Statement of Profit or Loss. The losses arising from impairment are recognised in “Impairment charge/ (reversal) for loans and other losses” (Note 14) in the Statement of Profit or Loss. Certain placements with banks are written off when they are determined to be uncollectible.
Bank Group
As at 31 December 2021 2020 2021 2020
LKR '000 LKR '000 LKR '000 LKR '000
Within Sri Lanka - 186,246 184,016 486,389
Outside Sri Lanka 4,957,950 27,429,999 5,160,954 27,429,975
Gross placements with banks 4,957,950 27,616,245 5,344,970 27,916,364
Less - Accumulated impairment [Note 24.2] 533 394 2,601 2,395
Net placements with banks 4,957,417 27,615,851 5,342,369 27,913,969
24.1 Analysis of Placements with Banks Based on Exposure to Credit Risk
Bank
As at 31 December 2021 2020
Stage 1 Stage 2 Stage 3 Total Total
LKR '000 LKR ‘000 LKR '000 LKR ‘000 LKR ‘000
Within Sri Lanka - - - - 186,246
Outside Sri Lanka 4,957,950 - - 4,957,950 27,429,999
4,957,950 - - 4,957,950 27,616,245
Less - Accumulated impairment 533 - - 533 394
Net placements with banks 4,957,417 - - 4,957,417 27,615,851
Group
As at 31 December 2021 2020
Stage 1 Stage 2 Stage 3 Total Total
LKR '000 LKR ‘000 LKR '000 LKR ‘000 LKR ‘000
Within Sri Lanka 184,016 - - 184,016 486,389
Outside Sri Lanka 5,160,954 - - 5,160,954 27,429,975
5,344,970 - - 5,344,970 27,916,364
Less - Accumulated impairment 2,601 - - 2,601 2,395
Net placements with banks 5,342,369 - - 5,342,369 27,913,969
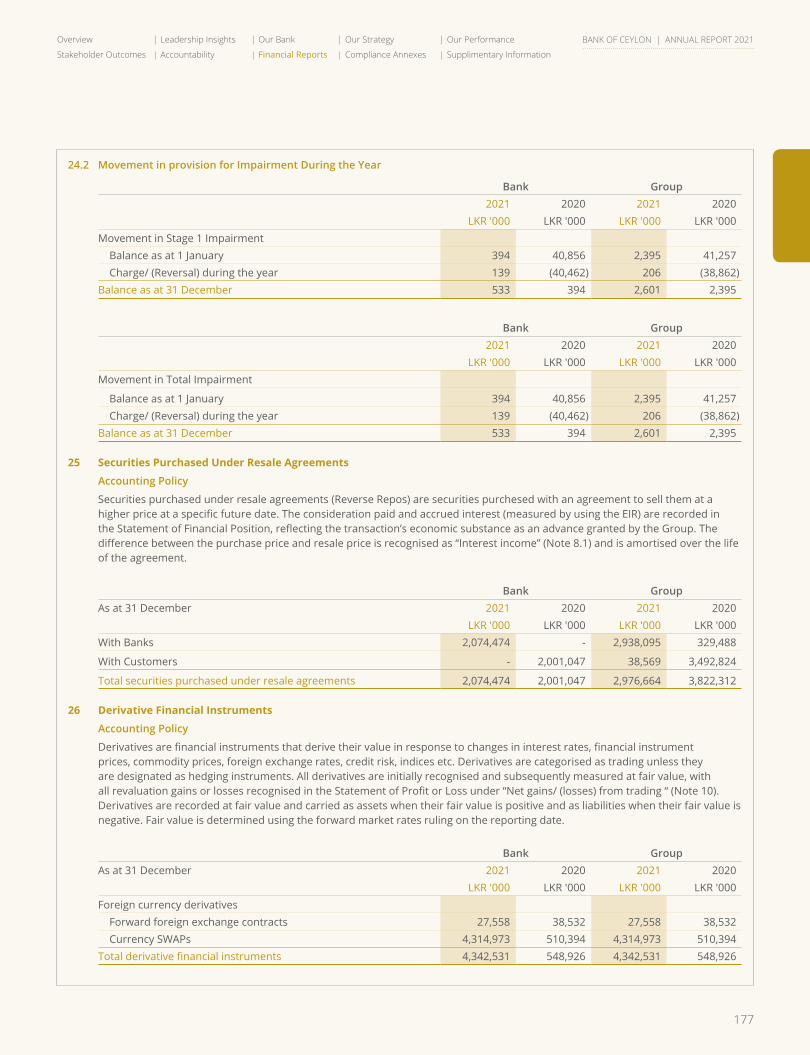
177
Overview Leadership Insights Our Bank Our Strategy Our Performance
Stakeholder Outcomes Accountability Financial Reports Compliance Annexes Supplimentary Information
BANK OF CEYLON | ANNUAL REPORT 2021
24.2 Movement in provision for Impairment During the Year
Bank Group2021 2020 2021 2020
LKR '000 LKR '000 LKR '000 LKR '000Movement in Stage 1 Impairment Balance as at 1 January 394 40,856 2,395 41,257 Charge/ (Reversal) during the year 139 (40,462) 206 (38,862)Balance as at 31 December 533 394 2,601 2,395
Bank Group2021 2020 2021 2020
LKR '000 LKR '000 LKR '000 LKR '000Movement in Total Impairment
Balance as at 1 January 394 40,856 2,395 41,257 Charge/ (Reversal) during the year 139 (40,462) 206 (38,862)Balance as at 31 December 533 394 2,601 2,395
25 Securities Purchased Under Resale Agreements
Accounting Policy
Securities purchased under resale agreements (Reverse Repos) are securities purchesed with an agreement to sell them at a higher price at a specific future date. The consideration paid and accrued interest (measured by using the EIR) are recorded in the Statement of Financial Position, reflecting the transaction’s economic substance as an advance granted by the Group. The difference between the purchase price and resale price is recognised as “Interest income” (Note 8.1) and is amortised over the life of the agreement.
Bank GroupAs at 31 December 2021 2020 2021 2020
LKR '000 LKR '000 LKR '000 LKR '000With Banks 2,074,474 - 2,938,095 329,488
With Customers - 2,001,047 38,569 3,492,824
Total securities purchased under resale agreements 2,074,474 2,001,047 2,976,664 3,822,312
26 Derivative Financial Instruments
Accounting Policy
Derivatives are financial instruments that derive their value in response to changes in interest rates, financial instrument prices, commodity prices, foreign exchange rates, credit risk, indices etc. Derivatives are categorised as trading unless they are designated as hedging instruments. All derivatives are initially recognised and subsequently measured at fair value, with all revaluation gains or losses recognised in the Statement of Profit or Loss under “Net gains/ (losses) from trading “ (Note 10). Derivatives are recorded at fair value and carried as assets when their fair value is positive and as liabilities when their fair value is negative. Fair value is determined using the forward market rates ruling on the reporting date.
Bank GroupAs at 31 December 2021 2020 2021 2020
LKR '000 LKR '000 LKR '000 LKR '000Foreign currency derivatives Forward foreign exchange contracts 27,558 38,532 27,558 38,532 Currency SWAPs 4,314,973 510,394 4,314,973 510,394 Total derivative financial instruments 4,342,531 548,926 4,342,531 548,926
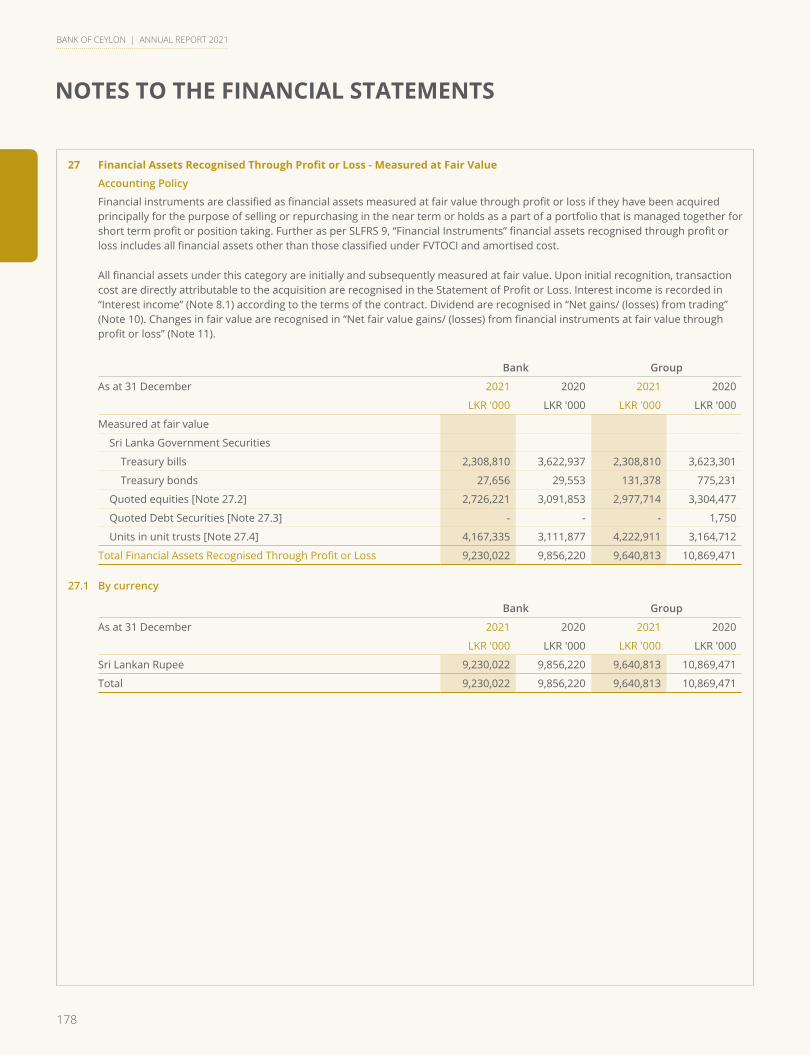
178
NOTES TO THE FINANCIAL STATEMENTS
BANK OF CEYLON | ANNUAL REPORT 2021
27 Financial Assets Recognised Through Profit or Loss - Measured at Fair Value
Accounting Policy
Financial instruments are classified as financial assets measured at fair value through profit or loss if they have been acquired principally for the purpose of selling or repurchasing in the near term or holds as a part of a portfolio that is managed together for short term profit or position taking. Further as per SLFRS 9, “Financial Instruments” financial assets recognised through profit or loss includes all financial assets other than those classified under FVTOCI and amortised cost.
All financial assets under this category are initially and subsequently measured at fair value. Upon initial recognition, transaction cost are directly attributable to the acquisition are recognised in the Statement of Profit or Loss. Interest income is recorded in “Interest income” (Note 8.1) according to the terms of the contract. Dividend are recognised in “Net gains/ (losses) from trading” (Note 10). Changes in fair value are recognised in “Net fair value gains/ (losses) from financial instruments at fair value through profit or loss” (Note 11).
Bank Group
As at 31 December 2021 2020 2021 2020
LKR '000 LKR '000 LKR '000 LKR '000
Measured at fair value
Sri Lanka Government Securities
Treasury bills 2,308,810 3,622,937 2,308,810 3,623,301
Treasury bonds 27,656 29,553 131,378 775,231
Quoted equities [Note 27.2] 2,726,221 3,091,853 2,977,714 3,304,477
Quoted Debt Securities [Note 27.3] - - - 1,750
Units in unit trusts [Note 27.4] 4,167,335 3,111,877 4,222,911 3,164,712
Total Financial Assets Recognised Through Profit or Loss 9,230,022 9,856,220 9,640,813 10,869,471
27.1 By currency
Bank Group
As at 31 December 2021 2020 2021 2020
LKR '000 LKR '000 LKR '000 LKR '000
Sri Lankan Rupee 9,230,022 9,856,220 9,640,813 10,869,471
Total 9,230,022 9,856,220 9,640,813 10,869,471
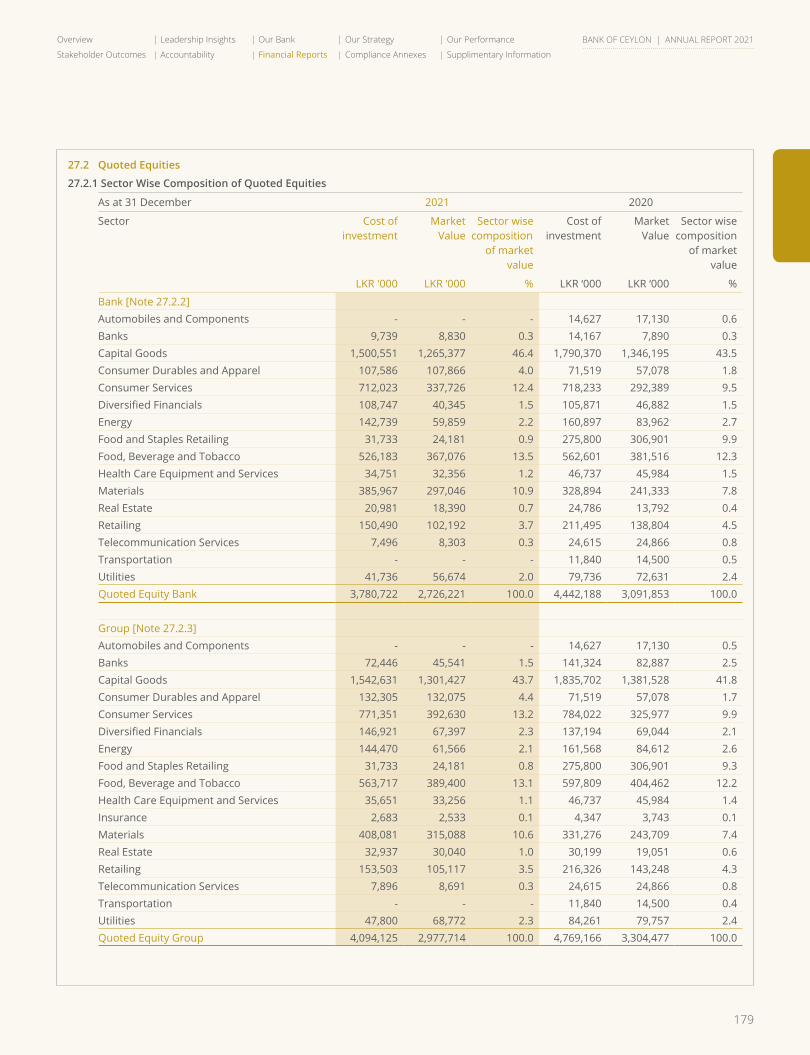
179
Overview Leadership Insights Our Bank Our Strategy Our Performance
Stakeholder Outcomes Accountability Financial Reports Compliance Annexes Supplimentary Information
BANK OF CEYLON | ANNUAL REPORT 2021
27.2 Quoted Equities
27.2.1 Sector Wise Composition of Quoted Equities
As at 31 December 2021 2020
Sector Cost of investment
Market Value
Sector wise composition
of marketvalue
Cost of investment
MarketValue
Sector wise composition
of market value
LKR '000 LKR ‘000 % LKR ‘000 LKR ‘000 %
Bank [Note 27.2.2]Automobiles and Components - - - 14,627 17,130 0.6Banks 9,739 8,830 0.3 14,167 7,890 0.3Capital Goods 1,500,551 1,265,377 46.4 1,790,370 1,346,195 43.5Consumer Durables and Apparel 107,586 107,866 4.0 71,519 57,078 1.8Consumer Services 712,023 337,726 12.4 718,233 292,389 9.5Diversified Financials 108,747 40,345 1.5 105,871 46,882 1.5Energy 142,739 59,859 2.2 160,897 83,962 2.7Food and Staples Retailing 31,733 24,181 0.9 275,800 306,901 9.9Food, Beverage and Tobacco 526,183 367,076 13.5 562,601 381,516 12.3Health Care Equipment and Services 34,751 32,356 1.2 46,737 45,984 1.5Materials 385,967 297,046 10.9 328,894 241,333 7.8Real Estate 20,981 18,390 0.7 24,786 13,792 0.4Retailing 150,490 102,192 3.7 211,495 138,804 4.5Telecommunication Services 7,496 8,303 0.3 24,615 24,866 0.8Transportation - - - 11,840 14,500 0.5Utilities 41,736 56,674 2.0 79,736 72,631 2.4Quoted Equity Bank 3,780,722 2,726,221 100.0 4,442,188 3,091,853 100.0
Group [Note 27.2.3]Automobiles and Components - - - 14,627 17,130 0.5 Banks 72,446 45,541 1.5 141,324 82,887 2.5 Capital Goods 1,542,631 1,301,427 43.7 1,835,702 1,381,528 41.8 Consumer Durables and Apparel 132,305 132,075 4.4 71,519 57,078 1.7 Consumer Services 771,351 392,630 13.2 784,022 325,977 9.9 Diversified Financials 146,921 67,397 2.3 137,194 69,044 2.1 Energy 144,470 61,566 2.1 161,568 84,612 2.6 Food and Staples Retailing 31,733 24,181 0.8 275,800 306,901 9.3 Food, Beverage and Tobacco 563,717 389,400 13.1 597,809 404,462 12.2 Health Care Equipment and Services 35,651 33,256 1.1 46,737 45,984 1.4 Insurance 2,683 2,533 0.1 4,347 3,743 0.1 Materials 408,081 315,088 10.6 331,276 243,709 7.4 Real Estate 32,937 30,040 1.0 30,199 19,051 0.6 Retailing 153,503 105,117 3.5 216,326 143,248 4.3 Telecommunication Services 7,896 8,691 0.3 24,615 24,866 0.8 Transportation - - - 11,840 14,500 0.4 Utilities 47,800 68,772 2.3 84,261 79,757 2.4 Quoted Equity Group 4,094,125 2,977,714 100.0 4,769,166 3,304,477 100.0
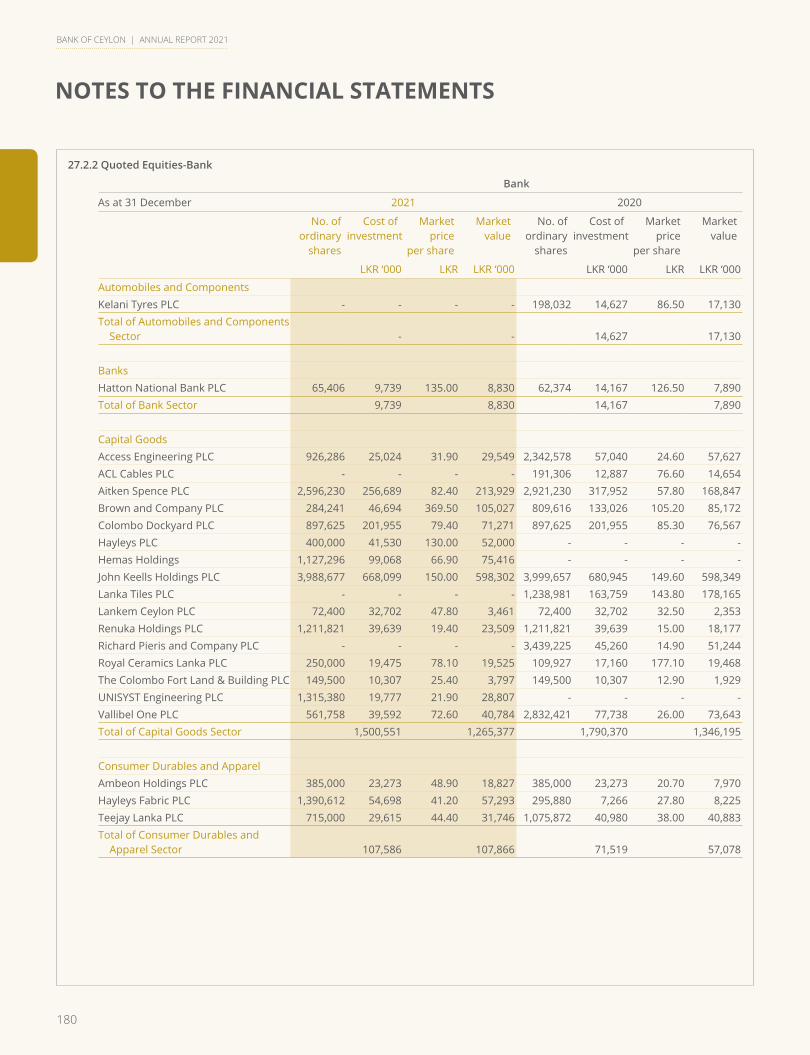
180
NOTES TO THE FINANCIAL STATEMENTS
BANK OF CEYLON | ANNUAL REPORT 2021
27.2.2 Quoted Equities-Bank
Bank
As at 31 December 2021 2020
No. of ordinary
shares
Cost of investment
Marketprice
per share
Marketvalue
No. of ordinary
shares
Cost of investment
Market price
per share
Marketvalue
LKR ‘000 LKR LKR ‘000 LKR ‘000 LKR LKR ‘000
Automobiles and ComponentsKelani Tyres PLC - - - - 198,032 14,627 86.50 17,130 Total of Automobiles and Components
Sector - - 14,627 17,130
BanksHatton National Bank PLC 65,406 9,739 135.00 8,830 62,374 14,167 126.50 7,890 Total of Bank Sector 9,739 8,830 14,167 7,890
Capital GoodsAccess Engineering PLC 926,286 25,024 31.90 29,549 2,342,578 57,040 24.60 57,627 ACL Cables PLC - - - - 191,306 12,887 76.60 14,654 Aitken Spence PLC 2,596,230 256,689 82.40 213,929 2,921,230 317,952 57.80 168,847 Brown and Company PLC 284,241 46,694 369.50 105,027 809,616 133,026 105.20 85,172 Colombo Dockyard PLC 897,625 201,955 79.40 71,271 897,625 201,955 85.30 76,567 Hayleys PLC 400,000 41,530 130.00 52,000 - - - - Hemas Holdings 1,127,296 99,068 66.90 75,416 - - - -John Keells Holdings PLC 3,988,677 668,099 150.00 598,302 3,999,657 680,945 149.60 598,349 Lanka Tiles PLC - - - - 1,238,981 163,759 143.80 178,165 Lankem Ceylon PLC 72,400 32,702 47.80 3,461 72,400 32,702 32.50 2,353 Renuka Holdings PLC 1,211,821 39,639 19.40 23,509 1,211,821 39,639 15.00 18,177 Richard Pieris and Company PLC - - - - 3,439,225 45,260 14.90 51,244 Royal Ceramics Lanka PLC 250,000 19,475 78.10 19,525 109,927 17,160 177.10 19,468 The Colombo Fort Land & Building PLC 149,500 10,307 25.40 3,797 149,500 10,307 12.90 1,929 UNISYST Engineering PLC 1,315,380 19,777 21.90 28,807 - - - -Vallibel One PLC 561,758 39,592 72.60 40,784 2,832,421 77,738 26.00 73,643 Total of Capital Goods Sector 1,500,551 1,265,377 1,790,370 1,346,195
Consumer Durables and ApparelAmbeon Holdings PLC 385,000 23,273 48.90 18,827 385,000 23,273 20.70 7,970 Hayleys Fabric PLC 1,390,612 54,698 41.20 57,293 295,880 7,266 27.80 8,225 Teejay Lanka PLC 715,000 29,615 44.40 31,746 1,075,872 40,980 38.00 40,883 Total of Consumer Durables and
Apparel Sector 107,586 107,866 71,519 57,078
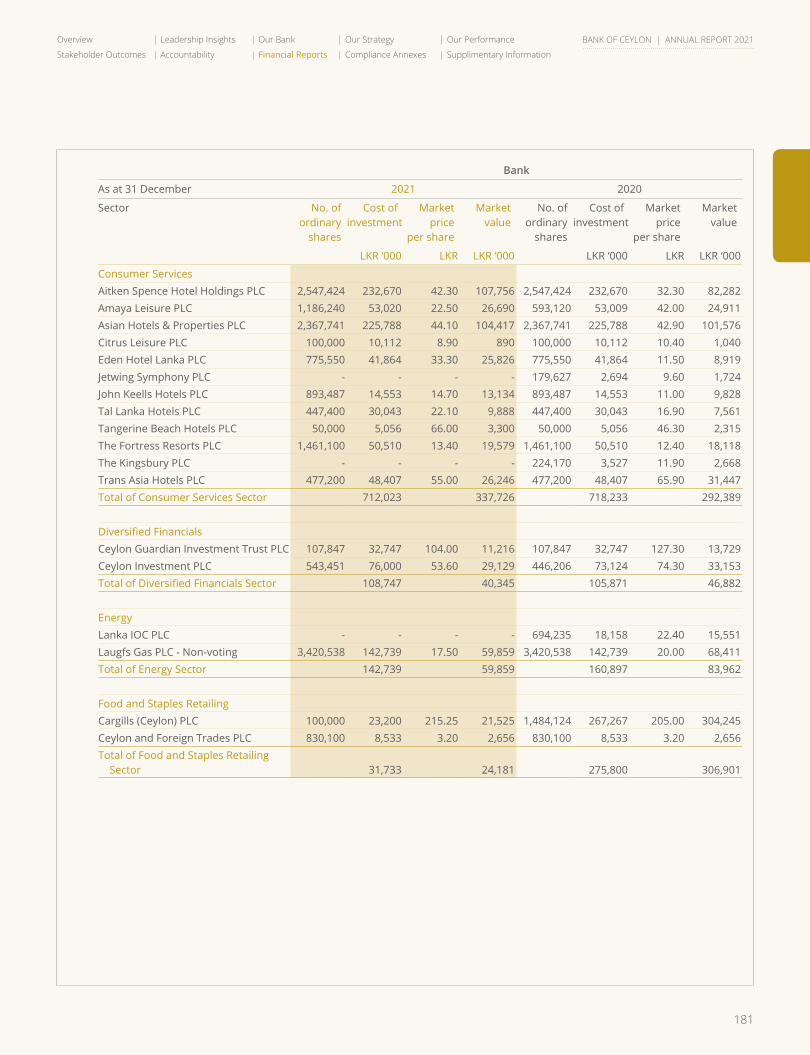
181
Overview Leadership Insights Our Bank Our Strategy Our Performance
Stakeholder Outcomes Accountability Financial Reports Compliance Annexes Supplimentary Information
BANK OF CEYLON | ANNUAL REPORT 2021
Bank
As at 31 December 2021 2020
Sector No. of ordinary
shares
Cost of investment
Marketprice
per share
Marketvalue
No. of ordinary
shares
Cost of investment
Market price
per share
Marketvalue
LKR ‘000 LKR LKR ‘000 LKR ‘000 LKR LKR ‘000
Consumer ServicesAitken Spence Hotel Holdings PLC 2,547,424 232,670 42.30 107,756 2,547,424 232,670 32.30 82,282 Amaya Leisure PLC 1,186,240 53,020 22.50 26,690 593,120 53,009 42.00 24,911 Asian Hotels & Properties PLC 2,367,741 225,788 44.10 104,417 2,367,741 225,788 42.90 101,576 Citrus Leisure PLC 100,000 10,112 8.90 890 100,000 10,112 10.40 1,040 Eden Hotel Lanka PLC 775,550 41,864 33.30 25,826 775,550 41,864 11.50 8,919 Jetwing Symphony PLC - - - - 179,627 2,694 9.60 1,724 John Keells Hotels PLC 893,487 14,553 14.70 13,134 893,487 14,553 11.00 9,828 Tal Lanka Hotels PLC 447,400 30,043 22.10 9,888 447,400 30,043 16.90 7,561 Tangerine Beach Hotels PLC 50,000 5,056 66.00 3,300 50,000 5,056 46.30 2,315 The Fortress Resorts PLC 1,461,100 50,510 13.40 19,579 1,461,100 50,510 12.40 18,118 The Kingsbury PLC - - - - 224,170 3,527 11.90 2,668 Trans Asia Hotels PLC 477,200 48,407 55.00 26,246 477,200 48,407 65.90 31,447 Total of Consumer Services Sector 712,023 337,726 718,233 292,389
Diversified FinancialsCeylon Guardian Investment Trust PLC 107,847 32,747 104.00 11,216 107,847 32,747 127.30 13,729 Ceylon Investment PLC 543,451 76,000 53.60 29,129 446,206 73,124 74.30 33,153 Total of Diversified Financials Sector 108,747 40,345 105,871 46,882
EnergyLanka IOC PLC - - - - 694,235 18,158 22.40 15,551 Laugfs Gas PLC - Non-voting 3,420,538 142,739 17.50 59,859 3,420,538 142,739 20.00 68,411 Total of Energy Sector 142,739 59,859 160,897 83,962
Food and Staples RetailingCargills (Ceylon) PLC 100,000 23,200 215.25 21,525 1,484,124 267,267 205.00 304,245 Ceylon and Foreign Trades PLC 830,100 8,533 3.20 2,656 830,100 8,533 3.20 2,656 Total of Food and Staples Retailing
Sector 31,733 24,181 275,800 306,901
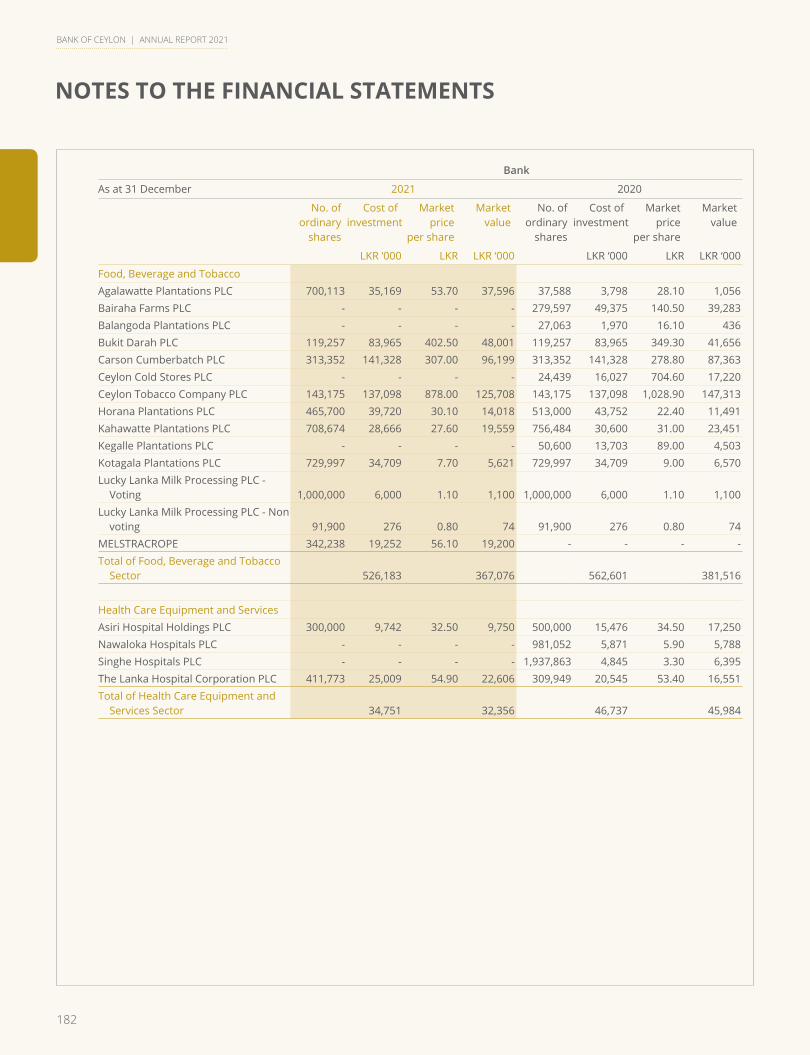
182
NOTES TO THE FINANCIAL STATEMENTS
BANK OF CEYLON | ANNUAL REPORT 2021
Bank
As at 31 December 2021 2020
No. of ordinary
shares
Cost of investment
Marketprice
per share
Marketvalue
No. of ordinary
shares
Cost of investment
Market price
per share
Marketvalue
LKR ‘000 LKR LKR ‘000 LKR ‘000 LKR LKR ‘000
Food, Beverage and TobaccoAgalawatte Plantations PLC 700,113 35,169 53.70 37,596 37,588 3,798 28.10 1,056 Bairaha Farms PLC - - - - 279,597 49,375 140.50 39,283 Balangoda Plantations PLC - - - - 27,063 1,970 16.10 436 Bukit Darah PLC 119,257 83,965 402.50 48,001 119,257 83,965 349.30 41,656 Carson Cumberbatch PLC 313,352 141,328 307.00 96,199 313,352 141,328 278.80 87,363 Ceylon Cold Stores PLC - - - - 24,439 16,027 704.60 17,220 Ceylon Tobacco Company PLC 143,175 137,098 878.00 125,708 143,175 137,098 1,028.90 147,313 Horana Plantations PLC 465,700 39,720 30.10 14,018 513,000 43,752 22.40 11,491 Kahawatte Plantations PLC 708,674 28,666 27.60 19,559 756,484 30,600 31.00 23,451 Kegalle Plantations PLC - - - - 50,600 13,703 89.00 4,503 Kotagala Plantations PLC 729,997 34,709 7.70 5,621 729,997 34,709 9.00 6,570 Lucky Lanka Milk Processing PLC -
Voting 1,000,000 6,000 1.10 1,100 1,000,000 6,000 1.10 1,100 Lucky Lanka Milk Processing PLC - Non
voting 91,900 276 0.80 74 91,900 276 0.80 74 MELSTRACROPE 342,238 19,252 56.10 19,200 - - - -Total of Food, Beverage and Tobacco
Sector 526,183 367,076 562,601 381,516
Health Care Equipment and ServicesAsiri Hospital Holdings PLC 300,000 9,742 32.50 9,750 500,000 15,476 34.50 17,250 Nawaloka Hospitals PLC - - - - 981,052 5,871 5.90 5,788 Singhe Hospitals PLC - - - - 1,937,863 4,845 3.30 6,395 The Lanka Hospital Corporation PLC 411,773 25,009 54.90 22,606 309,949 20,545 53.40 16,551 Total of Health Care Equipment and
Services Sector 34,751 32,356 46,737 45,984
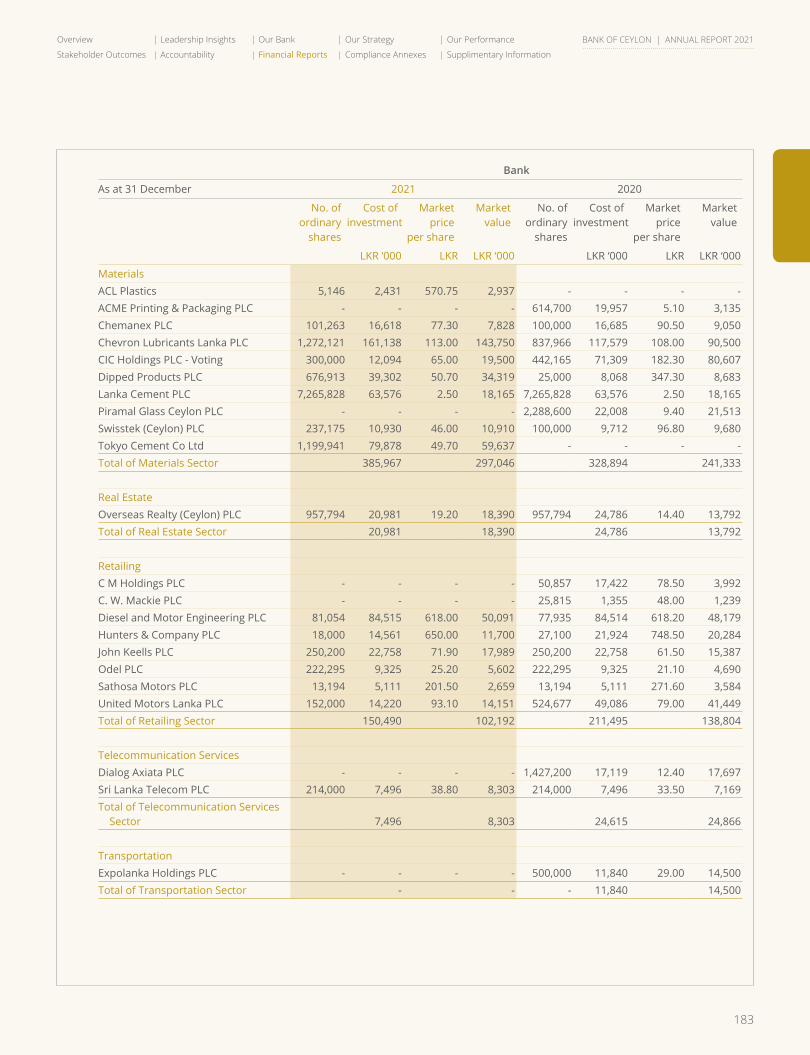
183
Overview Leadership Insights Our Bank Our Strategy Our Performance
Stakeholder Outcomes Accountability Financial Reports Compliance Annexes Supplimentary Information
BANK OF CEYLON | ANNUAL REPORT 2021
Bank
As at 31 December 2021 2020
No. of ordinary
shares
Cost of investment
Marketprice
per share
Marketvalue
No. of ordinary
shares
Cost of investment
Market price
per share
Marketvalue
LKR ‘000 LKR LKR ‘000 LKR ‘000 LKR LKR ‘000
MaterialsACL Plastics 5,146 2,431 570.75 2,937 - - - - ACME Printing & Packaging PLC - - - - 614,700 19,957 5.10 3,135 Chemanex PLC 101,263 16,618 77.30 7,828 100,000 16,685 90.50 9,050 Chevron Lubricants Lanka PLC 1,272,121 161,138 113.00 143,750 837,966 117,579 108.00 90,500 CIC Holdings PLC - Voting 300,000 12,094 65.00 19,500 442,165 71,309 182.30 80,607 Dipped Products PLC 676,913 39,302 50.70 34,319 25,000 8,068 347.30 8,683 Lanka Cement PLC 7,265,828 63,576 2.50 18,165 7,265,828 63,576 2.50 18,165 Piramal Glass Ceylon PLC - - - - 2,288,600 22,008 9.40 21,513 Swisstek (Ceylon) PLC 237,175 10,930 46.00 10,910 100,000 9,712 96.80 9,680 Tokyo Cement Co Ltd 1,199,941 79,878 49.70 59,637 - - - - Total of Materials Sector 385,967 297,046 328,894 241,333
Real EstateOverseas Realty (Ceylon) PLC 957,794 20,981 19.20 18,390 957,794 24,786 14.40 13,792 Total of Real Estate Sector 20,981 18,390 24,786 13,792
RetailingC M Holdings PLC - - - - 50,857 17,422 78.50 3,992 C. W. Mackie PLC - - - - 25,815 1,355 48.00 1,239 Diesel and Motor Engineering PLC 81,054 84,515 618.00 50,091 77,935 84,514 618.20 48,179 Hunters & Company PLC 18,000 14,561 650.00 11,700 27,100 21,924 748.50 20,284 John Keells PLC 250,200 22,758 71.90 17,989 250,200 22,758 61.50 15,387 Odel PLC 222,295 9,325 25.20 5,602 222,295 9,325 21.10 4,690 Sathosa Motors PLC 13,194 5,111 201.50 2,659 13,194 5,111 271.60 3,584 United Motors Lanka PLC 152,000 14,220 93.10 14,151 524,677 49,086 79.00 41,449 Total of Retailing Sector 150,490 102,192 211,495 138,804
Telecommunication ServicesDialog Axiata PLC - - - - 1,427,200 17,119 12.40 17,697 Sri Lanka Telecom PLC 214,000 7,496 38.80 8,303 214,000 7,496 33.50 7,169 Total of Telecommunication Services
Sector 7,496 8,303 24,615 24,866
TransportationExpolanka Holdings PLC - - - - 500,000 11,840 29.00 14,500 Total of Transportation Sector - - - 11,840 14,500
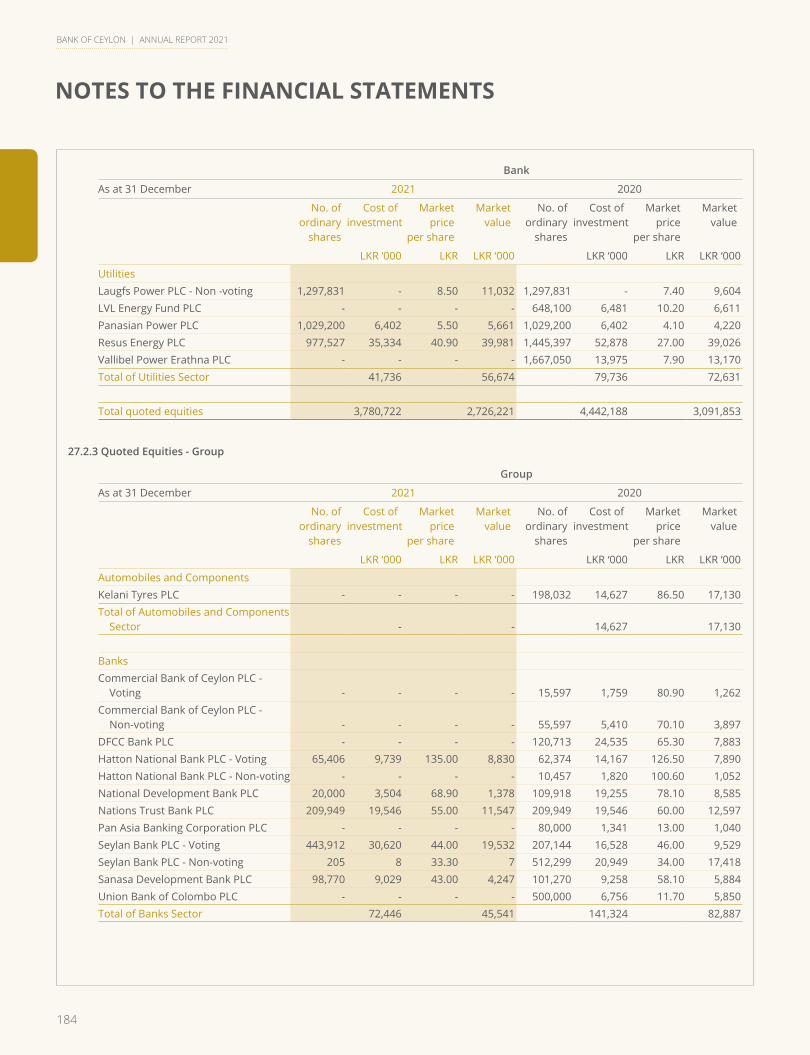
184
NOTES TO THE FINANCIAL STATEMENTS
BANK OF CEYLON | ANNUAL REPORT 2021
Bank
As at 31 December 2021 2020
No. of ordinary
shares
Cost of investment
Marketprice
per share
Marketvalue
No. of ordinary
shares
Cost of investment
Market price
per share
Marketvalue
LKR ‘000 LKR LKR ‘000 LKR ‘000 LKR LKR ‘000
UtilitiesLaugfs Power PLC - Non -voting 1,297,831 - 8.50 11,032 1,297,831 - 7.40 9,604 LVL Energy Fund PLC - - - - 648,100 6,481 10.20 6,611 Panasian Power PLC 1,029,200 6,402 5.50 5,661 1,029,200 6,402 4.10 4,220 Resus Energy PLC 977,527 35,334 40.90 39,981 1,445,397 52,878 27.00 39,026 Vallibel Power Erathna PLC - - - - 1,667,050 13,975 7.90 13,170 Total of Utilities Sector 41,736 56,674 79,736 72,631
Total quoted equities 3,780,722 2,726,221 4,442,188 3,091,853
27.2.3 Quoted Equities - Group
Group
As at 31 December 2021 2020
No. of ordinary
shares
Cost of investment
Marketprice
per share
Marketvalue
No. of ordinary
shares
Cost of investment
Market price
per share
Marketvalue
LKR ‘000 LKR LKR ‘000 LKR ‘000 LKR LKR ‘000
Automobiles and ComponentsKelani Tyres PLC - - - - 198,032 14,627 86.50 17,130 Total of Automobiles and Components
Sector - - 14,627 17,130
BanksCommercial Bank of Ceylon PLC -
Voting - - - - 15,597 1,759 80.90 1,262 Commercial Bank of Ceylon PLC -
Non-voting - - - - 55,597 5,410 70.10 3,897 DFCC Bank PLC - - - - 120,713 24,535 65.30 7,883 Hatton National Bank PLC - Voting 65,406 9,739 135.00 8,830 62,374 14,167 126.50 7,890 Hatton National Bank PLC - Non-voting - - - - 10,457 1,820 100.60 1,052 National Development Bank PLC 20,000 3,504 68.90 1,378 109,918 19,255 78.10 8,585 Nations Trust Bank PLC 209,949 19,546 55.00 11,547 209,949 19,546 60.00 12,597 Pan Asia Banking Corporation PLC - - - - 80,000 1,341 13.00 1,040 Seylan Bank PLC - Voting 443,912 30,620 44.00 19,532 207,144 16,528 46.00 9,529 Seylan Bank PLC - Non-voting 205 8 33.30 7 512,299 20,949 34.00 17,418 Sanasa Development Bank PLC 98,770 9,029 43.00 4,247 101,270 9,258 58.10 5,884 Union Bank of Colombo PLC - - - - 500,000 6,756 11.70 5,850 Total of Banks Sector 72,446 45,541 141,324 82,887

185
Overview Leadership Insights Our Bank Our Strategy Our Performance
Stakeholder Outcomes Accountability Financial Reports Compliance Annexes Supplimentary Information
BANK OF CEYLON | ANNUAL REPORT 2021
Group
As at 31 December 2021 2020
No. of ordinary
shares
Cost of investment
Marketprice
per share
Marketvalue
No. of ordinary
shares
Cost of investment
Market price
per share
Marketvalue
LKR ‘000 LKR LKR ‘000 LKR ‘000 LKR LKR ‘000
Capital GoodsAccess Engineering PLC 951,286 25,887 31.90 30,346 2,367,578 57,667 24.60 58,242 ACL Cables PLC - - - - 191,306 12,887 76.60 14,654 Aitken Spence PLC 2,596,230 256,689 82.40 213,929 3,031,230 329,063 57.80 175,205 Brown and Company PLC 284,241 46,694 369.50 105,027 839,616 135,257 105.20 88,328 Colombo Dockyard PLC 897,625 201,955 79.40 71,271 897,625 201,955 85.30 76,567 E B Creasy & Company PLC 5,000 285 26.50 133 - - - -Hayleys PLC 400,000 41,530 130.00 52,000 - - - - Hemas Holdings PLC 1,177,296 104,246 66.90 78,761 - - - - John Keells Holdings PLC 4,095,048 684,131 150.00 614,257 4,031,028 685,894 149.60 603,042 Kelani Cables PLC - - - - 15,000 1,776 116.50 1,748 Lanka Tiles PLC - - - - 1,238,981 163,758 143.80 178,165 Lankem Ceylon PLC 72,400 32,702 47.80 3,461 72,400 32,702 32.50 2,353 Mackwoods Energy PLC 1,200,000 3,848 2.90 3,480 - - - -MTD Walkers PLC 165,000 6,751 14.80 2,442 165,000 6,751 14.80 2,442 Renuka Holdings PLC 1,288,306 41,135 19.40 24,993 1,218,121 39,812 15.00 18,272 Richard Pieris and Company PLC - - - - 3,539,225 46,860 14.90 52,734 Royal Ceramics Lanka PLC 250,000 19,475 78.10 19,525 134,927 20,182 177.10 23,896 Serendib Engineering 164,900 1,136 7.00 1,154 - - - -Softlogic Holdings PLC - - - - 525,000 7,751 12.40 6,510 The Colombo Fort Land & Building PLC 149,500 10,307 25.40 3,797 290,000 12,853 12.90 3,741 UNISYST Engineering PLC 1,315,380 19,777 21.90 28,807 117,500 2,796 16.90 1,986 Vallibel One PLC 661,758 46,083 72.60 48,044 2,832,421 77,738 26.00 73,643 Total of Capital Goods Sector 1,542,631 1,301,427 1,835,702 1,381,528
Consumer Durables and ApparelAmbeon Holdings PLC 385,000 23,273 48.90 18,827 385,000 23,273 20.70 7,970 Blue Diamonds Jewellery Worldwide
PLC-Non Voting 250,000 125 0.50 125 - - - - Dankotuwa Porcelain PLC 1,000,000 15,395 14.60 14,600 - - - - Hayleys Fabric PLC 1,390,612 54,698 41.20 57,293 295,880 7,266 27.80 8,225 Hayleys Fibre PLC 34,741 2,768 81.30 2,824 - - - - Teejay Lanka PLC 865,000 36,046 44.40 38,406 1,075,872 40,980 38.00 40,883 Total of Consumer Durables and
Apparel Sector 132,305 132,075 71,519 57,078

186
NOTES TO THE FINANCIAL STATEMENTS
BANK OF CEYLON | ANNUAL REPORT 2021
Group
As at 31 December 2021 2020
No. of ordinary
shares
Cost of investment
Marketprice
per share
Marketvalue
No. of ordinary
shares
Cost of investment
Market price
per share
Marketvalue
LKR ‘000 LKR LKR ‘000 LKR ‘000 LKR LKR ‘000
Consumer ServicesAitken Spence Hotel Holdings PLC 2,547,424 232,670 42.30 107,756 2,610,641 238,449 32.30 84,324 Amaya Leisure PLC 1,229,106 54,133 22.50 27,655 609,553 53,907 42.00 25,601 Anilana Hotels & Properties PLC 1,000,000 1,475 1.40 1,400 - - - - Asian Hotels and Properties PLC 2,367,741 225,788 44.10 104,417 2,367,741 225,788 42.90 101,576 Citrus Leisure PLC 136,296 10,502 8.90 1,213 100,000 10,112 10.40 1,040 Dolphin Hotels PLC 15,000 630 37.20 558 15,000 442 26.40 396 Eden Hotel Lanka PLC 903,293 45,541 33.30 30,080 903,293 45,541 11.50 10,388 Jetwing Symphony PLC - - - - 179,627 2,694 9.60 1,724 John Keells Hotels PLC 893,487 14,553 14.70 13,134 893,487 14,553 11.00 9,828 Palm Garden Hotels PLC 28,000 2,052 121.50 3,402 147,472 10,890 27.00 3,982 Tal Lanka Hotels PLC 447,400 30,043 22.10 9,888 447,400 30,043 16.90 7,561 Tangerine Beach Hotels PLC 52,500 5,256 66.00 3,465 50,000 5,056 46.30 2,315 The Fortress Resorts PLC 1,461,100 50,510 13.40 19,579 1,461,100 50,510 12.40 18,118 The Kandy Hotels Company (1938) PLC 175,000 1,617 8.40 1,470 - - - - The Kingsbury PLC 3,875,454 41,834 9.50 36,817 2,161,893 45,360 11.90 25,727 Trans Asia Hotels PLC 477,200 48,407 55.00 26,246 477,200 48,407 65.90 31,447 Waskaduwa Beach Resort PLC 1,500,000 6,340 3.70 5,550 500,000 2,270 3.90 1,950 Total of Consumer Services Sector 771,351 392,630 784,022 325,977
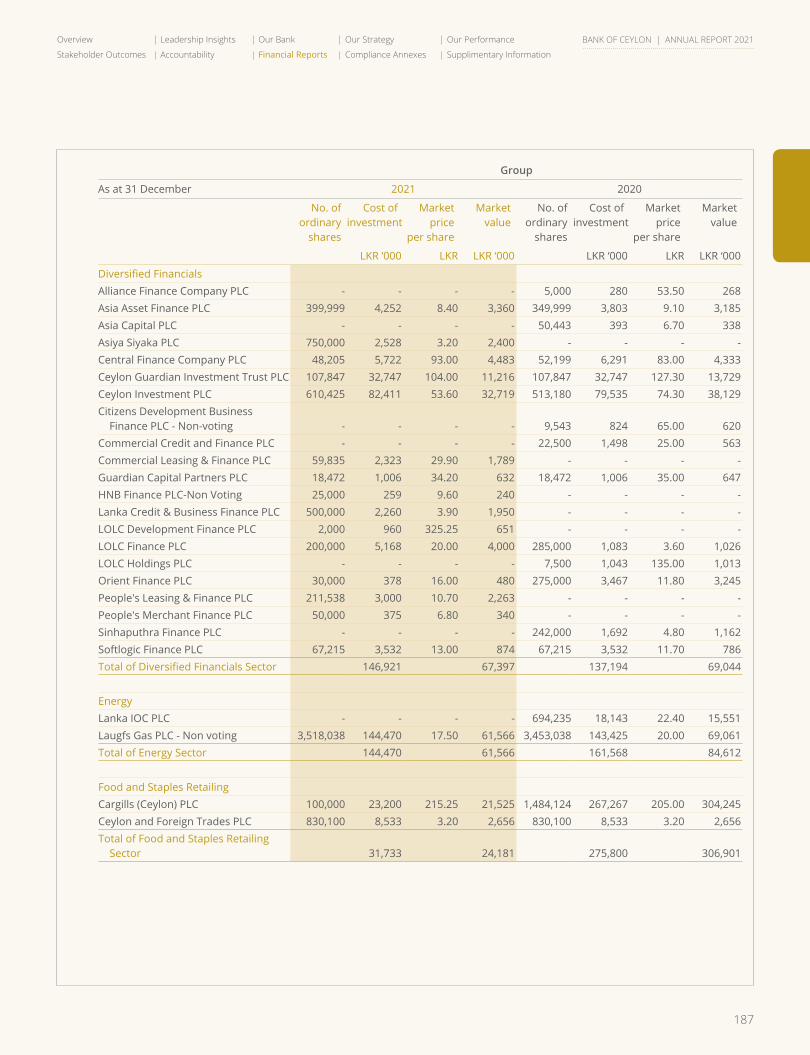
187
Overview Leadership Insights Our Bank Our Strategy Our Performance
Stakeholder Outcomes Accountability Financial Reports Compliance Annexes Supplimentary Information
BANK OF CEYLON | ANNUAL REPORT 2021
Group
As at 31 December 2021 2020
No. of ordinary
shares
Cost of investment
Marketprice
per share
Marketvalue
No. of ordinary
shares
Cost of investment
Market price
per share
Marketvalue
LKR ‘000 LKR LKR ‘000 LKR ‘000 LKR LKR ‘000
Diversified FinancialsAlliance Finance Company PLC - - - - 5,000 280 53.50 268 Asia Asset Finance PLC 399,999 4,252 8.40 3,360 349,999 3,803 9.10 3,185 Asia Capital PLC - - - - 50,443 393 6.70 338 Asiya Siyaka PLC 750,000 2,528 3.20 2,400 - - - - Central Finance Company PLC 48,205 5,722 93.00 4,483 52,199 6,291 83.00 4,333 Ceylon Guardian Investment Trust PLC 107,847 32,747 104.00 11,216 107,847 32,747 127.30 13,729 Ceylon Investment PLC 610,425 82,411 53.60 32,719 513,180 79,535 74.30 38,129 Citizens Development Business
Finance PLC - Non-voting - - - - 9,543 824 65.00 620 Commercial Credit and Finance PLC - - - - 22,500 1,498 25.00 563 Commercial Leasing & Finance PLC 59,835 2,323 29.90 1,789 - - - - Guardian Capital Partners PLC 18,472 1,006 34.20 632 18,472 1,006 35.00 647 HNB Finance PLC-Non Voting 25,000 259 9.60 240 - - - - Lanka Credit & Business Finance PLC 500,000 2,260 3.90 1,950 - - - - LOLC Development Finance PLC 2,000 960 325.25 651 - - - - LOLC Finance PLC 200,000 5,168 20.00 4,000 285,000 1,083 3.60 1,026 LOLC Holdings PLC - - - - 7,500 1,043 135.00 1,013 Orient Finance PLC 30,000 378 16.00 480 275,000 3,467 11.80 3,245 People's Leasing & Finance PLC 211,538 3,000 10.70 2,263 - - - - People's Merchant Finance PLC 50,000 375 6.80 340 - - - - Sinhaputhra Finance PLC - - - - 242,000 1,692 4.80 1,162 Softlogic Finance PLC 67,215 3,532 13.00 874 67,215 3,532 11.70 786 Total of Diversified Financials Sector 146,921 67,397 137,194 69,044
EnergyLanka IOC PLC - - - - 694,235 18,143 22.40 15,551 Laugfs Gas PLC - Non voting 3,518,038 144,470 17.50 61,566 3,453,038 143,425 20.00 69,061 Total of Energy Sector 144,470 61,566 161,568 84,612
Food and Staples RetailingCargills (Ceylon) PLC 100,000 23,200 215.25 21,525 1,484,124 267,267 205.00 304,245 Ceylon and Foreign Trades PLC 830,100 8,533 3.20 2,656 830,100 8,533 3.20 2,656 Total of Food and Staples Retailing
Sector 31,733 24,181 275,800 306,901
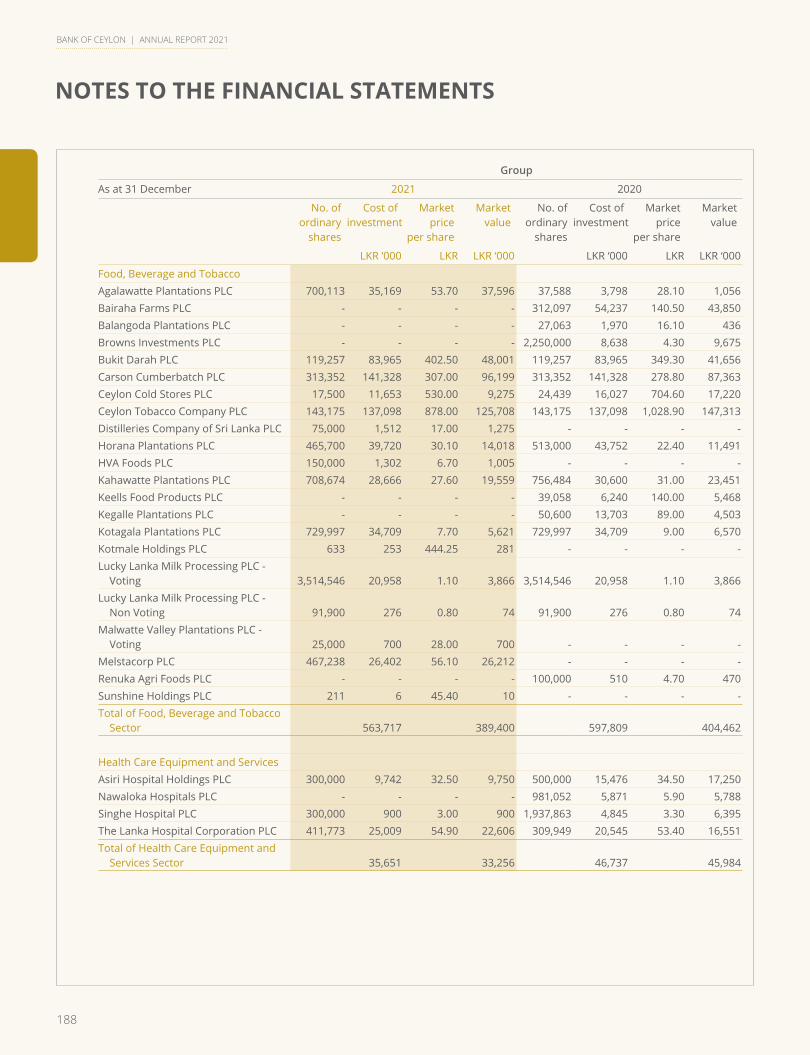
188
NOTES TO THE FINANCIAL STATEMENTS
BANK OF CEYLON | ANNUAL REPORT 2021
Group
As at 31 December 2021 2020
No. of ordinary
shares
Cost of investment
Marketprice
per share
Marketvalue
No. of ordinary
shares
Cost of investment
Market price
per share
Marketvalue
LKR ‘000 LKR LKR ‘000 LKR ‘000 LKR LKR ‘000
Food, Beverage and TobaccoAgalawatte Plantations PLC 700,113 35,169 53.70 37,596 37,588 3,798 28.10 1,056 Bairaha Farms PLC - - - - 312,097 54,237 140.50 43,850 Balangoda Plantations PLC - - - - 27,063 1,970 16.10 436 Browns Investments PLC - - - - 2,250,000 8,638 4.30 9,675 Bukit Darah PLC 119,257 83,965 402.50 48,001 119,257 83,965 349.30 41,656 Carson Cumberbatch PLC 313,352 141,328 307.00 96,199 313,352 141,328 278.80 87,363 Ceylon Cold Stores PLC 17,500 11,653 530.00 9,275 24,439 16,027 704.60 17,220 Ceylon Tobacco Company PLC 143,175 137,098 878.00 125,708 143,175 137,098 1,028.90 147,313 Distilleries Company of Sri Lanka PLC 75,000 1,512 17.00 1,275 - - - - Horana Plantations PLC 465,700 39,720 30.10 14,018 513,000 43,752 22.40 11,491 HVA Foods PLC 150,000 1,302 6.70 1,005 - - - - Kahawatte Plantations PLC 708,674 28,666 27.60 19,559 756,484 30,600 31.00 23,451 Keells Food Products PLC - - - - 39,058 6,240 140.00 5,468 Kegalle Plantations PLC - - - - 50,600 13,703 89.00 4,503 Kotagala Plantations PLC 729,997 34,709 7.70 5,621 729,997 34,709 9.00 6,570 Kotmale Holdings PLC 633 253 444.25 281 - - - - Lucky Lanka Milk Processing PLC -
Voting 3,514,546 20,958 1.10 3,866 3,514,546 20,958 1.10 3,866 Lucky Lanka Milk Processing PLC -
Non Voting 91,900 276 0.80 74 91,900 276 0.80 74 Malwatte Valley Plantations PLC -
Voting 25,000 700 28.00 700 - - - - Melstacorp PLC 467,238 26,402 56.10 26,212 - - - - Renuka Agri Foods PLC - - - - 100,000 510 4.70 470 Sunshine Holdings PLC 211 6 45.40 10 - - - - Total of Food, Beverage and Tobacco
Sector 563,717 389,400 597,809 404,462
Health Care Equipment and ServicesAsiri Hospital Holdings PLC 300,000 9,742 32.50 9,750 500,000 15,476 34.50 17,250 Nawaloka Hospitals PLC - - - - 981,052 5,871 5.90 5,788 Singhe Hospital PLC 300,000 900 3.00 900 1,937,863 4,845 3.30 6,395 The Lanka Hospital Corporation PLC 411,773 25,009 54.90 22,606 309,949 20,545 53.40 16,551 Total of Health Care Equipment and
Services Sector 35,651 33,256 46,737 45,984
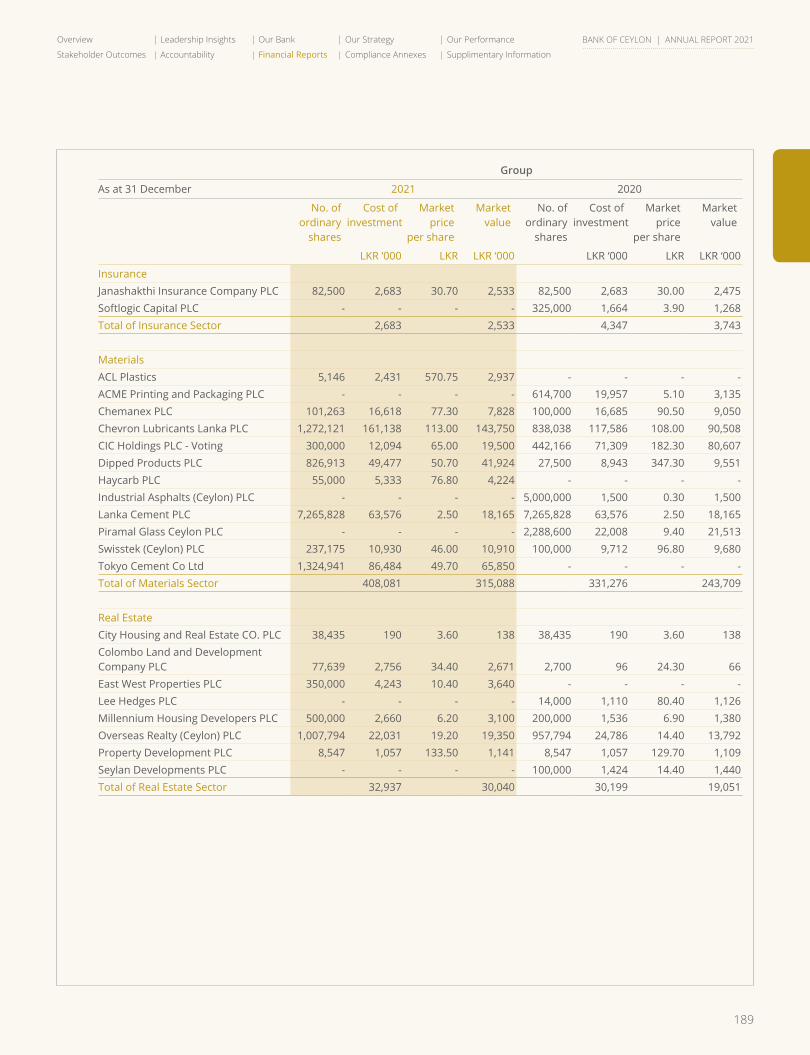
189
Overview Leadership Insights Our Bank Our Strategy Our Performance
Stakeholder Outcomes Accountability Financial Reports Compliance Annexes Supplimentary Information
BANK OF CEYLON | ANNUAL REPORT 2021
Group
As at 31 December 2021 2020
No. of ordinary
shares
Cost of investment
Marketprice
per share
Marketvalue
No. of ordinary
shares
Cost of investment
Market price
per share
Marketvalue
LKR ‘000 LKR LKR ‘000 LKR ‘000 LKR LKR ‘000
InsuranceJanashakthi Insurance Company PLC 82,500 2,683 30.70 2,533 82,500 2,683 30.00 2,475 Softlogic Capital PLC - - - - 325,000 1,664 3.90 1,268 Total of Insurance Sector 2,683 2,533 4,347 3,743
MaterialsACL Plastics 5,146 2,431 570.75 2,937 - - - - ACME Printing and Packaging PLC - - - - 614,700 19,957 5.10 3,135 Chemanex PLC 101,263 16,618 77.30 7,828 100,000 16,685 90.50 9,050 Chevron Lubricants Lanka PLC 1,272,121 161,138 113.00 143,750 838,038 117,586 108.00 90,508 CIC Holdings PLC - Voting 300,000 12,094 65.00 19,500 442,166 71,309 182.30 80,607 Dipped Products PLC 826,913 49,477 50.70 41,924 27,500 8,943 347.30 9,551 Haycarb PLC 55,000 5,333 76.80 4,224 - - - - Industrial Asphalts (Ceylon) PLC - - - - 5,000,000 1,500 0.30 1,500 Lanka Cement PLC 7,265,828 63,576 2.50 18,165 7,265,828 63,576 2.50 18,165 Piramal Glass Ceylon PLC - - - - 2,288,600 22,008 9.40 21,513 Swisstek (Ceylon) PLC 237,175 10,930 46.00 10,910 100,000 9,712 96.80 9,680 Tokyo Cement Co Ltd 1,324,941 86,484 49.70 65,850 - - - - Total of Materials Sector 408,081 315,088 331,276 243,709
Real EstateCity Housing and Real Estate CO. PLC 38,435 190 3.60 138 38,435 190 3.60 138 Colombo Land and Development Company PLC 77,639 2,756 34.40 2,671 2,700 96 24.30 66 East West Properties PLC 350,000 4,243 10.40 3,640 - - - - Lee Hedges PLC - - - - 14,000 1,110 80.40 1,126 Millennium Housing Developers PLC 500,000 2,660 6.20 3,100 200,000 1,536 6.90 1,380 Overseas Realty (Ceylon) PLC 1,007,794 22,031 19.20 19,350 957,794 24,786 14.40 13,792 Property Development PLC 8,547 1,057 133.50 1,141 8,547 1,057 129.70 1,109 Seylan Developments PLC - - - - 100,000 1,424 14.40 1,440 Total of Real Estate Sector 32,937 30,040 30,199 19,051

190
NOTES TO THE FINANCIAL STATEMENTS
BANK OF CEYLON | ANNUAL REPORT 2021
Group
As at 31 December 2021 2020
No. of ordinary
shares
Cost of investment
Marketprice
per share
Marketvalue
No. of ordinary
shares
Cost of investment
Market price
per share
Marketvalue
LKR ‘000 LKR LKR ‘000 LKR ‘000 LKR LKR ‘000
RetailingC M Holdings PLC - - - - 50,857 17,422 78.50 3,992 C. W. Mackie PLC - - - - 44,795 2,304 48.00 2,150 Diesel and Motor Engineering PLC 81,054 84,515 618.00 50,091 77,935 84,514 618.20 48,179 Eastern Merchants PLC 325,000 3,013 9.00 2,925 - - - - Hunters and Company PLC 18,000 14,561 650.00 11,700 27,100 21,924 748.50 20,284 John Keells PLC 250,200 22,758 71.90 17,989 250,200 22,758 61.50 15,387 Odel PLC 222,295 9,325 25.20 5,602 222,295 9,325 21.10 4,690 R I L Property PLC - - - - 250,000 2,484 8.60 2,150 Sathosa Motors PLC 13,194 5,111 201.50 2,659 13,194 5,111 271.60 3,584 United Motors Lanka PLC 152,000 14,220 93.10 14,151 542,177 50,484 79.00 42,832 Total of Retailing Sector 153,503 105,117 216,326 143,248
Telecommunication ServicesDialog Axiata PLC - - - - 1,427,200 17,119 12.40 17,697 Sri Lanka Telecom PLC 224,000 7,896 38.80 8,691 214,000 7,496 33.50 7,169 Total of Telecommunication Services
Sector 7,896 8,691 24,615 24,866
TransportationExpolanka Holdings PLC - - - - 500,000 11,840 29.00 14,500 Total of Transportation Sector - - 11,840 14,500
UtilitiesLaugfs Power PLC - non voting 1,397,831 917 8.50 11,882 1,297,831 - 7.40 9,604 Lotus Hydro Power PLC - - - - 75,000 819 10.60 795 LVL Energy Fund PLC - - - - 648,100 6,481 10.20 6,611 Panasian Power PLC 1,179,200 7,272 5.50 6,486 1,029,200 6,407 4.10 4,220 Resus Energy PLC 1,211,334 38,741 40.90 49,544 1,668,778 56,285 27.00 45,057 Vallibel Power Erathna PLC 100,000 870 8.60 860 1,667,050 13,970 7.90 13,170 Vidullanka PLC - - - - 50,000 299 6.00 300 Total of Utilities Sector 47,800 68,772 84,261 79,757
Total quoted equities 4,094,125 2,977,714 4,769,166 3,304,477

191
Overview Leadership Insights Our Bank Our Strategy Our Performance
Stakeholder Outcomes Accountability Financial Reports Compliance Annexes Supplimentary Information
BANK OF CEYLON | ANNUAL REPORT 2021
27.3 Quoted Debt Securities
Group
As at 31 December 2021 2020
No. of debenture
Cost of investment
Marketprice
per debenture
Marketvalue
No. of debenture
Cost of investment
Market price
per debenture
Marketvalue
LKR ‘000 LKR LKR ‘000 LKR ‘000 LKR LKR ‘000
Listed DebenturesHatton National Bank PLC - - - - 17,500 1,600 100.00 1,750 Total quoted debt securities - - 1,600 1,750
27.4 Units in Unit Trusts
As at 31 December 2021 2020
No. ofunits
Cost of investment
Marketvalue
No. of units
Cost of investment
Marketvalue
LKR ‘000 LKR ‘000 LKR ‘000 LKR ‘000 LKR ‘000
BankCeybank Unit Trust 111,307,627 1,738,215 3,466,120 111,307,627 1,738,215 2,558,962 Ceybank Century Growth Fund 7,539,256 132,952 701,151 7,539,256 132,952 552,854 Ceybank Surekum Gilt Edged Fund 4,921 50 64 4,921 50 61 Total units in unit trusts 1,871,217 4,167,335 1,871,217 3,111,877
GroupCeybank Unit Trust 111,307,627 1,738,215 3,466,120 111,307,627 1,738,215 2,558,962 Ceybank Century Growth Fund 7,539,256 132,952 701,151 7,539,256 132,952 552,854 Ceybank Surekum Gilt Edged Fund 4,921 50 64 4,921 50 61 Comtrust Money Market Fund 289,530 2,777 3,597 289,530 2,777 3,419 First Capital Asset Management Limited 29,387 40,778 51,979 29,387 40,778 49,416 Total units in unit trusts 1,914,772 4,222,911 1,914,772 3,164,712
28 Loans and Advances to Customers
Accounting Policy
Loans and advances include non-derivative financial assets with fixed or determinable payments that are not quoted in an active market, other than:
- Those that the Bank intends to sell immediately or in the near term and those that the Bank, upon initial recognition, designates as at fair value through profit or loss
- Those that the Bank, upon initial recognition, designates as fair value through OCI
- Those for which the Bank may not recover substantially all of its initial investment, other than due to credit deterioration
“Loans and advances” are initially measured at fair value and subsequently measured at amortised cost using the Effective Interest Rate (EIR), less allowance for impairment. Amortised cost is calculated by taking into account any discount or premium on acquisition and fees and costs that are an integral part of the EIR. The amortisation is included in “Interest income”(Note 8.1) in the Statement of Profit or Loss. The losses arising from impairment are recognised in “Impairment charge/(reversal) for loans and other losses” (Note 14) in the Statement of Profit or Loss.
192
NOTES TO THE FINANCIAL STATEMENTS
BANK OF CEYLON | ANNUAL REPORT 2021
Write-offofLoansandReceivables
Loans together with the associated allowance are written off when there is no realistic prospect of future recovery and all collateral has been realised . If a write-off is later recovered, the recovery is recognised in the “Net other operating income” (Note 13).
Collateral Valuation
The Group seeks to use collateral, where possible, to mitigate its risks on financial assets. The collateral comes in various forms such as cash, gold, securities, letters of credit/guarantees, real estate, inventories, other non-financial assets and credit enhancements such as netting arrangements. The fair value of collateral is generally assessed, at a minimum, at inception and based on the guidelines issued by Central Bank of Sri Lanka, there on.
Non-financial collaterals, including immovable and movables, are valued based on data provided by the independent professional valuers and Audited Financial Statements.
Collaterals Repossessed
The Group’s policy is to dispose of repossessed properties through parate execution or fiscal conveys (Foreclosed properties) in an orderly fashion. The proceeds are used to reduce or repay the outstanding claim. In general, the Group does not occupy repossessed properties for business use.
Renegotiated Loans (Restructured or Rescheduled)
Where possible, the Group seeks to renegotiate loans rather than take possession of collateral. This may involve extending the payment arrangements and agreement of new loan conditions. Once the terms have been renegotiated, any impairment is measured using the original EIR as calculated before the modification of terms. The management continuously reviews renegotiated loans to ensure that all criteria are met and that future payments are likely to occur. The loans continue to be subject to an individual or collective impairment assessment, calculated using the loan’s original EIR. Further the Bank may consider modifications for original terms and conditions to retain customer, support customer or/ and expansions.
Expected Credit Loss (ECL)
The Bank’s impairment provisioning method has fundamentally changed due to the adoption of SLFRS 9 by replacing LKAS 39 “Financial Instruments Recognition and Measurement” incurred loss approach with forward looking expected loss approach as mentioned in Note 4.4.11 to this Financial Statements. Accordingly, the Bank has recorded an expected credit loss allowance for all loans and other debt financial assets except which are held at FVPL, together with loan commitments and financial guarantee contracts which are commonly referred to as “financial instruments”.
The ECL allowance is based on the credit losses expected to arise over the life of the asset, the Lifetime Expected Credit Loss (LTECL) as outlined in Notes 4.4.11.2 and 4.4.11.3, if there has been no significant increase in credit risk since origination, in which case, the allowance is based on the 12 months’ expected credit loss (12mECL) as outlined in Note 4.4.11.1 to the Financial Statements. The Bank’s policies for determining whether there has been a significant increase in credit risk are set out in this note.
Both LTECLs and 12mECLs are calculated either on an individual basis or on collective basis, depending on the nature and size of the underlying portfolio of financial instruments. The Bank’s policy for grouping financial instruments measured on a collective basis is explained in Note 4.4.11.5.
The Bank has established a policy to perform an assessment, at the end of each reporting period, of whether a financial instrument’s credit risk has increased significantly since initial recognition, by considering the change in the risk of default occurring over the remaining life of the financial instrument.
Based on the above process, the Bank grouped its loans into Stage 1, Stage 2 and Stage 3 as described in Note 4.4.11.1 to 4.4.11.3 to this Financial Statements.
For financial assets in respect of which the Bank has no reasonable expectations of recovering either the entire outstanding amount, or a proportion thereof, the gross carrying amount of the financial asset is reduced.

193
Overview Leadership Insights Our Bank Our Strategy Our Performance
Stakeholder Outcomes Accountability Financial Reports Compliance Annexes Supplimentary Information
BANK OF CEYLON | ANNUAL REPORT 2021
The components of the ECL calculation is outlined under Note 4.4.11.4 to this Financial Statements and when estimating the ECLs, the Bank considers three economic scenarios (base case, best case and worst case). Each of these scenarios are associated with different loss rates.
For all products the Bank considers the maximum period over which the credit losses are determined is the contractual life of a financial instrument.
“Impairment losses and reversals are accounted for and disclosed separately from modification losses or gains that are accounted for as an adjustment of the financial asset’s gross carrying value.”
The methodology used for calculation of the ECL are summarised below:
Stage Classification Criteria ECL measurement
Stage 1 Includes financial assets that have not had a significant increase in credit risk since initial recognition or that have low credit risk at the reporting date. For these financial assets, 12mECLs are recognised i.e. the expected credit losses which result from default events that are possible within 12 months after the reporting date. It is not the expected cash shortfalls over the 12-month period but the entire credit loss on an asset weighted by the probability that the loss will occur in the next 12 months.
12 months’ expected credit loss
ECL12 = EAD12M * PD12M * LGDT * EFA12M (1 + EIR)n
Stage 2 Includes financial assets that have had a significant increase in credit risk since initial recognition but that do not have objective evidence of impairment. For these assets, LTECLs are recognised. LTECLs are the expected credit losses that result from all possible default events over the remaining maturity period of the loan from the reporting date. Expected credit losses are the weighted average credit losses with the probability of default (“PD”) as the weight.
Life time expected credit loss ECLLT= ∑t EADLT * PDLT * LGDT *EFAn + ....+ EADLT* PD(LT-t) *LGDT* EFAn (1 + EIR) (1 + EIR)n
Stage 3 Includes financial assets that have objective evidence of impairment at the reporting date which shows a significant credit risk. Lifetime ECLs are recognised based on the 100% probability.
Life time expected credit loss with probability of default at 100%. ECLLT = EADT * 100% * LGDT
Loan Commitments
When estimating ECLs for undrawn loan commitments, the Bank estimates the expected portion of the loan commitment that will be drawn down over its expected life. The ECL is then based on the present value of the expected shortfalls in cash flows if the loan is drawn down, based on a probability-weighting of the three scenarios. The expected cash shortfalls are discounted at an approximation to the expected EIR on the loan. For credit cards and revolving facilities, that include both a loan and an undrawn commitments, ECLs are calculated and presented together with the loan and loan commitments.
Financial Guarantee Contracts
The Bank’s liability under each guarantee is measured at the higher of the amount initially recognised less cumulative amortisation recognised in the statement of profit or loss, and the ECL provision. For this purpose, the Bank estimates ECLs based on the present value of the expected payments to reimburse the holder for a credit loss that it incurs. The shortfalls are discounted by the risk adjusted interest rate relevant to the exposure. The calculation is made using a probability-weighting of the three scenarios.
194
NOTES TO THE FINANCIAL STATEMENTS
BANK OF CEYLON | ANNUAL REPORT 2021
Revolving Facilities
The Bank’s product offering includes a variety of corporate and retail facilities, in which the Bank has the right to cancel and/or reduce the facilities with one day’s notice (eg: Overdraft and Credit Card). The Bank does not limit its exposure to credit losses to the contractual notice period, but, instead calculates ECL over a period that reflects the Bank’s expectations of the customer behaviour, its likelihood of default and the Bank’s future risk mitigation procedures, which could include reducing or cancelling the facilities.
The ongoing assessment of whether a significant increase in credit risk has occurred for revolving facilities is similar to other lending products. This is based on shifts in the customer’s delinquency.
The calculation of ECLs, including the estimation of the expected period of exposure and discount rate is made on an individual basis for individually significant loans and on a collective basis for other loans. The collective assessments are made separately for portfolios of facilities with similar homogeneous characteristics.
Forward Looking Information
In its ECL models, the Bank relies on a broad range of forward looking information as economic inputs, such as:
• GDP growth • Interest rate • Inflation • Exchange rate • Unemployment rates
Impairment Assessment
DefinitionofDefaultandUpgrade
The Bank considers a financial instrument defaulted and therefore assessed in Stage 3 (as credit-impaired) for ECL calculations in all cases when the borrower becomes 90 days past due on its contractual payments or the credit facility/ customer is classified as a non performing advance in accordance with CBSL directions.
As a part of a qualitative assessment of whether a customer is in default, the Bank also considers a variety of instances that may indicate unlikeliness to pay. When such events occur, the Bank carefully considers whether the event should result in treating the customer as defaulted and therefore assessed as Stage 3 for ECL calculations or whether Stage 2 is appropriate. Such events include:
• Credit rating of a borrower has been subsequently downgraded to B+ or below under the Sri Lankan National Rating scale by and External Credit Assessment Institution (ECAI).
• A two-notch downgrade under the Bank’s internal rating.
• Reasonable and supportable forecasts of future economic conditions show a direct negative impact on the performance of a customer/group of customers.
• A significant change in the geographical locations or natural catastrophes that directly impact the performance of a customer/group of customers.
• The value of collateral is significantly reduced and /or realisability of collateral is doubtful.
• Frequent changes in the Board of Directors and Senior Management of an institutional customer.
• Delay in commencement of business operations/projects by more than two years from the originally agreed date.
• Modification of terms resulting in concessions, including extensions, deferment of payments, waiver of covenants and other restructuring of credit facilities.

195
Overview Leadership Insights Our Bank Our Strategy Our Performance
Stakeholder Outcomes Accountability Financial Reports Compliance Annexes Supplimentary Information
BANK OF CEYLON | ANNUAL REPORT 2021
• A fall of 50% or more in the turnover and / or profit before tax of the borrower when compared to the previous year for two consecutive years and /or erosion of net-worth of the borrower by more than 25% (other than due to changes in equity structure and dividend policy) when compared to the previous financial year, and reduction will effect to the settlement of future contractual payments.
• The borrower is subject to litigation that significantly affects the performance of the credit facility.
• Unable to contact or find the borrower
• Claims made under obligation of Letter of Guarantee.
• The borrower is deceased / insolvent.
• Any other criteria that, materially impacted for recoverability.
It is the Bank’s policy to consider a financial instrument as “upgraded” and therefore re-classified out of Stage 3 when none of the default criteria is no longer present. The decision whether to classify an asset as Stage 2 or Stage 1 once upgraded depends on the updated credit grade, at the time of the upgrade, and whether there has been a significant increase in credit risk compared to initial recognition. Further restructured facilities are considered as “upgraded” once a satisfactory performing period of a minimum 90 days subsequent to the first capital and/ or interest installment post-restructure is in place, while upgrading of rescheduled facilities, branch/business unit should obtain the approval from the Chief Risk Officer confirming the customer’s ability of servicing debt obligation upto a forseeable future.
Probability of Default Estimation Process
The Bank estimates the Probability of Default (PD) based on historical information with regard to delinquency of loans and advances. In this process historical information pertaining to 3-5 years have been used depending on the nature of the product
Exposure at Default
The exposure at default (EAD) represents the gross carrying amount of the financial instruments subject to the impairment calculation, addressing both the client’s ability to increase its exposure while approaching default and potential early repayments too.
To calculate the EAD for Stage 1 loan facilities, the Bank assesses the possible default events within 12 months in the calculation of the 12mECL. For Stage 2, Stage 3 and Purchase or Credit Impaired (POCI) financial assets, the exposure at default is considered for events over the lifetime of the instruments.
The Bank determines EADs by modelling the range of possible exposure outcomes at various points in time. PDs are then assigned to the EAD so derived.
Loss Given Default
The Bank segments its lending portfolio into homogeneous portfolios, based on key characteristics that are relevant to the estimation of future cash flows. The loss given default is estimated based on historically collected loss data.
Significantincreaseincreditrisk
The Bank continuously monitors all assets subject to ECLs. In order to determine whether an instrument or a portfolio of instruments is subject to 12mECL or LTECL, the Bank assesses whether there has been a significant increase in credit risk since initial recognition. The Bank considers an exposure to have significantly increased in credit risk when the borrower becomes 30 days past due from the contractual due date.
The Bank also applies a secondary qualitative method for triggering a significant increase in credit risk for an asset, such as moving a customer/facility to the watch list, or reschedulement or restructure. Regardless of the change in credit grades, if contractual payments are more than 30 days past due, the credit risk is deemed to have increased significantly since initial recognition.
When estimating ECLs on a collective basis for a group of similar assets, the Bank applies the same principles for assessing whether there has been a significant increase in credit risk since initial recognition.
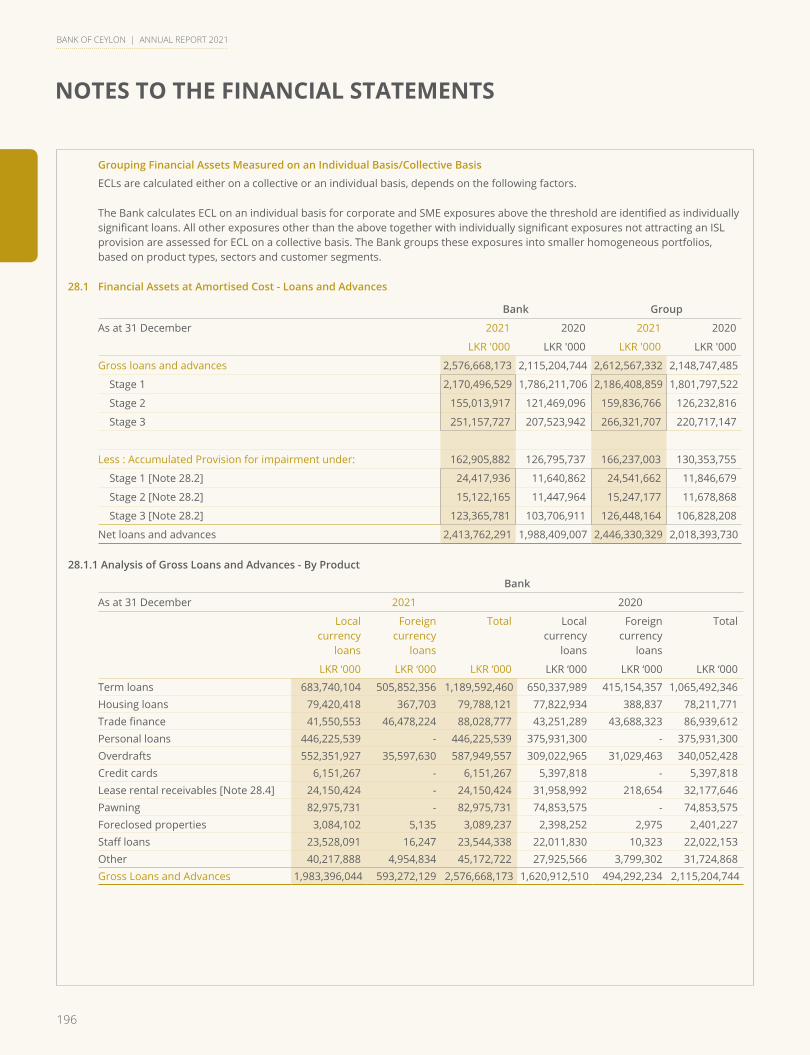
196
NOTES TO THE FINANCIAL STATEMENTS
BANK OF CEYLON | ANNUAL REPORT 2021
Grouping Financial Assets Measured on an Individual Basis/Collective Basis
ECLs are calculated either on a collective or an individual basis, depends on the following factors.
The Bank calculates ECL on an individual basis for corporate and SME exposures above the threshold are identified as individually significant loans. All other exposures other than the above together with individually significant exposures not attracting an ISL provision are assessed for ECL on a collective basis. The Bank groups these exposures into smaller homogeneous portfolios, based on product types, sectors and customer segments.
28.1 Financial Assets at Amortised Cost - Loans and Advances
Bank Group
As at 31 December 2021 2020 2021 2020
LKR '000 LKR '000 LKR '000 LKR '000
Gross loans and advances 2,576,668,173 2,115,204,744 2,612,567,332 2,148,747,485
Stage 1 2,170,496,529 1,786,211,706 2,186,408,859 1,801,797,522
Stage 2 155,013,917 121,469,096 159,836,766 126,232,816
Stage 3 251,157,727 207,523,942 266,321,707 220,717,147
Less : Accumulated Provision for impairment under: 162,905,882 126,795,737 166,237,003 130,353,755
Stage 1 [Note 28.2] 24,417,936 11,640,862 24,541,662 11,846,679
Stage 2 [Note 28.2] 15,122,165 11,447,964 15,247,177 11,678,868
Stage 3 [Note 28.2] 123,365,781 103,706,911 126,448,164 106,828,208
Net loans and advances 2,413,762,291 1,988,409,007 2,446,330,329 2,018,393,730
28.1.1 Analysis of Gross Loans and Advances - By Product
Bank
As at 31 December 2021 2020
Localcurrency
loans
Foreigncurrency
loans
Total Localcurrency
loans
Foreigncurrency
loans
Total
LKR ‘000 LKR ‘000 LKR ‘000 LKR ‘000 LKR ‘000 LKR ‘000
Term loans 683,740,104 505,852,356 1,189,592,460 650,337,989 415,154,357 1,065,492,346Housing loans 79,420,418 367,703 79,788,121 77,822,934 388,837 78,211,771 Trade finance 41,550,553 46,478,224 88,028,777 43,251,289 43,688,323 86,939,612 Personal loans 446,225,539 - 446,225,539 375,931,300 - 375,931,300 Overdrafts 552,351,927 35,597,630 587,949,557 309,022,965 31,029,463 340,052,428 Credit cards 6,151,267 - 6,151,267 5,397,818 - 5,397,818 Lease rental receivables [Note 28.4] 24,150,424 - 24,150,424 31,958,992 218,654 32,177,646 Pawning 82,975,731 - 82,975,731 74,853,575 - 74,853,575 Foreclosed properties 3,084,102 5,135 3,089,237 2,398,252 2,975 2,401,227 Staff loans 23,528,091 16,247 23,544,338 22,011,830 10,323 22,022,153 Other 40,217,888 4,954,834 45,172,722 27,925,566 3,799,302 31,724,868 Gross Loans and Advances 1,983,396,044 593,272,129 2,576,668,173 1,620,912,510 494,292,234 2,115,204,744
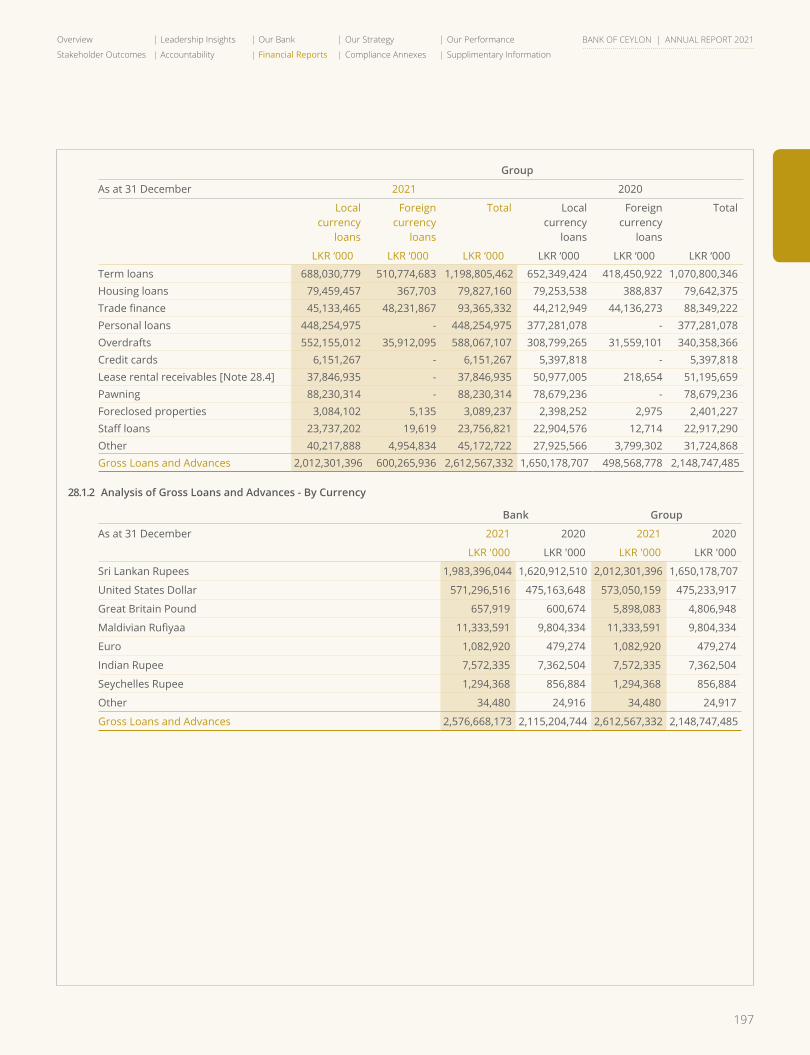
197
Overview Leadership Insights Our Bank Our Strategy Our Performance
Stakeholder Outcomes Accountability Financial Reports Compliance Annexes Supplimentary Information
BANK OF CEYLON | ANNUAL REPORT 2021
Group
As at 31 December 2021 2020
Localcurrency
loans
Foreigncurrency
loans
Total Localcurrency
loans
Foreigncurrency
loans
Total
LKR ‘000 LKR ‘000 LKR ‘000 LKR ‘000 LKR ‘000 LKR ‘000
Term loans 688,030,779 510,774,683 1,198,805,462 652,349,424 418,450,922 1,070,800,346Housing loans 79,459,457 367,703 79,827,160 79,253,538 388,837 79,642,375 Trade finance 45,133,465 48,231,867 93,365,332 44,212,949 44,136,273 88,349,222 Personal loans 448,254,975 - 448,254,975 377,281,078 - 377,281,078 Overdrafts 552,155,012 35,912,095 588,067,107 308,799,265 31,559,101 340,358,366 Credit cards 6,151,267 - 6,151,267 5,397,818 - 5,397,818 Lease rental receivables [Note 28.4] 37,846,935 - 37,846,935 50,977,005 218,654 51,195,659 Pawning 88,230,314 - 88,230,314 78,679,236 - 78,679,236 Foreclosed properties 3,084,102 5,135 3,089,237 2,398,252 2,975 2,401,227 Staff loans 23,737,202 19,619 23,756,821 22,904,576 12,714 22,917,290 Other 40,217,888 4,954,834 45,172,722 27,925,566 3,799,302 31,724,868 Gross Loans and Advances 2,012,301,396 600,265,936 2,612,567,332 1,650,178,707 498,568,778 2,148,747,485
28.1.2 Analysis of Gross Loans and Advances - By Currency
Bank Group
As at 31 December 2021 2020 2021 2020
LKR '000 LKR '000 LKR '000 LKR '000
Sri Lankan Rupees 1,983,396,044 1,620,912,510 2,012,301,396 1,650,178,707
United States Dollar 571,296,516 475,163,648 573,050,159 475,233,917
Great Britain Pound 657,919 600,674 5,898,083 4,806,948
Maldivian Rufiyaa 11,333,591 9,804,334 11,333,591 9,804,334
Euro 1,082,920 479,274 1,082,920 479,274
Indian Rupee 7,572,335 7,362,504 7,572,335 7,362,504
Seychelles Rupee 1,294,368 856,884 1,294,368 856,884
Other 34,480 24,916 34,480 24,917
Gross Loans and Advances 2,576,668,173 2,115,204,744 2,612,567,332 2,148,747,485
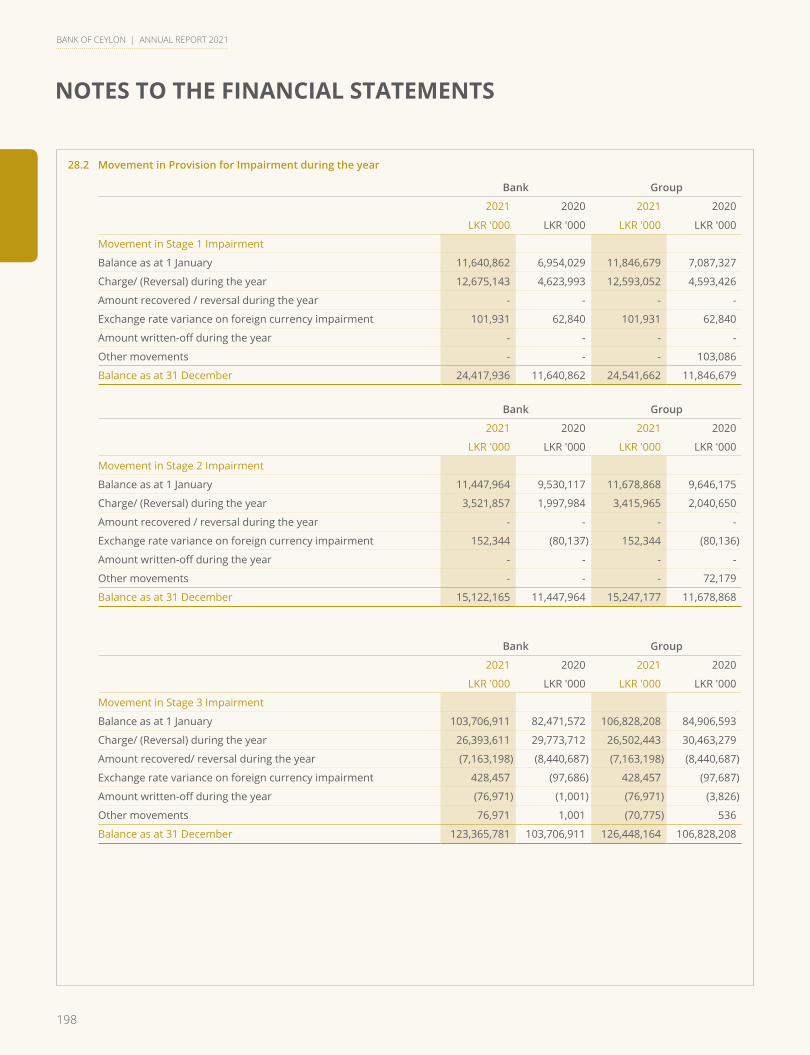
198
NOTES TO THE FINANCIAL STATEMENTS
BANK OF CEYLON | ANNUAL REPORT 2021
28.2 Movement in Provision for Impairment during the year
Bank Group
2021 2020 2021 2020
LKR '000 LKR '000 LKR '000 LKR '000
Movement in Stage 1 Impairment
Balance as at 1 January 11,640,862 6,954,029 11,846,679 7,087,327
Charge/ (Reversal) during the year 12,675,143 4,623,993 12,593,052 4,593,426
Amount recovered / reversal during the year - - - -
Exchange rate variance on foreign currency impairment 101,931 62,840 101,931 62,840
Amount written-off during the year - - - -
Other movements - - - 103,086
Balance as at 31 December 24,417,936 11,640,862 24,541,662 11,846,679
Bank Group
2021 2020 2021 2020
LKR '000 LKR '000 LKR '000 LKR '000
Movement in Stage 2 Impairment
Balance as at 1 January 11,447,964 9,530,117 11,678,868 9,646,175
Charge/ (Reversal) during the year 3,521,857 1,997,984 3,415,965 2,040,650
Amount recovered / reversal during the year - - - -
Exchange rate variance on foreign currency impairment 152,344 (80,137) 152,344 (80,136)
Amount written-off during the year - - - -
Other movements - - - 72,179
Balance as at 31 December 15,122,165 11,447,964 15,247,177 11,678,868
Bank Group
2021 2020 2021 2020
LKR '000 LKR '000 LKR '000 LKR '000
Movement in Stage 3 Impairment
Balance as at 1 January 103,706,911 82,471,572 106,828,208 84,906,593
Charge/ (Reversal) during the year 26,393,611 29,773,712 26,502,443 30,463,279
Amount recovered/ reversal during the year (7,163,198) (8,440,687) (7,163,198) (8,440,687)
Exchange rate variance on foreign currency impairment 428,457 (97,686) 428,457 (97,687)
Amount written-off during the year (76,971) (1,001) (76,971) (3,826)
Other movements 76,971 1,001 (70,775) 536
Balance as at 31 December 123,365,781 103,706,911 126,448,164 106,828,208

199
Overview Leadership Insights Our Bank Our Strategy Our Performance
Stakeholder Outcomes Accountability Financial Reports Compliance Annexes Supplimentary Information
BANK OF CEYLON | ANNUAL REPORT 2021
Bank Group
2021 2020 2021 2020
LKR '000 LKR '000 LKR '000 LKR '000
Movement in Total Impairment
Balance as at 1 January 126,795,737 98,955,718 130,353,755 101,640,095
Charge/ (Reversal) during the year 42,590,611 36,395,689 42,511,460 37,097,355
Amount recovered/ reversal during the year (7,163,198) (8,440,687) (7,163,198) (8,440,687)
Exchange rate variance on foreign currency impairment 682,732 (114,983) 682,732 (114,983)
Amount written-off during the year (76,971) (1,001) (76,971) (3,826)
Other movements 76,971 1,001 (70,775) 175,801
Balance as at 31 December 162,905,882 126,795,737 166,237,003 130,353,755
28.3 Sensitivity Factors Used to Calculate Impairment Provision
Sensitivity SensitivityEffecton Impairment Provisions
2021 2020
LKR '000 LKR '000
Change in Loss Given Default (LGD) 1% 5,233,770 3,775,248
-1% (5,233,770) (3,775,248)
Change in Economic Factor Adjustment (EFA) Worst case degrades by 5% 379,797 341,875
Worst case upgrades by 5% (379,160) (150,328)
Change in Deemed Closed Period Advanced by one year 2,702,782 2,518,712
Deferred by one year (1,809,974) (1,686,708)
28.4 Lease Rentals Receivables
Accounting Policy
Assets leased to customers, which transfer substantially all the risks and rewards associated with ownership, other than legal title, are classified as finance leases. Amounts receivable under finance leases are classified as lease and hire purchase receivables and presented within loans and receivables to customers in the Statement of Financial Position, after deduction of unearned lease income and the impairment for rentals doubtful of recovery.
Bank Group
As at 31 December 2021 2020 2021 2020
LKR '000 LKR '000 LKR '000 LKR '000
Gross lease rental receivables
Within one year 11,920,246 16,980,108 18,608,059 23,466,599
One to five years 17,919,803 21,151,596 22,730,883 31,754,262
More than five years 102,794 185,895 409,228 185,895
29,942,843 38,317,599 41,748,170 55,406,756
Less : Unearned finance income 5,792,419 6,139,953 3,901,235 4,211,097
Gross lease rentals receivables 24,150,424 32,177,646 37,846,935 51,195,659
Less : Provision for impairment losses 736,549 1,378,431 2,486,316 3,191,120
Net lease rental receivables 23,413,875 30,799,215 35,360,619 48,004,539
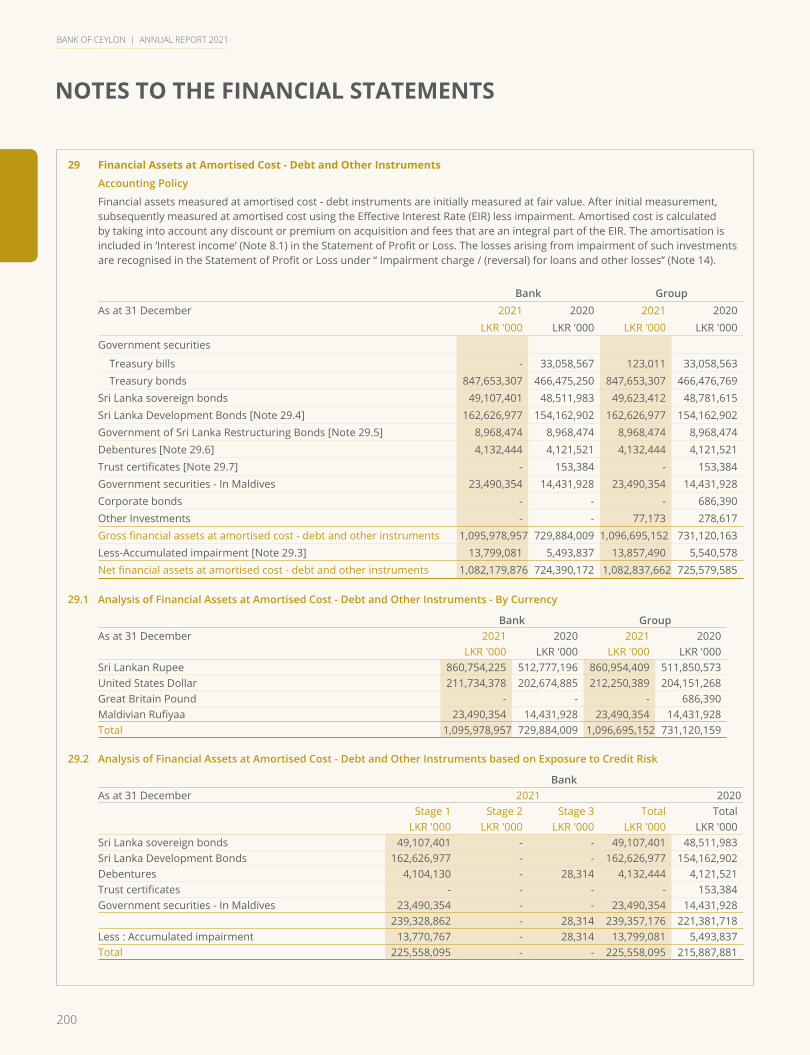
200
NOTES TO THE FINANCIAL STATEMENTS
BANK OF CEYLON | ANNUAL REPORT 2021
29 Financial Assets at Amortised Cost - Debt and Other Instruments
Accounting Policy
Financial assets measured at amortised cost - debt instruments are initially measured at fair value. After initial measurement, subsequently measured at amortised cost using the Effective Interest Rate (EIR) less impairment. Amortised cost is calculated by taking into account any discount or premium on acquisition and fees that are an integral part of the EIR. The amortisation is included in ‘Interest income’ (Note 8.1) in the Statement of Profit or Loss. The losses arising from impairment of such investments are recognised in the Statement of Profit or Loss under “ Impairment charge / (reversal) for loans and other losses” (Note 14).
Bank GroupAs at 31 December 2021 2020 2021 2020
LKR '000 LKR '000 LKR '000 LKR '000Government securities
Treasury bills - 33,058,567 123,011 33,058,563 Treasury bonds 847,653,307 466,475,250 847,653,307 466,476,769 Sri Lanka sovereign bonds 49,107,401 48,511,983 49,623,412 48,781,615 Sri Lanka Development Bonds [Note 29.4] 162,626,977 154,162,902 162,626,977 154,162,902 Government of Sri Lanka Restructuring Bonds [Note 29.5] 8,968,474 8,968,474 8,968,474 8,968,474 Debentures [Note 29.6] 4,132,444 4,121,521 4,132,444 4,121,521 Trust certificates [Note 29.7] - 153,384 - 153,384 Government securities - In Maldives 23,490,354 14,431,928 23,490,354 14,431,928 Corporate bonds - - - 686,390 Other Investments - - 77,173 278,617 Gross financial assets at amortised cost - debt and other instruments 1,095,978,957 729,884,009 1,096,695,152 731,120,163 Less-Accumulated impairment [Note 29.3] 13,799,081 5,493,837 13,857,490 5,540,578 Net financial assets at amortised cost - debt and other instruments 1,082,179,876 724,390,172 1,082,837,662 725,579,585
29.1 Analysis of Financial Assets at Amortised Cost - Debt and Other Instruments - By Currency
Bank GroupAs at 31 December 2021 2020 2021 2020
LKR '000 LKR '000 LKR '000 LKR '000Sri Lankan Rupee 860,754,225 512,777,196 860,954,409 511,850,573 United States Dollar 211,734,378 202,674,885 212,250,389 204,151,268 Great Britain Pound - - - 686,390 Maldivian Rufiyaa 23,490,354 14,431,928 23,490,354 14,431,928 Total 1,095,978,957 729,884,009 1,096,695,152 731,120,159
29.2 Analysis of Financial Assets at Amortised Cost - Debt and Other Instruments based on Exposure to Credit Risk
BankAs at 31 December 2021 2020
Stage 1 Stage 2 Stage 3 Total TotalLKR '000 LKR '000 LKR '000 LKR '000 LKR '000
Sri Lanka sovereign bonds 49,107,401 - - 49,107,401 48,511,983 Sri Lanka Development Bonds 162,626,977 - - 162,626,977 154,162,902 Debentures 4,104,130 - 28,314 4,132,444 4,121,521 Trust certificates - - - - 153,384 Government securities - In Maldives 23,490,354 - - 23,490,354 14,431,928
239,328,862 - 28,314 239,357,176 221,381,718 Less : Accumulated impairment 13,770,767 - 28,314 13,799,081 5,493,837 Total 225,558,095 - - 225,558,095 215,887,881

201
Overview Leadership Insights Our Bank Our Strategy Our Performance
Stakeholder Outcomes Accountability Financial Reports Compliance Annexes Supplimentary Information
BANK OF CEYLON | ANNUAL REPORT 2021
Group
As at 31 December 2021 2020
Stage 1 Stage 2 Stage 3 Total Total
LKR '000 LKR '000 LKR '000 LKR '000 LKR '000
Sri Lanka sovereign bonds 49,623,412 - - 49,623,412 48,781,615
Sri Lanka Development Bonds 162,626,977 - - 162,626,977 154,162,902
Debentures 4,104,130 - 28,314 4,132,444 4,121,521
Trust certificates - - - - 153,384
Government securities - In Maldives 23,490,354 - - 23,490,354 14,431,928
Corporate bonds - - - - 686,390
Other Investments 77,173 - - 77,173 278,617
239,922,046 - 28,314 239,950,360 222,616,357
Less : Accumulated impairment 13,829,176 - 28,314 13,857,490 5,540,578
Total 226,092,870 - - 226,092,870 217,075,779
29.3 Movement in Provision for Impairment During the Year
Bank Group
2021 2020 2021 2020
LKR '000 LKR '000 LKR '000 LKR '000
Movement in Stage 1 Impairment
Balance as at 1 January 5,465,523 2,147,719 5,512,264 2,181,124
Charge/(Reversal) during the year 8,305,244 3,317,804 8,316,912 3,331,140
Balance as at 31 December 13,770,767 5,465,523 13,829,176 5,512,264
Bank Group
2021 2020 2021 2020
LKR '000 LKR '000 LKR '000 LKR '000
Movement in Stage 3 Impairment
Balance as at 1 January 28,314 26,212 28,314 26,212
Charge/(Reversal) during the year - 2,102 - 2,102
Balance as at 31 December 28,314 28,314 28,314 28,314
Bank Group
2021 2020 2021 2020
LKR '000 LKR '000 LKR '000 LKR '000
Movement in Total Impairment
Balance as at 1 January 5,493,837 2,173,931 5,540,578 2,207,336
Charge/(Reversal) during the year 8,305,244 3,319,906 8,316,912 3,333,242
Balance as at 31 December 13,799,081 5,493,837 13,857,490 5,540,578
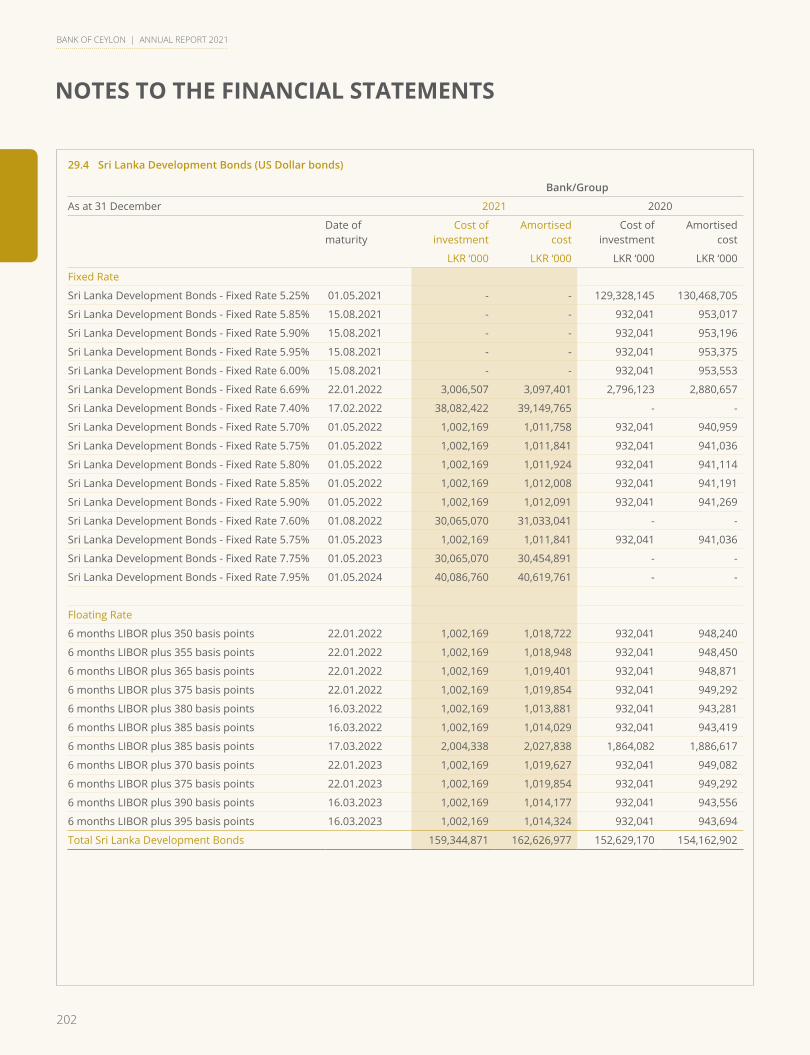
202
NOTES TO THE FINANCIAL STATEMENTS
BANK OF CEYLON | ANNUAL REPORT 2021
29.4 Sri Lanka Development Bonds (US Dollar bonds)
Bank/Group
As at 31 December 2021 2020
Date ofmaturity
Cost of investment
Amortised cost
Cost of investment
Amortised cost
LKR ‘000 LKR ‘000 LKR ‘000 LKR ‘000
Fixed Rate
Sri Lanka Development Bonds - Fixed Rate 5.25% 01.05.2021 - - 129,328,145 130,468,705
Sri Lanka Development Bonds - Fixed Rate 5.85% 15.08.2021 - - 932,041 953,017
Sri Lanka Development Bonds - Fixed Rate 5.90% 15.08.2021 - - 932,041 953,196
Sri Lanka Development Bonds - Fixed Rate 5.95% 15.08.2021 - - 932,041 953,375
Sri Lanka Development Bonds - Fixed Rate 6.00% 15.08.2021 - - 932,041 953,553
Sri Lanka Development Bonds - Fixed Rate 6.69% 22.01.2022 3,006,507 3,097,401 2,796,123 2,880,657
Sri Lanka Development Bonds - Fixed Rate 7.40% 17.02.2022 38,082,422 39,149,765 - -
Sri Lanka Development Bonds - Fixed Rate 5.70% 01.05.2022 1,002,169 1,011,758 932,041 940,959
Sri Lanka Development Bonds - Fixed Rate 5.75% 01.05.2022 1,002,169 1,011,841 932,041 941,036
Sri Lanka Development Bonds - Fixed Rate 5.80% 01.05.2022 1,002,169 1,011,924 932,041 941,114
Sri Lanka Development Bonds - Fixed Rate 5.85% 01.05.2022 1,002,169 1,012,008 932,041 941,191
Sri Lanka Development Bonds - Fixed Rate 5.90% 01.05.2022 1,002,169 1,012,091 932,041 941,269
Sri Lanka Development Bonds - Fixed Rate 7.60% 01.08.2022 30,065,070 31,033,041 - -
Sri Lanka Development Bonds - Fixed Rate 5.75% 01.05.2023 1,002,169 1,011,841 932,041 941,036
Sri Lanka Development Bonds - Fixed Rate 7.75% 01.05.2023 30,065,070 30,454,891 - -
Sri Lanka Development Bonds - Fixed Rate 7.95% 01.05.2024 40,086,760 40,619,761 - -
Floating Rate
6 months LIBOR plus 350 basis points 22.01.2022 1,002,169 1,018,722 932,041 948,240
6 months LIBOR plus 355 basis points 22.01.2022 1,002,169 1,018,948 932,041 948,450
6 months LIBOR plus 365 basis points 22.01.2022 1,002,169 1,019,401 932,041 948,871
6 months LIBOR plus 375 basis points 22.01.2022 1,002,169 1,019,854 932,041 949,292
6 months LIBOR plus 380 basis points 16.03.2022 1,002,169 1,013,881 932,041 943,281
6 months LIBOR plus 385 basis points 16.03.2022 1,002,169 1,014,029 932,041 943,419
6 months LIBOR plus 385 basis points 17.03.2022 2,004,338 2,027,838 1,864,082 1,886,617
6 months LIBOR plus 370 basis points 22.01.2023 1,002,169 1,019,627 932,041 949,082
6 months LIBOR plus 375 basis points 22.01.2023 1,002,169 1,019,854 932,041 949,292
6 months LIBOR plus 390 basis points 16.03.2023 1,002,169 1,014,177 932,041 943,556
6 months LIBOR plus 395 basis points 16.03.2023 1,002,169 1,014,324 932,041 943,694
Total Sri Lanka Development Bonds 159,344,871 162,626,977 152,629,170 154,162,902
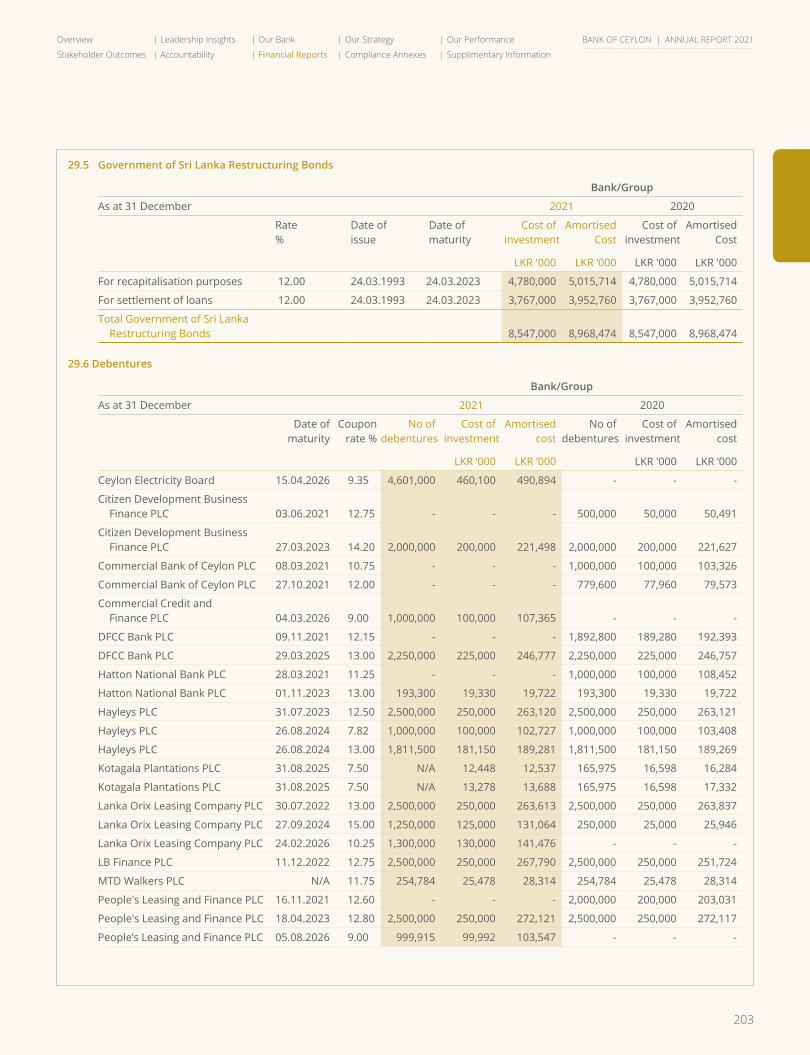
203
Overview Leadership Insights Our Bank Our Strategy Our Performance
Stakeholder Outcomes Accountability Financial Reports Compliance Annexes Supplimentary Information
BANK OF CEYLON | ANNUAL REPORT 2021
29.5 Government of Sri Lanka Restructuring Bonds
Bank/Group
As at 31 December 2021 2020
Rate%
Date of issue
Date of maturity
Cost of investment
Amortised Cost
Cost of investment
AmortisedCost
LKR '000 LKR ‘000 LKR '000 LKR '000
For recapitalisation purposes 12.00 24.03.1993 24.03.2023 4,780,000 5,015,714 4,780,000 5,015,714
For settlement of loans 12.00 24.03.1993 24.03.2023 3,767,000 3,952,760 3,767,000 3,952,760
Total Government of Sri Lanka Restructuring Bonds 8,547,000 8,968,474 8,547,000 8,968,474
29.6 Debentures
Bank/Group
As at 31 December 2021 2020
Date ofmaturity
Couponrate %
No ofdebentures
Cost of investment
Amortised cost
No ofdebentures
Cost of investment
Amortised cost
LKR ‘000 LKR ‘000 LKR '000 LKR ‘000
Ceylon Electricity Board 15.04.2026 9.35 4,601,000 460,100 490,894 - - -
Citizen Development Business Finance PLC 03.06.2021 12.75 - - - 500,000 50,000 50,491
Citizen Development Business Finance PLC 27.03.2023 14.20 2,000,000 200,000 221,498 2,000,000 200,000 221,627
Commercial Bank of Ceylon PLC 08.03.2021 10.75 - - - 1,000,000 100,000 103,326
Commercial Bank of Ceylon PLC 27.10.2021 12.00 - - - 779,600 77,960 79,573
Commercial Credit and Finance PLC 04.03.2026 9.00 1,000,000 100,000 107,365 - - -
DFCC Bank PLC 09.11.2021 12.15 - - - 1,892,800 189,280 192,393
DFCC Bank PLC 29.03.2025 13.00 2,250,000 225,000 246,777 2,250,000 225,000 246,757
Hatton National Bank PLC 28.03.2021 11.25 - - - 1,000,000 100,000 108,452
Hatton National Bank PLC 01.11.2023 13.00 193,300 19,330 19,722 193,300 19,330 19,722
Hayleys PLC 31.07.2023 12.50 2,500,000 250,000 263,120 2,500,000 250,000 263,121
Hayleys PLC 26.08.2024 7.82 1,000,000 100,000 102,727 1,000,000 100,000 103,408
Hayleys PLC 26.08.2024 13.00 1,811,500 181,150 189,281 1,811,500 181,150 189,269
Kotagala Plantations PLC 31.08.2025 7.50 N/A 12,448 12,537 165,975 16,598 16,284
Kotagala Plantations PLC 31.08.2025 7.50 N/A 13,278 13,688 165,975 16,598 17,332
Lanka Orix Leasing Company PLC 30.07.2022 13.00 2,500,000 250,000 263,613 2,500,000 250,000 263,837
Lanka Orix Leasing Company PLC 27.09.2024 15.00 1,250,000 125,000 131,064 250,000 25,000 25,946
Lanka Orix Leasing Company PLC 24.02.2026 10.25 1,300,000 130,000 141,476 - - -
LB Finance PLC 11.12.2022 12.75 2,500,000 250,000 267,790 2,500,000 250,000 251,724
MTD Walkers PLC N/A 11.75 254,784 25,478 28,314 254,784 25,478 28,314
People's Leasing and Finance PLC 16.11.2021 12.60 - - - 2,000,000 200,000 203,031
People's Leasing and Finance PLC 18.04.2023 12.80 2,500,000 250,000 272,121 2,500,000 250,000 272,117
People’s Leasing and Finance PLC 05.08.2026 9.00 999,915 99,992 103,547 - - -

204
NOTES TO THE FINANCIAL STATEMENTS
BANK OF CEYLON | ANNUAL REPORT 2021
Bank/GroupAs at 31 December 2021 2020
Date ofmaturity
Couponrate %
No. ofdebentures
Cost of investment
Amortised cost
No. ofdebentures
Cost of investment
Amortised cost
LKR ‘000 LKR ‘000 LKR '000 LKR ‘000Sampath Bank PLC 10.06.2021 12.75 - - - 1,500,000 150,000 160,401 Sampath Bank PLC 21.12.2022 12.50 2,270,000 227,000 227,564 2,270,000 227,000 227,391 Sampath Bank PLC 20.03.2023 12.50 2,500,000 250,000 258,704 2,500,000 250,000 258,704 Seylan Bank PLC 15.07.2021 13.00 - - - 451,600 45,160 47,871 Seylan Bank PLC 29.03.2023 12.85 2,500,000 250,000 258,128 2,500,000 250,000 258,054 Sri Lanka Telecom PLC 19.04.2028 12.75 5,000,000 500,000 512,514 5,000,000 500,000 512,376 Total debentures 3,918,776 4,132,444 3,948,554 4,121,521
29.7 TrustCertificates
Bank/Group
As at 31 December 2021 2020
Cost of investment
Amortised cost
Cost of investment
Amortised cost
LKR ‘000 LKR ‘000 LKR ‘000 LKR ‘000
Citizen Development Bank - - 81,136 108,579 Softlogic Finance PLC - - 32,500 44,805 Total trust certificates - - 113,636 153,384
30 Financial Assets Measured at Fair Value Through OCI
Financial assets measured at fair value through OCI include equity instruments which are elected fair value through OCI option at the initial recognition and debt instruments which contractual terms that give rise to cash flows on specified dates, that represent solely payments of principal and interest on the principal amount outstanding; and are held within a business model whose objective is achieved by both collecting contractual cash flows and selling financial assets.
All Financial assets measured at fair value through OCI are initially and subsequently measured at fair value. Unrealised gains and losses are recognised directly in equity in the ‘OCI reserve’ through Other Comprehensive Income. When the debt instrument under FVTOCI is disposed off, the cumulative gain or loss previously recognised in OCI reserve is recognised in the Statement of Profit or Loss and reflected in “Net gains/ (losses) from derecognition of financial assets” (Note12). When the equity instrument under FVTOCI is disposed off, the cumulative gain or loss previously recognised in OCI reserve is not recognised in the Statement of Profit or Loss and transfer directly to the retained profit. Interest earned whilst holding financial assets measured at fair value through OCI is reported as “Interest income” (Note 8.1) . Dividends earned whilst holding financial assets measured at fair value through OCI are recognised in the Statement of Profit or Loss under in “Net Other Operating Income” (Note 13) when the right of the payment has been established.
Bank GroupAs at 31 December 2021 2020 2021 2020
LKR '000 LKR '000 LKR '000 LKR '000Government Securities in Sri Lanka Treasury bills - 38,421 2,988,742 1,282,857 Treasury bonds 11,540,898 9,311,619 11,911,292 9,431,278 Government Securities in India 1,780,868 1,594,471 1,780,868 1,594,471 Quoted equities [Note 30.2] 2,749,598 2,329,969 3,940,622 3,494,494 Unquoted Equities [Note 30.3] 2,231,192 2,088,000 2,258,286 2,110,678 Total financial assets measured at FVTOCI 18,302,556 15,362,480 22,879,810 17,913,778
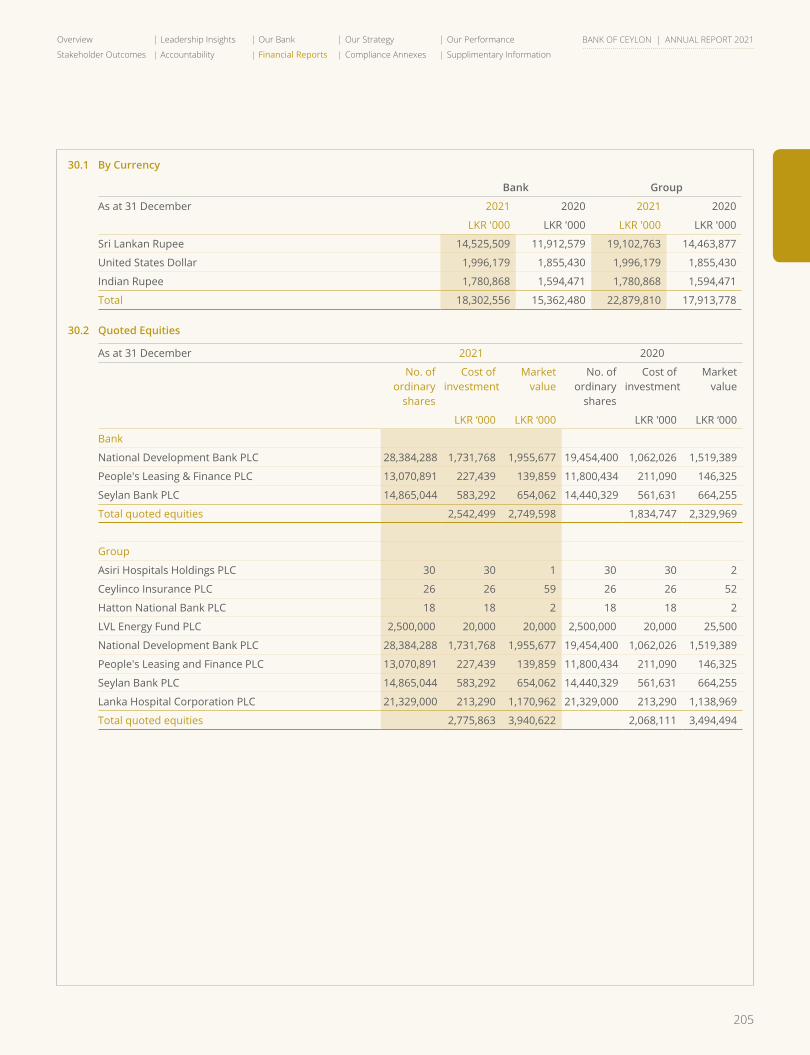
205
Overview Leadership Insights Our Bank Our Strategy Our Performance
Stakeholder Outcomes Accountability Financial Reports Compliance Annexes Supplimentary Information
BANK OF CEYLON | ANNUAL REPORT 2021
30.1 By Currency
Bank Group
As at 31 December 2021 2020 2021 2020
LKR '000 LKR '000 LKR '000 LKR '000
Sri Lankan Rupee 14,525,509 11,912,579 19,102,763 14,463,877
United States Dollar 1,996,179 1,855,430 1,996,179 1,855,430
Indian Rupee 1,780,868 1,594,471 1,780,868 1,594,471
Total 18,302,556 15,362,480 22,879,810 17,913,778
30.2 Quoted Equities
As at 31 December 2021 2020
No. ofordinary
shares
Cost of investment
Market value
No. ofordinary
shares
Cost of investment
Market value
LKR ‘000 LKR ‘000 LKR '000 LKR ‘000
Bank
National Development Bank PLC 28,384,288 1,731,768 1,955,677 19,454,400 1,062,026 1,519,389
People's Leasing & Finance PLC 13,070,891 227,439 139,859 11,800,434 211,090 146,325
Seylan Bank PLC 14,865,044 583,292 654,062 14,440,329 561,631 664,255
Total quoted equities 2,542,499 2,749,598 1,834,747 2,329,969
Group
Asiri Hospitals Holdings PLC 30 30 1 30 30 2
Ceylinco Insurance PLC 26 26 59 26 26 52
Hatton National Bank PLC 18 18 2 18 18 2
LVL Energy Fund PLC 2,500,000 20,000 20,000 2,500,000 20,000 25,500
National Development Bank PLC 28,384,288 1,731,768 1,955,677 19,454,400 1,062,026 1,519,389
People's Leasing and Finance PLC 13,070,891 227,439 139,859 11,800,434 211,090 146,325
Seylan Bank PLC 14,865,044 583,292 654,062 14,440,329 561,631 664,255
Lanka Hospital Corporation PLC 21,329,000 213,290 1,170,962 21,329,000 213,290 1,138,969
Total quoted equities 2,775,863 3,940,622 2,068,111 3,494,494
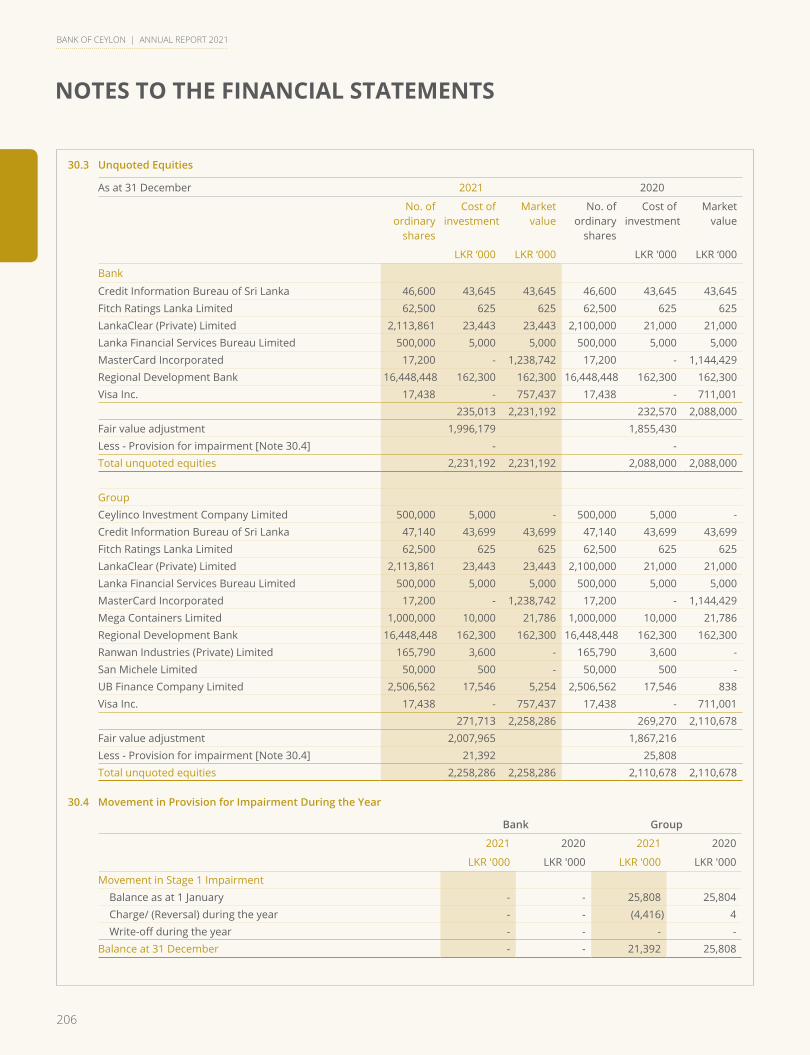
206
NOTES TO THE FINANCIAL STATEMENTS
BANK OF CEYLON | ANNUAL REPORT 2021
30.3 Unquoted Equities
As at 31 December 2021 2020
No. ofordinary
shares
Cost of investment
Market value
No. ofordinary
shares
Cost of investment
Market value
LKR ‘000 LKR ‘000 LKR '000 LKR ‘000
Bank
Credit Information Bureau of Sri Lanka 46,600 43,645 43,645 46,600 43,645 43,645 Fitch Ratings Lanka Limited 62,500 625 625 62,500 625 625 LankaClear (Private) Limited 2,113,861 23,443 23,443 2,100,000 21,000 21,000 Lanka Financial Services Bureau Limited 500,000 5,000 5,000 500,000 5,000 5,000 MasterCard Incorporated 17,200 - 1,238,742 17,200 - 1,144,429 Regional Development Bank 16,448,448 162,300 162,300 16,448,448 162,300 162,300 Visa Inc. 17,438 - 757,437 17,438 - 711,001
235,013 2,231,192 232,570 2,088,000 Fair value adjustment 1,996,179 1,855,430 Less - Provision for impairment [Note 30.4] - - Total unquoted equities 2,231,192 2,231,192 2,088,000 2,088,000
GroupCeylinco Investment Company Limited 500,000 5,000 - 500,000 5,000 - Credit Information Bureau of Sri Lanka 47,140 43,699 43,699 47,140 43,699 43,699 Fitch Ratings Lanka Limited 62,500 625 625 62,500 625 625 LankaClear (Private) Limited 2,113,861 23,443 23,443 2,100,000 21,000 21,000 Lanka Financial Services Bureau Limited 500,000 5,000 5,000 500,000 5,000 5,000 MasterCard Incorporated 17,200 - 1,238,742 17,200 - 1,144,429 Mega Containers Limited 1,000,000 10,000 21,786 1,000,000 10,000 21,786 Regional Development Bank 16,448,448 162,300 162,300 16,448,448 162,300 162,300 Ranwan Industries (Private) Limited 165,790 3,600 - 165,790 3,600 - San Michele Limited 50,000 500 - 50,000 500 - UB Finance Company Limited 2,506,562 17,546 5,254 2,506,562 17,546 838 Visa Inc. 17,438 - 757,437 17,438 - 711,001
271,713 2,258,286 269,270 2,110,678 Fair value adjustment 2,007,965 1,867,216 Less - Provision for impairment [Note 30.4] 21,392 25,808 Total unquoted equities 2,258,286 2,258,286 2,110,678 2,110,678
30.4 Movement in Provision for Impairment During the Year
Bank Group
2021 2020 2021 2020
LKR '000 LKR '000 LKR '000 LKR '000
Movement in Stage 1 Impairment Balance as at 1 January - - 25,808 25,804 Charge/ (Reversal) during the year - - (4,416) 4 Write-off during the year - - - -Balance at 31 December - - 21,392 25,808
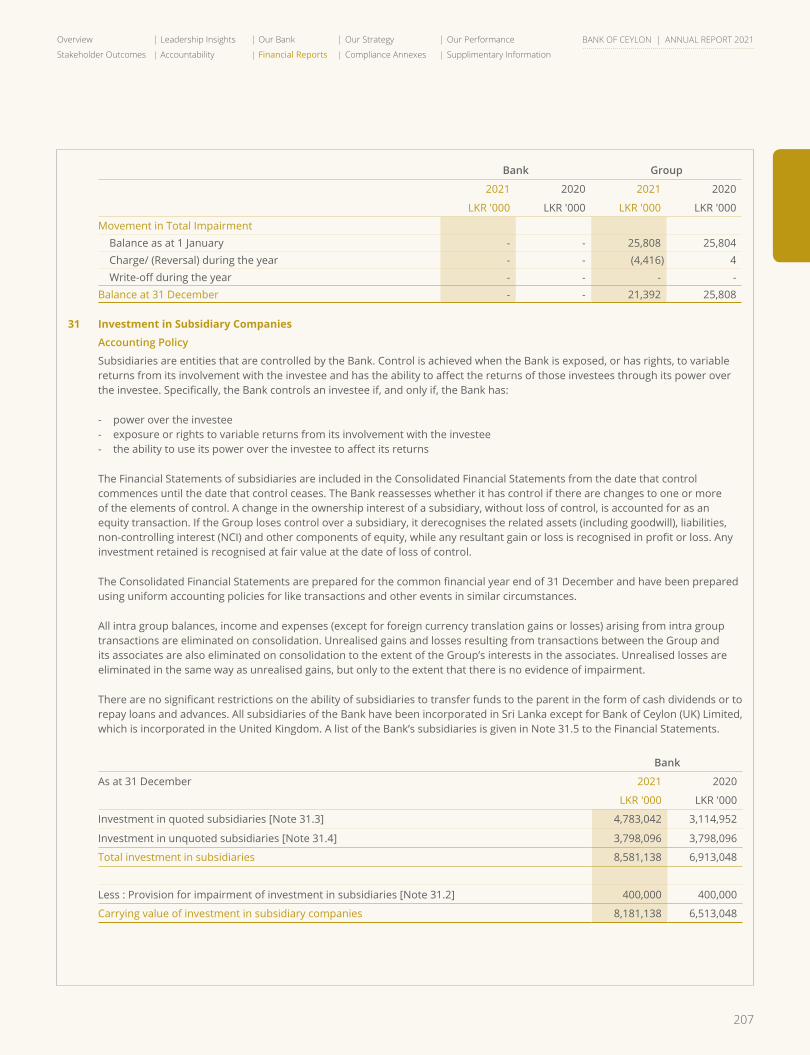
207
Overview Leadership Insights Our Bank Our Strategy Our Performance
Stakeholder Outcomes Accountability Financial Reports Compliance Annexes Supplimentary Information
BANK OF CEYLON | ANNUAL REPORT 2021
Bank Group
2021 2020 2021 2020
LKR '000 LKR '000 LKR '000 LKR '000
Movement in Total Impairment Balance as at 1 January - - 25,808 25,804 Charge/ (Reversal) during the year - - (4,416) 4 Write-off during the year - - - - Balance at 31 December - - 21,392 25,808
31 Investment in Subsidiary Companies
Accounting Policy
Subsidiaries are entities that are controlled by the Bank. Control is achieved when the Bank is exposed, or has rights, to variable returns from its involvement with the investee and has the ability to affect the returns of those investees through its power over the investee. Specifically, the Bank controls an investee if, and only if, the Bank has:
- power over the investee - exposure or rights to variable returns from its involvement with the investee - the ability to use its power over the investee to affect its returns
The Financial Statements of subsidiaries are included in the Consolidated Financial Statements from the date that control commences until the date that control ceases. The Bank reassesses whether it has control if there are changes to one or more of the elements of control. A change in the ownership interest of a subsidiary, without loss of control, is accounted for as an equity transaction. If the Group loses control over a subsidiary, it derecognises the related assets (including goodwill), liabilities, non-controlling interest (NCI) and other components of equity, while any resultant gain or loss is recognised in profit or loss. Any investment retained is recognised at fair value at the date of loss of control.
The Consolidated Financial Statements are prepared for the common financial year end of 31 December and have been prepared using uniform accounting policies for like transactions and other events in similar circumstances.
All intra group balances, income and expenses (except for foreign currency translation gains or losses) arising from intra group transactions are eliminated on consolidation. Unrealised gains and losses resulting from transactions between the Group and its associates are also eliminated on consolidation to the extent of the Group’s interests in the associates. Unrealised losses are eliminated in the same way as unrealised gains, but only to the extent that there is no evidence of impairment.
There are no significant restrictions on the ability of subsidiaries to transfer funds to the parent in the form of cash dividends or to repay loans and advances. All subsidiaries of the Bank have been incorporated in Sri Lanka except for Bank of Ceylon (UK) Limited, which is incorporated in the United Kingdom. A list of the Bank’s subsidiaries is given in Note 31.5 to the Financial Statements.
Bank
As at 31 December 2021 2020
LKR '000 LKR '000
Investment in quoted subsidiaries [Note 31.3] 4,783,042 3,114,952
Investment in unquoted subsidiaries [Note 31.4] 3,798,096 3,798,096
Total investment in subsidiaries 8,581,138 6,913,048
Less : Provision for impairment of investment in subsidiaries [Note 31.2] 400,000 400,000
Carrying value of investment in subsidiary companies 8,181,138 6,513,048
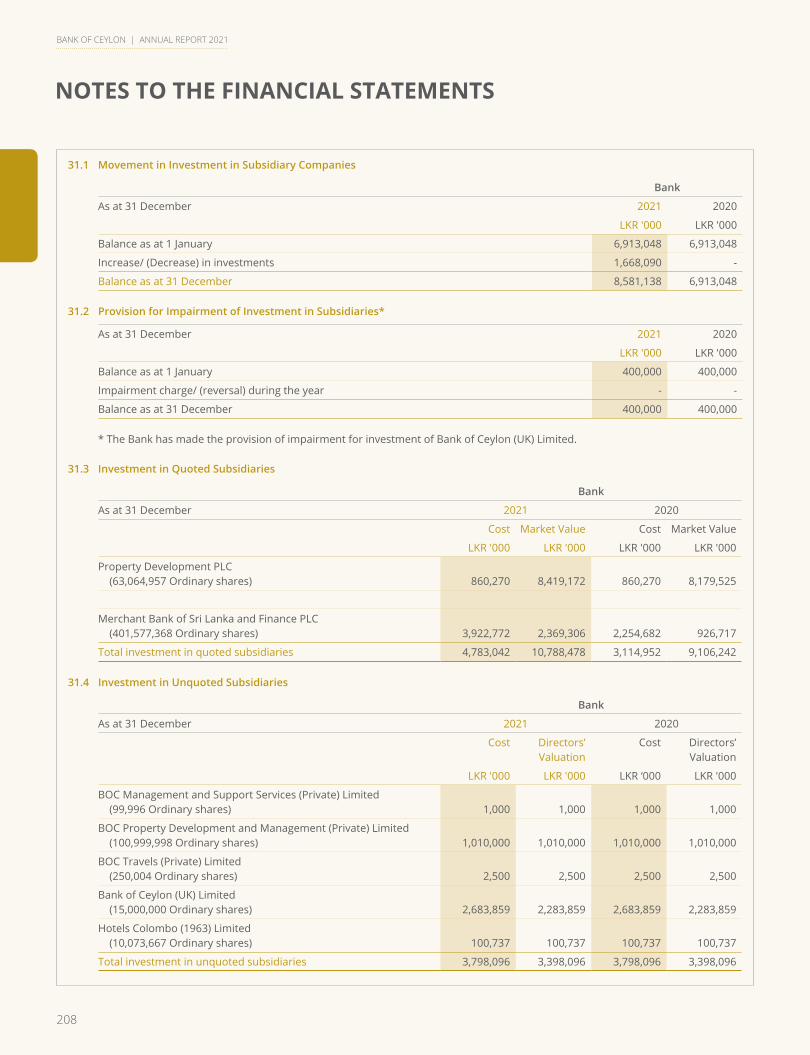
208
NOTES TO THE FINANCIAL STATEMENTS
BANK OF CEYLON | ANNUAL REPORT 2021
31.1 Movement in Investment in Subsidiary Companies
Bank
As at 31 December 2021 2020
LKR '000 LKR '000
Balance as at 1 January 6,913,048 6,913,048
Increase/ (Decrease) in investments 1,668,090 -
Balance as at 31 December 8,581,138 6,913,048
31.2 Provision for Impairment of Investment in Subsidiaries*
As at 31 December 2021 2020
LKR '000 LKR '000
Balance as at 1 January 400,000 400,000
Impairment charge/ (reversal) during the year - -
Balance as at 31 December 400,000 400,000
* The Bank has made the provision of impairment for investment of Bank of Ceylon (UK) Limited.
31.3 Investment in Quoted Subsidiaries
Bank
As at 31 December 2021 2020
Cost Market Value Cost Market Value
LKR '000 LKR '000 LKR '000 LKR '000
Property Development PLC (63,064,957 Ordinary shares) 860,270 8,419,172 860,270 8,179,525
Merchant Bank of Sri Lanka and Finance PLC (401,577,368 Ordinary shares) 3,922,772 2,369,306 2,254,682 926,717
Total investment in quoted subsidiaries 4,783,042 10,788,478 3,114,952 9,106,242
31.4 Investment in Unquoted Subsidiaries
Bank
As at 31 December 2021 2020
Cost Directors’ Valuation
Cost Directors’ Valuation
LKR '000 LKR '000 LKR ‘000 LKR '000
BOC Management and Support Services (Private) Limited (99,996 Ordinary shares) 1,000 1,000 1,000 1,000
BOC Property Development and Management (Private) Limited (100,999,998 Ordinary shares) 1,010,000 1,010,000 1,010,000 1,010,000
BOC Travels (Private) Limited (250,004 Ordinary shares) 2,500 2,500 2,500 2,500
Bank of Ceylon (UK) Limited (15,000,000 Ordinary shares) 2,683,859 2,283,859 2,683,859 2,283,859
Hotels Colombo (1963) Limited (10,073,667 Ordinary shares) 100,737 100,737 100,737 100,737
Total investment in unquoted subsidiaries 3,798,096 3,398,096 3,798,096 3,398,096
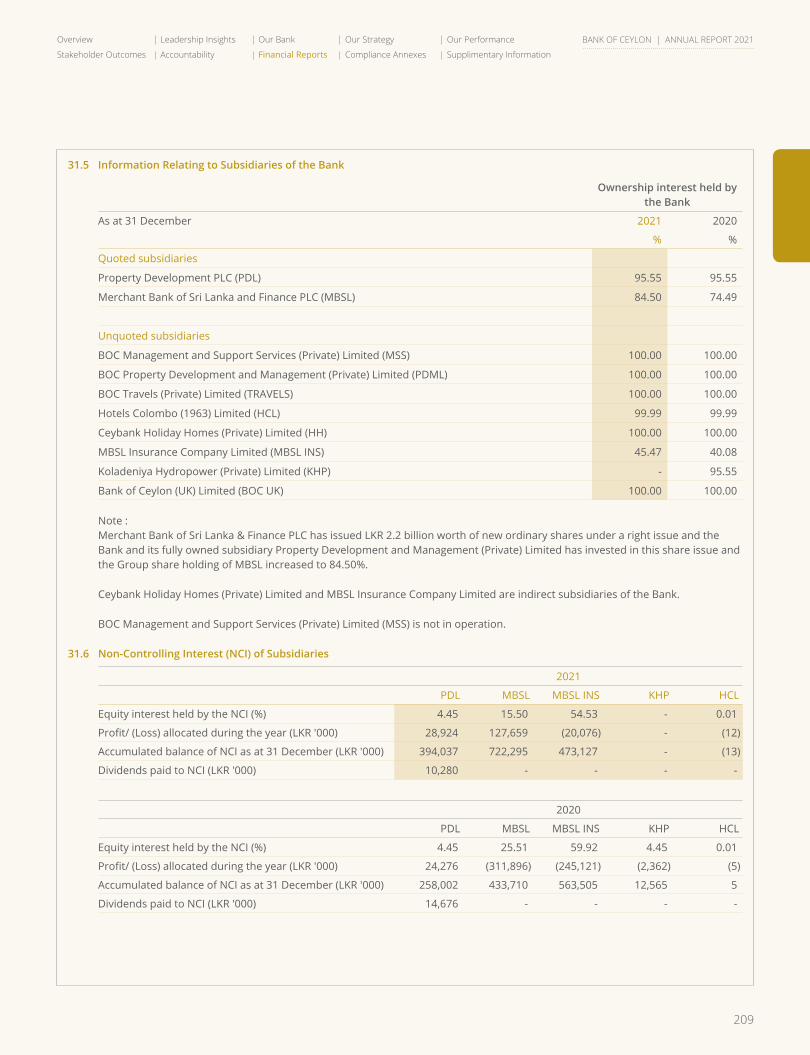
209
Overview Leadership Insights Our Bank Our Strategy Our Performance
Stakeholder Outcomes Accountability Financial Reports Compliance Annexes Supplimentary Information
BANK OF CEYLON | ANNUAL REPORT 2021
31.5 Information Relating to Subsidiaries of the Bank
Ownership interest held by the Bank
As at 31 December 2021 2020
% %
Quoted subsidiaries
Property Development PLC (PDL) 95.55 95.55
Merchant Bank of Sri Lanka and Finance PLC (MBSL) 84.50 74.49
Unquoted subsidiaries
BOC Management and Support Services (Private) Limited (MSS) 100.00 100.00
BOC Property Development and Management (Private) Limited (PDML) 100.00 100.00
BOC Travels (Private) Limited (TRAVELS) 100.00 100.00
Hotels Colombo (1963) Limited (HCL) 99.99 99.99
Ceybank Holiday Homes (Private) Limited (HH) 100.00 100.00
MBSL Insurance Company Limited (MBSL INS) 45.47 40.08
Koladeniya Hydropower (Private) Limited (KHP) - 95.55
Bank of Ceylon (UK) Limited (BOC UK) 100.00 100.00
Note : Merchant Bank of Sri Lanka & Finance PLC has issued LKR 2.2 billion worth of new ordinary shares under a right issue and the
Bank and its fully owned subsidiary Property Development and Management (Private) Limited has invested in this share issue and the Group share holding of MBSL increased to 84.50%.
Ceybank Holiday Homes (Private) Limited and MBSL Insurance Company Limited are indirect subsidiaries of the Bank.
BOC Management and Support Services (Private) Limited (MSS) is not in operation.
31.6 Non-Controlling Interest (NCI) of Subsidiaries
2021
PDL MBSL MBSL INS KHP HCL
Equity interest held by the NCI (%) 4.45 15.50 54.53 - 0.01
Profit/ (Loss) allocated during the year (LKR '000) 28,924 127,659 (20,076) - (12)
Accumulated balance of NCI as at 31 December (LKR '000) 394,037 722,295 473,127 - (13)
Dividends paid to NCI (LKR '000) 10,280 - - - -
2020
PDL MBSL MBSL INS KHP HCL
Equity interest held by the NCI (%) 4.45 25.51 59.92 4.45 0.01
Profit/ (Loss) allocated during the year (LKR '000) 24,276 (311,896) (245,121) (2,362) (5)
Accumulated balance of NCI as at 31 December (LKR '000) 258,002 433,710 563,505 12,565 5
Dividends paid to NCI (LKR '000) 14,676 - - - -
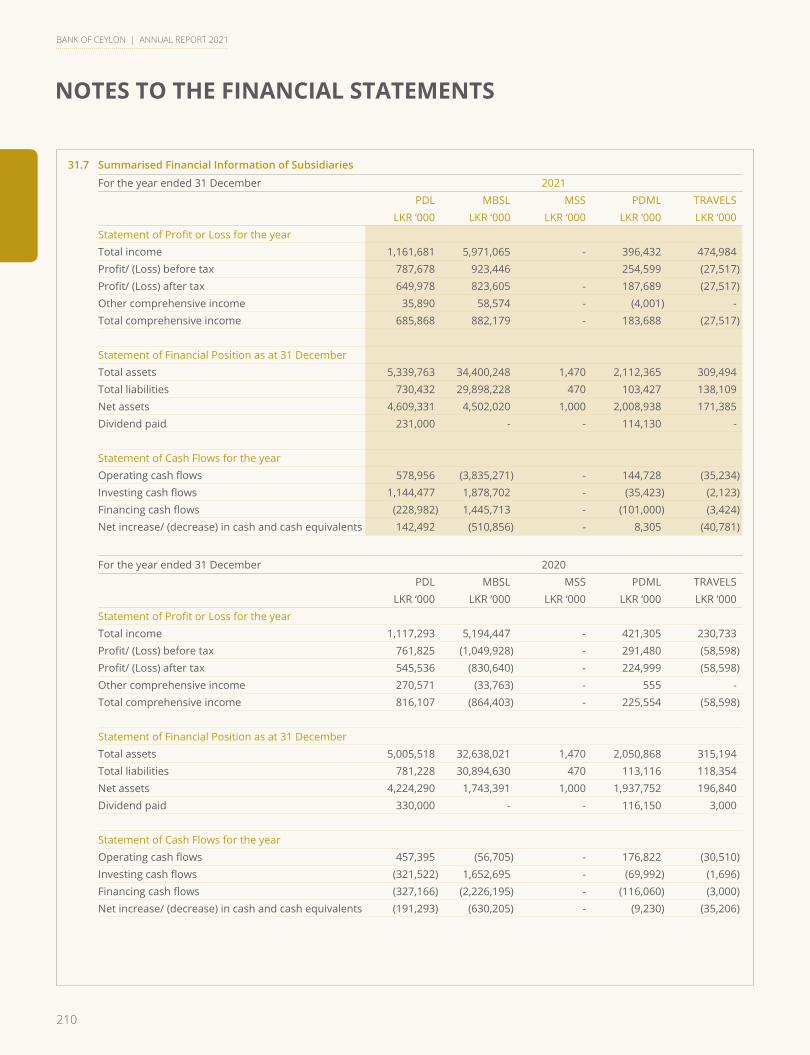
210
NOTES TO THE FINANCIAL STATEMENTS
BANK OF CEYLON | ANNUAL REPORT 2021
31.7 Summarised Financial Information of Subsidiaries
For the year ended 31 December 2021PDL MBSL MSS PDML TRAVELS
LKR ‘000 LKR ‘000 LKR ‘000 LKR ‘000 LKR ‘000Statement of Profit or Loss for the yearTotal income 1,161,681 5,971,065 - 396,432 474,984 Profit/ (Loss) before tax 787,678 923,446 254,599 (27,517)Profit/ (Loss) after tax 649,978 823,605 - 187,689 (27,517)Other comprehensive income 35,890 58,574 - (4,001) - Total comprehensive income 685,868 882,179 - 183,688 (27,517)
Statement of Financial Position as at 31 DecemberTotal assets 5,339,763 34,400,248 1,470 2,112,365 309,494 Total liabilities 730,432 29,898,228 470 103,427 138,109 Net assets 4,609,331 4,502,020 1,000 2,008,938 171,385 Dividend paid 231,000 - - 114,130 -
Statement of Cash Flows for the yearOperating cash flows 578,956 (3,835,271) - 144,728 (35,234)Investing cash flows 1,144,477 1,878,702 - (35,423) (2,123)Financing cash flows (228,982) 1,445,713 - (101,000) (3,424)Net increase/ (decrease) in cash and cash equivalents 142,492 (510,856) - 8,305 (40,781)
For the year ended 31 December 2020PDL MBSL MSS PDML TRAVELS
LKR ‘000 LKR ‘000 LKR ‘000 LKR ‘000 LKR ‘000Statement of Profit or Loss for the yearTotal income 1,117,293 5,194,447 - 421,305 230,733 Profit/ (Loss) before tax 761,825 (1,049,928) - 291,480 (58,598)Profit/ (Loss) after tax 545,536 (830,640) - 224,999 (58,598)Other comprehensive income 270,571 (33,763) - 555 - Total comprehensive income 816,107 (864,403) - 225,554 (58,598)
Statement of Financial Position as at 31 DecemberTotal assets 5,005,518 32,638,021 1,470 2,050,868 315,194 Total liabilities 781,228 30,894,630 470 113,116 118,354 Net assets 4,224,290 1,743,391 1,000 1,937,752 196,840 Dividend paid 330,000 - - 116,150 3,000
Statement of Cash Flows for the yearOperating cash flows 457,395 (56,705) - 176,822 (30,510)Investing cash flows (321,522) 1,652,695 - (69,992) (1,696)Financing cash flows (327,166) (2,226,195) - (116,060) (3,000)Net increase/ (decrease) in cash and cash equivalents (191,293) (630,205) - (9,230) (35,206)

211
Overview Leadership Insights Our Bank Our Strategy Our Performance
Stakeholder Outcomes Accountability Financial Reports Compliance Annexes Supplimentary Information
BANK OF CEYLON | ANNUAL REPORT 2021
For the year ended 31 December 2021HCL HH MBSL INS KHP BoC UK
LKR ‘000 LKR ‘000 LKR ‘000 LKR ‘000 LKR ‘000Statement of Profit or Loss for the yearTotal income 29,265 56,599 646,883 5,833 639,637 Profit/ (Loss) before tax (116,665) (25,601) (53,766) (7,183) 18,756 Profit / (Loss) after tax (116,665) (25,601) (53,766) (7,183) 18,756 Other comprehensive income - - (8,922) - 331,649 Total comprehensive income (116,665) (25,601) (62,688) (7,183) 350,405
Statement of Financial Position as at 31 DecemberTotal assets 215,876 42,145 2,605,090 - 13,239,850 Total liabilities 350,006 106,161 1,636,845 - 9,449,270 Net assets (134,130) (64,016) 968,245 - 3,790,580 Dividend paid - - - - -
Statement of Cash Flows for the yearOperating cash flows (17,234) 2,223 28,320 44,208 29,910 Investing cash flows (6,962) (591) 12,907 13,496 (4,869)Financing cash flows (1,300) - - (54,250) - Net increase/ (decrease) in cash and cash equivalents (25,496) 1,632 41,227 3,454 25,041
For the year ended 31 December 2020HCL HH MBSL INS KHP BoC UK
LKR ‘000 LKR ‘000 LKR ‘000 LKR ‘000 LKR ‘000Statement of Profit or Loss for the yearTotal income 73,042 65,761 478,954 52,741 597,718 Profit/ (Loss) before tax (110,800) (27,002) (61,375) (65,702) 4,001 Profit / (Loss) after tax (46,953) (27,002) (276,970) (53,078) 4,001 Other comprehensive income - - 11,191 (130) 221,688 Total comprehensive income (46,953) (27,002) (265,779) (53,208) 225,689
Statement of Financial Position as at 31 DecemberTotal assets 336,225 58,082 2,616,923 175,611 36,276,075 Total liabilities 288,682 90,120 1,584,943 23,212 32,835,645 Net assets 47,543 (32,038) 1,031,980 152,399 3,440,430 Dividend paid - - - 111,755 -
Statement of Cash Flows for the yearOperating cash flows (64,144) (3,136) 33,590 30,738 26,860 Investing cash flows (15,499) (1,074) 2,093 90,311 (8,932)Financing cash flows 53,347 (164) (17,727) (50,724) - Net increase/ (decrease) in cash and cash equivalents (26,296) (4,374) 17,956 70,325 17,928
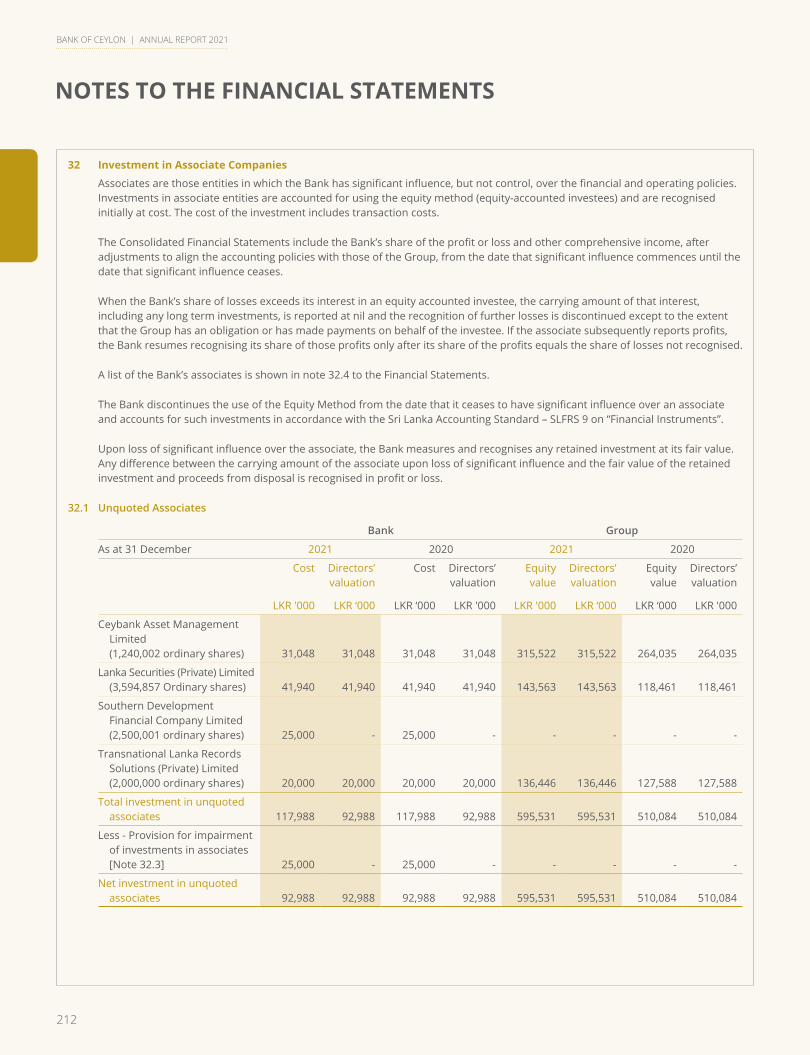
212
NOTES TO THE FINANCIAL STATEMENTS
BANK OF CEYLON | ANNUAL REPORT 2021
32 Investment in Associate Companies
Associates are those entities in which the Bank has significant influence, but not control, over the financial and operating policies. Investments in associate entities are accounted for using the equity method (equity-accounted investees) and are recognised initially at cost. The cost of the investment includes transaction costs.
The Consolidated Financial Statements include the Bank’s share of the profit or loss and other comprehensive income, after adjustments to align the accounting policies with those of the Group, from the date that significant influence commences until the date that significant influence ceases.
When the Bank’s share of losses exceeds its interest in an equity accounted investee, the carrying amount of that interest, including any long term investments, is reported at nil and the recognition of further losses is discontinued except to the extent that the Group has an obligation or has made payments on behalf of the investee. If the associate subsequently reports profits, the Bank resumes recognising its share of those profits only after its share of the profits equals the share of losses not recognised.
A list of the Bank’s associates is shown in note 32.4 to the Financial Statements.
The Bank discontinues the use of the Equity Method from the date that it ceases to have significant influence over an associate and accounts for such investments in accordance with the Sri Lanka Accounting Standard – SLFRS 9 on “Financial Instruments”.
Upon loss of significant influence over the associate, the Bank measures and recognises any retained investment at its fair value. Any difference between the carrying amount of the associate upon loss of significant influence and the fair value of the retained investment and proceeds from disposal is recognised in profit or loss.
32.1 Unquoted Associates
Bank Group
As at 31 December 2021 2020 2021 2020
Cost Directors’ valuation
Cost Directors’ valuation
Equityvalue
Directors’ valuation
Equityvalue
Directors’ valuation
LKR '000 LKR ‘000 LKR ‘000 LKR '000 LKR '000 LKR ‘000 LKR ‘000 LKR '000
Ceybank Asset Management Limited
(1,240,002 ordinary shares) 31,048 31,048 31,048 31,048 315,522 315,522 264,035 264,035
Lanka Securities (Private) Limited (3,594,857 Ordinary shares) 41,940 41,940 41,940 41,940 143,563 143,563 118,461 118,461
Southern Development Financial Company Limited (2,500,001 ordinary shares) 25,000 - 25,000 - - - - -
Transnational Lanka Records Solutions (Private) Limited (2,000,000 ordinary shares) 20,000 20,000 20,000 20,000 136,446 136,446 127,588 127,588
Total investment in unquoted associates 117,988 92,988 117,988 92,988 595,531 595,531 510,084 510,084
Less - Provision for impairment of investments in associates [Note 32.3] 25,000 - 25,000 - - - - -
Net investment in unquoted associates 92,988 92,988 92,988 92,988 595,531 595,531 510,084 510,084
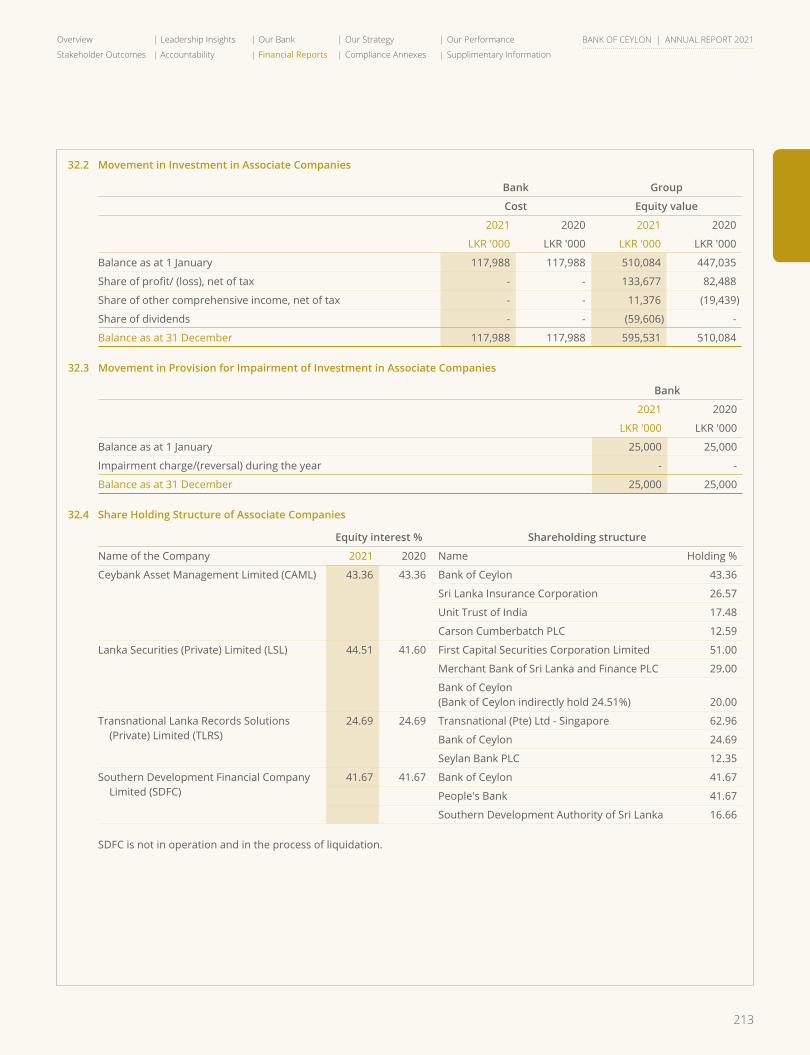
213
Overview Leadership Insights Our Bank Our Strategy Our Performance
Stakeholder Outcomes Accountability Financial Reports Compliance Annexes Supplimentary Information
BANK OF CEYLON | ANNUAL REPORT 2021
32.2 Movement in Investment in Associate Companies
Bank Group
Cost Equity value
2021 2020 2021 2020
LKR '000 LKR '000 LKR '000 LKR '000
Balance as at 1 January 117,988 117,988 510,084 447,035
Share of profit/ (loss), net of tax - - 133,677 82,488
Share of other comprehensive income, net of tax - - 11,376 (19,439)
Share of dividends - - (59,606) -
Balance as at 31 December 117,988 117,988 595,531 510,084
32.3 Movement in Provision for Impairment of Investment in Associate Companies
Bank
2021 2020
LKR '000 LKR '000
Balance as at 1 January 25,000 25,000
Impairment charge/(reversal) during the year - -
Balance as at 31 December 25,000 25,000
32.4 Share Holding Structure of Associate Companies
Equity interest % Shareholding structure
Name of the Company 2021 2020 Name Holding %
Ceybank Asset Management Limited (CAML) 43.36 43.36 Bank of Ceylon 43.36
Sri Lanka Insurance Corporation 26.57
Unit Trust of India 17.48
Carson Cumberbatch PLC 12.59
Lanka Securities (Private) Limited (LSL) 44.51 41.60 First Capital Securities Corporation Limited 51.00
Merchant Bank of Sri Lanka and Finance PLC 29.00
Bank of Ceylon (Bank of Ceylon indirectly hold 24.51%) 20.00
Transnational Lanka Records Solutions (Private) Limited (TLRS)
24.69 24.69 Transnational (Pte) Ltd - Singapore 62.96
Bank of Ceylon 24.69
Seylan Bank PLC 12.35
Southern Development Financial Company Limited (SDFC)
41.67 41.67 Bank of Ceylon 41.67
People's Bank 41.67
Southern Development Authority of Sri Lanka 16.66
SDFC is not in operation and in the process of liquidation.

214
NOTES TO THE FINANCIAL STATEMENTS
BANK OF CEYLON | ANNUAL REPORT 2021
32.5 Summarised Financial Information of Associates
2021
CAML LSL TLRS
LKR '000 LKR '000 LKR '000
Statement of profit or loss for the year
Total income 143,898 752,190 130,353
Profit / (Loss) before tax 59,045 373,566 117,932
Profit / (Loss) after tax 42,058 268,968 107,427
Other comprehensive income 26,237 - -
Total comprehensive income 68,295 268,968 107,427
Statement of Financial Position as at 31 December
Total assets 769,523 1,406,708 809,989
Current liabilities 30,384 958,031 95,405
Total liabilities 49,647 959,782 282,190
Net assets 719,876 446,926 527,799
Dividend paid during the year 21,450 70,000 40,500
Dividend received to the Bank (net) during the year 18,600 25,798 11,000
2020
CAML LSL TLRS
LKR '000 LKR '000 LKR '000
Statement of profit or loss for the year
Total income 48,131 233,022 127,038
Profit / (Loss) before tax 21,737 68,828 115,260
Profit / (Loss) after tax 21,326 52,310 106,777
Other comprehensive income (44,832) - -
Total comprehensive income (23,506) 52,310 106,777
Statement of Financial Position as at 31 December
Total assets 636,525 1,136,957 710,505
Current liabilities 18,985 822,686 24,751
Total liabilities 35,402 822,495 218,581
Net assets 601,123 314,462 491,924
Dividend paid during the year - - -
Dividend received to the Bank (net) during the year - - -
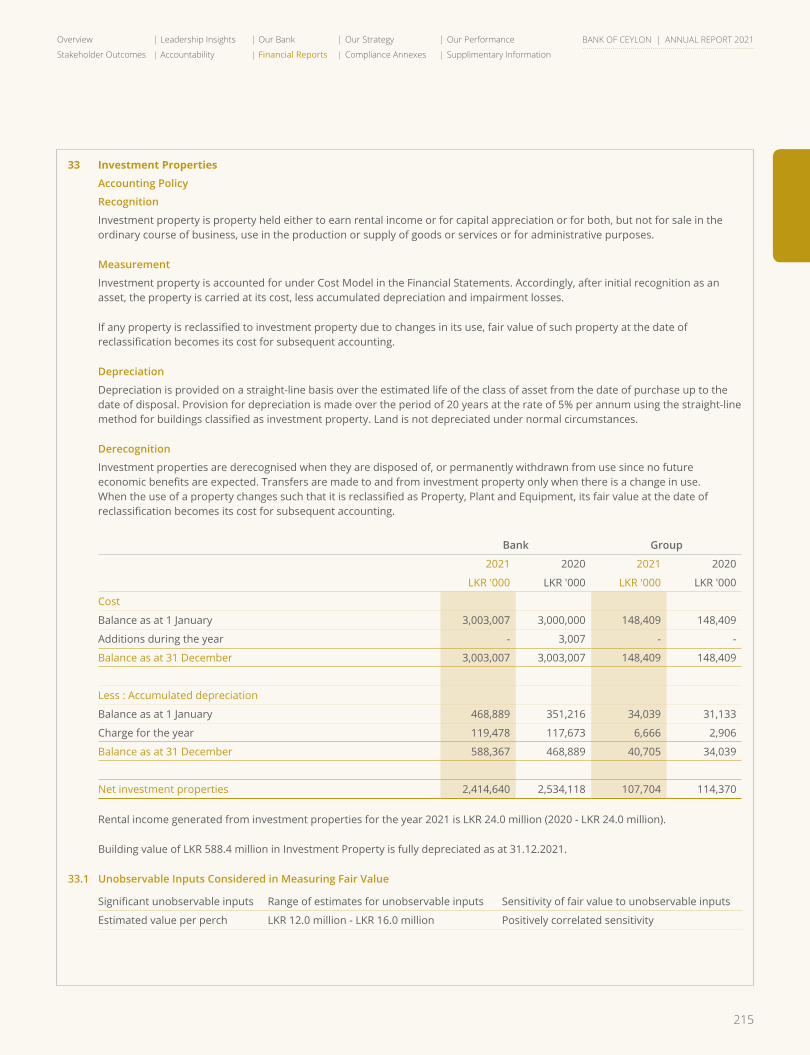
215
Overview Leadership Insights Our Bank Our Strategy Our Performance
Stakeholder Outcomes Accountability Financial Reports Compliance Annexes Supplimentary Information
BANK OF CEYLON | ANNUAL REPORT 2021
33 Investment Properties
Accounting Policy
Recognition
Investment property is property held either to earn rental income or for capital appreciation or for both, but not for sale in the ordinary course of business, use in the production or supply of goods or services or for administrative purposes.
Measurement
Investment property is accounted for under Cost Model in the Financial Statements. Accordingly, after initial recognition as an asset, the property is carried at its cost, less accumulated depreciation and impairment losses.
If any property is reclassified to investment property due to changes in its use, fair value of such property at the date of reclassification becomes its cost for subsequent accounting.
Depreciation
Depreciation is provided on a straight-line basis over the estimated life of the class of asset from the date of purchase up to the date of disposal. Provision for depreciation is made over the period of 20 years at the rate of 5% per annum using the straight-line method for buildings classified as investment property. Land is not depreciated under normal circumstances.
Derecognition
Investment properties are derecognised when they are disposed of, or permanently withdrawn from use since no future economic benefits are expected. Transfers are made to and from investment property only when there is a change in use. When the use of a property changes such that it is reclassified as Property, Plant and Equipment, its fair value at the date of reclassification becomes its cost for subsequent accounting.
Bank Group
2021 2020 2021 2020
LKR '000 LKR '000 LKR '000 LKR '000
Cost
Balance as at 1 January 3,003,007 3,000,000 148,409 148,409
Additions during the year - 3,007 - -
Balance as at 31 December 3,003,007 3,003,007 148,409 148,409
Less : Accumulated depreciation
Balance as at 1 January 468,889 351,216 34,039 31,133
Charge for the year 119,478 117,673 6,666 2,906
Balance as at 31 December 588,367 468,889 40,705 34,039
Net investment properties 2,414,640 2,534,118 107,704 114,370
Rental income generated from investment properties for the year 2021 is LKR 24.0 million (2020 - LKR 24.0 million).
Building value of LKR 588.4 million in Investment Property is fully depreciated as at 31.12.2021.
33.1 Unobservable Inputs Considered in Measuring Fair Value
Significant unobservable inputs Range of estimates for unobservable inputs Sensitivity of fair value to unobservable inputs
Estimated value per perch LKR 12.0 million - LKR 16.0 million Positively correlated sensitivity
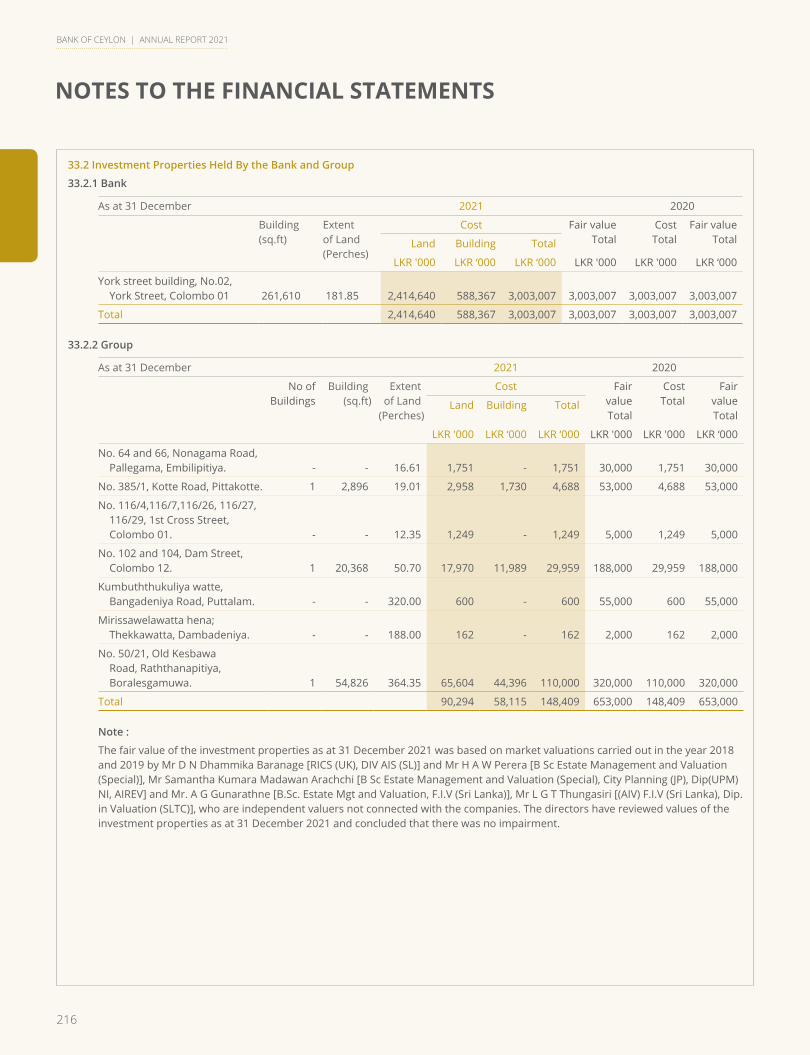
216
NOTES TO THE FINANCIAL STATEMENTS
BANK OF CEYLON | ANNUAL REPORT 2021
33.2 Investment Properties Held By the Bank and Group
33.2.1 Bank
As at 31 December 2021 2020
Building(sq.ft)
Extentof Land(Perches)
Cost Fair valueTotal
CostTotal
Fair valueTotalLand Building Total
LKR '000 LKR ‘000 LKR ‘000 LKR '000 LKR '000 LKR ‘000
York street building, No.02, York Street, Colombo 01 261,610 181.85 2,414,640 588,367 3,003,007 3,003,007 3,003,007 3,003,007
Total 2,414,640 588,367 3,003,007 3,003,007 3,003,007 3,003,007
33.2.2 Group
As at 31 December 2021 2020
No ofBuildings
Building(sq.ft)
Extentof Land
(Perches)
Cost Fair valueTotal
CostTotal
Fair valueTotal
Land Building Total
LKR '000 LKR ‘000 LKR ‘000 LKR '000 LKR '000 LKR ‘000
No. 64 and 66, Nonagama Road, Pallegama, Embilipitiya. - - 16.61 1,751 - 1,751 30,000 1,751 30,000
No. 385/1, Kotte Road, Pittakotte. 1 2,896 19.01 2,958 1,730 4,688 53,000 4,688 53,000
No. 116/4,116/7,116/26, 116/27, 116/29, 1st Cross Street, Colombo 01. - - 12.35 1,249 - 1,249 5,000 1,249 5,000
No. 102 and 104, Dam Street, Colombo 12. 1 20,368 50.70 17,970 11,989 29,959 188,000 29,959 188,000
Kumbuththukuliya watte, Bangadeniya Road, Puttalam. - - 320.00 600 - 600 55,000 600 55,000
Mirissawelawatta hena; Thekkawatta, Dambadeniya. - - 188.00 162 - 162 2,000 162 2,000
No. 50/21, Old Kesbawa Road, Raththanapitiya, Boralesgamuwa. 1 54,826 364.35 65,604 44,396 110,000 320,000 110,000 320,000
Total 90,294 58,115 148,409 653,000 148,409 653,000
Note :
The fair value of the investment properties as at 31 December 2021 was based on market valuations carried out in the year 2018 and 2019 by Mr D N Dhammika Baranage [RICS (UK), DIV AIS (SL)] and Mr H A W Perera [B Sc Estate Management and Valuation (Special)], Mr Samantha Kumara Madawan Arachchi [B Sc Estate Management and Valuation (Special), City Planning (JP), Dip(UPM)NI, AIREV] and Mr. A G Gunarathne [B.Sc. Estate Mgt and Valuation, F.I.V (Sri Lanka)], Mr L G T Thungasiri [(AIV) F.I.V (Sri Lanka), Dip. in Valuation (SLTC)], who are independent valuers not connected with the companies. The directors have reviewed values of the investment properties as at 31 December 2021 and concluded that there was no impairment.
217
Overview Leadership Insights Our Bank Our Strategy Our Performance
Stakeholder Outcomes Accountability Financial Reports Compliance Annexes Supplimentary Information
BANK OF CEYLON | ANNUAL REPORT 2021
34 Property, Plant and Equipment
Recognition
Property, Plant and Equipment (PPE) are recognised if it is probable that future economic benefits associated with the assets will flow to the Group and the cost of the asset can be reliably measured.
Measurement
Cost of Property, Plant and Equipment includes expenditures that are directly attributable to the acquisition of the asset. The cost of self-constructed assets includes the cost of materials and direct labour, any other costs directly attributable to bringing the assets to a working condition for their intended use, the costs of dismantling and removing the items and restoring the site on which they are located. Purchased software that is integral to the functionality of the related equipment is also capitalised as part of that equipment.
Items of Property, Plant and Equipment are measured at cost less accumulated depreciation and accumulated impairment losses. Revaluation model is applied for entire class of freehold land and buildings and buildings on leasehold lands. The Market participant’s ability to generate economic benefits by using the asset in its highest and best use or by selling it to another market participant that would use the asset in its highest and best use are taken into account in measuring the fair value.
Properties that carried at revaluation amount being their fair value at the date of revaluation, less any subsequent accumulated depreciation and subsequent accumulated impairment losses. Freehold land and building of the Group are revalued every three to five years or more frequently if the fair values are substantially different from their carrying amounts to ensure that the carrying amounts do not differ from the fair values at the Reporting date. Any surplus arising on revaluation of an asset is accumulated under the Revaluation Reserve in Equity through Other Comprehensive Income. However, if there is any revaluation deficit of the same asset previously recognised on profit or loss, revaluation surplus is recognised on Profit or Loss to the extent it reverse such deficit. Any deficit arising on revaluation of assets are recognised on Profit or Loss and such deficit is recognised in Other Comprehensive Income to the extent of any credit balance existing in the revaluation reserve in respect of that asset.
Accumulated depreciation as at revaluation date is eliminated against the gross carrying amount of assets and the net amount restated to the revalued amount of the assets. Where the carrying value of the Property, Plant and Equipment are reviewed for impairment, when an event or changes in circumstances indicate that the carrying value may not be recoverable.
When parts of an item of Property, Plant and Equipment have different useful lives, they are accounted for as separate items (major components) of PPE.
Subsequent Costs
The cost of replacing a part of an item of PPE is recognised in the carrying amount of the item if it is probable that the future economic benefits embodied within the part will flow to the Group and its cost can be measured reliably. The costs of the day to day servicing of Property, Plant and Equipment are recognised in the Statement of Profit or Loss in “ Other expenses “(Note 17) as incurred.
Capital Work in Progress
Capital work in progress is stated at cost. These are expenses of a capital nature directly incurred in the construction of buildings, awaiting capitalisation.
Borrowing Costs
Borrowing costs directly attributable to the acquisition, construction or production of an asset that necessarily takes a substantial period of time to get ready for its intended use or sale are capitalised as part of the cost of the asset. All other borrowing costs are expensed in the period in which they occur. Borrowing costs consist of interest and other costs that the bank incurs in connection with the borrowing of funds.
218
NOTES TO THE FINANCIAL STATEMENTS
BANK OF CEYLON | ANNUAL REPORT 2021
Depreciation
Depreciation is recognised in Statement of Profit or Loss on a straight line basis over the estimated useful lives of each part of an item of Property, Plant and Equipment since this method most closely reflects the expected pattern of consumption of the future economic benefits embodied in the asset. Leased assets under finance leases are depreciated over the shorter of the lease term and their useful lives. Land is not depreciated. Further, cost of expansion and major renovations on the building are depreciated over the remaining useful lives of the original buildings.
Provisioning for depreciation of PPE is made on prorata basis.
The Group’s estimated useful lives for the current and comparative periods are as follows:
Freehold buildings 40 - 60 years
Office equipment 03 - 08 years
Computer equipment 04 - 05 years
Furniture and fittings 08 years
Motor vehicles 04 years
Power plant 20 years
Depreciation methods, useful lives and residual values are reassessed at each financial year end and adjusted if appropriate.
Useful Life and Residual Values
Residual value is the amount that Group could receive for an asset at the reporting date if the asset was already at the age and in the condition that it will be in when the Group expects to dispose it.
The residual and useful life of an asset are reviewed at least at each reporting date, changes in the residual value and useful life are accounted for prospectively as a change in an accounting estimate only if the residual value is material.
Derecognition
The carrying amount of an item of Property, Plant and Equipment is derecognised on disposal, replacement or when no future economic benefits are expected from its use. The gain or loss arising from the derecognition of an item of Property, Plant and Equipment is included in the “Net other operating income” (Note 13) / “Other expenses” (Note 17) in the Statement of Profit or Loss in the year the item is derecognised.
ReclassificationasInvestmentProperty
When the use of property changes such that is reclassified as investment property, its fair value at the date of reclassification becomes its cost for subsequent accounting. Any gain arising on re-measurement is recognised in the Statement of Profit or Loss to the extent that it reverses a previous impairment loss on the specific property, with any remaining gain recognised in other Comprehensive Income and presented in revaluation reserve in equity. Any loss is recognised immediately in the Statement of Profit or Loss.
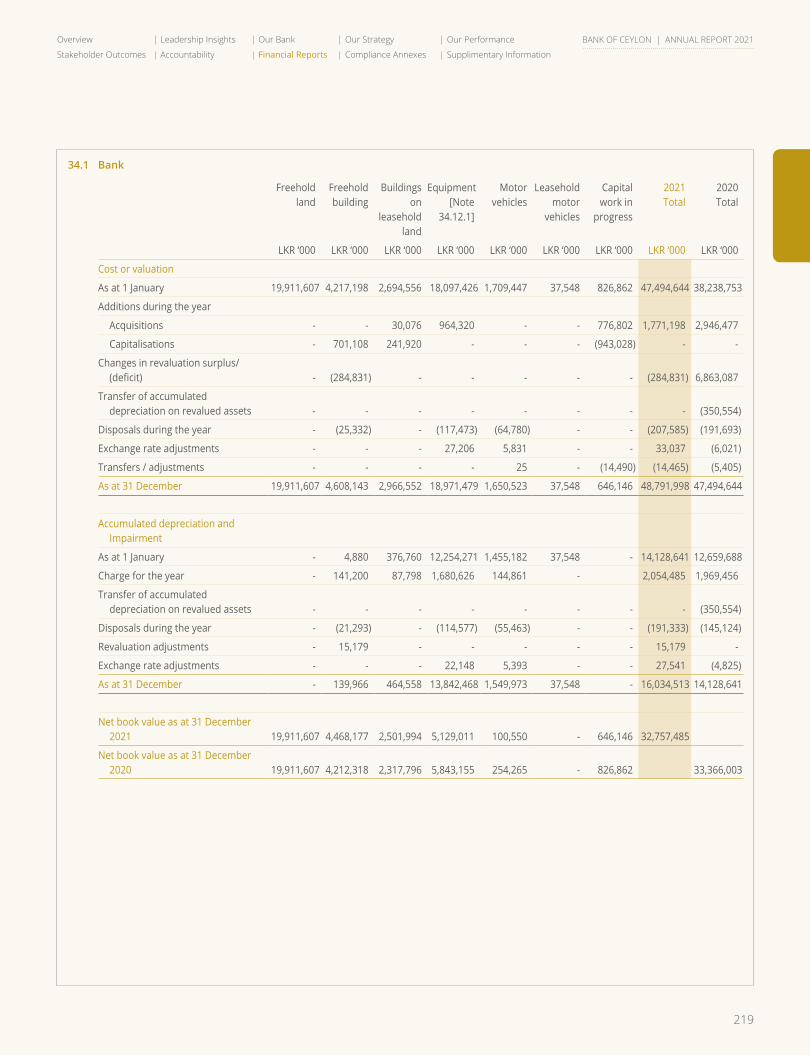
219
Overview Leadership Insights Our Bank Our Strategy Our Performance
Stakeholder Outcomes Accountability Financial Reports Compliance Annexes Supplimentary Information
BANK OF CEYLON | ANNUAL REPORT 2021
34.1 Bank
Freeholdland
Freeholdbuilding
Buildings on
leasehold land
Equipment[Note
34.12.1]
Motorvehicles
Leaseholdmotor
vehicles
Capitalwork in
progress
2021Total
2020Total
LKR ‘000 LKR ‘000 LKR ‘000 LKR ‘000 LKR ‘000 LKR ‘000 LKR ‘000 LKR ‘000 LKR ‘000
Cost or valuation
As at 1 January 19,911,607 4,217,198 2,694,556 18,097,426 1,709,447 37,548 826,862 47,494,644 38,238,753
Additions during the year
Acquisitions - - 30,076 964,320 - - 776,802 1,771,198 2,946,477
Capitalisations - 701,108 241,920 - - - (943,028) - -
Changes in revaluation surplus/ (deficit) - (284,831) - - - - - (284,831) 6,863,087
Transfer of accumulated depreciation on revalued assets - - - - - - - - (350,554)
Disposals during the year - (25,332) - (117,473) (64,780) - - (207,585) (191,693)
Exchange rate adjustments - - - 27,206 5,831 - - 33,037 (6,021)
Transfers / adjustments - - - - 25 - (14,490) (14,465) (5,405)
As at 31 December 19,911,607 4,608,143 2,966,552 18,971,479 1,650,523 37,548 646,146 48,791,998 47,494,644
Accumulated depreciation and Impairment
As at 1 January - 4,880 376,760 12,254,271 1,455,182 37,548 - 14,128,641 12,659,688
Charge for the year - 141,200 87,798 1,680,626 144,861 - 2,054,485 1,969,456
Transfer of accumulated depreciation on revalued assets - - - - - - - - (350,554)
Disposals during the year - (21,293) - (114,577) (55,463) - - (191,333) (145,124)
Revaluation adjustments - 15,179 - - - - - 15,179 -
Exchange rate adjustments - - - 22,148 5,393 - - 27,541 (4,825)
As at 31 December - 139,966 464,558 13,842,468 1,549,973 37,548 - 16,034,513 14,128,641
Net book value as at 31 December 2021 19,911,607 4,468,177 2,501,994 5,129,011 100,550 - 646,146 32,757,485
Net book value as at 31 December 2020 19,911,607 4,212,318 2,317,796 5,843,155 254,265 - 826,862 33,366,003
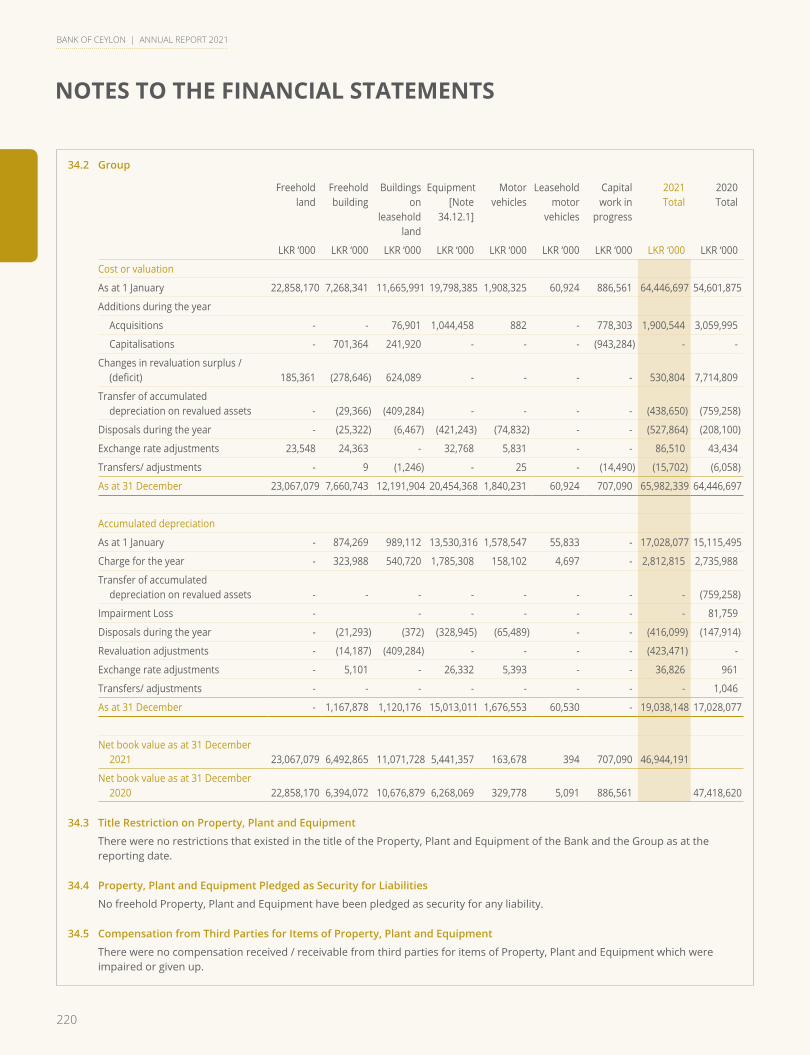
220
NOTES TO THE FINANCIAL STATEMENTS
BANK OF CEYLON | ANNUAL REPORT 2021
34.2 Group
Freeholdland
Freeholdbuilding
Buildings on
leasehold land
Equipment[Note
34.12.1]
Motorvehicles
Leaseholdmotor
vehicles
Capitalwork in
progress
2021Total
2020Total
LKR ‘000 LKR ‘000 LKR ‘000 LKR ‘000 LKR ‘000 LKR ‘000 LKR ‘000 LKR ‘000 LKR ‘000
Cost or valuation
As at 1 January 22,858,170 7,268,341 11,665,991 19,798,385 1,908,325 60,924 886,561 64,446,697 54,601,875
Additions during the year
Acquisitions - - 76,901 1,044,458 882 - 778,303 1,900,544 3,059,995
Capitalisations - 701,364 241,920 - - - (943,284) - -
Changes in revaluation surplus / (deficit) 185,361 (278,646) 624,089 - - - - 530,804 7,714,809
Transfer of accumulated depreciation on revalued assets - (29,366) (409,284) - - - - (438,650) (759,258)
Disposals during the year - (25,322) (6,467) (421,243) (74,832) - - (527,864) (208,100)
Exchange rate adjustments 23,548 24,363 - 32,768 5,831 - - 86,510 43,434
Transfers/ adjustments - 9 (1,246) - 25 - (14,490) (15,702) (6,058)
As at 31 December 23,067,079 7,660,743 12,191,904 20,454,368 1,840,231 60,924 707,090 65,982,339 64,446,697
Accumulated depreciation
As at 1 January - 874,269 989,112 13,530,316 1,578,547 55,833 - 17,028,077 15,115,495
Charge for the year - 323,988 540,720 1,785,308 158,102 4,697 - 2,812,815 2,735,988
Transfer of accumulated depreciation on revalued assets - - - - - - - - (759,258)
Impairment Loss - - - - - - - 81,759
Disposals during the year - (21,293) (372) (328,945) (65,489) - - (416,099) (147,914)
Revaluation adjustments - (14,187) (409,284) - - - - (423,471) -
Exchange rate adjustments - 5,101 - 26,332 5,393 - - 36,826 961
Transfers/ adjustments - - - - - - - - 1,046
As at 31 December - 1,167,878 1,120,176 15,013,011 1,676,553 60,530 - 19,038,148 17,028,077
Net book value as at 31 December 2021 23,067,079 6,492,865 11,071,728 5,441,357 163,678 394 707,090 46,944,191
Net book value as at 31 December 2020 22,858,170 6,394,072 10,676,879 6,268,069 329,778 5,091 886,561 47,418,620
34.3 Title Restriction on Property, Plant and Equipment
There were no restrictions that existed in the title of the Property, Plant and Equipment of the Bank and the Group as at the reporting date.
34.4 Property, Plant and Equipment Pledged as Security for Liabilities
No freehold Property, Plant and Equipment have been pledged as security for any liability.
34.5 Compensation from Third Parties for Items of Property, Plant and Equipment
There were no compensation received / receivable from third parties for items of Property, Plant and Equipment which were impaired or given up.
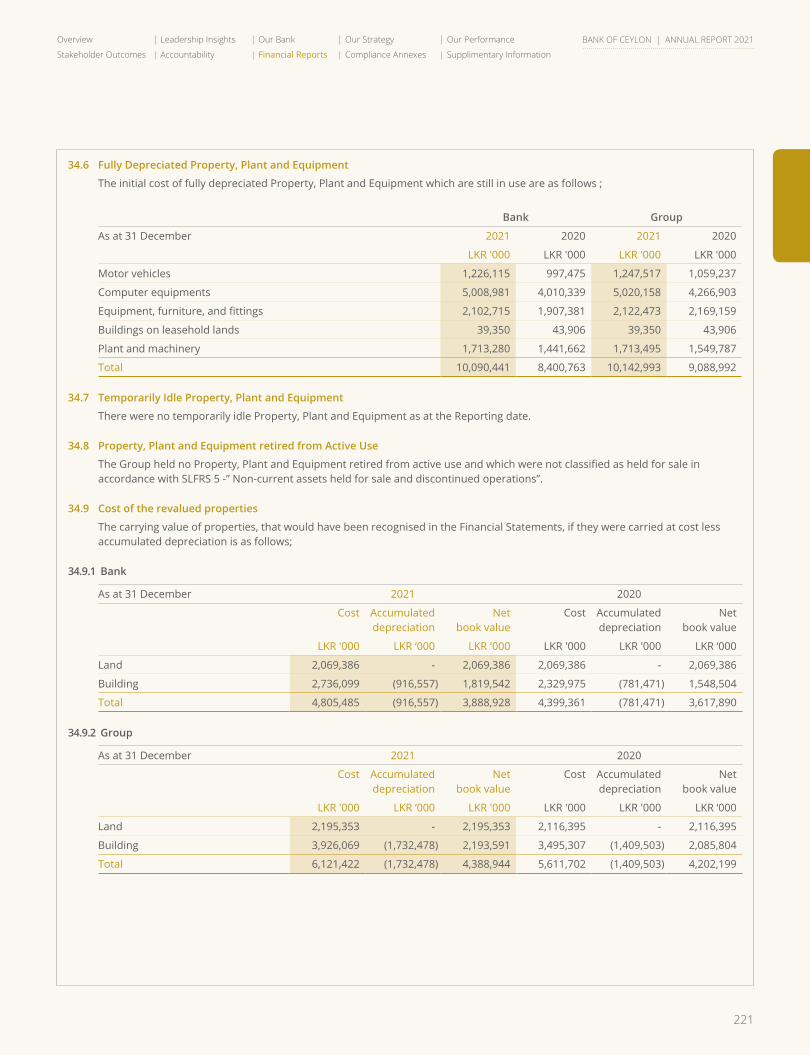
221
Overview Leadership Insights Our Bank Our Strategy Our Performance
Stakeholder Outcomes Accountability Financial Reports Compliance Annexes Supplimentary Information
BANK OF CEYLON | ANNUAL REPORT 2021
34.6 Fully Depreciated Property, Plant and Equipment
The initial cost of fully depreciated Property, Plant and Equipment which are still in use are as follows ;
Bank Group
As at 31 December 2021 2020 2021 2020
LKR '000 LKR '000 LKR '000 LKR '000
Motor vehicles 1,226,115 997,475 1,247,517 1,059,237
Computer equipments 5,008,981 4,010,339 5,020,158 4,266,903
Equipment, furniture, and fittings 2,102,715 1,907,381 2,122,473 2,169,159
Buildings on leasehold lands 39,350 43,906 39,350 43,906
Plant and machinery 1,713,280 1,441,662 1,713,495 1,549,787
Total 10,090,441 8,400,763 10,142,993 9,088,992
34.7 Temporarily Idle Property, Plant and Equipment
There were no temporarily idle Property, Plant and Equipment as at the Reporting date.
34.8 Property, Plant and Equipment retired from Active Use
The Group held no Property, Plant and Equipment retired from active use and which were not classified as held for sale in accordance with SLFRS 5 -” Non-current assets held for sale and discontinued operations”.
34.9 Cost of the revalued properties
The carrying value of properties, that would have been recognised in the Financial Statements, if they were carried at cost less accumulated depreciation is as follows;
34.9.1 Bank
As at 31 December 2021 2020
Cost Accumulateddepreciation
Netbook value
Cost Accumulateddepreciation
Net book value
LKR '000 LKR ‘000 LKR '000 LKR '000 LKR '000 LKR ‘000
Land 2,069,386 - 2,069,386 2,069,386 - 2,069,386
Building 2,736,099 (916,557) 1,819,542 2,329,975 (781,471) 1,548,504
Total 4,805,485 (916,557) 3,888,928 4,399,361 (781,471) 3,617,890
34.9.2 Group
As at 31 December 2021 2020
Cost Accumulateddepreciation
Netbook value
Cost Accumulateddepreciation
Net book value
LKR '000 LKR ‘000 LKR '000 LKR '000 LKR '000 LKR ‘000
Land 2,195,353 - 2,195,353 2,116,395 - 2,116,395
Building 3,926,069 (1,732,478) 2,193,591 3,495,307 (1,409,503) 2,085,804
Total 6,121,422 (1,732,478) 4,388,944 5,611,702 (1,409,503) 4,202,199
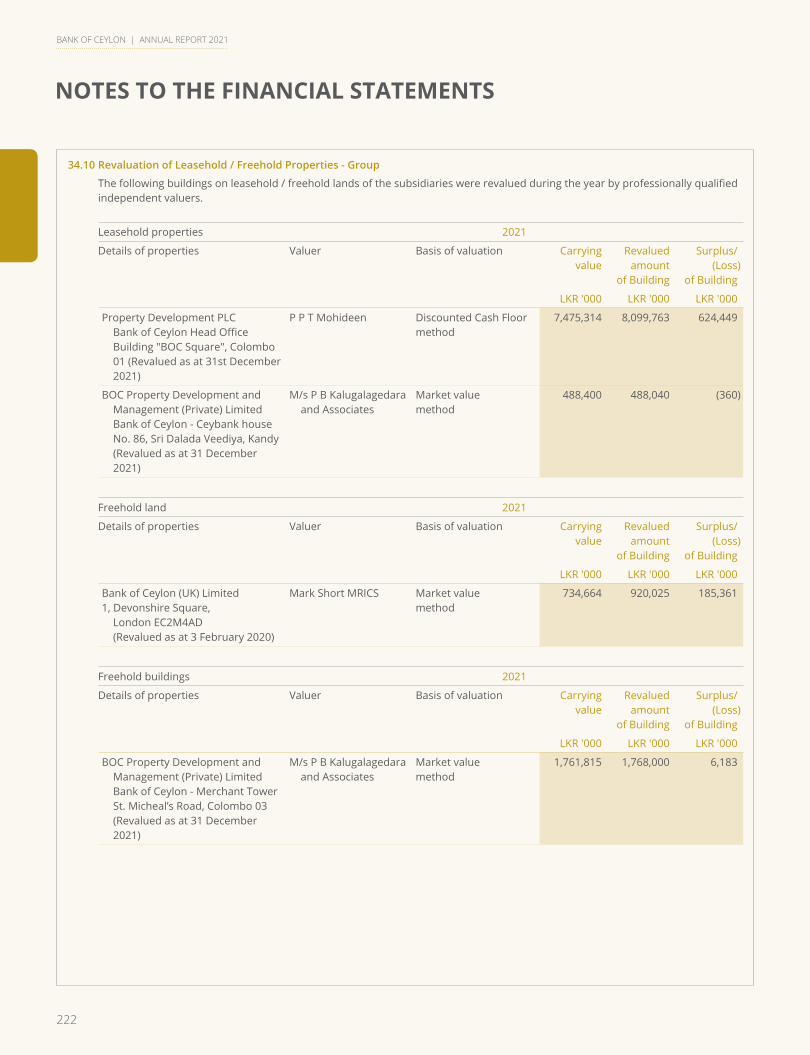
222
NOTES TO THE FINANCIAL STATEMENTS
BANK OF CEYLON | ANNUAL REPORT 2021
34.10 Revaluation of Leasehold / Freehold Properties - Group
The following buildings on leasehold / freehold lands of the subsidiaries were revalued during the year by professionally qualified independent valuers.
Leasehold properties 2021
Details of properties Valuer Basis of valuation Carryingvalue
Revalued amount
of Building
Surplus/(Loss)
of Building
LKR '000 LKR '000 LKR '000
Property Development PLC Bank of Ceylon Head Office Building "BOC Square", Colombo 01 (Revalued as at 31st December 2021)
P P T Mohideen Discounted Cash Floor method
7,475,314 8,099,763 624,449
BOC Property Development and Management (Private) Limited Bank of Ceylon - Ceybank house No. 86, Sri Dalada Veediya, Kandy (Revalued as at 31 December 2021)
M/s P B Kalugalagedara and Associates
Market valuemethod
488,400 488,040 (360)
Freehold land 2021
Details of properties Valuer Basis of valuation Carryingvalue
Revalued amount
of Building
Surplus/(Loss)
of Building
LKR '000 LKR '000 LKR '000
Bank of Ceylon (UK) Limited1, Devonshire Square,
London EC2M4AD (Revalued as at 3 February 2020)
Mark Short MRICS Market valuemethod
734,664 920,025 185,361
Freehold buildings 2021
Details of properties Valuer Basis of valuation Carryingvalue
Revalued amount
of Building
Surplus/(Loss)
of Building
LKR '000 LKR '000 LKR '000
BOC Property Development and Management (Private) Limited Bank of Ceylon - Merchant Tower St. Micheal’s Road, Colombo 03 (Revalued as at 31 December 2021)
M/s P B Kalugalagedara and Associates
Market valuemethod
1,761,815 1,768,000 6,183
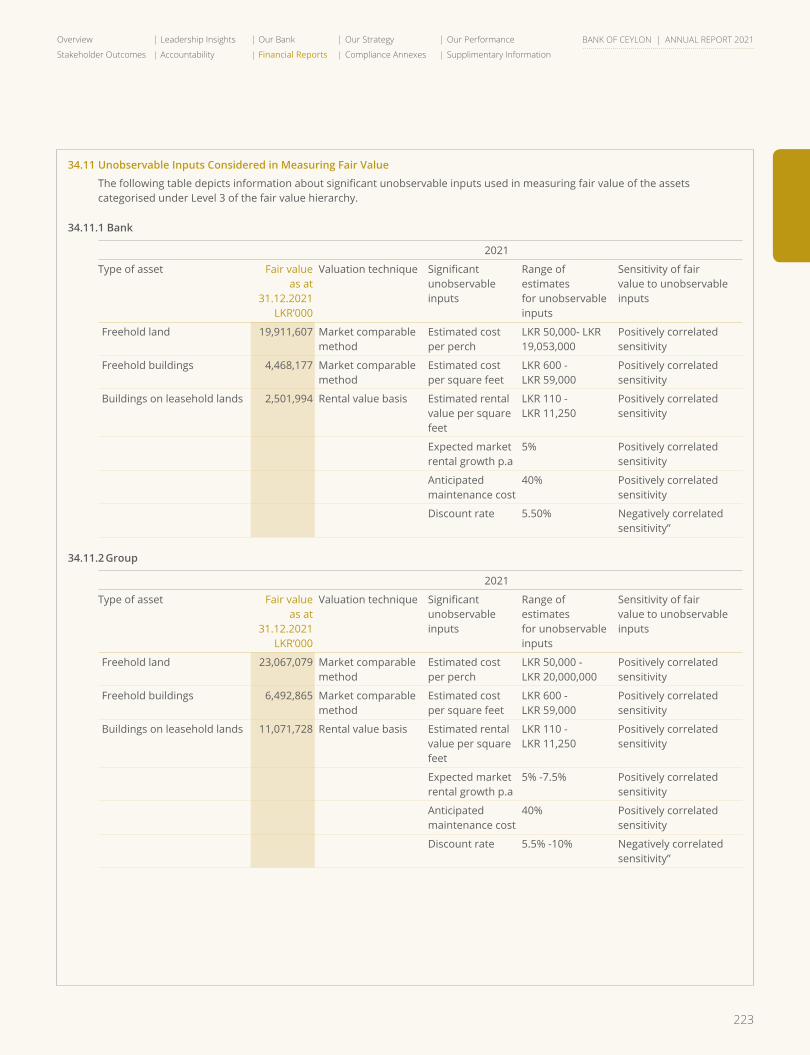
223
Overview Leadership Insights Our Bank Our Strategy Our Performance
Stakeholder Outcomes Accountability Financial Reports Compliance Annexes Supplimentary Information
BANK OF CEYLON | ANNUAL REPORT 2021
34.11 Unobservable Inputs Considered in Measuring Fair Value
The following table depicts information about significant unobservable inputs used in measuring fair value of the assets categorised under Level 3 of the fair value hierarchy.
34.11.1 Bank
2021
Type of asset Fair valueas at
31.12.2021LKR’000
Valuation technique Significantunobservableinputs
Range of estimatesfor unobservableinputs
Sensitivity of fairvalue to unobservableinputs
Freehold land 19,911,607 Market comparable method
Estimated cost per perch
LKR 50,000- LKR 19,053,000
Positively correlated sensitivity
Freehold buildings 4,468,177 Market comparable method
Estimated cost per square feet
LKR 600 -LKR 59,000
Positively correlated sensitivity
Buildings on leasehold lands 2,501,994 Rental value basis Estimated rental value per square feet
LKR 110 -LKR 11,250
Positively correlated sensitivity
Expected market rental growth p.a
5% Positively correlated sensitivity
Anticipated maintenance cost
40% Positively correlated sensitivity
Discount rate 5.50% Negatively correlated sensitivity”
34.11.2 Group
2021
Type of asset Fair valueas at
31.12.2021LKR’000
Valuation technique Significantunobservableinputs
Range of estimatesfor unobservableinputs
Sensitivity of fairvalue to unobservableinputs
Freehold land 23,067,079 Market comparable method
Estimated cost per perch
LKR 50,000 -LKR 20,000,000
Positively correlated sensitivity
Freehold buildings 6,492,865 Market comparable method
Estimated cost per square feet
LKR 600 -LKR 59,000
Positively correlated sensitivity
Buildings on leasehold lands 11,071,728 Rental value basis Estimated rental value per square feet
LKR 110 -LKR 11,250
Positively correlated sensitivity
Expected market rental growth p.a
5% -7.5% Positively correlated sensitivity
Anticipated maintenance cost
40% Positively correlated sensitivity
Discount rate 5.5% -10% Negatively correlated sensitivity”
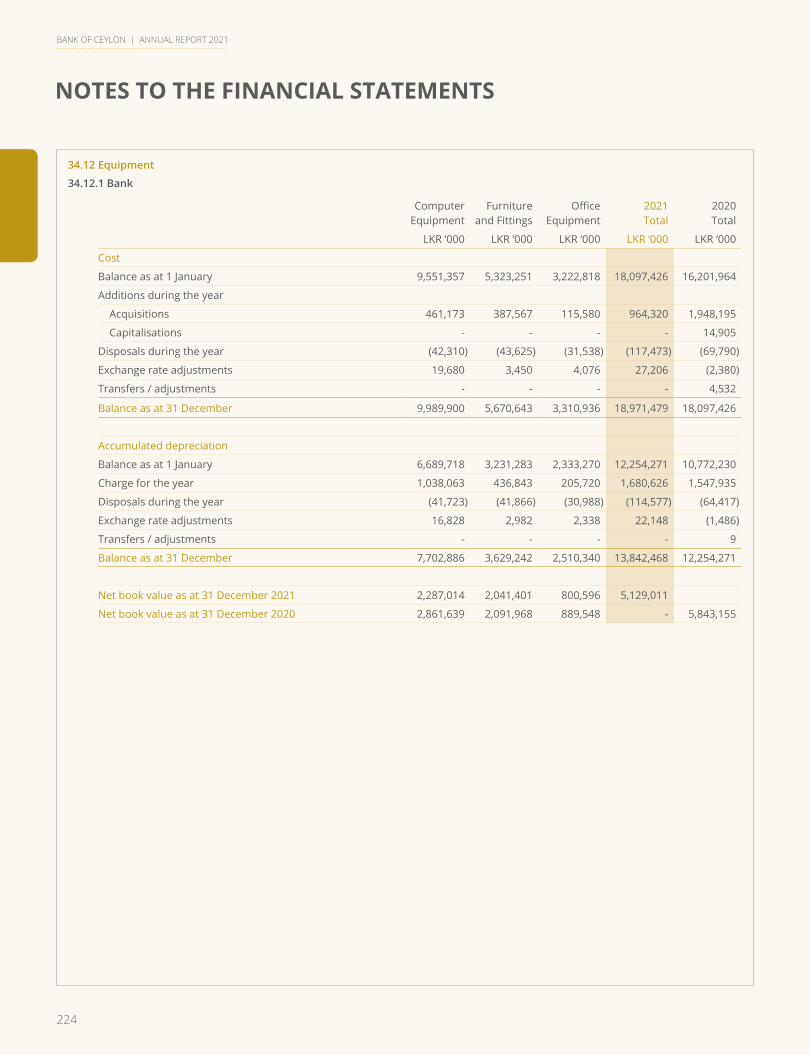
224
NOTES TO THE FINANCIAL STATEMENTS
BANK OF CEYLON | ANNUAL REPORT 2021
34.12 Equipment
34.12.1 Bank
Computer Equipment
Furniture and Fittings
Office Equipment
2021Total
2020Total
LKR ‘000 LKR ‘000 LKR ‘000 LKR ‘000 LKR ‘000
Cost
Balance as at 1 January 9,551,357 5,323,251 3,222,818 18,097,426 16,201,964
Additions during the year
Acquisitions 461,173 387,567 115,580 964,320 1,948,195
Capitalisations - - - - 14,905
Disposals during the year (42,310) (43,625) (31,538) (117,473) (69,790)
Exchange rate adjustments 19,680 3,450 4,076 27,206 (2,380)
Transfers / adjustments - - - - 4,532
Balance as at 31 December 9,989,900 5,670,643 3,310,936 18,971,479 18,097,426
Accumulated depreciation
Balance as at 1 January 6,689,718 3,231,283 2,333,270 12,254,271 10,772,230
Charge for the year 1,038,063 436,843 205,720 1,680,626 1,547,935
Disposals during the year (41,723) (41,866) (30,988) (114,577) (64,417)
Exchange rate adjustments 16,828 2,982 2,338 22,148 (1,486)
Transfers / adjustments - - - - 9
Balance as at 31 December 7,702,886 3,629,242 2,510,340 13,842,468 12,254,271
Net book value as at 31 December 2021 2,287,014 2,041,401 800,596 5,129,011
Net book value as at 31 December 2020 2,861,639 2,091,968 889,548 - 5,843,155
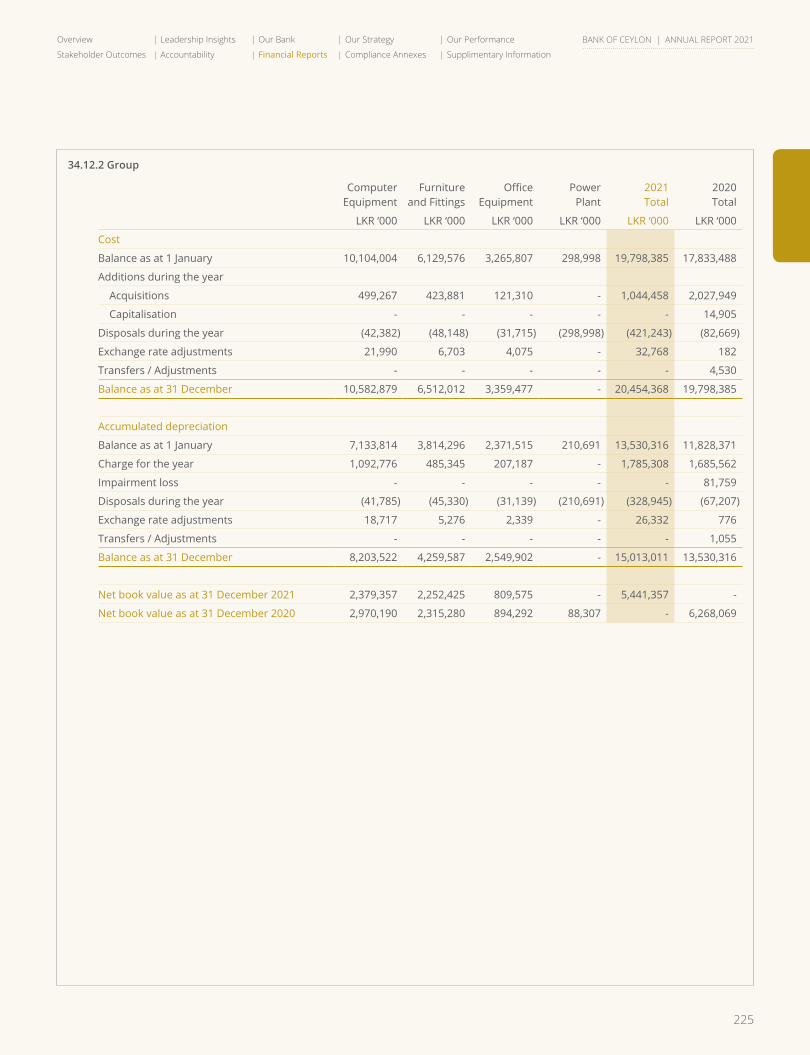
225
Overview Leadership Insights Our Bank Our Strategy Our Performance
Stakeholder Outcomes Accountability Financial Reports Compliance Annexes Supplimentary Information
BANK OF CEYLON | ANNUAL REPORT 2021
34.12.2 Group
Computer Equipment
Furniture and Fittings
Office Equipment
Power Plant
2021Total
2020Total
LKR ‘000 LKR ‘000 LKR ‘000 LKR ‘000 LKR ‘000 LKR ‘000
Cost
Balance as at 1 January 10,104,004 6,129,576 3,265,807 298,998 19,798,385 17,833,488
Additions during the year
Acquisitions 499,267 423,881 121,310 - 1,044,458 2,027,949
Capitalisation - - - - - 14,905
Disposals during the year (42,382) (48,148) (31,715) (298,998) (421,243) (82,669)
Exchange rate adjustments 21,990 6,703 4,075 - 32,768 182
Transfers / Adjustments - - - - - 4,530
Balance as at 31 December 10,582,879 6,512,012 3,359,477 - 20,454,368 19,798,385
Accumulated depreciation
Balance as at 1 January 7,133,814 3,814,296 2,371,515 210,691 13,530,316 11,828,371
Charge for the year 1,092,776 485,345 207,187 - 1,785,308 1,685,562
Impairment loss - - - - - 81,759
Disposals during the year (41,785) (45,330) (31,139) (210,691) (328,945) (67,207)
Exchange rate adjustments 18,717 5,276 2,339 - 26,332 776
Transfers / Adjustments - - - - - 1,055
Balance as at 31 December 8,203,522 4,259,587 2,549,902 - 15,013,011 13,530,316
Net book value as at 31 December 2021 2,379,357 2,252,425 809,575 - 5,441,357 -
Net book value as at 31 December 2020 2,970,190 2,315,280 894,292 88,307 - 6,268,069

226
NOTES TO THE FINANCIAL STATEMENTS
BANK OF CEYLON | ANNUAL REPORT 2021
34.13 The details of Freehold land and building held by the bank as at 31 December 2021 are as follows:
Name of Premises No. ofBuildings
Land Extent (Perches)
Building (Square feet)
Date of valuation
Valuer Basis of Valuation Revalued Amount of Land
Revalued Amountof Buildings
Total Value Accumulated Depreciation
Written Down Value
LKR ‘000 LKR ‘000 LKR ‘000 LKR ‘000 LKR ‘000
Central ProvinceGalaha Branch59/37, Deltota Road, Galaha 1 15.00 8,410 31.12.2020 R H Jayawardana Contractor's Method 22,500 29,370 51,870 839 51,031 Gampola Branch44, Kadugannawa Road, Gampola 1 175.00 9,832 31.12.2020 R H Jayawardana Contractor's Method 245,000 26,157 271,157 747 270,410 Galewela Branch 158, Dhambulla Road, Galewela 1 47.00 6,958 30.11.2020 Upali Rajapaksha Contractor's Method 117,500 60,193 177,693 1,437 176,256 HattonBranchandstaffQuarters46, Circular Road, Hatton 2 139.57 10,891 31.12.2020 R H Jayawardana Contractor's Method 279,140 42,970 322,110 1,098 321,012 Kandy 2nd City BranchCey Bank House, 88, Dalada Veediya, Kandy 1 42.81 18,523 31.12.2020 R H Jayawardana Contractor's Method 642,150 109,721 751,871 2,748 749,123 Kandapola Branch31,33, Main street, Kandapola 1 14.10 4,536 11.07.2018 K T D Tissera Contractor's Method 37,109 9,967 47,076 666 46,410 Maskeliya Branch66, Upcot Road, Maskeliya 1 42.05 6,607 31.12.2020 R H Jayawardana Contractor's Method 42,000 22,297 64,297 607 63,690 Nawalapitiya Branch6, Gampola Road, Nawalapitiya 1 21.92 9,790 31.12.2020 R H Jayawardana Contractor's Method 54,800 35,244 90,044 881 89,163 Nuwara Eliya Branch 43, Lawson Street, Nuwara Eliya 1 133.50 9,713 31.12.2020 R H Jayawardana Contractor's Method 867,750 38,863 906,613 955 905,658 NuwaraEliyaStaffQuarters14,19, Hill Street, Nuwara Eliya 1 41.40 4,847 31.12.2020 R H Jayawardana Contractor's Method 103,500 16,116 119,616 733 118,883 NuwaraEliyaPropertyLadiesstaffQuarters12, Hill Street, Nuwara Eliya 1 14.99 1,303 31.12.2020 R H Jayawardana Contractor's Method 11,242 4,104 15,346 103 15,243 Rikillagaskada Branch3, Dimbulkumbura Road, Rikillagaskada 1 19.60 4,676 26.07.2017 N M Keppetipola Contractor's Method 30,199 11,500 41,699 1,469 40,230 Thalawakele Branch23,25,29, Hatton Road, Thalawakele 1 25.30 7,332 31.12.2020 R H Jayawardana Contractor's Method 39,650 22,254 61,904 554 61,350 ThalawakeleStaffQuartersThalawakele Estate, Thalawakele 1 160.00 4,898 31.12.2020 R H Jayawardana Contractor's Method 11,200 13,944 25,144 349 24,795
2,503,740 442,700 2,946,440 13,186 2,933,254
Eastern ProvinceBatticaloa Branch19, Govington Road, Batticaloa 1 64.85 7,464 31.12.2020 R H Jayawardana Contractor's Method 64,850 23,676 88,526 1,184 87,342 Mutur Branch (New)36/1,Trincomalee Road Ward, No 07, Muttur 1 71.00 7,566 31.12.2020 R H Jayawardana Contractor's Method 24,850 45,396 70,246 1,135 69,111 Potuvil BranchMain Street, Pottuvil 1 10.70 4,077 31.12.2020 R H Jayawardana Contractor's Method 24,075 18,304 42,379 458 41,921 Trincomalee Branch24, Inner Harbour Road, Trincomalee 1 90.00 10,810 31.12.2020 R H Jayawardana Contractor's Method 99,000 25,699 124,699 1,274 123,425 Trincomalee City Branch 09, Main Street, Trincomalee 1 21.90 9,620 31.12.2020 R H Jayawardana Contractor's Method 38,325 85,863 124,188 179 124,009 Valachchenai BranchMain Street, Valachchenai 1 47.34 6,621 31.12.2020 R H Jayawardana Contractor's Method 37,872 18,795 56,667 614 56,053
288,972 217,733 506,705 4,844 501,861
Northern ProvinceJaffnaAreaOffice&Branch476, 476A, Hospital Road, Jaffna 2 166.25 23,641 30.11.2020 K T D Tissera Contractor's Method 540,000 35,137 575,137 1,752 573,385 Jaffna2ndBranch56, Stanley Road, Jaffna 1 33.89 18,092 30.10.2018 K T D Tissera Contractor's Method 135,269 52,330 187,599 2,835 184,764 Karainagar BranchPost Office View, Karainagar 1 20.09 2,633 30.11.2020 K T D Tissera Contractor's Method 5,000 9,000 14,000 257 13,743

227
Overview Leadership Insights Our Bank Our Strategy Our Performance
Stakeholder Outcomes Accountability Financial Reports Compliance Annexes Supplimentary Information
BANK OF CEYLON | ANNUAL REPORT 2021
34.13 The details of Freehold land and building held by the bank as at 31 December 2021 are as follows:
Name of Premises No. ofBuildings
Land Extent (Perches)
Building (Square feet)
Date of valuation
Valuer Basis of Valuation Revalued Amount of Land
Revalued Amountof Buildings
Total Value Accumulated Depreciation
Written Down Value
LKR ‘000 LKR ‘000 LKR ‘000 LKR ‘000 LKR ‘000
Central ProvinceGalaha Branch59/37, Deltota Road, Galaha 1 15.00 8,410 31.12.2020 R H Jayawardana Contractor's Method 22,500 29,370 51,870 839 51,031 Gampola Branch44, Kadugannawa Road, Gampola 1 175.00 9,832 31.12.2020 R H Jayawardana Contractor's Method 245,000 26,157 271,157 747 270,410 Galewela Branch 158, Dhambulla Road, Galewela 1 47.00 6,958 30.11.2020 Upali Rajapaksha Contractor's Method 117,500 60,193 177,693 1,437 176,256 HattonBranchandstaffQuarters46, Circular Road, Hatton 2 139.57 10,891 31.12.2020 R H Jayawardana Contractor's Method 279,140 42,970 322,110 1,098 321,012 Kandy 2nd City BranchCey Bank House, 88, Dalada Veediya, Kandy 1 42.81 18,523 31.12.2020 R H Jayawardana Contractor's Method 642,150 109,721 751,871 2,748 749,123 Kandapola Branch31,33, Main street, Kandapola 1 14.10 4,536 11.07.2018 K T D Tissera Contractor's Method 37,109 9,967 47,076 666 46,410 Maskeliya Branch66, Upcot Road, Maskeliya 1 42.05 6,607 31.12.2020 R H Jayawardana Contractor's Method 42,000 22,297 64,297 607 63,690 Nawalapitiya Branch6, Gampola Road, Nawalapitiya 1 21.92 9,790 31.12.2020 R H Jayawardana Contractor's Method 54,800 35,244 90,044 881 89,163 Nuwara Eliya Branch 43, Lawson Street, Nuwara Eliya 1 133.50 9,713 31.12.2020 R H Jayawardana Contractor's Method 867,750 38,863 906,613 955 905,658 NuwaraEliyaStaffQuarters14,19, Hill Street, Nuwara Eliya 1 41.40 4,847 31.12.2020 R H Jayawardana Contractor's Method 103,500 16,116 119,616 733 118,883 NuwaraEliyaPropertyLadiesstaffQuarters12, Hill Street, Nuwara Eliya 1 14.99 1,303 31.12.2020 R H Jayawardana Contractor's Method 11,242 4,104 15,346 103 15,243 Rikillagaskada Branch3, Dimbulkumbura Road, Rikillagaskada 1 19.60 4,676 26.07.2017 N M Keppetipola Contractor's Method 30,199 11,500 41,699 1,469 40,230 Thalawakele Branch23,25,29, Hatton Road, Thalawakele 1 25.30 7,332 31.12.2020 R H Jayawardana Contractor's Method 39,650 22,254 61,904 554 61,350 ThalawakeleStaffQuartersThalawakele Estate, Thalawakele 1 160.00 4,898 31.12.2020 R H Jayawardana Contractor's Method 11,200 13,944 25,144 349 24,795
2,503,740 442,700 2,946,440 13,186 2,933,254
Eastern ProvinceBatticaloa Branch19, Govington Road, Batticaloa 1 64.85 7,464 31.12.2020 R H Jayawardana Contractor's Method 64,850 23,676 88,526 1,184 87,342 Mutur Branch (New)36/1,Trincomalee Road Ward, No 07, Muttur 1 71.00 7,566 31.12.2020 R H Jayawardana Contractor's Method 24,850 45,396 70,246 1,135 69,111 Potuvil BranchMain Street, Pottuvil 1 10.70 4,077 31.12.2020 R H Jayawardana Contractor's Method 24,075 18,304 42,379 458 41,921 Trincomalee Branch24, Inner Harbour Road, Trincomalee 1 90.00 10,810 31.12.2020 R H Jayawardana Contractor's Method 99,000 25,699 124,699 1,274 123,425 Trincomalee City Branch 09, Main Street, Trincomalee 1 21.90 9,620 31.12.2020 R H Jayawardana Contractor's Method 38,325 85,863 124,188 179 124,009 Valachchenai BranchMain Street, Valachchenai 1 47.34 6,621 31.12.2020 R H Jayawardana Contractor's Method 37,872 18,795 56,667 614 56,053
288,972 217,733 506,705 4,844 501,861
Northern ProvinceJaffnaAreaOffice&Branch476, 476A, Hospital Road, Jaffna 2 166.25 23,641 30.11.2020 K T D Tissera Contractor's Method 540,000 35,137 575,137 1,752 573,385 Jaffna2ndBranch56, Stanley Road, Jaffna 1 33.89 18,092 30.10.2018 K T D Tissera Contractor's Method 135,269 52,330 187,599 2,835 184,764 Karainagar BranchPost Office View, Karainagar 1 20.09 2,633 30.11.2020 K T D Tissera Contractor's Method 5,000 9,000 14,000 257 13,743

228
NOTES TO THE FINANCIAL STATEMENTS
BANK OF CEYLON | ANNUAL REPORT 2021
Name of Premises No. ofBuildings
Land Extent (Perches)
Building (Square feet)
Date of valuation
Valuer Basis of Valuation Revalued Amount of Land
Revalued Amountof Buildings
Total Value Accumulated Depreciation
Written Down Value
LKR ‘000 LKR ‘000 LKR ‘000 LKR ‘000 LKR ‘000
Mannar Branch (Land)Moor Street, Mannar - 63.22 - 30.11.2020 A R M M Kaleel Contractor's Method 35,000 - 35,000 - 35,000 Nelliadi Branch23, Kodikamam Road, Nelliady 1 42.74 10,889 30.11.2020 A R M M Kaleel Contractor's Method 60,000 55,000 115,000 1,375 113,625
775,269 151,467 926,736 6,219 920,517
North Western Province Alawwa Branch64, Giriulla Road, Alawwa 1 30.80 7,011 30.11.2020 R W M S B Rajapaksha Contractor's Method 54,000 22,000 76,000 550 75,450 Bingiriya Land 44, Chilaw Road, Bingiriya - 40.00 - 30.11.2020 Upali Rajapaksha Contractor's Method 30,000 - 30,000 - 30,000 Chilaw BranchRadaguru Edmund Peiris Mawatha, Chilaw 1 38.25 8,935 30.11.2020 R W M S B Rajapaksha Contractor's Method 76,500 28,500 105,000 713 104,287 Dankotuwa Land01/60, Negombo Road, Dankotuwa - 32.90 - 03.08.2017 K T D Tissera Contractor's Method 49,973 - 49,973 - 49,973 Dummalasooriya Branch227, Kuliyapitiya - Madampe Road, Dummalasuriya 1 41.68 6,139 30.11.2020 R W M S B Rajapaksha Contractor's Method 41,500 23,500 65,000 587 64,413 KurunegalaProvinceOffice,AGM'sQuarters&CM Quarters18, Mihindu Mawatha, Kurunegala 3 225.00 20,575 31.12.2020 R H Jayawardana Contractor's Method 1,012,500 95,277 1,107,777 2,380 1,105,397 Kurunegala Super Grade BranchCommercial Complex, Kurunegala 1 - 12,242 31.12.2020 R H Jayawardana Investment method - 224,600 224,600 5,615 218,985 Kurunegala 2nd City Branch 35, Colombo Road, Kurunegala 1 49.40 28,000 30.11.2020 R W M S B Rajapaksha Comparison's Method 468,000 1,670 469,670 64 469,606 Madampe Branch10, Station Road, Madampe 1 61.10 7,260 30.11.2020 R W M S B Rajapaksha Contractor's Method 61,000 26,000 87,000 650 86,350 Madurankuliya Branch66, Colombo Road, Madurankuliya 1 46.00 5,760 30.11.2020 R W M S B Rajapaksha Contractor's Method 62,100 32,700 94,800 818 93,982 Malsiripura Branch 362, 358, Dambulla Road, Malsiripura 1 46.20 7,242 30.11.2020 R W M S B Rajapaksha Contractor's Method 69,000 47,443 116,443 1,180 115,263 Marawila Branch (Land)85, Negombo Road, Marawila - 35.00 - 03.04.2018 R W M S B Rajapaksha Contractor's Method 48,879 - 48,879 - 48,879 Narammala Branch139, Negombo Road, Narammala 1 117.50 7,190 30.11.2020 R W M S B Rajapaksha Contractor's Method 92,750 38,750 131,500 969 130,531 Nattandiya Branch (Land)115, Marawila Road, Nattandiya - 40.00 - 30.11.2020 Upali Rajapaksha Contractor's Method 60,000 - 60,000 - 60,000 Waikkal Branch (Land)43/44,Thopputota, Waikkal - 36.00 - 30.11.2020 Upali Rajapaksha Contractor's Method 60,000 - 60,000 - 60,000 Wariyapola Branch (Land)32, Kurunegala Road, Wariyapola - 40.80 - 30.11.2020 R W M S B Rajapaksha Comparison's Method 100,000 - 100,000 - 100,000
2,286,202 540,440 2,826,642 13,526 2,813,116
Sabaragamuwa ProvinceBalangoda Branch137,139, Main Street, Balangoda 1 14.50 3,520 30.11.2020 S A R Amarasinghe
Depreciated Replacement Cost Method 36,200 3,100 39,300 310 38,990
Dehiowita Branch62, Main Street, Dehiowita 1 38.60 3,818 30.11.2020 A G Gunaratna On Cost Approach 20,090 2,418 22,508 1,209 21,299 Kegalle Branch110, Colombo Road, Kegalle 1 131.38 16,718 30.11.2020 W D P Rupananda Contractor's Method 350,000 55,000 405,000 1,833 403,167 Ratnapura Branch6, Dharmapala Mawatha, Ratnapura 1 99.70 11,082 30.11.2020 W D P Rupananda Contractor's Method 110,000 35,000 145,000 972 144,028 Rathnapura Land25, Shaviya Mawatha, Ratnapura - 31.69 - 30.11.2020 W D P Rupananda Comparison Method 118,000 - 118,000 - 118,000
634,290 95,518 729,808 4,324 725,484
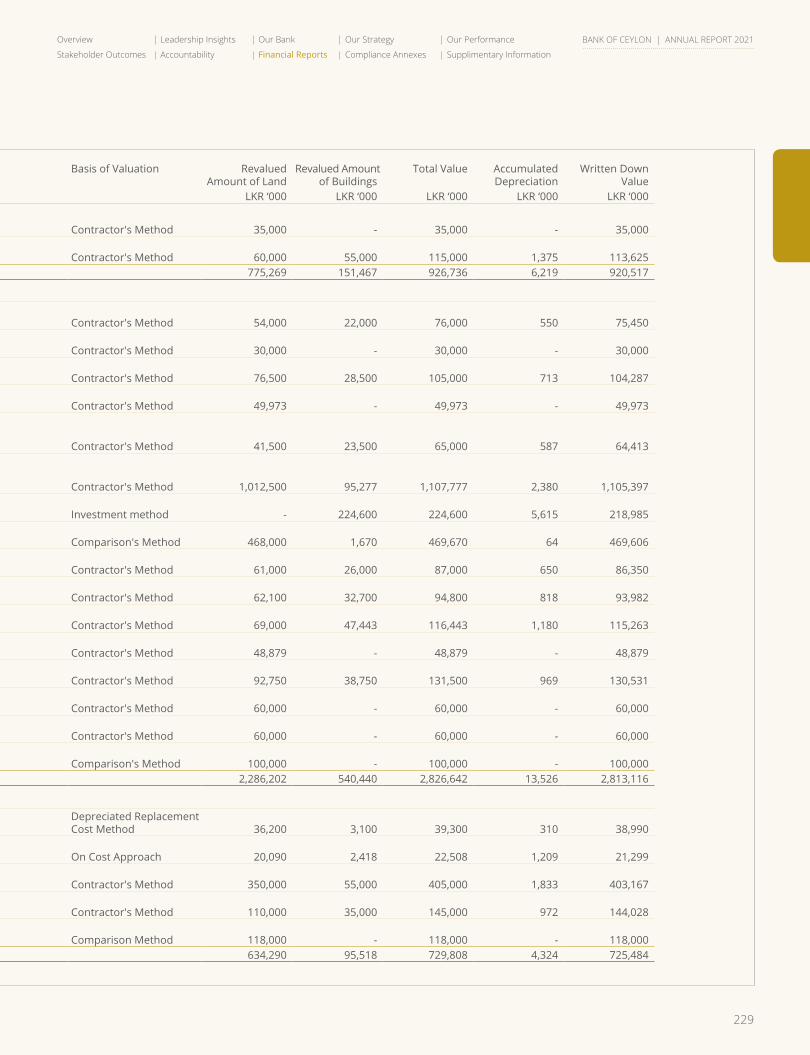
229
Overview Leadership Insights Our Bank Our Strategy Our Performance
Stakeholder Outcomes Accountability Financial Reports Compliance Annexes Supplimentary Information
BANK OF CEYLON | ANNUAL REPORT 2021
Name of Premises No. ofBuildings
Land Extent (Perches)
Building (Square feet)
Date of valuation
Valuer Basis of Valuation Revalued Amount of Land
Revalued Amountof Buildings
Total Value Accumulated Depreciation
Written Down Value
LKR ‘000 LKR ‘000 LKR ‘000 LKR ‘000 LKR ‘000
Mannar Branch (Land)Moor Street, Mannar - 63.22 - 30.11.2020 A R M M Kaleel Contractor's Method 35,000 - 35,000 - 35,000 Nelliadi Branch23, Kodikamam Road, Nelliady 1 42.74 10,889 30.11.2020 A R M M Kaleel Contractor's Method 60,000 55,000 115,000 1,375 113,625
775,269 151,467 926,736 6,219 920,517
North Western Province Alawwa Branch64, Giriulla Road, Alawwa 1 30.80 7,011 30.11.2020 R W M S B Rajapaksha Contractor's Method 54,000 22,000 76,000 550 75,450 Bingiriya Land 44, Chilaw Road, Bingiriya - 40.00 - 30.11.2020 Upali Rajapaksha Contractor's Method 30,000 - 30,000 - 30,000 Chilaw BranchRadaguru Edmund Peiris Mawatha, Chilaw 1 38.25 8,935 30.11.2020 R W M S B Rajapaksha Contractor's Method 76,500 28,500 105,000 713 104,287 Dankotuwa Land01/60, Negombo Road, Dankotuwa - 32.90 - 03.08.2017 K T D Tissera Contractor's Method 49,973 - 49,973 - 49,973 Dummalasooriya Branch227, Kuliyapitiya - Madampe Road, Dummalasuriya 1 41.68 6,139 30.11.2020 R W M S B Rajapaksha Contractor's Method 41,500 23,500 65,000 587 64,413 KurunegalaProvinceOffice,AGM'sQuarters&CM Quarters18, Mihindu Mawatha, Kurunegala 3 225.00 20,575 31.12.2020 R H Jayawardana Contractor's Method 1,012,500 95,277 1,107,777 2,380 1,105,397 Kurunegala Super Grade BranchCommercial Complex, Kurunegala 1 - 12,242 31.12.2020 R H Jayawardana Investment method - 224,600 224,600 5,615 218,985 Kurunegala 2nd City Branch 35, Colombo Road, Kurunegala 1 49.40 28,000 30.11.2020 R W M S B Rajapaksha Comparison's Method 468,000 1,670 469,670 64 469,606 Madampe Branch10, Station Road, Madampe 1 61.10 7,260 30.11.2020 R W M S B Rajapaksha Contractor's Method 61,000 26,000 87,000 650 86,350 Madurankuliya Branch66, Colombo Road, Madurankuliya 1 46.00 5,760 30.11.2020 R W M S B Rajapaksha Contractor's Method 62,100 32,700 94,800 818 93,982 Malsiripura Branch 362, 358, Dambulla Road, Malsiripura 1 46.20 7,242 30.11.2020 R W M S B Rajapaksha Contractor's Method 69,000 47,443 116,443 1,180 115,263 Marawila Branch (Land)85, Negombo Road, Marawila - 35.00 - 03.04.2018 R W M S B Rajapaksha Contractor's Method 48,879 - 48,879 - 48,879 Narammala Branch139, Negombo Road, Narammala 1 117.50 7,190 30.11.2020 R W M S B Rajapaksha Contractor's Method 92,750 38,750 131,500 969 130,531 Nattandiya Branch (Land)115, Marawila Road, Nattandiya - 40.00 - 30.11.2020 Upali Rajapaksha Contractor's Method 60,000 - 60,000 - 60,000 Waikkal Branch (Land)43/44,Thopputota, Waikkal - 36.00 - 30.11.2020 Upali Rajapaksha Contractor's Method 60,000 - 60,000 - 60,000 Wariyapola Branch (Land)32, Kurunegala Road, Wariyapola - 40.80 - 30.11.2020 R W M S B Rajapaksha Comparison's Method 100,000 - 100,000 - 100,000
2,286,202 540,440 2,826,642 13,526 2,813,116
Sabaragamuwa ProvinceBalangoda Branch137,139, Main Street, Balangoda 1 14.50 3,520 30.11.2020 S A R Amarasinghe
Depreciated Replacement Cost Method 36,200 3,100 39,300 310 38,990
Dehiowita Branch62, Main Street, Dehiowita 1 38.60 3,818 30.11.2020 A G Gunaratna On Cost Approach 20,090 2,418 22,508 1,209 21,299 Kegalle Branch110, Colombo Road, Kegalle 1 131.38 16,718 30.11.2020 W D P Rupananda Contractor's Method 350,000 55,000 405,000 1,833 403,167 Ratnapura Branch6, Dharmapala Mawatha, Ratnapura 1 99.70 11,082 30.11.2020 W D P Rupananda Contractor's Method 110,000 35,000 145,000 972 144,028 Rathnapura Land25, Shaviya Mawatha, Ratnapura - 31.69 - 30.11.2020 W D P Rupananda Comparison Method 118,000 - 118,000 - 118,000
634,290 95,518 729,808 4,324 725,484
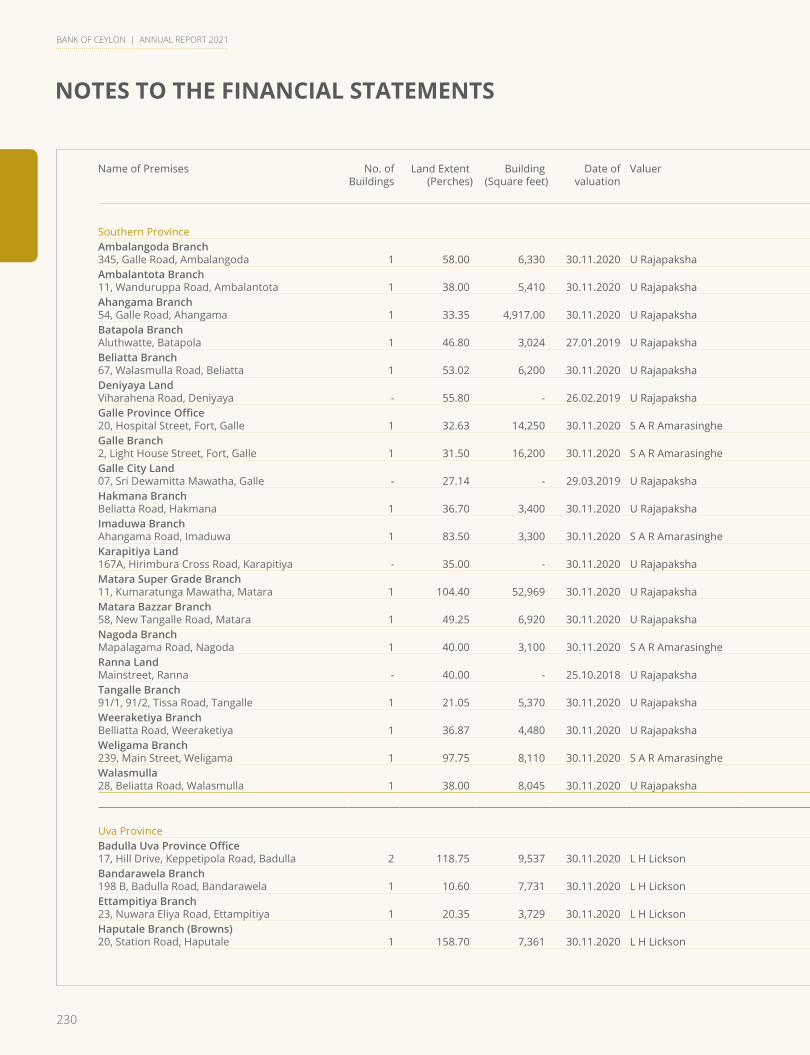
230
NOTES TO THE FINANCIAL STATEMENTS
BANK OF CEYLON | ANNUAL REPORT 2021
Name of Premises No. ofBuildings
Land Extent (Perches)
Building (Square feet)
Date of valuation
Valuer Basis of Valuation Revalued Amount of Land
Revalued Amountof Buildings
Total Value Accumulated Depreciation
Written Down Value
LKR ‘000 LKR ‘000 LKR ‘000 LKR ‘000 LKR ‘000
Southern ProvinceAmbalangoda Branch345, Galle Road, Ambalangoda 1 58.00 6,330 30.11.2020 U Rajapaksha Contractor's Method 116,000 39,550 155,550 989 154,561 Ambalantota Branch11, Wanduruppa Road, Ambalantota 1 38.00 5,410 30.11.2020 U Rajapaksha Contractor's Method 47,500 20,000 67,500 1,667 65,833 Ahangama Branch54, Galle Road, Ahangama 1 33.35 4,917.00 30.11.2020 U Rajapaksha Comparison Method 40,000 68,660 108,660 143 108,517 Batapola BranchAluthwatte, Batapola 1 46.80 3,024 27.01.2019 U Rajapaksha Contractor's Method 60,012 6,781 66,793 540 66,253 Beliatta Branch67, Walasmulla Road, Beliatta 1 53.02 6,200 30.11.2020 U Rajapaksha Contractor's Method 101,436 39,064 140,500 977 139,523 Deniyaya Land Viharahena Road, Deniyaya - 55.80 - 26.02.2019 U Rajapaksha Contractor's Method 57,224 - 57,224 - 57,224 GalleProvinceOffice20, Hospital Street, Fort, Galle 1 32.63 14,250 30.11.2020 S A R Amarasinghe Contractor's Method 261,000 25,650 286,650 1,282 285,368 Galle Branch2, Light House Street, Fort, Galle 1 31.50 16,200 30.11.2020 S A R Amarasinghe
Depreciated Replacement Cost Method 252,000 29,200 281,200 1,460 279,740
Galle City Land07, Sri Dewamitta Mawatha, Galle - 27.14 - 29.03.2019 U Rajapaksha Contractor's Method 126,566 - 126,566 - 126,566 Hakmana BranchBeliatta Road, Hakmana 1 36.70 3,400 30.11.2020 U Rajapaksha Contractor's Method 49,500 11,500 61,000 287 60,713 Imaduwa BranchAhangama Road, Imaduwa 1 83.50 3,300 30.11.2020 S A R Amarasinghe
Depreciated Replacement Cost Method 62,600 7,900 70,500 282 70,218
Karapitiya Land167A, Hirimbura Cross Road, Karapitiya - 35.00 - 30.11.2020 U Rajapaksha Comparison Method 77,000 - 77,000 - 77,000 Matara Super Grade Branch11, Kumaratunga Mawatha, Matara 1 104.40 52,969 30.11.2020 U Rajapaksha Contractor's Method 395,400 340,910 736,310 742 735,568 Matara Bazzar Branch58, New Tangalle Road, Matara 1 49.25 6,920 30.11.2020 U Rajapaksha Contractor's Method 153,750 43,729 197,479 1,093 196,386 Nagoda BranchMapalagama Road, Nagoda 1 40.00 3,100 30.11.2020 S A R Amarasinghe
Depreciated Replacement Cost Method 20,000 10,700 30,700 267 30,433
Ranna LandMainstreet, Ranna - 40.00 - 25.10.2018 U Rajapaksha Contractor's Method 28,199 - 28,199 - 28,199 Tangalle Branch91/1, 91/2, Tissa Road, Tangalle 1 21.05 5,370 30.11.2020 U Rajapaksha Contractor's Method 31,575 32,000 63,575 800 62,775 Weeraketiya BranchBelliatta Road, Weeraketiya 1 36.87 4,480 30.11.2020 U Rajapaksha Contractor's Method 48,000 26,700 74,700 667 74,033 Weligama Branch239, Main Street, Weligama 1 97.75 8,110 30.11.2020 S A R Amarasinghe
Depreciated Replacement Cost Method 97,750 22,265 120,015 731 119,284
Walasmulla 28, Beliatta Road, Walasmulla 1 38.00 8,045 30.11.2020 U Rajapaksha Contractor's Method 57,000 60,463 117,463 1,509 115,954
2,082,512 785,072 2,867,584 13,436 2,854,148
Uva ProvinceBadullaUvaProvinceOffice17, Hill Drive, Keppetipola Road, Badulla 2 118.75 9,537 30.11.2020 L H Lickson
Investment and Contractor's Method 59,316 17,347 76,663 1,927 74,736
Bandarawela Branch198 B, Badulla Road, Bandarawela 1 10.60 7,731 30.11.2020 L H Lickson Contractor's Method 82,824 23,776 106,600 1,399 105,201 Ettampitiya Branch23, Nuwara Eliya Road, Ettampitiya 1 20.35 3,729 30.11.2020 L H Lickson
Investment and Contractor's Method 11,123 10,628 21,751 266 21,485
Haputale Branch (Browns)20, Station Road, Haputale 1 158.70 7,361 30.11.2020 L H Lickson Contractor's Method 39,192 11,508 50,700 822 49,878
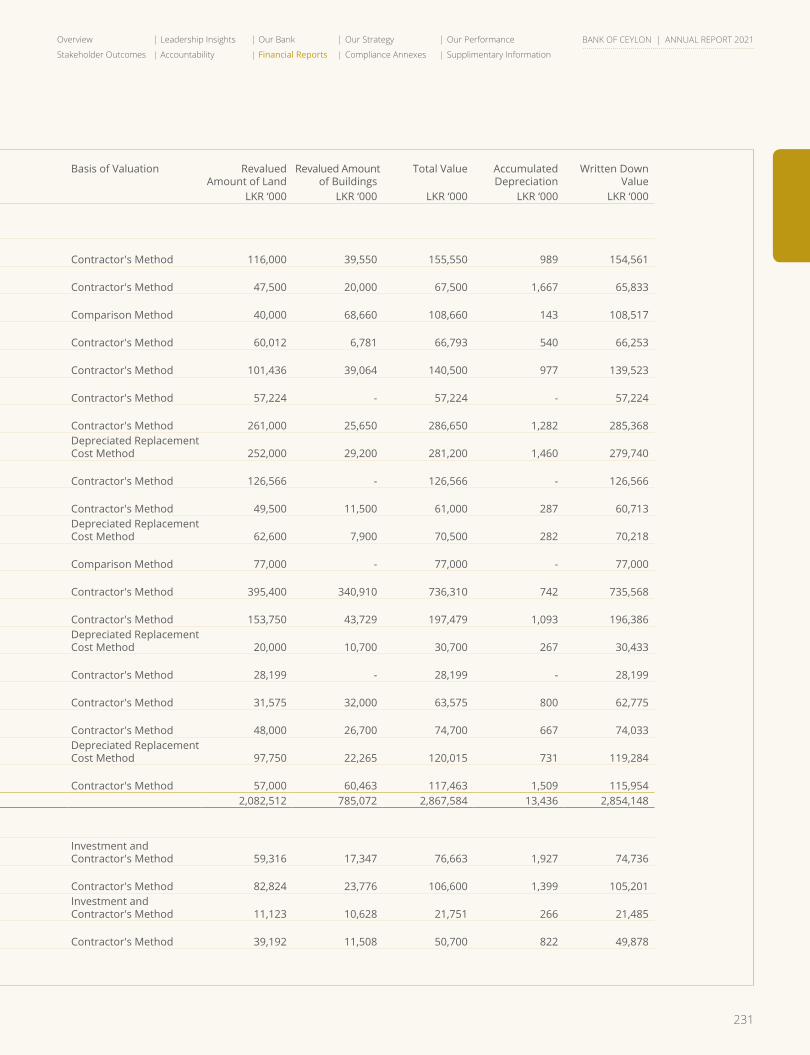
231
Overview Leadership Insights Our Bank Our Strategy Our Performance
Stakeholder Outcomes Accountability Financial Reports Compliance Annexes Supplimentary Information
BANK OF CEYLON | ANNUAL REPORT 2021
Name of Premises No. ofBuildings
Land Extent (Perches)
Building (Square feet)
Date of valuation
Valuer Basis of Valuation Revalued Amount of Land
Revalued Amountof Buildings
Total Value Accumulated Depreciation
Written Down Value
LKR ‘000 LKR ‘000 LKR ‘000 LKR ‘000 LKR ‘000
Southern ProvinceAmbalangoda Branch345, Galle Road, Ambalangoda 1 58.00 6,330 30.11.2020 U Rajapaksha Contractor's Method 116,000 39,550 155,550 989 154,561 Ambalantota Branch11, Wanduruppa Road, Ambalantota 1 38.00 5,410 30.11.2020 U Rajapaksha Contractor's Method 47,500 20,000 67,500 1,667 65,833 Ahangama Branch54, Galle Road, Ahangama 1 33.35 4,917.00 30.11.2020 U Rajapaksha Comparison Method 40,000 68,660 108,660 143 108,517 Batapola BranchAluthwatte, Batapola 1 46.80 3,024 27.01.2019 U Rajapaksha Contractor's Method 60,012 6,781 66,793 540 66,253 Beliatta Branch67, Walasmulla Road, Beliatta 1 53.02 6,200 30.11.2020 U Rajapaksha Contractor's Method 101,436 39,064 140,500 977 139,523 Deniyaya Land Viharahena Road, Deniyaya - 55.80 - 26.02.2019 U Rajapaksha Contractor's Method 57,224 - 57,224 - 57,224 GalleProvinceOffice20, Hospital Street, Fort, Galle 1 32.63 14,250 30.11.2020 S A R Amarasinghe Contractor's Method 261,000 25,650 286,650 1,282 285,368 Galle Branch2, Light House Street, Fort, Galle 1 31.50 16,200 30.11.2020 S A R Amarasinghe
Depreciated Replacement Cost Method 252,000 29,200 281,200 1,460 279,740
Galle City Land07, Sri Dewamitta Mawatha, Galle - 27.14 - 29.03.2019 U Rajapaksha Contractor's Method 126,566 - 126,566 - 126,566 Hakmana BranchBeliatta Road, Hakmana 1 36.70 3,400 30.11.2020 U Rajapaksha Contractor's Method 49,500 11,500 61,000 287 60,713 Imaduwa BranchAhangama Road, Imaduwa 1 83.50 3,300 30.11.2020 S A R Amarasinghe
Depreciated Replacement Cost Method 62,600 7,900 70,500 282 70,218
Karapitiya Land167A, Hirimbura Cross Road, Karapitiya - 35.00 - 30.11.2020 U Rajapaksha Comparison Method 77,000 - 77,000 - 77,000 Matara Super Grade Branch11, Kumaratunga Mawatha, Matara 1 104.40 52,969 30.11.2020 U Rajapaksha Contractor's Method 395,400 340,910 736,310 742 735,568 Matara Bazzar Branch58, New Tangalle Road, Matara 1 49.25 6,920 30.11.2020 U Rajapaksha Contractor's Method 153,750 43,729 197,479 1,093 196,386 Nagoda BranchMapalagama Road, Nagoda 1 40.00 3,100 30.11.2020 S A R Amarasinghe
Depreciated Replacement Cost Method 20,000 10,700 30,700 267 30,433
Ranna LandMainstreet, Ranna - 40.00 - 25.10.2018 U Rajapaksha Contractor's Method 28,199 - 28,199 - 28,199 Tangalle Branch91/1, 91/2, Tissa Road, Tangalle 1 21.05 5,370 30.11.2020 U Rajapaksha Contractor's Method 31,575 32,000 63,575 800 62,775 Weeraketiya BranchBelliatta Road, Weeraketiya 1 36.87 4,480 30.11.2020 U Rajapaksha Contractor's Method 48,000 26,700 74,700 667 74,033 Weligama Branch239, Main Street, Weligama 1 97.75 8,110 30.11.2020 S A R Amarasinghe
Depreciated Replacement Cost Method 97,750 22,265 120,015 731 119,284
Walasmulla 28, Beliatta Road, Walasmulla 1 38.00 8,045 30.11.2020 U Rajapaksha Contractor's Method 57,000 60,463 117,463 1,509 115,954
2,082,512 785,072 2,867,584 13,436 2,854,148
Uva ProvinceBadullaUvaProvinceOffice17, Hill Drive, Keppetipola Road, Badulla 2 118.75 9,537 30.11.2020 L H Lickson
Investment and Contractor's Method 59,316 17,347 76,663 1,927 74,736
Bandarawela Branch198 B, Badulla Road, Bandarawela 1 10.60 7,731 30.11.2020 L H Lickson Contractor's Method 82,824 23,776 106,600 1,399 105,201 Ettampitiya Branch23, Nuwara Eliya Road, Ettampitiya 1 20.35 3,729 30.11.2020 L H Lickson
Investment and Contractor's Method 11,123 10,628 21,751 266 21,485
Haputale Branch (Browns)20, Station Road, Haputale 1 158.70 7,361 30.11.2020 L H Lickson Contractor's Method 39,192 11,508 50,700 822 49,878

232
NOTES TO THE FINANCIAL STATEMENTS
BANK OF CEYLON | ANNUAL REPORT 2021
Name of Premises No. ofBuildings
Land Extent (Perches)
Building (Square feet)
Date of valuation
Valuer Basis of Valuation Revalued Amount of Land
Revalued Amountof Buildings
Total Value Accumulated Depreciation
Written Down Value
LKR ‘000 LKR ‘000 LKR ‘000 LKR ‘000 LKR ‘000
MonaragalaBranch,ManagerQuarters&staffQuarters401, Wellawaya Road, Moneragala 3 320.00 13,011 30.11.2020 L H Lickson Contractor's Method 84,800 42,538 127,338 1,288 126,050 Siyabalanduwa BranchPremadasa Hardware Building, Ampara Junction, Siyabalanduwa 1 28.00 5,877 01.11.2017 M C A Malik Investment Method 21,699 22,500 44,199 2,109 42,090
298,954 128,297 427,251 7,811 419,440
Western Province NorthBorella Branch71, Danister de Silva Mawatha, Borella 1 49.27 20,173 30.11.2020
W D P RupanandaK D Tissera
Investment and Contractor's Method 513,200 85,000 598,200 2,125 596,075
CityOffice41, Bristol Street, Colombo 1 1 39.50 31,443 30.11.2020 W D P Rupananda
Investment and Contractor's Method 610,000 77,000 687,000 2,200 684,800
Grand Pass Branch703, Sirimavo Bandaranaike Mawatha, Grandpass 1 20.12 6,210 30.11.2020 A G Gunaratna
Cost and Income Approach 181,080 24,045 205,125 829 204,296
Gampaha Branch170, Colombo Road, Gampaha 1 34.06 7,295 30.11.2020 S A R Amarasingha
Depreciated Replacement Cost Method 119,200 36,519 155,719 913 154,806
Ganemulla Branch (Land)156, Kirindiwita Road, Ganemulla - 43.61 - 26.01.2019 S A R Amarasingha Contractor's Method 72,645 - 72,645 - 72,645 Ja Ela Branch19, Negombo Road, Ja-ela 1 45.94 7,800 31.12.2020 A R M M Kaleel Contractor's Method 165,000 35,000 200,000 2,333 197,667 Kadawatha Branch469, Ragama Road, Kadawatha 1 30.72 6,138 31.12.2020 A R M M Kaleel Contractor's Method 120,000 20,000 140,000 500 139,500 Kiribathgoda Branch (Land)235, Kandy Road, Kiribathgoda - 43.70 - 21.06.2018 A G Gunarathne Contractor's Method 249,963 - 249,963 - 249,963 Negombo Branch118, Rajapakse Broadway, Negombo 1 93.60 13,503 30.11.2020 S A R Amarasingha
Depreciated Replacement Cost Method 327,600 33,417 361,017 946 360,071
Negombo City77, Main Street, Negombo 1 10.76 8,355 30.11.2020 S A R Amarasinghe
Depreciated Replacement Cost Method 48,400 53,500 101,900 1,529 100,371
Pettah Branch212/63, Gas Work Street, Colombo 11 1 28.29 25,222 30.11.2020 W D P Rupananda
investment and contractor's method 539,000 56,000 595,000 1,750 593,250
Dematagoda Land400, Danister De Silva Mawatha, Colombo 09 - 38.14 - 30.11.2020 W D P Rupananda Comparison Method 273,000 - 273,000 - 273,000
3,219,088 420,481 3,639,569 13,125 3,626,444
Western Province SouthAluthgama Branch14, Douglas Gunawardena Mawatha, Aluthgama 1 36.60 6,558 30.11.2020 B K Dayaratne Contractor's Method 80,520 24,262 104,782 606 104,176 Bambalapitiya Branch20, Galle Road, Colombo 4 1 - 7,776 30.11.2020 S A R Amarasingha
Depreciated Replacement Cost Method - 218,800 218,800 10,940 207,860
Beruwala Branch165A, Galle Road, Beruwala 1 21.50 5,850 30.11.2020 B K Dayaratne Contractor's Method 64,500 12,112 76,612 303 76,309 Bulathsinhala Branch40, Horana Road, Athura, Bulathsinhala 1 55.52 6,900 30.11.2020 B K Dayaratne Contractor's Method 80,790 13,900 94,690 356 94,334 Dehiwala Branch207, Galle Road, Dehiwela 1 22.00 12,454 30.11.2020 A G Gunaratna Cost Approach 154,000 57,800 211,800 1,651 210,149 Horana Branch87, Anguruwathota Road, Horana 1 70.02 10,280 30.11.2020 B K Dayaratne Contractor's Method 260,600 31,834 292,434 791 291,643 Idama Branch707, Galle Road, Moratuwa 1 61.12 10,464 30.11.2020 A G Gunaratna Cost Method 244,480 14,475 258,955 1,447 257,508 Kalutara Branch218, Galle Road, Kalutara South, Kalutara 1 45.86 10,645 30.11.2020 B K Dayaratne Contractor's Method 177,440 34,051 211,491 851 210,640 Kottawa Branch (Land)903, Avissawella Road, Kottawa - 35.22 - 01.12.2018 A G Gunaratna Contractor's Basis 219,772 - 219,772 - 219,772
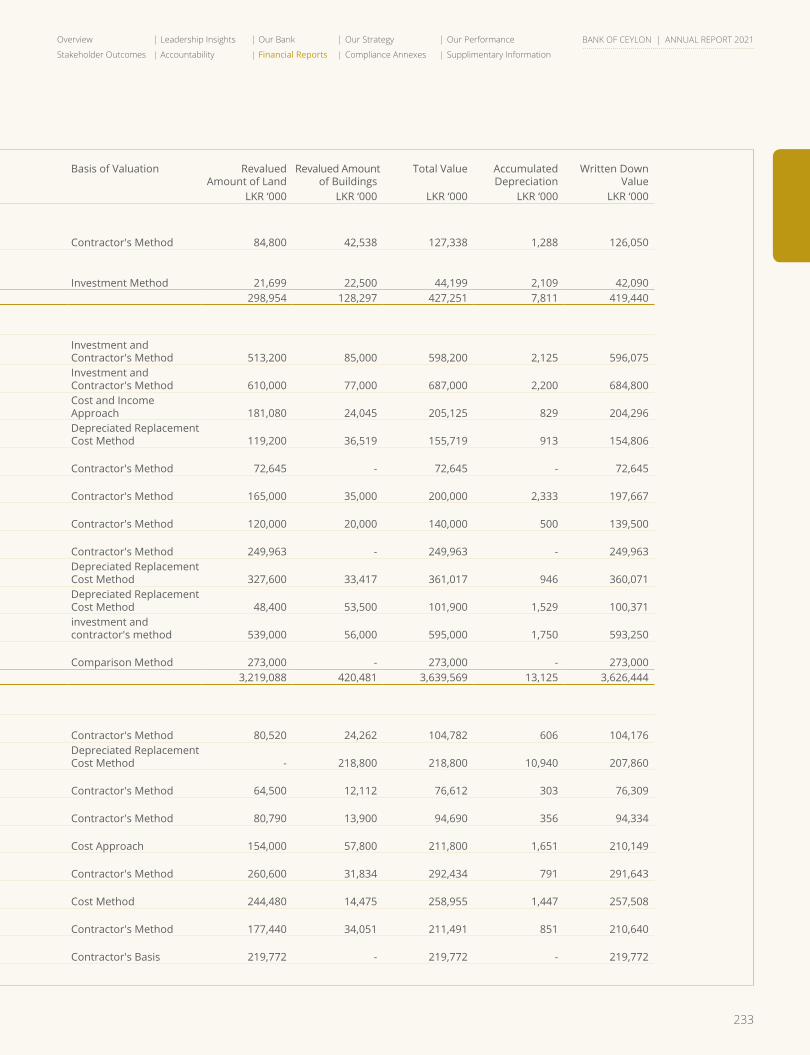
233
Overview Leadership Insights Our Bank Our Strategy Our Performance
Stakeholder Outcomes Accountability Financial Reports Compliance Annexes Supplimentary Information
BANK OF CEYLON | ANNUAL REPORT 2021
Name of Premises No. ofBuildings
Land Extent (Perches)
Building (Square feet)
Date of valuation
Valuer Basis of Valuation Revalued Amount of Land
Revalued Amountof Buildings
Total Value Accumulated Depreciation
Written Down Value
LKR ‘000 LKR ‘000 LKR ‘000 LKR ‘000 LKR ‘000
MonaragalaBranch,ManagerQuarters&staffQuarters401, Wellawaya Road, Moneragala 3 320.00 13,011 30.11.2020 L H Lickson Contractor's Method 84,800 42,538 127,338 1,288 126,050 Siyabalanduwa BranchPremadasa Hardware Building, Ampara Junction, Siyabalanduwa 1 28.00 5,877 01.11.2017 M C A Malik Investment Method 21,699 22,500 44,199 2,109 42,090
298,954 128,297 427,251 7,811 419,440
Western Province NorthBorella Branch71, Danister de Silva Mawatha, Borella 1 49.27 20,173 30.11.2020
W D P RupanandaK D Tissera
Investment and Contractor's Method 513,200 85,000 598,200 2,125 596,075
CityOffice41, Bristol Street, Colombo 1 1 39.50 31,443 30.11.2020 W D P Rupananda
Investment and Contractor's Method 610,000 77,000 687,000 2,200 684,800
Grand Pass Branch703, Sirimavo Bandaranaike Mawatha, Grandpass 1 20.12 6,210 30.11.2020 A G Gunaratna
Cost and Income Approach 181,080 24,045 205,125 829 204,296
Gampaha Branch170, Colombo Road, Gampaha 1 34.06 7,295 30.11.2020 S A R Amarasingha
Depreciated Replacement Cost Method 119,200 36,519 155,719 913 154,806
Ganemulla Branch (Land)156, Kirindiwita Road, Ganemulla - 43.61 - 26.01.2019 S A R Amarasingha Contractor's Method 72,645 - 72,645 - 72,645 Ja Ela Branch19, Negombo Road, Ja-ela 1 45.94 7,800 31.12.2020 A R M M Kaleel Contractor's Method 165,000 35,000 200,000 2,333 197,667 Kadawatha Branch469, Ragama Road, Kadawatha 1 30.72 6,138 31.12.2020 A R M M Kaleel Contractor's Method 120,000 20,000 140,000 500 139,500 Kiribathgoda Branch (Land)235, Kandy Road, Kiribathgoda - 43.70 - 21.06.2018 A G Gunarathne Contractor's Method 249,963 - 249,963 - 249,963 Negombo Branch118, Rajapakse Broadway, Negombo 1 93.60 13,503 30.11.2020 S A R Amarasingha
Depreciated Replacement Cost Method 327,600 33,417 361,017 946 360,071
Negombo City77, Main Street, Negombo 1 10.76 8,355 30.11.2020 S A R Amarasinghe
Depreciated Replacement Cost Method 48,400 53,500 101,900 1,529 100,371
Pettah Branch212/63, Gas Work Street, Colombo 11 1 28.29 25,222 30.11.2020 W D P Rupananda
investment and contractor's method 539,000 56,000 595,000 1,750 593,250
Dematagoda Land400, Danister De Silva Mawatha, Colombo 09 - 38.14 - 30.11.2020 W D P Rupananda Comparison Method 273,000 - 273,000 - 273,000
3,219,088 420,481 3,639,569 13,125 3,626,444
Western Province SouthAluthgama Branch14, Douglas Gunawardena Mawatha, Aluthgama 1 36.60 6,558 30.11.2020 B K Dayaratne Contractor's Method 80,520 24,262 104,782 606 104,176 Bambalapitiya Branch20, Galle Road, Colombo 4 1 - 7,776 30.11.2020 S A R Amarasingha
Depreciated Replacement Cost Method - 218,800 218,800 10,940 207,860
Beruwala Branch165A, Galle Road, Beruwala 1 21.50 5,850 30.11.2020 B K Dayaratne Contractor's Method 64,500 12,112 76,612 303 76,309 Bulathsinhala Branch40, Horana Road, Athura, Bulathsinhala 1 55.52 6,900 30.11.2020 B K Dayaratne Contractor's Method 80,790 13,900 94,690 356 94,334 Dehiwala Branch207, Galle Road, Dehiwela 1 22.00 12,454 30.11.2020 A G Gunaratna Cost Approach 154,000 57,800 211,800 1,651 210,149 Horana Branch87, Anguruwathota Road, Horana 1 70.02 10,280 30.11.2020 B K Dayaratne Contractor's Method 260,600 31,834 292,434 791 291,643 Idama Branch707, Galle Road, Moratuwa 1 61.12 10,464 30.11.2020 A G Gunaratna Cost Method 244,480 14,475 258,955 1,447 257,508 Kalutara Branch218, Galle Road, Kalutara South, Kalutara 1 45.86 10,645 30.11.2020 B K Dayaratne Contractor's Method 177,440 34,051 211,491 851 210,640 Kottawa Branch (Land)903, Avissawella Road, Kottawa - 35.22 - 01.12.2018 A G Gunaratna Contractor's Basis 219,772 - 219,772 - 219,772
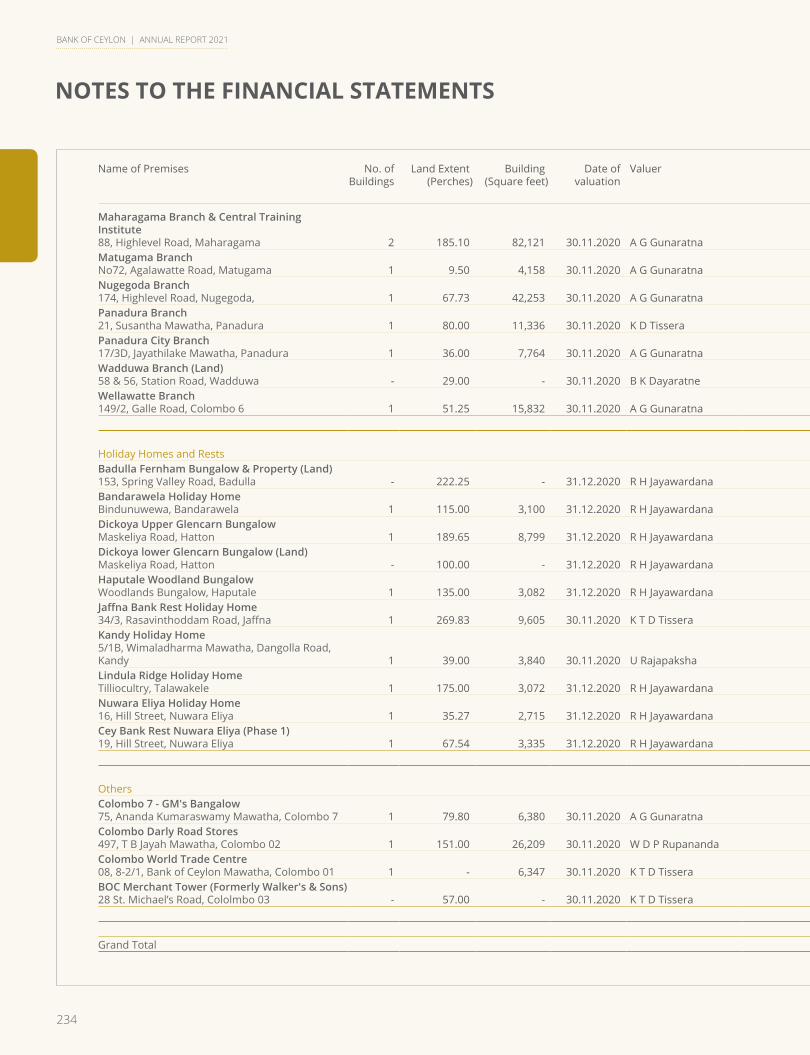
234
NOTES TO THE FINANCIAL STATEMENTS
BANK OF CEYLON | ANNUAL REPORT 2021
Name of Premises No. ofBuildings
Land Extent (Perches)
Building (Square feet)
Date of valuation
Valuer Basis of Valuation Revalued Amount of Land
Revalued Amountof Buildings
Total Value Accumulated Depreciation
Written Down Value
LKR ‘000 LKR ‘000 LKR ‘000 LKR ‘000 LKR ‘000
Maharagama Branch & Central Training Institute88, Highlevel Road, Maharagama 2 185.10 82,121 30.11.2020 A G Gunaratna
Cost and Income Approach 658,463 208,043 866,506 11,097 855,409
Matugama BranchNo72, Agalawatte Road, Matugama 1 9.50 4,158 30.11.2020 A G Gunaratna Cost Approach 47,500 4,260 51,760 608 51,152 Nugegoda Branch174, Highlevel Road, Nugegoda, 1 67.73 42,253 30.11.2020 A G Gunaratna Cost Approach 677,300 448,265 1,125,565 12,083 1,113,482 Panadura Branch21, Susantha Mawatha, Panadura 1 80.00 11,336 30.11.2020 K D Tissera Contractor's Method 360,000 26,870 386,870 1,258 385,612 Panadura City Branch17/3D, Jayathilake Mawatha, Panadura 1 36.00 7,764 30.11.2020 A G Gunaratna Cost Approach 63,000 69,643 132,643 1,741 130,902 Wadduwa Branch (Land)58 & 56, Station Road, Wadduwa - 29.00 - 30.11.2020 B K Dayaratne Contractor's Method 58,000 - 58,000 - 58,000 Wellawatte Branch149/2, Galle Road, Colombo 6 1 51.25 15,832 30.11.2020 A G Gunaratna Cost Approach 530,000 48,176 578,176 2,536 575,640
3,676,365 1,212,491 4,888,856 46,268 4,842,588
Holiday Homes and RestsBadulla Fernham Bungalow & Property (Land)153, Spring Valley Road, Badulla - 222.25 - 31.12.2020 R H Jayawardana Contractor's Method 22,225 - 22,225 - 22,225 Bandarawela Holiday HomeBindunuwewa, Bandarawela 1 115.00 3,100 31.12.2020 R H Jayawardana Contractor's Method 23,000 10,291 33,291 257 33,034 Dickoya Upper Glencarn BungalowMaskeliya Road, Hatton 1 189.65 8,799 31.12.2020 R H Jayawardana Contractor's Method 12,616 24,430 37,046 1,222 35,824 Dickoya lower Glencarn Bungalow (Land)Maskeliya Road, Hatton - 100.00 - 31.12.2020 R H Jayawardana Contractor's Method 15,000 - 15,000 - 15,000 Haputale Woodland Bungalow Woodlands Bungalow, Haputale 1 135.00 3,082 31.12.2020 R H Jayawardana Contractor's Method 21,000 7,917 28,917 566 28,351 JaffnaBankRestHolidayHome34/3, Rasavinthoddam Road, Jaffna 1 269.83 9,605 30.11.2020 K T D Tissera Market Value 121,424 99,780 221,204 208 220,996 Kandy Holiday Home 5/1B, Wimaladharma Mawatha, Dangolla Road, Kandy 1 39.00 3,840 30.11.2020 U Rajapaksha
Contractor's Principles and comparison Method 31,200 13,500 44,700 337 44,363
Lindula Ridge Holiday HomeTilliocultry, Talawakele 1 175.00 3,072 31.12.2020 R H Jayawardana Contractor's Method 8,750 9,090 17,840 364 17,476 Nuwara Eliya Holiday Home16, Hill Street, Nuwara Eliya 1 35.27 2,715 31.12.2020 R H Jayawardana Contractor's Method 85,750 7,126 92,876 238 92,638 Cey Bank Rest Nuwara Eliya (Phase 1)19, Hill Street, Nuwara Eliya 1 67.54 3,335 31.12.2020 R H Jayawardana Contractor's Method 168,850 12,121 180,971 303 180,668
509,815 184,255 694,070 3,495 690,575
OthersColombo 7 - GM's Bangalow75, Ananda Kumaraswamy Mawatha, Colombo 7 1 79.80 6,380 30.11.2020 A G Gunaratna Cost approach 1,436,400 13,600 1,450,000 800 1,449,200 Colombo Darly Road Stores 497, T B Jayah Mawatha, Colombo 02 1 151.00 26,209 30.11.2020 W D P Rupananda Contractor's Method 1,600,000 41,183 1,641,183 3,557 1,637,626 Colombo World Trade Centre08, 8-2/1, Bank of Ceylon Mawatha, Colombo 01 1 - 6,347 30.11.2020 K T D Tissera Rental Value Basis - 374,906 374,906 9,375 365,531 BOC Merchant Tower (Formerly Walker's & Sons)28 St. Michael’s Road, Cololmbo 03 - 57.00 - 30.11.2020 K T D Tissera Comparable Basis 600,000 - 600,000 - 600,000
3,636,400 429,689 4,066,089 13,732 4,052,357
Grand Total 19,911,607 4,608,143 24,519,750 139,966 24,379,784

235
Overview Leadership Insights Our Bank Our Strategy Our Performance
Stakeholder Outcomes Accountability Financial Reports Compliance Annexes Supplimentary Information
BANK OF CEYLON | ANNUAL REPORT 2021
Name of Premises No. ofBuildings
Land Extent (Perches)
Building (Square feet)
Date of valuation
Valuer Basis of Valuation Revalued Amount of Land
Revalued Amountof Buildings
Total Value Accumulated Depreciation
Written Down Value
LKR ‘000 LKR ‘000 LKR ‘000 LKR ‘000 LKR ‘000
Maharagama Branch & Central Training Institute88, Highlevel Road, Maharagama 2 185.10 82,121 30.11.2020 A G Gunaratna
Cost and Income Approach 658,463 208,043 866,506 11,097 855,409
Matugama BranchNo72, Agalawatte Road, Matugama 1 9.50 4,158 30.11.2020 A G Gunaratna Cost Approach 47,500 4,260 51,760 608 51,152 Nugegoda Branch174, Highlevel Road, Nugegoda, 1 67.73 42,253 30.11.2020 A G Gunaratna Cost Approach 677,300 448,265 1,125,565 12,083 1,113,482 Panadura Branch21, Susantha Mawatha, Panadura 1 80.00 11,336 30.11.2020 K D Tissera Contractor's Method 360,000 26,870 386,870 1,258 385,612 Panadura City Branch17/3D, Jayathilake Mawatha, Panadura 1 36.00 7,764 30.11.2020 A G Gunaratna Cost Approach 63,000 69,643 132,643 1,741 130,902 Wadduwa Branch (Land)58 & 56, Station Road, Wadduwa - 29.00 - 30.11.2020 B K Dayaratne Contractor's Method 58,000 - 58,000 - 58,000 Wellawatte Branch149/2, Galle Road, Colombo 6 1 51.25 15,832 30.11.2020 A G Gunaratna Cost Approach 530,000 48,176 578,176 2,536 575,640
3,676,365 1,212,491 4,888,856 46,268 4,842,588
Holiday Homes and RestsBadulla Fernham Bungalow & Property (Land)153, Spring Valley Road, Badulla - 222.25 - 31.12.2020 R H Jayawardana Contractor's Method 22,225 - 22,225 - 22,225 Bandarawela Holiday HomeBindunuwewa, Bandarawela 1 115.00 3,100 31.12.2020 R H Jayawardana Contractor's Method 23,000 10,291 33,291 257 33,034 Dickoya Upper Glencarn BungalowMaskeliya Road, Hatton 1 189.65 8,799 31.12.2020 R H Jayawardana Contractor's Method 12,616 24,430 37,046 1,222 35,824 Dickoya lower Glencarn Bungalow (Land)Maskeliya Road, Hatton - 100.00 - 31.12.2020 R H Jayawardana Contractor's Method 15,000 - 15,000 - 15,000 Haputale Woodland Bungalow Woodlands Bungalow, Haputale 1 135.00 3,082 31.12.2020 R H Jayawardana Contractor's Method 21,000 7,917 28,917 566 28,351 JaffnaBankRestHolidayHome34/3, Rasavinthoddam Road, Jaffna 1 269.83 9,605 30.11.2020 K T D Tissera Market Value 121,424 99,780 221,204 208 220,996 Kandy Holiday Home 5/1B, Wimaladharma Mawatha, Dangolla Road, Kandy 1 39.00 3,840 30.11.2020 U Rajapaksha
Contractor's Principles and comparison Method 31,200 13,500 44,700 337 44,363
Lindula Ridge Holiday HomeTilliocultry, Talawakele 1 175.00 3,072 31.12.2020 R H Jayawardana Contractor's Method 8,750 9,090 17,840 364 17,476 Nuwara Eliya Holiday Home16, Hill Street, Nuwara Eliya 1 35.27 2,715 31.12.2020 R H Jayawardana Contractor's Method 85,750 7,126 92,876 238 92,638 Cey Bank Rest Nuwara Eliya (Phase 1)19, Hill Street, Nuwara Eliya 1 67.54 3,335 31.12.2020 R H Jayawardana Contractor's Method 168,850 12,121 180,971 303 180,668
509,815 184,255 694,070 3,495 690,575
OthersColombo 7 - GM's Bangalow75, Ananda Kumaraswamy Mawatha, Colombo 7 1 79.80 6,380 30.11.2020 A G Gunaratna Cost approach 1,436,400 13,600 1,450,000 800 1,449,200 Colombo Darly Road Stores 497, T B Jayah Mawatha, Colombo 02 1 151.00 26,209 30.11.2020 W D P Rupananda Contractor's Method 1,600,000 41,183 1,641,183 3,557 1,637,626 Colombo World Trade Centre08, 8-2/1, Bank of Ceylon Mawatha, Colombo 01 1 - 6,347 30.11.2020 K T D Tissera Rental Value Basis - 374,906 374,906 9,375 365,531 BOC Merchant Tower (Formerly Walker's & Sons)28 St. Michael’s Road, Cololmbo 03 - 57.00 - 30.11.2020 K T D Tissera Comparable Basis 600,000 - 600,000 - 600,000
3,636,400 429,689 4,066,089 13,732 4,052,357
Grand Total 19,911,607 4,608,143 24,519,750 139,966 24,379,784
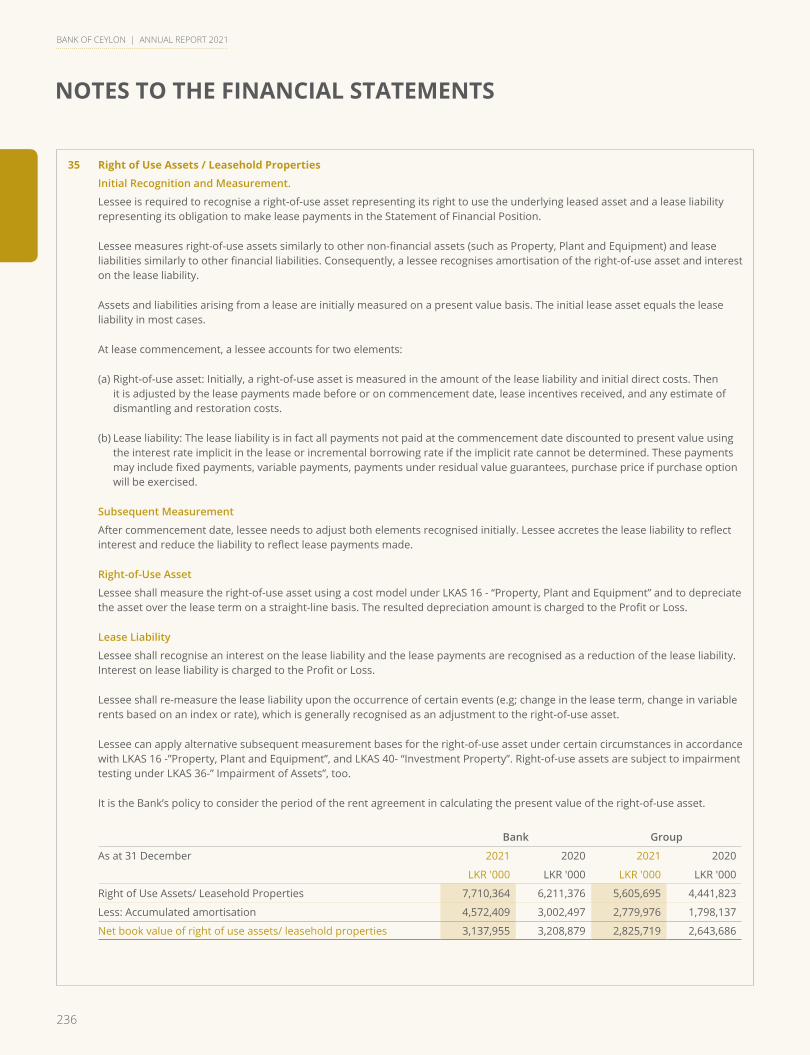
236
NOTES TO THE FINANCIAL STATEMENTS
BANK OF CEYLON | ANNUAL REPORT 2021
35 Right of Use Assets / Leasehold Properties
Initial Recognition and Measurement.
Lessee is required to recognise a right-of-use asset representing its right to use the underlying leased asset and a lease liability representing its obligation to make lease payments in the Statement of Financial Position.
Lessee measures right-of-use assets similarly to other non-financial assets (such as Property, Plant and Equipment) and lease liabilities similarly to other financial liabilities. Consequently, a lessee recognises amortisation of the right-of-use asset and interest on the lease liability.
Assets and liabilities arising from a lease are initially measured on a present value basis. The initial lease asset equals the lease liability in most cases.
At lease commencement, a lessee accounts for two elements:
(a) Right-of-use asset: Initially, a right-of-use asset is measured in the amount of the lease liability and initial direct costs. Then it is adjusted by the lease payments made before or on commencement date, lease incentives received, and any estimate of dismantling and restoration costs.
(b) Lease liability: The lease liability is in fact all payments not paid at the commencement date discounted to present value using the interest rate implicit in the lease or incremental borrowing rate if the implicit rate cannot be determined. These payments may include fixed payments, variable payments, payments under residual value guarantees, purchase price if purchase option will be exercised.
Subsequent Measurement
After commencement date, lessee needs to adjust both elements recognised initially. Lessee accretes the lease liability to reflect interest and reduce the liability to reflect lease payments made.
Right-of-Use Asset
Lessee shall measure the right-of-use asset using a cost model under LKAS 16 - “Property, Plant and Equipment” and to depreciate the asset over the lease term on a straight-line basis. The resulted depreciation amount is charged to the Profit or Loss.
Lease Liability
Lessee shall recognise an interest on the lease liability and the lease payments are recognised as a reduction of the lease liability. Interest on lease liability is charged to the Profit or Loss.
Lessee shall re-measure the lease liability upon the occurrence of certain events (e.g; change in the lease term, change in variable rents based on an index or rate), which is generally recognised as an adjustment to the right-of-use asset.
Lessee can apply alternative subsequent measurement bases for the right-of-use asset under certain circumstances in accordance with LKAS 16 -”Property, Plant and Equipment”, and LKAS 40- “Investment Property”. Right-of-use assets are subject to impairment testing under LKAS 36-” Impairment of Assets”, too.
It is the Bank’s policy to consider the period of the rent agreement in calculating the present value of the right-of-use asset.
Bank Group
As at 31 December 2021 2020 2021 2020
LKR '000 LKR '000 LKR '000 LKR '000
Right of Use Assets/ Leasehold Properties 7,710,364 6,211,376 5,605,695 4,441,823
Less: Accumulated amortisation 4,572,409 3,002,497 2,779,976 1,798,137
Net book value of right of use assets/ leasehold properties 3,137,955 3,208,879 2,825,719 2,643,686
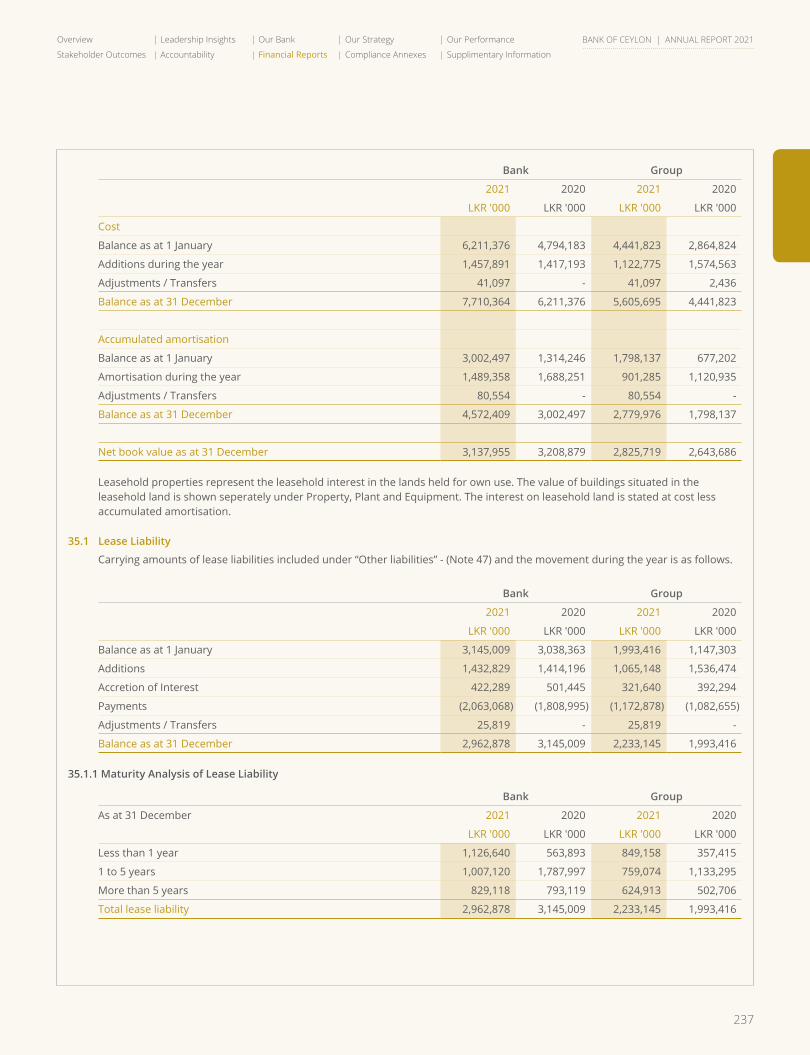
237
Overview Leadership Insights Our Bank Our Strategy Our Performance
Stakeholder Outcomes Accountability Financial Reports Compliance Annexes Supplimentary Information
BANK OF CEYLON | ANNUAL REPORT 2021
Bank Group
2021 2020 2021 2020
LKR '000 LKR '000 LKR '000 LKR '000
Cost
Balance as at 1 January 6,211,376 4,794,183 4,441,823 2,864,824
Additions during the year 1,457,891 1,417,193 1,122,775 1,574,563
Adjustments / Transfers 41,097 - 41,097 2,436
Balance as at 31 December 7,710,364 6,211,376 5,605,695 4,441,823
Accumulated amortisation
Balance as at 1 January 3,002,497 1,314,246 1,798,137 677,202
Amortisation during the year 1,489,358 1,688,251 901,285 1,120,935
Adjustments / Transfers 80,554 - 80,554 -
Balance as at 31 December 4,572,409 3,002,497 2,779,976 1,798,137
Net book value as at 31 December 3,137,955 3,208,879 2,825,719 2,643,686
Leasehold properties represent the leasehold interest in the lands held for own use. The value of buildings situated in the leasehold land is shown seperately under Property, Plant and Equipment. The interest on leasehold land is stated at cost less accumulated amortisation.
35.1 Lease Liability
Carrying amounts of lease liabilities included under “Other liabilities” - (Note 47) and the movement during the year is as follows.
Bank Group
2021 2020 2021 2020
LKR '000 LKR '000 LKR '000 LKR '000
Balance as at 1 January 3,145,009 3,038,363 1,993,416 1,147,303
Additions 1,432,829 1,414,196 1,065,148 1,536,474
Accretion of Interest 422,289 501,445 321,640 392,294
Payments (2,063,068) (1,808,995) (1,172,878) (1,082,655)
Adjustments / Transfers 25,819 - 25,819 -
Balance as at 31 December 2,962,878 3,145,009 2,233,145 1,993,416
35.1.1 Maturity Analysis of Lease Liability
Bank Group
As at 31 December 2021 2020 2021 2020
LKR '000 LKR '000 LKR '000 LKR '000
Less than 1 year 1,126,640 563,893 849,158 357,415
1 to 5 years 1,007,120 1,787,997 759,074 1,133,295
More than 5 years 829,118 793,119 624,913 502,706
Total lease liability 2,962,878 3,145,009 2,233,145 1,993,416
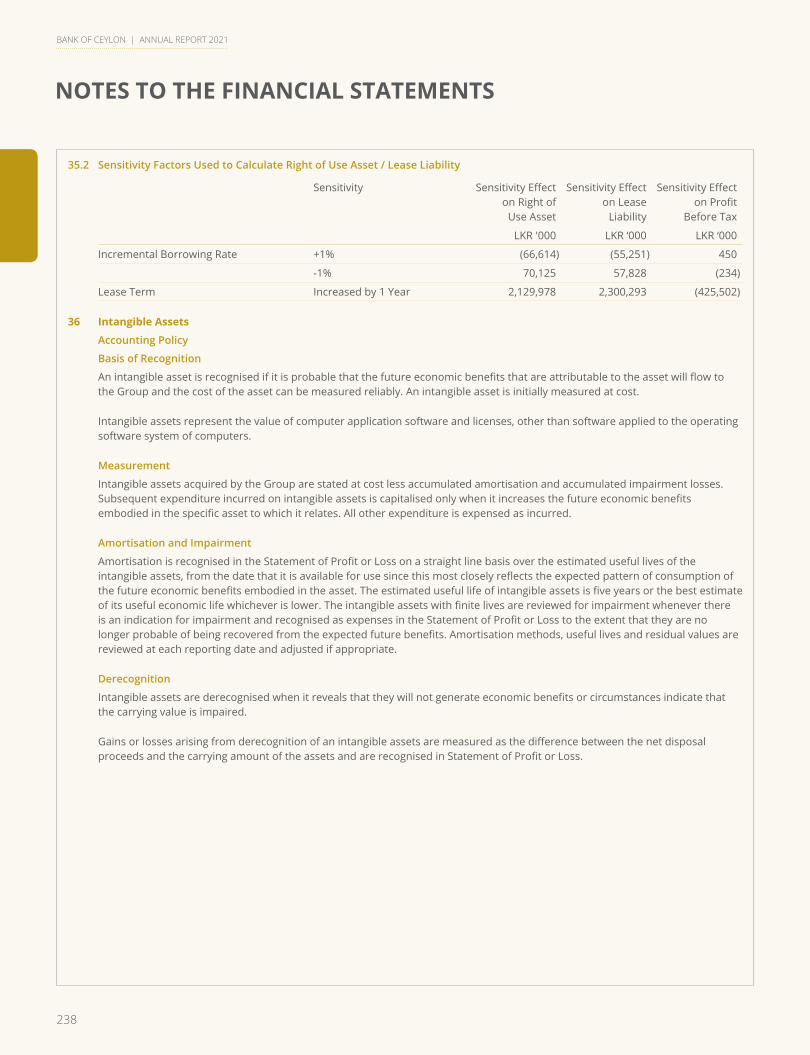
238
NOTES TO THE FINANCIAL STATEMENTS
BANK OF CEYLON | ANNUAL REPORT 2021
35.2 Sensitivity Factors Used to Calculate Right of Use Asset / Lease Liability
Sensitivity Sensitivity Effect on Right of
Use Asset
Sensitivity Effect on Lease
Liability
Sensitivity Effect on Profit
Before Tax
LKR '000 LKR ‘000 LKR ‘000
Incremental Borrowing Rate +1% (66,614) (55,251) 450
-1% 70,125 57,828 (234)
Lease Term Increased by 1 Year 2,129,978 2,300,293 (425,502)
36 Intangible Assets
Accounting Policy
Basis of Recognition
An intangible asset is recognised if it is probable that the future economic benefits that are attributable to the asset will flow to the Group and the cost of the asset can be measured reliably. An intangible asset is initially measured at cost.
Intangible assets represent the value of computer application software and licenses, other than software applied to the operating software system of computers.
Measurement
Intangible assets acquired by the Group are stated at cost less accumulated amortisation and accumulated impairment losses. Subsequent expenditure incurred on intangible assets is capitalised only when it increases the future economic benefits embodied in the specific asset to which it relates. All other expenditure is expensed as incurred.
Amortisation and Impairment
Amortisation is recognised in the Statement of Profit or Loss on a straight line basis over the estimated useful lives of the intangible assets, from the date that it is available for use since this most closely reflects the expected pattern of consumption of the future economic benefits embodied in the asset. The estimated useful life of intangible assets is five years or the best estimate of its useful economic life whichever is lower. The intangible assets with finite lives are reviewed for impairment whenever there is an indication for impairment and recognised as expenses in the Statement of Profit or Loss to the extent that they are no longer probable of being recovered from the expected future benefits. Amortisation methods, useful lives and residual values are reviewed at each reporting date and adjusted if appropriate.
Derecognition
Intangible assets are derecognised when it reveals that they will not generate economic benefits or circumstances indicate that the carrying value is impaired.
Gains or losses arising from derecognition of an intangible assets are measured as the difference between the net disposal proceeds and the carrying amount of the assets and are recognised in Statement of Profit or Loss.
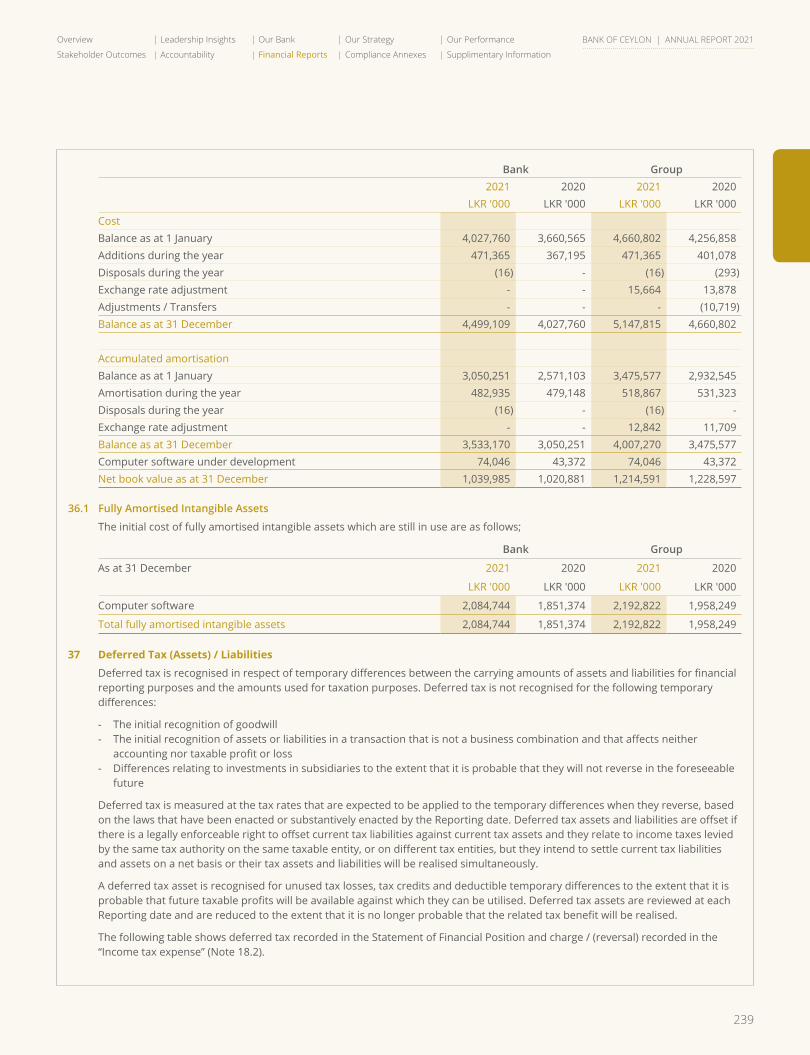
239
Overview Leadership Insights Our Bank Our Strategy Our Performance
Stakeholder Outcomes Accountability Financial Reports Compliance Annexes Supplimentary Information
BANK OF CEYLON | ANNUAL REPORT 2021
Bank Group2021 2020 2021 2020
LKR '000 LKR '000 LKR '000 LKR '000CostBalance as at 1 January 4,027,760 3,660,565 4,660,802 4,256,858 Additions during the year 471,365 367,195 471,365 401,078 Disposals during the year (16) - (16) (293)Exchange rate adjustment - - 15,664 13,878 Adjustments / Transfers - - - (10,719)Balance as at 31 December 4,499,109 4,027,760 5,147,815 4,660,802
Accumulated amortisationBalance as at 1 January 3,050,251 2,571,103 3,475,577 2,932,545 Amortisation during the year 482,935 479,148 518,867 531,323 Disposals during the year (16) - (16) - Exchange rate adjustment - - 12,842 11,709 Balance as at 31 December 3,533,170 3,050,251 4,007,270 3,475,577 Computer software under development 74,046 43,372 74,046 43,372 Net book value as at 31 December 1,039,985 1,020,881 1,214,591 1,228,597
36.1 Fully Amortised Intangible Assets
The initial cost of fully amortised intangible assets which are still in use are as follows;
Bank Group
As at 31 December 2021 2020 2021 2020
LKR '000 LKR '000 LKR '000 LKR '000
Computer software 2,084,744 1,851,374 2,192,822 1,958,249
Total fully amortised intangible assets 2,084,744 1,851,374 2,192,822 1,958,249
37 Deferred Tax (Assets) / Liabilities
Deferred tax is recognised in respect of temporary differences between the carrying amounts of assets and liabilities for financial reporting purposes and the amounts used for taxation purposes. Deferred tax is not recognised for the following temporary differences:
- The initial recognition of goodwill - The initial recognition of assets or liabilities in a transaction that is not a business combination and that affects neither
accounting nor taxable profit or loss - Differences relating to investments in subsidiaries to the extent that it is probable that they will not reverse in the foreseeable
future
Deferred tax is measured at the tax rates that are expected to be applied to the temporary differences when they reverse, based on the laws that have been enacted or substantively enacted by the Reporting date. Deferred tax assets and liabilities are offset if there is a legally enforceable right to offset current tax liabilities against current tax assets and they relate to income taxes levied by the same tax authority on the same taxable entity, or on different tax entities, but they intend to settle current tax liabilities and assets on a net basis or their tax assets and liabilities will be realised simultaneously.
A deferred tax asset is recognised for unused tax losses, tax credits and deductible temporary differences to the extent that it is probable that future taxable profits will be available against which they can be utilised. Deferred tax assets are reviewed at each Reporting date and are reduced to the extent that it is no longer probable that the related tax benefit will be realised.
The following table shows deferred tax recorded in the Statement of Financial Position and charge / (reversal) recorded in the “Income tax expense” (Note 18.2).
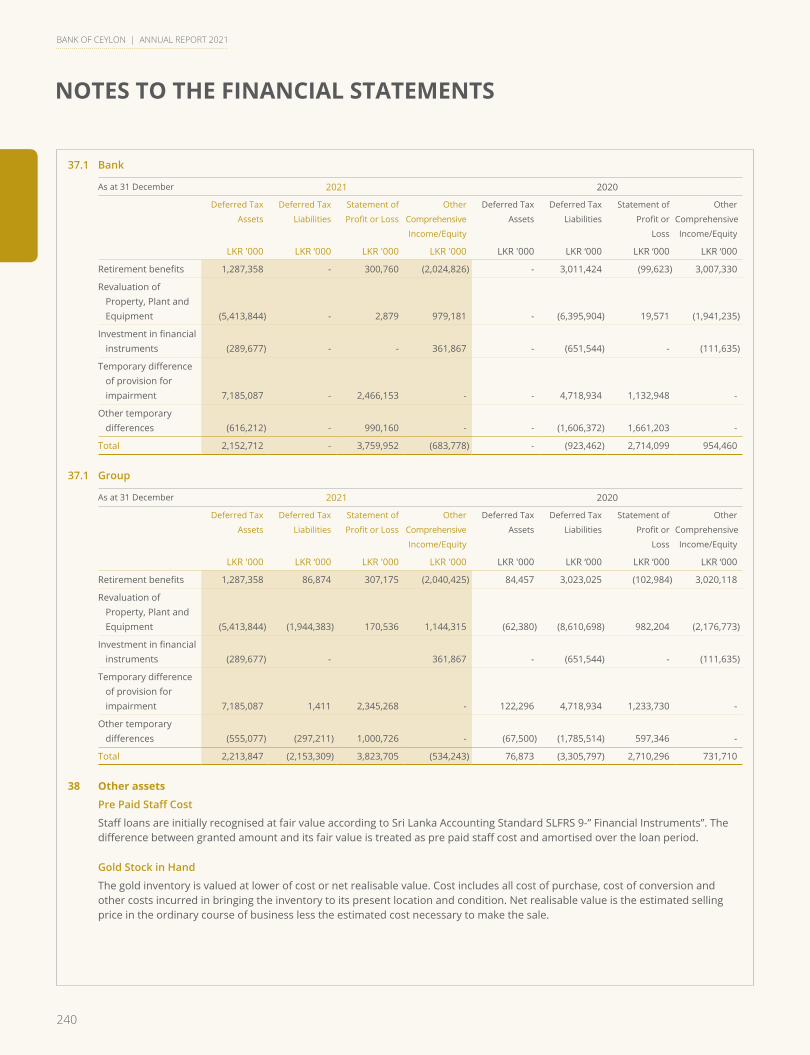
240
NOTES TO THE FINANCIAL STATEMENTS
BANK OF CEYLON | ANNUAL REPORT 2021
37.1 Bank
As at 31 December 2021 2020
Deferred Tax
Assets
Deferred Tax
Liabilities
Statement of
Profit or Loss
Other
Comprehensive
Income/Equity
Deferred Tax
Assets
Deferred Tax
Liabilities
Statement of
Profit or
Loss
Other
Comprehensive
Income/Equity
LKR '000 LKR ‘000 LKR '000 LKR '000 LKR '000 LKR ‘000 LKR ‘000 LKR ‘000
Retirement benefits 1,287,358 - 300,760 (2,024,826) - 3,011,424 (99,623) 3,007,330
Revaluation of Property, Plant and Equipment (5,413,844) - 2,879 979,181 - (6,395,904) 19,571 (1,941,235)
Investment in financial instruments (289,677) - - 361,867 - (651,544) - (111,635)
Temporary difference of provision for impairment 7,185,087 - 2,466,153 - - 4,718,934 1,132,948 -
Other temporary differences (616,212) - 990,160 - - (1,606,372) 1,661,203 -
Total 2,152,712 - 3,759,952 (683,778) - (923,462) 2,714,099 954,460
37.1 Group
As at 31 December 2021 2020
Deferred Tax
Assets
Deferred Tax
Liabilities
Statement of
Profit or Loss
Other
Comprehensive
Income/Equity
Deferred Tax
Assets
Deferred Tax
Liabilities
Statement of
Profit or
Loss
Other
Comprehensive
Income/Equity
LKR '000 LKR ‘000 LKR '000 LKR '000 LKR '000 LKR ‘000 LKR ‘000 LKR ‘000
Retirement benefits 1,287,358 86,874 307,175 (2,040,425) 84,457 3,023,025 (102,984) 3,020,118
Revaluation of Property, Plant and Equipment (5,413,844) (1,944,383) 170,536 1,144,315 (62,380) (8,610,698) 982,204 (2,176,773)
Investment in financial instruments (289,677) - 361,867 - (651,544) - (111,635)
Temporary difference of provision for impairment 7,185,087 1,411 2,345,268 - 122,296 4,718,934 1,233,730 -
Other temporary differences (555,077) (297,211) 1,000,726 - (67,500) (1,785,514) 597,346 -
Total 2,213,847 (2,153,309) 3,823,705 (534,243) 76,873 (3,305,797) 2,710,296 731,710
38 Other assets
PrePaidStaffCost
Staff loans are initially recognised at fair value according to Sri Lanka Accounting Standard SLFRS 9-” Financial Instruments”. The difference between granted amount and its fair value is treated as pre paid staff cost and amortised over the loan period.
Gold Stock in Hand
The gold inventory is valued at lower of cost or net realisable value. Cost includes all cost of purchase, cost of conversion and other costs incurred in bringing the inventory to its present location and condition. Net realisable value is the estimated selling price in the ordinary course of business less the estimated cost necessary to make the sale.
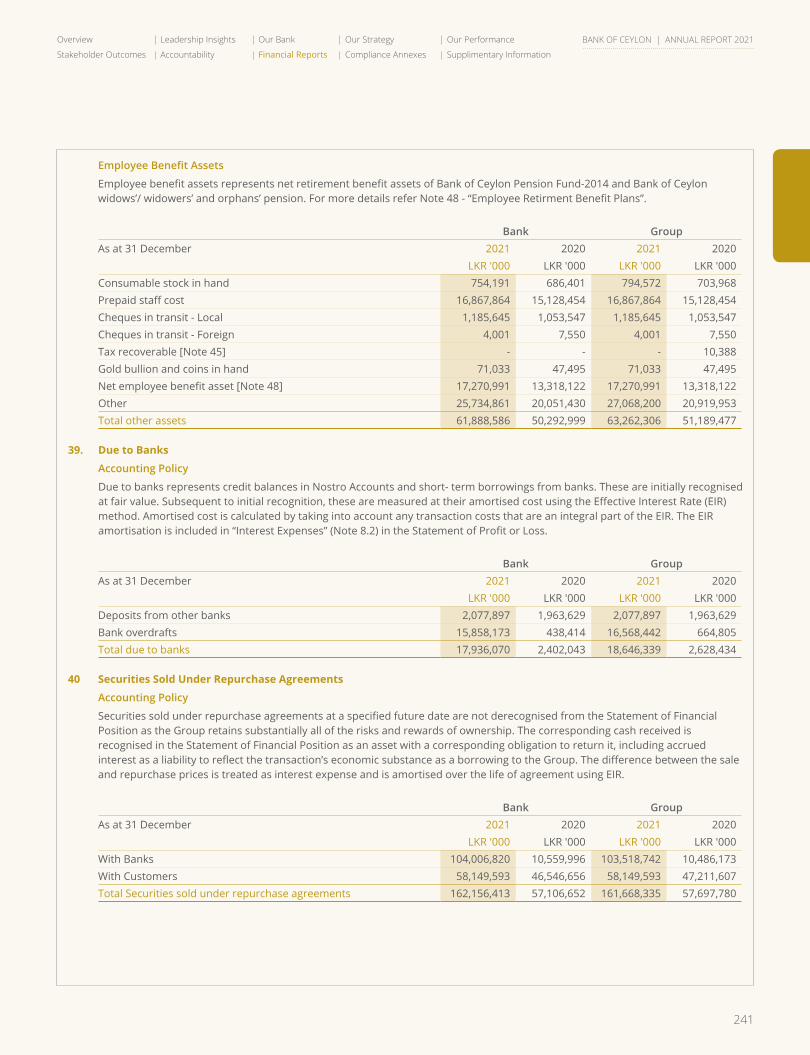
241
Overview Leadership Insights Our Bank Our Strategy Our Performance
Stakeholder Outcomes Accountability Financial Reports Compliance Annexes Supplimentary Information
BANK OF CEYLON | ANNUAL REPORT 2021
EmployeeBenefitAssets
Employee benefit assets represents net retirement benefit assets of Bank of Ceylon Pension Fund-2014 and Bank of Ceylon widows’/ widowers’ and orphans’ pension. For more details refer Note 48 - “Employee Retirment Benefit Plans”.
Bank GroupAs at 31 December 2021 2020 2021 2020
LKR '000 LKR '000 LKR '000 LKR '000Consumable stock in hand 754,191 686,401 794,572 703,968 Prepaid staff cost 16,867,864 15,128,454 16,867,864 15,128,454 Cheques in transit - Local 1,185,645 1,053,547 1,185,645 1,053,547 Cheques in transit - Foreign 4,001 7,550 4,001 7,550 Tax recoverable [Note 45] - - - 10,388 Gold bullion and coins in hand 71,033 47,495 71,033 47,495 Net employee benefit asset [Note 48] 17,270,991 13,318,122 17,270,991 13,318,122 Other 25,734,861 20,051,430 27,068,200 20,919,953 Total other assets 61,888,586 50,292,999 63,262,306 51,189,477
39. Due to Banks
Accounting Policy
Due to banks represents credit balances in Nostro Accounts and short- term borrowings from banks. These are initially recognised at fair value. Subsequent to initial recognition, these are measured at their amortised cost using the Effective Interest Rate (EIR) method. Amortised cost is calculated by taking into account any transaction costs that are an integral part of the EIR. The EIR amortisation is included in “Interest Expenses” (Note 8.2) in the Statement of Profit or Loss.
Bank GroupAs at 31 December 2021 2020 2021 2020
LKR '000 LKR '000 LKR '000 LKR '000Deposits from other banks 2,077,897 1,963,629 2,077,897 1,963,629 Bank overdrafts 15,858,173 438,414 16,568,442 664,805 Total due to banks 17,936,070 2,402,043 18,646,339 2,628,434
40 Securities Sold Under Repurchase Agreements
Accounting Policy
Securities sold under repurchase agreements at a specified future date are not derecognised from the Statement of Financial Position as the Group retains substantially all of the risks and rewards of ownership. The corresponding cash received is recognised in the Statement of Financial Position as an asset with a corresponding obligation to return it, including accrued interest as a liability to reflect the transaction’s economic substance as a borrowing to the Group. The difference between the sale and repurchase prices is treated as interest expense and is amortised over the life of agreement using EIR.
Bank GroupAs at 31 December 2021 2020 2021 2020
LKR '000 LKR '000 LKR '000 LKR '000With Banks 104,006,820 10,559,996 103,518,742 10,486,173 With Customers 58,149,593 46,546,656 58,149,593 47,211,607 Total Securities sold under repurchase agreements 162,156,413 57,106,652 161,668,335 57,697,780
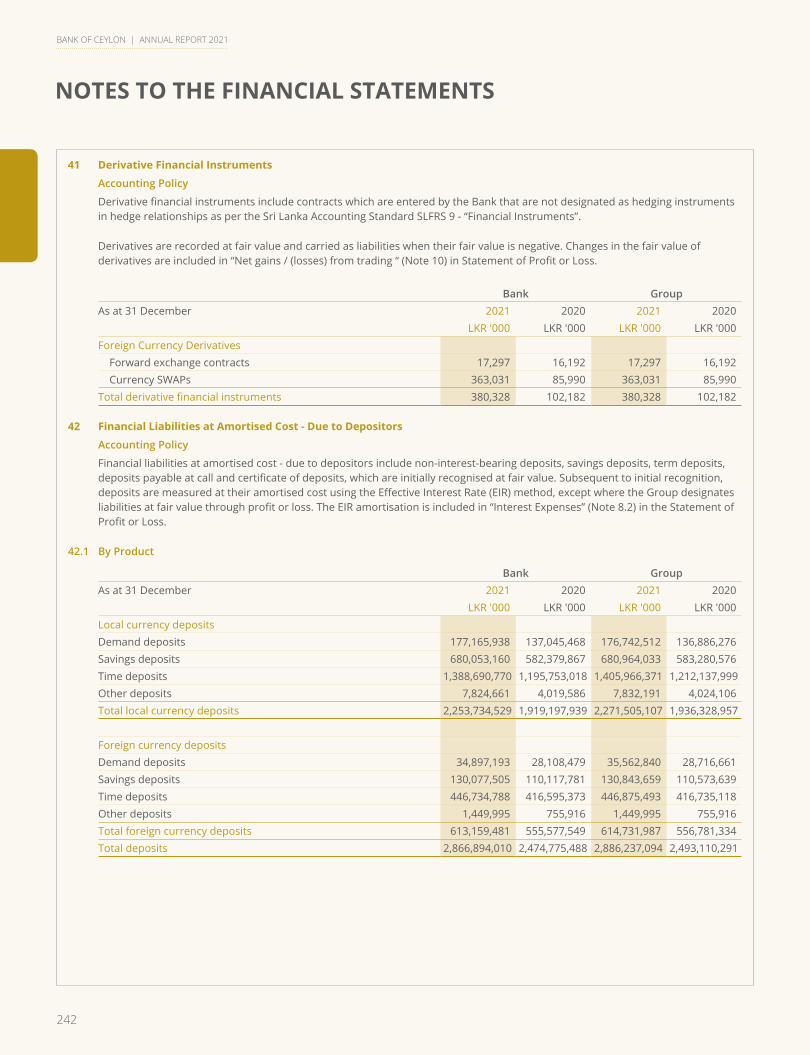
242
NOTES TO THE FINANCIAL STATEMENTS
BANK OF CEYLON | ANNUAL REPORT 2021
41 Derivative Financial Instruments
Accounting Policy
Derivative financial instruments include contracts which are entered by the Bank that are not designated as hedging instruments in hedge relationships as per the Sri Lanka Accounting Standard SLFRS 9 - “Financial Instruments”.
Derivatives are recorded at fair value and carried as liabilities when their fair value is negative. Changes in the fair value of derivatives are included in “Net gains / (losses) from trading “ (Note 10) in Statement of Profit or Loss.
Bank GroupAs at 31 December 2021 2020 2021 2020
LKR '000 LKR '000 LKR '000 LKR '000Foreign Currency Derivatives Forward exchange contracts 17,297 16,192 17,297 16,192 Currency SWAPs 363,031 85,990 363,031 85,990 Total derivative financial instruments 380,328 102,182 380,328 102,182
42 Financial Liabilities at Amortised Cost - Due to Depositors
Accounting Policy
Financial liabilities at amortised cost - due to depositors include non-interest-bearing deposits, savings deposits, term deposits, deposits payable at call and certificate of deposits, which are initially recognised at fair value. Subsequent to initial recognition, deposits are measured at their amortised cost using the Effective Interest Rate (EIR) method, except where the Group designates liabilities at fair value through profit or loss. The EIR amortisation is included in “Interest Expenses” (Note 8.2) in the Statement of Profit or Loss.
42.1 By Product
Bank GroupAs at 31 December 2021 2020 2021 2020
LKR '000 LKR '000 LKR '000 LKR '000Local currency deposits Demand deposits 177,165,938 137,045,468 176,742,512 136,886,276 Savings deposits 680,053,160 582,379,867 680,964,033 583,280,576 Time deposits 1,388,690,770 1,195,753,018 1,405,966,371 1,212,137,999 Other deposits 7,824,661 4,019,586 7,832,191 4,024,106 Total local currency deposits 2,253,734,529 1,919,197,939 2,271,505,107 1,936,328,957
Foreign currency deposits Demand deposits 34,897,193 28,108,479 35,562,840 28,716,661 Savings deposits 130,077,505 110,117,781 130,843,659 110,573,639 Time deposits 446,734,788 416,595,373 446,875,493 416,735,118 Other deposits 1,449,995 755,916 1,449,995 755,916 Total foreign currency deposits 613,159,481 555,577,549 614,731,987 556,781,334 Total deposits 2,866,894,010 2,474,775,488 2,886,237,094 2,493,110,291
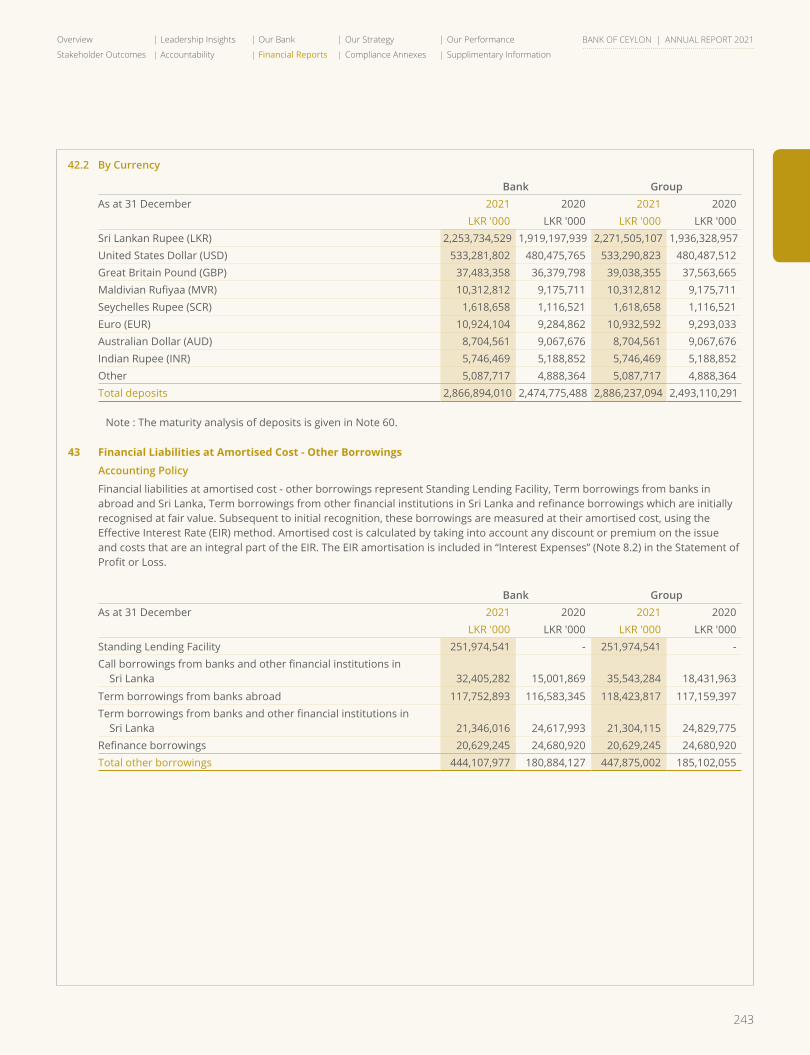
243
Overview Leadership Insights Our Bank Our Strategy Our Performance
Stakeholder Outcomes Accountability Financial Reports Compliance Annexes Supplimentary Information
BANK OF CEYLON | ANNUAL REPORT 2021
42.2 By Currency
Bank GroupAs at 31 December 2021 2020 2021 2020
LKR '000 LKR '000 LKR '000 LKR '000Sri Lankan Rupee (LKR) 2,253,734,529 1,919,197,939 2,271,505,107 1,936,328,957 United States Dollar (USD) 533,281,802 480,475,765 533,290,823 480,487,512 Great Britain Pound (GBP) 37,483,358 36,379,798 39,038,355 37,563,665 Maldivian Rufiyaa (MVR) 10,312,812 9,175,711 10,312,812 9,175,711 Seychelles Rupee (SCR) 1,618,658 1,116,521 1,618,658 1,116,521 Euro (EUR) 10,924,104 9,284,862 10,932,592 9,293,033 Australian Dollar (AUD) 8,704,561 9,067,676 8,704,561 9,067,676 Indian Rupee (INR) 5,746,469 5,188,852 5,746,469 5,188,852 Other 5,087,717 4,888,364 5,087,717 4,888,364 Total deposits 2,866,894,010 2,474,775,488 2,886,237,094 2,493,110,291
Note : The maturity analysis of deposits is given in Note 60.
43 Financial Liabilities at Amortised Cost - Other Borrowings
Accounting Policy
Financial liabilities at amortised cost - other borrowings represent Standing Lending Facility, Term borrowings from banks in abroad and Sri Lanka, Term borrowings from other financial institutions in Sri Lanka and refinance borrowings which are initially recognised at fair value. Subsequent to initial recognition, these borrowings are measured at their amortised cost, using the Effective Interest Rate (EIR) method. Amortised cost is calculated by taking into account any discount or premium on the issue and costs that are an integral part of the EIR. The EIR amortisation is included in “Interest Expenses” (Note 8.2) in the Statement of Profit or Loss.
Bank GroupAs at 31 December 2021 2020 2021 2020
LKR '000 LKR '000 LKR '000 LKR '000Standing Lending Facility 251,974,541 - 251,974,541 -Call borrowings from banks and other financial institutions in
Sri Lanka 32,405,282 15,001,869 35,543,284 18,431,963
Term borrowings from banks abroad 117,752,893 116,583,345 118,423,817 117,159,397 Term borrowings from banks and other financial institutions in
Sri Lanka 21,346,016 24,617,993 21,304,115 24,829,775 Refinance borrowings 20,629,245 24,680,920 20,629,245 24,680,920 Total other borrowings 444,107,977 180,884,127 447,875,002 185,102,055
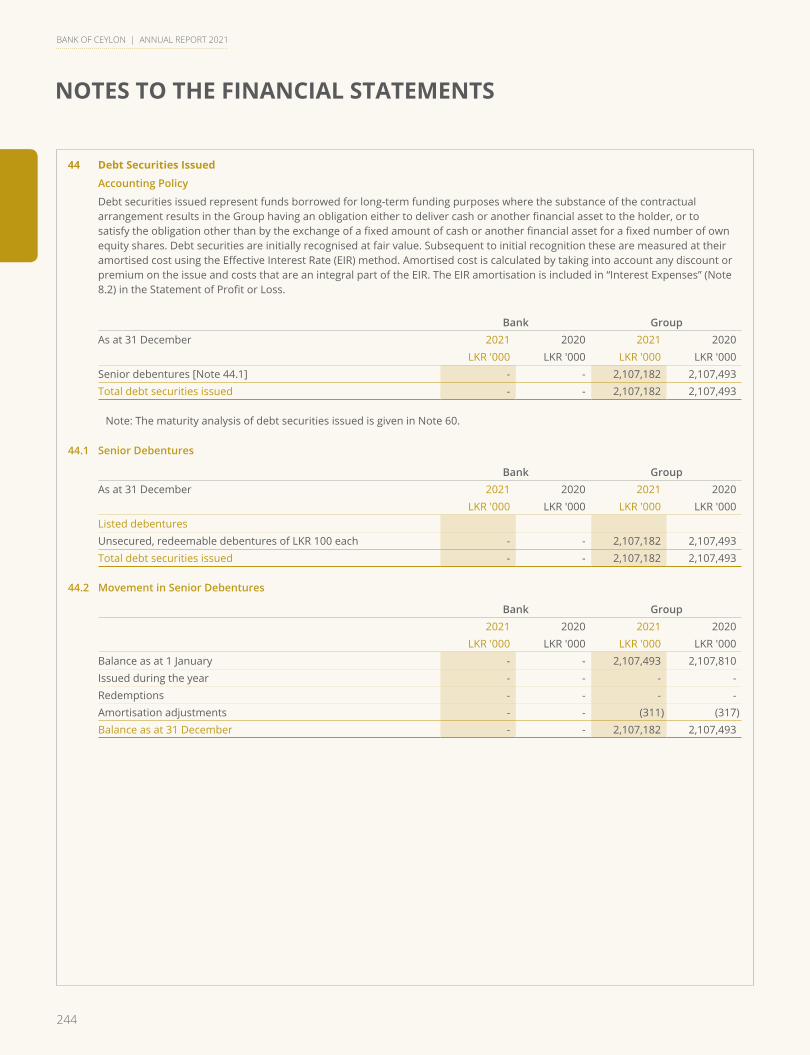
244
NOTES TO THE FINANCIAL STATEMENTS
BANK OF CEYLON | ANNUAL REPORT 2021
44 Debt Securities Issued
Accounting Policy
Debt securities issued represent funds borrowed for long-term funding purposes where the substance of the contractual arrangement results in the Group having an obligation either to deliver cash or another financial asset to the holder, or to satisfy the obligation other than by the exchange of a fixed amount of cash or another financial asset for a fixed number of own equity shares. Debt securities are initially recognised at fair value. Subsequent to initial recognition these are measured at their amortised cost using the Effective Interest Rate (EIR) method. Amortised cost is calculated by taking into account any discount or premium on the issue and costs that are an integral part of the EIR. The EIR amortisation is included in “Interest Expenses” (Note 8.2) in the Statement of Profit or Loss.
Bank GroupAs at 31 December 2021 2020 2021 2020
LKR '000 LKR '000 LKR '000 LKR '000Senior debentures [Note 44.1] - - 2,107,182 2,107,493 Total debt securities issued - - 2,107,182 2,107,493
Note: The maturity analysis of debt securities issued is given in Note 60.
44.1 Senior Debentures
Bank GroupAs at 31 December 2021 2020 2021 2020
LKR '000 LKR '000 LKR '000 LKR '000Listed debenturesUnsecured, redeemable debentures of LKR 100 each - - 2,107,182 2,107,493 Total debt securities issued - - 2,107,182 2,107,493
44.2 Movement in Senior Debentures
Bank Group2021 2020 2021 2020
LKR '000 LKR '000 LKR '000 LKR '000Balance as at 1 January - - 2,107,493 2,107,810 Issued during the year - - - - Redemptions - - - - Amortisation adjustments - - (311) (317)Balance as at 31 December - - 2,107,182 2,107,493
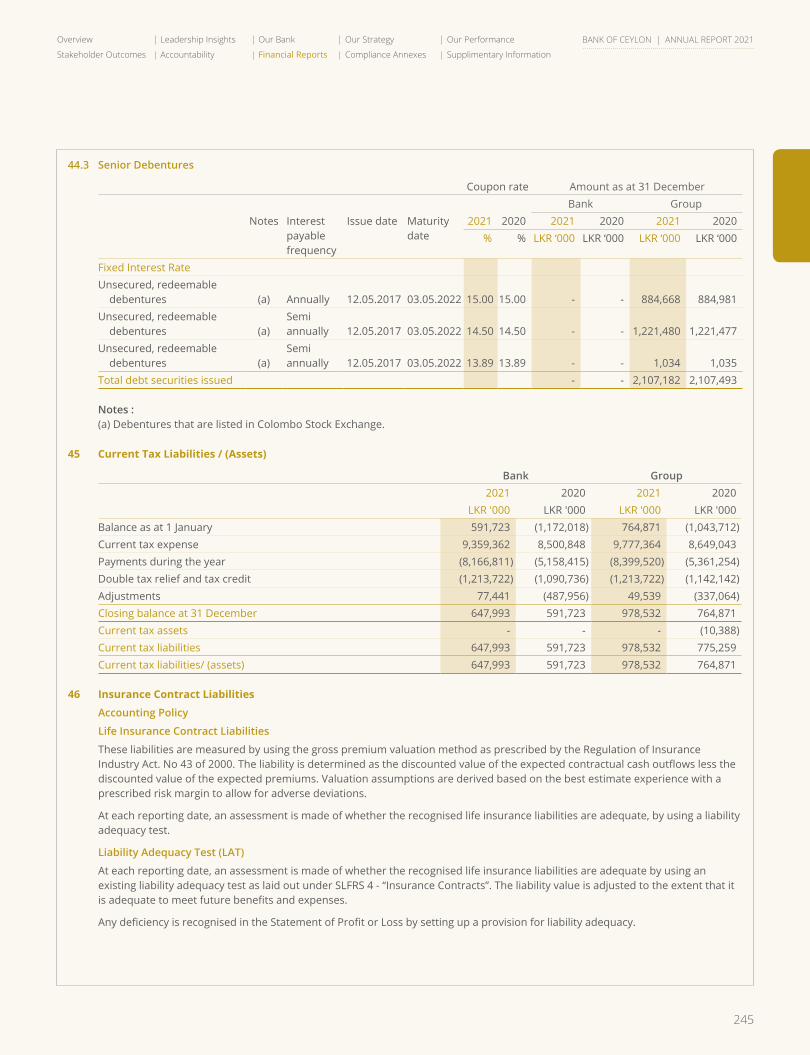
245
Overview Leadership Insights Our Bank Our Strategy Our Performance
Stakeholder Outcomes Accountability Financial Reports Compliance Annexes Supplimentary Information
BANK OF CEYLON | ANNUAL REPORT 2021
44.3 Senior Debentures
Coupon rate Amount as at 31 DecemberBank Group
Notes Interest payable frequency
Issue date Maturity date
2021 2020 2021 2020 2021 2020% % LKR ‘000 LKR ‘000 LKR ‘000 LKR ‘000
Fixed Interest RateUnsecured, redeemable
debentures (a) Annually 12.05.2017 03.05.2022 15.00 15.00 - - 884,668 884,981 Unsecured, redeemable
debentures (a)Semi annually 12.05.2017 03.05.2022 14.50 14.50 - - 1,221,480 1,221,477
Unsecured, redeemable debentures (a)
Semi annually 12.05.2017 03.05.2022 13.89 13.89 - - 1,034 1,035
Total debt securities issued - - 2,107,182 2,107,493
Notes : (a) Debentures that are listed in Colombo Stock Exchange.
45 Current Tax Liabilities / (Assets)
Bank Group2021 2020 2021 2020
LKR '000 LKR '000 LKR '000 LKR '000Balance as at 1 January 591,723 (1,172,018) 764,871 (1,043,712)Current tax expense 9,359,362 8,500,848 9,777,364 8,649,043 Payments during the year (8,166,811) (5,158,415) (8,399,520) (5,361,254)Double tax relief and tax credit (1,213,722) (1,090,736) (1,213,722) (1,142,142)Adjustments 77,441 (487,956) 49,539 (337,064)Closing balance at 31 December 647,993 591,723 978,532 764,871 Current tax assets - - - (10,388)Current tax liabilities 647,993 591,723 978,532 775,259 Current tax liabilities/ (assets) 647,993 591,723 978,532 764,871
46 Insurance Contract Liabilities
Accounting Policy
Life Insurance Contract Liabilities
These liabilities are measured by using the gross premium valuation method as prescribed by the Regulation of Insurance Industry Act. No 43 of 2000. The liability is determined as the discounted value of the expected contractual cash outflows less the discounted value of the expected premiums. Valuation assumptions are derived based on the best estimate experience with a prescribed risk margin to allow for adverse deviations.
At each reporting date, an assessment is made of whether the recognised life insurance liabilities are adequate, by using a liability adequacy test.
Liability Adequacy Test (LAT)
At each reporting date, an assessment is made of whether the recognised life insurance liabilities are adequate by using an existing liability adequacy test as laid out under SLFRS 4 - “Insurance Contracts”. The liability value is adjusted to the extent that it is adequate to meet future benefits and expenses.
Any deficiency is recognised in the Statement of Profit or Loss by setting up a provision for liability adequacy.
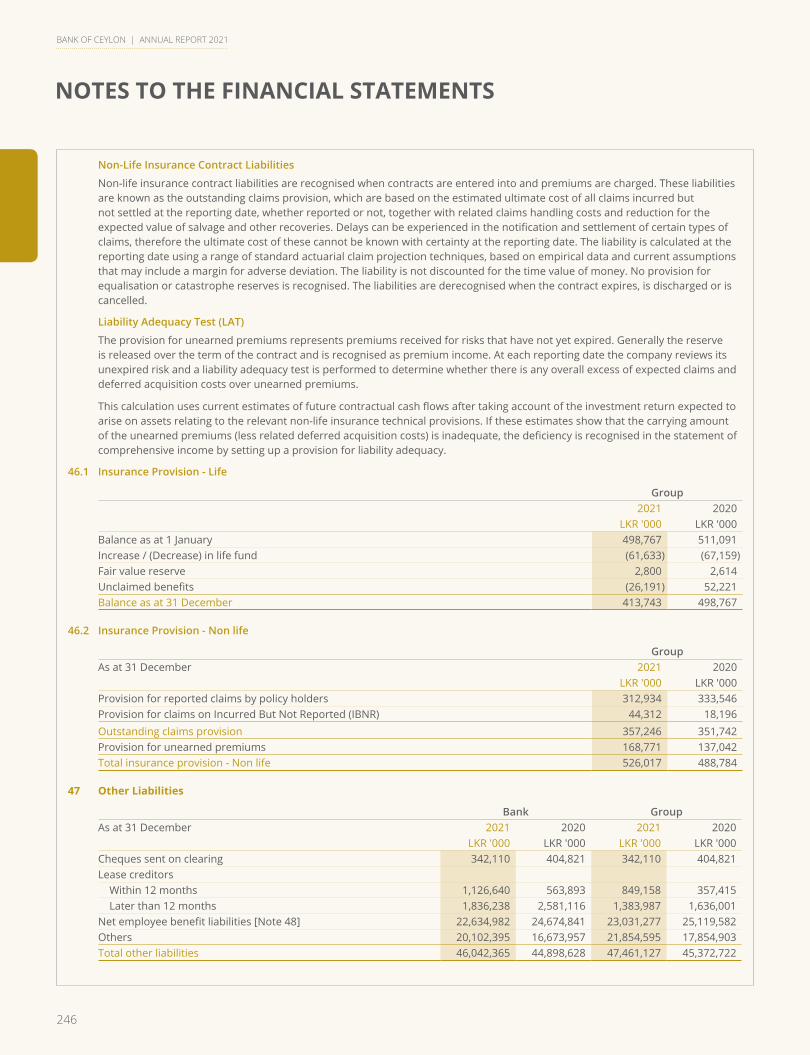
246
NOTES TO THE FINANCIAL STATEMENTS
BANK OF CEYLON | ANNUAL REPORT 2021
Non-Life Insurance Contract Liabilities
Non-life insurance contract liabilities are recognised when contracts are entered into and premiums are charged. These liabilities are known as the outstanding claims provision, which are based on the estimated ultimate cost of all claims incurred but not settled at the reporting date, whether reported or not, together with related claims handling costs and reduction for the expected value of salvage and other recoveries. Delays can be experienced in the notification and settlement of certain types of claims, therefore the ultimate cost of these cannot be known with certainty at the reporting date. The liability is calculated at the reporting date using a range of standard actuarial claim projection techniques, based on empirical data and current assumptions that may include a margin for adverse deviation. The liability is not discounted for the time value of money. No provision for equalisation or catastrophe reserves is recognised. The liabilities are derecognised when the contract expires, is discharged or is cancelled.
Liability Adequacy Test (LAT)
The provision for unearned premiums represents premiums received for risks that have not yet expired. Generally the reserve is released over the term of the contract and is recognised as premium income. At each reporting date the company reviews its unexpired risk and a liability adequacy test is performed to determine whether there is any overall excess of expected claims and deferred acquisition costs over unearned premiums.
This calculation uses current estimates of future contractual cash flows after taking account of the investment return expected to arise on assets relating to the relevant non-life insurance technical provisions. If these estimates show that the carrying amount of the unearned premiums (less related deferred acquisition costs) is inadequate, the deficiency is recognised in the statement of comprehensive income by setting up a provision for liability adequacy.
46.1 Insurance Provision - Life
Group2021 2020
LKR '000 LKR '000Balance as at 1 January 498,767 511,091 Increase / (Decrease) in life fund (61,633) (67,159)Fair value reserve 2,800 2,614 Unclaimed benefits (26,191) 52,221 Balance as at 31 December 413,743 498,767
46.2 Insurance Provision - Non life
GroupAs at 31 December 2021 2020
LKR '000 LKR '000Provision for reported claims by policy holders 312,934 333,546 Provision for claims on Incurred But Not Reported (IBNR) 44,312 18,196 Outstanding claims provision 357,246 351,742 Provision for unearned premiums 168,771 137,042 Total insurance provision - Non life 526,017 488,784
47 Other Liabilities
Bank GroupAs at 31 December 2021 2020 2021 2020
LKR '000 LKR '000 LKR '000 LKR '000Cheques sent on clearing 342,110 404,821 342,110 404,821 Lease creditors Within 12 months 1,126,640 563,893 849,158 357,415 Later than 12 months 1,836,238 2,581,116 1,383,987 1,636,001 Net employee benefit liabilities [Note 48] 22,634,982 24,674,841 23,031,277 25,119,582 Others 20,102,395 16,673,957 21,854,595 17,854,903 Total other liabilities 46,042,365 44,898,628 47,461,127 45,372,722
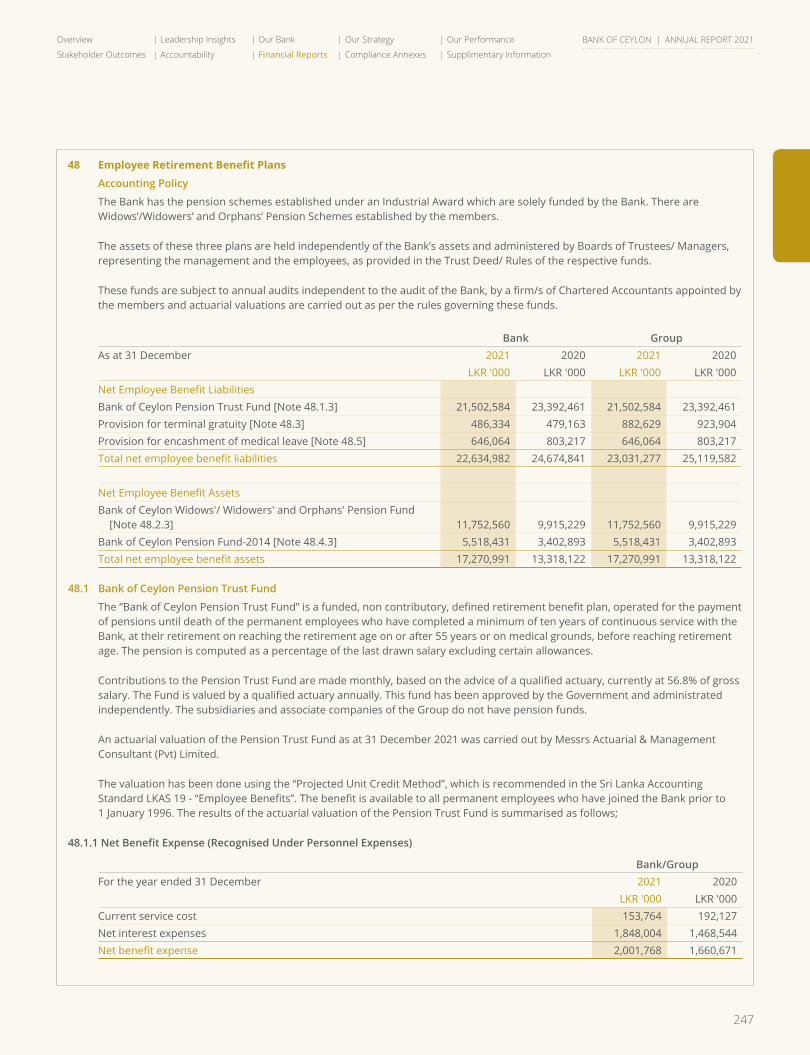
247
Overview Leadership Insights Our Bank Our Strategy Our Performance
Stakeholder Outcomes Accountability Financial Reports Compliance Annexes Supplimentary Information
BANK OF CEYLON | ANNUAL REPORT 2021
48 Employee Retirement Benefit Plans
Accounting Policy
The Bank has the pension schemes established under an Industrial Award which are solely funded by the Bank. There are Widows’/Widowers’ and Orphans’ Pension Schemes established by the members.
The assets of these three plans are held independently of the Bank’s assets and administered by Boards of Trustees/ Managers, representing the management and the employees, as provided in the Trust Deed/ Rules of the respective funds.
These funds are subject to annual audits independent to the audit of the Bank, by a firm/s of Chartered Accountants appointed by the members and actuarial valuations are carried out as per the rules governing these funds.
Bank GroupAs at 31 December 2021 2020 2021 2020
LKR '000 LKR '000 LKR '000 LKR '000Net Employee Benefit Liabilities Bank of Ceylon Pension Trust Fund [Note 48.1.3] 21,502,584 23,392,461 21,502,584 23,392,461 Provision for terminal gratuity [Note 48.3] 486,334 479,163 882,629 923,904 Provision for encashment of medical leave [Note 48.5] 646,064 803,217 646,064 803,217 Total net employee benefit liabilities 22,634,982 24,674,841 23,031,277 25,119,582
Net Employee Benefit AssetsBank of Ceylon Widows'/ Widowers' and Orphans' Pension Fund
[Note 48.2.3] 11,752,560 9,915,229 11,752,560 9,915,229 Bank of Ceylon Pension Fund-2014 [Note 48.4.3] 5,518,431 3,402,893 5,518,431 3,402,893 Total net employee benefit assets 17,270,991 13,318,122 17,270,991 13,318,122
48.1 Bank of Ceylon Pension Trust Fund
The ”Bank of Ceylon Pension Trust Fund” is a funded, non contributory, defined retirement benefit plan, operated for the payment of pensions until death of the permanent employees who have completed a minimum of ten years of continuous service with the Bank, at their retirement on reaching the retirement age on or after 55 years or on medical grounds, before reaching retirement age. The pension is computed as a percentage of the last drawn salary excluding certain allowances.
Contributions to the Pension Trust Fund are made monthly, based on the advice of a qualified actuary, currently at 56.8% of gross salary. The Fund is valued by a qualified actuary annually. This fund has been approved by the Government and administrated independently. The subsidiaries and associate companies of the Group do not have pension funds.
An actuarial valuation of the Pension Trust Fund as at 31 December 2021 was carried out by Messrs Actuarial & Management Consultant (Pvt) Limited.
The valuation has been done using the “Projected Unit Credit Method”, which is recommended in the Sri Lanka Accounting Standard LKAS 19 - “Employee Benefits”. The benefit is available to all permanent employees who have joined the Bank prior to 1 January 1996. The results of the actuarial valuation of the Pension Trust Fund is summarised as follows;
48.1.1NetBenefitExpense(RecognisedUnderPersonnelExpenses)
Bank/GroupFor the year ended 31 December 2021 2020
LKR '000 LKR '000Current service cost 153,764 192,127 Net interest expenses 1,848,004 1,468,544 Net benefit expense 2,001,768 1,660,671
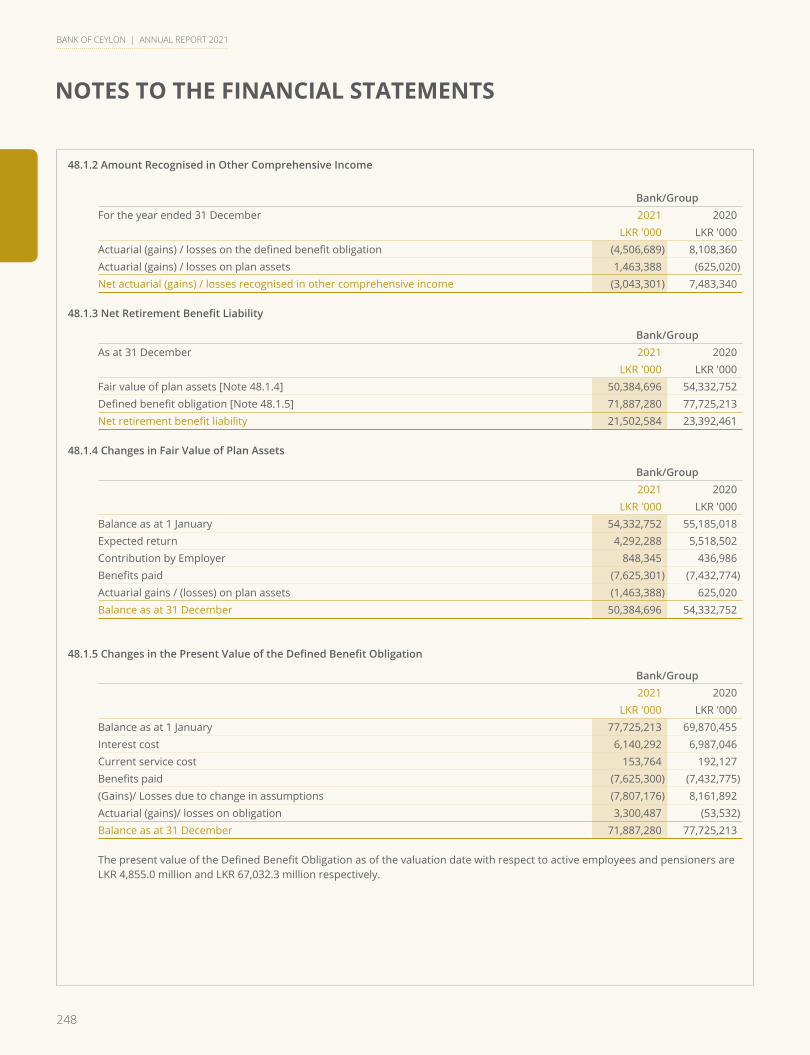
248
NOTES TO THE FINANCIAL STATEMENTS
BANK OF CEYLON | ANNUAL REPORT 2021
48.1.2 Amount Recognised in Other Comprehensive Income
Bank/GroupFor the year ended 31 December 2021 2020
LKR '000 LKR '000Actuarial (gains) / losses on the defined benefit obligation (4,506,689) 8,108,360 Actuarial (gains) / losses on plan assets 1,463,388 (625,020)Net actuarial (gains) / losses recognised in other comprehensive income (3,043,301) 7,483,340
48.1.3NetRetirementBenefitLiability
Bank/GroupAs at 31 December 2021 2020
LKR '000 LKR '000Fair value of plan assets [Note 48.1.4] 50,384,696 54,332,752 Defined benefit obligation [Note 48.1.5] 71,887,280 77,725,213 Net retirement benefit liability 21,502,584 23,392,461
48.1.4 Changes in Fair Value of Plan Assets
Bank/Group2021 2020
LKR '000 LKR '000Balance as at 1 January 54,332,752 55,185,018 Expected return 4,292,288 5,518,502 Contribution by Employer 848,345 436,986 Benefits paid (7,625,301) (7,432,774)Actuarial gains / (losses) on plan assets (1,463,388) 625,020 Balance as at 31 December 50,384,696 54,332,752
48.1.5ChangesinthePresentValueoftheDefinedBenefitObligation
Bank/Group2021 2020
LKR '000 LKR '000Balance as at 1 January 77,725,213 69,870,455 Interest cost 6,140,292 6,987,046 Current service cost 153,764 192,127 Benefits paid (7,625,300) (7,432,775)(Gains)/ Losses due to change in assumptions (7,807,176) 8,161,892 Actuarial (gains)/ losses on obligation 3,300,487 (53,532)Balance as at 31 December 71,887,280 77,725,213
The present value of the Defined Benefit Obligation as of the valuation date with respect to active employees and pensioners are LKR 4,855.0 million and LKR 67,032.3 million respectively.
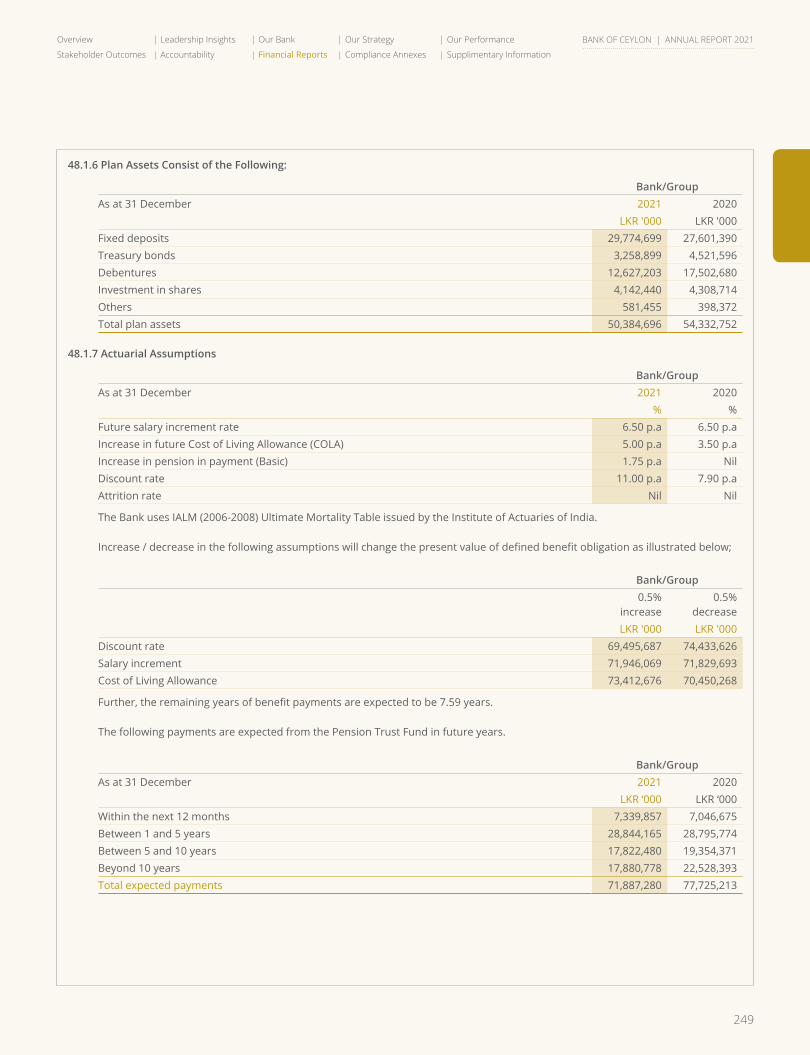
249
Overview Leadership Insights Our Bank Our Strategy Our Performance
Stakeholder Outcomes Accountability Financial Reports Compliance Annexes Supplimentary Information
BANK OF CEYLON | ANNUAL REPORT 2021
48.1.6 Plan Assets Consist of the Following:
Bank/GroupAs at 31 December 2021 2020
LKR '000 LKR '000Fixed deposits 29,774,699 27,601,390 Treasury bonds 3,258,899 4,521,596 Debentures 12,627,203 17,502,680 Investment in shares 4,142,440 4,308,714 Others 581,455 398,372 Total plan assets 50,384,696 54,332,752
48.1.7 Actuarial Assumptions
Bank/GroupAs at 31 December 2021 2020
% %Future salary increment rate 6.50 p.a 6.50 p.aIncrease in future Cost of Living Allowance (COLA) 5.00 p.a 3.50 p.aIncrease in pension in payment (Basic) 1.75 p.a NilDiscount rate 11.00 p.a 7.90 p.aAttrition rate Nil Nil
The Bank uses IALM (2006-2008) Ultimate Mortality Table issued by the Institute of Actuaries of India.
Increase / decrease in the following assumptions will change the present value of defined benefit obligation as illustrated below;
Bank/Group0.5%
increase0.5%
decreaseLKR '000 LKR '000
Discount rate 69,495,687 74,433,626 Salary increment 71,946,069 71,829,693 Cost of Living Allowance 73,412,676 70,450,268
Further, the remaining years of benefit payments are expected to be 7.59 years.
The following payments are expected from the Pension Trust Fund in future years.
Bank/GroupAs at 31 December 2021 2020
LKR ‘000 LKR ‘000Within the next 12 months 7,339,857 7,046,675 Between 1 and 5 years 28,844,165 28,795,774 Between 5 and 10 years 17,822,480 19,354,371 Beyond 10 years 17,880,778 22,528,393 Total expected payments 71,887,280 77,725,213
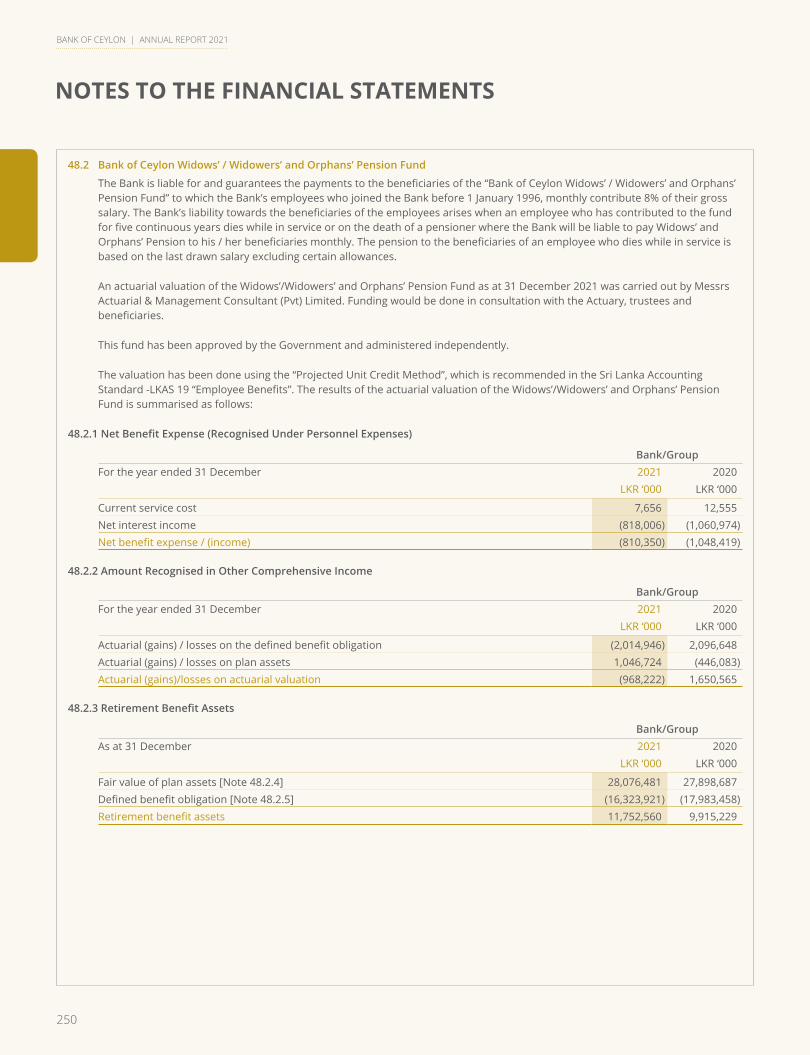
250
NOTES TO THE FINANCIAL STATEMENTS
BANK OF CEYLON | ANNUAL REPORT 2021
48.2 Bank of Ceylon Widows’ / Widowers’ and Orphans’ Pension Fund
The Bank is liable for and guarantees the payments to the beneficiaries of the “Bank of Ceylon Widows’ / Widowers’ and Orphans’ Pension Fund” to which the Bank’s employees who joined the Bank before 1 January 1996, monthly contribute 8% of their gross salary. The Bank’s liability towards the beneficiaries of the employees arises when an employee who has contributed to the fund for five continuous years dies while in service or on the death of a pensioner where the Bank will be liable to pay Widows’ and Orphans’ Pension to his / her beneficiaries monthly. The pension to the beneficiaries of an employee who dies while in service is based on the last drawn salary excluding certain allowances.
An actuarial valuation of the Widows’/Widowers’ and Orphans’ Pension Fund as at 31 December 2021 was carried out by Messrs Actuarial & Management Consultant (Pvt) Limited. Funding would be done in consultation with the Actuary, trustees and beneficiaries.
This fund has been approved by the Government and administered independently.
The valuation has been done using the “Projected Unit Credit Method”, which is recommended in the Sri Lanka Accounting Standard -LKAS 19 “Employee Benefits”. The results of the actuarial valuation of the Widows’/Widowers’ and Orphans’ Pension Fund is summarised as follows:
48.2.1NetBenefitExpense(RecognisedUnderPersonnelExpenses)
Bank/GroupFor the year ended 31 December 2021 2020
LKR ‘000 LKR ‘000
Current service cost 7,656 12,555 Net interest income (818,006) (1,060,974)Net benefit expense / (income) (810,350) (1,048,419)
48.2.2 Amount Recognised in Other Comprehensive Income
Bank/GroupFor the year ended 31 December 2021 2020
LKR ‘000 LKR ‘000
Actuarial (gains) / losses on the defined benefit obligation (2,014,946) 2,096,648 Actuarial (gains) / losses on plan assets 1,046,724 (446,083)Actuarial (gains)/losses on actuarial valuation (968,222) 1,650,565
48.2.3RetirementBenefitAssets
Bank/GroupAs at 31 December 2021 2020
LKR ‘000 LKR ‘000
Fair value of plan assets [Note 48.2.4] 28,076,481 27,898,687 Defined benefit obligation [Note 48.2.5] (16,323,921) (17,983,458)Retirement benefit assets 11,752,560 9,915,229
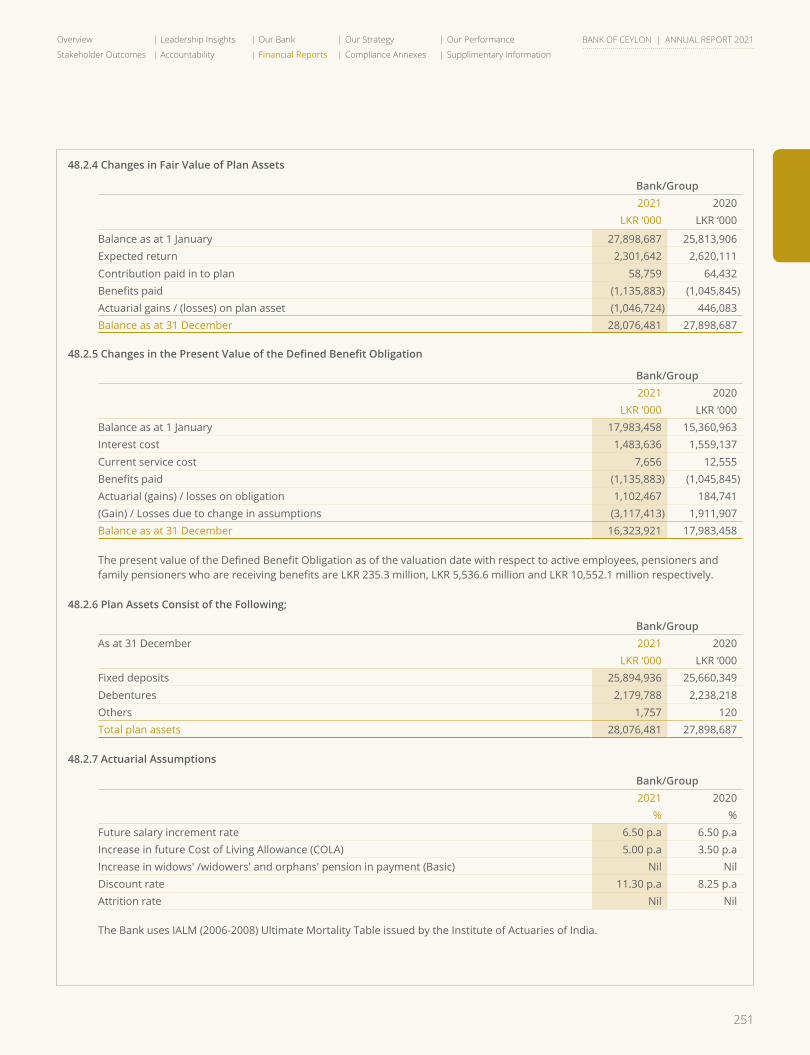
251
Overview Leadership Insights Our Bank Our Strategy Our Performance
Stakeholder Outcomes Accountability Financial Reports Compliance Annexes Supplimentary Information
BANK OF CEYLON | ANNUAL REPORT 2021
48.2.4 Changes in Fair Value of Plan Assets
Bank/Group2021 2020
LKR ‘000 LKR ‘000
Balance as at 1 January 27,898,687 25,813,906 Expected return 2,301,642 2,620,111 Contribution paid in to plan 58,759 64,432 Benefits paid (1,135,883) (1,045,845)Actuarial gains / (losses) on plan asset (1,046,724) 446,083 Balance as at 31 December 28,076,481 27,898,687
48.2.5ChangesinthePresentValueoftheDefinedBenefitObligation
Bank/Group2021 2020
LKR ‘000 LKR ‘000Balance as at 1 January 17,983,458 15,360,963 Interest cost 1,483,636 1,559,137 Current service cost 7,656 12,555 Benefits paid (1,135,883) (1,045,845)Actuarial (gains) / losses on obligation 1,102,467 184,741 (Gain) / Losses due to change in assumptions (3,117,413) 1,911,907 Balance as at 31 December 16,323,921 17,983,458
The present value of the Defined Benefit Obligation as of the valuation date with respect to active employees, pensioners and family pensioners who are receiving benefits are LKR 235.3 million, LKR 5,536.6 million and LKR 10,552.1 million respectively.
48.2.6 Plan Assets Consist of the Following;
Bank/GroupAs at 31 December 2021 2020
LKR ‘000 LKR ‘000Fixed deposits 25,894,936 25,660,349 Debentures 2,179,788 2,238,218 Others 1,757 120 Total plan assets 28,076,481 27,898,687
48.2.7 Actuarial Assumptions
Bank/Group2021 2020
% %Future salary increment rate 6.50 p.a 6.50 p.aIncrease in future Cost of Living Allowance (COLA) 5.00 p.a 3.50 p.aIncrease in widows' /widowers' and orphans' pension in payment (Basic) Nil NilDiscount rate 11.30 p.a 8.25 p.aAttrition rate Nil Nil
The Bank uses IALM (2006-2008) Ultimate Mortality Table issued by the Institute of Actuaries of India.
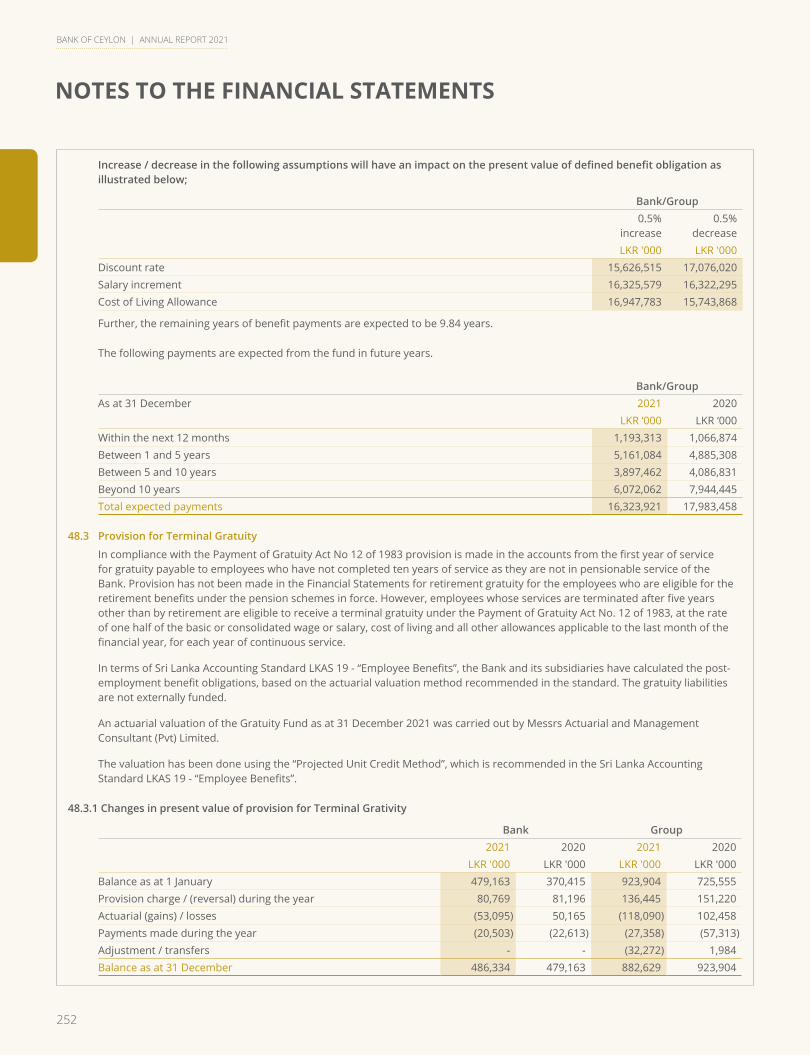
252
NOTES TO THE FINANCIAL STATEMENTS
BANK OF CEYLON | ANNUAL REPORT 2021
Increase/decreaseinthefollowingassumptionswillhaveanimpactonthepresentvalueofdefinedbenefitobligationasillustrated below;
Bank/Group0.5%
increase0.5%
decreaseLKR '000 LKR '000
Discount rate 15,626,515 17,076,020 Salary increment 16,325,579 16,322,295 Cost of Living Allowance 16,947,783 15,743,868
Further, the remaining years of benefit payments are expected to be 9.84 years.
The following payments are expected from the fund in future years.
Bank/GroupAs at 31 December 2021 2020
LKR ‘000 LKR ‘000Within the next 12 months 1,193,313 1,066,874 Between 1 and 5 years 5,161,084 4,885,308 Between 5 and 10 years 3,897,462 4,086,831 Beyond 10 years 6,072,062 7,944,445 Total expected payments 16,323,921 17,983,458
48.3 Provision for Terminal Gratuity
In compliance with the Payment of Gratuity Act No 12 of 1983 provision is made in the accounts from the first year of service for gratuity payable to employees who have not completed ten years of service as they are not in pensionable service of the Bank. Provision has not been made in the Financial Statements for retirement gratuity for the employees who are eligible for the retirement benefits under the pension schemes in force. However, employees whose services are terminated after five years other than by retirement are eligible to receive a terminal gratuity under the Payment of Gratuity Act No. 12 of 1983, at the rate of one half of the basic or consolidated wage or salary, cost of living and all other allowances applicable to the last month of the financial year, for each year of continuous service.
In terms of Sri Lanka Accounting Standard LKAS 19 - “Employee Benefits”, the Bank and its subsidiaries have calculated the post-employment benefit obligations, based on the actuarial valuation method recommended in the standard. The gratuity liabilities are not externally funded.
An actuarial valuation of the Gratuity Fund as at 31 December 2021 was carried out by Messrs Actuarial and Management Consultant (Pvt) Limited.
The valuation has been done using the “Projected Unit Credit Method”, which is recommended in the Sri Lanka Accounting Standard LKAS 19 - “Employee Benefits”.
48.3.1 Changes in present value of provision for Terminal Grativity
Bank Group2021 2020 2021 2020
LKR '000 LKR '000 LKR '000 LKR '000Balance as at 1 January 479,163 370,415 923,904 725,555 Provision charge / (reversal) during the year 80,769 81,196 136,445 151,220 Actuarial (gains) / losses (53,095) 50,165 (118,090) 102,458 Payments made during the year (20,503) (22,613) (27,358) (57,313)Adjustment / transfers - - (32,272) 1,984 Balance as at 31 December 486,334 479,163 882,629 923,904
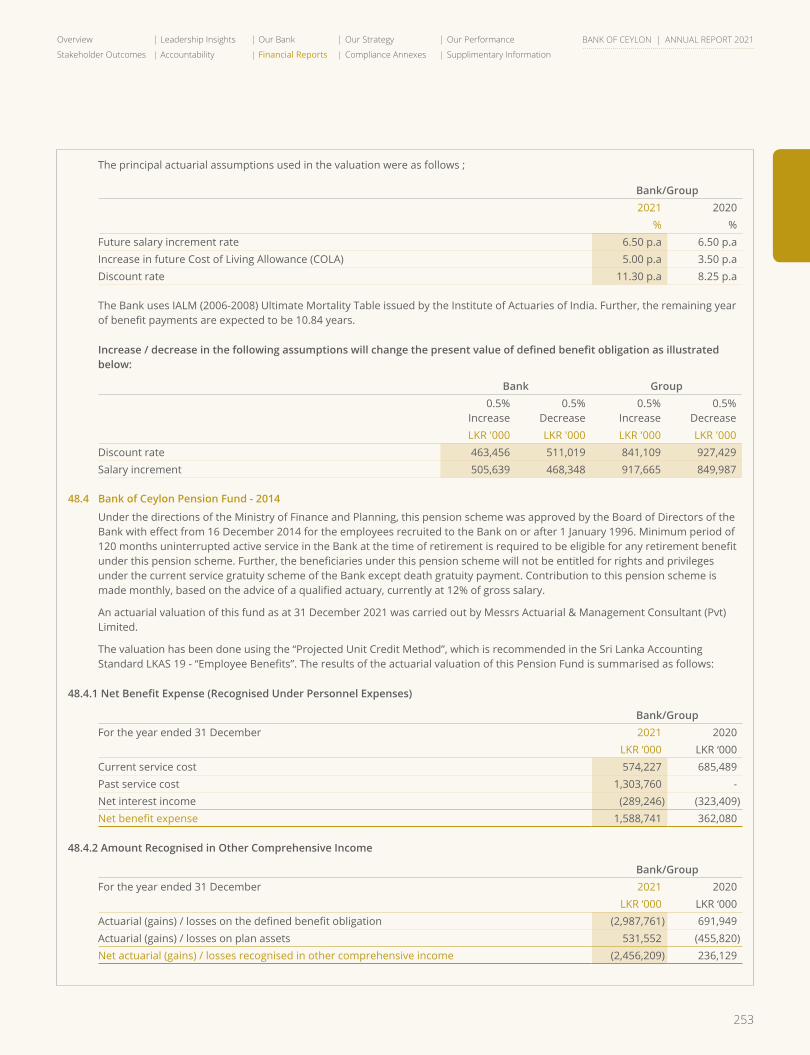
253
Overview Leadership Insights Our Bank Our Strategy Our Performance
Stakeholder Outcomes Accountability Financial Reports Compliance Annexes Supplimentary Information
BANK OF CEYLON | ANNUAL REPORT 2021
The principal actuarial assumptions used in the valuation were as follows ;
Bank/Group2021 2020
% %Future salary increment rate 6.50 p.a 6.50 p.aIncrease in future Cost of Living Allowance (COLA) 5.00 p.a 3.50 p.aDiscount rate 11.30 p.a 8.25 p.a
The Bank uses IALM (2006-2008) Ultimate Mortality Table issued by the Institute of Actuaries of India. Further, the remaining year of benefit payments are expected to be 10.84 years.
Increase/decreaseinthefollowingassumptionswillchangethepresentvalueofdefinedbenefitobligationasillustratedbelow:
Bank Group0.5%
Increase0.5%
Decrease0.5%
Increase0.5%
DecreaseLKR '000 LKR '000 LKR '000 LKR '000
Discount rate 463,456 511,019 841,109 927,429 Salary increment 505,639 468,348 917,665 849,987
48.4 Bank of Ceylon Pension Fund - 2014
Under the directions of the Ministry of Finance and Planning, this pension scheme was approved by the Board of Directors of the Bank with effect from 16 December 2014 for the employees recruited to the Bank on or after 1 January 1996. Minimum period of 120 months uninterrupted active service in the Bank at the time of retirement is required to be eligible for any retirement benefit under this pension scheme. Further, the beneficiaries under this pension scheme will not be entitled for rights and privileges under the current service gratuity scheme of the Bank except death gratuity payment. Contribution to this pension scheme is made monthly, based on the advice of a qualified actuary, currently at 12% of gross salary.
An actuarial valuation of this fund as at 31 December 2021 was carried out by Messrs Actuarial & Management Consultant (Pvt) Limited.
The valuation has been done using the “Projected Unit Credit Method”, which is recommended in the Sri Lanka Accounting Standard LKAS 19 - “Employee Benefits”. The results of the actuarial valuation of this Pension Fund is summarised as follows:
48.4.1NetBenefitExpense(RecognisedUnderPersonnelExpenses)
Bank/GroupFor the year ended 31 December 2021 2020
LKR ‘000 LKR ‘000Current service cost 574,227 685,489 Past service cost 1,303,760 - Net interest income (289,246) (323,409)Net benefit expense 1,588,741 362,080
48.4.2 Amount Recognised in Other Comprehensive Income
Bank/GroupFor the year ended 31 December 2021 2020
LKR ‘000 LKR ‘000Actuarial (gains) / losses on the defined benefit obligation (2,987,761) 691,949 Actuarial (gains) / losses on plan assets 531,552 (455,820)Net actuarial (gains) / losses recognised in other comprehensive income (2,456,209) 236,129
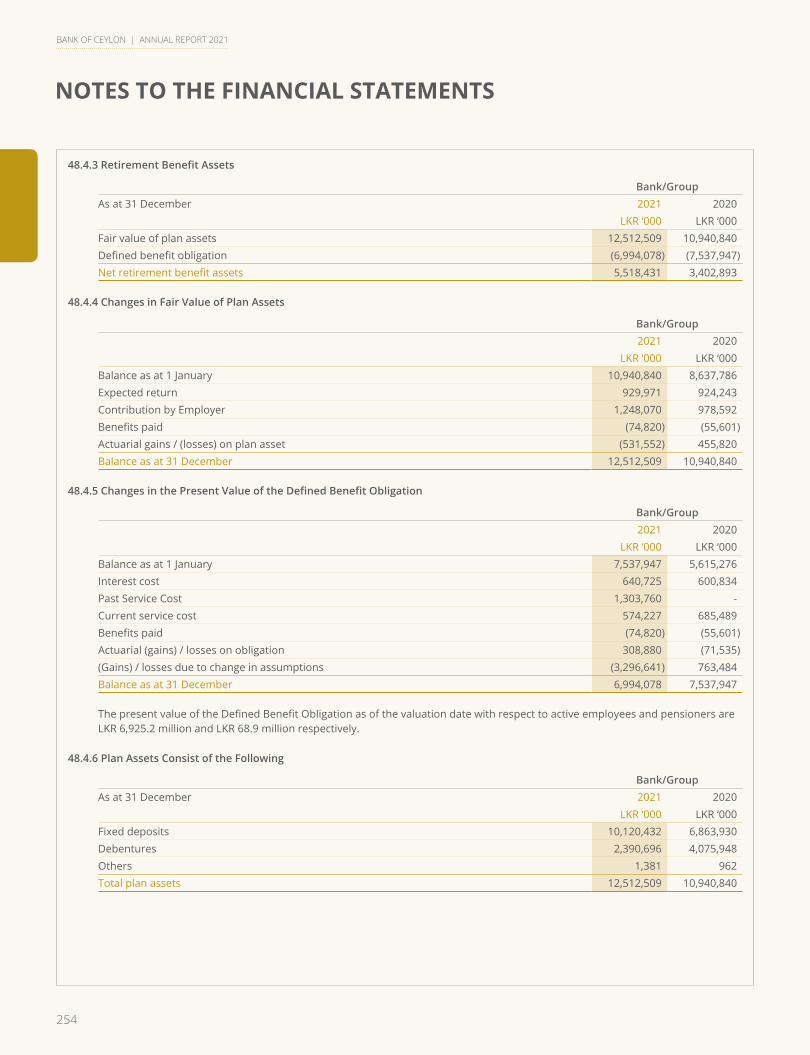
254
NOTES TO THE FINANCIAL STATEMENTS
BANK OF CEYLON | ANNUAL REPORT 2021
48.4.3RetirementBenefitAssets
Bank/GroupAs at 31 December 2021 2020
LKR ‘000 LKR ‘000Fair value of plan assets 12,512,509 10,940,840 Defined benefit obligation (6,994,078) (7,537,947)Net retirement benefit assets 5,518,431 3,402,893
48.4.4 Changes in Fair Value of Plan Assets
Bank/Group2021 2020
LKR ‘000 LKR ‘000Balance as at 1 January 10,940,840 8,637,786 Expected return 929,971 924,243 Contribution by Employer 1,248,070 978,592 Benefits paid (74,820) (55,601)Actuarial gains / (losses) on plan asset (531,552) 455,820 Balance as at 31 December 12,512,509 10,940,840
48.4.5ChangesinthePresentValueoftheDefinedBenefitObligation
Bank/Group2021 2020
LKR ‘000 LKR ‘000Balance as at 1 January 7,537,947 5,615,276 Interest cost 640,725 600,834 Past Service Cost 1,303,760 - Current service cost 574,227 685,489 Benefits paid (74,820) (55,601)Actuarial (gains) / losses on obligation 308,880 (71,535)(Gains) / losses due to change in assumptions (3,296,641) 763,484 Balance as at 31 December 6,994,078 7,537,947
The present value of the Defined Benefit Obligation as of the valuation date with respect to active employees and pensioners are LKR 6,925.2 million and LKR 68.9 million respectively.
48.4.6 Plan Assets Consist of the Following
Bank/GroupAs at 31 December 2021 2020
LKR ‘000 LKR ‘000Fixed deposits 10,120,432 6,863,930 Debentures 2,390,696 4,075,948 Others 1,381 962 Total plan assets 12,512,509 10,940,840
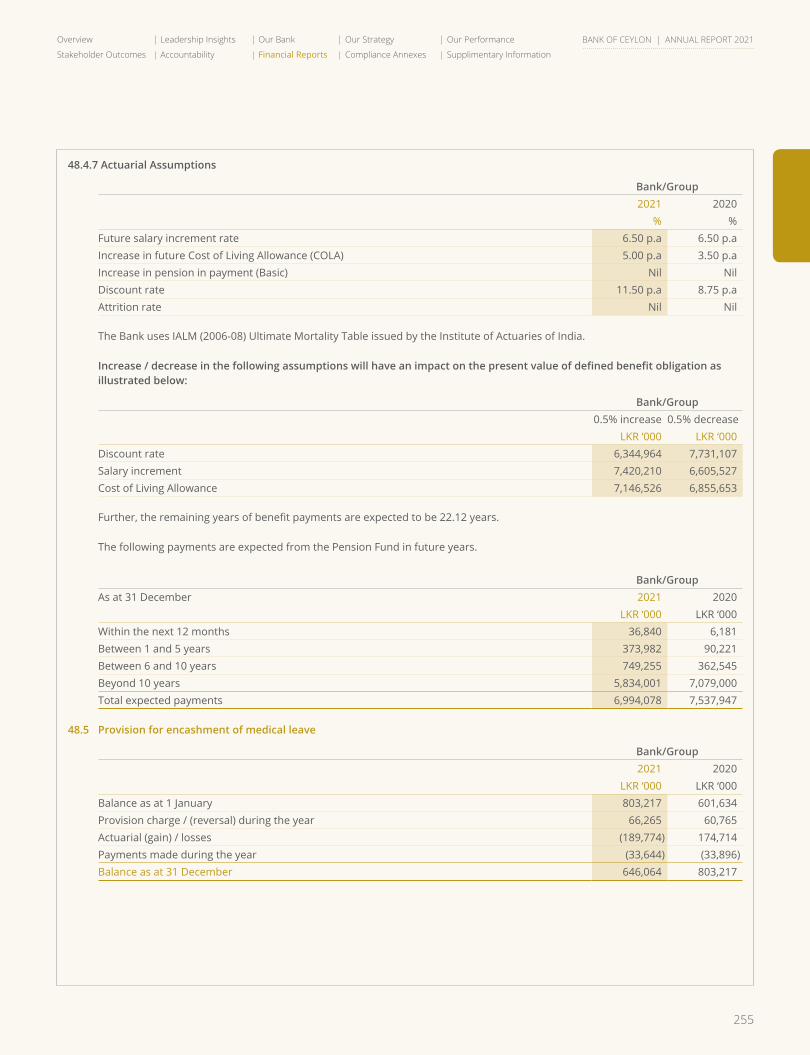
255
Overview Leadership Insights Our Bank Our Strategy Our Performance
Stakeholder Outcomes Accountability Financial Reports Compliance Annexes Supplimentary Information
BANK OF CEYLON | ANNUAL REPORT 2021
48.4.7 Actuarial Assumptions
Bank/Group2021 2020
% %Future salary increment rate 6.50 p.a 6.50 p.aIncrease in future Cost of Living Allowance (COLA) 5.00 p.a 3.50 p.aIncrease in pension in payment (Basic) Nil NilDiscount rate 11.50 p.a 8.75 p.aAttrition rate Nil Nil
The Bank uses IALM (2006-08) Ultimate Mortality Table issued by the Institute of Actuaries of India.
Increase/decreaseinthefollowingassumptionswillhaveanimpactonthepresentvalueofdefinedbenefitobligationasillustrated below:
Bank/Group0.5% increase 0.5% decrease
LKR ‘000 LKR ‘000Discount rate 6,344,964 7,731,107Salary increment 7,420,210 6,605,527Cost of Living Allowance 7,146,526 6,855,653
Further, the remaining years of benefit payments are expected to be 22.12 years.
The following payments are expected from the Pension Fund in future years.
Bank/GroupAs at 31 December 2021 2020
LKR ‘000 LKR ‘000Within the next 12 months 36,840 6,181 Between 1 and 5 years 373,982 90,221 Between 6 and 10 years 749,255 362,545 Beyond 10 years 5,834,001 7,079,000 Total expected payments 6,994,078 7,537,947
48.5 Provision for encashment of medical leave
Bank/Group2021 2020
LKR ‘000 LKR ‘000Balance as at 1 January 803,217 601,634 Provision charge / (reversal) during the year 66,265 60,765 Actuarial (gain) / losses (189,774) 174,714 Payments made during the year (33,644) (33,896)Balance as at 31 December 646,064 803,217
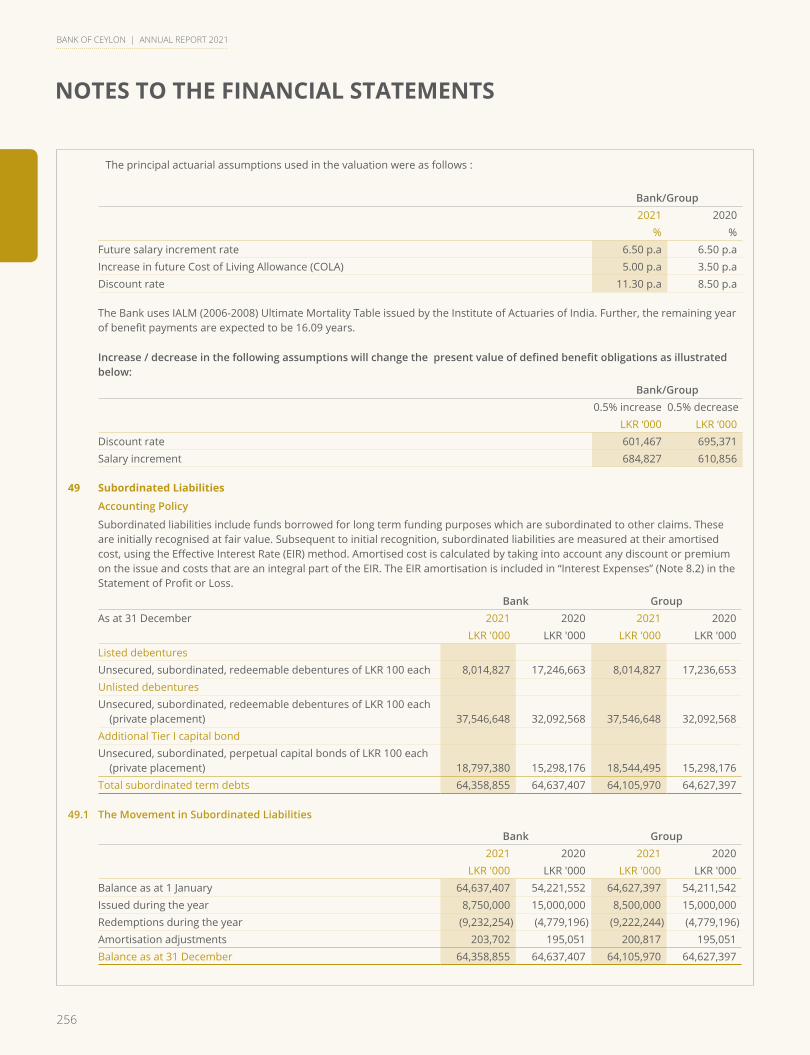
256
NOTES TO THE FINANCIAL STATEMENTS
BANK OF CEYLON | ANNUAL REPORT 2021
The principal actuarial assumptions used in the valuation were as follows :
Bank/Group2021 2020
% %Future salary increment rate 6.50 p.a 6.50 p.aIncrease in future Cost of Living Allowance (COLA) 5.00 p.a 3.50 p.aDiscount rate 11.30 p.a 8.50 p.a
The Bank uses IALM (2006-2008) Ultimate Mortality Table issued by the Institute of Actuaries of India. Further, the remaining year of benefit payments are expected to be 16.09 years.
Increase/decreaseinthefollowingassumptionswillchangethepresentvalueofdefinedbenefitobligationsasillustratedbelow:
Bank/Group0.5% increase 0.5% decrease
LKR ‘000 LKR ‘000Discount rate 601,467 695,371Salary increment 684,827 610,856
49 Subordinated Liabilities
Accounting Policy
Subordinated liabilities include funds borrowed for long term funding purposes which are subordinated to other claims. These are initially recognised at fair value. Subsequent to initial recognition, subordinated liabilities are measured at their amortised cost, using the Effective Interest Rate (EIR) method. Amortised cost is calculated by taking into account any discount or premium on the issue and costs that are an integral part of the EIR. The EIR amortisation is included in “Interest Expenses” (Note 8.2) in the Statement of Profit or Loss.
Bank GroupAs at 31 December 2021 2020 2021 2020
LKR '000 LKR '000 LKR '000 LKR '000Listed debenturesUnsecured, subordinated, redeemable debentures of LKR 100 each 8,014,827 17,246,663 8,014,827 17,236,653 Unlisted debenturesUnsecured, subordinated, redeemable debentures of LKR 100 each
(private placement) 37,546,648 32,092,568 37,546,648 32,092,568 Additional Tier I capital bondUnsecured, subordinated, perpetual capital bonds of LKR 100 each
(private placement) 18,797,380 15,298,176 18,544,495 15,298,176 Total subordinated term debts 64,358,855 64,637,407 64,105,970 64,627,397
49.1 The Movement in Subordinated Liabilities
Bank Group2021 2020 2021 2020
LKR '000 LKR '000 LKR '000 LKR '000Balance as at 1 January 64,637,407 54,221,552 64,627,397 54,211,542 Issued during the year 8,750,000 15,000,000 8,500,000 15,000,000 Redemptions during the year (9,232,254) (4,779,196) (9,222,244) (4,779,196)Amortisation adjustments 203,702 195,051 200,817 195,051 Balance as at 31 December 64,358,855 64,637,407 64,105,970 64,627,397
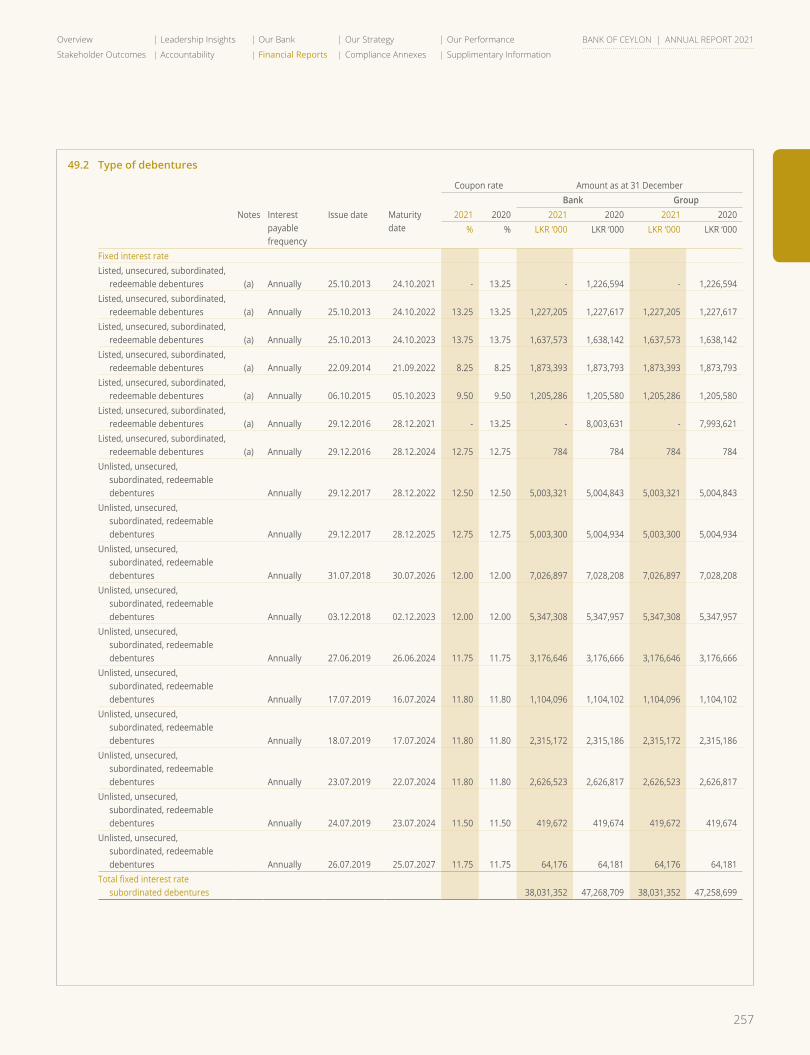
257
Overview Leadership Insights Our Bank Our Strategy Our Performance
Stakeholder Outcomes Accountability Financial Reports Compliance Annexes Supplimentary Information
BANK OF CEYLON | ANNUAL REPORT 2021
49.2 Type of debentures
Coupon rate Amount as at 31 DecemberBank Group
Notes Interest payable frequency
Issue date Maturity date
2021 2020 2021 2020 2021 2020% % LKR ‘000 LKR ‘000 LKR ‘000 LKR ‘000
Fixed interest rateListed, unsecured, subordinated,
redeemable debentures (a) Annually 25.10.2013 24.10.2021 - 13.25 - 1,226,594 - 1,226,594 Listed, unsecured, subordinated,
redeemable debentures (a) Annually 25.10.2013 24.10.2022 13.25 13.25 1,227,205 1,227,617 1,227,205 1,227,617 Listed, unsecured, subordinated,
redeemable debentures (a) Annually 25.10.2013 24.10.2023 13.75 13.75 1,637,573 1,638,142 1,637,573 1,638,142 Listed, unsecured, subordinated,
redeemable debentures (a) Annually 22.09.2014 21.09.2022 8.25 8.25 1,873,393 1,873,793 1,873,393 1,873,793 Listed, unsecured, subordinated,
redeemable debentures (a) Annually 06.10.2015 05.10.2023 9.50 9.50 1,205,286 1,205,580 1,205,286 1,205,580 Listed, unsecured, subordinated,
redeemable debentures (a) Annually 29.12.2016 28.12.2021 - 13.25 - 8,003,631 - 7,993,621 Listed, unsecured, subordinated,
redeemable debentures (a) Annually 29.12.2016 28.12.2024 12.75 12.75 784 784 784 784 Unlisted, unsecured,
subordinated, redeemable debentures Annually 29.12.2017 28.12.2022 12.50 12.50 5,003,321 5,004,843 5,003,321 5,004,843
Unlisted, unsecured, subordinated, redeemable debentures Annually 29.12.2017 28.12.2025 12.75 12.75 5,003,300 5,004,934 5,003,300 5,004,934
Unlisted, unsecured, subordinated, redeemable debentures Annually 31.07.2018 30.07.2026 12.00 12.00 7,026,897 7,028,208 7,026,897 7,028,208
Unlisted, unsecured, subordinated, redeemable debentures Annually 03.12.2018 02.12.2023 12.00 12.00 5,347,308 5,347,957 5,347,308 5,347,957
Unlisted, unsecured, subordinated, redeemable debentures Annually 27.06.2019 26.06.2024 11.75 11.75 3,176,646 3,176,666 3,176,646 3,176,666
Unlisted, unsecured, subordinated, redeemable debentures Annually 17.07.2019 16.07.2024 11.80 11.80 1,104,096 1,104,102 1,104,096 1,104,102
Unlisted, unsecured, subordinated, redeemable debentures Annually 18.07.2019 17.07.2024 11.80 11.80 2,315,172 2,315,186 2,315,172 2,315,186
Unlisted, unsecured, subordinated, redeemable debentures Annually 23.07.2019 22.07.2024 11.80 11.80 2,626,523 2,626,817 2,626,523 2,626,817
Unlisted, unsecured, subordinated, redeemable debentures Annually 24.07.2019 23.07.2024 11.50 11.50 419,672 419,674 419,672 419,674
Unlisted, unsecured, subordinated, redeemable debentures Annually 26.07.2019 25.07.2027 11.75 11.75 64,176 64,181 64,176 64,181
Total fixed interest rate subordinated debentures 38,031,352 47,268,709 38,031,352 47,258,699
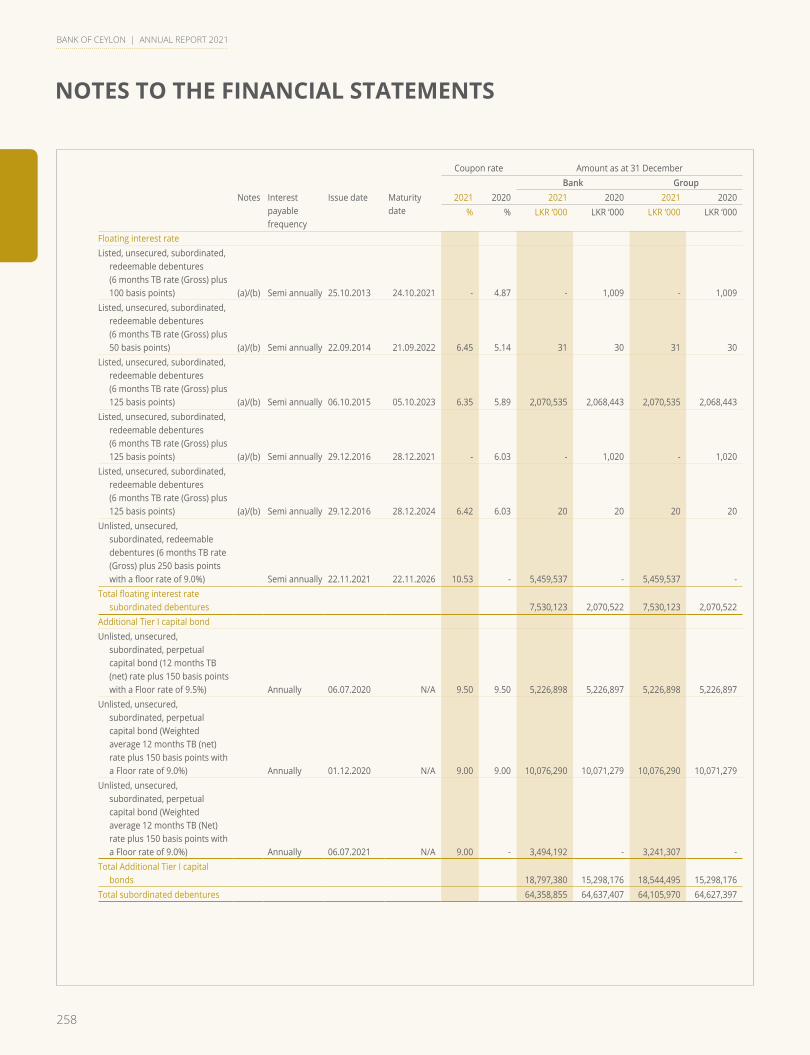
258
NOTES TO THE FINANCIAL STATEMENTS
BANK OF CEYLON | ANNUAL REPORT 2021
Coupon rate Amount as at 31 DecemberBank Group
Notes Interest payable frequency
Issue date Maturity date
2021 2020 2021 2020 2021 2020% % LKR ‘000 LKR ‘000 LKR ‘000 LKR ‘000
Floating interest rateListed, unsecured, subordinated,
redeemable debentures (6 months TB rate (Gross) plus 100 basis points) (a)/(b) Semi annually 25.10.2013 24.10.2021 - 4.87 - 1,009 - 1,009
Listed, unsecured, subordinated, redeemable debentures (6 months TB rate (Gross) plus 50 basis points) (a)/(b) Semi annually 22.09.2014 21.09.2022 6.45 5.14 31 30 31 30
Listed, unsecured, subordinated, redeemable debentures (6 months TB rate (Gross) plus 125 basis points) (a)/(b) Semi annually 06.10.2015 05.10.2023 6.35 5.89 2,070,535 2,068,443 2,070,535 2,068,443
Listed, unsecured, subordinated, redeemable debentures (6 months TB rate (Gross) plus 125 basis points) (a)/(b) Semi annually 29.12.2016 28.12.2021 - 6.03 - 1,020 - 1,020
Listed, unsecured, subordinated, redeemable debentures (6 months TB rate (Gross) plus 125 basis points) (a)/(b) Semi annually 29.12.2016 28.12.2024 6.42 6.03 20 20 20 20
Unlisted, unsecured, subordinated, redeemable debentures (6 months TB rate (Gross) plus 250 basis points with a floor rate of 9.0%) Semi annually 22.11.2021 22.11.2026 10.53 - 5,459,537 - 5,459,537 -
Total floating interest rate subordinated debentures 7,530,123 2,070,522 7,530,123 2,070,522
Additional Tier I capital bondUnlisted, unsecured,
subordinated, perpetual capital bond (12 months TB (net) rate plus 150 basis points with a Floor rate of 9.5%) Annually 06.07.2020 N/A 9.50 9.50 5,226,898 5,226,897 5,226,898 5,226,897
Unlisted, unsecured, subordinated, perpetual capital bond (Weighted average 12 months TB (net) rate plus 150 basis points with a Floor rate of 9.0%) Annually 01.12.2020 N/A 9.00 9.00 10,076,290 10,071,279 10,076,290 10,071,279
Unlisted, unsecured, subordinated, perpetual capital bond (Weighted average 12 months TB (Net) rate plus 150 basis points with a Floor rate of 9.0%) Annually 06.07.2021 N/A 9.00 - 3,494,192 - 3,241,307 -
Total Additional Tier I capital bonds 18,797,380 15,298,176 18,544,495 15,298,176
Total subordinated debentures 64,358,855 64,637,407 64,105,970 64,627,397
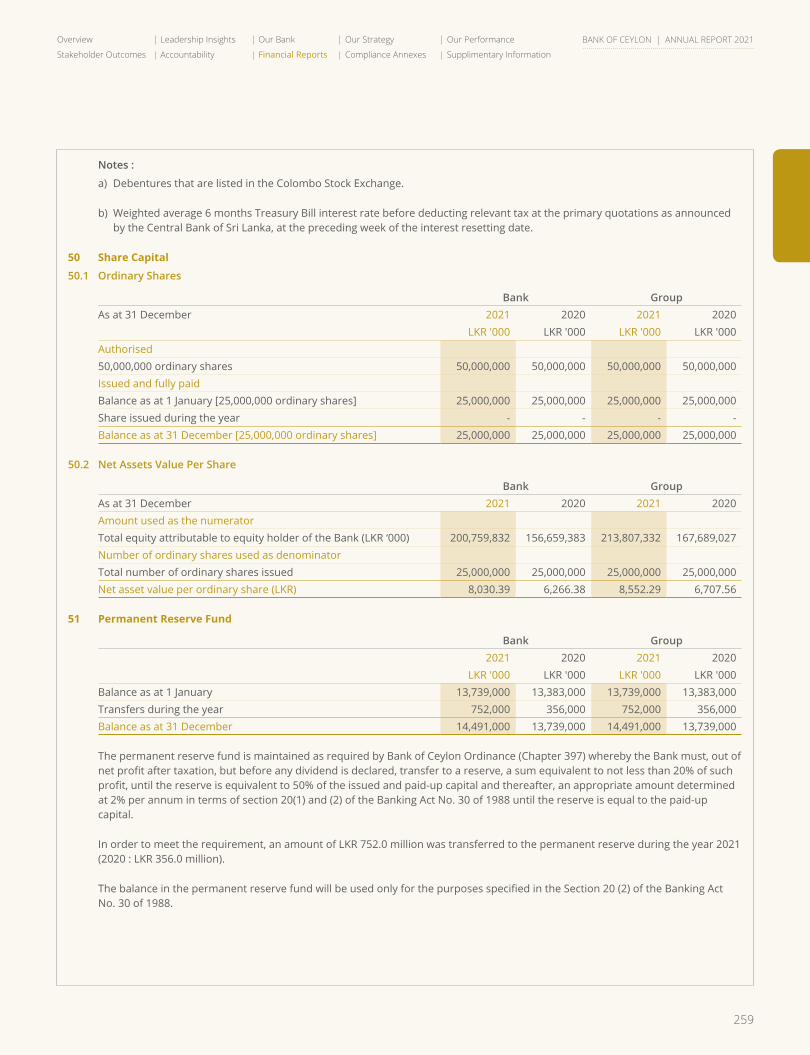
259
Overview Leadership Insights Our Bank Our Strategy Our Performance
Stakeholder Outcomes Accountability Financial Reports Compliance Annexes Supplimentary Information
BANK OF CEYLON | ANNUAL REPORT 2021
Notes :
a) Debentures that are listed in the Colombo Stock Exchange.
b) Weighted average 6 months Treasury Bill interest rate before deducting relevant tax at the primary quotations as announced by the Central Bank of Sri Lanka, at the preceding week of the interest resetting date.
50 Share Capital
50.1 Ordinary Shares
Bank GroupAs at 31 December 2021 2020 2021 2020
LKR '000 LKR '000 LKR '000 LKR '000Authorised 50,000,000 ordinary shares 50,000,000 50,000,000 50,000,000 50,000,000 Issued and fully paidBalance as at 1 January [25,000,000 ordinary shares] 25,000,000 25,000,000 25,000,000 25,000,000 Share issued during the year - - - - Balance as at 31 December [25,000,000 ordinary shares] 25,000,000 25,000,000 25,000,000 25,000,000
50.2 Net Assets Value Per Share
Bank GroupAs at 31 December 2021 2020 2021 2020Amount used as the numeratorTotal equity attributable to equity holder of the Bank (LKR ‘000) 200,759,832 156,659,383 213,807,332 167,689,027 Number of ordinary shares used as denominatorTotal number of ordinary shares issued 25,000,000 25,000,000 25,000,000 25,000,000 Net asset value per ordinary share (LKR) 8,030.39 6,266.38 8,552.29 6,707.56
51 Permanent Reserve Fund
Bank Group2021 2020 2021 2020
LKR '000 LKR '000 LKR '000 LKR '000Balance as at 1 January 13,739,000 13,383,000 13,739,000 13,383,000 Transfers during the year 752,000 356,000 752,000 356,000 Balance as at 31 December 14,491,000 13,739,000 14,491,000 13,739,000
The permanent reserve fund is maintained as required by Bank of Ceylon Ordinance (Chapter 397) whereby the Bank must, out of net profit after taxation, but before any dividend is declared, transfer to a reserve, a sum equivalent to not less than 20% of such profit, until the reserve is equivalent to 50% of the issued and paid-up capital and thereafter, an appropriate amount determined at 2% per annum in terms of section 20(1) and (2) of the Banking Act No. 30 of 1988 until the reserve is equal to the paid-up capital.
In order to meet the requirement, an amount of LKR 752.0 million was transferred to the permanent reserve during the year 2021 (2020 : LKR 356.0 million).
The balance in the permanent reserve fund will be used only for the purposes specified in the Section 20 (2) of the Banking Act No. 30 of 1988.
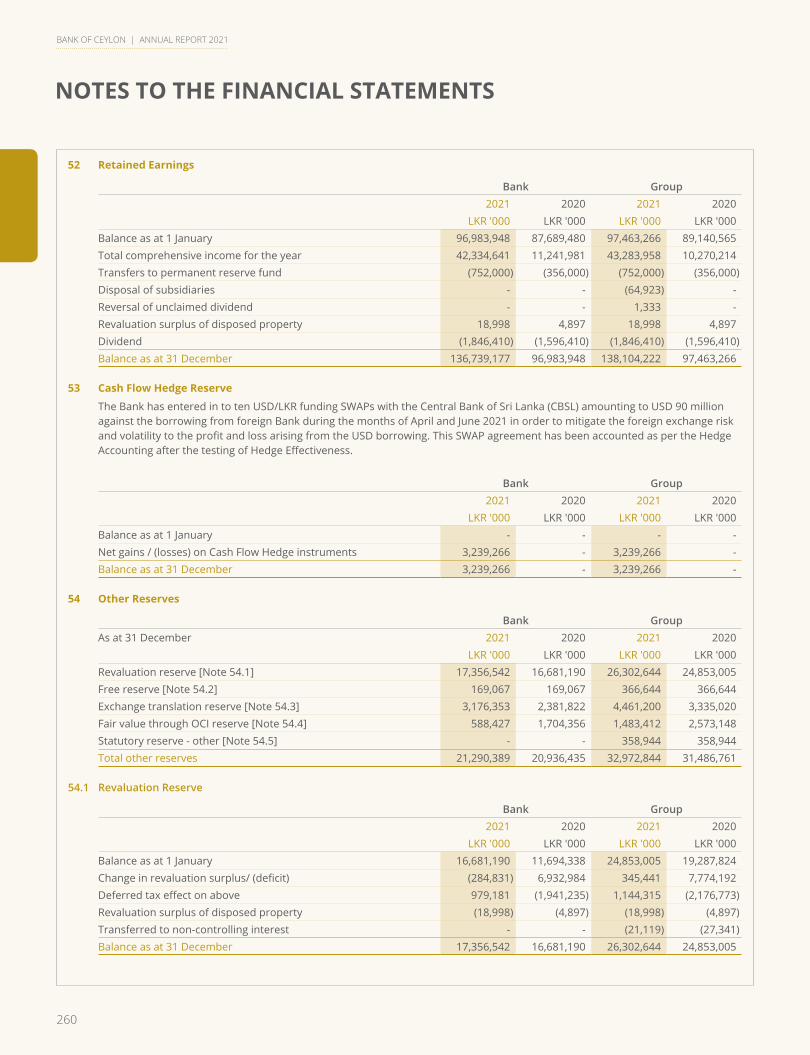
260
NOTES TO THE FINANCIAL STATEMENTS
BANK OF CEYLON | ANNUAL REPORT 2021
52 Retained Earnings
Bank Group2021 2020 2021 2020
LKR '000 LKR '000 LKR '000 LKR '000Balance as at 1 January 96,983,948 87,689,480 97,463,266 89,140,565 Total comprehensive income for the year 42,334,641 11,241,981 43,283,958 10,270,214 Transfers to permanent reserve fund (752,000) (356,000) (752,000) (356,000)Disposal of subsidiaries - - (64,923) - Reversal of unclaimed dividend - - 1,333 - Revaluation surplus of disposed property 18,998 4,897 18,998 4,897 Dividend (1,846,410) (1,596,410) (1,846,410) (1,596,410)Balance as at 31 December 136,739,177 96,983,948 138,104,222 97,463,266
53 Cash Flow Hedge Reserve
The Bank has entered in to ten USD/LKR funding SWAPs with the Central Bank of Sri Lanka (CBSL) amounting to USD 90 million against the borrowing from foreign Bank during the months of April and June 2021 in order to mitigate the foreign exchange risk and volatility to the profit and loss arising from the USD borrowing. This SWAP agreement has been accounted as per the Hedge Accounting after the testing of Hedge Effectiveness.
Bank Group2021 2020 2021 2020
LKR '000 LKR '000 LKR '000 LKR '000Balance as at 1 January - - - - Net gains / (losses) on Cash Flow Hedge instruments 3,239,266 - 3,239,266 - Balance as at 31 December 3,239,266 - 3,239,266 -
54 Other Reserves
Bank GroupAs at 31 December 2021 2020 2021 2020
LKR '000 LKR '000 LKR '000 LKR '000Revaluation reserve [Note 54.1] 17,356,542 16,681,190 26,302,644 24,853,005 Free reserve [Note 54.2] 169,067 169,067 366,644 366,644 Exchange translation reserve [Note 54.3] 3,176,353 2,381,822 4,461,200 3,335,020 Fair value through OCI reserve [Note 54.4] 588,427 1,704,356 1,483,412 2,573,148 Statutory reserve - other [Note 54.5] - - 358,944 358,944 Total other reserves 21,290,389 20,936,435 32,972,844 31,486,761
54.1 Revaluation Reserve
Bank Group2021 2020 2021 2020
LKR '000 LKR '000 LKR '000 LKR '000Balance as at 1 January 16,681,190 11,694,338 24,853,005 19,287,824 Change in revaluation surplus/ (deficit) (284,831) 6,932,984 345,441 7,774,192 Deferred tax effect on above 979,181 (1,941,235) 1,144,315 (2,176,773)Revaluation surplus of disposed property (18,998) (4,897) (18,998) (4,897)Transferred to non-controlling interest - - (21,119) (27,341)Balance as at 31 December 17,356,542 16,681,190 26,302,644 24,853,005
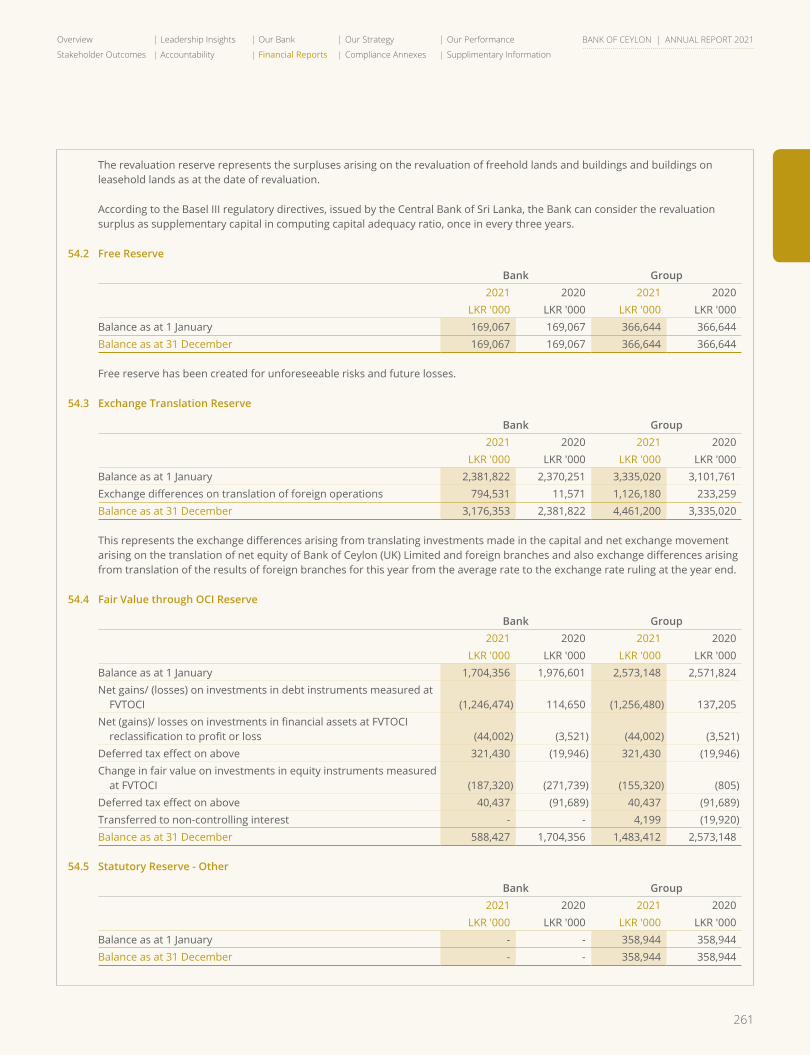
261
Overview Leadership Insights Our Bank Our Strategy Our Performance
Stakeholder Outcomes Accountability Financial Reports Compliance Annexes Supplimentary Information
BANK OF CEYLON | ANNUAL REPORT 2021
The revaluation reserve represents the surpluses arising on the revaluation of freehold lands and buildings and buildings on leasehold lands as at the date of revaluation.
According to the Basel III regulatory directives, issued by the Central Bank of Sri Lanka, the Bank can consider the revaluation surplus as supplementary capital in computing capital adequacy ratio, once in every three years.
54.2 Free Reserve
Bank Group2021 2020 2021 2020
LKR '000 LKR '000 LKR '000 LKR '000Balance as at 1 January 169,067 169,067 366,644 366,644 Balance as at 31 December 169,067 169,067 366,644 366,644
Free reserve has been created for unforeseeable risks and future losses.
54.3 Exchange Translation Reserve
Bank Group2021 2020 2021 2020
LKR '000 LKR '000 LKR '000 LKR '000Balance as at 1 January 2,381,822 2,370,251 3,335,020 3,101,761 Exchange differences on translation of foreign operations 794,531 11,571 1,126,180 233,259 Balance as at 31 December 3,176,353 2,381,822 4,461,200 3,335,020
This represents the exchange differences arising from translating investments made in the capital and net exchange movement arising on the translation of net equity of Bank of Ceylon (UK) Limited and foreign branches and also exchange differences arising from translation of the results of foreign branches for this year from the average rate to the exchange rate ruling at the year end.
54.4 Fair Value through OCI Reserve
Bank Group2021 2020 2021 2020
LKR '000 LKR '000 LKR '000 LKR '000Balance as at 1 January 1,704,356 1,976,601 2,573,148 2,571,824 Net gains/ (losses) on investments in debt instruments measured at
FVTOCI (1,246,474) 114,650 (1,256,480) 137,205 Net (gains)/ losses on investments in financial assets at FVTOCI
reclassification to profit or loss (44,002) (3,521) (44,002) (3,521)Deferred tax effect on above 321,430 (19,946) 321,430 (19,946)Change in fair value on investments in equity instruments measured
at FVTOCI (187,320) (271,739) (155,320) (805)Deferred tax effect on above 40,437 (91,689) 40,437 (91,689)Transferred to non-controlling interest - - 4,199 (19,920)Balance as at 31 December 588,427 1,704,356 1,483,412 2,573,148
54.5 Statutory Reserve - Other
Bank Group2021 2020 2021 2020
LKR '000 LKR '000 LKR '000 LKR '000Balance as at 1 January - - 358,944 358,944 Balance as at 31 December - - 358,944 358,944
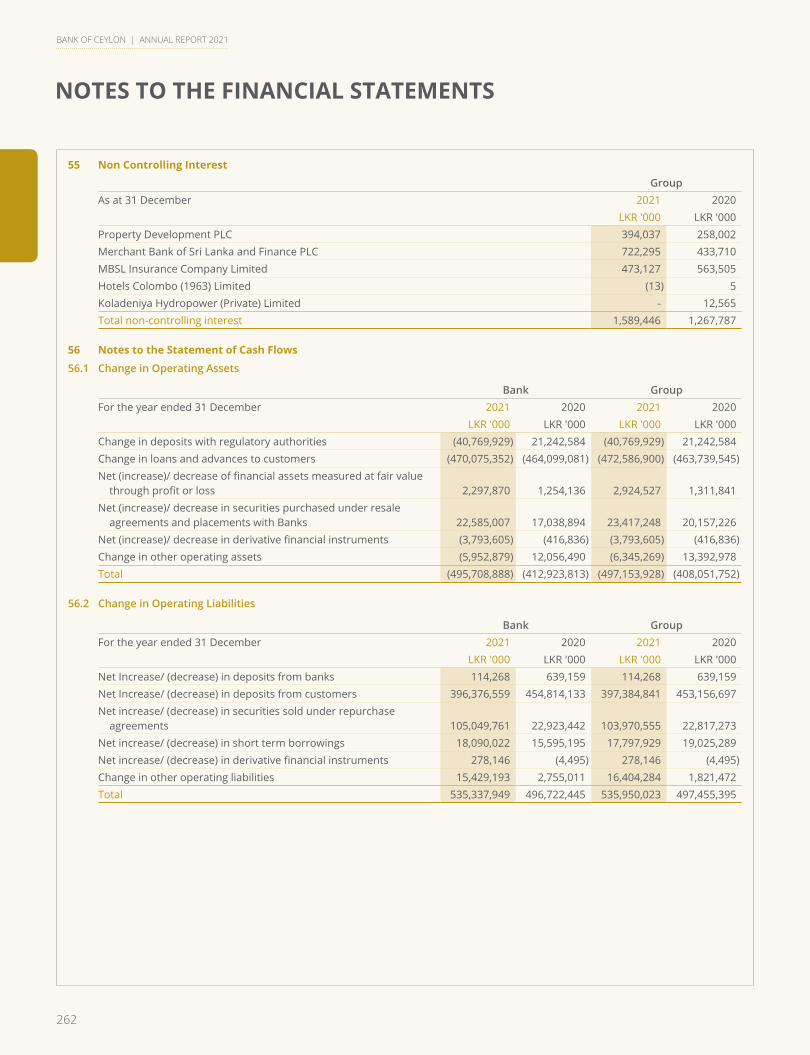
262
NOTES TO THE FINANCIAL STATEMENTS
BANK OF CEYLON | ANNUAL REPORT 2021
55 Non Controlling InterestGroup
As at 31 December 2021 2020LKR '000 LKR '000
Property Development PLC 394,037 258,002 Merchant Bank of Sri Lanka and Finance PLC 722,295 433,710 MBSL Insurance Company Limited 473,127 563,505 Hotels Colombo (1963) Limited (13) 5 Koladeniya Hydropower (Private) Limited - 12,565 Total non-controlling interest 1,589,446 1,267,787
56 Notes to the Statement of Cash Flows
56.1 Change in Operating Assets
Bank GroupFor the year ended 31 December 2021 2020 2021 2020
LKR '000 LKR '000 LKR '000 LKR '000Change in deposits with regulatory authorities (40,769,929) 21,242,584 (40,769,929) 21,242,584 Change in loans and advances to customers (470,075,352) (464,099,081) (472,586,900) (463,739,545)Net (increase)/ decrease of financial assets measured at fair value
through profit or loss 2,297,870 1,254,136 2,924,527 1,311,841 Net (increase)/ decrease in securities purchased under resale
agreements and placements with Banks 22,585,007 17,038,894 23,417,248 20,157,226 Net (increase)/ decrease in derivative financial instruments (3,793,605) (416,836) (3,793,605) (416,836)Change in other operating assets (5,952,879) 12,056,490 (6,345,269) 13,392,978 Total (495,708,888) (412,923,813) (497,153,928) (408,051,752)
56.2 Change in Operating Liabilities
Bank GroupFor the year ended 31 December 2021 2020 2021 2020
LKR '000 LKR '000 LKR '000 LKR '000Net Increase/ (decrease) in deposits from banks 114,268 639,159 114,268 639,159 Net Increase/ (decrease) in deposits from customers 396,376,559 454,814,133 397,384,841 453,156,697 Net increase/ (decrease) in securities sold under repurchase
agreements 105,049,761 22,923,442 103,970,555 22,817,273 Net increase/ (decrease) in short term borrowings 18,090,022 15,595,195 17,797,929 19,025,289 Net increase/ (decrease) in derivative financial instruments 278,146 (4,495) 278,146 (4,495)Change in other operating liabilities 15,429,193 2,755,011 16,404,284 1,821,472 Total 535,337,949 496,722,445 535,950,023 497,455,395

263
Overview Leadership Insights Our Bank Our Strategy Our Performance
Stakeholder Outcomes Accountability Financial Reports Compliance Annexes Supplimentary Information
BANK OF CEYLON | ANNUAL REPORT 2021
56.3 OtherNonCashItemsIncludedinProfitBeforeTax
Bank GroupFor the year ended 31 December 2021 2020 2021 2020
LKR '000 LKR '000 LKR '000 LKR '000(Gains) / Losses on revaluation of foreign exchange (4,529,610) (1,325,123) (4,529,610) (1,325,123)Contribution paid to defined benefit plans 2,927,193 1,116,293 2,991,611 1,194,127 Impairment charges 43,733,731 31,232,178 43,661,965 32,032,073 Depreciation of investment property 119,478 117,673 6,666 2,906 Depreciation of Property, Plant and Equipment 2,054,485 1,969,456 2,812,815 2,735,988 Amortisation of intangible assets and leasehold properties 1,972,293 2,167,399 1,420,152 1,652,258 Accrual for expenses and other non cash items 73,818 4,685,995 22,045 4,686,559 Total 46,351,388 39,963,871 46,385,644 40,978,788
57 Contingent Liabilities and Commitments
Contingent liabilities are possible obligations whose existence will be confirmed only by uncertain future events or present obligations where the transfer of economic benefit is not probable or cannot be readily measured as defined in the Sri Lanka Accounting Standard LKAS 37 - “Provisions, Contingent Liabilities and Contingent Assets”.
In the normal course of business, the Bank undertakes commitments and incurs contingent liabilities with legal recourse to its customers to accommodate the financial and investment needs of clients, to conduct trading activities and to manage its own exposure to risk. These consist of financial guarantees, letters of credit and other undrawn commitments to lend. Letters of credit and guarantees (including standby letters of credit) commit the Bank to make payments on behalf of customers in the event of a specific act, generally related to the import or export of goods. Guarantees and standby letters of credit carry a similar credit risk to loans. Operating lease commitments of the Bank (as a lessor and as a lessee) and pending legal claims against the Bank also form part of commitments of the Bank.
Contingent liabilities are not recognised in the Statement of Financial Position but are disclosed unless they are remote. These financial instruments generate interest or fees and carries elements of credit risk in excess of those amounts recognised as assets and liabilities in the Statement of Financial Position. However, no material losses are anticipated as a result of these transactions.
These commitments and contingencies are quantified below;
Bank GroupAs at 31 December 2021 2020 2021 2020
LKR '000 LKR '000 LKR '000 LKR '000Contingent liabilities [Note 57.1] 698,181,700 406,269,864 716,295,509 425,311,844 Undrawn and undisbursed facilities [Note 57.2] 164,240,074 178,855,060 164,356,319 179,151,389 Capital commitments [Note 57.3.2] 12,481,176 10,339,328 12,550,785 10,431,080 Lease commitments [Note 57.4] 4,453,525 4,746,435 4,568,883 4,775,574 Total contingent liabilities and commitments 879,356,475 600,210,687 897,771,496 619,669,887

264
NOTES TO THE FINANCIAL STATEMENTS
BANK OF CEYLON | ANNUAL REPORT 2021
57.1 Contingent Liabilities
Bank GroupAs at 31 December 2021 2020 2021 2020
LKR '000 LKR '000 LKR '000 LKR '000Acceptances and documentary credit 274,415,072 188,518,672 274,922,936 188,586,174 Bills for collection 29,141,466 20,100,204 29,141,466 20,100,204 Forward exchange contracts 126,597,458 45,012,605 126,597,458 45,012,605 Guarantees 157,348,930 124,846,871 157,507,429 125,046,318 Other commitments [Note 57.1.1] 110,678,774 27,791,512 128,126,220 46,566,543 Total contingent liabilities 698,181,700 406,269,864 716,295,509 425,311,844
57.1.1 Other Commitments
Bank GroupAs at 31 December 2021 2020 2021 2020
LKR '000 LKR '000 LKR '000 LKR '000Sale commitment of securities for secondary market - 2,013,532 - 2,013,532Purchase commitment of securities for secondary market - 1,482,003 - 1,482,003Purchase commitment of securities for primary market - 430,831 - 430,831Forward Exchange contract with Financial institutions 126,407 56,155 126,407 56,155 Currency Swaps 110,552,367 23,808,991 127,390,596 41,841,069 Other commitments - - 609,217 742,953 Total other commitments 110,678,774 27,791,512 128,126,220 46,566,543
57.2 Undrawn and Undisbursed Facilities
The unutilised value of irrevocable commitments, which cannot be withdrawn at the discretion of the Bank, without risk of incurring significant penalties or expenses are as follows:
Bank GroupAs at 31 December 2021 2020 2021 2020
LKR '000 LKR '000 LKR '000 LKR '000Undisbursed amount of loans 78,782,172 55,613,906 78,782,185 55,817,390 Undrawn limits of overdrafts 62,093,293 75,989,563 62,209,524 76,082,407 Undrawn limits of credit cards 10,795,829 10,411,203 10,795,829 10,411,203 Undrawn limits of letters of credit 6,757,030 17,819,300 6,757,030 17,819,300 Undrawn limits of letters of guarantee 5,811,750 19,021,088 5,811,751 19,021,089 Total undrawn and undisbursed facilities 164,240,074 178,855,060 164,356,319 179,151,389
57.3 Capital Commitments
Capital expenditure approved by the Directors, for which, no provision has been made in the Financial Statements, amounts to;
57.3.1 Capital Commitments in Relation to Property, Plant and Equipment
Bank GroupAs at 31 December 2021 2020 2021 2020
LKR '000 LKR '000 LKR '000 LKR '000Approved and contracted for 3,998,733 5,319,067 4,059,060 5,410,819 Approved but not contracted for 6,507,422 3,516,127 6,512,004 3,516,127 Total capital commitments in relation to Property, Plant and
Equipment 10,506,155 8,835,194 10,571,064 8,926,946
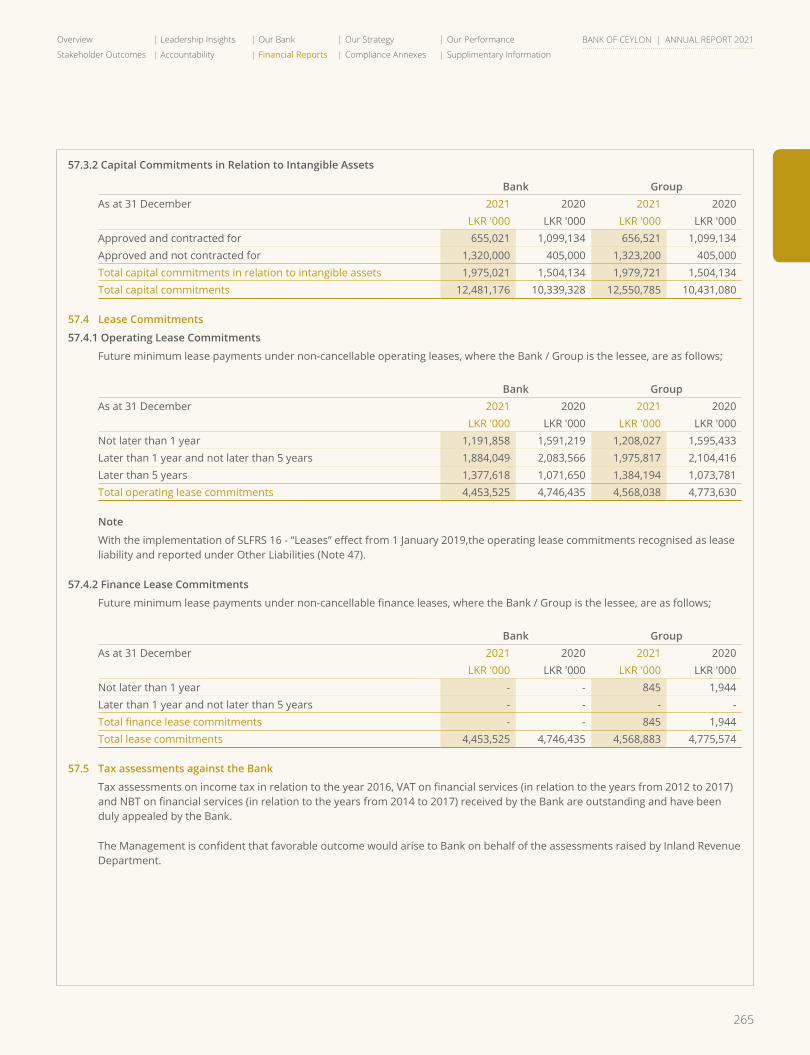
265
Overview Leadership Insights Our Bank Our Strategy Our Performance
Stakeholder Outcomes Accountability Financial Reports Compliance Annexes Supplimentary Information
BANK OF CEYLON | ANNUAL REPORT 2021
57.3.2 Capital Commitments in Relation to Intangible Assets
Bank GroupAs at 31 December 2021 2020 2021 2020
LKR '000 LKR '000 LKR '000 LKR '000Approved and contracted for 655,021 1,099,134 656,521 1,099,134 Approved and not contracted for 1,320,000 405,000 1,323,200 405,000 Total capital commitments in relation to intangible assets 1,975,021 1,504,134 1,979,721 1,504,134 Total capital commitments 12,481,176 10,339,328 12,550,785 10,431,080
57.4 Lease Commitments
57.4.1 Operating Lease Commitments
Future minimum lease payments under non-cancellable operating leases, where the Bank / Group is the lessee, are as follows;
Bank GroupAs at 31 December 2021 2020 2021 2020
LKR '000 LKR '000 LKR '000 LKR '000Not later than 1 year 1,191,858 1,591,219 1,208,027 1,595,433 Later than 1 year and not later than 5 years 1,884,049 2,083,566 1,975,817 2,104,416 Later than 5 years 1,377,618 1,071,650 1,384,194 1,073,781 Total operating lease commitments 4,453,525 4,746,435 4,568,038 4,773,630
Note
With the implementation of SLFRS 16 - “Leases” effect from 1 January 2019,the operating lease commitments recognised as lease liability and reported under Other Liabilities (Note 47).
57.4.2 Finance Lease Commitments
Future minimum lease payments under non-cancellable finance leases, where the Bank / Group is the lessee, are as follows;
Bank GroupAs at 31 December 2021 2020 2021 2020
LKR '000 LKR '000 LKR '000 LKR '000Not later than 1 year - - 845 1,944 Later than 1 year and not later than 5 years - - - - Total finance lease commitments - - 845 1,944 Total lease commitments 4,453,525 4,746,435 4,568,883 4,775,574
57.5 Tax assessments against the Bank
Tax assessments on income tax in relation to the year 2016, VAT on financial services (in relation to the years from 2012 to 2017) and NBT on financial services (in relation to the years from 2014 to 2017) received by the Bank are outstanding and have been duly appealed by the Bank.
The Management is confident that favorable outcome would arise to Bank on behalf of the assessments raised by Inland Revenue Department.
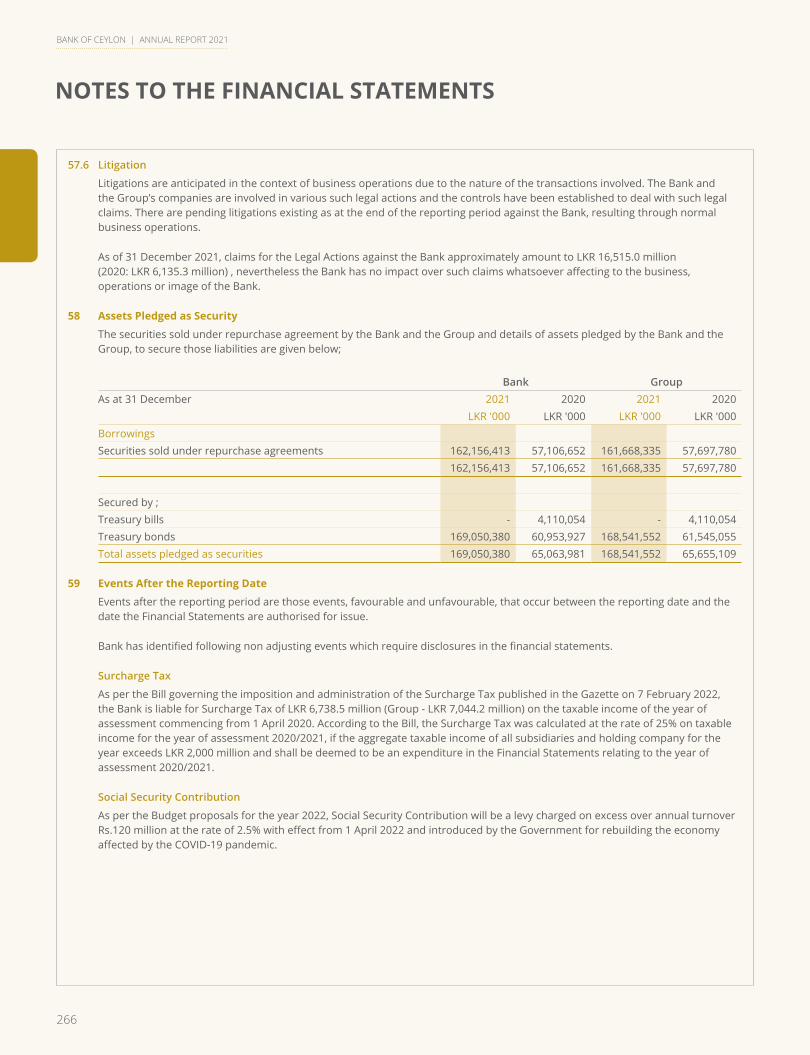
266
NOTES TO THE FINANCIAL STATEMENTS
BANK OF CEYLON | ANNUAL REPORT 2021
57.6 Litigation
Litigations are anticipated in the context of business operations due to the nature of the transactions involved. The Bank and the Group’s companies are involved in various such legal actions and the controls have been established to deal with such legal claims. There are pending litigations existing as at the end of the reporting period against the Bank, resulting through normal business operations.
As of 31 December 2021, claims for the Legal Actions against the Bank approximately amount to LKR 16,515.0 million (2020: LKR 6,135.3 million) , nevertheless the Bank has no impact over such claims whatsoever affecting to the business, operations or image of the Bank.
58 Assets Pledged as Security
The securities sold under repurchase agreement by the Bank and the Group and details of assets pledged by the Bank and the Group, to secure those liabilities are given below;
Bank GroupAs at 31 December 2021 2020 2021 2020
LKR '000 LKR '000 LKR '000 LKR '000BorrowingsSecurities sold under repurchase agreements 162,156,413 57,106,652 161,668,335 57,697,780
162,156,413 57,106,652 161,668,335 57,697,780
Secured by ;Treasury bills - 4,110,054 - 4,110,054 Treasury bonds 169,050,380 60,953,927 168,541,552 61,545,055 Total assets pledged as securities 169,050,380 65,063,981 168,541,552 65,655,109
59 Events After the Reporting Date
Events after the reporting period are those events, favourable and unfavourable, that occur between the reporting date and the date the Financial Statements are authorised for issue.
Bank has identified following non adjusting events which require disclosures in the financial statements.
Surcharge Tax
As per the Bill governing the imposition and administration of the Surcharge Tax published in the Gazette on 7 February 2022, the Bank is liable for Surcharge Tax of LKR 6,738.5 million (Group - LKR 7,044.2 million) on the taxable income of the year of assessment commencing from 1 April 2020. According to the Bill, the Surcharge Tax was calculated at the rate of 25% on taxable income for the year of assessment 2020/2021, if the aggregate taxable income of all subsidiaries and holding company for the year exceeds LKR 2,000 million and shall be deemed to be an expenditure in the Financial Statements relating to the year of assessment 2020/2021.
Social Security Contribution
As per the Budget proposals for the year 2022, Social Security Contribution will be a levy charged on excess over annual turnover Rs.120 million at the rate of 2.5% with effect from 1 April 2022 and introduced by the Government for rebuilding the economy affected by the COVID-19 pandemic.
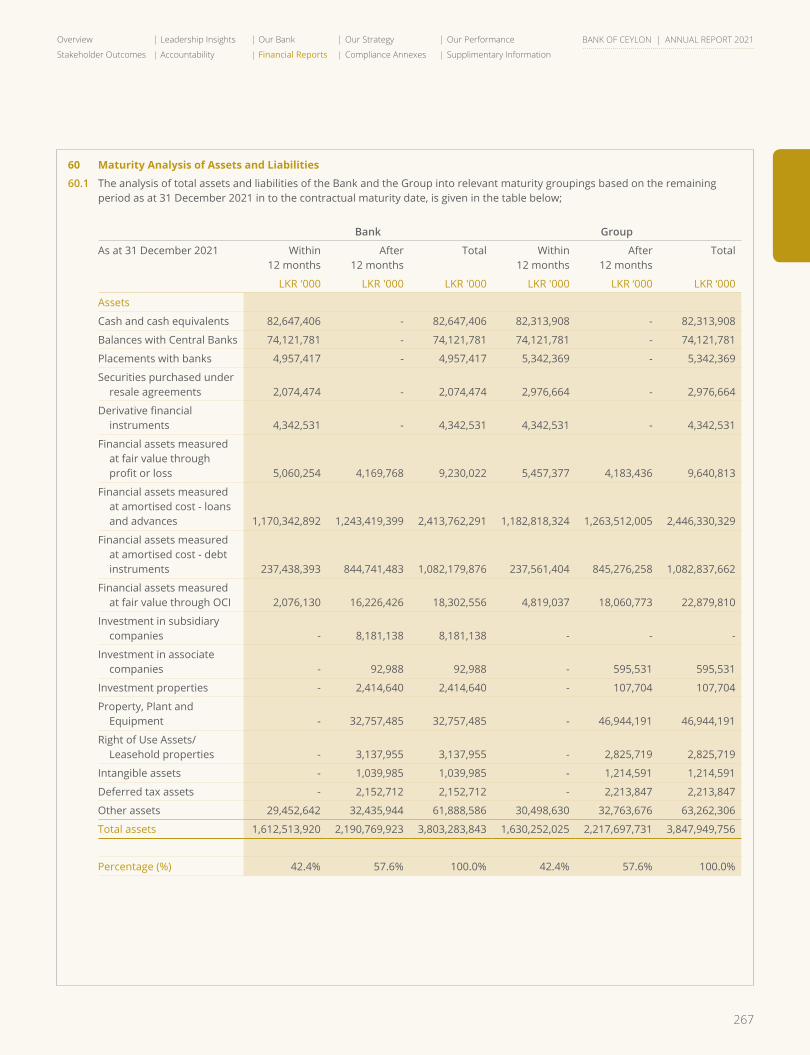
267
Overview Leadership Insights Our Bank Our Strategy Our Performance
Stakeholder Outcomes Accountability Financial Reports Compliance Annexes Supplimentary Information
BANK OF CEYLON | ANNUAL REPORT 2021
60 Maturity Analysis of Assets and Liabilities
60.1 The analysis of total assets and liabilities of the Bank and the Group into relevant maturity groupings based on the remaining period as at 31 December 2021 in to the contractual maturity date, is given in the table below;
Bank Group
As at 31 December 2021 Within12 months
After12 months
Total Within12 months
After12 months
Total
LKR '000 LKR '000 LKR '000 LKR '000 LKR ‘000 LKR ‘000
Assets
Cash and cash equivalents 82,647,406 - 82,647,406 82,313,908 - 82,313,908
Balances with Central Banks 74,121,781 - 74,121,781 74,121,781 - 74,121,781
Placements with banks 4,957,417 - 4,957,417 5,342,369 - 5,342,369
Securities purchased under resale agreements 2,074,474 - 2,074,474 2,976,664 - 2,976,664
Derivative financial instruments 4,342,531 - 4,342,531 4,342,531 - 4,342,531
Financial assets measured at fair value through profit or loss 5,060,254 4,169,768 9,230,022 5,457,377 4,183,436 9,640,813
Financial assets measured at amortised cost - loans and advances 1,170,342,892 1,243,419,399 2,413,762,291 1,182,818,324 1,263,512,005 2,446,330,329
Financial assets measured at amortised cost - debt instruments 237,438,393 844,741,483 1,082,179,876 237,561,404 845,276,258 1,082,837,662
Financial assets measured at fair value through OCI 2,076,130 16,226,426 18,302,556 4,819,037 18,060,773 22,879,810
Investment in subsidiary companies - 8,181,138 8,181,138 - - -
Investment in associate companies - 92,988 92,988 - 595,531 595,531
Investment properties - 2,414,640 2,414,640 - 107,704 107,704
Property, Plant and Equipment - 32,757,485 32,757,485 - 46,944,191 46,944,191
Right of Use Assets/ Leasehold properties - 3,137,955 3,137,955 - 2,825,719 2,825,719
Intangible assets - 1,039,985 1,039,985 - 1,214,591 1,214,591
Deferred tax assets - 2,152,712 2,152,712 - 2,213,847 2,213,847
Other assets 29,452,642 32,435,944 61,888,586 30,498,630 32,763,676 63,262,306
Total assets 1,612,513,920 2,190,769,923 3,803,283,843 1,630,252,025 2,217,697,731 3,847,949,756
Percentage (%) 42.4% 57.6% 100.0% 42.4% 57.6% 100.0%
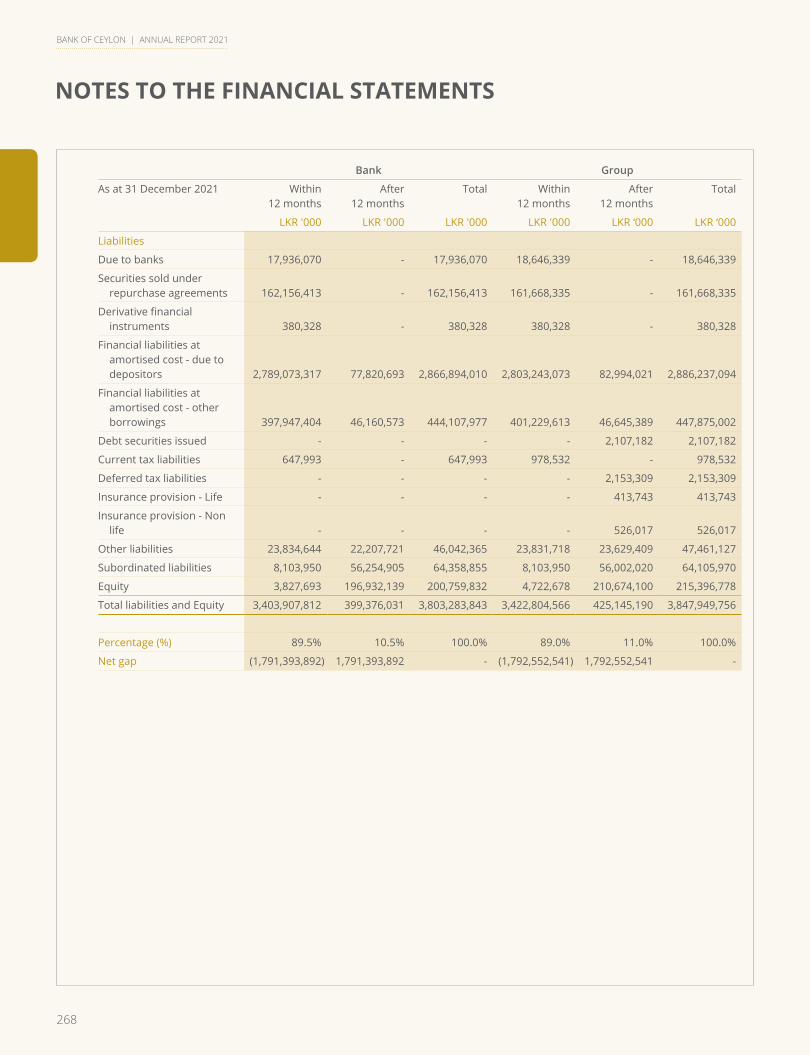
268
NOTES TO THE FINANCIAL STATEMENTS
BANK OF CEYLON | ANNUAL REPORT 2021
Bank Group
As at 31 December 2021 Within12 months
After12 months
Total Within12 months
After12 months
Total
LKR '000 LKR '000 LKR '000 LKR '000 LKR ‘000 LKR ‘000
Liabilities
Due to banks 17,936,070 - 17,936,070 18,646,339 - 18,646,339
Securities sold under repurchase agreements 162,156,413 - 162,156,413 161,668,335 - 161,668,335
Derivative financial instruments 380,328 - 380,328 380,328 - 380,328
Financial liabilities at amortised cost - due to depositors 2,789,073,317 77,820,693 2,866,894,010 2,803,243,073 82,994,021 2,886,237,094
Financial liabilities at amortised cost - other borrowings 397,947,404 46,160,573 444,107,977 401,229,613 46,645,389 447,875,002
Debt securities issued - - - - 2,107,182 2,107,182
Current tax liabilities 647,993 - 647,993 978,532 - 978,532
Deferred tax liabilities - - - - 2,153,309 2,153,309
Insurance provision - Life - - - - 413,743 413,743
Insurance provision - Non life - - - - 526,017 526,017
Other liabilities 23,834,644 22,207,721 46,042,365 23,831,718 23,629,409 47,461,127
Subordinated liabilities 8,103,950 56,254,905 64,358,855 8,103,950 56,002,020 64,105,970
Equity 3,827,693 196,932,139 200,759,832 4,722,678 210,674,100 215,396,778
Total liabilities and Equity 3,403,907,812 399,376,031 3,803,283,843 3,422,804,566 425,145,190 3,847,949,756
Percentage (%) 89.5% 10.5% 100.0% 89.0% 11.0% 100.0%
Net gap (1,791,393,892) 1,791,393,892 - (1,792,552,541) 1,792,552,541 -
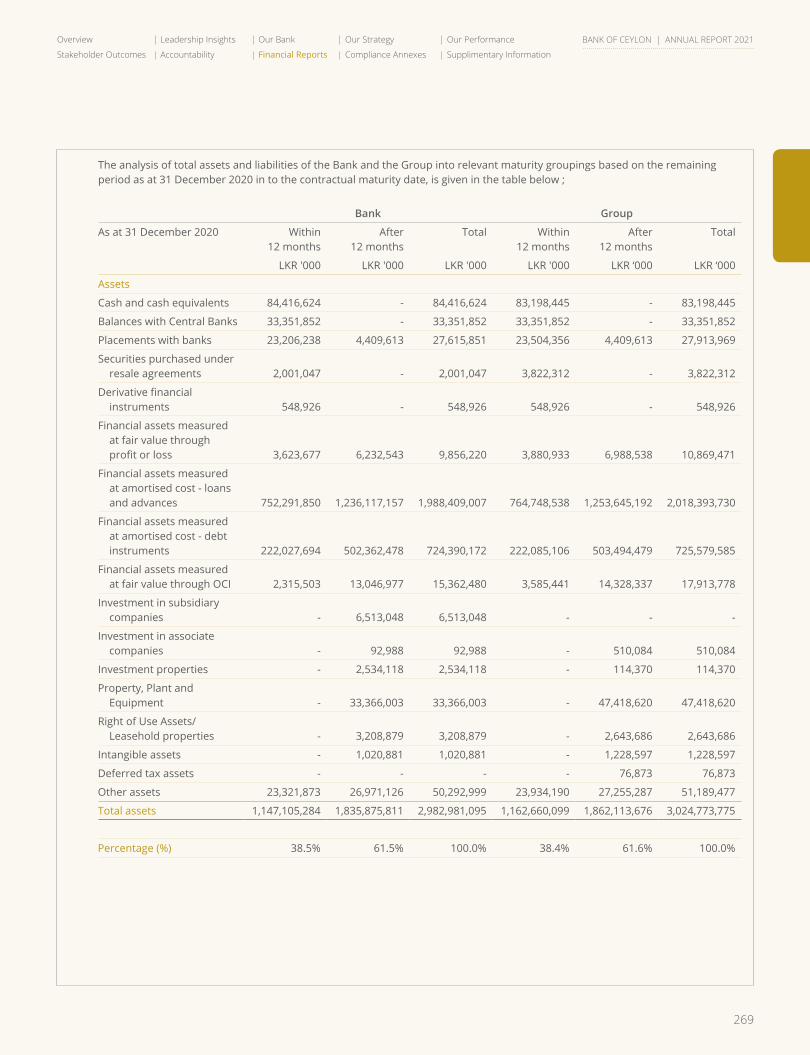
269
Overview Leadership Insights Our Bank Our Strategy Our Performance
Stakeholder Outcomes Accountability Financial Reports Compliance Annexes Supplimentary Information
BANK OF CEYLON | ANNUAL REPORT 2021
The analysis of total assets and liabilities of the Bank and the Group into relevant maturity groupings based on the remaining period as at 31 December 2020 in to the contractual maturity date, is given in the table below ;
Bank Group
As at 31 December 2020 Within12 months
After12 months
Total Within12 months
After12 months
Total
LKR '000 LKR '000 LKR '000 LKR '000 LKR ‘000 LKR ‘000
Assets
Cash and cash equivalents 84,416,624 - 84,416,624 83,198,445 - 83,198,445
Balances with Central Banks 33,351,852 - 33,351,852 33,351,852 - 33,351,852
Placements with banks 23,206,238 4,409,613 27,615,851 23,504,356 4,409,613 27,913,969
Securities purchased under resale agreements 2,001,047 - 2,001,047 3,822,312 - 3,822,312
Derivative financial instruments 548,926 - 548,926 548,926 - 548,926
Financial assets measured at fair value through profit or loss 3,623,677 6,232,543 9,856,220 3,880,933 6,988,538 10,869,471
Financial assets measured at amortised cost - loans and advances 752,291,850 1,236,117,157 1,988,409,007 764,748,538 1,253,645,192 2,018,393,730
Financial assets measured at amortised cost - debt instruments 222,027,694 502,362,478 724,390,172 222,085,106 503,494,479 725,579,585
Financial assets measured at fair value through OCI 2,315,503 13,046,977 15,362,480 3,585,441 14,328,337 17,913,778
Investment in subsidiary companies - 6,513,048 6,513,048 - - -
Investment in associate companies - 92,988 92,988 - 510,084 510,084
Investment properties - 2,534,118 2,534,118 - 114,370 114,370
Property, Plant and Equipment - 33,366,003 33,366,003 - 47,418,620 47,418,620
Right of Use Assets/ Leasehold properties - 3,208,879 3,208,879 - 2,643,686 2,643,686
Intangible assets - 1,020,881 1,020,881 - 1,228,597 1,228,597
Deferred tax assets - - - - 76,873 76,873
Other assets 23,321,873 26,971,126 50,292,999 23,934,190 27,255,287 51,189,477
Total assets 1,147,105,284 1,835,875,811 2,982,981,095 1,162,660,099 1,862,113,676 3,024,773,775
Percentage (%) 38.5% 61.5% 100.0% 38.4% 61.6% 100.0%
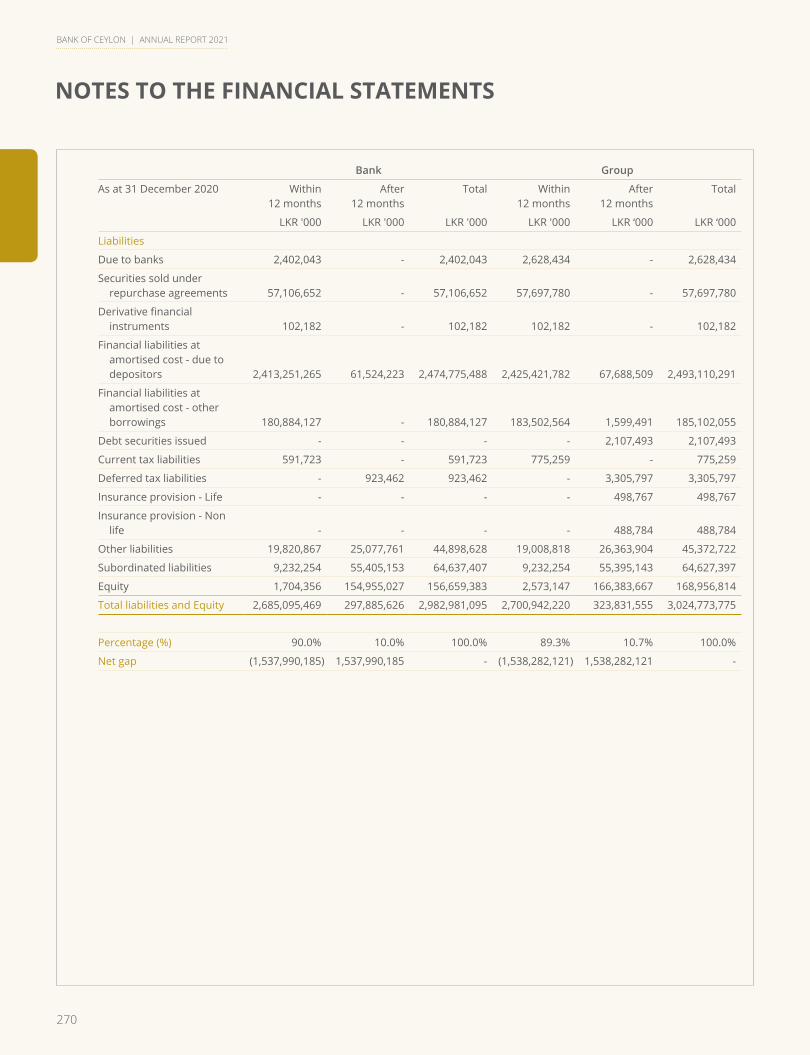
270
NOTES TO THE FINANCIAL STATEMENTS
BANK OF CEYLON | ANNUAL REPORT 2021
Bank Group
As at 31 December 2020 Within12 months
After12 months
Total Within12 months
After12 months
Total
LKR '000 LKR '000 LKR '000 LKR '000 LKR ‘000 LKR ‘000
Liabilities
Due to banks 2,402,043 - 2,402,043 2,628,434 - 2,628,434
Securities sold under repurchase agreements 57,106,652 - 57,106,652 57,697,780 - 57,697,780
Derivative financial instruments 102,182 - 102,182 102,182 - 102,182
Financial liabilities at amortised cost - due to depositors 2,413,251,265 61,524,223 2,474,775,488 2,425,421,782 67,688,509 2,493,110,291
Financial liabilities at amortised cost - other borrowings 180,884,127 - 180,884,127 183,502,564 1,599,491 185,102,055
Debt securities issued - - - - 2,107,493 2,107,493
Current tax liabilities 591,723 - 591,723 775,259 - 775,259
Deferred tax liabilities - 923,462 923,462 - 3,305,797 3,305,797
Insurance provision - Life - - - - 498,767 498,767
Insurance provision - Non life - - - - 488,784 488,784
Other liabilities 19,820,867 25,077,761 44,898,628 19,008,818 26,363,904 45,372,722
Subordinated liabilities 9,232,254 55,405,153 64,637,407 9,232,254 55,395,143 64,627,397
Equity 1,704,356 154,955,027 156,659,383 2,573,147 166,383,667 168,956,814
Total liabilities and Equity 2,685,095,469 297,885,626 2,982,981,095 2,700,942,220 323,831,555 3,024,773,775
Percentage (%) 90.0% 10.0% 100.0% 89.3% 10.7% 100.0%
Net gap (1,537,990,185) 1,537,990,185 - (1,538,282,121) 1,538,282,121 -
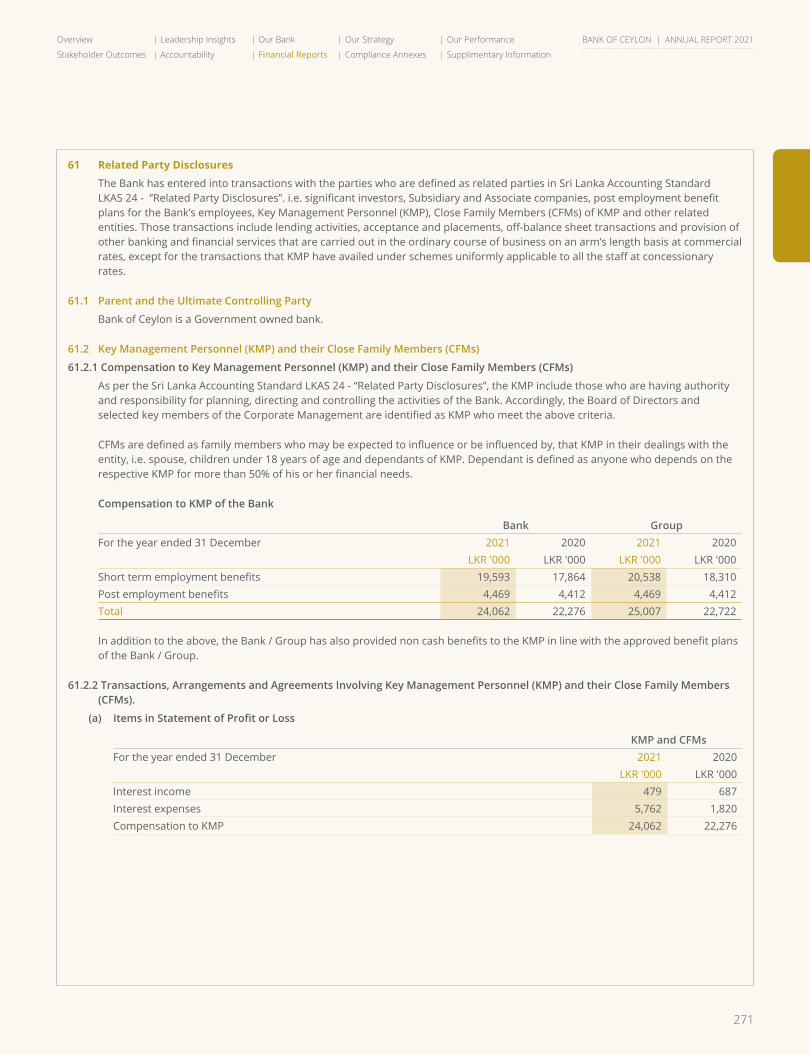
271
Overview Leadership Insights Our Bank Our Strategy Our Performance
Stakeholder Outcomes Accountability Financial Reports Compliance Annexes Supplimentary Information
BANK OF CEYLON | ANNUAL REPORT 2021
61 Related Party Disclosures
The Bank has entered into transactions with the parties who are defined as related parties in Sri Lanka Accounting Standard LKAS 24 - ”Related Party Disclosures”. i.e. significant investors, Subsidiary and Associate companies, post employment benefit plans for the Bank’s employees, Key Management Personnel (KMP), Close Family Members (CFMs) of KMP and other related entities. Those transactions include lending activities, acceptance and placements, off-balance sheet transactions and provision of other banking and financial services that are carried out in the ordinary course of business on an arm’s length basis at commercial rates, except for the transactions that KMP have availed under schemes uniformly applicable to all the staff at concessionary rates.
61.1 Parent and the Ultimate Controlling Party
Bank of Ceylon is a Government owned bank.
61.2 Key Management Personnel (KMP) and their Close Family Members (CFMs)
61.2.1 Compensation to Key Management Personnel (KMP) and their Close Family Members (CFMs)
As per the Sri Lanka Accounting Standard LKAS 24 - “Related Party Disclosures”, the KMP include those who are having authority and responsibility for planning, directing and controlling the activities of the Bank. Accordingly, the Board of Directors and selected key members of the Corporate Management are identified as KMP who meet the above criteria.
CFMs are defined as family members who may be expected to influence or be influenced by, that KMP in their dealings with the entity, i.e. spouse, children under 18 years of age and dependants of KMP. Dependant is defined as anyone who depends on the respective KMP for more than 50% of his or her financial needs.
Compensation to KMP of the Bank
Bank GroupFor the year ended 31 December 2021 2020 2021 2020
LKR '000 LKR '000 LKR '000 LKR '000Short term employment benefits 19,593 17,864 20,538 18,310 Post employment benefits 4,469 4,412 4,469 4,412 Total 24,062 22,276 25,007 22,722
In addition to the above, the Bank / Group has also provided non cash benefits to the KMP in line with the approved benefit plans of the Bank / Group.
61.2.2 Transactions, Arrangements and Agreements Involving Key Management Personnel (KMP) and their Close Family Members (CFMs).
(a) ItemsinStatementofProfitorLoss
KMP and CFMsFor the year ended 31 December 2021 2020
LKR '000 LKR '000Interest income 479 687Interest expenses 5,762 1,820Compensation to KMP 24,062 22,276
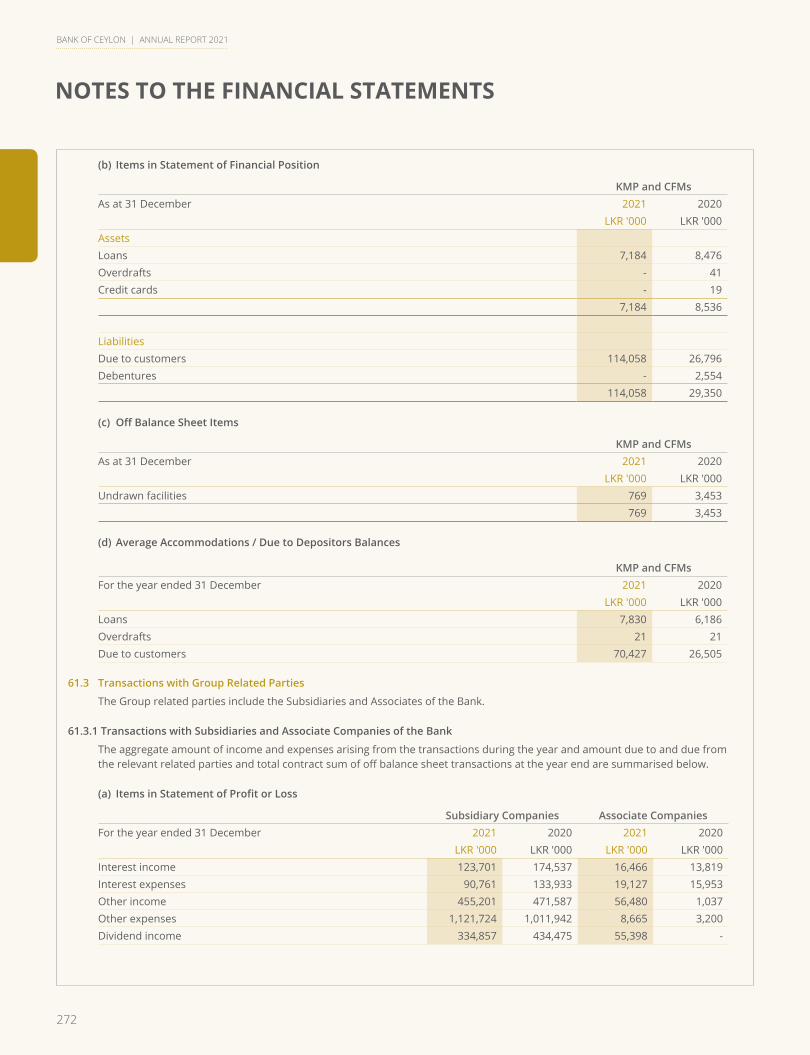
272
NOTES TO THE FINANCIAL STATEMENTS
BANK OF CEYLON | ANNUAL REPORT 2021
(b) Items in Statement of Financial Position
KMP and CFMsAs at 31 December 2021 2020
LKR '000 LKR '000AssetsLoans 7,184 8,476 Overdrafts - 41 Credit cards - 19
7,184 8,536
LiabilitiesDue to customers 114,058 26,796 Debentures - 2,554
114,058 29,350
(c) OffBalanceSheetItems
KMP and CFMsAs at 31 December 2021 2020
LKR '000 LKR '000Undrawn facilities 769 3,453
769 3,453
(d) Average Accommodations / Due to Depositors Balances
KMP and CFMsFor the year ended 31 December 2021 2020
LKR '000 LKR '000Loans 7,830 6,186 Overdrafts 21 21 Due to customers 70,427 26,505
61.3 Transactions with Group Related Parties
The Group related parties include the Subsidiaries and Associates of the Bank.
61.3.1 Transactions with Subsidiaries and Associate Companies of the Bank
The aggregate amount of income and expenses arising from the transactions during the year and amount due to and due from the relevant related parties and total contract sum of off balance sheet transactions at the year end are summarised below.
(a) ItemsinStatementofProfitorLoss
Subsidiary Companies Associate CompaniesFor the year ended 31 December 2021 2020 2021 2020
LKR '000 LKR '000 LKR '000 LKR '000Interest income 123,701 174,537 16,466 13,819 Interest expenses 90,761 133,933 19,127 15,953 Other income 455,201 471,587 56,480 1,037 Other expenses 1,121,724 1,011,942 8,665 3,200 Dividend income 334,857 434,475 55,398 -
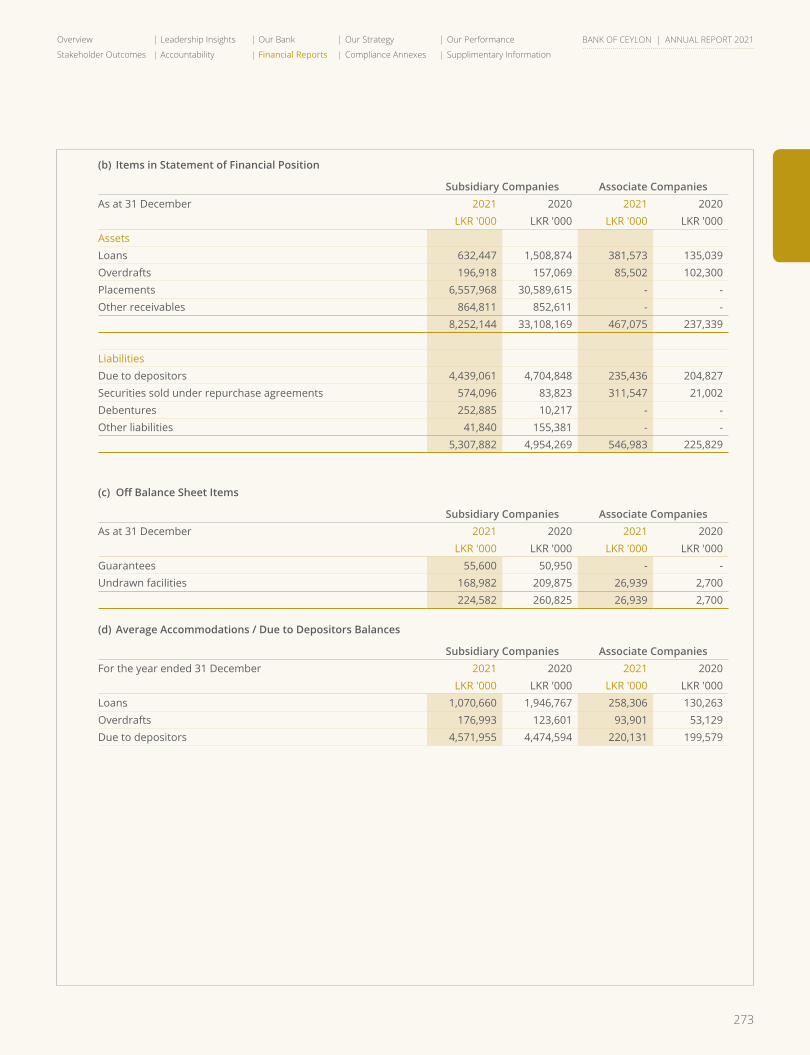
273
Overview Leadership Insights Our Bank Our Strategy Our Performance
Stakeholder Outcomes Accountability Financial Reports Compliance Annexes Supplimentary Information
BANK OF CEYLON | ANNUAL REPORT 2021
(b) Items in Statement of Financial Position
Subsidiary Companies Associate CompaniesAs at 31 December 2021 2020 2021 2020
LKR '000 LKR '000 LKR '000 LKR '000AssetsLoans 632,447 1,508,874 381,573 135,039 Overdrafts 196,918 157,069 85,502 102,300 Placements 6,557,968 30,589,615 - - Other receivables 864,811 852,611 - -
8,252,144 33,108,169 467,075 237,339
LiabilitiesDue to depositors 4,439,061 4,704,848 235,436 204,827 Securities sold under repurchase agreements 574,096 83,823 311,547 21,002 Debentures 252,885 10,217 - - Other liabilities 41,840 155,381 - -
5,307,882 4,954,269 546,983 225,829
(c) OffBalanceSheetItems
Subsidiary Companies Associate CompaniesAs at 31 December 2021 2020 2021 2020
LKR '000 LKR '000 LKR '000 LKR '000Guarantees 55,600 50,950 - - Undrawn facilities 168,982 209,875 26,939 2,700
224,582 260,825 26,939 2,700
(d) Average Accommodations / Due to Depositors Balances
Subsidiary Companies Associate CompaniesFor the year ended 31 December 2021 2020 2021 2020
LKR '000 LKR '000 LKR '000 LKR '000Loans 1,070,660 1,946,767 258,306 130,263 Overdrafts 176,993 123,601 93,901 53,129 Due to depositors 4,571,955 4,474,594 220,131 199,579

274
NOTES TO THE FINANCIAL STATEMENTS
BANK OF CEYLON | ANNUAL REPORT 2021
61.3.2 Transactions with Subsidiaries and Associate Companies of the Group
In addition to the transactions between the Bank and its Subsidiaries and Associate companies, transactions which were taken place between the Subsidiaries and Associate companies are also included in the section below;
(a)ItemsinStatementofProfitorLoss
Subsidiary Companies Associate CompaniesFor the year ended 31 December 2021 2020 2021 2020
LKR '000 LKR '000 LKR '000 LKR '000Interest income 144,562 175,402 16,466 13,819 Interest expense 90,761 133,933 19,127 15,953 Other income 912,538 986,665 58,427 2,103 Other expenses 1,601,287 1,528,411 9,247 3,740
(b) Items in Statement of Financial Position
Subsidiary Companies Associate CompaniesAs at 31 December 2021 2020 2021 2020
LKR '000 LKR '000 LKR '000 LKR '000AssetsLoans 864,850 1,810,677 381,573 145,104 Overdrafts 196,918 157,069 85,502 102,300 Investments in debts and Government securities - - - - Placements 6,557,968 30,589,615 - - Other receivables 866,394 853,264 - -
8,486,130 33,410,625 467,075 247,404
LiabilitiesDue to depositors 4,499,386 4,775,239 235,436 204,827 Securities sold under repurchase agreements 574,096 83,823 311,547 21,002 Debentures 252,885 10,217 - - Other liabilities 215,347 396,991 154 520
5,541,714 5,266,270 547,137 226,349
(c) OffBalanceSheetItems
Subsidiary Companies Associate CompaniesAs at 31 December 2021 2020 2021 2020
LKR '000 LKR '000 LKR '000 LKR '000Guarantees 55,600 50,950 - - Undrawn facilities 168,982 209,875 26,939 2,700
224,582 260,825 26,939 2,700
(d) Average Accommodations / Due to Depositors Balances
Subsidiary Companies Associate CompaniesFor the year ended 31 December 2021 2020 2021 2020
LKR '000 LKR '000 LKR '000 LKR '000Loans 1,337,763 2,226,941 263,339 135,296 Overdrafts 176,993 123,601 93,901 53,129 Due to depositors 4,637,313 4,639,062 220,131 199,579
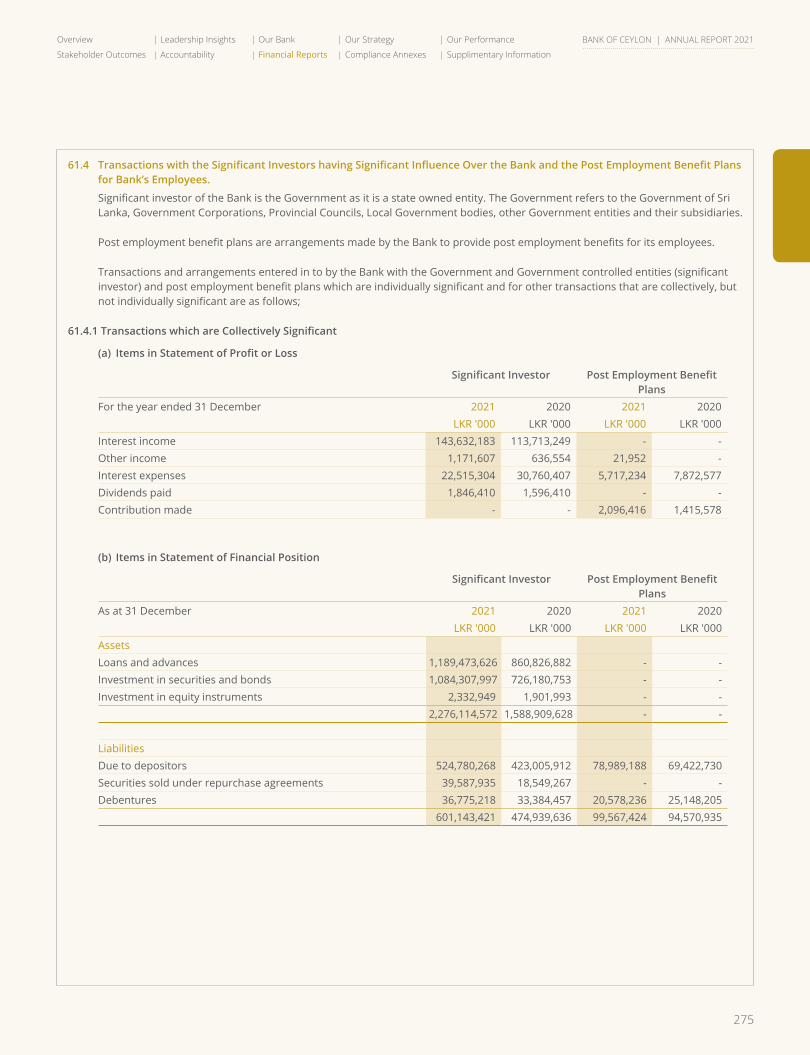
275
Overview Leadership Insights Our Bank Our Strategy Our Performance
Stakeholder Outcomes Accountability Financial Reports Compliance Annexes Supplimentary Information
BANK OF CEYLON | ANNUAL REPORT 2021
61.4 TransactionswiththeSignificantInvestorshavingSignificantInfluenceOvertheBankandthePostEmploymentBenefitPlansfor Bank’s Employees.
Significant investor of the Bank is the Government as it is a state owned entity. The Government refers to the Government of Sri Lanka, Government Corporations, Provincial Councils, Local Government bodies, other Government entities and their subsidiaries.
Post employment benefit plans are arrangements made by the Bank to provide post employment benefits for its employees.
Transactions and arrangements entered in to by the Bank with the Government and Government controlled entities (significant investor) and post employment benefit plans which are individually significant and for other transactions that are collectively, but not individually significant are as follows;
61.4.1TransactionswhichareCollectivelySignificant
(a) ItemsinStatementofProfitorLoss
SignificantInvestor PostEmploymentBenefitPlans
For the year ended 31 December 2021 2020 2021 2020LKR '000 LKR '000 LKR '000 LKR '000
Interest income 143,632,183 113,713,249 - - Other income 1,171,607 636,554 21,952 - Interest expenses 22,515,304 30,760,407 5,717,234 7,872,577 Dividends paid 1,846,410 1,596,410 - - Contribution made - - 2,096,416 1,415,578
(b) Items in Statement of Financial Position
SignificantInvestor PostEmploymentBenefitPlans
As at 31 December 2021 2020 2021 2020LKR '000 LKR '000 LKR '000 LKR '000
AssetsLoans and advances 1,189,473,626 860,826,882 - - Investment in securities and bonds 1,084,307,997 726,180,753 - - Investment in equity instruments 2,332,949 1,901,993 - -
2,276,114,572 1,588,909,628 - -
LiabilitiesDue to depositors 524,780,268 423,005,912 78,989,188 69,422,730 Securities sold under repurchase agreements 39,587,935 18,549,267 - - Debentures 36,775,218 33,384,457 20,578,236 25,148,205
601,143,421 474,939,636 99,567,424 94,570,935
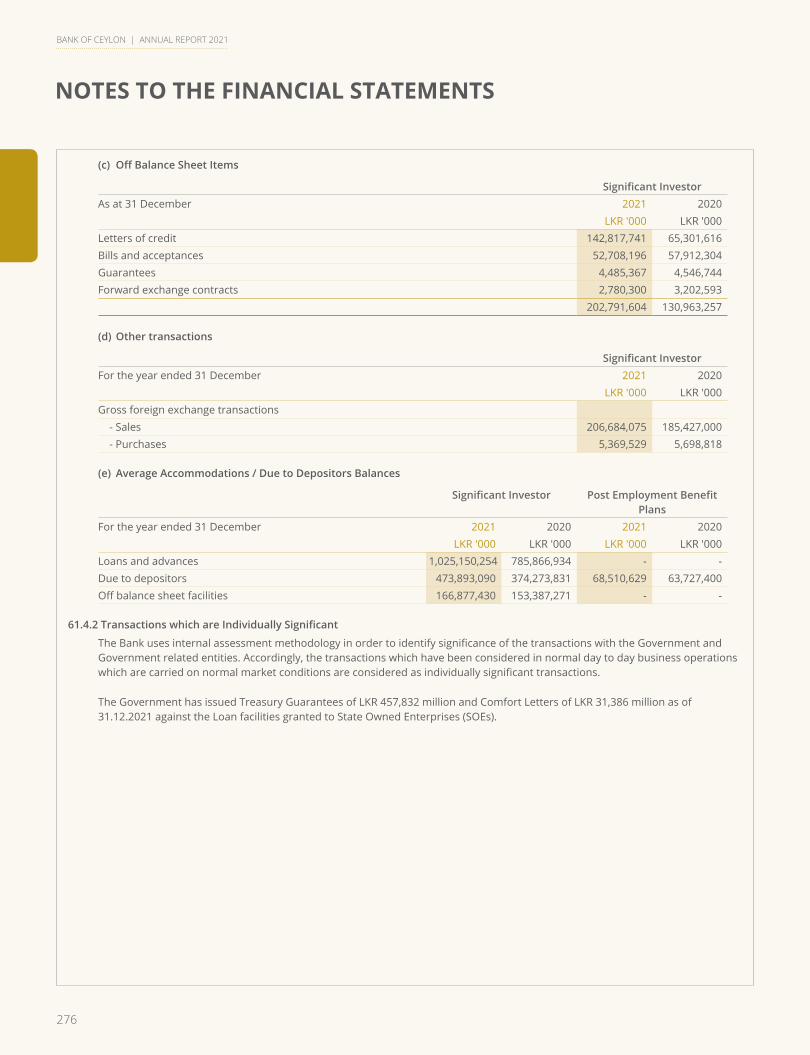
276
NOTES TO THE FINANCIAL STATEMENTS
BANK OF CEYLON | ANNUAL REPORT 2021
(c) OffBalanceSheetItems
SignificantInvestorAs at 31 December 2021 2020
LKR '000 LKR '000Letters of credit 142,817,741 65,301,616 Bills and acceptances 52,708,196 57,912,304 Guarantees 4,485,367 4,546,744 Forward exchange contracts 2,780,300 3,202,593
202,791,604 130,963,257
(d) Other transactions
SignificantInvestorFor the year ended 31 December 2021 2020
LKR '000 LKR '000Gross foreign exchange transactions - Sales 206,684,075 185,427,000 - Purchases 5,369,529 5,698,818
(e) Average Accommodations / Due to Depositors Balances
SignificantInvestor PostEmploymentBenefitPlans
For the year ended 31 December 2021 2020 2021 2020LKR '000 LKR '000 LKR '000 LKR '000
Loans and advances 1,025,150,254 785,866,934 - - Due to depositors 473,893,090 374,273,831 68,510,629 63,727,400 Off balance sheet facilities 166,877,430 153,387,271 - -
61.4.2TransactionswhichareIndividuallySignificant
The Bank uses internal assessment methodology in order to identify significance of the transactions with the Government and Government related entities. Accordingly, the transactions which have been considered in normal day to day business operations which are carried on normal market conditions are considered as individually significant transactions.
The Government has issued Treasury Guarantees of LKR 457,832 million and Comfort Letters of LKR 31,386 million as of 31.12.2021 against the Loan facilities granted to State Owned Enterprises (SOEs).
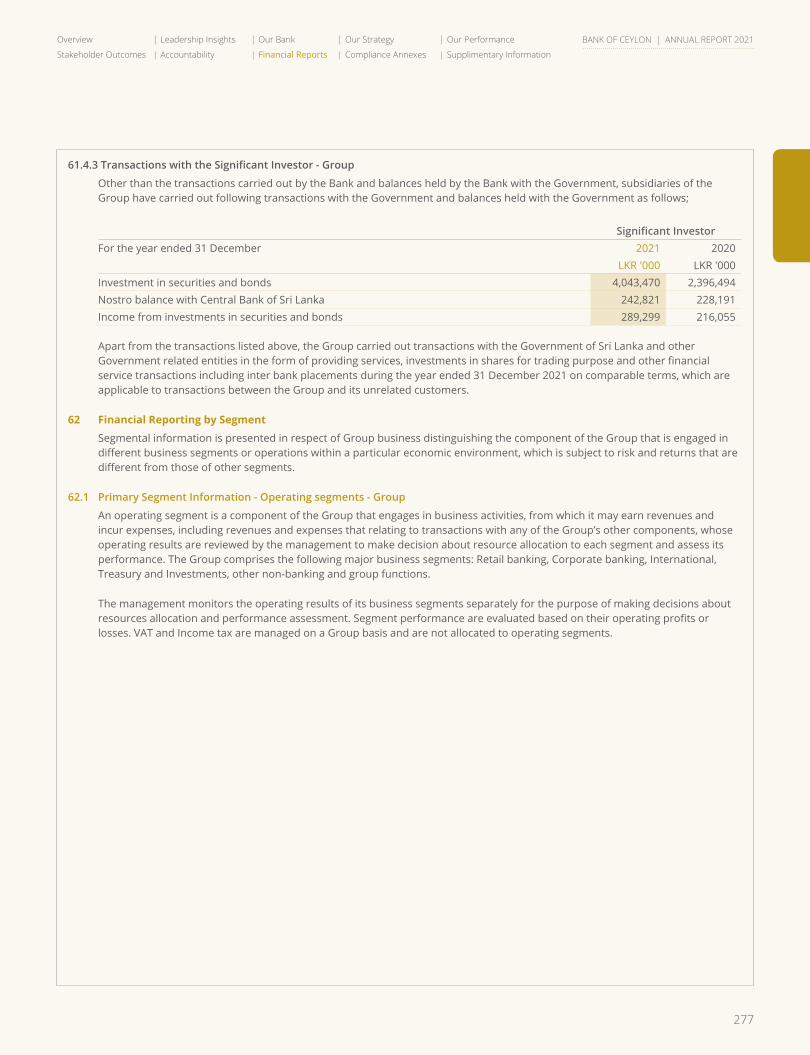
277
Overview Leadership Insights Our Bank Our Strategy Our Performance
Stakeholder Outcomes Accountability Financial Reports Compliance Annexes Supplimentary Information
BANK OF CEYLON | ANNUAL REPORT 2021
61.4.3TransactionswiththeSignificantInvestor-Group
Other than the transactions carried out by the Bank and balances held by the Bank with the Government, subsidiaries of the Group have carried out following transactions with the Government and balances held with the Government as follows;
SignificantInvestorFor the year ended 31 December 2021 2020
LKR '000 LKR '000Investment in securities and bonds 4,043,470 2,396,494 Nostro balance with Central Bank of Sri Lanka 242,821 228,191 Income from investments in securities and bonds 289,299 216,055
Apart from the transactions listed above, the Group carried out transactions with the Government of Sri Lanka and other Government related entities in the form of providing services, investments in shares for trading purpose and other financial service transactions including inter bank placements during the year ended 31 December 2021 on comparable terms, which are applicable to transactions between the Group and its unrelated customers.
62 Financial Reporting by Segment
Segmental information is presented in respect of Group business distinguishing the component of the Group that is engaged in different business segments or operations within a particular economic environment, which is subject to risk and returns that are different from those of other segments.
62.1 Primary Segment Information - Operating segments - Group
An operating segment is a component of the Group that engages in business activities, from which it may earn revenues and incur expenses, including revenues and expenses that relating to transactions with any of the Group’s other components, whose operating results are reviewed by the management to make decision about resource allocation to each segment and assess its performance. The Group comprises the following major business segments: Retail banking, Corporate banking, International, Treasury and Investments, other non-banking and group functions.
The management monitors the operating results of its business segments separately for the purpose of making decisions about resources allocation and performance assessment. Segment performance are evaluated based on their operating profits or losses. VAT and Income tax are managed on a Group basis and are not allocated to operating segments.
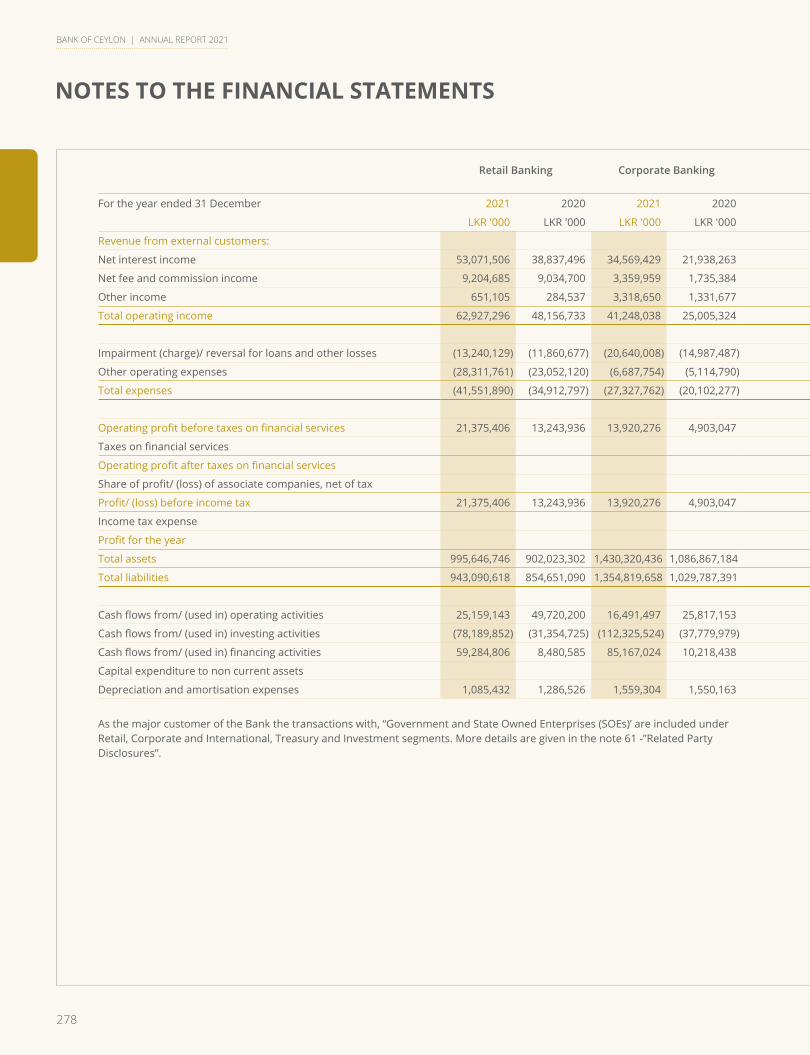
278
NOTES TO THE FINANCIAL STATEMENTS
BANK OF CEYLON | ANNUAL REPORT 2021
Retail Banking Corporate Banking International, Treasury and Investment
Group Function Unallocated Total
For the year ended 31 December 2021 2020 2021 2020 2021 2020 2021 2020 2021 2020 2021 2020
LKR '000 LKR '000 LKR '000 LKR '000 LKR '000 LKR '000 LKR '000 LKR '000 LKR '000 LKR '000 LKR '000 LKR '000
Revenue from external customers:
Net interest income 53,071,506 38,837,496 34,569,429 21,938,263 24,778,095 14,094,243 3,737,686 2,427,375 (1,167,089) (94,136) 114,989,627 77,203,241
Net fee and commission income 9,204,685 9,034,700 3,359,959 1,735,384 932,570 634,938 243,385 217,646 682,188 554,069 14,422,787 12,176,737
Other income 651,105 284,537 3,318,650 1,331,677 7,938,658 4,869,475 924,643 208,521 291,254 106,554 13,124,310 6,800,764
Total operating income 62,927,296 48,156,733 41,248,038 25,005,324 33,649,323 19,598,656 4,905,714 2,853,542 (193,647) 566,487 142,536,724 96,180,742
Impairment (charge)/ reversal for loans and other losses (13,240,129) (11,860,677) (20,640,008) (14,987,487) (9,003,987) (3,885,611) 71,766 (799,895) (849,607) (498,403) (43,661,965) (32,032,073)
Other operating expenses (28,311,761) (23,052,120) (6,687,754) (5,114,790) (6,092,663) (4,457,010) (3,351,115) (3,437,149) (588,411) (460,753) (45,031,704) (36,521,822)
Total expenses (41,551,890) (34,912,797) (27,327,762) (20,102,277) (15,096,650) (8,342,621) (3,279,349) (4,237,044) (1,438,018) (959,156) (88,693,669) (68,553,895)
Operating profit before taxes on financial services 21,375,406 13,243,936 13,920,276 4,903,047 18,552,673 11,256,035 1,626,365 (1,383,502) (1,631,665) (392,669) 53,843,055 27,626,847
Taxes on financial services (9,339,679) (5,463,182)
Operating profit after taxes on financial services 44,503,376 22,163,665
Share of profit/ (loss) of associate companies, net of tax 133,677 82,488 133,677 82,488
Profit/ (loss) before income tax 21,375,406 13,243,936 13,920,276 4,903,047 18,552,673 11,256,035 1,760,042 (1,301,014) (1,631,665) (392,669) 44,637,053 22,246,153
Income tax expense (5,953,659) (5,938,747)
Profit for the year 38,683,394 16,307,406
Total assets 995,646,746 902,023,302 1,430,320,436 1,086,867,184 1,213,737,811 861,849,707 44,665,909 41,792,680 163,578,854 132,240,902 3,847,949,756 3,024,773,775
Total liabilities 943,090,618 854,651,090 1,354,819,658 1,029,787,391 1,149,669,545 816,587,321 30,028,966 29,495,247 154,944,191 125,295,912 3,632,552,978 2,855,816,961
Cash flows from/ (used in) operating activities 25,159,143 49,720,200 16,491,497 25,817,153 13,453,432 19,914,798 (77,423) 646,628 1,002,574 5,625,368 56,029,223 101,724,147
Cash flows from/ (used in) investing activities (78,189,852) (31,354,725) (112,325,524) (37,779,979) (95,316,918) (29,958,273) (12,846,129) (4,596,752) 295,092 448,722 (298,383,331) (103,241,007)
Cash flows from/ (used in) financing activities 59,284,806 8,480,585 85,167,024 10,218,438 72,270,824 8,102,883 9,740,142 1,243,294 (896,862) (7,215,955) 225,565,934 20,829,245
Capital expenditure to non current assets (2,371,909) (3,461,073)
Depreciation and amortisation expenses 1,085,432 1,286,526 1,559,304 1,550,163 1,323,190 1,229,228 93,377 136,624 178,330 188,611 4,239,633 4,391,152
As the major customer of the Bank the transactions with, “Government and State Owned Enterprises (SOEs)’ are included under Retail, Corporate and International, Treasury and Investment segments. More details are given in the note 61 -”Related Party Disclosures”.
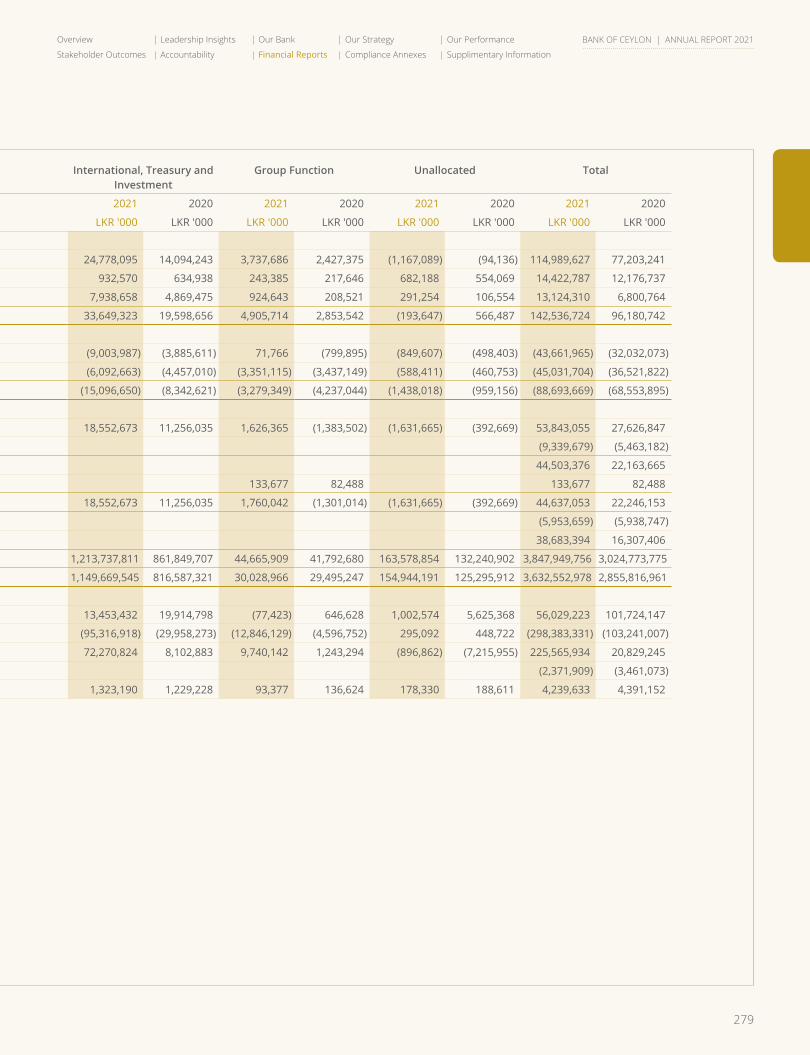
279
Overview Leadership Insights Our Bank Our Strategy Our Performance
Stakeholder Outcomes Accountability Financial Reports Compliance Annexes Supplimentary Information
BANK OF CEYLON | ANNUAL REPORT 2021
Retail Banking Corporate Banking International, Treasury and Investment
Group Function Unallocated Total
For the year ended 31 December 2021 2020 2021 2020 2021 2020 2021 2020 2021 2020 2021 2020
LKR '000 LKR '000 LKR '000 LKR '000 LKR '000 LKR '000 LKR '000 LKR '000 LKR '000 LKR '000 LKR '000 LKR '000
Revenue from external customers:
Net interest income 53,071,506 38,837,496 34,569,429 21,938,263 24,778,095 14,094,243 3,737,686 2,427,375 (1,167,089) (94,136) 114,989,627 77,203,241
Net fee and commission income 9,204,685 9,034,700 3,359,959 1,735,384 932,570 634,938 243,385 217,646 682,188 554,069 14,422,787 12,176,737
Other income 651,105 284,537 3,318,650 1,331,677 7,938,658 4,869,475 924,643 208,521 291,254 106,554 13,124,310 6,800,764
Total operating income 62,927,296 48,156,733 41,248,038 25,005,324 33,649,323 19,598,656 4,905,714 2,853,542 (193,647) 566,487 142,536,724 96,180,742
Impairment (charge)/ reversal for loans and other losses (13,240,129) (11,860,677) (20,640,008) (14,987,487) (9,003,987) (3,885,611) 71,766 (799,895) (849,607) (498,403) (43,661,965) (32,032,073)
Other operating expenses (28,311,761) (23,052,120) (6,687,754) (5,114,790) (6,092,663) (4,457,010) (3,351,115) (3,437,149) (588,411) (460,753) (45,031,704) (36,521,822)
Total expenses (41,551,890) (34,912,797) (27,327,762) (20,102,277) (15,096,650) (8,342,621) (3,279,349) (4,237,044) (1,438,018) (959,156) (88,693,669) (68,553,895)
Operating profit before taxes on financial services 21,375,406 13,243,936 13,920,276 4,903,047 18,552,673 11,256,035 1,626,365 (1,383,502) (1,631,665) (392,669) 53,843,055 27,626,847
Taxes on financial services (9,339,679) (5,463,182)
Operating profit after taxes on financial services 44,503,376 22,163,665
Share of profit/ (loss) of associate companies, net of tax 133,677 82,488 133,677 82,488
Profit/ (loss) before income tax 21,375,406 13,243,936 13,920,276 4,903,047 18,552,673 11,256,035 1,760,042 (1,301,014) (1,631,665) (392,669) 44,637,053 22,246,153
Income tax expense (5,953,659) (5,938,747)
Profit for the year 38,683,394 16,307,406
Total assets 995,646,746 902,023,302 1,430,320,436 1,086,867,184 1,213,737,811 861,849,707 44,665,909 41,792,680 163,578,854 132,240,902 3,847,949,756 3,024,773,775
Total liabilities 943,090,618 854,651,090 1,354,819,658 1,029,787,391 1,149,669,545 816,587,321 30,028,966 29,495,247 154,944,191 125,295,912 3,632,552,978 2,855,816,961
Cash flows from/ (used in) operating activities 25,159,143 49,720,200 16,491,497 25,817,153 13,453,432 19,914,798 (77,423) 646,628 1,002,574 5,625,368 56,029,223 101,724,147
Cash flows from/ (used in) investing activities (78,189,852) (31,354,725) (112,325,524) (37,779,979) (95,316,918) (29,958,273) (12,846,129) (4,596,752) 295,092 448,722 (298,383,331) (103,241,007)
Cash flows from/ (used in) financing activities 59,284,806 8,480,585 85,167,024 10,218,438 72,270,824 8,102,883 9,740,142 1,243,294 (896,862) (7,215,955) 225,565,934 20,829,245
Capital expenditure to non current assets (2,371,909) (3,461,073)
Depreciation and amortisation expenses 1,085,432 1,286,526 1,559,304 1,550,163 1,323,190 1,229,228 93,377 136,624 178,330 188,611 4,239,633 4,391,152
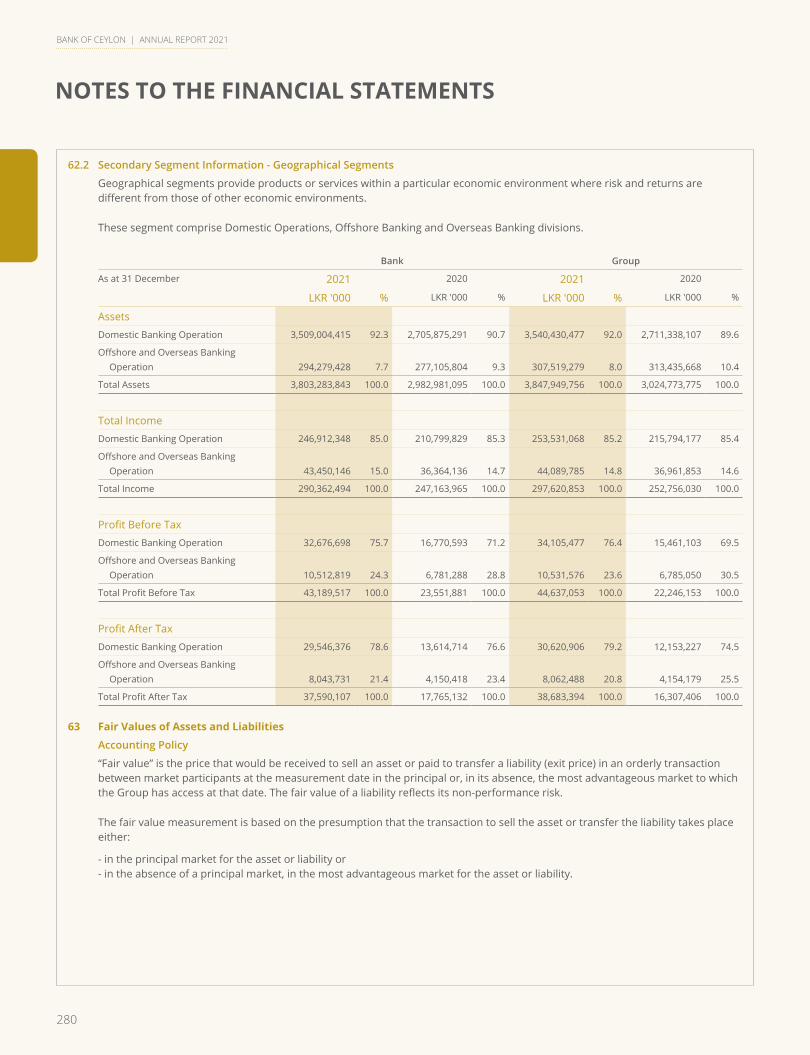
280
NOTES TO THE FINANCIAL STATEMENTS
BANK OF CEYLON | ANNUAL REPORT 2021
62.2 Secondary Segment Information - Geographical Segments
Geographical segments provide products or services within a particular economic environment where risk and returns are different from those of other economic environments.
These segment comprise Domestic Operations, Offshore Banking and Overseas Banking divisions.
Bank Group
As at 31 December 2021 2020 2021 2020
LKR '000 % LKR '000 % LKR '000 % LKR '000 %
Assets
Domestic Banking Operation 3,509,004,415 92.3 2,705,875,291 90.7 3,540,430,477 92.0 2,711,338,107 89.6
Offshore and Overseas Banking Operation 294,279,428 7.7 277,105,804 9.3 307,519,279 8.0 313,435,668 10.4
Total Assets 3,803,283,843 100.0 2,982,981,095 100.0 3,847,949,756 100.0 3,024,773,775 100.0
Total Income
Domestic Banking Operation 246,912,348 85.0 210,799,829 85.3 253,531,068 85.2 215,794,177 85.4
Offshore and Overseas Banking Operation 43,450,146 15.0 36,364,136 14.7 44,089,785 14.8 36,961,853 14.6
Total Income 290,362,494 100.0 247,163,965 100.0 297,620,853 100.0 252,756,030 100.0
Profit Before Tax
Domestic Banking Operation 32,676,698 75.7 16,770,593 71.2 34,105,477 76.4 15,461,103 69.5
Offshore and Overseas Banking Operation 10,512,819 24.3 6,781,288 28.8 10,531,576 23.6 6,785,050 30.5
Total Profit Before Tax 43,189,517 100.0 23,551,881 100.0 44,637,053 100.0 22,246,153 100.0
Profit After Tax
Domestic Banking Operation 29,546,376 78.6 13,614,714 76.6 30,620,906 79.2 12,153,227 74.5
Offshore and Overseas Banking Operation 8,043,731 21.4 4,150,418 23.4 8,062,488 20.8 4,154,179 25.5
Total Profit After Tax 37,590,107 100.0 17,765,132 100.0 38,683,394 100.0 16,307,406 100.0
63 Fair Values of Assets and Liabilities
Accounting Policy
“Fair value” is the price that would be received to sell an asset or paid to transfer a liability (exit price) in an orderly transaction between market participants at the measurement date in the principal or, in its absence, the most advantageous market to which the Group has access at that date. The fair value of a liability reflects its non-performance risk.
The fair value measurement is based on the presumption that the transaction to sell the asset or transfer the liability takes place either:
- in the principal market for the asset or liability or - in the absence of a principal market, in the most advantageous market for the asset or liability.
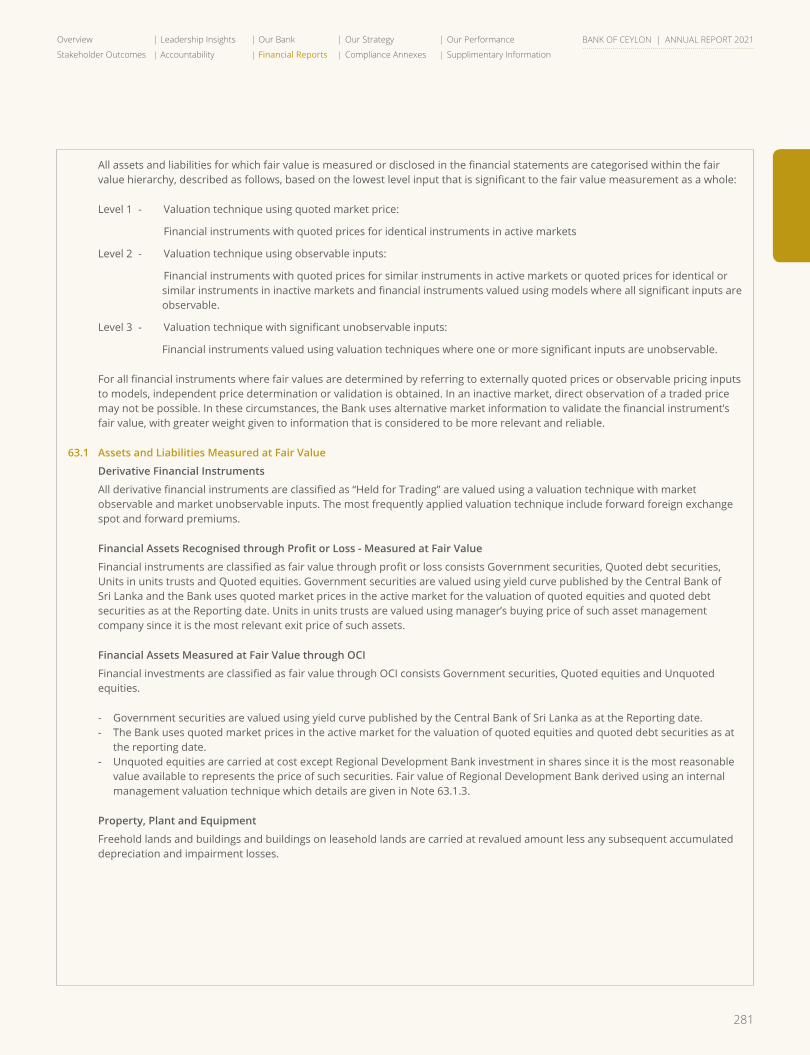
281
Overview Leadership Insights Our Bank Our Strategy Our Performance
Stakeholder Outcomes Accountability Financial Reports Compliance Annexes Supplimentary Information
BANK OF CEYLON | ANNUAL REPORT 2021
All assets and liabilities for which fair value is measured or disclosed in the financial statements are categorised within the fair value hierarchy, described as follows, based on the lowest level input that is significant to the fair value measurement as a whole:
Level 1 - Valuation technique using quoted market price:
Financial instruments with quoted prices for identical instruments in active markets
Level 2 - Valuation technique using observable inputs:
Financial instruments with quoted prices for similar instruments in active markets or quoted prices for identical or similar instruments in inactive markets and financial instruments valued using models where all significant inputs are observable.
Level 3 - Valuation technique with significant unobservable inputs:
Financial instruments valued using valuation techniques where one or more significant inputs are unobservable.
For all financial instruments where fair values are determined by referring to externally quoted prices or observable pricing inputs to models, independent price determination or validation is obtained. In an inactive market, direct observation of a traded price may not be possible. In these circumstances, the Bank uses alternative market information to validate the financial instrument’s fair value, with greater weight given to information that is considered to be more relevant and reliable.
63.1 Assets and Liabilities Measured at Fair Value
Derivative Financial Instruments
All derivative financial instruments are classified as “Held for Trading” are valued using a valuation technique with market observable and market unobservable inputs. The most frequently applied valuation technique include forward foreign exchange spot and forward premiums.
FinancialAssetsRecognisedthroughProfitorLoss-MeasuredatFairValue
Financial instruments are classified as fair value through profit or loss consists Government securities, Quoted debt securities, Units in units trusts and Quoted equities. Government securities are valued using yield curve published by the Central Bank of Sri Lanka and the Bank uses quoted market prices in the active market for the valuation of quoted equities and quoted debt securities as at the Reporting date. Units in units trusts are valued using manager’s buying price of such asset management company since it is the most relevant exit price of such assets.
Financial Assets Measured at Fair Value through OCI
Financial investments are classified as fair value through OCI consists Government securities, Quoted equities and Unquoted equities.
- Government securities are valued using yield curve published by the Central Bank of Sri Lanka as at the Reporting date. - The Bank uses quoted market prices in the active market for the valuation of quoted equities and quoted debt securities as at
the reporting date. - Unquoted equities are carried at cost except Regional Development Bank investment in shares since it is the most reasonable
value available to represents the price of such securities. Fair value of Regional Development Bank derived using an internal management valuation technique which details are given in Note 63.1.3.
Property, Plant and Equipment
Freehold lands and buildings and buildings on leasehold lands are carried at revalued amount less any subsequent accumulated depreciation and impairment losses.
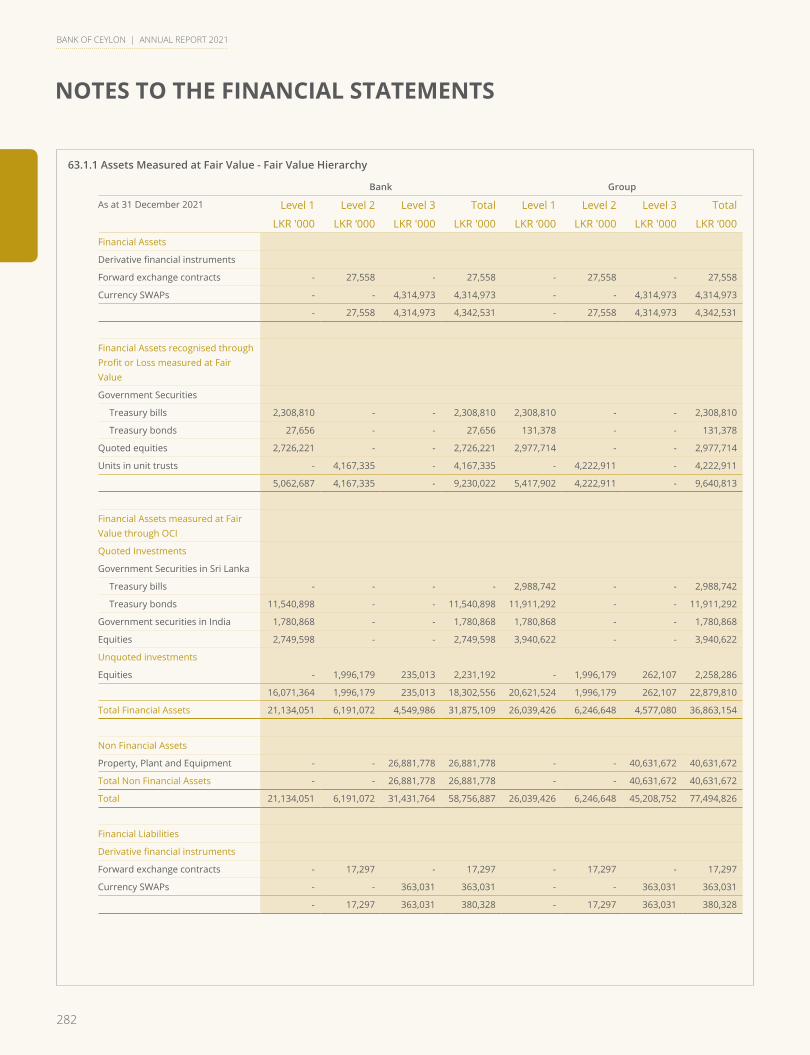
282
NOTES TO THE FINANCIAL STATEMENTS
BANK OF CEYLON | ANNUAL REPORT 2021
63.1.1 Assets Measured at Fair Value - Fair Value Hierarchy
Bank Group
As at 31 December 2021 Level 1 Level 2 Level 3 Total Level 1 Level 2 Level 3 Total
LKR '000 LKR ‘000 LKR '000 LKR '000 LKR ‘000 LKR '000 LKR '000 LKR ‘000
Financial Assets
Derivative financial instruments
Forward exchange contracts - 27,558 - 27,558 - 27,558 - 27,558
Currency SWAPs - - 4,314,973 4,314,973 - - 4,314,973 4,314,973
- 27,558 4,314,973 4,342,531 - 27,558 4,314,973 4,342,531
Financial Assets recognised through Profit or Loss measured at Fair Value
Government Securities
Treasury bills 2,308,810 - - 2,308,810 2,308,810 - - 2,308,810
Treasury bonds 27,656 - - 27,656 131,378 - - 131,378
Quoted equities 2,726,221 - - 2,726,221 2,977,714 - - 2,977,714
Units in unit trusts - 4,167,335 - 4,167,335 - 4,222,911 - 4,222,911
5,062,687 4,167,335 - 9,230,022 5,417,902 4,222,911 - 9,640,813
Financial Assets measured at Fair Value through OCI
Quoted Investments
Government Securities in Sri Lanka
Treasury bills - - - - 2,988,742 - - 2,988,742
Treasury bonds 11,540,898 - - 11,540,898 11,911,292 - - 11,911,292
Government securities in India 1,780,868 - - 1,780,868 1,780,868 - - 1,780,868
Equities 2,749,598 - - 2,749,598 3,940,622 - - 3,940,622
Unquoted investments
Equities - 1,996,179 235,013 2,231,192 - 1,996,179 262,107 2,258,286
16,071,364 1,996,179 235,013 18,302,556 20,621,524 1,996,179 262,107 22,879,810
Total Financial Assets 21,134,051 6,191,072 4,549,986 31,875,109 26,039,426 6,246,648 4,577,080 36,863,154
Non Financial Assets
Property, Plant and Equipment - - 26,881,778 26,881,778 - - 40,631,672 40,631,672
Total Non Financial Assets - - 26,881,778 26,881,778 - - 40,631,672 40,631,672
Total 21,134,051 6,191,072 31,431,764 58,756,887 26,039,426 6,246,648 45,208,752 77,494,826
Financial Liabilities
Derivative financial instruments
Forward exchange contracts - 17,297 - 17,297 - 17,297 - 17,297
Currency SWAPs - - 363,031 363,031 - - 363,031 363,031
- 17,297 363,031 380,328 - 17,297 363,031 380,328

283
Overview Leadership Insights Our Bank Our Strategy Our Performance
Stakeholder Outcomes Accountability Financial Reports Compliance Annexes Supplimentary Information
BANK OF CEYLON | ANNUAL REPORT 2021
63.1.1 Assets Measured at Fair Value - Fair Value Hierarchy
Bank Group
As at 31 December 2020 Level 1 Level 2 Level 3 Total Level 1 Level 2 Level 3 Total
LKR '000 LKR ‘000 LKR '000 LKR '000 LKR ‘000 LKR '000 LKR '000 LKR ‘000
Financial Assets
Derivative financial instruments
Forward exchange contracts - 38,532 - 38,532 - 38,532 - 38,532
Currency SWAPs - - 510,394 510,394 - - 510,394 510,394
- 38,532 510,394 548,926 - 38,532 510,394 548,926
Financial Assets recognised through Profit or Loss measured at Fair Value
Government Securities
Treasury bills 3,622,937 - - 3,622,937 3,623,301 - - 3,623,301
Treasury bonds 29,553 - - 29,553 775,231 - - 775,231
Quoted equities 3,091,853 - - 3,091,853 3,304,477 - - 3,304,477
Units in unit trusts - 3,111,877 - 3,111,877 - 3,164,712 - 3,164,712
Quoted debt securities - - - - 1,750 - - 1,750
6,744,343 3,111,877 - 9,856,220 7,704,759 3,164,712 - 10,869,471
Financial Assets measured at Fair Value through OCI
Quoted Investments
Government Securities in Sri Lanka
Treasury bills 38,421 - - 38,421 1,282,857 - - 1,282,857
Treasury bonds 9,311,619 - - 9,311,619 9,431,278 - - 9,431,278
Government securities in India 1,594,471 - - 1,594,471 1,594,471 - - 1,594,471
Equities 2,329,969 - - 2,329,969 3,494,494 - - 3,494,494
Unquoted investments
Equities - 1,855,430 232,570 2,088,000 - 1,855,430 255,248 2,110,678
13,274,480 1,855,430 232,570 15,362,480 15,803,100 1,855,430 255,248 17,913,778
Total Financial Assets 20,018,823 5,005,839 742,964 25,767,626 23,507,859 5,058,674 765,642 29,332,175
Non Financial Assets
Property, Plant and Equipment - - 26,441,721 26,441,721 - - 39,929,121 39,929,121
Total Non Financial Assets - - 26,441,721 26,441,721 - - 39,929,121 39,929,121
Total 20,018,823 5,005,839 27,184,685 52,209,347 23,507,859 5,058,674 40,694,763 69,261,296
Financial Liabilities
Derivative financial instruments
Forward exchange contracts - 16,192 - 16,192 - 16,192 - 16,192
Currency SWAPs - - 85,990 85,990 - - 85,990 85,990
Total Financial Liabilities - 16,192 85,990 102,182 - 16,192 85,990 102,182
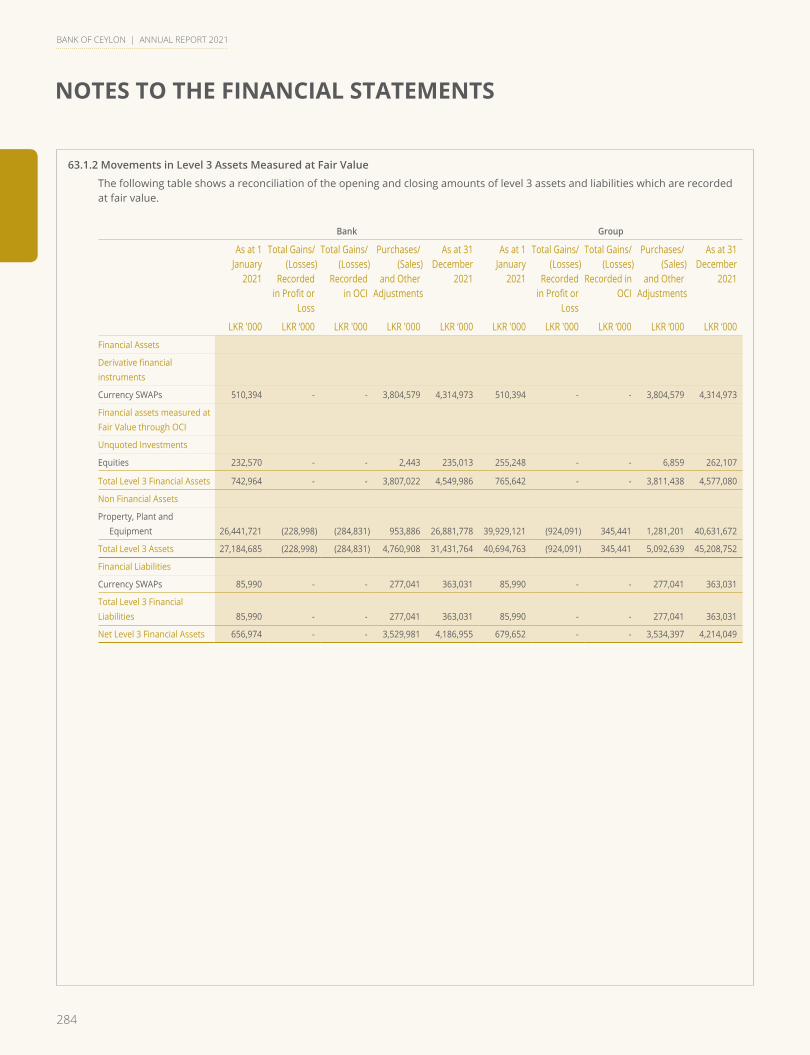
284
NOTES TO THE FINANCIAL STATEMENTS
BANK OF CEYLON | ANNUAL REPORT 2021
63.1.2 Movements in Level 3 Assets Measured at Fair Value
The following table shows a reconciliation of the opening and closing amounts of level 3 assets and liabilities which are recorded at fair value.
Bank Group
As at 1 January
2021
Total Gains/ (Losses)
Recorded in Profit or
Loss
Total Gains/ (Losses)
Recorded in OCI
Purchases/(Sales)
and OtherAdjustments
As at 31 December
2021
As at 1 January
2021
Total Gains/ (Losses)
Recorded in Profit or
Loss
Total Gains/ (Losses)
Recorded in OCI
Purchases/ (Sales)
and Other Adjustments
As at 31 December
2021
LKR '000 LKR ‘000 LKR '000 LKR '000 LKR ‘000 LKR '000 LKR '000 LKR ‘000 LKR ‘000 LKR ‘000
Financial Assets
Derivative financial instruments
Currency SWAPs 510,394 - - 3,804,579 4,314,973 510,394 - - 3,804,579 4,314,973
Financial assets measured at Fair Value through OCI
Unquoted Investments
Equities 232,570 - - 2,443 235,013 255,248 - - 6,859 262,107
Total Level 3 Financial Assets 742,964 - - 3,807,022 4,549,986 765,642 - - 3,811,438 4,577,080
Non Financial Assets
Property, Plant and Equipment 26,441,721 (228,998) (284,831) 953,886 26,881,778 39,929,121 (924,091) 345,441 1,281,201 40,631,672
Total Level 3 Assets 27,184,685 (228,998) (284,831) 4,760,908 31,431,764 40,694,763 (924,091) 345,441 5,092,639 45,208,752
Financial Liabilities
Currency SWAPs 85,990 - - 277,041 363,031 85,990 - - 277,041 363,031
Total Level 3 Financial Liabilities 85,990 - - 277,041 363,031 85,990 - - 277,041 363,031
Net Level 3 Financial Assets 656,974 - - 3,529,981 4,186,955 679,652 - - 3,534,397 4,214,049
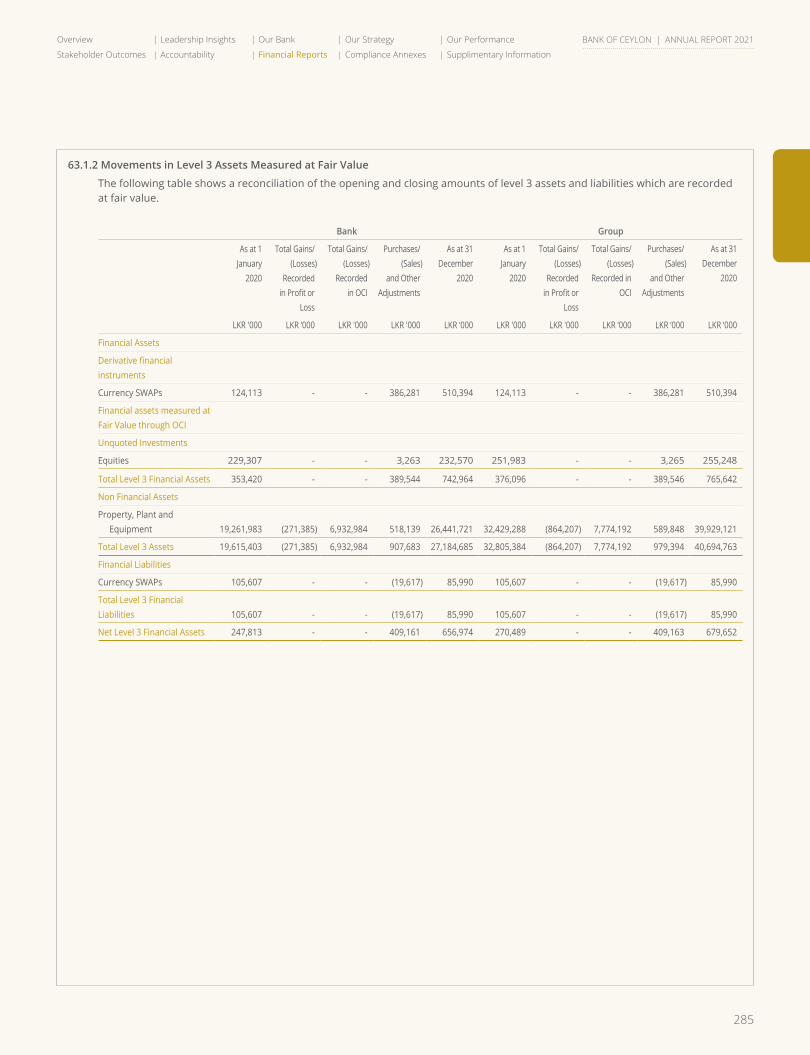
285
Overview Leadership Insights Our Bank Our Strategy Our Performance
Stakeholder Outcomes Accountability Financial Reports Compliance Annexes Supplimentary Information
BANK OF CEYLON | ANNUAL REPORT 2021
63.1.2 Movements in Level 3 Assets Measured at Fair Value
The following table shows a reconciliation of the opening and closing amounts of level 3 assets and liabilities which are recorded at fair value.
Bank Group
As at 1 January
2020
Total Gains/ (Losses)
Recorded in Profit or
Loss
Total Gains/ (Losses)
Recorded in OCI
Purchases/(Sales)
and OtherAdjustments
As at 31 December
2020
As at 1 January
2020
Total Gains/ (Losses)
Recorded in Profit or
Loss
Total Gains/ (Losses)
Recorded in OCI
Purchases/ (Sales)
and Other Adjustments
As at 31 December
2020
LKR '000 LKR ‘000 LKR '000 LKR '000 LKR ‘000 LKR '000 LKR '000 LKR ‘000 LKR ‘000 LKR ‘000
Financial Assets
Derivative financial instruments
Currency SWAPs 124,113 - - 386,281 510,394 124,113 - - 386,281 510,394
Financial assets measured at Fair Value through OCI
Unquoted Investments
Equities 229,307 - - 3,263 232,570 251,983 - - 3,265 255,248
Total Level 3 Financial Assets 353,420 - - 389,544 742,964 376,096 - - 389,546 765,642
Non Financial Assets
Property, Plant and Equipment 19,261,983 (271,385) 6,932,984 518,139 26,441,721 32,429,288 (864,207) 7,774,192 589,848 39,929,121
Total Level 3 Assets 19,615,403 (271,385) 6,932,984 907,683 27,184,685 32,805,384 (864,207) 7,774,192 979,394 40,694,763
Financial Liabilities
Currency SWAPs 105,607 - - (19,617) 85,990 105,607 - - (19,617) 85,990
Total Level 3 Financial Liabilities 105,607 - - (19,617) 85,990 105,607 - - (19,617) 85,990
Net Level 3 Financial Assets 247,813 - - 409,161 656,974 270,489 - - 409,163 679,652
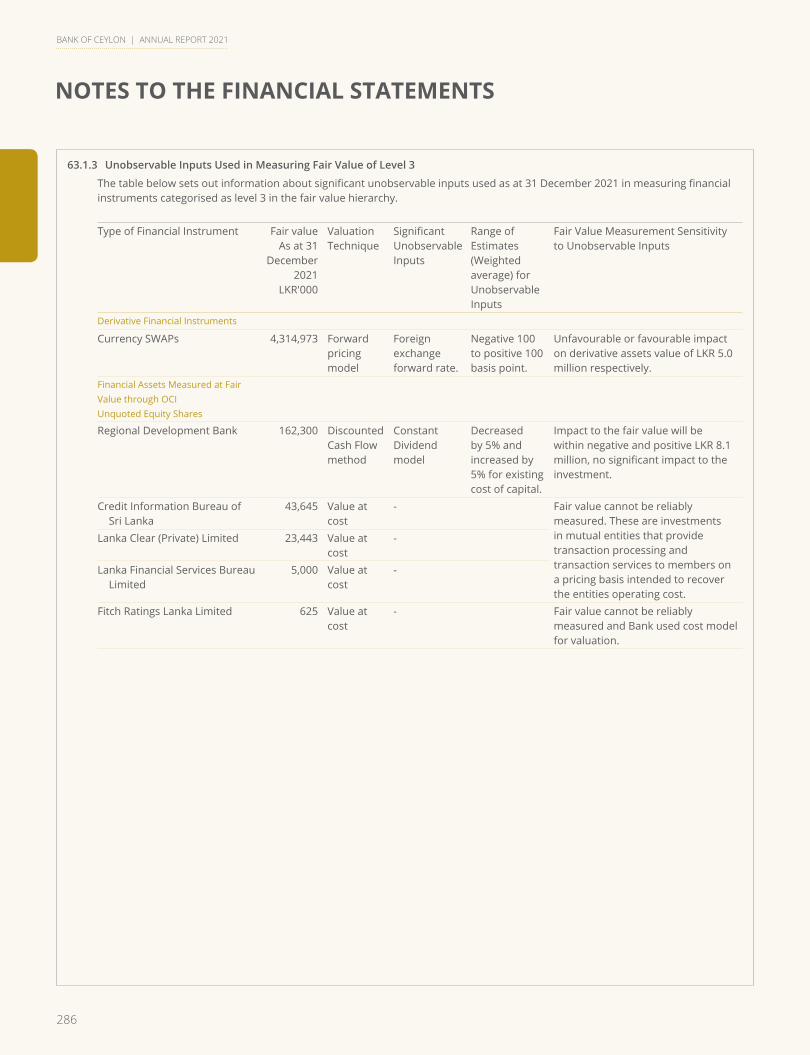
286
NOTES TO THE FINANCIAL STATEMENTS
BANK OF CEYLON | ANNUAL REPORT 2021
63.1.3 Unobservable Inputs Used in Measuring Fair Value of Level 3
The table below sets out information about significant unobservable inputs used as at 31 December 2021 in measuring financial instruments categorised as level 3 in the fair value hierarchy.
Type of Financial Instrument Fair valueAs at 31
December 2021
LKR'000
Valuation Technique
Significant Unobservable Inputs
Range of Estimates (Weighted average) for Unobservable Inputs
Fair Value Measurement Sensitivity to Unobservable Inputs
Derivative Financial Instruments
Currency SWAPs 4,314,973 Forward pricing model
Foreign exchange forward rate.
Negative 100 to positive 100 basis point.
Unfavourable or favourable impact on derivative assets value of LKR 5.0 million respectively.
Financial Assets Measured at Fair Value through OCI Unquoted Equity Shares
Regional Development Bank 162,300 Discounted Cash Flow method
Constant Dividend model
Decreased by 5% and increased by 5% for existing cost of capital.
Impact to the fair value will be within negative and positive LKR 8.1 million, no significant impact to the investment.
Credit Information Bureau of Sri Lanka
43,645 Value at cost
- Fair value cannot be reliably measured. These are investments in mutual entities that provide transaction processing and transaction services to members on a pricing basis intended to recover the entities operating cost.
Lanka Clear (Private) Limited 23,443 Value at cost
-
Lanka Financial Services Bureau Limited
5,000 Value at cost
-
Fitch Ratings Lanka Limited 625 Value at cost
- Fair value cannot be reliably measured and Bank used cost model for valuation.

287
Overview Leadership Insights Our Bank Our Strategy Our Performance
Stakeholder Outcomes Accountability Financial Reports Compliance Annexes Supplimentary Information
BANK OF CEYLON | ANNUAL REPORT 2021
63.2 Fairvalueoffinancialassetsandliabilitiesnotcarriedatfairvalue
Bank Group
As at 31 December 2021 Fair value Fair value
Level 1 Level 2 Level 3 Total Carrying value
Level 1 Level 2 Level 3 Total Carrying value
LKR '000 LKR ‘000 LKR '000 LKR '000 LKR ‘000 LKR '000 LKR '000 LKR ‘000 LKR ‘000 LKR ‘000
Assets
Financial assets at amortised cost
- Debt and other instruments 860,771,339 4,141,518 184,642,014 1,049,554,871 1,082,179,876 861,042,486 4,141,518 184,642,014 1,049,826,018 1,082,837,662
Investment properties - - 3,003,007 3,003,007 2,414,640 - - 653,000 653,000 107,704
Total 860,771,339 4,141,518 187,645,021 1,052,557,878 1,084,594,516 861,042,486 4,141,518 185,295,014 1,050,479,018 1,082,945,366
Liabilities
Other borrowings - - 444,107,977 444,107,977 444,107,977 - - 447,875,002 447,875,002 447,875,002
Debt securities issued - - - - - - - 2,107,182 2,107,182 2,107,182
Subordinate liabilities - 17,690,269 46,337,407 64,027,676 64,358,855 - 17,690,269 46,084,522 63,774,791 64,105,970
Total - 17,690,269 490,445,384 508,135,653 508,466,832 - 17,690,269 496,066,706 513,756,975 514,088,154
Bank Group
As at 31 December 2020 Fair value Fair value
Level 1 Level 2 Level 3 Total Carrying value
Level 1 Level 2 Level 3 Total Carrying value
LKR '000 LKR ‘000 LKR '000 LKR '000 LKR ‘000 LKR '000 LKR '000 LKR ‘000 LKR ‘000 LKR ‘000
Assets
Financial assets at amortised cost
- Debt and other instruments 588,945,728 4,428,239 177,716,688 771,090,655 724,390,172 589,216,875 4,428,239 177,716,688 771,361,802 725,579,585
Investment properties - - 3,003,007 3,003,007 2,534,118 - - 653,000 653,000 114,370
Total 588,945,728 4,428,239 180,719,695 774,093,662 726,924,290 589,216,875 4,428,239 178,369,688 772,014,802 725,693,955
Liabilities
Other borrowings - - 180,884,127 180,884,127 180,884,127 - - 185,102,055 185,102,055 185,102,055
Debt securities issued - - - - - - - 2,107,493 2,107,493 2,107,493
Subordinate liabilities - 17,258,196 54,248,009 71,506,205 64,637,407 - 17,258,196 54,248,009 71,506,205 64,627,397
Total - 17,258,196 235,132,136 252,390,332 245,521,534 - 17,258,196 241,457,557 258,715,753 251,836,945

288
NOTES TO THE FINANCIAL STATEMENTS
BANK OF CEYLON | ANNUAL REPORT 2021
The following describes the methodologies and assumptions used to determine fair values for those assets and liabilities which are not already recorded at fair value in the Financial Statements.
Financial Assets Measured at Amortised Cost
Financial assets measured at amortised cost comprise Sri Lanka Development Bonds, Government and Corporate debt securities.
Variable rate Sri Lanka Development Bonds are re-pricing semi-annually. Hence, it is assumed that the carrying amounts approximate their fair value. Listed corporate debt securities are valued using quoted market price as of the Reporting date, quoted government debt securities are valued using yield curve published by the Central Bank of Sri Lanka and fair value of unquoted corporate debt securities and Government securities including fixed rate Sri Lanka Development Bonds are estimated as the present value of future cash flows expected to be received from such investments calculated based on interest rates at the Reporting date for similar instruments.
Investment Properties
Investment properties are valued by the independent professional valuers and more details are given in Note 33.
Financial Liabilities at Amortised Cost - Other Borrowings
Financial liabilities at amortised cost - other borrowings represent Term borrowings from banks and other financial institutions in Sri Lanka and abroad and Refinance borrowings.
Fair value of term borrowings and refinance borrowings are estimated by the discounting the future cash flows using effective interest rates of similar instruments.
Debt Securities Issued
Fair value of debt securities issued are estimated as the present value of future cash flows expected to be paid from such investments calculated based on interest rates at the Reporting date for similar instruments.
Subordinated Liabilities
Subordinated liabilities that are listed in the Colombo Stock Exchange valued using quoted market price as of the Reporting date. Fair values of unlisted subordinated liabilities are estimated as the present value of future cash out flow expected to be paid to the instruments calculated based on the interest rates at the Reporting date for smiler instruments.
63.3 Assets and Liabilities for which Fair Value Approximates Carrying Value
For Financial Assets and Liabilities that have a short term maturity, it is assumed that the carrying amounts approximate their fair value for certain instruments which have contractual maturity of more than one year, the fair value is determined using reasonable basis. Given below is the bases adopted by the Bank in Order to establish the fair value of such financial instruments.
• Financial Assets at Amortised Cost - Loans and Advances
Approximately 38% of the total portfolio of loans and advances to customers have a remaining contractual maturity of less than one year and majority of balance loans are granted at floating rate. Therefore, fair value of loans and advances to customers approximates to their carrying value as at the reporting date.
• Financial Liabilities at Amortised Cost - Due to Depositors
Approximately 98% of the customer deposits are either repayable on demand or have a remaining contractual maturity of less than one year. Customer deposits with a contractual maturity of more than one year are subject to pre mature upliftment. Amounts paid to customers in the event of pre mature upliftment would not be materially different to its carrying value as at date. Therefore, fair value of customer deposits approximates to their carrying value as at the reporting date.

289
Overview Leadership Insights Our Bank Our Strategy Our Performance
Stakeholder Outcomes Accountability Financial Reports Compliance Annexes Supplimentary Information
BANK OF CEYLON | ANNUAL REPORT 2021
2021 2020
As at 31 December Carrying Amount
Fair Value Carrying Amount
Fair Value
LKR '000 LKR '000 LKR '000 LKR '000
Bank
Financial assets
Cash and cash equivalents 82,647,406 82,647,406 84,416,624 84,416,624
Balances with Central Banks 74,121,781 74,121,781 33,351,852 33,351,852
Placements with banks 4,957,417 4,957,417 27,615,851 27,615,851
Securities purchased under resale agreements 2,074,474 2,074,474 2,001,047 2,001,047
Financial assets at amortised cost loans and advances 2,413,762,291 2,413,762,291 1,988,409,007 1,988,409,007
Total financial assets 2,577,563,369 2,577,563,369 2,135,794,381 2,135,794,381
Financial liabilities
Due to banks 17,936,070 17,936,070 2,402,043 2,402,043
Securities sold under repurchase agreements 162,156,413 162,156,413 57,106,652 57,106,652
Due to depositors 2,866,894,010 2,866,894,010 2,474,775,488 2,474,775,488
Total financial liabilities 3,046,986,493 3,046,986,493 2,534,284,183 2,534,284,183
Group
Financial assets
Cash and cash equivalents 82,313,908 82,313,908 83,198,445 83,198,445
Balances with Central Banks 74,121,781 74,121,781 33,351,852 33,351,852
Placements with banks 5,342,369 5,342,369 27,913,969 27,913,969
Securities purchased under resale agreements 2,976,664 2,976,664 3,822,312 3,822,312
Financial assets at amortised cost loans and advances 2,446,330,329 2,446,330,329 2,018,393,730 2,018,393,730
Total financial assets 2,611,085,051 2,611,085,051 2,166,680,308 2,166,680,308
Financial liabilities
Due to banks 18,646,339 18,646,339 2,628,434 2,628,434
Securities sold under repurchase agreements 161,668,335 161,668,335 57,697,780 57,697,780
Due to depositors 2,886,237,094 2,886,237,094 2,493,110,291 2,493,110,291
Total financial liabilities 3,066,551,768 3,066,551,768 2,553,436,505 2,553,436,505
63.4 ReclassificationsofFinancialAssetsandFinancialLiabilities
There have been no reclassifications during 2021.
290
NOTES TO THE FINANCIAL STATEMENTS
BANK OF CEYLON | ANNUAL REPORT 2021
64 Financial Risk Management
64.1 Introduction
64.1.1 Overview
Risk is an inherent component in the business of banking and the Bank is mainly exposed to Credit risk , Market risk, Operational risk and Liquidity risk as a financial intermediary. Management of these risks is vital for the continuity and the sustainability of the Bank.
The comprehensive Risk Management Framework (RMF) of the Bank provides the necessary guidance for identifying, assessing, measuring, monitoring and reporting risk to be managed efficiently and effectively with the proper oversight by the Integrated Risk Management Committee (IRMC). Financial risk together with other material risks faced by the bank including strategic, reputational,compliance and legal risks are managed and overseen as a part of the Bank’s corporate governance and Risk Management Framework. This note presents the exposure to risk and the processes of measuring and managing such risks.
Credit Risk
64.2.2 Maximum exposure to credit risk
64.2.3 Credit quality by class of financial assets
64.2.4 Provision for impairment (ECL) movement
64.2.6 Country wise exposure
64.2.7 Sectorwise exposure
64.2.8 Commitments and guarantees
64.2.9 Management overlays over expected credit risk
Liquidity Risk
64.3.1 Liquidity risk exposure
64.3.2 Maturity analysis of financial asset and liabilities
Market Risk
64.4.1 Trading and non-trading portfolio - bank
64.4.2 Interest rate risk
64.4.3 Foreign exchange risk
64.4.4 Equity risk
Operational Risk
Capital adequacy and Capital Management
64.1.2 Group risk management
Bank of Ceylon group consist of 9 financial and non financial subsidiaries, directly and indirectly owned by the Bank and 4 associate companies. The principal activities of the group is spread over diverse range. Koladeniya Hydro power Ltd. has been disposed during the year. Due to size of the balance sheet, the affairs of subsidiaries and associates do not have significant impact to the Bank’s risk management except for reputation damage that could arise.
The Bank is managing the strategic risk through comprehensive review of group activities on a quarterly basis mainly in the perspective of Credit, Market, Liquidity and Operational risks which are overseen by the IRMC. Bank closely involves in risk, compliance and audit affairs of subsidiaries by appointing members of Senior Management of the Bank as members of the Boards of such companies. On special circumstances Internal Auditor of the Bank carries out audits in subsidiaries.
291
Overview Leadership Insights Our Bank Our Strategy Our Performance
Stakeholder Outcomes Accountability Financial Reports Compliance Annexes Supplimentary Information
BANK OF CEYLON | ANNUAL REPORT 2021
64.1.3 Risk Management Framework (RMF)
Risk Management Framework of the Bank begins with oversight by the Board of Directors through IRMC, which assures the performance of overall Risk Management . RMF therefore, provides a structured approach to manage all the risk exposures through Risk Management Policies, Risk Appetite and limit setting of the Bank. This establishes the strategic direction of the bank and provides a holistic approach to Bank’s risk management. These policies and frameworks are reviewed regularly to incorporate changes in the regulatory and market environment.
The Bank’s Independent Integrated Risk Management Division (IIRMD) is headed by the Chief Risk Officer (CRO), who directly reports to the Integrated Risk Management Committee (IRMC), which is a sub-committee of the Board. The IIRMD acts as the second line of defence in risk management. CRO is also a member of management level committees such as Credit Committee, Asset and Liability Management Committee (ALCO), Operational Risk Management Executive Committee (ORMEC), IT Steering Committee, Fraud Risk Management Committee and Non Performing Advances Monitoring Committee, which assist in managing various risks that the Bank is exposed to.
The Internal Audit function of the Bank independently monitors and evaluates the risk Management function of the Bank as third line of defence and provides their views on risk Management to the Audit Committee while business lines evaluates and manages associated risks as first line of defence.
64.1.4 Risk measurement, reporting and mitigation
Risks are measured using various rigorous methods and tools inline with the industry best practices with respect to Credit ,Market ,Operational, Liquidity and other risks . Owing to the prevailing unprecedented economic scenario, the bank carried out various adhoc analysis to assess the future risks and escalate to the top management for mitigation actions. The Bank has also carried out several single factor,non conventional scenario stress testing based on three risk levels : Mild, Moderate and Severe which are plausible in a stressed economic situation and are supported by the multiple scenario stress testing.
In addition, the Internal Capital Adequacy Assessment Process (ICAAP) sets out the framework for the Bank’s internal capital planning and the process provides an assurance that the Bank has adequate capital to support all risks as per the business profile. Different assessment methodologies which are internationally accepted are used to measure the Pillar II risks in addition to Pillar I risks. The result of the risk measurements and analysis are reported to the IRMC periodically for better risk management in addition to the regulatory requirements.
As a part of its overall risk management, the Bank uses several mitigation techniques and strategies to reduce the risk. In managing credit risk bank uses comprehensive pre sanctioning and post sanctioning techniques to reduce its credit risks. Collaterals are used to further mitigate losses. Market risk is mitigated using derivative instruments in limited context. Strong internal control mechanism is in place to manage operational risks and insurance is used as an operational risk transfer strategy where necessary. The most vulnerable risk in the present business environment, the IT risk is managed through the comprehensive policies and standards.
292
NOTES TO THE FINANCIAL STATEMENTS
BANK OF CEYLON | ANNUAL REPORT 2021
64.2 Credit Risk
Credit Risk is defined as potential losses arising due to a counterparty to a credit transaction failing to meet obligations in accordance with agreed terms. Credit Risk can take the form of default and concentration.
64.2.1 Management of Credit Risk
Credit risk management policy lays down the conditions and guidelines for granting, maintenance, monitoring and management of credit at both the transaction and portfolio levels. Credit risk management function is independent from business divisions and credit decision standards, processes and principles are consistently applied in corporate segment and retail segment. In order to get rid of concentration risk a diversified credit portfolio is maintained by assessing and managing borrower and industry specific concentration against risk appetite. The Bank has a range of strategies and processes to actively mitigate credit risks.
The Bank has well established process for approving new credit and for the renewal of existing credit. All the potential credit exposures of the bank are first evaluated by transaction originators who are the risk owners of the credit mechanism. Credit proposals exceeding a certain threshold are independently reviewed by the Chief Risk Officer.
Rating models are a key input by which the credit risk in portfolios is managed, measured and monitored. The Bank uses a range of credit risk rating models across the corporate and mid corporate portfolios covering the different industries the customers are in. Retail exposures are managed through number of retail scorecards.
Procedures are also in place to identify the credit exposures for which there may be an increased risk of loss at an early stage. In order to reduce potential credit losses and to increase the recovery of obligations credit risk mitigants are applied. Post sanctioning review of large credit exposures is carried out periodically to ensure proper documentation, adherence to the covenants imposed and quality of the loan book.
Collateral is used for credit risk mitigation purposes and minimizes losses that would otherwise be incurred. Collateral may take various forms depending on the type of borrower, the assets available, the structure and the term of credit obligations. Collateral is subject to regular valuation as prescribed in the relevant governing policies and standards.
According to the SLFRS 9, the incurred losses, as well as the expected credit losses need to be taken into consideration when providing for credit risk.
293
Overview Leadership Insights Our Bank Our Strategy Our Performance
Stakeholder Outcomes Accountability Financial Reports Compliance Annexes Supplimentary Information
BANK OF CEYLON | ANNUAL REPORT 2021
64.2.1.1 Calculation of expected credit losses (ECL)
Expected credit loss represents the default events over an expected life time of the financial assets. Expected credit losses are calculated using four main components, i.e. Probability of Default (PD), Loss Given Default (LGD), Exposure at Default (EAD) and Economic Factor Adjustment (EFA). These parameters are generally derived from internally developed statistical models combined with historical, current and forward-looking customer and macro-economic data.
SLFRS 9 introduces a three stage model for impairment of financial assets that are performing at the stage of origination or purchase. Three stage model for impairment is based on the changes in the credit quality since initial recognition. At initial recognition, financial assets which are not credit impaired are reflected in stage 1. If there is a significant increase in the credit risk, such financial assets are transferred to stage 2. Significant increase in the credit risk is defined using pre-determined credit risk indicators which are stated in the bank’s impairment policy. In case of a default, financial assets are classified as stage 3.
64.2.1.2 Incorporation of forward-looking information
The Bank has established an expert panel who considers a range of relevant forward-looking macro-economic assumptions for the determination of unbiased general industry adjustments and any related specific industry adjustments, that support the calculation of ECLs.
64.2.2 Maximum exposure to credit risk
64.2.2.1 Collateral and other credit enhancements
The Bank obtains different types of collaterals from the counterparties as a credit risk mitigant. The amount and the types of the collateral required depend on credit risk assessment of the counterparty. The acceptability of the collateral and valuation is determined based on the guidelines issued by the regulator and the bank’s policy. The main types of collateral obtained are
– For commercial lending-charges over movable and immovable properties
– For personal lending- mortgages over movable and immovable properties, cash & cash equivalents and gold articles
– For Government & State Owned Enterprises - Government Treasury guarantees
– For reverse repurchase transactions - Government securities
The Bank monitors the market value of collateral and will request additional collateral in accordance with the underlying agreement. It is the Bank’s policy to dispose of repossessed properties in an orderly fashion. The proceeds are used to reduce or repay the outstanding claim. In general, the Bank does not occupy repossessed properties for business use.
The following table shows the maximum exposure to credit risk, total fair value of collateral, any surplus collateral and the net exposure to credit risk
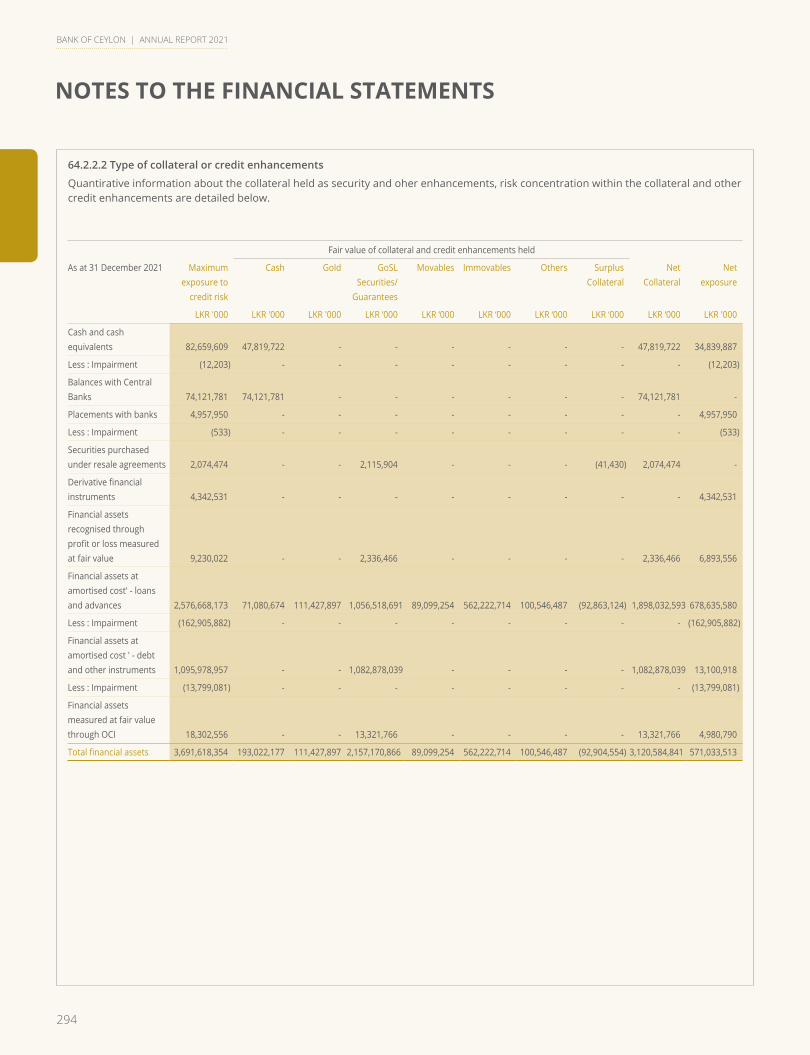
294
NOTES TO THE FINANCIAL STATEMENTS
BANK OF CEYLON | ANNUAL REPORT 2021
64.2.2.2 Type of collateral or credit enhancements
Quantirative information about the collateral held as security and oher enhancements, risk concentration within the collateral and other credit enhancements are detailed below.
Fair value of collateral and credit enhancements held
As at 31 December 2021 Maximumexposure to
credit risk
Cash Gold GoSL Securities/
Guarantees
Movables Immovables Others SurplusCollateral
Net Collateral
Net exposure
LKR '000 LKR '000 LKR '000 LKR ‘000 LKR ‘000 LKR ‘000 LKR ‘000 LKR ‘000 LKR ‘000 LKR '000
Cash and cash equivalents 82,659,609 47,819,722 - - - - - - 47,819,722 34,839,887
Less : Impairment (12,203) - - - - - - - - (12,203)
Balances with Central Banks 74,121,781 74,121,781 - - - - - - 74,121,781 -
Placements with banks 4,957,950 - - - - - - - - 4,957,950
Less : Impairment (533) - - - - - - - - (533)
Securities purchased under resale agreements 2,074,474 - - 2,115,904 - - - (41,430) 2,074,474 -
Derivative financial instruments 4,342,531 - - - - - - - - 4,342,531
Financial assets recognised through profit or loss measured at fair value 9,230,022 - - 2,336,466 - - - - 2,336,466 6,893,556
Financial assets at amortised cost' - loans and advances 2,576,668,173 71,080,674 111,427,897 1,056,518,691 89,099,254 562,222,714 100,546,487 (92,863,124) 1,898,032,593 678,635,580
Less : Impairment (162,905,882) - - - - - - - - (162,905,882)
Financial assets at amortised cost ' - debt and other instruments 1,095,978,957 - - 1,082,878,039 - - - - 1,082,878,039 13,100,918
Less : Impairment (13,799,081) - - - - - - - - (13,799,081)
Financial assets measured at fair value through OCI 18,302,556 - - 13,321,766 - - - - 13,321,766 4,980,790
Total financial assets 3,691,618,354 193,022,177 111,427,897 2,157,170,866 89,099,254 562,222,714 100,546,487 (92,904,554) 3,120,584,841 571,033,513
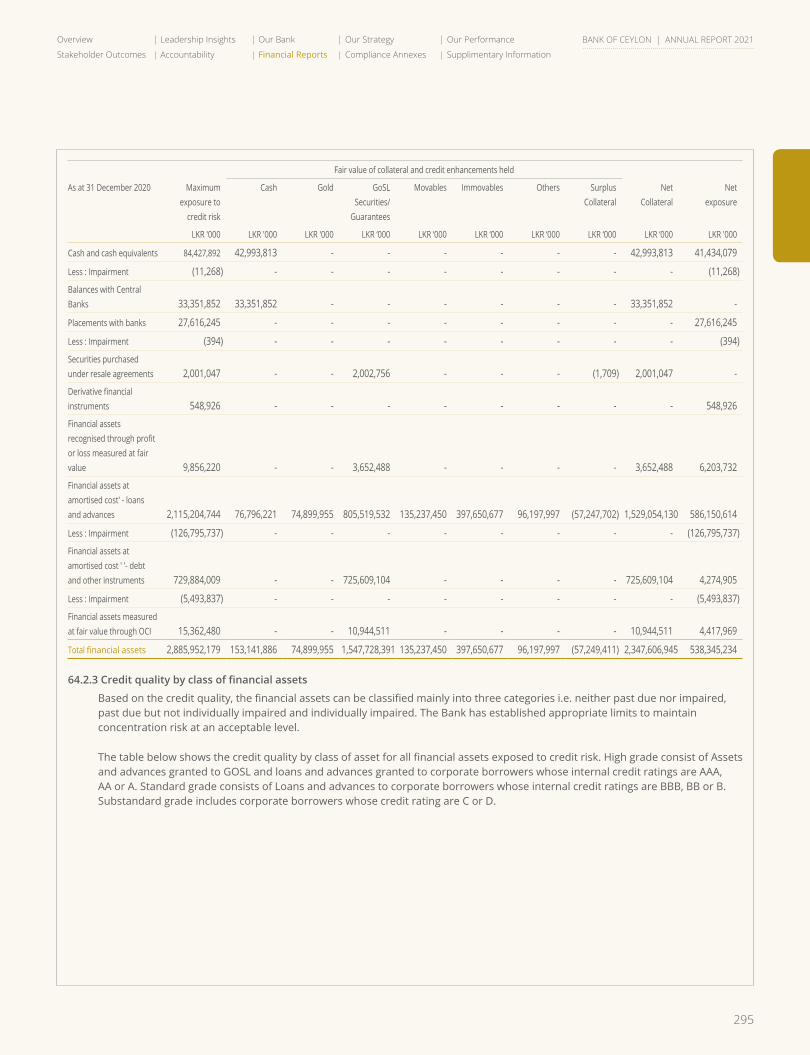
295
Overview Leadership Insights Our Bank Our Strategy Our Performance
Stakeholder Outcomes Accountability Financial Reports Compliance Annexes Supplimentary Information
BANK OF CEYLON | ANNUAL REPORT 2021
Fair value of collateral and credit enhancements held
As at 31 December 2020 Maximumexposure to
credit risk
Cash Gold GoSL Securities/
Guarantees
Movables Immovables Others SurplusCollateral
Net Collateral
Net exposure
LKR '000 LKR '000 LKR '000 LKR ‘000 LKR ‘000 LKR ‘000 LKR ‘000 LKR ‘000 LKR ‘000 LKR '000
Cash and cash equivalents 84,427,892 42,993,813 - - - - - - 42,993,813 41,434,079
Less : Impairment (11,268) - - - - - - - - (11,268)
Balances with Central Banks 33,351,852 33,351,852 - - - - - - 33,351,852 -
Placements with banks 27,616,245 - - - - - - - - 27,616,245
Less : Impairment (394) - - - - - - - - (394)
Securities purchased under resale agreements 2,001,047 - - 2,002,756 - - - (1,709) 2,001,047 -
Derivative financial instruments 548,926 - - - - - - - - 548,926
Financial assets recognised through profit or loss measured at fair value 9,856,220 - - 3,652,488 - - - - 3,652,488 6,203,732
Financial assets at amortised cost' - loans and advances 2,115,204,744 76,796,221 74,899,955 805,519,532 135,237,450 397,650,677 96,197,997 (57,247,702) 1,529,054,130 586,150,614
Less : Impairment (126,795,737) - - - - - - - - (126,795,737)
Financial assets at amortised cost ' '- debt and other instruments 729,884,009 - - 725,609,104 - - - - 725,609,104 4,274,905
Less : Impairment (5,493,837) - - - - - - - - (5,493,837)
Financial assets measured at fair value through OCI 15,362,480 - - 10,944,511 - - - - 10,944,511 4,417,969
Total financial assets 2,885,952,179 153,141,886 74,899,955 1,547,728,391 135,237,450 397,650,677 96,197,997 (57,249,411) 2,347,606,945 538,345,234
64.2.3Creditqualitybyclassoffinancialassets
Based on the credit quality, the financial assets can be classified mainly into three categories i.e. neither past due nor impaired, past due but not individually impaired and individually impaired. The Bank has established appropriate limits to maintain concentration risk at an acceptable level.
The table below shows the credit quality by class of asset for all financial assets exposed to credit risk. High grade consist of Assets and advances granted to GOSL and loans and advances granted to corporate borrowers whose internal credit ratings are AAA, AA or A. Standard grade consists of Loans and advances to corporate borrowers whose internal credit ratings are BBB, BB or B. Substandard grade includes corporate borrowers whose credit rating are C or D.
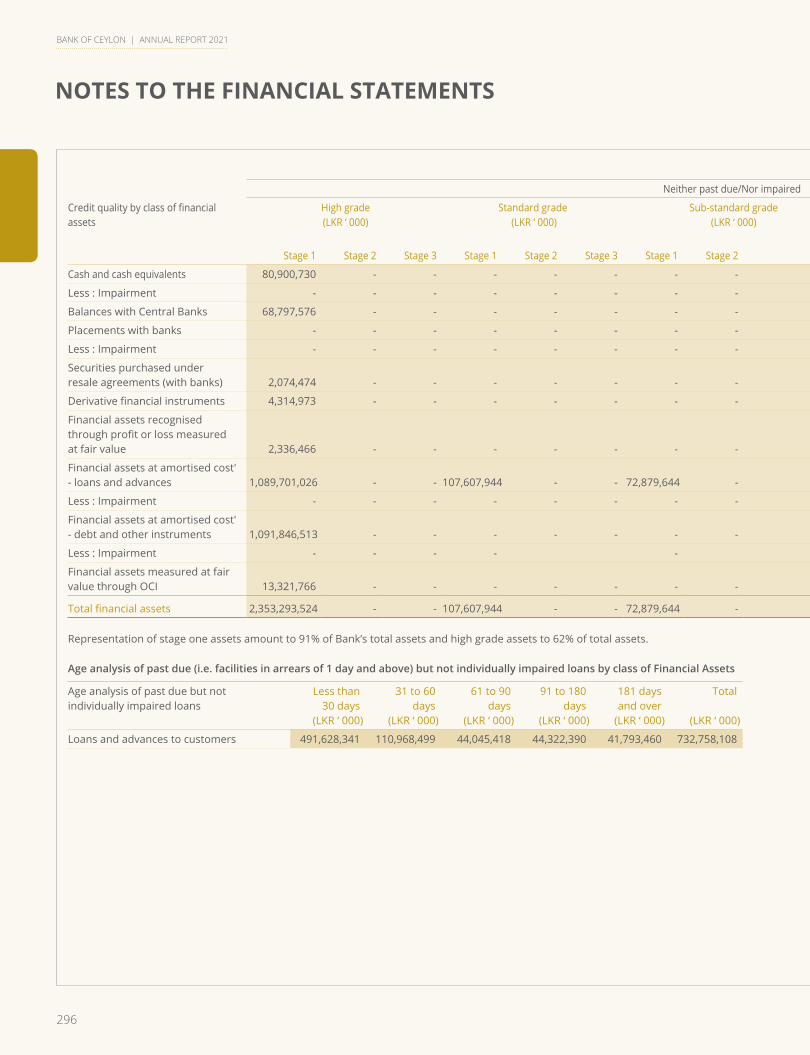
296
NOTES TO THE FINANCIAL STATEMENTS
BANK OF CEYLON | ANNUAL REPORT 2021
As At 31 December 2021
Neither past due/Nor impaired
Credit quality by class of financial assets
High grade (LKR ‘ 000)
Standard grade (LKR ‘ 000)
Sub-standard grade (LKR ‘ 000)
Grades not allocated / Un rated(LKR ‘ 000)
Past due but not individually impaired(LKR ‘ 000)
Individually impaired
(LKR ‘ 000)
Total(LKR ‘ 000)
Stage 1 Stage 2 Stage 3 Stage 1 Stage 2 Stage 3 Stage 1 Stage 2 Stage 3 Stage 1 Stage 2 Stage 3 Stage 1 Stage 2 Stage 3 Stage 3
Cash and cash equivalents 80,900,730 - - - - - - - - 1,758,879 - - - - - - 82,659,609
Less : Impairment - - - - - - - - - - - - - - - - (12,203)
Balances with Central Banks 68,797,576 - - - - - - - - 5,324,205 - - - - - - 74,121,781
Placements with banks - - - - - - - - - 4,957,950 - - - - - - 4,957,950
Less : Impairment - - - - - - - - - - - - - - - - (533)
Securities purchased under resale agreements (with banks) 2,074,474 - - - - - - - - - - - - - - - 2,074,474
Derivative financial instruments 4,314,973 - - - - - - - - 27,558 - - - - - - 4,342,531
Financial assets recognised through profit or loss measured at fair value 2,336,466 - - - - - - - - 6,893,556 - - - - - - 9,230,022
Financial assets at amortised cost' - loans and advances 1,089,701,026 - -
107,607,944 - - 72,879,644 - - 408,679,574 - - 491,628,341 155,013,917 86,115,850 165,041,877 2,576,668,173
Less : Impairment - - - - - - - - - - - - - - - - (162,905,882)
Financial assets at amortised cost' - debt and other instruments 1,091,846,513 - - - - - - - - 4,132,444 - - - - - - 1,095,978,957
Less : Impairment - - - - - - - - - - - - - (13,799,081)
Financial assets measured at fair value through OCI 13,321,766 - - - - - - - - 4,980,790 - - - - - - 18,302,556
Total financial assets 2,353,293,524 - - 107,607,944 - - 72,879,644 - - 436,754,956 - - 491,628,341 155,013,917 86,115,850 165,041,877 3,691,618,354
Representation of stage one assets amount to 91% of Bank’s total assets and high grade assets to 62% of total assets.
Age analysis of past due (i.e. facilities in arrears of 1 day and above) but not individually impaired loans by class of Financial Assets
Age analysis of past due but not individually impaired loans
Less than 30 days
(LKR ‘ 000)
31 to 60 days
(LKR ‘ 000)
61 to 90 days
(LKR ‘ 000)
91 to 180 days
(LKR ‘ 000)
181 days and over
(LKR ‘ 000)
Total
(LKR ‘ 000)
Loans and advances to customers 491,628,341 110,968,499 44,045,418 44,322,390 41,793,460 732,758,108
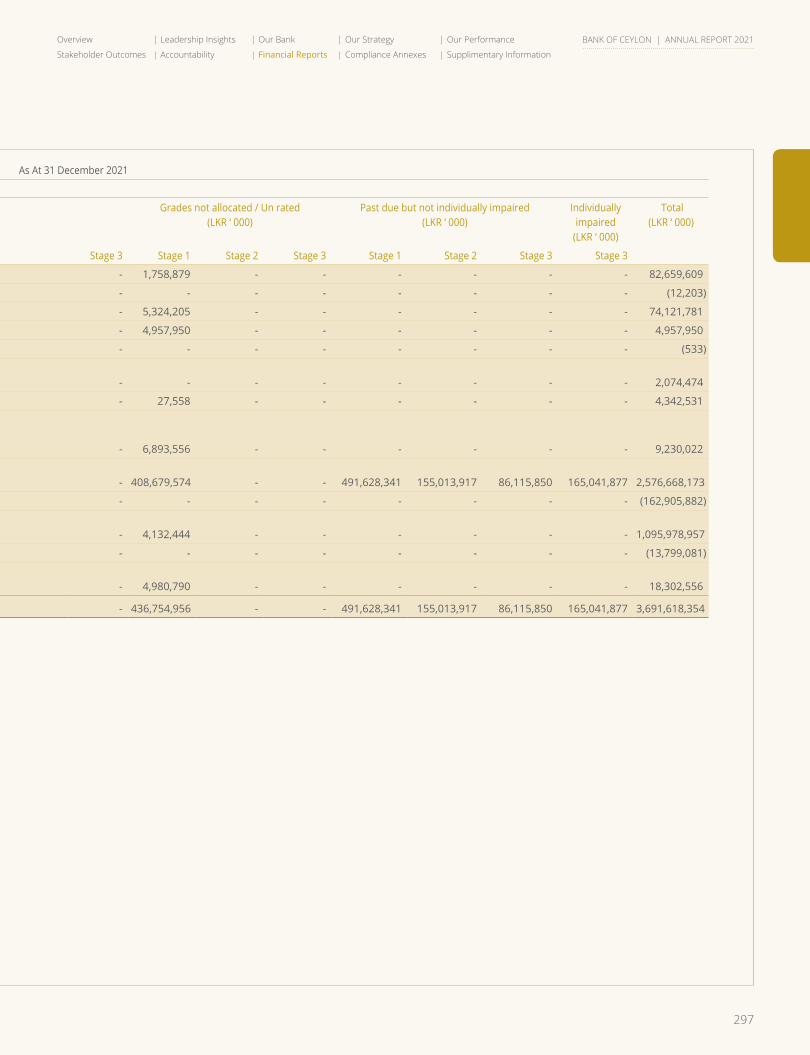
297
Overview Leadership Insights Our Bank Our Strategy Our Performance
Stakeholder Outcomes Accountability Financial Reports Compliance Annexes Supplimentary Information
BANK OF CEYLON | ANNUAL REPORT 2021
As At 31 December 2021
Neither past due/Nor impaired
Credit quality by class of financial assets
High grade (LKR ‘ 000)
Standard grade (LKR ‘ 000)
Sub-standard grade (LKR ‘ 000)
Grades not allocated / Un rated(LKR ‘ 000)
Past due but not individually impaired(LKR ‘ 000)
Individually impaired
(LKR ‘ 000)
Total(LKR ‘ 000)
Stage 1 Stage 2 Stage 3 Stage 1 Stage 2 Stage 3 Stage 1 Stage 2 Stage 3 Stage 1 Stage 2 Stage 3 Stage 1 Stage 2 Stage 3 Stage 3
Cash and cash equivalents 80,900,730 - - - - - - - - 1,758,879 - - - - - - 82,659,609
Less : Impairment - - - - - - - - - - - - - - - - (12,203)
Balances with Central Banks 68,797,576 - - - - - - - - 5,324,205 - - - - - - 74,121,781
Placements with banks - - - - - - - - - 4,957,950 - - - - - - 4,957,950
Less : Impairment - - - - - - - - - - - - - - - - (533)
Securities purchased under resale agreements (with banks) 2,074,474 - - - - - - - - - - - - - - - 2,074,474
Derivative financial instruments 4,314,973 - - - - - - - - 27,558 - - - - - - 4,342,531
Financial assets recognised through profit or loss measured at fair value 2,336,466 - - - - - - - - 6,893,556 - - - - - - 9,230,022
Financial assets at amortised cost' - loans and advances 1,089,701,026 - -
107,607,944 - - 72,879,644 - - 408,679,574 - - 491,628,341 155,013,917 86,115,850 165,041,877 2,576,668,173
Less : Impairment - - - - - - - - - - - - - - - - (162,905,882)
Financial assets at amortised cost' - debt and other instruments 1,091,846,513 - - - - - - - - 4,132,444 - - - - - - 1,095,978,957
Less : Impairment - - - - - - - - - - - - - (13,799,081)
Financial assets measured at fair value through OCI 13,321,766 - - - - - - - - 4,980,790 - - - - - - 18,302,556
Total financial assets 2,353,293,524 - - 107,607,944 - - 72,879,644 - - 436,754,956 - - 491,628,341 155,013,917 86,115,850 165,041,877 3,691,618,354
Representation of stage one assets amount to 91% of Bank’s total assets and high grade assets to 62% of total assets.
Age analysis of past due (i.e. facilities in arrears of 1 day and above) but not individually impaired loans by class of Financial Assets
Age analysis of past due but not individually impaired loans
Less than 30 days
(LKR ‘ 000)
31 to 60 days
(LKR ‘ 000)
61 to 90 days
(LKR ‘ 000)
91 to 180 days
(LKR ‘ 000)
181 days and over
(LKR ‘ 000)
Total
(LKR ‘ 000)
Loans and advances to customers 491,628,341 110,968,499 44,045,418 44,322,390 41,793,460 732,758,108
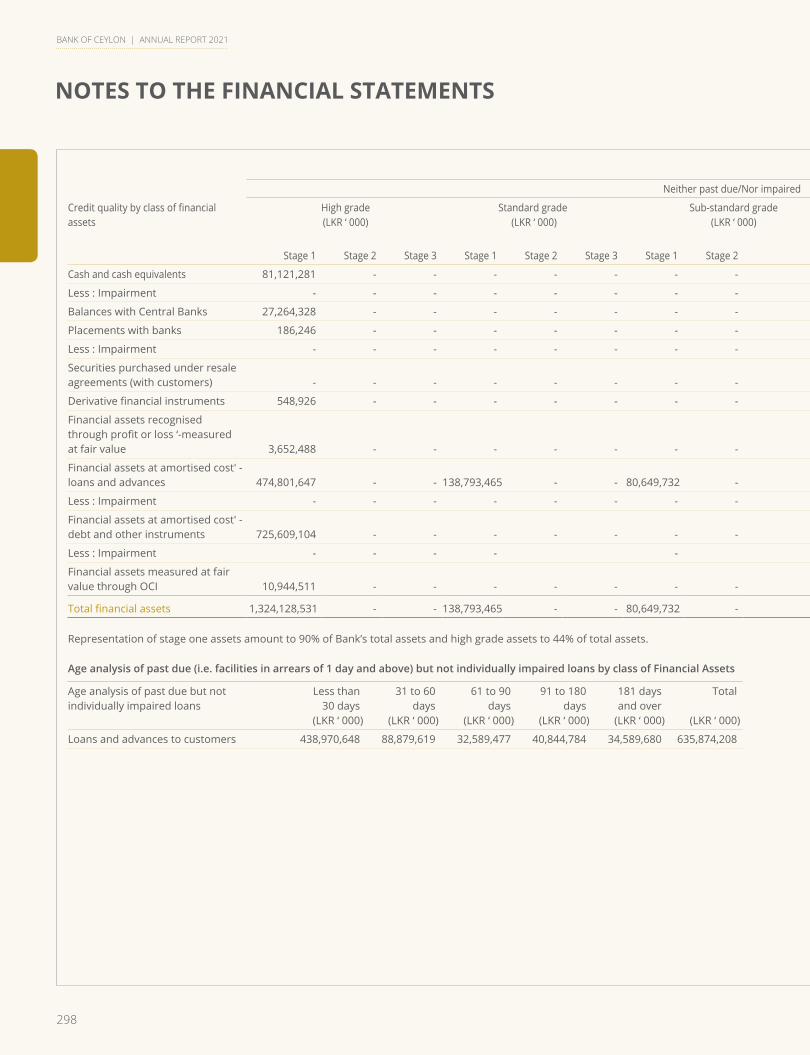
298
NOTES TO THE FINANCIAL STATEMENTS
BANK OF CEYLON | ANNUAL REPORT 2021
As At 31 December 2020
Neither past due/Nor impaired
Credit quality by class of financial assets
High grade (LKR ‘ 000)
Standard grade (LKR ‘ 000)
Sub-standard grade (LKR ‘ 000)
Grades not allocated / Un rated(LKR ‘ 000)
Past due but not individually impaired(LKR ‘ 000)
Individually impaired
(LKR ‘ 000)
Total(LKR ‘ 000)
Stage 1 Stage 2 Stage 3 Stage 1 Stage 2 Stage 3 Stage 1 Stage 2 Stage 3 Stage 1 Stage 2 Stage 3 Stage 1 Stage 2 Stage 3 Stage 3
Cash and cash equivalents 81,121,281 - - - - - - - - 3,306,611 - - - - - - 84,427,892
Less : Impairment - - - - - - - - - - - - - - - - (11,268)
Balances with Central Banks 27,264,328 - - - - - - - - 6,087,524 - - - - - - 33,351,852
Placements with banks 186,246 - - - - - - - - 27,429,999 - - - - - - 27,616,245
Less : Impairment - - - - - - - - - - - - - - - - (394)
Securities purchased under resale agreements (with customers) - - - - - - - - - 2,001,047 - - - - - - 2,001,047
Derivative financial instruments 548,926 - - - - - - - - - - - - - - - 548,926
Financial assets recognised through profit or loss ‘-measured at fair value 3,652,488 - - - - - - - - 6,203,732 - - - - - - 9,856,220
Financial assets at amortised cost' - loans and advances 474,801,647 - - 138,793,465 - - 80,649,732 - - 652,996,214 - - 438,970,648 121,469,096 75,434,464 132,089,478 2,115,204,744
Less : Impairment - - - - - - - - - - - - - - - - (126,795,737)
Financial assets at amortised cost' - debt and other instruments 725,609,104 - - - - - - - - 4,274,905 - - - - - - 729,884,009
Less : Impairment - - - - - - - - - - - - - (5,493,837)
Financial assets measured at fair value through OCI 10,944,511 - - - - - - - - 4,417,969 - - - - - - 15,362,480
Total financial assets 1,324,128,531 - - 138,793,465 - - 80,649,732 - - 706,718,001 - - 438,970,648 121,469,096 75,434,464 132,089,478 2,885,952,179
Representation of stage one assets amount to 90% of Bank’s total assets and high grade assets to 44% of total assets.
Age analysis of past due (i.e. facilities in arrears of 1 day and above) but not individually impaired loans by class of Financial Assets
Age analysis of past due but not individually impaired loans
Less than 30 days
(LKR ‘ 000)
31 to 60 days
(LKR ‘ 000)
61 to 90 days
(LKR ‘ 000)
91 to 180 days
(LKR ‘ 000)
181 days and over
(LKR ‘ 000)
Total
(LKR ‘ 000)
Loans and advances to customers 438,970,648 88,879,619 32,589,477 40,844,784 34,589,680 635,874,208
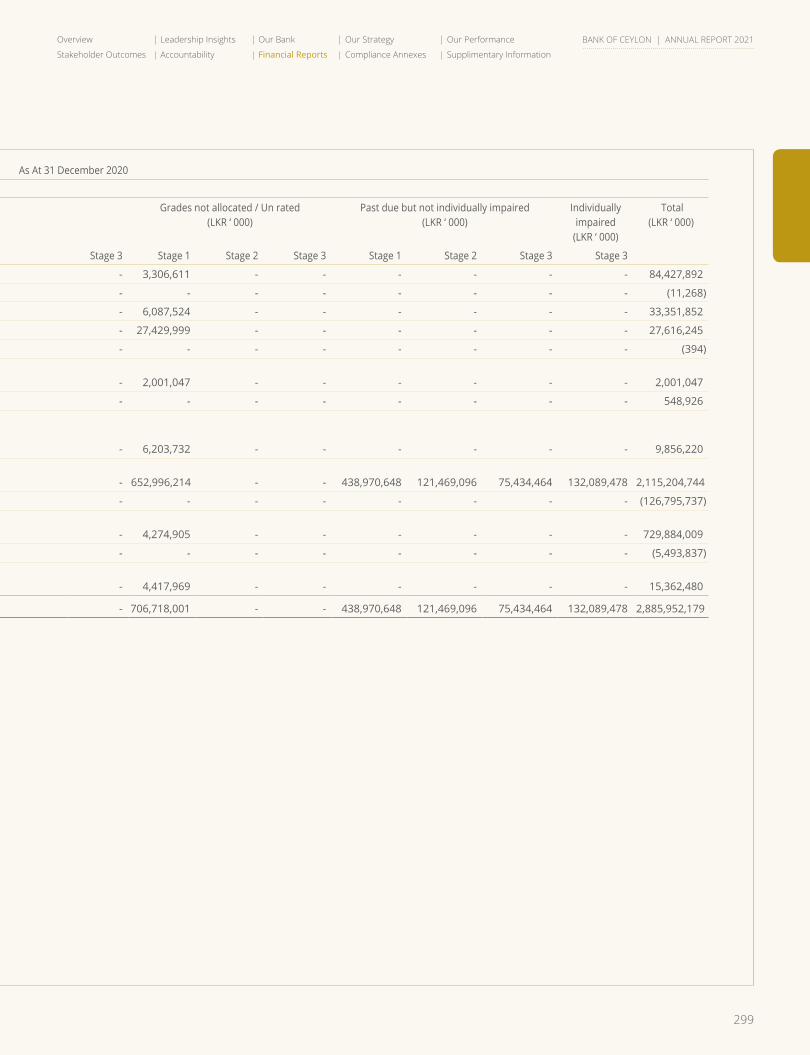
299
Overview Leadership Insights Our Bank Our Strategy Our Performance
Stakeholder Outcomes Accountability Financial Reports Compliance Annexes Supplimentary Information
BANK OF CEYLON | ANNUAL REPORT 2021
As At 31 December 2020
Neither past due/Nor impaired
Credit quality by class of financial assets
High grade (LKR ‘ 000)
Standard grade (LKR ‘ 000)
Sub-standard grade (LKR ‘ 000)
Grades not allocated / Un rated(LKR ‘ 000)
Past due but not individually impaired(LKR ‘ 000)
Individually impaired
(LKR ‘ 000)
Total(LKR ‘ 000)
Stage 1 Stage 2 Stage 3 Stage 1 Stage 2 Stage 3 Stage 1 Stage 2 Stage 3 Stage 1 Stage 2 Stage 3 Stage 1 Stage 2 Stage 3 Stage 3
Cash and cash equivalents 81,121,281 - - - - - - - - 3,306,611 - - - - - - 84,427,892
Less : Impairment - - - - - - - - - - - - - - - - (11,268)
Balances with Central Banks 27,264,328 - - - - - - - - 6,087,524 - - - - - - 33,351,852
Placements with banks 186,246 - - - - - - - - 27,429,999 - - - - - - 27,616,245
Less : Impairment - - - - - - - - - - - - - - - - (394)
Securities purchased under resale agreements (with customers) - - - - - - - - - 2,001,047 - - - - - - 2,001,047
Derivative financial instruments 548,926 - - - - - - - - - - - - - - - 548,926
Financial assets recognised through profit or loss ‘-measured at fair value 3,652,488 - - - - - - - - 6,203,732 - - - - - - 9,856,220
Financial assets at amortised cost' - loans and advances 474,801,647 - - 138,793,465 - - 80,649,732 - - 652,996,214 - - 438,970,648 121,469,096 75,434,464 132,089,478 2,115,204,744
Less : Impairment - - - - - - - - - - - - - - - - (126,795,737)
Financial assets at amortised cost' - debt and other instruments 725,609,104 - - - - - - - - 4,274,905 - - - - - - 729,884,009
Less : Impairment - - - - - - - - - - - - - (5,493,837)
Financial assets measured at fair value through OCI 10,944,511 - - - - - - - - 4,417,969 - - - - - - 15,362,480
Total financial assets 1,324,128,531 - - 138,793,465 - - 80,649,732 - - 706,718,001 - - 438,970,648 121,469,096 75,434,464 132,089,478 2,885,952,179
Representation of stage one assets amount to 90% of Bank’s total assets and high grade assets to 44% of total assets.
Age analysis of past due (i.e. facilities in arrears of 1 day and above) but not individually impaired loans by class of Financial Assets
Age analysis of past due but not individually impaired loans
Less than 30 days
(LKR ‘ 000)
31 to 60 days
(LKR ‘ 000)
61 to 90 days
(LKR ‘ 000)
91 to 180 days
(LKR ‘ 000)
181 days and over
(LKR ‘ 000)
Total
(LKR ‘ 000)
Loans and advances to customers 438,970,648 88,879,619 32,589,477 40,844,784 34,589,680 635,874,208
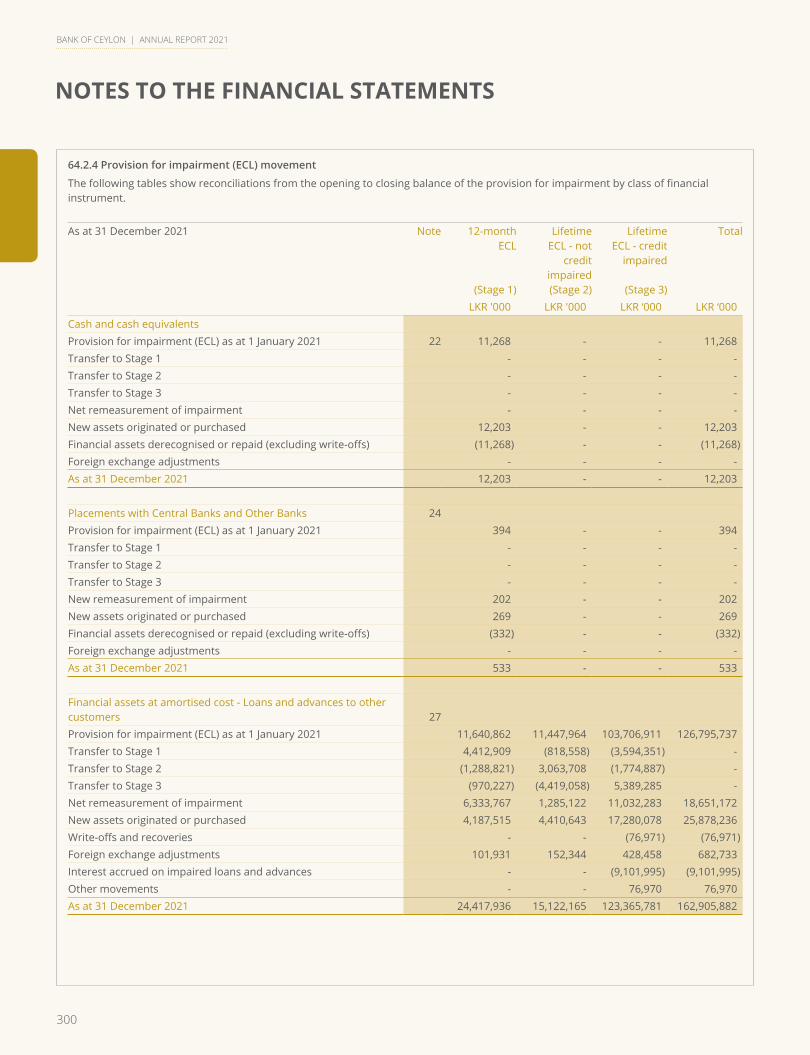
300
NOTES TO THE FINANCIAL STATEMENTS
BANK OF CEYLON | ANNUAL REPORT 2021
64.2.4 Provision for impairment (ECL) movement
The following tables show reconciliations from the opening to closing balance of the provision for impairment by class of financial instrument.
As at 31 December 2021 Note 12-monthECL
(Stage 1)
LifetimeECL - not
creditimpaired(Stage 2)
LifetimeECL - credit
impaired
(Stage 3)
Total
LKR '000 LKR '000 LKR ‘000 LKR ‘000Cash and cash equivalentsProvision for impairment (ECL) as at 1 January 2021 22 11,268 - - 11,268 Transfer to Stage 1 - - - - Transfer to Stage 2 - - - - Transfer to Stage 3 - - - - Net remeasurement of impairment - - - - New assets originated or purchased 12,203 - - 12,203 Financial assets derecognised or repaid (excluding write-offs) (11,268) - - (11,268)Foreign exchange adjustments - - - - As at 31 December 2021 12,203 - - 12,203
Placements with Central Banks and Other Banks 24Provision for impairment (ECL) as at 1 January 2021 394 - - 394 Transfer to Stage 1 - - - - Transfer to Stage 2 - - - - Transfer to Stage 3 - - - - New remeasurement of impairment 202 - - 202 New assets originated or purchased 269 - - 269 Financial assets derecognised or repaid (excluding write-offs) (332) - - (332)Foreign exchange adjustments - - - - As at 31 December 2021 533 - - 533
Financial assets at amortised cost - Loans and advances to other customers 27Provision for impairment (ECL) as at 1 January 2021 11,640,862 11,447,964 103,706,911 126,795,737 Transfer to Stage 1 4,412,909 (818,558) (3,594,351) -Transfer to Stage 2 (1,288,821) 3,063,708 (1,774,887) -Transfer to Stage 3 (970,227) (4,419,058) 5,389,285 -Net remeasurement of impairment 6,333,767 1,285,122 11,032,283 18,651,172New assets originated or purchased 4,187,515 4,410,643 17,280,078 25,878,236Write-offs and recoveries - - (76,971) (76,971)Foreign exchange adjustments 101,931 152,344 428,458 682,733 Interest accrued on impaired loans and advances - - (9,101,995) (9,101,995)Other movements - - 76,970 76,970As at 31 December 2021 24,417,936 15,122,165 123,365,781 162,905,882
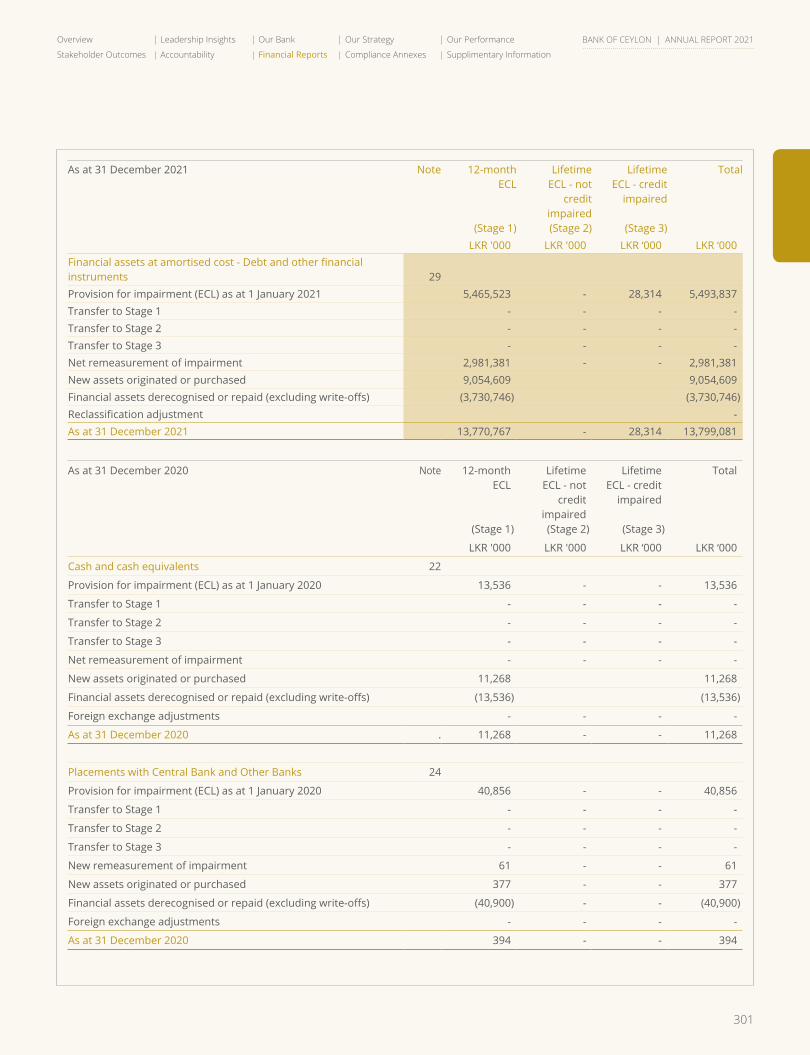
301
Overview Leadership Insights Our Bank Our Strategy Our Performance
Stakeholder Outcomes Accountability Financial Reports Compliance Annexes Supplimentary Information
BANK OF CEYLON | ANNUAL REPORT 2021
As at 31 December 2021 Note 12-monthECL
(Stage 1)
LifetimeECL - not
creditimpaired(Stage 2)
LifetimeECL - credit
impaired
(Stage 3)
Total
LKR '000 LKR '000 LKR ‘000 LKR ‘000Financial assets at amortised cost - Debt and other financial instruments 29Provision for impairment (ECL) as at 1 January 2021 5,465,523 - 28,314 5,493,837 Transfer to Stage 1 - - - - Transfer to Stage 2 - - - - Transfer to Stage 3 - - - - Net remeasurement of impairment 2,981,381 - - 2,981,381 New assets originated or purchased 9,054,609 9,054,609 Financial assets derecognised or repaid (excluding write-offs) (3,730,746) (3,730,746)Reclassification adjustment - As at 31 December 2021 13,770,767 - 28,314 13,799,081
As at 31 December 2020 Note 12-monthECL
(Stage 1)
LifetimeECL - not
creditimpaired(Stage 2)
LifetimeECL - credit
impaired
(Stage 3)
Total
LKR '000 LKR '000 LKR ‘000 LKR ‘000
Cash and cash equivalents 22
Provision for impairment (ECL) as at 1 January 2020 13,536 - - 13,536
Transfer to Stage 1 - - - -
Transfer to Stage 2 - - - -
Transfer to Stage 3 - - - -
Net remeasurement of impairment - - - -
New assets originated or purchased 11,268 11,268
Financial assets derecognised or repaid (excluding write-offs) (13,536) (13,536)
Foreign exchange adjustments - - - -
As at 31 December 2020 . 11,268 - - 11,268
Placements with Central Bank and Other Banks 24
Provision for impairment (ECL) as at 1 January 2020 40,856 - - 40,856
Transfer to Stage 1 - - - -
Transfer to Stage 2 - - - -
Transfer to Stage 3 - - - -
New remeasurement of impairment 61 - - 61
New assets originated or purchased 377 - - 377
Financial assets derecognised or repaid (excluding write-offs) (40,900) - - (40,900)
Foreign exchange adjustments - - - -
As at 31 December 2020 394 - - 394
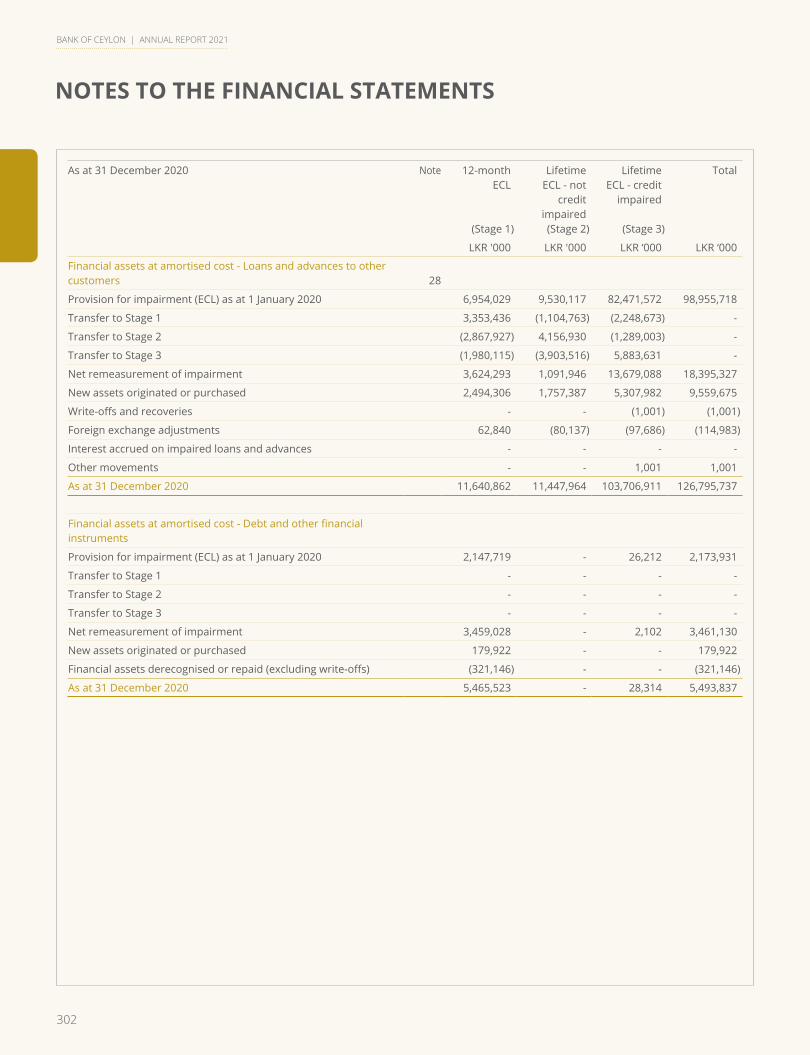
302
NOTES TO THE FINANCIAL STATEMENTS
BANK OF CEYLON | ANNUAL REPORT 2021
As at 31 December 2020 Note 12-monthECL
(Stage 1)
LifetimeECL - not
creditimpaired(Stage 2)
LifetimeECL - credit
impaired
(Stage 3)
Total
LKR '000 LKR '000 LKR ‘000 LKR ‘000
Financial assets at amortised cost - Loans and advances to other customers 28
Provision for impairment (ECL) as at 1 January 2020 6,954,029 9,530,117 82,471,572 98,955,718
Transfer to Stage 1 3,353,436 (1,104,763) (2,248,673) -
Transfer to Stage 2 (2,867,927) 4,156,930 (1,289,003) -
Transfer to Stage 3 (1,980,115) (3,903,516) 5,883,631 -
Net remeasurement of impairment 3,624,293 1,091,946 13,679,088 18,395,327
New assets originated or purchased 2,494,306 1,757,387 5,307,982 9,559,675
Write-offs and recoveries - - (1,001) (1,001)
Foreign exchange adjustments 62,840 (80,137) (97,686) (114,983)
Interest accrued on impaired loans and advances - - - -
Other movements - - 1,001 1,001
As at 31 December 2020 11,640,862 11,447,964 103,706,911 126,795,737
Financial assets at amortised cost - Debt and other financial instruments
Provision for impairment (ECL) as at 1 January 2020 2,147,719 - 26,212 2,173,931
Transfer to Stage 1 - - - -
Transfer to Stage 2 - - - -
Transfer to Stage 3 - - - -
Net remeasurement of impairment 3,459,028 - 2,102 3,461,130
New assets originated or purchased 179,922 - - 179,922
Financial assets derecognised or repaid (excluding write-offs) (321,146) - - (321,146)
As at 31 December 2020 5,465,523 - 28,314 5,493,837

303
Overview Leadership Insights Our Bank Our Strategy Our Performance
Stakeholder Outcomes Accountability Financial Reports Compliance Annexes Supplimentary Information
BANK OF CEYLON | ANNUAL REPORT 2021
64.2.5 Analysis of risk concentration
Concentration risk in credit portfolios arises due to an uneven distribution of bank loans to individual borrowers, industry, sector or geographical regions. In managing the concentration risk the bank uses the Herfindahl-Hrischman Index (HHI) as a measurement tool. The Bank has established appropriate limits to maintain concentration risk at an acceptable level.
64.2.6 Country wise exposure
The Bank has established branches in three countries i.e. India, Maldives, and Seychelles through which the bank mainly maintains exposures outside Sri Lanka. Bank also has a fully owned subsidiary operating in United Kingdom (UK). All overseas branches are operating with pre-set limits (credit limits as well as country limits) which are approved by the Board of Directors.
Exposures in other countries include placements with banks and nostro account balances with correspondent banks whose risks are managed through Board approved limits.
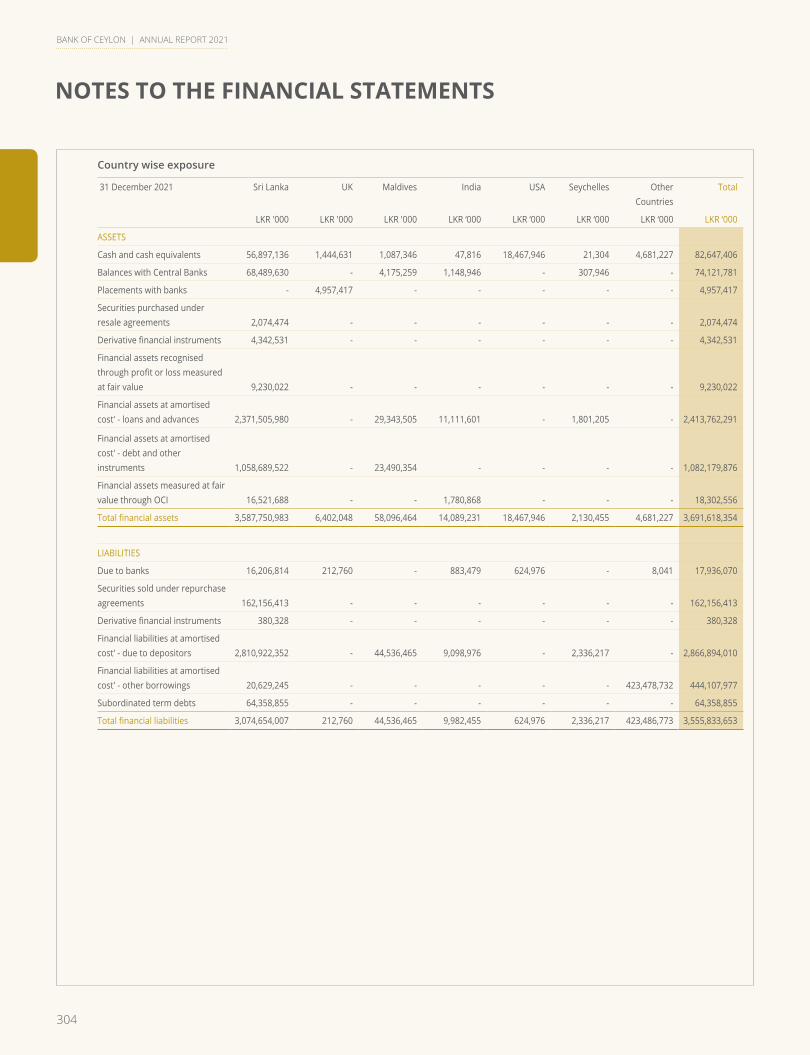
304
NOTES TO THE FINANCIAL STATEMENTS
BANK OF CEYLON | ANNUAL REPORT 2021
Country wise exposure
31 December 2021 Sri Lanka UK Maldives India USA Seychelles OtherCountries
Total
LKR '000 LKR '000 LKR '000 LKR ‘000 LKR ‘000 LKR ‘000 LKR ‘000 LKR ‘000
ASSETS
Cash and cash equivalents 56,897,136 1,444,631 1,087,346 47,816 18,467,946 21,304 4,681,227 82,647,406
Balances with Central Banks 68,489,630 - 4,175,259 1,148,946 - 307,946 - 74,121,781
Placements with banks - 4,957,417 - - - - - 4,957,417
Securities purchased under resale agreements 2,074,474 - - - - - - 2,074,474
Derivative financial instruments 4,342,531 - - - - - - 4,342,531
Financial assets recognised through profit or loss measured at fair value 9,230,022 - - - - - - 9,230,022
Financial assets at amortised cost' - loans and advances 2,371,505,980 - 29,343,505 11,111,601 - 1,801,205 - 2,413,762,291
Financial assets at amortised cost' - debt and other instruments 1,058,689,522 - 23,490,354 - - - - 1,082,179,876
Financial assets measured at fair value through OCI 16,521,688 - - 1,780,868 - - - 18,302,556
Total financial assets 3,587,750,983 6,402,048 58,096,464 14,089,231 18,467,946 2,130,455 4,681,227 3,691,618,354
LIABILITIES
Due to banks 16,206,814 212,760 - 883,479 624,976 - 8,041 17,936,070
Securities sold under repurchase agreements 162,156,413 - - - - - - 162,156,413
Derivative financial instruments 380,328 - - - - - - 380,328
Financial liabilities at amortised cost' - due to depositors 2,810,922,352 - 44,536,465 9,098,976 - 2,336,217 - 2,866,894,010
Financial liabilities at amortised cost' - other borrowings 20,629,245 - - - - - 423,478,732 444,107,977
Subordinated term debts 64,358,855 - - - - - - 64,358,855
Total financial liabilities 3,074,654,007 212,760 44,536,465 9,982,455 624,976 2,336,217 423,486,773 3,555,833,653
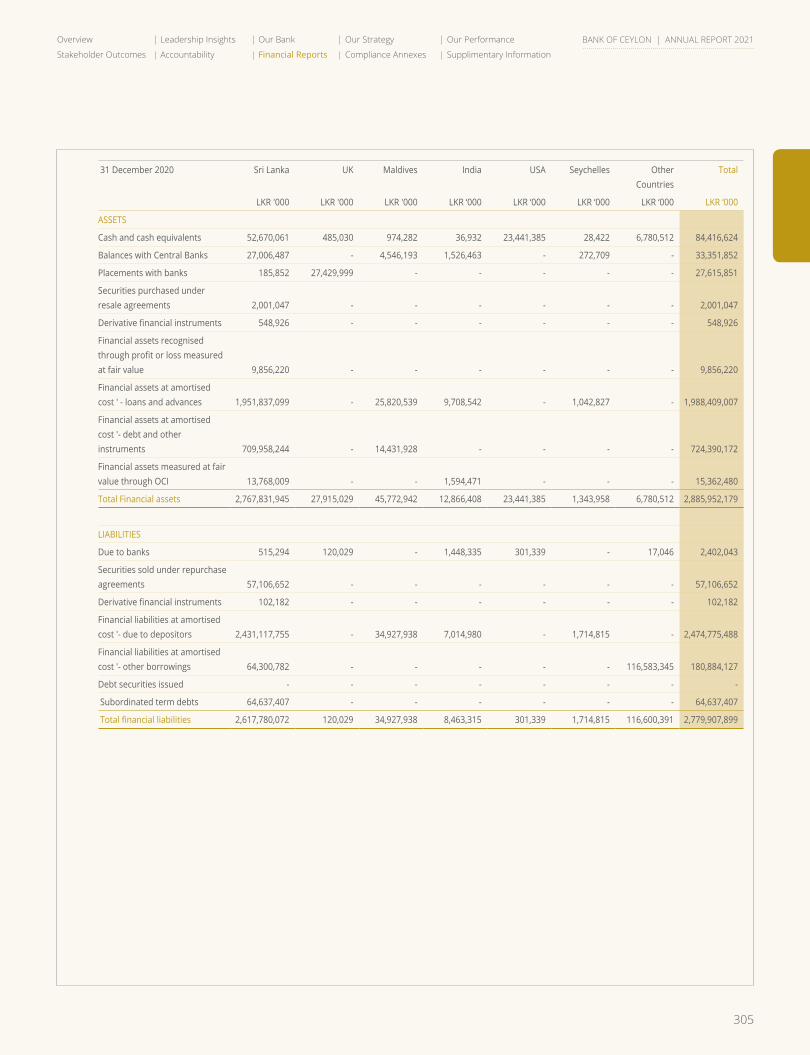
305
Overview Leadership Insights Our Bank Our Strategy Our Performance
Stakeholder Outcomes Accountability Financial Reports Compliance Annexes Supplimentary Information
BANK OF CEYLON | ANNUAL REPORT 2021
31 December 2020 Sri Lanka UK Maldives India USA Seychelles OtherCountries
Total
LKR '000 LKR '000 LKR '000 LKR ‘000 LKR ‘000 LKR ‘000 LKR ‘000 LKR ‘000
ASSETS
Cash and cash equivalents 52,670,061 485,030 974,282 36,932 23,441,385 28,422 6,780,512 84,416,624
Balances with Central Banks 27,006,487 - 4,546,193 1,526,463 - 272,709 - 33,351,852
Placements with banks 185,852 27,429,999 - - - - - 27,615,851
Securities purchased under resale agreements 2,001,047 - - - - - - 2,001,047
Derivative financial instruments 548,926 - - - - - - 548,926
Financial assets recognised through profit or loss measured at fair value 9,856,220 - - - - - - 9,856,220
Financial assets at amortised cost ' - loans and advances 1,951,837,099 - 25,820,539 9,708,542 - 1,042,827 - 1,988,409,007
Financial assets at amortised cost '- debt and other instruments 709,958,244 - 14,431,928 - - - - 724,390,172
Financial assets measured at fair value through OCI 13,768,009 - - 1,594,471 - - - 15,362,480
Total Financial assets 2,767,831,945 27,915,029 45,772,942 12,866,408 23,441,385 1,343,958 6,780,512 2,885,952,179
LIABILITIES
Due to banks 515,294 120,029 - 1,448,335 301,339 - 17,046 2,402,043
Securities sold under repurchase agreements 57,106,652 - - - - - - 57,106,652
Derivative financial instruments 102,182 - - - - - - 102,182
Financial liabilities at amortised cost '- due to depositors 2,431,117,755 - 34,927,938 7,014,980 - 1,714,815 - 2,474,775,488
Financial liabilities at amortised cost '- other borrowings 64,300,782 - - - - - 116,583,345 180,884,127
Debt securities issued - - - - - - - -
Subordinated term debts 64,637,407 - - - - - - 64,637,407
Total financial liabilities 2,617,780,072 120,029 34,927,938 8,463,315 301,339 1,714,815 116,600,391 2,779,907,899
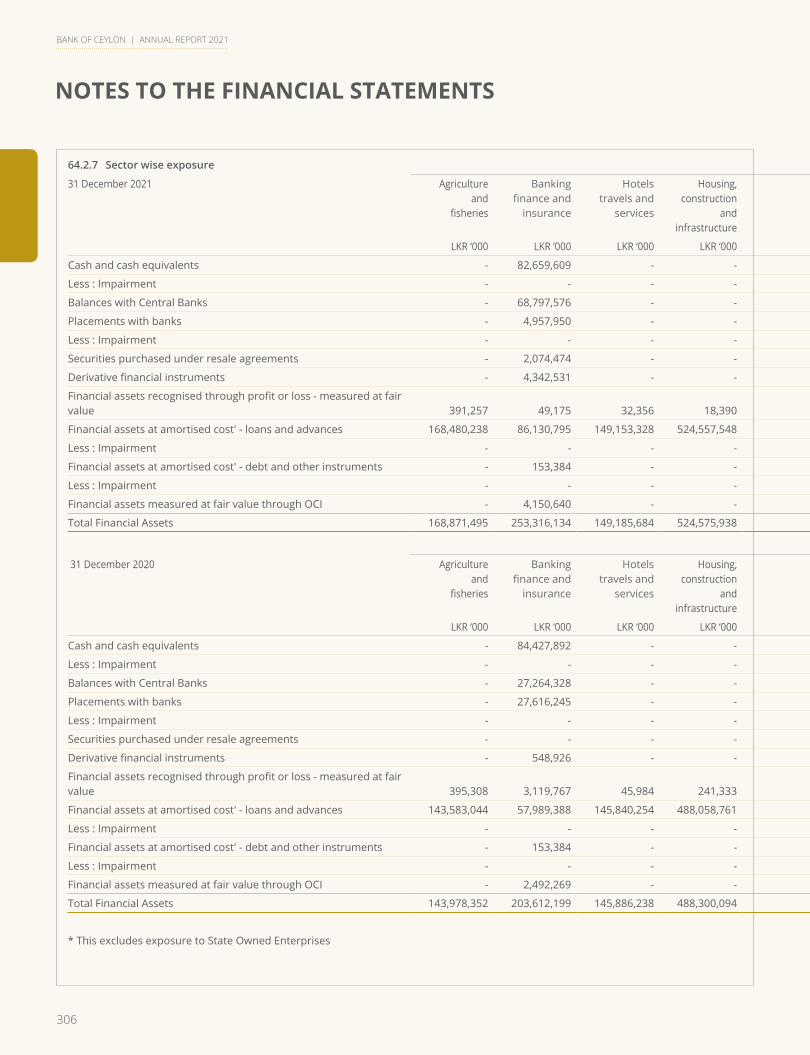
306
NOTES TO THE FINANCIAL STATEMENTS
BANK OF CEYLON | ANNUAL REPORT 2021
64.2.7 Sector wise exposure
31 December 2021 Agricultureand
fisheries
Bankingfinance and
insurance
Hotelstravels and
services
Housing,construction
and infrastructure
Manufacturing Commercialtrade
Sovereign and direct
government
Transportationand
logistics
Othercommercial
services
Consumptionand
others
Total
LKR ‘000 LKR ‘000 LKR ‘000 LKR ‘000 LKR ‘000 LKR ‘000 LKR ‘000 LKR ‘000 LKR ‘000 LKR ‘000 LKR ‘000
Cash and cash equivalents - 82,659,609 - - - - - - - - 82,659,609
Less : Impairment - - - - - - - - - - (12,203)
Balances with Central Banks - 68,797,576 - - - - - - 5,324,205 - 74,121,781
Placements with banks - 4,957,950 - - - - - - - - 4,957,950
Less : Impairment - - - - - - - - - - (533)
Securities purchased under resale agreements - 2,074,474 - - - - - - - - 2,074,474
Derivative financial instruments - 4,342,531 - - - - - - - - 4,342,531
Financial assets recognised through profit or loss - measured at fair value 391,257 49,175 32,356 18,390 1,730,148 8,303 2,336,466 - 102,192 4,561,735 9,230,022
Financial assets at amortised cost' - loans and advances 168,480,238 86,130,795 149,153,328 524,557,548 179,824,294 366,791,141 475,917,078* 206,713,908 81,929,293 337,170,550 2,576,668,173
Less : Impairment - - - - - - - - - - (162,905,882)
Financial assets at amortised cost' - debt and other instruments - 153,384 - - - 3,979,060 1,091,846,513 - - - 1,095,978,957
Less : Impairment - - - - - - - - - - (13,799,081)
Financial assets measured at fair value through OCI - 4,150,640 - - - - 13,321,766 - 830,150 - 18,302,556
Total Financial Assets 168,871,495 253,316,134 149,185,684 524,575,938 181,554,442 370,778,504 1,583,421,823 206,713,908 88,185,840 341,732,285 3,691,618,354
31 December 2020 Agricultureand
fisheries
Bankingfinance and
insurance
Hotelstravels and
services
Housing,construction
and infrastructure
Manufacturing Commercialtrade
Sovereign and direct
government
Transportationand
logistics
Othercommercial
services
Consumptionand
others
Total
LKR ‘000 LKR ‘000 LKR ‘000 LKR ‘000 LKR ‘000 LKR ‘000 LKR ‘000 LKR ‘000 LKR ‘000 LKR ‘000 LKR ‘000
Cash and cash equivalents - 84,427,892 - - - - - - - - 84,427,892
Less : Impairment - - - - - - - - - - (11,268)
Balances with Central Banks - 27,264,328 - - - - - - 6,087,524 - 33,351,852
Placements with banks - 27,616,245 - - - - - - - - 27,616,245
Less : Impairment - - - - - - - - - - (394)
Securities purchased under resale agreements - - - - - - - - 2,001,047 - 2,001,047
Derivative financial instruments - 548,926 - - - - - - - - 548,926
Financial assets recognised through profit or loss - measured at fair value 395,308 3,119,767 45,984 241,333 1,403,273 138,806 3,652,488 104,261 390,863 364,137 9,856,220
Financial assets at amortised cost' - loans and advances 143,583,044 57,989,388 145,840,254 488,058,761 114,697,275 266,311,439 306,860,446* 206,824,644 79,497,934 305,541,559 2,115,204,744
Less : Impairment - - - - - - - - - - (126,795,737)
Financial assets at amortised cost' - debt and other instruments - 153,384 - - - 4,121,521 725,609,104 - - - 729,884,009
Less : Impairment - - - - - - - - - - (5,493,837)
Financial assets measured at fair value through OCI - 2,492,269 - - - - 10,944,511 - 1,925,700 - 15,362,480
Total Financial Assets 143,978,352 203,612,199 145,886,238 488,300,094 116,100,548 270,571,766 1,047,066,549 206,928,905 89,903,068 305,905,696 2,885,952,179
* This excludes exposure to State Owned Enterprises
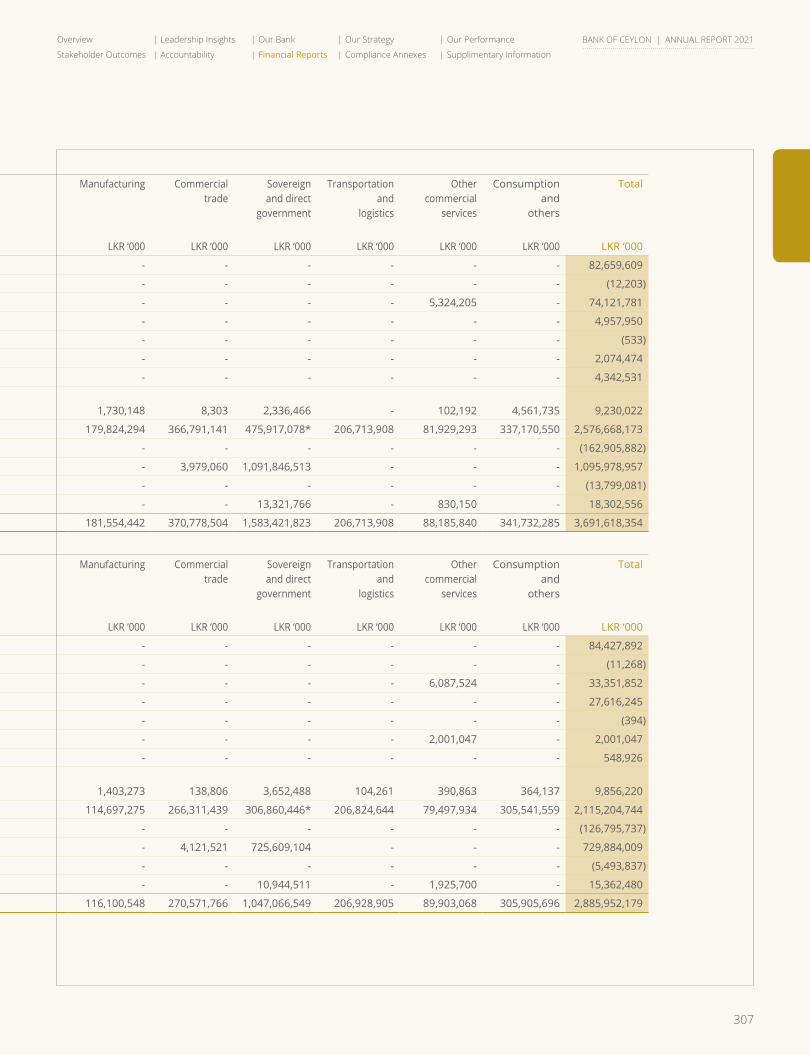
307
Overview Leadership Insights Our Bank Our Strategy Our Performance
Stakeholder Outcomes Accountability Financial Reports Compliance Annexes Supplimentary Information
BANK OF CEYLON | ANNUAL REPORT 2021
64.2.7 Sector wise exposure
31 December 2021 Agricultureand
fisheries
Bankingfinance and
insurance
Hotelstravels and
services
Housing,construction
and infrastructure
Manufacturing Commercialtrade
Sovereign and direct
government
Transportationand
logistics
Othercommercial
services
Consumptionand
others
Total
LKR ‘000 LKR ‘000 LKR ‘000 LKR ‘000 LKR ‘000 LKR ‘000 LKR ‘000 LKR ‘000 LKR ‘000 LKR ‘000 LKR ‘000
Cash and cash equivalents - 82,659,609 - - - - - - - - 82,659,609
Less : Impairment - - - - - - - - - - (12,203)
Balances with Central Banks - 68,797,576 - - - - - - 5,324,205 - 74,121,781
Placements with banks - 4,957,950 - - - - - - - - 4,957,950
Less : Impairment - - - - - - - - - - (533)
Securities purchased under resale agreements - 2,074,474 - - - - - - - - 2,074,474
Derivative financial instruments - 4,342,531 - - - - - - - - 4,342,531
Financial assets recognised through profit or loss - measured at fair value 391,257 49,175 32,356 18,390 1,730,148 8,303 2,336,466 - 102,192 4,561,735 9,230,022
Financial assets at amortised cost' - loans and advances 168,480,238 86,130,795 149,153,328 524,557,548 179,824,294 366,791,141 475,917,078* 206,713,908 81,929,293 337,170,550 2,576,668,173
Less : Impairment - - - - - - - - - - (162,905,882)
Financial assets at amortised cost' - debt and other instruments - 153,384 - - - 3,979,060 1,091,846,513 - - - 1,095,978,957
Less : Impairment - - - - - - - - - - (13,799,081)
Financial assets measured at fair value through OCI - 4,150,640 - - - - 13,321,766 - 830,150 - 18,302,556
Total Financial Assets 168,871,495 253,316,134 149,185,684 524,575,938 181,554,442 370,778,504 1,583,421,823 206,713,908 88,185,840 341,732,285 3,691,618,354
31 December 2020 Agricultureand
fisheries
Bankingfinance and
insurance
Hotelstravels and
services
Housing,construction
and infrastructure
Manufacturing Commercialtrade
Sovereign and direct
government
Transportationand
logistics
Othercommercial
services
Consumptionand
others
Total
LKR ‘000 LKR ‘000 LKR ‘000 LKR ‘000 LKR ‘000 LKR ‘000 LKR ‘000 LKR ‘000 LKR ‘000 LKR ‘000 LKR ‘000
Cash and cash equivalents - 84,427,892 - - - - - - - - 84,427,892
Less : Impairment - - - - - - - - - - (11,268)
Balances with Central Banks - 27,264,328 - - - - - - 6,087,524 - 33,351,852
Placements with banks - 27,616,245 - - - - - - - - 27,616,245
Less : Impairment - - - - - - - - - - (394)
Securities purchased under resale agreements - - - - - - - - 2,001,047 - 2,001,047
Derivative financial instruments - 548,926 - - - - - - - - 548,926
Financial assets recognised through profit or loss - measured at fair value 395,308 3,119,767 45,984 241,333 1,403,273 138,806 3,652,488 104,261 390,863 364,137 9,856,220
Financial assets at amortised cost' - loans and advances 143,583,044 57,989,388 145,840,254 488,058,761 114,697,275 266,311,439 306,860,446* 206,824,644 79,497,934 305,541,559 2,115,204,744
Less : Impairment - - - - - - - - - - (126,795,737)
Financial assets at amortised cost' - debt and other instruments - 153,384 - - - 4,121,521 725,609,104 - - - 729,884,009
Less : Impairment - - - - - - - - - - (5,493,837)
Financial assets measured at fair value through OCI - 2,492,269 - - - - 10,944,511 - 1,925,700 - 15,362,480
Total Financial Assets 143,978,352 203,612,199 145,886,238 488,300,094 116,100,548 270,571,766 1,047,066,549 206,928,905 89,903,068 305,905,696 2,885,952,179
* This excludes exposure to State Owned Enterprises
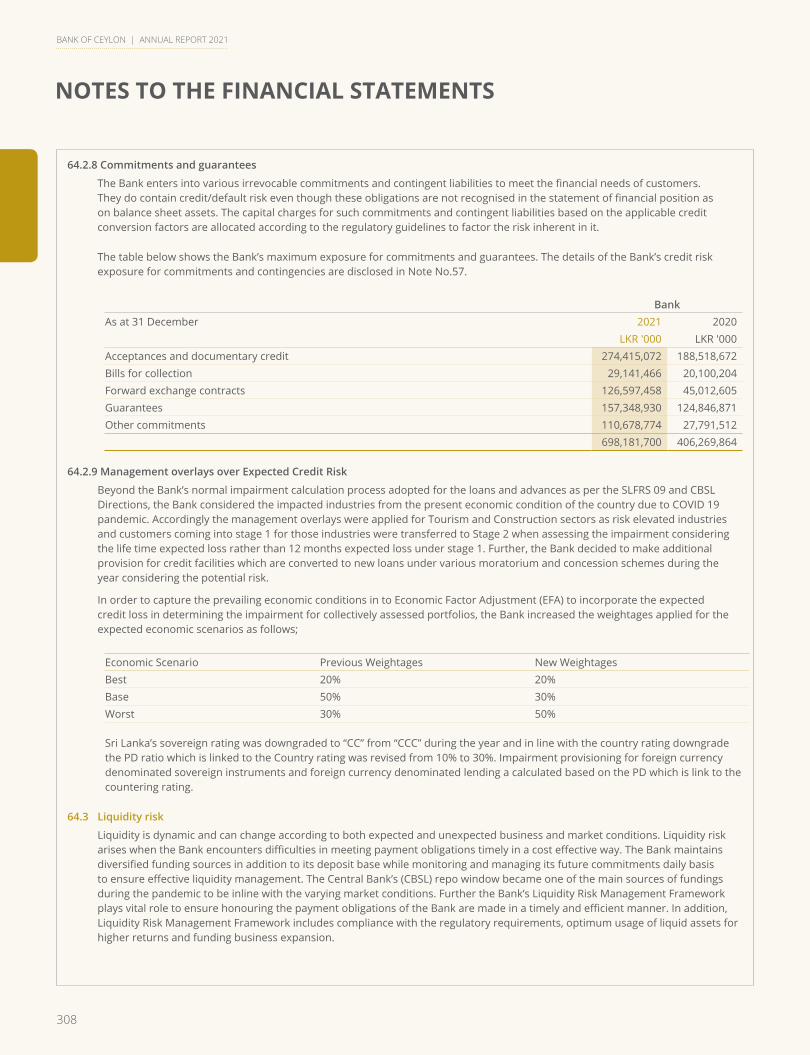
308
NOTES TO THE FINANCIAL STATEMENTS
BANK OF CEYLON | ANNUAL REPORT 2021
64.2.8 Commitments and guarantees
The Bank enters into various irrevocable commitments and contingent liabilities to meet the financial needs of customers. They do contain credit/default risk even though these obligations are not recognised in the statement of financial position as on balance sheet assets. The capital charges for such commitments and contingent liabilities based on the applicable credit conversion factors are allocated according to the regulatory guidelines to factor the risk inherent in it.
The table below shows the Bank’s maximum exposure for commitments and guarantees. The details of the Bank’s credit risk exposure for commitments and contingencies are disclosed in Note No.57.
BankAs at 31 December 2021 2020
LKR '000 LKR '000Acceptances and documentary credit 274,415,072 188,518,672 Bills for collection 29,141,466 20,100,204 Forward exchange contracts 126,597,458 45,012,605 Guarantees 157,348,930 124,846,871 Other commitments 110,678,774 27,791,512
698,181,700 406,269,864
64.2.9 Management overlays over Expected Credit Risk
Beyond the Bank’s normal impairment calculation process adopted for the loans and advances as per the SLFRS 09 and CBSL Directions, the Bank considered the impacted industries from the present economic condition of the country due to COVID 19 pandemic. Accordingly the management overlays were applied for Tourism and Construction sectors as risk elevated industries and customers coming into stage 1 for those industries were transferred to Stage 2 when assessing the impairment considering the life time expected loss rather than 12 months expected loss under stage 1. Further, the Bank decided to make additional provision for credit facilities which are converted to new loans under various moratorium and concession schemes during the year considering the potential risk.
In order to capture the prevailing economic conditions in to Economic Factor Adjustment (EFA) to incorporate the expected credit loss in determining the impairment for collectively assessed portfolios, the Bank increased the weightages applied for the expected economic scenarios as follows;
Economic Scenario Previous Weightages New WeightagesBest 20% 20%Base 50% 30%Worst 30% 50%
Sri Lanka’s sovereign rating was downgraded to “CC” from “CCC” during the year and in line with the country rating downgrade the PD ratio which is linked to the Country rating was revised from 10% to 30%. Impairment provisioning for foreign currency denominated sovereign instruments and foreign currency denominated lending a calculated based on the PD which is link to the countering rating.
64.3 Liquidity risk
Liquidity is dynamic and can change according to both expected and unexpected business and market conditions. Liquidity risk arises when the Bank encounters difficulties in meeting payment obligations timely in a cost effective way. The Bank maintains diversified funding sources in addition to its deposit base while monitoring and managing its future commitments daily basis to ensure effective liquidity management. The Central Bank’s (CBSL) repo window became one of the main sources of fundings during the pandemic to be inline with the varying market conditions. Further the Bank’s Liquidity Risk Management Framework plays vital role to ensure honouring the payment obligations of the Bank are made in a timely and efficient manner. In addition, Liquidity Risk Management Framework includes compliance with the regulatory requirements, optimum usage of liquid assets for higher returns and funding business expansion.
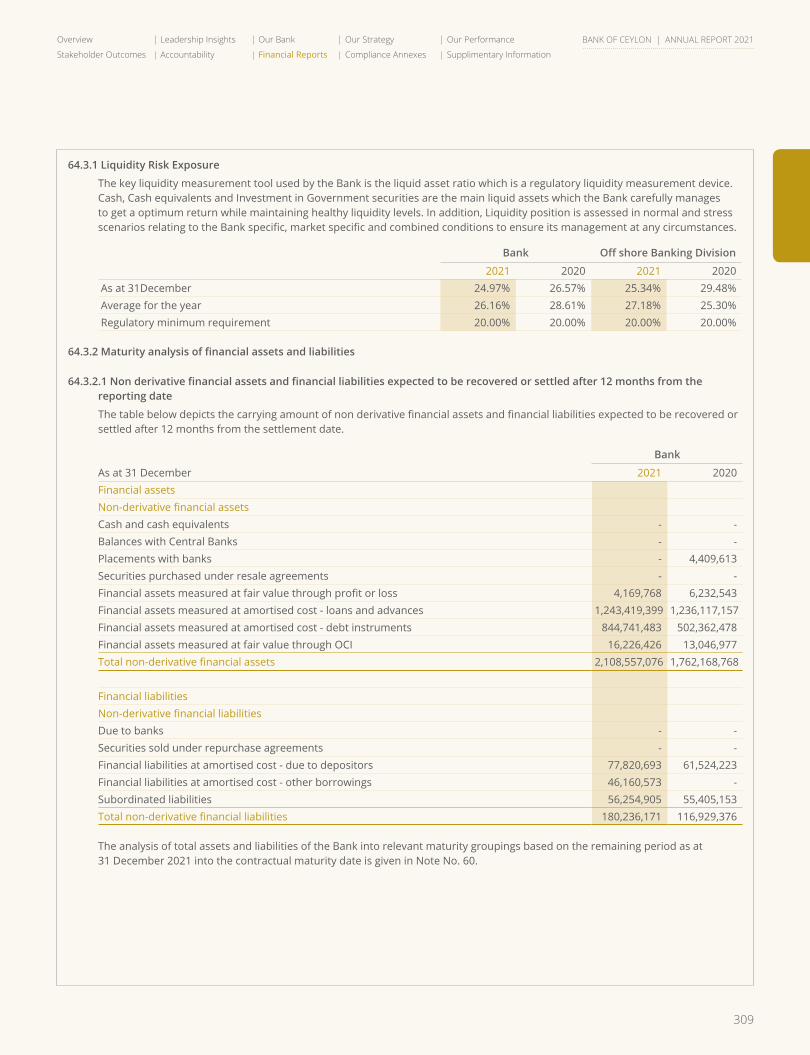
309
Overview Leadership Insights Our Bank Our Strategy Our Performance
Stakeholder Outcomes Accountability Financial Reports Compliance Annexes Supplimentary Information
BANK OF CEYLON | ANNUAL REPORT 2021
64.3.1 Liquidity Risk Exposure
The key liquidity measurement tool used by the Bank is the liquid asset ratio which is a regulatory liquidity measurement device. Cash, Cash equivalents and Investment in Government securities are the main liquid assets which the Bank carefully manages to get a optimum return while maintaining healthy liquidity levels. In addition, Liquidity position is assessed in normal and stress scenarios relating to the Bank specific, market specific and combined conditions to ensure its management at any circumstances.
Bank OffshoreBankingDivision
2021 2020 2021 2020 As at 31December 24.97% 26.57% 25.34% 29.48% Average for the year 26.16% 28.61% 27.18% 25.30% Regulatory minimum requirement 20.00% 20.00% 20.00% 20.00%
64.3.2Maturityanalysisoffinancialassetsandliabilities
64.3.2.1Nonderivativefinancialassetsandfinancialliabilitiesexpectedtoberecoveredorsettledafter12monthsfromthereporting date
The table below depicts the carrying amount of non derivative financial assets and financial liabilities expected to be recovered or settled after 12 months from the settlement date.
Bank
As at 31 December 2021 2020Financial assetsNon-derivative financial assetsCash and cash equivalents - - Balances with Central Banks - - Placements with banks - 4,409,613 Securities purchased under resale agreements - - Financial assets measured at fair value through profit or loss 4,169,768 6,232,543 Financial assets measured at amortised cost - loans and advances 1,243,419,399 1,236,117,157 Financial assets measured at amortised cost - debt instruments 844,741,483 502,362,478 Financial assets measured at fair value through OCI 16,226,426 13,046,977 Total non-derivative financial assets 2,108,557,076 1,762,168,768
Financial liabilitiesNon-derivative financial liabilitiesDue to banks - - Securities sold under repurchase agreements - - Financial liabilities at amortised cost - due to depositors 77,820,693 61,524,223 Financial liabilities at amortised cost - other borrowings 46,160,573 - Subordinated liabilities 56,254,905 55,405,153Total non-derivative financial liabilities 180,236,171 116,929,376
The analysis of total assets and liabilities of the Bank into relevant maturity groupings based on the remaining period as at 31 December 2021 into the contractual maturity date is given in Note No. 60.

310
NOTES TO THE FINANCIAL STATEMENTS
BANK OF CEYLON | ANNUAL REPORT 2021
64.3.2.2Undiscountedcashflowoffinancialliabilities
The table below presents the undiscounted maturity of the bank’s financial liabilities as at 31 December 2021.
31 December 2021 On demand
Less than3 months
3 to 12 months
1 to 5 years
Over 5 years
Total
LKR '000 LKR ‘000 LKR ‘000 LKR ‘000 LKR ‘000 LKR ‘000Due to banks 17,936,070 - - - - 17,936,070 Securities Sold Under Repurchase
Agreements - 170,428,673 - - - 170,428,673 Derivative financial instruments - 380,328 - - - 380,328 Financial liabilities at amortised cost
- due to depositors 1,031,468,452 708,254,611 1,101,418,097 76,925,090 2,922,588 2,920,988,838 Financial liabilities at amortised cost
- other borrowings 288,578,014 100,360,987 21,763,640 32,295,307 18,082,361 461,080,309 Total 1,337,982,536 979,424,599 1,123,181,737 109,220,397 21,004,949 3,570,814,218
31 December 2020 On demand
Less than3 months
3 to 12 months
1 to 5 years
Over 5 years
Total
LKR '000 LKR ‘000 LKR ‘000 LKR ‘000 LKR ‘000 LKR ‘000Due to banks - 2,402,043 - - - 2,402,043 Securities Sold Under Repurchase
Agreements - 54,802,364 3,931,613 - - 58,733,977 Derivative financial instruments - 102,182 - - - 102,182 Financial liabilities at amortised cost -
due to depositors 862,427,097 618,927,956 942,537,097 67,712,484 138,598 2,491,743,232 Financial liabilities at amortised cost -
other borrowings - 100,682,906 88,955,514 54,173,770 19,095,745 262,907,935 Total 862,427,097 776,917,451 1,035,424,224 121,886,254 19,234,343 2,815,889,369
64.4 Market Risk
Market risk is the risk of loss arising due to unfavourable movements in market variables such as interest rates, foreign exchange rates, equity prices and commodity prices. Exposure to the market risk arises mainly from Interest Rate Risk (IRR) and Foreign Exchange (FX) Risks. Exposure to commodity related risk is insignificant as it is limited to the extent of the fluctuation of the price of the gold stock. The Bank classifies exposures into either trading or non-trading portfolios and manages each of these portfolios separately. The market risk for the foreign exchange and equity trading portfolios are managed and monitored based on a Value at Risk (VaR) methodology. Interest rate risk of the trading portfolio is managed through Price Value per Basis Point (PVBP) and duration gap analysis. In addition trading and non trading portfolios are managed through risk monitoring, risk assessment, sensitivity analysis and stress testing.
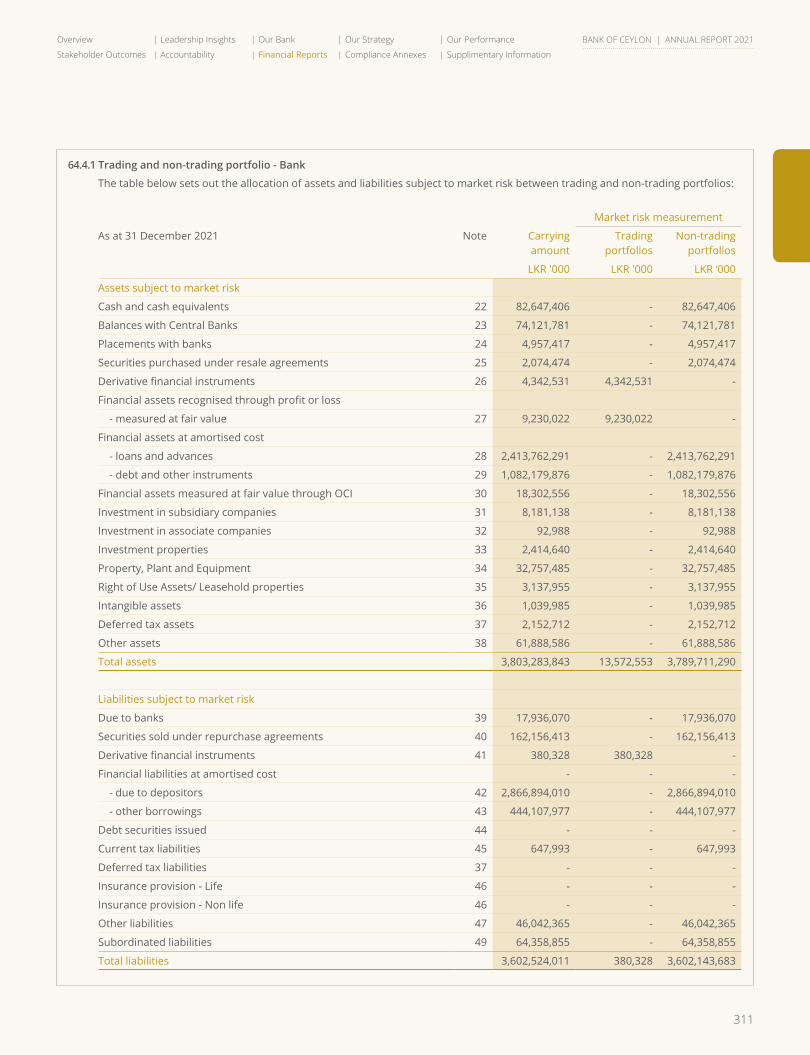
311
Overview Leadership Insights Our Bank Our Strategy Our Performance
Stakeholder Outcomes Accountability Financial Reports Compliance Annexes Supplimentary Information
BANK OF CEYLON | ANNUAL REPORT 2021
64.4.1 Trading and non-trading portfolio - Bank
The table below sets out the allocation of assets and liabilities subject to market risk between trading and non-trading portfolios:
Market risk measurement
As at 31 December 2021 Note Carryingamount
Tradingportfolios
Non-tradingportfolios
LKR '000 LKR '000 LKR ‘000
Assets subject to market risk
Cash and cash equivalents 22 82,647,406 - 82,647,406
Balances with Central Banks 23 74,121,781 - 74,121,781
Placements with banks 24 4,957,417 - 4,957,417
Securities purchased under resale agreements 25 2,074,474 - 2,074,474
Derivative financial instruments 26 4,342,531 4,342,531 -
Financial assets recognised through profit or loss
- measured at fair value 27 9,230,022 9,230,022 -
Financial assets at amortised cost
- loans and advances 28 2,413,762,291 - 2,413,762,291
- debt and other instruments 29 1,082,179,876 - 1,082,179,876
Financial assets measured at fair value through OCI 30 18,302,556 - 18,302,556
Investment in subsidiary companies 31 8,181,138 - 8,181,138
Investment in associate companies 32 92,988 - 92,988
Investment properties 33 2,414,640 - 2,414,640
Property, Plant and Equipment 34 32,757,485 - 32,757,485
Right of Use Assets/ Leasehold properties 35 3,137,955 - 3,137,955
Intangible assets 36 1,039,985 - 1,039,985
Deferred tax assets 37 2,152,712 - 2,152,712
Other assets 38 61,888,586 - 61,888,586
Total assets 3,803,283,843 13,572,553 3,789,711,290
Liabilities subject to market risk
Due to banks 39 17,936,070 - 17,936,070
Securities sold under repurchase agreements 40 162,156,413 - 162,156,413
Derivative financial instruments 41 380,328 380,328 -
Financial liabilities at amortised cost - - -
- due to depositors 42 2,866,894,010 - 2,866,894,010
- other borrowings 43 444,107,977 - 444,107,977
Debt securities issued 44 - - -
Current tax liabilities 45 647,993 - 647,993
Deferred tax liabilities 37 - - -
Insurance provision - Life 46 - - -
Insurance provision - Non life 46 - - -
Other liabilities 47 46,042,365 - 46,042,365
Subordinated liabilities 49 64,358,855 - 64,358,855
Total liabilities 3,602,524,011 380,328 3,602,143,683
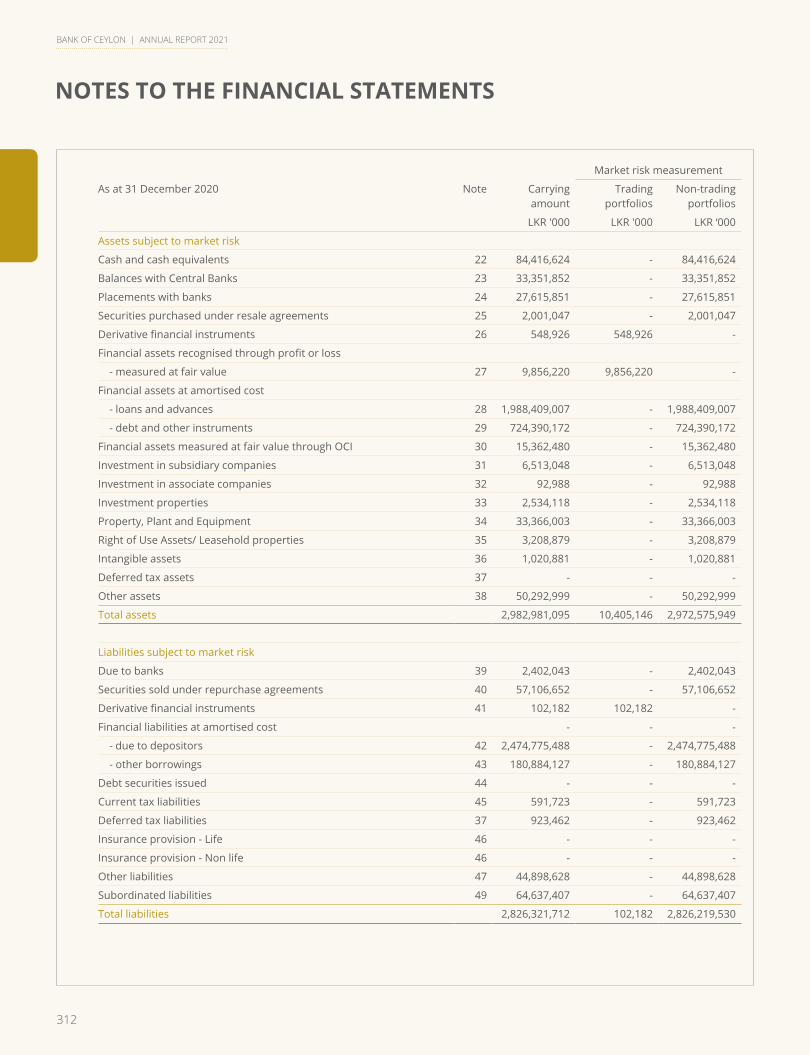
312
NOTES TO THE FINANCIAL STATEMENTS
BANK OF CEYLON | ANNUAL REPORT 2021
Market risk measurement
As at 31 December 2020 Note Carryingamount
Tradingportfolios
Non-tradingportfolios
LKR '000 LKR '000 LKR ‘000
Assets subject to market risk
Cash and cash equivalents 22 84,416,624 - 84,416,624
Balances with Central Banks 23 33,351,852 - 33,351,852
Placements with banks 24 27,615,851 - 27,615,851
Securities purchased under resale agreements 25 2,001,047 - 2,001,047
Derivative financial instruments 26 548,926 548,926 -
Financial assets recognised through profit or loss
- measured at fair value 27 9,856,220 9,856,220 -
Financial assets at amortised cost
- loans and advances 28 1,988,409,007 - 1,988,409,007
- debt and other instruments 29 724,390,172 - 724,390,172
Financial assets measured at fair value through OCI 30 15,362,480 - 15,362,480
Investment in subsidiary companies 31 6,513,048 - 6,513,048
Investment in associate companies 32 92,988 - 92,988
Investment properties 33 2,534,118 - 2,534,118
Property, Plant and Equipment 34 33,366,003 - 33,366,003
Right of Use Assets/ Leasehold properties 35 3,208,879 - 3,208,879
Intangible assets 36 1,020,881 - 1,020,881
Deferred tax assets 37 - - -
Other assets 38 50,292,999 - 50,292,999
Total assets 2,982,981,095 10,405,146 2,972,575,949
Liabilities subject to market risk
Due to banks 39 2,402,043 - 2,402,043
Securities sold under repurchase agreements 40 57,106,652 - 57,106,652
Derivative financial instruments 41 102,182 102,182 -
Financial liabilities at amortised cost - - -
- due to depositors 42 2,474,775,488 - 2,474,775,488
- other borrowings 43 180,884,127 - 180,884,127
Debt securities issued 44 - - -
Current tax liabilities 45 591,723 - 591,723
Deferred tax liabilities 37 923,462 - 923,462
Insurance provision - Life 46 - - -
Insurance provision - Non life 46 - - -
Other liabilities 47 44,898,628 - 44,898,628
Subordinated liabilities 49 64,637,407 - 64,637,407
Total liabilities 2,826,321,712 102,182 2,826,219,530

313
Overview Leadership Insights Our Bank Our Strategy Our Performance
Stakeholder Outcomes Accountability Financial Reports Compliance Annexes Supplimentary Information
BANK OF CEYLON | ANNUAL REPORT 2021
64.4.2 Interest rate risk
Interest rate risk is the possibility of fluctuation in the future cash flows or the fair value of financial instruments as a result of an unexpected changes in interest rates that negatively affects the Net Interest Income (NII) . Continuous monitoring and periodic repricing strategies ensures the interest rate risk is managed effectively.
Price Value per Basis Point (PVBP) and Duration analysis are monitored against the risk appetite limits daily basis to assess the impact of interest rate changes on Bank’s trading portfolios of treasury bonds and bills which are rate sensitive instruments. PVBP measures the change in the value of Treasury bills and bonds due to a 1 basis point change in the interest rates.
As at 31 December 2021LKR ‘000
2020LKR ‘000
Risk AppetiteLKR ‘000
PVBPInvestment in TBills 2,550 7,407 600,000Investment in TBonds 869,969 566,120 1,800,000
Sensitivity analysis of interest sensitive assets and liabilities is carried out to monitor interest rate risk in the banking book by placing those assets and liabilities in pre-determined maturity buckets considering its residual time to maturity and setting and monitoring gap limits and the repricing profile. The table below analyses the bank’s interest rate risk exposure as a percentage on financial assets and liabilities.
2021 Upto 1 Month
1-3 Months
3-6 Months
6-12 Months
1-2 Years
2-3 Years
3-4 Years
4-5 Years
Over5 Years
Rate sensitive assets 13.6% 17.2% 5.7% 9.3% 8.7% 16.9% 7.2% 5.9% 15.3%
Rate sensitive liabilities 19.4% 18.0% 9.1% 14.4% 4.4% 4.4% 3.4% 3.4% 23.5%
GAP -5.8% -0.8% -3.4% -5.1% 4.3% 12.5% 3.8% 2.5% -8.2%
2020 Upto 1 Month
1-3 Months
3-6 Months
6-12 Months
1-2 Years
2-3 Years
3-4 Years
4-5 Years
Over5 Years
Rate sensitive assets 9.0% 17.6% 12.2% 13.6% 11.6% 11.6% 4.7% 4.7% 15.0%
Rate sensitive liabilities 11.7% 15.0% 12.7% 17.9% 4.5% 4.5% 4.1% 4.1% 25.6%
GAP -2.7% 2.6% -0.5% -4.3% 7.1% 7.1% 0.6% 0.6% -10.6%
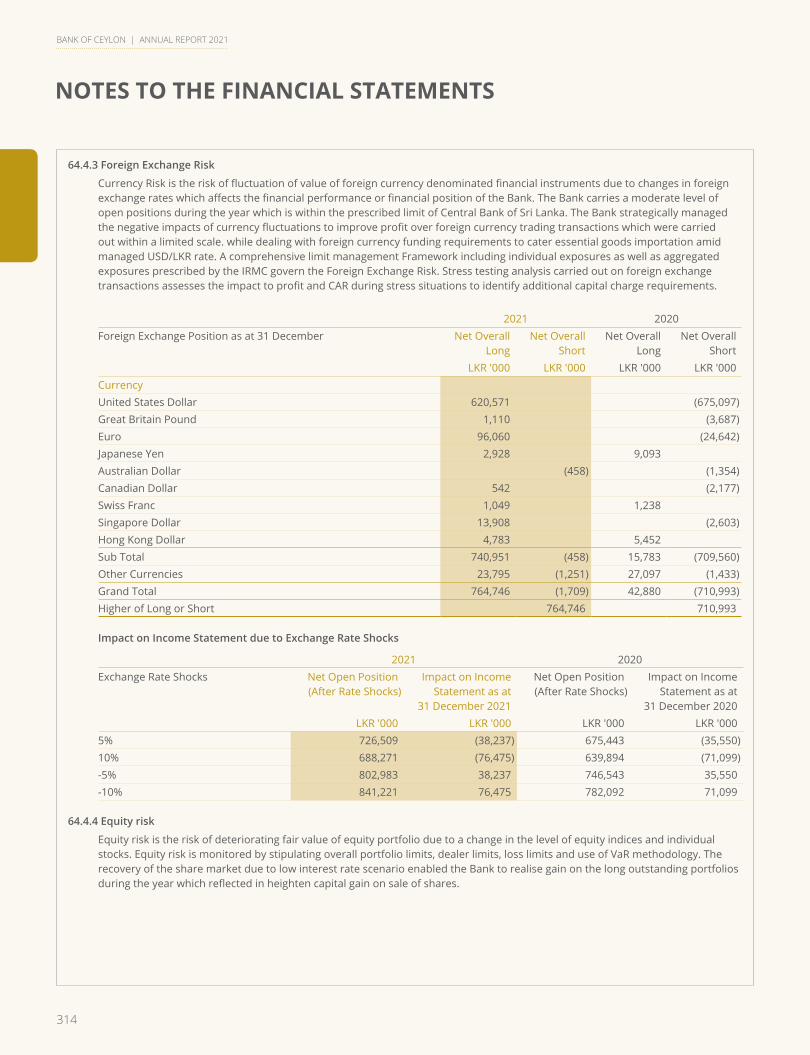
314
NOTES TO THE FINANCIAL STATEMENTS
BANK OF CEYLON | ANNUAL REPORT 2021
64.4.3 Foreign Exchange Risk
Currency Risk is the risk of fluctuation of value of foreign currency denominated financial instruments due to changes in foreign exchange rates which affects the financial performance or financial position of the Bank. The Bank carries a moderate level of open positions during the year which is within the prescribed limit of Central Bank of Sri Lanka. The Bank strategically managed the negative impacts of currency fluctuations to improve profit over foreign currency trading transactions which were carried out within a limited scale. while dealing with foreign currency funding requirements to cater essential goods importation amid managed USD/LKR rate. A comprehensive limit management Framework including individual exposures as well as aggregated exposures prescribed by the IRMC govern the Foreign Exchange Risk. Stress testing analysis carried out on foreign exchange transactions assesses the impact to profit and CAR during stress situations to identify additional capital charge requirements.
2021 2020Foreign Exchange Position as at 31 December Net Overall
LongNet Overall
ShortNet Overall
LongNet Overall
ShortLKR '000 LKR '000 LKR '000 LKR '000
CurrencyUnited States Dollar 620,571 (675,097)Great Britain Pound 1,110 (3,687)Euro 96,060 (24,642)Japanese Yen 2,928 9,093 Australian Dollar (458) (1,354)Canadian Dollar 542 (2,177)Swiss Franc 1,049 1,238 Singapore Dollar 13,908 (2,603)Hong Kong Dollar 4,783 5,452 Sub Total 740,951 (458) 15,783 (709,560)Other Currencies 23,795 (1,251) 27,097 (1,433)Grand Total 764,746 (1,709) 42,880 (710,993)Higher of Long or Short 764,746 710,993
Impact on Income Statement due to Exchange Rate Shocks
2021 2020Exchange Rate Shocks Net Open Position
(After Rate Shocks) Impact on Income
Statement as at31 December 2021
Net Open Position (After Rate Shocks)
Impact on Income Statement as at
31 December 2020 LKR '000 LKR '000 LKR '000 LKR '000
5% 726,509 (38,237) 675,443 (35,550)10% 688,271 (76,475) 639,894 (71,099)-5% 802,983 38,237 746,543 35,550 -10% 841,221 76,475 782,092 71,099
64.4.4 Equity risk
Equity risk is the risk of deteriorating fair value of equity portfolio due to a change in the level of equity indices and individual stocks. Equity risk is monitored by stipulating overall portfolio limits, dealer limits, loss limits and use of VaR methodology. The recovery of the share market due to low interest rate scenario enabled the Bank to realise gain on the long outstanding portfolios during the year which reflected in heighten capital gain on sale of shares.
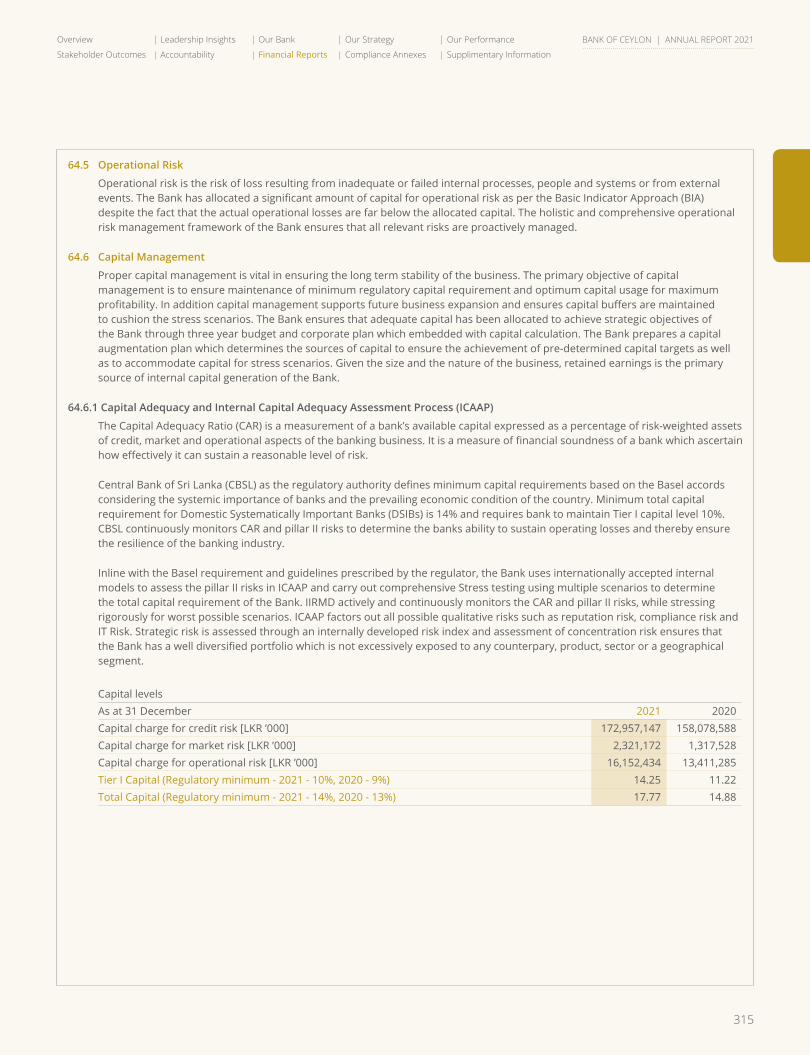
315
Overview Leadership Insights Our Bank Our Strategy Our Performance
Stakeholder Outcomes Accountability Financial Reports Compliance Annexes Supplimentary Information
BANK OF CEYLON | ANNUAL REPORT 2021
64.5 Operational Risk
Operational risk is the risk of loss resulting from inadequate or failed internal processes, people and systems or from external events. The Bank has allocated a significant amount of capital for operational risk as per the Basic Indicator Approach (BIA) despite the fact that the actual operational losses are far below the allocated capital. The holistic and comprehensive operational risk management framework of the Bank ensures that all relevant risks are proactively managed.
64.6 Capital Management
Proper capital management is vital in ensuring the long term stability of the business. The primary objective of capital management is to ensure maintenance of minimum regulatory capital requirement and optimum capital usage for maximum profitability. In addition capital management supports future business expansion and ensures capital buffers are maintained to cushion the stress scenarios. The Bank ensures that adequate capital has been allocated to achieve strategic objectives of the Bank through three year budget and corporate plan which embedded with capital calculation. The Bank prepares a capital augmentation plan which determines the sources of capital to ensure the achievement of pre-determined capital targets as well as to accommodate capital for stress scenarios. Given the size and the nature of the business, retained earnings is the primary source of internal capital generation of the Bank.
64.6.1 Capital Adequacy and Internal Capital Adequacy Assessment Process (ICAAP)
The Capital Adequacy Ratio (CAR) is a measurement of a bank’s available capital expressed as a percentage of risk-weighted assets of credit, market and operational aspects of the banking business. It is a measure of financial soundness of a bank which ascertain how effectively it can sustain a reasonable level of risk.
Central Bank of Sri Lanka (CBSL) as the regulatory authority defines minimum capital requirements based on the Basel accords considering the systemic importance of banks and the prevailing economic condition of the country. Minimum total capital requirement for Domestic Systematically Important Banks (DSIBs) is 14% and requires bank to maintain Tier I capital level 10%. CBSL continuously monitors CAR and pillar II risks to determine the banks ability to sustain operating losses and thereby ensure the resilience of the banking industry.
Inline with the Basel requirement and guidelines prescribed by the regulator, the Bank uses internationally accepted internal models to assess the pillar II risks in ICAAP and carry out comprehensive Stress testing using multiple scenarios to determine the total capital requirement of the Bank. IIRMD actively and continuously monitors the CAR and pillar II risks, while stressing rigorously for worst possible scenarios. ICAAP factors out all possible qualitative risks such as reputation risk, compliance risk and IT Risk. Strategic risk is assessed through an internally developed risk index and assessment of concentration risk ensures that the Bank has a well diversified portfolio which is not excessively exposed to any counterpary, product, sector or a geographical segment.
Capital levelsAs at 31 December 2021 2020Capital charge for credit risk [LKR ’000] 172,957,147 158,078,588 Capital charge for market risk [LKR ’000] 2,321,172 1,317,528 Capital charge for operational risk [LKR ’000] 16,152,434 13,411,285Tier I Capital (Regulatory minimum - 2021 - 10%, 2020 - 9%) 14.25 11.22Total Capital (Regulatory minimum - 2021 - 14%, 2020 - 13%) 17.77 14.88
316
BANK OF CEYLON | ANNUAL REPORT 2021
COMPLIANCE ANNEXESCompliance with Code of Best Practice on Corporate Governance 2017 issued by CA Sri Lanka ...............................................................317
Compliance Requirements as per Banking Act Direction No. 11 of 2007 .........................................................................................322
Compliance Requirements Enforced by Colombo Stock Exchange.............................................................................................................339
Compliance Requirements Enforced by the Central Bank of Sri Lanka .................................................................................................341
Capital Adequacy ..........................................................................................................................345
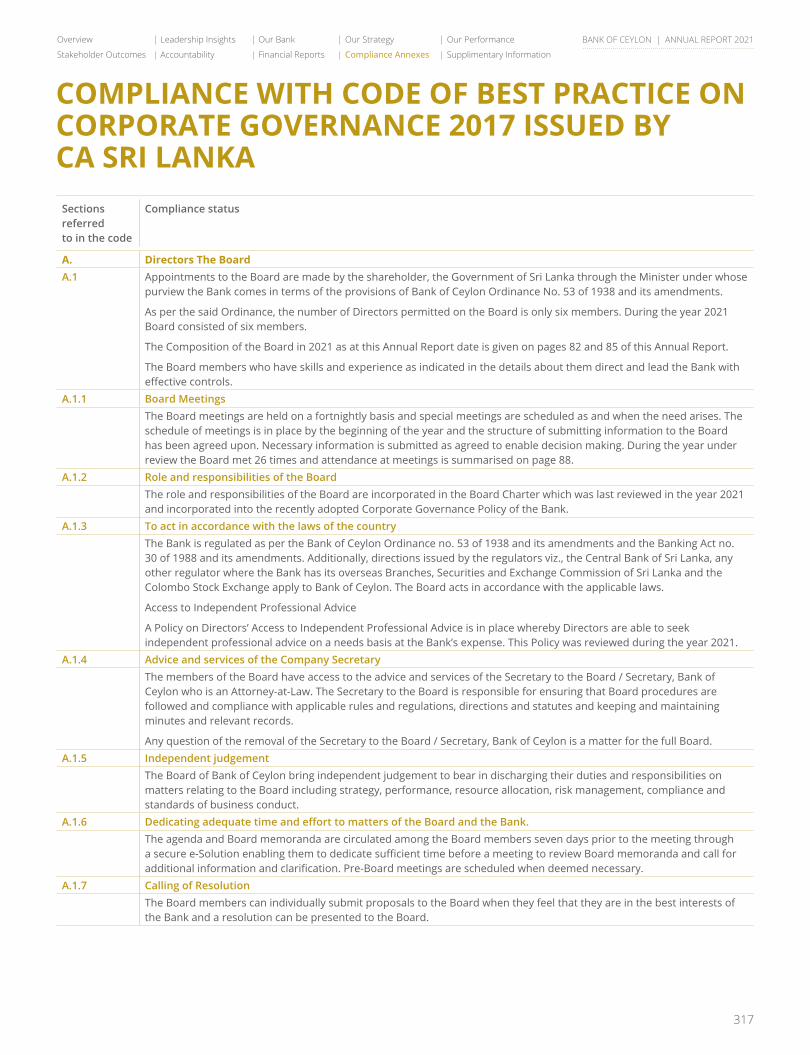
317
Overview Leadership Insights Our Bank Our Strategy Our Performance
Stakeholder Outcomes Accountability Financial Reports Compliance Annexes Supplimentary Information
BANK OF CEYLON | ANNUAL REPORT 2021
COMPLIANCE WITH CODE OF BEST PRACTICE ON CORPORATE GOVERNANCE 2017 ISSUED BY CA SRI LANKA
Sections referred to in the code
Compliance status
A. Directors The BoardA.1 Appointments to the Board are made by the shareholder, the Government of Sri Lanka through the Minister under whose
purview the Bank comes in terms of the provisions of Bank of Ceylon Ordinance No. 53 of 1938 and its amendments.
As per the said Ordinance, the number of Directors permitted on the Board is only six members. During the year 2021 Board consisted of six members.
The Composition of the Board in 2021 as at this Annual Report date is given on pages 82 and 85 of this Annual Report.
The Board members who have skills and experience as indicated in the details about them direct and lead the Bank with effective controls.
A.1.1 Board MeetingsThe Board meetings are held on a fortnightly basis and special meetings are scheduled as and when the need arises. The schedule of meetings is in place by the beginning of the year and the structure of submitting information to the Board has been agreed upon. Necessary information is submitted as agreed to enable decision making. During the year under review the Board met 26 times and attendance at meetings is summarised on page 88.
A.1.2 Role and responsibilities of the BoardThe role and responsibilities of the Board are incorporated in the Board Charter which was last reviewed in the year 2021 and incorporated into the recently adopted Corporate Governance Policy of the Bank.
A.1.3 To act in accordance with the laws of the countryThe Bank is regulated as per the Bank of Ceylon Ordinance no. 53 of 1938 and its amendments and the Banking Act no. 30 of 1988 and its amendments. Additionally, directions issued by the regulators viz., the Central Bank of Sri Lanka, any other regulator where the Bank has its overseas Branches, Securities and Exchange Commission of Sri Lanka and the Colombo Stock Exchange apply to Bank of Ceylon. The Board acts in accordance with the applicable laws.
Access to Independent Professional Advice
A Policy on Directors’ Access to Independent Professional Advice is in place whereby Directors are able to seek independent professional advice on a needs basis at the Bank’s expense. This Policy was reviewed during the year 2021.
A.1.4 Advice and services of the Company SecretaryThe members of the Board have access to the advice and services of the Secretary to the Board / Secretary, Bank of Ceylon who is an Attorney-at-Law. The Secretary to the Board is responsible for ensuring that Board procedures are followed and compliance with applicable rules and regulations, directions and statutes and keeping and maintaining minutes and relevant records.
Any question of the removal of the Secretary to the Board / Secretary, Bank of Ceylon is a matter for the full Board.A.1.5 Independent judgement
The Board of Bank of Ceylon bring independent judgement to bear in discharging their duties and responsibilities on matters relating to the Board including strategy, performance, resource allocation, risk management, compliance and standards of business conduct.
A.1.6 DedicatingadequatetimeandefforttomattersoftheBoardandtheBank.The agenda and Board memoranda are circulated among the Board members seven days prior to the meeting through a secure e-Solution enabling them to dedicate sufficient time before a meeting to review Board memoranda and call for additional information and clarification. Pre-Board meetings are scheduled when deemed necessary.
A.1.7 Calling of ResolutionThe Board members can individually submit proposals to the Board when they feel that they are in the best interests of the Bank and a resolution can be presented to the Board.
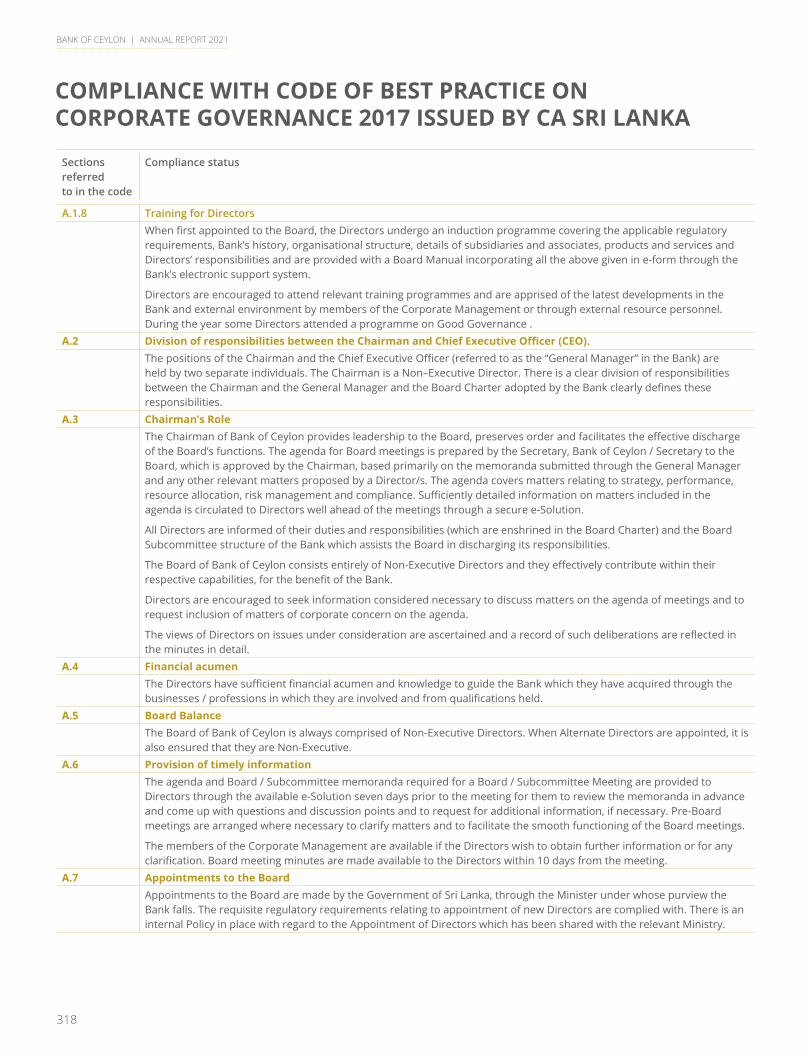
318
BANK OF CEYLON | ANNUAL REPORT 2021
COMPLIANCE WITH CODE OF BEST PRACTICE ON CORPORATE GOVERNANCE 2017 ISSUED BY CA SRI LANKA
Sections referred to in the code
Compliance status
A.1.8 Training for DirectorsWhen first appointed to the Board, the Directors undergo an induction programme covering the applicable regulatory requirements, Bank’s history, organisational structure, details of subsidiaries and associates, products and services and Directors’ responsibilities and are provided with a Board Manual incorporating all the above given in e-form through the Bank’s electronic support system.
Directors are encouraged to attend relevant training programmes and are apprised of the latest developments in the Bank and external environment by members of the Corporate Management or through external resource personnel. During the year some Directors attended a programme on Good Governance .
A.2 Division of responsibilities between the Chairman and Chief Executive Officer (CEO).The positions of the Chairman and the Chief Executive Officer (referred to as the “General Manager” in the Bank) are held by two separate individuals. The Chairman is a Non–Executive Director. There is a clear division of responsibilities between the Chairman and the General Manager and the Board Charter adopted by the Bank clearly defines these responsibilities.
A.3 Chairman’s RoleThe Chairman of Bank of Ceylon provides leadership to the Board, preserves order and facilitates the effective discharge of the Board’s functions. The agenda for Board meetings is prepared by the Secretary, Bank of Ceylon / Secretary to the Board, which is approved by the Chairman, based primarily on the memoranda submitted through the General Manager and any other relevant matters proposed by a Director/s. The agenda covers matters relating to strategy, performance, resource allocation, risk management and compliance. Sufficiently detailed information on matters included in the agenda is circulated to Directors well ahead of the meetings through a secure e-Solution.
All Directors are informed of their duties and responsibilities (which are enshrined in the Board Charter) and the Board Subcommittee structure of the Bank which assists the Board in discharging its responsibilities.
The Board of Bank of Ceylon consists entirely of Non-Executive Directors and they effectively contribute within their respective capabilities, for the benefit of the Bank.
Directors are encouraged to seek information considered necessary to discuss matters on the agenda of meetings and to request inclusion of matters of corporate concern on the agenda.
The views of Directors on issues under consideration are ascertained and a record of such deliberations are reflected in the minutes in detail.
A.4 Financial acumenThe Directors have sufficient financial acumen and knowledge to guide the Bank which they have acquired through the businesses / professions in which they are involved and from qualifications held.
A.5 Board BalanceThe Board of Bank of Ceylon is always comprised of Non-Executive Directors. When Alternate Directors are appointed, it is also ensured that they are Non-Executive.
A.6 Provision of timely informationThe agenda and Board / Subcommittee memoranda required for a Board / Subcommittee Meeting are provided to Directors through the available e-Solution seven days prior to the meeting for them to review the memoranda in advance and come up with questions and discussion points and to request for additional information, if necessary. Pre-Board meetings are arranged where necessary to clarify matters and to facilitate the smooth functioning of the Board meetings.
The members of the Corporate Management are available if the Directors wish to obtain further information or for any clarification. Board meeting minutes are made available to the Directors within 10 days from the meeting.
A.7 Appointments to the BoardAppointments to the Board are made by the Government of Sri Lanka, through the Minister under whose purview the Bank falls. The requisite regulatory requirements relating to appointment of new Directors are complied with. There is an internal Policy in place with regard to the Appointment of Directors which has been shared with the relevant Ministry.
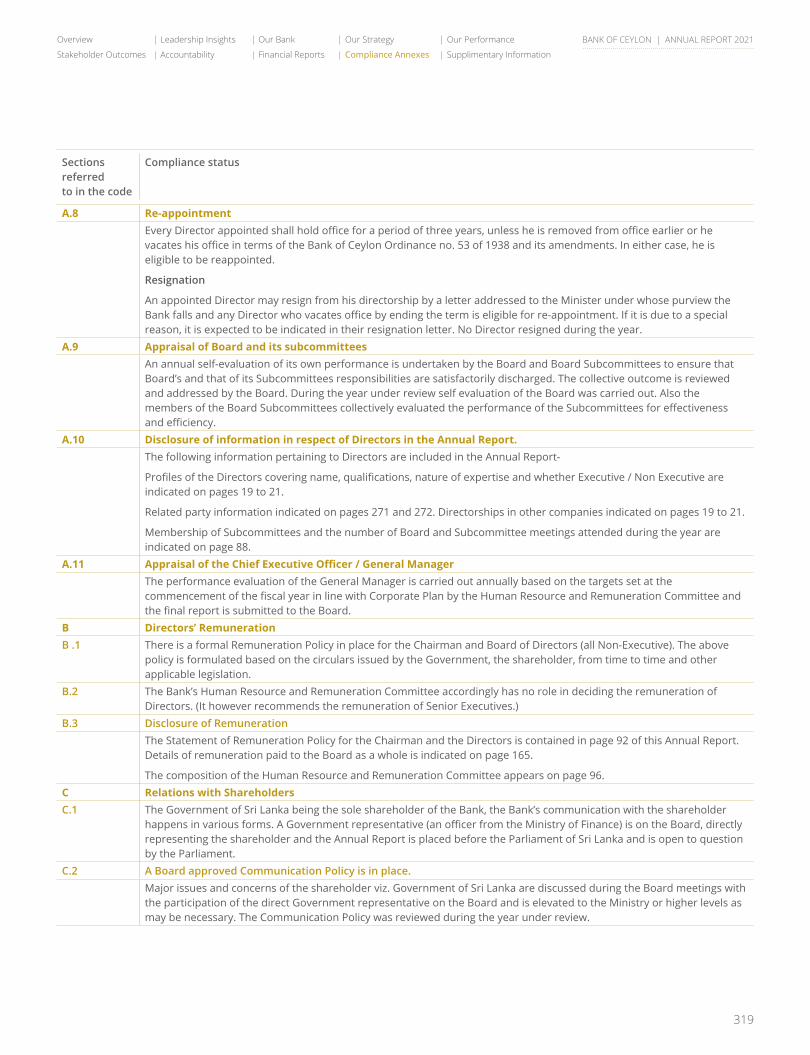
319
Overview Leadership Insights Our Bank Our Strategy Our Performance
Stakeholder Outcomes Accountability Financial Reports Compliance Annexes Supplimentary Information
BANK OF CEYLON | ANNUAL REPORT 2021
Sections referred to in the code
Compliance status
A.8 Re-appointmentEvery Director appointed shall hold office for a period of three years, unless he is removed from office earlier or he vacates his office in terms of the Bank of Ceylon Ordinance no. 53 of 1938 and its amendments. In either case, he is eligible to be reappointed.
Resignation
An appointed Director may resign from his directorship by a letter addressed to the Minister under whose purview the Bank falls and any Director who vacates office by ending the term is eligible for re-appointment. If it is due to a special reason, it is expected to be indicated in their resignation letter. No Director resigned during the year.
A.9 Appraisal of Board and its subcommitteesAn annual self-evaluation of its own performance is undertaken by the Board and Board Subcommittees to ensure that Board’s and that of its Subcommittees responsibilities are satisfactorily discharged. The collective outcome is reviewed and addressed by the Board. During the year under review self evaluation of the Board was carried out. Also the members of the Board Subcommittees collectively evaluated the performance of the Subcommittees for effectiveness and efficiency.
A.10 Disclosure of information in respect of Directors in the Annual Report.The following information pertaining to Directors are included in the Annual Report-
Profiles of the Directors covering name, qualifications, nature of expertise and whether Executive / Non Executive are indicated on pages 19 to 21.
Related party information indicated on pages 271 and 272. Directorships in other companies indicated on pages 19 to 21.
Membership of Subcommittees and the number of Board and Subcommittee meetings attended during the year are indicated on page 88.
A.11 Appraisal of the Chief Executive Officer / General ManagerThe performance evaluation of the General Manager is carried out annually based on the targets set at the commencement of the fiscal year in line with Corporate Plan by the Human Resource and Remuneration Committee and the final report is submitted to the Board.
B Directors’ RemunerationB .1 There is a formal Remuneration Policy in place for the Chairman and Board of Directors (all Non-Executive). The above
policy is formulated based on the circulars issued by the Government, the shareholder, from time to time and other applicable legislation.
B.2 The Bank’s Human Resource and Remuneration Committee accordingly has no role in deciding the remuneration of Directors. (It however recommends the remuneration of Senior Executives.)
B.3 Disclosure of RemunerationThe Statement of Remuneration Policy for the Chairman and the Directors is contained in page 92 of this Annual Report. Details of remuneration paid to the Board as a whole is indicated on page 165.
The composition of the Human Resource and Remuneration Committee appears on page 96.C Relations with ShareholdersC.1 The Government of Sri Lanka being the sole shareholder of the Bank, the Bank’s communication with the shareholder
happens in various forms. A Government representative (an officer from the Ministry of Finance) is on the Board, directly representing the shareholder and the Annual Report is placed before the Parliament of Sri Lanka and is open to question by the Parliament.
C.2 A Board approved Communication Policy is in place.Major issues and concerns of the shareholder viz. Government of Sri Lanka are discussed during the Board meetings with the participation of the direct Government representative on the Board and is elevated to the Ministry or higher levels as may be necessary. The Communication Policy was reviewed during the year under review.
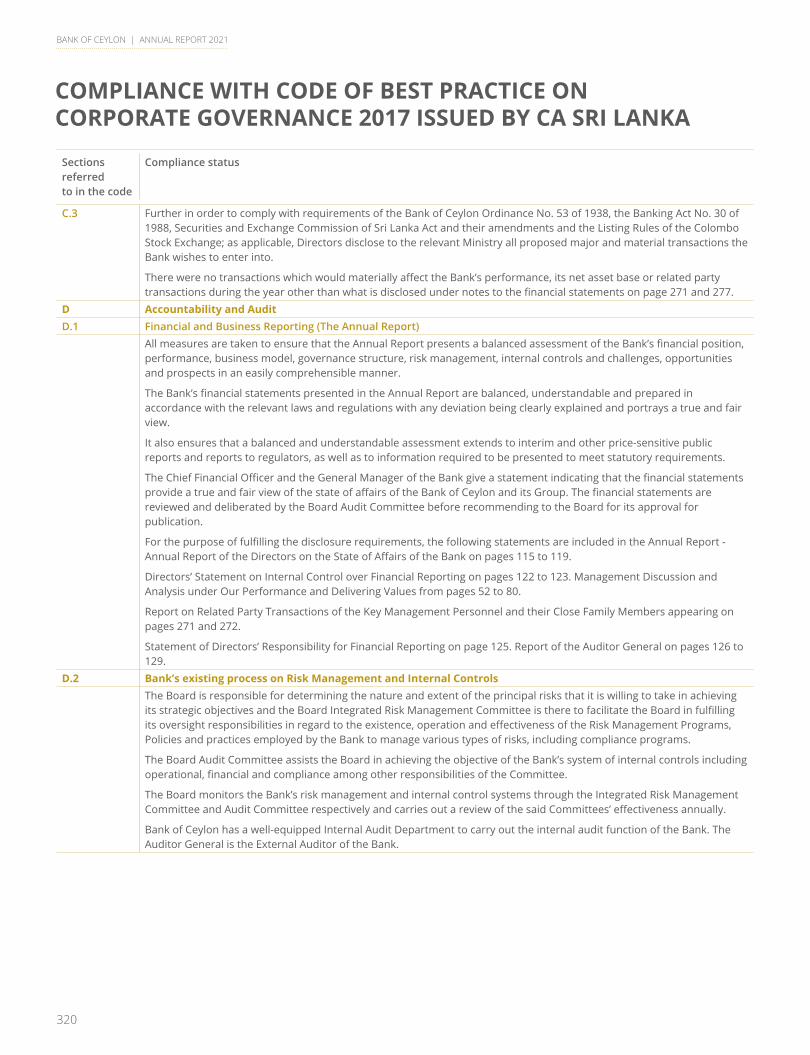
320
BANK OF CEYLON | ANNUAL REPORT 2021
COMPLIANCE WITH CODE OF BEST PRACTICE ON CORPORATE GOVERNANCE 2017 ISSUED BY CA SRI LANKA
Sections referred to in the code
Compliance status
C.3 Further in order to comply with requirements of the Bank of Ceylon Ordinance No. 53 of 1938, the Banking Act No. 30 of 1988, Securities and Exchange Commission of Sri Lanka Act and their amendments and the Listing Rules of the Colombo Stock Exchange; as applicable, Directors disclose to the relevant Ministry all proposed major and material transactions the Bank wishes to enter into.
There were no transactions which would materially affect the Bank’s performance, its net asset base or related party transactions during the year other than what is disclosed under notes to the financial statements on page 271 and 277.
D Accountability and AuditD.1 Financial and Business Reporting (The Annual Report)
All measures are taken to ensure that the Annual Report presents a balanced assessment of the Bank’s financial position, performance, business model, governance structure, risk management, internal controls and challenges, opportunities and prospects in an easily comprehensible manner.
The Bank’s financial statements presented in the Annual Report are balanced, understandable and prepared in accordance with the relevant laws and regulations with any deviation being clearly explained and portrays a true and fair view.
It also ensures that a balanced and understandable assessment extends to interim and other price-sensitive public reports and reports to regulators, as well as to information required to be presented to meet statutory requirements.
The Chief Financial Officer and the General Manager of the Bank give a statement indicating that the financial statements provide a true and fair view of the state of affairs of the Bank of Ceylon and its Group. The financial statements are reviewed and deliberated by the Board Audit Committee before recommending to the Board for its approval for publication.
For the purpose of fulfilling the disclosure requirements, the following statements are included in the Annual Report - Annual Report of the Directors on the State of Affairs of the Bank on pages 115 to 119.
Directors’ Statement on Internal Control over Financial Reporting on pages 122 to 123. Management Discussion and Analysis under Our Performance and Delivering Values from pages 52 to 80.
Report on Related Party Transactions of the Key Management Personnel and their Close Family Members appearing on pages 271 and 272.
Statement of Directors’ Responsibility for Financial Reporting on page 125. Report of the Auditor General on pages 126 to 129.
D.2 Bank’s existing process on Risk Management and Internal ControlsThe Board is responsible for determining the nature and extent of the principal risks that it is willing to take in achieving its strategic objectives and the Board Integrated Risk Management Committee is there to facilitate the Board in fulfilling its oversight responsibilities in regard to the existence, operation and effectiveness of the Risk Management Programs, Policies and practices employed by the Bank to manage various types of risks, including compliance programs.
The Board Audit Committee assists the Board in achieving the objective of the Bank’s system of internal controls including operational, financial and compliance among other responsibilities of the Committee.
The Board monitors the Bank’s risk management and internal control systems through the Integrated Risk Management Committee and Audit Committee respectively and carries out a review of the said Committees’ effectiveness annually.
Bank of Ceylon has a well-equipped Internal Audit Department to carry out the internal audit function of the Bank. The Auditor General is the External Auditor of the Bank.
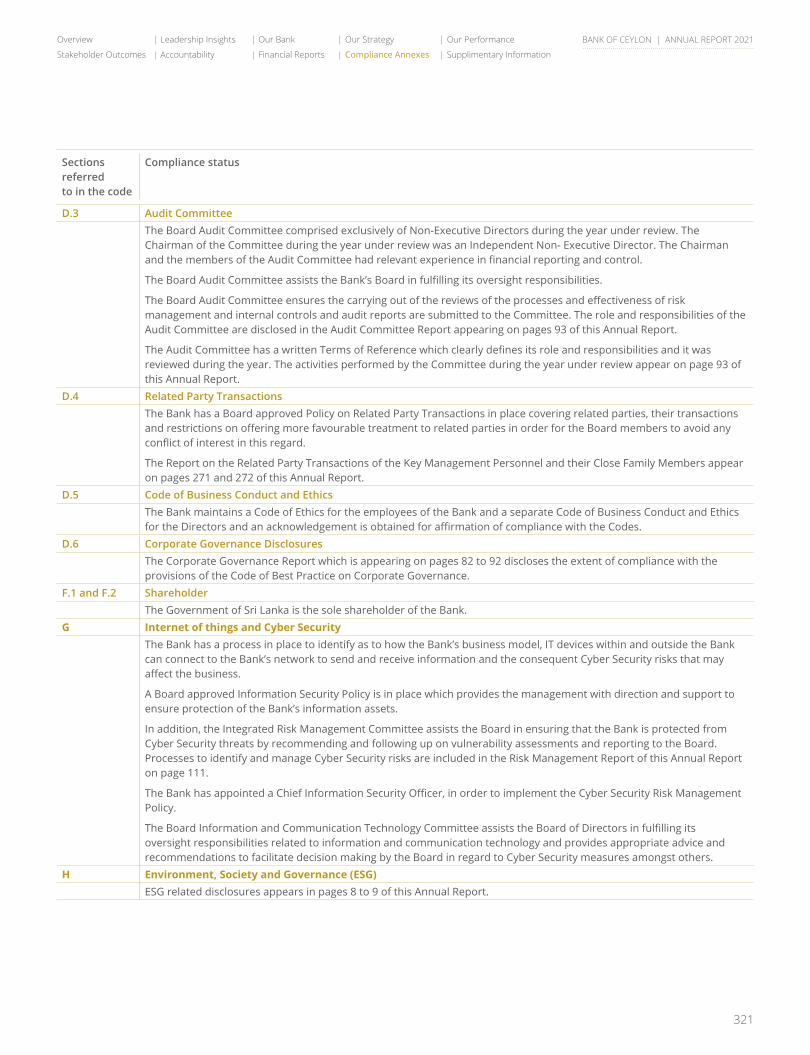
321
Overview Leadership Insights Our Bank Our Strategy Our Performance
Stakeholder Outcomes Accountability Financial Reports Compliance Annexes Supplimentary Information
BANK OF CEYLON | ANNUAL REPORT 2021
Sections referred to in the code
Compliance status
D.3 Audit CommitteeThe Board Audit Committee comprised exclusively of Non-Executive Directors during the year under review. The Chairman of the Committee during the year under review was an Independent Non- Executive Director. The Chairman and the members of the Audit Committee had relevant experience in financial reporting and control.
The Board Audit Committee assists the Bank’s Board in fulfilling its oversight responsibilities.
The Board Audit Committee ensures the carrying out of the reviews of the processes and effectiveness of risk management and internal controls and audit reports are submitted to the Committee. The role and responsibilities of the Audit Committee are disclosed in the Audit Committee Report appearing on pages 93 of this Annual Report.
The Audit Committee has a written Terms of Reference which clearly defines its role and responsibilities and it was reviewed during the year. The activities performed by the Committee during the year under review appear on page 93 of this Annual Report.
D.4 Related Party TransactionsThe Bank has a Board approved Policy on Related Party Transactions in place covering related parties, their transactions and restrictions on offering more favourable treatment to related parties in order for the Board members to avoid any conflict of interest in this regard.
The Report on the Related Party Transactions of the Key Management Personnel and their Close Family Members appear on pages 271 and 272 of this Annual Report.
D.5 Code of Business Conduct and Ethics The Bank maintains a Code of Ethics for the employees of the Bank and a separate Code of Business Conduct and Ethics
for the Directors and an acknowledgement is obtained for affirmation of compliance with the Codes.D.6 Corporate Governance Disclosures
The Corporate Governance Report which is appearing on pages 82 to 92 discloses the extent of compliance with the provisions of the Code of Best Practice on Corporate Governance.
F.1 and F.2 ShareholderThe Government of Sri Lanka is the sole shareholder of the Bank.
G Internet of things and Cyber SecurityThe Bank has a process in place to identify as to how the Bank’s business model, IT devices within and outside the Bank can connect to the Bank’s network to send and receive information and the consequent Cyber Security risks that may affect the business.
A Board approved Information Security Policy is in place which provides the management with direction and support to ensure protection of the Bank’s information assets.
In addition, the Integrated Risk Management Committee assists the Board in ensuring that the Bank is protected from Cyber Security threats by recommending and following up on vulnerability assessments and reporting to the Board. Processes to identify and manage Cyber Security risks are included in the Risk Management Report of this Annual Report on page 111.
The Bank has appointed a Chief Information Security Officer, in order to implement the Cyber Security Risk Management Policy.
The Board Information and Communication Technology Committee assists the Board of Directors in fulfilling its oversight responsibilities related to information and communication technology and provides appropriate advice and recommendations to facilitate decision making by the Board in regard to Cyber Security measures amongst others.
H Environment, Society and Governance (ESG)ESG related disclosures appears in pages 8 to 9 of this Annual Report.
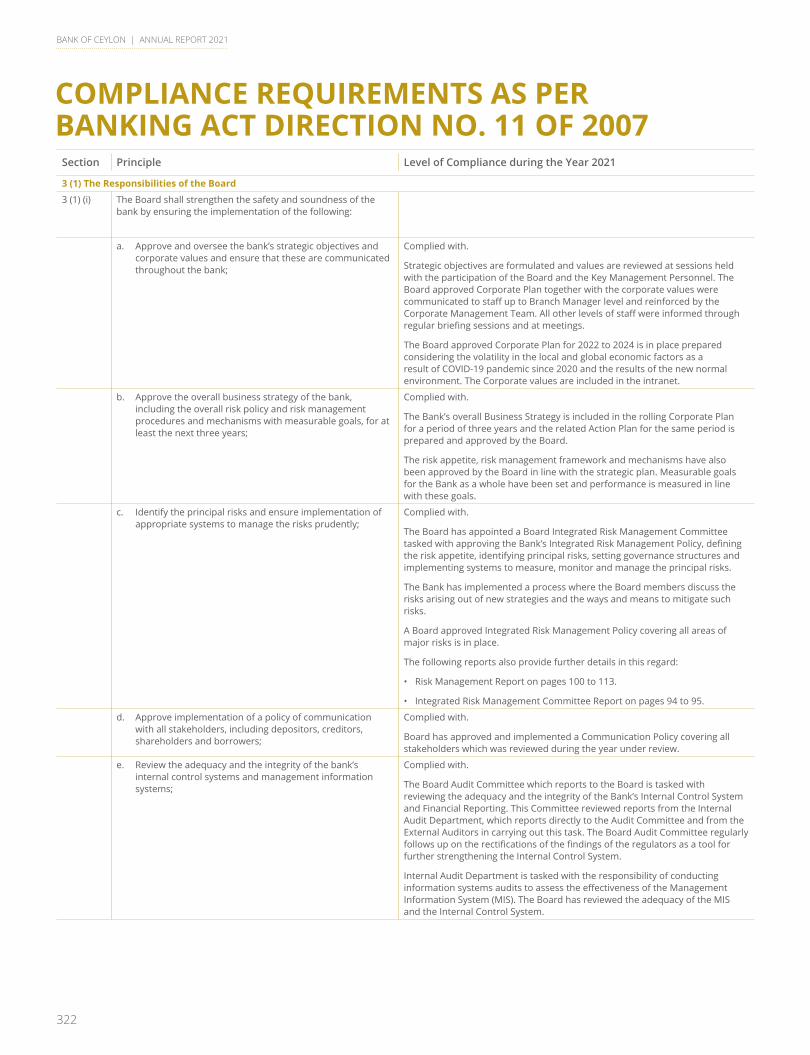
322
BANK OF CEYLON | ANNUAL REPORT 2021
COMPLIANCE REQUIREMENTS AS PERBANKING ACT DIRECTION NO. 11 OF 2007
Section Principle Level of Compliance during the Year 2021
3 (1) The Responsibilities of the Board
3 (1) (i) The Board shall strengthen the safety and soundness of the bank by ensuring the implementation of the following:
a. Approve and oversee the bank’s strategic objectives and corporate values and ensure that these are communicated throughout the bank;
Complied with.
Strategic objectives are formulated and values are reviewed at sessions held with the participation of the Board and the Key Management Personnel. The Board approved Corporate Plan together with the corporate values were communicated to staff up to Branch Manager level and reinforced by the Corporate Management Team. All other levels of staff were informed through regular briefing sessions and at meetings.
The Board approved Corporate Plan for 2022 to 2024 is in place prepared considering the volatility in the local and global economic factors as a result of COVID-19 pandemic since 2020 and the results of the new normal environment. The Corporate values are included in the intranet.
b. Approve the overall business strategy of the bank, including the overall risk policy and risk management procedures and mechanisms with measurable goals, for at least the next three years;
Complied with.
The Bank’s overall Business Strategy is included in the rolling Corporate Plan for a period of three years and the related Action Plan for the same period is prepared and approved by the Board.
The risk appetite, risk management framework and mechanisms have also been approved by the Board in line with the strategic plan. Measurable goals for the Bank as a whole have been set and performance is measured in line with these goals.
c. Identify the principal risks and ensure implementation of appropriate systems to manage the risks prudently;
Complied with.
The Board has appointed a Board Integrated Risk Management Committee tasked with approving the Bank’s Integrated Risk Management Policy, defining the risk appetite, identifying principal risks, setting governance structures and implementing systems to measure, monitor and manage the principal risks.
The Bank has implemented a process where the Board members discuss the risks arising out of new strategies and the ways and means to mitigate such risks.
A Board approved Integrated Risk Management Policy covering all areas of major risks is in place.
The following reports also provide further details in this regard:
• Risk Management Report on pages 100 to 113.
• Integrated Risk Management Committee Report on pages 94 to 95.
d. Approve implementation of a policy of communication with all stakeholders, including depositors, creditors, shareholders and borrowers;
Complied with.
Board has approved and implemented a Communication Policy covering all stakeholders which was reviewed during the year under review.
e. Review the adequacy and the integrity of the bank’s internal control systems and management information systems;
Complied with.
The Board Audit Committee which reports to the Board is tasked with reviewing the adequacy and the integrity of the Bank’s Internal Control System and Financial Reporting. This Committee reviewed reports from the Internal Audit Department, which reports directly to the Audit Committee and from the External Auditors in carrying out this task. The Board Audit Committee regularly follows up on the rectifications of the findings of the regulators as a tool for further strengthening the Internal Control System.
Internal Audit Department is tasked with the responsibility of conducting information systems audits to assess the effectiveness of the Management Information System (MIS). The Board has reviewed the adequacy of the MIS and the Internal Control System.
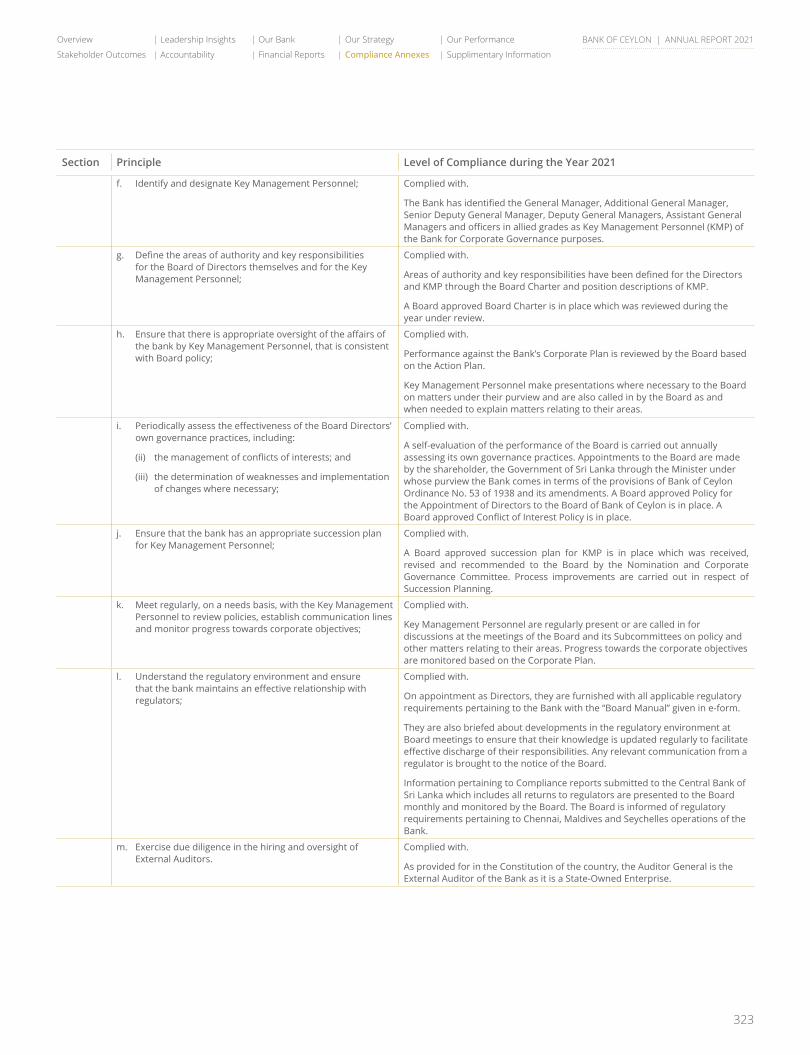
323
Overview Leadership Insights Our Bank Our Strategy Our Performance
Stakeholder Outcomes Accountability Financial Reports Compliance Annexes Supplimentary Information
BANK OF CEYLON | ANNUAL REPORT 2021
Section Principle Level of Compliance during the Year 2021
f. Identify and designate Key Management Personnel; Complied with.
The Bank has identified the General Manager, Additional General Manager, Senior Deputy General Manager, Deputy General Managers, Assistant General Managers and officers in allied grades as Key Management Personnel (KMP) of the Bank for Corporate Governance purposes.
g. Define the areas of authority and key responsibilities for the Board of Directors themselves and for the Key Management Personnel;
Complied with.
Areas of authority and key responsibilities have been defined for the Directors and KMP through the Board Charter and position descriptions of KMP.
A Board approved Board Charter is in place which was reviewed during the year under review.
h. Ensure that there is appropriate oversight of the affairs of the bank by Key Management Personnel, that is consistent with Board policy;
Complied with.
Performance against the Bank’s Corporate Plan is reviewed by the Board based on the Action Plan.
Key Management Personnel make presentations where necessary to the Board on matters under their purview and are also called in by the Board as and when needed to explain matters relating to their areas.
i. Periodically assess the effectiveness of the Board Directors’ own governance practices, including:
(ii) the management of conflicts of interests; and
(iii) the determination of weaknesses and implementation of changes where necessary;
Complied with.
A self-evaluation of the performance of the Board is carried out annually assessing its own governance practices. Appointments to the Board are made by the shareholder, the Government of Sri Lanka through the Minister under whose purview the Bank comes in terms of the provisions of Bank of Ceylon Ordinance No. 53 of 1938 and its amendments. A Board approved Policy for the Appointment of Directors to the Board of Bank of Ceylon is in place. A Board approved Conflict of Interest Policy is in place.
j. Ensure that the bank has an appropriate succession plan for Key Management Personnel;
Complied with.
A Board approved succession plan for KMP is in place which was received, revised and recommended to the Board by the Nomination and Corporate Governance Committee. Process improvements are carried out in respect of Succession Planning.
k. Meet regularly, on a needs basis, with the Key Management Personnel to review policies, establish communication lines and monitor progress towards corporate objectives;
Complied with.
Key Management Personnel are regularly present or are called in for discussions at the meetings of the Board and its Subcommittees on policy and other matters relating to their areas. Progress towards the corporate objectives are monitored based on the Corporate Plan.
l. Understand the regulatory environment and ensure that the bank maintains an effective relationship with regulators;
Complied with.
On appointment as Directors, they are furnished with all applicable regulatory requirements pertaining to the Bank with the “Board Manual” given in e-form.
They are also briefed about developments in the regulatory environment at Board meetings to ensure that their knowledge is updated regularly to facilitate effective discharge of their responsibilities. Any relevant communication from a regulator is brought to the notice of the Board.
Information pertaining to Compliance reports submitted to the Central Bank of Sri Lanka which includes all returns to regulators are presented to the Board monthly and monitored by the Board. The Board is informed of regulatory requirements pertaining to Chennai, Maldives and Seychelles operations of the Bank.
m. Exercise due diligence in the hiring and oversight of External Auditors.
Complied with.
As provided for in the Constitution of the country, the Auditor General is the External Auditor of the Bank as it is a State-Owned Enterprise.
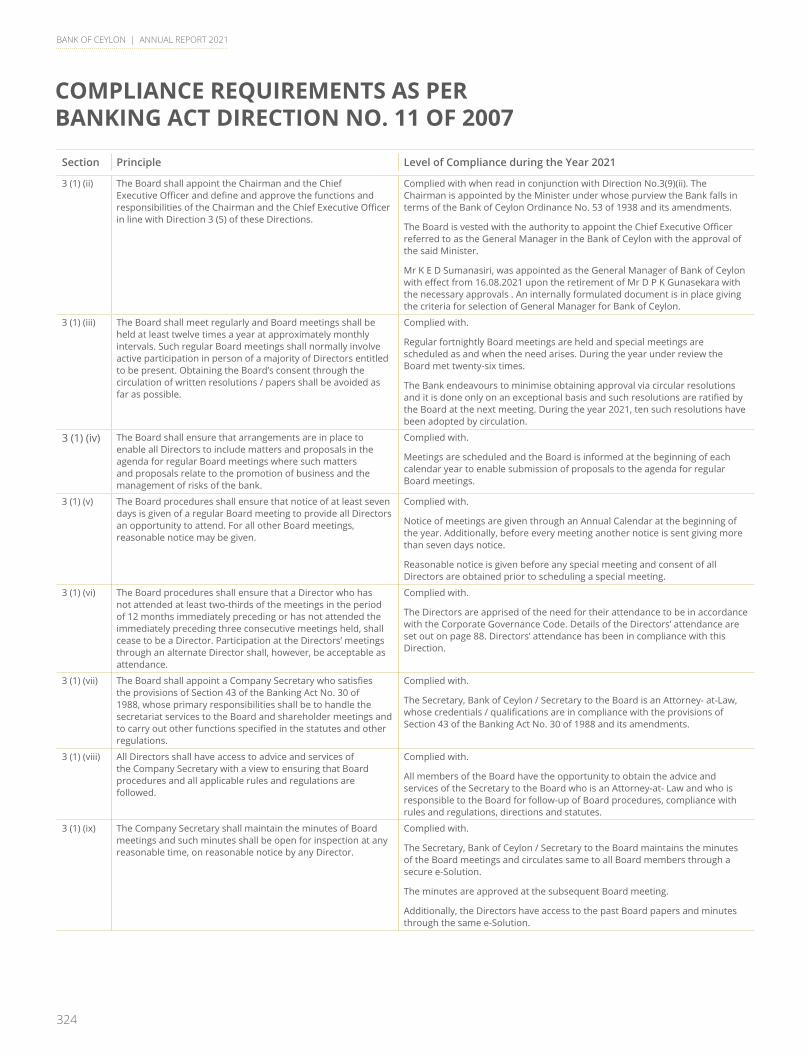
324
BANK OF CEYLON | ANNUAL REPORT 2021
COMPLIANCE REQUIREMENTS AS PER BANKING ACT DIRECTION NO. 11 OF 2007
Section Principle Level of Compliance during the Year 2021
3 (1) (ii) The Board shall appoint the Chairman and the Chief Executive Officer and define and approve the functions and responsibilities of the Chairman and the Chief Executive Officer in line with Direction 3 (5) of these Directions.
Complied with when read in conjunction with Direction No.3(9)(ii). The Chairman is appointed by the Minister under whose purview the Bank falls in terms of the Bank of Ceylon Ordinance No. 53 of 1938 and its amendments.
The Board is vested with the authority to appoint the Chief Executive Officer referred to as the General Manager in the Bank of Ceylon with the approval of the said Minister.
Mr K E D Sumanasiri, was appointed as the General Manager of Bank of Ceylon with effect from 16.08.2021 upon the retirement of Mr D P K Gunasekara with the necessary approvals . An internally formulated document is in place giving the criteria for selection of General Manager for Bank of Ceylon.
3 (1) (iii) The Board shall meet regularly and Board meetings shall be held at least twelve times a year at approximately monthly intervals. Such regular Board meetings shall normally involve active participation in person of a majority of Directors entitled to be present. Obtaining the Board’s consent through the circulation of written resolutions / papers shall be avoided as far as possible.
Complied with.
Regular fortnightly Board meetings are held and special meetings are scheduled as and when the need arises. During the year under review the Board met twenty-six times.
The Bank endeavours to minimise obtaining approval via circular resolutions and it is done only on an exceptional basis and such resolutions are ratified by the Board at the next meeting. During the year 2021, ten such resolutions have been adopted by circulation.
3 (1) (iv) The Board shall ensure that arrangements are in place to enable all Directors to include matters and proposals in the agenda for regular Board meetings where such matters and proposals relate to the promotion of business and the management of risks of the bank.
Complied with.
Meetings are scheduled and the Board is informed at the beginning of each calendar year to enable submission of proposals to the agenda for regular Board meetings.
3 (1) (v) The Board procedures shall ensure that notice of at least seven days is given of a regular Board meeting to provide all Directors an opportunity to attend. For all other Board meetings, reasonable notice may be given.
Complied with.
Notice of meetings are given through an Annual Calendar at the beginning of the year. Additionally, before every meeting another notice is sent giving more than seven days notice.
Reasonable notice is given before any special meeting and consent of all Directors are obtained prior to scheduling a special meeting.
3 (1) (vi) The Board procedures shall ensure that a Director who has not attended at least two-thirds of the meetings in the period of 12 months immediately preceding or has not attended the immediately preceding three consecutive meetings held, shall cease to be a Director. Participation at the Directors’ meetings through an alternate Director shall, however, be acceptable as attendance.
Complied with.
The Directors are apprised of the need for their attendance to be in accordance with the Corporate Governance Code. Details of the Directors’ attendance are set out on page 88. Directors’ attendance has been in compliance with this Direction.
3 (1) (vii) The Board shall appoint a Company Secretary who satisfies the provisions of Section 43 of the Banking Act No. 30 of 1988, whose primary responsibilities shall be to handle the secretariat services to the Board and shareholder meetings and to carry out other functions specified in the statutes and other regulations.
Complied with.
The Secretary, Bank of Ceylon / Secretary to the Board is an Attorney- at-Law, whose credentials / qualifications are in compliance with the provisions of Section 43 of the Banking Act No. 30 of 1988 and its amendments.
3 (1) (viii) All Directors shall have access to advice and services of the Company Secretary with a view to ensuring that Board procedures and all applicable rules and regulations are followed.
Complied with.
All members of the Board have the opportunity to obtain the advice and services of the Secretary to the Board who is an Attorney-at- Law and who is responsible to the Board for follow-up of Board procedures, compliance with rules and regulations, directions and statutes.
3 (1) (ix) The Company Secretary shall maintain the minutes of Board meetings and such minutes shall be open for inspection at any reasonable time, on reasonable notice by any Director.
Complied with.
The Secretary, Bank of Ceylon / Secretary to the Board maintains the minutes of the Board meetings and circulates same to all Board members through a secure e-Solution.
The minutes are approved at the subsequent Board meeting.
Additionally, the Directors have access to the past Board papers and minutes through the same e-Solution.
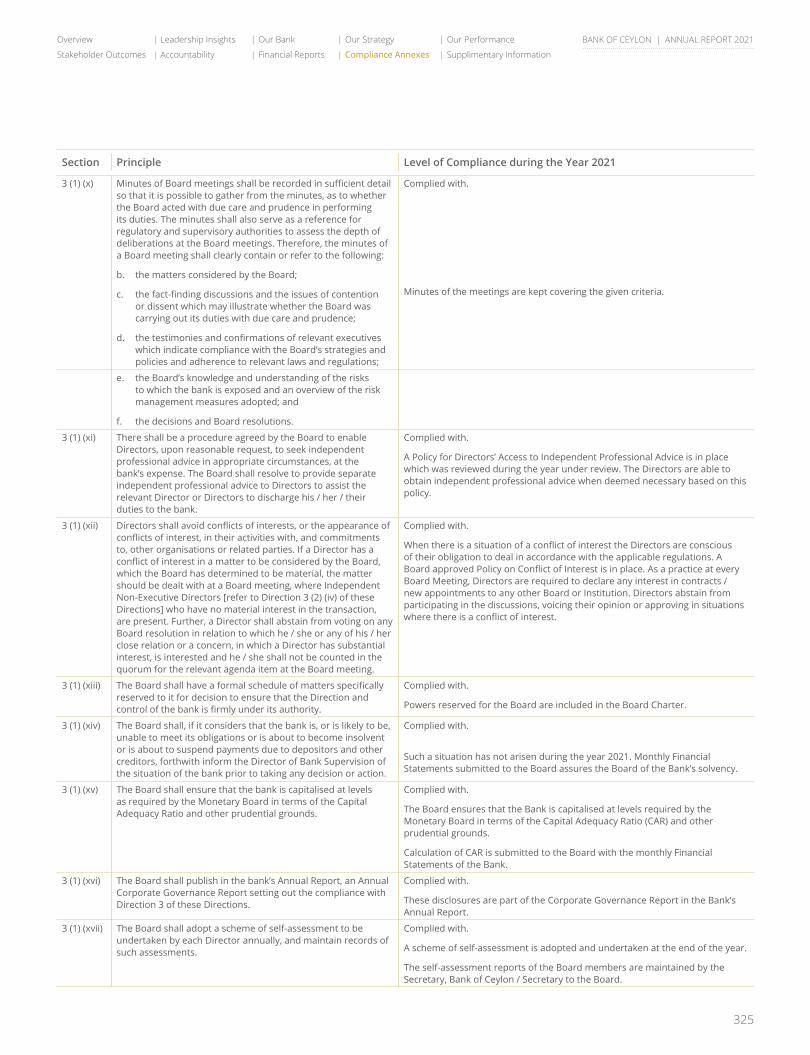
325
Overview Leadership Insights Our Bank Our Strategy Our Performance
Stakeholder Outcomes Accountability Financial Reports Compliance Annexes Supplimentary Information
BANK OF CEYLON | ANNUAL REPORT 2021
Section Principle Level of Compliance during the Year 2021
3 (1) (x) Minutes of Board meetings shall be recorded in sufficient detail so that it is possible to gather from the minutes, as to whether the Board acted with due care and prudence in performing its duties. The minutes shall also serve as a reference for regulatory and supervisory authorities to assess the depth of deliberations at the Board meetings. Therefore, the minutes of a Board meeting shall clearly contain or refer to the following:
b. the matters considered by the Board;
c. the fact-finding discussions and the issues of contention or dissent which may illustrate whether the Board was carrying out its duties with due care and prudence;
d. the testimonies and confirmations of relevant executives which indicate compliance with the Board’s strategies and policies and adherence to relevant laws and regulations;
Complied with.
Minutes of the meetings are kept covering the given criteria.
e. the Board’s knowledge and understanding of the risks to which the bank is exposed and an overview of the risk management measures adopted; and
f. the decisions and Board resolutions.
3 (1) (xi) There shall be a procedure agreed by the Board to enable Directors, upon reasonable request, to seek independent professional advice in appropriate circumstances, at the bank’s expense. The Board shall resolve to provide separate independent professional advice to Directors to assist the relevant Director or Directors to discharge his / her / their duties to the bank.
Complied with.
A Policy for Directors’ Access to Independent Professional Advice is in place which was reviewed during the year under review. The Directors are able to obtain independent professional advice when deemed necessary based on this policy.
3 (1) (xii) Directors shall avoid conflicts of interests, or the appearance of conflicts of interest, in their activities with, and commitments to, other organisations or related parties. If a Director has a conflict of interest in a matter to be considered by the Board, which the Board has determined to be material, the matter should be dealt with at a Board meeting, where Independent Non-Executive Directors [refer to Direction 3 (2) (iv) of these Directions] who have no material interest in the transaction, are present. Further, a Director shall abstain from voting on any Board resolution in relation to which he / she or any of his / her close relation or a concern, in which a Director has substantial interest, is interested and he / she shall not be counted in the quorum for the relevant agenda item at the Board meeting.
Complied with.
When there is a situation of a conflict of interest the Directors are conscious of their obligation to deal in accordance with the applicable regulations. A Board approved Policy on Conflict of Interest is in place. As a practice at every Board Meeting, Directors are required to declare any interest in contracts / new appointments to any other Board or Institution. Directors abstain from participating in the discussions, voicing their opinion or approving in situations where there is a conflict of interest.
3 (1) (xiii) The Board shall have a formal schedule of matters specifically reserved to it for decision to ensure that the Direction and control of the bank is firmly under its authority.
Complied with.
Powers reserved for the Board are included in the Board Charter.
3 (1) (xiv) The Board shall, if it considers that the bank is, or is likely to be, unable to meet its obligations or is about to become insolvent or is about to suspend payments due to depositors and other creditors, forthwith inform the Director of Bank Supervision of the situation of the bank prior to taking any decision or action.
Complied with.
Such a situation has not arisen during the year 2021. Monthly Financial Statements submitted to the Board assures the Board of the Bank’s solvency.
3 (1) (xv) The Board shall ensure that the bank is capitalised at levels as required by the Monetary Board in terms of the Capital Adequacy Ratio and other prudential grounds.
Complied with.
The Board ensures that the Bank is capitalised at levels required by the Monetary Board in terms of the Capital Adequacy Ratio (CAR) and other prudential grounds.
Calculation of CAR is submitted to the Board with the monthly Financial Statements of the Bank.
3 (1) (xvi) The Board shall publish in the bank’s Annual Report, an Annual Corporate Governance Report setting out the compliance with Direction 3 of these Directions.
Complied with.
These disclosures are part of the Corporate Governance Report in the Bank’s Annual Report.
3 (1) (xvii) The Board shall adopt a scheme of self-assessment to be undertaken by each Director annually, and maintain records of such assessments.
Complied with.
A scheme of self-assessment is adopted and undertaken at the end of the year.
The self-assessment reports of the Board members are maintained by the Secretary, Bank of Ceylon / Secretary to the Board.
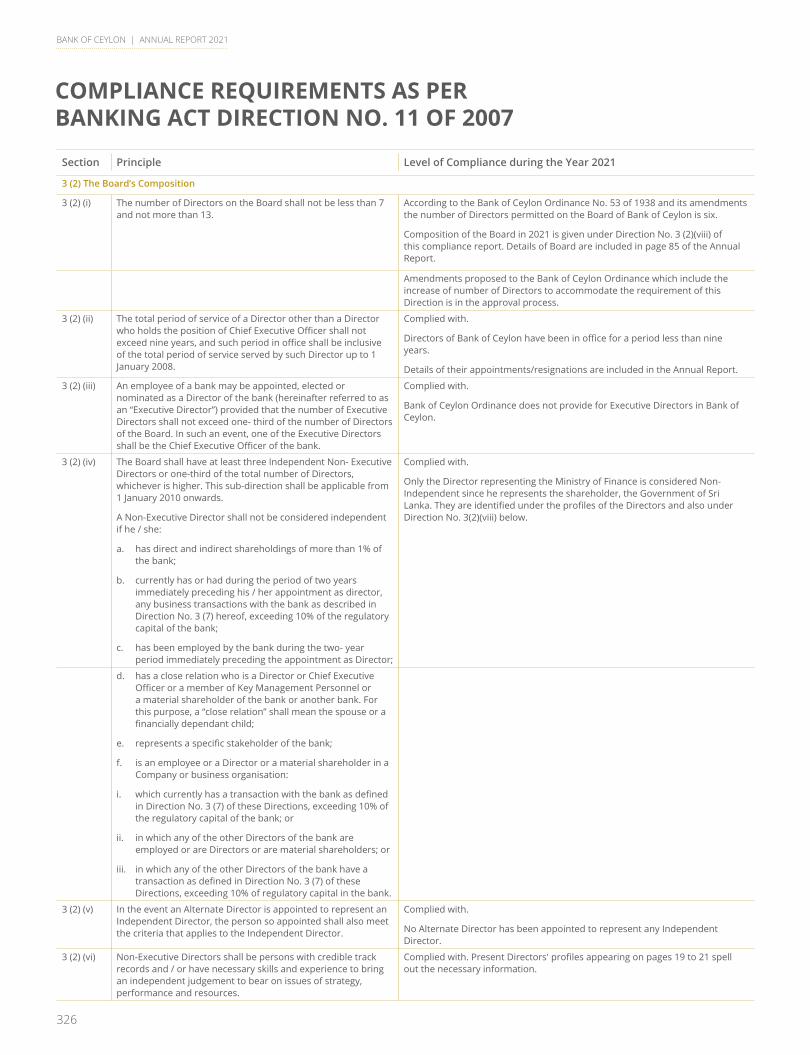
326
BANK OF CEYLON | ANNUAL REPORT 2021
COMPLIANCE REQUIREMENTS AS PER BANKING ACT DIRECTION NO. 11 OF 2007
Section Principle Level of Compliance during the Year 2021
3 (2) The Board’s Composition
3 (2) (i) The number of Directors on the Board shall not be less than 7 and not more than 13.
According to the Bank of Ceylon Ordinance No. 53 of 1938 and its amendments the number of Directors permitted on the Board of Bank of Ceylon is six.
Composition of the Board in 2021 is given under Direction No. 3 (2)(viii) of this compliance report. Details of Board are included in page 85 of the Annual Report.
Amendments proposed to the Bank of Ceylon Ordinance which include the increase of number of Directors to accommodate the requirement of this Direction is in the approval process.
3 (2) (ii) The total period of service of a Director other than a Director who holds the position of Chief Executive Officer shall not exceed nine years, and such period in office shall be inclusive of the total period of service served by such Director up to 1 January 2008.
Complied with.
Directors of Bank of Ceylon have been in office for a period less than nine years.
Details of their appointments/resignations are included in the Annual Report.
3 (2) (iii) An employee of a bank may be appointed, elected or nominated as a Director of the bank (hereinafter referred to as an “Executive Director”) provided that the number of Executive Directors shall not exceed one- third of the number of Directors of the Board. In such an event, one of the Executive Directors shall be the Chief Executive Officer of the bank.
Complied with.
Bank of Ceylon Ordinance does not provide for Executive Directors in Bank of Ceylon.
3 (2) (iv) The Board shall have at least three Independent Non- Executive Directors or one-third of the total number of Directors, whichever is higher. This sub-direction shall be applicable from 1 January 2010 onwards.
A Non-Executive Director shall not be considered independent if he / she:
a. has direct and indirect shareholdings of more than 1% of the bank;
b. currently has or had during the period of two years immediately preceding his / her appointment as director, any business transactions with the bank as described in Direction No. 3 (7) hereof, exceeding 10% of the regulatory capital of the bank;
c. has been employed by the bank during the two- year period immediately preceding the appointment as Director;
Complied with.
Only the Director representing the Ministry of Finance is considered Non-Independent since he represents the shareholder, the Government of Sri Lanka. They are identified under the profiles of the Directors and also under Direction No. 3(2)(viii) below.
d. has a close relation who is a Director or Chief Executive Officer or a member of Key Management Personnel or a material shareholder of the bank or another bank. For this purpose, a “close relation” shall mean the spouse or a financially dependant child;
e. represents a specific stakeholder of the bank;
f. is an employee or a Director or a material shareholder in a Company or business organisation:
i. which currently has a transaction with the bank as defined in Direction No. 3 (7) of these Directions, exceeding 10% of the regulatory capital of the bank; or
ii. in which any of the other Directors of the bank are employed or are Directors or are material shareholders; or
iii. in which any of the other Directors of the bank have a transaction as defined in Direction No. 3 (7) of these Directions, exceeding 10% of regulatory capital in the bank.
3 (2) (v) In the event an Alternate Director is appointed to represent an Independent Director, the person so appointed shall also meet the criteria that applies to the Independent Director.
Complied with.
No Alternate Director has been appointed to represent any Independent Director.
3 (2) (vi) Non-Executive Directors shall be persons with credible track records and / or have necessary skills and experience to bring an independent judgement to bear on issues of strategy, performance and resources.
Complied with. Present Directors' profiles appearing on pages 19 to 21 spell out the necessary information.
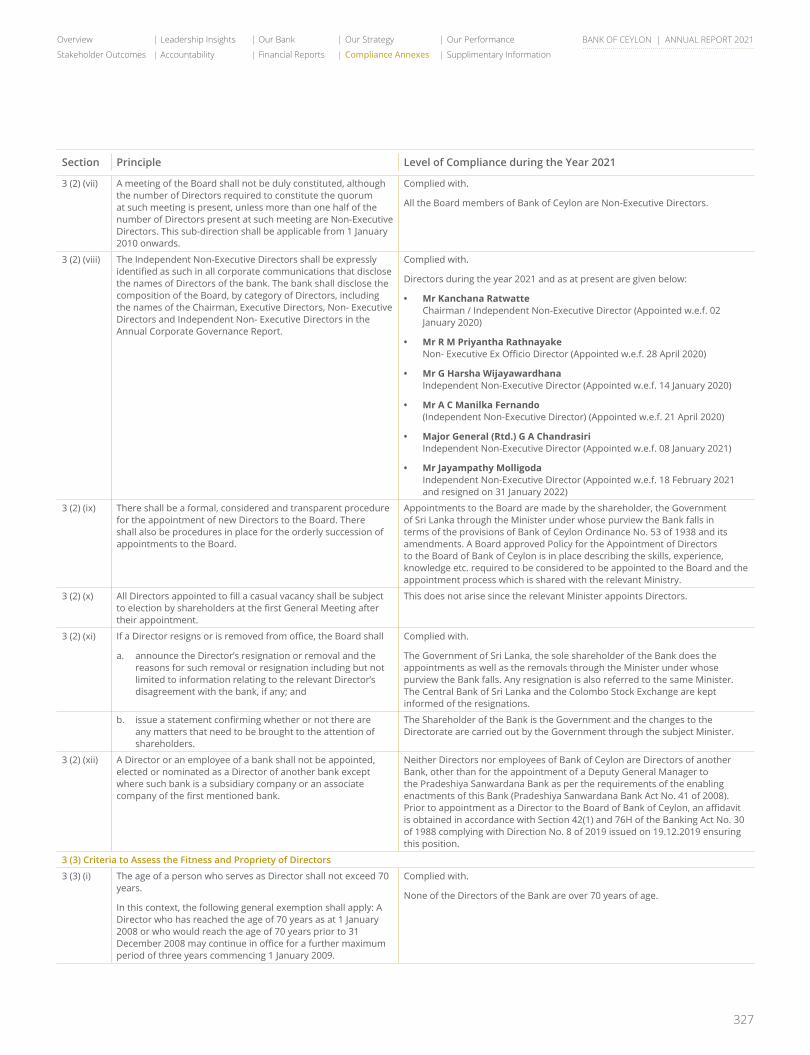
327
Overview Leadership Insights Our Bank Our Strategy Our Performance
Stakeholder Outcomes Accountability Financial Reports Compliance Annexes Supplimentary Information
BANK OF CEYLON | ANNUAL REPORT 2021
Section Principle Level of Compliance during the Year 2021
3 (2) (vii) A meeting of the Board shall not be duly constituted, although the number of Directors required to constitute the quorum at such meeting is present, unless more than one half of the number of Directors present at such meeting are Non-Executive Directors. This sub-direction shall be applicable from 1 January 2010 onwards.
Complied with.
All the Board members of Bank of Ceylon are Non-Executive Directors.
3 (2) (viii) The Independent Non-Executive Directors shall be expressly identified as such in all corporate communications that disclose the names of Directors of the bank. The bank shall disclose the composition of the Board, by category of Directors, including the names of the Chairman, Executive Directors, Non- Executive Directors and Independent Non- Executive Directors in the Annual Corporate Governance Report.
Complied with.
Directors during the year 2021 and as at present are given below:
• Mr Kanchana Ratwatte Chairman / Independent Non-Executive Director (Appointed w.e.f. 02
January 2020)
• Mr R M Priyantha Rathnayake Non- Executive Ex Officio Director (Appointed w.e.f. 28 April 2020)
• Mr G Harsha Wijayawardhana Independent Non-Executive Director (Appointed w.e.f. 14 January 2020)
• Mr A C Manilka Fernando (Independent Non-Executive Director) (Appointed w.e.f. 21 April 2020)
• Major General (Rtd.) G A Chandrasiri Independent Non-Executive Director (Appointed w.e.f. 08 January 2021)
• Mr Jayampathy Molligoda Independent Non-Executive Director (Appointed w.e.f. 18 February 2021
and resigned on 31 January 2022)
3 (2) (ix) There shall be a formal, considered and transparent procedure for the appointment of new Directors to the Board. There shall also be procedures in place for the orderly succession of appointments to the Board.
Appointments to the Board are made by the shareholder, the Government of Sri Lanka through the Minister under whose purview the Bank falls in terms of the provisions of Bank of Ceylon Ordinance No. 53 of 1938 and its amendments. A Board approved Policy for the Appointment of Directors to the Board of Bank of Ceylon is in place describing the skills, experience, knowledge etc. required to be considered to be appointed to the Board and the appointment process which is shared with the relevant Ministry.
3 (2) (x) All Directors appointed to fill a casual vacancy shall be subject to election by shareholders at the first General Meeting after their appointment.
This does not arise since the relevant Minister appoints Directors.
3 (2) (xi) If a Director resigns or is removed from office, the Board shall
a. announce the Director’s resignation or removal and the reasons for such removal or resignation including but not limited to information relating to the relevant Director’s disagreement with the bank, if any; and
Complied with.
The Government of Sri Lanka, the sole shareholder of the Bank does the appointments as well as the removals through the Minister under whose purview the Bank falls. Any resignation is also referred to the same Minister. The Central Bank of Sri Lanka and the Colombo Stock Exchange are kept informed of the resignations.
b. issue a statement confirming whether or not there are any matters that need to be brought to the attention of shareholders.
The Shareholder of the Bank is the Government and the changes to the Directorate are carried out by the Government through the subject Minister.
3 (2) (xii) A Director or an employee of a bank shall not be appointed, elected or nominated as a Director of another bank except where such bank is a subsidiary company or an associate company of the first mentioned bank.
Neither Directors nor employees of Bank of Ceylon are Directors of another Bank, other than for the appointment of a Deputy General Manager to the Pradeshiya Sanwardana Bank as per the requirements of the enabling enactments of this Bank (Pradeshiya Sanwardana Bank Act No. 41 of 2008). Prior to appointment as a Director to the Board of Bank of Ceylon, an affidavit is obtained in accordance with Section 42(1) and 76H of the Banking Act No. 30 of 1988 complying with Direction No. 8 of 2019 issued on 19.12.2019 ensuring this position.
3 (3) Criteria to Assess the Fitness and Propriety of Directors
3 (3) (i) The age of a person who serves as Director shall not exceed 70 years.
In this context, the following general exemption shall apply: A Director who has reached the age of 70 years as at 1 January 2008 or who would reach the age of 70 years prior to 31 December 2008 may continue in office for a further maximum period of three years commencing 1 January 2009.
Complied with.
None of the Directors of the Bank are over 70 years of age.
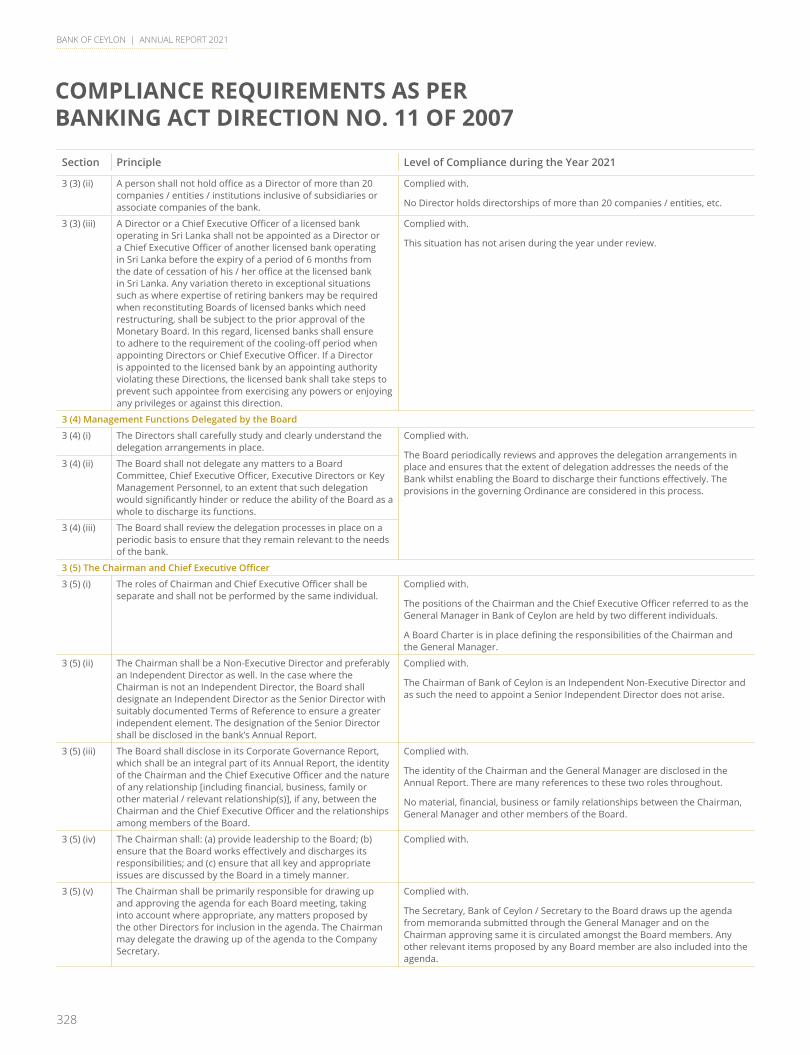
328
BANK OF CEYLON | ANNUAL REPORT 2021
COMPLIANCE REQUIREMENTS AS PER BANKING ACT DIRECTION NO. 11 OF 2007
Section Principle Level of Compliance during the Year 2021
3 (3) (ii) A person shall not hold office as a Director of more than 20 companies / entities / institutions inclusive of subsidiaries or associate companies of the bank.
Complied with.
No Director holds directorships of more than 20 companies / entities, etc.
3 (3) (iii) A Director or a Chief Executive Officer of a licensed bank operating in Sri Lanka shall not be appointed as a Director or a Chief Executive Officer of another licensed bank operating in Sri Lanka before the expiry of a period of 6 months from the date of cessation of his / her office at the licensed bank in Sri Lanka. Any variation thereto in exceptional situations such as where expertise of retiring bankers may be required when reconstituting Boards of licensed banks which need restructuring, shall be subject to the prior approval of the Monetary Board. In this regard, licensed banks shall ensure to adhere to the requirement of the cooling-off period when appointing Directors or Chief Executive Officer. If a Director is appointed to the licensed bank by an appointing authority violating these Directions, the licensed bank shall take steps to prevent such appointee from exercising any powers or enjoying any privileges or against this direction.
Complied with.
This situation has not arisen during the year under review.
3 (4) Management Functions Delegated by the Board
3 (4) (i) The Directors shall carefully study and clearly understand the delegation arrangements in place.
Complied with.
The Board periodically reviews and approves the delegation arrangements in place and ensures that the extent of delegation addresses the needs of the Bank whilst enabling the Board to discharge their functions effectively. The provisions in the governing Ordinance are considered in this process.
3 (4) (ii) The Board shall not delegate any matters to a Board Committee, Chief Executive Officer, Executive Directors or Key Management Personnel, to an extent that such delegation would significantly hinder or reduce the ability of the Board as a whole to discharge its functions.
3 (4) (iii) The Board shall review the delegation processes in place on a periodic basis to ensure that they remain relevant to the needs of the bank.
3(5)TheChairmanandChiefExecutiveOfficer
3 (5) (i) The roles of Chairman and Chief Executive Officer shall be separate and shall not be performed by the same individual.
Complied with.
The positions of the Chairman and the Chief Executive Officer referred to as the General Manager in Bank of Ceylon are held by two different individuals.
A Board Charter is in place defining the responsibilities of the Chairman and the General Manager.
3 (5) (ii) The Chairman shall be a Non-Executive Director and preferably an Independent Director as well. In the case where the Chairman is not an Independent Director, the Board shall designate an Independent Director as the Senior Director with suitably documented Terms of Reference to ensure a greater independent element. The designation of the Senior Director shall be disclosed in the bank’s Annual Report.
Complied with.
The Chairman of Bank of Ceylon is an Independent Non-Executive Director and as such the need to appoint a Senior Independent Director does not arise.
3 (5) (iii) The Board shall disclose in its Corporate Governance Report, which shall be an integral part of its Annual Report, the identity of the Chairman and the Chief Executive Officer and the nature of any relationship [including financial, business, family or other material / relevant relationship(s)], if any, between the Chairman and the Chief Executive Officer and the relationships among members of the Board.
Complied with.
The identity of the Chairman and the General Manager are disclosed in the Annual Report. There are many references to these two roles throughout.
No material, financial, business or family relationships between the Chairman, General Manager and other members of the Board.
3 (5) (iv) The Chairman shall: (a) provide leadership to the Board; (b) ensure that the Board works effectively and discharges its responsibilities; and (c) ensure that all key and appropriate issues are discussed by the Board in a timely manner.
Complied with.
3 (5) (v) The Chairman shall be primarily responsible for drawing up and approving the agenda for each Board meeting, taking into account where appropriate, any matters proposed by the other Directors for inclusion in the agenda. The Chairman may delegate the drawing up of the agenda to the Company Secretary.
Complied with.
The Secretary, Bank of Ceylon / Secretary to the Board draws up the agenda from memoranda submitted through the General Manager and on the Chairman approving same it is circulated amongst the Board members. Any other relevant items proposed by any Board member are also included into the agenda.
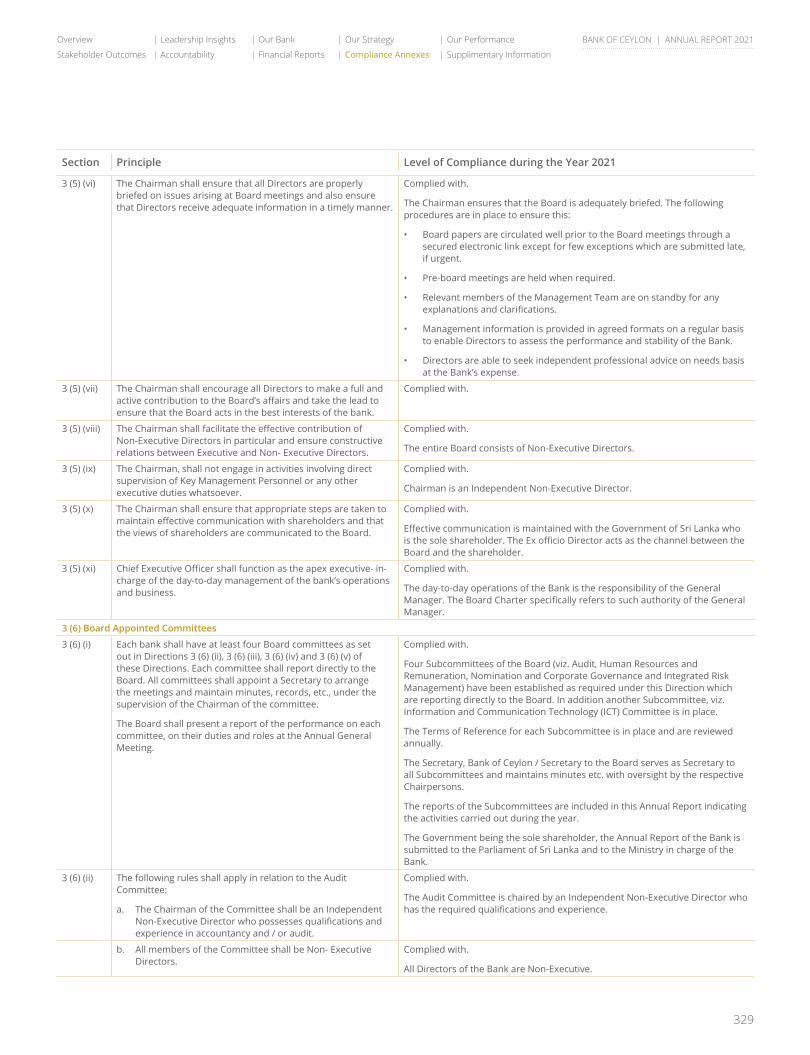
329
Overview Leadership Insights Our Bank Our Strategy Our Performance
Stakeholder Outcomes Accountability Financial Reports Compliance Annexes Supplimentary Information
BANK OF CEYLON | ANNUAL REPORT 2021
Section Principle Level of Compliance during the Year 2021
3 (5) (vi) The Chairman shall ensure that all Directors are properly briefed on issues arising at Board meetings and also ensure that Directors receive adequate information in a timely manner.
Complied with.
The Chairman ensures that the Board is adequately briefed. The following procedures are in place to ensure this:
• Board papers are circulated well prior to the Board meetings through a secured electronic link except for few exceptions which are submitted late, if urgent.
• Pre-board meetings are held when required.
• Relevant members of the Management Team are on standby for any explanations and clarifications.
• Management information is provided in agreed formats on a regular basis to enable Directors to assess the performance and stability of the Bank.
• Directors are able to seek independent professional advice on needs basis at the Bank’s expense.
3 (5) (vii) The Chairman shall encourage all Directors to make a full and active contribution to the Board’s affairs and take the lead to ensure that the Board acts in the best interests of the bank.
Complied with.
3 (5) (viii) The Chairman shall facilitate the effective contribution of Non-Executive Directors in particular and ensure constructive relations between Executive and Non- Executive Directors.
Complied with.
The entire Board consists of Non-Executive Directors.
3 (5) (ix) The Chairman, shall not engage in activities involving direct supervision of Key Management Personnel or any other executive duties whatsoever.
Complied with.
Chairman is an Independent Non-Executive Director.
3 (5) (x) The Chairman shall ensure that appropriate steps are taken to maintain effective communication with shareholders and that the views of shareholders are communicated to the Board.
Complied with.
Effective communication is maintained with the Government of Sri Lanka who is the sole shareholder. The Ex officio Director acts as the channel between the Board and the shareholder.
3 (5) (xi) Chief Executive Officer shall function as the apex executive- in-charge of the day-to-day management of the bank’s operations and business.
Complied with.
The day-to-day operations of the Bank is the responsibility of the General Manager. The Board Charter specifically refers to such authority of the General Manager.
3 (6) Board Appointed Committees
3 (6) (i) Each bank shall have at least four Board committees as set out in Directions 3 (6) (ii), 3 (6) (iii), 3 (6) (iv) and 3 (6) (v) of these Directions. Each committee shall report directly to the Board. All committees shall appoint a Secretary to arrange the meetings and maintain minutes, records, etc., under the supervision of the Chairman of the committee.
The Board shall present a report of the performance on each committee, on their duties and roles at the Annual General Meeting.
Complied with.
Four Subcommittees of the Board (viz. Audit, Human Resources and Remuneration, Nomination and Corporate Governance and Integrated Risk Management) have been established as required under this Direction which are reporting directly to the Board. In addition another Subcommittee, viz.Information and Communication Technology (ICT) Committee is in place.
The Terms of Reference for each Subcommittee is in place and are reviewed annually.
The Secretary, Bank of Ceylon / Secretary to the Board serves as Secretary to all Subcommittees and maintains minutes etc. with oversight by the respective Chairpersons.
The reports of the Subcommittees are included in this Annual Report indicating the activities carried out during the year.
The Government being the sole shareholder, the Annual Report of the Bank is submitted to the Parliament of Sri Lanka and to the Ministry in charge of the Bank.
3 (6) (ii) The following rules shall apply in relation to the Audit Committee:
a. The Chairman of the Committee shall be an Independent Non-Executive Director who possesses qualifications and experience in accountancy and / or audit.
Complied with.
The Audit Committee is chaired by an Independent Non-Executive Director who has the required qualifications and experience.
b. All members of the Committee shall be Non- Executive Directors.
Complied with.
All Directors of the Bank are Non-Executive.
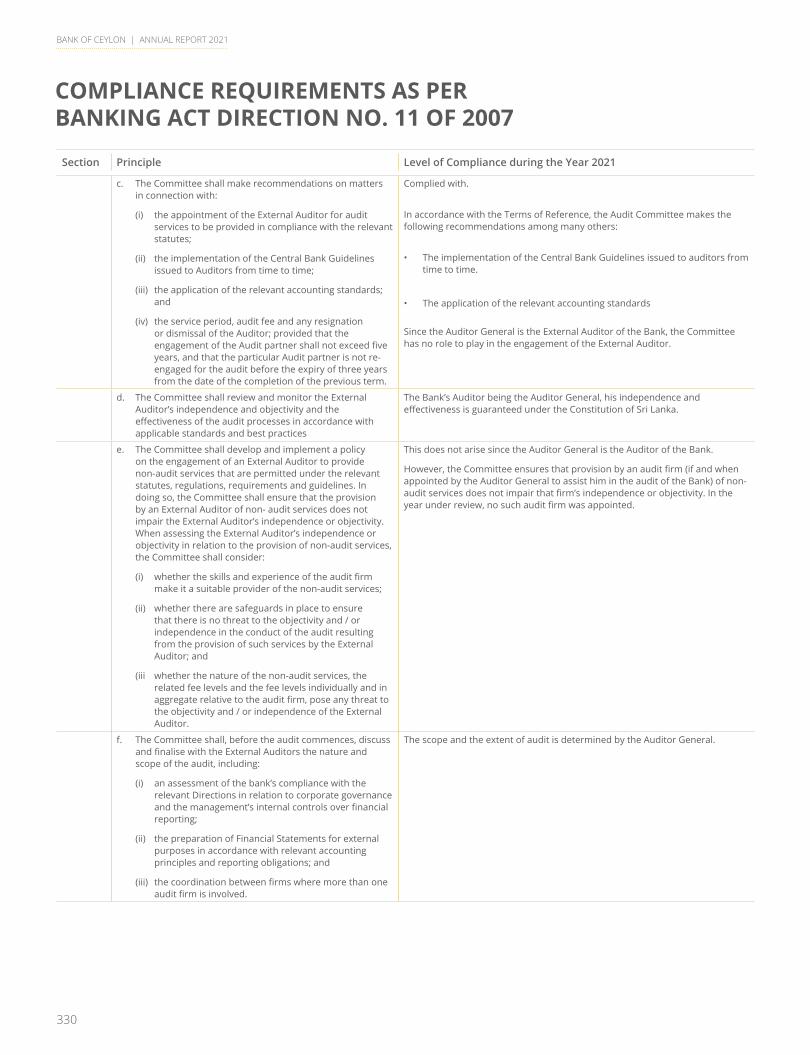
330
BANK OF CEYLON | ANNUAL REPORT 2021
COMPLIANCE REQUIREMENTS AS PER BANKING ACT DIRECTION NO. 11 OF 2007
Section Principle Level of Compliance during the Year 2021
c. The Committee shall make recommendations on matters in connection with:
(i) the appointment of the External Auditor for audit services to be provided in compliance with the relevant statutes;
(ii) the implementation of the Central Bank Guidelines issued to Auditors from time to time;
(iii) the application of the relevant accounting standards; and
(iv) the service period, audit fee and any resignation or dismissal of the Auditor; provided that the engagement of the Audit partner shall not exceed five years, and that the particular Audit partner is not re-engaged for the audit before the expiry of three years from the date of the completion of the previous term.
Complied with.
In accordance with the Terms of Reference, the Audit Committee makes the following recommendations among many others:
• The implementation of the Central Bank Guidelines issued to auditors from time to time.
• The application of the relevant accounting standards
Since the Auditor General is the External Auditor of the Bank, the Committee has no role to play in the engagement of the External Auditor.
d. The Committee shall review and monitor the External Auditor’s independence and objectivity and the effectiveness of the audit processes in accordance with applicable standards and best practices
The Bank’s Auditor being the Auditor General, his independence and effectiveness is guaranteed under the Constitution of Sri Lanka.
e. The Committee shall develop and implement a policy on the engagement of an External Auditor to provide non-audit services that are permitted under the relevant statutes, regulations, requirements and guidelines. In doing so, the Committee shall ensure that the provision by an External Auditor of non- audit services does not impair the External Auditor’s independence or objectivity. When assessing the External Auditor’s independence or objectivity in relation to the provision of non-audit services, the Committee shall consider:
(i) whether the skills and experience of the audit firm make it a suitable provider of the non-audit services;
(ii) whether there are safeguards in place to ensure that there is no threat to the objectivity and / or independence in the conduct of the audit resulting from the provision of such services by the External Auditor; and
(iii whether the nature of the non-audit services, the related fee levels and the fee levels individually and in aggregate relative to the audit firm, pose any threat to the objectivity and / or independence of the External Auditor.
This does not arise since the Auditor General is the Auditor of the Bank.
However, the Committee ensures that provision by an audit firm (if and when appointed by the Auditor General to assist him in the audit of the Bank) of non-audit services does not impair that firm’s independence or objectivity. In the year under review, no such audit firm was appointed.
f. The Committee shall, before the audit commences, discuss and finalise with the External Auditors the nature and scope of the audit, including:
(i) an assessment of the bank’s compliance with the relevant Directions in relation to corporate governance and the management’s internal controls over financial reporting;
(ii) the preparation of Financial Statements for external purposes in accordance with relevant accounting principles and reporting obligations; and
(iii) the coordination between firms where more than one audit firm is involved.
The scope and the extent of audit is determined by the Auditor General.
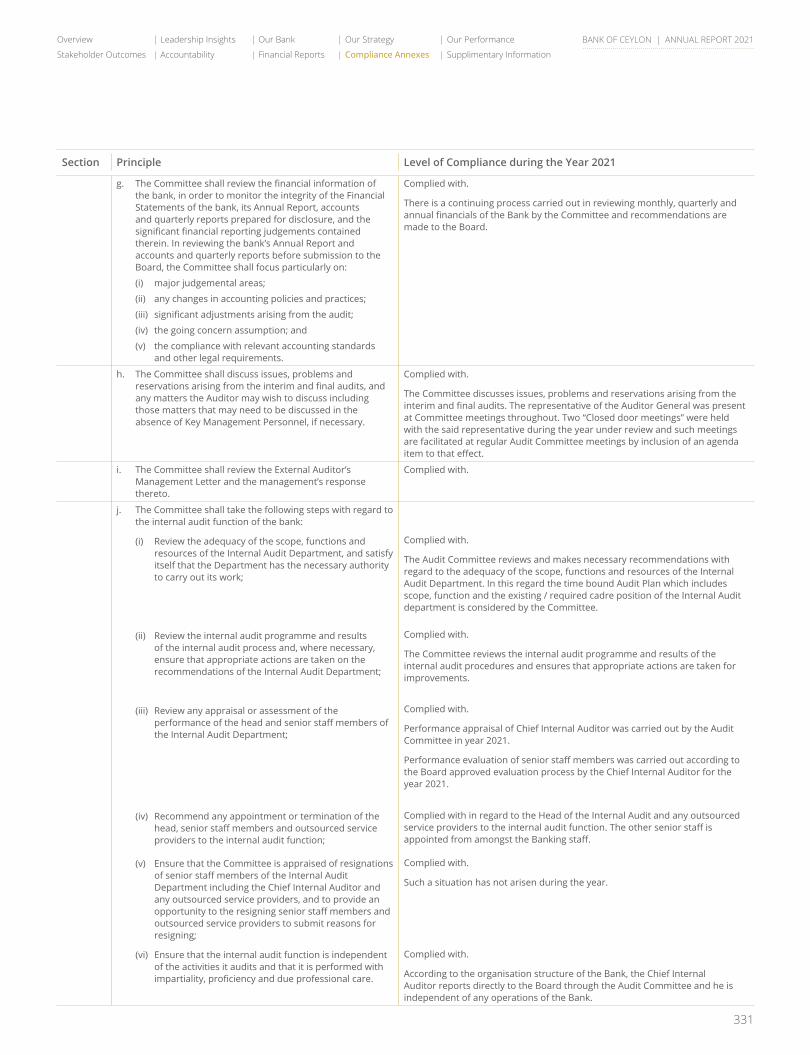
331
Overview Leadership Insights Our Bank Our Strategy Our Performance
Stakeholder Outcomes Accountability Financial Reports Compliance Annexes Supplimentary Information
BANK OF CEYLON | ANNUAL REPORT 2021
Section Principle Level of Compliance during the Year 2021
g. The Committee shall review the financial information of the bank, in order to monitor the integrity of the Financial Statements of the bank, its Annual Report, accounts and quarterly reports prepared for disclosure, and the significant financial reporting judgements contained therein. In reviewing the bank’s Annual Report and accounts and quarterly reports before submission to the Board, the Committee shall focus particularly on:
(i) major judgemental areas;
(ii) any changes in accounting policies and practices;
(iii) significant adjustments arising from the audit;
(iv) the going concern assumption; and
(v) the compliance with relevant accounting standards and other legal requirements.
Complied with.
There is a continuing process carried out in reviewing monthly, quarterly and annual financials of the Bank by the Committee and recommendations are made to the Board.
h. The Committee shall discuss issues, problems and reservations arising from the interim and final audits, and any matters the Auditor may wish to discuss including those matters that may need to be discussed in the absence of Key Management Personnel, if necessary.
Complied with.
The Committee discusses issues, problems and reservations arising from the interim and final audits. The representative of the Auditor General was present at Committee meetings throughout. Two “Closed door meetings” were held with the said representative during the year under review and such meetings are facilitated at regular Audit Committee meetings by inclusion of an agenda item to that effect.
i. The Committee shall review the External Auditor’s Management Letter and the management’s response thereto.
Complied with.
j. The Committee shall take the following steps with regard to the internal audit function of the bank:
(i) Review the adequacy of the scope, functions and resources of the Internal Audit Department, and satisfy itself that the Department has the necessary authority to carry out its work;
(ii) Review the internal audit programme and results of the internal audit process and, where necessary, ensure that appropriate actions are taken on the recommendations of the Internal Audit Department;
(iii) Review any appraisal or assessment of the performance of the head and senior staff members of the Internal Audit Department;
(iv) Recommend any appointment or termination of the head, senior staff members and outsourced service providers to the internal audit function;
(v) Ensure that the Committee is appraised of resignations of senior staff members of the Internal Audit Department including the Chief Internal Auditor and any outsourced service providers, and to provide an opportunity to the resigning senior staff members and outsourced service providers to submit reasons for resigning;
(vi) Ensure that the internal audit function is independent of the activities it audits and that it is performed with impartiality, proficiency and due professional care.
Complied with.
The Audit Committee reviews and makes necessary recommendations with regard to the adequacy of the scope, functions and resources of the Internal Audit Department. In this regard the time bound Audit Plan which includes scope, function and the existing / required cadre position of the Internal Audit department is considered by the Committee.
Complied with.
The Committee reviews the internal audit programme and results of the internal audit procedures and ensures that appropriate actions are taken for improvements.
Complied with.
Performance appraisal of Chief Internal Auditor was carried out by the Audit Committee in year 2021.
Performance evaluation of senior staff members was carried out according to the Board approved evaluation process by the Chief Internal Auditor for the year 2021.
Complied with in regard to the Head of the Internal Audit and any outsourced service providers to the internal audit function. The other senior staff is appointed from amongst the Banking staff.
Complied with.
Such a situation has not arisen during the year.
Complied with.
According to the organisation structure of the Bank, the Chief Internal Auditor reports directly to the Board through the Audit Committee and he is independent of any operations of the Bank.
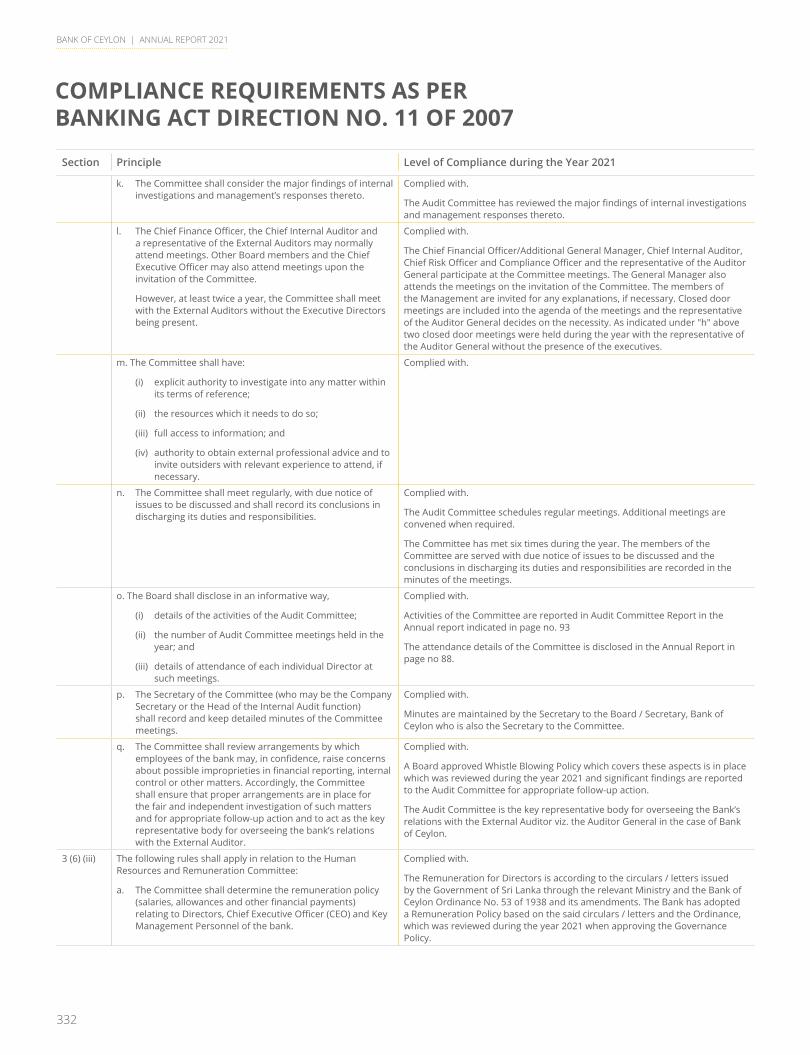
332
BANK OF CEYLON | ANNUAL REPORT 2021
COMPLIANCE REQUIREMENTS AS PER BANKING ACT DIRECTION NO. 11 OF 2007
Section Principle Level of Compliance during the Year 2021
k. The Committee shall consider the major findings of internal investigations and management’s responses thereto.
Complied with.
The Audit Committee has reviewed the major findings of internal investigations and management responses thereto.
l. The Chief Finance Officer, the Chief Internal Auditor and a representative of the External Auditors may normally attend meetings. Other Board members and the Chief Executive Officer may also attend meetings upon the invitation of the Committee.
However, at least twice a year, the Committee shall meet with the External Auditors without the Executive Directors being present.
Complied with.
The Chief Financial Officer/Additional General Manager, Chief Internal Auditor, Chief Risk Officer and Compliance Officer and the representative of the Auditor General participate at the Committee meetings. The General Manager also attends the meetings on the invitation of the Committee. The members of the Management are invited for any explanations, if necessary. Closed door meetings are included into the agenda of the meetings and the representative of the Auditor General decides on the necessity. As indicated under "h" above two closed door meetings were held during the year with the representative of the Auditor General without the presence of the executives.
m. The Committee shall have:
(i) explicit authority to investigate into any matter within its terms of reference;
(ii) the resources which it needs to do so;
(iii) full access to information; and
(iv) authority to obtain external professional advice and to invite outsiders with relevant experience to attend, if necessary.
Complied with.
n. The Committee shall meet regularly, with due notice of issues to be discussed and shall record its conclusions in discharging its duties and responsibilities.
Complied with.
The Audit Committee schedules regular meetings. Additional meetings are convened when required.
The Committee has met six times during the year. The members of the Committee are served with due notice of issues to be discussed and the conclusions in discharging its duties and responsibilities are recorded in the minutes of the meetings.
o. The Board shall disclose in an informative way,
(i) details of the activities of the Audit Committee;
(ii) the number of Audit Committee meetings held in the year; and
(iii) details of attendance of each individual Director at such meetings.
Complied with.
Activities of the Committee are reported in Audit Committee Report in the Annual report indicated in page no. 93
The attendance details of the Committee is disclosed in the Annual Report in page no 88.
p. The Secretary of the Committee (who may be the Company Secretary or the Head of the Internal Audit function) shall record and keep detailed minutes of the Committee meetings.
Complied with.
Minutes are maintained by the Secretary to the Board / Secretary, Bank of Ceylon who is also the Secretary to the Committee.
q. The Committee shall review arrangements by which employees of the bank may, in confidence, raise concerns about possible improprieties in financial reporting, internal control or other matters. Accordingly, the Committee shall ensure that proper arrangements are in place for the fair and independent investigation of such matters and for appropriate follow-up action and to act as the key representative body for overseeing the bank’s relations with the External Auditor.
Complied with.
A Board approved Whistle Blowing Policy which covers these aspects is in place which was reviewed during the year 2021 and significant findings are reported to the Audit Committee for appropriate follow-up action.
The Audit Committee is the key representative body for overseeing the Bank’s relations with the External Auditor viz. the Auditor General in the case of Bank of Ceylon.
3 (6) (iii) The following rules shall apply in relation to the Human Resources and Remuneration Committee:
a. The Committee shall determine the remuneration policy (salaries, allowances and other financial payments) relating to Directors, Chief Executive Officer (CEO) and Key Management Personnel of the bank.
Complied with.
The Remuneration for Directors is according to the circulars / letters issued by the Government of Sri Lanka through the relevant Ministry and the Bank of Ceylon Ordinance No. 53 of 1938 and its amendments. The Bank has adopted a Remuneration Policy based on the said circulars / letters and the Ordinance, which was reviewed during the year 2021 when approving the Governance Policy.
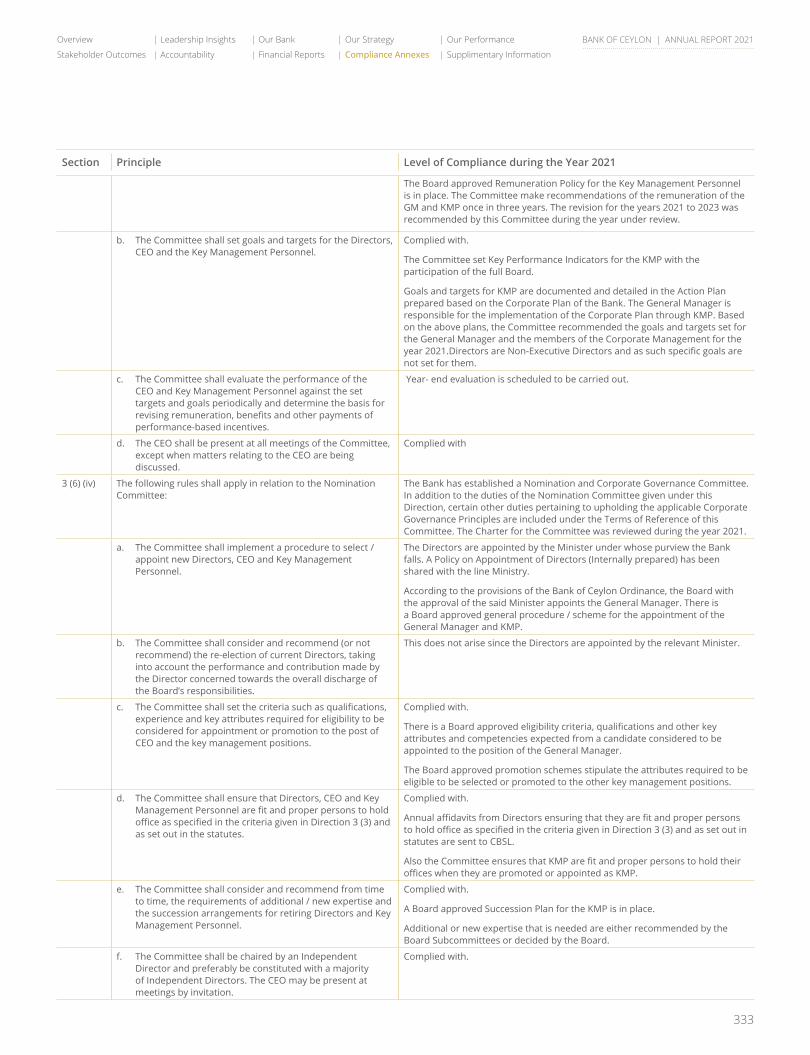
333
Overview Leadership Insights Our Bank Our Strategy Our Performance
Stakeholder Outcomes Accountability Financial Reports Compliance Annexes Supplimentary Information
BANK OF CEYLON | ANNUAL REPORT 2021
Section Principle Level of Compliance during the Year 2021
The Board approved Remuneration Policy for the Key Management Personnel is in place. The Committee make recommendations of the remuneration of the GM and KMP once in three years. The revision for the years 2021 to 2023 was recommended by this Committee during the year under review.
b. The Committee shall set goals and targets for the Directors, CEO and the Key Management Personnel.
Complied with.
The Committee set Key Performance Indicators for the KMP with the participation of the full Board.
Goals and targets for KMP are documented and detailed in the Action Plan prepared based on the Corporate Plan of the Bank. The General Manager is responsible for the implementation of the Corporate Plan through KMP. Based on the above plans, the Committee recommended the goals and targets set for the General Manager and the members of the Corporate Management for the year 2021.Directors are Non-Executive Directors and as such specific goals are not set for them.
c. The Committee shall evaluate the performance of the CEO and Key Management Personnel against the set targets and goals periodically and determine the basis for revising remuneration, benefits and other payments of performance-based incentives.
Year- end evaluation is scheduled to be carried out.
d. The CEO shall be present at all meetings of the Committee, except when matters relating to the CEO are being discussed.
Complied with
3 (6) (iv) The following rules shall apply in relation to the Nomination Committee:
The Bank has established a Nomination and Corporate Governance Committee. In addition to the duties of the Nomination Committee given under this Direction, certain other duties pertaining to upholding the applicable Corporate Governance Principles are included under the Terms of Reference of this Committee. The Charter for the Committee was reviewed during the year 2021.
a. The Committee shall implement a procedure to select / appoint new Directors, CEO and Key Management Personnel.
The Directors are appointed by the Minister under whose purview the Bank falls. A Policy on Appointment of Directors (Internally prepared) has been shared with the line Ministry.
According to the provisions of the Bank of Ceylon Ordinance, the Board with the approval of the said Minister appoints the General Manager. There is a Board approved general procedure / scheme for the appointment of the General Manager and KMP.
b. The Committee shall consider and recommend (or not recommend) the re-election of current Directors, taking into account the performance and contribution made by the Director concerned towards the overall discharge of the Board’s responsibilities.
This does not arise since the Directors are appointed by the relevant Minister.
c. The Committee shall set the criteria such as qualifications, experience and key attributes required for eligibility to be considered for appointment or promotion to the post of CEO and the key management positions.
Complied with.
There is a Board approved eligibility criteria, qualifications and other key attributes and competencies expected from a candidate considered to be appointed to the position of the General Manager.
The Board approved promotion schemes stipulate the attributes required to be eligible to be selected or promoted to the other key management positions.
d. The Committee shall ensure that Directors, CEO and Key Management Personnel are fit and proper persons to hold office as specified in the criteria given in Direction 3 (3) and as set out in the statutes.
Complied with.
Annual affidavits from Directors ensuring that they are fit and proper persons to hold office as specified in the criteria given in Direction 3 (3) and as set out in statutes are sent to CBSL.
Also the Committee ensures that KMP are fit and proper persons to hold their offices when they are promoted or appointed as KMP.
e. The Committee shall consider and recommend from time to time, the requirements of additional / new expertise and the succession arrangements for retiring Directors and Key Management Personnel.
Complied with.
A Board approved Succession Plan for the KMP is in place.
Additional or new expertise that is needed are either recommended by the Board Subcommittees or decided by the Board.
f. The Committee shall be chaired by an Independent Director and preferably be constituted with a majority of Independent Directors. The CEO may be present at meetings by invitation.
Complied with.
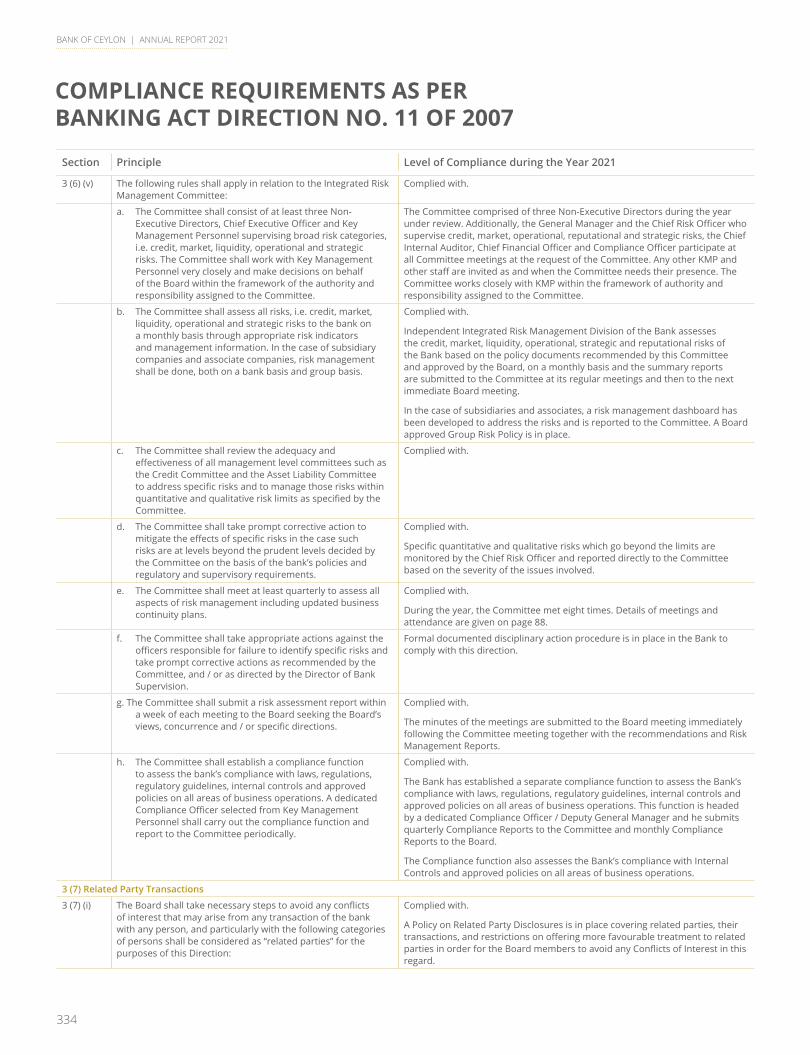
334
BANK OF CEYLON | ANNUAL REPORT 2021
COMPLIANCE REQUIREMENTS AS PER BANKING ACT DIRECTION NO. 11 OF 2007
Section Principle Level of Compliance during the Year 2021
3 (6) (v) The following rules shall apply in relation to the Integrated Risk Management Committee:
Complied with.
a. The Committee shall consist of at least three Non- Executive Directors, Chief Executive Officer and Key Management Personnel supervising broad risk categories, i.e. credit, market, liquidity, operational and strategic risks. The Committee shall work with Key Management Personnel very closely and make decisions on behalf of the Board within the framework of the authority and responsibility assigned to the Committee.
The Committee comprised of three Non-Executive Directors during the year under review. Additionally, the General Manager and the Chief Risk Officer who supervise credit, market, operational, reputational and strategic risks, the Chief Internal Auditor, Chief Financial Officer and Compliance Officer participate at all Committee meetings at the request of the Committee. Any other KMP and other staff are invited as and when the Committee needs their presence. The Committee works closely with KMP within the framework of authority and responsibility assigned to the Committee.
b. The Committee shall assess all risks, i.e. credit, market, liquidity, operational and strategic risks to the bank on a monthly basis through appropriate risk indicators and management information. In the case of subsidiary companies and associate companies, risk management shall be done, both on a bank basis and group basis.
Complied with.
Independent Integrated Risk Management Division of the Bank assesses the credit, market, liquidity, operational, strategic and reputational risks of the Bank based on the policy documents recommended by this Committee and approved by the Board, on a monthly basis and the summary reports are submitted to the Committee at its regular meetings and then to the next immediate Board meeting.
In the case of subsidiaries and associates, a risk management dashboard has been developed to address the risks and is reported to the Committee. A Board approved Group Risk Policy is in place.
c. The Committee shall review the adequacy and effectiveness of all management level committees such as the Credit Committee and the Asset Liability Committee to address specific risks and to manage those risks within quantitative and qualitative risk limits as specified by the Committee.
Complied with.
d. The Committee shall take prompt corrective action to mitigate the effects of specific risks in the case such risks are at levels beyond the prudent levels decided by the Committee on the basis of the bank’s policies and regulatory and supervisory requirements.
Complied with.
Specific quantitative and qualitative risks which go beyond the limits are monitored by the Chief Risk Officer and reported directly to the Committee based on the severity of the issues involved.
e. The Committee shall meet at least quarterly to assess all aspects of risk management including updated business continuity plans.
Complied with.
During the year, the Committee met eight times. Details of meetings and attendance are given on page 88.
f. The Committee shall take appropriate actions against the officers responsible for failure to identify specific risks and take prompt corrective actions as recommended by the Committee, and / or as directed by the Director of Bank Supervision.
Formal documented disciplinary action procedure is in place in the Bank to comply with this direction.
g. The Committee shall submit a risk assessment report within a week of each meeting to the Board seeking the Board’s views, concurrence and / or specific directions.
Complied with.
The minutes of the meetings are submitted to the Board meeting immediately following the Committee meeting together with the recommendations and Risk Management Reports.
h. The Committee shall establish a compliance function to assess the bank’s compliance with laws, regulations, regulatory guidelines, internal controls and approved policies on all areas of business operations. A dedicated Compliance Officer selected from Key Management Personnel shall carry out the compliance function and report to the Committee periodically.
Complied with.
The Bank has established a separate compliance function to assess the Bank’s compliance with laws, regulations, regulatory guidelines, internal controls and approved policies on all areas of business operations. This function is headed by a dedicated Compliance Officer / Deputy General Manager and he submits quarterly Compliance Reports to the Committee and monthly Compliance Reports to the Board.
The Compliance function also assesses the Bank’s compliance with Internal Controls and approved policies on all areas of business operations.
3 (7) Related Party Transactions
3 (7) (i) The Board shall take necessary steps to avoid any conflicts of interest that may arise from any transaction of the bank with any person, and particularly with the following categories of persons shall be considered as “related parties” for the purposes of this Direction:
Complied with.
A Policy on Related Party Disclosures is in place covering related parties, their transactions, and restrictions on offering more favourable treatment to related parties in order for the Board members to avoid any Conflicts of Interest in this regard.
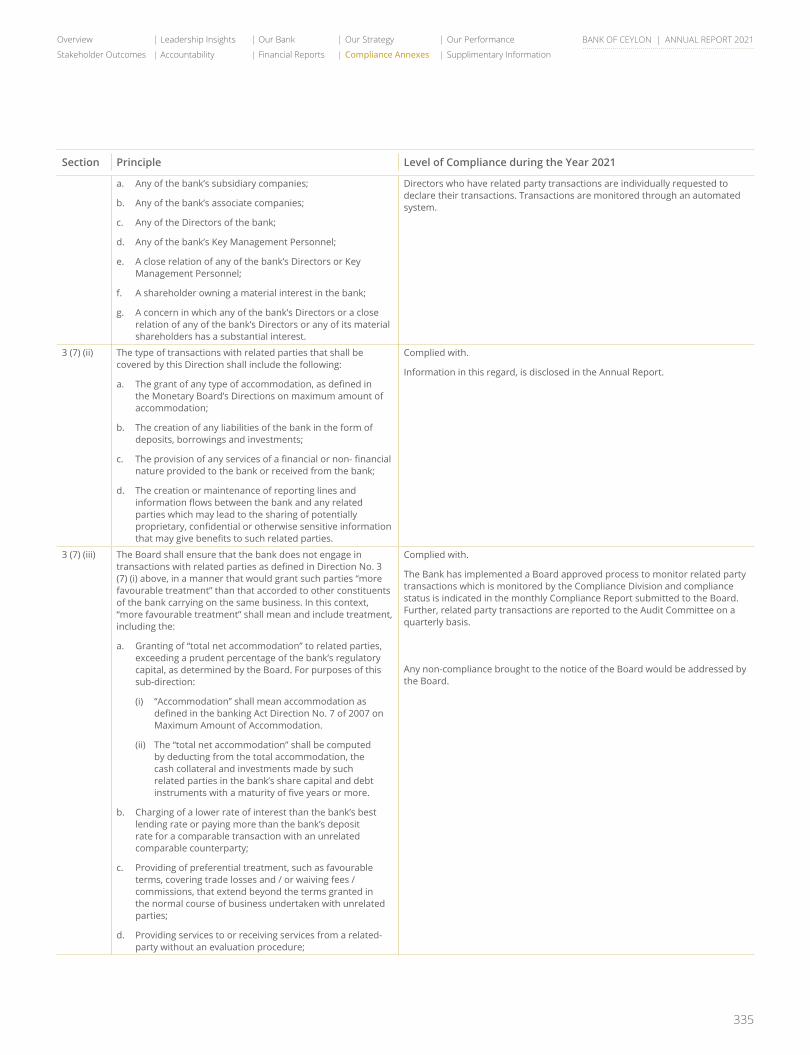
335
Overview Leadership Insights Our Bank Our Strategy Our Performance
Stakeholder Outcomes Accountability Financial Reports Compliance Annexes Supplimentary Information
BANK OF CEYLON | ANNUAL REPORT 2021
Section Principle Level of Compliance during the Year 2021
a. Any of the bank’s subsidiary companies;
b. Any of the bank’s associate companies;
c. Any of the Directors of the bank;
d. Any of the bank’s Key Management Personnel;
e. A close relation of any of the bank’s Directors or Key Management Personnel;
f. A shareholder owning a material interest in the bank;
g. A concern in which any of the bank’s Directors or a close relation of any of the bank’s Directors or any of its material shareholders has a substantial interest.
Directors who have related party transactions are individually requested to declare their transactions. Transactions are monitored through an automated system.
3 (7) (ii) The type of transactions with related parties that shall be covered by this Direction shall include the following:
a. The grant of any type of accommodation, as defined in the Monetary Board’s Directions on maximum amount of accommodation;
b. The creation of any liabilities of the bank in the form of deposits, borrowings and investments;
c. The provision of any services of a financial or non- financial nature provided to the bank or received from the bank;
d. The creation or maintenance of reporting lines and information flows between the bank and any related parties which may lead to the sharing of potentially proprietary, confidential or otherwise sensitive information that may give benefits to such related parties.
Complied with.
Information in this regard, is disclosed in the Annual Report.
3 (7) (iii) The Board shall ensure that the bank does not engage in transactions with related parties as defined in Direction No. 3 (7) (i) above, in a manner that would grant such parties “more favourable treatment” than that accorded to other constituents of the bank carrying on the same business. In this context, “more favourable treatment” shall mean and include treatment, including the:
a. Granting of “total net accommodation” to related parties, exceeding a prudent percentage of the bank’s regulatory capital, as determined by the Board. For purposes of this sub-direction:
(i) “Accommodation” shall mean accommodation as defined in the banking Act Direction No. 7 of 2007 on Maximum Amount of Accommodation.
(ii) The “total net accommodation” shall be computed by deducting from the total accommodation, the cash collateral and investments made by such related parties in the bank’s share capital and debt instruments with a maturity of five years or more.
b. Charging of a lower rate of interest than the bank’s best lending rate or paying more than the bank’s deposit rate for a comparable transaction with an unrelated comparable counterparty;
c. Providing of preferential treatment, such as favourable terms, covering trade losses and / or waiving fees / commissions, that extend beyond the terms granted in the normal course of business undertaken with unrelated parties;
d. Providing services to or receiving services from a related-party without an evaluation procedure;
Complied with.
The Bank has implemented a Board approved process to monitor related party transactions which is monitored by the Compliance Division and compliance status is indicated in the monthly Compliance Report submitted to the Board. Further, related party transactions are reported to the Audit Committee on a quarterly basis.
Any non-compliance brought to the notice of the Board would be addressed by the Board.

336
BANK OF CEYLON | ANNUAL REPORT 2021
COMPLIANCE REQUIREMENTS AS PER BANKING ACT DIRECTION NO. 11 OF 2007
Section Principle Level of Compliance during the Year 2021
e. Maintaining reporting lines and information flows that may lead to sharing potentially proprietary, confidential or otherwise sensitive information with related parties, except as required for the performance of legitimate duties and functions.
3 (7) (iv) A bank shall not grant any accommodation to any of its Directors or to a close relation of such Director unless such accommodation is sanctioned at a meeting of its Board of Directors, with not less than two-thirds of the number of Directors other than the Director concerned, voting in favour of such accommodation.
This accommodation shall be secured by such security as may from time to time be determined by the Monetary Board as well.
Complied with.
3 (7) (v) a. Where any accommodation has been granted by a bank to a person or a close relation of a person or to any concern in which the person has a substantial interest, and such person is subsequently appointed as a Director of the bank, steps shall be taken by the bank to obtain the necessary security as may be approved for that purpose by the Monetary Board, within one year from the date of appointment of the person as a Director.
b. Where such security is not provided by the period as provided in Direction 3 (7) (v) (a) above, the bank shall take steps to recover any amount due on account of any accommodation, together with interest, if any, within the period specified at the time of the grant of accommodation or at the expiry of a period of eighteen months from the date of appointment of such Director, whichever is earlier.
c. Any Director who fails to comply with the above sub- directions shall be deemed to have vacated the office of Director and the bank shall disclose such fact to the public.
d. This sub-direction, however, shall not apply to a Director who at the time of the grant of the accommodation was an employee of the bank and the accommodation was granted under a scheme applicable to all employees of such bank.
Complied with.
3 (7) (vi) A bank shall not grant any accommodation or “more favourable treatment” relating to the waiver of fees and / or commissions to any employee or a close relation of such employee or to any concern in which the employee or close relation has a substantial interest other than on the basis of a scheme applicable to the employees of such bank or when secured by security as may be approved by the Monetary Board in respect of accommodation granted as per Direction 3 (7) (v) above.
Complied with.
No favourable treatment / accommodation is provided to any employee of the Bank on more favourable terms unless under general staff loan schemes applicable to all employees of the Bank. Circular instructions have been issued in this regard. Close relations of Bank employees are also not given any favourable treatment.
3 (7) (vii) No accommodation granted by a bank under direction 3(7)(v) and 3(7)(vi) above, nor any part of such accommodation, nor any interest due thereon shall be remitted without the prior approval of the Monitory Board and any remission without such approval shall be void and of no effect.
Complied with.
Such a situation has not arisen during the year 2021.
3 (8) Disclosure
3 (8) (i) The Board shall ensure that:
a. annual Audited Financial Statements and quarterly Financial Statements are prepared and published in accordance with the formats prescribed by the supervisory and regulatory authorities and applicable accounting standards; and that
b. such statements are published in the newspapers in an abridged form, in Sinhala, Tamil and English.
Complied with.
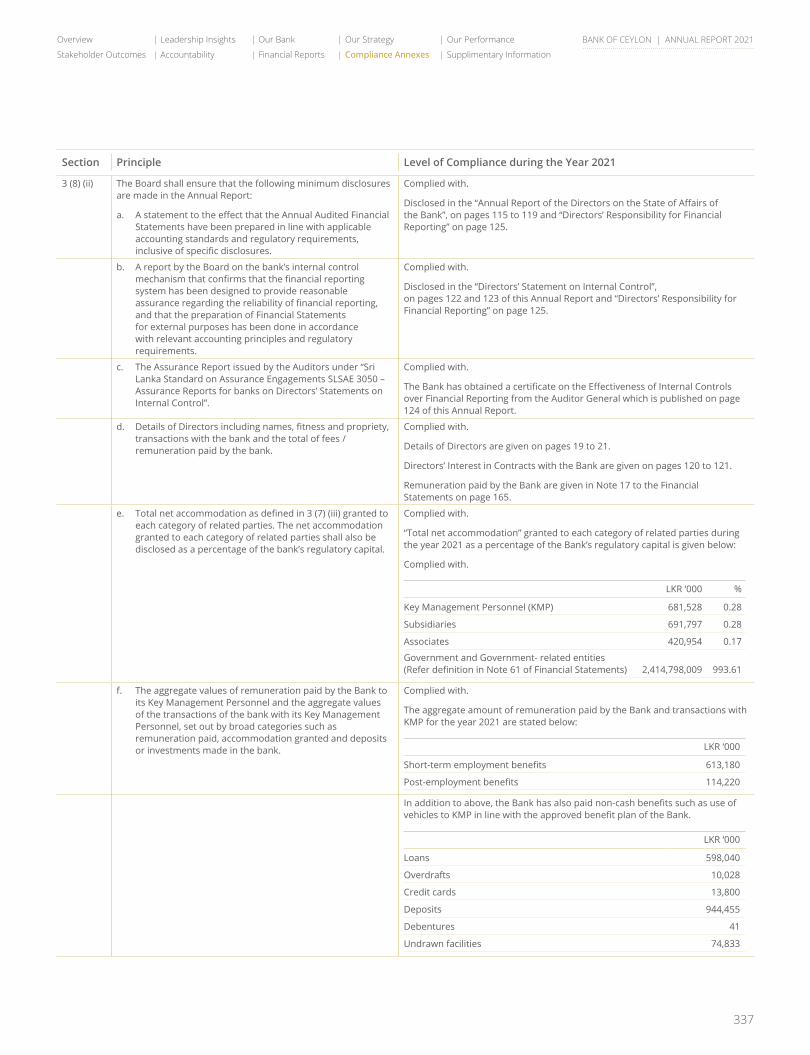
337
Overview Leadership Insights Our Bank Our Strategy Our Performance
Stakeholder Outcomes Accountability Financial Reports Compliance Annexes Supplimentary Information
BANK OF CEYLON | ANNUAL REPORT 2021
Section Principle Level of Compliance during the Year 2021
3 (8) (ii) The Board shall ensure that the following minimum disclosures are made in the Annual Report:
a. A statement to the effect that the Annual Audited Financial Statements have been prepared in line with applicable accounting standards and regulatory requirements, inclusive of specific disclosures.
Complied with.
Disclosed in the “Annual Report of the Directors on the State of Affairs of the Bank”, on pages 115 to 119 and “Directors’ Responsibility for Financial Reporting” on page 125.
b. A report by the Board on the bank’s internal control mechanism that confirms that the financial reporting system has been designed to provide reasonable assurance regarding the reliability of financial reporting, and that the preparation of Financial Statements for external purposes has been done in accordance with relevant accounting principles and regulatory requirements.
Complied with.
Disclosed in the “Directors’ Statement on Internal Control”, on pages 122 and 123 of this Annual Report and “Directors’ Responsibility for Financial Reporting” on page 125.
c. The Assurance Report issued by the Auditors under “Sri Lanka Standard on Assurance Engagements SLSAE 3050 – Assurance Reports for banks on Directors’ Statements on Internal Control”.
Complied with.
The Bank has obtained a certificate on the Effectiveness of Internal Controls over Financial Reporting from the Auditor General which is published on page 124 of this Annual Report.
d. Details of Directors including names, fitness and propriety, transactions with the bank and the total of fees / remuneration paid by the bank.
Complied with.
Details of Directors are given on pages 19 to 21.
Directors’ Interest in Contracts with the Bank are given on pages 120 to 121.
Remuneration paid by the Bank are given in Note 17 to the Financial Statements on page 165.
e. Total net accommodation as defined in 3 (7) (iii) granted to each category of related parties. The net accommodation granted to each category of related parties shall also be disclosed as a percentage of the bank’s regulatory capital.
Complied with.
“Total net accommodation” granted to each category of related parties during the year 2021 as a percentage of the Bank’s regulatory capital is given below:
Complied with.
LKR ‘000 %
Key Management Personnel (KMP) 681,528 0.28
Subsidiaries 691,797 0.28
Associates 420,954 0.17
Government and Government- related entities (Refer definition in Note 61 of Financial Statements) 2,414,798,009 993.61
f. The aggregate values of remuneration paid by the Bank to its Key Management Personnel and the aggregate values of the transactions of the bank with its Key Management Personnel, set out by broad categories such as remuneration paid, accommodation granted and deposits or investments made in the bank.
Complied with.
The aggregate amount of remuneration paid by the Bank and transactions with KMP for the year 2021 are stated below:
LKR ‘000
Short-term employment benefits 613,180
Post-employment benefits 114,220
In addition to above, the Bank has also paid non-cash benefits such as use of vehicles to KMP in line with the approved benefit plan of the Bank.
LKR ‘000
Loans 598,040
Overdrafts 10,028
Credit cards 13,800
Deposits 944,455
Debentures 41
Undrawn facilities 74,833
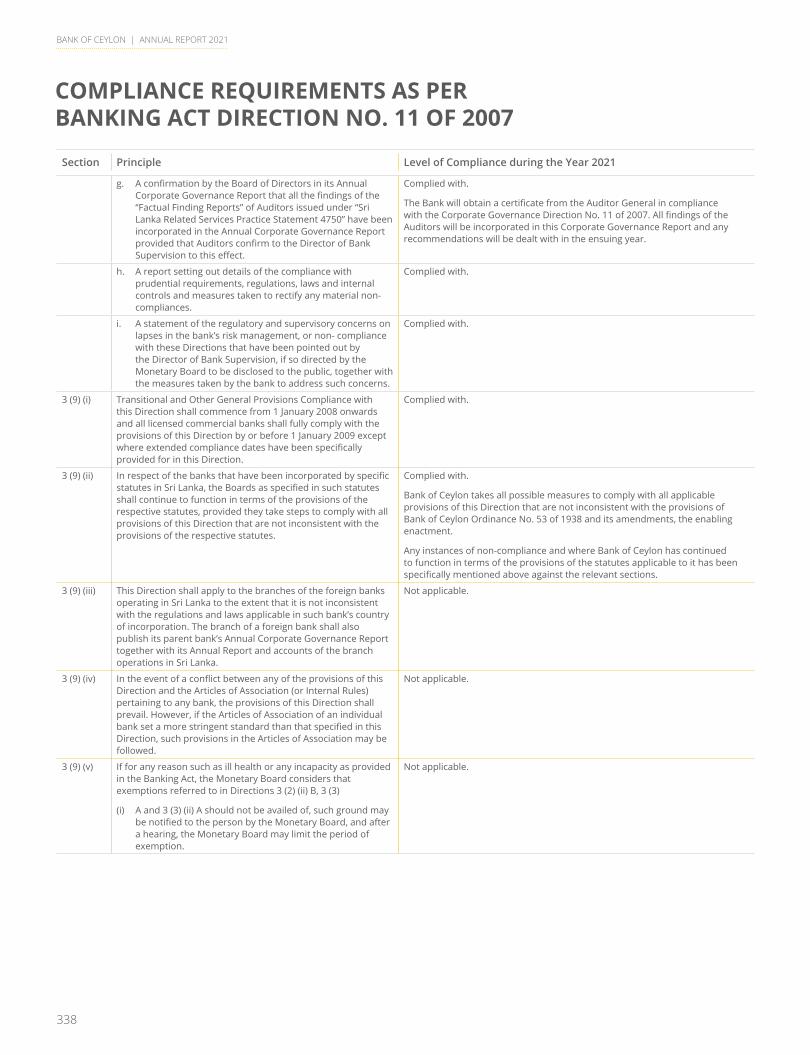
338
BANK OF CEYLON | ANNUAL REPORT 2021
COMPLIANCE REQUIREMENTS AS PER BANKING ACT DIRECTION NO. 11 OF 2007
Section Principle Level of Compliance during the Year 2021
g. A confirmation by the Board of Directors in its Annual Corporate Governance Report that all the findings of the “Factual Finding Reports” of Auditors issued under “Sri Lanka Related Services Practice Statement 4750” have been incorporated in the Annual Corporate Governance Report provided that Auditors confirm to the Director of Bank Supervision to this effect.
Complied with.
The Bank will obtain a certificate from the Auditor General in compliance with the Corporate Governance Direction No. 11 of 2007. All findings of the Auditors will be incorporated in this Corporate Governance Report and any recommendations will be dealt with in the ensuing year.
h. A report setting out details of the compliance with prudential requirements, regulations, laws and internal controls and measures taken to rectify any material non- compliances.
Complied with.
i. A statement of the regulatory and supervisory concerns on lapses in the bank’s risk management, or non- compliance with these Directions that have been pointed out by the Director of Bank Supervision, if so directed by the Monetary Board to be disclosed to the public, together with the measures taken by the bank to address such concerns.
Complied with.
3 (9) (i) Transitional and Other General Provisions Compliance with this Direction shall commence from 1 January 2008 onwards and all licensed commercial banks shall fully comply with the provisions of this Direction by or before 1 January 2009 except where extended compliance dates have been specifically provided for in this Direction.
Complied with.
3 (9) (ii) In respect of the banks that have been incorporated by specific statutes in Sri Lanka, the Boards as specified in such statutes shall continue to function in terms of the provisions of the respective statutes, provided they take steps to comply with all provisions of this Direction that are not inconsistent with the provisions of the respective statutes.
Complied with.
Bank of Ceylon takes all possible measures to comply with all applicable provisions of this Direction that are not inconsistent with the provisions of Bank of Ceylon Ordinance No. 53 of 1938 and its amendments, the enabling enactment.
Any instances of non-compliance and where Bank of Ceylon has continued to function in terms of the provisions of the statutes applicable to it has been specifically mentioned above against the relevant sections.
3 (9) (iii) This Direction shall apply to the branches of the foreign banks operating in Sri Lanka to the extent that it is not inconsistent with the regulations and laws applicable in such bank’s country of incorporation. The branch of a foreign bank shall also publish its parent bank’s Annual Corporate Governance Report together with its Annual Report and accounts of the branch operations in Sri Lanka.
Not applicable.
3 (9) (iv) In the event of a conflict between any of the provisions of this Direction and the Articles of Association (or Internal Rules) pertaining to any bank, the provisions of this Direction shall prevail. However, if the Articles of Association of an individual bank set a more stringent standard than that specified in this Direction, such provisions in the Articles of Association may be followed.
Not applicable.
3 (9) (v) If for any reason such as ill health or any incapacity as provided in the Banking Act, the Monetary Board considers that exemptions referred to in Directions 3 (2) (ii) B, 3 (3)
(i) A and 3 (3) (ii) A should not be availed of, such ground may be notified to the person by the Monetary Board, and after a hearing, the Monetary Board may limit the period of exemption.
Not applicable.
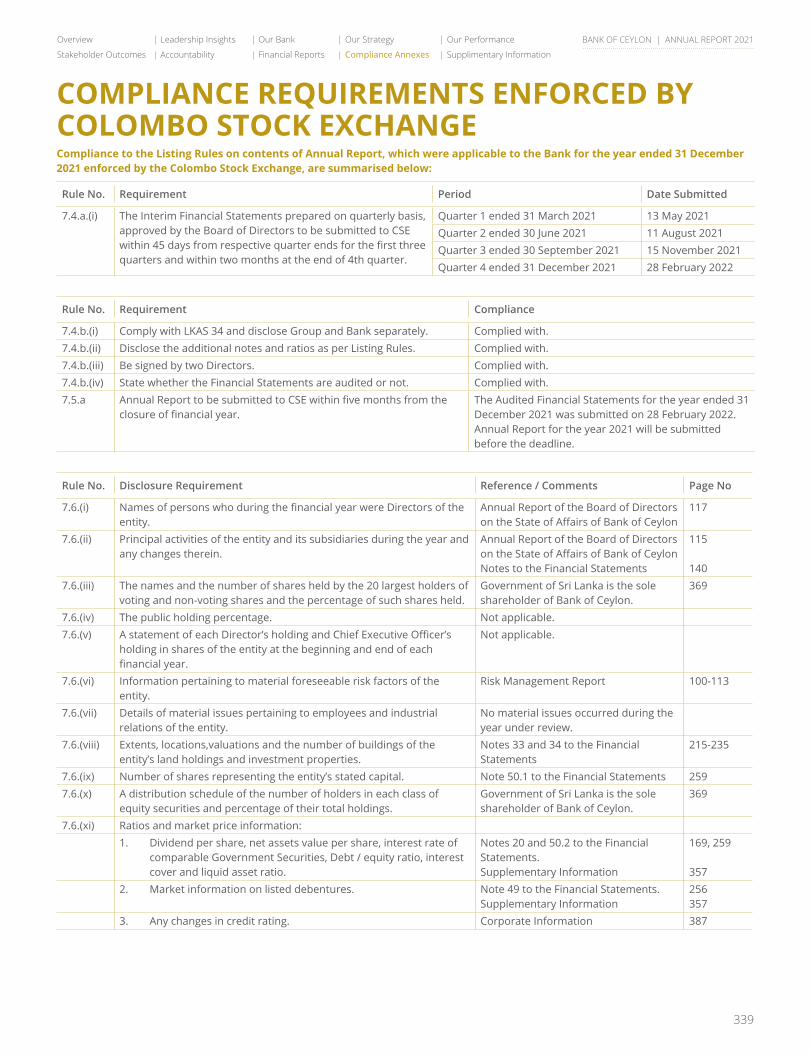
339
Overview Leadership Insights Our Bank Our Strategy Our Performance
Stakeholder Outcomes Accountability Financial Reports Compliance Annexes Supplimentary Information
BANK OF CEYLON | ANNUAL REPORT 2021
COMPLIANCE REQUIREMENTS ENFORCED BY COLOMBO STOCK EXCHANGECompliance to the Listing Rules on contents of Annual Report, which were applicable to the Bank for the year ended 31 December 2021 enforced by the Colombo Stock Exchange, are summarised below:
Rule No. Requirement Period Date Submitted
7.4.a.(i) The Interim Financial Statements prepared on quarterly basis, approved by the Board of Directors to be submitted to CSE within 45 days from respective quarter ends for the first three quarters and within two months at the end of 4th quarter.
Quarter 1 ended 31 March 2021 13 May 2021Quarter 2 ended 30 June 2021 11 August 2021Quarter 3 ended 30 September 2021 15 November 2021Quarter 4 ended 31 December 2021 28 February 2022
Rule No. Requirement Compliance
7.4.b.(i) Comply with LKAS 34 and disclose Group and Bank separately. Complied with.7.4.b.(ii) Disclose the additional notes and ratios as per Listing Rules. Complied with.7.4.b.(iii) Be signed by two Directors. Complied with.7.4.b.(iv) State whether the Financial Statements are audited or not. Complied with.7.5.a Annual Report to be submitted to CSE within five months from the
closure of financial year.The Audited Financial Statements for the year ended 31 December 2021 was submitted on 28 February 2022.Annual Report for the year 2021 will be submitted before the deadline.
Rule No. Disclosure Requirement Reference / Comments Page No
7.6.(i) Names of persons who during the financial year were Directors of the entity.
Annual Report of the Board of Directors on the State of Affairs of Bank of Ceylon
117
7.6.(ii) Principal activities of the entity and its subsidiaries during the year and any changes therein.
Annual Report of the Board of Directors on the State of Affairs of Bank of CeylonNotes to the Financial Statements
115
1407.6.(iii) The names and the number of shares held by the 20 largest holders of
voting and non-voting shares and the percentage of such shares held.Government of Sri Lanka is the sole shareholder of Bank of Ceylon.
369
7.6.(iv) The public holding percentage. Not applicable.7.6.(v) A statement of each Director’s holding and Chief Executive Officer’s
holding in shares of the entity at the beginning and end of each financial year.
Not applicable.
7.6.(vi) Information pertaining to material foreseeable risk factors of the entity.
Risk Management Report 100-113
7.6.(vii) Details of material issues pertaining to employees and industrial relations of the entity.
No material issues occurred during the year under review.
7.6.(viii) Extents, locations,valuations and the number of buildings of the entity’s land holdings and investment properties.
Notes 33 and 34 to the Financial Statements
215-235
7.6.(ix) Number of shares representing the entity’s stated capital. Note 50.1 to the Financial Statements 2597.6.(x) A distribution schedule of the number of holders in each class of
equity securities and percentage of their total holdings.Government of Sri Lanka is the sole shareholder of Bank of Ceylon.
369
7.6.(xi) Ratios and market price information:1. Dividend per share, net assets value per share, interest rate of
comparable Government Securities, Debt / equity ratio, interest cover and liquid asset ratio.
Notes 20 and 50.2 to the Financial Statements.Supplementary Information
169, 259
3572. Market information on listed debentures. Note 49 to the Financial Statements.
Supplementary Information256357
3. Any changes in credit rating. Corporate Information 387
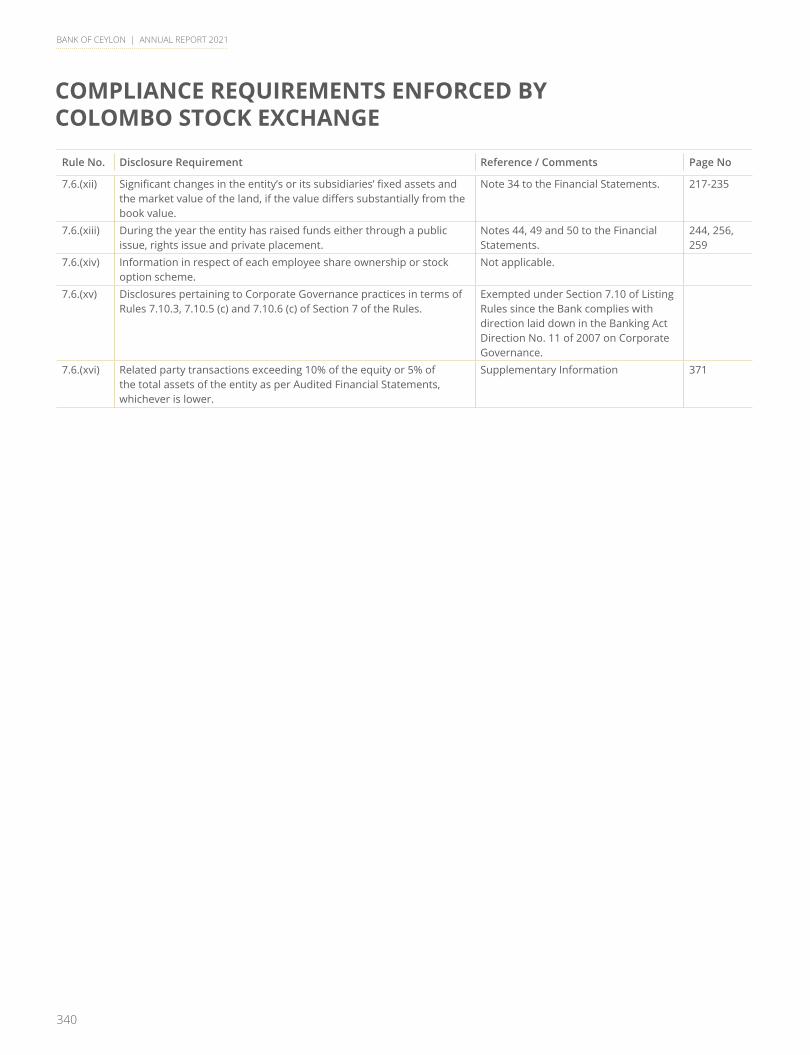
340
BANK OF CEYLON | ANNUAL REPORT 2021
COMPLIANCE REQUIREMENTS ENFORCED BY COLOMBO STOCK EXCHANGE
Rule No. Disclosure Requirement Reference / Comments Page No
7.6.(xii) Significant changes in the entity’s or its subsidiaries’ fixed assets and the market value of the land, if the value differs substantially from the book value.
Note 34 to the Financial Statements. 217-235
7.6.(xiii) During the year the entity has raised funds either through a public issue, rights issue and private placement.
Notes 44, 49 and 50 to the Financial Statements.
244, 256, 259
7.6.(xiv) Information in respect of each employee share ownership or stock option scheme.
Not applicable.
7.6.(xv) Disclosures pertaining to Corporate Governance practices in terms of Rules 7.10.3, 7.10.5 (c) and 7.10.6 (c) of Section 7 of the Rules.
Exempted under Section 7.10 of Listing Rules since the Bank complies with direction laid down in the Banking Act Direction No. 11 of 2007 on Corporate Governance.
7.6.(xvi) Related party transactions exceeding 10% of the equity or 5% of the total assets of the entity as per Audited Financial Statements, whichever is lower.
Supplementary Information 371
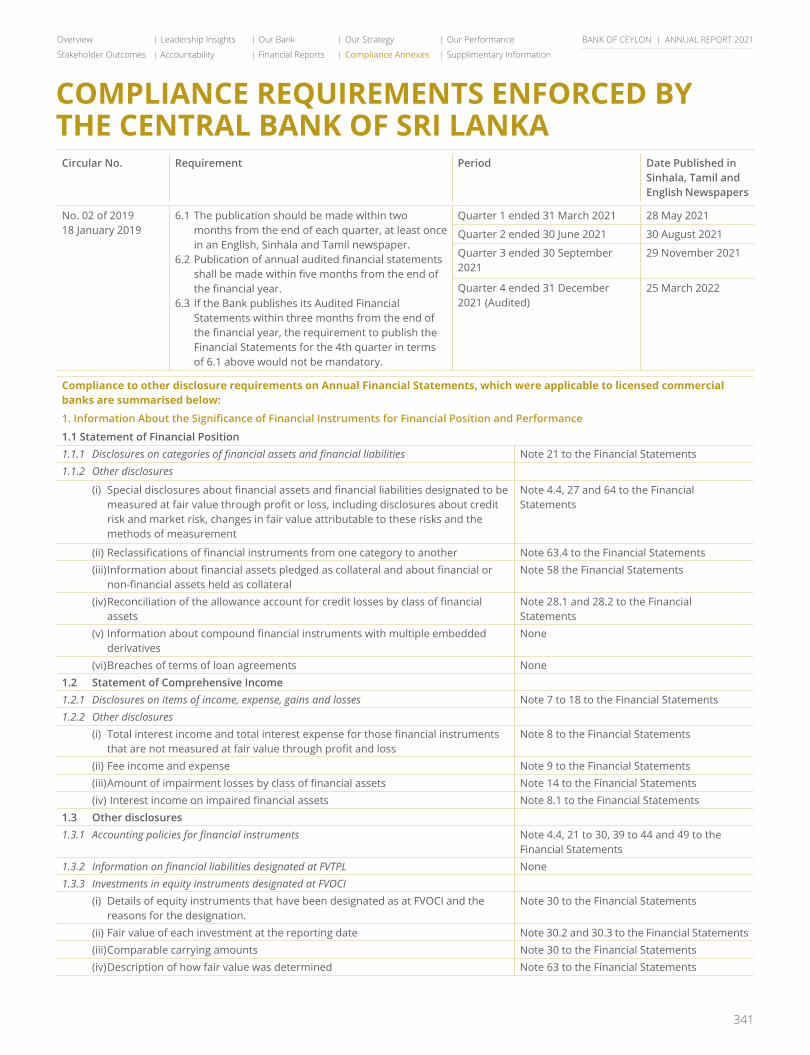
341
Overview Leadership Insights Our Bank Our Strategy Our Performance
Stakeholder Outcomes Accountability Financial Reports Compliance Annexes Supplimentary Information
BANK OF CEYLON | ANNUAL REPORT 2021
COMPLIANCE REQUIREMENTS ENFORCED BY THE CENTRAL BANK OF SRI LANKA
Circular No. Requirement Period Date Published in Sinhala, Tamil and English Newspapers
No. 02 of 2019 18 January 2019
6.1 The publication should be made within two months from the end of each quarter, at least once in an English, Sinhala and Tamil newspaper.
6.2 Publication of annual audited financial statements shall be made within five months from the end of the financial year.
6.3 If the Bank publishes its Audited Financial Statements within three months from the end of the financial year, the requirement to publish the Financial Statements for the 4th quarter in terms of 6.1 above would not be mandatory.
Quarter 1 ended 31 March 2021 28 May 2021
Quarter 2 ended 30 June 2021 30 August 2021
Quarter 3 ended 30 September 2021
29 November 2021
Quarter 4 ended 31 December 2021 (Audited)
25 March 2022
Compliance to other disclosure requirements on Annual Financial Statements, which were applicable to licensed commercial banks are summarised below:
1.InformationAbouttheSignificanceofFinancialInstrumentsforFinancialPositionandPerformance
1.1 Statement of Financial Position1.1.1 Disclosuresoncategoriesoffinancialassetsandfinancialliabilities Note 21 to the Financial Statements1.1.2 Other disclosures
(i) Special disclosures about financial assets and financial liabilities designated to be measured at fair value through profit or loss, including disclosures about credit risk and market risk, changes in fair value attributable to these risks and the methods of measurement
Note 4.4, 27 and 64 to the Financial Statements
(ii) Reclassifications of financial instruments from one category to another Note 63.4 to the Financial Statements (iii) Information about financial assets pledged as collateral and about financial or
non-financial assets held as collateralNote 58 the Financial Statements
(iv) Reconciliation of the allowance account for credit losses by class of financial assets
Note 28.1 and 28.2 to the Financial Statements
(v) Information about compound financial instruments with multiple embedded derivatives
None
(vi) Breaches of terms of loan agreements None1.2 Statement of Comprehensive Income1.2.1 Disclosures on items of income, expense, gains and losses Note 7 to 18 to the Financial Statements1.2.2 Other disclosures (i) Total interest income and total interest expense for those financial instruments
that are not measured at fair value through profit and lossNote 8 to the Financial Statements
(ii) Fee income and expense Note 9 to the Financial Statements (iii) Amount of impairment losses by class of financial assets Note 14 to the Financial Statements (iv) Interest income on impaired financial assets Note 8.1 to the Financial Statements1.3 Other disclosures1.3.1 Accountingpoliciesforfinancialinstruments Note 4.4, 21 to 30, 39 to 44 and 49 to the
Financial Statements1.3.2 InformationonfinancialliabilitiesdesignatedatFVTPL None1.3.3 InvestmentsinequityinstrumentsdesignatedatFVOCI (i) Details of equity instruments that have been designated as at FVOCI and the
reasons for the designation.Note 30 to the Financial Statements
(ii) Fair value of each investment at the reporting date Note 30.2 and 30.3 to the Financial Statements (iii) Comparable carrying amounts Note 30 to the Financial Statements (iv) Description of how fair value was determined Note 63 to the Financial Statements
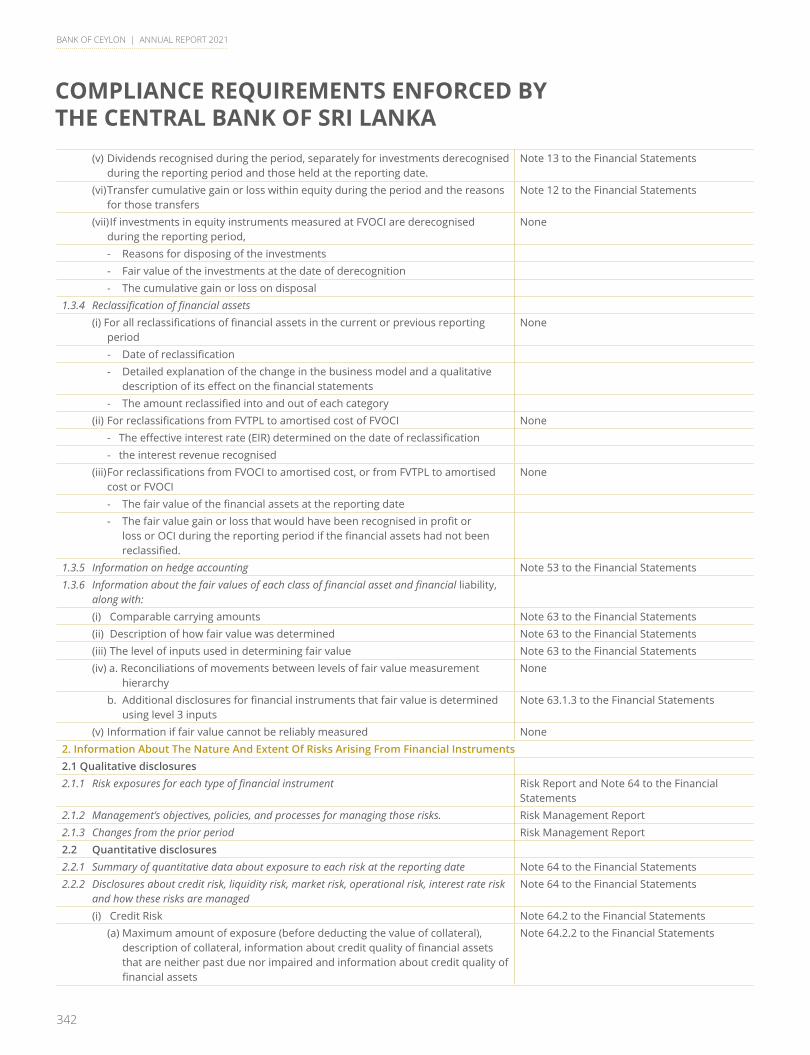
342
BANK OF CEYLON | ANNUAL REPORT 2021
COMPLIANCE REQUIREMENTS ENFORCED BY THE CENTRAL BANK OF SRI LANKA
(v) Dividends recognised during the period, separately for investments derecognised during the reporting period and those held at the reporting date.
Note 13 to the Financial Statements
(vi) Transfer cumulative gain or loss within equity during the period and the reasons for those transfers
Note 12 to the Financial Statements
(vii) If investments in equity instruments measured at FVOCI are derecognised during the reporting period,
None
- Reasons for disposing of the investments - Fair value of the investments at the date of derecognition - The cumulative gain or loss on disposal1.3.4 Reclassificationoffinancialassets (i) For all reclassifications of financial assets in the current or previous reporting
periodNone
- Date of reclassification - Detailed explanation of the change in the business model and a qualitative
description of its effect on the financial statements - The amount reclassified into and out of each category (ii) For reclassifications from FVTPL to amortised cost of FVOCI None - The effective interest rate (EIR) determined on the date of reclassification - the interest revenue recognised (iii) For reclassifications from FVOCI to amortised cost, or from FVTPL to amortised
cost or FVOCINone
- The fair value of the financial assets at the reporting date - The fair value gain or loss that would have been recognised in profit or
loss or OCI during the reporting period if the financial assets had not been reclassified.
1.3.5 Information on hedge accounting Note 53 to the Financial Statements1.3.6 Informationaboutthefairvaluesofeachclassoffinancialassetandfinancialliability,
along with: (i) Comparable carrying amounts Note 63 to the Financial Statements (ii) Description of how fair value was determined Note 63 to the Financial Statements (iii) The level of inputs used in determining fair value Note 63 to the Financial Statements (iv) a. Reconciliations of movements between levels of fair value measurement
hierarchyNone
b. Additional disclosures for financial instruments that fair value is determined using level 3 inputs
Note 63.1.3 to the Financial Statements
(v) Information if fair value cannot be reliably measured None2. Information About The Nature And Extent Of Risks Arising From Financial Instruments2.1 Qualitative disclosures2.1.1 Riskexposuresforeachtypeoffinancialinstrument Risk Report and Note 64 to the Financial
Statements2.1.2 Management’s objectives, policies, and processes for managing those risks. Risk Management Report2.1.3 Changes from the prior period Risk Management Report2.2 Quantitative disclosures2.2.1 Summary of quantitative data about exposure to each risk at the reporting date Note 64 to the Financial Statements2.2.2 Disclosures about credit risk, liquidity risk, market risk, operational risk, interest rate risk
and how these risks are managedNote 64 to the Financial Statements
(i) Credit Risk Note 64.2 to the Financial Statements (a) Maximum amount of exposure (before deducting the value of collateral),
description of collateral, information about credit quality of financial assets that are neither past due nor impaired and information about credit quality of financial assets
Note 64.2.2 to the Financial Statements
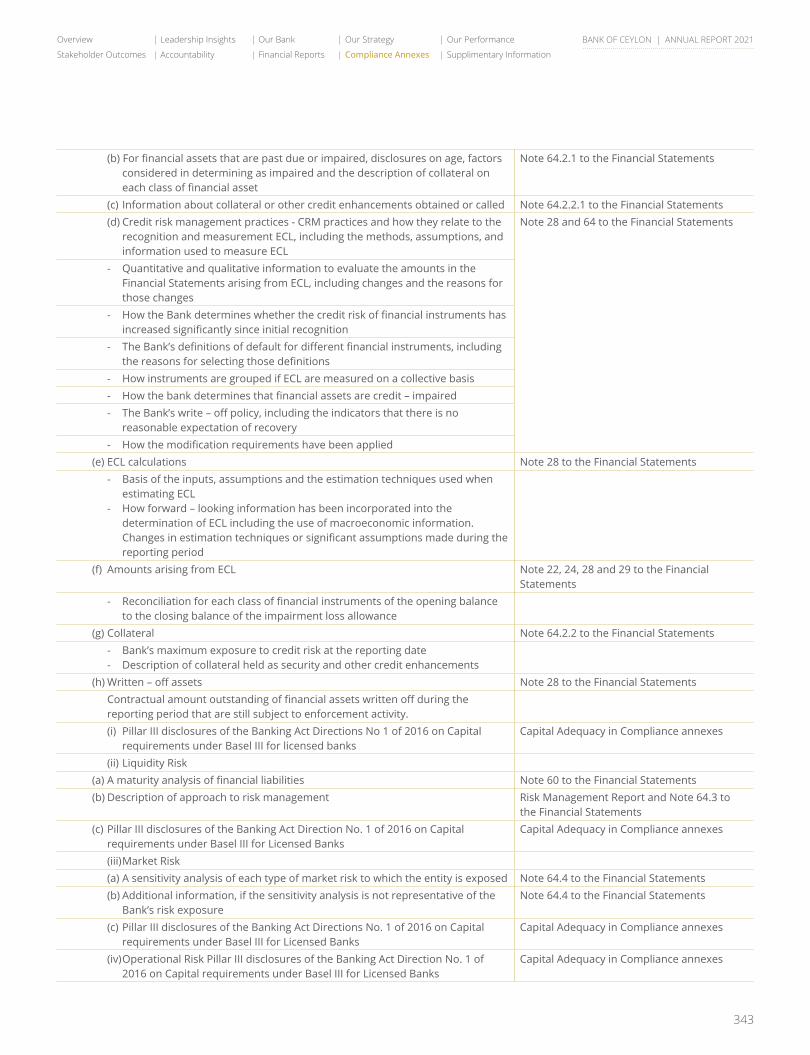
343
Overview Leadership Insights Our Bank Our Strategy Our Performance
Stakeholder Outcomes Accountability Financial Reports Compliance Annexes Supplimentary Information
BANK OF CEYLON | ANNUAL REPORT 2021
(b) For financial assets that are past due or impaired, disclosures on age, factors considered in determining as impaired and the description of collateral on each class of financial asset
Note 64.2.1 to the Financial Statements
(c) Information about collateral or other credit enhancements obtained or called Note 64.2.2.1 to the Financial Statements (d) Credit risk management practices - CRM practices and how they relate to the
recognition and measurement ECL, including the methods, assumptions, and information used to measure ECL
Note 28 and 64 to the Financial Statements
- Quantitative and qualitative information to evaluate the amounts in the Financial Statements arising from ECL, including changes and the reasons for those changes
- How the Bank determines whether the credit risk of financial instruments has increased significantly since initial recognition
- The Bank’s definitions of default for different financial instruments, including the reasons for selecting those definitions
- How instruments are grouped if ECL are measured on a collective basis - How the bank determines that financial assets are credit – impaired - The Bank’s write – off policy, including the indicators that there is no
reasonable expectation of recovery - How the modification requirements have been applied (e) ECL calculations Note 28 to the Financial Statements - Basis of the inputs, assumptions and the estimation techniques used when
estimating ECL - How forward – looking information has been incorporated into the
determination of ECL including the use of macroeconomic information. Changes in estimation techniques or significant assumptions made during the
reporting period (f) Amounts arising from ECL Note 22, 24, 28 and 29 to the Financial
Statements - Reconciliation for each class of financial instruments of the opening balance
to the closing balance of the impairment loss allowance (g) Collateral Note 64.2.2 to the Financial Statements - Bank’s maximum exposure to credit risk at the reporting date - Description of collateral held as security and other credit enhancements (h) Written – off assets Note 28 to the Financial Statements Contractual amount outstanding of financial assets written off during the
reporting period that are still subject to enforcement activity. (i) Pillar III disclosures of the Banking Act Directions No 1 of 2016 on Capital
requirements under Basel III for licensed banksCapital Adequacy in Compliance annexes
(ii) Liquidity Risk (a) A maturity analysis of financial liabilities Note 60 to the Financial Statements (b) Description of approach to risk management Risk Management Report and Note 64.3 to
the Financial Statements (c) Pillar III disclosures of the Banking Act Direction No. 1 of 2016 on Capital
requirements under Basel III for Licensed BanksCapital Adequacy in Compliance annexes
(iii) Market Risk (a) A sensitivity analysis of each type of market risk to which the entity is exposed Note 64.4 to the Financial Statements (b) Additional information, if the sensitivity analysis is not representative of the
Bank’s risk exposureNote 64.4 to the Financial Statements
(c) Pillar III disclosures of the Banking Act Directions No. 1 of 2016 on Capital requirements under Basel III for Licensed Banks
Capital Adequacy in Compliance annexes
(iv) Operational Risk Pillar III disclosures of the Banking Act Direction No. 1 of 2016 on Capital requirements under Basel III for Licensed Banks
Capital Adequacy in Compliance annexes
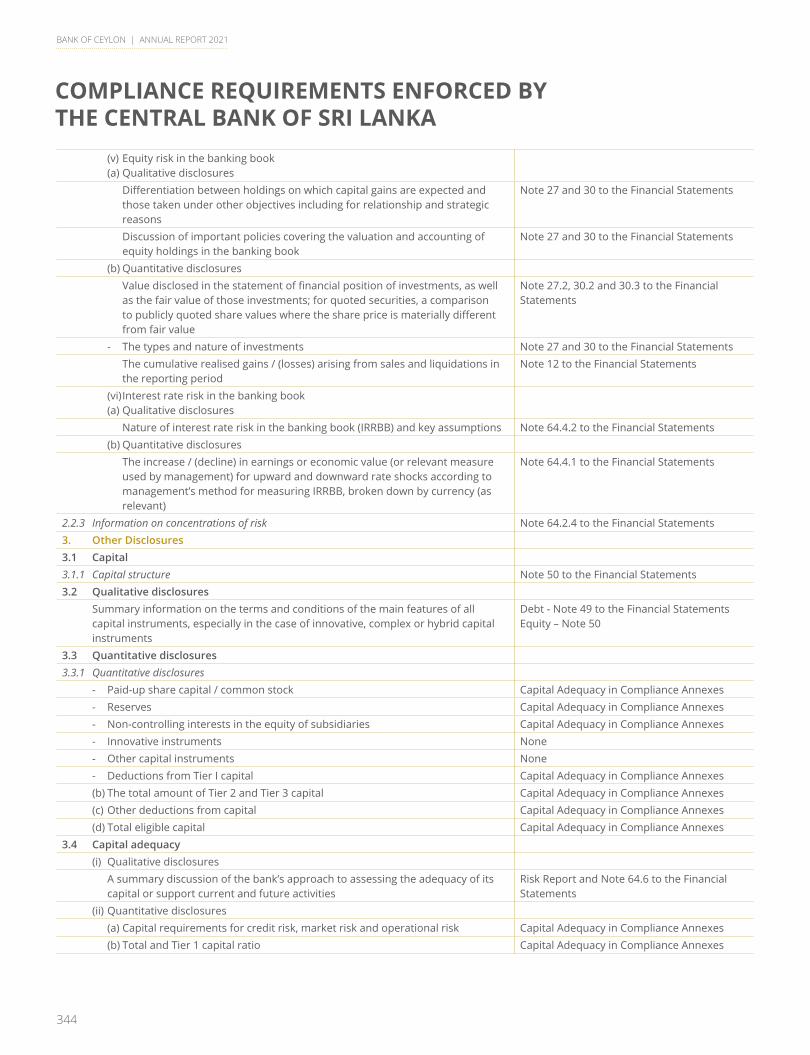
344
BANK OF CEYLON | ANNUAL REPORT 2021
COMPLIANCE REQUIREMENTS ENFORCED BY THE CENTRAL BANK OF SRI LANKA
(v) Equity risk in the banking book (a) Qualitative disclosures Differentiation between holdings on which capital gains are expected and
those taken under other objectives including for relationship and strategic reasons
Note 27 and 30 to the Financial Statements
Discussion of important policies covering the valuation and accounting of equity holdings in the banking book
Note 27 and 30 to the Financial Statements
(b) Quantitative disclosures Value disclosed in the statement of financial position of investments, as well
as the fair value of those investments; for quoted securities, a comparison to publicly quoted share values where the share price is materially different from fair value
Note 27.2, 30.2 and 30.3 to the Financial Statements
- The types and nature of investments Note 27 and 30 to the Financial Statements The cumulative realised gains / (losses) arising from sales and liquidations in
the reporting periodNote 12 to the Financial Statements
(vi) Interest rate risk in the banking book (a) Qualitative disclosures Nature of interest rate risk in the banking book (IRRBB) and key assumptions Note 64.4.2 to the Financial Statements (b) Quantitative disclosures The increase / (decline) in earnings or economic value (or relevant measure
used by management) for upward and downward rate shocks according to management’s method for measuring IRRBB, broken down by currency (as relevant)
Note 64.4.1 to the Financial Statements
2.2.3 Information on concentrations of risk Note 64.2.4 to the Financial Statements3. Other Disclosures3.1 Capital3.1.1 Capital structure Note 50 to the Financial Statements3.2 Qualitative disclosures Summary information on the terms and conditions of the main features of all
capital instruments, especially in the case of innovative, complex or hybrid capital instruments
Debt - Note 49 to the Financial Statements Equity – Note 50
3.3 Quantitative disclosures3.3.1 Quantitative disclosures - Paid-up share capital / common stock Capital Adequacy in Compliance Annexes - Reserves Capital Adequacy in Compliance Annexes - Non-controlling interests in the equity of subsidiaries Capital Adequacy in Compliance Annexes - Innovative instruments None - Other capital instruments None - Deductions from Tier I capital Capital Adequacy in Compliance Annexes (b) The total amount of Tier 2 and Tier 3 capital Capital Adequacy in Compliance Annexes (c) Other deductions from capital Capital Adequacy in Compliance Annexes (d) Total eligible capital Capital Adequacy in Compliance Annexes3.4 Capital adequacy (i) Qualitative disclosures A summary discussion of the bank’s approach to assessing the adequacy of its
capital or support current and future activitiesRisk Report and Note 64.6 to the Financial Statements
(ii) Quantitative disclosures (a) Capital requirements for credit risk, market risk and operational risk Capital Adequacy in Compliance Annexes (b) Total and Tier 1 capital ratio Capital Adequacy in Compliance Annexes
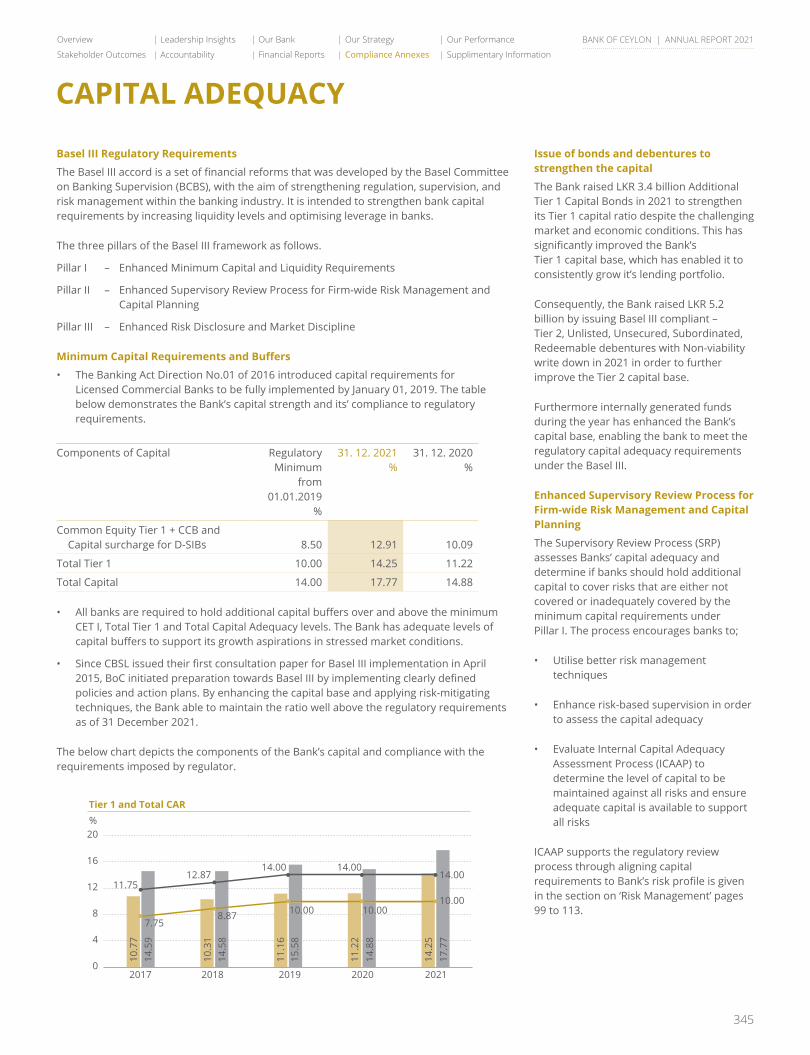
345
Overview Leadership Insights Our Bank Our Strategy Our Performance
Stakeholder Outcomes Accountability Financial Reports Compliance Annexes Supplimentary Information
BANK OF CEYLON | ANNUAL REPORT 2021
CAPITAL ADEQUACY
Basel III Regulatory Requirements
The Basel III accord is a set of financial reforms that was developed by the Basel Committee on Banking Supervision (BCBS), with the aim of strengthening regulation, supervision, and risk management within the banking industry. It is intended to strengthen bank capital requirements by increasing liquidity levels and optimising leverage in banks.
The three pillars of the Basel III framework as follows.
Pillar I – Enhanced Minimum Capital and Liquidity Requirements
Pillar II – Enhanced Supervisory Review Process for Firm-wide Risk Management and Capital Planning
Pillar III – Enhanced Risk Disclosure and Market Discipline
Minimum Capital Requirements and Buffers
• The Banking Act Direction No.01 of 2016 introduced capital requirements for Licensed Commercial Banks to be fully implemented by January 01, 2019. The table below demonstrates the Bank’s capital strength and its’ compliance to regulatory requirements.
Components of Capital Regulatory Minimum
from 01.01.2019
%
31. 12. 2021%
31. 12. 2020%
Common Equity Tier 1 + CCB and Capital surcharge for D-SIBs 8.50 12.91 10.09
Total Tier 1 10.00 14.25 11.22
Total Capital 14.00 17.77 14.88
• All banks are required to hold additional capital buffers over and above the minimum CET I, Total Tier 1 and Total Capital Adequacy levels. The Bank has adequate levels of capital buffers to support its growth aspirations in stressed market conditions.
• Since CBSL issued their first consultation paper for Basel III implementation in April 2015, BoC initiated preparation towards Basel III by implementing clearly defined policies and action plans. By enhancing the capital base and applying risk-mitigating techniques, the Bank able to maintain the ratio well above the regulatory requirements as of 31 December 2021.
The below chart depicts the components of the Bank’s capital and compliance with the requirements imposed by regulator.
Issue of bonds and debentures to strengthen the capital
The Bank raised LKR 3.4 billion Additional Tier 1 Capital Bonds in 2021 to strengthen its Tier 1 capital ratio despite the challenging market and economic conditions. This has significantly improved the Bank’s Tier 1 capital base, which has enabled it to consistently grow it’s lending portfolio.
Consequently, the Bank raised LKR 5.2 billion by issuing Basel III compliant – Tier 2, Unlisted, Unsecured, Subordinated, Redeemable debentures with Non-viability write down in 2021 in order to further improve the Tier 2 capital base.
Furthermore internally generated funds during the year has enhanced the Bank’s capital base, enabling the bank to meet the regulatory capital adequacy requirements under the Basel III.
Enhanced Supervisory Review Process for Firm-wide Risk Management and Capital Planning
The Supervisory Review Process (SRP) assesses Banks’ capital adequacy and determine if banks should hold additional capital to cover risks that are either not covered or inadequately covered by the minimum capital requirements under Pillar I. The process encourages banks to;
• Utilise better risk management techniques
• Enhance risk-based supervision in order to assess the capital adequacy
• Evaluate Internal Capital Adequacy Assessment Process (ICAAP) to determine the level of capital to be maintained against all risks and ensure adequate capital is available to support all risks
ICAAP supports the regulatory review process through aligning capital requirements to Bank’s risk profile is given in the section on ‘Risk Management’ pages 99 to 113.
0
4
8
12
16
20
Tier 1 (Actual) Total CAR (Actual) Tier 1 (Norm) Total CAR (Norm)2017 2018 2019 2020 2021
10.7
7
11.75
7.75
12.87
8.87
14.00
10.00
14.00
10.00
14.00
10.00
14.5
9
10.3
114
.58
11.1
615
.58
11.2
214
.88
14.2
517
.77
Tier 1 and Total CAR %
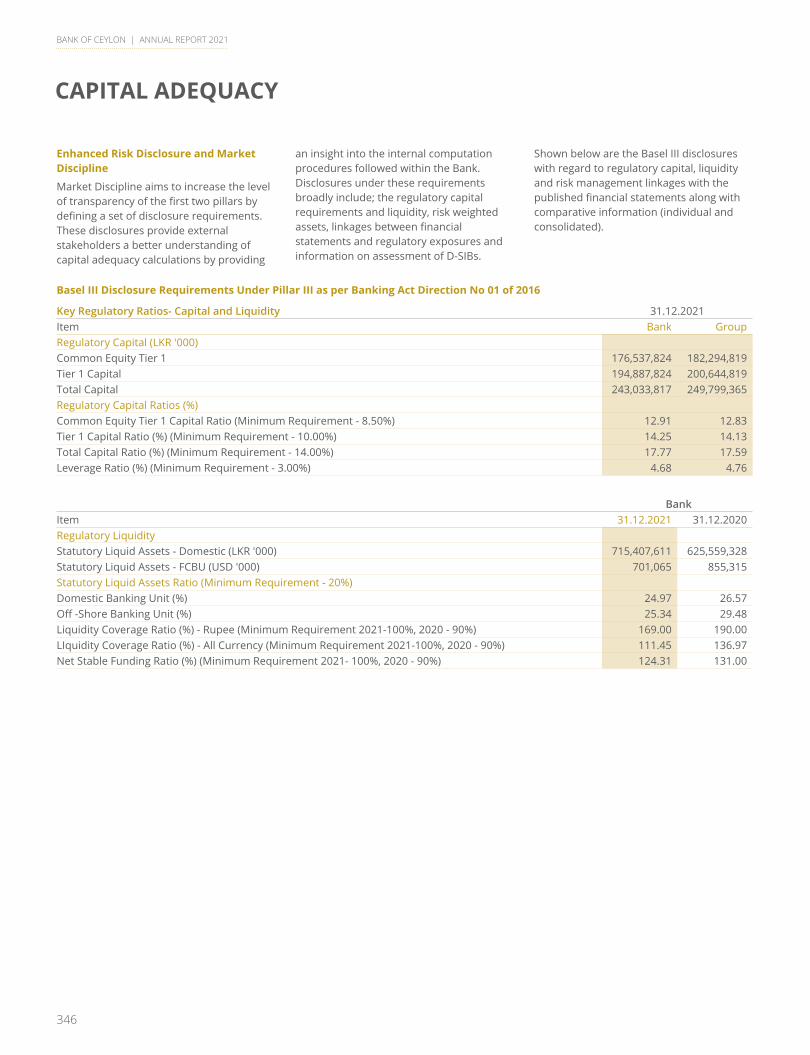
346
BANK OF CEYLON | ANNUAL REPORT 2021
CAPITAL ADEQUACY
Enhanced Risk Disclosure and Market Discipline
Market Discipline aims to increase the level of transparency of the first two pillars by defining a set of disclosure requirements. These disclosures provide external stakeholders a better understanding of capital adequacy calculations by providing
an insight into the internal computation procedures followed within the Bank. Disclosures under these requirements broadly include; the regulatory capital requirements and liquidity, risk weighted assets, linkages between financial statements and regulatory exposures and information on assessment of D-SIBs.
Shown below are the Basel III disclosures with regard to regulatory capital, liquidity and risk management linkages with the published financial statements along with comparative information (individual and consolidated).
Basel III Disclosure Requirements Under Pillar III as per Banking Act Direction No 01 of 2016
Key Regulatory Ratios- Capital and Liquidity 31.12.2021Item Bank GroupRegulatory Capital (LKR '000)Common Equity Tier 1 176,537,824 182,294,819 Tier 1 Capital 194,887,824 200,644,819 Total Capital 243,033,817 249,799,365 Regulatory Capital Ratios (%)Common Equity Tier 1 Capital Ratio (Minimum Requirement - 8.50%) 12.91 12.83 Tier 1 Capital Ratio (%) (Minimum Requirement - 10.00%) 14.25 14.13 Total Capital Ratio (%) (Minimum Requirement - 14.00%) 17.77 17.59 Leverage Ratio (%) (Minimum Requirement - 3.00%) 4.68 4.76
Bank Item 31.12.2021 31.12.2020Regulatory LiquidityStatutory Liquid Assets - Domestic (LKR '000) 715,407,611 625,559,328 Statutory Liquid Assets - FCBU (USD '000) 701,065 855,315 Statutory Liquid Assets Ratio (Minimum Requirement - 20%)Domestic Banking Unit (%) 24.97 26.57 Off -Shore Banking Unit (%) 25.34 29.48 Liquidity Coverage Ratio (%) - Rupee (Minimum Requirement 2021-100%, 2020 - 90%) 169.00 190.00 LIquidity Coverage Ratio (%) - All Currency (Minimum Requirement 2021-100%, 2020 - 90%) 111.45 136.97 Net Stable Funding Ratio (%) (Minimum Requirement 2021- 100%, 2020 - 90%) 124.31 131.00
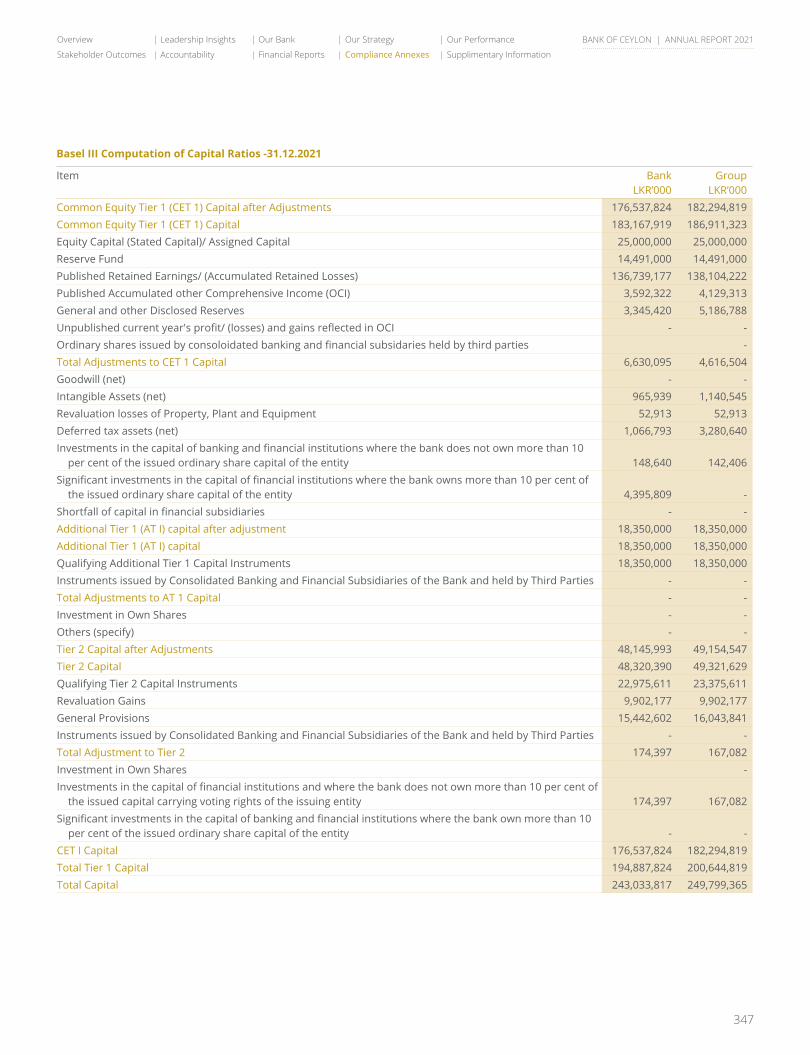
347
Overview Leadership Insights Our Bank Our Strategy Our Performance
Stakeholder Outcomes Accountability Financial Reports Compliance Annexes Supplimentary Information
BANK OF CEYLON | ANNUAL REPORT 2021
Basel III Computation of Capital Ratios -31.12.2021
Item BankLKR’000
GroupLKR’000
Common Equity Tier 1 (CET 1) Capital after Adjustments 176,537,824 182,294,819 Common Equity Tier 1 (CET 1) Capital 183,167,919 186,911,323 Equity Capital (Stated Capital)/ Assigned Capital 25,000,000 25,000,000 Reserve Fund 14,491,000 14,491,000 Published Retained Earnings/ (Accumulated Retained Losses) 136,739,177 138,104,222 Published Accumulated other Comprehensive Income (OCI) 3,592,322 4,129,313 General and other Disclosed Reserves 3,345,420 5,186,788 Unpublished current year's profit/ (losses) and gains reflected in OCI - - Ordinary shares issued by consoloidated banking and financial subsidaries held by third parties - Total Adjustments to CET 1 Capital 6,630,095 4,616,504 Goodwill (net) - - Intangible Assets (net) 965,939 1,140,545 Revaluation losses of Property, Plant and Equipment 52,913 52,913 Deferred tax assets (net) 1,066,793 3,280,640 Investments in the capital of banking and financial institutions where the bank does not own more than 10
per cent of the issued ordinary share capital of the entity 148,640 142,406 Significant investments in the capital of financial institutions where the bank owns more than 10 per cent of
the issued ordinary share capital of the entity 4,395,809 - Shortfall of capital in financial subsidiaries - - Additional Tier 1 (AT I) capital after adjustment 18,350,000 18,350,000 Additional Tier 1 (AT I) capital 18,350,000 18,350,000 Qualifying Additional Tier 1 Capital Instruments 18,350,000 18,350,000 Instruments issued by Consolidated Banking and Financial Subsidiaries of the Bank and held by Third Parties - - Total Adjustments to AT 1 Capital - - Investment in Own Shares - - Others (specify) - -Tier 2 Capital after Adjustments 48,145,993 49,154,547 Tier 2 Capital 48,320,390 49,321,629 Qualifying Tier 2 Capital Instruments 22,975,611 23,375,611 Revaluation Gains 9,902,177 9,902,177 General Provisions 15,442,602 16,043,841 Instruments issued by Consolidated Banking and Financial Subsidiaries of the Bank and held by Third Parties - - Total Adjustment to Tier 2 174,397 167,082 Investment in Own Shares - Investments in the capital of financial institutions and where the bank does not own more than 10 per cent of
the issued capital carrying voting rights of the issuing entity 174,397 167,082 Significant investments in the capital of banking and financial institutions where the bank own more than 10
per cent of the issued ordinary share capital of the entity - - CET I Capital 176,537,824 182,294,819 Total Tier 1 Capital 194,887,824 200,644,819 Total Capital 243,033,817 249,799,365
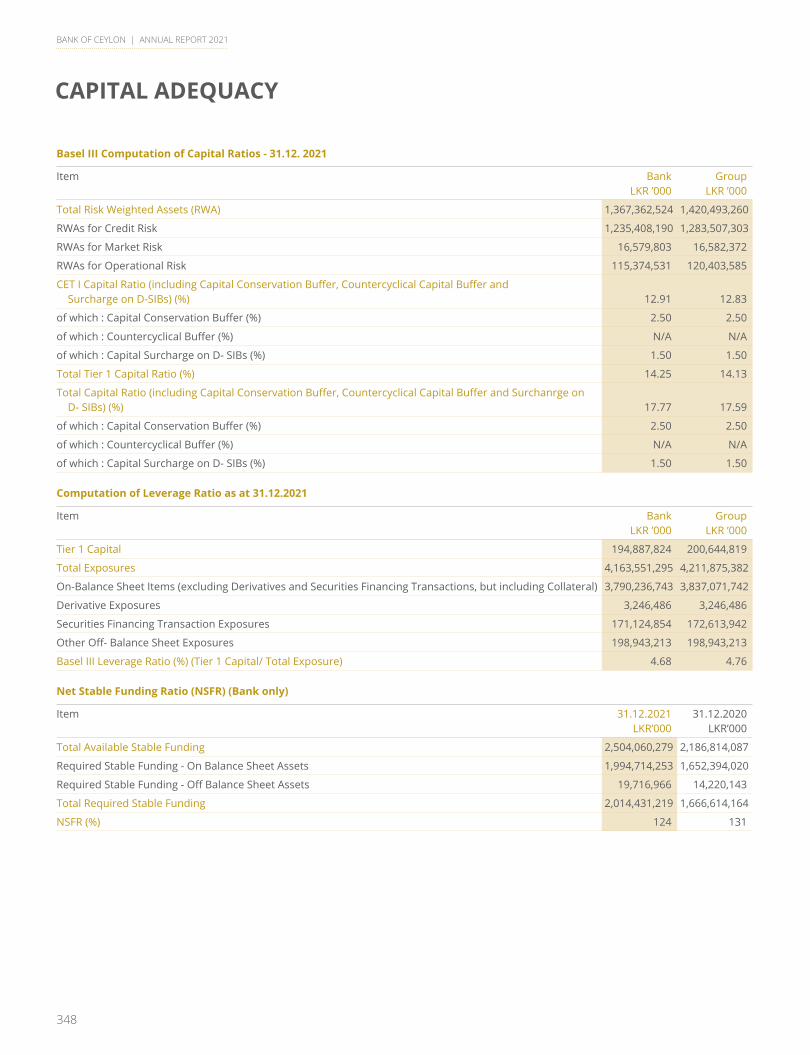
348
BANK OF CEYLON | ANNUAL REPORT 2021
CAPITAL ADEQUACY
Basel III Computation of Capital Ratios - 31.12. 2021
Item BankLKR ’000
GroupLKR ’000
Total Risk Weighted Assets (RWA) 1,367,362,524 1,420,493,260
RWAs for Credit Risk 1,235,408,190 1,283,507,303
RWAs for Market Risk 16,579,803 16,582,372
RWAs for Operational Risk 115,374,531 120,403,585
CET I Capital Ratio (including Capital Conservation Buffer, Countercyclical Capital Buffer and Surcharge on D-SIBs) (%) 12.91 12.83
of which : Capital Conservation Buffer (%) 2.50 2.50
of which : Countercyclical Buffer (%) N/A N/A
of which : Capital Surcharge on D- SIBs (%) 1.50 1.50
Total Tier 1 Capital Ratio (%) 14.25 14.13
Total Capital Ratio (including Capital Conservation Buffer, Countercyclical Capital Buffer and Surchanrge on D- SIBs) (%) 17.77 17.59
of which : Capital Conservation Buffer (%) 2.50 2.50
of which : Countercyclical Buffer (%) N/A N/A
of which : Capital Surcharge on D- SIBs (%) 1.50 1.50
Computation of Leverage Ratio as at 31.12.2021
Item BankLKR ’000
GroupLKR ’000
Tier 1 Capital 194,887,824 200,644,819
Total Exposures 4,163,551,295 4,211,875,382
On-Balance Sheet Items (excluding Derivatives and Securities Financing Transactions, but including Collateral) 3,790,236,743 3,837,071,742
Derivative Exposures 3,246,486 3,246,486
Securities Financing Transaction Exposures 171,124,854 172,613,942
Other Off- Balance Sheet Exposures 198,943,213 198,943,213
Basel III Leverage Ratio (%) (Tier 1 Capital/ Total Exposure) 4.68 4.76
Net Stable Funding Ratio (NSFR) (Bank only)
Item 31.12.2021LKR’000
31.12.2020LKR’000
Total Available Stable Funding 2,504,060,279 2,186,814,087
Required Stable Funding - On Balance Sheet Assets 1,994,714,253 1,652,394,020
Required Stable Funding - Off Balance Sheet Assets 19,716,966 14,220,143
Total Required Stable Funding 2,014,431,219 1,666,614,164
NSFR (%) 124 131
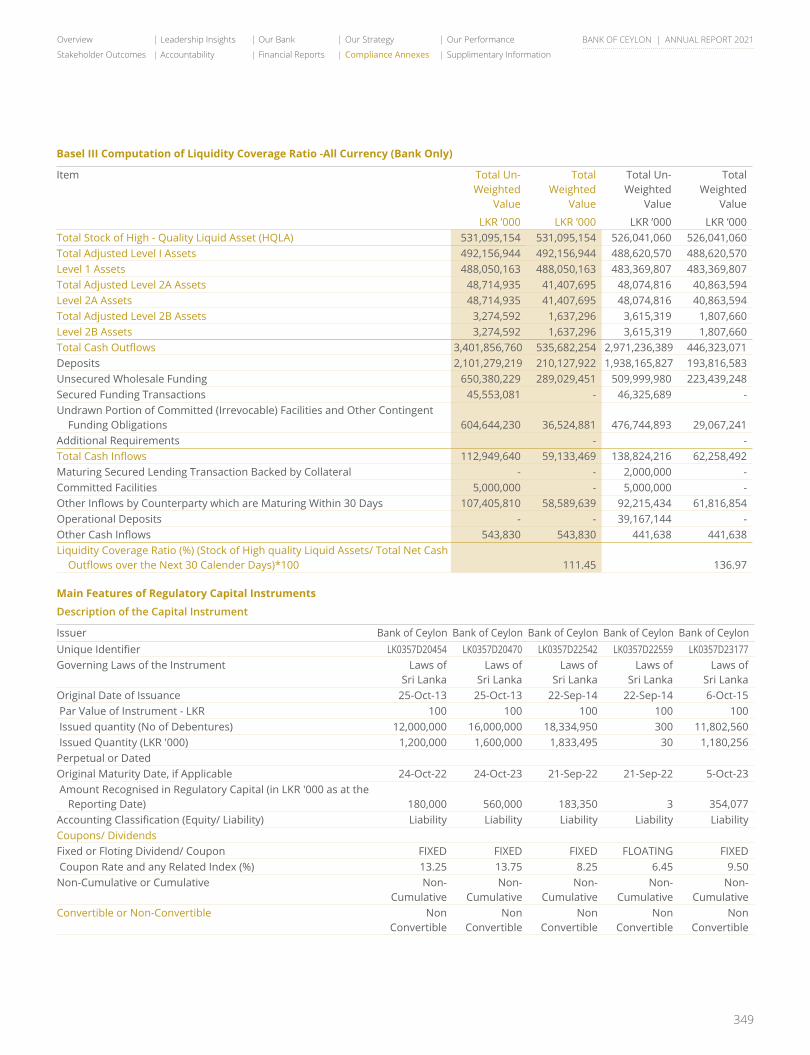
349
Overview Leadership Insights Our Bank Our Strategy Our Performance
Stakeholder Outcomes Accountability Financial Reports Compliance Annexes Supplimentary Information
BANK OF CEYLON | ANNUAL REPORT 2021
Basel III Computation of Liquidity Coverage Ratio -All Currency (Bank Only)
Item Total Un-Weighted
Value
Total Weighted
Value
Total Un-Weighted
Value
Total Weighted
Value
LKR ’000 LKR ’000 LKR ’000 LKR ’000Total Stock of High - Quality Liquid Asset (HQLA) 531,095,154 531,095,154 526,041,060 526,041,060 Total Adjusted Level I Assets 492,156,944 492,156,944 488,620,570 488,620,570 Level 1 Assets 488,050,163 488,050,163 483,369,807 483,369,807 Total Adjusted Level 2A Assets 48,714,935 41,407,695 48,074,816 40,863,594 Level 2A Assets 48,714,935 41,407,695 48,074,816 40,863,594 Total Adjusted Level 2B Assets 3,274,592 1,637,296 3,615,319 1,807,660 Level 2B Assets 3,274,592 1,637,296 3,615,319 1,807,660 Total Cash Outflows 3,401,856,760 535,682,254 2,971,236,389 446,323,071 Deposits 2,101,279,219 210,127,922 1,938,165,827 193,816,583 Unsecured Wholesale Funding 650,380,229 289,029,451 509,999,980 223,439,248 Secured Funding Transactions 45,553,081 - 46,325,689 - Undrawn Portion of Committed (Irrevocable) Facilities and Other Contingent
Funding Obligations 604,644,230 36,524,881 476,744,893 29,067,241 Additional Requirements - - Total Cash Inflows 112,949,640 59,133,469 138,824,216 62,258,492 Maturing Secured Lending Transaction Backed by Collateral - - 2,000,000 - Committed Facilities 5,000,000 - 5,000,000 - Other Inflows by Counterparty which are Maturing Within 30 Days 107,405,810 58,589,639 92,215,434 61,816,854 Operational Deposits - - 39,167,144 - Other Cash Inflows 543,830 543,830 441,638 441,638 Liquidity Coverage Ratio (%) (Stock of High quality Liquid Assets/ Total Net Cash
Outflows over the Next 30 Calender Days)*100 111.45 136.97
Main Features of Regulatory Capital Instruments
Description of the Capital Instrument
Issuer Bank of Ceylon Bank of Ceylon Bank of Ceylon Bank of Ceylon Bank of CeylonUnique Identifier LK0357D20454 LK0357D20470 LK0357D22542 LK0357D22559 LK0357D23177Governing Laws of the Instrument Laws of
Sri LankaLaws of
Sri LankaLaws of
Sri LankaLaws of
Sri LankaLaws of
Sri LankaOriginal Date of Issuance 25-Oct-13 25-Oct-13 22-Sep-14 22-Sep-14 6-Oct-15 Par Value of Instrument - LKR 100 100 100 100 100 Issued quantity (No of Debentures) 12,000,000 16,000,000 18,334,950 300 11,802,560 Issued Quantity (LKR '000) 1,200,000 1,600,000 1,833,495 30 1,180,256 Perpetual or DatedOriginal Maturity Date, if Applicable 24-Oct-22 24-Oct-23 21-Sep-22 21-Sep-22 5-Oct-23 Amount Recognised in Regulatory Capital (in LKR '000 as at the
Reporting Date) 180,000 560,000 183,350 3 354,077 Accounting Classification (Equity/ Liability) Liability Liability Liability Liability LiabilityCoupons/ DividendsFixed or Floting Dividend/ Coupon FIXED FIXED FIXED FLOATING FIXED Coupon Rate and any Related Index (%) 13.25 13.75 8.25 6.45 9.50 Non-Cumulative or Cumulative Non-
CumulativeNon-
CumulativeNon-
CumulativeNon-
CumulativeNon-
CumulativeConvertible or Non-Convertible Non
ConvertibleNon
ConvertibleNon
ConvertibleNon
ConvertibleNon
Convertible
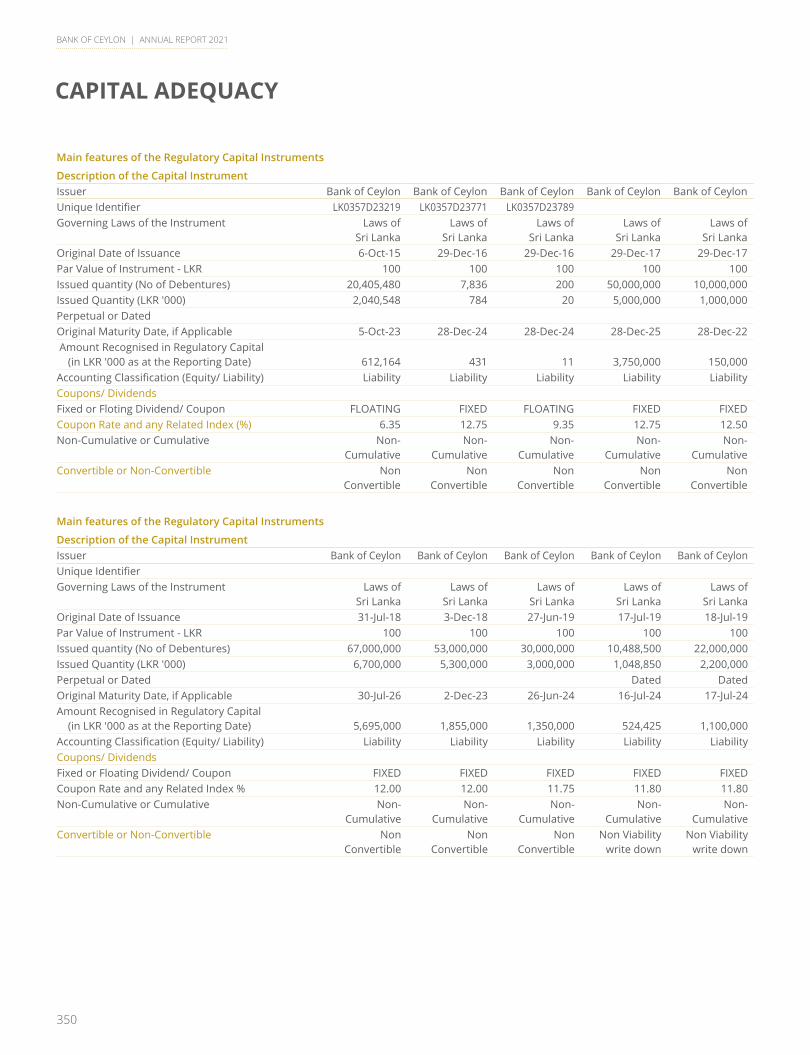
350
BANK OF CEYLON | ANNUAL REPORT 2021
CAPITAL ADEQUACY
Main features of the Regulatory Capital Instruments
Description of the Capital InstrumentIssuer Bank of Ceylon Bank of Ceylon Bank of Ceylon Bank of Ceylon Bank of CeylonUnique Identifier LK0357D23219 LK0357D23771 LK0357D23789Governing Laws of the Instrument Laws of
Sri LankaLaws of
Sri LankaLaws of
Sri LankaLaws of
Sri LankaLaws of
Sri LankaOriginal Date of Issuance 6-Oct-15 29-Dec-16 29-Dec-16 29-Dec-17 29-Dec-17Par Value of Instrument - LKR 100 100 100 100 100 Issued quantity (No of Debentures) 20,405,480 7,836 200 50,000,000 10,000,000 Issued Quantity (LKR '000) 2,040,548 784 20 5,000,000 1,000,000 Perpetual or DatedOriginal Maturity Date, if Applicable 5-Oct-23 28-Dec-24 28-Dec-24 28-Dec-25 28-Dec-22 Amount Recognised in Regulatory Capital
(in LKR '000 as at the Reporting Date) 612,164 431 11 3,750,000 150,000 Accounting Classification (Equity/ Liability) Liability Liability Liability Liability LiabilityCoupons/ DividendsFixed or Floting Dividend/ Coupon FLOATING FIXED FLOATING FIXED FIXEDCoupon Rate and any Related Index (%) 6.35 12.75 9.35 12.75 12.50 Non-Cumulative or Cumulative Non-
CumulativeNon-
CumulativeNon-
CumulativeNon-
CumulativeNon-
CumulativeConvertible or Non-Convertible Non
ConvertibleNon
ConvertibleNon
ConvertibleNon
ConvertibleNon
Convertible
Main features of the Regulatory Capital Instruments
Description of the Capital InstrumentIssuer Bank of Ceylon Bank of Ceylon Bank of Ceylon Bank of Ceylon Bank of CeylonUnique IdentifierGoverning Laws of the Instrument Laws of
Sri LankaLaws of
Sri LankaLaws of
Sri LankaLaws of
Sri LankaLaws of
Sri LankaOriginal Date of Issuance 31-Jul-18 3-Dec-18 27-Jun-19 17-Jul-19 18-Jul-19Par Value of Instrument - LKR 100 100 100 100 100 Issued quantity (No of Debentures) 67,000,000 53,000,000 30,000,000 10,488,500 22,000,000 Issued Quantity (LKR '000) 6,700,000 5,300,000 3,000,000 1,048,850 2,200,000 Perpetual or Dated Dated DatedOriginal Maturity Date, if Applicable 30-Jul-26 2-Dec-23 26-Jun-24 16-Jul-24 17-Jul-24Amount Recognised in Regulatory Capital
(in LKR '000 as at the Reporting Date) 5,695,000 1,855,000 1,350,000 524,425 1,100,000 Accounting Classification (Equity/ Liability) Liability Liability Liability Liability LiabilityCoupons/ DividendsFixed or Floating Dividend/ Coupon FIXED FIXED FIXED FIXED FIXEDCoupon Rate and any Related Index % 12.00 12.00 11.75 11.80 11.80 Non-Cumulative or Cumulative Non-
CumulativeNon-
CumulativeNon-
CumulativeNon-
CumulativeNon-
CumulativeConvertible or Non-Convertible Non
ConvertibleNon
ConvertibleNon
ConvertibleNon Viability
write downNon Viability
write down
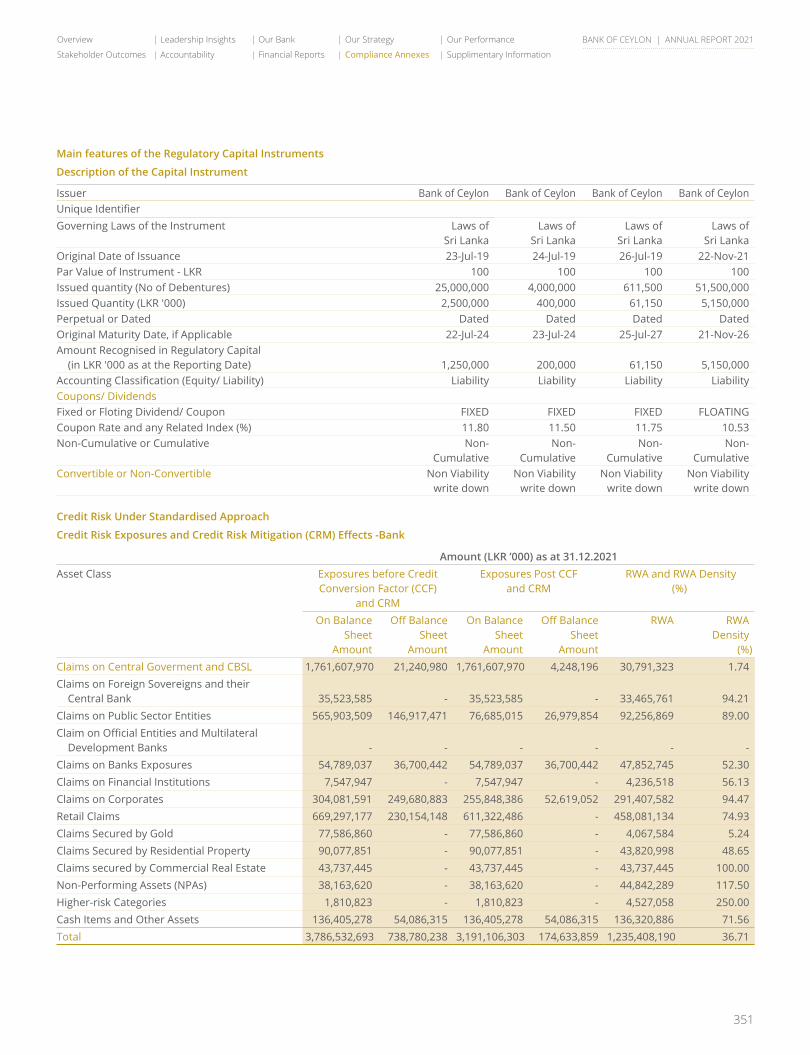
351
Overview Leadership Insights Our Bank Our Strategy Our Performance
Stakeholder Outcomes Accountability Financial Reports Compliance Annexes Supplimentary Information
BANK OF CEYLON | ANNUAL REPORT 2021
Main features of the Regulatory Capital Instruments
Description of the Capital Instrument
Issuer Bank of Ceylon Bank of Ceylon Bank of Ceylon Bank of CeylonUnique IdentifierGoverning Laws of the Instrument Laws of
Sri LankaLaws of
Sri LankaLaws of
Sri LankaLaws of
Sri LankaOriginal Date of Issuance 23-Jul-19 24-Jul-19 26-Jul-19 22-Nov-21Par Value of Instrument - LKR 100 100 100 100 Issued quantity (No of Debentures) 25,000,000 4,000,000 611,500 51,500,000 Issued Quantity (LKR '000) 2,500,000 400,000 61,150 5,150,000 Perpetual or Dated Dated Dated Dated DatedOriginal Maturity Date, if Applicable 22-Jul-24 23-Jul-24 25-Jul-27 21-Nov-26Amount Recognised in Regulatory Capital
(in LKR '000 as at the Reporting Date) 1,250,000 200,000 61,150 5,150,000 Accounting Classification (Equity/ Liability) Liability Liability Liability LiabilityCoupons/ DividendsFixed or Floting Dividend/ Coupon FIXED FIXED FIXED FLOATINGCoupon Rate and any Related Index (%) 11.80 11.50 11.75 10.53 Non-Cumulative or Cumulative Non-
CumulativeNon-
CumulativeNon-
CumulativeNon-
CumulativeConvertible or Non-Convertible Non Viability
write downNon Viability
write downNon Viability
write downNon Viability
write down
Credit Risk Under Standardised Approach
CreditRiskExposuresandCreditRiskMitigation(CRM)Effects-Bank
Amount (LKR ’000) as at 31.12.2021Asset Class Exposures before Credit
Conversion Factor (CCF) and CRM
Exposures Post CCF and CRM
RWA and RWA Density(%)
On Balance Sheet
Amount
Off Balance Sheet
Amount
On Balance Sheet
Amount
Off Balance Sheet
Amount
RWA RWADensity
(%)Claims on Central Goverment and CBSL 1,761,607,970 21,240,980 1,761,607,970 4,248,196 30,791,323 1.74 Claims on Foreign Sovereigns and their
Central Bank 35,523,585 - 35,523,585 - 33,465,761 94.21 Claims on Public Sector Entities 565,903,509 146,917,471 76,685,015 26,979,854 92,256,869 89.00 Claim on Official Entities and Multilateral
Development Banks - - - - - - Claims on Banks Exposures 54,789,037 36,700,442 54,789,037 36,700,442 47,852,745 52.30 Claims on Financial Institutions 7,547,947 - 7,547,947 - 4,236,518 56.13 Claims on Corporates 304,081,591 249,680,883 255,848,386 52,619,052 291,407,582 94.47 Retail Claims 669,297,177 230,154,148 611,322,486 - 458,081,134 74.93 Claims Secured by Gold 77,586,860 - 77,586,860 - 4,067,584 5.24 Claims Secured by Residential Property 90,077,851 - 90,077,851 - 43,820,998 48.65 Claims secured by Commercial Real Estate 43,737,445 - 43,737,445 - 43,737,445 100.00 Non-Performing Assets (NPAs) 38,163,620 - 38,163,620 - 44,842,289 117.50 Higher-risk Categories 1,810,823 - 1,810,823 - 4,527,058 250.00 Cash Items and Other Assets 136,405,278 54,086,315 136,405,278 54,086,315 136,320,886 71.56 Total 3,786,532,693 738,780,238 3,191,106,303 174,633,859 1,235,408,190 36.71
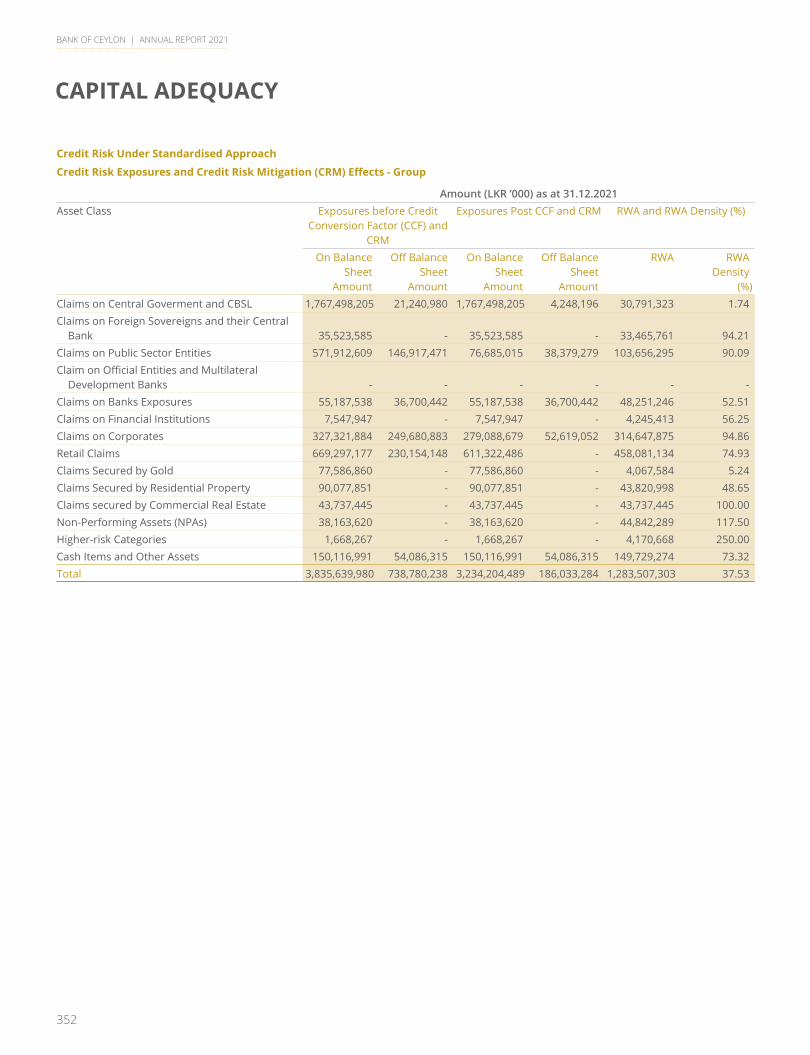
352
BANK OF CEYLON | ANNUAL REPORT 2021
CAPITAL ADEQUACY
Credit Risk Under Standardised Approach
Credit Risk Exposures and Credit Risk Mitigation (CRM) Effects - Group
Amount (LKR ’000) as at 31.12.2021Asset Class Exposures before Credit
Conversion Factor (CCF) and CRM
Exposures Post CCF and CRM RWA and RWA Density (%)
On Balance Sheet
Amount
Off Balance Sheet
Amount
On Balance Sheet
Amount
Off Balance Sheet
Amount
RWA RWADensity
(%)Claims on Central Goverment and CBSL 1,767,498,205 21,240,980 1,767,498,205 4,248,196 30,791,323 1.74 Claims on Foreign Sovereigns and their Central
Bank 35,523,585 - 35,523,585 - 33,465,761 94.21 Claims on Public Sector Entities 571,912,609 146,917,471 76,685,015 38,379,279 103,656,295 90.09 Claim on Official Entities and Multilateral
Development Banks - - - - - - Claims on Banks Exposures 55,187,538 36,700,442 55,187,538 36,700,442 48,251,246 52.51 Claims on Financial Institutions 7,547,947 - 7,547,947 - 4,245,413 56.25 Claims on Corporates 327,321,884 249,680,883 279,088,679 52,619,052 314,647,875 94.86 Retail Claims 669,297,177 230,154,148 611,322,486 - 458,081,134 74.93 Claims Secured by Gold 77,586,860 - 77,586,860 - 4,067,584 5.24 Claims Secured by Residential Property 90,077,851 - 90,077,851 - 43,820,998 48.65 Claims secured by Commercial Real Estate 43,737,445 - 43,737,445 - 43,737,445 100.00 Non-Performing Assets (NPAs) 38,163,620 - 38,163,620 - 44,842,289 117.50 Higher-risk Categories 1,668,267 - 1,668,267 - 4,170,668 250.00 Cash Items and Other Assets 150,116,991 54,086,315 150,116,991 54,086,315 149,729,274 73.32 Total 3,835,639,980 738,780,238 3,234,204,489 186,033,284 1,283,507,303 37.53
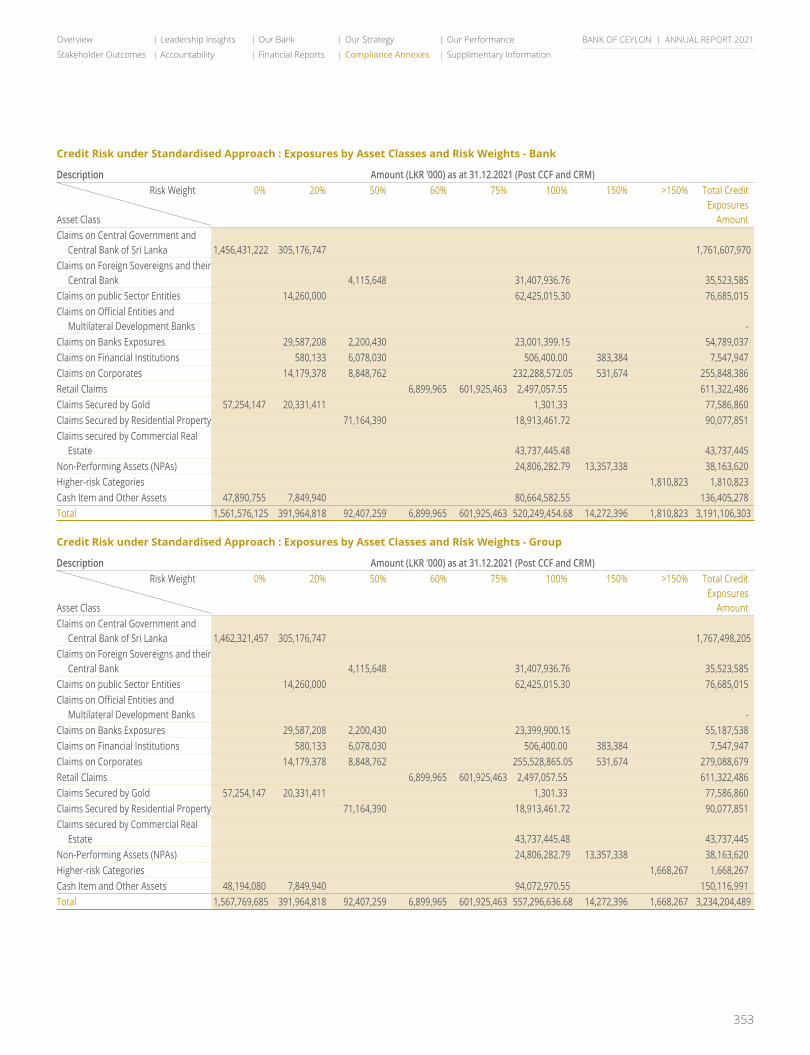
353
Overview Leadership Insights Our Bank Our Strategy Our Performance
Stakeholder Outcomes Accountability Financial Reports Compliance Annexes Supplimentary Information
BANK OF CEYLON | ANNUAL REPORT 2021
Credit Risk under Standardised Approach : Exposures by Asset Classes and Risk Weights - Bank
Description Amount (LKR ’000) as at 31.12.2021 (Post CCF and CRM) Risk Weight
Asset Class
0% 20% 50% 60% 75% 100% 150% >150% Total Credit Exposures
AmountClaims on Central Government and
Central Bank of Sri Lanka 1,456,431,222 305,176,747 1,761,607,970 Claims on Foreign Sovereigns and their
Central Bank 4,115,648 31,407,936.76 35,523,585 Claims on public Sector Entities 14,260,000 62,425,015.30 76,685,015 Claims on Official Entities and
Multilateral Development Banks - Claims on Banks Exposures 29,587,208 2,200,430 23,001,399.15 54,789,037 Claims on Financial Institutions 580,133 6,078,030 506,400.00 383,384 7,547,947 Claims on Corporates 14,179,378 8,848,762 232,288,572.05 531,674 255,848,386 Retail Claims 6,899,965 601,925,463 2,497,057.55 611,322,486 Claims Secured by Gold 57,254,147 20,331,411 1,301.33 77,586,860 Claims Secured by Residential Property 71,164,390 18,913,461.72 90,077,851 Claims secured by Commercial Real
Estate 43,737,445.48 43,737,445 Non-Performing Assets (NPAs) 24,806,282.79 13,357,338 38,163,620 Higher-risk Categories 1,810,823 1,810,823 Cash Item and Other Assets 47,890,755 7,849,940 80,664,582.55 136,405,278 Total 1,561,576,125 391,964,818 92,407,259 6,899,965 601,925,463 520,249,454.68 14,272,396 1,810,823 3,191,106,303
Credit Risk under Standardised Approach : Exposures by Asset Classes and Risk Weights - Group
Description Amount (LKR ’000) as at 31.12.2021 (Post CCF and CRM) Risk Weight
Asset Class
0% 20% 50% 60% 75% 100% 150% >150% Total Credit Exposures
AmountClaims on Central Government and
Central Bank of Sri Lanka 1,462,321,457 305,176,747 1,767,498,205 Claims on Foreign Sovereigns and their
Central Bank 4,115,648 31,407,936.76 35,523,585 Claims on public Sector Entities 14,260,000 62,425,015.30 76,685,015 Claims on Official Entities and
Multilateral Development Banks - Claims on Banks Exposures 29,587,208 2,200,430 23,399,900.15 55,187,538 Claims on Financial Institutions 580,133 6,078,030 506,400.00 383,384 7,547,947 Claims on Corporates 14,179,378 8,848,762 255,528,865.05 531,674 279,088,679 Retail Claims 6,899,965 601,925,463 2,497,057.55 611,322,486 Claims Secured by Gold 57,254,147 20,331,411 1,301.33 77,586,860 Claims Secured by Residential Property 71,164,390 18,913,461.72 90,077,851 Claims secured by Commercial Real
Estate 43,737,445.48 43,737,445 Non-Performing Assets (NPAs) 24,806,282.79 13,357,338 38,163,620 Higher-risk Categories 1,668,267 1,668,267 Cash Item and Other Assets 48,194,080 7,849,940 94,072,970.55 150,116,991 Total 1,567,769,685 391,964,818 92,407,259 6,899,965 601,925,463 557,296,636.68 14,272,396 1,668,267 3,234,204,489
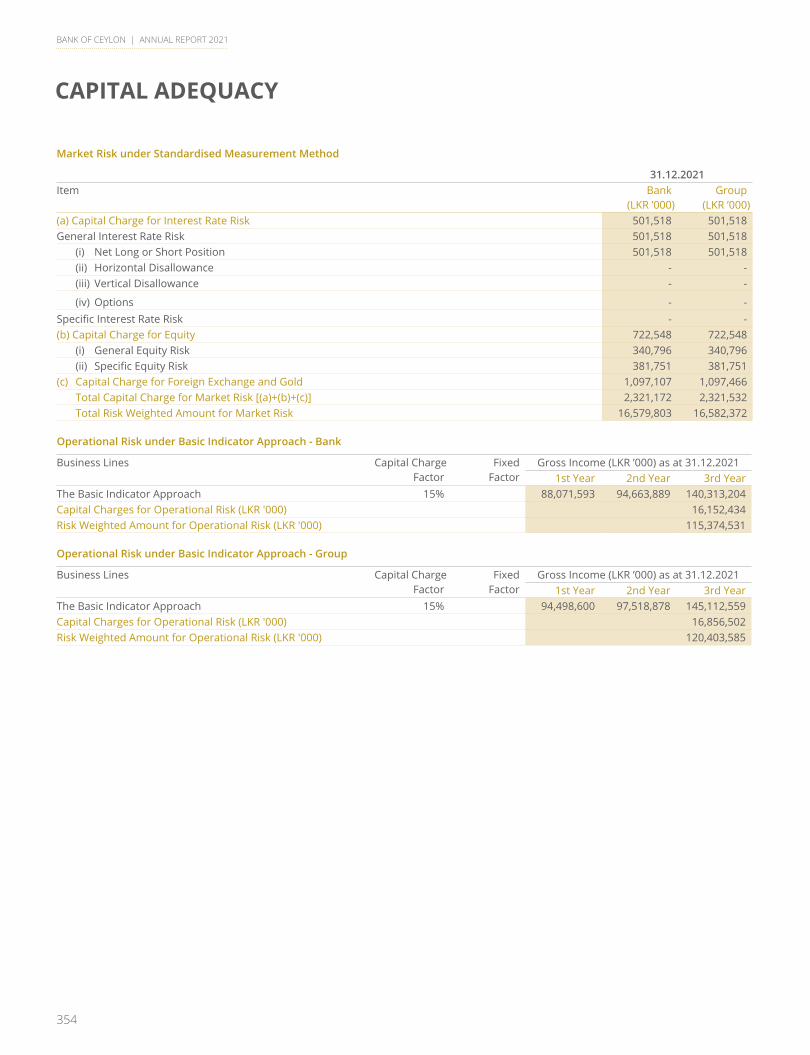
354
BANK OF CEYLON | ANNUAL REPORT 2021
CAPITAL ADEQUACY
Market Risk under Standardised Measurement Method
31.12.2021Item Bank
(LKR ’000)Group
(LKR ’000)(a) Capital Charge for Interest Rate Risk 501,518 501,518 General Interest Rate Risk 501,518 501,518
(i) Net Long or Short Position 501,518 501,518 (ii) Horizontal Disallowance - - (iii) Vertical Disallowance - -
(iv) Options - - Specific Interest Rate Risk - - (b) Capital Charge for Equity 722,548 722,548
(i) General Equity Risk 340,796 340,796 (ii) Specific Equity Risk 381,751 381,751
(c) Capital Charge for Foreign Exchange and Gold 1,097,107 1,097,466 Total Capital Charge for Market Risk [(a)+(b)+(c)] 2,321,172 2,321,532 Total Risk Weighted Amount for Market Risk 16,579,803 16,582,372
Operational Risk under Basic Indicator Approach - Bank
Business Lines Capital Charge Factor
FixedFactor
Gross Income (LKR ’000) as at 31.12.20211st Year 2nd Year 3rd Year
The Basic Indicator Approach 15% 88,071,593 94,663,889 140,313,204 Capital Charges for Operational Risk (LKR '000) 16,152,434 Risk Weighted Amount for Operational Risk (LKR '000) 115,374,531
Operational Risk under Basic Indicator Approach - Group
Business Lines Capital Charge Factor
FixedFactor
Gross Income (LKR ’000) as at 31.12.20211st Year 2nd Year 3rd Year
The Basic Indicator Approach 15% 94,498,600 97,518,878 145,112,559 Capital Charges for Operational Risk (LKR '000) 16,856,502 Risk Weighted Amount for Operational Risk (LKR '000) 120,403,585
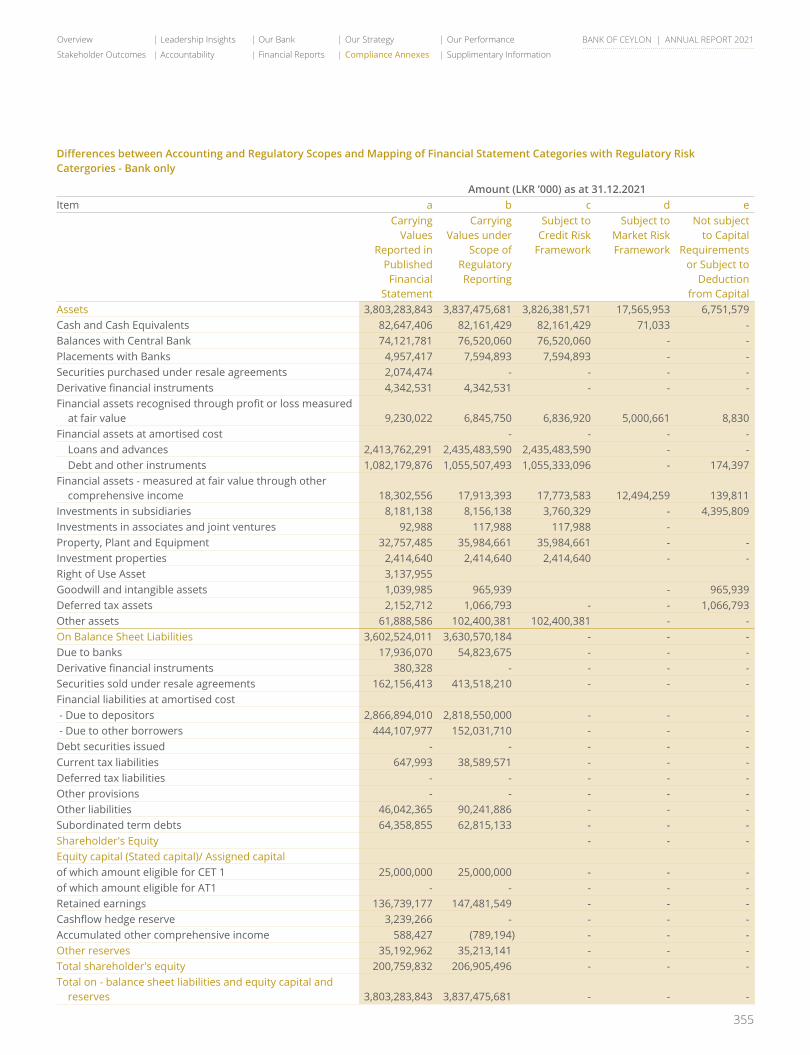
355
Overview Leadership Insights Our Bank Our Strategy Our Performance
Stakeholder Outcomes Accountability Financial Reports Compliance Annexes Supplimentary Information
BANK OF CEYLON | ANNUAL REPORT 2021
DifferencesbetweenAccountingandRegulatoryScopesandMappingofFinancialStatementCategorieswithRegulatoryRiskCatergories - Bank only
Amount (LKR ’000) as at 31.12.2021 Item a b c d e
Carrying Values
Reported in Published Financial
Statement
Carrying Values under
Scope of Regulatory Reporting
Subject to Credit Risk
Framework
Subject to Market Risk Framework
Not subject to Capital
Requirements or Subject to
Deduction from Capital
Assets 3,803,283,843 3,837,475,681 3,826,381,571 17,565,953 6,751,579 Cash and Cash Equivalents 82,647,406 82,161,429 82,161,429 71,033 - Balances with Central Bank 74,121,781 76,520,060 76,520,060 - - Placements with Banks 4,957,417 7,594,893 7,594,893 - - Securities purchased under resale agreements 2,074,474 - - - - Derivative financial instruments 4,342,531 4,342,531 - - - Financial assets recognised through profit or loss measured
at fair value 9,230,022 6,845,750 6,836,920 5,000,661 8,830 Financial assets at amortised cost - - - - Loans and advances 2,413,762,291 2,435,483,590 2,435,483,590 - - Debt and other instruments 1,082,179,876 1,055,507,493 1,055,333,096 - 174,397 Financial assets - measured at fair value through other
comprehensive income 18,302,556 17,913,393 17,773,583 12,494,259 139,811 Investments in subsidiaries 8,181,138 8,156,138 3,760,329 - 4,395,809 Investments in associates and joint ventures 92,988 117,988 117,988 - Property, Plant and Equipment 32,757,485 35,984,661 35,984,661 - - Investment properties 2,414,640 2,414,640 2,414,640 - - Right of Use Asset 3,137,955 Goodwill and intangible assets 1,039,985 965,939 - 965,939 Deferred tax assets 2,152,712 1,066,793 - - 1,066,793 Other assets 61,888,586 102,400,381 102,400,381 - - On Balance Sheet Liabilities 3,602,524,011 3,630,570,184 - - - Due to banks 17,936,070 54,823,675 - - - Derivative financial instruments 380,328 - - - - Securities sold under resale agreements 162,156,413 413,518,210 - - - Financial liabilities at amortised cost - Due to depositors 2,866,894,010 2,818,550,000 - - - - Due to other borrowers 444,107,977 152,031,710 - - - Debt securities issued - - - - - Current tax liabilities 647,993 38,589,571 - - - Deferred tax liabilities - - - - - Other provisions - - - - - Other liabilities 46,042,365 90,241,886 - - - Subordinated term debts 64,358,855 62,815,133 - - - Shareholder's Equity - - - Equity capital (Stated capital)/ Assigned capitalof which amount eligible for CET 1 25,000,000 25,000,000 - - - of which amount eligible for AT1 - - - - - Retained earnings 136,739,177 147,481,549 - - - Cashflow hedge reserve 3,239,266 - - - -Accumulated other comprehensive income 588,427 (789,194) - - - Other reserves 35,192,962 35,213,141 - - - Total shareholder's equity 200,759,832 206,905,496 - - - Total on - balance sheet liabilities and equity capital and
reserves 3,803,283,843 3,837,475,681 - - -
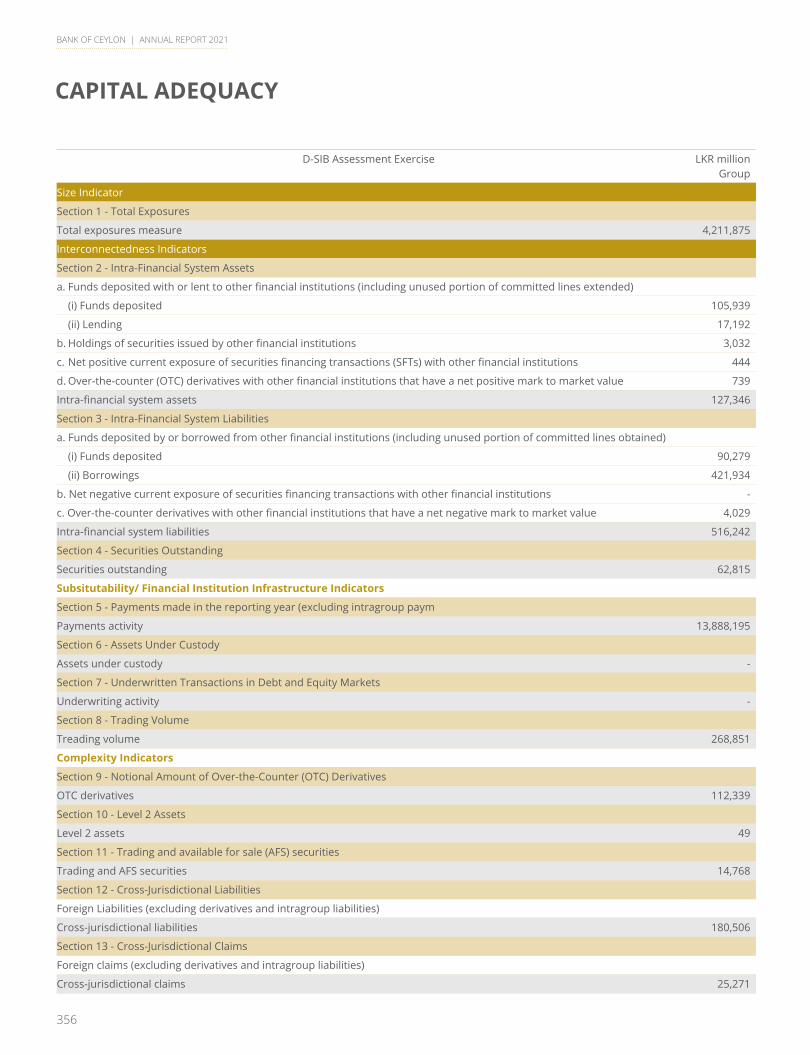
356
BANK OF CEYLON | ANNUAL REPORT 2021
CAPITAL ADEQUACY
D-SIB Assessment Exercise LKR millionGroup
Size Indicator
Section 1 - Total Exposures
Total exposures measure 4,211,875
Interconnectedness Indicators
Section 2 - Intra-Financial System Assets
a. Funds deposited with or lent to other financial institutions (including unused portion of committed lines extended)
(i) Funds deposited 105,939
(ii) Lending 17,192
b. Holdings of securities issued by other financial institutions 3,032
c. Net positive current exposure of securities financing transactions (SFTs) with other financial institutions 444
d. Over-the-counter (OTC) derivatives with other financial institutions that have a net positive mark to market value 739
Intra-financial system assets 127,346
Section 3 - Intra-Financial System Liabilities
a. Funds deposited by or borrowed from other financial institutions (including unused portion of committed lines obtained)
(i) Funds deposited 90,279
(ii) Borrowings 421,934
b. Net negative current exposure of securities financing transactions with other financial institutions -
c. Over-the-counter derivatives with other financial institutions that have a net negative mark to market value 4,029
Intra-financial system liabilities 516,242
Section 4 - Securities Outstanding
Securities outstanding 62,815
Subsitutability/ Financial Institution Infrastructure Indicators
Section 5 - Payments made in the reporting year (excluding intragroup paym
Payments activity 13,888,195
Section 6 - Assets Under Custody
Assets under custody -
Section 7 - Underwritten Transactions in Debt and Equity Markets
Underwriting activity -
Section 8 - Trading Volume
Treading volume 268,851
Complexity Indicators
Section 9 - Notional Amount of Over-the-Counter (OTC) Derivatives
OTC derivatives 112,339
Section 10 - Level 2 Assets
Level 2 assets 49
Section 11 - Trading and available for sale (AFS) securities
Trading and AFS securities 14,768
Section 12 - Cross-Jurisdictional Liabilities
Foreign Liabilities (excluding derivatives and intragroup liabilities)
Cross-jurisdictional liabilities 180,506
Section 13 - Cross-Jurisdictional Claims
Foreign claims (excluding derivatives and intragroup liabilities)
Cross-jurisdictional claims 25,271
357
Overview Leadership Insights Our Bank Our Strategy Our Performance
Stakeholder Outcomes Accountability Financial Reports Compliance Annexes Supplimentary Information
BANK OF CEYLON | ANNUAL REPORT 2021
SUPPLIMENTARY INFORMATIONGRI Index ........................................................................................................................................358
Independent Assurance Report - Sustainability ........................................................................361
Statement of Profit or Loss in USD .............................................................................................363
Statement of Comprehensive Income in USD ...........................................................................364
Statement of Financial Position in USD ......................................................................................365
Quarterly Performance ................................................................................................................366
Share and Debenture Information .............................................................................................369
Ten Year Statistical Summary – Bank .........................................................................................370
Subsidiaries and Associates ........................................................................................................372
Correspondent Relationships by Country .................................................................................374
Exchange Companies by Country ...............................................................................................380
Glossary of Financial/ Banking Terms ........................................................................................381
Corporate Offices and Overseas Branches ...............................................................................385
Corporate Information .................................................................................................................387

358
BANK OF CEYLON | ANNUAL REPORT 2021
GRI INDEX
GRI Standard Disclosure Location/Explanation Page number
GRI 101: Foundation 2016 (does not include any disclosures)General DisclosuresGRI 102: GeneralDisclosures 2016
102-1 Name of the Organisation About This Report 2102-2 Activities, brands, products and services Value Creatin Model 32
102-3 Location of headquarters Corporate Information 387102-4 Location of operations About Us 6102-5 Ownership and legal form Corporate Information 387102-6 Markets served About Us 6102-7 Scale of the organisation Performance Highlight 7102-8 Information on employees and other workers Our Employees 68102-9 Supply chain Business Partners 78102-10 Significant changes to the organisation and its supply chain
About This Report 3
102-11 Precautionary principle or approach About This Report 2102-12 External initiatives About This Report 3102-13 Membership of associations Business Partners 78102-14 Statement from senior decision maker Chairman’s Message 10-13102-16 Values, principles, norms and standards of behaviour
Corporate Governance 89-90
102-18 Governance Structure Corporate Governance 84102-40 List of stakeholder groups Our Approach to Integrated
Thinking4
102-41 Collective bargaining agreements Employees 70102-42 Identifying and selecting stakeholders Our Approach to Integrated
Thinking4
102-43 Approach to stakeholder engagement Stakeholder Outcomes 62-80102-44 Key topics and concerns raised Material Issues 39102-45 Entities included in the consolidated financial statements
Notes to the Financial Statements 140
102-46 Defining report content and topic boundary About This Report 2102-47 Material topics Material Issues 39-40102-48 Restatement of information About This Report 2102-49 Changes in reporting About This Report 2102-50 Reporting period About This Report 2102-51 Date of most recent report About This Report 2102-52 Reporting cycle About This Report 2102-53 Contact point for questions regarding Report About This Report 3102-54 Claims of reporting in accordance with GRI Standards
About This Report 3
102-55 GRI context index Supplementary Information 358-360102-56 External assurance External Assuarance statement -
Sustainability361-362
103 Management ApproachGRI 103:Management Approach
103-1 Explanation of material topics and its boundaries
Material Issues 39-40
103-2 The Management Approach and its components Stakeholder Outcomes 62-80103-3 Evaluation of the Management Approach Resource Allocation and Strategic
Outcomes44-46
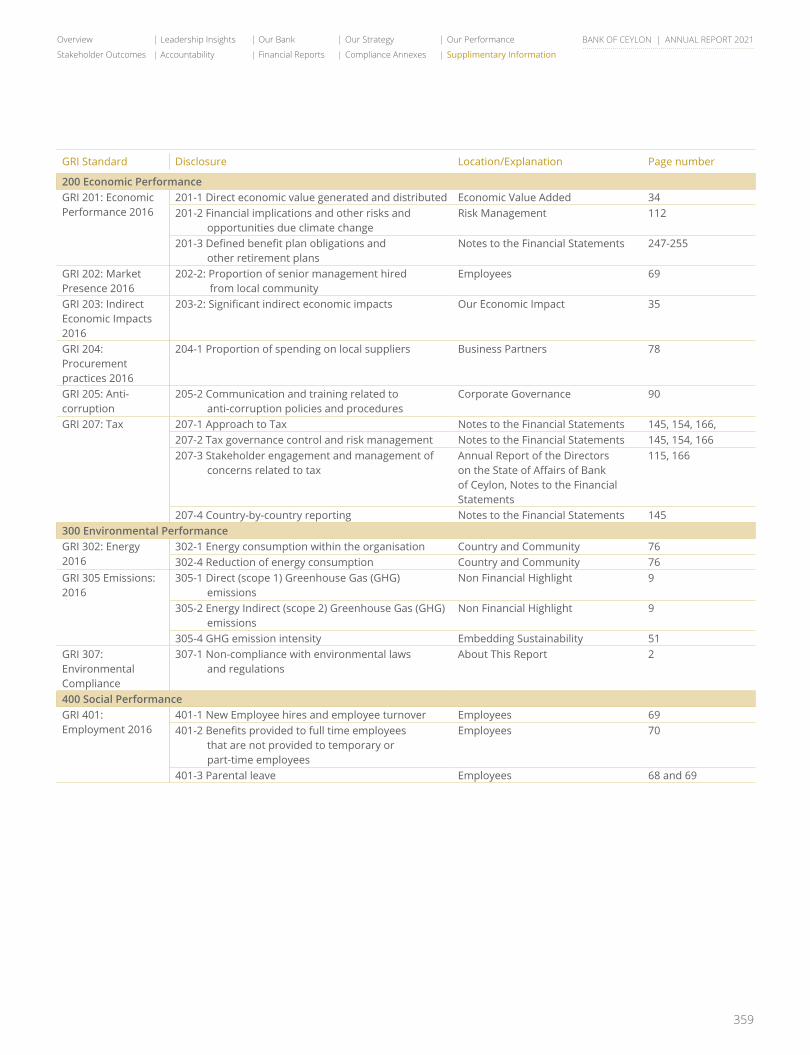
359
Overview Leadership Insights Our Bank Our Strategy Our Performance
Stakeholder Outcomes Accountability Financial Reports Compliance Annexes Supplimentary Information
BANK OF CEYLON | ANNUAL REPORT 2021
GRI Standard Disclosure Location/Explanation Page number
200 Economic PerformanceGRI 201: Economic Performance 2016
201-1 Direct economic value generated and distributed Economic Value Added 34201-2 Financial implications and other risks and opportunities due climate change
Risk Management 112
201-3 Defined benefit plan obligations and other retirement plans
Notes to the Financial Statements 247-255
GRI 202: MarketPresence 2016
202-2: Proportion of senior management hired from local community
Employees 69
GRI 203: Indirect Economic Impacts 2016
203-2: Significant indirect economic impacts Our Economic Impact 35
GRI 204:Procurement practices 2016
204-1 Proportion of spending on local suppliers Business Partners 78
GRI 205: Anti-corruption
205-2 Communication and training related to anti-corruption policies and procedures
Corporate Governance 90
GRI 207: Tax 207-1 Approach to Tax Notes to the Financial Statements 145, 154, 166,207-2 Tax governance control and risk management Notes to the Financial Statements 145, 154, 166207-3 Stakeholder engagement and management of concerns related to tax
Annual Report of the Directors on the State of Affairs of Bank of Ceylon, Notes to the Financial Statements
115, 166
207-4 Country-by-country reporting Notes to the Financial Statements 145300 Environmental PerformanceGRI 302: Energy 2016
302-1 Energy consumption within the organisation Country and Community 76302-4 Reduction of energy consumption Country and Community 76
GRI 305 Emissions: 2016
305-1 Direct (scope 1) Greenhouse Gas (GHG) emissions
Non Financial Highlight 9
305-2 Energy Indirect (scope 2) Greenhouse Gas (GHG) emissions
Non Financial Highlight 9
305-4 GHG emission intensity Embedding Sustainability 51GRI 307: Environmental Compliance
307-1 Non-compliance with environmental laws and regulations
About This Report 2
400 Social PerformanceGRI 401: Employment 2016
401-1 New Employee hires and employee turnover Employees 69401-2 Benefits provided to full time employees that are not provided to temporary or part-time employees
Employees 70
401-3 Parental leave Employees 68 and 69

360
BANK OF CEYLON | ANNUAL REPORT 2021
GRI INDEX
GRI Standard Disclosure Location/Explanation Page number
GRI 402: Labour Management Relations 2016
402-1 Minimum notice periods regarding operational changes
Employees 72
403: Occupational health and safety 2016
403-1 Occupational health and safety management system
Employees 71
403-2 Hazard identification, risk assessment and incident investigation
Employees, Corporate Governance Risk Management
71, 91, 111
403-3 Occupational health services Employees 71403-4 Worker participation, consultation, and communication on occupational health and safety
Employees 71
403-5 Worker training on occupational health and safety
Employees 71
403-6 Promotion of worker health Employees 71403-7 Prevention and mitigation of occupational health and safety impacts directly linked by business relationships
Employees 71
403-8 Workers covered by an occupational health and safety management system
Employees 70
GRI 404: Training and education
404-1 Average hours of training per year per employee Employees 72404-2 Programmes for upgrading skills and transition assistance programmes
Employees 71
404-3 Percentage of employees receiving regular performance and career development reviews
Employees 70
GRI 405: Diversity and equal opportunity 2016
405-2 Ratio of basic salary and remuneration of women to men
Employees 68
GRI 406: Non Discrimination
406-1 incidents of discrimination and corrective actions taken
Employees 70
GRI 407 Freedom of Association and Collection Bargaining
407-1 Operations and suppliers in which the right to freedom of association and collective bargaining may be at risk
Business Partners 78
GRI 408: Child Labour
408-1 Operations and suppliers at significant risk for incidents of child labour
Business Partners 78
GRI 409: Forced or Compulsory labour
409-1 Operations and suppliers at significant risk for incidents of forced or compulsory labour
Business Partners 78
GRI 413: Local communities 2016
413-1 Operations with local community engagement, impact assessments and development programmes
Country and Community 74
GRI 417: Marketing and labelling
417-1 Requirements for product and service labelling Delivering Value 67417-2 Incidents of non-compliance concerning product and service information and labelling
Customers 67
417-3 Incidents of non-compliance concerning marketing communications
Customers 67
GRI 418: Customer Privacy 2016
418-1 Total number of substantiated complaints regarding breaches of customer privacy and losses of customer data
Customers 67
GRI 419: Socio Economic Compliance
419-1 Non - Compliance with laws and regulations in the social and economic era
Annual Report of the Directors on the State of Affairs of Bank of Ceylon
118
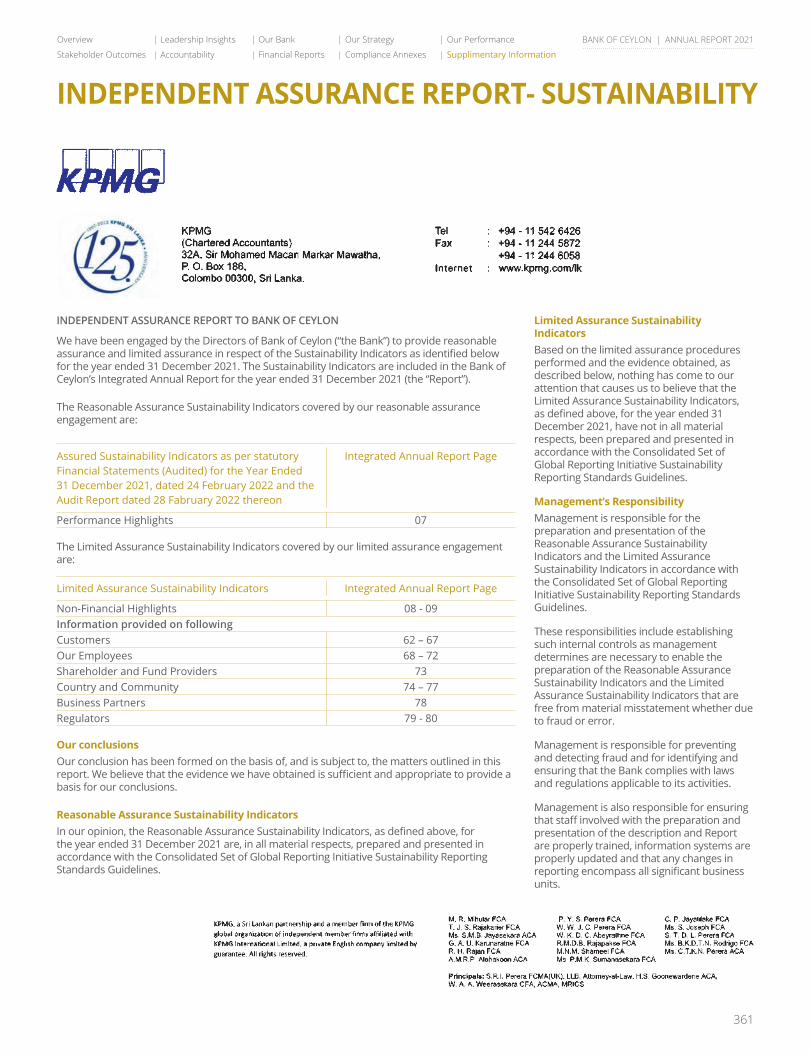
361
Overview Leadership Insights Our Bank Our Strategy Our Performance
Stakeholder Outcomes Accountability Financial Reports Compliance Annexes Supplimentary Information
BANK OF CEYLON | ANNUAL REPORT 2021
INDEPENDENT ASSURANCE REPORT- SUSTAINABILITY
INDEPENDENT ASSURANCE REPORT TO BANK OF CEYLON
We have been engaged by the Directors of Bank of Ceylon (“the Bank”) to provide reasonable assurance and limited assurance in respect of the Sustainability Indicators as identified below for the year ended 31 December 2021. The Sustainability Indicators are included in the Bank of Ceylon’s Integrated Annual Report for the year ended 31 December 2021 (the “Report”).
The Reasonable Assurance Sustainability Indicators covered by our reasonable assurance engagement are:
Assured Sustainability Indicators as per statutory Financial Statements (Audited) for the Year Ended 31 December 2021, dated 24 February 2022 and the Audit Report dated 28 Fabruary 2022 thereon
Integrated Annual Report Page
Performance Highlights 07
The Limited Assurance Sustainability Indicators covered by our limited assurance engagement are:
Limited Assurance Sustainability Indicators Integrated Annual Report Page
Non-Financial Highlights 08 - 09Information provided on followingCustomers 62 – 67Our Employees 68 – 72Shareholder and Fund Providers 73Country and Community 74 – 77Business Partners 78Regulators 79 - 80
Our conclusionsOur conclusion has been formed on the basis of, and is subject to, the matters outlined in this report. We believe that the evidence we have obtained is sufficient and appropriate to provide a basis for our conclusions.
Reasonable Assurance Sustainability IndicatorsIn our opinion, the Reasonable Assurance Sustainability Indicators, as defined above, for the year ended 31 December 2021 are, in all material respects, prepared and presented in accordance with the Consolidated Set of Global Reporting Initiative Sustainability Reporting Standards Guidelines.
Limited Assurance Sustainability IndicatorsBased on the limited assurance procedures performed and the evidence obtained, as described below, nothing has come to our attention that causes us to believe that the Limited Assurance Sustainability Indicators, as defined above, for the year ended 31 December 2021, have not in all material respects, been prepared and presented in accordance with the Consolidated Set of Global Reporting Initiative Sustainability Reporting Standards Guidelines.
Management’s Responsibility Management is responsible for the preparation and presentation of the Reasonable Assurance Sustainability Indicators and the Limited Assurance Sustainability Indicators in accordance with the Consolidated Set of Global Reporting Initiative Sustainability Reporting Standards Guidelines.
These responsibilities include establishing such internal controls as management determines are necessary to enable the preparation of the Reasonable Assurance Sustainability Indicators and the Limited Assurance Sustainability Indicators that are free from material misstatement whether due to fraud or error.
Management is responsible for preventing and detecting fraud and for identifying and ensuring that the Bank complies with laws and regulations applicable to its activities.
Management is also responsible for ensuring that staff involved with the preparation and presentation of the description and Report are properly trained, information systems are properly updated and that any changes in reporting encompass all significant business units.
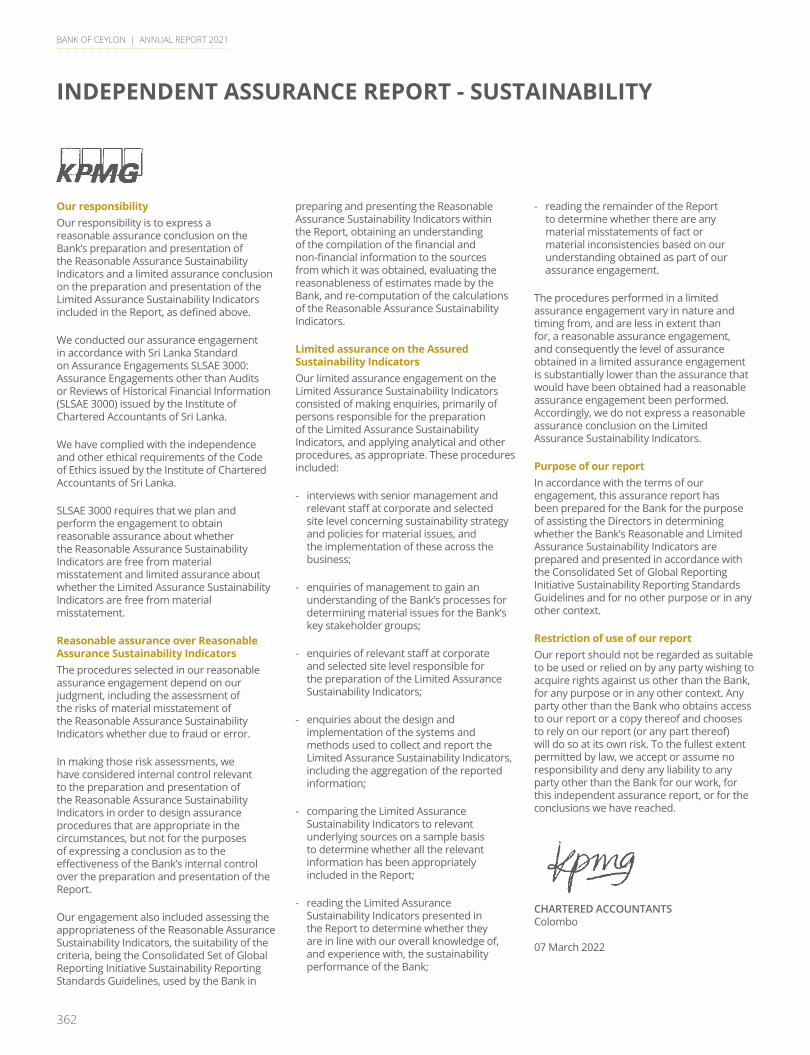
362
BANK OF CEYLON | ANNUAL REPORT 2021
INDEPENDENT ASSURANCE REPORT - SUSTAINABILITY
Our responsibilityOur responsibility is to express a reasonable assurance conclusion on the Bank’s preparation and presentation of the Reasonable Assurance Sustainability Indicators and a limited assurance conclusion on the preparation and presentation of the Limited Assurance Sustainability Indicators included in the Report, as defined above.
We conducted our assurance engagement in accordance with Sri Lanka Standard on Assurance Engagements SLSAE 3000: Assurance Engagements other than Audits or Reviews of Historical Financial Information (SLSAE 3000) issued by the Institute of Chartered Accountants of Sri Lanka.
We have complied with the independence and other ethical requirements of the Code of Ethics issued by the Institute of Chartered Accountants of Sri Lanka.
SLSAE 3000 requires that we plan and perform the engagement to obtain reasonable assurance about whether the Reasonable Assurance Sustainability Indicators are free from material misstatement and limited assurance about whether the Limited Assurance Sustainability Indicators are free from material misstatement.
Reasonable assurance over Reasonable Assurance Sustainability IndicatorsThe procedures selected in our reasonable assurance engagement depend on our judgment, including the assessment of the risks of material misstatement of the Reasonable Assurance Sustainability Indicators whether due to fraud or error.
In making those risk assessments, we have considered internal control relevant to the preparation and presentation of the Reasonable Assurance Sustainability Indicators in order to design assurance procedures that are appropriate in the circumstances, but not for the purposes of expressing a conclusion as to the effectiveness of the Bank’s internal control over the preparation and presentation of the Report.
Our engagement also included assessing the appropriateness of the Reasonable Assurance Sustainability Indicators, the suitability of the criteria, being the Consolidated Set of Global Reporting Initiative Sustainability Reporting Standards Guidelines, used by the Bank in
preparing and presenting the Reasonable Assurance Sustainability Indicators within the Report, obtaining an understanding of the compilation of the financial and non-financial information to the sources from which it was obtained, evaluating the reasonableness of estimates made by the Bank, and re-computation of the calculations of the Reasonable Assurance Sustainability Indicators.
Limited assurance on the Assured Sustainability IndicatorsOur limited assurance engagement on the Limited Assurance Sustainability Indicators consisted of making enquiries, primarily of persons responsible for the preparation of the Limited Assurance Sustainability Indicators, and applying analytical and other procedures, as appropriate. These procedures included:
- interviews with senior management and relevant staff at corporate and selected site level concerning sustainability strategy and policies for material issues, and the implementation of these across the business;
- enquiries of management to gain an understanding of the Bank’s processes for determining material issues for the Bank’s key stakeholder groups;
- enquiries of relevant staff at corporate and selected site level responsible for the preparation of the Limited Assurance Sustainability Indicators;
- enquiries about the design and implementation of the systems and methods used to collect and report the Limited Assurance Sustainability Indicators, including the aggregation of the reported information;
- comparing the Limited Assurance Sustainability Indicators to relevant underlying sources on a sample basis to determine whether all the relevant information has been appropriately included in the Report;
- reading the Limited Assurance Sustainability Indicators presented in the Report to determine whether they are in line with our overall knowledge of, and experience with, the sustainability performance of the Bank;
- reading the remainder of the Report to determine whether there are any material misstatements of fact or material inconsistencies based on our understanding obtained as part of our assurance engagement.
The procedures performed in a limited assurance engagement vary in nature and timing from, and are less in extent than for, a reasonable assurance engagement, and consequently the level of assurance obtained in a limited assurance engagement is substantially lower than the assurance that would have been obtained had a reasonable assurance engagement been performed. Accordingly, we do not express a reasonable assurance conclusion on the Limited Assurance Sustainability Indicators.
Purpose of our reportIn accordance with the terms of our engagement, this assurance report has been prepared for the Bank for the purpose of assisting the Directors in determining whether the Bank’s Reasonable and Limited Assurance Sustainability Indicators are prepared and presented in accordance with the Consolidated Set of Global Reporting Initiative Sustainability Reporting Standards Guidelines and for no other purpose or in any other context.
Restriction of use of our reportOur report should not be regarded as suitable to be used or relied on by any party wishing to acquire rights against us other than the Bank, for any purpose or in any other context. Any party other than the Bank who obtains access to our report or a copy thereof and chooses to rely on our report (or any part thereof) will do so at its own risk. To the fullest extent permitted by law, we accept or assume no responsibility and deny any liability to any party other than the Bank for our work, for this independent assurance report, or for the conclusions we have reached.
CHARTERED ACCOUNTANTSColombo
07 March 2022
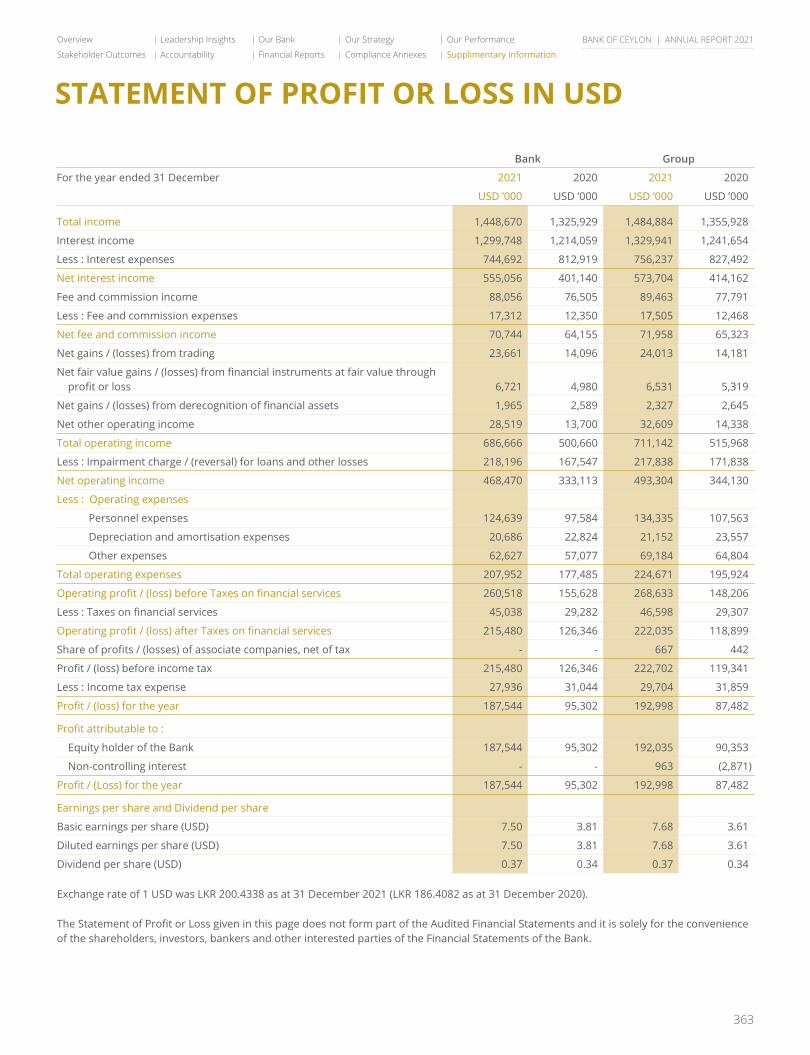
363
Overview Leadership Insights Our Bank Our Strategy Our Performance
Stakeholder Outcomes Accountability Financial Reports Compliance Annexes Supplimentary Information
BANK OF CEYLON | ANNUAL REPORT 2021
STATEMENT OF PROFIT OR LOSS IN USD
Bank Group
For the year ended 31 December 2021 2020 2021 2020
USD ’000 USD ’000 USD ’000 USD ’000
Total income 1,448,670 1,325,929 1,484,884 1,355,928
Interest income 1,299,748 1,214,059 1,329,941 1,241,654
Less : Interest expenses 744,692 812,919 756,237 827,492
Net interest income 555,056 401,140 573,704 414,162
Fee and commission income 88,056 76,505 89,463 77,791
Less : Fee and commission expenses 17,312 12,350 17,505 12,468
Net fee and commission income 70,744 64,155 71,958 65,323
Net gains / (losses) from trading 23,661 14,096 24,013 14,181
Net fair value gains / (losses) from financial instruments at fair value through profit or loss 6,721 4,980 6,531 5,319
Net gains / (losses) from derecognition of financial assets 1,965 2,589 2,327 2,645
Net other operating income 28,519 13,700 32,609 14,338
Total operating income 686,666 500,660 711,142 515,968
Less : Impairment charge / (reversal) for loans and other losses 218,196 167,547 217,838 171,838
Net operating income 468,470 333,113 493,304 344,130
Less : Operating expenses
Personnel expenses 124,639 97,584 134,335 107,563
Depreciation and amortisation expenses 20,686 22,824 21,152 23,557
Other expenses 62,627 57,077 69,184 64,804
Total operating expenses 207,952 177,485 224,671 195,924
Operating profit / (loss) before Taxes on financial services 260,518 155,628 268,633 148,206
Less : Taxes on financial services 45,038 29,282 46,598 29,307
Operating profit / (loss) after Taxes on financial services 215,480 126,346 222,035 118,899
Share of profits / (losses) of associate companies, net of tax - - 667 442
Profit / (loss) before income tax 215,480 126,346 222,702 119,341
Less : Income tax expense 27,936 31,044 29,704 31,859
Profit / (loss) for the year 187,544 95,302 192,998 87,482
Profit attributable to :
Equity holder of the Bank 187,544 95,302 192,035 90,353
Non-controlling interest - - 963 (2,871)
Profit / (Loss) for the year 187,544 95,302 192,998 87,482
Earnings per share and Dividend per share
Basic earnings per share (USD) 7.50 3.81 7.68 3.61
Diluted earnings per share (USD) 7.50 3.81 7.68 3.61
Dividend per share (USD) 0.37 0.34 0.37 0.34
Exchange rate of 1 USD was LKR 200.4338 as at 31 December 2021 (LKR 186.4082 as at 31 December 2020).
The Statement of Profit or Loss given in this page does not form part of the Audited Financial Statements and it is solely for the convenience of the shareholders, investors, bankers and other interested parties of the Financial Statements of the Bank.
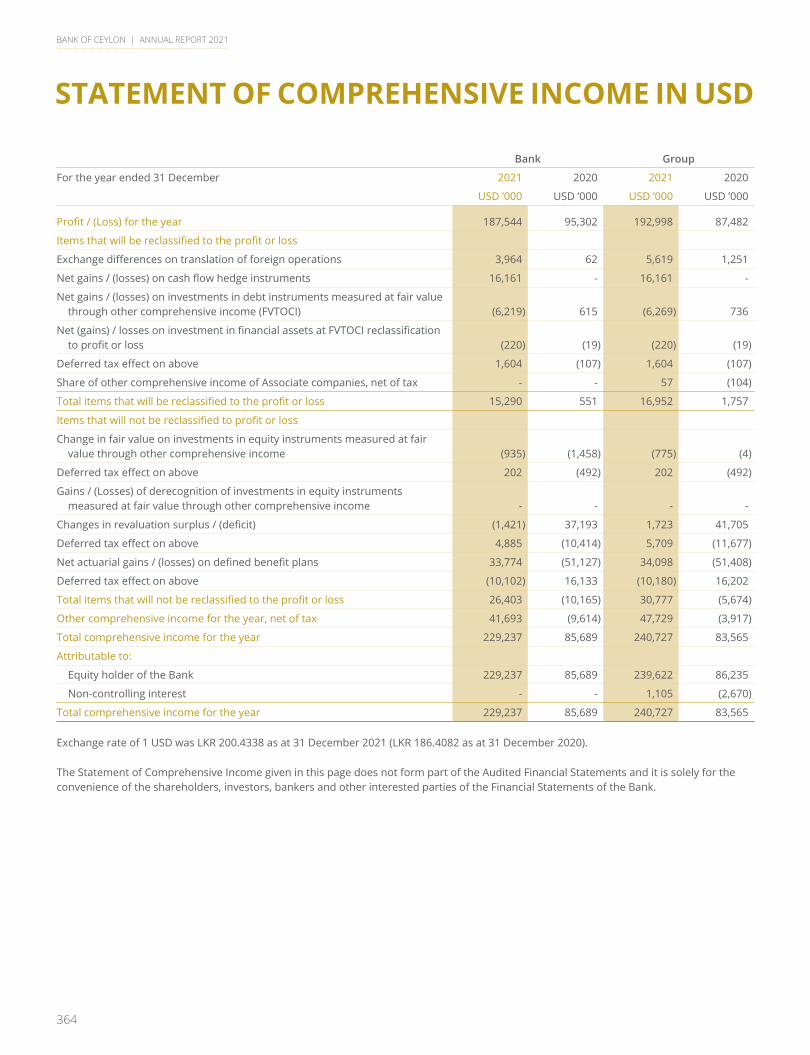
364
BANK OF CEYLON | ANNUAL REPORT 2021
STATEMENT OF COMPREHENSIVE INCOME IN USD
Bank Group
For the year ended 31 December 2021 2020 2021 2020
USD ’000 USD ’000 USD ’000 USD ’000
Profit / (Loss) for the year 187,544 95,302 192,998 87,482
Items that will be reclassified to the profit or loss
Exchange differences on translation of foreign operations 3,964 62 5,619 1,251
Net gains / (losses) on cash flow hedge instruments 16,161 - 16,161 -
Net gains / (losses) on investments in debt instruments measured at fair value through other comprehensive income (FVTOCI) (6,219) 615 (6,269) 736
Net (gains) / losses on investment in financial assets at FVTOCI reclassification to profit or loss (220) (19) (220) (19)
Deferred tax effect on above 1,604 (107) 1,604 (107)
Share of other comprehensive income of Associate companies, net of tax - - 57 (104)
Total items that will be reclassified to the profit or loss 15,290 551 16,952 1,757
Items that will not be reclassified to profit or loss
Change in fair value on investments in equity instruments measured at fair value through other comprehensive income (935) (1,458) (775) (4)
Deferred tax effect on above 202 (492) 202 (492)
Gains / (Losses) of derecognition of investments in equity instruments measured at fair value through other comprehensive income - - - -
Changes in revaluation surplus / (deficit) (1,421) 37,193 1,723 41,705
Deferred tax effect on above 4,885 (10,414) 5,709 (11,677)
Net actuarial gains / (losses) on defined benefit plans 33,774 (51,127) 34,098 (51,408)
Deferred tax effect on above (10,102) 16,133 (10,180) 16,202
Total items that will not be reclassified to the profit or loss 26,403 (10,165) 30,777 (5,674)
Other comprehensive income for the year, net of tax 41,693 (9,614) 47,729 (3,917)
Total comprehensive income for the year 229,237 85,689 240,727 83,565
Attributable to:
Equity holder of the Bank 229,237 85,689 239,622 86,235
Non-controlling interest - - 1,105 (2,670)
Total comprehensive income for the year 229,237 85,689 240,727 83,565
Exchange rate of 1 USD was LKR 200.4338 as at 31 December 2021 (LKR 186.4082 as at 31 December 2020).
The Statement of Comprehensive Income given in this page does not form part of the Audited Financial Statements and it is solely for the convenience of the shareholders, investors, bankers and other interested parties of the Financial Statements of the Bank.
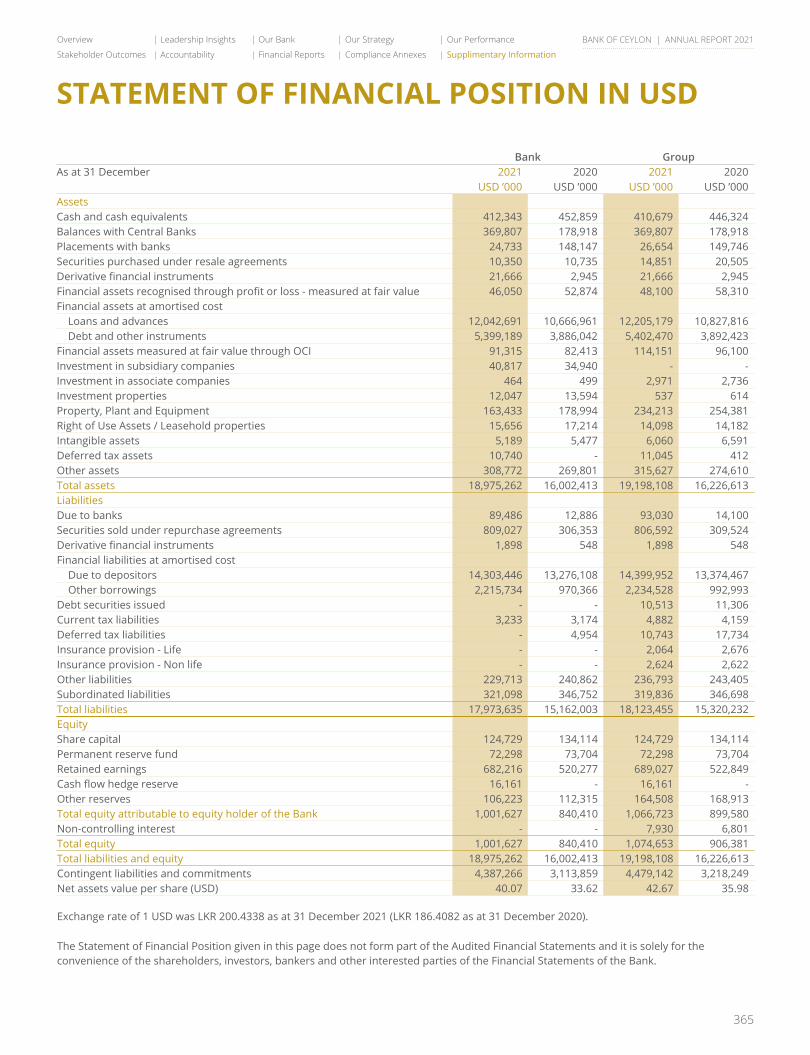
365
Overview Leadership Insights Our Bank Our Strategy Our Performance
Stakeholder Outcomes Accountability Financial Reports Compliance Annexes Supplimentary Information
BANK OF CEYLON | ANNUAL REPORT 2021
STATEMENT OF FINANCIAL POSITION IN USD
Bank GroupAs at 31 December 2021 2020 2021 2020
USD ’000 USD ’000 USD ’000 USD ’000AssetsCash and cash equivalents 412,343 452,859 410,679 446,324Balances with Central Banks 369,807 178,918 369,807 178,918Placements with banks 24,733 148,147 26,654 149,746Securities purchased under resale agreements 10,350 10,735 14,851 20,505Derivative financial instruments 21,666 2,945 21,666 2,945Financial assets recognised through profit or loss - measured at fair value 46,050 52,874 48,100 58,310Financial assets at amortised cost
Loans and advances 12,042,691 10,666,961 12,205,179 10,827,816Debt and other instruments 5,399,189 3,886,042 5,402,470 3,892,423
Financial assets measured at fair value through OCI 91,315 82,413 114,151 96,100Investment in subsidiary companies 40,817 34,940 - -Investment in associate companies 464 499 2,971 2,736Investment properties 12,047 13,594 537 614Property, Plant and Equipment 163,433 178,994 234,213 254,381Right of Use Assets / Leasehold properties 15,656 17,214 14,098 14,182Intangible assets 5,189 5,477 6,060 6,591Deferred tax assets 10,740 - 11,045 412Other assets 308,772 269,801 315,627 274,610Total assets 18,975,262 16,002,413 19,198,108 16,226,613LiabilitiesDue to banks 89,486 12,886 93,030 14,100Securities sold under repurchase agreements 809,027 306,353 806,592 309,524Derivative financial instruments 1,898 548 1,898 548Financial liabilities at amortised cost
Due to depositors 14,303,446 13,276,108 14,399,952 13,374,467Other borrowings 2,215,734 970,366 2,234,528 992,993
Debt securities issued - - 10,513 11,306Current tax liabilities 3,233 3,174 4,882 4,159Deferred tax liabilities - 4,954 10,743 17,734Insurance provision - Life - - 2,064 2,676Insurance provision - Non life - - 2,624 2,622Other liabilities 229,713 240,862 236,793 243,405Subordinated liabilities 321,098 346,752 319,836 346,698Total liabilities 17,973,635 15,162,003 18,123,455 15,320,232EquityShare capital 124,729 134,114 124,729 134,114Permanent reserve fund 72,298 73,704 72,298 73,704Retained earnings 682,216 520,277 689,027 522,849Cash flow hedge reserve 16,161 - 16,161 -Other reserves 106,223 112,315 164,508 168,913Total equity attributable to equity holder of the Bank 1,001,627 840,410 1,066,723 899,580Non-controlling interest - - 7,930 6,801Total equity 1,001,627 840,410 1,074,653 906,381Total liabilities and equity 18,975,262 16,002,413 19,198,108 16,226,613Contingent liabilities and commitments 4,387,266 3,113,859 4,479,142 3,218,249Net assets value per share (USD) 40.07 33.62 42.67 35.98
Exchange rate of 1 USD was LKR 200.4338 as at 31 December 2021 (LKR 186.4082 as at 31 December 2020).
The Statement of Financial Position given in this page does not form part of the Audited Financial Statements and it is solely for the convenience of the shareholders, investors, bankers and other interested parties of the Financial Statements of the Bank.
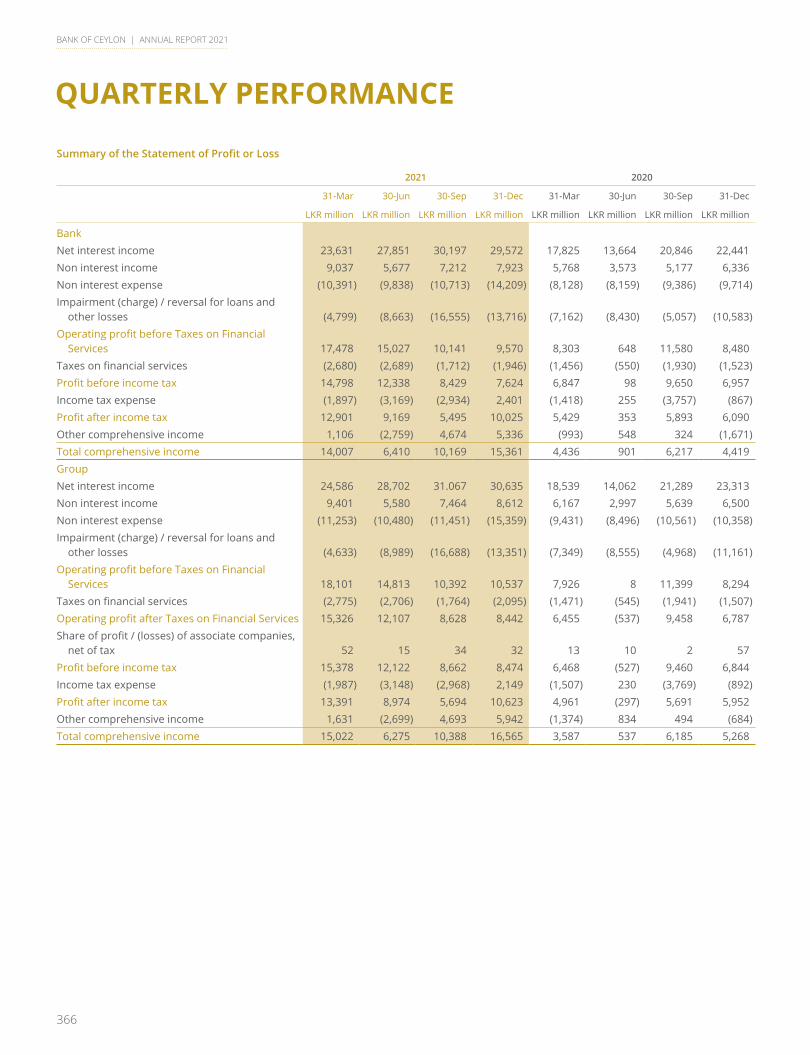
366
BANK OF CEYLON | ANNUAL REPORT 2021
QUARTERLY PERFORMANCE
SummaryoftheStatementofProfitorLoss
2021 2020
31-Mar 30-Jun 30-Sep 31-Dec 31-Mar 30-Jun 30-Sep 31-Dec
LKR million LKR million LKR million LKR million LKR million LKR million LKR million LKR million
BankNet interest income 23,631 27,851 30,197 29,572 17,825 13,664 20,846 22,441Non interest income 9,037 5,677 7,212 7,923 5,768 3,573 5,177 6,336Non interest expense (10,391) (9,838) (10,713) (14,209) (8,128) (8,159) (9,386) (9,714)Impairment (charge) / reversal for loans and
other losses (4,799) (8,663) (16,555) (13,716) (7,162) (8,430) (5,057) (10,583)Operating profit before Taxes on Financial
Services 17,478 15,027 10,141 9,570 8,303 648 11,580 8,480Taxes on financial services (2,680) (2,689) (1,712) (1,946) (1,456) (550) (1,930) (1,523)Profit before income tax 14,798 12,338 8,429 7,624 6,847 98 9,650 6,957Income tax expense (1,897) (3,169) (2,934) 2,401 (1,418) 255 (3,757) (867)Profit after income tax 12,901 9,169 5,495 10,025 5,429 353 5,893 6,090Other comprehensive income 1,106 (2,759) 4,674 5,336 (993) 548 324 (1,671)Total comprehensive income 14,007 6,410 10,169 15,361 4,436 901 6,217 4,419GroupNet interest income 24,586 28,702 31.067 30,635 18,539 14,062 21,289 23,313Non interest income 9,401 5,580 7,464 8,612 6,167 2,997 5,639 6,500Non interest expense (11,253) (10,480) (11,451) (15,359) (9,431) (8,496) (10,561) (10,358)Impairment (charge) / reversal for loans and
other losses (4,633) (8,989) (16,688) (13,351) (7,349) (8,555) (4,968) (11,161)Operating profit before Taxes on Financial
Services 18,101 14,813 10,392 10,537 7,926 8 11,399 8,294Taxes on financial services (2,775) (2,706) (1,764) (2,095) (1,471) (545) (1,941) (1,507)Operating profit after Taxes on Financial Services 15,326 12,107 8,628 8,442 6,455 (537) 9,458 6,787Share of profit / (losses) of associate companies,
net of tax 52 15 34 32 13 10 2 57Profit before income tax 15,378 12,122 8,662 8,474 6,468 (527) 9,460 6,844Income tax expense (1,987) (3,148) (2,968) 2,149 (1,507) 230 (3,769) (892)Profit after income tax 13,391 8,974 5,694 10,623 4,961 (297) 5,691 5,952Other comprehensive income 1,631 (2,699) 4,693 5,942 (1,374) 834 494 (684)Total comprehensive income 15,022 6,275 10,388 16,565 3,587 537 6,185 5,268
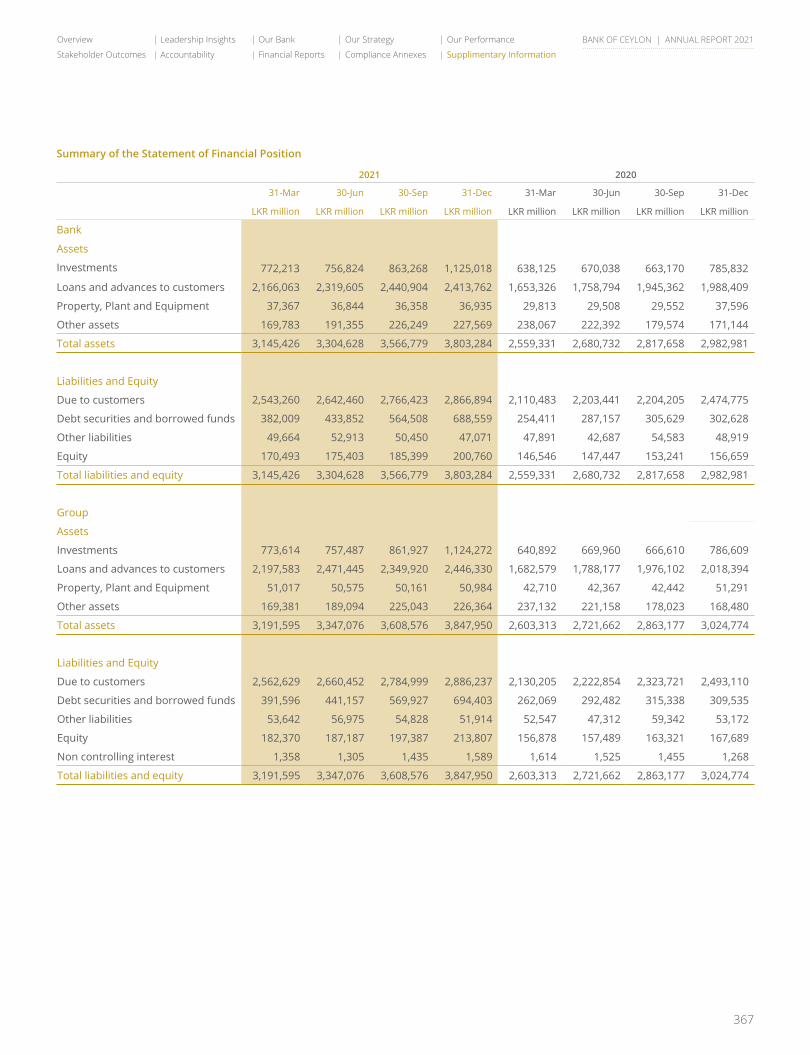
367
Overview Leadership Insights Our Bank Our Strategy Our Performance
Stakeholder Outcomes Accountability Financial Reports Compliance Annexes Supplimentary Information
BANK OF CEYLON | ANNUAL REPORT 2021
Summary of the Statement of Financial Position
2021 2020
31-Mar 30-Jun 30-Sep 31-Dec 31-Mar 30-Jun 30-Sep 31-Dec
LKR million LKR million LKR million LKR million LKR million LKR million LKR million LKR million
Bank
Assets
Investments 772,213 756,824 863,268 1,125,018 638,125 670,038 663,170 785,832
Loans and advances to customers 2,166,063 2,319,605 2,440,904 2,413,762 1,653,326 1,758,794 1,945,362 1,988,409
Property, Plant and Equipment 37,367 36,844 36,358 36,935 29,813 29,508 29,552 37,596
Other assets 169,783 191,355 226,249 227,569 238,067 222,392 179,574 171,144
Total assets 3,145,426 3,304,628 3,566,779 3,803,284 2,559,331 2,680,732 2,817,658 2,982,981
Liabilities and Equity
Due to customers 2,543,260 2,642,460 2,766,423 2,866,894 2,110,483 2,203,441 2,204,205 2,474,775
Debt securities and borrowed funds 382,009 433,852 564,508 688,559 254,411 287,157 305,629 302,628
Other liabilities 49,664 52,913 50,450 47,071 47,891 42,687 54,583 48,919
Equity 170,493 175,403 185,399 200,760 146,546 147,447 153,241 156,659
Total liabilities and equity 3,145,426 3,304,628 3,566,779 3,803,284 2,559,331 2,680,732 2,817,658 2,982,981
Group
Assets
Investments 773,614 757,487 861,927 1,124,272 640,892 669,960 666,610 786,609
Loans and advances to customers 2,197,583 2,471,445 2,349,920 2,446,330 1,682,579 1,788,177 1,976,102 2,018,394
Property, Plant and Equipment 51,017 50,575 50,161 50,984 42,710 42,367 42,442 51,291
Other assets 169,381 189,094 225,043 226,364 237,132 221,158 178,023 168,480
Total assets 3,191,595 3,347,076 3,608,576 3,847,950 2,603,313 2,721,662 2,863,177 3,024,774
Liabilities and Equity
Due to customers 2,562,629 2,660,452 2,784,999 2,886,237 2,130,205 2,222,854 2,323,721 2,493,110
Debt securities and borrowed funds 391,596 441,157 569,927 694,403 262,069 292,482 315,338 309,535
Other liabilities 53,642 56,975 54,828 51,914 52,547 47,312 59,342 53,172
Equity 182,370 187,187 197,387 213,807 156,878 157,489 163,321 167,689
Non controlling interest 1,358 1,305 1,435 1,589 1,614 1,525 1,455 1,268
Total liabilities and equity 3,191,595 3,347,076 3,608,576 3,847,950 2,603,313 2,721,662 2,863,177 3,024,774
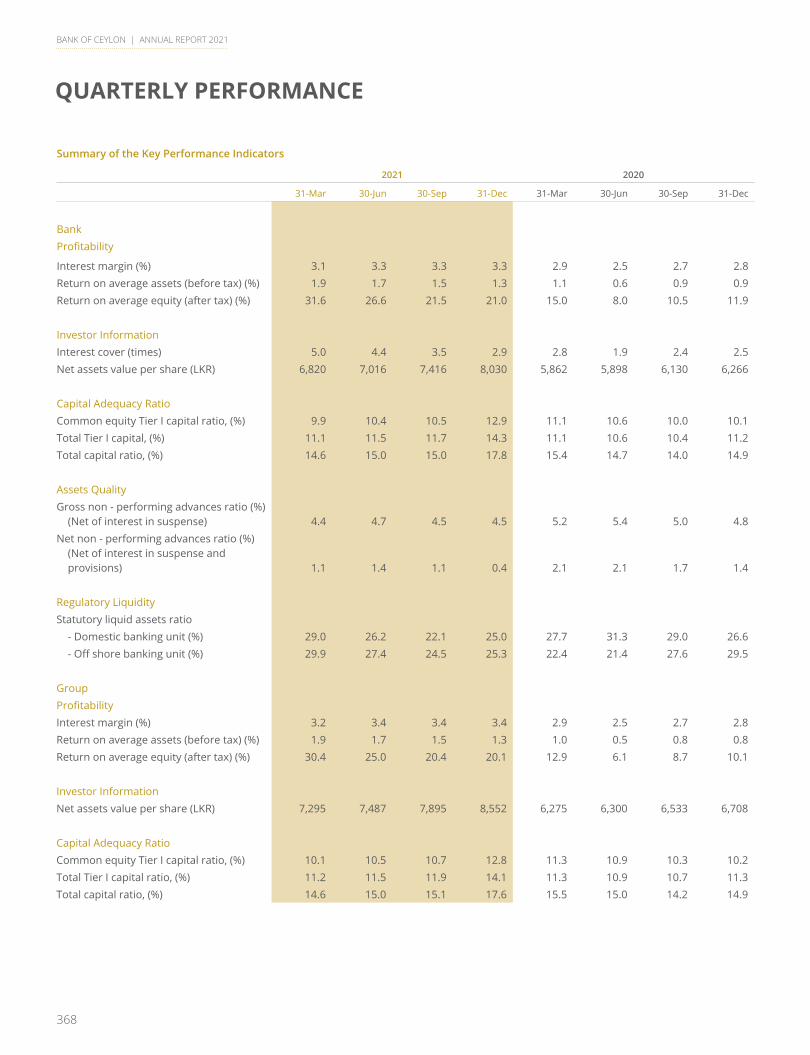
368
BANK OF CEYLON | ANNUAL REPORT 2021
QUARTERLY PERFORMANCE
Summary of the Key Performance Indicators
2021 2020
31-Mar 30-Jun 30-Sep 31-Dec 31-Mar 30-Jun 30-Sep 31-Dec
BankProfitability
Interest margin (%) 3.1 3.3 3.3 3.3 2.9 2.5 2.7 2.8Return on average assets (before tax) (%) 1.9 1.7 1.5 1.3 1.1 0.6 0.9 0.9Return on average equity (after tax) (%) 31.6 26.6 21.5 21.0 15.0 8.0 10.5 11.9
Investor InformationInterest cover (times) 5.0 4.4 3.5 2.9 2.8 1.9 2.4 2.5Net assets value per share (LKR) 6,820 7,016 7,416 8,030 5,862 5,898 6,130 6,266
Capital Adequacy RatioCommon equity Tier I capital ratio, (%) 9.9 10.4 10.5 12.9 11.1 10.6 10.0 10.1Total Tier I capital, (%) 11.1 11.5 11.7 14.3 11.1 10.6 10.4 11.2Total capital ratio, (%) 14.6 15.0 15.0 17.8 15.4 14.7 14.0 14.9
Assets QualityGross non - performing advances ratio (%)
(Net of interest in suspense) 4.4 4.7 4.5 4.5 5.2 5.4 5.0 4.8Net non - performing advances ratio (%)
(Net of interest in suspense and provisions) 1.1 1.4 1.1 0.4 2.1 2.1 1.7 1.4
Regulatory LiquidityStatutory liquid assets ratio - Domestic banking unit (%) 29.0 26.2 22.1 25.0 27.7 31.3 29.0 26.6 - Off shore banking unit (%) 29.9 27.4 24.5 25.3 22.4 21.4 27.6 29.5
GroupProfitabilityInterest margin (%) 3.2 3.4 3.4 3.4 2.9 2.5 2.7 2.8Return on average assets (before tax) (%) 1.9 1.7 1.5 1.3 1.0 0.5 0.8 0.8Return on average equity (after tax) (%) 30.4 25.0 20.4 20.1 12.9 6.1 8.7 10.1
Investor InformationNet assets value per share (LKR) 7,295 7,487 7,895 8,552 6,275 6,300 6,533 6,708
Capital Adequacy RatioCommon equity Tier I capital ratio, (%) 10.1 10.5 10.7 12.8 11.3 10.9 10.3 10.2Total Tier I capital ratio, (%) 11.2 11.5 11.9 14.1 11.3 10.9 10.7 11.3Total capital ratio, (%) 14.6 15.0 15.1 17.6 15.5 15.0 14.2 14.9
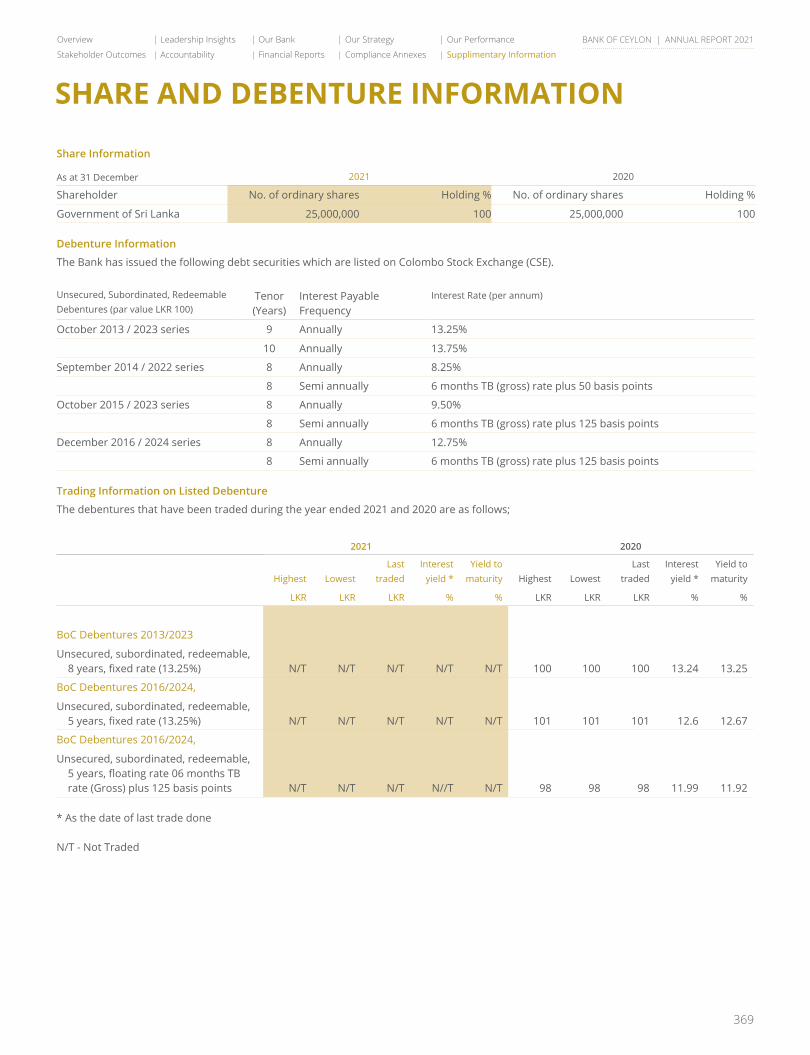
369
Overview Leadership Insights Our Bank Our Strategy Our Performance
Stakeholder Outcomes Accountability Financial Reports Compliance Annexes Supplimentary Information
BANK OF CEYLON | ANNUAL REPORT 2021
SHARE AND DEBENTURE INFORMATION
Share Information
As at 31 December 2021 2020
Shareholder No. of ordinary shares Holding % No. of ordinary shares Holding %
Government of Sri Lanka 25,000,000 100 25,000,000 100
Debenture Information
The Bank has issued the following debt securities which are listed on Colombo Stock Exchange (CSE).
Unsecured, Subordinated, Redeemable Debentures (par value LKR 100)
Tenor (Years)
Interest Payable Frequency
Interest Rate (per annum)
October 2013 / 2023 series 9 Annually 13.25%
10 Annually 13.75%
September 2014 / 2022 series 8 Annually 8.25%
8 Semi annually 6 months TB (gross) rate plus 50 basis points
October 2015 / 2023 series 8 Annually 9.50%
8 Semi annually 6 months TB (gross) rate plus 125 basis points
December 2016 / 2024 series 8 Annually 12.75%
8 Semi annually 6 months TB (gross) rate plus 125 basis points
Trading Information on Listed Debenture
The debentures that have been traded during the year ended 2021 and 2020 are as follows;
2021 2020
Highest LowestLast
tradedInterest
yield *Yield to
maturity Highest LowestLast
tradedInterest
yield *Yield to
maturity
LKR LKR LKR % % LKR LKR LKR % %
BoC Debentures 2013/2023
Unsecured, subordinated, redeemable, 8 years, fixed rate (13.25%) N/T N/T N/T N/T N/T 100 100 100 13.24 13.25
BoC Debentures 2016/2024,
Unsecured, subordinated, redeemable, 5 years, fixed rate (13.25%) N/T N/T N/T N/T N/T 101 101 101 12.6 12.67
BoC Debentures 2016/2024,
Unsecured, subordinated, redeemable, 5 years, floating rate 06 months TB rate (Gross) plus 125 basis points N/T N/T N/T N//T N/T 98 98 98 11.99 11.92
* As the date of last trade done
N/T - Not Traded
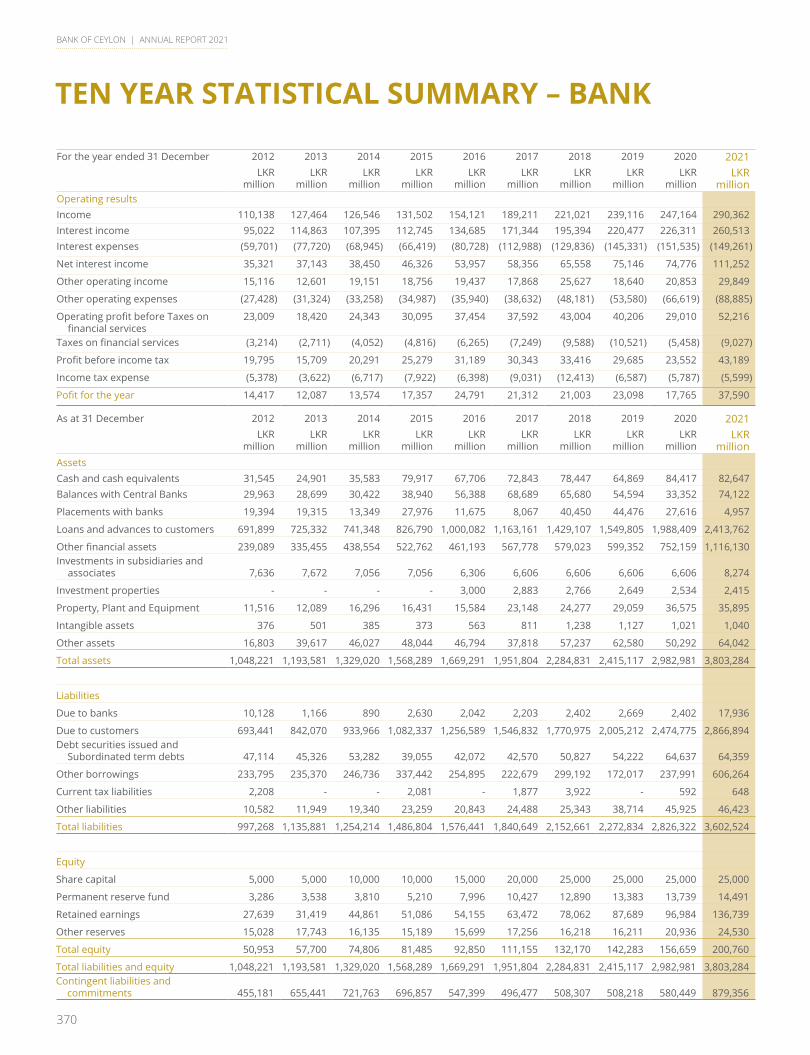
370
BANK OF CEYLON | ANNUAL REPORT 2021
TEN YEAR STATISTICAL SUMMARY – BANK
For the year ended 31 December 2012 2013 2014 2015 2016 2017 2018 2019 2020 2021LKR
million LKR
million LKR
million LKR
million LKR
million LKR
million LKR
million LKR
million LKR
million LKR
million Operating resultsIncome 110,138 127,464 126,546 131,502 154,121 189,211 221,021 239,116 247,164 290,362Interest income 95,022 114,863 107,395 112,745 134,685 171,344 195,394 220,477 226,311 260,513Interest expenses (59,701) (77,720) (68,945) (66,419) (80,728) (112,988) (129,836) (145,331) (151,535) (149,261)
Net interest income 35,321 37,143 38,450 46,326 53,957 58,356 65,558 75,146 74,776 111,252
Other operating income 15,116 12,601 19,151 18,756 19,437 17,868 25,627 18,640 20,853 29,849
Other operating expenses (27,428) (31,324) (33,258) (34,987) (35,940) (38,632) (48,181) (53,580) (66,619) (88,885)
Operating profit before Taxes on financial services
23,009 18,420 24,343 30,095 37,454 37,592 43,004 40,206 29,010 52,216
Taxes on financial services (3,214) (2,711) (4,052) (4,816) (6,265) (7,249) (9,588) (10,521) (5,458) (9,027)
Profit before income tax 19,795 15,709 20,291 25,279 31,189 30,343 33,416 29,685 23,552 43,189
Income tax expense (5,378) (3,622) (6,717) (7,922) (6,398) (9,031) (12,413) (6,587) (5,787) (5,599)
Pofit for the year 14,417 12,087 13,574 17,357 24,791 21,312 21,003 23,098 17,765 37,590
As at 31 December 2012 2013 2014 2015 2016 2017 2018 2019 2020 2021LKR
million LKR
million LKR
million LKR
million LKR
million LKR
million LKR
million LKR
million LKR
million LKR
million AssetsCash and cash equivalents 31,545 24,901 35,583 79,917 67,706 72,843 78,447 64,869 84,417 82,647Balances with Central Banks 29,963 28,699 30,422 38,940 56,388 68,689 65,680 54,594 33,352 74,122
Placements with banks 19,394 19,315 13,349 27,976 11,675 8,067 40,450 44,476 27,616 4,957
Loans and advances to customers 691,899 725,332 741,348 826,790 1,000,082 1,163,161 1,429,107 1,549,805 1,988,409 2,413,762
Other financial assets 239,089 335,455 438,554 522,762 461,193 567,778 579,023 599,352 752,159 1,116,130Investments in subsidiaries and
associates 7,636 7,672 7,056 7,056 6,306 6,606 6,606 6,606 6,606 8,274
Investment properties - - - - 3,000 2,883 2,766 2,649 2,534 2,415
Property, Plant and Equipment 11,516 12,089 16,296 16,431 15,584 23,148 24,277 29,059 36,575 35,895
Intangible assets 376 501 385 373 563 811 1,238 1,127 1,021 1,040
Other assets 16,803 39,617 46,027 48,044 46,794 37,818 57,237 62,580 50,292 64,042
Total assets 1,048,221 1,193,581 1,329,020 1,568,289 1,669,291 1,951,804 2,284,831 2,415,117 2,982,981 3,803,284
Liabilities
Due to banks 10,128 1,166 890 2,630 2,042 2,203 2,402 2,669 2,402 17,936
Due to customers 693,441 842,070 933,966 1,082,337 1,256,589 1,546,832 1,770,975 2,005,212 2,474,775 2,866,894Debt securities issued and
Subordinated term debts 47,114 45,326 53,282 39,055 42,072 42,570 50,827 54,222 64,637 64,359
Other borrowings 233,795 235,370 246,736 337,442 254,895 222,679 299,192 172,017 237,991 606,264
Current tax liabilities 2,208 - - 2,081 - 1,877 3,922 - 592 648
Other liabilities 10,582 11,949 19,340 23,259 20,843 24,488 25,343 38,714 45,925 46,423
Total liabilities 997,268 1,135,881 1,254,214 1,486,804 1,576,441 1,840,649 2,152,661 2,272,834 2,826,322 3,602,524
Equity
Share capital 5,000 5,000 10,000 10,000 15,000 20,000 25,000 25,000 25,000 25,000
Permanent reserve fund 3,286 3,538 3,810 5,210 7,996 10,427 12,890 13,383 13,739 14,491
Retained earnings 27,639 31,419 44,861 51,086 54,155 63,472 78,062 87,689 96,984 136,739
Other reserves 15,028 17,743 16,135 15,189 15,699 17,256 16,218 16,211 20,936 24,530
Total equity 50,953 57,700 74,806 81,485 92,850 111,155 132,170 142,283 156,659 200,760
Total liabilities and equity 1,048,221 1,193,581 1,329,020 1,568,289 1,669,291 1,951,804 2,284,831 2,415,117 2,982,981 3,803,284Contingent liabilities and
commitments 455,181 655,441 721,763 696,857 547,399 496,477 508,307 508,218 580,449 879,356
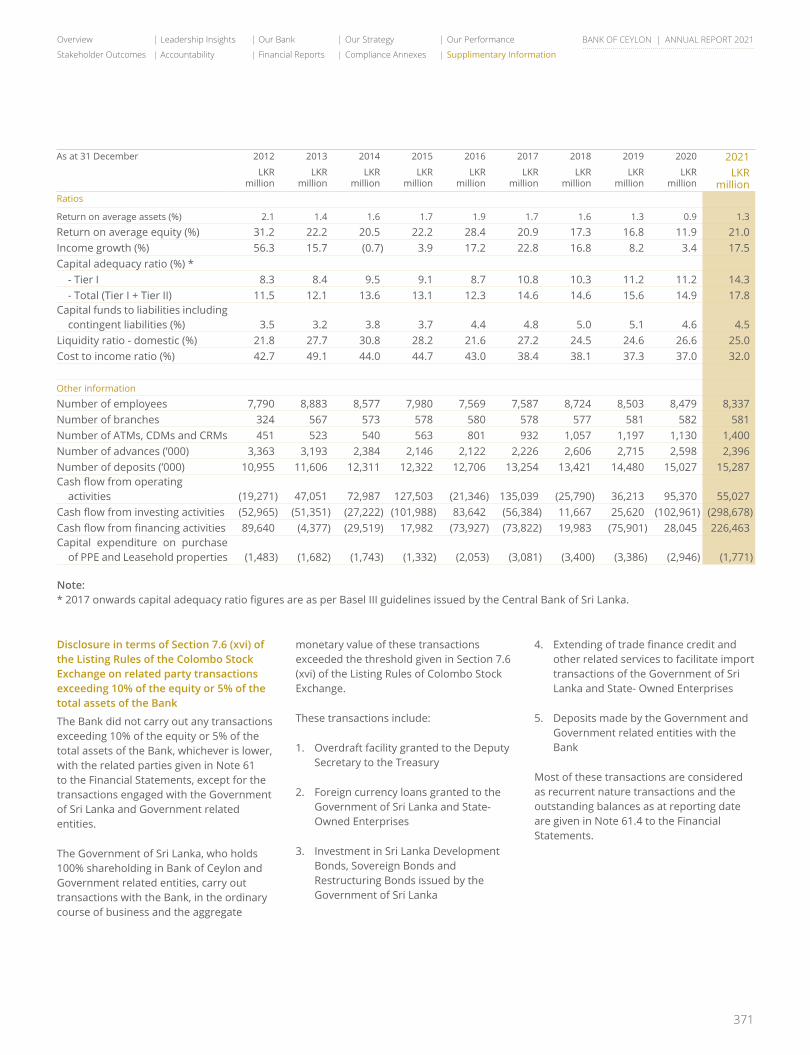
371
Overview Leadership Insights Our Bank Our Strategy Our Performance
Stakeholder Outcomes Accountability Financial Reports Compliance Annexes Supplimentary Information
BANK OF CEYLON | ANNUAL REPORT 2021
As at 31 December 2012 2013 2014 2015 2016 2017 2018 2019 2020 2021LKR
million LKR
million LKR
million LKR
million LKR
million LKR
million LKR
million LKR
million LKR
million LKR
million Ratios
Return on average assets (%) 2.1 1.4 1.6 1.7 1.9 1.7 1.6 1.3 0.9 1.3
Return on average equity (%) 31.2 22.2 20.5 22.2 28.4 20.9 17.3 16.8 11.9 21.0Income growth (%) 56.3 15.7 (0.7) 3.9 17.2 22.8 16.8 8.2 3.4 17.5Capital adequacy ratio (%) * - Tier I 8.3 8.4 9.5 9.1 8.7 10.8 10.3 11.2 11.2 14.3 - Total (Tier I + Tier II) 11.5 12.1 13.6 13.1 12.3 14.6 14.6 15.6 14.9 17.8Capital funds to liabilities including
contingent liabilities (%) 3.5 3.2 3.8 3.7 4.4 4.8 5.0 5.1 4.6 4.5Liquidity ratio - domestic (%) 21.8 27.7 30.8 28.2 21.6 27.2 24.5 24.6 26.6 25.0Cost to income ratio (%) 42.7 49.1 44.0 44.7 43.0 38.4 38.1 37.3 37.0 32.0
Other information
Number of employees 7,790 8,883 8,577 7,980 7,569 7,587 8,724 8,503 8,479 8,337Number of branches 324 567 573 578 580 578 577 581 582 581Number of ATMs, CDMs and CRMs 451 523 540 563 801 932 1,057 1,197 1,130 1,400Number of advances (’000) 3,363 3,193 2,384 2,146 2,122 2,226 2,606 2,715 2,598 2,396Number of deposits (’000) 10,955 11,606 12,311 12,322 12,706 13,254 13,421 14,480 15,027 15,287Cash flow from operating
activities (19,271) 47,051 72,987 127,503 (21,346) 135,039 (25,790) 36,213 95,370 55,027Cash flow from investing activities (52,965) (51,351) (27,222) (101,988) 83,642 (56,384) 11,667 25,620 (102,961) (298,678)Cash flow from financing activities 89,640 (4,377) (29,519) 17,982 (73,927) (73,822) 19,983 (75,901) 28,045 226,463Capital expenditure on purchase
of PPE and Leasehold properties (1,483) (1,682) (1,743) (1,332) (2,053) (3,081) (3,400) (3,386) (2,946) (1,771)
Note:* 2017 onwards capital adequacy ratio figures are as per Basel III guidelines issued by the Central Bank of Sri Lanka.
Disclosure in terms of Section 7.6 (xvi) of the Listing Rules of the Colombo Stock Exchange on related party transactions exceeding 10% of the equity or 5% of the total assets of the Bank
The Bank did not carry out any transactions exceeding 10% of the equity or 5% of the total assets of the Bank, whichever is lower, with the related parties given in Note 61 to the Financial Statements, except for the transactions engaged with the Government of Sri Lanka and Government related entities.
The Government of Sri Lanka, who holds 100% shareholding in Bank of Ceylon and Government related entities, carry out transactions with the Bank, in the ordinary course of business and the aggregate
monetary value of these transactions exceeded the threshold given in Section 7.6 (xvi) of the Listing Rules of Colombo Stock Exchange.
These transactions include:
1. Overdraft facility granted to the Deputy Secretary to the Treasury
2. Foreign currency loans granted to the Government of Sri Lanka and State- Owned Enterprises
3. Investment in Sri Lanka Development Bonds, Sovereign Bonds and Restructuring Bonds issued by the Government of Sri Lanka
4. Extending of trade finance credit and other related services to facilitate import transactions of the Government of Sri Lanka and State- Owned Enterprises
5. Deposits made by the Government and Government related entities with the Bank
Most of these transactions are considered as recurrent nature transactions and the outstanding balances as at reporting date are given in Note 61.4 to the Financial Statements.
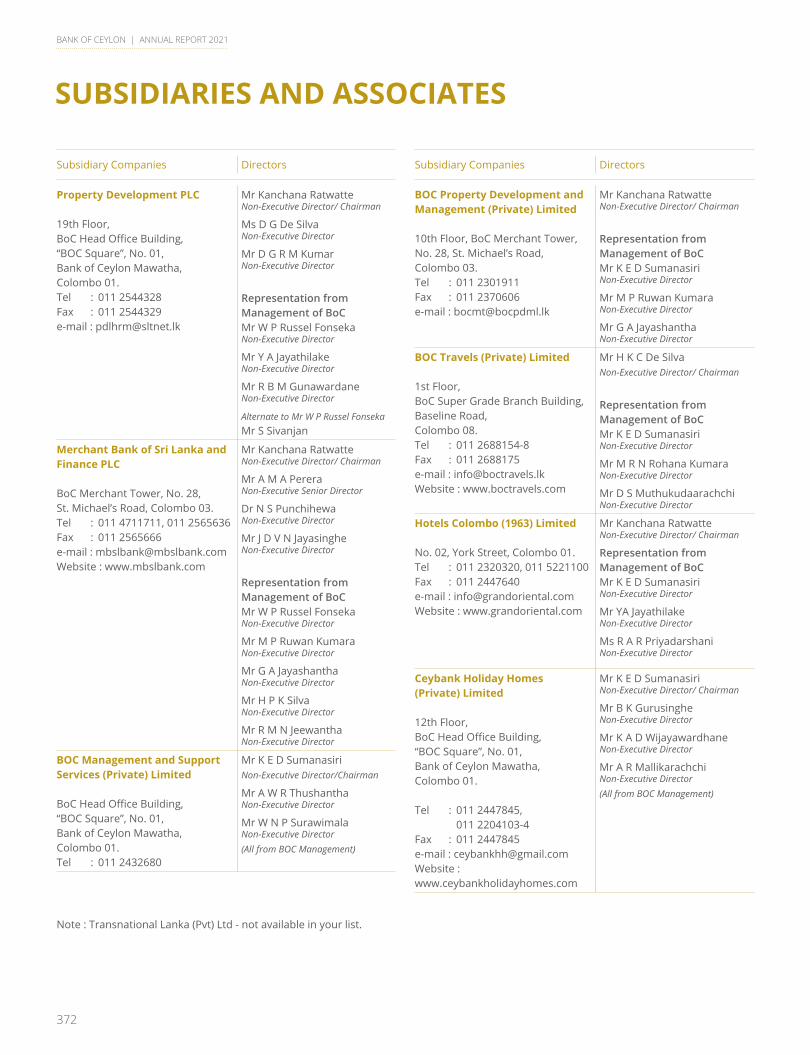
372
BANK OF CEYLON | ANNUAL REPORT 2021
SUBSIDIARIES AND ASSOCIATES
Subsidiary Companies Directors
Property Development PLC
19th Floor, BoC Head Office Building, “BOC Square”, No. 01, Bank of Ceylon Mawatha, Colombo 01.Tel : 011 2544328Fax : 011 2544329e-mail : [email protected]
Mr Kanchana RatwatteNon-Executive Director/ Chairman
Ms D G De Silva Non-Executive Director
Mr D G R M Kumar Non-Executive Director
Representation from Management of BoCMr W P Russel FonsekaNon-Executive Director
Mr Y A Jayathilake Non-Executive Director
Mr R B M Gunawardane Non-Executive Director
AlternatetoMrWPRusselFonsekaMr S Sivanjan
Merchant Bank of Sri Lanka and Finance PLC
BoC Merchant Tower, No. 28, St. Michael’s Road, Colombo 03.Tel : 011 4711711, 011 2565636Fax : 011 2565666e-mail : [email protected] : www.mbslbank.com
Mr Kanchana RatwatteNon-Executive Director/ Chairman
Mr A M A Perera Non-Executive Senior Director
Dr N S Punchihewa Non-Executive Director
Mr J D V N Jayasinghe Non-Executive Director
Representation from Management of BoCMr W P Russel FonsekaNon-Executive Director
Mr M P Ruwan KumaraNon-Executive Director
Mr G A JayashanthaNon-Executive Director
Mr H P K SilvaNon-Executive Director
Mr R M N JeewanthaNon-Executive Director
BOC Management and Support Services (Private) Limited
BoC Head Office Building, “BOC Square”, No. 01, Bank of Ceylon Mawatha, Colombo 01.Tel : 011 2432680
Mr K E D SumanasiriNon-Executive Director/Chairman
Mr A W R Thushantha Non-Executive Director
Mr W N P Surawimala Non-Executive Director(All from BOC Management)
Subsidiary Companies Directors
BOC Property Development and Management (Private) Limited
10th Floor, BoC Merchant Tower, No. 28, St. Michael’s Road, Colombo 03.Tel : 011 2301911Fax : 011 2370606e-mail : [email protected]
Mr Kanchana RatwatteNon-Executive Director/ Chairman
Representation from Management of BoCMr K E D Sumanasiri Non-Executive Director
Mr M P Ruwan Kumara Non-Executive Director
Mr G A Jayashantha Non-Executive Director
BOC Travels (Private) Limited
1st Floor,BoC Super Grade Branch Building, Baseline Road,Colombo 08.Tel : 011 2688154-8Fax : 011 2688175e-mail : [email protected] Website : www.boctravels.com
Mr H K C De Silva Non-Executive Director/ Chairman
Representation from Management of BoCMr K E D SumanasiriNon-Executive Director
Mr M R N Rohana KumaraNon-Executive Director
Mr D S MuthukudaarachchiNon-Executive Director
Hotels Colombo (1963) Limited
No. 02, York Street, Colombo 01.Tel : 011 2320320, 011 5221100Fax : 011 2447640e-mail : [email protected] Website : www.grandoriental.com
Mr Kanchana RatwatteNon-Executive Director/ Chairman
Representation from Management of BoCMr K E D SumanasiriNon-Executive Director
Mr YA JayathilakeNon-Executive Director
Ms R A R PriyadarshaniNon-Executive Director
Ceybank Holiday Homes (Private) Limited
12th Floor, BoC Head Office Building, “BOC Square”, No. 01, Bank of Ceylon Mawatha, Colombo 01.
Tel : 011 2447845, 011 2204103-4Fax : 011 2447845e-mail : [email protected] : www.ceybankholidayhomes.com
Mr K E D Sumanasiri Non-Executive Director/ Chairman
Mr B K GurusingheNon-Executive Director
Mr K A D WijayawardhaneNon-Executive Director
Mr A R MallikarachchiNon-Executive Director(All from BOC Management)
Note : Transnational Lanka (Pvt) Ltd - not available in your list.
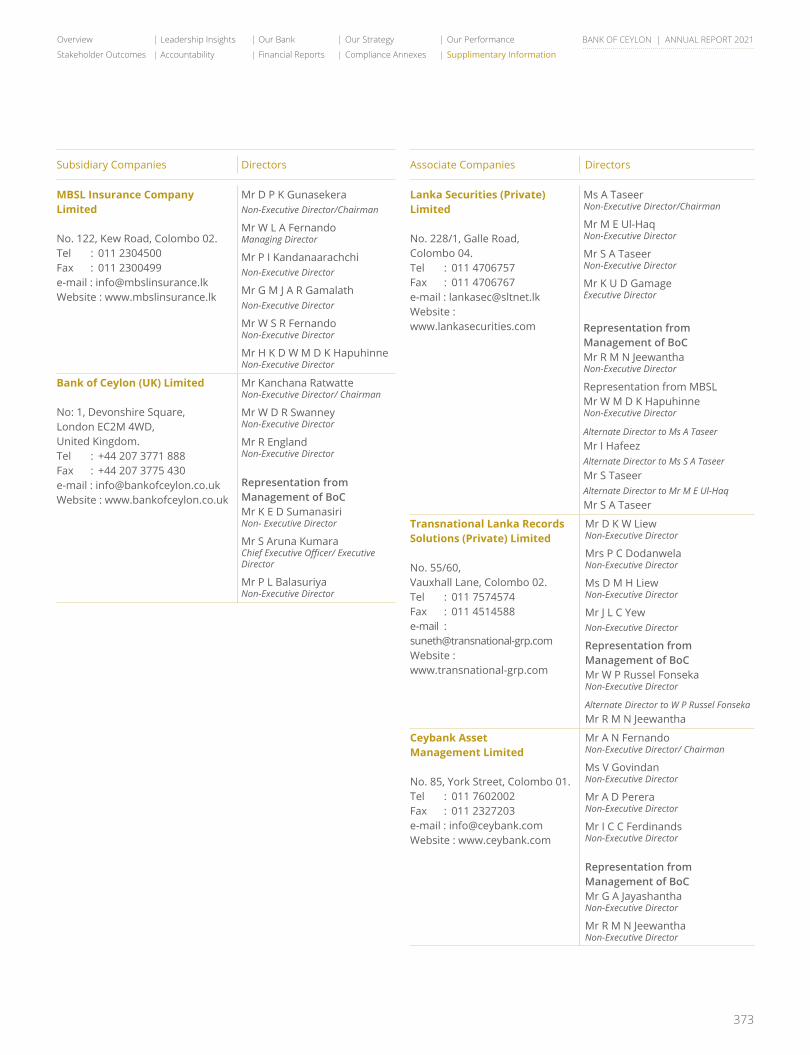
373
Overview Leadership Insights Our Bank Our Strategy Our Performance
Stakeholder Outcomes Accountability Financial Reports Compliance Annexes Supplimentary Information
BANK OF CEYLON | ANNUAL REPORT 2021
Subsidiary Companies Directors
MBSL Insurance Company Limited
No. 122, Kew Road, Colombo 02.Tel : 011 2304500Fax : 011 2300499e-mail : [email protected] : www.mbslinsurance.lk
Mr D P K Gunasekera Non-Executive Director/Chairman
Mr W L A Fernando Managing Director
Mr P I Kandanaarachchi Non-Executive Director
Mr G M J A R Gamalath Non-Executive Director
Mr W S R Fernando Non-Executive Director
Mr H K D W M D K Hapuhinne Non-Executive Director
Bank of Ceylon (UK) Limited
No: 1, Devonshire Square, London EC2M 4WD, United Kingdom.Tel : +44 207 3771 888Fax : +44 207 3775 430e-mail : [email protected] : www.bankofceylon.co.uk
Mr Kanchana RatwatteNon-Executive Director/ Chairman
Mr W D R Swanney Non-Executive Director
Mr R England Non-Executive Director
Representation from Management of BoCMr K E D Sumanasiri Non- Executive Director
Mr S Aruna Kumara ChiefExecutiveOfficer/ExecutiveDirector
Mr P L BalasuriyaNon-Executive Director
Associate Companies Directors
Lanka Securities (Private) Limited
No. 228/1, Galle Road, Colombo 04.Tel : 011 4706757Fax : 011 4706767e-mail : [email protected] Website : www.lankasecurities.com
Ms A Taseer Non-Executive Director/Chairman
Mr M E Ul-Haq Non-Executive Director
Mr S A Taseer Non-Executive Director
Mr K U D Gamage Executive Director
Representation from Management of BoCMr R M N Jeewantha Non-Executive Director
Representation from MBSL Mr W M D K Hapuhinne Non-Executive Director
AlternateDirectortoMsATaseerMr I Hafeez AlternateDirectortoMsSATaseerMr S Taseer Alternate Director to Mr M E Ul-HaqMr S A Taseer
Transnational Lanka Records Solutions (Private) Limited
No. 55/60,Vauxhall Lane, Colombo 02.Tel : 011 7574574Fax : 011 4514588e-mail : [email protected] : www.transnational-grp.com
Mr D K W Liew Non-Executive Director
Mrs P C Dodanwela Non-Executive Director
Ms D M H Liew Non-Executive Director
Mr J L C YewNon-Executive Director
Representation from Management of BoCMr W P Russel FonsekaNon-Executive Director
Alternate DirectortoWPRusselFonsekaMr R M N Jeewantha
Ceybank Asset Management Limited
No. 85, York Street, Colombo 01.Tel : 011 7602002Fax : 011 2327203e-mail : [email protected] : www.ceybank.com
Mr A N Fernando Non-Executive Director/ Chairman
Ms V Govindan Non-Executive Director
Mr A D Perera Non-Executive Director
Mr I C C Ferdinands Non-Executive Director
Representation from Management of BoCMr G A Jayashantha Non-Executive Director
Mr R M N JeewanthaNon-Executive Director
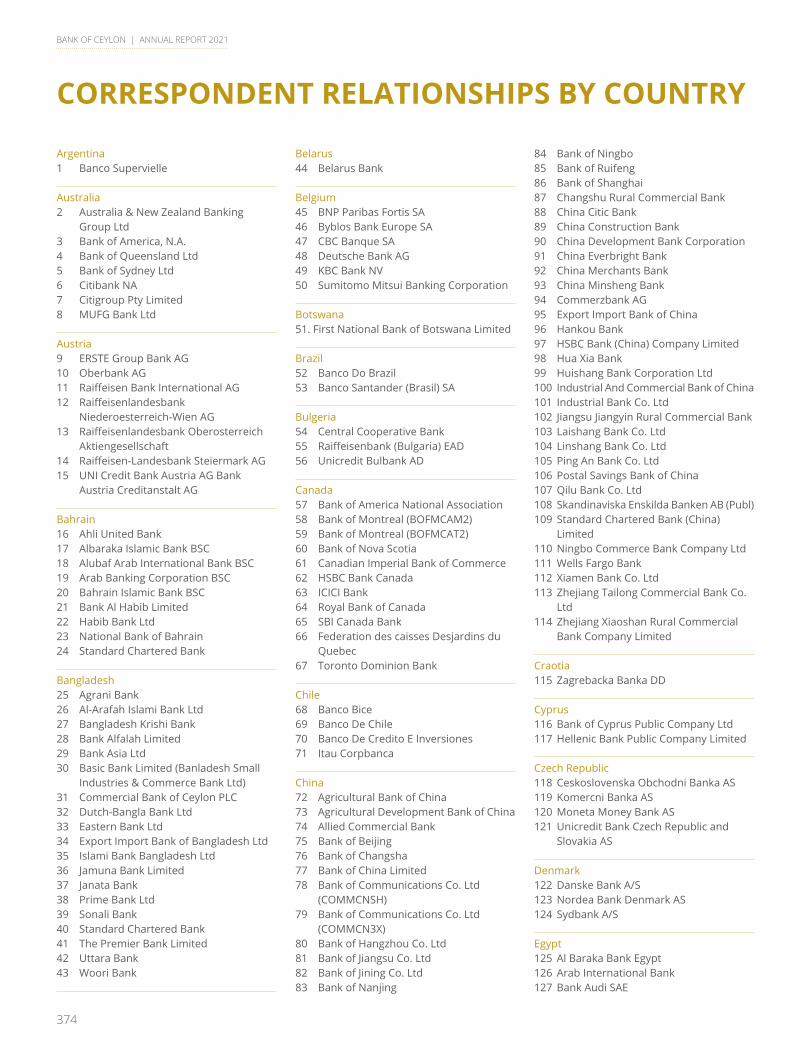
374
BANK OF CEYLON | ANNUAL REPORT 2021
CORRESPONDENT RELATIONSHIPS BY COUNTRY
84 Bank of Ningbo85 Bank of Ruifeng86 Bank of Shanghai87 Changshu Rural Commercial Bank88 China Citic Bank89 China Construction Bank 90 China Development Bank Corporation91 China Everbright Bank92 China Merchants Bank93 China Minsheng Bank94 Commerzbank AG95 Export Import Bank of China96 Hankou Bank97 HSBC Bank (China) Company Limited98 Hua Xia Bank99 Huishang Bank Corporation Ltd100 Industrial And Commercial Bank of China101 Industrial Bank Co. Ltd102 Jiangsu Jiangyin Rural Commercial Bank103 Laishang Bank Co. Ltd104 Linshang Bank Co. Ltd105 Ping An Bank Co. Ltd106 Postal Savings Bank of China107 Qilu Bank Co. Ltd108 Skandinaviska Enskilda Banken AB (Publ)109 Standard Chartered Bank (China)
Limited110 Ningbo Commerce Bank Company Ltd111 Wells Fargo Bank112 Xiamen Bank Co. Ltd113 Zhejiang Tailong Commercial Bank Co.
Ltd114 Zhejiang Xiaoshan Rural Commercial
Bank Company Limited
Craotia115 Zagrebacka Banka DD
Cyprus116 Bank of Cyprus Public Company Ltd117 Hellenic Bank Public Company Limited
Czech Republic118 Ceskoslovenska Obchodni Banka AS119 Komercni Banka AS120 Moneta Money Bank AS121 Unicredit Bank Czech Republic and
Slovakia AS
Denmark122 Danske Bank A/S123 Nordea Bank Denmark AS 124 Sydbank A/S
Egypt125 Al Baraka Bank Egypt 126 Arab International Bank127 Bank Audi SAE
Argentina1 Banco Supervielle
Australia2 Australia & New Zealand Banking
Group Ltd3 Bank of America, N.A. 4 Bank of Queensland Ltd5 Bank of Sydney Ltd6 Citibank NA7 Citigroup Pty Limited8 MUFG Bank Ltd
Austria9 ERSTE Group Bank AG10 Oberbank AG11 Raiffeisen Bank International AG12 Raiffeisenlandesbank
Niederoesterreich-Wien AG13 Raiffeisenlandesbank Oberosterreich
Aktiengesellschaft 14 Raiffeisen-Landesbank Steiermark AG15 UNI Credit Bank Austria AG Bank
Austria Creditanstalt AG
Bahrain16 Ahli United Bank17 Albaraka Islamic Bank BSC18 Alubaf Arab International Bank BSC19 Arab Banking Corporation BSC20 Bahrain Islamic Bank BSC21 Bank Al Habib Limited22 Habib Bank Ltd23 National Bank of Bahrain 24 Standard Chartered Bank
Bangladesh25 Agrani Bank26 Al-Arafah Islami Bank Ltd27 Bangladesh Krishi Bank28 Bank Alfalah Limited29 Bank Asia Ltd30 Basic Bank Limited (Banladesh Small
Industries & Commerce Bank Ltd)31 Commercial Bank of Ceylon PLC32 Dutch-Bangla Bank Ltd33 Eastern Bank Ltd34 Export Import Bank of Bangladesh Ltd35 Islami Bank Bangladesh Ltd36 Jamuna Bank Limited37 Janata Bank38 Prime Bank Ltd39 Sonali Bank40 Standard Chartered Bank41 The Premier Bank Limited42 Uttara Bank43 Woori Bank
Belarus44 Belarus Bank
Belgium45 BNP Paribas Fortis SA46 Byblos Bank Europe SA47 CBC Banque SA48 Deutsche Bank AG49 KBC Bank NV50 Sumitomo Mitsui Banking Corporation
Botswana51. First National Bank of Botswana Limited
Brazil52 Banco Do Brazil53 Banco Santander (Brasil) SA
Bulgeria54 Central Cooperative Bank55 Raiffeisenbank (Bulgaria) EAD56 Unicredit Bulbank AD
Canada57 Bank of America National Association58 Bank of Montreal (BOFMCAM2)59 Bank of Montreal (BOFMCAT2)60 Bank of Nova Scotia61 Canadian Imperial Bank of Commerce62 HSBC Bank Canada63 ICICI Bank64 Royal Bank of Canada65 SBI Canada Bank66 Federation des caisses Desjardins du
Quebec67 Toronto Dominion Bank
Chile68 Banco Bice69 Banco De Chile70 Banco De Credito E Inversiones71 Itau Corpbanca
China72 Agricultural Bank of China73 Agricultural Development Bank of China 74 Allied Commercial Bank75 Bank of Beijing76 Bank of Changsha77 Bank of China Limited78 Bank of Communications Co. Ltd
(COMMCNSH)79 Bank of Communications Co. Ltd
(COMMCN3X)80 Bank of Hangzhou Co. Ltd81 Bank of Jiangsu Co. Ltd82 Bank of Jining Co. Ltd83 Bank of Nanjing
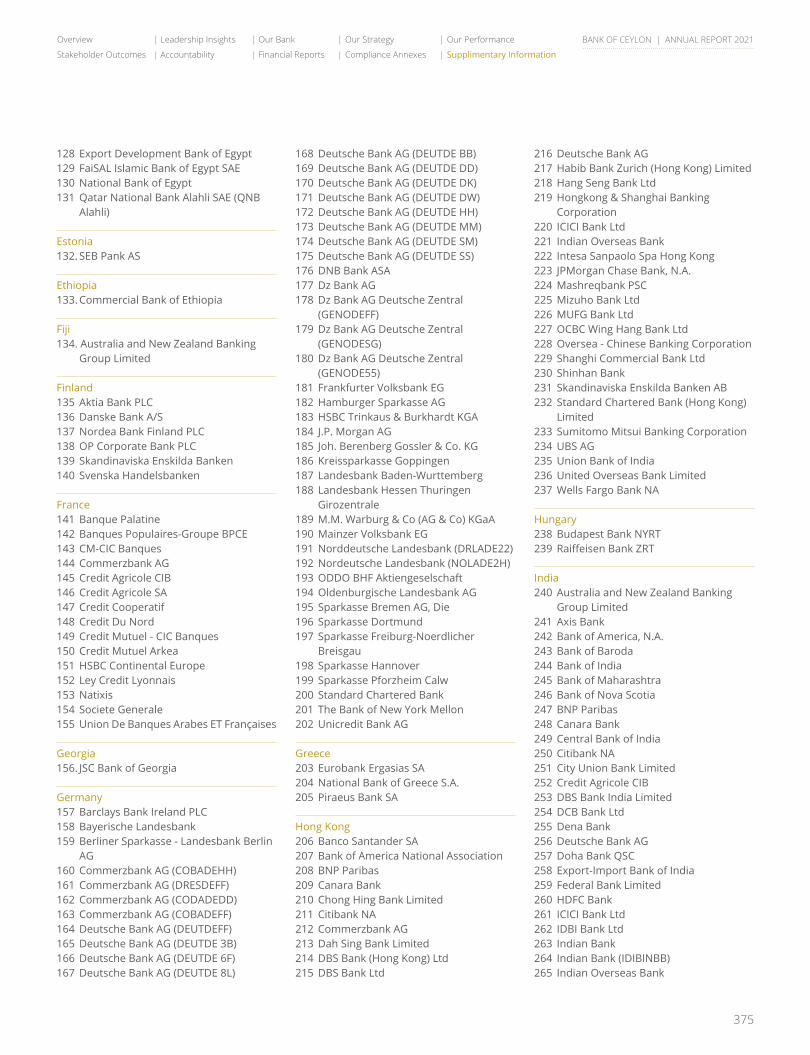
375
Overview Leadership Insights Our Bank Our Strategy Our Performance
Stakeholder Outcomes Accountability Financial Reports Compliance Annexes Supplimentary Information
BANK OF CEYLON | ANNUAL REPORT 2021
128 Export Development Bank of Egypt129 FaiSAL Islamic Bank of Egypt SAE130 National Bank of Egypt131 Qatar National Bank Alahli SAE (QNB
Alahli)
Estonia132. SEB Pank AS
Ethiopia133. Commercial Bank of Ethiopia
Fiji134. Australia and New Zealand Banking
Group Limited
Finland135 Aktia Bank PLC136 Danske Bank A/S137 Nordea Bank Finland PLC138 OP Corporate Bank PLC139 Skandinaviska Enskilda Banken140 Svenska Handelsbanken
France141 Banque Palatine142 Banques Populaires-Groupe BPCE143 CM-CIC Banques144 Commerzbank AG145 Credit Agricole CIB146 Credit Agricole SA147 Credit Cooperatif148 Credit Du Nord149 Credit Mutuel - CIC Banques150 Credit Mutuel Arkea151 HSBC Continental Europe152 Ley Credit Lyonnais153 Natixis154 Societe Generale155 Union De Banques Arabes ET Françaises
Georgia156. JSC Bank of Georgia
Germany157 Barclays Bank Ireland PLC158 Bayerische Landesbank159 Berliner Sparkasse - Landesbank Berlin
AG160 Commerzbank AG (COBADEHH)161 Commerzbank AG (DRESDEFF)162 Commerzbank AG (CODADEDD)163 Commerzbank AG (COBADEFF)164 Deutsche Bank AG (DEUTDEFF)165 Deutsche Bank AG (DEUTDE 3B)166 Deutsche Bank AG (DEUTDE 6F)167 Deutsche Bank AG (DEUTDE 8L)
168 Deutsche Bank AG (DEUTDE BB)169 Deutsche Bank AG (DEUTDE DD)170 Deutsche Bank AG (DEUTDE DK)171 Deutsche Bank AG (DEUTDE DW)172 Deutsche Bank AG (DEUTDE HH)173 Deutsche Bank AG (DEUTDE MM)174 Deutsche Bank AG (DEUTDE SM)175 Deutsche Bank AG (DEUTDE SS)176 DNB Bank ASA177 Dz Bank AG178 Dz Bank AG Deutsche Zentral
(GENODEFF) 179 Dz Bank AG Deutsche Zentral
(GENODESG)180 Dz Bank AG Deutsche Zentral
(GENODE55)181 Frankfurter Volksbank EG182 Hamburger Sparkasse AG183 HSBC Trinkaus & Burkhardt KGA184 J.P. Morgan AG185 Joh. Berenberg Gossler & Co. KG186 Kreissparkasse Goppingen187 Landesbank Baden-Wurttemberg188 Landesbank Hessen Thuringen
Girozentrale189 M.M. Warburg & Co (AG & Co) KGaA190 Mainzer Volksbank EG191 Norddeutsche Landesbank (DRLADE22)192 Nordeutsche Landesbank (NOLADE2H)193 ODDO BHF Aktiengeselschaft194 Oldenburgische Landesbank AG195 Sparkasse Bremen AG, Die196 Sparkasse Dortmund197 Sparkasse Freiburg-Noerdlicher
Breisgau198 Sparkasse Hannover199 Sparkasse Pforzheim Calw200 Standard Chartered Bank201 The Bank of New York Mellon202 Unicredit Bank AG
Greece203 Eurobank Ergasias SA204 National Bank of Greece S.A.205 Piraeus Bank SA
Hong Kong206 Banco Santander SA207 Bank of America National Association208 BNP Paribas209 Canara Bank210 Chong Hing Bank Limited211 Citibank NA212 Commerzbank AG213 Dah Sing Bank Limited214 DBS Bank (Hong Kong) Ltd215 DBS Bank Ltd
216 Deutsche Bank AG217 Habib Bank Zurich (Hong Kong) Limited218 Hang Seng Bank Ltd219 Hongkong & Shanghai Banking
Corporation220 ICICI Bank Ltd221 Indian Overseas Bank222 Intesa Sanpaolo Spa Hong Kong223 JPMorgan Chase Bank, N.A.224 Mashreqbank PSC225 Mizuho Bank Ltd 226 MUFG Bank Ltd227 OCBC Wing Hang Bank Ltd228 Oversea - Chinese Banking Corporation229 Shanghi Commercial Bank Ltd230 Shinhan Bank231 Skandinaviska Enskilda Banken AB232 Standard Chartered Bank (Hong Kong)
Limited233 Sumitomo Mitsui Banking Corporation234 UBS AG 235 Union Bank of India236 United Overseas Bank Limited237 Wells Fargo Bank NA
Hungary238 Budapest Bank NYRT239 Raiffeisen Bank ZRT
India240 Australia and New Zealand Banking
Group Limited241 Axis Bank242 Bank of America, N.A. 243 Bank of Baroda244 Bank of India 245 Bank of Maharashtra246 Bank of Nova Scotia247 BNP Paribas248 Canara Bank249 Central Bank of India250 Citibank NA251 City Union Bank Limited252 Credit Agricole CIB253 DBS Bank India Limited254 DCB Bank Ltd255 Dena Bank256 Deutsche Bank AG257 Doha Bank QSC258 Export-Import Bank of India259 Federal Bank Limited260 HDFC Bank261 ICICI Bank Ltd262 IDBI Bank Ltd263 Indian Bank264 Indian Bank (IDIBINBB)265 Indian Overseas Bank
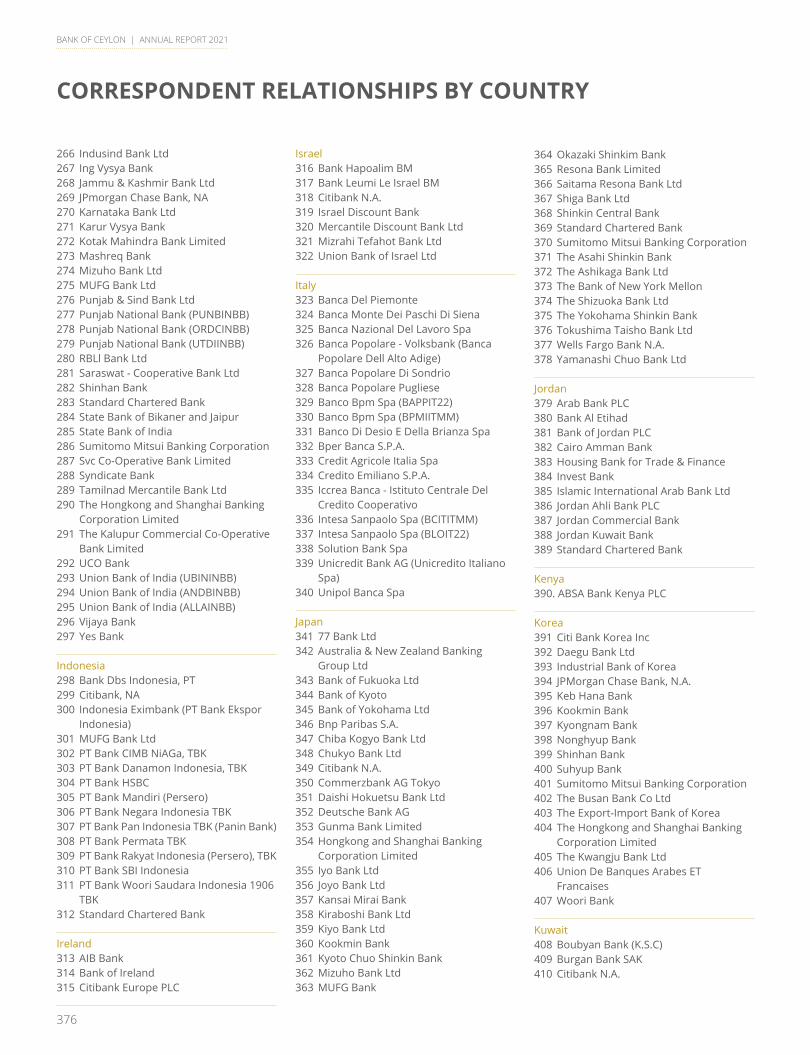
376
BANK OF CEYLON | ANNUAL REPORT 2021
CORRESPONDENT RELATIONSHIPS BY COUNTRY
266 Indusind Bank Ltd267 Ing Vysya Bank268 Jammu & Kashmir Bank Ltd269 JPmorgan Chase Bank, NA270 Karnataka Bank Ltd271 Karur Vysya Bank272 Kotak Mahindra Bank Limited273 Mashreq Bank274 Mizuho Bank Ltd275 MUFG Bank Ltd276 Punjab & Sind Bank Ltd277 Punjab National Bank (PUNBINBB)278 Punjab National Bank (ORDCINBB)279 Punjab National Bank (UTDIINBB)280 RBLl Bank Ltd281 Saraswat - Cooperative Bank Ltd282 Shinhan Bank283 Standard Chartered Bank284 State Bank of Bikaner and Jaipur285 State Bank of India286 Sumitomo Mitsui Banking Corporation287 Svc Co-Operative Bank Limited288 Syndicate Bank289 Tamilnad Mercantile Bank Ltd290 The Hongkong and Shanghai Banking
Corporation Limited291 The Kalupur Commercial Co-Operative
Bank Limited292 UCO Bank293 Union Bank of India (UBININBB)294 Union Bank of India (ANDBINBB)295 Union Bank of India (ALLAINBB)296 Vijaya Bank297 Yes Bank
Indonesia298 Bank Dbs Indonesia, PT299 Citibank, NA300 Indonesia Eximbank (PT Bank Ekspor
Indonesia)301 MUFG Bank Ltd302 PT Bank CIMB NiAGa, TBK303 PT Bank Danamon Indonesia, TBK304 PT Bank HSBC305 PT Bank Mandiri (Persero)306 PT Bank Negara Indonesia TBK307 PT Bank Pan Indonesia TBK (Panin Bank)308 PT Bank Permata TBK309 PT Bank Rakyat Indonesia (Persero), TBK310 PT Bank SBI Indonesia311 PT Bank Woori Saudara Indonesia 1906
TBK312 Standard Chartered Bank
Ireland313 AIB Bank314 Bank of Ireland315 Citibank Europe PLC
Israel316 Bank Hapoalim BM317 Bank Leumi Le Israel BM318 Citibank N.A.319 Israel Discount Bank 320 Mercantile Discount Bank Ltd321 Mizrahi Tefahot Bank Ltd322 Union Bank of Israel Ltd
Italy323 Banca Del Piemonte324 Banca Monte Dei Paschi Di Siena325 Banca Nazional Del Lavoro Spa326 Banca Popolare - Volksbank (Banca
Popolare Dell Alto Adige)327 Banca Popolare Di Sondrio328 Banca Popolare Pugliese329 Banco Bpm Spa (BAPPIT22)330 Banco Bpm Spa (BPMIITMM)331 Banco Di Desio E Della Brianza Spa332 Bper Banca S.P.A.333 Credit Agricole Italia Spa334 Credito Emiliano S.P.A.335 Iccrea Banca - Istituto Centrale Del
Credito Cooperativo336 Intesa Sanpaolo Spa (BCITITMM)337 Intesa Sanpaolo Spa (BLOIT22)338 Solution Bank Spa339 Unicredit Bank AG (Unicredito Italiano
Spa)340 Unipol Banca Spa
Japan341 77 Bank Ltd342 Australia & New Zealand Banking
Group Ltd 343 Bank of Fukuoka Ltd344 Bank of Kyoto345 Bank of Yokohama Ltd346 Bnp Paribas S.A.347 Chiba Kogyo Bank Ltd348 Chukyo Bank Ltd349 Citibank N.A.350 Commerzbank AG Tokyo351 Daishi Hokuetsu Bank Ltd352 Deutsche Bank AG353 Gunma Bank Limited354 Hongkong and Shanghai Banking
Corporation Limited355 Iyo Bank Ltd356 Joyo Bank Ltd357 Kansai Mirai Bank358 Kiraboshi Bank Ltd359 Kiyo Bank Ltd360 Kookmin Bank361 Kyoto Chuo Shinkin Bank362 Mizuho Bank Ltd363 MUFG Bank
364 Okazaki Shinkim Bank365 Resona Bank Limited366 Saitama Resona Bank Ltd367 Shiga Bank Ltd368 Shinkin Central Bank369 Standard Chartered Bank370 Sumitomo Mitsui Banking Corporation371 The Asahi Shinkin Bank372 The Ashikaga Bank Ltd373 The Bank of New York Mellon374 The Shizuoka Bank Ltd375 The Yokohama Shinkin Bank376 Tokushima Taisho Bank Ltd377 Wells Fargo Bank N.A.378 Yamanashi Chuo Bank Ltd
Jordan379 Arab Bank PLC380 Bank Al Etihad 381 Bank of Jordan PLC382 Cairo Amman Bank383 Housing Bank for Trade & Finance384 Invest Bank385 Islamic International Arab Bank Ltd386 Jordan Ahli Bank PLC387 Jordan Commercial Bank388 Jordan Kuwait Bank389 Standard Chartered Bank
Kenya390. ABSA Bank Kenya PLC
Korea391 Citi Bank Korea Inc 392 Daegu Bank Ltd393 Industrial Bank of Korea394 JPMorgan Chase Bank, N.A.395 Keb Hana Bank396 Kookmin Bank397 Kyongnam Bank398 Nonghyup Bank399 Shinhan Bank400 Suhyup Bank401 Sumitomo Mitsui Banking Corporation402 The Busan Bank Co Ltd403 The Export-Import Bank of Korea404 The Hongkong and Shanghai Banking
Corporation Limited405 The Kwangju Bank Ltd406 Union De Banques Arabes ET
Francaises407 Woori Bank
Kuwait408 Boubyan Bank (K.S.C)409 Burgan Bank SAK410 Citibank N.A.
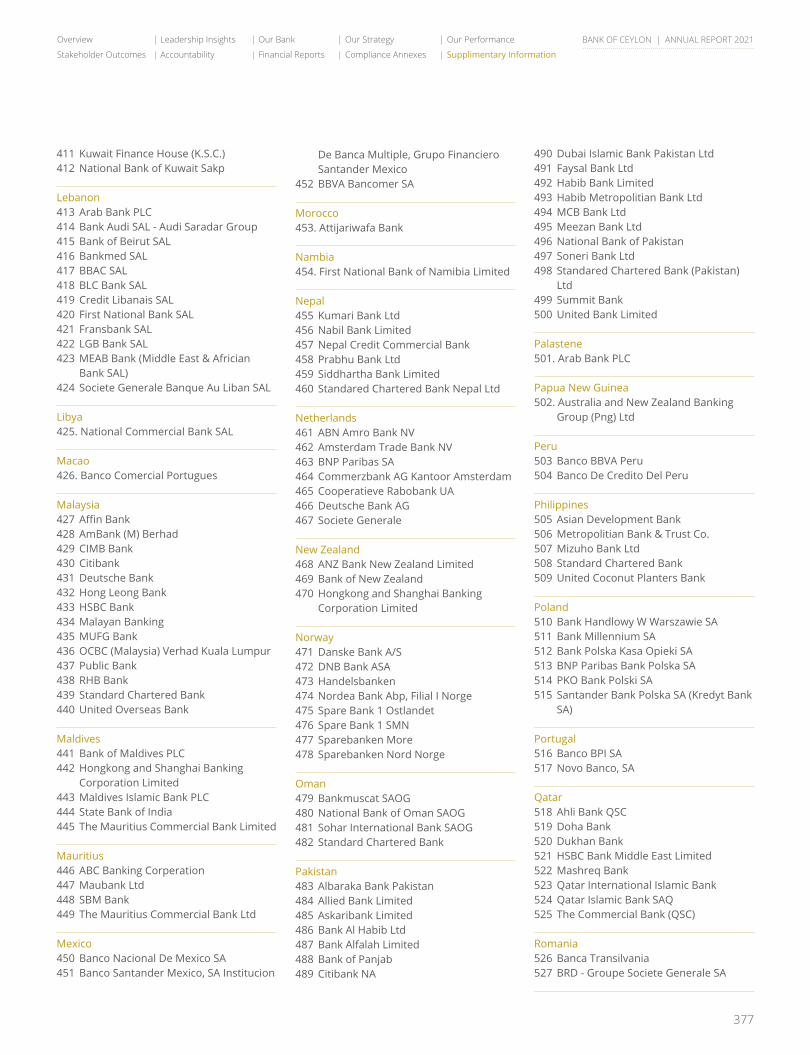
377
Overview Leadership Insights Our Bank Our Strategy Our Performance
Stakeholder Outcomes Accountability Financial Reports Compliance Annexes Supplimentary Information
BANK OF CEYLON | ANNUAL REPORT 2021
411 Kuwait Finance House (K.S.C.)412 National Bank of Kuwait Sakp
Lebanon413 Arab Bank PLC414 Bank Audi SAL - Audi Saradar Group415 Bank of Beirut SAL416 Bankmed SAL417 BBAC SAL418 BLC Bank SAL419 Credit Libanais SAL420 First National Bank SAL 421 Fransbank SAL422 LGB Bank SAL423 MEAB Bank (Middle East & Africian
Bank SAL)424 Societe Generale Banque Au Liban SAL
Libya425. National Commercial Bank SAL
Macao426. Banco Comercial Portugues
Malaysia427 Affin Bank428 AmBank (M) Berhad429 CIMB Bank430 Citibank431 Deutsche Bank432 Hong Leong Bank433 HSBC Bank434 Malayan Banking435 MUFG Bank436 OCBC (Malaysia) Verhad Kuala Lumpur437 Public Bank438 RHB Bank439 Standard Chartered Bank440 United Overseas Bank
Maldives441 Bank of Maldives PLC442 Hongkong and Shanghai Banking
Corporation Limited443 Maldives Islamic Bank PLC444 State Bank of India445 The Mauritius Commercial Bank Limited
Mauritius446 ABC Banking Corperation447 Maubank Ltd448 SBM Bank449 The Mauritius Commercial Bank Ltd
Mexico450 Banco Nacional De Mexico SA451 Banco Santander Mexico, SA Institucion
De Banca Multiple, Grupo Financiero Santander Mexico
452 BBVA Bancomer SA
Morocco453. Attijariwafa Bank
Nambia454. First National Bank of Namibia Limited
Nepal455 Kumari Bank Ltd456 Nabil Bank Limited457 Nepal Credit Commercial Bank 458 Prabhu Bank Ltd459 Siddhartha Bank Limited460 Standared Chartered Bank Nepal Ltd
Netherlands461 ABN Amro Bank NV462 Amsterdam Trade Bank NV463 BNP Paribas SA 464 Commerzbank AG Kantoor Amsterdam465 Cooperatieve Rabobank UA466 Deutsche Bank AG467 Societe Generale
New Zealand468 ANZ Bank New Zealand Limited469 Bank of New Zealand470 Hongkong and Shanghai Banking
Corporation Limited
Norway471 Danske Bank A/S472 DNB Bank ASA473 Handelsbanken474 Nordea Bank Abp, Filial I Norge475 Spare Bank 1 Ostlandet 476 Spare Bank 1 SMN477 Sparebanken More478 Sparebanken Nord Norge
Oman479 Bankmuscat SAOG480 National Bank of Oman SAOG481 Sohar International Bank SAOG482 Standard Chartered Bank
Pakistan483 Albaraka Bank Pakistan484 Allied Bank Limited485 Askaribank Limited 486 Bank Al Habib Ltd487 Bank Alfalah Limited488 Bank of Panjab489 Citibank NA
490 Dubai Islamic Bank Pakistan Ltd491 Faysal Bank Ltd492 Habib Bank Limited493 Habib Metropolitian Bank Ltd494 MCB Bank Ltd495 Meezan Bank Ltd496 National Bank of Pakistan497 Soneri Bank Ltd498 Standared Chartered Bank (Pakistan)
Ltd499 Summit Bank500 United Bank Limited
Palastene501. Arab Bank PLC
Papua New Guinea502. Australia and New Zealand Banking
Group (Png) Ltd
Peru503 Banco BBVA Peru504 Banco De Credito Del Peru
Philippines505 Asian Development Bank506 Metropolitian Bank & Trust Co.507 Mizuho Bank Ltd508 Standard Chartered Bank509 United Coconut Planters Bank
Poland510 Bank Handlowy W Warszawie SA511 Bank Millennium SA512 Bank Polska Kasa Opieki SA513 BNP Paribas Bank Polska SA514 PKO Bank Polski SA515 Santander Bank Polska SA (Kredyt Bank
SA)
Portugal516 Banco BPI SA517 Novo Banco, SA
Qatar518 Ahli Bank QSC519 Doha Bank520 Dukhan Bank521 HSBC Bank Middle East Limited522 Mashreq Bank523 Qatar International Islamic Bank524 Qatar Islamic Bank SAQ525 The Commercial Bank (QSC)
Romania526 Banca Transilvania527 BRD - Groupe Societe Generale SA
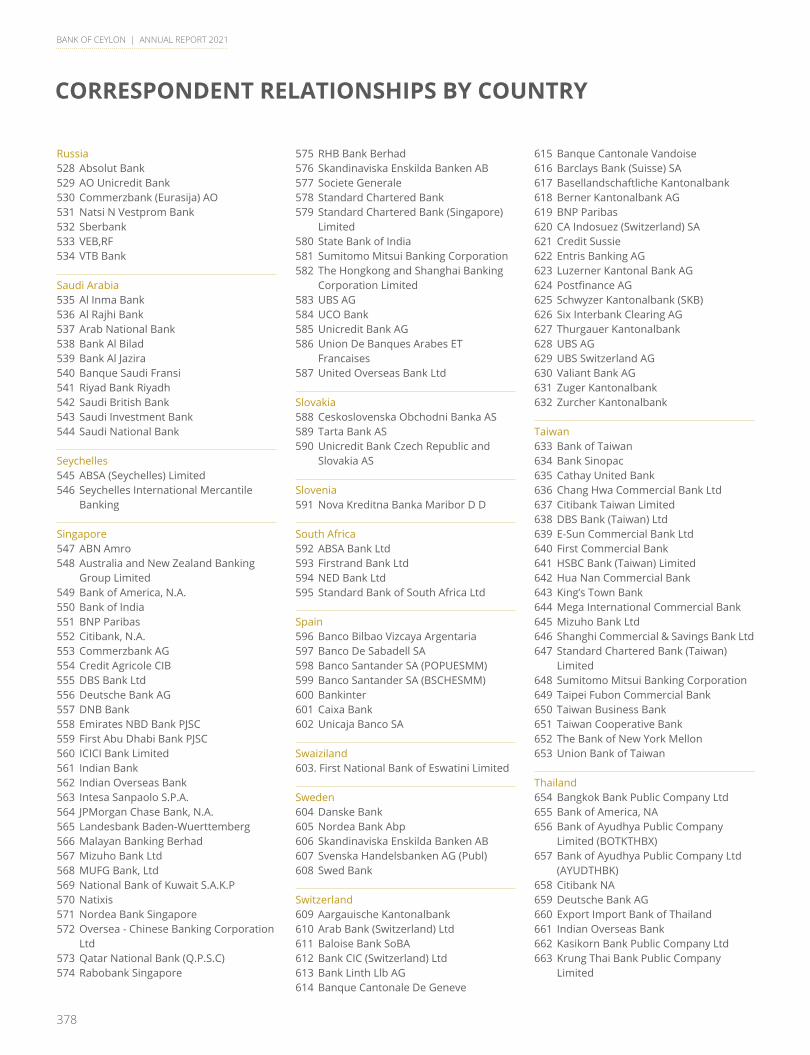
378
BANK OF CEYLON | ANNUAL REPORT 2021
CORRESPONDENT RELATIONSHIPS BY COUNTRY
Russia528 Absolut Bank529 AO Unicredit Bank530 Commerzbank (Eurasija) AO531 Natsi N Vestprom Bank532 Sberbank533 VEB,RF534 VTB Bank
Saudi Arabia535 Al Inma Bank536 Al Rajhi Bank 537 Arab National Bank538 Bank Al Bilad539 Bank Al Jazira540 Banque Saudi Fransi541 Riyad Bank Riyadh542 Saudi British Bank543 Saudi Investment Bank544 Saudi National Bank
Seychelles545 ABSA (Seychelles) Limited546 Seychelles International Mercantile
Banking
Singapore547 ABN Amro 548 Australia and New Zealand Banking
Group Limited549 Bank of America, N.A.550 Bank of India551 BNP Paribas 552 Citibank, N.A.553 Commerzbank AG554 Credit Agricole CIB555 DBS Bank Ltd556 Deutsche Bank AG557 DNB Bank558 Emirates NBD Bank PJSC559 First Abu Dhabi Bank PJSC560 ICICI Bank Limited561 Indian Bank562 Indian Overseas Bank563 Intesa Sanpaolo S.P.A.564 JPMorgan Chase Bank, N.A.565 Landesbank Baden-Wuerttemberg566 Malayan Banking Berhad567 Mizuho Bank Ltd568 MUFG Bank, Ltd569 National Bank of Kuwait S.A.K.P570 Natixis571 Nordea Bank Singapore572 Oversea - Chinese Banking Corporation
Ltd573 Qatar National Bank (Q.P.S.C)574 Rabobank Singapore
575 RHB Bank Berhad576 Skandinaviska Enskilda Banken AB577 Societe Generale578 Standard Chartered Bank579 Standard Chartered Bank (Singapore)
Limited580 State Bank of India581 Sumitomo Mitsui Banking Corporation582 The Hongkong and Shanghai Banking
Corporation Limited583 UBS AG584 UCO Bank 585 Unicredit Bank AG586 Union De Banques Arabes ET
Francaises587 United Overseas Bank Ltd
Slovakia588 Ceskoslovenska Obchodni Banka AS589 Tarta Bank AS590 Unicredit Bank Czech Republic and
Slovakia AS
Slovenia591 Nova Kreditna Banka Maribor D D
South Africa592 ABSA Bank Ltd593 Firstrand Bank Ltd594 NED Bank Ltd595 Standard Bank of South Africa Ltd
Spain596 Banco Bilbao Vizcaya Argentaria597 Banco De Sabadell SA598 Banco Santander SA (POPUESMM)599 Banco Santander SA (BSCHESMM)600 Bankinter601 Caixa Bank602 Unicaja Banco SA
Swaiziland603. First National Bank of Eswatini Limited
Sweden604 Danske Bank605 Nordea Bank Abp606 Skandinaviska Enskilda Banken AB607 Svenska Handelsbanken AG (Publ)608 Swed Bank
Switzerland609 Aargauische Kantonalbank610 Arab Bank (Switzerland) Ltd611 Baloise Bank SoBA612 Bank CIC (Switzerland) Ltd613 Bank Linth Llb AG614 Banque Cantonale De Geneve
615 Banque Cantonale Vandoise616 Barclays Bank (Suisse) SA617 Basellandschaftliche Kantonalbank618 Berner Kantonalbank AG619 BNP Paribas620 CA Indosuez (Switzerland) SA621 Credit Sussie622 Entris Banking AG623 Luzerner Kantonal Bank AG624 Postfinance AG625 Schwyzer Kantonalbank (SKB)626 Six Interbank Clearing AG627 Thurgauer Kantonalbank628 UBS AG629 UBS Switzerland AG630 Valiant Bank AG631 Zuger Kantonalbank632 Zurcher Kantonalbank
Taiwan633 Bank of Taiwan634 Bank Sinopac635 Cathay United Bank636 Chang Hwa Commercial Bank Ltd637 Citibank Taiwan Limited638 DBS Bank (Taiwan) Ltd639 E-Sun Commercial Bank Ltd640 First Commercial Bank 641 HSBC Bank (Taiwan) Limited642 Hua Nan Commercial Bank643 King’s Town Bank644 Mega International Commercial Bank645 Mizuho Bank Ltd646 Shanghi Commercial & Savings Bank Ltd647 Standard Chartered Bank (Taiwan)
Limited648 Sumitomo Mitsui Banking Corporation649 Taipei Fubon Commercial Bank650 Taiwan Business Bank651 Taiwan Cooperative Bank652 The Bank of New York Mellon653 Union Bank of Taiwan
Thailand654 Bangkok Bank Public Company Ltd655 Bank of America, NA656 Bank of Ayudhya Public Company
Limited (BOTKTHBX)657 Bank of Ayudhya Public Company Ltd
(AYUDTHBK)658 Citibank NA659 Deutsche Bank AG660 Export Import Bank of Thailand661 Indian Overseas Bank 662 Kasikorn Bank Public Company Ltd663 Krung Thai Bank Public Company
Limited
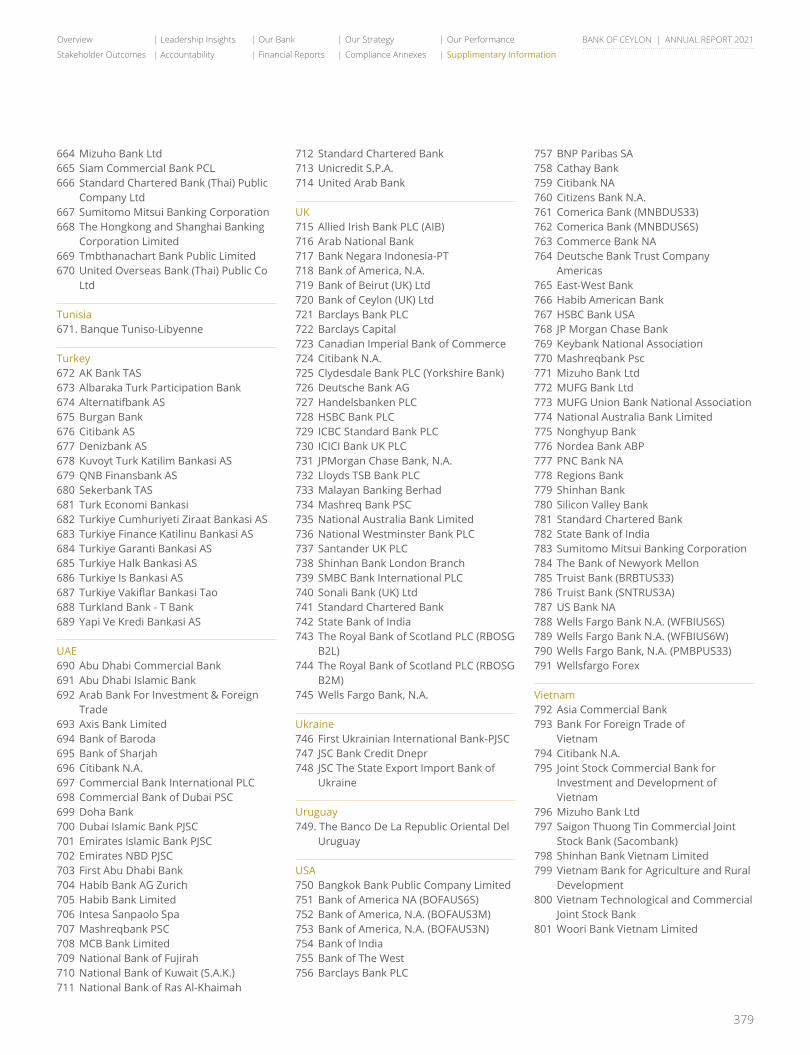
379
Overview Leadership Insights Our Bank Our Strategy Our Performance
Stakeholder Outcomes Accountability Financial Reports Compliance Annexes Supplimentary Information
BANK OF CEYLON | ANNUAL REPORT 2021
664 Mizuho Bank Ltd665 Siam Commercial Bank PCL666 Standard Chartered Bank (Thai) Public
Company Ltd667 Sumitomo Mitsui Banking Corporation668 The Hongkong and Shanghai Banking
Corporation Limited669 Tmbthanachart Bank Public Limited670 United Overseas Bank (Thai) Public Co
Ltd
Tunisia671. Banque Tuniso-Libyenne
Turkey672 AK Bank TAS673 Albaraka Turk Participation Bank674 Alternatifbank AS675 Burgan Bank676 Citibank AS677 Denizbank AS678 Kuvoyt Turk Katilim Bankasi AS679 QNB Finansbank AS680 Sekerbank TAS681 Turk Economi Bankasi682 Turkiye Cumhuriyeti Ziraat Bankasi AS683 Turkiye Finance Katilinu Bankasi AS684 Turkiye Garanti Bankasi AS685 Turkiye Halk Bankasi AS 686 Turkiye Is Bankasi AS687 Turkiye Vakiflar Bankasi Tao688 Turkland Bank - T Bank689 Yapi Ve Kredi Bankasi AS
UAE690 Abu Dhabi Commercial Bank 691 Abu Dhabi Islamic Bank692 Arab Bank For Investment & Foreign
Trade693 Axis Bank Limited694 Bank of Baroda695 Bank of Sharjah696 Citibank N.A.697 Commercial Bank International PLC698 Commercial Bank of Dubai PSC699 Doha Bank700 Dubai Islamic Bank PJSC701 Emirates Islamic Bank PJSC702 Emirates NBD PJSC703 First Abu Dhabi Bank704 Habib Bank AG Zurich705 Habib Bank Limited706 Intesa Sanpaolo Spa707 Mashreqbank PSC708 MCB Bank Limited709 National Bank of Fujirah710 National Bank of Kuwait (S.A.K.)711 National Bank of Ras Al-Khaimah
712 Standard Chartered Bank713 Unicredit S.P.A.714 United Arab Bank
UK715 Allied Irish Bank PLC (AIB)716 Arab National Bank717 Bank Negara Indonesia-PT718 Bank of America, N.A. 719 Bank of Beirut (UK) Ltd720 Bank of Ceylon (UK) Ltd721 Barclays Bank PLC722 Barclays Capital723 Canadian Imperial Bank of Commerce724 Citibank N.A.725 Clydesdale Bank PLC (Yorkshire Bank)726 Deutsche Bank AG727 Handelsbanken PLC728 HSBC Bank PLC729 ICBC Standard Bank PLC730 ICICI Bank UK PLC731 JPMorgan Chase Bank, N.A.732 Lloyds TSB Bank PLC733 Malayan Banking Berhad734 Mashreq Bank PSC735 National Australia Bank Limited736 National Westminster Bank PLC737 Santander UK PLC738 Shinhan Bank London Branch739 SMBC Bank International PLC740 Sonali Bank (UK) Ltd741 Standard Chartered Bank742 State Bank of India743 The Royal Bank of Scotland PLC (RBOSG
B2L)744 The Royal Bank of Scotland PLC (RBOSG
B2M)745 Wells Fargo Bank, N.A.
Ukraine746 First Ukrainian International Bank-PJSC 747 JSC Bank Credit Dnepr748 JSC The State Export Import Bank of
Ukraine
Uruguay749. The Banco De La Republic Oriental Del
Uruguay
USA750 Bangkok Bank Public Company Limited751 Bank of America NA (BOFAUS6S)752 Bank of America, N.A. (BOFAUS3M)753 Bank of America, N.A. (BOFAUS3N)754 Bank of India755 Bank of The West756 Barclays Bank PLC
757 BNP Paribas SA758 Cathay Bank759 Citibank NA760 Citizens Bank N.A.761 Comerica Bank (MNBDUS33)762 Comerica Bank (MNBDUS6S)763 Commerce Bank NA764 Deutsche Bank Trust Company
Americas765 East-West Bank766 Habib American Bank767 HSBC Bank USA768 JP Morgan Chase Bank769 Keybank National Association770 Mashreqbank Psc771 Mizuho Bank Ltd772 MUFG Bank Ltd773 MUFG Union Bank National Association774 National Australia Bank Limited775 Nonghyup Bank776 Nordea Bank ABP777 PNC Bank NA778 Regions Bank779 Shinhan Bank780 Silicon Valley Bank781 Standard Chartered Bank 782 State Bank of India783 Sumitomo Mitsui Banking Corporation784 The Bank of Newyork Mellon785 Truist Bank (BRBTUS33)786 Truist Bank (SNTRUS3A)787 US Bank NA788 Wells Fargo Bank N.A. (WFBIUS6S)789 Wells Fargo Bank N.A. (WFBIUS6W)790 Wells Fargo Bank, N.A. (PMBPUS33)791 Wellsfargo Forex
Vietnam792 Asia Commercial Bank 793 Bank For Foreign Trade of
Vietnam 794 Citibank N.A. 795 Joint Stock Commercial Bank for
Investment and Development of Vietnam
796 Mizuho Bank Ltd 797 Saigon Thuong Tin Commercial Joint
Stock Bank (Sacombank) 798 Shinhan Bank Vietnam Limited 799 Vietnam Bank for Agriculture and Rural
Development 800 Vietnam Technological and Commercial
Joint Stock Bank 801 Woori Bank Vietnam Limited
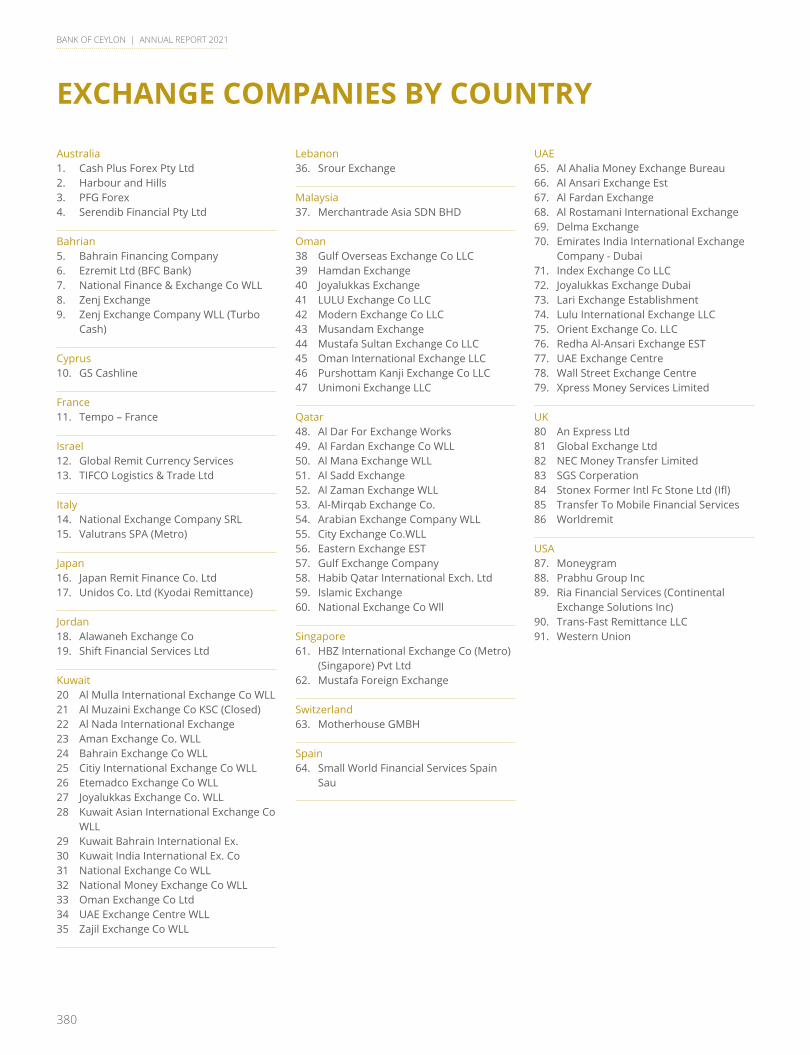
380
BANK OF CEYLON | ANNUAL REPORT 2021
EXCHANGE COMPANIES BY COUNTRY
Australia1. Cash Plus Forex Pty Ltd2. Harbour and Hills3. PFG Forex4. Serendib Financial Pty Ltd
Bahrian5. Bahrain Financing Company6. Ezremit Ltd (BFC Bank)7. National Finance & Exchange Co WLL8. Zenj Exchange9. Zenj Exchange Company WLL (Turbo
Cash)
Cyprus10. GS Cashline
France11. Tempo – France
Israel12. Global Remit Currency Services13. TIFCO Logistics & Trade Ltd
Italy14. National Exchange Company SRL15. Valutrans SPA (Metro)
Japan16. Japan Remit Finance Co. Ltd 17. Unidos Co. Ltd (Kyodai Remittance)
Jordan18. Alawaneh Exchange Co19. Shift Financial Services Ltd
Kuwait20 Al Mulla International Exchange Co WLL 21 Al Muzaini Exchange Co KSC (Closed)22 Al Nada International Exchange23 Aman Exchange Co. WLL24 Bahrain Exchange Co WLL25 Citiy International Exchange Co WLL26 Etemadco Exchange Co WLL27 Joyalukkas Exchange Co. WLL28 Kuwait Asian International Exchange Co
WLL29 Kuwait Bahrain International Ex.30 Kuwait India International Ex. Co31 National Exchange Co WLL32 National Money Exchange Co WLL33 Oman Exchange Co Ltd34 UAE Exchange Centre WLL35 Zajil Exchange Co WLL
Lebanon36. Srour Exchange
Malaysia37. Merchantrade Asia SDN BHD
Oman38 Gulf Overseas Exchange Co LLC39 Hamdan Exchange40 Joyalukkas Exchange41 LULU Exchange Co LLC42 Modern Exchange Co LLC43 Musandam Exchange44 Mustafa Sultan Exchange Co LLC45 Oman International Exchange LLC46 Purshottam Kanji Exchange Co LLC47 Unimoni Exchange LLC
Qatar48. Al Dar For Exchange Works49. Al Fardan Exchange Co WLL50. Al Mana Exchange WLL51. Al Sadd Exchange52. Al Zaman Exchange WLL53. Al-Mirqab Exchange Co.54. Arabian Exchange Company WLL55. City Exchange Co.WLL56. Eastern Exchange EST57. Gulf Exchange Company58. Habib Qatar International Exch. Ltd59. Islamic Exchange 60. National Exchange Co Wll
Singapore61. HBZ International Exchange Co (Metro)
(Singapore) Pvt Ltd62. Mustafa Foreign Exchange
Switzerland63. Motherhouse GMBH
Spain64. Small World Financial Services Spain
Sau
UAE65. Al Ahalia Money Exchange Bureau66. Al Ansari Exchange Est67. Al Fardan Exchange68. Al Rostamani International Exchange69. Delma Exchange 70. Emirates India International Exchange
Company - Dubai71. Index Exchange Co LLC 72. Joyalukkas Exchange Dubai73. Lari Exchange Establishment74. Lulu International Exchange LLC75. Orient Exchange Co. LLC 76. Redha Al-Ansari Exchange EST77. UAE Exchange Centre 78. Wall Street Exchange Centre79. Xpress Money Services Limited
UK80 An Express Ltd 81 Global Exchange Ltd82 NEC Money Transfer Limited83 SGS Corperation 84 Stonex Former Intl Fc Stone Ltd (Ifl) 85 Transfer To Mobile Financial Services86 Worldremit
USA87. Moneygram 88. Prabhu Group Inc89. Ria Financial Services (Continental
Exchange Solutions Inc)90. Trans-Fast Remittance LLC91. Western Union
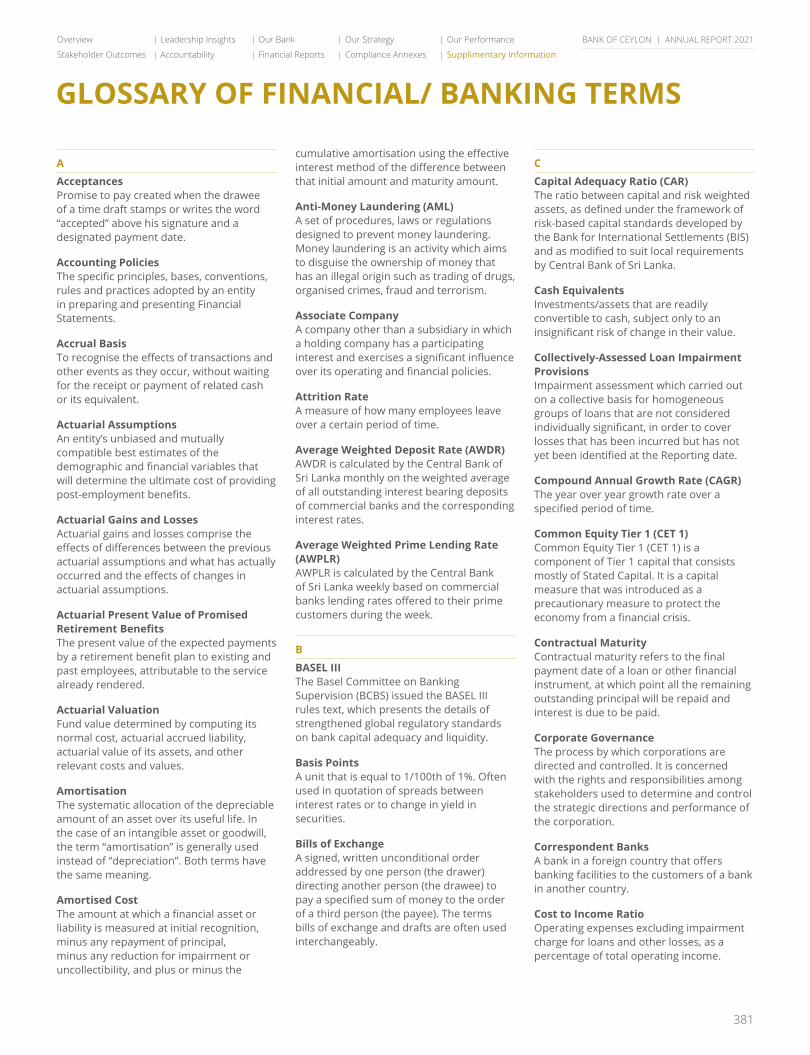
381
Overview Leadership Insights Our Bank Our Strategy Our Performance
Stakeholder Outcomes Accountability Financial Reports Compliance Annexes Supplimentary Information
BANK OF CEYLON | ANNUAL REPORT 2021
GLOSSARY OF FINANCIAL/ BANKING TERMS
AAcceptancesPromise to pay created when the drawee of a time draft stamps or writes the word “accepted” above his signature and a designated payment date.
Accounting PoliciesThe specific principles, bases, conventions, rules and practices adopted by an entity in preparing and presenting Financial Statements.
Accrual BasisTo recognise the effects of transactions and other events as they occur, without waiting for the receipt or payment of related cash or its equivalent.
Actuarial AssumptionsAn entity’s unbiased and mutually compatible best estimates of the demographic and financial variables that will determine the ultimate cost of providing post-employment benefits.
Actuarial Gains and LossesActuarial gains and losses comprise the effects of differences between the previous actuarial assumptions and what has actually occurred and the effects of changes in actuarial assumptions.
Actuarial Present Value of Promised Retirement BenefitsThe present value of the expected payments by a retirement benefit plan to existing and past employees, attributable to the service already rendered.
Actuarial ValuationFund value determined by computing its normal cost, actuarial accrued liability, actuarial value of its assets, and other relevant costs and values.
AmortisationThe systematic allocation of the depreciable amount of an asset over its useful life. In the case of an intangible asset or goodwill, the term “amortisation” is generally used instead of “depreciation”. Both terms have the same meaning.
Amortised CostThe amount at which a financial asset or liability is measured at initial recognition, minus any repayment of principal, minus any reduction for impairment or uncollectibility, and plus or minus the
cumulative amortisation using the effective interest method of the difference between that initial amount and maturity amount.
Anti-Money Laundering (AML)A set of procedures, laws or regulations designed to prevent money laundering. Money laundering is an activity which aims to disguise the ownership of money that has an illegal origin such as trading of drugs, organised crimes, fraud and terrorism.
Associate CompanyA company other than a subsidiary in which a holding company has a participating interest and exercises a significant influence over its operating and financial policies.
Attrition RateA measure of how many employees leave over a certain period of time.
Average Weighted Deposit Rate (AWDR)AWDR is calculated by the Central Bank of Sri Lanka monthly on the weighted average of all outstanding interest bearing deposits of commercial banks and the corresponding interest rates.
Average Weighted Prime Lending Rate (AWPLR)AWPLR is calculated by the Central Bank of Sri Lanka weekly based on commercial banks lending rates offered to their prime customers during the week.
BBASEL IIIThe Basel Committee on Banking Supervision (BCBS) issued the BASEL III rules text, which presents the details of strengthened global regulatory standards on bank capital adequacy and liquidity.
Basis PointsA unit that is equal to 1/100th of 1%. Often used in quotation of spreads between interest rates or to change in yield in securities.
Bills of ExchangeA signed, written unconditional order addressed by one person (the drawer) directing another person (the drawee) to pay a specified sum of money to the order of a third person (the payee). The terms bills of exchange and drafts are often used interchangeably.
CCapital Adequacy Ratio (CAR)The ratio between capital and risk weighted assets, as defined under the framework of risk-based capital standards developed by the Bank for International Settlements (BIS) and as modified to suit local requirements by Central Bank of Sri Lanka.
Cash EquivalentsInvestments/assets that are readily convertible to cash, subject only to an insignificant risk of change in their value.
Collectively-Assessed Loan Impairment ProvisionsImpairment assessment which carried out on a collective basis for homogeneous groups of loans that are not considered individually significant, in order to cover losses that has been incurred but has not yet been identified at the Reporting date.
Compound Annual Growth Rate (CAGR)The year over year growth rate over a specified period of time.
Common Equity Tier 1 (CET 1)Common Equity Tier 1 (CET 1) is a component of Tier 1 capital that consists mostly of Stated Capital. It is a capital measure that was introduced as a precautionary measure to protect the economy from a financial crisis.
Contractual MaturityContractual maturity refers to the final payment date of a loan or other financial instrument, at which point all the remaining outstanding principal will be repaid and interest is due to be paid.
Corporate GovernanceThe process by which corporations are directed and controlled. It is concerned with the rights and responsibilities among stakeholders used to determine and control the strategic directions and performance of the corporation.
Correspondent BanksA bank in a foreign country that offers banking facilities to the customers of a bank in another country.
Cost to Income RatioOperating expenses excluding impairment charge for loans and other losses, as a percentage of total operating income.

382
BANK OF CEYLON | ANNUAL REPORT 2021
GLOSSARY OF FINANCIAL/ BANKING TERMS
Country RiskThe credit risk associated with lending to borrowers within a particular country, sometimes taken to include sovereign risk.
Credit RiskThe risk of loss due to non-payment of a loan or other line of credit (either the principal or interest or both), by the borrower or a counterparty.
Credit RatingsAn evaluation of a corporate’s ability to repay its obligations or the likelihood of not defaulting carried out by an independent rating agency.
DDealing SecuritiesSecurities acquired and held with the intention of reselling them in the short term.
Debt Equity RatioLong-term borrowings divided by shareholder’s equity.
Deferred TaxationSum set aside for tax in the Financial Statements that will become payable/ receivable in a financial year other than the current financial year. It arises because of temporary differences between tax rules and accounting conventions.
Defined Benefit PlansRetirement benefit plans under which amounts to be paid as retirement benefits are determined by reference to a formula usually based on employees’ earning history, tenure of service and age.
DerivativesA financial instrument, the price of which has a strong relationship with an underlying commodity, currency variable or financial instrument.
Documentary Letters of Credit (LC)Written undertakings by a bank on behalf of its customers (typically an importer), authorising a third party (e.g. an exporter) to draw drafts on the Bank up to a stipulated amount under specific terms and conditions. Such undertakings are established for the purpose of facilitating international trade.
Domestic Systemically Important Banks (D-SIBs)Systemically Important Banks (SIBs) are perceived as banks that are “Too Big To Fail”. D-SIBs are critical for the uninterrupted availability of essential banking services to the country’s real economy even during crisis. The CBSL has designated Licenced Commercial Banks with total assets equal to or greater than LKR 500 billion as D-SIBs
Equity MethodA method of accounting whereby the investment is initially recorded at cost and adjusted thereafter for the post acquisition change in the investor’s share of net assets of the invested. The Statement of profit or loss reflects the investor’s share of the results of operations of the invested.
Events After the Reporting DateEvents after the Reporting date are those events, both favourable and unfavourable, that occur between the Reporting date and the date when the financial statements are authorised for issue.
Exchange Company/HouseAn overseas location where the Bank’s representatives provide banking services as a promotional tool.
FFair ValueThe price that would be required to sell an asset or paid to transfer a liability in an orderly transaction between market participants at the measurement date.
Finance LeaseLeases which transfer risks and rewards of ownership. Title may or may not eventually be transferred.
Financing ActivitiesActivities that result in changes in the size and composition of the equity capital and borrowings of the entity.
Financial InstrumentsFinancial instrument is any contract that gives rise to financial asset of one entity and a financial liability or equity instrument of another entity.
Financial Assets Measured at Amortised CostA financial asset is measured at amortised cost if the asset is held within a business
model whose objective is to hold assets to collect contractual cash flows and the contractual terms of the financial asset give rise on specified dates to cash flows that are solely payments of principal and interest on the principal amount outstanding.
Financial Assets Measured at Fair Value through Other Comprehensive Income (FVOCI) FVOCI include debt and equity instruments measured at fair value through other comprehensive income. A debt instrument is measured at FVOCI, if it is held within a business model whose objective is achieved by both collecting contractual cash flows and selling financial assets and the contractual terms of the financial asset give rise on specified dates to cash flows that are solely payments of principal and interest on the principal amount outstanding.
Equity investments may be irrevocably classified as FVOCI when they meet the definition of Equity under LKAS 32- “Financial Instruments: Presentation”, and are not held for trading.
Financial Assets Measured at Fair Value through Profit or Loss (FVTPL)All financial assets other than those classified at Amortised Cost or FVOCI are classified as measured at FVTPL. These are held for trading or managed and their performance is evaluated on a fair value basis as they are neither held to collect contractual cash flows nor held both to collect contractual cash flows and to sell financial assets.
Foreclosed PropertiesProperties acquired in full or partial settlement of debts, which will be held with the intention of resale at the earliest opportunity.
Foreign Exchange IncomeThe gain recorded when assets or liabilities denominated in foreign currencies are translated into Sri Lankan Rupees on the Reporting date at prevailing rates which differ from those rates in force at inception or on the previous Reporting date. Foreign exchange income also arises from trading in foreign currencies.
Forward Exchange ContractsAgreements between two parties to exchange one currency for another at a future date at a rate agreed upon today.
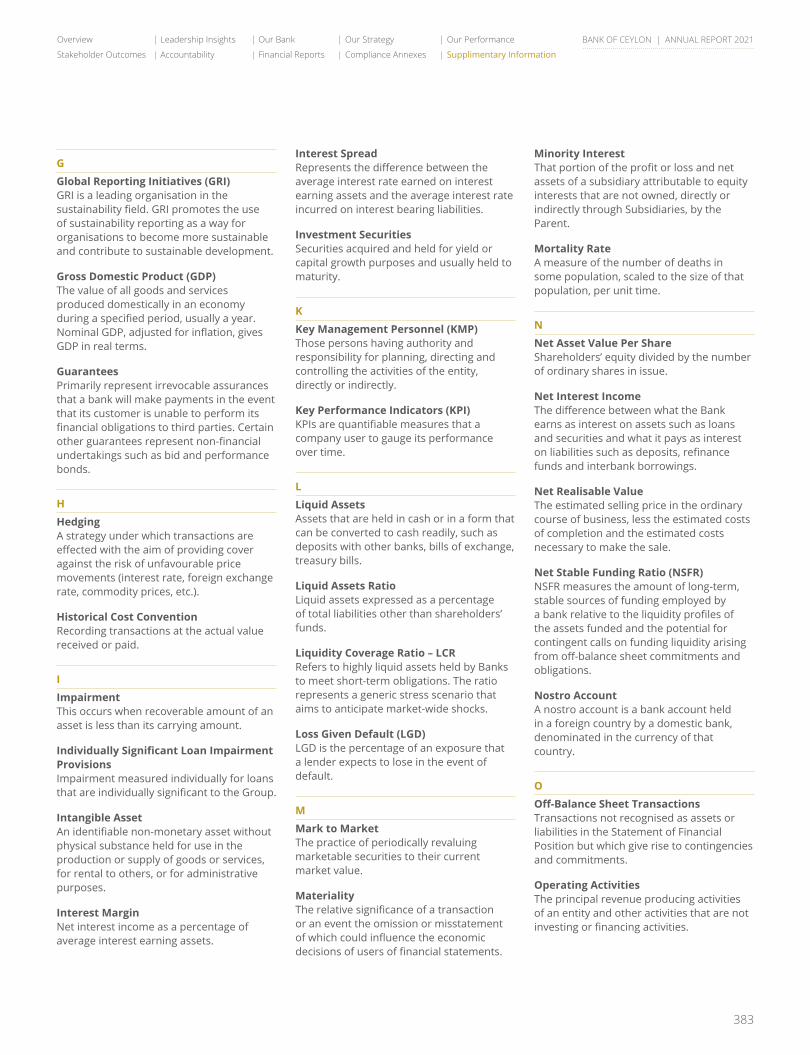
383
Overview Leadership Insights Our Bank Our Strategy Our Performance
Stakeholder Outcomes Accountability Financial Reports Compliance Annexes Supplimentary Information
BANK OF CEYLON | ANNUAL REPORT 2021
GGlobal Reporting Initiatives (GRI)GRI is a leading organisation in the sustainability field. GRI promotes the use of sustainability reporting as a way for organisations to become more sustainable and contribute to sustainable development.
Gross Domestic Product (GDP)The value of all goods and services produced domestically in an economy during a specified period, usually a year. Nominal GDP, adjusted for inflation, gives GDP in real terms.
GuaranteesPrimarily represent irrevocable assurances that a bank will make payments in the event that its customer is unable to perform its financial obligations to third parties. Certain other guarantees represent non-financial undertakings such as bid and performance bonds.
HHedging A strategy under which transactions are effected with the aim of providing cover against the risk of unfavourable price movements (interest rate, foreign exchange rate, commodity prices, etc.).
Historical Cost ConventionRecording transactions at the actual value received or paid.
IImpairmentThis occurs when recoverable amount of an asset is less than its carrying amount.
Individually Significant Loan Impairment ProvisionsImpairment measured individually for loans that are individually significant to the Group.
Intangible AssetAn identifiable non-monetary asset without physical substance held for use in the production or supply of goods or services, for rental to others, or for administrative purposes.
Interest MarginNet interest income as a percentage of average interest earning assets.
Interest SpreadRepresents the difference between the average interest rate earned on interest earning assets and the average interest rate incurred on interest bearing liabilities.
Investment SecuritiesSecurities acquired and held for yield or capital growth purposes and usually held to maturity.
KKey Management Personnel (KMP)Those persons having authority and responsibility for planning, directing and controlling the activities of the entity, directly or indirectly.
Key Performance Indicators (KPI)KPIs are quantifiable measures that a company user to gauge its performance over time.
LLiquid AssetsAssets that are held in cash or in a form that can be converted to cash readily, such as deposits with other banks, bills of exchange, treasury bills.
Liquid Assets RatioLiquid assets expressed as a percentage of total liabilities other than shareholders’ funds.
Liquidity Coverage Ratio – LCRRefers to highly liquid assets held by Banks to meet short-term obligations. The ratio represents a generic stress scenario that aims to anticipate market-wide shocks.
Loss Given Default (LGD)LGD is the percentage of an exposure that a lender expects to lose in the event of default.
MMark to MarketThe practice of periodically revaluing marketable securities to their current market value.
MaterialityThe relative significance of a transaction or an event the omission or misstatement of which could influence the economic decisions of users of financial statements.
Minority InterestThat portion of the profit or loss and net assets of a subsidiary attributable to equity interests that are not owned, directly or indirectly through Subsidiaries, by the Parent.
Mortality RateA measure of the number of deaths in some population, scaled to the size of that population, per unit time.
NNet Asset Value Per ShareShareholders’ equity divided by the number of ordinary shares in issue.
Net Interest IncomeThe difference between what the Bank earns as interest on assets such as loans and securities and what it pays as interest on liabilities such as deposits, refinance funds and interbank borrowings.
Net Realisable ValueThe estimated selling price in the ordinary course of business, less the estimated costs of completion and the estimated costs necessary to make the sale.
Net Stable Funding Ratio (NSFR)NSFR measures the amount of long-term, stable sources of funding employed by a bank relative to the liquidity profiles of the assets funded and the potential for contingent calls on funding liquidity arising from off-balance sheet commitments and obligations.
Nostro AccountA nostro account is a bank account held in a foreign country by a domestic bank, denominated in the currency of that country.
OOff-Balance Sheet TransactionsTransactions not recognised as assets or liabilities in the Statement of Financial Position but which give rise to contingencies and commitments.
Operating ActivitiesThe principal revenue producing activities of an entity and other activities that are not investing or financing activities.
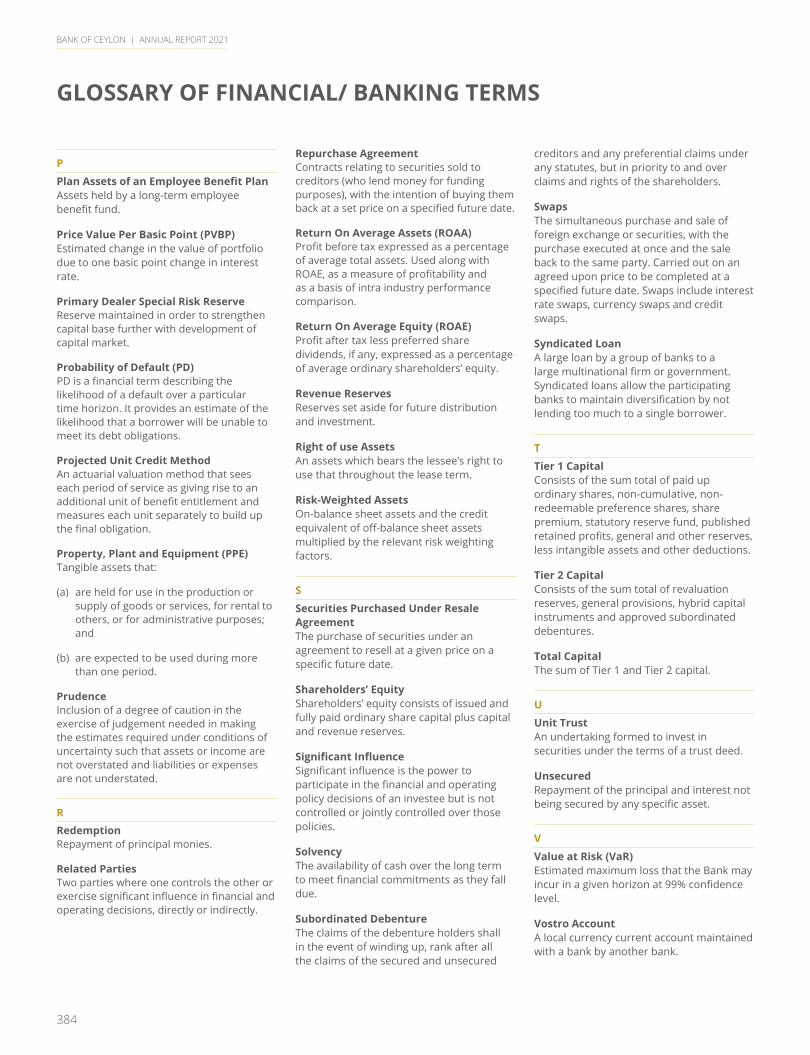
384
BANK OF CEYLON | ANNUAL REPORT 2021
GLOSSARY OF FINANCIAL/ BANKING TERMS
PPlan Assets of an Employee Benefit Plan Assets held by a long-term employee benefit fund.
Price Value Per Basic Point (PVBP)Estimated change in the value of portfolio due to one basic point change in interest rate.
Primary Dealer Special Risk ReserveReserve maintained in order to strengthen capital base further with development of capital market.
Probability of Default (PD)PD is a financial term describing the likelihood of a default over a particular time horizon. It provides an estimate of the likelihood that a borrower will be unable to meet its debt obligations.
Projected Unit Credit MethodAn actuarial valuation method that sees each period of service as giving rise to an additional unit of benefit entitlement and measures each unit separately to build up the final obligation.
Property, Plant and Equipment (PPE)Tangible assets that:
(a) are held for use in the production or supply of goods or services, for rental to others, or for administrative purposes; and
(b) are expected to be used during more than one period.
PrudenceInclusion of a degree of caution in the exercise of judgement needed in making the estimates required under conditions of uncertainty such that assets or income are not overstated and liabilities or expenses are not understated.
R
RedemptionRepayment of principal monies.
Related PartiesTwo parties where one controls the other or exercise significant influence in financial and operating decisions, directly or indirectly.
Repurchase AgreementContracts relating to securities sold to creditors (who lend money for funding purposes), with the intention of buying them back at a set price on a specified future date.
Return On Average Assets (ROAA)Profit before tax expressed as a percentage of average total assets. Used along with ROAE, as a measure of profitability and as a basis of intra industry performance comparison.
Return On Average Equity (ROAE)Profit after tax less preferred share dividends, if any, expressed as a percentage of average ordinary shareholders’ equity.
Revenue ReservesReserves set aside for future distribution and investment.
Right of use AssetsAn assets which bears the lessee’s right to use that throughout the lease term.
Risk-Weighted AssetsOn-balance sheet assets and the credit equivalent of off-balance sheet assets multiplied by the relevant risk weighting factors.
SSecurities Purchased Under Resale AgreementThe purchase of securities under an agreement to resell at a given price on a specific future date.
Shareholders’ EquityShareholders’ equity consists of issued and fully paid ordinary share capital plus capital and revenue reserves.
Significant InfluenceSignificant influence is the power to participate in the financial and operating policy decisions of an investee but is not controlled or jointly controlled over those policies.
SolvencyThe availability of cash over the long term to meet financial commitments as they fall due.
Subordinated DebentureThe claims of the debenture holders shall in the event of winding up, rank after all the claims of the secured and unsecured
creditors and any preferential claims under any statutes, but in priority to and over claims and rights of the shareholders.
SwapsThe simultaneous purchase and sale of foreign exchange or securities, with the purchase executed at once and the sale back to the same party. Carried out on an agreed upon price to be completed at a specified future date. Swaps include interest rate swaps, currency swaps and credit swaps.
Syndicated LoanA large loan by a group of banks to a large multinational firm or government. Syndicated loans allow the participating banks to maintain diversification by not lending too much to a single borrower.
TTier 1 CapitalConsists of the sum total of paid up ordinary shares, non-cumulative, non-redeemable preference shares, share premium, statutory reserve fund, published retained profits, general and other reserves, less intangible assets and other deductions.
Tier 2 CapitalConsists of the sum total of revaluation reserves, general provisions, hybrid capital instruments and approved subordinated debentures.
Total CapitalThe sum of Tier 1 and Tier 2 capital.
UUnit TrustAn undertaking formed to invest in securities under the terms of a trust deed.
UnsecuredRepayment of the principal and interest not being secured by any specific asset.
VValue at Risk (VaR)Estimated maximum loss that the Bank may incur in a given horizon at 99% confidence level.
Vostro AccountA local currency current account maintained with a bank by another bank.
385
Overview Leadership Insights Our Bank Our Strategy Our Performance
Stakeholder Outcomes Accountability Financial Reports Compliance Annexes Supplimentary Information
BANK OF CEYLON | ANNUAL REPORT 2021
Electronic Banking Unit
Management of ATM Card operations, facilitator for Internet and Mobile banking
21st Floor, Bank of Ceylon Head Office, “BOC Square”, No. 01, Bank of Ceylon Mawatha, Colombo 01, Sri Lanka.Tel : +94 11 2204650, 2204674Fax : +94 11 2447569Email : [email protected], [email protected]
Branch Code : 777
Inward Remittances Department
Facilitator in processing inward remittances to Sri Lanka
8th Floor, Bank of Ceylon Head Office, “BOC Square”, No. 01, Bank of Ceylon Mawatha, Colombo 01, Sri Lanka.Tel : +94 11 2439560, 2541933Fax : +94 11 2344845Email : [email protected]
Branch Code : 087
Islamic Banking Unit
Brand house for Islamic Banking products and services
25th Floor, Bank of Ceylon Head Office, “BOC Square”, No. 01, Bank of Ceylon Mawatha, Colombo 01, Sri Lanka.Tel : +94 11 2205030, 2445811Fax : +94 11 2205036Email : [email protected]
Branch Code : 776
Credit Support Department
Issuing of local and International Guarantees and documentation of credit facilities
3rd Floor, Bank of Ceylon Head Office, “BOC Square”, No. 01, Bank of Ceylon Mawatha, Colombo 01, Sri Lanka.Tel : +94 11 2541943Fax : +94 11 2446820Email : [email protected] [email protected]
Branch Code : 660
Correspondent Banking Unit
Gatewaytoglobalbankingandfinancialrelationships
9th Floor, Bank of Ceylon Head Office, “BOC Square”, No. 01, Bank of Ceylon Mawatha, Colombo 01, Sri Lanka.Tel : +94 11 2445791Fax : +94 11 2445791Email : [email protected]/ [email protected]
Branch Code : 087
Dealing Room
Providing money market and foreign exchange related services
7th Floor, Bank of Ceylon Head Office, “BOC Square”, No. 01, Bank of Ceylon Mawatha, Colombo 01, Sri Lanka.Tel : +94 11 2395814, 2445785-7Fax : +94 11 2445788Email : [email protected]
Branch Code : 760
CORPORATE OFFICES AND OVERSEAS BRANCHES
Corporate Offices
BoC Card Centre
Issuing and managing VISA and Master branded Credit Cards, Franchising and servicing merchants using point of sales machines
Level - 01, West Tower, World Trade Centre, Echelon Square, Colombo 01, Sri Lanka.Tel : +94 11 2325088, 2205620, +94 11 2205621, 2325095, +94 11 2541935, 2205650Fax : +94 11 2325092, 2395807Email : [email protected], [email protected]
Branch Code : 731
BoC Premier Centre
Dedicated Centre for Private Banking
No. 21, Sir Ernest De Silva Mawatha, Colombo 07, Sri Lanka.Tel : +94 11 2694282 - 86Fax : +94 11 2694280Email : [email protected]
Branch Code : 788
Ceybank Gold Shop
Supplier of precious gold to the nation
Ground Floor, Bank of Ceylon Head Office, “BOC Square”, No. 01, Bank of Ceylon Mawatha, Colombo 01, Sri Lanka.Tel : +94 11 2345420Fax : +94 11 2345420Email : [email protected]
Branch Code : 087
386
BANK OF CEYLON | ANNUAL REPORT 2021
CORPORATE OFFICES AND OVERSEAS BRANCHES
Primary Dealer Unit
Trading and Investment of Government Securities
7th Floor, Bank of Ceylon Head Office, “BOC Square”, No. 01, Bank of Ceylon Mawatha, Colombo 01, Sri Lanka.Tel : +94 11 2448830, 2203607Fax : +94 11 2448207Email : [email protected]
Branch Code : 760
Trade Promotion Department
Service provider for migrant employee community
9th Floor, Bank of Ceylon Head Office, “BOC Square”, No. 01, Bank of Ceylon Mawatha, Colombo 01, Sri Lanka.Tel : +94 11 2447831, 2203626Fax : +94 11 2346841Email : [email protected], [email protected]
Branch Code : 087
Trade Services Department
Providingtradefinancefacilitiesandservices
2nd Floor, Bank of Ceylon Head Office, “BOC Square”, No. 01, Bank of Ceylon Mawatha, Colombo 01, Sri Lanka.Tel : +94 11 2394310, 2203310Fax : +94 11 2542170Email : [email protected]
Branch Code : 660
Overseas Branches
Male Branch
“Aage” No. 12, Boduthakurufaanu Magu, Henveiru, Male. 20094, Republic of Maldives.Tel : +960 3323045, 3020500Email : [email protected] code : BCEYMVMV
Branch code : 632
Hulhumale Branch
Teak Unit 1, Amin Avenue, Hulhumale, Repuplic of Maldives.Tel : +960 3350921, 3350923Fax : +960 3350924
Chennai Branch
No. 20/21, Casa Major Road, New No. 2 (Old No. 11), Zerat Garden, 2nd Lane, Egmore, Chennai 600 008, India.Tel : +91 44 2819 0972/ 73/ 75 +91 44 3951 9913Email : [email protected] code : BCEYIN5M
Branch code : 758
Seychelles Branch
Oliaji Trade Center, Fransis Rachel Street, P.O. Box 1599, Victoria, Mahe, Republic of Seychelles.Tel : +248 467 3608, 461 1889Email : [email protected] code : BCEYSCSC
Branch code : 807
387
Overview Leadership Insights Our Bank Our Strategy Our Performance
Stakeholder Outcomes Accountability Financial Reports Compliance Annexes Supplimentary Information
BANK OF CEYLON | ANNUAL REPORT 2021
CORPORATE INFORMATION
Name of the InstitutionBank of Ceylon
Legal FormA banking corporation domiciled in Sri Lanka, duly incorporated on 1 August 1939 under the Bank of Ceylon Ordinance No. 53 of 1938.
A licensed commercial bank established under the Banking Act No. 30 of 1988.
Registered OfficeNo. 01, ‘BOC Square’ Bank of Ceylon Mawatha Colombo 01, Sri Lanka
Tel : +94 11 2203333 (Hotline) +94 11 2446790-811 (22 lines) +94 11 2338741-47 (7 lines) +94 11 2445815-20 (6 lines) +94 11 2544340-44 (5 lines) +94 11 2544333-37 (5 lines)
Facsimile : +94 11 2321160Bank code : 7010SWIFT code : BCEYLKLXE-Mail : [email protected], [email protected] : www.boc.lk
Call CentreTel : +94 11 2204444, 1975Facsimile : +94 11 2320864
24 Hour Service CentreTravel Counter, Ground Floor Bank of Ceylon Head Office No. 01, ‘BOC Square’ Bank of Ceylon MawathaColombo 01, Sri LankaTel : +94 11 2203044/ 45Facsimile : +94 11 2445801
Accounting Year End31 December
Tax Payer Identification Number (TIN)409000070
VAT Registration Number409000070-7000
SVAT Registration NumberSVAT002898
Stock Exchange ListingThe Unsecured, Subordinated Redeemable Debentures of October 2013/ October 2023 series, September 2014/ September 2022 series, October 2015/ October 2023 series and December 2016/ December 2024 series with fixed and floating interest rates are listed on Colombo Stock Exchange.
Local Ratings• National Long-term rating: ‘AA-(lka)’
Outlook Stable• Subordinated debentures: ‘A (lka)’ by Fitch
Ratings Lanka Limited• Issuer rating: (SL) AAA (Negative) by ICRA
Lanka Limited
Global Ratings‘CC’ by Fitch Ratings
LawyersMr B K Gurusinghe Chief Legal Officer of Bank of Ceylon and his assistants.Tel : +94 11 2445813/ 2204400Facsimile : +94 11 2321167E-mail : [email protected]
Compliance OfficerMs W B P Rathnayake (Deputy General Manager – Compliance)Tel : +94 11 2448532/ 2204800Facsimile : +94 11 2544306E-mail : [email protected]
AuditorThe Auditor GeneralNational Audit Office306/ 72, Polduwa RoadBattaramulla, Sri LankaTel : +94 11 2887028-34 (6 lines)Facsimile : +94 11 2887223E-mail : [email protected](Appointed in terms of the provisions of Article 154 of the Constitution of the Democratic Socialist Republic of Sri Lanka)
Registrars to the Debenture IssuesBank of CeylonInvestment Banking Division7th Floor, Bank of Ceylon Head Office No. 01, ‘BOC Square’ Bank of Ceylon MawathaColombo 01, Sri Lanka.Tel : +94 11 2394311 +94 11 2448348 +94 11 2346845
Facsimile : +94 11 2346842E-mail : [email protected]
Board of DirectorsMr Kanchana Ratwatte (Chairman)Mr R M Priyantha RathnayakeMr G Harsha WijayawardhanaMr A C Manilka FernandoMajor General (Rtd.) G A ChandrasiriMr Jayampathy Molligoda
Secretary, Bank of Ceylon/ Secretary to the BoardMs Janaki Senanayake Siriwardane
For Clarifications on the Report, Please ContactMr M P Ruwan KumaraDeputy General Manager (Finance and Planning)10th Floor, Bank of Ceylon Head Office No. 01, ‘BOC Square’ Bank of Ceylon MawathaColombo 01, Sri Lanka.Tel : +94 11 2432680 +94 11 2203900Facsimile : +94 11 2448203E-Mail : [email protected]
Audit CommitteeMr A C Manilka Fernando (Chairman)Mr R M Priyantha RathnayakeMr G Harsha WijayawardhanaMajor General (Rtd.) G A Chandrasiri
Integrated Risk Management CommitteeMr R M Priyantha Rathnayake (Chairman)Mr G Harsha WijayawardhanaMr Jayampathy Molligoda
Human Resources and Remuneration CommitteeMr A C Manilka Fernando (Chairman)Mr R M Priyantha RathnayakeMajor General (Rtd.) G A Chandrasiri
Nomination and Corporate Governance CommitteeMr Jayampathy Molligoda (Chairman)Mr A C Manilka FernandoMr R M Priyantha RathnayakeMr G Harsha Wijayawardhana
Information and Communication Technology CommitteeMr G Harsha Wijayawardhana (Chairman)Mr A C Manilka FernandoMr Jayampathy Molligoda

BANK OF CEYLON | ANNUAL REPORT 2021
NOTES

Designed & produced by
Photography by Dimitri CruszPrinting by Gunaratne Offset (Pvt) Ltd

Bank of CeylonNo. 01, BOC Square,Bank of Ceylon Mawatha,Colombo 01, Sri Lanka.
Tel : +94 11 220 3333 (Hotline) +94 11 244 6790-811 (22 lines)Facimile : +94 11 232 1160E-mail : [email protected] [email protected] : www.boc.lk