Financial Reports - CSE
94
-
Upload
khangminh22 -
Category
Documents
-
view
0 -
download
0
Transcript of Financial Reports - CSE


OVERVIEW, PERFORMANCE & GOVER-
NANCE
About us 1Financial Highlights 2Key Events in Chronological Order 6Group Structure 8Our Vision, Mission & Values 9Chairman’s Message 10Chief Executive Officer’s Review 12Risk Management 16New Investments 18Board of Directors 20Executive Staff 23 Year in Pictures 26Corporate Governance 32Audit Committee Report 35Remuneration Committee Report 36
FINANCIAL REPORTS
Annual Report of the Board of Directors 38Statement of Directors’ Responsibilities 45Independent Auditor’s Report 46Balance Sheet 47Income Statement 48Statement of Changes in Equity 49Cash Flow Statement 50Notes to the Financial Statements 51
SUPPLEMENTARY INFORMATION
Ten Years Financial Summary 79Statement of Value Added 80Shareholder Information 81Retail Outlets & Dealer Network List 83Notice of Meeting 88Form of Proxy 89Corporate Information Inner Back Cover

2011/12 2010/11 Change 2009/10Rs.'000 Rs.'000 % Rs.'000
Results for the Year
Gross Turnover 1,499,824 1,194,909 26% 642,236
Profit Before Tax 217,619 170,434 28% 62,651
Profit After Tax 137,178 103,374 33% 35,727
Investment in Property, Plant, & Equipment 178,315 65,355 173% 7,966
Revenue to Government 266,770 222,210 20% 110,784
Value Addition 568,405 503,377 13% 303,567
Position at the Year End
Shareholders' Funds 2,989,909 1,916,074 56% 887,442
Market Capitalisation 2,297,500 2,250,000 2% 1,096,875
Total Assets 3,271,712 2,188,360 50% 1,254,358
Total Borrowings 16,692 74,733 -78% 180,853
Employment - persons 564 475 19% 462
Per Share details
Earnings per share - Rs. 4.51 5.51 -18% 2.86
Market value (year end) - Rs. 91.90 90.00 2% 87.75
Net Assets (year end) - Rs. 87.34 76.64 14% 71.00
Ratios
Gross Profit (Gross Profit/Sales) 27% 32% 37%
Interest Cover (Profit before Interest/Interest) 19.17 7.80 2.77
Current Ratio (Current Assets/Current Liabilities) 6.62 4.70 1.73
Gearing Ratio (Borrowings/Total Assets) 1% 3% 14%
2

-
1,000
2,000
3,000
4,000
5,000
07/08 08/09 09/10 10/11 11/12
Turnover (Rs.) Mn
(100)
-
100
200
300
07/08 08/09 09/10 10/11 11/12
Profitability (Rs.) Mn
Profit before Tax Profit after Tax
(6.00)
(4.00)
(2.00)
-
2.00
4.00
6.00
07/08 08/09 09/10 10/11 11/12
Earning per Share (Rs.)
-
20.00
40.00
60.00
80.00
100.00
07/08 08/09 09/10 10/11 11/12
Net Assets per Share (Rs.)
-
500
1,000
1,500
2,000
2,500
07/08 08/09 09/10 10/11 11/12
Market Capitalisation (Rs.) Mn
-
100
200
300
400
500
600
07/08 08/09 09/10 10/11 11/12
Value Addition (Rs.) Mn
v
3

2011/12 2010/11 Change 2009/10Rs.'000 Rs.'000 % Rs.'000
Results for the Year
Gross Turnover 4,558,444 1,206,583 278% 648,649
Profit Before Tax 124,707 175,352 -29% 62,651
Profit After Tax 43,754 106,939 -59% 35,898
Investment in Property, Plant, & Equipment 189,255 65,355 190% 7,966
Revenue to Government 267,854 223,874 20% 111,368
Value Addition 957,815 502,684 91% 307,910
Position at the Year End
Shareholders Funds 2,940,628 1,907,006 54% 874,809
Market Capitalisation 2,297,500 2,250,000 2% 1,096,875
Total Assets 5,543,699 4,754,992 24% 1,242,464
Total Borrowings 1,354,401 1,301,797 4% 180,854
Employment - persons 1,747 475 268% 462
Per Share details
Earnings per share - Rs. 3.02 5.70 -47% 2.87
Market value (year end) - Rs. 91.90 90.00 2% 87.75
Net Assets (year end) - Rs. 85.90 76.28 13% 69.98
Ratios
Gross Profit (Gross Profit/Sales) 17% 33% 38%
Interest Cover (Profit Before Interest/Interest) 3.03 11.05 2.77
Current Ratio (Current Assets/Current Liabilities) 1.42 1.17 1.67
Gearing Ratio (Borrowings/Total Assets) 24% 29% 15%
4

-
1,000
2,000
3,000
4,000
5,000
07/08 08/09 09/10 10/11 11/12
Turnover (Rs.) Mn
(100)
(50)
-
50
100
150
200
07/08 08/09 09/10 10/11 11/12
Profitability (Rs.) Mn
Profit before Tax Profit after Tax
(4.00)
(2.00)
-
2.00
4.00
6.00
07/08 08/09 09/10 10/11 11/12
Earning per Share (Rs.)
-
20.00
40.00
60.00
80.00
100.00
07/08 08/09 09/10 10/11 11/12
Net Assets per Share (Rs.)
-
500
1,000
1,500
2,000
2,500
07/08 08/09 09/10 10/11 11/12
Market Capitalisation (Rs.) Mn
-
200
400
600
800
1,000
1,200
07/08 08/09 09/10 10/11 11/12
Value Addition (Rs.) Mn
v
5


Not
e : P
erce
ntag
e vo
ting
right
s hel
d in
dica
ted
in %
A
CR
ON
YM
S E
RI
E
nviro
nmen
tal R
esou
rces
Inve
stm
ent P
LC
D
NH
*
DN
H F
inan
cial
s (Pv
t) Lt
d.
CLP
PLC
*
Cey
lon
Leat
her P
rodu
cts P
LC
R
oom
sNeT
rave
l **
Ro
omsN
et T
rave
l (Pv
t) L
td.
SAT
**
So
uth
Asia
Tex
tile
Indu
strie
s Lan
ka (P
vt)
D
PL
* D
anko
tuw
a Po
rcel
ain
PLC
PH
AR
*
Col
ombo
Pha
rmac
y C
ompa
ny P
LC
O
LAN
CO
M
* O
lanc
om (P
vt) L
td.
ET
PL
**
Ent
erpr
ise T
echn
olog
ies (
Pvt)
Ltd.
SEN
IT
**
Seni
t Tec
hnol
ogie
s (Pv
t) Lt
d.
CLP
DL
**
Cey
lon
Leat
her P
rodu
cts D
istrib
utor
s (Pv
t)
R
oom
sNet
**
Ro
omsN
et In
tern
atio
nal
Ltd.
PA
LLA
**
Pa
lla &
Com
pany
(Pvt
) Ltd
.
* D
irect
Sub
sidia
ries o
f ERI
**
Indi
rect
Sub
sidia
ries o
f ERI
*
** A
ssoc
iate
of E
RI
100%
10
0%
100%
93%
10
0%
66%
PHAR
CL
PPLC
DNH
8%
58%
ERI
OLA
NCO
M
86%
51%
10
0%
SEN
IT
Room
sNet
ETPL
PALL
A
CLPD
L
DPL
60%
8%
GROU
P ST
RUCT
URE
100%
SA
T
Room
sNet
Tr
avel

VisionTo be the undisputed leader in the “RealLeather” market for apparel and related ac-cessories and to be synonymous with “RealLeather and Real Designs”.
MissionTo be Sri Lanka’s undisputed leader & benchmarkfor leather apparel products delivered by compe-tent & committed employees to a satisfied & loyalcustomer base, both in Sri Lanka & abroad, pro-viding excellent & sustainable shareholder value.
ValuesTo be a customer driven company exceedingcustomer expectations and adhere to high eth-ical standards and practices. To adopt a pro-fessional approach in all our dealings, to betransparent, to value employee developmentand their happiness.
9
Dear Shareholders,
It gives me great pleasure to welcome all of you, onbehalf of the Board of Directors of the CeylonLeather Products PLC to the Annual General Meet-ing 2012. I am also pleased to present to you the An-nual Report and the Audited Statement ofAccounts in respect of the financial year ended31st March 2012.
Although the company’s history goes back to theyear 1939 it was listed as a public company only inthe year 2003 at which time the company had lessthan 1,000 shareholders. I am proud to say that thenumber of shareholders has now risen to over 2,000proving the public trust and confidence the com-pany has gained over during this short period.
In my message last year I indicated that the com-pany has been able to turn around and achieve in-creased profits by increasing turnover, utilization ofoptimum capacity, taking action on reducing cost,modernization in the manufacturing process andmaintaining industrial peace. This trend continuedduring the financial year as well resulting after taxprofits reaching Rs. 137 million compared to Rs. 103million last year.
I am pleased to inform our valued shareholdersthat the company acquired majority shares of Palla& Co. (Pvt) Ltd which is a ladies footwear manu-facturing company located in KEPZ.
This enabled us to obtain the services of the foreignconsultants and designers attached to Palla & Co.(Pvt) Ltd to upgrade the products of DI as well. Inaddition Palla’s marketing network can be made useof to promote DI products internationally in the fu-ture. As at present Ceylon Leather Products PLC isthe major shareholder of South Asia Textile Indus-tries Lanka (Pvt) Ltd and Palla & Co. (Pvt) Ltd. Cey-lon Leather Products PLC has minor shareholdingin Dankotuwa Porcelain Plc in which the majorityshares are held by Environmental Resources Invest-ment PLC. The principal shareholder of CeylonLeather Products PLC is also the Environmental Resources Investment PLC.
Sri Lanka’s sustained growth momentum has takenthe country to high growth trajectory which is re-flected in the increased per capita income to US$2,836. The increase in the disposable income of thepublic augurs well to increase the demand for leatherproducts as well. It has been found that there is ademand for up market high value footwear by theurban and semi urban consumers, and the companyhas made arrangements to cater to this segmentcompeting with imported footwear.
The reduction of duty on imported shoes by theBudget 2011 has had detrimental effects on thelocal shoe industry. This certainly affects local man-ufacturers of high end shoes.
The government’s decision to introduce innovativedesigns through the National Designs Centre will fa-cilitate the industry to cut down cost of productionand enable the use of state-of-the-Art Technologyin our production process. These will supplementthe in-house design capabilities augmented by Pallaexpertise in the field which will enable us to growsuccessfully both at the local and international mar-kets.
The Board of Directors are confident of our futuregrowth and on behalf of the Board I wish to thankall our valued stake holders who kept their trust andconfidence on us. My special thanks goes to our en-ergetic Managing Director/Chief Executive OfficerMr. Sitendra Senaratne, the Management team andall levels of staff whose contribution and dedica-tion to the Company brought about the continuousgrowth.
We have strived hard to achieve success and makethis Company even better and we shall adhere to ourmotto “ We Make it Work”.
(Sgd.)Lalith HeengamaChairman
07th August 2012
10

ys;j;a fldgialdr Nj;=ks"
fuu jif¾ jd¾Isl uyd iNd /iaùug meñKs Tn yeu
fok wOHlaI uKav,h fjkqfjka ms<s.ekSug ,eîu
ug uy;a i;=gls' tfiau ud¾;= 31 Èkfhka wjika jQ
uqo,a j¾Ih fjkqfjka jQ wOHlaIuKav, jd¾Isl
jd¾;dj iy ú.Kk lrk ,o .sKqï m%ldYkho Tn
fj; bÈßm;a lrkafka uy;a i;=glsks'
wm iud.fï b;sydih 1939 jir ;rï wE;g hk kuqÿ
fmdÿ iud.ula f,ig fldgia fj<`ofmdf,a ,shdmÈxÑ
lrk ,oafoa 2003 jif¾ §h' tu wjia:dfõ§ wm
iud.fï fldgialdr Nj;=ka ixLHdj oyilg wvq
m%udKhlg iSud úh' wo olajdjQ flá ld,h ;=, fld-
gia lrejka fooyila blaujd we;' fuhska wm
iud.u flfrys Tjqka ;nd we;s úYajdikSh;ajh
;yjqre fõ'
miq.sh jif¾ wmf.a mKsúvfhys wm ioyka lf,a
iud.u úiska l%shd;aul lrk ,o msßjegqu jeä lsÍu"
Wmßu Odß;djh m%fhdackhg .ekSu" úhoï wvqlr
.ekSfï mshjr .ekSu" ksIamdok l%shdj,sh kùlrKh
yd ld¾ñl iyfhda.S;djh u`.ska ,dNh Wmßu lr
.ekSug l%shd l< njh' fuu j¾Ifhao tu mshjrj,a
.ekSu ksid miq.sh jif¾ ,enQ Y+oaO ,dNh jQ remsh,a
ñ,shk 103 blaujd ñ,shk 137 olajd kxjd,Sug iu;a
ùuq'
tfiau wmf.a w.kd fldgialdr Nj;=ka fj; oekaúh
lreKla jkafka isf,daka f,o¾ fm%dvlaÜia iud.u
lgqkdhl ksoyia fj<o l,dmfha msysá me,d iy
iud.fuys nyq;r fldgia ñ, § .;a njhs' fuu
iud.u ldka;d mdjyka ksmojk úfoaYSh iud.uls'
fuu iud.u w;alr .ekSu ksid wu;r jYfhka thg
wkqhqla; WmfoaYlhskaf.a yd fudaia;r ks¾udKlre-
jkaf.a iydho wm iud.ug ,nd .ekSug;a fuu
iud.u we;s lrf.k we;s cd;Hka;r wf<ú cd,h o
Wmfhda.S lrf.k u;= l,l§ isf,daka f,o¾
fm%dvlaÜia iud.fï ksIamdok wmkhkhgo iydh lr
.; yels fõ'
me,d iud.fuys nyq;r fldgia ñ,§ .ekSu;a iu`.
isf,dka f,o¾ fm%vlaÜia iud.ï iuQyh ;j;a jHdma;
ù we;' oekg wm iud.ug wkqnoaO iud.ï jkqfha
isf,dAka f,o¾ fm%vlaÜia äiaá%ìhqg¾ia fm!oa.,sl
iud.u" ijq;a taIShd fglaiaghs,aia fm!oa.,sl iud.u
iy me,d mdjyka fm!oa.,sl iud.uh'óg wu;rj wm
iud.fuys m%Odk fldgialdr iud.u jk tka-
jhrkaukag,a ßfidaiia bkafjiaÜukaÜ mS t,a iS
iud.ug nyq;r fldgia ysñ okafldgqj fmdaisf,aka
iud.fïo fldgia j, wm iud.u wdfhdackh lr
we;'
Y%S ,xldfõ tal mqoa., wdodhu fvd,¾ 2836 la ms<sìUq
lrk by< j¾Okhla ,nd f.k we;' ck;djg
w;sf¾l úh meyeoï oeÍug yels wdodhula ;sîu ksid
iïNdKav flf¾ we;s b,a¨u jeä ùugo bv ;sfí'
úfYaIfhkau kd.ßl iy w¾O kd.ßl mdßfNda.slhka
w;r ;;ajfhka by< jeä ñ, mdjyka i`oyd b,a¨u
jeä ù we;' tu b,a u imqrd,Su i`oyd wdkhkh lrkq
,nk mdjyka iu`. ;r`. l< yels mdjyka ksIamdokh
lsÍu i`oyd wm iud.u lghq;= lrf.k hkq ,efí'
tfia jqjo 2011 whjefhka wdkhkh lrk im;a;= j,
nÿ uqo, wvq lsÍu ksid foaYSh mdjyka l¾udka;hg
wjdisodhl ;;ajhla we;s ù we;s w;r úfYaIfhkau
by< jákdlñka hq;a mdjyka ksmojkqkag wys;lr
n,mEula ksYaÑ;fhkau we;s ù we;' wm wdh;kfha
fudaia;r ks¾udKhg w;sf¾lj rch .;a ;SrKhla u;
cd;sl fudaia;r uOHia:dkh úiska kj ks¾udKd;aul
fudaia;r iemhSu iïNdKav ksIamdokfha§ jeh wvq lr
.ekSug yels jkq we;'
tfiau ksIamdok l%shdj,sfha§ kùk ;dlaIK Wmfhda.S
lr .ekSfuka foaYSh yd cd;Hka;r fj<ofmd<g
id¾:lj msúiSug yels jkq we;'
iud.fï wkd.; j¾Okh iy id¾:l;ajh ms<sn`oj
wOHlaI uKav,hg oeä úYajdihla we;' wm fj;
fldgialdr Nj;=ka iy wfkl=;a md¾Yj lrejka ;nd
we;s úYajdih .ek wOHlaI uKav,h fjkqfjka uf.a
ia;+;sh m< lrñ' wm iud.fï wLKav j¾Okh we;s
lsÍfuys,d lemjQ iud.fï ish¨ ;drd;srï j, fiajl
uy;au uy;aókag iy úfYaIfhkau wm%;sy;
ffO¾hfhka l%shd lrk l<uKdldr wOHlaIl"m%Odk
úOdhl ks<OdÍ isf;akaø fiakdr;ak uy;dg;a wmf.a
úfYaI ia;+;sh m< lruq'
wms id¾:l;ajh wLKavj wdrlaId lr.ekSu Wfoid;a
iud.u úYsIaghka w;r úYsIagu iud.u njg m;a
lsÍug lemfjuq' wmf.a wdo¾Y mdGh jk —wm th
mK.kajuq˜ wkqj lghq;= lruq'
,,s;a ySka.u
iNdm;s
isf,daka f,o¾ fm%dvlaÜia
07 wf.daia;+ 2012
11

Macro Outlook
Historically for centuries the economies of theAsian countries have been in the shadow of theWestern countries. The position has changed com-pletely; the Asian economies became the growtharea for the global economy, whilst the Westerneconomies had to struggle with debt crisis.
The period under review was characterized by amixed operating environment. Sri Lanka recordedan economic growth of 8.3% and a growth of10.8% in the textile, apparel and leather sector. SriLanka was ranked as one of the fast growingeconomies in 2011. The situation changed in year2012. Sri Lankan economy too had to face themacro economy turbulence. The growth in moneysupply influenced by certain import duty reductionsled to excess demand on imports leading to widen-ing the current account deficits and pressure on thebalance of payment. As a result the prevailedfavourable conditions such as low interest rates, sta-ble currency rates, low inflation and economicgrowth changed to adverse conditions creating anumber of implications to the manufacturers.
Company Outlook
During the year under review, the Company main-tained the growth trend from the previous year andreached the mark of Rs. 1.5 bn turnover reflectinga growth of 25% over the previous year’s Rs. 1.2 bnturnover. The Company achieved a net profit afterTax of Rs. 137 mn compared to last year which wasRs. 106 mn. This was possible due to the total com-mitment of all categories of employees in the strate-gic business units coupled with the continuedsupport and guidance of the major shareholder.
The duty for imported footwear was reduced fromthe Budget 2011. This will definitely have an adverseimpact on the local shoe industry especially for com-panies producing high quality, up market footwear.There is a high expectation amongst the
manufacturers that the Government will interveneto safeguard and to protect the local manufacturersand prevent import dumping.
Review of Achievement
Tannery
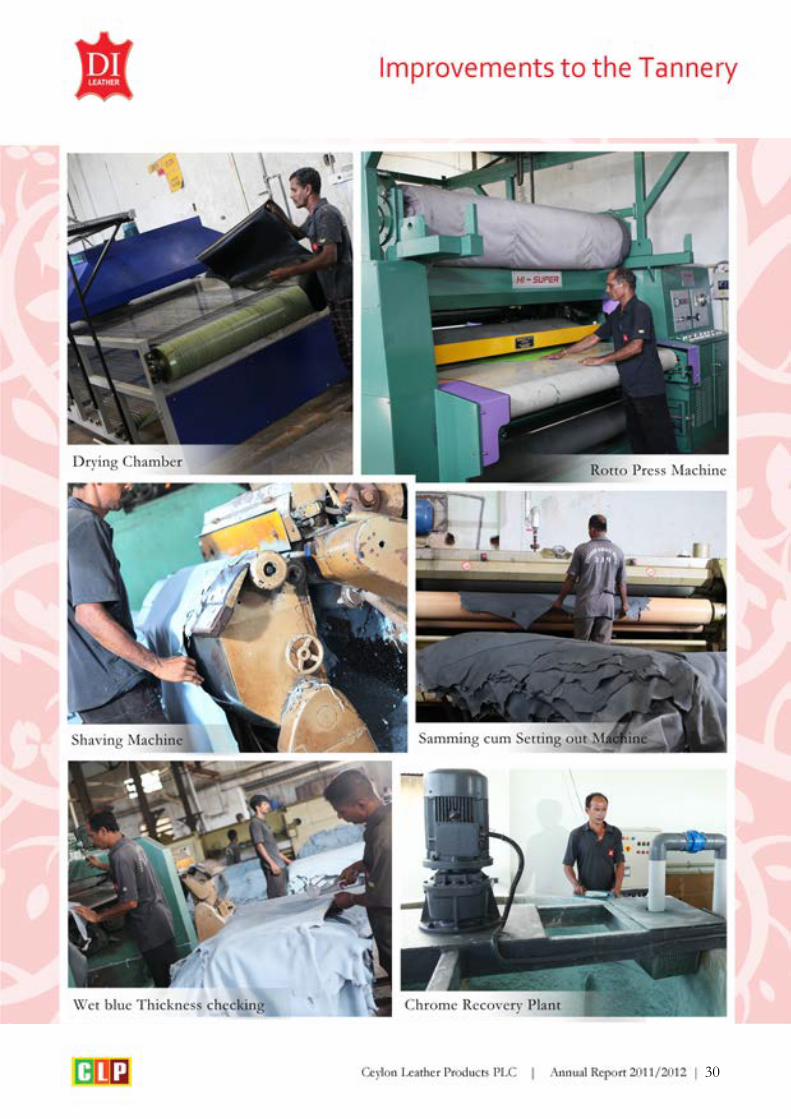
The turnover of the tannery during the year underreview including internal transfers was Rs. 326.4 mncompared to Rs. 226.9 mn in the previous financialyear. A total sum of Rs. 44.6 mn was invested duringthe year under review in relation to the moderniza-tion programme, to enhance the quality of productsand the productivity. Infrared Drying Chamber, Hy-draulic Sammying cum Setting Out Machine,through feed Hydraulic Ironing and Embossing Ma-chine and a Dosemat Experimental Drum weresome of the major equipment which were pur-chased. It is expected to continue the modernizationprogramme which would enable the tannery to pro-duce leather of high quality in keeping with inter-national standards.
Footwear Factory
There was continues upward growth in the turnoverof the shoe factory. During the year under reviewthe turnover recorded was Rs. 1,385 mn as com-pared to Rs. 1,124 mn last year reflecting a growthof 23%.
A total sum of Rs. 54.6 mn was invested in plant andmachinery. The greater portion of the investmentwas on a new production line. This new line is basedon a process which has polyurethane instead ofconventional sole moulded to the shoe upper. Thisinvestment cost the company Rs. 47.0 mn. The newplant will give the opportunity to produce doubledensity safety footwear and light weight high qualitydomestic footwear in volumes enabling the market-ing to compete with imports. This new productionprocess will also ease the undue pressure on otherconstruction lines enabling the shoe factory to meetthe demands of the marketing department.
12

Leather Products Factory
The previous year’s turnover of the leather productsunit was below expectation compared to other man-ufacturing units . The year under review saw a greatimprovement. The growth of this unit was two fold.Year under review, the turnover was Rs. 81.7 mncompared to Rs. 38 mn last year. This is highly cred-itable and was possible due to corrective and strate-gic initiatives taken by the management. Themanagement expects greater contributions fromthis segment in the future.
Marketing
The momentum that was recorded in this segmentlast year continued during the year under review.This year the Company recorded a turnover of Rs.1,499 mn compared to Rs. 1,195 mn last year.
Ceylon Leather Products Distributors (Pvt) Ltd, thedistribution arm of the Ceylon Leather ProductsPLC, made a profit of Rs. 5.3 mn which contributedtowards the profitability of the group.
The Company forged ahead with the Leather Bou-tique concept by adding two more shops to its retailchain. Due to the peaceful environment, in theNorth and the East, marketing operations expandedto these two areas. However greater results are yetto be realized in this expansion programme.
The commercial vehicle fleet was increased by in-vesting Rs. 2.6 mn. Plans are afoot to strengthenthe Marketing Department in order to capitalize onthe present and future opportunities.
The vacuum in the export segment is expected to befilled with the acquiring of Palla & Co. (Pvt) Ltd.A significant growth is expected in this segment.This new factory essentially caters for the exportmarket with ladies designs. The contribution fromthis factory will further enhance the profitability ofour Company in the future.
Management Information System
The Company continued with implementing pro-duction modules and currently initial action has beentaken to capture primary information in product de-velopment areas. The Company has taken necessarysteps to computerize sales outlets in order to capturereal time sales information to the enterprises re-sources system (ERP). Computerization of six retailshops is already completed. A total sum of Rs. 3.5mn was invested during the year under review,which included the purchase of Microsoft LicensedSoftware.
The Finance Cost
The cost of finance for the period under review wasRs. 12.49 mn as compared to previous year whichwas Rs. 25.33 mn. This lower figure was achieveddue to consistent and prudent pursuance of effec-tive working capital management supported by pos-itive cash flows generated from operations. This wasachieved despite rising interest rates and increasedworking capital requirements to support the growthin turnover in the year under review.
Industrial Relations
Industrial relations during the year under review wasstable. The collective agreement signed in year 2009with the Trade Unions ended in March 2012. Themanagement is having discussions under the guid-ance of the Employers’ Federation of Ceylon withthe employee representatives to finalize a newagreement . The negotiations are based on a reason-able salary increase spread over 3 years for perma-nent non executive employees and to reach anagreement to increase the production norms. Themanagement is confident that an agreement couldbe reached resulting in a “ Win Win situation“ forall parties.
Absenteeism has been a perennial problem. In thisrespect every effort was made to reduce the rate of
13

absenteeism by counseling and interviewing the per-sonnel concerned. While this action is been contin-ued it is envisaged to implement a monetary benefitscheme in the form of an attendance bonus withinthe frame of the Collective Agreement which is ne-gotiated at present.
Corporate Social Activities
We consider social responsibilities as an ethical ob-ligation. The Company has no expectations in re-turn for its involvements in social activities.
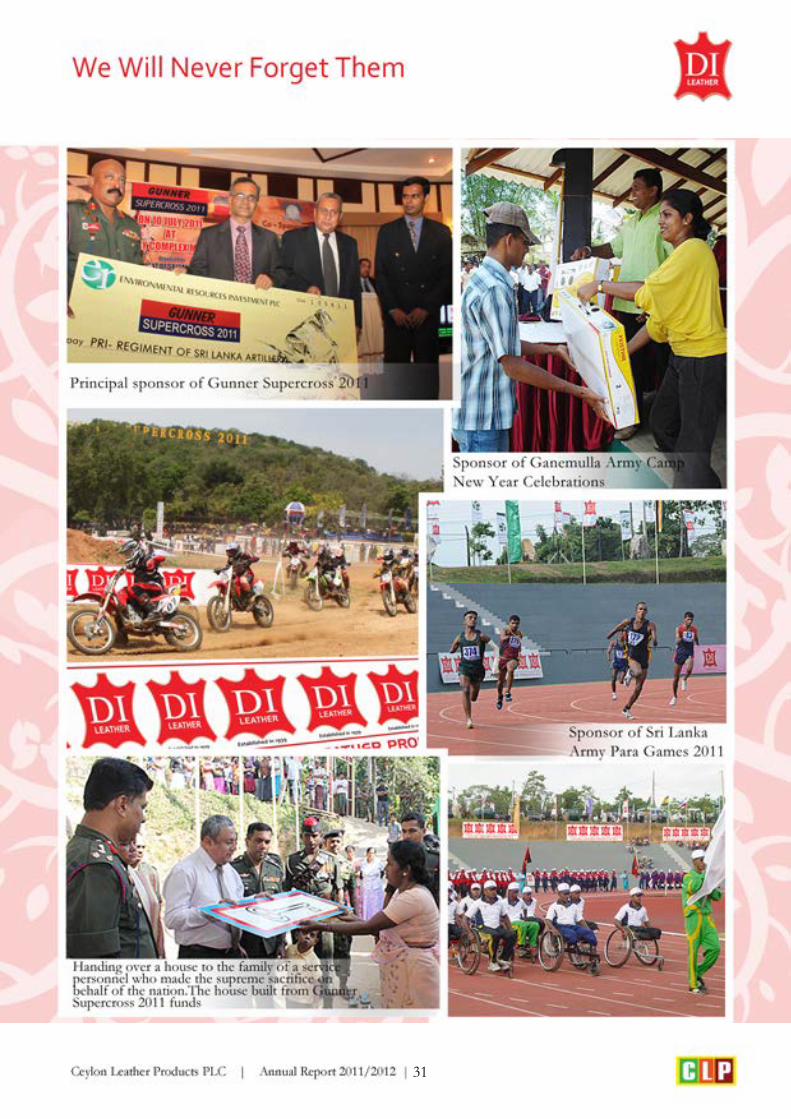
During the period under review the Company hassponsored many major events in the Forces and sev-eral events in needy schools. The participants whorepresented Henerathgoda Kepitipola MadyamahaVidyala in Martial Arts Competition held in Malaysiawas sponsored by us. We undertook to sponsor theAnnual Prize Giving of Rathupaswela Bodiraja Col-lege. The school has a history of 48 years but it hadnever held a Prize Giving due to lack of funds. Do-nated shoes required by the Thotawatte MethodistVidyala Eastern Band. Sponsored the Chess Teamof Belummahara Rahula Vidyalaya, Mudungoda totour India for a tournament. We also have assistedmany social organizations in the area.
Internally those who have completed 25 years ofservice were awarded the customary Oil Lamp. We had Posson Bakthi Geetha organized by the ShoeFactory staff and a Dansala . In December 2011 forthe first time, Christmas Carols were sung in theShoe Factory premises with public participation.
We also took the intiative to celebrate mass at theTannery premises during the annual feast of St.An-thony.
Government Revenue
The Company’s contribution to the Governmentrevenue by way of taxes for the period under reviewwas Rs. 266.7 mn as compared to Rs. 222.5 mn theprevious year.
Subsidiaries
Palla & Co. (Pvt) Ltd
During the period under review total investment ofRs. 453.7 mn was made in relation to the acquisitionof 60% stake in Palla & Co. (Pvt) Ltd, a high endfashion footwear manufacturing co. in the Katu-nayake Export Promotion Zone.
The profitability of the Company was hampered dueto the current adverse economic situation in Europe. However, the Company managed to make a gross profit of Rs. 96.0 mn and a net profit of Rs. 3.2 mnduring the period under review.
The management is looking into the possibility ofdeveloping new markets in the region as an alterna-tive to the European Union and US.
South Asia Textile Industries (Pvt) Ltd
Ceylon Leather Products PLC along with the prin-cipal shareholder Environmental Resources Invest-ment PLC holds 59% stake of South Asia TextileIndustries (Pvt) Ltd (SAT). The financial results ofthe Company showed a recovery during the periodunder review. The gross profit for the year under re-view was Rs. 328.7 mn compared to a loss of Rs.29.5 mn during the previous year. The loss for theyear was Rs. 118.4 mn compared to a loss of Rs750.7 mn during the previous year.
After the acquisition, the Company has changed themarketing strategy and is giving preference to thedomestic export oriented industries instead of directexports. Measures are being implemented to reducecost, streamline purchases and control inventory.The Compliance Unit of Environmental ResourcesInvestment PLC group has implemented strict mon-itoring procedures which are being reflected in theimproved performance.
14

Dankotuwa Porcelain PLC
Ceylon Leather Products PLC holds 8% of theshares of Dankotuwa Porcelain PLC whilst the prin-cipal shareholder Environmental Resources Invest-ment PLC holds 58%. The company’s marketingactivities were hampered due to the crisis in Europeand USA. The management of Dankotuwa Porce-lain PLC under the guidance of Envirmental Re-sourses Investment PLC has been taking steps toadopt new strategies to find new markets and to im-plement productivity improvement measures toovercome the situation.
Awards
DI Brand was placed within the 100 most valuablebrands by the Brand Finance presented by the MediaServices.
At the National Business Excellence Award 2011,organized by the National Chamber of Commerceof Sri Lanka, the Company received the Runnersup award in the Manufacture of Apparel , Textileand Leather Products sector.
The Company was also awarded the Bronze Awardfor Agriculture bulk sector by the National Chamberof Exporters of Sri Lanka.
Future Outlook
The key focus will remain on consolidation. Thereis a limit the Company can expand in the naturalleather based products during the coming years.Strategies will be implemented to safe guard themarket share in the institutional sales and to spreadwings in the domestic market.
The designers and the technical experts with thehelp of the foreign consultants are planning to pro-duce a range of high quality fashion shoes for bothgents and ladies to compete with the up market im-ports and targeting the urban and semi urban pop-ulation.
South Asia Textile Industries Lanka (Pvt) Ltd is op-erating around 60 – 65% capacity and will increase the capacity gradually catering to the export ori-ented garment manufactures.
The demand for fashion footwear produced inPalla & Co. (Pvt) Ltd was less compared to the pre-vious years due to the crisis in the EU. The man-agement is in the process of identifying newmarkets to utilize the capacity.
The Company is also looking at the possibility ofintroducing its own global brand. A new Design Consultant from Europe is in the process of devel-oping a new collection.
Acknowledgement
I take this opportunity to thank the Chairman and the Directors for their continued guidance and di-rection given at all times.
Principal shareholder Environmental Resources In-vestment PLC continued their contribution unhesi-tatingly towards good governance of themanagement of the Company. The involvement ofERI in the Company is reflected in the growth ofthe Company during the past 3 consecutive finan-cial years.
I will be failing in my duty if I do not acknowledgethe commitment, dedication and the cooporation ofthe staff at all levels . Their continuous commit-ment will help to make our Company the undis-puted leader in the leather products segment.
I extend my sincere appreciation to all stakeholdersespecially to all our shareholders who had alwaysbeen supportive of the Company.
(Sgd.)Sitendra SenaratneManaging Director, Chief Executive Officer
07th August 2012
15

MATERIAL FORESEEABLE RISK FACTORS The Company identifies those uncertain events, which could have an adverse effect on the achievement of the organization’s operational and financial objectives as risk factors. Risk Management is the practice of managing the resources of the operation in such way as to maintain an acceptable level of risk. The Board of Directors of the Company places special emphasis on the management of business risk, providing assurance that sound system of controls are in place in order to manage and mitigate the potential impact of such risks. Ceylon Leather Products PLC, being in the manufacturing and marketing of Leather, Leather footwear and Leather goods industry is exposed to a multitude of risks. Operational Risk Operational risks are those relating to firm’s business model, product, satisfying customers, and achieving company’s quality, cost, and performance objectives. The Company has designed and implemented internal control procedures to prevent operational risks that may arise in day to day activities. These include daily, weekly, monthly, quarterly and yearly reporting. The quality and effectiveness of such systems are subject to regular review by the Management and updated with appropriate changes where necessary to suit the changing business environment. Regular checks and audits are carried out by the compliance unit to ensure that these systems and procedures are being adhered to. Credit Risk Credit risk is the potential financial loss arising from payment delays and non-payment from debtors. Company implements regular monitoring and debt collection procedures. In addition, Company implements customer based specific credit policies and payment terms. Capacity Utilization Risk Insufficient capacity hinders the Company’s ability to meet customer demands in time, and on the other hand excess capacity affects achievement of competitive profit margins. This risk is mitigated by effective budgeting and forecasting done on regular intervals. The Company forecasts its supply position in line with expected demand and other relevant factors. This is being monitored thereafter on a monthly and quarterly basis against actual performance and corrective measures taken where necessary. Liquidity Risk Liquidity refers to the ability of the Company to meet financial obligations as they become due without affecting the day to day operation. The Company carries out regular cash flow forecasts with projected cash inflows and expected payment commitments giving sufficient leverage to corrective measures where appropriate.
16

Interest Rate Risk Refers to as the negative impact on the profitability as a result of interest rate increases. The exposure to interest rate risk is managed successfully by negotiating better rates by offering sound security, operating within approved credit limits and making repayment of loans on time. Effective working capital management and customer payment terms helped in mitigating interest rate risk. Legal Risk Legal risk arises from legal consequences of a transaction or any other legal implications which may result in unexpected losses to the Company. The Company has placed special emphasis on this and is subjected to regular review by the management committee and Board of Directors. Where necessary specific issues are being referred to outside experts’/consultants’ opinion. Reputation Risk In the macro environment, reputation has become an organization’s most valuable asset. The Company has recognized the need of maintaining good reputation and in order to protect itself ensure the compliance with all legal and statutory requirements and maintain high standard of ethics and increasing transparency. Company’s responsibility to all stakeholders and to the country take precedence over everything else. Changes in Designs and Fashion Risk Footwear and leather goods market is often exposed to changes in consumer taste in relation to latest designs and fashion trends. The Marketing department keeps a regular tab on consumer trends reactions in order to take prompt measures. In addition Company’s design studio which comprises of well experienced design staff carries out frequent developments in this area. Cost Inflation Risk Identified as potential impact on profitability due to increasing costs of inputs. Inflationary risk is mitigated by implementing effective budgetary controls in order to assess impact on a timely manner and corrective measures taken on a prompt basis. Company focuses on increasing productivity as a measure to reduce the cost base. Also has developed multiple and alternative suppliers and service providers to reduce over-dependency.
17

18

19

Lalith HeengamaChairman/Non - Executive
Sitendra SenaratneManaging Director/Chief Executive Officer
Kosala HeengamaDirector/Non - Executive
Gregory Scott NewsomeDirector/Non - Executive
Kapila DodamgodaDirector – Independent/ Non – Executive
Heen Banda DissanayakeDirector – Independent/ Non – Executive
Gamini Sarath MunasingheDirector – Independent/ Non – Executive
20

Lalith Heengama
Mr. Lalith Heengama has been a senior public of-ficial of the Sri Lanka Administrative Service(SLAS) since 1965. During his distinguished ca-reer spanning over four decades, he has heldmany senior management positions in the Gov-ernment of Sri Lanka and also in the private sec-tor. Prior to his retirement from public service,he served as State Secretary to the Ministry ofTrade and Commerce. He has also served as Di-rector General of Sri Lanka Customs, Chairmanof Development Lotteries Board, Member of thePresidential Tariff Commission and on theBoards of Directors of SLPA, HKARTI, CDA,Laksala Craft Council and SLIATE.
He has also authored many books and transla-tions. Mr. Heengama is a Graduate from the Uni-versity of Peradeniya (Economics andGeography) and later acquired a Diploma in In-tellectual Property Rights (WIPO). He is a Fellowof the Economic Development Institute ofWorld Bank and the Institute of Management ofSri Lanka. Mr. Lalith Heengama is also the Chair-man of The Colombo Pharmacy Company PLC& Ceylon Leather Products Distributors (Pvt)Ltd.
Sitendra Senaratne
Mr. Sitendra Senaratne counts over 30 years man-agerial experience in the Marketing, Manufactur-ing and Administration. During his distinguishedcareer in the private sector, he has served as theChief Operating Officer of C W Mackie & Co.Ltd, Assistant Chief Executive of Ceymac Rub-ber Co. Ltd, Assistant Chief Executive of CeytraLtd. Managing Director of Mackgrains Distrib-utors Pvt Ltd, Director of Scan Products Hold-ing Co. Ltd. Director of Scan ProductsManufacturing Pvt. Ltd and Scan Tours and Trav-els Ltd.
He is a Diploma Holder from the University ofSri Lanka, Katubadda Campus, Diploma Holderin Marketing, Member of the Chartered Instituteof Marketing, UK, and Member of the Instituteof Materials, Minerals and Mining – U.K. Atpresent, Mr. Sitendra Senaratne is the Chairmanof South Asia Textile Industries Lanka (Pvt)Limited, Dankotuwa Porcelain PLC, ManagingDirector/CEO of Ceylon Leather Products Dis-tributors (Pvt) Ltd and a Director of Palla &Co. (Pvt) Ltd. He is also the Chairman of theColombo Rubber Buyers’ Association.
Kosala Heengama
Dr. Kosala Heengama brings in more than adecade of specialized ICT, management experi-ence in leading and expanding large global ITservice organizations. He has also been instru-mental in implementation of low cost simplifiedenterprise systems and technologies which worksseamlessly for efficient information distributionin multi-layer platforms. Earlier, he was attachedto the Ministry of Finance as an ICT Chief Ad-visor for Government of Sri Lanka.
Dr. Heengama, who works on improved efficien-cies and process in many industries, ventured intofinancial services and strategic investments inERI, and is a Member of Institute of Electronicand Electrical Engineers (MIEEE). Dr. KosalaHeengama serves as a Director of The ColomboPharmacy Company PLC, Ceylon Leather Prod-ucts Distributors (Pvt) Ltd, Palla & Co. (Pvt) Ltdand Dankotuwa Porcelain PLC.
Gregory Scott Newsome
Mr. Gregory Scott Newsome has been a leader ofmany companies. Mr. Newsome is an electronictrading professional with over a decade of expe-rience. He is a multi-exchange consultant for US,Europe and South Asian Stock Exchanges and askilled presenter of technical material in seminars
21

and training classes. Mr. Newsome holds a BBADegree in Finance with a focus on Derivative Se-curities and Investments from James MadisonUniversity, Harrisonburg, Virginia, USA.
He has authored ‘SoesBook’, a technical textbookand reference guide for trading in the NASDAQIndex. His vision is to evolve blueprints for thefuture growth for companies as well as nationalstock exchanges. Mr. Newsome serves as a Direc-tor of The Colombo Pharmacy Company PLC,Ceylon Leather Products Distributors (Pvt) Ltd,Palla & Co. (Pvt) Ltd, South Asia Textile Indus-tries Lanka (Pvt) Limited and Dankotuwa Porce-lain PLC.
Kapila Dodamgoda
Kapila Dodamgoda has over 15 years of mana-gerial experience. During his distinguished careerhe has served as an Engineer at Hayleys and as aSenior Manager at Vanik Incorporation. Hejoined MAS Holdings as the Head of Finance forShadowline Cluster and later became the GeneralManager for Overseas Operations. Kapila was theFinance Director for MAS Investments beforestarting his own venture in education, training andconsulting - The Academy of Finance. He is alsothe CEO of ICMA (Australia)- Sri Lanka Branch.
Kapila has a B.Sc. Engineering (Electronics andTelecommunications) Degree from University ofMoratuwa and a Masters Degree in Economicsfrom the University of Colombo. Kapila is a Fel-low of the Chartered Institute of ManagementAccountants (UK) & a Member of the CharteredInstitute of Marketing (UK). He is also a CertifiedManagement Accountant – ICMA Australia.
Heen Banda Dissanayake
Mr. H.B. Dissanayake is a former Governor ofthe Central Bank of Sri Lanka. He entered theCeylon Civil Service in 1962. He has held the po-
sitions of General Manager of the Industrial De-velopment Board, Government Agent Kurune-gala, Director General of Sri Lanka Customs andDeputy Secretary to the Treasury in the Ministryof Finance.
He was also a Director of the Asia Development Bank and held the position of Chairman of theNational Development Trust Fund.
The top posts he has held in many reputed insti-tutions have enriched him with a wealth of man-agerial experience. Mr. Dissanayake is a Graduatefrom the University of Peradeniya. Mr. Dis-sanayake also serves as a Director of TheColombo Pharmacy Company PLC & CeylonLeather Products Distributors (Pvt) Ltd.
Gamini Sarath Munasinghe
Mr. Gamini Sarath Munasinghe has been a careerdiplomat. During his distinguished career, he hasserved as Deputy High Commissioner in London(1991-97), High Commissioner in South Africa(1998-02) and High Commissioner in Bangladesh(2003-06). When serving in Sri Lanka, at the Min-istry of Foreign Affairs, he has held the posts ofDirector of Economic Affairs, Director Generalof South Asia and SAARC, and Additional Sec-retary before his retirement from the public serv-ice.
He Graduated from the University of Ceylon(Peradeniya) obtaining a Bachelor of Arts Degree.He also holds a Master’s Degree in Buddhist Stud-ies awarded by the Postgraduate Institute of Paliand Buddhist Studies of the University of Ke-laniya. Mr. Munasinghe is a Director of TheColombo Pharmacy Company PLC & CeylonLeather Products Distributors (Pvt) Ltd.
22

Sitendra SenaratneDip.M,MCIM (UK),MIMM (UK)Managing Director/Chief Executive Officer
Lalith W.K. PeligeFCA, B.Sc.(B.Admin)Sri. JGroup General Manager – Finance & IT
A.S.EdiriweeraDip. in Shoe Technology (UK)Factory Manager – Shoe Factory
Manjula IndunilDip.in Production ManagementFactory Manager - Tannery
Vipul MadanayakeManager - Domestic Sales
Ashmi AmarasinghePQHRM (IPM Sri Lanka), AIPM, MBA(Aus)Human Resources Manager
V.R.R.De.SilvaSAT, Finalist (ICASL)Finance Manager
A.N.R.GunasekaraB.Sc. (Colombo)Certificate Course in Statistical Q.CCertificate Course in Productivity Improvement(Japan)Quality Assurance Manager
Mrs.K.D.F.M.ShiraniB.F.A (Hons)Chief Designer
Mrs.P. SuraweeraB.Com.(Peradeniya)Accountant
G.A.R.NanayakkaraCertificate in Rubber TechnologyAsst. Factory Manager
C.D.SenanayakeNational Certificate in TechnologyCertificate Course in Leather TechnologyChief Maintenance Executive
Nuwan DissanayakeB.Sc.(Hons), PGDBMGeneral Manager – Operations
G.WickramasingheDip.in Leather Goods Production (U.K)Dip.in Chemical Engineering (Sri Lanka)Factory Manager – Leather Goods Factory
Miss.Thusitha HettiarachchiB.A (Colombo)Manager - Tender Sales
Channa WijeratneB.Business(Perth),HNDA(UK)Procurement Manager
W.K.C.T.S. JayasundaraADICS(LBS),MCP(VB.Net)Manager – Information Technology
K.P SahabanduCerificate in Leather Technology(U.K)City & Guild (Leather) U.K.Quality Assurance Manager – Tannery
Miss R. B. JayatillakeSecretary
A.J.S.K De SilvaL.P.R.I.(UK)Asst.Factory Manager – Rubber Plant
Mrs.J.A.S. JayasekaraPlanning Executive – Tannery
K.G.D.S.K. JayasingheCost Executive - Tannery
MANAGEMENT COMMITTEE
EXECUTIVES
23

P.D.ThilakarathneProduction Executive - Shoe Factory
Mrs.I.S. RupasingheStores Executive
W.V DevendraPlanning Officer
Mathew WicramarathneAsst. Manager – Procurement
C.A. WirasinghaChief Cashier
J.P.L. GalappaththiExecutive Procurement
Mrs.Dinesha AbeykoonPQHRM(IPM), PCM(SLIM)Human Resource Executive
A.R. DayarathneLeather Development Executive
W.T.D. AnilF.C.H.R.M.(IPM)Human Resource Executive - Tannery
I.P.S. Kumara DayanandaB.B. Mgt (Mkt) Sp. (Kelaniya)Marketing Executive
Aruna Prasad NanayakkaraB.sc (Kelaniya)Production Executive – Shoe Factory
T.D.L. LiyanageB.A. (Econ) Sp. (Colombo)Executive – Human Resources Dept.
W.C. DayanandaPassed Finalist (AATSL)Accounts Executive
R.ThilakarathneProduction Executive – Leather Goods Factory
Samantha K. LekamgeMarketing Executive
N.N.K.de SilvaMCSASystem Administrator
Indika AmarathungeMarketing Executive
W Eranda SamanDIPOM (U.K)Production Executive – Shoe Factory
I. J. GallageDip. TV Promotion & Media MarketingExecutive Promotion & Advertising
K.K.T. AmarasiriCTLPDC (Karachchi)Product Development Executive
Gayan ThilakarathneB.sc (Electronics), Dip. In Maintenance Manage-ment Executive – Engineering Dept.
A.A.Dasitha Roshan AdikariB.Sc (Sri. J)CIMA (Management Level)Planning Executive – Shoe Factory
K.G.Buddhika PrasannaB.Sc (Ruhuna)Production Executive – Leather Goods Factory
W.A.Gihan ChathurangaDiploma in Material ManagementStores Executive
24

Miss. Diluka BalasuriyaB.B.Mgt.(Hon)CIMA Passed FinalistExecutive – Costing & Control
W. ChamindaStores Executive
D.L. Danushka NishardB.Sc (Colombo)Production Executive
T.A. Tharidu NimeshProduction Executive - Tannery
Mrs.W.Chathurika PathiranaMarketing Co-ordinator
Miss.Inoka GunasekaraB. Design (Hons) MoratuwaProduct Development Executive
D.K.D. NeranjanPg. Dip NRM (Kelaniya)B.Sc, (Kelaniya)Procurement Executive
R.M. Upul NishanthaMarketing Executive
Vincent JosephProduction Executive – Shoe Factory
W.K.WickramasingheB.Sc (Ceylon), Dip in Leather Technology (UK)Consultant – Leather Sector
M.S.K. PereraB.Com (Ceylon),M.Sc.(Bus.Admin-U.K)Dip.in Regional Industrial Development (TheNetherlands)Consultant – Marketing & Human Resources
Madhuranga PeirisDip. In Mechanical Engineering, B.Sc (UK)Maintenance Engineer - Tannery
D.Kasun Malitha HettiarachchiB.A. (Kelaniya)Executive – Tender Sales
N.G.K. Deepthi NamalProduction Executive - Tannery
Mrs. Chathurani JayasekaraB. Design (Hons) MoratuwaProduct Development Executive
Miss.U.G. Thilini MadushikaB. Design (Hons) MoratuwaProduct Development Executive
J.A. Tharidu Asiri JayasingheB. Design (Hons) MoratuwaProduct Development Executive
H.S.D. LusenaProduction Executive – Shoe Factory
K.A.S.S. NiroshanB.L.E. (Colombo) Sp.Stores Executive
Keith AndrewBA Design and CraftNational Art School – Sydney, Australia Consultant – Product Development
CONSULTANTS
25

26

27

28

29
30
31
The Board is responsible for formulating the Company's strategic goals, providing leadership to put them into effect, supervising the management of the business, and reporting to the shareholders on their stewardship. The Board is committed to manage its affairs by complying with generally accepted corporate governance practices as well as specific requirements under the Listing Rules of the Colombo Stock Exchange and the Code of Best Practices issued by the Institute of Chartered Accountants of Sri Lanka on matters relating to the financial aspect of corporate governance as a useful guideline.
BOARD OF DIRECTORS
The Board consists of Seven Directors, six Non-Executive Directors and one Executive Director being the Managing Director/Chief Executive Officer, Mr. Sitendra Senaratne.
The Board has determined that three Non-Executive Directors – Messrs M.A.K.B Dodamgoda H.B Dissanayake and Mr. G.S Munasinghe are ‘Independent’ as per the criteria set out in the Listing Rules of the Colombo Stock Exchange.
In its said determination, the Board has considered that Messrs H.B Dissanayake and Mr. G.S Munasinghe who serve on the directorate of Environmental Resources Investment PLC (which is the holding company of Ceylon Leather Products PLC) and certain other companies in the group, do not qualify as “Independent” against the criteria set out in Rule 7.10.4(g) of the Listing Rules of the CSE. Nevertheless, the Board, having considered that Messrs H.B Dissanayake and Mr. G.S Munasinghe serve as Independent Directors on the Board of the holding company has resolved that in its opinion the directorships held by said Directors do not compromise their independence and objectivity in discharging the functions as “Independent” Director in Ceylon Leather Products PLC and accordingly in terms of Rule 7.10.3(b) of the Listing Rules of the CSE, the Board has determined that H.B Dissanayake and Mr. G.S Munasinghe are nevertheless “Independent” as per the said Listing Rules. Further the Board has also determined that Mr. M.A.K.B. Dodangoda’s directorship on Ceylon Leather Products Distributors (Pvt) Ltd, which is a fully owned subsidiary on which all other Directors of the Company are also serve as Directors do not compromise his independence and Mr. M.A.K.B. Dodangoda is nevertheless “independent”.
Each Non-Executive Director has submitted a Declaration of his independence or non-independence as required under the Listing Rules of the Colombo Stock Exchange.
BOARD SUB COMMITTEES
Audit Committee The Audit Committee is responsible for monitoring the integrity of financial statements of the Company by ensuring compliance with relevant financial reporting regulations and requirements. The Audit Committee also oversees the relationship between the Company and the Auditor and reviews the Company’s financial reporting system. The Board has appointed an Audit Committee, which was reconstituted in November 2011. The Audit Committee consists of three independent non-executive Directors. Mr. Kapila Dodamgoda, Chairman of the Audit Committee is a member of the Chartered Institute of Management Accountants (UK). The names of the members of the Audit Committee are as follows. Mr. Kapila Dodamgoda (Chairman) - Independent Non-Executive Director (Appointed as Chairman on 3.11.2011) Mr. H.B. Dissanayake - Independent Non-Executive Director
32

Mr. Gamini S. Munasinghe - Independent Non-Executive Director Dr. Kosala Heengama (Chairman) - Non Executive (Resigned on 3.11.2011) Mr. Gregory S. Newsome - Non Executive (Resigned on 3.11.2011)
The report of the Audit Committee appears on page 35.
Remuneration Committee The Board has appointed a Remuneration Committee consisting of three non-executive Directors of whom two are Independent. The Remuneration Committee consists of; Dr. Kosala Heengama (Chairman) - Non- Executive Director (Appointed as Chairman on 3.11.2011) Mr. H.B. Dissanayake - Non-Executive/ Independent Director Mr. Kapila Dodamgoda - Non-Executive / Independent Director Mr. Gregory S. Newsome - Non-Executive Directors (Resigned on 3.11.2011)
Report of the Remuneration Committee appears on Page 36. Board meetings and attendance of Directors
Board Meetings are held to consider among other matters, the performance and Financial Statements for the period and to approve capital expenditure. Special Board meetings are held as and when required to discuss urgent matters. Attendance at the Board meetings held during April 2011 to March 2012 is set out below.
Name of Director
Directorship Status
Attendance
Total number of meetings held 5
Mr. Lalith Heengama (Chairman)
Non –Executive/Non Independent 5/5
Mr. Sitendra Senaratne (Managing Director/CEO)
Executive 5/5
Dr. Kosala Heengama
Non –Executive/Non Independent 5/5
Mr. Gregory Scott Newsome
Non –Executive/Non Independent 3/5
Mr. M.A.K.B Dodamgoda
Non –Executive/ Independent 5/5
Mr. Heen Banda Dissanayake
Non –Executive/ Independent 5/5
Mr. Gamini Sarath Munasinghe
Non –Executive/ Independent 4/5
33

Compliance The Company’s level of compliance with the CSE’s Listing Rules is given below. Corporate Governance Principles
CSE Rule Reference
ComplianceStatus
Company’s level of compliance
Non- Executive Directors 7.10.1 Compliant 6 out of 7 Directors are non-executives Independent Directors 7.10.2 (a)
7.10.2 (b) Compliant
3 out of 6 non executive directors are “ independent”
Disclosures relating to Directors
7.10.3 Compliant Given under the heading of “Board of Directors” of this report and also refer to pages 20-22.
Remuneration Committee 7.10.5 (a)
Compliant
The Committee comprises of 3 non executive Directors , two of whom are independent.
7.10.5 (b) 7.10.5 (c)
Compliant
Please refer Remuneration Committee Report on page 36. The aggregate remuneration paid to non executive directors is given on page 41
Audit Committee 7.10.6 (a)
Compliant The Committee comprises of 3 independent non executive Directors.
7.10.6 (c) Compliant Please refer report of the Audit Committee on page 35.
Going Concern The Board after reviewing the financial position and cash flow of the Company is confident that the Company is satisfied having adequate resources to continue its operations in the foreseeable future and the Directors have adopted the going concern basis in preparing the accounts. Compliance Report The Directors confirm that to the best of their knowledge all taxes and duties payable by the Company and all contributions, levies and taxes payable on behalf of and in respect of the employees of the company and all other known statutory dues payable as at the Balance Sheet date have been paid or provided for in the accounts. By order of the Board of Ceylon Leather Products PLC (Sgd.) P W Corporate Secretarial (Pvt) Ltd Secretaries Colombo 07th August 2012
34
The Audit Committee consists of the following Directors: Mr. Kapila Dodamgoda (Chairman – appointed on 3rd November 2011) Mr. H B Dissanayake Mr. Gamini S. Munasinghe Dr. Kosala Heengama ( Chairman up to 3rd November 2011) Mr. G S Newsome ( up to 3rd November 2011) M/s. Kapila Dodamgoda, H B Dissanayake and Gamini S Munasinghe are Non-Executive and independent Directors. M/s. G S Newsome and Dr.Kosala Heengama are Non-Executive and Non-independent Directors. The key objectives and functions of the committee is to provide assistance to the Board of Directors in overseeing ;
The review and integrity of the Company’s Financial Statements The company’s compliance with legal and regulatory requirements. Review in depth periodic reports issued by the Auditors to ensure that all necessary follow up
actions have been initiated. The performance of the company’s internal audit function and its independent Auditors and Review Compliance & Corporate Governance issues relating to Internal Controls of the
Organization in the context of regulatory and statutory requirements. Make recommendations to the Board pertaining to the appointment, re-appointment and/or
removal of external auditors and approve the remuneration and terms of engagement of the external auditors.
The Audit Committee had four meetings and several informal discussions during the period under review. The meetings were to review all financial statements including the Quarterly Financial Statements and the Annual Financial Statements. The Managing Director/Chief Executive Officer, Group General Manager Finance and the Finance Manager attended all Audit Committee Meetings by invitation. A separate Compliance Unit comprising of independent staff reporting direct to the major shareholders has been established to go through all financial transactions of the company to ensure the interest of stake holders are safeguarded. Having reviewed the scope and effectiveness of the external audit, and the independence and objectivity of the external auditors, the Audit Committee recommends the re-appointment of M/s. Ernst & Young, Chartered Accountants as Auditors for the Year 2012/2013. (Sgd.) Kapila Dodamgoda Chairman, Audit Committee 07th August 2012
35

The Remuneration Committee appointed by and responsible to the Board of Directors, comprise of :
Dr. Kosala Heengama ( Chairman)
Mr. H B Dissanayake
Mr. M A K B Dodamgoda
The Committee is responsible for evaluating and recommending to the Board the Remuneration Policy and Practices that supports the strategic direction and the objectives of the company. The remuneration policy of the Company is to attract, motivate and retain high quality executive talent by reference to the corporate goals and objectives resolved by the Board from time to time.
During the period under review, salaries of all executive staff were revised. The Committee also authorized the Managing Director to negotiate with the Trade Unions to enter into a Collective Agreement for a period of 3 years for all non- executive staff to increase salaries and adjust production norms to increase productivity.
( Sgd.) Dr. Kosala Heengama Chairman, Remuneration Committee 07th August 2012
36

Financial ReportsAnnual Report of the Board of Directors 38Statement of Directors’ Responsibilities 45Independent Auditor’s Report 46Balance Sheet 47Income Statement 48Statement of Changes in Equity 49Cash Flow Statement 50Notes to the Financial Statements 51
Financial Calendar 2011/121st Quarter Report - 11th August 20112nd Quarter Report - 08th November 20113rd Quarter Report - 15th February 20124th Quarter Report - 31st May 2012Annual General Meeting - 19th September 2012

The Directors of Ceylon Leather Products PLC have pleasure in presenting their report together with Audited Financial Statements of the Company for the year ended 31 March 2012. PRINCIPAL ACTIVITIES The principal activity of the Company is manufacturing and selling of leather, leather footwear and leather goods. Investments Ceylon Leather Products PLC has the under-mentioned investments in subsidiary and other companies.
Name Shareholding Activity
Ceylon Leather Products Distributors (Pvt) Limited 100% Marketing arm of the parent Company
South Asia Textile industries Lanka (Pvt) Ltd 51.55% Manufacturing and selling of knitted fabrics for the export and local market
Palla & Company (Pvt) Ltd 60% Manufacturing of shoes for export
NedLanka (Ceylon) Ltd 14.29% Manufacturing of leather gloves
Dankotuwa Porcelain PLC 8.31% Manufacturing of porcelain tableware targeted for export and local market
Investment details are disclosed under notes 7 and 8 of the Financial Statements. BUSINESS REVIEW The Chairman’s message and Managing Director/Chief Executive Officer’s Review describe briefly the activities during the year under review. The results for the year are set out in the Income Statement. FINANCIAL STATEMENTS The complete Financial Statements of the Company duly signed by two Directors on behalf of the Board and the Auditors are given on pages 46 to 78
38

Summarized Financial Position The summarized financial position of the Company is as follows: Descriptions
GROUP COMPANY
2011-2012 Rs’000
2010-2011 Rs’000
2011-2012 Rs’000
2010-2011 Rs’000
Turnover 4,371,544 1,051,122
1,313,494 1,039,759
Gross Profit 762,263 345,487
358,402 334,125
Profit/(Loss)before Taxation 124,708 175,352
217,619 170,434
Taxation (80,954) (68,412)
(80,441) (67,060)
Profit/(Loss)attributable to Shareholders 43,754 106,940
137,178 103,374
Auditors’ Report The Report of the Auditors on the Financial Statements of the Company is given on page 46. Accounting Policies The accounting policies adopted by the Company in the preparation of Financial Statements are given on pages 51 to 61 and are consistent with those of the previous period. Directors’ responsibility for Financial Reporting The Directors are responsible for the preparation of Financial Statements of the Company to reflect a true and fair view of the state of its affairs. A further statement in this regard is included on page 45. STATED CAPITAL The Stated Capital of the Company as at 31 March 2012 was Rs.1,979,344,948/- representing 34,233,774 ordinary shares (Rs.1,037,500,000/- representing 25,000,000 ordinary shares as at 31st March 2011). Further information in this regard are given in note 12 to the Financial Statements. Issue of shares through exchange of warrants The Company raised Rs.941,844,948/- during the year under review through the issue of 9,233,774 ordinary shares at Rs.102/- each consequent to the exchange of warrants.
39

The proceeds of the said issue were utilized as set out below : Description
Amount (Rs.)
The Proceeds on exchange of 9,233,774 warrants@102/- per share 941,844,948
Used in: Acquisition of subsidiary Acquisition of other Investments Acquisition of short Term Deposits Direct Expenses relating to Issue Balance Utilized for repayment of interest bearing borrowings
453,732,445117,644,688 290,200,000
5,565,225 74,702,590
Total 941,844,948 DIRECTORS The names of the Directors who held office as at the end of the accounting period are given below and their brief profiles appear on pages 20 to 22. Mr. L.Heengama Chairman Mr. S. Senaratne Managing Director/Chief Executive Officer Mr. G.S Newsome Director Dr. K. Heengama Director Mr M.A.K.B. Dodamgoda Director Mr. H.B Dissanayake Director Mr. G.S. Munasinghe Director In terms of Article 20(6) of the Articles of Association of the Company, Mr. M A K B Dodamgoda retires by rotation and being eligible is recommended by the Directors for re-election. At the conclusion of the forthcoming Annual General Meeting Mr. Lalith Heengama and Mr. H.B. Dissanayake who are of 73 years and 75 years of age respectively will vacate office in pursuance of Section 210 of the Companies Act No. 7 of 2007. A resolution will be placed before the shareholders in terms of section 211 of the Companies Act with regard to the re-election of the said Directors. Directors of subsidiary Companies
Ceylon Leather Products Distributors (Pvt) Ltd
Mr. L.Heengama Mr. S. Senaratne Mr. G.S Newsome Dr. K. Heengama Mr M.A.K.B. Dodamgoda Mr. H.B Dissanayake
40

Mr. G.S. Munasinghe South Asia Textiles Industries Lanka (Pvt) Ltd Mr Ker Uei Yang Mr Prithiv Sivaji Dorai Mr Ker Uei Chang Mr G.S.Newsome Mr S.S. Senaratne Mr E.B. Wickramanayake Palla and Company (Pvt) Ltd Dr.K.Heengama Mr G S Newsome Mr S S Senaratne Mr M.T. Fanning Directors’ Shareholding The Directors did not hold any shares as at 31st March 2012 or 31st March 2011. Directors’ Remuneration The total amount of remuneration and other benefits of Directors for the year ended 31st March 2012 was Rs. 10,226,880/- of which Rs. 6,276,800/- was paid to Non-Executive Directors. Interests Register The Company maintains an Interests Register in terms of the Companies Act, No. 7 of 2007, which is deemed to form part and parcel of this Annual Report. Directors’ interests in contracts Related party disclosures as required by the Sri Lanka Accounting Standards No.30 are detailed in note 25 to the Financial Statements. The Company carried out transactions in the ordinary course of its business at commercial rates with the following Director related entities. Name of Related Party Relationship Names of common Directors
Ceylon Leather Products Distributors (Pvt) Ltd.
Subsidiary Mr. L.Heengama Mr. S. Senaratne Mr. G.S Newsome Dr. K. Heengama Mr M.A.K.B. Dodamgoda Mr. H.B Dissanayake Mr. G.S. Munasinghe
41
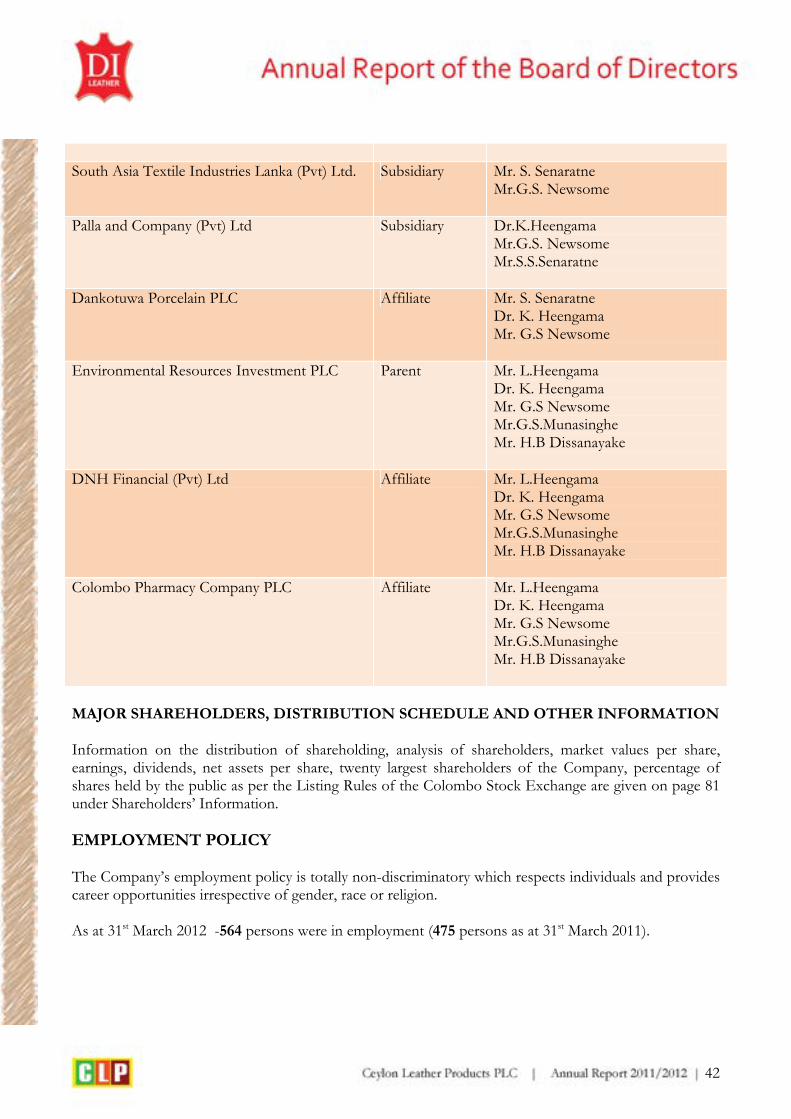
South Asia Textile Industries Lanka (Pvt) Ltd. Subsidiary Mr. S. Senaratne
Mr.G.S. Newsome
Palla and Company (Pvt) Ltd Subsidiary Dr.K.Heengama Mr.G.S. Newsome Mr.S.S.Senaratne
Dankotuwa Porcelain PLC Affiliate Mr. S. Senaratne Dr. K. Heengama Mr. G.S Newsome
Environmental Resources Investment PLC Parent Mr. L.Heengama Dr. K. Heengama Mr. G.S Newsome Mr.G.S.Munasinghe Mr. H.B Dissanayake
DNH Financial (Pvt) Ltd Affiliate Mr. L.Heengama Dr. K. Heengama Mr. G.S Newsome Mr.G.S.Munasinghe Mr. H.B Dissanayake
Colombo Pharmacy Company PLC Affiliate Mr. L.Heengama Dr. K. Heengama Mr. G.S Newsome Mr.G.S.Munasinghe Mr. H.B Dissanayake
MAJOR SHAREHOLDERS, DISTRIBUTION SCHEDULE AND OTHER INFORMATION Information on the distribution of shareholding, analysis of shareholders, market values per share, earnings, dividends, net assets per share, twenty largest shareholders of the Company, percentage of shares held by the public as per the Listing Rules of the Colombo Stock Exchange are given on page 81 under Shareholders’ Information. EMPLOYMENT POLICY The Company’s employment policy is totally non-discriminatory which respects individuals and provides career opportunities irrespective of gender, race or religion. As at 31st March 2012 -564 persons were in employment (475 persons as at 31st March 2011).
42

STATUTORY PAYMENTS The Directors confirm that to the best of their knowledge, all payments in respect of statutory liabilities including EPF,ETF, and PAYE tax have been made within the stipulated periods during the financial year. RESERVES The reserves of the Company with the movements during the year are given in Note 13 to the Financial Statements on page 69 and in the Equity Statement on page 49. CAPITAL EXPENDITURE ON PROPERTY PLANT & EQUIPMENT The Company incurred capital expenditure of Rs. 178,314,626/- during the year. The details are disclosed under note 4 to the Financial Statements. LAND HOLDINGS Extents, locations, valuations and the number of buildings of the Company’s land holdings and investment properties as at 31 March 2012 are as follows. Location Land Extent No of Buildings Building Extent Value-Rs.’000 Mattakkuliya 4.75 Acres 15 75,010 Sq.feet 479,000 Belummahara 2.96 Acres 10 76,460 Sq.feet 337,338 Mattakkuliya 6 perches 01 2,120 Sq.feet 10,006 Company revalued its land and buildings during the Financial year of which the details are disclosed in note 4.4 to the Financial Statements. MATERIAL FORESEEABLE RISK FACTORS Information pertaining to material foreseeable risk factors of the Company are given on page 16. TAXATION The Company’s liability to taxation has been computed according to the provisions of the Inland Revenue Act No.10 of 2006 and amendments thereto. Note 15 to the Financial Statements describes the method of computation of taxes of the Company DONATIONS No Donations were made by the Company or its subsidiaries during the year under review. DIVIDENDS Directors do not recommend a dividend for the year under review.
43

CORPORATE GOVERNANCE The report on Corporate Governance is given on Page 32 of the Annual Report. POST BALANCE SHEET EVENTS There were no post Balance Sheet events which would require adjustment to or disclosure in the Financial Statements. AUDITORS Messrs Ernst & Young, Chartered Accountants served as the Auditors during the year under review and also provided non audit/consultancy services. A total amount of Rs 1,354,374/- is payable by the Company to the Auditors for the year under review comprising Rs 850,000./- as audit fees and Rs.504,374./- for non audit services. The Auditors have expressed their willingness to continue in office. The Audit Committee at a meeting held on 07th August 2012 recommended that they be re-appointed as Auditors. A resolution to re-appoint the Auditors and to authorize the Directors to determine their remuneration will be proposed at the Annual General Meeting. ANNUAL GENERAL MEETING The Annual General Meeting of the Company will be held at Taj Samudra Hotel on 19th September 2012 at 11am. The Notice of the Annual General Meeting is on 88 of this Report. This Annual Report is signed for and on behalf of the Board of Directors by (Sgd.) (Sgd.) Lalith Heengama S S Senaratne Chairman Managing Director/CEO (Sgd.) P W Corporate Secretarial (Pvt) Ltd Secretaries 07th day of August 2012
44

The responsibility of the Directors in relation to the Financial Statements of the Company is set out in the following statement. The responsibility of the Auditors, in relation to the Financial Statements, prepared in accordance with the provisions of the Companies Act No. 07 of 2007, is set out in the Independent Auditors' report appearing on page 46. The Companies Act No. 07 of 2007 stipulates that Directors are responsible for the preparation of Financial Statements for each financial year and place before a general meeting Financial Statements, comprising a Profit and Loss Account and a Balance Sheet which presents a true and fair view of the state of affairs of the Company as at the end of the financial year and which comply with the requirements of the above Act. The Financial Statements have been prepared and presented in accordance with Sri Lanka Accounting Standards. In preparing the Financial Statements appropriate accounting policies have been selected and applied consistently, whilst reasonable and prudent judgments and estimates have been made. As per Section 148 of the Act, the Directors are required to maintain sufficient accounting records to disclose with reasonable accuracy the financial position of the Company and to ensure that the Financial Statements presented comply with the requirements of the Companies Act. The Directors are also responsible for devising proper internal controls for safeguarding the assets of the Company against unauthorized use or disposition and prevention and detection of fraud and for reliability of financial information used within the business or publication. The Directors continue to adopt the going concern basis in preparing accounts and after making inquiries and following a review of the Company’s budget for the financial year 2012/2013 including cash flows and borrowing facilities, consider that the Company has adequate resources to continue in operation. The Board of Directors is of the opinion that the Board has discharged its responsibilities as set out above. By order of the Board of Ceylon Leather Products PLC (Sgd.) P W Corporate Secretarial (Pvt) Ltd Secretaries Colombo 07th August 2012
45

APAG/WDPL/D INDEPENDENTO THE SHARPRODUCTS P Report on the We have audCeylon Leathefinancial statemGroup”) which2012, and theequity and cassummary of explanatory no Management’s Management presentation ofLanka Accoundesigning, imrelevant to thestatements thadue to fraud accounting polreasonable in t Scope of Audi Our responsibstatements baaccordance witrequire that weassurance whmaterial missta An audit inclsupporting thestatements. An
DM
T AUDITOR’S REHOLDERS OPLC
Financial Stat
dited the accomer Products PLments of the C comprise the
e income statesh flow stateme
significant ates.
s Responsibili
is responsiblef these financianting Standard
mplementing ae preparation at are free from
or error; sellicies; and makthe circumstanc
it and Basis of
ility is to expreased on our ath Sri Lanka Aue plan and perfhether the finaatement.
ludes examinie amounts an audit also inclu
REPORT OF CEYLON LE
tements
mpanying finanLC (“Company”Company and i balance shee
ements, statements for the yeaaccounting po
ity for the Fina
e for the prl statements in ds. This respnd maintaininand fair presem material mislecting and aking accountingces.
f Opinion
ess an opinionaudit. We conduditing Standardform the audit tancial stateme
ng, on a tesnd disclosureudes assessing
EATHER
ncial statemen”), the consolidts subsidiaries
ets as at 31 Ments of changr then ended, aolicies and
ancial Stateme
eparation and accordance wiponsibility inclng internal coentation of finasstatement, whpplying appropg estimates tha
n on these finaducted our audds. Those standto obtain reasoents are free
st basis, evids in the finag the accounting
nts of dated (“the
March ges in and a other
ents
d fair ith Sri udes: ontrol ancial hether priate at are
ancial dit in dards nable from
dence ancial g
policas pres We hthe purpprov Opin In oComendeand 2012acco In ouand profiSri subsshar Rep In ourequCom 07 AColo
cies used and well as evaentation.
have obtained best of our kn
poses of our avides a reasona
nion
ur opinion, so mpany maintained 31 March 20fair view of the
2 and its profit ordance with Sr
ur opinion, the fair view of thet and cash flowLanka Accoun
sidiaries dealt reholders of the
ort on Other L
ur opinion, thesuirements of Sempanies Act No.
August 2012 ombo.
significant estimaluating the
all the informatowledge and baudit. We therble basis for ou
far as appeaned proper acc012 and the fine Company’s s and cash flowi Lanka Accoun
consolidated fie state of affairsws for the year thnting Standard
with thereby Company.
egal and Regu
se financial staections 151(2) 07 of 2007.
mates made boverall finan
tion and explanbelief were nerefore believe ur opinion.
ars from our ecounting recordnancial statemestate of affairs ws for the yearnting Standards
nancial statems as at 31 Marcthen ended, in ads, of the Coy, so far as
ulatory Requir
atements also c and 153(2) to
y managementcial statemen
nations which tocessary for thethat our aud
xamination, theds for the yeaents give a trueas at 31 Marchr then ended ins.
ents give a truech 2012 and theaccordance withmpany and its concerns the
ements
comply with theo 153(7) of the
t, nt
o e it
e ar e h n
e e h s e
e e
46
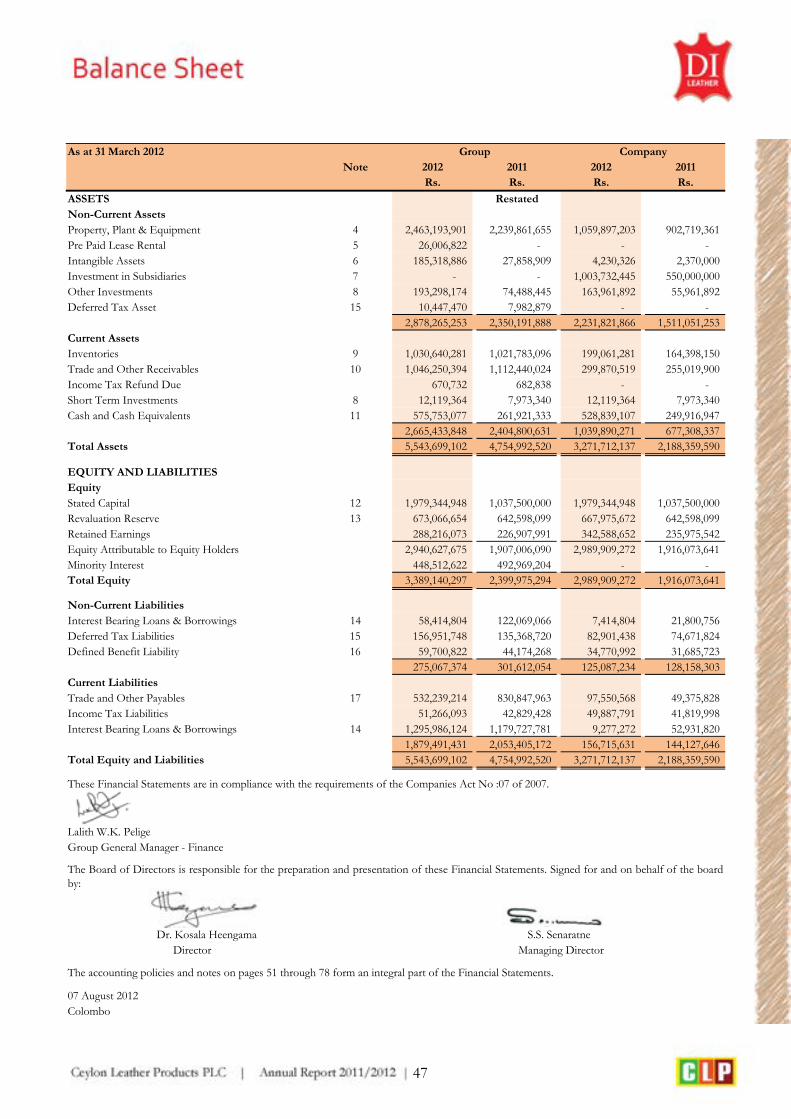
As at 31 March 2012Note 2012 2011 2012 2011
Rs. Rs. Rs. Rs.
ASSETS RestatedNon-Current AssetsProperty, Plant & Equipment 4 2,463,193,901 2,239,861,655 1,059,897,203 902,719,361 Pre Paid Lease Rental 5 26,006,822 - - - Intangible Assets 6 185,318,886 27,858,909 4,230,326 2,370,000 Investment in Subsidiaries 7 - - 1,003,732,445 550,000,000 Other Investments 8 193,298,174 74,488,445 163,961,892 55,961,892 Deferred Tax Asset 15 10,447,470 7,982,879 - -
2,878,265,253 2,350,191,888 2,231,821,866 1,511,051,253 Current AssetsInventories 9 1,030,640,281 1,021,783,096 199,061,281 164,398,150 Trade and Other Receivables 10 1,046,250,394 1,112,440,024 299,870,519 255,019,900 Income Tax Refund Due 670,732 682,838 - - Short Term Investments 8 12,119,364 7,973,340 12,119,364 7,973,340 Cash and Cash Equivalents 11 575,753,077 261,921,333 528,839,107 249,916,947
2,665,433,848 2,404,800,631 1,039,890,271 677,308,337 Total Assets 5,543,699,102 4,754,992,520 3,271,712,137 2,188,359,590
EQUITY AND LIABILITIESEquityStated Capital 12 1,979,344,948 1,037,500,000 1,979,344,948 1,037,500,000 Revaluation Reserve 13 673,066,654 642,598,099 667,975,672 642,598,099 Retained Earnings 288,216,073 226,907,991 342,588,652 235,975,542 Equity Attributable to Equity Holders 2,940,627,675 1,907,006,090 2,989,909,272 1,916,073,641 Minority Interest 448,512,622 492,969,204 - - Total Equity 3,389,140,297 2,399,975,294 2,989,909,272 1,916,073,641
Non-Current Liabilities Interest Bearing Loans & Borrowings 14 58,414,804 122,069,066 7,414,804 21,800,756 Deferred Tax Liabilities 15 156,951,748 135,368,720 82,901,438 74,671,824 Defined Benefit Liability 16 59,700,822 44,174,268 34,770,992 31,685,723
275,067,374 301,612,054 125,087,234 128,158,303 Current Liabilities Trade and Other Payables 17 532,239,214 830,847,963 97,550,568 49,375,828 Income Tax Liabilities 51,266,093 42,829,428 49,887,791 41,819,998 Interest Bearing Loans & Borrowings 14 1,295,986,124 1,179,727,781 9,277,272 52,931,820
1,879,491,431 2,053,405,172 156,715,631 144,127,646 Total Equity and Liabilities 5,543,699,102 4,754,992,520 3,271,712,137 2,188,359,590
These Financial Statements are in compliance with the requirements of the Companies Act No :07 of 2007.
Lalith W.K. PeligeGroup General Manager - Finance
Dr. Kosala HeengamaDirector
The accounting policies and notes on pages 51 through 78 form an integral part of the Financial Statements.
07 August 2012Colombo
S.S. SenaratneManaging Director
Group Company
The Board of Directors is responsible for the preparation and presentation of these Financial Statements. Signed for and on behalf of the boardby:
47
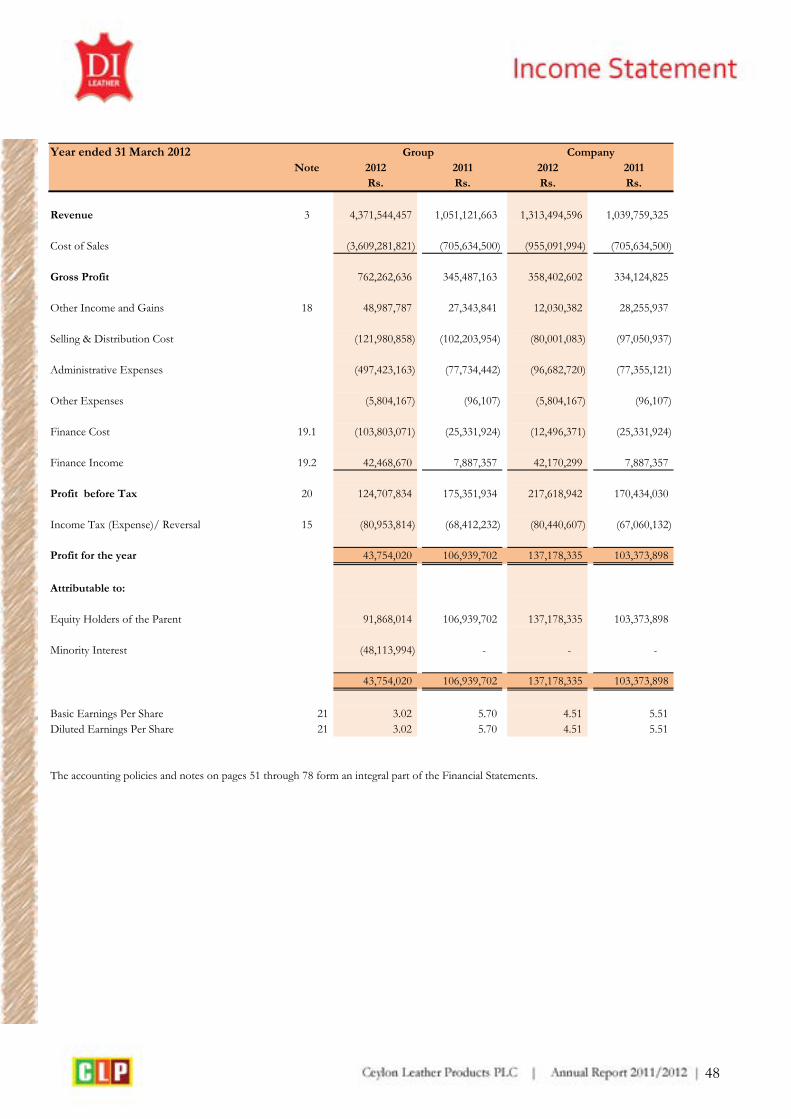
Year ended 31 March 2012Note 2012 2011 2012 2011
Rs. Rs. Rs. Rs.
Revenue 3 4,371,544,457 1,051,121,663 1,313,494,596 1,039,759,325
Cost of Sales (3,609,281,821) (705,634,500) (955,091,994) (705,634,500)
Gross Profit 762,262,636 345,487,163 358,402,602 334,124,825
Other Income and Gains 18 48,987,787 27,343,841 12,030,382 28,255,937
Selling & Distribution Cost (121,980,858) (102,203,954) (80,001,083) (97,050,937)
Administrative Expenses (497,423,163) (77,734,442) (96,682,720) (77,355,121)
Other Expenses (5,804,167) (96,107) (5,804,167) (96,107)
Finance Cost 19.1 (103,803,071) (25,331,924) (12,496,371) (25,331,924)
Finance Income 19.2 42,468,670 7,887,357 42,170,299 7,887,357
Profit before Tax 20 124,707,834 175,351,934 217,618,942 170,434,030
Income Tax (Expense)/ Reversal 15 (80,953,814) (68,412,232) (80,440,607) (67,060,132)
Profit for the year 43,754,020 106,939,702 137,178,335 103,373,898
Attributable to:
Equity Holders of the Parent 91,868,014 106,939,702 137,178,335 103,373,898
Minority Interest (48,113,994) - - -
43,754,020 106,939,702 137,178,335 103,373,898
Basic Earnings Per Share 21 3.02 5.70 4.51 5.51 Diluted Earnings Per Share 21 3.02 5.70 4.51 5.51
The accounting policies and notes on pages 51 through 78 form an integral part of the Financial Statements.
CompanyGroup
48

Company Note Stated Revaluation Retained Total Capital Reserve Earnings
Rs. Rs. Rs. Rs.
As at 01 April 2010 125,000,000 623,479,034 138,963,239 887,442,273
Net Profit for the year - - 103,373,898 103,373,898
Issue of Ordinary Shares 12 912,500,000 - - 912,500,000
Adjustment due to change in Income Tax Rate 15 - 19,119,065 - 19,119,065
Expenses on Right Issue - - (6,361,595) (6,361,595)
As at 31 March 2011 1,037,500,000 642,598,099 235,975,542 1,916,073,641
Net Profit for the year - - 137,178,335 137,178,335
Surplus on Re valuation of Land & Buildings - 23,815,628 - 23,815,628
Reversal of Deferred Tax effect on Re valuation - 1,561,945 - 1,561,945
Issue of Ordinary Shares 941,844,948 - - 941,844,948
Direct Cost on Share Issue - - (5,565,225) (5,565,225)
Dividend paid - - (25,000,000) (25,000,000)
As at 31 March 2012 1,979,344,948 667,975,672 342,588,652 2,989,909,272
Group Note Stated Revaluation Retained Total Minority Total Capital Reserve Earnings Interest
Restated RestatedRs. Rs. Rs. Rs. Rs. Rs.
As at 31 March 2010 125,000,000 623,479,034 126,329,884 874,808,918 - 874,808,918
Net Profit for the year - - 106,939,702 106,939,702 - 106,939,702
Issue of Ordinary Shares 12 912,500,000 - - 912,500,000 - 912,500,000
Adjustment due to change in Income Tax Rate 15 - 19,119,065 - 19,119,065 - 19,119,065
Expenses on Rights Issue - - (6,361,595) (6,361,595) - (6,361,595)
Minority interest arising from business acquisition - - - - 492,969,204 492,969,204
As at 31 March 2011 1,037,500,000 642,598,099 226,907,991 1,907,006,090 492,969,204 2,399,975,294
As at 01 April 2012 as previously reported 1,037,500,000 642,598,099 226,907,991 1,907,006,090 276,306,223 2,183,312,313 Effect of adjustment due to revaluation of Assets of Subsidiary - - - 216,662,981 216,662,981 As at 01 April 2012 - Restated 1,037,500,000 642,598,099 226,907,991 1,907,006,090 492,969,204 2,399,975,294
Net Profit for the year - - 91,868,014 91,868,014 (48,113,994) 43,754,020
Surplus on Revaluation of Land & Buildings - 28,812,841 5,293 28,818,134 4,701,677 33,519,811
Deferred Tax Liability on Revaluation Surplus (750,376) (750,376) (705,252) (1,455,628)
Reversal of Deferred Tax effect on Re valuation - 2,406,090 - 2,406,090 - 2,406,090 -
Issue of Ordinary Shares 941,844,948 - - 941,844,948 - 941,844,948 -
Direct Cost on Share Issue - - (5,565,225) (5,565,225) - (5,565,225) -
Dividend paid - - (25,000,000) (25,000,000) - (25,000,000)
Minority Interest arisen from Business acquisition - - - - (339,013) (339,013)
As at 31 March 2012 1,979,344,948 673,066,654 288,216,073 2,940,627,675 448,512,622 3,389,140,297
The accounting policies and notes on pages 51 through 78 form an integral part of the Financial Statements.
49
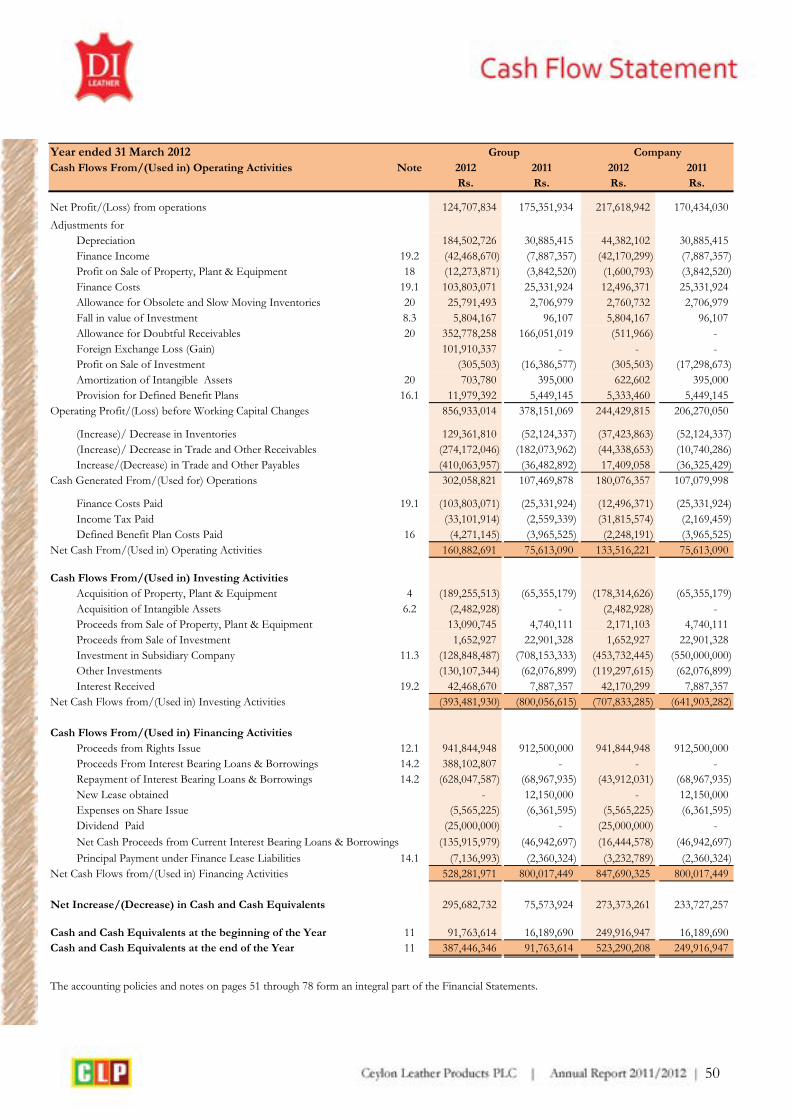
Year ended 31 March 2012Cash Flows From/(Used in) Operating Activities Note 2012 2011 2012 2011
Rs. Rs. Rs. Rs.
Net Profit/(Loss) from operations 124,707,834 175,351,934 217,618,942 170,434,030
Adjustments for Depreciation 184,502,726 30,885,415 44,382,102 30,885,415
Finance Income 19.2 (42,468,670) (7,887,357) (42,170,299) (7,887,357) Profit on Sale of Property, Plant & Equipment 18 (12,273,871) (3,842,520) (1,600,793) (3,842,520) Finance Costs 19.1 103,803,071 25,331,924 12,496,371 25,331,924 Allowance for Obsolete and Slow Moving Inventories 20 25,791,493 2,706,979 2,760,732 2,706,979 Fall in value of Investment 8.3 5,804,167 96,107 5,804,167 96,107 Allowance for Doubtful Receivables 20 352,778,258 166,051,019 (511,966) - Foreign Exchange Loss (Gain) 101,910,337 - - - Profit on Sale of Investment (305,503) (16,386,577) (305,503) (17,298,673) Amortization of Intangible Assets 20 703,780 395,000 622,602 395,000 Provision for Defined Benefit Plans 16.1 11,979,392 5,449,145 5,333,460 5,449,145
Operating Profit/(Loss) before Working Capital Changes 856,933,014 378,151,069 244,429,815 206,270,050
(Increase)/ Decrease in Inventories 129,361,810 (52,124,337) (37,423,863) (52,124,337) (Increase)/ Decrease in Trade and Other Receivables (274,172,046) (182,073,962) (44,338,653) (10,740,286) Increase/(Decrease) in Trade and Other Payables (410,063,957) (36,482,892) 17,409,058 (36,325,429)
Cash Generated From/(Used for) Operations 302,058,821 107,469,878 180,076,357 107,079,998
Finance Costs Paid 19.1 (103,803,071) (25,331,924) (12,496,371) (25,331,924) Income Tax Paid (33,101,914) (2,559,339) (31,815,574) (2,169,459) Defined Benefit Plan Costs Paid 16 (4,271,145) (3,965,525) (2,248,191) (3,965,525)
Net Cash From/(Used in) Operating Activities 160,882,691 75,613,090 133,516,221 75,613,090
Cash Flows From/(Used in) Investing ActivitiesAcquisition of Property, Plant & Equipment 4 (189,255,513) (65,355,179) (178,314,626) (65,355,179) Acquisition of Intangible Assets 6.2 (2,482,928) - (2,482,928) - Proceeds from Sale of Property, Plant & Equipment 13,090,745 4,740,111 2,171,103 4,740,111 Proceeds from Sale of Investment 1,652,927 22,901,328 1,652,927 22,901,328 Investment in Subsidiary Company 11.3 (128,848,487) (708,153,333) (453,732,445) (550,000,000) Other Investments (130,107,344) (62,076,899) (119,297,615) (62,076,899) Interest Received 19.2 42,468,670 7,887,357 42,170,299 7,887,357
Net Cash Flows from/(Used in) Investing Activities (393,481,930) (800,056,615) (707,833,285) (641,903,282)
Cash Flows From/(Used in) Financing ActivitiesProceeds from Rights Issue 12.1 941,844,948 912,500,000 941,844,948 912,500,000 Proceeds From Interest Bearing Loans & Borrowings 14.2 388,102,807 - - - Repayment of Interest Bearing Loans & Borrowings 14.2 (628,047,587) (68,967,935) (43,912,031) (68,967,935) New Lease obtained - 12,150,000 - 12,150,000 Expenses on Share Issue (5,565,225) (6,361,595) (5,565,225) (6,361,595) Dividend Paid (25,000,000) - (25,000,000) - Net Cash Proceeds from Current Interest Bearing Loans & Borrowings (135,915,979) (46,942,697) (16,444,578) (46,942,697) Principal Payment under Finance Lease Liabilities 14.1 (7,136,993) (2,360,324) (3,232,789) (2,360,324)
Net Cash Flows from/(Used in) Financing Activities 528,281,971 800,017,449 847,690,325 800,017,449
Net Increase/(Decrease) in Cash and Cash Equivalents 295,682,732 75,573,924 273,373,261 233,727,257
Cash and Cash Equivalents at the beginning of the Year 11 91,763,614 16,189,690 249,916,947 16,189,690 Cash and Cash Equivalents at the end of the Year 11 387,446,346 91,763,614 523,290,208 249,916,947
The accounting policies and notes on pages 51 through 78 form an integral part of the Financial Statements.
Group Company
50

1. CORPORATE INFORMATION
1.1 General
Reporting Entity
Ceylon Leather Products PLC (The Company) is alimited liability company incorporated and domi-ciled in Sri Lanka. The registered office of theCompany is located at No.64, Belummahara,Mudungoda and the principal place of business issituated at No.64, Belummahara, Mudungoda.
The Consolidated Financial Statements of thecompany for the year ended 31 March 2012 com-prises of the company and its subsidiaries (togetherreferred to as the “Group”).
Subsidiaries
Ceylon Leather Products Distributors (Pvt) Limitedis a limited liability company incorporated anddomiciled in Sri Lanka. The registered office andthe principal place of business are same as the par-ent Company.
South Asia Textile Industries Lanka (Pvt) Limitedis a limited liability Company incorporated anddomiciled in Sri Lanka. The registered office of theCompany and the principal place of business is sit-uated at No.70, Felix Dias Bandaranayake Mawatha,Pugoda, Sri Lanka
Palla and Company (Private) Limited is a limited li-ability Company incorporated and domiciled in SriLanka. The registered office of the Company andprincipal place of the business is located at SpurRd. 4, Lot 25B, Katunayake Export PromotionZone.
1.2 Principal Activities & Nature of Operations
Company
During the year, the principal activities of the Com-pany were manufacturing and selling of Leather,Leather Footwear and Leather Goods.
Subsidiaries –
Ceylon Leather Products Distributors (Private)Limited
During the year, the principal activity of the Com-pany was retail selling of Leather Footwear andLeather Goods.
South Asia Textile Industries Lanka (Private)Limited
During the year, the principal activities of the Com-pany were manufacturing and sale of knitted fab-rics for the export and local markets.
Palla and Company (Private) Limited
During the year the principal activities of the Com-pany were manufacturing shoes for exports.
1.3 Parent Entity and Ultimate Parent Entity
The Company’s parent entity is Environmental Re-sources Investment PLC. In the opinion of the Di-rectors, the Company’s ultimate parent undertakingand controlling party is Environmental ResourcesInvestment PLC, which is incorporated in SriLanka.
1.4 Date of Authorization for Issue
The Financial Statements for the year ended 31March 2012 were authorized for issue in accor-dance with a resolution by the Board of Birectorson 07 August 2012.
BASIS OF PREPARATION
2.1 Basis of Preparation
2.1.1 Statement of Compliance
The balance sheet, statements of income, changesin equity and cash flows, together with accountingpolicies and notes, (“Financial Statements”) i.e.Consolidated Financial Statements & Separate Fi-nancial Statements of the Company as at 31 March2012 and for the year then ended, have been pre-
51

pared in accordance with Sri Lanka AccountingStandards (SLAS).
The Financial Statements are presented in SriLankan rupees. The Financial Statements have beenprepared on a historical cost basis except for Prop-erty, Plant & Equipment, that have been measuredat revalued amounts.
The preparation and presentation of these Finan-cial Statements is in compliance with the Compa-nies Act. No. 07 of 2007
The Group and the Company did not adopt any in-appropriate accounting treatments which are notcomplying with the requirements of the Sri LankaAccounting Standards and other laws and regula-tions governing the preparation and presentationof Financial Statements
2.1.2 Basis of Consolidation
The Consolidated Financial Statements include theresults, assets and liabilities of the Company, andits Subsidiaries as at 31 March and the proportion-ate share of results of its associate company. TheConsolidated financial statements are prepared toa common financial year ending 31 March.
All intra group balances, transactions, profits andlosses are eliminated on consolidation. Subsidiariesare fully consolidated from the date on which con-trol is transferred to the Company and continuedto be consolidated until the date that such controlceases. The results of subsidiaries acquired or dis-posed of during the year are included in the Con-solidated Income Statement from the date ofacquisition or up to the date of disposal, as appro-priate.
Subsidiaries
Subsidiaries are those enterprises controlled by theparent. Control exists when the parent holds morethan 50% of the voting rights or otherwise has con-trolling interest.
Other Investments
Investment in companies where the group holdsless than 20% of the equity, and where the groupdoes not have significant influence, have been ac-counted for at cost. Income from these investmentsis recognised only to the extent of dividends re-ceived if any.
2.1.3 Going Concern
The Directors have made an assessment of theCompany’s ability to continue as a going concernand they do not intend either to liquidate or tocease trading.
2.1.4 Comparative Information
Comparative information is reclassified wherevernecessary to comply with the current presentation.The Accounting Policies have been consistently ap-plied by the Company and, are consistent withthose used in the previous year.
2.1.5 Business Combinations and Goodwill
Business combinations are accounted for using thePurchase Method of Accounting as per the require-ments of Sri Lanka Accounting Standard No. 25(Revised 2004) on ‘Business Combinations’. Thisinvolves recognising identifiable assets (includingpreviously unrecognised intangibles) and liabilities(including contingent liabilities) of the acquiredbusiness at fair value. Any excess of the cost of ac-quisition over the fair values of the identifiable netassets acquired, is recognised as goodwill. If thecost of acquisition is less than the fair values of theidentifiable net assets acquired, the difference isidentified as discount on acquisition (negativegoodwill) and is recognised directly in the IncomeStatement in the year of acquisition.
Goodwill acquired in a Business Combination isinitially measured at cost, being the excess of thecost of the Business Combination over the Com-pany’s interests in the net fair value of the identifi-able assets, liabilities and contingent liabilities
52

acquired. Sri Lanka Accounting Standard No. 25(Revised 2004) on ‘Business Combinations’ re-quires that following the initial recognition, good-will is to be measured at cost less any accumulatedimpairment losses and goodwill to be reviewed forimpairment, annually or more frequently if eventsor changes in circumstances indicate that the car-rying value may be impaired.
2.2 SIGNIFICANT ACCOUNTING JUDG-MENTS, ESTIMATES AND ASSUMP-TIONS
In the process of applying the group accountingpolicies, management is required to make judg-ments, apart from those involving estimations,which have the most significant effect on theamounts recognized in the Financial Statements.Further, management is required to consider keyassumptions concerning the future and other keysources of estimation of uncertainty at the balancesheet date, that have a significant risk of causingmaterial adjustments to the carrying amounts ofassets and liabilities within the next financial yearare discussed below. The respective carryingamounts of assets and liabilities are given in relatednotes to the Financial Statements. The respectivecarrying amounts of such assets and liabilities areas given in related notes to the Financial State-ments. The key items as such are discussed below.
Deferred Tax Assets
Deferred tax assets are recognised for all unusedtax losses to the extent that it is probable that tax-able profit will be available against which the lossescan be utilised. Significant management judgmentis required to determine the amount of deferredtax assets that can be recognised, based upon thelikely timing and level of future taxable profits to-gether with future tax planning strategies.
Fair value of Property, Plant and Equipment
The property, plant and equipment of the groupwere reflected at fair value. When current market
prices of similar assets are available, such evidenceare considered in estimating fair values of thesesassets. In the absence of such information thecompany determines within reasonable fair valueestimates, amounts that can be attributed as fair val-ues, taking in to consideration discounted cash flowprojections based on estimates, derived evidencesuch as current market rates for similar propertiesand using discount rates that reflect uncertainty inthe amount and timing of cash flows.
Defined Benefit Plans:
The cost of defined benefit plans- gratuity is de-termined using actuarial valuations. The actuarialvaluation involves making assumptions about dis-count rates, expected rates of return on assets, fu-ture salary increases, mortality rates and futurepension increases. Due to the long term nature ofthese plans, such estimates are subject to significantuncertainty.
Allowances for Doubtful Debts:
The group reviewed at each balance sheet date allreceivables to assess whether an allowance shouldbe recorded in the income statement. The manage-ment uses judgment in estimating such amounts inthe light of the duration of outstanding and anyother factors management is aware of that indicatesuncertainty in recovery.
Useful lives of Property, Plant & Equipment
The Company reviews the assets’ residual values,useful lives and methods of depreciation at eachreporting date. Judgment by the management is ex-ercised in the estimation of these values, rates,methods, and hence they are subject to uncertainty
2.3 SUMMARY OF SIGNIFICANT AC-COUNTING POLICIES
2.3.1 Foreign Currency Translation
The Financial Statements are presented in SriLanka Rupees, which is the Company’s functionaland presentation currency. Transactions in foreign
53

currencies are initially recorded at the functionalcurrency rate at the date of the transaction. Mone-tary assets and liabilities denominated in foreigncurrencies are retranslated at the functional cur-rency rate of exchange at the balance sheet date.All differences are taken to profit or loss. Nonmonetary items that are measured in terms of his-torical cost in a foreign currency are translatedusing the exchange rates as at the dates of the initialtransactions. Non monetary items measured at fairvalue in a foreign currency are translated using theexchange rates at the date when the fair value wasdetermined.
2.3.2 Taxation
a) Current Taxes
Current income tax assets and liabilities for the cur-rent and prior periods are measured at the amountexpected to be recovered from or paid to the taxa-tion authorities. The tax rates and tax laws used tocompute the amount are those that are enacted orsubstantively enacted by the balance sheet date.
The provision for income tax is based on the ele-ments of income and expenditure as reported inthe Financial Statements and computed in accor-dance with the provisions of the relevant tax legis-lations.
Current income tax relating to items recognised di-rectly in equity is recognised in equity and not inthe income statement.
b) Deferred Taxation
Deferred income tax is provided, using the liabilitymethod, on temporary differences at the balancesheet date between the tax bases of assets and lia-bilities and their carrying amounts for financial re-porting purposes.
Deferred income tax liabilities are recognised forall taxable temporary differences except where thedeferred income tax liability arises from the initialrecognition of an asset or liability in a transactionthat is not a business combination and, at the timeof the transaction, affects neither the accounting
profit nor taxable profit or loss.Deferred income tax assets are recognised for alldeductible temporary differences, carry-forward ofunused tax assets and unused tax losses, to the ex-tent that it is probable that taxable profit will beavailable against which the deductible temporarydifferences, and the carry-forward of unused taxassets and unused tax losses can be utilized exceptwhere the deferred income tax asset relating to thedeductible temporary difference arises from the ini-tial recognition of an asset or liability in a transac-tion that is not a business combination and, at thetime of the transaction, affects neither the account-ing profit nor taxable profit or loss; and
The carrying amount of deferred income tax assetsis reviewed at each balance sheet date and reducedto the extent that it is no longer probable that suf-ficient taxable profit will be available to allow all orpart of the deferred income tax asset to be utilized.
Deferred income tax assets and liabilities are meas-ured at the tax rates that are expected to apply tothe year when the asset is realised or the liability issettled, based on tax rates and tax laws that havebeen enacted or substantively enacted at the bal-ance sheet date.
Deferred income tax relating to items recogniseddirectly in equity is recognised in equity and not inthe income statement.
2.3.3 Borrowing Costs
Borrowing costs are recognised as an expense inthe period in which they are incurred.
2.4 VALUATION OF ASSETS AND THEIRMEASUREMENT BASES
2.4.1 Inventories
Inventories are valued at the lower of cost and netrealisable value, after making due allowances forobsolete and slow moving items. Net realisablevalue is the price at which inventories can be soldin the ordinary course of business less the esti-mated cost of completion and the estimated cost
54

necessary to make the sale.The cost incurred in bringing inventories to itspresent location and condition are accounted usingthe following cost formulae:-
Raw Materials - At purchase cost on weighted average basis.
Finished Goods & Work-in-Progress- At the cost of direct mate rials,direct labour and an appropriate proportion of fixed production over- heads based on normal operating capacity, but excluding borrowing Costs.
Consumables & Spares - At purchase cost on
weighted average basis
Goods in Transit - At purchase price
Net realizable value is the estimated selling price inthe ordinary course of business, less estimated costof completion and estimated costs necessary tomake the sale.
2.4.2 Trade and Other Receivables
Trade receivables are stated at the amounts they areestimated to realise net of allowances for bad anddoubtful receivables.
Other receivables and dues from Related Parties arerecognised at cost less allowances for bad anddoubtful receivables.
2.4.3 Cash and Cash Equivalents
Cash and cash equivalents are defined as cash onhand, demand deposits and short term highly liquidinvestments, readily convertible to known amountsof cash and subject to insignificant risk of changesin value.For the purpose of cash flow statement, cash andcash equivalents consist of cash on hand and de-
posits in banks net of outstanding bank over-drafts. Investments with short maturities i.e. threemonths or less from the date of acquisition are alsotreated as cash equivalents.
2.4.4 Property, Plant and Equipment
a) Cost /Revaluation
Plant & Equipment are recorded at cost excludingthe costs of day to day servicing, less accumulateddepreciation & accumulated impairment in value.Such cost includes the cost of replacing part of theplant and equipment when that cost is incurred, ifthe recognition criteria are met.
Land and buildings are measured at fair value lessdepreciation on buildings and impairment chargedsubsequent to the date of the revaluation. Valua-tions are performed every 3-5 years to ensure thatthe fair value of a revalued asset does not differ ma-terially from its carrying amount.
All items of Property, Plant & Equipment are ini-tially recorded at cost. Where items of Property,Plant and Equipment are subsequently revalued,the entire class of such assets is revalued. Revalua-tions are made with sufficient regularity to ensurethat their carrying amounts do not differ materiallyfrom their fair values at the balance sheet date sub-sequent to the initial recognition as an asset at cost.Revalued Property, Plant and Equipment are car-ried at revalued amounts less any subsequent de-preciation thereon. All other Property, Plant andEquipment are stated at historical cost less depre-ciation.
When an asset is revalued, any increase in the car-rying amount is credited directly to a revaluationsurplus unless it reverses a previous revaluation de-crease relating to the same asset, which was previ-ously recognised as an expense. In thesecircumstances the increase is recognised as incometo the extent of the previous write down. When anasset’s carrying amount is decreased as a result ofa revaluation, the decrease is recognised as an ex-
55

pense unless it reverses a previous increment relat-ing to that asset, in which case it is charged againstany related revaluation surplus, to the extent thatthe decrease does not exceed the amount held inthe revaluation surplus in respect of that sameasset. Any balance remaining in the revaluation sur-plus in respect of an asset, is transferred directly toAccumulated Profits on retirement or disposal ofthe asset.
b) Restoration Costs
Expenditure incurred on repairs or maintenance ofProperty, Plant and Equipment in order to restoreor maintain the future economic benefits expectedfrom originally assessed standard of performance,is recognised as an expense when incurred.
c) Depreciation
The provision for depreciation is calculated byusing a straight line method on the cost or valuationof all Property, Plant and Equipment other thanfreehold land, in order to write off such amountsover the estimated useful economic lives by equalinstalments. Effective rates are as follows: Land Development Cost 10%Buildings on Free Hold Land 2.5%Buildings on Lease Hold Land 2% - 5%Plant & Machinery 10%Production Equipment 5.5%Electrical Installations 6.67% - 20%Office Equipment 10%Furniture and Fittings 10% - 20%Water Embankment & Purification Project 10%Motor Vehicle 16.67% - 25%
The depreciation charges are determined separatelyfor each significant part of an item of property,plant & equipment and begin to depreciate when itis available for use.
d) De-recognition
An item of property, plant and equipment is dere-cognised upon disposal or when no future eco-
nomic benefits are expected from its use or dis-posal. Any gain or loss arising on derecognition ofthe asset (calculated as the difference between thenet disposal proceeds and the carrying amount ofthe asset) is included in the income statement in theyear the asset is derecognised.
2.4.5 Intangible Assets
Intangible assets acquired separately are measuredon initial recognition at cost. Following initialrecognition, intangible assets are carried at cost lessany accumulated amortization and any accumulatedimpairment losses. Internally generated intangibleassets, excluding capitalized development costs, arenot capitalized and expenditure is reflected in theincome statement in the year in which the expen-diture is incurred.
Intangible assets with finite lives are amortized overthe useful economic life and assessed for impair-ment whenever there is an indication that the in-tangible assets may be impaired. The amortizationperiod and the amortization method for intangibleassets with finite useful life is received at least ateach financial year end. Changes in the expecteduseful life or the expected pattern of consumptionof future economic benefits embodied in the assetsis accounted for by changing the amortization pe-riod or method, as appropriate, and treated aschanges in accounting estimates. The amortizationexpenses on intangible assets with finite lives arerecognized in the income statement in the expensecategory consistent with the function of the intan-gible assets.
Computer Software and Licences
Computer Software is amortized over 10 yearsfrom the date of acquisition or development.
2.4.6 Leases - Company as a lessee
Finance leases, which transfer to the Company sub-stantially all the risks and benefits incidental toownership of the leased item, are capitalised at theinception of the lease at the fair value of the leased
56

property or, if lower, at the present value of theminimum lease payments. Lease payments are ap-portioned between the finance charges and reduc-tion of the lease liability so as to achieve a constantrate of interest on the remaining balance of the li-ability. Finance charges are reflected in the incomestatement.
Capitalised leased assets are depreciated over theshorter of the estimated useful life of the asset andthe lease term, if there is no reasonable certaintythat the Company will obtain ownership by the endof the lease term. The depreciation policy for de-preciable leased assets is consistent with that fordepreciable asset that are owned as described in2.4.4.
Operating lease payments are recognised as an ex-pense in the income statement on a straight linebasis over the lease term.
2.4.7 Investments
a) Initial Recognition
Cost of investment includes purchase cost and ac-quisition charges such as brokerages, fees, dutiesand bank regulatory fees. The company distin-guishes and presents current and non current in-vestment in the balance sheet.
b) Measurement
i) Current Investments
Current investments are carried at the lower of costand market value.
The cost of an investment is the cost of acquisitioninclusive of brokerages, fees, duties and bank fees.
Reduction to market value and reversals of such re-ductions required to reflect current investments atthe lower of cost and market value, are credited orcharged to the income statement.
ii) Long Term Investments
Long term investments are stated at cost. The car-
rying amounts are reduced to recognize a declineother than temporary, determined for each invest-ment individually. These reductions for other thantemporary declines in carrying amounts are chargedto income statement.
c) Disposal of Investment
On disposal of an investment, the difference be-tween net disposals and proceed and the carryingamounts is recognized as income or expense.
2.5 LIABILITIES AND PROVISIONS
2.5.1 Provisions
Provisions are recognized when the company hasa present obligation (legal or constructive) as a re-sult of a past event, where it is probable that anoutflow of resources embodying economic bene-fits will be required to settle the obligation and areliable estimate can be made of the amount of theobligation. When the company expects some or allof a provision to be reimbursed, the reimburse-ment is recognised as a separate assets but onlywhen the reimbursement is virtually certain. Theexpense relating to any provision is presented in theincome statement net of any reimbursement. If theeffect of the time of value of money is material,provisions are determined by discounting the ex-pected future cash flows at a pre-tax rate that re-flects current market assessment of the time valueof money and, where appropriate, the risk specificto the liability.
2.5.2 Retirement Benefit Obligations
a) Defined Benefit Plan – Gratuity
Gratuity is a post employment benefit plan. Provi-sions have been made for retirement gratuity fromthe first year of service for all employees in con-formity with SLAS 16. However, under the pay-ment of Gratuity Act No. 12 of 1983, the liabilityto an employee arises only on completion of fiveyears of continued service. The Company is liableto pay gratuity in terms of relevant statute. In orderto meet this liability, a provision is carried forward
57

in the Balance Sheet. Based on the Sri Lanka Accounting Standard 16(Revised 2006) - Employee Benefit, the companymeasures the present value of the promisedretirement benefits for gratuity, which is a definedbenefit plan with the advice of an independentprofessional actuary once in every three (03) yearsusing the Projected Unit Credit Method (PUC).
For the purpose of determining the charge for anyperiod before the next regular actuarial valuationfalls due, an approximate estimate provided by thequalified actuary is used.
The item is stated under Defined Benefit Liabilityin the Balance Sheet.
Recognition of Actuarial Gains and Losses
Actuarial gains and losses are recognised as incomeor expenses when the net cumulative unrecognisedactuarial gains and losses at the end of the previousreporting period exceeds 10% of the higher of thedefined benefit obligation and the fair value of planassets at the date.
The gains/losses are recognised over the expectedaverage remaining working lives of the employeesparticipating in the plan.
Recognition of Past Service Cost
Past Service Costs are recognised as an expense ona straight line basis over the average period until thebenefits become vested. If the benefits have alreadybeen vested, immediately following theintroduction of, or changes to the plan, past servicecosts are recognised immediately.
Funding Arrangements
The gratuity liability is not externally funded.
b) Defined Contribution Plans – Employees’Provident Fund & Employees’ Trust Fund
Employees are eligible for Employees’ ProvidentFund Contributions and Employees’ Trust Fund
Contributions in line with the respective statutesand regulations. The Company contributes 12 %and 3% of gross emoluments of employees to Em-ployees’ Provident Fund and Employees’ TrustFund respectively.
2.5.3 Grants and Subsidies
Grants and subsidies are recognised at their fairvalue where there is reasonable assurance that thegrant/subsidy will be received and all attaching con-ditions, if any, will be complied with. When thegrant or subsidy relates to an expense item it isrecognised as income over the periods necessary tomatch them to the costs to which it is intended tocompensate on a systematic basis.
2.5.4 Impairment of Non Financial Assets
The group assesses at each reporting date whetherthere is an indication that an asset may be impaired.If any such indication exists, or when annual im-pairment testing for an asset is required, the Com-pany makes an estimate of the asset’s recoverableamount. An asset’s recoverable amount is thehigher of an asset’s or cash-generating unit’s fairvalue less costs to sell and its value in use and is de-termined for an individual asset, unless the assetdoes not generate cash inflows that are largely in-dependent of those from other assets or groups ofassets. Where the carrying amount of an asset ex-ceeds its recoverable amount, the asset is consid-ered impaired and is written down to its recoverableamount. In assessing value in use, the estimated fu-ture cash flows are discounted to their present valueusing a pre-tax discount rate that reflects currentmarket assessments of the time value of moneyand the risks specific to the asset. In determiningfair value less costs to sell, an appropriate valuationmodel is used. These calculations are corroboratedby valuation multiples or other available fair valueindicators.
Impairment losses of continuing operations arerecognised in the income statement in those ex-pense categories consistent with the function of
58

the impaired asset, except for property previouslyrevalued where the revaluation was taken to equity.In this case the impairment is also recognised in eq-uity up to the amount of any previous revaluation.
For assets, an assessment is made at each reportingdate as to whether there is any indication that pre-viously recognised impairment losses may nolonger exist or may have decreased. If such indica-tion exists, the Company makes an estimate of re-coverable amount. A previously recognisedimpairment loss is reversed only if there has beena change in the estimates used to determine theasset’s recoverable amount since the last impair-ment loss was recognised. If that is the case the car-rying amount of the asset is increased to itsrecoverable amount. That increased amount cannotexceed the carrying amount that would have beendetermined, net of depreciation, had no impair-ment loss been recognised for the asset in prioryears. Such reversal is recognised in the incomestatement unless the asset is carried at revaluedamount, in which case the reversal is treated as arevaluation increase.
2.6 INCOME STATEMENT
2.6.1 Revenue Recognition
Revenue is recognised to the extent that it is prob-able that the economic benefits will flow to theCompany and the revenue and associated costs in-curred or to be incurred can be reliably measured.Revenue is measured at the fair value of the con-sideration received or receivable net of trade dis-counts and sales taxes. The following specificcriteria are used for the purpose of recognition ofrevenue.
a) Sale of Goods
Revenue from sale of goods is recognised when thesignificant risks and rewards of ownership of thegoods have passed to buyer; with the Company re-taining neither continuing managerial involvementto the degree usually associated with ownership,
nor effective control over the goods sold. b) Interest income
Interest Income is recognised as the interest ac-crues taking into account the effective yield on theasset unless collectability is in doubt.
c) Dividends
Dividend income from shares is recognized whenthe shareholders’ right to receive the payment is es-tablished.
d) Others
Other income is recognised on an accrual basis.Net Gains and losses of a revenue nature on thedisposal of Property, Plant & Equipment and othernon current assets including investments have beenaccounted for in the income statement, having de-ducted from proceeds on disposal, the carryingamount of the assets and related selling expenses.
Gains and losses arising from incidental activitiesto main revenue generating activities and those aris-ing from a group of similar transactions which arenot material, are aggregated, reported and pre-sented on a net basis.
2.6.2 Expenditure Recognition
a) Expenses are recognised in the income state-ment on the basis of a direct association betweenthe cost incurred and the earning of specific itemsof income. All expenditure incurred in the runningof the business and in maintaining the Property,Plant & Equipment in a state of efficiency has beencharged to income in arriving at the profit for theyear.
b) For the purpose of presentation of the IncomeStatement the directors are of the opinion that thefunction of expenses method present fairly the el-ements of the Company’s performance, and hencesuch presentation method is adopted.
59
2.7 Sri Lanka Accounting Standards EffectiveFrom 01 January 2012
The Company will be adopting the new Sri LankaAccounting Standards (new SLAS) comprisingLKAS and SLFRS applicable for financial periodscommencing from 01 January 2012 as issued bythe Institute of Chartered Accountants of SriLanka. The Company has commenced reviewingits accounting policies and financial reporting inreadiness for the transition. As the Company hasa 31 March year end, priority has been given toconsidering the preparation of an opening balancesheet in accordance with the new SLASs as at 01April 2012. This will form the basis of accountingfor the new SLASs in the future, and is requiredwhen the Company prepares its first new SLAScompliant Financial Statements for the year ending31 March 2013. Set out below are the key areaswhere accounting policies will change and mayhave an impact on the Financial Statements of theCompany. The Company is in the process of quan-tifying the impact on the financial statements aris-ing from such changes in accounting policies.
(a) SLFRS 1 – First Time Adoption of Sri Lanka Ac-counting Standards requires the Company to prepareand present opening new SLFRS Financial State-ments at the date of transition to new SLAS. TheCompany shall use the same accounting policies inits opening new SLAS Financial Statements andthroughout all comparable periods presented in itsfirst new SLAS Financial Statements.
(b) LKAS 1 – Presentation of Financial Statements re-quires an entity to present, in a statement ofchanges in equity, all owner changes in equity. Allnon owner changes in equity are required to be pre-sented in one statement of comprehensive incomeor in two statements (a separate income statementand a statement of comprehensive income). Com-ponents of comprehensive income are not permit-ted to be presented in the statement of changes inequity. This standard also requires the Company todisclose information that enables users of its finan-cial statements to evaluate the entity’s objectives,policies and processes for managing capital.
(c) LKAS 16 – Property Plant and Equipment requiresa Company to initially measure an item of propertyplant and equipment at cost, using the cash priceequivalent at the recognition date. If payment is de-ferred beyond normal credit terms, the differencebetween the cash price equivalent and the total pay-ment is recognized as interest over the period, un-less such interest is capitalized in accordance withLKAS 23 Borrowing Costs.All site restoration costs including other environ-mental restoration and similar costs must be esti-mated and capitalized at initial recognition, in orderthat such costs can be depreciated over the usefullife of the asset.
This standard requires depreciation of assets overtheir useful lives, where the residual value of assetsis deducted to arrive at the depreciable value. It alsorequires that significant components of an asset beevaluated separately for depreciation.
(d) LKAS 32 – Financial Instruments: Presentation,LKAS 39 – Financial Instruments: Recognition and Meas-urement and SLFRS 7 – Disclosures will result inchanges to the current method of recognizing fi-nancial assets, financial liabilities and equity instru-ments. These standards will require measurementof financial assets and financial liabilities at fairvalue at initial measurement. The subsequent meas-urement of financial assets classified as fair valuethrough profit and loss and available for sale willbe at fair value, with the gains and losses routedthrough the statements of comprehensive incomeand other comprehensive income respectively.
Financial assets classified as held to maturity andloans and receivables will be measured subse-quently at amortized cost. These assets will need tobe assessed for any objective evidence of impair-ment as a result of one or more events that oc-curred after the initial recognition of the asset (a‘loss event’) coupled with a reliable estimate of theloss event (or events) impact on the estimated fu-ture cash flows of the financial asset or group offinancial assets. As such the current method of as-
60

sessing for impairment will have to be changed tomeet the requirements of these new standards.
Financial liabilities will be either classified as fairvalue through profit or loss or at amortized cost.At present, the Company does not identify, catego-rize and measure financial assets and liabilities asper the requirements of the standard and also doesnot recognize certain derivative instruments on thebalance sheet
(e) SLFRS 2 – Share Based Payments, will require theCompany to reflect in its profit or loss and financialposition the effects of share based payment trans-actions, including expenses associated with shareoptions granted to employees. An entity is requiredto recognize share based payment transactionswhen goods are received or services obtained basedon the fair value of goods or services or the fairvalue of equity instruments granted. Hence theCompany will be required to determine the fairvalue of options issued to employees as remunera-tion and recognize an expense in the statement offinancial performance. This standard is not limitedto options and extends to all forms of equity basedremuneration and payments.
(f) SLFRS 3 – Business combinations will require theCompany to apply this standard to transactions andother events that meet the new definition of a busi-ness i.e. an integrated set of assets(inputs) and ac-tivities( processes) which are capable of beingconducted and managed to provide a return, as op-posed to a mere asset acquisition. Under the newacquisition method of accounting, in addition torecognizing and measuring in its financial state-ments the identifiable assets acquired and liabilitiesassumed the standard also requires recognition andmeasurement of any non-controlling interest in theacquirement and re-measuring to fair value any pre-viously held interests which could have an impacton the recognition of goodwill.
Subsequent to the acquisition of control any acqui-sitions or disposals of non-controlling interestwithout loss of control will be accounted for as eq-
uity transactions and cannot be recognized asprofit/loss on disposal of investments in the state-ment of financial performance.
(g) LKAS 23 – Borrowing Cost, the Company mustcapitalize borrowing costs in relation to a qualifyingasset. [if applicable] Since the current policy is toexpense all borrowing costs, this will result in achange in accounting policy.
(h) LKAS 12 – Income Tax requires deferred tax tobe provided in respect of temporary differenceswhich will arise as a result of adjustments made tocomply with the new SLAS.
(i) LKAS 18 – Revenue requires the Company tomeasure revenue at fair value of the considerationreceived or receivable. It also specifies recognitioncriteria for revenue, and the Company needs toapply such recognition criteria to the separatelyidentifiable components of a single transaction inorder to reflect the substance of the transaction.
The Institute of Chartered Accountants of SriLanka has resolved an amendment to Sri Lanka Ac-counting Standard 10, whereby the provision con-tained in paragraphs 30 and 31 of SLAS 10 –Accounting Policies, Changes in Accounting Esti-mates and Errors would not be applicable for Fi-nancial Statements prepared in respect of financialperiods commencing before 1 January 2012 andhence the impact of this transition is not requiredto be disclosed in these Financial Statements.
61

3. REVENUE 2012 2011 2012 2011Rs. Rs. Rs Rs.
3.1 SummaryGross Sales 4,558,444,131 1,206,583,448 1,499,824,084 1,194,909,356 Less: Sales Taxes: Turnover Tax - (210,025) - (20,686) Nation Building Tax (26,604,118) (28,057,291) (26,033,932) (27,934,876) Value Added Tax (160,295,556) (127,194,469) (160,295,556) (127,194,469) Revenue 4,371,544,457 1,051,121,663 1,313,494,596 1,039,759,325
3.2 Segment Information
Product Segment: Leather, Leather Footwear, & Leather GoodsAs at 31 March 2012 the group is organised into two main business segments geographically: - Revenue from local sales - Revenue from export sales
Local Sales 1,545,607,099 1,194,295,248 1,490,900,346 1,182,621,156 Less: Sales Taxes: (186,899,674) (155,461,785) (186,329,488) (155,150,031) Net Revenue from Local Sales 1,358,707,425 1,038,833,463 1,304,570,858 1,027,471,125 Export Sales 3,012,837,032 12,288,200 8,923,738 12,288,200
4,371,544,457 1,051,121,663 1,313,494,596 1,039,759,325
3.3 Segment Information - ProductYear Ended 31 March 2012 Leather & Footwear Textile Total
Rs. Rs. Rs.
Revenue - Local Net of Taxes 1,318,118,652 40,588,773 1,358,707,425 Revenue - Export Direct / Indirect 273,971,778 2,738,865,254 3,012,837,032
1,592,090,430 2,779,454,027 4,371,544,457
Operating Profit Segment Results (before finance cost) 193,316,347 (7,274,112) 186,042,235
Finance Cost (7,242,210) (96,560,861) (103,803,071) Finance Income 42,213,480 255,190 42,468,670 Finance Cost - Net 34,971,270 (96,305,671) (61,334,401)
Share of Profit / ( Loss ) of Associate - Profit/ (Loss) before Tax 228,287,617 (103,579,783) 124,707,834 Income Tax (Expense)/ Reversal (82,595,627) 1,641,813 (80,953,814) Net Profit/(Loss) For the Year 145,691,990 (101,937,970) 43,754,020
3.4 Segment Information - ProductYear ended 31 March 2011 Leather & Footwear Textile Total
Rs. Rs. Rs.
Revenue - Local Net of Taxes 1,038,833,463 - 1,038,833,463 Revenue - Export Direct / Indirect 12,288,200 - 12,288,200
1,051,121,663 - 1,051,121,663
Operating Profit Segment Results (before finance cost) 192,796,501 - 192,796,501
Finance Cost (25,331,924) - (25,331,924) Finance Income 7,887,357 - 7,887,357 Finance Cost - Net (17,444,567) (17,444,567)
Share of Profit / ( Loss ) of Associate - Profit/ (Loss) before Tax 175,351,934 - 175,351,934 Income Tax (Expense)/ Reversal (68,412,232) - (68,412,232) Net Profit/(Loss) For the Year 106,939,702 - 106,939,702
Group Company
Group
Group
62
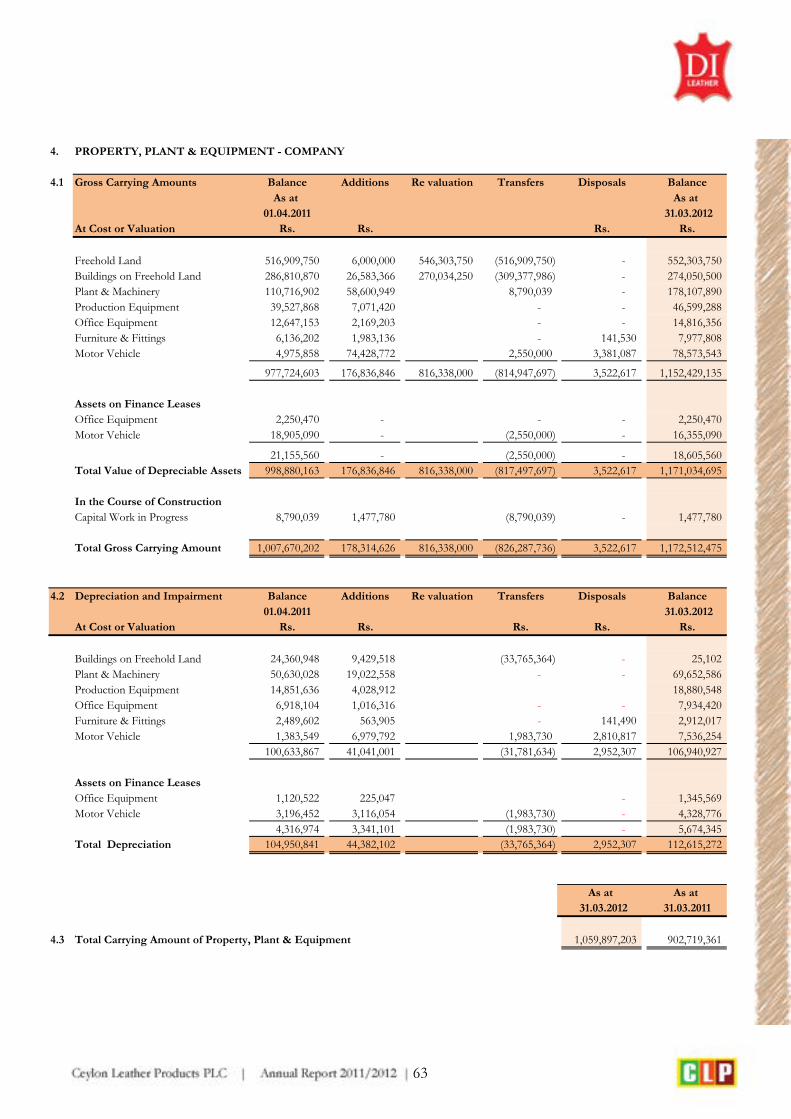
4.
4.1 Gross Carrying Amounts Balance Additions Re valuation Transfers Disposals BalanceAs at As at
01.04.2011 31.03.2012At Cost or Valuation Rs. Rs. Rs. Rs.
Freehold Land 516,909,750 6,000,000 546,303,750 (516,909,750) - 552,303,750 Buildings on Freehold Land 286,810,870 26,583,366 270,034,250 (309,377,986) - 274,050,500 Plant & Machinery 110,716,902 58,600,949 8,790,039 - 178,107,890 Production Equipment 39,527,868 7,071,420 - - 46,599,288 Office Equipment 12,647,153 2,169,203 - - 14,816,356 Furniture & Fittings 6,136,202 1,983,136 - 141,530 7,977,808 Motor Vehicle 4,975,858 74,428,772 2,550,000 3,381,087 78,573,543
977,724,603 176,836,846 816,338,000 (814,947,697) 3,522,617 1,152,429,135
Assets on Finance LeasesOffice Equipment 2,250,470 - - - 2,250,470 Motor Vehicle 18,905,090 - (2,550,000) - 16,355,090
21,155,560 - (2,550,000) - 18,605,560 Total Value of Depreciable Assets 998,880,163 176,836,846 816,338,000 (817,497,697) 3,522,617 1,171,034,695
In the Course of ConstructionCapital Work in Progress 8,790,039 1,477,780 (8,790,039) - 1,477,780
Total Gross Carrying Amount 1,007,670,202 178,314,626 816,338,000 (826,287,736) 3,522,617 1,172,512,475
4.2 Depreciation and Impairment Balance Additions Re valuation Transfers Disposals Balance01.04.2011 31.03.2012
At Cost or Valuation Rs. Rs. Rs. Rs. Rs.
Buildings on Freehold Land 24,360,948 9,429,518 (33,765,364) - 25,102 Plant & Machinery 50,630,028 19,022,558 - - 69,652,586 Production Equipment 14,851,636 4,028,912 18,880,548 Office Equipment 6,918,104 1,016,316 - - 7,934,420 Furniture & Fittings 2,489,602 563,905 - 141,490 2,912,017 Motor Vehicle 1,383,549 6,979,792 1,983,730 2,810,817 7,536,254
100,633,867 41,041,001 (31,781,634) 2,952,307 106,940,927
Assets on Finance LeasesOffice Equipment 1,120,522 225,047 - 1,345,569 Motor Vehicle 3,196,452 3,116,054 (1,983,730) - 4,328,776
4,316,974 3,341,101 (1,983,730) - 5,674,345 Total Depreciation 104,950,841 44,382,102 (33,765,364) 2,952,307 112,615,272
As at As at 31.03.2012 31.03.2011
4.3 Total Carrying Amount of Property, Plant & Equipment 1,059,897,203 902,719,361
PROPERTY, PLANT & EQUIPMENT - COMPANY
63

4. PROPERTY, PLANT & EQUIPMENT - GROUP
4.1 Gross Carrying Amounts Balance Business Additions Re valuation Transfers Disposals BalanceAs at Acquisitions As at
01.04.2011 31.03.2012Restated
At Cost or Valuation Rs. Rs. Rs. Rs. Rs. Rs. Rs.
Freehold Land 516,909,750 - 6,000,000 546,303,750 (516,909,750) - 552,303,750 Land Development Cost 20,361,232 - - - - - 20,361,232 Buildings on Freehold Land 286,810,870 - 26,583,366 270,034,250 (309,377,986) - 274,050,500 Plant & Machinery 998,186,602 75,234,434 60,065,886 - 8,790,039 207,000 1,142,069,961
Production Equipment 74,263,258 23,329,275 7,707,093 - - 59,500 105,240,126 Electrical Installation 99,897,983 - 253,555 - - - 100,151,538 Office Equipment 64,078,619 5,503,844 6,875,323 - - 100,750 76,357,036 Furniture & Fittings 19,006,800 596,117 2,250,406 - - 141,530 21,711,793 Water Embankment & Purification Project 110,760,567 - 336,562 - - - 111,097,129 Motor Vehicles 28,063,531 3,572,978 74,567,772 - 2,550,000 8,211,522 100,542,759
2,218,339,212 108,236,648 184,639,963 816,338,000 (814,947,697) 8,720,302 2,503,885,824
Assets on Finance LeasesBuildings on Lease Hold Land 633,682,622 116,313,290 1,235,970 628,650,000 (633,682,622) - 746,199,260 Office Equipment 2,250,470 - - - - - 2,250,470 Motor Vehicles 18,905,090 - - - (2,550,000) - 16,355,090
654,838,182 116,313,290 1,235,970 628,650,000 (636,232,622) - 764,804,820 Total Value of Depreciable Assets 2,873,177,394 224,549,938 185,875,933 1,444,988,000 (1,451,180,319) 8,720,302 3,268,690,644
In the Course of ConstructionPlant & Machinery 74,972,138 - 1,901,800 - (8,790,039) - 68,083,899 Electricity Installation - 0 1,477,780 - 1,477,780 Total Gross Carrying Amount 2,948,149,532 224,549,938 189,255,513 1,444,988,000 (1,459,970,358) 8,720,302 3,338,252,323
4.2 Depreciation and Impairment Balance Business Additions Transfers Disposals BalanceAs at Acquisitions As at
01.04.2011 31.03.2012At Cost or Valuation Rs. Rs. Rs. Rs. Rs. Rs.
Land Development Cost 10,062,421 - 2,036,119 - - 12,098,540 Buildings on Freehold Land 24,360,948 - 9,429,518 (33,765,364) - 25,102 Plant & Machinery 418,758,146 8,278,585 115,937,632 - 192 542,974,171 Production Equipment 35,545,893 17,818,945 4,300,398 - 30,364 57,634,872 Electrical Installation 88,960,996 - 8,008,565 - - 96,969,561 Office Equipment 55,341,480 4,276,722 4,424,771 - 90,129 63,952,844 Furniture & Fittings 13,471,643 419,792 1,851,951 - 141,490 15,601,896 Water Embankment & Purification Project 33,232,006 - 11,076,056 - - 44,308,062 Motor Vehicles 24,237,370 1,115,538 7,421,251 1,983,730 7,641,252 27,116,637
703,970,903 31,909,583 164,486,261 (31,781,634) 7,903,427 860,681,686
Assets on Finance LeasesLeasehold Buildings - 6,763,832 16,675,364 (14,736,805) - 8,702,391 Office Equipment 1,120,522 - 225,047 - - 1,345,569 Motor Vehicles 3,196,452 - 3,116,054 (1,983,730) - 4,328,776
4,316,974 6,763,832 20,016,465 (1,983,730) - 14,376,736 Total Depreciation 708,287,877 38,673,415 184,502,726 (33,765,364) 7,903,427 875,058,422
As at As at
31.03.2012 31.03.2011Rs. Rs.
Total Carrying Amount of Property, Plant & Equipment 2,463,193,901 2,239,861,655
64
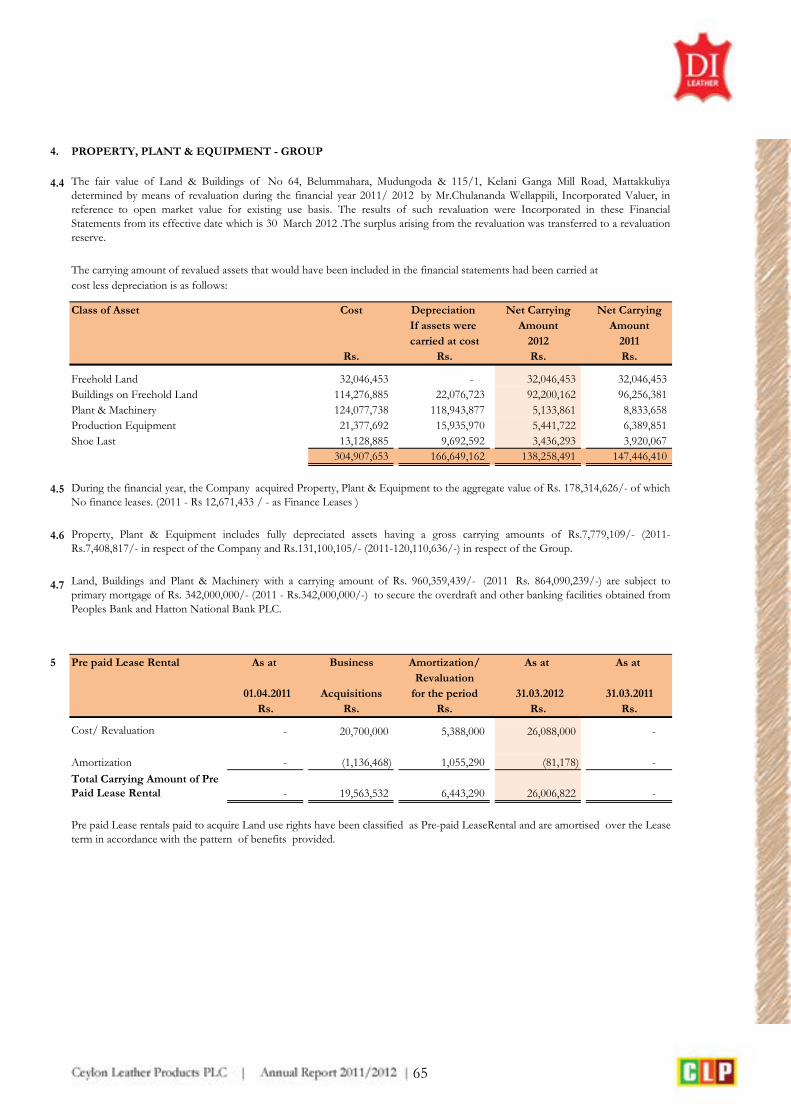
4. PROPERTY, PLANT & EQUIPMENT - GROUP
4.4
The carrying amount of revalued assets that would have been included in the financial statements had been carried at cost less depreciation is as follows:
Class of Asset Cost Depreciation Net Carrying Net CarryingIf assets were Amount Amountcarried at cost 2012 2011
Rs. Rs. Rs. Rs.
Freehold Land 32,046,453 - 32,046,453 32,046,453 Buildings on Freehold Land 114,276,885 22,076,723 92,200,162 96,256,381 Plant & Machinery 124,077,738 118,943,877 5,133,861 8,833,658 Production Equipment 21,377,692 15,935,970 5,441,722 6,389,851 Shoe Last 13,128,885 9,692,592 3,436,293 3,920,067
304,907,653 166,649,162 138,258,491 147,446,410
4.5
4.6
4.7
5 Pre paid Lease Rental As at Business Amortization/ As at As at Revaluation
01.04.2011 Acquisitions for the period 31.03.2012 31.03.2011Rs. Rs. Rs. Rs. Rs.
Cost/ Revaluation - 20,700,000 5,388,000 26,088,000 -
Amortization - (1,136,468) 1,055,290 (81,178) -
- 19,563,532 6,443,290 26,006,822 -
Pre paid Lease rentals paid to acquire Land use rights have been classified as Pre-paid LeaseRental and are amortised over the Lease term in accordance with the pattern of benefits provided.
During the financial year, the Company acquired Property, Plant & Equipment to the aggregate value of Rs. 178,314,626/- of whichNo finance leases. (2011 - Rs 12,671,433 / - as Finance Leases )
Property, Plant & Equipment includes fully depreciated assets having a gross carrying amounts of Rs.7,779,109/- (2011-Rs.7,408,817/- in respect of the Company and Rs.131,100,105/- (2011-120,110,636/-) in respect of the Group.
Land, Buildings and Plant & Machinery with a carrying amount of Rs. 960,359,439/- (2011 Rs. 864,090,239/-) are subject toprimary mortgage of Rs. 342,000,000/- (2011 - Rs.342,000,000/-) to secure the overdraft and other banking facilities obtained fromPeoples Bank and Hatton National Bank PLC.
The fair value of Land & Buildings of No 64, Belummahara, Mudungoda & 115/1, Kelani Ganga Mill Road, Mattakkuliyadetermined by means of revaluation during the financial year 2011/ 2012 by Mr.Chulananda Wellappili, Incorporated Valuer, inreference to open market value for existing use basis. The results of such revaluation were Incorporated in these FinancialStatements from its effective date which is 30 March 2012 .The surplus arising from the revaluation was transferred to a revaluationreserve.
Total Carrying Amount of Pre Paid Lease Rental
65

6 INTANGIBLE ASSETS2012 2011 2012 2011Rs. Rs. Rs. Rs.
Summary RestatedComputer Software (Note 6.1) 1,975,000 2,370,000 1,975,000 2,370,000 Computer Software - License - (Note 6.2) 2,255,326 - 2,255,326 - Goodwill on Consolidation ( Note 6.3) 181,088,560 25,488,909 - -
185,318,886 27,858,909 4,230,326 2,370,000
6.1 Computer Software CostAs at 01 April 3,950,000 3,950,000 3,950,000 3,950,000 Acquired during the Year - - - - Disposed during the Year - - - - As at 31 March 3,950,000 3,950,000 3,950,000 3,950,000
AmortizationAs at 01 April 1,580,000 1,185,000 1,580,000 1,185,000 Amortization for the Year 395,000 395,000 395,000 395,000 As at 31 March 1,975,000 1,580,000 1,975,000 1,580,000
Net Book Value 1,975,000 2,370,000 1,975,000 2,370,000
6.2 Computer Software - LicenseCostAcquired during the Year 2,482,928 - 2,482,928 - As at 31 March 2,482,928 - 2,482,928 -
AmortizationAmortization for the Year 227,602 - 227,602
Net Book Value 2,255,326 - 2,255,326
6.3 Goodwill on ConsolidationAs at 01 April as previously Reported 256,014,742 - Effect of adjustment due to revaluation of Assets of Subsidiary (264,001,249) - Effect of adjustment due to Deferrded Tax on Revaluation 33,475,416 - As at 01 April - Restated 25,488,909 -
Arising from acqusition of subsidiaries (Note 11.3) 155,599,651 25,488,909 As at 31 March 181,088,560 25,488,909
7 INVESTMENT IN SUBSIDIARY - COMPANY Directors DirectorsCost Valuation Cost Valuation
Holding 2012 2012 2011 2011
Non-Quoted % Rs. Rs. Rs. Rs.
Ceylon Leather Products Distributors (Pvt) Limited 100% 100,000 - 100,000 - No of Ordinary Shares - 10,000Allowance for fall in value of Investment (100,000) - (100,000) South Asia Textile Industries Lanka (Pvt) Ltd 51.55% 550,000,000 550,000,000 550,000,000 550,000,000 - No of Ordinary Shares - 383,060,660Palla & Company Pvt Ltd No of Ordinary Shares - 54,000 60% 155,091,132 155,091,132 No of Preference Shares - 298,641 298,641,313 298,641,313 Total Non- Quoted Investment in Subsidiary 1,003,732,445 1,003,732,445 550,000,000 550,000,000
Group Company
Company purchased a locally developed Software, which is capitalized to the company's intangible assets during financial year 2007/08. It isestimated that the benefits of this asset would accrue to the company over period of 10 years, and being amortized over a period of 10 years. Theremaining useful life of intangible asset is 05 years as at 31 March 2012
66
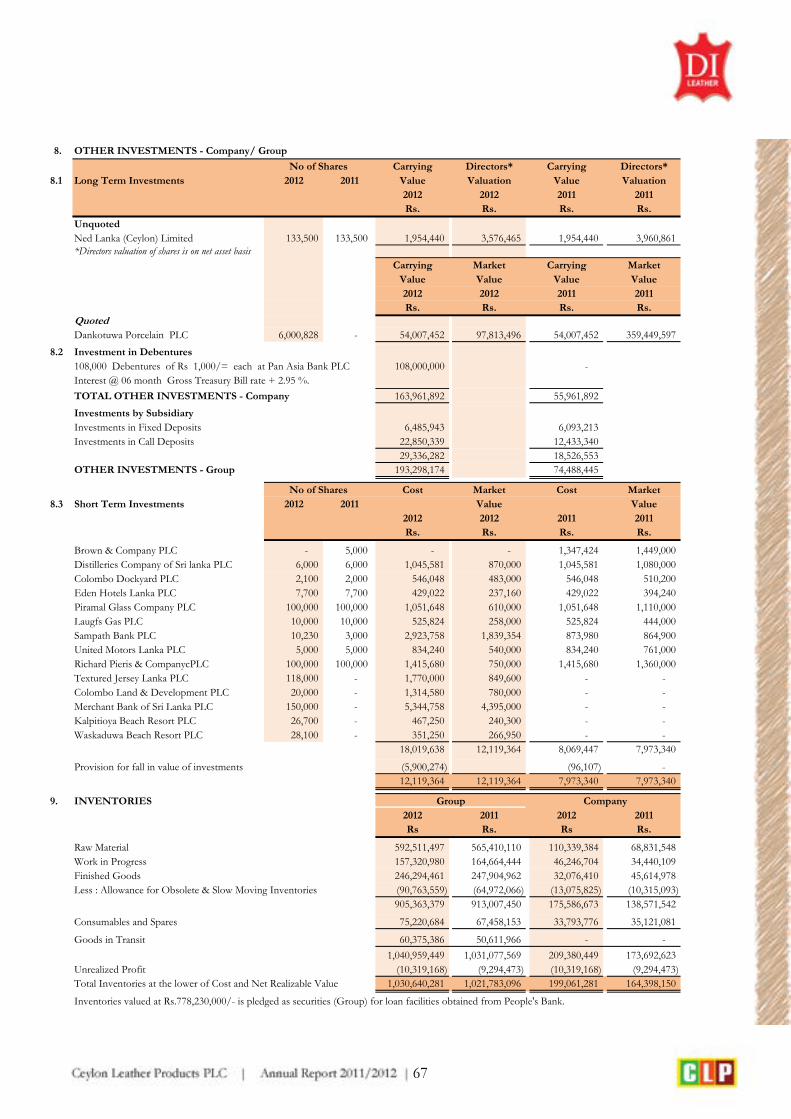
8. OTHER INVESTMENTS - Company/ Group
Carrying Directors* Carrying Directors*8.1 Long Term Investments 2012 2011 Value Valuation Value Valuation
2012 2012 2011 2011Rs. Rs. Rs. Rs.
UnquotedNed Lanka (Ceylon) Limited 133,500 133,500 1,954,440 3,576,465 1,954,440 3,960,861 *Directors valuation of shares is on net asset basis
Carrying Market Carrying MarketValue Value Value Value2012 2012 2011 2011Rs. Rs. Rs. Rs.
QuotedDankotuwa Porcelain PLC 6,000,828 - 54,007,452 97,813,496 54,007,452 359,449,597
8.2 Investment in Debentures108,000 Debentures of Rs 1,000/= each at Pan Asia Bank PLC 108,000,000 - Interest @ 06 month Gross Treasury Bill rate + 2.95 %.
TOTAL OTHER INVESTMENTS - Company 163,961,892 55,961,892
Investments by SubsidiaryInvestments in Fixed Deposits 6,485,943 6,093,213 Investments in Call Deposits 22,850,339 12,433,340
29,336,282 18,526,553 OTHER INVESTMENTS - Group 193,298,174 74,488,445
Cost Market Cost Market8.3 Short Term Investments 2012 2011 Value Value
2012 2012 2011 2011Rs. Rs. Rs. Rs.
Brown & Company PLC - 5,000 - - 1,347,424 1,449,000 Distilleries Company of Sri lanka PLC 6,000 6,000 1,045,581 870,000 1,045,581 1,080,000 Colombo Dockyard PLC 2,100 2,000 546,048 483,000 546,048 510,200 Eden Hotels Lanka PLC 7,700 7,700 429,022 237,160 429,022 394,240 Piramal Glass Company PLC 100,000 100,000 1,051,648 610,000 1,051,648 1,110,000 Laugfs Gas PLC 10,000 10,000 525,824 258,000 525,824 444,000 Sampath Bank PLC 10,230 3,000 2,923,758 1,839,354 873,980 864,900 United Motors Lanka PLC 5,000 5,000 834,240 540,000 834,240 761,000 Richard Pieris & CompanycPLC 100,000 100,000 1,415,680 750,000 1,415,680 1,360,000 Textured Jersey Lanka PLC 118,000 - 1,770,000 849,600 - - Colombo Land & Development PLC 20,000 - 1,314,580 780,000 - - Merchant Bank of Sri Lanka PLC 150,000 - 5,344,758 4,395,000 - - Kalpitioya Beach Resort PLC 26,700 - 467,250 240,300 - - Waskaduwa Beach Resort PLC 28,100 - 351,250 266,950 - -
18,019,638 12,119,364 8,069,447 7,973,340
Provision for fall in value of investments (5,900,274) (96,107) - 12,119,364 12,119,364 7,973,340 7,973,340
9. INVENTORIES2012 2011 2012 2011Rs Rs. Rs Rs.
Raw Material 592,511,497 565,410,110 110,339,384 68,831,548 Work in Progress 157,320,980 164,664,444 46,246,704 34,440,109 Finished Goods 246,294,461 247,904,962 32,076,410 45,614,978 Less : Allowance for Obsolete & Slow Moving Inventories (90,763,559) (64,972,066) (13,075,825) (10,315,093)
905,363,379 913,007,450 175,586,673 138,571,542
Consumables and Spares 75,220,684 67,458,153 33,793,776 35,121,081
Goods in Transit 60,375,386 50,611,966 - -
1,040,959,449 1,031,077,569 209,380,449 173,692,623 Unrealized Profit (10,319,168) (9,294,473) (10,319,168) (9,294,473) Total Inventories at the lower of Cost and Net Realizable Value 1,030,640,281 1,021,783,096 199,061,281 164,398,150
No of Shares
CompanyGroup
No of Shares
Inventories valued at Rs.778,230,000/- is pledged as securities (Group) for loan facilities obtained from People's Bank.
67

10. TRADE AND OTHER RECEIVABLES 2012 2011 2012 2011Rs Rs. Rs Rs.
Trade Debtors 764,777,758 578,723,410 245,440,485 203,832,999 Trade Dues Receivable from Related Parties (10.1) 447,256,045 384,437,167 2,803,101 7,730,161 Less: Allowances for Doubtful Debts (489,236,120) (135,740,587) (23,284,153) (23,796,119)
722,797,683 827,419,990 224,959,433 187,767,041
Other Debtors 143,220,364 158,448,491 12,595,426 37,537,549 Other Dues Receivable from Related Parties (10.2) 99,290,306 88,130,569 20,117,420 13,041,781 Advances and Prepayments 105,894,418 63,393,351 67,150,617 41,625,906 Less: Allowances for Doubtful Receivables (24,952,377) (24,952,377) (24,952,377) (24,952,377)
323,452,711 285,020,034 74,911,086 67,252,859 1,046,250,394 1,112,440,024 299,870,519 255,019,900
10.1 Trade Dues Receivables from Related PartiesRelationship
Ceylon Leather Products Distributors (Pvt) Limited. Subsidiary - - 28,572,302 33,857,961
Less: Allowance for Doubtful Debts - - (26,269,000) (26,269,000) - - 2,303,302 7,588,961
J.K.Apparels Lanka (Pvt) Ltd Affiliate 132,329,846 112,314,758 - South Asia Textile Industries (Pte) Ltd -Singapore Affiliate 314,926,199 272,122,409 - South Asia Textile Industries Lanka (Pvt) Ltd. Subsidiary - - 499,799 141,200
447,256,045 384,437,167 2,803,101 7,730,161
10.2 Other Dues Receivables from Related PartiesRelationship
J.K.Apparels Lanka (Pvt) Ltd Affiliate 48,716,872 37,560,735 15,158,139 10,000,000 Dankotuwa Porcelain PLC Affiliate 850,000 850,000 850,000 850,000 Colombo Pharmacy 3,600 - 3,600 - South Asia Laundry Lanka (Pvt) Ltd Affiliate 160,664,061 160,664,061 - - South Asia Textile Industries Lanka (Pvt) Ltd. Subsidiary - - 4,105,681 2,191,781 Less: Allowances for Doubtful Debts (110,944,227) (110,944,227) - -
99,290,306 88,130,569 20,117,420 13,041,781
11. CASH AND CASH EQUIVALENTS IN THE CASH FLOW STATEMENTComponents of Cash and Cash Equivalents
2012 2011 2012 201111.1 Favourable Cash & Cash Equivalents balance Rs Rs. Rs Rs.
Cash & Bank Balances 55,753,077 32,121,333 8,839,107 20,116,947 Fixed Deposits 520,000,000 229,800,000 520,000,000 229,800,000
575,753,077 261,921,333 528,839,107 249,916,947 11.2 Un-favourable Cash & Cash Equivalents balance
Bank Overdrafts (188,306,731) (170,157,719) (5,548,899) - Total Cash and Cash Equivalents for the Purpose of Cash Flow Statements 387,446,346 91,763,614 523,290,208 249,916,947
11.3 ACQUISITION OF SUBSIDIARY DURING THE YEARAcquisition of Palla & co.(pvt) Ltd
2012 2011Palla & Company South Asia Textiles
RestatedRs. Rs.
Property, Plant and Equipment 185,876,523 1,337,142,294 Value of Lease Hold Right on Land 26,088,000 - Investments - 18,526,553 Deferred Tax Asset - 7,982,879 Inventories 164,010,488 857,384,946 Trade and Other Receivables 13,227,254 867,342,066 Income Tax Receivable 617,838 Cash & Cash Equivalents 26,242,645 12,004,386 Interest Bearing Loans and Borrowings (315,542,484) (100,268,310) Retirement Benefit Liability (7,818,307) (12,488,545) Trade and Other Payables (80,689,525) (783,270,956) Interest Bearing Loans and Borrowings - Current - (956,638,242) Bank Overdraft - (170,157,719) Deferred Tax Liability (12,242,126) (60,696,896) Total Identifiable Assets (847,532) 1,017,480,294
Net Assets Acquired (508,519) 524,511,091 Goodwill on Acquisition 155,599,651 25,488,909 Cash consideration paid on the acquisition of Subsidiary 155,091,132 550,000,000
Net Cash Outflow from the acquisition (128,848,487) (708,153,333)
On 02nd December 2011, the group acquired 60% of the voting shares of Palla & Compny (Pvt) Ltd. The values of identifiable assets and liabilities of Palla & Company (Pvt)Ltd. as at the date of acquisition were:
Group Company
Group Company
68
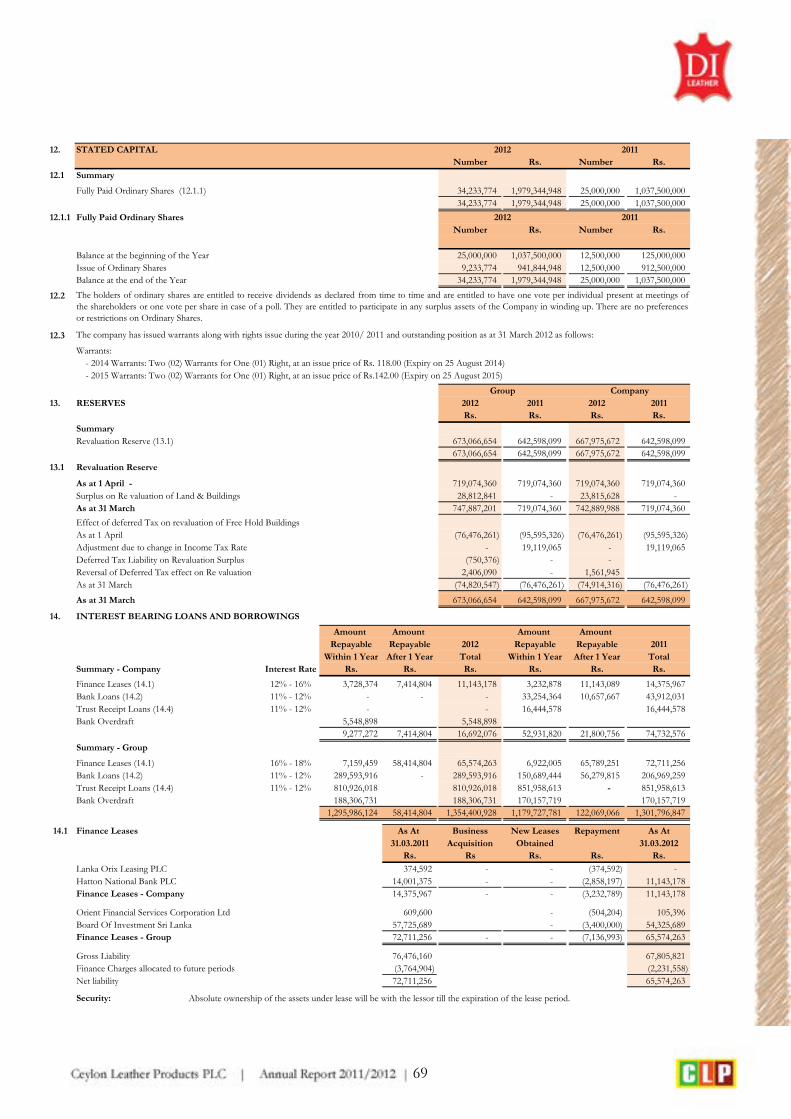
12. STATED CAPITALNumber Rs. Number Rs.
12.1 Summary
Fully Paid Ordinary Shares (12.1.1) 34,233,774 1,979,344,948 25,000,000 1,037,500,000 34,233,774 1,979,344,948 25,000,000 1,037,500,000
12.1.1 Fully Paid Ordinary Shares Number Rs. Number Rs.
Balance at the beginning of the Year 25,000,000 1,037,500,000 12,500,000 125,000,000 Issue of Ordinary Shares 9,233,774 941,844,948 12,500,000 912,500,000 Balance at the end of the Year 34,233,774 1,979,344,948 25,000,000 1,037,500,000
12.2
12.3
Warrants: - 2014 Warrants: Two (02) Warrants for One (01) Right, at an issue price of Rs. 118.00 (Expiry on 25 August 2014) - 2015 Warrants: Two (02) Warrants for One (01) Right, at an issue price of Rs.142.00 (Expiry on 25 August 2015)
13. RESERVES 2012 2011 2012 2011Rs. Rs. Rs. Rs.
SummaryRevaluation Reserve (13.1) 673,066,654 642,598,099 667,975,672 642,598,099
673,066,654 642,598,099 667,975,672 642,598,099
13.1 Revaluation Reserve
As at 1 April - 719,074,360 719,074,360 719,074,360 719,074,360 Surplus on Re valuation of Land & Buildings 28,812,841 - 23,815,628 - As at 31 March 747,887,201 719,074,360 742,889,988 719,074,360
Effect of deferred Tax on revaluation of Free Hold BuildingsAs at 1 April (76,476,261) (95,595,326) (76,476,261) (95,595,326) Adjustment due to change in Income Tax Rate - 19,119,065 - 19,119,065 Deferred Tax Liability on Revaluation Surplus (750,376) - - Reversal of Deferred Tax effect on Re valuation 2,406,090 - 1,561,945 As at 31 March (74,820,547) (76,476,261) (74,914,316) (76,476,261)
As at 31 March 673,066,654 642,598,099 667,975,672 642,598,099
14. INTEREST BEARING LOANS AND BORROWINGS
Amount Amount Amount Amount Repayable Repayable 2012 Repayable Repayable 2011
Within 1 Year After 1 Year Total Within 1 Year After 1 Year TotalSummary - Company Interest Rate Rs. Rs. Rs. Rs. Rs. Rs.
Finance Leases (14.1) 12% - 16% 3,728,374 7,414,804 11,143,178 3,232,878 11,143,089 14,375,967 Bank Loans (14.2) 11% - 12% - - - 33,254,364 10,657,667 43,912,031 Trust Receipt Loans (14.4) 11% - 12% - - 16,444,578 16,444,578 Bank Overdraft 5,548,898 5,548,898
9,277,272 7,414,804 16,692,076 52,931,820 21,800,756 74,732,576
Summary - Group
Finance Leases (14.1) 16% - 18% 7,159,459 58,414,804 65,574,263 6,922,005 65,789,251 72,711,256 Bank Loans (14.2) 11% - 12% 289,593,916 - 289,593,916 150,689,444 56,279,815 206,969,259 Trust Receipt Loans (14.4) 11% - 12% 810,926,018 810,926,018 851,958,613 - 851,958,613 Bank Overdraft 188,306,731 188,306,731 170,157,719 170,157,719
1,295,986,124 58,414,804 1,354,400,928 1,179,727,781 122,069,066 1,301,796,847
14.1 Finance Leases As At Business New Leases Repayment As At31.03.2011 Acquisition Obtained 31.03.2012
Rs. Rs Rs. Rs. Rs.
Lanka Orix Leasing PLC 374,592 - - (374,592) - Hatton National Bank PLC 14,001,375 - - (2,858,197) 11,143,178 Finance Leases - Company 14,375,967 - - (3,232,789) 11,143,178
Orient Financial Services Corporation Ltd 609,600 - (504,204) 105,396 Board Of Investment Sri Lanka 57,725,689 - (3,400,000) 54,325,689 Finance Leases - Group 72,711,256 - - (7,136,993) 65,574,263
Gross Liability 76,476,160 67,805,821 Finance Charges allocated to future periods (3,764,904) (2,231,558) Net liability 72,711,256 65,574,263
Security: Absolute ownership of the assets under lease will be with the lessor till the expiration of the lease period.
2012 2011
Group Company
The holders of ordinary shares are entitled to receive dividends as declared from time to time and are entitled to have one vote per individual present at meetings ofthe shareholders or one vote per share in case of a poll. They are entitled to participate in any surplus assets of the Company in winding up. There are no preferencesor restrictions on Ordinary Shares.
2012 2011
The company has issued warrants along with rights issue during the year 2010/ 2011 and outstanding position as at 31 March 2012 as follows:
69

14. INTEREST BEARING LOANS AND BORROWINGS (Contd..)
14.2 Bank Loan As At Business Loans Repayment Exchange As AtInterest Rate 01.04.2011 Acquisition Obtained (Gain) / Loss 31.03.2012
Rs. Rs. Rs. Rs. Rs. Rs.
Hatton National Bank PLC 12.00% 43,912,031 - - (43,912,031) - Bank Loans - Company 43,912,031 - - (43,912,031) -
Pan Asia Bank- Block Loan 10.50% - 380,000,000 (142,500,000) 237,500,000 People's Bank -(Block Loan VIII) LIBOR + 3% 33,850,734 (33,933,721) 82,987 - People's Bank -(Block Loan IX) LIBOR + 3% 111,675,060 (75,789,276) 6,943,966 42,829,750 National Development Bank - E-Friends Loan 6.50% 17,531,434 - (10,017,986) 7,513,448 National Development Bank - 16,901,171 8,102,807 (23,253,260) 1,750,718 Related Party Loans 298,641,313 - (298,641,313) - Bank Loans - Group 206,969,259 315,542,484 388,102,807 (628,047,587) 7,026,953 289,593,916 Security:
Loan Repayment Terms: Hatton National Bank PLC In monthly instalments of Rs. 3,017,617/-People's Bank -(Block Loan VIII) In monthly instalments of USD 28,500/-People's Bank -(Block Loan IX) In monthly instalments of USD 55,500/-National Development Bank In monthly instalments of Rs. 834,832/-Pan Asia Bank PLC In monthly instalments of Rs 47,500,000 /-
14.3 Trust Receipt/ Short Term Loans As At Business Loans Repayment Exchange As AtInterest Rate 01.04.2011 Acquisition Obtained (Gain) / Loss 31.03.2012
Rs. Rs. Rs. Rs. Rs. Rs.
Peoples Bank 11.0% 11,670,700 - 165,033,587 (176,704,287) - Hatton National Bank PLC 12.0% 4,773,878 117,628,864 (122,402,742) - Trust Receipt Loans - Company 16,444,578 - 282,662,451 (299,107,029) -
Peoples Bank 366,561,613 1,545,827,872 (1,407,825,069) 83,516,107 588,080,523 PABC Bank 395,318,000 644,749,760 (902,223,964) (225,178) 137,618,618 Standard Chartered Bank 73,634,422 - 11,592,455 85,226,877
Trust Receipt Loans - Group 851,958,613 2,473,240,083 (2,609,156,062) 94,883,384 810,926,018
Security: Ceylon Leather Products PLC
b) Deposit of Confirmed Orders from Government Forces, Departments and Other Reputed Institutions.
South Asia Textile Industries Lanka Pvt Limiteda) Machinery, Lease hold Buildings, and Inventory were pledged as security.
Loan Repayment Terms: Each short term loans under the limit should be repaid within a period of 150 days
15. TAXATION
15.1 Income Tax Expense
The major components of Income Tax Expense for the Year ended 31 March are as follows :Income Statement
2012 2011 2012 2011Current Income Tax Rs. Rs. Rs. Rs.
Current Income Tax Charge 57,325,038 43,985,898 55,613,106 42,633,798 Deemed Dividend Tax - 1,854,159 - 1,854,159 Under/(Over) provision of current taxes in respect of prior years 15,802,003 (498,500) 15,035,942 (498,500)
73,127,041 45,341,557 70,649,048 43,989,457 Deferred Income TaxDeferred Taxation Charge/(Reversal) 7,826,773 23,070,675 9,791,559 23,070,675 Income Tax Expense reported in the Income Statement 80,953,814 68,412,232 80,440,607 67,060,132
Statement of Changes in EquityDeferred Income Tax Related to Item Charged or Credited Directly to EquityNet Gain on Revaluation of Property, Plant & Equipment 1,561,945 - 1,561,945 Income Tax Expense/ (Reversal) Reported in Equity 1,561,945 - 1,561,945
Group
a) Mortgage over Land, building and Immovable Machinery at Kelani Ganga Mills Road, Mattakkuliya.
- Machineries, Lease hold buildings, and inventory were pledged against Peoples Bank and National Development Bank Facilities
- Primary floating mortgage bond for Rs.191 Mn over land and building depicted in lots 1 & 2 in plan no. 3560 dated 22 January 2008 made by L. Goonesekerasituated in Belummahara has been kept as security in order to acquire the loan.
Company
70

15. TAXATION (Contd..)
15.2 Reconciliation between tax expense and the product of accounting profit multiplied by the statutory tax rate
2012 2011 2012 2011Rs. Rs. Rs. Rs.
Accounting Profit/(Loss) before Tax from operations 124,707,834 175,351,934 217,618,942 170,434,030
Non-deductible expenses 315,095,274 57,408,665 61,474,662 57,408,665 Tax Deductible expense (246,622,574) (41,927,864) (77,916,124) (41,927,864) Income Exempt from Tax (43,181) Taxable Credits (42,170,299) (7,845,769) (42,170,299) (7,845,769) Income/(Loss) not subject to Tax 68,022,472 Tax Loss brought forward (34,846,709) (101,637,121) (64,749,912) Tax Loss Carried forward /Tax loss claimed during the year 31,451,508 34,846,709 (1,131,973) -
Taxable Profit on Business Income 215,594,325 116,196,554 157,875,208 113,319,150 Taxable Profit on Other Income 42,190,229 7,845,769 42,170,299 7,845,769
Net Taxable Profit 257,784,554 124,042,323 200,045,507 121,164,919
Current Tax ExpenseIncome Tax @ 28% 56,490,257 43,032,875 55,313,379 41,700,757 Income Tax @ 12% 835,007 302,985 299,727 302,985 SRL @ 1.5% 650,038 630,056 Under/(Over) provision of current taxes in respect of prior years 15,802,003 (498,500) 15,035,942 (498,500) Current Income Tax Charge 73,127,267 43,487,398 70,649,048 42,135,298
15.3 Deferred Tax Liability / (Asset)2012 2011 2012 2011Rs. Rs. Rs. Rs.
As at 1 April as previously stated 62,448,080 70,720,214 74,671,824 70,720,214 Effect of adjustment due to revaluation of Assets of Subsidiary 64,937,761 - - - Balance as at 1 April - Restated 127,385,841 70,720,214 74,671,824 70,720,214
Transferred from/ (to) Revaluation Reserve (950,462) (19,119,065) (1,561,945) (19,119,065) Business Acquisition 12,242,126 52,714,017 - - Provision/(Reversal) for the Year 7,826,773 23,070,675 9,791,559 23,070,675 As at 31 March 146,504,278 127,385,841 82,901,438 74,671,824
Deferred Tax Arising from:Group/ CompanyDeferred Tax LiabilityAccelerated Depreciation for Tax Purposes 11,514,820 (3,282,897) 17,723,000 7,067,565 Revaluation of Property, Plant & Equipment 147,943,194 141,414,022 74,914,315 76,476,261
159,458,014 138,131,125 92,637,315 83,543,826
Deferred Tax AssetsDefined Benefit Plans (12,953,736) (10,745,284) (9,735,878) (8,872,002) Tax Losses Carried Forward - - -
(12,953,736) (10,745,284) (9,735,878) (8,872,002)
Net Deferred Tax Liability 146,504,278 127,385,841 82,901,437 74,671,824
Deferred Tax Liability 156,951,748 135,368,720 82,901,437 74,671,824
Deferred Tax Asset 10,447,470 7,982,879 - -
Group Company
Group Company
71

16. DEFINED BENEFIT LIABILITYRetirement benefit obligation- Gratuity 2012 2011 2012 2011
Rs. Rs. Rs. Rs.Changes in the Present Value of the Defined Benefit Obligation are as follows:
Defined benefit obligation at 01 April 44,174,268 30,202,103 31,685,723 30,202,103
Interest Cost on benefit liability 4,252,735 3,020,210 3,327,001 3,020,210
Current Service Cost 9,113,291 1,958,474 2,101,072 1,958,474
Transitional Liability/(Asset) recognised during the year (1,386,634) 470,461 (94,613) 470,461
Benefits paid during the year (4,271,145) (3,965,525) (2,248,191) (3,965,525)
Business Acquisition 7,818,307 12,488,545 - Defined Benefit Obligation at 31 March 59,700,822 44,174,268 34,770,992 31,685,723
16.1 Net benefit expense recognised
Current Service Cost 9,113,291 1,958,474 2,101,072 1,958,474 Transitional Liability/(Asset) recognised during the year (1,386,634) 470,461 (94,613) 470,461 Interest Cost on benefit liability 4,252,735 3,020,210 3,327,001 3,020,210 Net benefit expense 11,979,392 5,449,145 5,333,460 5,449,145
16.2
The principal assumptions used for this purpose are as follows: Discount Rate 10 % 10.50% Salary Increase 08 % 8.50% Retirement Age 55 years 55 Years
Staff Turnover Age 20 25 30 35 40 45 50 >50 T/O 30% 40% 25% 30% 10% 5% 6% 4%
17. TRADE AND OTHER PAYABLES2012 2011 2012 2011Rs. Rs. Rs. Rs.
Trade Payables 392,268,680 728,374,220 16,355,891 9,029,529 Trade Dues Payable to Related Parties (17.1) 27,103,023 10,248,845 25,338,086 9,576,920 Sundry Creditors Including Accrued Expenses 112,867,511 92,224,898 55,856,591 30,769,379
532,239,214 830,847,963 97,550,568 49,375,828
17.1 Trade & Other Dues Payable to Related PartiesRelationship
Environmental Resources Investment Parent Company 26,015,841 9,000,000 19,987,681 9,000,000 J.K Apparels Lanka (pvt) Ltd Affiliate Company - 109,201 - 109,201 DNH Financials Ltd Affiliate Company 421,861 467,719 421,861 467,719 Enterprise Technology (Pvt) Ltd. Affiliate Company 459,429 671,925 - - The Colombo Pharmacy PLC Affiliate Company 176,428 - 176,428 - Palla & Co Pvt LTD - - 4,752,116 - Dankotuwa Porcelain PLC 29,464 - - -
27,103,023 10,248,845 25,338,086 9,576,920
18. OTHER INCOME AND GAINS 2012 2011 2012 2011Rs. Rs. Rs. Rs.
Rental Income 8,531,400 4,527,217 8,531,400 4,527,217 Sundry Income 27,877,012 2,587,527 1,592,685 2,587,527 Profit on sale of Investment 305,504 16,386,577 305,504 17,298,673 Profit on Sale of Property, Plant & Equipment 12,273,871 3,842,520 1,600,793 3,842,520
48,987,787 27,343,841 12,030,382 28,255,937
Group Company
Group Company
This obligation which is not externally funded, is based on an actuarial valuation of the defined benefit plan based on the projected unit creditmethod, which is the bench mark method specified in Sri Lanka Accounting Standards No.16, carried out by Messrs Actuarial & ManagementConsultants (Private) Limited, Professional Actuary, for the Year ended 31 March 2012.
Group Company
72
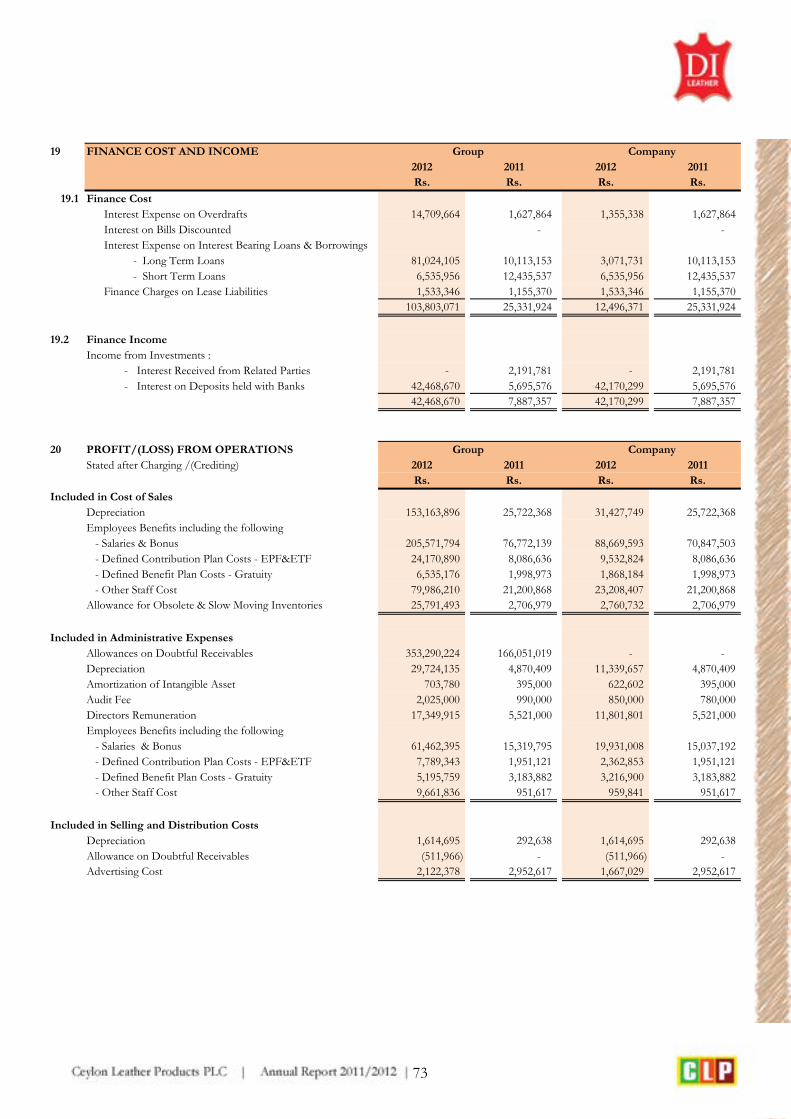
19 FINANCE COST AND INCOME2012 2011 2012 2011Rs. Rs. Rs. Rs.
19.1 Finance Cost Interest Expense on Overdrafts 14,709,664 1,627,864 1,355,338 1,627,864 Interest on Bills Discounted - - Interest Expense on Interest Bearing Loans & Borrowings - Long Term Loans 81,024,105 10,113,153 3,071,731 10,113,153 - Short Term Loans 6,535,956 12,435,537 6,535,956 12,435,537 Finance Charges on Lease Liabilities 1,533,346 1,155,370 1,533,346 1,155,370
103,803,071 25,331,924 12,496,371 25,331,924
19.2 Finance IncomeIncome from Investments : - Interest Received from Related Parties - 2,191,781 - 2,191,781 - Interest on Deposits held with Banks 42,468,670 5,695,576 42,170,299 5,695,576
42,468,670 7,887,357 42,170,299 7,887,357
20 PROFIT/(LOSS) FROM OPERATIONSStated after Charging /(Crediting) 2012 2011 2012 2011
Rs. Rs. Rs. Rs.
Included in Cost of Sales Depreciation 153,163,896 25,722,368 31,427,749 25,722,368 Employees Benefits including the following - Salaries & Bonus 205,571,794 76,772,139 88,669,593 70,847,503 - Defined Contribution Plan Costs - EPF&ETF 24,170,890 8,086,636 9,532,824 8,086,636 - Defined Benefit Plan Costs - Gratuity 6,535,176 1,998,973 1,868,184 1,998,973 - Other Staff Cost 79,986,210 21,200,868 23,208,407 21,200,868 Allowance for Obsolete & Slow Moving Inventories 25,791,493 2,706,979 2,760,732 2,706,979
Included in Administrative Expenses Allowances on Doubtful Receivables 353,290,224 166,051,019 - - Depreciation 29,724,135 4,870,409 11,339,657 4,870,409 Amortization of Intangible Asset 703,780 395,000 622,602 395,000 Audit Fee 2,025,000 990,000 850,000 780,000 Directors Remuneration 17,349,915 5,521,000 11,801,801 5,521,000 Employees Benefits including the following - Salaries & Bonus 61,462,395 15,319,795 19,931,008 15,037,192 - Defined Contribution Plan Costs - EPF&ETF 7,789,343 1,951,121 2,362,853 1,951,121 - Defined Benefit Plan Costs - Gratuity 5,195,759 3,183,882 3,216,900 3,183,882 - Other Staff Cost 9,661,836 951,617 959,841 951,617
Included in Selling and Distribution CostsDepreciation 1,614,695 292,638 1,614,695 292,638 Allowance on Doubtful Receivables (511,966) - (511,966) - Advertising Cost 2,122,378 2,952,617 1,667,029 2,952,617
Group Company
Group Company
73

21 EARNINGS PER SHARE
The following reflects the income and share data used in the basic Earnings Per Share Computations.
2012 2012 2011Rs. Rs.
Net Profit 91,868,014 106,939,702 137,178,335 103,373,898 Net Profit attributable to share holders for basic EPS 91,868,014 106,939,702 137,178,335 103,373,898
Number of Ordinary Shares Used as Denominator: 2012 2011Number Number
Number of Ordinary Shares at the beginning of the year 25,000,000 12,500,000 Number of Ordinary Shares in Issue during the Year 9,233,774 12,500,000 Weigthed Average Number of Ordinary Shares applicable to Basic Earnings Per Share 30,386,368 18,750,000
Weigthed Average Number of Ordinary Shares applicable to Diluted Earnings Per Share 30,386,368 18,750,000
22 COMMITMENTS AND CONTINGENCIES
22.1 Capital Expenditure Commitments
There were no material commitments which require disclosure as at the date of the balance sheet.
22.2 Contingencies
22.2.1 Letters of Credit and Bank Guarantees
2012 2011Rs Rs.
Letters of Credit Opened with Banks favouring suppliers 4,389,375 19,498,949 Guarantees Issued by Banks on behalf of the Company 45,631,798 57,652,094
22.2.2 Operating Lease Commitments
2012 2011Rs. Rs.
Within one year 3,000,000 3,000,000 After one year but not more than five years 15,000,000 15,000,000 More than five years 33,000,000 36,000,000 Present value of minimum lease payments 51,000,000 54,000,000
22.2.3 Legal Claims:A case has been filed by Standard Chartered Bank-Sri Lanka (No: DDR/143/2011) against the Subsidiary, South Asia Textiles IndustriesLanka (Pvt) Ltd., for the recoverablity of loan amounting to Rs. 80,527,163/-. The possible interest and other related expenditure has notbeen provided in the financial statements. Although there can be no assurance, the Directors believe, based on the information currentlyavailable, that the ultimate resolution of such procedures would not likely to have a material adverse effect on results of operations, financialposition or liquidity.
2011
Basic Earnings Per Share is calculated by dividing the net profit for the year attributable to ordinary shareholders by the weighted averagenumber of ordinary shares outstanding during the year.
Company, in its normal course of business opens letters of credit with banks favouring suppliers in respect of material procurement andgives guarantees issued by banks on company's behalf favouring customers. Respective balances outstanding as at the Balance Sheet date aregiven below:
The subsidiary, South Asia Textiles Industries Lanka (Pvt) Ltd. Has an operating lease for land. This lease has a term of renewal but nopurchase option and escalation clause. Renewals are at the option of the specific entity that holds the lease. Future, lease payments underoperating lease contract are as follows;
CompanyGroup
74

23 ASSETS PLEDGED
The following assets have been pledged as security for liabilities.
Nature of Assets Included under2012 2011Rs. Rs.
Company
Immovable Properties Floating Mortgage Property, Plant for Loans and Borrowings 826,329,148 779,359,672 & Equipment
Leased Assets Charge over Leased Assets Property, Plant on Finance Lease Liabilities 12,931,215 16,838,586 & Equipment
Plant & Machinery Floating MortgageOther than leased for Loans and Borrowings 133,098,997 84,730,567 Property, Plant
& Equipment
Group
Immovable Properties Floating Mortgage 826,329,148 779,359,672 Property, Plant for Loans and Borrowings and Equipment
Primary Mortgage 95,770,000 89,681,047 Property, Plant for Loans and Borrowings and Equipment
Leased Assets Charge over Leased Assets Property, Plant on Finance Lease Liabilities 12,931,215 16,838,586 & Equipment
Plant & Machinery Floating MortgageOther than leased for Loans and Borrowings 133,098,997 84,730,567 Property, Plant
& EquipmentMachineries Primary Mortgage 432,840,000 519,341,582 Property, Plant
for Loans and Borrowings and Equipment
Raw Materials, Finished Goods Primary/Concurrent Mortgage 778,230,000 829,092,881 Inventoriesand Work in Progress for Loans and Borrowings
Trade Debtors Primary/Concurrent Mortgage 879,070,000 740,774,179 Trade and Other Receivables
24 EVENTS OCCURRING AFTER THE BALANCE SHEET DATE
Carrying Amount PledgedNature of Liability
There have been no material events occurring after the Balance Sheet date that require adjustments to or disclosure in the financialstatements
75

25 RELATED PARTY DISCLOSURE
Details of significant related party disclosures are as follows:
25.1 Transactions with Key Management Persons of the Company
25.1.1 Key Management Personnel Compensation 2012 2011Rs. Rs.
CompanyShort-Term employee benefits 11,801,800 5,521,000
GroupShort-Term employee benefits 17,349,914 5,521,000
25.2 Transactions with Subsidiary, Associate of the Company
25.2.1 Transactions with Subsidiary
2012 2011Rs. Rs.
Opening Balance 36,190,942 39,524,464 Sale of Goods 23,899,574 15,501,839 Purchases (4,800,503) - Settlement of Dues (30,910,022) (21,087,142) Rendering of Services 4,045,676 60,000 Loan Granted - 100,000,000 Loan Settlement - (100,000,000) Interest Income - 2,191,781 Closing Balance 28,425,667 36,190,942
25.2.2 Transactions with Associate
2012 2011Rs. Rs.
Opening Balance - (7,901,331) Sale of Goods & Services - - Settlement of Dues - 7,901,331 Rent Income - - Closing Balance - -
Key Management Personnel (KMPs) are defined as those persons having authority and responsibility for planning, directingand controlling the activities of the group (Company and it's Subsidiary). Such KMPs include the Board of Directors of theCompany; key employees of the Company holding directorships in Subsidiary Company. Independent Transactions with KeyManagement Personnel and transactions with the Close Family Members (CFMs) of the KMPs,if any, also been have takeninto consideration in the following disclosure:
Tan Lanka Ltd (upto 6th August 2010) is the only Associate Company of Ceylon Leather Products PLC, and following are themajor transactions that the Company entered in to with its Associate Company
Ceylon Leather Products Distributors (Pvt) Ltd , South Asia Textile Industries Lanka (Pvt) Ltd and Palla & Company (Pvt)Ltd are the Subsidiary Companies of Ceylon Leather Products PLC, and following are the major transactions that theCompany entered into with its Subsidiary Companies.
The following table provides the total amount of transactions, which have been entered into with related parties for therelevant financial year.(for information regarding outstanding balances at 31 March 2012 and 2011, refer to Notes 10.1 &17.1):
76

25 RELATED PARTY DISCLOSURES (Contd..)
25.2.3 Transactions with Major Shareholders of the Company
2012 2011Rs. Rs.
Opening Balance (9,000,000) 5,786,413 Settlement of Previous year outstanding - (5,786,413) Sale of Goods - 259,597 Loan Granted - 200,000 Expenses Recovered 42,748 850,000 Purchases of Assets (71,456,000) (927,061) Expenses Payable (24,933,629) (7,263,638) Settlement of Dues 95,000,000 1,606,291 Settlement of Net Balances - 5,274,811 Re imbursement of Administrative Expenses (9,640,800) (9,000,000) Closing Balance (19,987,681) (9,000,000)
25.2.4 Transactions with the Other Related Parties
2012 2011Rs. Rs.
Opening Balance 10,273,080 (33,725,918) Settlement of Previous year outstanding - 725,918 Purchases (800,565) (1,806,970) Intangible Asset Purchases (2,837,632) - Expenses Payable (169,035) - Settlement of Dues 3,740,005 949,172 Loan Granted 5,158,139 10,000,000 Loan Settlement - 33,000,000 Expenses Recovered 49,457 1,130,878 Closing Balance 15,413,449 10,273,080
Followings are the major transactions entered in to by the Company with its Major Share Holders:
Transaction, arrangements and agreements involving Key Management Personnel (KMPs) and their Close Family Members(CFMs), and Entities which are controlled, jointly controlled or significantly influenced by the KMP's and their CFMs orshareholders who have either control, jointly control or significant influence over the entity. J.K.Apperals Lanka(Pvt)Ltd,Dankotuwa Porcelain PLC,DNH Financial (Pvt) Ltd,Enterprise Technology & The Colombo Pharmacy CompanyPLC are the other related parties of Ceylon Leather Products PLC. Followings are the major transactions entered into by theCompany with other Related Parties.
77

26
As Effect onReported Value Restated Previously Increase/ Balance
Note 31.03.2011 (Decrease) 31.03.2011Rs. Rs. Rs.
Balance Sheet
Property,Plant & Equipments (Land & Building) 4.1 2,572,282,723 375,866,809 2,948,149,532 Accumulated Depreciation 4.2 844,547,642 (136,259,765) 708,287,877 Goodwill (Included under Intangible Assets) 6.3 256,014,742 (230,525,833) 25,488,909 Deferred Tax Asset 15.3 12,223,744 (4,240,865) 7,982,879 Deferred Tax Liability 15.3 74,671,824 60,696,896 135,368,720 Minority Interest 276,306,223 216,662,981 492,969,204
Income Statement - - -
EFFECT ON ACQUIIREE'S IDENTIFIABLE ASSETS,LIABILITIES AND CONTINGENT LIABILITIES ANDTHE COST OF THE BUSINESS COMBINATION
As reported in the previous year, some of the assets of the acquiree were provisionally determined and accounted in the last year.During the current financial year, the group has identified the fair value of those assets and accounted from the acquisition date andaccordingly, comparative information presented previously have been restated.The effect on the financial statement is disclosedbelow.
78

Yea
r en
ded
31
Mar
ch (
Au
dit
ed)
2012
2011
2010
2009
2008
2007
2006
2005
2004
2003
RS.
' 000
RS.
' 000
RS.
' 000
RS.
' 000
RS.
' 000
RS.
' 000
RS.
' 000
RS.
' 000
RS.
' 000
RS.
' 000
SUM
MA
RY
OF
OP
ER
AT
ING
RE
SUL
TS
Tur
nove
r4,
371,
544
1,
051,
122
56
4,03
4
368,
327
43
8,81
3
53
0,22
7
56
3,89
5
539,
825
52
4,41
2
410,
944
Gro
ss P
rofit
762,
263
345,
487
215,
240
78
,340
78,2
38
77,1
47
95,3
22
84
,789
102,
654
90
,285
Net
Pro
fit b
efor
e F
inan
ce C
ost
228,
511
200,
684
98,0
72
14
0
76,6
57
(21,
898)
35,3
69
(7
,173
)
48
,825
38,5
36
Pro
fit/
(Los
s) b
efor
e T
axat
ion
124,
708
175,
352
62,6
51
(3
9,84
1)
32
,037
(5
9,23
7)
4,
068
(3
1,28
6)
23
,349
14,9
31
Tax
atio
n(8
0,95
4)
(68,
412)
(2
6,75
3)
15
,690
9,18
2
11,4
09
(1,0
57)
2,19
1
(11,
450)
(2,1
64)
Pro
fit f
or th
e Y
ear
43,7
54
106,
940
35,8
98
(2
4,15
1)
41
,219
(4
7,82
8)
3,
011
(2
9,09
5)
11
,899
12,7
67
SUM
MA
RY
OF
FIN
AN
CIA
L P
OSI
TIO
N
Stat
ed /
Iss
ued
Cap
ital
1,97
9,34
5
1,03
7,50
0
125,
000
12
5,00
0
125,
000
125,
000
125,
000
12
5,00
0
125,
000
10
0,00
0
Res
erve
s67
3,06
7
64
2,59
8
62
3,47
9
623,
479
47
8,68
7
33
3,21
0
33
3,21
0
333,
210
10
2,04
3
102,
043
Ret
aine
d E
arni
ngs
288,
216
226,
908
126,
330
90
,432
109,
217
(119
,373
)
(6
3,96
5)
(6
3,22
1)
(2
6,00
0)
(3
7,89
9)
Min
ority
Int
eres
t44
8,51
3
27
6,30
6
-
-
-
-
-
-
-
-
Tot
al E
quity
3,38
9,14
1
2,18
3,31
2
874,
809
83
8,91
1
712,
904
338,
837
394,
245
39
4,98
9
201,
043
16
4,14
4
ASS
ET
S &
LIA
BIL
ITIE
S
Cur
rent
Ass
ets
2,66
5,43
4
2,40
4,80
1
362,
643
33
6,87
3
383,
304
271,
108
301,
187
34
0,54
3
283,
026
19
4,45
4
Cur
rent
Lia
bilit
ies
(1,8
79,4
91)
(2
,053
,405
)
(217
,603
)
(248
,232
)
(278
,383
)
(2
40,4
28)
(217
,024
)
(245
,734
)
(115
,714
)
(222
,229
)
Net
Cur
rent
Ass
ets
785,
943
351,
396
145,
040
88
,641
104,
921
30,6
80
84,1
63
94
,809
167,
312
(2
7,77
5)
Pro
pert
y, P
lant
Equ
ip. &
Inv
estm
ents
2,86
7,81
8
2,06
0,60
8
879,
820
90
1,56
7
641,
704
447,
274
457,
448
46
1,21
3
234,
540
23
4,65
0
Def
erre
d T
ax L
iabi
litie
s (N
et)
(146
,505
)
(6
2,44
8)
(70,
720)
(65,
898)
(8,6
43)
(10,
144)
(11,
773)
(2,1
64)
Non
Cur
rent
Lia
bilit
ies
(118
,115
)
(1
66,2
43)
(79,
331)
(85,
399)
(33,
721)
(139
,117
)
(1
38,7
23)
(1
50,8
89)
(1
89,0
36)
(4
0,56
7)
Net
Ass
ets
3,38
9,14
1
2,18
3,31
3
874,
809
83
8,91
1
712,
904
338,
837
394,
245
39
4,98
9
201,
043
16
4,14
4
KE
Y R
AT
IOS
Ear
ning
s pe
r Sh
are
(Rs)
3.02
5.
70
2.87
(1
.93)
3.
30
(3
.83)
0.24
(2
.33)
1.
04
1.27
Net
Ass
ets
per
Shar
e (R
s)85
.90
87.3
369
.98
67.1
157
.03
27.1
131
.54
31.6
016
.08
16.4
1
Div
iden
d pe
r Sh
are
(Rs)
1.00
-
-
-
-
-
-
-
0.
65
-
Ann
ual S
ales
Gro
wth
(%)
315.
9%86
.4%
53.1
%-1
6.1%
-17.
2%-6
.0%
4.5%
2.9%
27.6
%(4
.6%
)
Cur
rent
Rat
io (T
imes
)1.
42
1.17
1.
67
1.36
1.
38
1.
13
1.
39
1.39
2.
45
0.88
Shar
e pr
ices
at t
he e
nd91
.990
87.7
550
.00
68
.00
21
.25
22.7
515
.25
7.25
N/A
The a
bove
sum
mer
ised
finan
cial in
form
atio
n is
extra
cted
from
audi
ted
finan
cial s
tate
men
ts.
79

For The Year Ended 31 March
Value Generated: Rs.' 000 Rs.' 000
Gross Turnover 4,558,444 1,206,583 Other Income 48,988 27,344 Less: Cost of Materials and Services bought in (3,649,617) (731,243) Value Generated 957,815 502,684
Distributed as Follows: Share % Rs. Share % Rs.
To Employees as Remuneration 42% 400,370 25% 123,540
To Government as Taxes 28% 267,854 45% 223,874 - Sales Taxes 186,900 155,462 - Income & Deferred Tax 80,954 68,412
To Lenders as Interest - net 6% 61,334 3% 17,445
Retained in the Business 24% 228,257 27% 137,825 - Depreciation 184,503 30,885 - Profit Retained 43,754 106,940
100% 957,815 100% 502,684
Note: Results for 2011/12 includes consolidation of South Asia Textiles Industries Lanka (Pvt) Ltd. effective 01 April 2011 and Palla & Company (Pvt) Ltd. effective 01 December 2011.
2012 2011
42%
28%
6%
24%
2011/12
To Employees as Remuneration
To Government as Taxes
To Lenders as Interest - net
Retained in the Business
Value Distributed as follows:
80

1 to 1,000 1799 457642 1.34 4 2,100 0.01 1,803 459,742 1.35
1001 to 10,000 418 1272618 3.72 7 28,600 0.08 425 1,301,218 3.80
10,001 to 100,000 61 1586132 4.63 4 100,400 0.29 65 1,686,532 4.92
100,001 to 1,000,000 1 150700 0.44 - 0 - 1 150,700 0.44
Over 1,000,000 1 29471753 86.09 1 1,163,829 3.40 2 30,635,582 89.49
2,280 32,938,845 96.22 16 1,294,929 3.78 2,296 34,233,774 100.00
Total Holding%
Individual Shareholders 95.3% 11.9%
Institutional 4.7% 88.1%
TOTAL 100% 100%
No of
shares held
1 Environmental Resources Investment PLC 29,471,753 86.09%
2 Dr. Kasim Nader 1,163,829 3.40%
3 Mrs. D.S.K. Athukorala 150,700 0.44%
4 Harsha International (Pvt) Ltd 100,000 0.29%
5 Mrs. U.C.P. Abeysekera 79,000 0.23%
6 Seylan Bank PLS/Mr. S.S.C. Fernando 78,150 0.23%
7 Mr. E.P.I. Fernando 76,900 0.22%
8 Mr. N.A.A. Karunarathna 70,200 0.21%
9 Waldock Mackenzie Ltd/Mr. L.P.Hapangama 64,900 0.19%
10 Dr. Sena Yaddehige 54,100 0.16%
11 Mrs.F.A. Safiyullah 50,000 0.15%
12 Mr. W.P.A.S. Perera 47,000 0.14%
13 Mr.F.Fernandez 39,000 0.11%
14 Pan Asia Banking Corporation PLC/Mrs. M.B.F. Farzana 34,668 0.10%
15 Entrust Limited 31,000 0.09%
16 Pan Asia Banking Corporation PLC/Mr. A.W. Mohottala 30,200 0.09%
17 Mr.G. Rajendren 30,100 0.09%
18 Mrs.K.N.L. Pieris 29,248 0.09%
19 Mr. A.V.A.D.Rushantha 26,564 0.08%
20 Mr. Y.K.B. Dissanayake 25,674 0.07%
PERCENTAGE OF PUBLIC HOLDING 13.91%
MARKET VALUE OF SHARES
For the Year Ended 31 March 2012 2011Rs Rs
Highest 114.00 130.00
Lowest 85.50 88.50
Year End 91.90 90.00
2,187 4,063,326
TOTAL
Number of Shareholders
Number of Shares
Number of Shareholders
Number of Shares
Number of Shareholders
Categories of Shareholders
RESIDENT NON RESIDENT
COMPOSITION OF THE SHAREHOLDERS AS AT 31ST MARCH 2012
No of Share holders % Number of Holdings
No of Shares
Number of Shares
% Holding % Holding%
HoldingShare Holdings
109
2,296 34,233,774
30,170,448
TWENTY LARGEST SHAREHOLDERS AS AT 31 ST MARCH 2012
% Name of the Shareholder
81

No of
shares held
1 Environmental Resources Investment PLC 18,411,702 73.65%
2 Mr.A.W. Mohottala 550,900 2.20%
3 Mrs. G.L.S. Chandrika 156,300 0.63%
4 Pan Asia Banking Corporation PLC/Mr. M.N.Ranasinghe 150,000 0.60%
5 Miss. G.D.S.N.Perera 146,400 0.59%
6 Mr. J.P. Wijeweera 141,199 0.56%
7 Mr. P.S.K. Jeewantha 130,000 0.52%
8 Mr. K.G.Lokuketagoda 129,500 0.52%
9 Pan Asia Banking Corporation PLC/Mr. N.Vandabona 124,000 0.50%
10 Sampath Bank PLC/Mr.S.A. Cooray 110,000 0.44%
11 Mr. H.M. Keerthiratne 109,500 0.44%
12 Mr. T.A.J.Maloney 108,300 0.43%
13 Mr.M.P.C.F. Jayasooriya 107,400 0.43%
14 Mr. H.H.A. Chandrasiri 104,000 0.42%
15 Mrs.S.S. Silva 100,000 0.40%
16 Mr. A.I. Marawila 90,800 0.36%
17 A.T. Cooray (Pvt) Ltd 90,400 0.36%
18 Mr.D.M.K.B.A. Dissanayake 86,600 0.35%
19 Mr.D.A.Dasantha Premal 80,003 0.32%
20 Mr. P.G. Gamini 74,400 0.30%
PERCENTAGE OF PUBLIC HOLDING 26.35%
Warrant Prices (WR2014) for the Year ended 31.03.2012
Higest Rs.21.70
Lowest Rs.10.50
Last Traded Price Rs.12.60
No of
shares held
1 Environmental Resources Investment PLC 18,411,702 73.65%
2 Mr. W.P.A.S. Perera 382,827 1.53%
3 Mr. A.W. Mohottala 344,900 1.38%
4 Pan Asia Banking Corporation PLC/Mr. N.Vandabona 232,900 0.93%
5 Miss. A.S.Halpern Weber 185,500 0.74%
6 Mr. R.S. Gunawardena 176,900 0.71%
7 Richard Pieris Financial Services(Pvt) Ltd/W.P.A.S.Perera 150,700 0.60%
8 Mr. S.P.J.De Silva 138,200 0.55%
9 Sampath Bank PLC/Mr.S.A. Cooray 130,000 0.52%
10 Mrs.G.L.S.Chandrika 127,600 0.51%
11 Mrs.D.S.K. Athukorala 115,500 0.46%
12 Sampath Bank PLC/Mr.A.W. Mohottala 100,500 0.40%
13 Pan Asia Banking Corporation PLC/Mr. K.H.K.H. Perera 100,000 0.40%
14 Mrs. F.A. Safiyullah 100,000 0.40%
15 A.T. Cooray (Pvt) Ltd 100,000 0.40%
16 Waldock Mackenzie Limited/Mr.L.P. Hapangama 97,600 0.39%
17 Pan Asia Banking Corporation PLC/Mr. W.N.P.Withanarachchi 92,000 0.37%
18 Commercial Bank of Ceylon PLC/Mr. A.W.Mohottala 83,337 0.33%
19 Mr.H.M.Keerthiratne 80,700 0.32%
20 Miss. G.N.R.L.Dias 71,980 0.29%
PERCENTAGE OF PUBLIC HOLDING 26.35%
Warrant Prices (WR2015) for the Year ended 31.03.2012
Higest Rs. 21.70
Lowest Rs.9.30
Last Traded Price Rs.12.20
% Name of the Shareholder
Name of the Shareholder %
Twenty Major Warrant holders as at 31 st March 2012 - Warrant 2015 (WR2015)
Twenty Major Warrant holders as at 31 st March 2012 - Warrant 2014 (WR2014)
82

83

84

85

86

87

NOTICE IS HEREBY GIVEN that the Annual General Meeting of Ceylon Leather Products PLC
will be held at Taj Samudra Hotel, Colombo 03 (Samudra Ballroom) on 19th September 2012 at 11.00
am for the following purposes:
1. To receive and consider the Annual Report of the Board of Directors on the affairs of the Company with the Financial Statements for the year ended 31st March 2012.
2. To re-elect Mr. M A K B Dodamgoda , who retires by rotation in terms of Article 20 (6) of the Articles of Association as a Director of the Company.
3. To re-elect Mr. Lalith Heengama who retires in terms of Section 210 of the Companies Act No. 7 of 2007 as a Director of the Company and to adopt the following resolution :-
“RESOLVED that Mr. Lalith Heengama who has attained the age of 73 years be and is hereby re-elected as a Director of the Company, and it is hereby declared that the age limit of 70 years referred to in Section 210 of the Companies Act No. 7 of 2007 shall not apply to the said Director”
4. To re-elect Mr. Heen Banda Dissanayake who retires in terms of Section 210 of the Companies Act No. 7 of 2007 as a Director of the Company and to adopt the following resolution :-
“RESOLVED that Mr. Heenbanda Dissanayake who has attained the age of 75 years be and is hereby re-elected as a Director of the Company, and it is hereby declared that the age limit of 70 years referred to in Section 210 of the Companies Act No. 7 of 2007 shall not apply to the said Director”
5. To re-appoint M/s Ernst & Young, Chartered Accountants, as Auditors of the Company and to authorize the Directors to determine their remuneration.
6. To authorize the Directors to determine and make payments for charitable and other purposes for the year 2012/2013 and up to the date of next Annual General Meeting as set out in the Companies Donation Act (CAP147).
By order of the Board of Ceylon Leather Products PLC (Sgd.) P W Corporate Secretarial (Pvt) Ltd Secretaries Colombo 07th August 2012 Notes: (i) A shareholder entitled to attend and vote at the Meeting is entitled to appoint a proxy or proxies to
attend and vote instead of him/her. A Proxy need not be a shareholder of the Company. A form of proxy accompanies this notice (ii) The completed form of proxy should be deposited at the Registered office of the Company at
No,64, Belummahara, Mudungoda by 11.00 am on 17th September 2012.
88

I/We……………………………………………………………..of …………………………………...
………………………………………………. Shareholder/shareholders of Ceylon Leather Products
PLC, hereby appoint ………..…………………………..…………………………………………….of
………………………………………………..……………………………… or failing him/her
Mr. L.Heengama of Colombo or failing him Mr. S. Senaratne of Colombo or failing him Mr. G.S Newsome of Colombo or failing him Dr. K. Heengama of Colombo or failing him Mr M.A.K.B. Dodamgoda of Colombo or failing him Mr. H.B Dissanayake of Colombo or failing him Mr. G.S. Munasinghe of Colombo
as my /our proxy to speak and vote for me/us on my/our behalf at the Annual General Meeting of the Company to be held on the 19th day of September 2012 and at any adjournment thereof and at every poll which may be taken in consequence thereof.
FOR AGAINST
i. To consider and receive the Report of the Board of Directors on the affairs of the Company with the Financial Statements for the year ended 31st March 2012 together with the Report of the Auditors thereon.
ii. To re-elect Mr. M A K B Dodamgoda who retires by rotation in terms of Article 20(6) of the Articles of Association as a Director of the Company.
iii. To re-elect Mr. Lalith Heengama who retires in terms of Section 210 of the Companies Act No. 7 of 2007 as a Director of the Company and to adopt the following resolution :-
“RESOLVED that Mr. Lalith Heengama who has attained the age of 73 years be and is hereby re-elected as a Director of the Company, and it is hereby declared that the age limit of 70 years referred to in Section 210 of the Companies Act No. 7 of 2007 shall not apply to the said Director”
iv. To re-elect Mr. Heen Banda Dissanayake who retires in terms of Section 210 of the Companies Act No. 7 of 2007 as a Director of the Company and to adopt the following resolution :-
“RESOLVED that Mr. Heen Banda Dissanayake who has attained the age of 75 years be and is hereby re-elected as a Director of the Company, and it is hereby declared that the age limit of 70 years referred to in Section 210 of the Companies Act No. 7 of 2007 shall not apply to the said Director”
v. To re-appoint M/s Ernst & Young, Chartered Accountants, as Auditors of the Company and to authorize the Directors to determine their remuneration.
vi. To authorize the Directors to determine and make payments for charitable and other purposes for the year 2012/2013 and up to the date of next Annual General Meeting as set out in the Companies Donation Act (CAP147).
89

Signed on this ……………………Day of …………….. 2012. ………………………….. Signature Please furnish following information: Share certificate No …………………… CDS A/c No. …………………… ………. NIC No. ...…………………………… No of Shares ……………………….. Note: i. A Shareholder entitled to attend, speak and vote at the Meeting is entitled to appoint a proxy or
proxies to attend and vote instead of him/her. A Proxy need not be a shareholder of the company. ii. A form of proxy accompanies this notice iii. The instrument appointing a Proxy shall be in writing under the hand of the appointer or of
his/her Attorney duly authorized in writing or if such appointer is a company/corporation, either under its Common Seal, or under the hand of an Officer/s or Attorney duly authorized in terms of the Articles of Association /Statute.
Iv. In the case of a proxy signed by an Attorney, the original Power of Attorney must be deposited at
the Registrars’ Office (i.e. SSP Corporate Services (Pvt) Ltd, No. 101, Inner Flower Road, Colombo 03. Telephone : 011 2573894 for registration.
v. The completed form of proxy should be deposited at the Registered office of the Company at No.
64, Belummahara, Mudungoda by 11.00 am on 17th September 2012.
Shareholders/Proxies attending the meeting are requested to bring their National Identity Card or Passport.
90
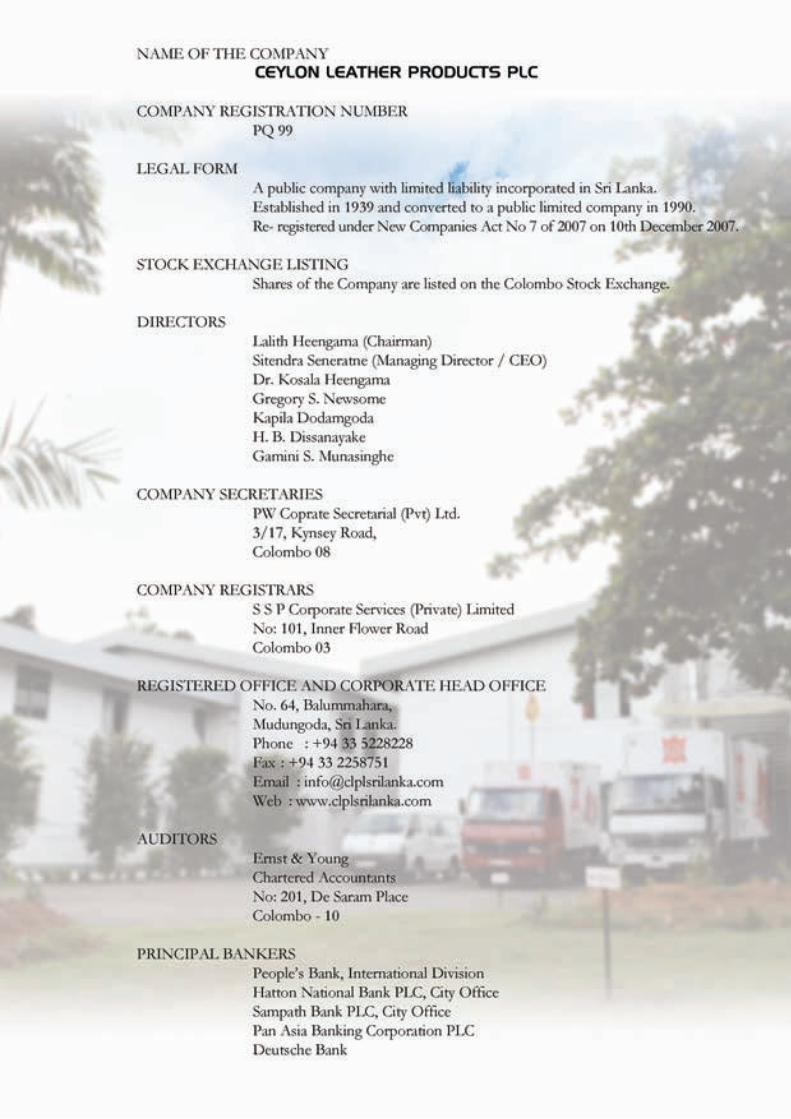

Sampath Jayasundara
Typewritten Text
Annual Report compiled in-house